South Florida Coral Reef Initiative (SEFCRI) Coral Reef Needs Assessment Study. Manoj Shivlani
|
|
|
- Dayna Byrd
- 6 years ago
- Views:
Transcription
1 South Florida Coral Reef Initiative (SEFCRI) Coral Reef Needs Assessment Study Manoj Shivlani July 31,
2 Table of contents SECTION PAGE NUMBER Executive Summary 3 Introduction 6 Visitor beach survey project 10 Resident phone and mail back survey project 28 Stakeholder interview project 40 Marine industry electronic mail and telephone survey project 51 Registered boater field intercept survey project 56 Findings and recommendations 67 References 74 Appendix 1: Pilot visitor beach survey project report 76 Appendix 2: Visitor survey project survey instrument 84 Appendix 3: Resident phone survey project survey instrument 85 Appendix 4: Resident mail survey project survey instrument 87 Appendix 5: Registered boater mail survey project survey instrument 89 Appendix 6: Stakeholder guiding questions 91 Appendix 7: Marine industry survey 93 2
3 Executive Summary This report describes the five projects undertaken to conduct a Needs Assessment Study for the Southeast Florida Coral Reef Initiative (SEFCRI), utilizing a sample of Miami-Dade, Broward, Palm Beach, and Martin Counties residents, visitors, and a representative sample of stakeholder groups to assess the existing knowledge and values that the general public places on the coral reef ecosystem. The five projects, devised to assess the various groups, were: 1. Visitor beach survey project; 2. Resident phone and mail back survey project; 3. Stakeholder interview project; 4. Marine industry electronic mail and telephone survey project; 5. Registered boater field intercept survey project. Altogether, the research team conducted a total of 1,773 visitor beach surveys, comprised of 587 residents and 1,125 visitors, in on four beaches in the four-county region. The results demonstrated that beach visitors were more knowledgeable about coral reefs in general than about coral reefs in southeast Florida. Most visitors believed that coral reefs have more of a use, or instrumental value, than an intrinsic value; that fisheries may not negatively impact coral reefs; and that coral reefs are most likely found in the Florida Keys in southeast Florida. Also, a majority of visitors were willing to pay to protect coral reefs and believed that coral reefs should be afforded protection. Within the resident project, the research team mailed out 12,000 surveys to the region s residents, and it received 619 returns. While the sample over-represented educated, older, and mainly Caucasian residents, the results demonstrated the potential extent of local knowledge on coral reefs. Also, the results were shown to be very similar to those obtained for the resident sub-sample in the visitor beach study project, suggesting means by which to compare findings on an age and county-level basis. Residents, like visitors, were more knowledgeable about coral reefs in general than about coral reefs in southeast Florida. Most residents learned about coral reefs from the media, and most were in favor of providing protection to local coral reefs. Although a majority was not willing to pay an additional sales tax, over a third of those sampled were willing to pay an additional average 0.65% sales tax to protect coral reefs in southeast Florida. The stakeholder interview project, conducted in the field with five different types of direct users of coral reefs in the region, led to the completion of 60 interviews. The findings suggest that most stakeholders believe that coral reefs are in decline in the SEFCRI region. However, while respondents from the upper counties (Martin and Palm Beach Counties) believed that their constituents are not knowledgeable about coral reefs, and that pollution (as related to agriculture, development, and population) may be a major reason for that decline; their counterparts from the lower counties believed that their groups held considerable knowledge on coral reefs, and that development and overuse were to blame for coral reef decline. Depending on the stakeholder type, respondents felt that education should be administered via government or non-governmental sources, and a majority believed that education is necessary. Also, while not in favor of marine zoning as a group, 3
4 several stakeholders argued for increased management and/or enforcement measures to protect coral reefs and marine resources. The marine industry project started as an electronic mail survey sent out to a census of marine industry association members in the region; however, it was later modified into a telephone survey that led to the completion of 70 interviews. Among the results of interest, it was determined that up to 25% of those association members that received an invitation to participate chose not to do so because they did not believe that their industry had an impact on or is affected by coral reefs. Like their stakeholder counterparts, over half of those industry members who chose to participate believed that coral reefs in southeast Florida were in fair to very poor condition, and they ranked coral reefs as the least healthy of all local coastal and marine ecosystems. Marine industry member opinions on coral reef benefits and threats, as well as the group s preferred information sources, were generally similar to those obtained for the other groups, suggesting that marine industries exhibit comparable views on coral reefs, hold like levels of knowledge, and prefer similar information sources. Finally, the registered boater field intercept survey project targeted boaters at selected marinas in Miami-Dade and Broward Counties, completing a total of 356 and 340 surveys in five sites over 10 sessions in the two counties, respectively. As determined in the other efforts, the boater survey project findings indicated that the resident boating community possesses a base understanding of coral reefs in general but less so of coral reefs in southeast Florida, that its views towards coral reefs are shaped primarily from a direct use perspective, and it prefers to be informed via media sources. In terms of water-based activities, the results indicated that over 40% of the boaters surveyed participate in recreational fishing on a regular basis, compared to a smaller percentage that dives or snorkels with any frequency. The findings also suggest that boaters are knowledgeable of fishery regulations from a variety of sources, but that their perceptions on the efficacy of enforcement of such regulations are primarily negative. Overall, the Needs Assessment Study proved to be successful in assessing the knowledge and values shared by a variety of public and stakeholder groups in the SEFCRI region. Its success was due in a large part to the study s methodological flexibility which allowed the various projects to be completed even when affected by the 2005 hurricanes and lower than expected return rates. The flexibility demonstrated that when conducting an assessment study that involves human dimensions research, it is important that research plans include contingencies. In this case, the contingencies developed assisted in the completion of each planned project and yielded important findings and management recommendations. Key findings 1. There is a base understanding among residents and visitors, as well as specific stakeholders, on coral reefs in southeast Florida, which consists of the majority of those surveyed recognizing that coral reefs exist within the region, that coral reefs serve multiple purposes and provide ecological and economic benefits, and that coral reefs deserve protection. 2. Most of the persons surveyed believe that coral reefs serve a more utilitarian than preservation purpose; that is, coral reefs are not generally perceived as rain forests or old-growth forests that are often valued for their existence. Instead, respondents 4
5 opinions suggest that residents and visitors perceive coral reefs as providing important economic benefits, such as recreation and seafood, over ecological ones, including biodiversity. 3. Residents are generally more aware of southeast Florida coral reefs than visitors, and among visitors, foreign tourists are the least informed group. Importantly, more respondents in each group residents and visitors alike are knowledgeable about coral reefs in general than about coral reefs in southeast Florida. 4. Most respondents do not identify fisheries as negatively impacting coral reefs, and most rank fisheries as among the lowest threats currently facing coral reefs; conversely, respondents rank seafood as an important benefit provided by coral reefs. This view, which again suggests the utilitarian function that coral reefs serve, suggests that residents and visitors may not fully understand the connection between reef fishes and coral reefs and thus may be less in favor of alternate management strategies such as zoning. 5. Most respondents who agree that there are coral reefs in southeast Florida identify the Florida Keys as the primary location, and fewer identify the SEFCRI region counties as having coral reefs. 6. Stakeholders who use coral reefs in southeastern Florida generally agree that the resource is in declining and/or poor condition. 7. All groups surveyed agree that the main way that they wish to stay informed on coral reefs in the SEFRCI region is via media (television and radio) sources. Visitors, and foreign visitors in particular, favor visual aids, such as signage, but tourists are also in favor of active promotion via media. 8. Stakeholders in different counties do not agree on a single cause for coral reef decline, and views may be formed in part by both upland effects (ex. agricultural runoff) and a perceived increase in coastal, non-point source pollution. Stakeholders in Martin County believe that agricultural based pollution may be killing the region s coral reefs, Palm Beach and Broward County stakeholders point more to pollution resulting from coastal development, and Miami-Dade County stakeholders identify overuse as a factor in the county s coral reef decline. 9. Almost a quarter of the marine industry organizations/members surveyed do not consider their activities being affected by or affecting coral reefs. Management recommendations 1. Efforts in coral reef awareness and education should be tailored to target different audiences, including residents, visitors, and stakeholders, based on the amount of knowledge held, preferred sources of information, and other socio-demographic factors. 2. Under-represented ethnic and racial, minority groups need to be reached to be incorporated into the education and awareness process. 3. Education and outreach should consider utilizing terrestrial models (ex. tropical rain forests) to demonstrate the similar, intrinsic value of coral reefs, as reservoirs of biodiversity, and indirect economic values, such as ecosystem services and storm protection, ahead of the direct economic benefits recognized by most users. 4. Management must work with different stakeholder groups in developing meaningful ways by which to improve communication, such that the groups can provide information on coral reef conditions, stressors, and remedies. 5. Non-traditional, coastal and marine industries should be engaged to demonstrate to these industries their linkages to coral reefs. 5
6 Introduction Southeast Florida, defined in this study as the four-county region comprised of Miami-Dade, Broward, Palm Beach, and Martin counties, is an ecologically diverse and socio-culturally and socioeconomically complex area. Its natural attributes include important and fragile, terrestrial, coastal, and marine ecosystems, of which the latter include the continental United States only barrier coral reef. The second largest of its kind, southeast Florida s barrier reef system extends from its northern origin in Martin County into the eastern Gulf of Mexico 1, comprising a critical resource that provides natural and economic benefits and serves as part of the region s social and cultural identity. However, the coral reef and associated ecosystems (for example, sea grasses and mangroves) are also very vulnerable to anthropogenic activities, including direct uses such as fishing, visitation, and boating, as well as indirect impacts resulting from water and land-based sources of pollution, alterations to linked ecosystems, hurricanes, and global climate change (Andrews et al., 2005). Even though efforts are initiated to protect coral reefs (Executive Order 13089), management strategies cannot necessarily ensure success without an understanding of the public s support for the protection of coastal and marine resources. Moreover, as the population of the fourcounty region continues to swell, it is clear that the already stressed coral reefs may encounter even greater challenges to survive into the near and medium terms. Finally, and perhaps most importantly, it is only through an assessment of existing knowledge base, prevailing attitudes, and general perceptions among the population that interacts with and affects the coral reefs in the region that appropriate management strategies can be developed. The overarching goal of this study was to assess the existing knowledge and values that the general public in the four county region of southeast Florida place on coral reefs in order to assist in the development of a coordinated and targeted outreach and education effort in southeast Florida. The study, conducted for the Southeast Florida Coral Reef Initiative (SEFCRI) and developed in conjunction with the SEFCRI Awareness and Appreciation Team (AA Team), utilized a multi-pronged approach to obtain knowledge, attitudes, perceptions, and beliefs information from residents and visitors from the four county region. The approach was by necessity multi-pronged, due in part to the socio-cultural diversity present in the large population (5.13 million residents in 2000 (US Census, 2006)) in the region, the multiple uses of coral reefs and associated ecosystems, and the large tourism economy that relies considerably on coastal and marine ecosystem health and resources (for example, recreational fisheries, scuba diving, snorkeling, boating, etc.). The approach applied was also highly differentiated at the target level, both in terms of the methodology adopted to reach a specific group and the content of the query. It should be emphasized, however, that the approach described above was nevertheless based on sound and tested social science (mainly survey) fieldwork theory and techniques, and that the flexibility utilized in conducting the study took into account the larger, objective aspects of study design, implementation, analysis, and reporting. Thus, the results derived from the study provide a 1 The Florida Reef Tract itself extends from Soldier Key to the Tortugas Banks, but the reef system continues northward in a discontinuous fashion from northern Monroe County (Florida Keys) to Martin County (Andrews et al., 2005). 6
7 largely representative view of their target groups, and these can be then used to establish and update future baselines. As per the study requirement, there were a total of three different groups in the four-county region that needed to be characterized: Residents; visitors; and stakeholders. Stakeholders consisted mainly of residents, but they were differentiated within the solicitation as those groups who are most likely to interact with the coral reef ecosystem. Thus, stakeholders included commercial fishers, for-hire fishing organizations, recreational fishers, marina operators, boatyard operators, dive operators, recreational divers and snorkelers, boaters, and marine industry groups, among others. Under the study s scope of work, the stakeholders to be considered for assessment would be registered boaters, marine industry groups, and commercial fishers and fish processors, charter operations, recreational fishing groups and clubs, dive operators, and others. These comprised three subgroups under the heading of stakeholders, and thus should be considered separately. The study undertaken by the research team of Shivlani, Villanueva, and others (hereafter research team ) commenced in March 2005 and ended on March 31, The study developed five projects that the research team implemented to canvass the aforementioned user groups within the larger population in the four county region: Visitors, residents, registered vessel owners/operators, direct consumptive and nonconsumptive stakeholders and stakeholder representatives, and marine industry groups. As stated in the previous paragraph, the research team adopted a flexible approach to surveying each population of users. This was done for two, main reasons. The first was due to the fact that very few studies had been conducted on these groups in the southeast Florida region, with the exception of periodic boating research surveys, project development related assessment studies (ex. environmental impact statement and environmental assessment research, as required under the National Environmental Policy Act (NEPA) (42 USC 4321 et seq.) and others), artificial and natural reef use studies, and smaller, issue-specific efforts (ex. limited interviews and surveys on environmental topics with stakeholders, etc.). Therefore, the research team could not rely on previous results on how to best structure its approach within each project. The second reason why the research team adopted a flexible approach was due to the logistics that the study presented. Because the study called for the assessment of general knowledge on coral reefs for a set of populations that exceeded five million residents, more than 27 million tourists in Miami-Dade, Broward, and Palm Beach Counties in 2005 alone, over 600,000 registered boat owners, and hundreds of stakeholders, the research team decided that it would promote a preferred approach while retaining sufficient flexibility to modify that approach as the situation demanded. The value of adopting a flexible approach became clear by October 2005, when the last of three hurricanes impacted southeast Florida in a three month span. While previous storm events were not as deleterious as Hurricane Wilma, which made landfall on October 24, 2005, both Hurricanes Katrina and Rita resulted in serious project disruptions. The impact of the 2005 hurricane season led to the effective loss of four months of data collection (September December 2005), a period during which progress in ongoing projects was halted and where the implementation of other projects had to be postponed. The major problem that the storm events presented was that they affected the very populations to be sampled. In the case of visitors, the storms had a dampening effect on visitation, especially at the beach sites where surveys were being conducted. Residents could not be contacted as 7
8 regularly as planned due to poor telephone service following the hurricanes, as well as the severe disruption in their daily lives and the results on their willingness to participate in the project. Registered boaters also were less likely to participate due in part to storm damages to facilities and higher fuel costs, both of which reduced the amount of potential respondents at intercept sites. The research team decided to postpone stakeholder and marine industry projects due to the concern that return rates would be negatively affected in the months following the storms. Finally, and as importantly, the hurricanes impacted members of the research team, who work and reside in the affected communities. Following the disruptions, the research team convened with AA Team members to revise its approach and conduct originally planned projects using alternative, yet scientifically viable, methodologies. Among the changes applied, which are all described in more detail in the relevant project sections, included the accelerated completion of visitor surveys in the final three months of the project, the development of a mail-back resident survey to be used instead of telephone interviews, and field intercept surveys of registered boaters. These changes resulted mainly due to the project disruption described above, but the research team was able to develop and implement alternate methodologies within budgetary and temporal parameters. Most importantly, the research team applied sound social science theory and techniques in developing these revised methodologies, and each was successful in yielding coral reef awareness information. The overall approach consisting of the rationale and methodology and the findings for each project is described in the following sections: 1. Visitor beach survey project; 2. Resident phone and mail back survey project; 3. Stakeholder interview project; 4. Marine industry electronic mail and telephone survey project; 5. Registered boater field intercept survey project. The survey instruments developed for each project incorporated consistency as a rule to ensure that data collected was comparable across groups. Moreover, the surveys collected as much quantitative information as is feasible, such that descriptive and other statistics could be run to interpret the data. The research team paid particular attention to the topics concerning the value and willingness to protect coral reefs, and a contingent valuation method was developed (building on research already conducted on coral reef use contingent valuation by Johns et al., 2002, Park et al., 2002, Shivlani et al., 2003, and Bhat, 2003). Additionally, the team used its expertise to ensure that previously existing research in the general field of coral reef ecosystem social science research and within the more discrete fields of public participation models, contingent valuation, attitudes, perceptions, and beliefs, and marine resource impact assessment, among others, were addressed. Another key consideration in the approach was the inclusion of spatial data collection to the extent possible within each of the surveys. Resident and visitor data, as well as much of the stakeholder information, were made spatially explicit such that GIS was incorporated to interpret county-wide differences in awareness and other factors among respondents. As can be inferred from the section titles and descriptions, the research team employed an eclectic set of survey methodologies, ranging from traditional, field-based interviews to 8
9 electronic mail questionnaires, to sample the population of each major group. Following a description of each group project approach and findings, the report compares the groups, in terms of their attitudes, perceptions, and beliefs concerning coral reefs in southeast Florida, and it evaluates the current status of knowledge and understanding of the region s coral reefs, information gaps, and means by which to improve public communication and increase awareness. 9
10 Visitor beach survey project The research team developed the visitor beach survey project as a means by which to assess visitors understanding of the region s coral reefs and to identify information mechanisms that could be used to increase awareness. Rationale and methodology The methodology employed was that used by Shivlani et al. (2003) on three beaches in the Miami-Dade County areas of Key Biscayne and Virginia Key, in that the project followed the previous study s 12-month, field survey approach. The rationale for conducting beach surveys was that beach surveys would yield considerable visitor data, that a year-long sampling period would capture both summer and winter visitors (Leeworthy and Wiley, 1996), and that visitors surveyed at beaches may be able to provide a more informed opinion on coral reefs (or that such visitors would at least be more interested in the marine resource topic than visitors surveyed at other locations, such as malls). Additionally, the team used the Shivlani et al. study approach because that study yielded a large sample with a very low rejection rate in the same region where the present project was to be conducted. The preferred methodology called for a stepwise completion of the following activities: The identification of sampling sites (i.e. beaches) in all four counties; the development of a survey instrument to be tested in a pilot survey period; and the implementation of a field survey period. The first step in the methodology consisted of the development of a survey instrument (Appendix 2). The research team and AA Team members expended considerable effort in refining this first survey instrument, mainly because much of the content developed would be used in subsequent projects. The pilot instrument contained a total of 13 questions, of which several contained subsections and follow-up questions. The questions concerned the demography of the respondent, trip logistics, coastal and marine-based activities undertaken in southeast Florida, knowledge and sources of information of coral reefs in general and coral reefs in southeast Florida, perceptions on coral reef function, benefits, and threats, willingness to support and pay for coral reef protection, modes of information to stay informed on southeast Florida coral reefs, and household income. Additionally, the instrument recorded the sex of the respondent, location of interview, and date of survey session. The second step in methodology development was the determination of study sites. The research team, in collaboration with the AA Team, selected a single site from a larger list of beaches per county that served as that county s study area. The final sites selected were: 1. Miami-Dade County South Beach (from the start of Ocean Drive north 2 2. Broward County Fort Lauderdale Beach (from Las Olas to Sunrise Boulevards); 2 Surveys were conducted in South Beach by starting at the southern end of the beach and surveying visitors while traveling northward; the survey session was completed once the data collector completed two hours of data collection, and the distance traveled depended on the visitor density and visitor willingness to participate. 10
11 3. Palm Beach County Singer Island; 4. Martin County Bathtub Reef Park 3. The sites were selected mainly due to the high rates of non-resident visitation that they enjoy, and the teams agreed that these sites would provide the most visitor surveys (compared to other beaches in the respective counties). Site selection and survey instrument development were concluded on March 13, 2005, followed by a survey pilot period. The research team conducted a total of two pilot sessions at each site from March 25-29, 2005, with each session lasting no longer than two hours or by the time that the beach has been completed surveyed, whichever arrived first. Data collected from the 142 pilot surveys completed during the survey pilot sessions was analyzed to determine the applicability of the survey instrument, and all pilot work, including survey development, methodology, and findings, shall be discussed in a visitor pilot survey report. Please refer to Appendix 1for a description of the visitor beach survey pilot period and its results. The third step in the methodology consisted of the field survey period, which included the completion of two survey sessions per beach per month for a period of 12 months (or 24 sessions per beach), commencing on March 25, 2005 and terminating on March 11, While it was estimated from the pilot period that an average of 20 surveys per session could be completed, this turned out to be an over-estimate, due mainly to sessions when less than 20 beach visitors were present at sites. Findings: Survey totals Overall, the research team completed a total of 1,773 beach visitor surveys in 96 sessions, at an average of 18.5 surveys per session. South Beach in Miami-Dade County and Fort Lauderdale Beach in Broward County returned the most surveys, or 460 and 473 surveys, respectively. Table 1 shows the returns per county and relative percentages. Table 1: Beach visitor survey totals and returns South Beach Fort Lauderdale Beach Singer Island Jensen Beach All beaches 1. Number of surveys (% of total) 460 (25.9) 473 (26.7) 429 (24.2) 411 (23.2) Surveys per session Weekend days/week days (%) 52.4/ / / / / Sex of respondent (male/female %) 48.0/ / / / /52.7 As shown in Table 1, Fort Lauderdale Beach and South Beach reported the highest return rates per session. An average of 19.7 surveys were completed in the Broward County site, compared to only 17.1 surveys completed per session at Jensen Beach in Martin County. Overall, an average of 18.5 surveys was completed per survey session. In terms of surveys 3 The research team switched the Bathtub Reef Park with Jensen Beach in month 2 of the study, following the pilot session, due to the inconsistency in visitor totals at the former site. The team decided, based on field observations, that Jensen Beach would provide more samples per session on a consistent basis. 11
12 completed on weekend days and week days, South Beach and Jensen Beach had more surveys completed on weekend days than on weekdays, and the opposite was observed for Singer Island and Fort Lauderdale Beach. Finally, for all beaches, women completed a majority of surveys (52.7%). Findings: Demographic, trip, and activities characteristics The demographic characteristics of the beach visitor sample, including domicile, age group participation, income, and educational background, as well as trip characteristics are presented in the following tables and graphics. Where relevant, inter-beach statistics are presented and compared. Table 2: Domicile of beach visitors by site Visitor base (%/n) South Beach Fort Lauderdale Beach Singer Island Jensen Beach Total Miami-Dade County Broward County Palm Beach County Martin County Saint Lucie County US Foreign 35.8 (160) 2.2 (10) 0.2 (1) 0 (0.0) 0 (0.0) 44.3 (198) 17.4 (78) 2.8 (13) 36.4 (168) 2.8 (13) 0.2 (1) 0 (0.0) 44.9 (207) 12.8 (59) 0.2 (1) 0.2 (1) 38.1 (157) 0.5 ( 2) 0.5 ( 2) 52.4 (216) 8.0 (33) 0.5 (2) 1.0 (4) 3.6 (14) 10.2 (40) 23.2 (91) 56.6 (222) 4.8 (19) 10.3 (176) 10.7 (183) 10.8 (185) 2.5 (43) 5.4 (93) 49.2 (843) 11.0 (189) Total 100 (447) 100 (461) 100 (412) 100 (392) 100 (1712) Table 2 demonstrates the differences in the beach sites across counties, as determined by the percentage of visitor domiciles. While all beaches attracted a large, total percentage of nonresident visitors (over 65%), the beaches clearly did not attract the same kinds of visitors. South Beach, for instance, hosted a large percentage of local, Miami-Dade County residents (35.8%), as well as large percentages of US (44.3%) and foreign (17.4%) visitors. Similarly, Fort Lauderdale Beach hosted a large percentage of local, Broward County residents (36.4%) and almost 58% of its sample was comprised of US and foreign visitors. By contrast, both Singer Island and Jensen Beach attracted more US visitors, with over 52% of both beaches samples being made up of US visitors. Foreign visitors were less prevalent, and even among the 8% that Singer Island reported, 73% of these foreign visitors originated from a single country, Canada. Interestingly, Jensen Beach was the only site where local, or intra-county, beach participation did not reach 35%. Instead, only over 10% of local residents comprised the sample, with considerable participation from Port Saint Lucie, an adjacent, northern town. If the 23.2% participants from that county are combined with the 10.2% of Martin County residents, then the rate of local participation approximates that which was found in the other three counties. A final aspect described in Table 2 that is of importance is the proportion of non-resident participants. Almost two-thirds of the sample (65.6%) was comprised of non-residents, or visitors, showing that the beaches selected did in fact fulfill 12
13 their expectations of yielding high percentages of visitor surveys. Even if the Saint Lucie sub-sample is interpreted as part of a local population, the project resulted in a 60.2% visitor sample. 0.6 Mean number per group under 18 years years years years years years over 65 years Age group SB FLB SI JB Total Figure 1: Average age group participation by beach (SB = South Beach; FLB = Fort Lauderdale Beach; SI = Singer Island; JB = Jensen Beach; and Total = all beaches) Figure 1 shows the average proportion of age groups at each beach in the sample. Within the total sample, the dominant age group was the year old group, with an average of 0.49 participants (SD = 1.00) per survey; the least common age group was the over 65 year old group, with an average of 0.14 participants (SD = 0.50) per survey. Individual beaches displayed important differences in the age groups that they attracted. Within South Beach and Fort Lauderdale Beach, for example, the most common age group at both sites was the year old group (SB mean = 0.56, SD = 1.05; FLB mean 0.53, SD = 1.03); this is contrasted with Singer Island and Jensen Beach, where the most common age group at both beaches was considerably older, or between years old (SI mean = 0.45, SD = 0.90; JB mean = 0.55; SD = 1.0). Generally, a greater proportion of older visitors frequented the Palm Beach and Martin County beaches than Broward and Miami-Dade County beaches. There were fewer differences in group size. In total, the average size of a group visiting one of the four beaches consisted of 2.51 (SD = 1.63) persons. Jensen Beach group sizes were highest, at 2.61 (SD = 1.44) visitors per group, followed by Fort Lauderdale Beach (mean = 2.54 visitors; SD = 1.66) and Singer Island (mean = 2.49 visitors; SD = 1.89). South Beach groups, by contrast, were smaller, at only 2.41 visitors (SD = 1.94) per group. Almost one third of respondents at South Beach (32.3%) stated that they were recreating alone; no other beach had more than 25% of its sample being comprised of single visitor groups. 13
14 Percentage Less than $10,000 $10,000-24,999 $25,000-49,999 $50,000-99,999 $100, ,999 $200,000 or more Household income Total Resident Visitor Figure 2: Household income of beach visitors The average household income for all respondents was 3.64 (SD = 1.10), or between $25,000 49,999 and $50,000 99,999, and the median income was $50,000 99,999. Residents on average earned a bit less than the total sample, or 3.57 (SD = 1.10), while visitors earned more, or 3.64 (SD = 1.12). Figure 2 shows the breakdown of income among all six income brackets recorded in the survey. Respondents also provided information on their education level. A majority of visitors surveyed had completed a college education (31.8%), and 15.4% had conducted postgraduate studies. Another 22% were either still in college or had not completed college, and 30.5% held at least a high school diploma (or were still in high school). Because the survey asked of the respondent s education level, and that was dependent on the age of the respondent, the relative proportions of educational attainment should not be viewed as terminal stages. For example, many of those younger visitors interviewed were still either in high school or in college, and thus they reported their current status at the time of the survey. Within trip characteristics, 69.7% of non-residents reported that they had been to southeast Florida previously. Within US visitors, 70.8% had been to southeast Florida before, compared to 65.1% of foreign visitors. Those visitors who were returning generally tended to have visited recently. As shown in figure 3, almost two-thirds (62.2%) of the sample that reported being return visitors had been in southeast Florida in the past year (2004 and 2005), and of that total, 35.2% had visited in the same year of the survey (2005). Altogether, 91.1% of return visitors had been in southeast Florida since
15 Percentage s 1990s Time period of last visit Figure 3: Last visit to southeast Florida Most visitors (86.5%) reported being overnight visitors who would spend an average of 11.7 days (SD = 26.0) days in southeast Florida. The range of time varied considerably, with 91.2% of the sample reporting a trip of 21 days or less, and 6.4% stating that they planned to stay for a month or longer. Among those who reported longer stays, these tended to be part-time residents who live in southeast Florida over the winter. Among the beaches, Fort Lauderdale Beach visitors reported spending an average of 14.4 days (SD =35.6), followed by Singer Island visitors (mean = 11.5 days; SD = 24.9), Jensen Beach visitors (9.9 days; SD = 17.2), and South Beach visitors (mean = 9.7 days; SD = 19.8). Finally, almost 70% of visitors reported arriving in southeast Florida by air, compared to 30% who came over land. Among foreign visitors, the air mode of arrival was expectedly higher, at 75.9%, compared to US visitors, of whom 68.2% arrived by air. As shown in Figure 4, the dominant group of foreign visitors was that of North American tourists who comprised a majority of the foreign visitor sample; in fact, Canada represented 43.2% of the North American tourists who visited one of the four beaches (Mexico represented 3.8%). With European visitors, the UK dominated the sample, representing 11.1%, followed by Germany (7.4%) and Italy (6.9%). Central and South America provided 13% of the foreign visitors in the sample, and these represented a total of 12 countries. 15
16 35% 2% 3% 1% 1% 11% 47% Africa Asia Caribbean Central America Europe North America South America Figure 4: Foreign visitor distribution The survey obtained information on water-based activities in which visitors participated while in southeast Florida. The activities ranged from in-water activities such as swimming, snorkeling and diving, and surfing, as well as different kinds of watercraft activities, and potentially extractive activities such as fishing or spear fishing. The participation percentages are shown in Figure 5. Percentage Swim Snorkel/dive Fish Boat Sail Surf Kayak Glassbottom Activity SB FLB SI JB Total Figure 5: Water-based activities undertaken in southeast Florida (SB = South Beach; FLB = Fort Lauderdale Beach; SI = Singer Island; JB = Jensen Beach; and Total = all beaches) Figure 5 shows that respondents from all four beaches reported participating in similar proportion among popular, water-based activities while recreating in southeast Florida. The dominant water-based activity reported for all beaches was swimming, and almost 90% of the total sample reported swimming. The second most popular activity was 16
17 snorkeling/diving, in which over one quarter (26.1%) of the sample participated. This was followed by boating (24.3%) and fishing (20.9%). Interestingly, however, fishing was more popular among Singer Island and Jensen Beach visitors than South Beach or Fort Lauderdale Beach tourists. Conversely, surfing was more popular among South Beach respondents than other beach visitors. Altogether, the findings demonstrate that most of the respondents participated in one or more water-based activities, suggesting that most visitors had at least some experience (ex. swimming in the ocean, boating, saltwater fishing, or snorkeling or diving, among other activities) with the southeast Florida coastal and marine environment. Findings: Knowledge and perceptions of coral reefs, coral reef function, and benefits and threats This section presents the findings concerning respondents knowledge of coral reefs, where they are found, what role they serve, and the benefits and threats facing coral reefs. The results are shown for the entire sample, as well as resident and visitor strata. The latter stratum is further stratified into US and foreign visitors wherever applicable. The demographic characteristics of the beach visitor sample, including domicile, age group participation, and educational background, as well as trip characteristics are presented in the following tables and graphics. Where relevant, inter-beach statistics are presented and compared. When asked whether they had heard of coral reefs, 93.3% of the respondents stated that they had. Among residents, 95.2% knew about coral reefs, which was the highest percentage reported among any group. Conversely, while 93.2% of the visitor sample stated knowledge of coral reefs, which is very similar to the 93.3% for the entire sample, only 87.3% of foreign visitors stated knowing about coral reefs. Percentage School Media Friends Brochures/literature Source of information Total Residents US visitors Foreign visitors Figure 6: Sources of information on coral reefs for total sample, residents, and visitors Non-resident visitor data suggested that foreign visitors may not rely on the same sources of information as do resident or even US visitors. As shown in Figure 6, the sources of 17
18 information among foreign visitors were significantly different compared to those stated by US visitors and residents. For example, only 43.9% of foreign visitors reported learning about corals from school, compared to 67% of the entire sample, 67.3% of residents, and 69.7% of US visitors. Similarly, only 56.1% of foreign visitors obtained coral reef information from the media, compared to 63.9% of all respondents and of US visitors and 61.2% of residents. Most importantly, twice as many foreign visitors (20.1%) learned about coral reefs from brochures and related literature than did US visitors (8.7%) and the total sample (10.8%). This finding, to be discussed in more detail later, suggests that foreign visitors may be less informed about coral reefs than their US counterparts, and that their means of obtaining information may be different as well. When asked where coral reefs may be found, only 19.2% stated that they did not know. The most common, general locations given were the ocean (51.6%), tropical waters (9.6%), and off coasts (4.6%). Among those respondents who provided more specific locations where coral reefs are found, the most common of these was Florida (6.7%), the Caribbean (5.6%), Australia (4.9%), and the Pacific Ocean (1.8%). Many respondents listed more than one location, and the most popular sites were among those that are the best known, such as the Great Barrier Reef. As stated above, fewer respondents understood the relationship between warm waters and coral reefs, as only 9.6% stated that tropical (and subtropical) shallow waters are where reefs are most often found. This suggests that while 93% of the sample had heard about coral reefs, a much smaller percentage knew where they are most likely to be found. Moreover, even among those who knew where they might be found, many provided specific locations, such as the Florida Keys or the Great Barrier Reef, rather than general areas and/or conditions that foster coral reef growth (ex. tropical coastlines). Respondents also provided their views on what functions coral reefs serve, both in terms of their ecological role (ex. habitat, reservoirs of biodiversity) and ecosystem (and economic) services (ex. medicine, storm barriers, recreational areas). Overall, the sample stated that the main role of coral reefs is to provide habitat (75.7) and fisheries (60.2%). Fewer respondents perceived coral reefs as centers of biodiversity (36.8%) or storm barriers (30.5%). Instead, more visitors felt that coral reefs provide recreational opportunities (42.5%). Also, less than one fifth of the sample believed that coral reefs can provide any medicinal benefits (18.8%). 18
19 Percentage Habitat Fisheries Storm protection Recreation Biodiversity Coral reef function/role Medicine Residents US visitors Foreign visitors Figure 7: Differences in visitors' and residents' views on coral reef role/function Figure 7 demonstrates the differences in the opinions shared among visitors and residents concerning coral reef function. Although a majority of residents, US visitors, and foreign visitors stated that coral reefs provide habitat and fisheries, more residents (40.4%) than either US (25.6%) or foreign (29.6%) visitors believed that coral reefs also serve as storm barriers. This may be due in part to the residents experience with the 2004 and 2005 active hurricane seasons. However, on almost every category, with the exception of fisheries, more residents than visitors stated that coral reefs serve the given function. Among visitors, both US and foreign visitors displayed low percentages for coral reef function such as biodiversity, storm protection, and medicine. Much as the previous section in which most respondents could not identify locations and/or conditions in which coral reefs can be found, these percentages suggest that both residents and visitors did not fully know what coral reefs do, and they largely perceived coral reef function as more an economic than ecological one (ex. over 60% and 42.5% of the sample identified fisheries and recreation as main coral reef functions, compared to less than 37% that identified biodiversity). When asked about whether they know if there are coral reefs in southeast Florida, almost three-quarters, or 74.5%, stated that there are coral reefs in the region. A higher percentage of residents (82.3%) knew that there were coral reefs in southeast Florida than did all visitors (69.5%), US visitors (72.7%), or foreign visitors (54%). Thus, while over two thirds of the tourist sample knew about southeast Florida coral reefs, that knowledge was not equally shared among US and foreign visitors. Figure 8 shows the sources of information on southeast Florida coral reefs. 19
20 60 50 Percentage School Media Friends Brochures/literature Source of information on coral reefs in southeast Florida Total Residents US Foreign Figure 8: Source of information on southeast Florida coral reefs among residents and visitors Overall, the sample received most of its information on coral reefs in southeast Florida from the media (46.6%), followed by school (46.4%), friends (20.2%), and brochures and related literature (8.2%). Media sources were most important to US and foreign visitors, whereas school and friends provided more information to residents. Interestingly, brochures and other related literature represented less than 10% of the information that the sample identified. Also, as could be expected, foreign visitors reported receiving the least information via schooling (12.7%), the media (24.3%), and friends (15.9%) on southeast Florida coral reefs. Finally, when compared with the statistics concerning information on coral reefs in general, it is clear that both residents and visitors are less knowledgeable about coral reefs in southeast Florida (74.5%) than about coral reefs in general (93.3%). More southeast Florida residents (95.2%) had heard of coral reefs in general than they had about coral reefs in southeast Florida (82.3%). Similarly, while 93.3% of visitors reported knowledge of coral reefs in general, less than 70% (69.5%) reported similar knowledge of coral reefs in southeast Florida. The largest such difference was reported for foreign visitors, for whom the percentage difference in knowledge of coral reefs in general (87.3%) and in southeast Florida (54%) was 33.3% or one third of all foreign visitors surveyed. 20
21 Visitor Survey Where coral reefs are found VII 14 I 15 VI 14 II 19 III 17 V IV Miles Figure 9: Location of coral reefs in south Florida as reported by visitors 21
22 As per the location of coral reefs in south Florida, almost half the sample (46.3%) identified the Florida Keys as the sole location. Another 9.7% stated that coral reefs are found in parts of south Florida that includes the Florida Keys. Thus, 56% of the respondents believed that the Florida Keys are either the exclusive location for coral reefs in the region or that at least it is one of the main areas where coral reefs are found in southeast Florida. Fewer respondents pointed to any of the four southeast counties as areas where coral reefs are found exclusively (2.5%); instead, they argued more in favor for reefs being found across counties (10.4%). Importantly, over 40% (40.9%) of the sample stated that it did not know where coral reefs are found in south Florida. When the percentages of those respondents who listed a site for coral reefs in south Florida are compared (see Figure 9), it is shown that 95% of the respondents believed that coral reefs are found in the Florida Keys. Among residents, 48.2% reported that corals reefs in south Florida are found exclusively in the Florida Keys, whereas another 12.3% believed that reefs can be found along the region s entire coast. Over a third, or 33.2%, did not know where coral reefs are found in south Florida. Over 44% of all visitors also believed that coral reefs in south Florida are found exclusively in the Florida Keys, and US visitors identified the Florida Keys more frequently (46.3%) than did foreign visitors (33.3%). Also, fewer visitors (6.4%) than residents believed that coral reefs are found along south Florida s entire coast. Altogether, 45.4% of all visitors did not know where coral reefs are found in the region, including over 61% of foreign visitors. These findings show that while both a majority of residents and visitors (indeed the entire sample) reported that they knew that there are coral reefs in south Florida, most of these respondents did not know where the coral reefs are found or held only partial knowledge of reef locations (ex. Florida Keys, Biscayne Bay, etc.). Next, respondents ranked a series of benefits and threats facing coral reefs, where 1 represented the least benefit or threat and 5 represented the greatest benefit or worst threat. The results, presented in average ranks for each benefit and threat, demonstrate the relative importance placed on each activity by the total sample, residents, and visitors. Table 3: Perceived benefits of coral reefs Benefit 1. Habitat 2. Seafood 3. Storm protection 4. Recreation 5. Medicine 6. Biodiversity Total Residents Visitors US visitors Foreign visitors 3.97 (1.45) n = (1.31) n = (1.30) n = (1.35) n = (1.31) n = (1.35) n = (1.33) n = (1.41) n = (1.36) n = (1.30) n = (1.50) n = (1.32) n = (1.26) n = (1.35) n = (1.32) n = (1.54) n = (1.31) n = (1.25) n = (1.35) n = (1.32) n = (1.07) n = (1.37) n = (1.32) n = (1.32) n = (1.28) n =
23 (1.24) (1.25) (1.24) (1.25) (1.04) n = 1653 n = 562 n = 1033 n = 873 n = 1.60 As shown in Table 3, respondents ranked habitat (average rank = 3.97) above other benefits that coral reefs provide. This was followed by biodiversity (3.77) and seafood (3.57). Other benefits, such as medicinal products derived from coral reefs, recreational opportunities, and storm protection were all ranked lower. Interestingly, residents ranked all benefits, with the exception of storm protection, higher than the total sample. Similarly, foreign visitors, with the exception of medicine, also ranked all benefits higher than the total sample. Table 4: Perceived threats to coral reefs Total Residents Visitors US visitors Foreign visitors Threat 1. Boating (1.28) (1.27) (1.25) (1.25) (1.23) n = 1687 n = 573 n = 1055 n = 887 n = Dredging (1.17) (1.10) (1.17) (1.17) (1.13) n = 1664 n = 567 n = 1038 n = 881 n = Touching (1.32) (1.37) (1.29) (1.25) (1.46) n = 1690 n = 575 n = 1056 n = 889 n = Pollution (0.95) (0.95) (0.96) (0.95) (0.96) n = 1707 n = 576 n = 1071 n = 898 n = Fishing (1.18) (1.20) (1.19) (1.16) (1.28) n = 1675 n = 570 n = 1046 n = 882 n = Development (1.37) (1.42) (1.32) (1.31) (1.38) n = 1677 n = 569 n = 1048 n = 881 n = Global warming (1.17) (1.19) (1.16) (1.16) (1.17) n = 1631 n = 552 n = 1017 n = 863 n = Scuba diving (1.26) (1.29) (1.23) (1.23) (1.26) n = 789 n = 345 n = 541 n = 335 n = 106 The total sample ranked pollution (average rank = 4.23) and dredging (4.00) as the most significant threats to coral reefs, followed by global warming (3.81), boating (3.57), development (3.54), and touching (3.53). Other activities, such as fishing (3.05) and scuba or skin diving (2.33) were not perceived as significant as the aforementioned ones. Within the resident sample, respondents ranked all threats except scuba diving higher than did the total sample. To residents, pollution (4.32) and dredging (4.13) represented the foremost threats, followed by global warming (3.89), boating (3.68), and development (3.60). However, as with the total sample, residents generally did not perceive threats to coral reefs from fishing (3.06) or scuba diving (2.30). Finally, tourists also largely perceived the same threats as did the total and resident samples. Interestingly, foreign visitors believed that while fishing represented even less of a threat than did US visitors (2.82 versus 3.09), the former did perceive more problems arising from pollution (4.50), dredging (4.27), and global warming (3.92) than did the resident, US visitor, and total samples. 23
24 These results suggest that respondents largely acknowledged the most obvious threats facing coral reefs, such as those resulting from pollution or mechanical damage (ex. dredgingrelated reef damage and sedimentation impacts). The sample also understood that touching corals may result in damage and thus would represent a threat; however, two findings that were not necessarily expected deserve further attention. First, the sample ranked global warming as among the most serious threats, as it ranked third in the total and all stratified samples. This suggests that while it is unclear whether respondents correlated global warming to the expected impacts of sea level rise and increased incidence of coral bleaching, that the respondents nevertheless acknowledged that the problem may have significant consequences. The second finding of interest was that related to all samples ranking fisheries as the second least significant impact on coral reefs, only above scuba diving. As shown in an earlier section where over 60% of the respondents perceived fisheries as a benefit provided by coral reefs, coupled with the high ranking for seafood as a benefit of coral reefs, that the sample did not accept the view that fishing can have deleterious impacts on coral reefs. Furthermore, it is instructive to note that respondents recognized habitat as a coral reef s most important role and greatest benefit, as it is from the habitat provided that fisheries can be generated. Thus, most respondents did not perceive fishing as a negative activity, as the data suggest that they assigned a mainly instrumental value to coral reefs. This finding is of particular importance for coral reef protection where fisheries may be protected, as the results demonstrate that both residents and visitors are less likely to accept that fishing negatively impacts coral reefs than that fishing is a benefit to be derived from coral reefs. Findings: Willingness to protect coral reefs in southeast Florida and preferred information pathways Beach visitors responded to whether coral reefs should be protected, if they are willing to pay to protect coral reefs in southeast Florida, and the options that they prefer to stay informed on the region s coral reefs. Almost the entire sample (94.9%) believed that corals and coral reefs deserved protection. Within the visitor sample, 953 respondents stated whether they would be willing to pay an additional bed tax into a coral reef protection program fund to be used exclusively to manage and protect southeast Florida coral reefs. Of the total, 61.6% were in favor of paying the amount that they were proffered, and within the 38.4% refused to pay the amount, 15.3% were willing to pay a lower bed tax to help protect coral reefs. The average amount that visitors were willing to pay was $3.14 (SD = 2.83) in an additional bed tax to protect coral reefs in southeast Florida. Within the resident sample, 54.9% of the 556 residents who responded stated that they would be willing to pay an additional sales tax into a coral reef protection fund to be used exclusively to manage and protect southeast Florida coral reefs. Of the 45.1% who stated that they would not pay the amount proffered, 19.1% were willing to pay a lower sales tax. The average, additional sales tax that residents were willing to pay was 0.77% (SD = 0.78). Finally, to stay informed on southeast Florida corals and coral reefs, both residents and visitors stated whether they would prefer media-based announcements, internet alerts, public 24
25 service announcement (PSA), signage, and/or publications and brochures. Figure 8 describes the findings. Percentage Media Internet Community events Preferred outreach option PSA Signage Publications Total Residents Visitors US visitors Foreign visitors Figure 10: Preferred outreach options on coral reefs As shown in Figure 10, a majority in the sample preferred media (television and radio) as the means by which to receive information and updates on coral reefs in southeast Florida. The internet (51%) and signage (42%) were also popular options. The least preferred option among the entire sample was community events, which generated support from 28.9% of the respondents. Community events, as might be expected, were slightly more popular among residents (33.9%) than for visitors (28.6%). Among visitors, it is interesting to note that PSA (28.6%) and publications and brochures (32.8%) were not as popular as the internet (48.3%) and signage (41.4%). Even foreign visitors who are most likely to encounter in-flight PSA did not show much support for that option, and only 23.8% listed it as a preferred source. Discussion The discussion on the visitor beach project is divided into sections that consider the efficacy of the methodology, the general findings, and the importance of the findings to the objectives of the study. The methodology utilized in the visitor beach project served its purpose in yielding a high number of completed surveys, conducted in person and in several locations, and finished over a full season (March 2005 March 2006). It should be noted, however, that the project required that more surveys be conducted during the winter (November April) season than the summer (May October) season. The reason for this was the delay caused by Hurricanes Katrina (August 2005), Rita (September 2005), and Wilma (October 2005). As stated earlier, the impacts of these storms cannot be overstated, as they each disrupted data collection several days prior to their passage and, depending on the effects of the storm, a 25
26 week to months following the event. Visitor totals generally declined in the days leading up to a storm, making data collection ineffective. Then, especially as in the case of Hurricane Wilma 4, impacts led to lower visitor totals after the storm. Figure 11 shows the surveys completed by month. Monthly surveys Mar- 05 Apr- 05 May- 05 Jun- 05 Jul-05 Aug- 05 Sep- 05 Oct- 05 Nov- 05 Dec- 05 Jan- 06 Feb- 06 Mar Total surveys Month Monthly surveys Total surveys Figure 11: Visitor beach surveys completed per month In total, the research team completed 1,157 winter (March April 2005, November 2005 March 2006) surveys, or just under two thirds of the sample (65.3%). The summer surveys, completed between May and October 2005, represented 34.7% (n = 616) of the total. While the sample was definitely skewed to the winter season, the data collected was representative (based on Morris (2004)) for both seasons. Moreover, whereas it was projected that the sampling would yield 40% visitor surveys (based on previous work done in the region), the project yielded 60.2% visitor surveys. As the primary purpose of the project was to assess visitor (i.e. non-resident) opinions on coral reefs, the methodology proved successful in accomplishing that task. Finally, in discussing survey returns, it is important to consider why completed surveys did not approximate the 25 surveys per session estimated in the study proposal. As stated in the visitor study pilot report (Appendix 1), pilot findings suggested that because of a more detailed survey instrument developed by the research team and the AA Team, each survey took an average of 5.9 minutes to complete. While response rates did not decrease between the pilot and full study periods, survey completion time did increase. This is noted by the average number of surveys per session declining from 20.3 in the pilot period to 18.5 during the full period. This was due primarily to bad weather (and thus fewer visitors) during certain sessions that led to a slight decline in overall survey rates. 4 The Miami Herald reported on November 2, 2005 that the City of Fort Lauderdale banned swimming on all of its beaches following Hurricane Wilma s landfall (Miami Herald, 2005). Additionally, data collection that resumed in November 2005 found very low visitor totals and had to be postponed. 26
27 Within the general findings, the data suggested that the most visitors who frequented one of the four beaches were middle to middle-upper class (earning between $50,000 and $100,000) who were mostly repeat visitors who spent an average of 12 days in the region, and participated mainly in swimming as a water-based activity. Also, most visitors had heard of coral reefs, mainly from school and media, but only a few could identify the locations and/or conditions in which coral reefs are found. Fewer visitors knew that there are coral reefs in southeast Florida, and sources of information again were dominated by school and media. Importantly, 46.3% of all respondents identified the Florida Keys as the sole location where coral reefs are found in Florida. Among coral reef function and benefits and threats facing coral reefs, most visitors perceived the resource for its instrument, instead of intrinsic, value, pointing to economic benefits such as fisheries and recreation ahead of biodiversity. Even when asked about benefits and threats, visitors tended to downplay secondary impacts such as fisheries and scuba diving, instead referring mainly to pollution and mechanical damage resulting from dredging. Most visitors were willing to pay for coral reef protection in southeast Florida, and the average amount that they would pay as an additional bed tax was $3.14 to be used as an exclusive fund for protecting the region s coral reefs. Finally, most visitors favored the media and internet as means by which to receive information on southeast Florida reefs over more established sources such as brochures and signage. These findings show that most visitors held basic knowledge about coral reefs, as determined by popular constructions of the marine resource 5. That is, many visitors identified coral reefs in well known areas, such as the iconic Great Barrier Reef, and that they recognized coral reefs as important habitat centers for fisheries and recreation. Visitors were less able to identify the secondary impacts that extractive and recreational activities may have on coral reefs. Also, it is unclear from the findings whether respondents fully understood the impacts that global warming may have on coral reefs, but it was identified as a significant threat among the sample. An important gap in awareness is that visitors were less aware of coral reefs in southeast Florida than they were of coral reefs in general. This was especially true of foreign visitors, who are an important segment of the over 27 million tourists who visited the region in Even where visitors stated that they knew about coral reefs in the region, a majority pointed to the Florida Keys as the sole center for coral reefs in southeast Florida. These results reinforce the apparent means by which visitors obtained their information on coral reefs (ex. media) and how that shaped their opinions on where the resources are found regionally. Finally and most importantly, visitors showed a strong support for the protection of what they believed is an important resource, and most were willing to pay an additional amount to fund that protection. 5 See, for instance, work conducted on perceptions of coral reefs in Australia by Fenton et al. (1998), who report on the importance of how reefs are presented (i.e. marketed). 27
28 Resident phone and mail back survey project The research team developed the resident phone and mail back survey project as a means by which to assess residents knowledge of the region s coral reefs, their perceptions on the benefits provided by and threats facing coral reefs, and to identify information mechanisms that could be used to increase awareness among local communities. Rationale and methodology The rationale for this project was to assess resident understanding of and views on coral reefs using a survey approach that would yield a statistically significant sample from the region s resident population. The initial methodology, employed from June to August 2005, called for the use of randomly selected telephone numbers to contact and interview respondents in each of the four counties. This methodology acknowledged the potential problems in obtaining high return rates, based on technology such as Caller ID and the prevalence of cellular phones, and the research team estimated that the response rate would not exceed 10%. The procedures adopted for this approach consisted of: 1. Calling each number from 10 am 8 pm; 2. Trying a total of SIX (6) times before removing the number from the list; 3. Contacting and interviewing any member of the household who is a resident of the County (having resided in the County for over 12 months); 4. Maintaining lists of all rejections, non responses, and nonworking numbers. The research team conducted a pilot period in June 1-3, 2005, during which a total of 20 surveys were completed, at a response rate of 10% (see Appendix 3 for a copy of the resident phone survey instrument). Based on the findings of the pilot period, the research team commenced with the full survey period in June The first county selected for completion was Miami-Dade County. By August 2005, the project had completed a total of 79 surveys. However, return rates did not exceed 5%, as a result of residents either not answering their phones or stating a lack of interest in the study. In late August 2005, Hurricane Katrina passed over south Florida, delaying data collection. With Hurricane Rita shutting down operations in September 2005 and Hurricane Wilma affecting southern Palm Beach, all Broward, and much of Miami-Dade Counties, data collection was halted until after the 2005 holiday season. The research team decided that it could not expect to receive an increase in response rates with residents recuperating from hurricane damage and preparing for the holiday season. In January 2006, the research team decided that it would change its methodology from phone surveys to mail back surveys. The decision was reached because of the fact that phone surveys did not prove effective, in terms of their response rates, and also because of disruption resulting from the hurricanes in 2005 that affected telephone service in many areas and made residents even less willing to participate in phone surveys. The research team selected the mail back survey methodology because of the following reasons: Mail back surveys provided the best means by which to reach residents in all four counties; the 28
29 surveys could be conducted in the study time period, and; the mail back survey methodology was cost effective. In terms of reaching residents in all four counties, the research team considered intercept surveys and mail back surveys as alternate methodologies to phone surveys. It decided on using mail back surveys because these assured that there would be no location (and socioeconomic group) bias, in terms of where the intercept survey is conducted. The research team also favored mail back surveys because it was already conducting two, separate intercept surveys (visitor beach surveys and registered boater surveys) that would capture residents. The second factor that favored a mail back survey was the time period of the study. The alternate methodology was to be applied in January 2006, and with a mail back survey, the research team could prepare and mail surveys to a resident sample, obtain and code responses, and conduct analysis within a period of 90 days. Finally, the research team favored mail back surveys because these represented the most cost effective methodology, in terms of reaching a randomly selected group of residents across the large, four county region. It is important to emphasize two aspects of change in methodology. First, as stated in the introduction, the research team employed a flexible approach to data collection, in order to be able to complete each project even where selected methodologies proved insufficient. Thus, the research team, upon determining that phone surveys would be a suboptimal format for surveying southeast Florida residents, exercised its flexibility in switching the methodology to mail back surveys. Second, when the research team made the decision to switch methodologies, it did so in accordance with accepted social science research design theory and techniques. That is (as described below), the mail back survey methodology followed research design protocol (West, 1996; Babbie, 1990). In January 2006, the research team decided that it would send out a total of 12,000 resident surveys to 3,000 residents in each of the four counties in southeast Florida. The first 1,000 residents in each county would receive surveys where the willingness to pay amount for coral reef protection was 1%, the second 1,000 residents would receive surveys where the amount was 2%, and the third 1,000 residents would receive surveys where the amount as 3%. Because the survey format would now involve the respondent filling out and returning the survey, the research team worked closely with the AA Team in developing a suitable cover letter that described the exercise, the need for participation, and additional information on the study. The research team also offered a FDEP coral reef brochure to residents who sent back a completed survey. The research team modified the survey template that was used across all projects to ensure that questions were formatted in a manner that they were easy to interpret and fill out, and that the survey was able to be completed in a timely manner and simple to mail back. Finally, the research team decided that it would send both English and Spanish versions of the survey to all Miami-Dade residents. By February 6, 2006, the research team put together a team that assisted with survey preparation, envelopes, and labels. Each survey was sent out with a business reply envelope, such that respondents would not incur costs for returning surveys, and each survey was also coded to determine the zip code of the respondent (for post-survey, data analysis, especially as related to GIS). All 12,000 surveys were mailed out February 10, 2006, and the first set of returns was received on February 16,
30 Findings The findings are presented in two sections for the resident surveys. This first section describes the findings from the 79 Miami-Dade phone surveys, conducted between June 1, 2005 and August 20, The second section describes finding from the 581 mail back surveys received between February 16, 2006 and March 23, Findings: Phone surveys The research team contacted a total of 1,500 Miami-Dade County phone numbers to obtain 79 phone based interviews. A majority of the phone numbers (900 phone numbers or 60% of the total) dialed were not answered during the six times that the phone was called. If that total were considered a general non response, then the effective success rate was 13.2%. However, this still demonstrates that over 500 persons contacted did not wish to participate in the study. Because these findings are consistent with those determined in the other projects, it is suggested that the methodological findings (i.e. return rates) show that a majority of the southeast Florida population may be largely ignorant about coral reefs and coral reef issues; that is, many of the persons contacted in this and other project surveys did not believe that coral reefs were important enough such that they would answer questions about the topic. Also, as discussed in the resident mail back survey, it could be that many residents simply lack knowledge about coral reefs, leading to their unwillingness to participate. Of the 79 respondents who participated in the resident phone surveys, 63% had lived in southeast Florida for 10 years or longer. The average length of residency was 20.2 years (SD = 15.8). The average age of the respondents was 4.85 (SD = 1.63), or between years old. The median age in the sample was between years old, and 59% of those surveyed were 55 years or older. In terms of education, a large percentage (46%) held a college degree. By contrast, only 9% had not completed high school (and this included respondents who were still in high school). Thus, the sample represented a well educated group that proportionally was more educated than the Miami-Dade County population (just over a fifth of that population held a college degree, as according to the 2000 US Census). Finally, the sample was skewed considerably towards certain race/ethnic groups; almost 42% of the respondents identified themselves as Caucasian, 39.5% as Hispanic/Latino, and only 8% as African American. Two thirds of the residents surveyed, or 67%, had participated in a water-based activity in the past two years. Swimming was the most popular activity (60.7%), followed by boating (25.3%), fishing (20.3%), and snorkeling and diving (10.2%). By contrast, only 5% reported sailing, and 2.8% and 1.4% listed kayaking and surfing, respectively. Finally, no respondent listed taking a glass bottom boat trip in the past two years. When compared with other samples, while these respondents reported generally lower overall percentages, the percentage trends were similar. That is, within most samples, swimming, boating, and fishing dominated as the most popular water-based activities in southeast Florida. Over 87.3% of the sample had heard of coral reefs, and the main sources of information were the media (49.4%), school (34.2%), friends (22.8%), and brochures and literature (13.9%). Although almost 90% of the respondents reported knowing about coral reefs, less 30
31 than a third knew where coral reefs are found. Only 58.2% knew that there are coral reefs in southeast Florida, with the main sources of information again being the media (31.6%), school (17.7%), friends (16.5%), and brochures (8.9%). Interestingly, however, all sources of information declined, as more respondents did not know about coral reefs in southeast Florida than they did about coral reefs in general. Only 20.2% provided an exact location where coral reefs are located in southeast Florida, and the most common location was off all southeast Florida beaches (8.9%). These results are important in that they show that most residents knew less about coral reefs in southeast Florida than they purported to know about coral reefs in general. Because most of the sample was well educated and had been living in the region for over a decade, these results suggest that residents may be largely unaware of the coral reefs and their ecological and socioeconomic value to the region. Even though there was considerable ignorance concerning coral reefs in southeast Florida among the residents surveyed, most (82.3%) were in favor of protecting the resource. Fewer respondents (26.8%) were willing to pay an additional sales tax of between 1-3% to protect them, and the average, additional sales tax was 0.26% (SD = 0.53). Respondents were most in favor of the media (72.2%) as a means by which to be provided information of coral reefs in southeast Florida. Other, less popular sources included publications (26.6%) and the internet (24.1%). However, community events were not perceived as important, as only 15.2% of those surveyed listed them as a preferred information source. Of even less relevance were PSAs (10.1%) and signage (6.3%); residents may have viewed these more as information sources for visitors. Findings: Mail back surveys The research team sent out a total of 12,000 surveys to a randomly selected group of residents in the four counties (or 3,000 surveys per county), and it received a total of 619 surveys (refer to Appendix 4 for a copy of the resident mail-back survey instrument). This corresponded to a return rate of 5.2%, which was lower than expected. The total and county return rates are shown in Figure
32 Returns Miami-Dade Brow ard Palm Beach Martin Total County Return rate (in %) Returns Return rate Figure 12: Resident survey returns and return rates Martin County had the highest return rate, at 7.1% (213 returns), followed by Palm Beach County (5.8% return rate, with 175 returns), Broward County (4.0% return rate, with 120 returns), and Miami-Dade County (3.5%, with 106 returns). These returns were much lower than expected, especially when compared to registered boater survey returns obtained in recent Boating Research Center studies (Villanueva, personal communication). However, other mail-back survey efforts (see for instance Suman et al., 1999, for a description of return rates from environmental group members in Miami and the Florida Keys) have proved less effective (in terms of return rates) in the region. It is unclear whether the 2005 hurricanes affected return rates, but the few undeliverable surveys suggest that changes in addresses had not occurred. Notwithstanding the lower than expected returns at the county level, the survey effort did succeed in obtaining 619 returns which, if considered as part of the entire region s population, represents a significant sample. Thus, the resident results are presented mainly as a single sample, rather than stratified at the county level. Finally, it is important to recall that this resident project was only one of five efforts that obtained resident data. The other projects, concerning visitors, registered boaters, consumptive and nonconsumptive stakeholders, and marine industries, also collected resident data that can be used to assess local knowledge of and attitudes towards coral reefs. Figure 13 below spatially demonstrates the return rate by zip code in each county. As can be determined, most of the returns were from the northern two counties. It is also interesting to note that returns may have been biased towards coastal zip codes in each county. 32
, with over three quarters (76.5%) having resided in southeast Florida for ten or more years. The average age group within the sample was 5.4 (SD = 1.")
33 Figure 13: Resident survey returns by zip code Demographic data collected from the mail back surveys showed that respondents had been residents for an average of 22.6 years (SD = 15.5), with over three quarters (76.5%) having resided in southeast Florida for ten or more years. The average age group within the sample was 5.4 (SD = 1.44), or between years old (24%) and years old (16.4%). However, the most common age group among respondents was 65 years or older, which represented 31.4% of the sample. Within southeast Florida, residents 65 years or older comprised 16.7% of the population in 2000, although there were more senior citizens in Martin County (23.2% of the total population) than in the other three counties. Thus, the percentage of respondents 65 years or older was over-represented in the sample. Over 75% (75.7%) of the sample was Anglo-American, 12.7% was Hispanic, 4.3% was African-American, and 1.4% was Asian/Pacific Islander. When compared to the demographics of the region using the 2000 US Census data, it is shown that Anglo- Americans (or whites) represented 72.5% of the region, African-Americans represented 18.6%, and Asian/Pacific Islanders represented 1.7%. Within the US Census grouping, Hispanic/Latino is not considered as a race category; therefore, the 33.4% Hispanics/Latinos of the 5.13 million residents in 2000 belong to one of seven race categories. However, it is clear that African-Americans were under-represented in the present sample. This was due in part to a greater proportion of returns from Martin County 33
34 (which had the fewest African-Americans as a percentage of the county s total population in the region in 2000), and it was also a result of fewer returns from African Americans in other counties. The same was true of returns by Hispanics/Latinos, who represented over 33% of the 2000 population but only 12.7% of the sample. This may again be a result of higher returns from Martin and Palm Beach Counties, where the percentages of Hispanics/Latinos was 7.5% and 12.4% of the total population, respectively. As per education levels, most of the sample was very well educated. Over half (54.3%) of the respondents reported holding a college degree (29.9%) or having done post-graduate studies (24.4%), and only 16.7% had a high school diploma or less (it should be noted that 10.5% of the respondents were under 24 years old, and these age groups reflected the high school education percentages). The 2000 Census data showed that 24.1% of the regions residents over 25 years old held a bachelor s degree or higher; thus, the present sample overrepresented higher education levels. A majority of those surveyed (77.5%) stated having participated in water-based activities in southeast Florida in the past two years. Figure 14 below shows the most popular activities. Percentage Swim Snorkel/dive Fish Boat/jetski Sail Surf Glassbottom boat Water-based activity Figure 14: Resident water-based activities in southeast Florida The most popular activities were swimming (65.3%), boating (36.2%), fishing (36%), and snorkeling/diving (29.6%). By contrast, only 3.6% of the respondents reported taking a glassbottom boat tour, less than 7% went surfing, and only 9.7% sailed. These findings suggest strong levels of participation in most southeast Florida water-based activities, including those that may be related to coral reef use (ex. snorkeling/diving and fishing). 34
35 Percentage Knowledge School Friends Media Brochures Sources of information on coral reefs Coral reefs Coral reefs in southeast Florida Figure 15: Source of information on coral reefs in general and in southeast Florida As shown in Figure 15 above, over 92% of sample reported having heard of corals and coral reefs, compared to 86.1% who had heard of corals and coral reefs in southeast Florida. The media comprised the dominant source of information, providing 69.5% and 62% of information on coral reefs in general and in southeast Florida, respectively. Friends, or word of mouth, proved to be an important source on coral reefs in southeast Florida, but schooling provided more information on coral reefs in general. Finally, brochures and related literature were least important, as these were reported by only 30% of the respondents as information sources. These findings suggest that residents relied on different sources of information for coral reefs in general than for coral reefs in southeast Florida. While media sources were most important for both aspects of coral reef knowledge, respondents tended to rely as much on local knowledge (as represented by friends) for coral reefs in southeast Florida as they did on school. This may have been due to not all residents having been schooled in southeast Florida, but it may also be a result of age groups of the residents surveyed. For example, when the results of the younger population of residents surveyed as part of the visitor survey project are compared with the present sample, it shows that a higher percentage in the former group (49%) listed school for information on coral reefs in southeast Florida than did the present sample (40.4%). These differences may suggest that younger residents did indeed receive more information on local marine resources in school than did their older counterparts. Residents ranked the benefits provided by and threats facing coral reefs (see Table 5). Among benefits, habitat provided by coral reefs (4.32) ranked above others, followed by biodiversity (3.97), seafood (3.81), recreation (3.72), and storm protection (3.59). Medicine (3.14) ranked at the bottom of perceived benefits. In terms of threats facing coral reefs, dredging ranked as the most serious threat (4.45), followed by pollution (4.38), development (3.87), touching (3.51), and global warming (3.44). By contrast, fishing (2.52) and boating (2.87) were not perceived to be as threatening as the others. These findings were consistent with the activities listed by the respondents. Among the most popular activities were fishing 35
36 and boating, in which over a third of the respondents participated; their perceptions on the impacts of these activities therefore may have been partly derived from their experience. However, it is important to note that the residents surveyed did not rank fishing (an extractive activity, unless catch-and-release is practiced) as an activity that impacts coral reefs. Much as their visitor counterparts, residents ranked seafood as a strong benefit, and thus both groups may perceive coral reefs in terms of their instrumental (or use) values. These findings, as in those reported for visitors, are important in that they demonstrate the potential lack of support among residents for coral reef management strategies that may involve fishery closures. Table 5: Benefits from and threats facing coral reefs Total Total Benefit Threat 1. Habitat 4.32 (1.16) n = Boating 2.87 (1.39) n = Seafood Dredging 4.45 (1.43) (1.06) n = 502 n = Storm protection 3.59 (1.40) n = Touching 3.51 (1.42) n = Recreation Pollution 4.38 (1.32) (1.08) n = 498 n = Medicine 3.14 (1.43) n = Fishing 2.52 (1.31) n = Biodiversity Development 3.87 (1.26) (1.29) n = 466 n = Global warming 3.44 (1.48) n = 453 Over 93% (93.5%) surveyed agreed that coral reefs deserve protection, but of that total, only 36.4% were willing to pay an additional sales tax (of either 1%, 2%, or 3%) to be added to a coral reef protection fund that would be used exclusively to protect coral reefs in southeast Florida. Among those who were asked to pay 1%, just over half (50.5%) were in favor of the additional tax. That support dropped to 32.1% among those asked to pay 2% and 26.1% among those asked to pay 3%. Thus, as the percentage solicited increased, support for the fund decreased; however, the average amount offered by those unwilling to pay the percentage requested increased, suggesting that residents were willing to pay a smaller percentage than solicited. For instance, 24% of those who refused to pay 1% were willing to pay an average of 0.37% (SD = 10.15). Similarly, 65.6% of those who refused to pay 2% were willing to pay an average of 0.74% (SD = 0.29). Finally, 65.4% of those who refused to pay 3% were willing to pay an average of 0.87% (SD = 0.42). Overall, the sample was willing to pay an additional 0.65% tax (SD = 0.51) for coral reef protection, compared to 0.59% (SD = 0.44) among those asked to pay 1%, 0.65% (SD = 0.42) among those asked to pay 2%, and 0.68% (SD = 0.50) among those asked to pay 3%. 36
37 Finally, residents reported on how they would like to remain informed on coral reefs in southeast Florida. Among the sources available were passive sources such as media (TV, radio), publications and brochures, signage, and PSA, and more (inter)active sources such as community events internet sites and alerts. Figure 16 shows the relative importance of each source to the respondents. Percentage Media PSA Internet Signage Community events Information source Publications Figure 16: Preferred information sources on coral reefs in southeast Florida As shown in the figure above, the most important sources that residents preferred to be informed on coral reefs in southeast Florida were media sources (85.8%) and publications (63.5%). Less than half of the respondents preferred the other sources, with the internet (46.4%) ranking ahead of community events (44.4%), signage (33.1%), and PSA (30.9%). The latter two sources may have been perceived to be of more interest to visitors, as only a third or fewer residents listed them as preferred information sources. Discussion The discussion on the resident survey project focuses on two aspects of the project. The first aspect concerns the efficacy of the methodology, as determined by the response rates and findings. The second aspect relates to the ramifications of the findings, in terms of their usefulness to the development of management recommendations. As stated earlier in this report section, the research team changed its methodology to surveying southeast Florida residents, from a telephone survey of randomly selected households, to a mail back survey that included the mailing of 12,000 surveys to randomly selected, home addresses in the four-county region. The research team made the change based on low response rates from telephone surveys, which it attributed to persons screening their calls and hurricane effects on both telephones and persons willingness to participate. An additional reason may have been the increasing reliance on cellular phones among the regional population (Leeworthy, personal communication). 37
38 It was expected that response rates from a mail back survey would reach 20%, based on previous work conducted by the University of Miami Boating Research Center (BRC) in the region (Villanueva, personal communication). The research team even added Spanish version surveys to the surveys sent to all Miami-Dade residents to ensure that Spanish speakers would get an opportunity to participate. Also, the cover letter sent with each survey described the research and the need for participation, as well as offering a free brochure to be mailed to each respondent. Finally, surveys were conducted in the winter to ensure that part-time residents would be in southeast Florida to receive them. However, the overall return rate did not exceed 5.2%, and while Martin and Palm Beach County residents responded more frequently than their Broward and Miami-Dade counterparts, none of the county return rates exceeded 7.1%. Moreover, because undeliverable surveys made up only a small percentage of the total surveys sent (0.25%, or 30 undeliverable surveys), it had to be assumed that a majority of the respondents did receive the surveys and that general non response bias did not play a significant role in return rates. It is suggested instead that the low return rates were most likely due to two, different factors, both of which may affect future, mail-based surveys and related research. The first factor was related to the general population surveyed for the project. In other mail back surveys conducted in southeast Florida, response rates exceeding 20% have been achieved for industry or group-specific surveys (Muñoz-Carpena et al., 2003; Shivlani, 2000, and BRC, 1991, among others); however, few general surveys as this one have been conducted with southeast Florida residents. The second factor affecting response rate was likely related to the content of the survey; that is, of the surveys received, almost all the respondents knew about coral reefs in general (92%) and coral reefs in southeast Florida (86.1%). Among the resident sample in the visitor survey project, only 82.3% knew of coral reefs in southeast Florida. Thus, it was likely that the response rates may have been (at least) partially biased towards those residents who knew about coral reefs in southeast Florida. Notwithstanding the issues discussed above, it is argued that the resident sample obtained from the mail back survey project provided important information on resident knowledge of and attitudes towards coral reefs. The information could be most useful when the resident sample results are used in conjunction with those obtained for the residents surveyed in the visitor survey project. The percentages of age groups within both samples are presented in Figure
39 35 30 Percentage Less than 18 years years years years years years 65 years and older Age group Visitor survey project Resident survey project Figure 17: Comparison of resident age groups in visitor and resident survey projects As shown in the Figure 17, visitor survey project obtained considerable data for the age groups that the resident survey project did not, and vice versa. At least in terms of resident knowledge and attitudes concerning coral reefs on an age basis, results from both projects could be used to determine important similarities and differences. Another aspect of the project findings that is important is that the findings likely represent the knowledge and attitudes of highly educated and informed residents, as determined by the education profile and stated knowledge of coral reefs in general and in southeast Florida, and that they may even represent the most informed segment of the resident population in the region. 39
40 Stakeholder interview project The research team developed the stakeholder interview project as a means by which to obtain more in-depth, qualitative information on coral reef conditions and trends in southeast Florida, as related by representatives of various stakeholder groups in the four county region. Unlike the other projects that relied more on rigid questionnaires, the stakeholder effort focused more on an open-ended approach that facilitated discussion and provided stakeholders more opportunity to provide information they believed was important to the study. The stakeholder interview project was developed as one part of three efforts to assess stakeholder knowledge, attitudes, perceptions, and beliefs of coral reefs in southeast Florida. The other two efforts, which are discussed further in the report, were comprised of the marine industry electronic mail and telephone survey project and the registered boater field intercept survey project. Rationale and methodology Stakeholders in this project (and the other two stakeholder efforts) were defined as those users that directly interact with the affected resources and are a subset of a larger, affect population. Previous research in the region (Suman et al., 1999; Shivlani et al., 2003; Shivlani et al., 2005) had led to the identification of several stakeholder groups that rely directly on marine resources and which could be divided into consumptive and nonconsumptive users. Consumptive users or stakeholders are comprised of all fishing interests, including commercial fishers, charterboat operations, headboats, and other for-hire operations, and recreational fishers (including consumptive divers) and their respective oreganizations. The commercial fishers rely directly on the products (ex. fish and shellfish, among others) extracted from the coastal and marine environment. The for-hire operations (and recreational fishers) may also rely on extractive activities, but they may also exercise catchand-release guidelines. Nonconsumptive users are comprised of an array of environmentally-friendly (or ecotourist ) operations, including diver and snorkel charters, kayak and other light craft rentals, and birdwatching and other nature excursion guides, as well as the group loosely defined as the marine industry, comprised of service industries (marinas, boatyards, bait shops, and others) that rely on are provide services to other stakeholder groups. Nonconsumptive stakeholders, like consumptive stakeholders, rely directly on the marine resources, but in a non-extractive manner. Their views on marine resources tend to be more preservation-based than those of their consumptive counterparts. Marine industry groups tend to be further removed from direct contact with the resources but do rely on a healthy coral reef ecosystem to be able to provide their services to the aforementioned stakeholders. As in other projects in the study, the research team worked in tandem with the AA Team to develop guiding questions for the interviews such that data collection was not limited by survey-type questions but still allowed for a structured approach under which data collected can be compared within and between stakeholder groups (please refer to Appendix 6 for a copy of the stakeholder interview questionnaire). Stakeholder interviews were completed and stored as narratives on a database, and tools such as content analysis were used to systematically determine areas of convergence between respondents. 40
41 The research team decided that it would complete 15 interviews per county, or 60 interviews for the entire four-county region, for the project. This was decided because the objective of the project was to conduct in-depth, open-ended interviews rather than focus on a representative stakeholder sample. The research team and AA Team also discussed the composition of stakeholder groups within each county, and it was decided that the major consumptive and nonconsumptive stakeholder groups would be represented in equal proportion. Therefore, the research team categorized the aforementioned stakeholder inventory into commercial fishers and processors, recreational fishing groups, clubs, and organizations, for-hire fishing charters, dive and snorkel operations, and marinas and boatyards, and the methodology called for the completion of three interviews per county of each of the five stakeholder groups. Stakeholder group identification and inventory included consulting a variety of sources, including published and gray literature, government lists, commercial sources, organizational rosters, key contacts, and word of mouth, to compile stakeholder inventories. These included recent studies on stakeholder groups; organization lists from groups (and from the AA Team, which provided excellent contacts and assistance); and a comprehensive inventory of all listed and advertised commercial stakeholders. The research team identified 158 stakeholders in Miami-Dade County, 170 in Broward County, 119 in Palm Beach County, and 51 in Martin County 6. Using these lists, key stakeholders were contacted and requested to participate in the study via personal interviews. The interviews were scheduled to commence in August 2005 but had to be postponed until January 2006 due to the delays resulting from the hurricane season. The field period lasted from January to March 2006, leading to the completion of 60 interviews from the four county region. Findings The findings from the interviews are presented by county, but comparisons within types of activities are also discussed, where relevant. Also, data (ex. descriptive statistics) for the 60 interviews are only presented where they demonstrate pertinent trends or results. Martin County The smallest of the four counties considered in the study, Martin County contains the northernmost portion of the southeast Florida coral reef ecosystem (Andrews et al., 2005). The coral reef is relatively close and runs parallel to the shoreline. The research team identified the fewest stakeholders in Martin County, which is in part a reflection of the county s low population compared to the southern counties. The project interviewed the required total of 15 stakeholders, and the composition of the stakeholders was as follows: 6 Please note that the stakeholder lists developed for each county did not include commercial fishing operations; instead, the operations were interviewed opportunistically (by contacting fish processors who provided names of knowledgeable fishers). According to the Florida Fish and Wildlife Institute (FWRI), there were 1,780 Saltwater Products License (SPL) holders in the four county region in 2005, of which 41.5% fished out of Miami-Dade County, 30.4% out of Palm Beach County, 15.6% out of Broward County, and 12.5% out of Martin County (FWRI, 2006). 41
42 1. Three charter, or for-hire, fishing operations, of which two were head boats and one was a smaller, charter fishing operation; 2. Three commercial fishing interests, of whom two were commercial fishers and one represented a local commercial fishing organization; 3. Three diving interests, comprised of two dive shops and one that represented local diving knowledge, concerns, and interests; 4. Three marinas; 5. Three recreational fishing/boating interests, of which there was a bait and tackle store, a boating club, and a recreational fishing club. On average, the stakeholders interviewed had an average tenure of 26.2 years (SD = 15.8) in Martin County, suggesting considerable local knowledge. While not all were commercial enterprises, those that were employed an average of 12.9 employees (SD = 17.9), although there was considerable variation among the number of employees, depending mainly on the type of organization. Interestingly, almost all of the stakeholders interviewed stated that their groups did not use much of Martin County s nearshore marine environment, in that they reported considerably higher use in the northern (St. Lucie County) and southern (Palm Beach County) areas. The northern areas were most often reported by fishing and boating interests, whereas the dive operations reported traveling to Palm Beach County natural and artificial reefs. There were two main reasons why local resources were not used on an exclusive. The first reason was the small size of Martin County, which led to the use of marine resources in adjacent counties. The second reason was the condition of resources in the county (especially as reported by dive operations), which were generally reported as declining and/or poor, and which necessitated travel to other areas. Also, fishers and fishing organizations that reported fishing for pelagic (open water) species tended to fish further offshore. Among those stakeholders who reported extractive, or even catch-and-release, fishing uses, the species that were most commonly mentioned were pelagic fin fish, especially highly migratory ones like king mackerel (Scomberomorus cavalla) and Spanish mackerel (Scomberomorus maculates). Also reported, but less frequently, were reef fish, such as snappers and groupers. The dive operations stated that the recreational diver population in Martin County includes many who practice hunting (spearfishing) or diving for lobster. In fact, one of the respondents reported that 60% of his operation s clients are consumptive divers (spear fishers). While most of the stakeholders believed that their groups targeted trips to local coral reefs, almost all added that coral reef use (especially diving) was more extensive to the south. That is, the coral reefs in Martin County were considered usable, but because stakeholders considered the extent and condition of these resources to be limited and poor, respectively, they reported more coral reef use in southeastern, Palm Beach County. Also, it should be noted that apart from the diving and some fishing interests, most stakeholders felt that offshore areas were more important to their groups than coral reefs (at least from a use perspective). This was especially true of the commercial fishing interests interviewed, who reported most of their use in offshore waters for the aforementioned pelagic species. 42
43 A majority of the stakeholders felt that their group and the general population did not know much about coral reefs in southeast Florida. While some argued that the high levels of ignorance were due to the large snowbird, or seasonal resident, population in the county, others felt that it was a result of indifference. As stated by one respondent, in the past when people lived off the ocean, they cared. Now, as stated by another, reefs represent a place to stick a fishing pole in the water and catch fish. Of even more concern to many respondents was that the level of knowledge concerning reefs has been decreasing over time. While none of the stakeholders identified a reason for this decline, those who take out others on fishing or diving trips reported that their groups do provide information to their clients. Apart from these efforts, many felt that the government (local and state agencies) should be involved in providing information on coral reefs. One of the persons interviewed stated that the government should utilize innovative media approaches (ex. TV commercial, radio jingles, etc.) to promote coral reef awareness rather than relying on more traditional ones, such as workshops. Most respondents who commented on the condition of coral reefs in Martin County believed that the coral reefs had declined significantly. As discussed below, stakeholders representing dive interests believed that the coral reefs had been smothered by sedimentation; one noted a significant decline in coral cover in local areas. Importantly, none of the stakeholders interviewed suggested that the condition of coral reefs in Martin County had improved or even remained unchanged. Almost all of the stakeholders believed that the primary problem facing Martin County s coral reefs (and its marine environment) is the runoff from inland agricultural areas (ex. Lake Okeechobee) that pulses through Indian and Saint Lucie Rivers during the summer. These discharges, which several respondents believed transport heavy metals as well as nutrients, have destroyed most types of fishing in the nearshore environment. Many of the commercial and recreational fishers added that bait fish, which were once plentiful in these areas, are almost non-existent. Diving interests believed that the increased sedimentation loads arriving as a result of agricultural runoff, coupled with eutrophication, have reduced water visibility to less than 20 feet (rendering diving futile in nearshore waters). Among other activities that may impact coral reefs, most pointed to development as a driver. Several pointed out that development is an indicator of population, and as the latter increases, so does development. With an increase in population, Martin County has experienced more land-based pollution, as well as vessel-based pollution, according to many respondents. One of the stakeholders stated that Peck Lake (located adjacent to local Peck Lake County Park) has experienced tremendous declines in patch reef coral cover due in part to coastal development, resulting in increased coastal pollution and higher recreational fishing pressure. Other stakeholders argued that development has affected the very population of users that relied on coral reefs and other marine resources and had resulted in a shift in the user types. Commercial fishing, dive operations, and marinas stated that with increasing coastal property values, the county faced a gentrification threat which, if not controlled, would lead to the elimination of dock space for working waterfront interests. Commercial fishing respondents added that they were being further impacted by rising energy prices, which had led to several in their group to migrate to southeastern Palm Beach County, where fishing grounds are relatively closer to shore. 43
44 Asked how coral reef management should proceed in their county, most Martin County residents reiterated that land-based pollution, especially that emanating from inland agricultural sources, needs to be controlled if local coral reefs are to survive. Many believed that current management was effective, but some added that with increased resources being diverted to homeland security activities, that the enforcement side of management was being undermined. Not many respondents were in favor of taxing a particular user group to fund coral reef protection, and commercial fishing interests countered that their group often pays more than other groups for resource access (ex. federal commercial reef fish licenses could cost upwards of $24,000, according to one respondent). Similarly, most stakeholders did not believe that alternative management strategies such as zoning should be implemented to protect coral reefs. This may have been due to the fact that a majority of the respondents did not believe that fishing impacted coral reefs, but even among those who felt otherwise, zoning was not considered a reasonable option. Fishers argued that zoning would not achieve greater protection (again, due to pollution impacts) and may in fact increase user conflicts in reduced area available following zoning closures. Finally, almost all stakeholders felt that the enforcement system does not need to be changed (ex. to incorporate more interpretative or penalty-based approaches), but that the amount of enforcement in terms of vessels and personnel needs to be increased. Moreover, because respondents generally did not associate boating, fishing, or diving impacts of coral reefs, their views on enforcement were less related to coral reef protection than to fishery resource management. Palm Beach County The research team identified 147 stakeholder operations in Palm Beach County, comprised of boat charters, dive operations, fishing charters, marinas, recreational fishing groups and fishing interests, and retail fish markets (this did not include the bait and tackle stores or commercial fishers who were interviewed on an opportunistic basis). The project interviewed the required total to 15 stakeholders, and the composition of the stakeholders was as follows: 1. Three charter, or for-hire, fishing operations; 2. Three commercial fishing interests, of whom two were commercial fishers and one operated a retail fish market; 3. Three diving interests, comprised of dive shops; 4. Two boat rental/charters and a recreational marina; 5. Three recreational fishing/boating interests, of which there were two bait and tackle store and a recreational fishing club. Most of the stakeholders interviewed had been in operation had been in operation for 10 years or longer (93.3%), and the average tenure in the county was 20.4 years (SD = 17.6). While the commercial fishing and charter fishing operations were general single person businesses, others such as the dive shops and marinas had several employees. On average, the stakeholders had 3.3 employees (SD = 2.57). 44
45 Almost all of the stakeholders interviewed stated that their group used the marine resources in Palm Beach County, although commercial fishers and charter fishing operations did report trips to northern areas (with one commercial fishing operation listing Georgia as a fishing area). Dive operators also stated that they sometimes took extended charters to the Florida Keys, but this was not a common occurrence. As for reef use, many stated that they did not regularly use Palm Beach County coral reefs because of the relative paucity of the resource, especially as compared to southern areas. By contrast, dive operators reported using natural reefs in the county for as much as 75% of their use, whereas the remaining 25% was spent on artificial reef sites. In terms of extracting resources from coral reefs, only the commercial fishers reported doing so, and that too was done sparingly, due again to the perceived scarcity of coral reefs in the region. The main fisheries reported by commercial and recreational fishing interests were highly migratory species such as king mackerel and offshore pelagics (ex. dolphin, wahoo, tuna). Dive shops stated that they did cater to extractive divers but made it clear that these types of users represented either a seasonal clientele or a decreasing one. One dive operation surveyed stated that it had stopped allowing spear fishing altogether, and it was moving to a resort dive model. Among those dive operations that still allowed extractive diving, they listed spiny lobster diving as the most popular extractive activity among recreational divers in Palm Beach County. However, even these dive shops reported that they did not allow both nonconsumptive and extractive diving in the same trips (or at least discouraged such mixed trips). These findings are consistent with those reported for dive shops in the Florida Keys (Shivlani and Suman, 2000), where operators preferred not to have mixed trips, and only 5% allowed any type of spear fishing. As among Martin County stakeholders, most Palm Beach County stakeholders believed that their groups (and the general public) had a limited knowledge (86.7%) about coral reefs; moreover, 60% believed that the knowledge base has not increased in their tenure. According to one stakeholder, most people believe that reefs provide fish, and that is all they know. Another felt that his and other groups take reefs for granted, and that the knowledge is based mainly on the fishing provided by reefs ( I have never been asked for reefs for more than how good the fishing is ). Yet another argued that apathy is rampant among his and other groups. Respondents provided a list of information sources from which they believed that their group obtains coral reef knowledge, and these included magazines, TV shows, dive certification courses, and government agency literature. However, most of these sources were considered insufficient, as several stakeholders pointed out even with producing more directed literature, it is not certain that targeted groups will absorb the information. One stakeholder believed that the problem lay with reefs (and other marine resources) being an invisible resource, such that if something were to happen to them, these impacts are largely unobserved ( out of sight, out of mind ). Instead, this stakeholder and others called for the development of more accessible information sources, using methods similar to those that have promoted dolphins and manatees in the public consciousness. Another stakeholder suggested government agencies use existing information sources/pathways to ensure that certain groups receive coral reef-related information. This could include sending out coral reef literature with renewal commercial fishing license applications, providing 45
46 material that could be used to deliver a presentation on coral reefs during diver certification courses, and other such targeted approaches. A majority of those interviewed, or 54%, believed that coral reef conditions had declined in Palm Beach County over their experience. While no single reason dominated, response trends suggested that stakeholders believed that land based sources relating to development played an important role in reef decline. Interestingly, however, most respondents did not identify land-based pollution related to agricultural runoff as a major stressor, as did the stakeholders in Martin County; instead, many believed that while pollution may have been a problem in the past, regulations and best management practices had greatly reduced (at least, direct) sources. Instead, the consensus seemed to be that development has resulted in deteriorating water quality, increased use levels, displacement of traditional uses, and new, inexperienced users, all of which contribute to the decline of the already limited coral reef areas in the county. Most stakeholders reported disappointment on local, or county, level efforts to manage coral reefs. One person felt that management is not concerned about coral reefs as they are mainly out of public view. Several others claimed that there was no management of coral reefs at all in their area, in that the resource was simply not being protected. Asked whether they could support a surtax or license fee to fund a coral reef protection program, most stakeholders declined, arguing either that user fees would hurt the participants who most respect and protect the resource (especially in the case of dive operators) or that there was no guarantee that the funds would not be diverted for other, unrelated purposes. Conversely, there was more support among the stakeholder for establishing marine protected areas, which 53% of the respondents supported in some capacity. Several of these persons argued that if there are to be closures to protect reefs and reef resources, that the closures be temporary. Others added that it might be useful for management to consider rotational closures, where a series of sites are left alternatively open and closed. However, many of the respondents who disagreed with marine zoning of any kind did so because they believed that the already taxed enforcement system could not control violations in such areas. A majority of those interviewed felt that enforcement was already stretched, and some charter and commercial fishing stakeholders argued in favor for more punitive enforcement for recreational violations ( they get away with a slap on their wrist but we have too much at stake to break the rules ). Broward County The research team identified 208 stakeholder operations in Broward County, comprised of boat charters, dive operations, fishing charters, marinas, recreational fishing groups and fishing interests, and wholesale and retail fish markets. The project interviewed the required total to 15 stakeholders, and the composition of the stakeholders was as follows: 1. Three charter, or for-hire, fishing operations; 2. Three commercial fishing interests, of which two were commercial fish houses and one was a wholesale/retail fish market; 3. Three diving interests, comprised of dive shops; 4. Three recreational marinas; 46
47 5. Three recreational fishing/boating interests, of which two were recreational fishing organizations and one was a public boat ramp facility. Of the 15 stakeholders interviewed, a majority (86.7%) had been in Broward County for over 10 years and thus represented considerable local knowledge. The oldest of the organizations represented among the stakeholders had been in operation for 67 years. On average, the stakeholders had been in the county for 28 years (SD = 15.8). As in the other counties, commercial and charter fishing organizations generally had fewer employees, and on average, the stakeholders had 13.4 employees (SD = 11.8), with the largest organization having 35 employees. Use of Broward County marine resources ranged considerably, based on the stakeholders. For example, commercial fishing interests reported that the county was only barely used by commercial fishers, due in part to regulations and the dominance of charter and recreational fishing fleets (both in terms of competition for fishery resources and dockside space). Conversely, dive operations surveyed stated using Broward County reefs on almost an exclusive basis (apart from when they took longer trips to the Florida Keys). Also, unlike in the northern counties, reef use tended to be more nonconsumptive among the stakeholders, as all dive operations reported not allowing spear fishing on a regular basis, most recreational fishing groups reporting a rise in catch and release fishing in the region, and charter fishing operations suggesting that they allow landings only for personal consumption and only of certain food species (ex. snappers and groupers). Moreover, as stated previously, with commercial fishing interests reporting limited commercial harvest from the region, the stakeholders appeared to suggest that Broward County coral reefs may be moving towards de facto protected status (at least in terms of resources extracted from such sites). Interestingly, unlike their counterparts in the northern counties, Broward County stakeholders believed that half of their group members knew a considerable amount about coral reefs, 28.6% had some knowledge, and only 21.4% had little to no knowledge. Over 86% of these respondents believed that the extent of knowledge had increased over time. Experience (42.8%) was listed most often as the means for learning about reefs, followed by publications and other literature (21.4%) and dive certification or boating courses (14.3%). One respondent did state that coral reef awareness has increased in the county because of the attention that the resource has received in more recent years, due ironically to the impacts that coral reefs have sustained and to the level that they have declined. In terms of improving the knowledge base among stakeholders, respondents believed that dive certification courses, fishing license renewals, and other such targeted approaches should be the conditions under which coral reef literature and/or presentations should be provided. Thus, the sample preferred a stakeholder specific education strategy over a general public education strategy. All but one of the respondents believed that reef conditions have declined in Broward County. The main reason stated for that decline was pollution, which 78.6% of the sample argued was destroying the coral reefs. Unlike the agriculture-based pollution reported by Martin County respondents, Broward County stakeholders believed that the pollution affecting their reefs emanated from coastal development activities, namely from outflow 47
48 pipes and non-point, land based sources. The former was often identified as the main reason why coral reefs in the region were diseased, smothered by algae, or otherwise bleached, whereas non-point source pollution was identified as resulting in deteriorating water quality. To reverse this trend, many stakeholders called for better funded, stronger laws and enforcement. Others called for specific actions to address stakeholder ignorance, such as mandatory boating classes and increased community education. But, not many stakeholders were in favor of alternative funding strategies, such as user fees and license fees. Also, while most stakeholders were generally in favor of some type of zoning strategy, those respondents who extracted fishery resources were vehemently opposed to marine protected areas. One of these opponents argued that the reef line is too small in Broward, and there is not enough enforcement as it is, claiming that zoning would be too restrictive and unenforceable. Another felt that all that is left in the county is sportfishing, and that there is no longer much local seafood production; therefore, by closing off the coral reefs, it would only hurt the few remaining commercial fishing operations. Finally, most respondents were in favor of having more enforcement, but many qualified their answer by adding that enforcement needs to be primarily interpretative. The reason given for this was that most violations occur due to ignorance, and these could be better addressed by education than by penalties. Respondents were also in favor of having a scaled enforcement system, where repeat offenders should be penalized accordingly (ex. where a first infraction leads to a warning, and subsequent infractions lead to increasing penalties). Miami-Dade County The research team identified 184 stakeholder operations in Miami-Dade County, comprised of boat charters, dive operations, fishing charters, marinas, recreational fishing groups and fishing interests, and wholesale and retail fish markets. The project interviewed the required total to 15 stakeholders, and the composition of the stakeholders was as follows: 6. Three charter, or for-hire, fishing operations; 7. Three commercial fishing interests, of which two were commercial fishers and one was a commercial fish house; 8. Three diving interests, comprised of dive shops; 9. Three recreational marinas; 10. Three recreational fishing/boating interests, of which two were recreational fishing clubs and one was a recreational fishing tournament organization. Generally, the Miami-Dade County stakeholders represented a long history of marine resource knowledge in the region. Over 86% of the respondents had been in the county for 10 or more years, and the average tenure by stakeholder was 28.7 years (SD = 18.5). One organization had been in existence since the 1920s. On average, the groups had over 7.8 (SD = 6.1) employees per operation/organization, but there was a wide range of employees, based primarily on the type of operation; as in the other counties, single vessel operations, such as those of commercial and charter fishers, tended to have fewer employees than dive shops and marinas. 48
49 All the respondents reported accessing the waters and marine resources off Miami-Dade County, and several stated that they traveled as far southeast as Key Largo. However, none of the stakeholders reported traveling to the upper counties. This was a contrast in the trends reported for the other counties where there was more travel to adjacent counties. Also, respondents reported targeting more and different species in the county than the upper three counties. These included stone crab, blue crab, and shrimp, all of which were reported as being target species for the commercial fisheries; this information is corroborated by the most recent commercial landings for Miami-Dade County (FWRI, 2006). Most stakeholders (46.7%) stated that most of their group members were very knowledgeable about coral reefs, and another third felt that their groups were somewhat knowledgeable. Only 20% believed that their group members had very little knowledge about coral reefs. These findings are similar to those reported by Broward County stakeholders but different than the Martin County and Palm Beach County resident findings. In the latter two counties, a majority of stakeholders believed that their group members had limited knowledge on coral reefs. This may be due in part to the higher concentration of coral reefs in the southeastern two counties, as well as their relative proximity to the Florida Keys. Most Miami-Dade respondents (86.7%) believed that stakeholder knowledge of coral reefs had increased over time, but several who provided this answer stated that the increase in knowledge has been a result of greater media exposure of deteriorating reefs. Sources of information concerning coral reefs among Miami-Dade County stakeholders varied considerably, but the most important source identified was experience (35.7%), and it was the source most often provided by commercial, charter, and recreational fishing interests. By contrast, dive shops identified dive certification courses as the main source of information, which one dive stakeholder related had adopted coral reef awareness as part of the certification process. In terms of improving awareness, respondents believed that media would be the best way to teach the general public, but others added that education should be tailored to the specific group. Thus, such stakeholders felt that recreational vessel registration and fishing licenses should require an education course that would include information on coral reefs. As remarked by one of the dive operators, while awareness among certain user groups is high, to most people, coral is just a rock. Over 93% of the sample believed that coral reefs were declining in the region, and only one stakeholder felt otherwise. The main reasons given for the decline varied more than they did in the other counties, and they included pollution (50%), overuse (35.7%), and development (14.3%). Many respondents believed that pollution resulting from the canals in southeastern Miami-Dade County and sewage outflows were responsible for coral reef declines. As stated by a commercial fishery stakeholder, some of the (stone crab) traps grow grass in three days due to the large amounts of nutrients pumped into the waters. However, others believed that it was the over-utilization of the resources that was leading to a coral reef decline. Several blamed overfishing in general and commercial fishing in particular as the main reasons for the decline. This is to be contrasted with the more development and agricultural pollution explanations provided by stakeholders for coral reef decline in the other counties. In Miami-Dade County, where there still exists a marginal fishery, some members of other stakeholder groups believed that it was overfishing that has led to a coral reef decline. 49
50 When asked how to improve coral reef management, most respondents suggested that more funding be provided for management and enforcement. The latter was an especially important aspect of coral reef management in Miami-Dade County, where most respondents believed that penalty-based, rather than interpretative, enforcement should be used to control violations. Several respondents also called for more basic management measures, stating that there is a need to install mooring buoys in many parts of Miami-Dade County, that the county needs a coral reef management plan, and that there needs to be a cohesive political effort on part of the county and cities to protect coral reefs, among others. Most respondents were against increasing license fees or adding user fees to fund coral reef protection, and over half the sample favored some type of zoning strategy (including the aforementioned use of mooring buoys). Several stakeholders also raised the issue of improving enforcement, suggesting that current modes of enforcement were poorly funded and understaffed. Yet others pushed to have boat and fishing license renewals be part of a management strategy, and they coupled those recommendations with a more interpretative enforcement program. 50
51 Marine industry electronic mail and telephone survey project The marine industry project involved the use of electronic mail technology to reach stakeholders in the marine industry associations of the four counties in southeast Florida to determine industry knowledge, attitudes, perceptions, and beliefs on the region s coral reefs. The marine industry project served as the second prong in the three prong approach to survey stakeholders. Rationale and methodology The rationale for this project is described in the previous section, concerning stakeholder interviews. Like that project, the marine industry project sought to reach a sample of marine industry associations to determine how this group of stakeholders differs from the direct use stakeholders and the registered boaters in its knowledge of and opinions concerning southeast Florida coral reefs. The sample was developed using two marine industry association lists: The Marine Industry Association of South Florida (MIASF) and the Martin County Marine Industry Association. Unlike as suggested in the study proposal, the research team decided to complete a census survey instead of a random sample survey. That is, the research team extracted all addresses for MIASF and Monroe County Marine Industry Association and generated a distribution list. Next, the research team created a PDF (Adobe Acrobat) survey document which respondents could fill out on their computer and back to the research team directly, or they could fill it out, print it, and mail or fax it back to the research team (refer to Appendix 7 for a copy of the survey instrument). Respondents were also given the option of printing out the survey and then filling and mailing or faxing it back. Once the survey instrument was completed, it was submitted to the AA Team for consideration and then tested within the research team for consistency. The advantages that this approach promised were that respondents would have the ease of completing an electronic version of a survey, that respondents could be contacted very quickly compared to other methods (ex. mail), that follow-up s could be sent relatively simply (and quickly), that data could be entered directly into a database, and that the approach would be cost-effective. However, even though the research team conducted a census and did so using proven technology, return rates (discussed in more detail in the next subsection) did not meet expectations. Even after a second round, return rates did not improve. To determine whether the low return rates were related to problems with filling out the survey in electronic format, problems with returning the survey using , or problems with working with this type of technology, the research team decided to conduct a short, non-response bias, followup survey. This survey, conducted over the phone with a randomly generated list of marine industry association members, determined why the previous approach had not yielded higher return rates and, equally importantly, whether the technology utilized would work in future studies. 51
52 Findings The research team sent out the PDF version of the marine industry association survey, along with a cover letter in the , to 822 members of the two industry association groups in February Of this total, 235 addresses bounced back, which meant that these were undeliverable. Of the 587 surveys that were presumably received by association members, the research team received a total of 27 returns. After a two-week period, the research team decided to re-send the surveys to all members again, and it included a note in the that a member of the research team may contact the association member at a later date in case the survey is not returned. In March 2006, when only 30 surveys (return rate = 5.1%) had been collected, the research team implemented the telephone, non-response bias survey. It randomly selected a group of 300 association members that team members than contacted over a two-week period to determine whether the respondents received the survey and, if so, then why they had chosen not to return a completed copy. Of the 300 persons contacted, the research team completed 40 surveys, which resulted in a 13.3% return rate. However, the effective return rate was higher, as 71 of the 300 members contacted were unreachable. This meant that the completed surveys represented an effective return rate of 17.5%. When contacted, each randomly selected member was requested to reply why that person chosen not to complete the ed survey. Most respondents could not confirm whether they had received the , as they commonly claimed that if they did not recognize the sender, they would delete the . Others added that they would not open attachments unless they could recognize the senders. Finally, some respondents stated that they rarely check their . As stated previously, of the 229 members contacted, 40 agreed to complete the survey over the phone. Of the 189 that refused to participate, 24% chose not to participate because they felt that the survey did not affect their industry. This finding is of particular importance, as it shows that as in the other samples, a large percentage of the marine industry believed that coral reefs are not related to their occupation; that is, about a quarter of those who refused did not understand the importance of coral reefs to the marine environment in southeast Florida. These misperceptions, which were also noted as a potential reason for the low return rate among residents in the resident survey project, suggest that the several segments of the southeast Florida population may not fully understand or appreciate the natural, social, and economic values provided by coral reefs. Among the 70 industry association members that participated in the survey project, just under half (48.5%) sold, serviced, or otherwise catered to vessels. Another 12.9% represented marinas. The remainder of the sample consisted of insurance brokers (4.3%), consulting firms (4.3%), publishing companies (2.9%), promotions firms (2.9%), and others. Most of the industry members interviewed (60%) employed ten or fewer employees. However, the sample did contain responses from a few larger companies (24.6%) that hired more than 20 employees. An equal percentage of respondents reported their company being in operation for 1 to 5 years and over 30 years (17.9%), and the average length of operation was 3.8 (SD = 2.15), or 16 to 20 years. 52
53 Less than half, or 42.7%, of the respondents reported that their companies directly accessed the marine environment, and to most of these companies, all coastal and marine areas (40%) were equally important, followed by nearshore areas (36.7%) and offshore areas (20%). Among the 95% of respondents who reported that their clients access the marine environment, most (59.1%) believed that all of their clients access the marine environment, followed by 10.6% who believed that between 76-99% of their clients access the marine environment. Overall, 86.4% estimated that half or more of their clients access the marine environment (i.e. the marine environment is therefore important to the respondents operations). When asked to rate the quality of coastal and marine resources in southeast Florida, 54.5% and 47.1% rated mangroves and beaches in good to excellent condition, respectively. However, only 33.8% believed that seagrasses were in good to excellent condition, and even fewer respondents (23.9%) agreed that coral reefs were in good to excellent condition. But, it is noted that the number of respondents stating that they did not know about the condition of a resource generally increased as the resource concerned was located further from shore: Beaches (8.8%) < Mangroves (16.2%) < Coral reefs (23.9%). When the means of the quality of each resource are compared (where 1 = very poor resource condition and 5 = excellent resource condition), they show that respondents ranked mangroves highest in resource quality (mean = 3.63; SD = 0.92), followed by beaches (mean = 3.5; SD = 0.86), sea grasses (mean = 3.18; SD =0.96), and coral reefs (mean = 2.9; SD = 1.0). Importantly, respondents ranked coral reefs as being slightly below fair conditions (fair = 3), suggesting that, apart from the part of the sample that did not have sufficient knowledge to comment on coral reef conditions, there was concern among respondents that coral reefs were the least healthy of all local marine ecosystems. Almost 89% of the sample agreed that coral reefs in southeast Florida deserved further attention, but only 35.9% were willing to pay an additional, 1% sales tax to be used to establish a coral reef protection fund. The average willingness to pay among the sample was 0.36% (SD = 0.48). As shown in Table 6, when asked about benefits provided by and threats facing coral reefs, the sample ranked habitat (mean = 4.50) as the primary benefit derived from coral reefs, and pollution (mean = 4.52) as the primary threat. Among other important perceived benefits, respondents ranked biodiversity (mean = 3.97) and recreation (mean = 3.83) as such. Storm protection, seafood production, and medicine were considered important as well, but these were clearly secondary to the aforementioned benefits. Following pollution, respondents ranked dredging (mean = 3.91), and development (mean = 3.72) as major threats facing coral reefs. Others, such as touching (mean = 3.61) and global warming (mean = 3.25) were considered less imminent threats. However, as observed in other project samples, marine industry association members did not consider boating, scuba diving, or fishing as threats to coral reefs. This may be partly due to the fact that a majority of the sample represented the boat manufacturing and service industry; however, as stated above, it is important to emphasize that the view that extractive activities such as fishing do not threaten reefs (at least as much as other threats) is consistent across most groups. 53
54 Table 6: Benefits from and threats facing coral reefs Total Benefit 1. Habitat 4.50 (0.81) n = Seafood 3.58 (1.23) n = Storm protection 3.60 (1.32) n = Recreation 3.83 (1.14) n = Medicine 3.16 (1.15) n = Biodiversity 3.97 (1.01) n = 58 Total Threat 1. Boating 2.35 (1.32) n = Dredging 3.91 (1.37) n = Touching 3.61 (1.28) n = Pollution 4.52 (0.91) n = Fishing 2.29 (1.06) n = Development 3.72 (1.19) n = Global warming 3.25 (1.32) n = Scuba diving 2.25 (1.34) n = 60 Finally, marine industry association members listed their preferred sources of information. The most popular of these sources was the media (54.3%), followed by the internet (41.4%), and community events (28.6%) and PSAs (28.6%). The least important information sources were brochures (25.7%) and signage (18.6%). Thus, much like the other groups, the marine industry tended to favor TV and radio as the means by which they wanted to stay informed on coral reefs in southeast Florida, although over 40% did favor the internet 7 and almost 30% preferred community events, suggesting a certain preference towards interactive events. Discussion The marine industry and phone survey project results highlighted two important findings. The first was that participation rates within the group were low in part because many industry members perceive that their activities do not impact and/or are not related to coral reefs. The second finding of importance was that even though this survey focused on 7 It is instructive to consider that while 4 out of 10 respondents stated that they preferred internet sources, the marine industry association survey results showed that /internet-based surveys proved mostly ineffective. While one part of this was due to potential respondents unwillingness to open unverified messages, and another part was due to a percentage of the population that did not identify their interests with coral reefs (and the marine environment), several of the persons interviewed professed to either not have checked their or been unable to complete the PDF survey. These results in part suggest that although respondents from this and other groups may have stated a preference towards internet sources, they may not be able to fully access that information. 54
55 a specialized group of marine industries, the results suggested the industry shares mostly the same amount of knowledge on coral reefs as do other groups, and that like its counterparts in the other projects the industry exhibited a high level of support for coral reef protection in southeast Florida. The fact that many industry association members selected not to participate suggests that these members most likely did not align their economic interests with the condition of coral reefs in southeast Florida. Anecdotally speaking, many of the businesses contacted argued that they did not know enough about reefs to complete a survey, while others added that their operations were exclusively land-based and therefore did not concern or impact coral reefs. These perceptions show that in a region that is entirely coastal 8, many economic concerns could not identify the importance of one of the area s most unique ecosystems. However, those businesses that chose to participate generally agreed that coral reefs were among the least healthy of southeast Florida resources, that coral reefs provide important ecological and economic benefits, and that they would support coral reef protection. These results were consistent with those obtained for the other groups, showing that even though respondents across samples may not fully comprehend the ecological and socioeconomic value of coral reefs in southeast Florida; there nevertheless remains a basic conservation ethic towards the resource. This baseline of support may in turn be used to generate greater awareness via targeted education and outreach opportunities. 8 Under the Florida Coastal Management Program, the State of Florida's coastal zone includes the area encompassed by the state's 67 counties and its territorial seas (DEP, 2006). 55
56 Registered boater field intercept survey project The registered boater survey project, which consisted of a mail-back survey component and a field intercept survey component, represented the final prong in a three prong approach to characterize southeast Florida stakeholders in terms of their attitudes, perceptions, and beliefs concerning coral reefs. Registered boaters are comprised of a diverse set of stakeholders themselves, including recreational fishers, divers, and pleasure boaters, among others, who interact often quite frequently with the region s coastal and marine environments, including southeast Florida s coral reefs. Rationale and methodology The rationale for this project is described in the first of the two stakeholder sections, concerning stakeholder interviews. Like that project, the registered boater survey project sought to reach a sample of registered boaters to determine how this group of stakeholders differs from the direct use stakeholders and marine industry in its knowledge of and opinions concerning southeast Florida coral reefs. Moreover, as stated previously, registered boaters represent a variety of stakeholder interests, and the present project provided an important opportunity in both demonstrating the boaters various uses of coral reefs determining how their knowledge of and attitudes towards coral reefs may differ from general visitor and resident populations and their stakeholder counterparts. The initial methodology called for conducting a mail-back survey, developed in cooperation with the AA Team, which would yield a representative sample of registered boaters over the study area. Previous research with registered boaters in south Florida and a recent study with Palm Beach County registered boaters (Villanueva, personal communication; BRC, 1991) had established greater than 20% return rates. The research team assumed a binomial distribution for the registered boater population for each county and determined that it would need to mail out a 2,000 surveys per county, or 8,000 surveys in total, to receive the sample required. The research team also decided to utilize many of the questions used by a previous BRC study (BRC, 1991) in gathering more information from respondents who identified themselves as consumptive or nonconsumptive users (refer to Appendix 5 for a copy of the survey instrument). Finally, the research team opted to develop a pilot version of the survey that it would mail out to a randomized list of 200 registered boaters, to determine return rates, ensure that survey questions were answered and were applicable, and identify other factors (ex. survey length) that may affect survey returns. Due to very poor return rates (described in more detail in the following sub-section), the research team decided to change methodology from mail-back surveys to field-intercept surveys. The latter technique was adopted because it had functioned effectively in the visitor survey project of the present study (where beach visitors were randomly surveyed using a field intercept approach), it had been used in previous registered boater studies (ex. BRC, 1991), and it provided an alternate means by which to reach the same stakeholder group, using a well-established survey methodology (Alreck and Settle, 1985). The revised methodology called for field intercept sessions to be conducted in a minimum of three sites per study region (i.e. county). The sites consisted of recreational marinas, which were selected in terms of their regional use (such that more heavily used marinas were 56
57 favored over lesser used ones) and to maximize intra-county coverage. Data collectors intercepted exiting or returning boaters and requested participation in the survey project. As an enticement, boaters who agreed to participate were provided with a series of local charts. Survey sessions were set up to coincide over weekend days, to increase survey returns, and they took place during morning and early afternoon hours. Findings As part of the pilot session for the initial methodology calling for mail-back surveys, the research team sent out a total of 200 surveys to randomly selected registered boaters in the four-county region on January 3, By January 10, 2006, only seven boaters returned completed surveys, representing a return rate of 3.5%, which was considerably lower than the estimated 20% return rate. Although the research team would have otherwise considered modifications to the methodology (ex. increasing the number of surveys mailed, decreasing the length of the survey, etc.), it decided to adopt a field intercept approach due mainly to the large number of undeliverable addresses. Over a quarter of the 200 surveys sent, or 27% (54 surveys) 9, could not be delivered. Due mainly to the unreliability of the registered boater address database, the research team concluded that modifications could not ensure sufficient returns and thus aborted the mail-back methodology. The field intercept approach commenced in early February and spanned over ten sessions (or ten weekend days), which were conducted on an opportunistic basis. That is, sessions were planned for every weekend day but were only conducted under favorable weather conditions. When the forecast called for 15 miles per hour or greater wind conditions, the research team did not conduct field intercept surveys, as boaters generally avoided going out in such weather. Also, due to the time and effort required to conduct field sessions, the research team decided that it would conduct a two county survey project, using the data collected from those counties to determine registered boater views on coral reefs. Other projects within the study also incorporated boater views (ex. 36.2% of residents surveyed by mail and 24.3% of visitors surveyed in person reported boating in southeast Florida over the past two years, respectively, and both the stakeholder interview and marine industry and telephone survey projects included boaters and boating organizations as part of their samples), and it was concluded that the combined efforts identified much of the boating community s attitudes, perceptions, and beliefs. The research team selected Miami-Dade and Broward Counties due to their large registered boater population and various marinas that could provide intra-county coverage.. The results for each county are described separately. 9 Undeliverable mail represents a general non-response and is usually excluded from the total sample to generate a net return rate. In the registered boater pilot session survey, the net return rate was 4.8%, based on 7 returns from a net mailing of 146 surveys (since 54 were undeliverable). 57
58 Miami-Dade County boater surveys Within Miami-Dade county, the research team identified Haulover Marina (northern section), Rickenbacker Marina and Crandon Park Marinas (central section), Dinner Key Marina (south-central section), and Black Point Marina (south section) as intercept sites. It adopted a methodology that called for the completion of a minimum of 60 surveys per section, with an overall goal of reaching 385 surveys Between January 14, 2006 and March 5, 2006, the research team used five data collectors to conduct a total of 10 sessions at five marinas (representing 21 outings, as several sessions involved multiple marina outings). The data collection locations and dates, as well as weather conditions, are shown in Table 7. Table 7: Boater field intercept survey sessions Session date Weather conditions Marinas surveyed January 14, 2006 Lo: 55 o F; Wind: 37 mph Black Point, Crandon, Dinner Key, Haulover, Rickenbacker January 22, 2006 Lo: 72 o F; Wind: 32mph Crandon, Dinner Key, Haulover January 28, 2006 Lo: 66 o F; Wind: 30 mph Black Point, Crandon, Rickenbacker January 29, 2006 Lo: 68 o F; Wind: 22 mph Dinner Key, Haulover February 4, 2006 Lo: 57 o F; Wind: 36; rain: 2.64 in Black Point, Black Point, Rickenbacker February 5, 2006 Lo; 52 o F; Wind: 26 mph Black Point February 12, 2006 Lo; 48 o F; Wind: 24 mph Crandon, Rickenbacker February 26, 2006 Lo; 59 o F; Wind: 32 mph; showers Rickenbacker March 4, 2006 Lo: 62 o F; Wind: 20 mph Black Point March 5, 2006 Lo: 63 o F; Wind: 18 mph Black Point, Rickenbacker As shown in the Table 7, the dates sampled encountered considerable weather problems, especially as related to temperature and wind. Average wind conditions affected sampling more than temperature, as the former led to fewer boaters going out on the water. Another factor affecting the number of boaters at marinas may have been the high gas prices. Averaging well over $2.00 per gallon during the survey period, the price of gas increased by 21.6% from February 2005 to February 2006 (Department of Labor, 2006); this increase may have negatively impacted the number of boaters. Therefore, it is emphasized that the major impediment to data collection was the lower number of boaters taking trips rather than low rates of participation; in fact, data collectors reported upwards of 90% response rates among boaters. Overall, the research team conducted a total of 356 surveys over the 21 outings, or 10 sessions, averaging 16.9 surveys per outing, or 35.6 surveys per session. A total of 75 surveys were completed for four marinas; in Dinner Key Marina, data collection lagged compared to the other marinas due to poor participation and thus resulted in the completion of 56 surveys. The 356 surveys represent a 5.19% confidence interval at a 95% confidence level. Almost 91% of the respondents identified themselves as full-time, southeast Florida residents; the rest were either part-time residents (3.4%) or non-residents on vacation (3.4%). Most Miami-Dade County resident boaters identified waterfront zip codes as their 58
59 domiciles 10, with Coconut Grove (8.6%), Palmetto Bay (7.2%), and Key Biscayne (3.3%) leading all locations. Over 92% (92.6%) of the sample had heard of coral reefs and a similar percentage (91.9%) knew that there were coral reefs in southeast Florida, with school (50.3%) being the primary source of information. By contrast, 37.1% learned about coral reefs from media, 31.5% from friends, and 20.2% from brochures and other literature. The percentage of boaters who reported learning about coral reefs in school were similar to those reported by southeast Florida residents (51%), but a higher percentage of the latter group received information on coral reefs from media sources (67%) than did registered boaters. Also, more boaters knew about coral reefs in southeastern Florida than did respondents from any other sample. A majority of boaters identified habitat (78.1%), fisheries (57.0%), and biodiversity (53.6%) as coral reef benefits, while less than half identified recreation (49.2%), storm protection (43.5%) and medicine (32.9%) as such. As with respondents in the other projects, boaters ranked consumptive benefits highly, although more boaters acknowledged the importance of biodiversity as a benefit than did other project samples. Table 8: Benefits from and threats facing coral reefs Total Benefit 1. Habitat 4.67 (0.84) n = Seafood 4.08 (1.25) n = Storm protection 3.64 (1.37) n = Recreation 4.14 (1.19) n = Medicine 3.30 (1.45) n = Biodiversity 4.41 (0.98) n = 299 Total Threat 1. Boating 3.22 (1.32) n = Dredging 4.25 (1.21) n = Touching 3.59 (1.49) n = Pollution 4.46 (1.10) n = Fishing 2.73 (1.32) n = Development 3.83 (1.33) n = Global warming 3.53 (1.41) n = 281 As shown in the Table 8, boaters tended to reinforce their views on coral reef benefits from the previous questions when asked to rank individual benefits. The most important benefit offered by coral reefs for boaters was habitat, followed by biodiversity, recreation, and seafood. Storm protection and medicine were considered less important benefits. Interestingly, when the threats to coral reef are compared, it is shown that boaters ranked 10 Waterfront zip codes were identified as those which are located east of US Highway 1. 59
60 fishing as the lowest threat, even below boating. Thus, as with the other groups, it is clear that boaters assigned an instrumental value to coral reefs, as reservoirs of biodiversity that provide recreational and seafood benefits. Activities that most threatened these systems, as reported by the sample, were pollution, dredging, and development (these views were also consistent with the other groups). Over 93% (93.3%) of the boaters surveyed agreed that coral reefs deserve protection, and over half (52%) were willing to pay the percentage of sales tax increase they were proffered. Overall, respondents were willing to pay an average of an additional 0.95% sales tax (SD = 0.96) for the protection of coral reefs in southeast Florida. Among preferred information sources, most boaters (68.8%) favored media (TV, radio) sources. Other sources that ranked highly were the internet (41.3%), publications (35.7%), and community events (28.9%). Signage (27.0%) and public service announcements (24.5%) were considered less important. These findings were generally consistent with those reported for residents, who also did not favor signage and public service announcements. These results suggest that residents (as most boaters were residents) do not favor information sources that they may perceive as created for tourists, such as signs and short announcements. Respondents reported on their most frequent activities on their trips. The most popular activity listed was cruising, for which the average response was most of the time (mean = 1.92; SD = 1.50), followed by swimming, in which respondents participated between most of the time and half of the time (mean = 2.54; SD = 2.54). The most popular consumptive activity 11 was recreational fishing, which the sample on average reported conducting half of the time (mean = 2.65; SD = 1.70). Overall, 43% of those surveyed reported fishing on all trips, and over 63% fished on half or more of their trips. The average rates of participation per activity are shown in Table The survey did not request that respondents differentiate between catch-and-release and take fishing. 60
61 Table 9: Boater activity participation rates Activity Always Most of the time Half of the time Rarely Never Mean 1. Recreational fishing (1.70) n = Water-skiing (1.26) n = Land activity (picnic, etc.) (1.38) n = Snorkeling (1.61) n = Diving (1.57) n = Swimming (1.63) n = Cruising (1.50) n = Commercial fishing (0.89) n = 264 Other 7% Bahamas 4% Offshore 17% Intercoastal 5% Florida Keys 4% Biscayne Bay and Miam i 63% Figure 18: Most frequent boater destinations/locations Figure 18 above shows the distribution of the most frequent locations listed by the Miami- Dade County boaters surveyed. Most listed parts of Biscayne Bay, including the islands within or north of Biscayne National Park (Key Biscayne, Elliot Key, Soldier Key, and 61
62 others) and central and north Miami (including Miami Beach), followed by 17% who stated that they took offshore trips, which included reefs located on the ocean side of Biscayne National Park (Fowey Rocks, Star Reef, etc.) and out to the Gulf Stream. Fewer respondents reported traveling to the Florida Keys (which includes Florida Bay) and the Bahamas. Thus, between trips taken within the intercoastal and Biscayne Bay, most boater use was local. Over two-thirds of the boaters (68.5%) stated that they had heard of the State of Florida s fisheries regulations. The most common source of information on regulations were a mixture of other sources, which comprised of license renewal forms, magazines, and other sundry sources, and these provided information to 37.1% of the respondents. Almost 20% (19.7%) received fisheries regulation information from the internet, 14.0% from mail, and 4.2% from attending meetings. Interesting, a considerable percentage, or 14.9% (which was greater than the percentage that received information from mailings or meetings), reported receiving fisheries regulation information by word of mouth. Finally, the boaters were asked to estimate how many persons out of 100 persons fishing in the area frequented by the respondents would be stopped and have their catch inspected by a State of Florida Fish and Wildlife Conservation Commission officer. While 19.1% reported that they could not estimate the frequency of inspections, among the respondents who provided an answer, the most common response was between 1-24 persons (64.4%), followed by none (17.8%), and between persons (9.7%). In fact, only 8.3% of those that responded believed that half or more of persons fishing in their areas would be stopped and have their catch inspected. These percentages are generally consistent with those reported in other studies concerning fisheries regulation enforcement (see Milon et al., 1997, for views on such enforcement in Florida Keys fisheries), suggesting that there is low confidence among user groups on such matters. Broward County boater surveys Within Broward County, the research team selected John U. Lloyd State Park, Hollywood Marina, Cooley s Landing, Las Olas, and Harbour Towne as the five sites at which to conduct intercept surveys. However, after a very poor session at the Las Olas site, where only five surveys were completed in over four hours, the research team decided to eliminate that site. Between March 6, 2006 and July 5, 2006, the research team used three data collectors to conduct a total of 20 outings/sessions. Data collection occurred on weekend dates, except for those dates when wind conditions or weather conditions (i.e. rain) prevented fieldwork. As with the Miami-Dade surveys, data collectors who conducted Broward County surveys reported that while response rates were high, there were relatively few boaters, even during favorable weather conditions and in marinas that are otherwise very well frequented (if not congested). Overall, the Broward County boater surveys yielded a total of 340 surveys over the 20 outings, representing an average of 17 surveys per outing (or session). Most surveys were completed in John U. Lloyd Park (220 surveys), followed by Harbour Town (130 surveys), 62
63 Hollywood Marina (61 surveys), Cooley s Landing (23 surveys), and Las Olas (23 surveys). The 340 surveys represent a 5.2% confidence interval at a 95% confidence level. Over 90% (90.3%) of the boaters surveyed identified themselves as full-time, southeast Florida residents, and most of these were Broward County residents. Only six respondents, or 1.8%, stated that they were part-time residents, and another 5.3% (or 18 respondents) stated that they were tourists. Almost 96% (95.7%) of the sample reported having heard of coral reefs, and 93.5% knew that there were coral reefs in southeast Florida. The primary sources of information on coral reefs were school (52.1%), media (44.7%), friends (30.9%), and brochures and other literature (27.4%). These sources of information for Broward County boaters were similar to those reported by Miami-Dade County boaters; however, the Broward County sample relied more heavily on media (44.7%) than did its Miami-Dade County counterpart (37.1%). However, both samples of boaters relied less extensively on media sources than did the southeast Florida resident sample (67%). Respondents from the Broward County sample rated all coral reef benefits very highly; that is, over half of the boaters surveyed identified habitat (92.7%), recreation (76.2%), fisheries (71.2%), biodiversity (61.8%), storm protection (62.9%), and medicine (52.1%) as important coral reef benefits. By contrast, less than half Miami-Dade County boaters identified recreation (49.2%), storm protection (43.5%) and medicine (32.9%) as important coral reef benefits. In both samples and other projects, boaters ranked consumptive benefits such as recreation and fisheries highly, although more Broward and Miami-Dade Counties boaters acknowledged the importance of biodiversity as a benefit than did other project samples. Table 10: Benefits from and threats facing coral reefs Total Total Benefit Threat 1. Habitat 4.71 (0.84) n = Boating 2.75 (1.45) n = Seafood Dredging 4.40 (1.39) (1.08) n = 318 n = Storm protection 3.66 (1.42) n = Touching 3.63 (1.49) n = Recreation Pollution 4.60 (1.15) (0.90) n = 321 n = Medicine 3.35 (1.44) n = Fishing 2.49 (1.36) n = Biodiversity Development 3.85 (1.17) (1.37) n = 293 n = Global warming 3.47 (1.56) n =
64 As shown in the Table 10, Broward County boaters, as their Miami-Dade County counterparts, tended to reinforce their views on coral reef benefits from the previous questions when asked to rank individual benefits. The most important benefit for both samples was habitat, followed by biodiversity, recreation, and seafood. Similarly, both counties respondents ranked fishing as the lowest threat, even below their own primary activity of boating. Thus, both samples (and respondents from the other projects) perceived more instrumental value than intrinsic value in coral reefs. Almost all of the Broward County boaters surveyed, or 98.5%, agreed that coral reefs deserve protection, and 41.6% were willing to pay the percentage of sales tax increase that they were proffered; however, over 58% were willing to pay the amount proffered or a lower amount. Overall, Broward County boaters were willing to pay an average of an additional 0.95% sales tax (SD = 0.93; n = 279) for the protection of coral reef in southeast Florida, an amount almost identical to that reported by Miami-Dade County boaters. Like Miami-Dade County boaters, Broward County respondents preferred media (81.8%) over all other sources. The internet (52.9%), publications (45.6%), and community events (36.5%) also ranked highly, as these were reported by a third or greater of the sample. Less important were signage (30.9%) and public service announcements (31.2%), but it should be noted that even these sources of information were reported by 30% or greater of the respondents, suggesting that Broward County boaters in particular may favor a multipronged approach to obtaining information on coral reefs. Respondents reported on their most frequent activities on their trips, as shown in Table 11. The most popular activity listed for Broward County boaters was cruising and recreational fishing, in which over half the sample reported participating for most of the time or on all trips. Other activities, including diving and snorkeling (which were both popular with Miami-Dade County boaters) were less popular, as a majority of the respondents reported never participating in such activities. 64
65 Table 11: Boater activity participation rates Activity Always Most of the time Half of the time Rarely Never Mean 1. Recreational fishing (1.72) n = Water-skiing (1.06) n = Land activity (picnic, etc.) (1.32) n = Snorkeling (1.49) n = Diving (1.42) n = Swimming (1.58) n = Cruising (1.67) n = Commercial fishing (0.79) n = 314 Other 16% Bahamas 5% Florida Keys 16% Offshore 10% Nearshore 53% Figure 19: Most frequent boater destinations/locations Figure 19 shows the distribution of the most frequent locations listed by Broward County boaters surveyed. Because many boaters listed nearshore locations north and south of the county (and into both Miami-Dade and Palm Beach Counties), the research team decided that it would collapse these locations and list them as nearshore areas. As shown in Figure 19, over half of the respondents reported traveling to such locations as their primary 65
66 destinations. More Broward County than Miami-Dade County boaters reported traveling to the Florida Keys. While the reason for this was not determined, it is suggested that coral reef areas may play a role in this site selection; that is, because Miami-Dade boaters can access local reefs more readily than their Broward County counterparts, fewer may have taken trips to the Florida Keys. Almost three-quarters of the boaters (73%) stated that they had heard of the State of Florida s fisheries regulations, and the most common sources of information were word of mouth (31.3%), followed by the internet (30.5%) and other sources (19.7%). As with Miami-Dade County boaters, fewer Broward County respondents reported receiving such information from mailings (12%) and by attending meetings (6.4%). Finally, the Broward County boaters were asked to estimate how many persons out of 100 persons fishing in the area frequented by the respondents would be stopped and have their catch inspected by a State of Florida Fish and Wildlife Conservation Commission officer. While 19.7% reported that they could not estimate the frequency of inspections, among the respondents who provided an answer, the most common response was between 1-24 persons (62.2%), followed by persons (13.8%), and between persons (12.1%). As in the Miami-Dade County sample, only a small percentage of Broward County boaters (18.6%) believed that half or more of persons fishing in their areas would be stopped and have their catch inspected. 66
67 Findings and recommendations This final section considers the major findings from the overall study and develops management recommendations. It is emphasized that the findings do not represent a universe of all results and, in fact, may not include components of the study that may require further inquiry; instead, the findings (and recommendations) that follow represent those results that the research team determined were most useful for management purposes, as described in the Needs Assessment Study proposal: Based on the determination that there exists a lack of awareness and appreciation for the coral reef ecosystem that constitutes a significant source of continued degradation, it is important to assess the existing knowledge and values that the general public places on the coral reef ecosystem, to assist in the development of a targeted coral reef ecosystem outreach and education effort in southeast Florida such that by increasing awareness and refining practices, users can be encouraged to participate in positive behaviors and make decisions such that impacts on the ecosystem are reduced. The section discusses nine key findings and five main management recommendations, developed from the study s five survey projects, which address current levels of awareness, knowledge, concerns, attitudes, perceptions, and beliefs, and practices related to the reefs and reef conservation in the SEFCI region. Key findings 1. There is a base understanding among residents and visitors, as well as specific stakeholders, on coral reefs in southeast Florida, which consists of the majority of those surveyed recognizing that coral reefs exist within the region, that coral reefs serve multiple purposes and provide ecological and economic benefits, and that coral reefs deserve protection. A majority of the respondents in each of the survey projects reported knowledge of coral reefs in southeast Florida. Whereas that information may have been erroneous in terms of the location, function, and value of the coral reefs, the projects nevertheless demonstrated that there exists the basic knowledge in over half of each survey sample of coral reefs in the region. Another important, related finding was that residents and visitors (and stakeholder groups) understand that coral reefs serve multiple purposes, including providing ecological services such as habitat and biodiversity and economic benefits such as recreation and seafood. Whereas there exists considerably more nuanced knowledge among the direct use stakeholders, and especially dive operations, the study findings demonstrated that the knowledge present is beyond the simple, rudimentary understanding of coral reefs being comprised of living organisms. Finally and most importantly among this set of findings is that an overwhelming majority of respondents from all survey projects are in favor of protecting corals and a large percentage is willing to pay either additional sales taxes (as residents) or bed taxes (as visitors) to ensure the protection of coral reefs in southeastern Florida. Thus, while it could be argued that the knowledge that a majority of the respondents hold is incomplete and/or biased (towards 67
68 economic benefits, for example), the findings suggest that all groups would back a coral reef protection program 12 if implemented in the region. 2. Most of the persons surveyed believe that coral reefs serve a more utilitarian than preservation purpose; that is, coral reefs are not generally perceived as rain forests or old-growth forests that are often valued for their existence. Instead, respondents opinions suggest that residents and visitors perceive coral reefs as providing important economic benefits, such as recreation and seafood, over ecological ones, including biodiversity. From the data collected from all groups, it is clear that residents and visitors alike place a utilitarian value on coral reefs, such that their benefits are tied directly to the extractive (ex. seafood) or enjoyment (ex. recreation) that users can derive from coral reefs. There exists a poor understanding of how coral reefs may assist in providing important services such as storm protection (which most respondents acknowledged as a benefit, but only as a minor one compared to others). Therefore, unless these views are changed to show that coral reefs are beneficial in much the same way that terrestrial systems such as rain forests are beneficial (i.e. by promoting the coral reefs existence value), residents and visitors will continue to perceive them as claimed one stakeholder: an invisible resource. 3. Residents are generally more aware of southeast Florida coral reefs than visitors, and among visitors, foreign tourists are the least informed group. Importantly, more respondents in each group residents and visitors alike are knowledgeable about coral reefs in general than about coral reefs in southeast Florida. There is certainly more knowledge present among residents concerning coral reefs in southeast Florida than there is among visitors in general and especially among foreign tourists. The latter possesses the least amount of information on the region s coral reef, particularly as many of the foreign nationals who visit southeast Florida do not learn about area coral reefs in schools or local media. However, the data collection session with beach visitors demonstrated that both US and foreign visitors are generally keen to learn more about the region s coastal and marine resources (as noted anecdotally by the overwhelming majority of respondents who accepted the SEFCRI coral reef information brochure), and that while all groups may lack an understanding on the location and importance of southeast Florida coral reefs, residents and visitors alike are more knowledgeable about coral reefs in general. Thus, any management strategy that targets building coral reef awareness may be developed with the expectation that a majority in the various populations have a basic understanding of coral reefs. 4. Most respondents do not identify fisheries as negatively impacting coral reefs, and most rank fisheries as among the lowest threats currently facing coral reefs; conversely, 12 It should be noted however that respondents were not informed of the level of protection that coral reefs enjoy (ex. the State of Florida ban on stony coral collection). 68
69 respondents rank seafood as an important benefit provided by coral reefs. This view, which again suggests the utilitarian function that coral reefs serve, suggests that residents and visitors may not fully understand the connection between reef fishes and coral reefs and thus may be less in favor of alternate management strategies such as zoning. This is among the most important findings from a management perspective, as it suggests that while different groups are generally in favor of coral reef protection, most may not accept marine zoning (i.e. marine protected areas) as a conservation strategy. This is because the general attitude towards coral reefs is derived from the extractive and recreational benefits that they offer, as well as the groups inability to accept the resource s intrinsic (or existence) value; taken together, these perceptions suggest that it is imperative that if a management strategy that exercises exclusion be implemented, management should first consider how to promote both buy-in from the stakeholders who may be directly impacted from access restrictions and, more importantly, acceptance by resident and visitor populations on the non-use values provided by coral reefs. 5. Most respondents who agree that there are coral reefs in southeast Florida identify the Florida Keys as the primary location, and fewer identify the SEFCRI region counties as having coral reefs. As shown between residents and visitors alike, most respondents believe that the sole locations where coral reefs are present in southeast Florida (and for many, the entire state) are the Florida Keys. Whether informed by media sources promoting the Florida Keys as a reef haven and/or brochures and other literature promoting Florida Keys National Marine Sanctuary, John Pennekamp Coral Reef State Park, and other coral reef-oriented protected areas, the net effect is an almost attenuated identification of coral reefs as the Florida Keys. Even in the cases where respondents (mainly residents) identified coral reefs in the county in which they were surveyed, they often did so by omitting all other regional locations. Thus, knowledge on coral reefs is most likely constructed via media sources and thus focuses mainly on the Florida Keys or is experienced and therefore remains largely local. In either case, most residents and visitors most likely do not know that there are coral reefs off the counties in which they reside or are visiting. 6. Stakeholders who use coral reefs in southeastern Florida generally agree that the resource is in declining and/or poor condition. An overwhelming majority of stakeholders in all four counties agree that coral reefs are in poor condition and have been declining for a number of years, if not decades. The reasons for the decline are contested across counties (see Finding 8), but the consensus is that coral reefs are in a state of deterioration. It is unclear whether this view is shared among other groups, such as residents and visitors, but with a large majority among all groups in favor of coral reef protection, it is clear that there is support for recovery and sustainability efforts. 69
70 7. All groups surveyed agree that the main way that they wish to stay informed on coral reefs in the SEFCRI region is via media (television and radio) sources. Visitors, and foreign visitors in particular, favor visual aids, such as signage, but tourists are also in favor of active promotion via media. Notwithstanding the strong support for media source, another information source that was favorably received is electronic mail alerts/internet websites. The advantage to using this improving technology is that it can act as either a passive (one-way) form of information dissemination and as an interactive form of information exchange and capacity building. However, while technology-based outreach and education programs may be effective, the findings from the marine industry electronic mail survey project suggest that unless the programs promote trust (both in terms of the accuracy of the information provided and the security of the electronic mail transmitted), recipients may simply not respond. 8. Stakeholders in different counties do not agree on a single cause for coral reef decline, and views may be formed in part by both upland effects (ex. agricultural runoff) and a perceived increase in coastal, non-point source pollution. Stakeholders in Martin County believe that agricultural based pollution may be killing the region s coral reefs, Palm Beach and Broward County stakeholders point more to pollution resulting from coastal development, and Miami-Dade County stakeholders identify overuse as a factor in the county s coral reef decline. Stakeholders provided detailed information on coral reef awareness, conditions, and management options in each of the four counties in which they were interviewed. One of the most important findings that stakeholders provided was that there exist very different perceptions between counties among stakeholders on the main reasons for coral reef decline (which almost all stakeholders in each of the four counties reported was occurring). Both the amount of coral reef and total population increases in each county from Martin County south of Miami-Dade County. Thus, the pressures affecting coral reefs change as well, from agricultural run-off in Martin County to development and overuse (population-based pressures) in Miami-Dade County. 9. Almost a quarter of the marine industry organizations/members surveyed do not consider their activities being affected by or affecting coral reefs. While it is clear that many of the marine industry organizations/members that stated not being affected by or affecting coral reefs may be a mostly accurate statement, in that many such entities do not interact directly with the region s coral reefs, the view is emblematic of much of the southeast Florida population, as corroborated by the low response rates among residents in the resident telephone survey and mail-back survey projects. This is in many ways the central problem facing an outreach and awareness program, which must not only attempt to improve the understanding of coral reefs among residents and visitors in southeast Florida but also explain why coral reefs are important to the region, how all groups affect and are affected by coral reefs (either directly or indirectly), and the need to protect this otherwise deteriorating resource. 70
71 Management recommendations 1. Efforts in coral reef awareness and education should be tailored to target different audiences, including residents, visitors, and stakeholders, based on the amount of knowledge held, preferred sources of information, and other socio-demographic factors. While the challenges to educate the various groups may appear to be homogeneous, in that all groups lack a basic understanding of coral reefs in southeast Florida, that there needs to be a focus on emphasizing the intrinsic value of coral reefs, and that groups must be shown the linkages between coral reef health and fisheries, awareness and education should be sufficiently tailored to target the various difference audiences, as the findings demonstrate that not even all strata within a single group possess the identical levels of knowledge, hold the same biases, or prefer similar sources of information. Using the visitor study results as an example, a successful visitor outreach and education program should consider that there are three tiers of visitors: residents visiting local and adjacent county beaches; domestic (non-sefcri county, US visitors) tourists; and foreign tourists. Because each tier possesses different levels of information and relatively dissimilar preferred sources of information, an outreach and education program should target each tier differently. The resident tier, for instance, may be provided with more local coral reef protection and initiative information, such as on how to access community events, family activities, and other local (medium to long-term) initiatives, as well as other specific material that shows how coral reefs affect the regional economy, how the resources are a part of the region s natural and cultural heritage, etc. The visitor tiers could be given more use and access information, such as how domestic and foreign visitors may enjoy the region s coral reefs. This would help build knowledge among visitors on the location of coral reefs in the SEFCRI counties, and it would assist in promoting a conservation ethic. The means by which to disseminate this information, while focusing on those sources identified by respondents, should target those areas that represent knowledge gaps. For example, the findings show that there is considerable support for coral reef protection in southeast Florida but a limited understanding on the location or function of the resource; thus, information provided on local coral reefs should not attempt so much to build support, but rather to build knowledge on coral reef function, location, and status. 2. Under-represented ethnic and racial, minority groups need to be reached to be incorporated into the education and awareness process. The study findings, especially those related to the resident survey project, largely underrepresented ethnic and racial, minority groups, and especially African-Americans. Although this was partly a result of lower than expected return rates from such groups, it still points to problems in the methodology (as related to the under-represented groups) and calls into 71
72 question the applicability of the findings towards improving awareness and education among under-represented groups. It is not summarized that the findings do not apply to the groups surveyed, in that they do provide meaningful information on the extent of group knowledge of and attitudes towards coral reefs; however, it is suggested that if the groups that were least represented in the survey findings are to participate in an outreach and education program that an effort be made to engage these groups that: (a) utilizes Spanish-based literature on coral reefs, especially in Miami-Dade County; (b) uses other institutions than environmental governmental and academic organizations to disseminate information; (c) promotes dialogue (i.e. an informal teaching environment) over presentations; and (d) offers field-based opportunities, such as coral reef trips. These recommendations do not represent a universe of management options to reach groups that were clearly under-represented in the findings; rather, they provide examples on how the groups may be encouraged to participate. 3. Education and outreach should consider utilizing terrestrial models (ex. tropical rain forests) to demonstrate the similar, intrinsic value of coral reefs, as reservoirs of biodiversity, and indirect economic values, such as ecosystem services and storm protection, ahead of the direct economic benefits recognized by most users. Terrestrial model literature, with at least some of its origins in conservation ethics (ex. Henry David Thoreau s Walden, writings by John Muir, and other early naturalist exaltation of natural places), largely promotes the existence value of mainly terrestrial areas (Meffe and Carroll, 1997), a theme taken up lately by marine scientists and conservationists, especially as promoted as marine protected areas (Agardy, 1997; NRC, 2001). However, from the findings, it is clear that most residents and visitors surveyed do not perceive the intrinsic value that coral reefs have, and how that value alone (as opposed to providing economic benefits) may make coral reefs valuable enough to save for future generations. It is not suggested here that management condescend to the various groups; thus, it is recommended that an education and outreach program use the existing paradigm of terrestrial protected areas as a means by which to convey the shared existence value in tropical rain forests and coral reefs. While many respondents may not immediately buy into the comparison, and especially those who extract fishery resources from coral reefs, it may assist in developing a connection between the two, highly productive ecosystems, thereby providing a means by which promote the existence value of coral reefs. 4. Management must work with different stakeholder groups in developing meaningful ways by which to improve communication, such that the groups can provide information on coral reef conditions, stressors, and remedies. 5. Non-traditional, coastal and marine industries should be engaged to demonstrate to these industries their linkages to coral reefs. Recommendations 4 and 5 are considered together, as they represent similar suggestions. First, as per the comments provided by stakeholder groups, it is clear that these groups are 72
73 generally knowledgeable about coral reefs and have an understanding on local (and even regional) coral reef conditions; thus, a management strategy to improve knowledge among the participants should be participatory in nature because management can learn as much from the stakeholders as can they from management, and also because means by which to reach different stakeholders will vary considerably. For example, an outreach and education program concerning dive operations may require the development of strong, scientifically based literature that could be used to educate the operators, as well as the production of more basic information for their clients divers and snorkelers. Conversely, information produced for commercial fishers and other Saltwater Products License (SPL) holders (such as fishing charter operators) may require more fishery-based literature that could be best disseminated by mail with license renewal forms (as suggested by several fishing operations). Second, all businesses, but especially non-traditional, coastal and marine industries should be engaged to demonstrate the linkages between their operations and coral reefs. As stated previously, almost a quarter of the sample contacted during the non-response bias, telephone survey session of the marine industry survey project argued that it was not affected by and did not affect southeast Florida coral reefs. It is only by demonstrating how all persons in the SEFCRI region are affected, and indeed shaped, by coral reefs and the history of coral reefs in the region (whether it is by living on a street, development, or city that has coral in its name, the importance of the commercial image of southeast Florida as a tropical paradise with sandy beaches and coral reef fish, or the actual dependence on parts of the economy on healthy, productive reefs), that the various groups can be galvanized to protect this fragile and unique resource. This report was prepared for the Florida Department of Environmental Protection by Manoj Shivlani under awards NA16OZ2440 and NA03NOS from the National Oceanic and Atmospheric Administration, U.S. Department of Commerce. The statements, findings, conclusions, and recommendations are those of the author and do not necessarily reflect the views of the National Oceanic and Atmospheric Administration or the Department of Commerce. 73
74 References Agardy, T. S Marine protected areas and ocean conservation. San Diego, CA: Academic Press. Alreck, P. L., and R. B. Settle The survey research handbook. Homewood, IL: Richard D. Irwin, Inc. Andrews, K., Nall, L., Jeffrey, J., and S. Pittman (eds.) The state of coral reef ecosystems in Florida. pp In: J. Waddell (ed.), The state of coral reef ecosystems of the United States and Pacific Freely Associated States: NOAA Technical Memorandum NOS NCCOS 11. NOAA/NCCOS Center for Coastal Monitoring and Assessment s Biogeography Team. Silver Spring, MD. Babbie, E Survey research methods. Belmont, California: Wadsworth Publishing Company. Bhat, M Application of non-market valuation to the Florida Keys marine reserve management. Journal of Environmental Management 67: Boating Research Center (BRC) Boat use patterns and boat traffic study: Biscayne Bay, Dade County, Florida. Miami, FL: DERM/BRC. Department of Labor Consumer Price Index for Miami-Fort Lauderdale February World Wide Web document. URL: Executive Order of June 11, Coral Reef Protection. Federal Register 63 (115): Fenton, D. M., M. Young, and V. Y. Johnson Re-Presenting the Great Barrier Reef to tourists: Implications for tourist experience and evaluation of coral reef environments. Leisure Sciences 20: Florida Department of Environmental Protection (DEP) Florida Coastal Management Program website. World Wide Web document. URL: Florida Fish and Wildlife Research Institute (FWRI) Commercial fishing licenses. World Wide Web document. URL: Leeworthy, V. R. Special Projects Office. National Ocean Service. National Oceanic and Atmospheric Administration. Personal communication. March 9, Meffe, G. K., and C. R. Carroll Principles of conservation biology. Sunderland, Mass: Sinauer Associates. Miami Herald November 2,
75 Milon, J. W., D. O. Suman, M. Shivlani, and K. A. Cochran Commercial fishers' perceptions of marine reserves for the Florida Keys National Marine Sanctuary. Florida Sea Grant Technical Paper-89. Muñoz-Carpena, R., J.H. Crane, G. Israel and C. Yurgalevitch Golf courses' water use and conservations practices in Miami-Dade County. Fact Sheet ABE 348 of the Department of Agriculture and Biological Engineering, University of Florida. World Wide Web document. URL: National Research Council Marine protected areas: Tools for sustaining ocean ecosystems. Washington, DC: National Academy Press. Park, T., Bowker, J., M., and V. R. Leeworthy Valuing snorkeling visits to the Florida Keyswith stated and revealed preference models. Journal of Environmental Management 65: Shivlani, M. P., Letson, D., and M. Theis Visitor preferences for public beach amenities and beach restoration in South Florida. Coastal Management 31 (4): Shivlani, M., Murray, T, and J. London An assessment of visitor perceptions on the quality of tourism in Key West, Florida. IN Proceedings of the Coastal Zone 05 Conference, July 18-21, Shivlani, M. P. and D. O. Suman Dive operator use patterns in the designated notake zones within the Florida Keys National Marine Sanctuary. Environmental Management 25 (6): Suman, D. O., M. P. Shivlani, and J. W. Milon Perceptions and attitudes regarding marine reserves: A comparison of stakeholder groups in the Florida Keys National Marine Sanctuary. Ocean and Coastal Management 42: US Census US Census website. World Wide Web document. URL: Villanueva, M. Division of Marine Affairs and Policy. University of Miami. Personal communication. March 16, West, N Applied statistics for marine affairs professionals. Westport, CT: Praeger. 75
76 Appendix 1: Pilot visitor beach survey project report DEP Coral Reef Needs Assessment Visitor Study: Pilot beach visitor sampling session results Manoj Shivlani Maria Villanueva I. Executive Summary This report summarizes the findings from the beach visitor survey pilot session, conducted over a period of four days (March 26-29, 2005) at sites in Miami-Dade, Broward, Palm Beach, and Martin Counties. The survey instrument, developed by the research team and commented upon by Florida Department of Environment (DEP) Awareness and Appreciation Focus Team, functioned effectively and provided meaningful results. Over a period of seven sessions, lasting two hours each, a total of 143 surveys were completed. The average number of surveys completed per session was 20.4 surveys. From the pilot session results, it was determined that, with minor modifications (which are solely editorial), the survey instrument would be used to conduct the full survey session, and that the March 2005 results would be considered as part of the overall sample. II. Introduction Among the most difficult groups to assess for such a large and diverse region are its visitors, and the approach used in the study has been to maximize data collection by conducting intercept surveys at locations where visitors may congregate, i.e. popular beach sites. The beaches represent a key attraction among visitors in general to the State of Florida and specifically to those visitors who may have knowledge of coastal and marine resources, including coral reefs. Moreover, recent study results (Shivlani et al., ) suggest that response rates among southeast Florida beach visitors are high, and a large percentage of the participants in popular beaches (ex. well-known and marketed areas) are non-residents. The approach utilized in this study is comprised of a year-long survey effort, stratified into weekday and weekend sampling periods, across sites in each of the four, southeast Florida counties. To best determine the efficacy of the sampling approach and the suitability of the selected sites, this report describes the results of a pilot survey session conducted with beach visitors at one site in each of the four southeastern Florida counties, as part of the visitor component of the DEP Coral Reef Needs Assessment Study. The pilot session, conducted following Alreck and Settle (1985) 14, followed 13 Shivlani, M. P., Letson, D., and M. Theis Visitor preferences for public beach amenities and beach restoration in South Florida. Coastal Management 31 (4): Alreck, P. L., and R. B. Settle The Survey Research Handbook. Homewood, IL: Richard D. Irwin, Inc. 76
77 previously used methodology (Shivlani et al., 2003) to survey beach visitors over the period of four days in each of the four beach sites. III. Methodology The methodology selected for the pilot session consisted of the development of a pilot survey and the implementation of pilot survey sessions at each of the beach sites in the four counties. First, the research team interacted with the Awareness and Appreciation Focus Team in the development of a pilot survey instrument. Next, the two teams selected a single site per county that served as that county s study area. Beach selection was based on factors such as visitation rates and types of visitors, among others. Once selected, a total of two pilot sessions (one weekday and one weekend day) were planned for each of the four sites. As part of the pilot sessions, the pilot survey developed by the two teams was implemented. Individual sessions were set up to last no longer than two hours or by the time that the beach had been completely surveyed, whichever arrived first. By the end of the pilot period, a total of seven pilot sessions were completed. Data that has been collected from the pilot surveys were then analyzed to determine the applicability of the survey instrument. In late March 2005, the research team met with the Awareness and Appreciation Focus Team to develop the survey instrument. At the meeting, it was decided that the survey instrument must collect socio-demographic information, assess the extent of knowledge that respondents possess on coral reefs (including threats facing and benefits derived from coral reefs), the source of knowledge on coral reefs, the existence and location of southeast Florida coral reefs, uses of the local coastal and marine environment, and willingness to pay for the protection of coral reefs in southeast Florida. Additionally, the teams believed that it is important to determine as how the users (visitors and residents, alike) would prefer to receive outreach and education on coral reefs. Finally, in a related effort, the research team agreed that it would develop an on-line survey which respondents could access to comment on DEP coral reef brochures, which the former would pass out during its data collection sessions. Also, at the meeting, the Awareness and Appreciation Focus Team assisted in the identification of beach survey sites in each of the four counties. The final sites selected were: 1. Miami-Dade County South Beach (from the start of Ocean Drive north in Miami Beach 2. Broward County Fort Lauderdale Beach (from Las Olas to Sunrise Boulevards) 3. Palm Beach County Singer Island 4. Martin County Bathtub Reef Park The sites were selected mainly due to the high rates of non-resident visitation that they enjoy, and the teams agreed that these sites would provide the most visitor surveys (compared to other beaches in the respective counties). 77
78 The research team developed a page-long survey instrument, which it finalized on March 22, The survey instrument contained a total of 13 questions, of which several questions included more than one response. For example, the question (Question 10) concerning threats to and benefits from coral reefs asked respondents to rank 11 threats and benefits. Also, the survey instrument divided the willingness to pay question (Question 11) into two sections, where the first section related to visitors who were asked to pay as part of an increase to the bed tax, contrasted by the second section which targeted residents who were asked to pay as part of an increase in the local sales tax. The survey instrument was sent via electronic mail to the Awareness and Appreciation Focus Team for comments, and following comments it was finalized on March 25, 2005 for use as the pilot survey. The pilot survey session took place from March 26-29, 2005 at the aforementioned sites, each of which was sampled at least once. Due to unexpected traffic conditions that forced the cancellation of the Miami-Dade weekend sampling session 15, that site was only sampled once (during a weekday); however, all other sites were sampled during a weekday and weekend day, as per the sample design. Number of surveys completed in the session Session Total surveys completed Surveys Total surveys Figure 19: Pilot surveys completed, by session and total As shown in the figure above, the number of surveys completed per session did not vary considerably. The average number of surveys completed was 20.3 surveys per session (SD = 1.38), and the range was between 18 and 22 surveys. Moreover, data collection revealed that it took around five or more minutes to complete each survey, which corroborates well with the 5.9 minutes that each survey would have taken, based on a 120 minute sampling session. This total was higher than the three minute total estimated during sampling design (see page 15 of the technical proposal). Under the estimated 15 The Winter Music Conference (see was held partly in Miami Beach from March 22-27, The resulting traffic hindered transportation into the Miami- Dade beach sampling site. It was decided after a three-hour delay on March 26 th that it would be best to focus on the other sites and return to the Miami-Dade site for a weekday session. 78
79 total, a total of 25 surveys could have been completed per session. However, because the teams agreed that a more detailed instrument should be developed, the time required for completion increased and the total number of surveys completed per session decreased. Therefore, following the end of the pilot session, the total projected surveys over the period of one year were estimated based on 20 surveys per session, rather than the 25 surveys per session projected in the technical proposal. Based on eight sessions per month (two sessions per site for four sites), a total of 96 sessions would be completed from March 2005 to February , resulting in the completion of approximately 1,920 surveys. In the technical proposal project, it was estimated that approximately 2,500 surveys would be completed. However, while the number of surveys completed will be lower than earlier estimated, it must be noted that the lower quantity of surveys shall provide more information, especially that information that relates to respondents knowledge of coral reefs, their understanding of threats and benefits concerning coral reefs, and the means by which they wish to remain informed on coral reef issues. IV. Results The results for the 142 completed surveys are presented mostly in the order of questions in the survey instrument, and the questions can be reviewed in a copy of the survey instrument. Also, no statistical analyses apart from descriptive statistics are presented. Finally, data are not presented according to beach strata, as the focus in this report is primarily on the efficacy of the data set itself. Future reports, which shall be based on several months worth of data for each site, shall describe site-specific data and present inter-site analyses. Most surveys (58.5%) were completed in the pilot session during weekdays. A total of 26 fewer surveys were completed during weekend days, but that is mainly due to the fact that one less weekend day session was completed. Generally, the numbers of surveys completed were similar during both weekdays and weekend days, suggesting that equal proportions may be obtained over the year-long sampling period (unless there is a drop in weekday visitation rates over the summer months). An equal percentage of surveys were completed at each site, with Singer Island (30.3%) leading all sites. A total of 39 surveys, or 27.5%, each were completed in Fort Lauderdale Beach and Bathtub Reef Park. Only Miami Beach reported fewer surveys (14.8%), due again to the single session completed at the site. In terms of socio-demographics, a majority of those interviewed (58.5%) were at least high school graduates. Over 10% had completed some college, compared to 27.5% who held a college degree. Only 3.5% had post-graduate experience. Also, over 30% of those interviewed reported zip codes from within the study area (or one of the four counties). 16 The research team shall make up for all lost sessions, such as the lost weekend session at the Miami- Dade site in March 2005, by completing additional sessions for those sites in subsequent months. Particular attention shall be paid to ensure that lost sessions are made up both as soon as possible and that the make-up sessions be conducted during the same season as the lost sessions. 79
80 Another 25% did not provide zip code information. Thus, almost 45% of the pilot sample identified itself as non-local. If these results are consistent across the year-long field session, it is estimated that the effort shall complete at least 864 visitor surveys (based on a total of 1,920 surveys). However, it is likely that visitor totals shall be higher, as these tend to peak in the winter months (and especially November to March). Additionally, additional emphasis shall be given on soliciting zip code information in monthly sessions to reduce the number of participants who do not provide such data. The most common age groups represented in pilot surveys were those person aged years old (average = 0.86 persons per respondent; SD = 1.46). Equally common were persons aged years old (0.71; SD = 1.41) and those aged years old (0.65; SD = 1.20). The least common age groups were those persons 55 or older (0.15; SD = 0.56). In a previous beach visitor study conducted in south Florida (Shivlani et al., 2003), it was found that different beaches attracted different age groups. Further field data collection shall be needed to determine whether that is the case with these sites. Only 8.5% of those surveyed refused to reveal their household income bracket, and among those who did, the most common bracket reported was between $50,000 99,999 (31.7%). Overall, almost 60% of the sample reported earning between $25,000 99,999. Those earning less than $25,000 represented only 10% of the sample, compared to almost 21% of the respondents who earned $100,000 or more. These pilot results predict that while several respondents may not wish to reveal income, that most should answer the question. Therefore, it is recommended that the question be retained for the full survey session. Trip profile data showed that 38.6% of those visiting the region had done so for the first time, whereas 61.4% were return visitors. Among those who provided information on their last visit, almost half (48.3%) had last been to southeast Florida a year (or less) ago. Most visitors stated that they planned to stay for more than one day, and only 34.5% reported taking a day trip (and these respondents were mainly from neighboring Florida counties). The average number of days that visitors planned to stay was 3.16 days (SD = 2.04), and the trip length ranged from 1-10 days. The most common mode of arrival was by air (66.7%), and the rest of the visitors arrived by vehicle (another indicator of Florida and other neighboring states visitors). All of the persons interviewed reported swimming as a primary water-based activity, followed by boating (12%), snorkeling/diving (10.6%), and fishing (9.9%). Only one respondent listed sailing, and no one reported surfing, kayaking, or glass-bottom boating. The entire sample reported having heard of coral reefs, and the most common sources of information were schools (100%) and media (100%). Only 4.9% stated that they had learned about coral reefs from friends, and no respondent reported having read about corals in brochures. When asked where coral reefs are found, most persons (96.5%) could not explain more about location beyond the ocean, and only a small percentage (1.4%) listed actual locations (ex. Australia). It is clear from these findings that there is limited knowledge as to the actual location within the water column where coral reefs are 80
81 located, and it is recommended that this question be retained but asked differently such that respondents provide a physical or geographical location for reefs. When asked about coral reef function, all respondents agreed that reefs provide habitat, 85.2% believed that reefs are sources of fisheries, 24.6% felt that they afford storm protection, and 57% argued in favor of reefs serving as recreational sites. By contrast, only 5.6% believed that coral reefs are reservoirs of biodiversity, and smaller percentage (4.9%) agreed that they hold any medicinal benefits. Most pilot study participants (90.9%) agreed that there are coral reefs in southeast Florida, and most (90.9%) had learned this fact in school and via the media. A large percentage, or 31.7%, knew of southeast Florida reefs because of friends, but none in the sample had received any information from brochures. Asked as to where coral reefs may be encountered in the region, only one respondent stated that they are found across the region. Most (63.4%) believed that coral reefs in south Florida are confined to the Florida Keys. Importantly, over a fifth of those interviewed (or 22%) stated that they did not know where the coral reefs are in south Florida. Average rank Rank Boating Dredging Touching Pollution Fishing Development Global warming Threat Figure 20: Coral reef threats 81
82 Average rank Rank Habitat Seafood Storm protection Recreation Medicine Biodiversity Benefit Figure 21: Coral reef benefits The figures above show the sample s ranked perceptions on threats to and benefits of coral reefs. Respondents identified boating (rank = 1.68; SD = 0.69) and pollution (rank = 2.12; SD = 0.73) as the most serious threats to coral reefs. Interestingly, wider impacts that may result from global warming were perceived as more serious than local impacts derived from development and dredging. Also, the sample did not consider touching coral as more of a threat than pollution. As for benefits, respondents ranked habitat (rank = 1.66; SD = 0.58) and storm protection (1.99; SD = 0.71) as the most important coral reef-related benefits. Least important were seafood provided by coral reefs and the medicinal value present in the ecosystems. A large majority, or 94.4%, was in favor of protecting coral reefs; however, when asked whether they would be willing to pay to protect local reefs, the percentage of support dropped to 59.4% among visitors and 36.6% among residents. The average amount that visitors were willing to pay was $3.80 as additional bed tax, compared to a 1.1% increase in sales tax supported by residents. Finally, when asked how they would like to be kept informed on regional coral reefs and reefs in general, most respondents preferred media sources (67.6%), followed by the internet (66.2%), publications and brochures (52.1%), community events (48.6%), PSA (47.9%), and signage (47.9%). V. Conclusions The pilot session demonstrated that the survey instrument developed by the research team, with cooperation from the Awareness and Appreciation Focus Team, can provide information pertinent to the objectives of the research project, is sufficiently focused to yield unambiguous results, and is of a length where a suitable number of surveys can be completed. The pilot session also showed that the sampling design adopted, consisting of 82
83 eight sessions per month divided into weekday and weekend day sessions at each of four beaches, can be replicated throughout the year-long sampling period. Any lost sessions (especially those that may arise due to weather conditions and hurricane threats) can be made up during the same or subsequent month. Finally, the pilot session results confirmed the suitability of the sites selected. Due to their popularity with visitors, the sites contain a large percentage of non-residents, an important factor for the study; moreover, the sites were also consistently well visited during the pilot session, suggesting that future sessions should result in high completion rates. 83
84 Appendix 2: Visitor survey project survey instrument 1. What is your primary residence? Zip code Country of residence 2. How many persons in your party fall into each of these age categories? Which of the following best describes your educational background? High school College College graduate Post-graduate 4. Is this your first visit to South Florida? YES NO If this is NOT your first visit, then when were you last here? 5. Are you a day visitor or and overnight visitor? Day visitor Overnight visitor If an overnight visitor, the number of days spent in South Florida were/will be days 6. Did you arrive in South Florida by: Air Auto/Car Boat Other 7. In what water-based activities do you participate here in South Florida (check all those that apply)? a. Swimming e. Sailing b. Snorkel/diving f. Surfing c. Fishing/spear fishing g. Kayaking d. Pleasure boating/jet skiing h. Glass-bottom boating 8. Have you heard of corals and coral reefs? YES NO a. If YES, then from where? - School, college - Friends - Media (TV, radio, movies) - Brochures b. If YES, then do you know where they are found? c. If YES, then do you know what they do? - Habitat - Recreation - Fisheries - Biodiversity - Storm protection - Medicine 9. Do you know if there are corals and coral reefs in South Florida? YES NO a. If YES, then from where? - School, college - Friends - Media (TV, radio, movies) - Brochures b. If YES, then do you know where they are found in South Florida? 10. Please rank the following activities in terms of the effects you believe they would have coral reefs, from 1 being the least to 5 being the worst AND rank the following benefits from 1 being the least to 5 being the most. Activity Impact Benefit Impact 1. Boating 1. Habitat 2. Dredging 2. Seafood 3. Touching 3. Storm protection 4. Pollution 4. Recreation 5. Fishing 5. Medicine 6. Development 6. Biodiversity 7. Global warming 11. Should corals and coral reefs be protected? YES NO a. IF YES and visitor, then would you be willing to pay a total of $3/$5/$10 as an additional bed tax (on your hotel rate) into a coral reef protection fund that would be used EXCLUSIVELY to manage and protect South Florida reefs? YES NO - If NO, then what is the maximum you would pay? $ b. IF YES and resident, then would you be willing to pay an additional 1%/2%/3% sales tax (on all items) into a coral reef protection fund that would be used EXCLUSIVELY to manage and protect South Florida reefs? YES NO - If NO, then what is the maximum you would pay? % 12. To keep you informed of South Florida corals and coral reefs, which of the following options should be used? a. Media TV/radio d. PSA (in-flight, radio, TV) b. Internet website/ alerts e. Signage c. Community events f. Publications, brochures 13. Which of the following best describes your household income? <$10,000 $10,000-24,999 $25,000-49,999 $50,000-99,999 $100, ,999 $200,000 or more 84
85 Appendix 3: Resident phone survey project survey instrument Dear sir/madam, my name is and I am part of a team conducting a short survey with South Florida residents on their views on the environment. The survey is part of a study funded by the National Oceanic and Atmospheric Administration (NOAA) and the Florida Department of Environmental Protection. The information collected is completely confidential and shall be used only to improve the protection of the area s local environment. The survey will take no longer than five minutes of your time and is very important to our study. 1. Are you a South Florida resident? YES NO a. IF YES, then how many years have you been a resident? years 5. Please rank the following activities in terms of the effects you believe they would have coral reefs, from 1 being the least to 5 being the worst AND rank the following benefits from 1 being the least to 5 being the most. b. IF NO, then END of INTERVIEW 2. In the past TWO years, have you participated in any water-based activities here in South Florida? YES NO a. If YES, then which activities from the following list? - Swimming - Sailing - Snorkel/diving - Surfing - Fishing/spear fishing - Kayaking - Pleasure boating/jet skiing - Glass-bottom boating - Other 3. Have you heard of corals and coral reefs? YES NO a. If YES, then from which of the following sources? - School/college - Media (TV, radio, movies) - Friends - Brochures - Other - b. If YES, then do you know where coral reefs are located? - 4. Do you know if there are coral reefs in South Florida? YES NO a. If YES, then from which of the following sources? - School/college - Media (TV, radio, movies) - Friends - Brochures - Other b. IF YES, then where do you believe the reefs in South Florida are located? - Activity Impact Benefit Impact 1. Boating 1. Habitat 2. Dredging 2. Seafood 3. Touching 3. Storm protection 4. Pollution 4. Recreation 5. Fishing 5. Medicine 6. Development 6. Biodiversity 7. Global warming 8. Scuba/skin diving 6. Should corals and coral reefs be protected? YES NO a. If YES, then would you be willing to pay an additional 1%/2%/3% sales tax (on all items) into a coral reef protection fund that would be used EXCLUSIVELY to manage and protect South Florida reefs? YES NO - if NO, then what is the maximum you would pay % 7. To keep you informed of South Florida corals and coral reefs, which of the following options should be used? a. Media TV/radio d. PSA (in-flight, radio, TV) b. Internet website/ alerts e. Signage c. Community events f. Publications, brochures 8. What is your zip code? 9. Which of the following includes your age group? Under Over Which of the following describes your educational background? Some high school High school graduate Some college College graduate Post-graduate 85
86 11. Which of the following describes your ethnic background? Anglo-American African-American Hispanic/Latino Asian/Pacific Islander Other 12. Do you work in a marine industry in Southeast Florida? YES NO - If YES, then which one? END OF SURVEY 86
87 Appendix 4: Resident mail survey project survey instrument (Miami-Dade County) 87
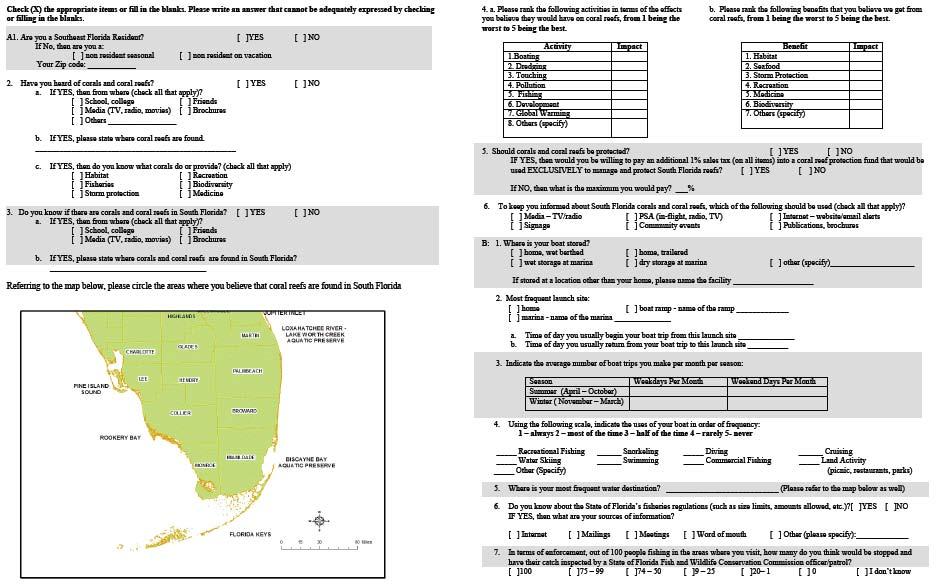
88 88
89 Appendix 5: Registered boater mail survey project survey instrument (Miami-Dade County) 89
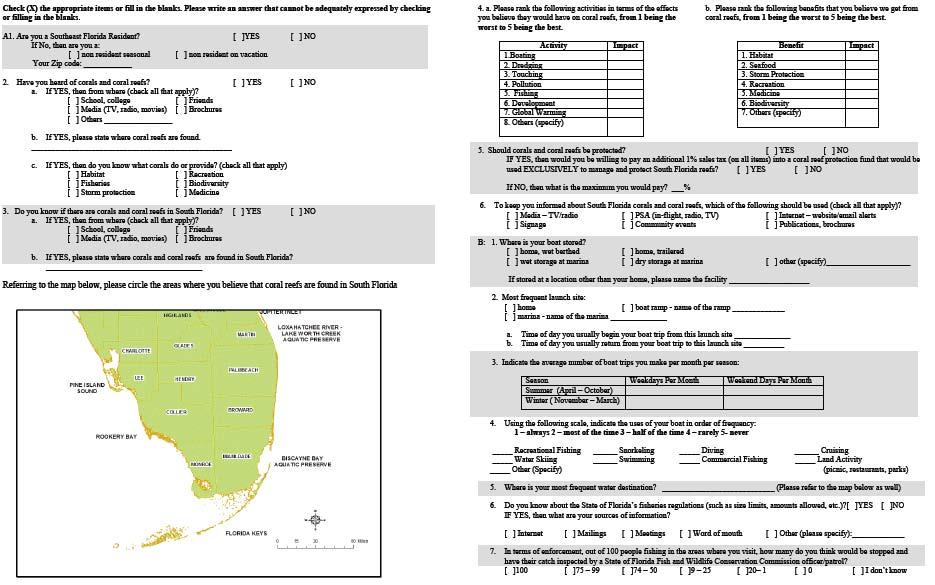
90 90
Final Report, October 19, Socioeconomic characteristics of reef users
 Socioeconomic Study of Reefs in Southeast Florida - Executive Summary By Hazen and Sawyer in association with Florida State University and National Oceanic and Atmospheric Administration, October 19, 2001
Re: Algae/Cyanobacteria Bloom in St. Lucie, Martin, Palm Beach and Lee Counties.
 July 18, 2016 Richard L. Scott Governor, State of Florida 400 S Monroe St Tallahassee, FL 32399 Re: Algae/Cyanobacteria Bloom in St. Lucie, Martin, Palm Beach and Lee Counties. Dear Governor Scott: I am
Socioeconomic Values of Reefs in Monroe County
 Chapter 6: Socioeconomic Values of Reefs in Monroe County This chapter describes the Socioeconomic Value of Artificial and Natural Reefs in Monroe County to residents and visitors. Monroe County includes
Coastal and marine recreation in New England is ingrained in the region s economic and
 RECREATION Coastal and marine recreation in New England is ingrained in the region s economic and social fabric. Recreation on the ocean and coast includes many of New Englanders most time-honored and
A Threatened Bay: Challenges to the Future of the Penobscot Bay Region and its Communities
 A Threatened Bay: Challenges to the Future of the Penobscot Bay Region and its Communities 1 A A Threatened Bay: Challenges to the Future of the Penobscot Bay Region and its Communities In 1996 the Island
Re: Port Everglades Feasibility Project, Final Feasibility Report and Environmental Impact Statement
 April 20, 2015 Terri Jordan-Sellers, Regional Technical Specialist U.S. Army Corps of Engineers Jacksonville District 701 San Marco Boulevard Jacksonville, FL 32207 Via Email: Terri.Jordan-Sellers@usace.army.mil
Goliath grouper management stakeholder project. Kai Lorenzen, Jessica Sutt, Joy Hazell, Bryan Fluech, Martha Monroe University of Florida
 Goliath grouper management stakeholder project Kai Lorenzen, Jessica Sutt, Joy Hazell, Bryan Fluech, Martha Monroe University of Florida The Management Challenge Divergent stakeholder views and high scientific
RESEARCH Massachusetts Recreational Boater Survey. Project Summary
 Coastal and Marine Spatial Planning RESEARCH Project Summary 2010 Massachusetts Recreational Boater Survey The 2010 Massachusetts Recreational Boater Survey gathered spatial and economic data relating
Case Study 3. Case Study 3: Cebu Island, Philippines MPA Network 10
 Case studies of mpa networks Case Study 3: Cebu Island, Philippines MPA Network 10 Location and background Cebu Island in the Philippines lies in the center of the Visayan Islands, known as an area high
BOATING VISITORS SURVEY SCREENER/TALLY SHEET. Interview Location (circle county): Palm Beach Broward Dade Monroe
: Palm Beach Broward Dade Monroe") BOATING VISITORS SURVEY SCREENER/TALLY SHEET Interviewer: _ Interview Location (circle county): Palm Beach Broward Dade Monroe Site Location: 1. Are you a permanent resident of (county of interview)? YES
BOATING VISITORS SURVEY SCREENER/TALLY SHEET Interviewer: _ Interview Location (circle county): Palm Beach Broward Dade Monroe Site Location: 1. Are you a permanent resident of (county of interview)? YES
1999 On-Board Sacramento Regional Transit District Survey
 SACOG-00-009 1999 On-Board Sacramento Regional Transit District Survey June 2000 Sacramento Area Council of Governments 1999 On-Board Sacramento Regional Transit District Survey June 2000 Table of Contents
DEPARTMENT OF FISHERIES. COMMUNITY PERCEPTIONS RESEARCH May 2013
 DEPARTMENT OF FISHERIES COMMUNITY PERCEPTIONS RESEARCH May 2013 This page has been intentionally left blank for double-sided printing. CONTENTS RECAPPING THE OBJECTIVES... 4 METHODOLOGY... 5 TESTS OF STATISTICAL
Appendix 9 SCUBA diving in the sea
 Appendix 9 SCUBA diving in the sea Firth of Clyde Forum SMRTS2015 Final Report 195 March 2016 Appendix 9 SCUBA diving in the sea Table A9.1: Summary of sample confidence levels Responses Spatial data Questionnaire
EXPLORING MOTIVATION AND TOURIST TYPOLOGY: THE CASE OF KOREAN GOLF TOURISTS TRAVELLING IN THE ASIA PACIFIC. Jae Hak Kim
 EXPLORING MOTIVATION AND TOURIST TYPOLOGY: THE CASE OF KOREAN GOLF TOURISTS TRAVELLING IN THE ASIA PACIFIC Jae Hak Kim Thesis submitted for the degree of Doctor of Philosophy at the University of Canberra
Travel and Rider Characteristics for Metrobus
 Travel and Rider Characteristics for Metrobus 040829040.15 Travel and Rider Characteristics for Metrobus: 2012-2015 Overview The Miami Dade County Metropolitan Planning Organization (MPO) conducted a series
Tennessee Black Bear Public Opinion Survey
 Tennessee Black Bear Public Opinion Survey Executive Summary 2012 Survey TWRA Technical Report 12 02 This electronic publication was developed by the Tennessee Wildlife Resources Agency s Division of Wildlife
Connections to the Wild Salmon Resource in prince William Sound/southeast
 Connections to the Wild Salmon Resource in prince William Sound/southeast Highlights of Opinion Research Sponsored by The Salmon Project As part of a feasibility study in early 2013, the Salmon Project
WHALE SHARK (Rhincodon typus) RECOVERY PLAN
 RECOVERY PLAN") WHALE SHARK (Rhincodon typus) RECOVERY PLAN 2004-2009 Great Barrier Reef Marine Park Authority Background The whale shark (Rhincodon typus) is the world s largest fish, and one of only 3 filter-feeding
WHALE SHARK (Rhincodon typus) RECOVERY PLAN 2004-2009 Great Barrier Reef Marine Park Authority Background The whale shark (Rhincodon typus) is the world s largest fish, and one of only 3 filter-feeding
Artificial Reef Uses. Mitigation Shore Protection Scientific Studies Habitat Creation Conservation Economic Stimulus Diver Attractions
 Artificial Reef Uses Mitigation Shore Protection Scientific Studies Habitat Creation Conservation Economic Stimulus Diver Attractions Barbados Study The Relationship between Diver Experience Levels and
MARKET STUDY FOR BOATING ON THE MINNESOTA WATERS OF LAKE SUPERIOR
 MARKET STUDY FOR BOATING ON THE MINNESOTA WATERS OF LAKE SUPERIOR MARKET STUDY FOR BOATING ON THE MINNESOTA WATERS OF LAKE SUPERIOR CANADA Minnesota Apostle Islands Isle Royale Lake Superior Michigan Wisconsin
Scuba diving in the Oosterschelde: Combining travel cost estimates with stated choice experiments
 Scuba diving in the Oosterschelde: Combining travel cost estimates with stated choice experiments Sandra Rousseau and Anthony Tejerizo Fuertes CEDON Faculty of Business and Economics ENVECON, London, 9
A SURVEY OF 1997 COLORADO ANGLERS AND THEIR WILLINGNESS TO PAY INCREASED LICENSE FEES
 Executive Summary of research titled A SURVEY OF 1997 COLORADO ANGLERS AND THEIR WILLINGNESS TO PAY INCREASED LICENSE FEES Conducted by USDA Forest Service Rocky Mountain Research Station Fort Collins,
Orange County MPA Watch A n n u a l R e p o r t
 Orange County MPA Watch 2 0 1 5 A n n u a l R e p o r t WHAT IS AN MPA? Marine Protected Areas (MPAs) are discrete geographic marine or estuarine areas designed to protect or conserve marine life and habitat.
Big Blue Adventure Event Analysis UTC Tourism Center October 2016
 A report summarizing Big Blue Adventure events economic impact on the Lake Tahoe region as well as participants assessments of their event experience Big Blue Adventure Event Analysis UTC Tourism Center
Connections to the Wild Salmon Resource in cook inlet
 Connections to the Wild Salmon Resource in cook inlet Highlights of Opinion Research Sponsored by The Salmon Project As part of a feasibility study in early 2013, the Salmon Project sponsored extensive
GULF ANGLER FOCUS GROUP INITIATIVE PROCESS OVERVIEW AND PHASES SUMMARY
 GULF ANGLER FOCUS GROUP INITIATIVE PROCESS OVERVIEW AND PHASES SUMMARY GULF ANGLER FOCUS GROUP INITIATIVE PROCESS OVERVIEW In order to provide substantive and consistent input and better influence decision-making
Appendix 21 Sea angling from the shore
 Appendix 21 Sea angling from the shore LUC SMRTS2015 Final Report 342 March 2016 Appendix 21 Sea angling from the shore Table A21.1: Summary of sample confidence levels Responses Spatial data Questionnaire
Wildlife Ad Awareness & Attitudes Survey 2015
 Wildlife Ad Awareness & Attitudes Survey 2015 Contents Executive Summary 3 Key Findings: 2015 Survey 8 Comparison between 2014 and 2015 Findings 27 Methodology Appendix 41 2 Executive Summary and Key Observations
Scuba diving and sustainable tourism development in a less developed country. Melville Saayman & Andrea Saayman
 Scuba diving and sustainable tourism development in a less developed country Melville Saayman & Andrea Saayman Scuba diving and sustainable tourism development in a less developed country Melville Saayman
HIGH YIELD ANGLERS IN RTO13: A SITUATION ANALYSIS EXECUTIVE SUMMARY
 HIGH YIELD ANGLERS IN RTO13: A SITUATION ANALYSIS EXECUTIVE SUMMARY PREPARED FOR TOURISM NORTHERN ONTARIO BY Research Resolutions & Consulting Ltd. MARCH 2013 2 INTRODUCTION As one of the ways to increase
AN EXAMINATION OF PREPAREDNESS OF COMMIUINITY FOR COMMUNITY BASED TOURISM SRI LANKA A CASE STUDY OF KALPITIYA TOURISM AREA
 AN EXAMINATION OF PREPAREDNESS OF COMMIUINITY FOR COMMUNITY BASED TOURISM SRI LANKA A CASE STUDY OF KALPITIYA TOURISM AREA S. M. P. D. Sathkumara 08/9639 Dissertation submitted in partial fulfillment of
WILMAPCO Public Opinion Survey Summary of Results
 Wilmington Area Planning Council WILMAPCO Public Opinion Survey Summary of Results Prepared by: 2955 Valmont Road, Suite 300 Boulder, Colorado 80301 t: 303-444-7863 f: 303-444-1145 www.n-r-c.com Table
HEARING ON THE ENVIRONMENTAL AND ECONOMIC IMPACTS OF OCEAN ACIDIFICATION
 WRITTEN STATEMENT OF THOMAS INGRAM EXECUTIVE DIRECTOR DIVING EQUIPMENT AND MARKETING ASSOCIATION A NON-PROFIT TRADE ASSOCIATION REPRESENTING RECREATIONAL DIVING AND SNORKELING HEARING ON THE ENVIRONMENTAL
Department of Agricultural and Resource Economics, Fort Collins, CO
 July 2011 EMPR 11-01 Department of Agricultural and Resource Economics, Fort Collins, CO 80523-1172 http://dare.colostate.edu/pubs WHAT IS THE VALUE OF A FISHING TRIP? A COMPARISON OF PUBLIC AND PRIVATE
The Economic Impact of Recreational Fishing in the Everglades Region
 The Economic Impact of Recreational Fishing in the Everglades Region Prepared for: The Everglades Foundation Prepared by: Tony Fedler, Ph.D. For the Bonefish and Tarpon Trust December 2009 Table of Contents
The 1998 Arctic Winter Games A Study of the Benefits of Participation
 The 1998 Arctic Winter Games A Study of the Benefits of Participation Prepared by Dr. Samuel V. Lankford World Leisure & Recreation Association Professional Services (WPS) And Program for Community Recreation,
The 2001 Economic Benefits of Hunting, Fishing and Wildlife Watching in MISSOURI. Prepared by:
 The 2001 Economic Benefits of Hunting, Fishing and Wildlife Watching in MISSOURI Prepared by: Southwick Associates, Inc. PO Box 6435 Fernandina Beach, FL 32035 Ph (904) 277-9765 Fax (904) 261-1145 Email:
Agenda Item Summary BACKGROUND. Attachment 1
 Agenda Item Summary Attachment 1 BACKGROUND Oregon s recreational abalone fishery was suspended by emergency rule beginning January 1, 2018. This suspension was due to 1) low densities of red abalone,
National Oceanic and Atmospheric Administration. Fisheries of the Caribbean, Gulf of Mexico, and South
 This document is scheduled to be published in the Federal Register on 07/13/2016 and available online at http://federalregister.gov/a/2016-16510, and on FDsys.gov Billing Code: 3510-22-P DEPARTMENT OF
Orange County MPA Watch 2016 A n n u a l R e p o r t
 Orange County MPA Watch 2016 A n n u a l R e p o r t WHAT IS AN MPA? Marine Protected Areas (MPAs) are discrete geographic marine or estuarine areas designed to protect or conserve marine life and habitat.
The 2006 Economic Benefits of Hunting, Fishing and Wildlife Watching in TEXAS. Prepared by:
 The 2006 Economic Benefits of Hunting, Fishing and Wildlife Watching in TEXAS Prepared by: Southwick Associates, Inc. P.O. Box 6435 Fernandina Beach, FL 32035 Ph (904) 277-9765 Fax (904) 261-1145 Email:
Balancing Sustainable Tourism & Commercial Fishing In The Turneffe Atoll Marine Reserve 1. Executive Summary
 Center for Responsible Travel Balancing Sustainable Tourism & Commercial Fishing In The Turneffe Atoll Marine Reserve 1 Executive Summary The Belize government s official declaration on November 22, 2012
Eastern New Brunswick Coastal and Inland Recreational Fisheries Advisory Committee
 Eastern New Brunswick Coastal and Inland Recreational Fisheries Advisory Committee Submitted By: Atlantic Salmon Federation Submitted To: Fisheries and Oceans Canada (Gulf Region) Date: 14 December 2017
What is Project Baseline?
 What is Project Baseline? A global network of highly skilled and organized SCUBA divers who are creating a lasting visual legacy of underwater conditions in oceans, lakes, rivers, springs, and caves all
National Survey for Wales Key Facts for Policy and Practice
 National Survey for Wales 2016-17 Key Facts for Policy and Practice Outdoor Recreation This bulletin describes the main findings of the Outdoor Recreation section of the 2016-2017 National Survey for Wales.
INDEPENDENT EVALUATION GROUP - IFC APPROACH PAPER
 82211 INDEPENDENT EVALUATION GROUP - IFC Evaluation of IFC s Private Enterprise Partnership Technical Assistance Program in the Former Soviet Union (PEP study). APPROACH PAPER A. Introduction 1. This evaluation
Policy Instruments for Fisheries Management and the Concept of Fisheries Refugia
 REVERSING ENVIRONMENTAL DEGRADATION TRENDS Policy Instruments for Fisheries Management and the Concept of Fisheries Refugia Christopher Paterson, UNEP/GEF South China Sea Project REVERSING ENVIRONMENTAL
Do you have any reef related concerns or specific problems you would like to share?
 Submitted County Do you have any reef related concerns or specific problems you would like to share? Do you have any suggestions about how to Improve the Our Florida Reefs Community Planning Process? What's
Goliath Grouper Public Workshops August and October, 2017
 Goliath Grouper Public Workshops August and October, 2017 Florida Fish and Wildlife Conservation Commission Division of Marine Fisheries Management and Fish and Wildlife Research Institute Version 1 1
The Wide Spread Negative Effects of Exposure to Excess Nutrients for Coral Reefs
 The Wide Spread Negative Effects of Exposure to Excess Nutrients for Coral Reefs Introduction: The majority of the Earth we live on is underwater, yet we know so little about life below the surface. It
SA New Trial Artificial Reef Project
 BACKGROUND PAPER SA New Trial Artificial Reef Project Development of options for the trial artificial reef 1. Summary CONTENTS Each year, an estimated 236,000 South Australians participate in recreational
Appendix 22 Sea angling from a private or chartered boat
 Appendix 22 Sea angling from a private or chartered boat LUC SMRTS2015 Final Report 359 March 2016 Appendix 22 Sea angling from a private or chartered boat Table A22.1: Summary of sample confidence levels
National Marine Fisheries Service, Habitat Conservation Division:
 National Marine Fisheries Service, Habitat Conservation Division: Essential Fish Habitat, South East Florida Coral Reef Initiative and Land- Based Sources of Pollution effects on Critical Fisheries Habitats
Brook Trout Angling in Maine2009 Survey Results
 Maine State Library Maine State Documents Resource Management Documents Inland Fisheries and Wildlife 5-3-2010 Brook Trout Angling in Maine2009 Survey Results Marc Edwards University of Maine Cooperative
WORLD. Geographic Trend Report for GMAT Examinees
 2012 WORLD Geographic Trend Report for GMAT Examinees WORLD Geographic Trend Report for GMAT Examinees The World Geographic Trend Report for GMAT Examinees identifies mobility trends among candidates applying
Evaluation of effects of management options for the recreational cod fishery in the western Baltic Sea
 1 Evaluation of effects of management options for the recreational cod fishery in the western Baltic Sea Thünen Institute of Baltic Sea Fisheries (Thünen-OF) Rostock, 09.Sept.2016 Dr Harry Strehlow, Dr.
Monitoring Surfing Quality Below the Jordan River Generating Station (Year 3)
") Jordan River Water Use Plan Monitoring Surfing Quality Below the Jordan River Generating Station (Year 3) Reference: JORMON-5 Monitoring Surfing Quality Below the Jordan River Generating Station Study
Jordan River Water Use Plan Monitoring Surfing Quality Below the Jordan River Generating Station (Year 3) Reference: JORMON-5 Monitoring Surfing Quality Below the Jordan River Generating Station Study
California Department of Fish and Wildlife Report to the International Pacific Halibut Commission on 2017 California Fisheries
 IPHC-2018-AM094-AR08 Received: 22 December 2017 California Department of Fish and Wildlife Report to the International Pacific Halibut Commission on 2017 California Fisheries California Department of Fish
2013 ECONOMIC IMPACT OF FLATS FISHING IN BELIZE
 2013 ECONOMIC IMPACT OF FLATS FISHING IN BELIZE Prepared for: Bonefish and Tarpon Trust P.O. Box 644257 Vero Beach, FL 32964 Prepared by: Anthony J. Fedler, Ph.D. Human Dimensions Consulting 9707 SW 55th
Earth Month 2017 Recap
 Your Southeast Florida Coral Reef Initiative has been busy in the last six months raising awareness for our reefs, and designing the future of our objectives for the next several years. The spring team
Maryland Chapter Trout Unlimited Brook Trout Conservation Effort
 Maryland Chapter Trout Unlimited Brook Trout Conservation Effort Photo by Matt Kline Portfolio of Recent Work MDTU Brook Trout Conservation Coordinator: Scott C. Scarfone, ASLA sscarfone@oasisdesigngroup.com
Summary Report: Built Environment, Health and Obesity
 Research and education Built Environment Edmonton Project Summary Report: Built Environment, Health and Obesity Introduction In 2007 the Canadian Institutes of Health Research and the Heart and Stroke
The Economic Impacts of Recreational Fishing in the Matagorda Bay System
 The Economic Impacts of Recreational Fishing in the Matagorda Bay System Prepared by Andrew Ropicki 1 Daniel Hanselka 2 Rebekka Dudensing 3 Rhonda Cummins 4 Bill Balboa 5 December 12, 2016 1 Assistant
Biogeographic Assessment of Florida Keys National Marine Sanctuary
 Biogeographic Assessment of Florida Keys National Marine Sanctuary NOAA National Centers for Coastal Ocean Science NOAA Florida Keys National Marine Sanctuary Florida Fish and Wildlife Commission Photos
Modifications to Gulf Reef Fish and South Atlantic Snapper Grouper Fishery Management Plans
 Tab B, No. 11b 3/19/15 Modifications to Gulf Reef Fish and South Atlantic Snapper Grouper Fishery Management Plans Draft Joint Generic Amendment DECISION DOCUMENT For the Joint Council Committee on South
Rookery Bay National Estuarine Research Reserve. Team OCEAN at Rookery Bay
 Rookery Bay National Estuarine Research Reserve Team OCEAN at Rookery Bay What is Team OCEAN? Why have it at Rookery Bay? How is it implemented? Partnership + + National Estuarine Research Reserves Partnership
This presentation is a review and discussion of the biology, research, and management status of goliath grouper. The presentation will also describe
 This presentation is a review and discussion of the biology, research, and management status of goliath grouper. The presentation will also describe a stakeholder survey conducted by the University of
Determining coral reef impacts associated with boat anchoring and user activity
 Determining coral reef impacts associated with boat anchoring and user activity Protect Our Reefs Grant Interim Report October 1, 2008 March 31, 2009 Donald C. Behringer 1, Thomas K. Frazer 1, Robert A.
Angling in Manitoba (2000)
") Angling in Manitoba (2000) TABLE OF CONTENTS Page Introduction 1 Angler Profile 2 Angling Effort 7 Catch and Harvest 10 Angling Expenditures 13 Bait Use 16 Nonresident Trip Characteristics 18 Angling in
Angling in Manitoba (2000) TABLE OF CONTENTS Page Introduction 1 Angler Profile 2 Angling Effort 7 Catch and Harvest 10 Angling Expenditures 13 Bait Use 16 Nonresident Trip Characteristics 18 Angling in
The 2006 Economic Benefits of Hunting, Fishing and Wildlife Watching in NORTH CAROLINA. Prepared by:
 The 2006 Economic Benefits of Hunting, Fishing and Wildlife Watching in NORTH CAROLINA Prepared by: Southwick Associates, Inc. P.O. Box 6435 Fernandina Beach, FL 32035 Ph (904) 277-9765 Fax (904) 261-1145
Monitoring Surfing Quality below the Jordan River Generating Station (Year 2)
") Jordan River Project Water Use Plan Monitoring Surfing Quality below the Jordan River Generating Station (Year 2) Reference: JORMON#5 Monitoring Surfing Quality Below the Jordan River Generating Station
Jordan River Project Water Use Plan Monitoring Surfing Quality below the Jordan River Generating Station (Year 2) Reference: JORMON#5 Monitoring Surfing Quality Below the Jordan River Generating Station
Gulf of Mexico Oil Spill
 Bulletin 1204 May 2013 Estimation of the Baseline for Assessment of Economic Impacts of the Gulf of Mexico Oil Spill on Mississippi s Commercial Fishing Sector Discrimination based upon race, color, religion,
The Right Invitation: A Comprehensive Research Study to Guide the Golf Industry to Meaningfully Increase Women s Golf Participation and Satisfaction
 The Right Invitation: A Comprehensive Research Study to Guide the Golf Industry to Meaningfully Increase Women s Golf Participation and Satisfaction 1 BACKGROUND AND OBJECTIVES Prior research conducted
Recreational Fishing License Sales in Florida:
 Recreational Fishing License Sales in Florida: 1990-2000 1 Kristina Stephan and Chuck Adams 2 Introduction The recreational fishing industry is an important natural resource-based industry in Florida.
Report to the Joint Standing Committee on Inland Fisheries and Wildlife
 Report to the Joint Standing Committee on Inland Fisheries and Wildlife As Required by 12 Section 10107-A White-tailed Deer Population Management Written By: Wildlife Management Staff, Inland Fisheries
The University of Georgia
 The University of Georgia Center for Agribusiness and Economic Development College of Agricultural and Environmental Sciences Economic Impacts of Alabama Quail Hunting Prepared by: Archie Flanders and
Orange County MPA Watch A n n u a l R e p o r t
 Orange County MPA Watch 2 0 1 4 A n n u a l R e p o r t WHAT IS AN MPA? Marine Protected Areas (MPAs) are discrete geographic marine or estuarine areas designed to protect or conserve marine life and habitat.
ECONOMIC DEVELOPMENT ELEMENT
 ECONOMIC DEVELOPMENT ELEMENT Background The Economic Development Element considers labor force and labor force characteristics, employment by place of work and residence, and analysis of the community
National Oceanic and Atmospheric Administration. Fisheries of the Caribbean, Gulf of Mexico, and South Atlantic;
 This document is scheduled to be published in the Federal Register on 02/05/2019 and available online at https://federalregister.gov/d/2019-01117, and on govinfo.gov BILLING CODE 3510-22-P DEPARTMENT OF
The Economic Impacts of Recreational Fishing in the San Antonio Bay System
 The Economic Impacts of Recreational Fishing in the San Antonio Bay System Prepared by Andrew Ropicki 1 Daniel Hanselka 2 Rebekka Dudensing 3 Rhonda Cummins 4 December 12, 2016 1 Assistant Professor and
BOBLME-2015-Ecology-52
 ii BOBLME-2015-Ecology-52 The designations employed and the presentation of material in this publication do not imply the expression of any opinion whatsoever on the part of Food and Agriculture Organization
Hunter and Angler Expenditures, Characteristics, and Economic Effects, North Dakota,
 Agribusiness and Applied Economics Report No. 507-S January 2003 Hunter and Angler Expenditures, Characteristics, and Economic Effects, North Dakota, 2001-2002 Dean A. Bangsund and F. Larry Leistritz*
Orange County MARINE PROTECTED AREAS
 Orange County MARINE PROTECTED AREAS Orange County Coastkeeper QUARTERLY REPORT 1/1/ 2013 3/30/12 2013 WHAT IS THE OC MPA WATCH PROGRAM? The Orange County Marine Protected Area (OC MPA) Watch Program enlists
Marine Management Strategy Frequently Asked Questions
 Marine Management Strategy Frequently Asked Questions Can I still go fishing at Rottnest? Yes Where will I be able to go fishing on Rottnest Island? Recreational fishing can occur at any location outside
EXECUTIVE SUMMARY. Methods
 EXECUTIVE SUMMARY In the United States, there has been both an explosion in access to gambling, and an explosion in the senior population as the baby boom generation ages. As seniors seek out recreational
Hunter Perceptions of Chronic Wasting Disease in Illinois
 HumanDimensions R e s e a r c h P r o g r a m Hunter Perceptions of Chronic Wasting Disease in Illinois Joel Brunsvold, Director Illinois Department of Natural Resources Paul Vehlow Federal Aid Coordinator
ADOT Statewide Bicycle and Pedestrian Program Summary of Phase IV Activities APPENDIX B PEDESTRIAN DEMAND INDEX
 ADOT Statewide Bicycle and Pedestrian Program Summary of Activities APPENDIX B PEDESTRIAN DEMAND INDEX May 24, 2009 Pedestrian Demand Index for State Highway Facilities Revised: May 29, 2007 Introduction
Appendix 13 Rowing and sculling in the sea
 Appendix 13 Rowing and sculling in the sea Steve Thompson SMRTS2015 Final Report 251 March 2016 Appendix 13 Rowing and sculling in the sea Table A13.1: Summary of sample confidence levels Responses Spatial
Angling in Manitoba Survey of Recreational Angling
 Angling in Manitoba 2005 Survey of Recreational Angling TABLE OF CONTENTS Page Introduction 1 Angler Profile 2 Angling Effort 6 Catch and Harvest 9 Angling Expenditures 11 Bait Use 14 Canadian and Nonresident
Monitoring beach usage on Gold Coast beaches: Is it beneficial?
 Monitoring beach usage on Gold Coast beaches: Is it beneficial? Peta Williams 1, Gervase Tuxworth 2 and Chris Lane 2 1 Griffith Centre for Coastal Management (GCCM) Gold Coast Campus, Griffith University
OVERVIEW OF METHODOLOGY
 I N T R O D U C T I O N The Orange County Transportation Authority () is the county transportation commission responsible for planning, funding and delivering transportation improvements in Orange County
Golfers in Colorado: The Role of Golf in Recreational and Tourism Lifestyles and Expenditures
 Golfers in Colorado: The Role of Golf in Recreational and Tourism Lifestyles and Expenditures by Josh Wilson, Phil Watson, Dawn Thilmany and Steve Davies Graduate Research Assistants, Associate Professor
Frequently asked questions
 Frequently asked questions Improving recreational boating safety Who will be most affected by these reforms? The primary focus of the reforms is the estimated 676 000 recreational marine licence holders
Life Transitions and Travel Behaviour Study. Job changes and home moves disrupt established commuting patterns
 Life Transitions and Travel Behaviour Study Evidence Summary 2 Drivers of change to commuting mode Job changes and home moves disrupt established commuting patterns This leaflet summarises new analysis
To Fish or Not to Fish? A role-playing activity based on the Marine Reserves process at the Channel Islands National Marine Sanctuary
 To Fish or Not to Fish? A role-playing activity based on the Marine Reserves process at the Channel Islands National Marine Sanctuary Introduction This role playing activity is designed to teach you about
Liverpool Lime Street station engineering work. Knowledge and support for October 2017 improvement work November 2017
 Liverpool Lime Street station engineering work Knowledge and support for October 2017 improvement work November 2017 Overview before the engineering work starts On 30 September work began at Liverpool
DRAFT REPORT. EN United in diversity EN. European Parliament 2017/2120(INI)
") European Parliament 2014-2019 Committee on Fisheries 2017/2120(INI) 19.12.2017 DRAFT REPORT on the state of play of recreational fisheries in the European Union (2017/2120(INI)) Committee on Fisheries
European Parliament 2014-2019 Committee on Fisheries 2017/2120(INI) 19.12.2017 DRAFT REPORT on the state of play of recreational fisheries in the European Union (2017/2120(INI)) Committee on Fisheries
Re: Consultation on the addition of narwhal and two bowhead whale populations to the SARA List
 March 31, 2006 Central & Arctic Region SARA Coordinator Freshwater Institute Fisheries & Oceans Canada 501 University Avenue Winnipeg MB R3T 2N6 Re: Consultation on the addition of narwhal and two bowhead
The Quality of Life of the People in Norway
 1 Example Report The Quality of Life of the People in Norway The Management Institute for Quality-of-Life Studies December 2018 2 Introduction This report provides a detailed picture of the quality of
Vulnerability in small-scale coastal fisheries from northern coast of Sao Paulo, Brazil, in face of global environmental change
 Vulnerability in small-scale coastal fisheries from northern coast of Sao Paulo, Brazil, in face of global environmental change Luziana Garuana S. Silva Supervisor (Brazil): Dr. Cristiana Seixas Supervisor