UPPER COLUMBIA RIVER JUVENILE WHITE STURGEON MONITORING: PHASE 4 INVESTIGATIONS,
|
|
|
- Octavia Paul
- 5 years ago
- Views:
Transcription


1 UPPER COLUMBIA RIVER JUVENILE WHITE STURGEON MONITORING: PHASE 4 INVESTIGATIONS, Engineering Earth s Development, Preserving Earth s Integrity
2
3 UPPER COLUMBIA RIVER JUVENILE WHITE STURGEON MONITORING: PHASE 4 INVESTIGATIONS, FINAL REPORT - Prepared for: BC HYDRO Environment and Social Issues 1200 Powerhouse Road, P.O. Box 500 Revelstoke, B.C. V0E 2S0 Prepared by: GOLDER ASSOCIATES LTD. 201 Columbia Avenue Castlegar, B.C. V1N 1A2 Phone: (250) Fax: (250) March 2007
4 Cover photo: Juvenile white sturgeon captured at Waneta Eddy. Suggested Citation: Golder Associates Ltd Upper Columbia River juvenile white sturgeon monitoring: Phase 4 investigations, Report prepared for BC Hydro, Castlegar, B.C. Golder Report No F: 70 p. + 6 app.
5 GOLDER ASSOCIATES LTD. EXECUTIVE SUMMARY In total, hatchery raised juvenile white sturgeon were introduced into the Transboundary Recovery Area of the Columbia River, between Hugh L. Keenleyside Dam (HLK) in Canada and Grand Coulee Dam in the U.S., from 2002 to The majority (42 969) were released into the Keenleyside Reach (HLK to the Canada - U.S. border) from 2002 to 2005, and 5637 were released into the Roosevelt Reach (Canada - U.S. border to Grand Coulee Dam) in 2004 and The primary objectives of the present study ( ; Phase 4) were to conduct a field sampling program to assess the distribution, abundance, survival, growth, and condition of juvenile white sturgeon within the study area; further identify and describe the location and characteristics of juvenile white sturgeon habitats; and, identify the degree and types of physical deformities in these fish. Sample methods used during the present study were gill nets (each net with mesh sizes of 5.1, 10.2 and 15.2 cm stretch measure), angling, underwater video, and the deployment of an underwater PIT tag reader system. Angling and set line sampling were also evaluated using the results of the 2005 Broodstock Collection Program. Phase 4 monitoring was conducted in November 2005 and in March and April Angling, gill net sampling, and underwater video surveys (using the Little Benthic Vehicle; LBV) were conducted in November LBV surveys and the underwater PIT tag reader system pilot program were conducted in March and April In total, 124 juvenile white sturgeon were captured during the present study and approximately 883 were observed during LBV surveys. The overall catch-rate of juvenile white sturgeon was 10.2 fish/net-unit (one net-unit = 100 m 2 of net sampled for 24 hours; total effort = 10 net-units); the overall observation-rate was 200 fish/hour (total effort = 4.4 hours). The Washington Department of Fish and Wildlife (WDFW) also conducted gill net sampling in October 2005 for juvenile white sturgeon in the Roosevelt Reach; 462 net-units of sample effort were expended and 212 juvenile white sturgeon were captured (0.5 fish/net-unit). Data for 52 juvenile white sturgeon captured during various other sampling programs were also obtained. In total, life history data was obtained for 388 juvenile white sturgeon (including 19 recaptures) in During the four days it was operational, the underwater PIT tag reader detected 29 individual PIT tags, of which six were detected twice. The majority (80%) of juvenile white sturgeon captured and all juveniles observed using the LBV during the present study were at depths of 15 m or more. Of the juvenile white sturgeon recorded by the LBV, 525 (59.5%) were observed over substrate composed of fines with some gravels, 159 (18.0%) were observed over fines, 130 (14.7%) were observed over fines with some gravels and cobbles, 56 (6.3%) were observed over cobbles with some gravels and fines, 10 (1.1%) were observed near boulders with some fines or cobbles and gravels, and 3 (0.3%) were observed over gravels and cobbles. Upper Columbia River Juvenile White Sturgeon Monitoring Phase 4 Investigations, Draft Report Page i
6 GOLDER ASSOCIATES LTD. Juvenile white sturgeon use of the deep (50 m), central portion of Fort Shepherd Eddy was confirmed during an LBV survey conducted on 28 November 2005 (19 juveniles were observed). A juvenile white sturgeon was captured at Genelle Eddy on 9 November 2005; the first capture in this area to date. Similar to surveys in January and March 2004, and in February 2005, hundreds of juvenile white sturgeon tightly grouped and interspersed with adults were observed during LBV surveys in Waneta Eddy in March These fish were on the river bottom, aligned facing into the current, exhibited relatively little movement, and were in very close proximity to each other (touching in many instances) within a relatively small area. Many of these juveniles were situated in the valleys between low-relief dunes (composed of fines and black slag from the Teck Cominco smelter in Trail, B.C.). This was believed to represent overwintering behaviour because the large group of juveniles was not observed during surveys conducted in August and November 2004, and November The movements of 90 hatchery juveniles implanted with sonic tags were monitored during the present study. These fish were released in May 2004 (52 Juveniles; 26 released at HLK Eddy and 26 released at Beaver Creek) and May 2005 (38 juveniles; 15 released at HLK Eddy, 15 released at Beaver Creek and 8 released in the Roosevelt Reach). Sonic tagged fish released in the Keenleyside Reach exhibited two general movement patterns based on where they were released. Fish released in HLK Eddy tended to remain between there and Sturgeon Island (an area of preferred habitat conditions with depths in excess of 15 m, near-bottom current velocities less than 0.5 m/s, and substrates consisting mainly of fines). Fish released at Beaver Creek tended to exhibit a downstream dispersal to preferred habitats in areas such as Fort Shepherd Eddy, Waneta Eddy, or Little Dalles (Roosevelt Reach). Data obtained from 2002 to 2005 were used to determine the mean fork length (FL) and mean weight (ranges in brackets) of age-1 to 4 hatchery juveniles: Age-1 (n = 225): 34.5 cm FL (21.8 to 48.0 cm); g (64 to 710 g); Age-2 (n = 212): 46.7 cm FL (34.2 to 61.1 cm); g (232 to 1592 g); Age-3 (n = 169): 52.9 cm FL (42.2 to 68.4 cm); g (414 to 2320 g); and, Age-4 (n = 120): 59.6 cm FL (45.9 to 78.8 cm); g (610 to 4750 g). Hatchery juveniles continued to exhibit relatively high growth rates during the present study. The mean growth rate of age-1 fish captured in 2005 (n = 73; 0.07 cm/day FL and 1.10 g/day) was slightly higher those captured in 2004 (n = 77; 0.06 cm/day FL and 0.85 g/day), but substantially lower than for age-1 fish captured in 2002 (n = 36; 0.11 cm/day FL and 2.01 g/day) and 2003 (n = 37; 0.10 cm/day FL and 1.80 g/day). The mean growth rate of age-2 juveniles captured in 2005 (n = 78; 0.04 cm/day FL and 1.14 g/day) was similar to those captured in 2004 (n = 70; 0.05 cm/day FL and 1.13 g/day), and slightly lower than those captured in 2003 (n = 58; 0.06 cm/day FL and 1.36 g/day). The mean growth rate of age-3 juveniles captured in 2005 (n = 80; 0.04 cm/day FL and 0.90 g/day) was lower than those captured in 2004 Upper Columbia River Juvenile White Sturgeon Monitoring Phase 4 Investigations, Draft Report Page ii
7 GOLDER ASSOCIATES LTD. (n = 78; 0.04 cm/day FL and 1.31 g/day). Comparisons of mean growth rates of juveniles at different capture locations and with and without pectoral fin deformities were also conducted. Between release and capture, 94% of juvenile white sturgeon captured from 2002 to 2005 exhibited a decrease in relative weight. This was not considered unusual because the fish were fed in the hatchery before release and then were required to adapt to life in the river. The mean relative weight of all age-1 to 4 fish at release and capture were: Age-1 (n = 221) at release: 100.5% (73.1 to 131.0%); at capture: 82.7% (63.1 to 116.5%); Age-2 (n = 208) at release: 103.4% (71.6 to 173.9%); at capture: 77.8% (55.5 to 139.6); Age-3 (n = 159) at release: 106.0% (70.9 to 155.1%); at capture: 76.0% (56.9 to 129.6%); and, Age-4 (n = 115) at release: 110.2% (78.1 to 169.6%); at capture: 82.5% (63.1 to 121.8%). Of the 350 hatchery juvenile white sturgeon for which the required data was obtained in 2005, 100 (28.6%) exhibited pectoral fin deformities. The incidence of pectoral fin deformities of hatchery juveniles captured in 2002 (n = 36) was 52.8%, of fish captured in 2003 (n = 95) was 50.5%, and of fish captured in 2004 (n = 245) was 42.9%. The incidence of pectoral fin deformities in fish from the 2001 brood year captured from 2002 to 2005 (n = 297) was 47.5%, of 2002 brood year fish (n = 189) was 43.9%, of 2003 brood year fish (n = 164) was 20.1%, and of 2004 brood year fish (n = 73) was 17.8%. This indicated that the incidence of pectoral fin deformities in hatchery juvenile white sturgeon decreased both with each successive year of sampling and brood year. An estimate of hatchery juvenile survival was conducted using the Cormack-Jolly-Seber (CJS) live recapture data type using Program MARK. Several plausible forms of the CJS model were examined and the conditional Akaike Information Criteria (AIC c ) produced by Program MARK was used to determine the most likely model within each candidate set for making the parameter estimates. The selected model, using the lowest AIC c scores, resulted in a mean survival estimate of the 2002 (releases) cohort of 0.42 ± (S.D.) between the time of release and capture in the fall. The 2003, 2004, and 2005 cohorts were pooled and the mean survival estimate between release and capture in the fall for these combined age-1+ cohorts was 0.21 ± (S.D.). The mean survival rate for all subsequent time after the first six months in the river was estimated for all cohorts combined at 0.97 ± (S.D.). As the exact number of fish released and incorporated into the analysis was known, the CJS survival parameters and their confidence intervals were used to gain a crude estimate of abundance (along with 95% confidence interval) for the population of juvenile white sturgeon now in the system of (7125 to ). The effects of capture method and gill net mesh size on selectivity for size and age classes were explored by use of the General Linear Model (GLM) for examination of fork length variability as a function of both gear type and mesh size (in the case of gill nets). Gear types with sufficient recoveries for analysis included angling, gill nets and underwater PIT tag reader data (age-class information only). The size selectivity of gill net mesh size was quite apparent (ANOVA Upper Columbia River Juvenile White Sturgeon Monitoring Phase 4 Investigations, Draft Report Page iii
8 GOLDER ASSOCIATES LTD. p < 0.001; this analysis was limited to Keenleyside Reach releases where all mesh sizes were deployed). The age-class selectivity of gear types and the geographical distribution of fish captured by gill net were also examined. The nature of the released juvenile white sturgeon population in the Transboundary Recovery Area creates difficulties in developing a long term indexing protocol. The age structure of the population will continue to change over time (i.e., in 2006 age-1+ to 5+ fish will be present, in 2007 age-1+ to 6+, etc.). Eventually gill nets will no longer be effective in capturing the older fish, and other methods will have to be incorporated. Gill net sampling, underwater video surveys, angling, and the underwater PIT tag reader should continue to be the main methods utilized during 2006 monitoring. Regardless of the methods used for long term indexing of the hatchery juvenile population, methods should be standardized in subsequent years. These methods should ensure standard release times and locations of juveniles, maintain constant sampling sites each year, and that gear type and effort are constant. Gill nets should continue to be standardized with three panels, one of each mesh size (5.1, 10.2 and 15.2 cm stretch measure). Upper Columbia River Juvenile White Sturgeon Monitoring Phase 4 Investigations, Draft Report Page iv
9 GOLDER ASSOCIATES LTD. ACKNOWLEDGEMENTS Special thanks are extended to BC HYDRO as the funding source for the project and to Karen Bray (BC Hydro, Revelstoke) for support, advice, and assistance. The following people are gratefully acknowledged for contributions of information and assistance during this study. B.C. MINISTRY OF ENVIRONMENT Colin Spence, Nelson, B.C. FRESHWATER FISHERIES SOCIETY, B.C. Ron Ek, Kootenay Sturgeon Conservation Hatchery, Wardner, B.C. WASHINGTON DEPARTMENT OF FISH AND WILDLIFE Matt Howell, Spokane, WA The following employees of GOLDER ASSOCIATES LTD. contributed to the collection of data and the preparation of this report. Michael Hildebrand, B.Sc., R.P.Bio. Larry Hildebrand, B.Sc., R.P.Bio. Dana Schmidt, Ph.D., R.P.Bio. Robyn Irvine, Ph.D. Bradley Hildebrand, B.Sc. Edward Lem, Tech. Dipl. Demitria Burgoon, Tech. Dipl. Steve Whitehead, Tech. Dipl. Chris King, Tech. Dipl. Fisheries Biologist, Author Senior Fisheries Biologist, Editor Senior Scientist/Limnologist, Statistics Statistical Ecologist, Statistics Fisheries Biologist Senior Biological Technician Biological Technician Biological Technician Biological Technician Upper Columbia River Juvenile White Sturgeon Monitoring Phase 4 Investigations, Draft Report Page v
10 GOLDER ASSOCIATES LTD. TABLE OF CONTENTS Page # EXECUTIVE SUMMARY... i ACKNOWLEDGEMENTS... v LIST OF TABLES... viii LIST OF FIGURES... ix 1.0 INTRODUCTION BACKGROUND OBJECTIVES STUDY AREA STUDY PERIOD METHODS PHYSICAL PARAMETERS Discharge Water Temperature SAMPLE METHODS Gill Nets Underwater Video Surveys Sonic Telemetry Angling Set Lines Underwater PIT Tag Reader System Boat Electroshocking Life History Data Collection Relative Weight Survival Estimates Analysis of Factors Affecting Size at Capture RESULTS PHYSICAL PARAMETERS Discharge Water Temperature FISH CAPTURE/OBSERVATION METHODS Gill Nets Incidental Catch Underwater Video Sonic Telemetry Angling Set Lines Underwater PIT Tag Reader System Boat Electroshocking JUVENILE WHITE STURGEON Distribution Characteristics of Selected Habitats Movement Keenleyside Reach Keenleyside Reach Dispersal Upper Columbia River Juvenile White Sturgeon Monitoring Phase 4 Investigations, Draft Report Page vi
11 GOLDER ASSOCIATES LTD Overwintering Areas of Sonic Tagged Juveniles Released in the Keenleyside Reach Roosevelt Reach Roosevelt Reach Dispersal Overwintering Areas of Sonic Tagged Juveniles Released in the Roosevelt Reach Life History Information Length and Weight Growth Relative Weight Pectoral Fin Deformities Captures by Family Survival Analysis Analysis of Factors Affecting Size-at-Capture DISCUSSION DISTRIBUTION AND ABUNDANCE Habitat Characteristics Depth Substrate Current Velocity Cover Movement Net Movement Movement Within Waneta Eddy JUVENILE WHITE STURGEON CONDITION Relative Weight and Growth Pectoral Fin Deformities Survival Analysis of Fork Length and Age-Class Selectivity PROPOSED LONG TERM INDEXING PROTOCOL SAMPLE METHODS Gill Nets Underwater Surveys Hook and Line Methods Underwater Remote PIT Tag Reader LITERATURE CITED APPENDIX A APPENDIX B APPENDIX C APPENDIX D APPENDIX E APPENDIX F RELEASE DATA FISH CAPTURE AND OBSERVATION DATA LIFE HISTORY INFORMATION MOVEMENT DATA PROGRAM MARK SURVIVAL ANALYSIS PROJECTIONS OF JUVENILE WHITE STURGEON SURVIVAL AND ABUNDANCE PLATES Upper Columbia River Juvenile White Sturgeon Monitoring Phase 4 Investigations, Draft Report Page vii
12 GOLDER ASSOCIATES LTD. LIST OF TABLES Page # Table 1.1 Sampling schedule for the upper Columbia River juvenile white sturgeon monitoring, Phase 4 investigations, November 2005 to April Table 2.1 Summary of VR2 receiver locations within the Transboundary Recovery Area, March Table 3.1 Summary of gill net sample effort, catch and catch-rate of juvenile white sturgeon; 2002 to Table 3.2 Comparison of juvenile white sturgeon fork length by gill net mesh size during Phase 4 monitoring, November Table 3.3 Table 3.4 Table 3.5 Table 3.6 Table 3.7 Table 3.8 Table 3.9 Table 3.10 Table 3.11 Table 3.12 Summary of age and size of juvenile white sturgeon captured by angling during the present study and the 2005 Broodstock Collection Program Summary of capture methods and locations of juvenile white sturgeon for which data was obtained from June to November 2005 (the number of recaptured fish are in brackets) Summary of juvenile white sturgeon captured and catch-rate by gill net in different depth strata during 2002 to 2005 monitoring Summary of juvenile white sturgeon captured and catch-rate by gill net in different depth strata sampled by the WDFW, October 2004 and 2005 (data provided by WDFW) Summary of substrates over which juvenile white sturgeon were observed during LBV surveys at Waneta and Fort Shepherd eddies, November 2005 and March Summary of last detections of high output sonic tags implanted in hatchery reared juvenile white sturgeon released in the Keenleyside Reach in May Summary of last detections of high and low output sonic tags implanted in hatchery reared juvenile white sturgeon released in the Keenleyside Reach in May Summary of overwintering locations of juvenile white sturgeon implanted with sonic tags and released in the Keenleyside Reach, May Summary of overwintering locations during the winter of 2005/2006 of juvenile white sturgeon implanted with sonic tags and released in May Summary of last detections of high and low output sonic tags implanted in hatchery reared juvenile white sturgeon released in the Roosevelt Reach in May Table 3.13 Life history summary of wild juvenile white sturgeon captured from 2002 to Table 3.14 Mean, minimum and maximum relative weight of hatchery juvenile white sturgeon (for which relative weight could be determined) released and captured from 2002 to Table 3.15 Summary of hatchery juvenile white sturgeon releases and captures by family, 2002 to 2005 (recaptures are not included in the percent captured column) Table 3.16 Survival and abundance estimates (with Confidence Intervals; CI) based on tag recoveries using Program MARK. The abundance estimates are derived from the survival estimates and the number of tagged fish released and included in the analysis (not purposefully removed from the population) Upper Columbia River Juvenile White Sturgeon Monitoring Phase 4 Investigations, Draft Report Page viii
13 GOLDER ASSOCIATES LTD. Table 3.17 Table 4.1 Table 4.2 Table 4.3 Table 4.4 Table 4.5 Summary of comparisons of the age-class frequencies of juvenile white sturgeon captured by gill net and angling, and detected by the underwater PIT tag reader at Waneta Eddy in Comparison of gill net effort and juvenile white sturgeon catch-rates at Kootenay Eddy, Sandbar Eddy, Fort Shepherd Eddy, and Rock Eddy during Phase 3 (September and November 2004) and Phase 4 (November 2005) monitoring Comparison of depth distribution information for juvenile white sturgeon in the Columbia and Kootenay rivers Summary of net movements of sonic tagged juvenile white sturgeon monitored during the present study, for which reliable detections were obtained, 2004 to Summary of the detected upstream and downstream movements of sonic tagged juvenile white sturgeon released in the Transboundary Recovery Area in May 2004 and Summary of the incidence of pectoral fin deformities by brood year, for juvenile white sturgeon (for which deformity data was available) captured in the Transboundary Recovery Area from 2002 to LIST OF FIGURES Page # Figure 1.1 Overview of the Keenleyside Reach study area and main sample areas Figure 1.2 Overview of the Roosevelt Reach study area... 6 Figure 3.1 Figure 3.2 Figure 3.3 Mean daily discharge of the Columbia River at Hugh L. Keenleyside Dam and Birchbank, the Kootenay River at Brilliant Dam, and the Pend d Oreille River at Waneta Dam, 1 September 2005 to 18 March Mean daily water temperatures in the Columbia River at Hugh L. Keenleyside Dam and the Birchbank Water Station, in the Kootenay River at Brilliant Dam, and the Pend d Oreille River at Waneta Dam, 1 September 2005 to 22 March Length-frequency distributions of age-1, 2, 3 and 4 hatchery juvenile white sturgeon released and captured from 2002 to Figure 3.4 Fork length of hatchery juvenile white sturgeon at release and capture, 2002 to Figure 3.5 Weight of hatchery juvenile white sturgeon at release and capture, 2002 to Figure 3.6 Figure 3.7 Frequency distribution of relative weights of age-1 hatchery juvenile white sturgeon at release and capture, 2002 to Note: bins for relative weight represent a range of 4 (i.e., 52 = 52 to 56) Frequency distribution of relative weights of age-2 hatchery juvenile white sturgeon at release and capture, 2002 to Note: bins for relative weight represent a range of 4 (i.e., 52 = 52 to 56) Upper Columbia River Juvenile White Sturgeon Monitoring Phase 4 Investigations, Draft Report Page ix
14 GOLDER ASSOCIATES LTD. Figure 3.8 Figure 3.9 Figure 3.10 Figure 3.11 Figure 3.12 Figure 3.13 Figure 3.14 Frequency distribution of relative weights of age-3 (top and middle) and age-4 (bottom) hatchery juvenile white sturgeon at release and capture, 2002 to Note: bins for relative weight represent a range of 4 (i.e., 52 = 52 to 56) Length vs. weight (relative weight) plot for hatchery juvenile white sturgeon released and captured from 2002 to releases were captured in 2002 (age-1), 2003 (age-2), 2004 (age-3), and 2005 (age-4) releases were captured in 2003 (age-1), 2004 (age-2), and 2005 (age-3) releases were captured in 2004 (age-1) and 2005 (age-2). All 2005 releases were age-1 when captured in A normal curve fit to the length-frequency data collected for juvenile white sturgeon using gill net mesh sizes of 5.1 cm (blue = Roosevelt Reach; red = Keenleyside Reach), 10.2 cm and 15.2 cm (Keenleyside Reach only) Box plot of length-frequencies of juvenile white sturgeon captured during each Phase (year) as a function of gill net mesh size (in inches; 2 = 5.1 cm; 4 = 10.2 cm; 6 = 15.2 cm) Fork length of age-1 to 4 juvenile white sturgeon captured in 2005 (Keenleyside Reach releases only) as a function of age-class and river kilometre. Trend line is a quadratic smoother Fork length of age-1 to 3 juvenile white sturgeon captured in 2004 (Keenleyside Reach releases only) as a function of age-class and river kilometre. Trend line is a quadratic smoother Comparison of Fork length distribution of Age-1,2, 3 and 4 juvenile white sturgeon captured in 2003 (Keenleyside Reach releases only) near the HLK Dam area and the Waneta Area. Only a single age-4 sturgeon was captured in the HLK Dam Area. Box plots indicate Median, Quartiles, and range of the data within 1.5 x the Intra-Quartile distance. Outlier data points beyond this distance are indicated with an asterisk Upper Columbia River Juvenile White Sturgeon Monitoring Phase 4 Investigations, Draft Report Page x
15 GOLDER ASSOCIATES LTD. 1.0 INTRODUCTION 1.1 BACKGROUND White sturgeon in the Keenleyside Reach of the Columbia River between Hugh L. Keenleyside Dam (HLK) and the Canada-U.S. border (hereafter termed the study area) have been studied intensively since 1990 (R.L. & L. 1994, 1998, 2001; Hildebrand et al. 1999; Golder 2002, Golder 2003a). These studies have indicated that for approximately the last 30 years, recruitment of white sturgeon in the study area has not occurred at a rate sufficient to maintain the population. The reasons for this remain unclear, but are likely related to industrial developments and the presence and operational characteristics of dams on the mainstem Columbia River (i.e., Hugh L. Keenleyside, Revelstoke, and Mica dams) and on major tributaries (i.e., Brilliant Dam on the Kootenay River and Waneta Dam on the Pend d Oreille River, as well as upstream dams in Canada and the United States on both rivers; Hildebrand et al. 1999, R.L. & L. 1994, UCWSRI 2002). In 1993, the confluence of the Pend d Oreille River and the Columbia River was identified as a white sturgeon spawning area, and in 1999 another spawning area was identified in the Columbia River below Revelstoke Dam (R.L. & L. 2001). To date, these two locations are the only known spawning areas for white sturgeon in the Canadian portion of the Columbia River downstream of Revelstoke Dam. In 2005, white sturgeon spawning was confirmed in the American portion of the Columbia River upstream of Grand Coulee Dam, near Northport (Howell and McLellan 2007). While spawning has been confirmed at these locations, annual recruitment from these spawning events has been extremely limited. As a result of these recruitment problems, the Upper Columbia White Sturgeon Recovery Initiative (UCWSRI) was formed in The UCWSRI is an international organization with members from state, provincial, and federal fisheries agencies and biologists from First Nations in British Columbia and Washington State. The geographic scope of the Recovery Initiative encompasses all white sturgeon residing in the Columbia River upstream of Grand Coulee Dam. The UCWSRI has developed a Recovery Plan (UCWSRI 2002), of which a key component is the supplementation of the existing white sturgeon population in the Columbia River between HLK and Grand Coulee Dam (i.e., the Transboundary Recovery Area) through broodstock collections, hatchery rearing, and subsequent stocking of juvenile white sturgeon. Chronic recruitment failure of white sturgeon in the Transboundary Recovery Area of the Columbia River has been demonstrated in many studies from the early 1980s to the present (Hildebrand and Birch 1996; R.L. & L. 1998; DeVore et al. 2000; UCWSRI 2002). The Lake Roosevelt Fisheries Evaluation Program was conducted by the Spokane Tribe of Indians in the northern portion of Lake Roosevelt from 1998 to 2003, and began sampling specifically for juvenile white sturgeon in During that study, two juvenile white sturgeon (less than 1 m total length) were captured in 1998, one in 1999, two in 2000, one in 2001, and two in 2002; juvenile white sturgeon were not captured in 2003 (C. Lee, Spokane Tribe of Indians, Wellpinit, WA, pers. comm., 2004). One of the juveniles captured in 2002 was a hatchery fish released between Beaver Creek and Waneta Eddy earlier the same year; the remaining fish were wild Upper Columbia River Juvenile White Sturgeon Monitoring Phase 4 Investigations, Draft Report Page 1
16 GOLDER ASSOCIATES LTD. juveniles. During a separate sampling program conducted in 2001, the Spokane Tribe of Indians deployed 44 gill nets (6 foot by 100 foot panels of 2 inch stretch measure) in the northern portion of Lake Roosevelt between Northport and Kettle Falls, Washington, for a total of hours of sample effort; juvenile white sturgeon were not captured (Lee and Underwood 2002). In fall 2002, hours of gill net effort expended by the Spokane Tribe of Indians in upper Lake Roosevelt captured six juvenile white sturgeon [62 cm fork length (FL) and under; C. Lee, pers. comm., 2003]; these included two hatchery juveniles that were released in Canada in Gill net sampling throughout Lake Roosevelt by the Spokane Tribe in Washington State from 1994 to 2002 resulted in an average annual catch of approximately two juvenile white sturgeon (under 1 m in fork length; C. Lee, pers. comm., 2003). The Washington Department of Fish and Wildlife (WDFW) sampled for juvenile white sturgeon in the American portion of the Columbia River upstream of Grand Coulee Dam from 2002 to the present. Catches have increased with each successive year of sampling and are discussed later in this report. In total, hatchery reared juvenile white sturgeon have been released into the Transboundary Recovery Area from 2002 to 2005; in 2005, in 2004, in 2003, and 8671 in 2002 (Appendix A, Table A1). Of these fish, (88%) were released in the Keenleyside Reach and 5637 (12%) in the Roosevelt Reach. In total, 90 hatchery reared juvenile white sturgeon have been implanted with sonic tags prior to their release; 52 in 2004 and 38 in Detailed information regarding release dates and locations, numbers, length, weight, and tags for juveniles released from 2002 to 2005 are provided in Appendix A, Tables A1 to A8. The Phase 1 juvenile white sturgeon monitoring program was initiated in the fall of 2002 (Golder 2003b). The primary objective of Phase 1 was to conduct a field sampling program to determine appropriate non-destructive methods to assess the distribution, abundance, survival, growth, and condition of juvenile white sturgeon within the study area. The Phase 2 monitoring program (Golder 2005a) was developed based on the results of Phase 1 monitoring, and conducted from October 2003 to March The Phase 3 monitoring program (Golder 2005b) was developed based on Phases 1 and 2, and conducted from August 2004 to February The results of the present study are provided in this report and compared with results from 2002 to 2004 studies where appropriate. 1.2 OBJECTIVES The first priority of the present study approach was to increase the relative rate of encounter (sample size) of tagged individuals from the various cohorts present in the juvenile population in order to improve the accuracy and precision of the survival estimates provided in the 2004 (Phase 3) report (Golder 2005b). Sampling was conducted in a manner designed to enable more robust statistical analyses (i.e., to optimize comparability and decrease variability and uncertainty in the results) than had been available from past study results. Upper Columbia River Juvenile White Sturgeon Monitoring Phase 4 Investigations, Draft Report Page 2
17 GOLDER ASSOCIATES LTD. The primary objectives of the Phase 4 (fall 2005 to spring 2006) juvenile white sturgeon monitoring program were to: 1) Conduct a field index monitoring program based on the results of 2002 to 2004 sampling to refine the use of appropriate non-destructive methods for assessing the distribution, abundance, survival, growth, and condition of juvenile white sturgeon with a specific focus on: a) maintaining consistency in gear type, sample locations, timing, biological sampling parameters, and habitat measurements established from 2002 to 2004; b) maintaining consistency of data acquisition and management by following protocols from the first 3 years of study and continuing to use and update the Upper Columbia Basin White Sturgeon Database; c) the continued experimental development of alternative, non-destructive strategies and gear types to sample juvenile white sturgeon within a range of potentially suitable habitats; and, d) the continued collaboration with U.S. agencies (i.e., the Washington Department of Fish and Wildlife) to ensure methods are consistent and data are compatible. 2) Prepare a concise technical report outlining the findings and recommendations of Phase 4 studies, including: a) assessments of the distribution, abundance, growth, condition, and survival of hatchery-reared juvenile white sturgeon encountered during field sampling; b) descriptions of habitat measurements and biological sampling results; c) development of a standardized, long-term field monitoring protocol based on the results of sampling; and, d) recommendations for the indexing program. 1.3 STUDY AREA The Columbia River between HLK and Grand Coulee Dam (i.e., the Transboundary Recovery Area) was divided into two reaches for the purpose of the present study. These reaches are: 1) the Keenleyside Reach (HLK to the Canada - U.S. border, including the Kootenay River below Brilliant Dam; and, 2) the Roosevelt Reach (the Canada - U.S. border to Grand Coulee Dam). The Keenleyside Reach was subdivided into three sections: 1) Upper Section (HLK to the Columbia - Kootenay rivers confluence, including the Kootenay River below Brilliant Dam; 2) Middle Section (immediately downstream of the Columbia - Kootenay rivers confluence to immediately upstream of Beaver Creek; and, 3) Lower Section (Beaver Creek to the Canada - U.S. border). Upper Columbia River Juvenile White Sturgeon Monitoring Phase 4 Investigations, Draft Report Page 3
18 GOLDER ASSOCIATES LTD. Phase 4 juvenile white sturgeon monitoring (the present study) was conducted in the Keenleyside Reach. Specific locations within the Keenleyside Reach where sampling was focussed were: HLK Eddy, Balfour Bay, Sturgeon Island, Kootenay Eddy, Sandbar Eddy, Genelle Eddy, Beaver Creek Launch Eddy, Trimac Eddy, Fort Shepherd Eddy, Waneta Eddy, and Rock Eddy (Figure 1.1). Sampling by the Washington Department of Fish and Wildlife (WDFW) was conducted in the Roosevelt Reach, between Gifford and Deadman s Eddy (Figure 1.2). 1.4 STUDY PERIOD Field sampling activities for juvenile white sturgeon during the present study are summarized in Table 1.1. Gill net sampling was conducted from 7 to 18 November This period was selected for the following reasons: to correspond with the main study periods of the 2002 to 2004 studies; to allow hatchery juveniles released in 2005 time to distribute throughout the study area and select suitable rearing habitats; higher water clarity during this period that allowed more effective sampling by the LBV300 TM ; and, juvenile white sturgeon are concentrated in large, overwintering aggregations at known locations (eg., HLK Eddy and Waneta Eddy) during this period, which facilitated indexing efforts. Angling was conducted in association with personnel from the Ministry of Water, Land and Air Protection (WLAP) and BC Hydro to test the effectiveness of this method and supplement encounter rates of juveniles. The mobile tracking survey was conducted to determine the degree of use of areas outside of VR2 coverage. Surveys using the Seabotix Little Benthic Vehicle 300 TM (LBV) were conducted to observe behaviour, habitat use, and provide additional data on the degree of use of Waneta and Fort Shepherd Eddies. A remote PIT tag reader system was deployed in Waneta Eddy on 26 March Sampling for juvenile white sturgeon by the WDFW in the Roosevelt Reach was conducted in October Table 1.1 Sampling schedule for the upper Columbia River juvenile white sturgeon monitoring, Phase 4 investigations, November 2005 to April Angling Mobile Tracking Gill Net Sampling LBV Surveys Remote PIT Tag Reader 2 November November November November March - 13 April November November November March November March November November November 2005 Upper Columbia River Juvenile White Sturgeon Monitoring Phase 4 Investigations, Draft Report Page 4
19 Arrow Lakes Generating Station Hugh L. Keenleyside Dam Rialto Creek # HLK Eddy Balfour Bay Sturgeon Island # # Norns Creek Castlegar # # Waldie's Island Brilliant Dam Brilliant Bridge Kootenay Eddy r K o o t e n a y R i v e N Blueberry Creek Sandbar Eddy Waterloo Eddy Su l Birchbank Water Gauge Station China Creek Genelle Eddy livan Creek # C O L U M B I A R I V E R # Rivervale Champion Creek Beaver Creek Trail Rock Island LEGEND Waneta Eddy Rock Eddy # Scale 1 : 200, Kilometers Railway Bridge Main Roads River / Stream Lake Fort Shepherd Eddy Sheppard Creek Island Swamp / Marsh Sand or Gravel Bar # 2005 Gill Net Sites Waneta Dam REFERENCE Digital Data Sets 082F.002, 082F.003, 082F.012, 082F.013, 082F.022, 082F.023, 082F.032 and 082F.033 from British Columbia Hydro. Datum: NAD 83 Projection: UTM Zone 11 # # # # Beaver Creek Launch Eddy Trimac Eddy Trimac Seven Mile Dam Cominco Water Station PROJECT TITLE P e n d Upper Columbia River Juvenile White Sturgeon Monitoring Phase 4 Investigations, Fall Spring 2006 Overview of Keenleyside Reach Study Area and Main Sample Areas Castlegar, British Columbia d ' O r e i l l e R i v e r BRITISH COLUMBIA, CANADA WASHINGTON, U.S.A. PROJECT No SCALE AS SHOWN DESIGN EL 31 March 2006 GIS EL 31 March 2006 CHECK MH 31 March 2006 REVIEW LH 31 March 2006 REV. 0 FIGURE 1.1
20
21 r l e N BRITISH COLUMBIA, CANADA WASHINGTON, U.S.A. Northport Bridge (Km 71) Little Dalles (Km 83) Columbia River # Northport Deadman's Eddy (Km 68) China Bend (Km 90) Marcus Flats Kettle Falls Bridge (Km 123) Rickey Point (Km 130) Kett le R. Colville R. Kettle Falls North Gorge (Km 96) Evans (Km 104) Marcus Island (Km 115) Barnaby Island (Km 141) Nez Perce s e v o l t Gifford (Km 160) Grand Coulee Dam Creek R o Ri v e Sanpoi Creek Wilmont e L a k Hunters (Km 180) # R Spokane i v e r LEGEND (Km 00) River Kilometer measured downstream from Hugh L. Keenleyside Dam River / Stream Hydroelectric Dam REFERENCE Digital data sets translated from USGS DLG 1 : quadrangle mapsheets. Datum: NAD 83 Projection: UTM Zone 11 Hawk C reek PROJECT TITLE Scale: 1 : Kilometers Upper Columbia River Juvenile White Sturgeon Monitoring: Phase 4 Investigations Fall Spring 2006 Overview of the Roosevelt Reach Study Area Castlegar, British Columbia PROJECT No DESIGN EL 31 Mar GIS EL 31 Mar CHECK MH 31 Mar REVIEW LH 31 Mar SCALE AS SHOWN FIGURE 1.2 REV. 0
22
23 GOLDER ASSOCIATES LTD. 2.0 METHODS 2.1 PHYSICAL PARAMETERS Discharge Discharge data for the Columbia River at HLK (including the Arrow Lakes Generating Station) and Birchbank were obtained from BC Hydro Power Records. Discharge data for Brilliant Dam and Waneta Dam were obtained from FortisBC. Mean daily discharges were calculated from the hourly data obtained Water Temperature Water temperature data was obtained from temperature loggers (Vemco 12, accurate to ±0.1 C and Onset Stowaway Tidbit, accurate to ±0.2 C; programmed to record at hourly intervals) set in the Columbia River below HLK and at the Birchbank Water Station. Kootenay River water temperatures were obtained from thermisters set below Brilliant Dam. Pend d Oreille River water temperatures were obtained from thermisters set in the Waneta Dam forebay. 2.2 SAMPLE METHODS Gill Nets Gill nets were the main sample method used to capture juvenile white sturgeon during the present study. Sample sites were selected based on 2002 to 2004 findings (and a wide range of other studies) that indicated little or no use of shallow, higher velocity habitats, to maintain consistency with previous sampling, and to facilitate statistical comparisons between years. Gill net sample sites from previous years were repeated for comparison purposes; additional effort was expended in Waneta Eddy so effort would be more proportional to abundance and to increase the overall number of juveniles captured. The nets used were multi-filament, horizontal gill nets of two sizes: 1.8 m deep by 15.2 m long (27.9 m 2 ) and 1.8 m deep by 45.7 m long (83.6 m 2 ); each comprised of three equal size panels of differing mesh size (5.1 cm, 10.2 cm and 15.2 cm stretch measure). Panel area was 9.3 m 2 for the small nets and 27.9 m 2 for the large nets. Gill nets were deployed at the bottom of the water column, with a float and float line and two concrete anchors attached to each end of the net. The nets were set in areas with low velocities and uniform substrates to prevent the nets from drifting or snagging on the bottom. The mesh size that each fish was captured in was recorded, along with set depth and orientation to flow. Gill nets were originally set during the day in the upper section of the Keenleyside Reach for approximately 3 hour periods to assess the degree of by-catch and the condition of white sturgeon captured. Fish were not captured during the daytime sets, so gill nets were set overnight. Daytime sets were not used in the middle (between the Kootenay River and Upper Columbia River Juvenile White Sturgeon Monitoring Phase 4 Investigations, Draft Report Page 7
24 GOLDER ASSOCIATES LTD. Beaver Creek) and lower sections (Beaver Creek to the Canada - U.S. border) due to the time required to process fish and travel between sections, and because of limited daylight hours Underwater Video Surveys During the present study, the SeaBotix Little Benthic Vehicle 300 TM (LBV) remotely operated underwater vehicle was used to observe juvenile white sturgeon behaviour and habitat use. The use of this system provided a visual record of habitat parameters and the availability and use of bottom cover in areas where juvenile white sturgeon were observed. LBV surveys were conducted in Waneta Eddy to attempt to locate the large aggregation of overwintering juveniles, as in previous years, and Fort Shepherd Eddy to provide a visual record of habitats in the deep portion of the eddy and data on the use of the area by juvenile white sturgeon. Footage obtained was reviewed in the office at slow speeds and the number of juvenile white sturgeon recorded was counted. If the LBV was manoeuvred away from a group of juveniles and the same group was observed later (based on location and bottom features), these fish were not counted twice. The SeaBotix Little Benthic Vehicle 300 TM consisted of the LBV with protective bumper frame, control console, surface power supply, and 300 m umbilical. The features of the LBV included: a four thruster configuration (2 forward, 1 lateral, and 1 vertical), 270 field of vision, 180 camera tilt, 2 video cameras (0.3 lux colour and 0.03 lux low-light black and white), halogen lights that track the cameras, dual scaling lasers (to aid in determining the size of objects/fish observed), and sensors for depth, heading, and temperature. Images captured by the cameras were transferred to the surface monitor via a fiber-optic cable enclosed in an 8.4 mm diameter umbilical cord. Before the LBV was placed in the water, the thrusters and cameras were tested, the unit was vacuum tested to ensure that it was watertight, and the heading sensor was calibrated. The unit was then placed in the water to verify it was neutrally buoyant and the depth sensor was calibrated. The thruster controls were checked again in the water and then the unit was sent down to the river bottom. The LBV was then manoeuvred in the desired direction(s) to obtain footage of habitat and fish. This unit can be operated at depths up to 300 m and in current speeds of up to 150 cm/s (3 knots), although its mobility decreases as current speed increases (mainly due to increased drag on the umbilical) Sonic Telemetry In total, 90 juvenile white sturgeon have been implanted with sonic tags; 52 from the 2002 brood year that were held over and released in May 2004 (Appendix A, Tables A5 and A6), and 38 from the 2004 brood year that were released in May 2005 (Appendix A, Table A3). Aside from the mobile tracking survey conducted on 4 November 2005 as part of the present study, movements of these fish were monitored as part of the Upper Columbia white sturgeon stock monitoring and data management program, funded by BC MOE, as well as by the WDFW, funded by the Spokane Tribe of Indians and the Bonneville Power Administration. A detailed description of the methods used is available in the annual report for the stock monitoring and data management program (Golder 2005c). As a component of the Brilliant Expansion Project white sturgeon monitoring program (funded by Columbia Power Corporation; Golder 2004c), two VR1 receivers were deployed in the Kootenay River on 7 February 2003 (Table 2.1). These units Upper Columbia River Juvenile White Sturgeon Monitoring Phase 4 Investigations, Draft Report Page 8
25 GOLDER ASSOCIATES LTD. were replaced on 12 February 2004 with VR2 receivers capable of detecting the sonic tags implanted in juvenile white sturgeon (V8SC-2H-R04K and V8SC-2L-R04K coded transmitters; 69.0 khz). In June 2003, VR2 receivers were deployed in HLK, Fort Shepherd, and Waneta eddies (Figure 1.1). These stations have been maintained and in continuous operation since that time. In order to improve coverage of the study area, additional VR2s were deployed as summarized in Table 2.1. Table 2.1 Summary of VR2 receiver locations within the Transboundary Recovery Area, March Receiver Location a b Date of Initial UTM Coordinates (Zone 11U) Date of Last River Kilometre Deployment Easting Northing Download Keenleyside Reach HLK Eddy June March 2006 Balfour Bay May March 2006 Sturgeon Island May March 2006 Waldie s Island June March 2006 Sandbar Eddy June March 2006 Genelle May March 2006 Sullivan Creek June March 2006 Rivervale February March 2006 Rock Island May March 2006 Trimac June March 2006 Fort Shepherd Eddy June March 2006 Waneta Eddy June March 2006 Rock Eddy June March 2006 Kootenay River Kootenay Eddy 0.1K 7 February March 2006 Brilliant Bridge 2.0K 7 February March 2006 Roosevelt Reach Deadman s Eddy June January 2006 c Northport June March 2006 Little Dalles June March 2006 China Bend 90 2 April March 2006 North Gorge 96 3 June March 2006 Marcus Island June March 2006 Kettle Falls Bridge June March 2006 Rickey Point June March 2006 Barnaby Island June April 2005 Gifford August March 2006 Hunters August March 2006 a See Figures 1.1 and 1.2 for VR2 locations. b River kilometres measured downstream from HLK in the Columbia River and upstream from the mouth in the Kootenay River. c This VR2 was lost sometime between 11 January and 16 March Angling BC Hydro, BC MOE, and Golder personnel participated in angling as part of juvenile white sturgeon monitoring on 2 November 2005 at Waneta Eddy. Worms, kokanee, roe, maggots, and eulachon were used as bait. Sampling consisted of two boats with four anglers and another boat with two work-up personnel. Juvenile white sturgeon captured by anglers were transferred to the work-up boat and processed as described in Section Angling was also conducted as part of the 2005 Broodstock Collection Program in June Although pre-spawning adult white sturgeon were targeted during this program, juveniles were frequently captured. A detailed description of angling methods used in that study can be found in the 2004 broodstock report (Golder 2005e). Upper Columbia River Juvenile White Sturgeon Monitoring Phase 4 Investigations, Draft Report Page 9
26 GOLDER ASSOCIATES LTD Set Lines Sampling by set line was not conducted during the present study; however, this method resulted in the capture of juvenile white sturgeon during the 2005 Broodstock Collection Program. A detailed description of this method can be found in the 2004 broodstock report (Golder 2005e) Underwater PIT Tag Reader System The pilot underwater PIT tag reader system was deployed on 26 March The main components of this system were: a floating wooden platform (Plate 1): 122 cm long by 122 cm wide by 22 cm deep; filled with styrofoam floatation; a weather resistant metal box (Plate 1): 92 cm long by 61 cm wide by 30 cm deep; bolted to the floating platform; an underwater housing (manufactured by Prevco Subsea LLC; Plate 2): 45 cm long, 30 cm in diameter, anodized aluminum cylinder; that housed the PIT tag reader; and, a 66 cm long by 31 cm wide waterproof, flat-plate antenna (manufactured by Biomark Inc.; Plate 2). Golder s Destron-Fearing Model 2001F-ISO PIT tag reader was sent to Biomark Inc. and was modified to be powered by 12 V batteries and for use with the underwater housing and flat-plate antenna. The PIT tag reader was placed inside the underwater housing (Plate 3) and the cables (power, communication and antenna) attached to the connections inside the underwater housing. The underwater housing was attached to an anchor frame using hose clamps and bungee cords, and a garden hose was cut open and placed over the antenna cable to provide protection (Plate 4). The antenna flanges were cable tied together at either end, with the cable inside the protective hose also attached to protect the cable insertion (Plate 5). A rope that was shorter than the antenna cable was attached to the anchor frame and antenna plate to relieve stress on the antenna cable. The power and communication cables were fed through a hole in the bottom of the floating platform and into the weather resistant box. Anchors (two 65 pound concrete anchors with 2 m of chain) were deployed approximately 5 m upstream and 5 m downstream of where the system was to be set. The anchor lines were measured to reach the river bottom, but remain as tight as possible, and 5 m lines were then attached from the marked floats to the floating platform. The floating platform was deployed off the boat and the underwater housing and antenna were lowered from the boat together to prevent stress on the antenna cable. Marked polyform LD-2 floats were attached to each corner of the platform to provide extra floatation and improve visibility (Plate 6). Signage with Golder contact information was affixed to each side of the weather resistant box. The boat was attached to the anchor lines during the deployment procedure. As a result of surging flows within the eddy, the anchors drifted from the targeted area of 19 m depth to an area of 16 m depth. Upper Columbia River Juvenile White Sturgeon Monitoring Phase 4 Investigations, Draft Report Page 10
27 GOLDER ASSOCIATES LTD. Once the system was deployed, two 80 amp-hour, deep cycle, sealed, valve regulated, non-spillable batteries were set up in series in the weather resistant box (Plate 7). The reader was then powered up and communication with the unit was established using a laptop computer. The unique delay was set to 60 seconds (i.e., a PIT tag would only be recorded once for each minute it was above the antenna); to save memory space, which was limited to 4000 tag detections with associated time and date stamps. As a test of the system, a PIT tag was affixed to the LBV which was then driven directly over the antenna. The PIT tag was detected and recorded by the system, which provided confirmation that the system was working. A marker float (and associated lines and anchors) was deployed on each side of the platform, a sufficient distance away to prevent the ropes becoming tangled. To attract fish to the antenna, frozen kokanee were cut up and placed into a bait canister (Plate 8), which was deployed approximately 10 m upstream of the antenna location. The batteries in the weather resistant box were swapped out for fully charged batteries after each download, and the bait in the canister was replaced Boat Electroshocking The effectiveness of boat electroshocking as a juvenile white sturgeon capture method was assessed during the Lower Columbia River Fish Indexing Program (LCRFIP), a separate program conducted by Golder Associates Ltd. for BC Hydro from 19 September to 1 November This program involved 6 weeks of intensive sampling to document the composition and abundance of fish species that used nearshore habitats in the Columbia River throughout the Keenleyside Reach. In the event juvenile white sturgeon were captured during the electroshocking surveys, the crew was equipped with a PIT tag reader and the equipment to conduct the necessary life history work-up. A detailed description of this sample method is provided in the 2004 LCRFIP report (Golder 2005d) Life History Data Collection Captured juvenile white sturgeon were placed in a 75 L cooler of water to which fresh river water was frequently added. The fish were scanned for PIT tags using a Destron Fearing Model 2001F-ISO portable transceiver system and checked for external marks (i.e., lateral scute removals and previous pectoral fin clips) and abnormalities. If a PIT tag was not found, one was implanted subdermally behind the head on the left side of the fish. The following measurements (to the nearest mm) were taken along the left side of each juvenile white sturgeon: snout (tip of snout to the beginning of the eye), head (tip of snout to the end of the opercular opening), fork length (FL: tip of snout to the fork where the upper and lower caudal lobes meet), total length (TL: tip of snout to the point where the upper and lower caudal lobes meet, then to the tip of the upper caudal fin lobe), and girth (circumference of fish just behind the pectoral fin insertions). Fish were weighed (to the nearest g) using an Ohaus 5000 g digital scale (±2 g). Due to time constraints (i.e., the onset of darkness), only fork length, total length, and weight were measured for many fish. After processing, fish were released when they had recovered sufficiently to swim away of their own volition. External exams were conducted for all juvenile white sturgeon captured during the present study according to protocols provided by BC MOE (a modified United States Geological Survey form). External exams included: condition of eyes, Upper Columbia River Juvenile White Sturgeon Monitoring Phase 4 Investigations, Draft Report Page 11
28 GOLDER ASSOCIATES LTD. head, barbels, body surface, opercles, gills, and fins. Any abnormalities were recorded and notable abnormalities were photographed. Fin ray sections (for ageing purposes) were obtained from three wild juveniles captured in the Roosevelt Reach by the WDFW. DNA fin samples were also taken from these three fish. Stomach samples were not obtained during the present study since a decision was made by the UCWSRI Technical Working Group (TWG) not to sacrifice fish for stomach content analysis and there were no mortalities during sampling. However, six stomach samples were collected by the WDFW in the Roosevelt Reach from juveniles that succumbed to the sample procedure (five hatchery fish and one wild fish) Relative Weight The relative weight index (W r ) is a commonly used method for comparing the condition of fish populations. The index is expressed as a percent and is calculated as: W r = W W s 100 where W is the weight of the sampled fish in kilograms, and W s is the length-specific standard-weight value for a particular species. For the purposes of this report, the W s used for calculating W r was from Beamesderfer (1993): W s = α L β where α = E -6 and ß = and L is the total length of the individual fish in cm. These parameters were derived by the regression-line-75 th percentile technique (RLP) recommended by Murphy et al. (1991). The RLP technique takes the 75 th percentile weights for each 1 cm total length interval and then regresses these values onto length to develop the W s (Murphy et al. 1991). This RLP was based on populations of white sturgeon from five rivers in the Pacific North- West (Beamesderfer 1993). During 2003 (Golder 2005a), where total lengths (TL) were not available from release or field data, they were calculated from the fork lengths (FL) using a factor of (Beamesderfer 1993). Total length data was available in the 2001 brood hatchery release data, but not for the 2002 to 2004 brood years. Relative weights originally calculated (using a factor of 1.110) for 2002 and 2003 brood fish at the point of release appeared high (approximately 30% higher than 2001 brood fish at the point of release). Therefore, the 2001 brood release data was used to calculate a new FL to TL conversion factor. The mean TL/FL ratio calculated using these 8671 fish was The TL at release of 2002 to 2004 brood fish was therefore calculated using a factor of and relative weights were determined using the resulting total lengths (see Section ). Upper Columbia River Juvenile White Sturgeon Monitoring Phase 4 Investigations, Draft Report Page 12
29 GOLDER ASSOCIATES LTD. Low numbers of juveniles captured from 2002 to 2005 exhibited malformed or shortened upper caudal fins. Discrepancies were also noted in total length data obtained from various sources. The mean TL/FL ratio of all juveniles captured from 2002 to 2005 by Golder (n = 342) was calculated as (very similar to the conversion factor above). This value was used to calculate the TL of juveniles for which this data was missing, or obviously incorrect Survival Estimates Survival estimates used the Cormack-Jolly-Seber (CJS) live recapture data type using Program MARK. The following assumptions were used for the survival estimates: 1. equal probability of capture was assumed for all cohorts sampled during the fall sampling period; 2. the probability of capturing a marked individual of a particular cohort at a given time was equal to the proportion of marked members in the population at that time; 3. fish did not lose their marks during the study period; and, 4. all marks were reported on recovery. For Program MARK survival estimates, a candidate model set was constructed. Detailed descriptions of the alternative formulations of CJS survival estimates are available in the Program MARK help file. The analysis examined several plausible forms of the CJS model and used the conditional Akaike Information Criteria (AIC c ) produced by Program MARK for determining the most likely model within each candidate set for making the parameter estimates. Models that were used in the analysis were selected from a limited set of all possible models that were believed to have some reasonable likelihood of reflecting the current understanding of the biology of juvenile white sturgeon. All fish from different release areas were grouped for the overall survival estimates. Apparent survival was estimated for the 2002 cohort during their first 6 months, the 2003 cohort for their first 6 months and all cohorts once they had been in the river for greater than 6 months. Probability of capture was estimated for 3 time periods, ( ; , 2004-present). PIT tag losses were assumed to be negligible with all non-pit tagged fish without scute removals assumed to be wild fish. Wild fish numbers were negligible and were not used in estimating survival. A goodness-of-fit (GOF) test was completed on the models using the MARK median C-hat GOF procedure. The resultant Quasi-Akaike Conditional Informational Criteria (QAIC c ) were then used to evaluate if over or under dispersion would impact model selection. C-hat values ranging from 0.5 to 4 were assessed Analysis of Factors Affecting Size at Capture The effect of capture method and gill net mesh size on selectivity for size and age classes were explored by use of the General Linear Model (GLM) for examination of fork length variability as a function of both gear type and mesh size in the case of gill nets. Gear types with sufficient recoveries for analysis included angling, gill nets and underwater PIT tag reader data. In the case of data collected by the underwater PIT tag reader, only age-class information was obtained by Upper Columbia River Juvenile White Sturgeon Monitoring Phase 4 Investigations, Draft Report Page 13
30 GOLDER ASSOCIATES LTD. identification of the individual fish. Contingency table analysis was used for hypothesis testing of differences in gear type selectivity for age class categorical data. Both Pearson Chi-square and Likelihood Ratio Chi-Square test results are reported. Geographical trends in FL of captured juvenile white sturgeon for each age class were evaluated graphically for 2003, 2004, and 2005 juvenile white sturgeon captures. Analysis was limited to Keenleyside Reach released hatchery fish only, where gill nets were standardized for having all mesh sizes of 5.1, 10.2, and 15.2 cm. All analyses of capture selectivity were completed using SYSTAT version 11 statistical software. Upper Columbia River Juvenile White Sturgeon Monitoring Phase 4 Investigations, Draft Report Page 14
31 GOLDER ASSOCIATES LTD. 3.0 RESULTS 3.1 PHYSICAL PARAMETERS Discharge Mean daily discharges of the Columbia River between 1 September 2005 and 18 March 2006 were obtained from Arrow Lakes Reservoir below HLK (via HLK and Arrow Lakes Generating Station combined) and the Birchbank Water Station, for the Kootenay River from Brilliant Dam, and for the Pend d Oreille River from Waneta Dam (Figure 3.1). During this period, the Columbia River at Birchbank followed a typical, post-impoundment discharge pattern of declining and lower discharges in the fall, increasing to a peak in December (as a result of fall precipitation events and downstream power generation requirements during the winter), with decreasing discharges through late December and January down to baseflow conditions in February. Peak discharge at Birchbank during this period was 3012 m 3 /s on 14 December and minimum discharge was 1049 m 3 /s on 14 February Main Phase 4 Sample Period Columbia River at HLK Kootenay River at Brilliant Dam Columbia River at Birchbank Pend d'oreille River at Waneta Dam Discharge (m 3 /s) Sep-05 1-Oct-05 1-Nov-05 1-Dec-05 1-Jan-06 1-Feb-06 1-Mar-06 Date Figure 3.1 Mean daily discharge of the Columbia River at Hugh L. Keenleyside Dam and Birchbank, the Kootenay River at Brilliant Dam, and the Pend d Oreille River at Waneta Dam, 1 September 2005 to 18 March Upper Columbia River Juvenile White Sturgeon Monitoring Phase 4 Investigations, Draft Report Page 15
32
33 GOLDER ASSOCIATES LTD. Over the 1 September 2005 to 5 March 2006 period, discharge from Brilliant Dam remained quite stable during September and October, generally increased from November to mid-december, exhibited relatively minor fluctuations until late January, and was stable for the remainder of the period. Maximum and minimum discharge occurred on 3 December (980 m 3 /s) and 1 March (426 m 3 /s), respectively. Mean daily discharge from Waneta Dam generally fluctuated between 955 m 3 /s (16 January) and 101 m 3 /s (10 September), with the exception of the 18 and 4 September, when discharge dropped to 37 m 3 /s and 31 m 3 /s, respectively. Discharge in the Columbia and Kootenay rivers generally increased over most of the main study period, but exhibited some fluctuation. Discharge in the Pend d Oreille River fluctuated between a high of 867 m 3 /s on 5 November and a low of 171 m 3 /s on 19 November Water Temperature Water temperatures from 1 September 2005 to 22 March 2006 were recorded in the Columbia River upstream (HLK tailrace) and downstream (Birchbank Water Station) of the influence of the Kootenay River, as well as in the Kootenay River (Brilliant Dam tailrace) and Pend d Oreille River (Waneta Dam forebay; Figure 3.2). Water temperatures in all three rivers followed a typical seasonal pattern, and declined until late February. Mean daily water temperatures in the HLK tailrace decreased from 17.1 C in early September to 3.2 C in mid-february, and at Birchbank from 17.4 to 3.1 C in late February. Water temperatures in the Kootenay and Pend d Oreille rivers followed similar patterns. During the November study period, water temperatures in the Columbia River below HLK decreased from 9.1 to 7.0 C, and downstream of the Columbia-Kootenay rivers confluence from 9.4 to 7.3 C. Water temperatures in the Kootenay River decreased from 10.4 to 7.4 C and in the Pend d Oreille River from 11.1 to FISH CAPTURE/OBSERVATION METHODS Gill Nets The majority of juvenile white sturgeon (n = 102; 82% of juveniles captured during the present study; 2005) were captured by gill net. In total, the 36 gill nets set resulted in net-hours or 10.0 net-units (one net-unit = 100 m 2 of net sampled for 24 hours). The effort expended and catch in each area sampled is provided in Appendix B, Table B1 and summarized in Table 3.1. The overall catch-rate of juvenile sturgeon was 10.2 fish/net-unit, compared to 3.8 fish/net-unit in 2002 (Phase 1; Golder 2003b), 7.6 fish/net-unit in 2003 (Phase 2; Golder 2005a), and 7.5 fish/netunit in 2004 (Phase 3; Golder 2005b). The catch-rate was lower in HLK Eddy and higher in Balfour Bay during the present study than in 2002 to 2004 studies (Table 3.1). The catch-rate in Kootenay and Sandbar eddies was lower during the present study than in Juvenile white sturgeon were not captured in Fort Shepherd or Rock eddies during the present study. The catch-rate in Waneta Eddy was similar to that recorded in 2004, lower than in 2003, and higher than A juvenile white sturgeon was captured in Genelle Eddy during the present study; this represented the first capture in this area. Upper Columbia River Juvenile White Sturgeon Monitoring Phase 4 Investigations, Draft Report Page 16
34
35 GOLDER ASSOCIATES LTD Main Phase 4 Sample Period Columbia River at HLK Kootenay River at Brilliant Dam Columbia River at Birchbank Pend d'oreille River at Waneta Dam Temperature ( o C) Sep-05 1-Oct-05 1-Nov-05 1-Dec-05 1-Jan-06 1-Feb-06 1-Mar-06 Date Figure 3.2 Mean daily water temperatures in the Columbia River at Hugh L. Keenleyside Dam and the Birchbank Water Station, in the Kootenay River at Brilliant Dam, and the Pend d Oreille River at Waneta Dam, 1 September 2005 to 22 March Table 3.1 Summary of gill net sample effort, catch and catch-rate of juvenile white sturgeon; 2002 to Phase 1 (2002) Phase 2 (2003) Phase 3 (2004) Phase 4 (2005) Location a Effort No. Catchrate Cap. rate Cap. rate Cap. rate c No. Catch- No. Catch- No. Catch- b c Effortb c Effortb c Effortb Cap. HLK BB KE SE GE NS d NS d NS d FSE NS d NS d NS d WE RE NS d NS d NS d Subtotal Rest e Total a See Figure 1.1 for sample locations. HLK = HLK Eddy; BB = Balfour Bay; KE = Kootenay Eddy; SE = Sandbar Eddy; GE = Genelle Eddy; FSE = Fort Shepherd Eddy; WE = Waneta Eddy; RE = Rock Eddy. b Effort is in net-units; one net-unit = 100 m 2 of net sampled for 24 hours. c Catch-rate = number of juvenile white sturgeon captured per net-unit. d NS = not sampled (these locations were not sampled during Phase 1 monitoring). e Rest = rest of study area. Upper Columbia River Juvenile White Sturgeon Monitoring Phase 4 Investigations, Draft Report Page 17
36
37 GOLDER ASSOCIATES LTD. During the present study, daytime gill net sets were only conducted in the upper section (HLK Eddy to Kootenay Eddy). Juvenile white sturgeon (or incidental species) were not captured by daytime sets. The total effort expended for daytime sets was 0.50 net-units; overnight effort was 9.52 net-units. During the present study, each gill net used was composed of equal areas of 5.1, 10.2, and 15.2 cm stretch measure mesh. Each mesh size was fished for one third of the total effort, or 3.34 net-units. Catch-rates for each mesh size were 9.6 fish/net-unit (5.1 cm; n = 32 fish), 14.4 fish/net-unit (10.2 cm; n = 48 fish), and 6.6 fish/net-unit (15.2 cm; n = 22 fish; Appendix B, Table B1). A difference in the size of juveniles captured by the three different mesh sizes was apparent from the results of the present study (Table 3.2; ANOVA p < 0.001; see Sections and 4.2.4). Table 3.2 Comparison of juvenile white sturgeon fork length by gill net mesh size during Phase 4 monitoring, November Fork Length (cm) Mesh Size (cm stretch measure) Mean Minimum Maximum Standard Error n ANOVA p < Washington Department of Fish and Wildlife (WDFW) personnel expended 462 net-units of effort in the Roosevelt Reach from 3 to 27 October 2005; 212 juvenile white sturgeon were captured (M. Howell, WDFW, Colville, Washington, U.S.A., pers. comm., 2006). The overall catch-rate of juvenile sturgeon was 0.5 fish/net-unit (Appendix B, Table B2). Gill nets used by the WDFW measured m long by 3.66 m deep. If the nets were treated as 1.83 m deep for comparison purposes (i.e., since juveniles were rarely captured in the upper portion of the nets), the catch-rate would increase to 0.9 fish/net-unit (based on 231 net-units of effort) Incidental Catch During the present study, 22 fish were captured incidentally during gill net sampling. The majority (n = 18; 81.8%) were non-sportfish species (Appendix B, Table B3) and consisted of longnose sucker (n = 11), largescale sucker (n = 6), and peamouth (n = 1). The only sportfish species captured incidentally was lake whitefish (n = 4). In total, 68% of the incidental captures were released alive Underwater Video In total, 4.4 hours of underwater footage was obtained using the LBV during the present study; 2.7 hours at Waneta Eddy and 1.6 hours at Fort Shepherd Eddy. An estimated 880 juvenile, 6 sub-adult, and 8 adult white sturgeon, as well as 17 fish of other species were observed (Appendix B, Table B4). In total, approximately 860 juvenile white sturgeon were observed at Waneta Eddy and 19 were observed at Fort Shepherd Eddy. A summary of juvenile white sturgeon Upper Columbia River Juvenile White Sturgeon Monitoring Phase 4 Investigations, Draft Report Page 18
38 GOLDER ASSOCIATES LTD. observations and the habitat characteristics associated with these observations is provided in Appendix B, Table B5, and further described in Section During the survey in Waneta Eddy on 16 November 2005, a total of 356 juvenile white sturgeon were observed. These fish were either alone or in groups that ranged from 2 to 67 fish (Appendix B, Table B5). The large aggregations of juvenile white sturgeon previously observed at this location in January 2004, March 2004, and February 2005 were not observed on this date (Golder 2005a and 2005b). However, the juveniles that were observed exhibited similar behaviour to those observed in the large aggregation recorded on 24 March 2006 (see below), but with lower numbers and densities. During this and the following surveys described below, it was noted that the scaling lasers on the LBV appeared to spook juvenile white sturgeon when attempts were made to get size estimates of fish observed. An LBV survey was conducted in Fort Shepherd Eddy on 28 November This represented the first time observations were made in the approximately 50 m deep central portion of this eddy. In total, 19 juvenile and one adult white sturgeon were observed during this survey. The dominant substrates of the deep portion of Fort Shepherd Eddy were boulders and cobbles, but areas of gravels and fines were also observed. Large woody debris was also observed in several areas. An LBV survey was conducted in Waneta Eddy on 24 March 2006, to determine if the large aggregations of juveniles previously observed in the eddy were present and to identify the best location for deployment of the underwater PIT tag reader system. In total, approximately 500 juvenile white sturgeon (812 fish/hour) were observed, including one large aggregation estimated to consist of over 350 fish (Appendix B, Table B5). The location of this group was marked using an anchor, rope and float, which was used to determine the location to deploy the underwater PIT tag reader system on 26 March The majority of these fish were observed tightly grouped and interspersed with adults in one large aggregation, similar to that observed on 19 January and 29 March 2004 (Phase 2; Golder 2005a), and on 24 February 2005 (Phase 3; Golder 2005b). These fish were on the river bottom, aligned facing into the current, exhibited relatively little movement, and were in very close proximity to each other (touching in many instances) within a relatively small area. The majority of juveniles observed over substrates comprised mainly of fines and black slag (from the Teck Cominco smelter in Trail) were situated in the lee of the valleys between the low-relief dunes (still facing into the current). The LBV was deployed on 26 March 2006 at Waneta Eddy to check whether the large aggregation of juveniles observed on 24 March was still present at the same location and to observe the underwater PIT tag system after it was deployed to determine if there were any problems with the deployment. Although a small number of juveniles were observed (12 fish), the large aggregation was no longer at the marked location. This was similar to observations made during 2003 to 2004 monitoring (Golder 2005a), when a large aggregation marked on one day moved to a new location on the next day. The deployment of the underwater PIT tag reader system was successful and problems with the deployment configuration were not observed during the LBV survey. Upper Columbia River Juvenile White Sturgeon Monitoring Phase 4 Investigations, Draft Report Page 19
39 GOLDER ASSOCIATES LTD Sonic Telemetry The majority of sonic tags implanted in the 52 juvenile white sturgeon released in May 2004 and the 38 released in May 2005 were detected by the VR2 stations deployed in the Keenleyside and Roosevelt reaches. The VR2 stations were in constant operation prior to, during, and after the present study. Information on the movement of juvenile implanted with sonic tags is provided in Section Angling In total, 34 hook-hours of angling effort were expended on 2 November 2005 at Waneta Eddy as part of the present study; 22 juvenile white sturgeon were captured (catch-rate of 0.6 fish/hook-hour; Appendix B, Table B6). Angling was also conducted during the 2005 Broodstock Collection Program (June 2005) where 125 hook-hours of angling effort captured 25 juvenile white sturgeon (0.2 fish/hook-hour; Golder, unpublished data). Of these 25 fish, 3 were captured at Fort Shepherd Eddy (48 hook-hours; 0.1 fish/hook-hour) and 22 were captured at Waneta Eddy (71 hook-hours; 0.3 fish/hook-hour). The total number of juvenile white sturgeon captured by angling during 2005 was 47 and the overall catch-rate was 0.3 fish/hook-hour. Angling appeared to be more effective at capturing larger, older fish than smaller, younger fish (Table 3.3). Table 3.3 Summary of age and size of juvenile white sturgeon captured by angling during the present study and the 2005 Broodstock Collection Program. Age n Fork Length (cm) Weight (g) Mean Minimum Maximum Mean Minimum Maximum Set Lines Set line sampling was not conducted as a component of the present study. This was the main sample method used during the 2005 Broodstock Collection Program, when hook-hours of sample effort were expended (Golder, unpublished data). In total, two hatchery juvenile white sturgeon were captured using this method, resulting in an overall catch-rate of 0.03 fish/100 hook-hours (Appendix B, Table B7). These fish were both from the 2001 brood year (i.e., age-4+); one was released on 14 May 2002 in the Kootenay River (52.0 cm FL and 1134 g at capture) and one was released on 17 May 2002 between Beaver Creek and Waneta Eddy (61.0 cm FL and 1814 g at capture) Underwater PIT Tag Reader System The underwater PIT tag reader was successfully downloaded on 27 March 2006, the day after it was deployed. A total of 12 detections had been recorded: 10 individual tags of which two were detected twice. The system was downloaded again on 30 March 2006: a total of 23 detections were recorded (19 individual tags of which four were detected twice). Over the first 4 days after deployment of the system, a total of 29 individual PIT tags were detected and six tags were Upper Columbia River Juvenile White Sturgeon Monitoring Phase 4 Investigations, Draft Report Page 20
40 GOLDER ASSOCIATES LTD. detected twice. The time between the first and second detections for these six tags were approximately 2 minutes, 14 minutes, 2.5 hours, 3 hours, 21 hours, and 22.5 hours. The system was downloaded again on 5 April The laptop could not communicate with the reader. The batteries were swapped out, after which communication was successful. However, the system had reverted to default settings, the date and time reverted to 1 June 1996, and there were no tag detections in the memory. Discussions with Biomark indicated the problem was most likely related to the failure of the lithium battery inside the reader. The two 100 amphour 12 V batteries were replaced with three 80 amp-hour 12 V batteries. Based on the draw of the system (1.2 amps/hour), these batteries were calculated to provide over 8 days of life. Replacing the lithium battery would have required pulling up the system, opening the underwater housing and the reader, closing them back up, performing a vacuum test of the underwater housing, and redeploying the system. The decision was made to leave the system in place and to download it 5 days later (i.e., well before the new 12 V batteries expired). When next checked on 10 April 2006, the system had shifted and the floats attached to the anchor lines were now beside each other. When downloaded, the reader had not detected any tags. The 12 V batteries were replaced and the reader was successfully communicated with afterwards. The date and time remained correct, however. This indicated that the problem was not the lithium battery as previously thought. The decision was then made to remove the system on 13 April During the removal of the system, it was noted that the cables and ropes were quite tangled, and that, coupled with the drifting of the system, may have resulted in stress to the antenna cable insertion despite the precautions taken to prevent this. The system will be sent to Biomark for repair and modification as required Boat Electroshocking During the 2005 LCRFIP, approximately 240 km (about 40 km during each of six sample sessions conducted from 19 September to 1 November) of nearshore habitat were sampled by boat electroshocking within the present study area. Juvenile white sturgeon were not captured during the 2005 LCRFIP (Golder 2006). 3.3 JUVENILE WHITE STURGEON Unless otherwise specified, data in the following sections are based on a total of 381 juvenile white sturgeon (388 including seven fish captured twice in 2005) for which life history data were obtained in In total, 379 hatchery juveniles and two wild juveniles were captured in Life history data of juvenile white sturgeon were obtained from the following sources: 124 from the present study (including 5 fish captured twice in 2005); o 102 during gill net sampling (2 were also captured by angling, 2 were also captured during the 2005 Broodstock Collection Program, and 1 was captured twice during gill net sampling); o 22 during angling; Upper Columbia River Juvenile White Sturgeon Monitoring Phase 4 Investigations, Draft Report Page 21
41 GOLDER ASSOCIATES LTD. 212 from Roosevelt Reach juvenile white sturgeon sampling conducted by WDFW (gill netting; WDFW unpublished data); one was captured twice by the WDFW and one was also captured during sampling conducted by the Colville Confederated Tribes for the Environmental Protection Agency (EPA); 27 from the 2005 Broodstock Collection Program; o o 25 by angling; 2 by set line; 12 from Spokane Tribe of Indians Fish Assemblage Sampling for the EPA (gill netting; WDFW unpublished data); 11 from sampling conducted by the Colville Confederated Tribes for the EPA (gill netting; WDFW unpublished data); and, 2 from a WDFW Limnetic Survey (gill netting; WDFW unpublished data) Distribution A summary of the distribution (capture locations) of the 388 juvenile white sturgeon included in this analysis (data obtained as described above) is provided in Table 3.4. The majority (n = 336; 86.6%) of these fish were captured during the present study (n = 124; 32.0%) and during juvenile white sturgeon sampling conducted by the WDFW (n = 212; 54.6%). The main areas where juvenile white sturgeon were captured were Waneta Eddy (n = 136; 35.1%), Little Dalles (n = 55; 14.2%) and downstream of Little Dalles to China Bend (n = 55; 14.2%). Approximately 80% (n = 190) of the 237 juveniles captured in the Roosevelt Reach in 2005 were captured in a 41 km section between Little Dalles (RKm 82) and the downstream end of Marcus Flats (Kettle Falls Bridge; RKm 123); an area where 45% of the sample effort was expended (209 of 462 net-units). In total, approximately 900 juvenile white sturgeon were observed using the LBV. With the exception of 19 observed at Fort Shepherd Eddy, all of these fish were observed at Waneta Eddy. Since 2002, a total of 755 juvenile white sturgeon have been captured in the Transboundary Recovery Area (24 of these fish have been captured twice). A summary of where these fish were captured is provided in Appendix B, Table B8. The majority of these fish were captured during 2002 to 2005 monitoring (n = 366; 48.5%) and during juvenile white sturgeon sampling conducted by the WDFW (n = 336; 44.5%). Despite the low catch during the present study (n = 6; 1.5%), HLK Eddy was one of the main areas where juvenile white sturgeon were captured from 2002 to 2005 (n = 91; 11.7%), along with Waneta Eddy (n = 278; 35.7%), Little Dalles (n = 82; 10.5%) and downstream of Little Dalles to China Bend (n = 79; 10.1%). Similar to 2005 results, approximately 80% (n = 286) of the 361 juveniles captured in the Roosevelt Reach from 2002 to 2005 were captured in a 41 km section between Little Dalles (RKm 82) and the downstream end of Marcus Flats (Kettle Falls Bridge; RKm 123). Upper Columbia River Juvenile White Sturgeon Monitoring Phase 4 Investigations, Draft Report Page 22
42 GOLDER ASSOCIATES LTD. Table 3.4 Summary of capture methods and locations of juvenile white sturgeon for which data was obtained from June to November 2005 (the number of recaptured fish are in brackets). Location a River Km b Capture Method Gill Net Angling Set Line All Methods No. % No. % No. % No. % HLK Eddy Balfour Bay Kootenay Eddy 0.1K Sandbar Eddy Genelle Eddy Fort Shepherd Eddy Waneta Eddy (10) (4) (14) 35.1 Keenleyside Reach Subtotal (10) (4) (14) 38.9 Deadman s Eddy to Northport Five-mile Creek area Northport Hole to Onion Creek Little Dalles (1) (1) 14.2 Marble to China Bend (2) (2) 14.2 North Gorge area (1) (1) 5.7 Bossburg to Marcus Island (1) (1) 6.7 Marcus Flats Kettle Falls to Martin Creek Roosevelt Reach Subtotal (5) (5) 61.1 Total (15) (4) (19) a See Figures 1.1 and 1.2 for sample locations. b River kilometres measured downstream from HLK. A K designation indicates distance in the Kootenay River upstream from the mouth Characteristics of Selected Habitats During the present study, gill nets were set in different depth strata to assess juvenile white sturgeon use of different depths (Table 3.5). Gill net depths were derived by calculating the mean of the minimum and maximum depth of each net set. The minimum depth at which juvenile white sturgeon were captured was 6.5 m (Appendix C, Table C1). A summary of juvenile white sturgeon captured and the catch-rate of these fish in the depth strata sampled by the WDFW is provided in Table 3.6. The minimum capture depth recorded during 2005 sampling by the WDFW was 5.8 m. Specific depth data for juvenile white sturgeon captured during the 2005 Broodstock Collection Program was unavailable. The 22 juveniles captured by angling at Waneta Eddy on 2 November 2005 were caught between 15 and 20 m depth. The 12 juvenile captured during sampling in the Roosevelt Reach by the Spokane Tribe of Indians were at 10 m depth; of the juveniles captured by the Colville Confederated Tribes for which depth data was available, 7 were captured at 18 m depth and 1 at 20 m depth; the 2 juveniles captured during the WDFW limnetic survey were captured at 40 m depth (WDFW unpublished data). Upper Columbia River Juvenile White Sturgeon Monitoring Phase 4 Investigations, Draft Report Page 23
43 GOLDER ASSOCIATES LTD. Table 3.5 Summary of juvenile white sturgeon captured and catch-rate by gill net in different depth strata during 2002 to 2005 monitoring. Depth Number of Nets Effort (net-units) a Number Captured CPUE (No./net-unit) b (m) < Total < a One net-unit = 100 m 2 of net sampled for 24 hours. b CPUE = catch-per-unit-effort. Table 3.6 Summary of juvenile white sturgeon captured and catch-rate by gill net in different depth strata sampled by the WDFW, October 2004 and 2005 (data provided by WDFW). Depth (m) Number of Nets Effort (net-units) a Number Captured CPUE (No./net-unit) b < Total < a One net-unit = 100 m 2 of net sampled for 24 hours. b CPUE = catch-per-unit-effort. For analysis purposes, the number of juvenile white sturgeon observed using the LBV was set at 883 fish (Appendix B, Table B4). All of the 356 juveniles observed at Waneta Eddy on 16 November 2005 were between 15 and 21 m in depth. Of the 496 juvenile observed at Waneta Eddy on 24 March 2006, 483 were between 19 and 21 m depth and 13 were between 15 and 19 m depth. The 12 juveniles observed at Waneta Eddy on 26 March 2006 were also all between 15 and 20 m depth. Of the 19 Juveniles observed at Fort Shepherd Eddy on 28 November 2005, four were between 37 and 44 m depth and 15 were between 45 and 50 m depth. Almost all (878 of 883; 99.4%) of the juveniles observed using the LBV during the present study were associated with substrate composed at least partially of fines, 715 (81.0%) were associated with gravels, 191 (21.6%) were associated with cobbles, and 10 (1.1%) were associated with boulders (Table 3.7). Substrate and habitat conditions in Waneta Eddy and Fort Shepherd Eddy are discussed in Section Prior to the LBV survey conducted at Fort Shepherd Eddy on 28 November 2005, substrate conditions there were unknown. Upper Columbia River Juvenile White Sturgeon Monitoring Phase 4 Investigations, Draft Report Page 24
44 GOLDER ASSOCIATES LTD. Table 3.7 Summary of substrates over which juvenile white sturgeon were observed during LBV surveys at Waneta and Fort Shepherd eddies, November 2005 and March Substrate a Juvenile White Sturgeon Observed n % Waneta Eddy Fines Fines and Gravel Fines, Gravel & Cobble Cobble, Gravel & Fines Gravel & Fines Gravel & Cobble Waneta Eddy Total Fort Shepherd Eddy Fines Fines, Cobble & Gravel Cobble, Fines & Gravel Boulder & Fines Cobble, Gravel & Boulder Cobble Fort Shepherd Eddy Total a Substrates are listed from most to least dominant. Fines include black slag from the Teck Cominco smelter in Trail, B.C Movement Keenleyside Reach In May 2004, the 52 hatchery juvenile white sturgeon held over from the 2002 brood year for high output sonic tag implantation were released in the Keenleyside Reach. Half of these fish were released at Beaver Creek on 12 May (Appendix A, Table A5) and half at HLK Eddy on 13 May (Appendix A, Table A6). A summary of when these fish were last detected is provided in Table 3.8. In May 2005, 30 hatchery juvenile white sturgeon implanted with sonic tags (2004 brood year) were released in the Keenleyside Reach. These fish were released on 4 May, split evenly between HLK Eddy and Beaver Creek; half were implanted with high output V8 pingers and half with low output V8 pingers (Appendix A, Table A3). A summary of when these fish were last detected is provided in Table 3.9. In the Keenleyside Reach, little difference was observed between the detection effectiveness of the low and high output V8 pingers that were implanted in juveniles released in May This may reflect the narrower channel width of the Columbia River in the Keenleyside Reach as compared to the Roosevelt Reach, as well as the tendency of the juveniles to concentrate in the discrete larger eddy and lower velocity habitats within the Keenleyside Reach (i.e., HLK Eddy to Sturgeon Island, Fort Shepherd Eddy, and Waneta Eddy). Upper Columbia River Juvenile White Sturgeon Monitoring Phase 4 Investigations, Draft Report Page 25
45 GOLDER ASSOCIATES LTD. Table 3.8 Summary of last detections of high output sonic tags implanted in hatchery reared juvenile white sturgeon released in the Keenleyside Reach in May Last Detected Released at HLK Released at Beaver Creek n Tag IDs n Tag IDs Total n never reliably detected , 1865, 1883, 1894, May , 1892, , 1879, 1885, June , 1876, 1882, 1889, 1891, , 1859, 1893, 1904, July Aug , Sep Nov , Mar Apr May June , Aug Sep , 1871, Mar (present) , 1866, 1874, 1887, 1890, , 1877, Table 3.9 Summary of last detections of high and low output sonic tags implanted in hatchery reared juvenile white sturgeon released in the Keenleyside Reach in May Released at HLK Released at Beaver Creek Last Detected Tag IDs Tag IDs Total n n n Low Output High Output Low Output High Output never reliably detected , 1827, 1831, May June July , Aug Oct Dec , Mar (present) , 1808, , , 1835, Keenleyside Reach Dispersal The movement patterns of individual juvenile white sturgeon implanted with sonic tags and released in May 2004 are presented in Appendix D, Figure D1; the detection histories of fish not included in Figure D1 (due to lack of detections, unreliable detections, or detections only on the day of release that indicated no movement) are described in Appendix D, Table D1. The dispersal of juveniles released at Beaver Creek on 12 May 2004 that were detected in areas other than Fort Shepherd Eddy and/or Waneta Eddy is depicted in Appendix D, Figure D2. The movement patterns of the 26 juveniles released at HLK Eddy on 13 May 2004 are summarized as follows: 1 fish was not reliably detected after release (#1864); 24 fish were only detected between HLK Eddy and Sturgeon Island; o 7 were only detected between HLK Eddy and Sturgeon Island; 2 of these fish were last detected in June 2004 (#1876 and 1889); 1 was last detected in May 2005 (#1881); 1 was last detected in August 2005 (#1895); Upper Columbia River Juvenile White Sturgeon Monitoring Phase 4 Investigations, Draft Report Page 26
46 GOLDER ASSOCIATES LTD. 3 were last detected in March 2006 (the last download; #1866, 1874, and 1898); o o 6 were only detected at HLK Eddy; 2 only on the day of release (#1892 and 1901); 1 was last detected in June 2004 (#1870); 1 was last detected in July 2004 (#1867); 2 were last detected in March 2006 (#1887 and 1890); 11 were only detected at HLK Eddy and Balfour Bay; 3 were last detected in June 2004 (#1882, 1891, and 1897); 1 was last detected in August 2004 (#1902); 1 was last detected in September 2004 (#1903); 2 were last detected in November 2004 (#1862 and 1868); 1 was last detected in March 2005 (#1896); 2 were last detected in June 2005 (#1854 and 1899); 1 was last detected in March 2006 (#1860); and, 1 fish (#1858) moved downstream and was last detected at Rivervale on 25 May The movement patterns of the 26 juveniles released at Beaver Creek on 12 May 2004 are summarized as follows: 5 fish were not reliably detected after release (#1856, 1865, 1883, 1894, and 1900); 14 fish were detected only in the lower section of the Keenleyside Reach (Fort Shepherd and Waneta eddies); o o 9 were detected only at Fort Shepherd Eddy; 4 were last detected in June 2004 (#1855, 1859, 1893, and 1905); 1 was last detected in July 2004 (#1873); 2 were last detected in August 2004 (#1857 and 1863); 1 was last detected in April 2005 (#1880); 1 was last detected in March 2006 (#1884); 5 moved to Waneta Eddy and were subsequently only detected there; 1 was detected only on the day of release (#1853); 2 were last detected in May 2004 (#1879 and 1888); 1 was last detected in June 2004 (#1904); 1 was last detected in May 2005 (#1875); 5 fish moved downstream into the Roosevelt Reach; o 2 remained at Little Dalles; 1 was last detected in September 2005 (#1869); 1 was last detected in March 2006 (#1861); o 1 was last detected at North Gorge in September 2004 (#1886); o 1 was last detected at Kettle Falls Bridge in May 2004 (#1885); o 1 moved back into the Keenleyside Reach to the Kootenay River and was last detected in September 2005; (#1871); 2 fish moved into the upper section of the Keenleyside Reach; o 1 was last detected in September 2005 (#1872); and, o 1 was last detected in March 2006 (#1877). Upper Columbia River Juvenile White Sturgeon Monitoring Phase 4 Investigations, Draft Report Page 27
47 GOLDER ASSOCIATES LTD. The movements of individual juvenile white sturgeon implanted with sonic tags and released in May 2005 are presented in Appendix D, Figure D3; the detection histories of fish not included in Figure D3 (due to lack of detections, unreliable detections, or detections only on the day of release that indicated no movement) are described in Appendix D, Table D2. The dispersal patterns of juveniles released at Beaver Creek on 4 May 2005 that did not remain at Fort Shepherd Eddy and/or Waneta Eddy are depicted in Appendix D, Figure D4. Of the 15 juveniles released at HLK Eddy, 13 were detected only at this location and Balfour Bay, and 2 were detected only between HLK Eddy and Sturgeon Island. Of the 15 juveniles released at Beaver Creek, 6 were detected only at Fort Shepherd and Waneta eddies (1 at Fort Shepherd Eddy only), 4 moved downstream into the Roosevelt Reach, and 5 were not reliably detected after release Overwintering Areas of Sonic Tagged Juveniles Released in the Keenleyside Reach All of the juvenile white sturgeon released at HLK Eddy in May 2004 for which overwintering locations could be determined were located between HLK Eddy and Sturgeon Island (Table 3.10). Of the 26 juveniles released at Beaver Creek in May 2004, one overwintered at Balfour Bay, two at Fort Shepherd Eddy, one at Waneta Eddy, and two at Little Dalles (one of which overwintered there during both winters at-large). The remaining juveniles were detected sporadically during the winter periods, therefore an overwintering location could not be assigned with confidence. Table 3.10 Summary of overwintering locations of juvenile white sturgeon implanted with sonic tags and released in the Keenleyside Reach, May Release Location Overwintering Location Sonic Tag IDs Detected During the Winter Period HLK Eddy HLK Eddy , 1887, 1890 HLK Eddy to Balfour Bay 1898 Balfour Bay HLK Eddy to Sturgeon Island 1895 Sturgeon Island 1866 Beaver Creek Balfour Bay 1877 Fort Shepherd Eddy 1872, 1880 Waneta Eddy 1875 Little Dalles 1861, Similar to fish released in May 2004, all of the juveniles released at HLK Eddy in May 2005 for which overwintering locations could be determined were located between HLK Eddy and Sturgeon Island (Table 3.11). Of the 15 juveniles released at Beaver Creek in May 2005, two overwintered at Fort Shepherd Eddy and two at Little Dalles. Table 3.11 Summary of overwintering locations during the winter of 2005/2006 of juvenile white sturgeon implanted with sonic tags and released in May Release Location Overwintering Location Sonic Tag IDs Detected HLK Eddy HLK Eddy 1800, 1804, 1808, 1814, 1830, 1836 HLK Eddy to Balfour Bay 1834 HLK Eddy to Sturgeon Island 1806 Beaver Creek Fort Shepherd Eddy 1811, 1835 Little Dalles 1829, 1837 Nancy Creek/Marcus Flats (Roosevelt Reach) Fort Shepherd Eddy 1823 Upper Columbia River Juvenile White Sturgeon Monitoring Phase 4 Investigations, Draft Report Page 28
48 GOLDER ASSOCIATES LTD Roosevelt Reach On 11 May 2005, eight hatchery juvenile white sturgeon (2004 brood year) implanted with sonic tags were released in the Roosevelt Reach. Half of these fish were implanted with high output V8 pingers and half with low output V8 pingers (Appendix A, Table A3). A summary of when these fish were last detected is provided in Table Table 3.12 Summary of last detections of high and low output sonic tags implanted in hatchery reared juvenile white sturgeon released in the Roosevelt Reach in May Last Detected Low Output Tag IDs High Output Tag IDs May July August , 1828 November March 2006 (present) In the Roosevelt Reach, high output V8 pingers appeared to be more effective (i.e., had a higher detection rate) than the low output pingers that were implanted in juveniles released in May This was likely due to the greater width of the Columbia River in this reach compared to the Keenleyside Reach, as well as the tendency of the juveniles to be less concentrated in specific habitats Roosevelt Reach Dispersal The movement patterns of individual juvenile white sturgeon implanted with sonic tags and released in the Roosevelt Reach in May 2005 are shown in Appendix D, Figure D3 and Appendix D, Figure D5. Of the eight juveniles released in the Nancy Creek/Marcus Flats area, seven remained in the Roosevelt Reach and one moved upstream into the Keenleyside Reach to Fort Shepherd Eddy where it has since remained Overwintering Areas of Sonic Tagged Juveniles Released in the Roosevelt Reach The one juvenile released in the Roosevelt Reach for which an overwintering location could be determined is included in Table In addition to this fish, one juvenile (#1816) was detected at Little Dalles until 26 November 2005 and another juvenile (#1832) was detected at Hunters until 14 November These were the last dates these fish were detected; therefore it was unknown whether they overwintered in nearby areas or moved to areas without VR2 coverage Life History Information Summaries of release dates and locations of juvenile white sturgeon (by family) from 2002 to 2005 are provided in Appendix A, Tables A2 to A8; Table A1 provides a summary of all hatchery juveniles released to date. Life history data obtained during the present study and those studies mentioned in Section 3.3 are provided in Appendix C, Table C1. Summaries of fork length, total length, and weight for hatchery juveniles captured from 2002 to 2005 are provided in Appendix C, Table C2. Upper Columbia River Juvenile White Sturgeon Monitoring Phase 4 Investigations, Draft Report Page 29
49 GOLDER ASSOCIATES LTD Length and Weight The following provides a summary of the mean fork length (FL) and weight of age-1 to age-4 juveniles (with ranges) captured to date (additional information is provided in Appendix C, Table C2; length-frequency distributions are provided in Figure 3.3): Age-1: 34.5 cm FL (21.8 to 48.0 cm), 289 g (64 to 710 g); Age-2: 46.7 cm FL (34.2 to 61.1 cm), 679 g (232 to 1592 g); Age-3: 52.9 cm FL (42.2 to 68.4 cm), 1010 g (414 to 2320 g); and, Age-4: 59.6 cm FL (45.9 to 78.8 cm), 1659 g (610 to 4750 g). Wild juveniles were not captured during the present study; however, three were captured by WDFW in October These wild juveniles, along with those captured from 2002 to 2004, are included in Table Information for the wild juveniles (and hatchery juveniles) captured in 2005 is provided in Appendix C, Table C1. Additional information for wild juveniles captured from 2002 to 2004 is available in the 2002 to 2004 reports (Golder 2003b, 2005a, and 2005b). Table 3.13 Life history summary of wild juvenile white sturgeon captured from 2002 to Sample Number Capture a Locationb RKm Capture Capture Fork Weight PIT Tag Number Age (Year b Method c Date Length (cm) (g) Applied Class) 2 HLK Eddy 0.4 gill net 29 Oct C d 43 Upstream Ft. Shep. Eddy 50.0 ES 23 Sep E0C (1999) e 154 Fort Shepherd Eddy 52.0 angling 10 May F7E6A Waneta Eddy 55.0 angling 23 Jun A 7 (1997) e 218 Waneta Eddy 54.9 gill net 16 Sep none (mortality) 3 (2001) e 293 Marcus - old river channel gill net 8 Oct (2001) e 362 China Bend 92.5 gill net 26 Oct (2001) e 522 Marcus Flats gill net 7 Oct Marcus Flats gill net 7 Oct none (mortality) China Bend 90.7 gill net 21 Oct a Identifier used in Appendix C, Table C1 and previous reports. b See Figures 1.1 and 1.2 for locations; river kilometres measured downstream from HLK. c ES = boat electroshocking. d Data not available. e Fin ray sections were difficult to age due to indistinct annuli (fish had not laid down strong annuli patterns) and/or fin abnormalities. As such, the ages assigned were considered the most likely age. Sample number 156 was at least 7 years old, but possibly older (most likely 7 to 9). The middle of the fin ray was deformed, making it difficult to determine if annuli were present in this portion of the fin ray section. Upper Columbia River Juvenile White Sturgeon Monitoring Phase 4 Investigations, Draft Report Page 30
50
51 Age 1 Captured 2002 (n = 37) Age 1 Captured 2003 (n = 38) Age 1 Captured 2004 (n = 82) Age 1 Captured 2005 (n = 70) Percent Frequency Age 2 Captured 2003 (n = 60) Age 2 Captured 2004 (n = 70) Age 2 Captured 2005 (n = 78) Age 3 Captured 2004 (n = 90) Age 3 Captured 2005 (n = 85) Fork Length (mm) Figure 3.3 Length-frequency distributions of age-1, 2, 3 and 4 hatchery juvenile white sturgeon released and captured from 2002 to 2005.
52
53 Age 4 Captured 2005 (n = 119) Percent All Age 1 (n = 227) All Age 2 (n = 208) All Age 3 (n = 175) Fork Length (mm) Figure 3.3 Concluded.
54
55 GOLDER ASSOCIATES LTD Growth For comparison purposes, the daily growth rates (fork length and weight) of hatchery juveniles (for which the required data was available) captured from 2002 to 2005 were calculated. Comparisons of the mean daily growth rate of age-1 to age-4 hatchery juveniles captured from 2002 to 2005 are provided in Appendix C, Table C3. The apparent trend of slower growth of age-1 fish with each successive release noted during 2002 to 2004 monitoring was not apparent in the 2005 results [mean growth of age-1 fish captured during 2002 (n = 36) was 0.11 cm/day FL and 2.01 g/day; of fish captured in 2003 (n = 37) was 0.10 cm/day and 1.80 g/day; in 2004 (n = 77) was 0.06 cm/day and 0.85 g/day; and in 2005 (n = 73) was 0.07 cm/day and 1.10 g/day]. The mean growth rate of age-2 fish was similar in 2003, 2004, and The mean growth rate of age-3 fish captured in 2005 (n = 80; 0.04 cm/day and 0.90 g/day) was similar for fork length, but lower for weight than that exhibited by age-3 fish captured in 2004 (n = 78; 0.04 cm/day and 1.31 g/day). The mean growth of age-4 fish captured in 2005 (n = 116) was 0.03 cm/day and 1.28 g/day. The fork length (Figure 3.4) and weight (Figure 3.5) at release and capture of hatchery juvenile white sturgeon captured in the Transboundary Recovery Area from 2002 to 2005 are provided below. Upper Columbia River Juvenile White Sturgeon Monitoring Phase 4 Investigations, Draft Report Page 33
56
57 Fork Length (cm) age 2 age 3 age all releases age 1 Year 1 at Release (2002, n = 295) Year 1 at Capture (2002, n = 38; 2003, n = 58; 2004 n = 85; 2005 n = 114) Year 2 at Release (2003, n = 186) Year 2 at Capture (2003, n = 37; 2004, n = 70; 2005, n = 79) Year 3 at Release (2004, n = 151) Year 3 at Capture (2004, n = 78; 2005, n = 73) Year 4 at Release (2005, n = 50) Year 4 at Capture (2005, n = 50) Days after 1 May (of release year) Figure 3.4 Fork length of hatchery juvenile white sturgeon at release and capture, 2002 to 2005.
58
59 Weight (g) all releases Year 1 at Release (2002, n = 287) Year 1 at Capture (2002, n = 37; 2003, n = 58; 2004 n = 78; 2005, n = 114) Year 2 at Release (2003, n = 186) Year 2 at Capture (2003, n = 37; 2004, n = 70; 2005, n = 79) Year 3 at Release (2004, n = 150) Year 3 at Capture (2004, n = 77; 2005, n = 73) Year 4 at Release (2005, n = 50) Year 4 at Capture (2005, n = 50) age 1 age Days after 1 May (of release year) age 3 age 4 Figure 3.5 Weight of hatchery juvenile white sturgeon at release and capture, 2002 to 2005.
60
61 GOLDER ASSOCIATES LTD. Comparisons of the mean daily growth rate and 95% CI of the mean of age-1 to 4 hatchery juveniles captured from 2002 to 2005 in the upper, middle, or lower sections of the Keenleyside Reach and in the Roosevelt Reach are provided in Appendix C, Table C4. The trends identified are based on the presented CI s on this table. The highest mean growth rates were exhibited by fish captured in the upper section of the Keenleyside Reach for all of the ages examined, although only one age-4 fish was captured in the upper section. The low numbers of juveniles captured in the middle section during each year precluded comparisons. The mean growth rate exhibited by age-1 fish captured in the lower section of the Keenleyside Reach (n = 45; 0.09 cm/day and 1.45 g/day) was higher than that same aged fish captured in the Roosevelt Reach (n = 142; 0.06 cm/day and 0.97 g/day). The mean growth rate exhibited by age-2 fish captured in the lower section (n = 79; 0.05 cm/day and 1.02 g/day) and the Roosevelt Reach (n = 83; 0.05 cm/day and 1.15 g/day) were similar. The mean growth rate of age-3 and 4 fish captured in the lower section of the Keenleyside Reach (age-3; n = 82: 0.04 cm/day and 0.85 g/day; age-4; n = 58: 0.03 cm/day and 0.95 g/day) was lower than those captured in the Roosevelt Reach (age-3; n = 43: 0.04 cm/day and 1.31 g/day; age-4; n = 57: 0.04 cm/day and 1.60 g/day). Comparisons of the mean daily growth rate and 95% CI of the means of age-1 to 4 hatchery juveniles captured from 2002 to 2005 with and without pectoral fin deformities (see Section ) are provided in Appendix C, Table C5. The following trends identified are based on the differences between the 95% CI s identified in Table C5. The mean growth rates of the groups of fish examined (fish with deformed pectoral fins vs. fish without of each age-class) were generally similar. The greatest differences in mean growth rates between fish with and without pectoral fin deformities were exhibited by age-1 fish. Age-1 fish with deformities exhibited a higher mean growth rate (n = 58; 0.09 cm/day and 1.53 g/day) than age-1 fish without deformities (n = 155; 0.07 cm/day and 1.16 g/day). The highest mean growth rate was exhibited by age-1 fish with pectoral fin deformities that were considered major (see Section for definitions; n = 34; 0.10 cm/day and 1.57 g/day). The mean growth rates of age-2, 3, and 4 juveniles with and without pectoral fin deformities were similar. In total, 19 hatchery juvenile white sturgeon were recaptured (i.e., have been captured twice from 2002 to 2005) during 2005 monitoring. Of these fish, three were previously captured in 2003, nine were previously captured in 2004, and seven were captured twice in Excluding the seven fish captured twice in 2005, 17 juvenile white sturgeon have been captured twice from 2002 to The growth rates of these fish between initial release and their first capture event, subsequent release and second capture event, and initial release and second capture event are provided in Appendix C, Table C6. Growth rates for fork length were substantially higher between initial release and the first capture event than between subsequent release and the second capture event for all of these fish. With the exception of three of these fish, growth rates were also higher for weight between initial release and the first capture event than between subsequent release and the second capture event Relative Weight The relative weight (W r ) index for juvenile white sturgeon released and captured from 2002 to 2005 is summarized in Table The W r index for age-1 hatchery juveniles at point of release and capture is depicted in Figure 3.6, for age-2 fish in Figure 3.7, and for age-3 and 4 fish in Figure 3.8. The weight vs. length for fish released and captured (2002 to Upper Columbia River Juvenile White Sturgeon Monitoring Phase 4 Investigations, Draft Report Page 36
62 GOLDER ASSOCIATES LTD. 2005) was plotted in relation to theoretical weight vs. length curves for relative weights of 100%, 75% and 50% (Figure 3.9). This plot highlights that all juveniles captured from 2002 to 2005 were in better than average condition (i.e., all juveniles showed W r values higher than 50%). Table 3.14 Mean, minimum and maximum relative weight of hatchery juvenile white sturgeon (for which relative weight could be determined) released and captured from 2002 to Brood Year Release Year Capture Year Relative Weight (%) Age n At Release At Capture Mean Minimum Maximum Mean Minimum Maximum All Age-1+ Fish All Age-2+ Fish All Age-3+ Fish Of the fish released and captured in the same year (i.e., age-1+ fish; n = 221), 5.0% (n = 11) of their relative weights at the point of capture were over 100%, and 84.2% (n = 186) were over 75% (Figure 3.6). Of the age-2+ fish for which relative weight was determined (n = 208), six (2.9%) exhibited relative weights over 100% and 114 (54.8%) were over 75% (Figure 3.7). Of the age-3+ fish for which relative weight was determined (n = 159), 10 (6.3%) exhibited relative weights over 100% and 58 (36.5%) were over 75% (Figure 3.8). Of the age-4+ fish for which relative weight was determined (n = 115), 10 (8.7%) exhibited relative weights over 100% and 83 (72.2%) were over 75% (Figure 3.8). Upper Columbia River Juvenile White Sturgeon Monitoring Phase 4 Investigations, Draft Report Page 37
63 Brood n = 37 At release in 2002 At capture in Frequency (n ) Brood n = Relative Weight At release in 2003 At capture in 2003 Figure 3.6 Frequency distribution of relative weights of age-1 hatchery juvenile white sturgeon at release and capture, 2002 to Note: bins for relative weight represent a range of 4 (i.e., 52 = 52 to 56).
64
65 Brood n = 77 At release in 2004 At capture in Frequency (n ) Brood n = 70 At release in 2005 At capture in Relative Weight Figure 3.6 Concluded.
66
67 Brood n = 58 At release in 2002 At capture in Frequency (n) Brood n = 73 At release in 2003 At capture in Brood n = 77 At release in 2004 At capture in Relative Weight Figure 3.7 Frequency distribution of relatvie weights of age-2 hatchery juvenile white sturgeon at release and capture, 2002 to Note: bins for relative weight represent a range of 4 (i.e., 52 = 52 to 56).
68
69 Brood n = 79 At release in 2002 At capture in Frequency (n) Brood n = 80 At release in 2003 At capture in Brood n = Relative Weight At release in 2002 At capture in 2005 Figure 3.8 Frequency distribution of relatvie weights of age-3 (top and middle) and age-4 (bottom) hatchery juvenile white sturgeon at release and capture, 2002 to Note: bins for relative weight represent a range of 4 (i.e., 52 = 52 to 56).
70
71 Weight (g) fish at release (n = 267) 2003 fish at release (n = 182) 2004 fish at release (n = 151) 2005 fish at release (n = 70) Age-1 fish at capture (n = 221) Age-2 fish at capture (n = 202) Age-3 fish at capture (n = 155) Age-4 fish at capture (n = 97) Relative Weight = 100% Relative Weight = 75% Relative Weight = 50% Total Length (cm) Figure 3.9 Length vs. weight (relative weight) plot for hatchery juvenile white sturgeon released and captured from 2002 to releases were captured in 2002 (age - 1), 2003 (age-2), 2004 (age-3) and 2005 (age-4) releases were captured in 2003 (age-1), 2004 (age-2) and 2005 (age-3) releases were captured in 2004 (age-1) and 2005 (age-2). All 2005 releases were age-1 when captured in 2005.
72
73 GOLDER ASSOCIATES LTD Pectoral Fin Deformities A summary of the incidence of pectoral fin deformities by family in hatchery juvenile white sturgeon captured from 2002 to 2005 is provided in Appendix C, Table C7. Of the 350 hatchery juvenile white sturgeon captured and examined for deformities in 2005 (not including recaptures), 100 (28.6%) exhibited pectoral fin deformities. The majority (88%) of these deformities were in the form of shrivelled or shrunken pectoral fins: 7 (7%) were shrivelled or shrunken as well as curled, wavy, or rolled; 4 (4%) were normal sized and wavy; and 1 (1%) was normal sized and curled. Of the 100 fish that exhibited pectoral fin deformities, 74 (74%) had one deformed fin and 26 (26%) had both fins deformed. Of the 74 fish that exhibited one deformed pectoral fin, 39 (52.7%) exhibited deformities of the left pectoral fin and 35 (47.3%) of the right pectoral fin. Pectoral fin deformities were classified as either minor or major. Pectoral fin deformities were considered major if one or both fins were 50% of normal size or less and minor if both fins were greater than 50% of normal size. For example, a fish with one normal sized fin and one fin less than half the normal size was considered to have a major deformity; a fish with one fin 80% and the other 60% of normal size was considered to have a minor deformity. Based on these classifications, 77 (77% of fish with deformities) exhibited pectoral fin deformities that were considered major and 23 (23%) that were considered minor. Severity classifications for all juvenile white sturgeon captured from 2002 to 2005 are provided in Appendix C, Table C8. The overall incidence of pectoral fin deformities in hatchery juvenile white sturgeon captured from 2002 to 2005 was 37.5% (272 of 726 fish; Appendix C, Table C7). The deformity rate of 2001 brood fish captured from 2002 to 2005 was 47.5%, of 2002 brood fish captured from 2003 to 2005 was 43.9%, of 2003 brood fish captured in 2004 and 2005 was 20.1%, and of 2004 brood fish captured in 2005 was 17.8%. The incidence of pectoral fin deformities in juveniles captured in 2002 was 52.8%, in 2003 was 50.5%, in 2004 was 42.9%, and in 2005 was 28.6%. Only one of the 10 wild juveniles captured from 2002 to 2005 exhibited pectoral fin deformities; both fins of this fish were slightly curled and of normal size (considered a minor deformity). Deformed (i.e., curled) pectoral fins are occasionally observed in wild white sturgeon in the study area, but at a much lower frequency than observed for the hatchery releases. The majority of pectoral fin deformities observed for hatchery juveniles consisted of stunted/shrivelled fins. Pectoral fin deformities are discussed further in Section Captures by Family A summary of juvenile white sturgeon released and captured (by family) in the Transboundary Recovery Area from 2002 to 2005 is provided in Table Of the 8671 juvenile white sturgeon (2001 brood year) released into the Keenleyside Reach in 2002, 304 (3.5%) have been captured to date (2002 to 2005). Of the juvenile white sturgeon (2002 brood year) released into the Keenleyside Reach in 2003, 189 (1.6%) have been captured (2003 to 2005). Of the juvenile white sturgeon (2003 brood year) released into the Transboundary Recovery Area in 2004, 171 (1.5%) have been captured (2004 and 2005). Of the juvenile white sturgeon (2004 brood year) released into the Transboundary Recovery Area in 2005, 77 (0.5%) have been captured (2005). The greatest recovery Upper Columbia River Juvenile White Sturgeon Monitoring Phase 4 Investigations, Draft Report Page 43
74 GOLDER ASSOCIATES LTD. rate for a specific family group from 2002 to 2005 was from family 01-wf (4.5%; 22 fish of this family were released in 2002 and 1 has been captured). Families 01-6 and 01-5 had the second highest recovery rates from 2002 to 2005 (3.8% each). The highest recovery rates for 2002 brood fish were from family 02-2 (1.8%), for 2003 brood fish were from family 03-6 (2.6%), and for 2004 brood fish were from family 04-7 (0.7%). The majority of fish from families 03-6 and 04-7 were captured in the Roosevelt Reach, where 1882 and 1956 fish from these families, respectively, were released. Table 3.15 Summary of hatchery juvenile white sturgeon releases and captures by family, 2002 to 2005 (recaptures are not included in the percent captured column). Number Captured Brood Family Number Percent a Year Released Captured Orig. b Orig. b Recap. b Orig. b Recap. b Orig. b Recap. b Orig. b Recap. b wf unknown N/A N/A 2001 Brood Total unknown N/A N/A 2002 Brood Total unknown N/A N/A 2003 Brood Total unknown N/A N/A 2004 Brood Total unknown c unknown N/A N/A All Broods Wild Fish N/A N/A a The first two digits represent brood year (i.e., ); last digit represents family ID from that brood year; wf = wild fry (hatched from captured wild eggs); unknown = could not be found in release data or PIT tag was not detected at capture. b Orig. = original capture; Recap. = recapture. c Brood year could not be determined due to difficulty in reading scute removal patterns Survival Analysis The hatchery juvenile white sturgeon population has predominantly been sampled during the fall of 2002, 2003, 2004, and PIT tag marked fish from the UCRWSI hatchery program were seeded into the Columbia River at one or more intervals during the spring and summer of these years. The relative rate of recovery of the tags among years was Upper Columbia River Juvenile White Sturgeon Monitoring Phase 4 Investigations, Draft Report Page 44
75 GOLDER ASSOCIATES LTD. used to develop a Cormack-Jolly-Seber (CJS) survival model to assess the overall success of the hatchery program. The model parameters were initially estimated using the logistic link function with the lowest scored model and subsequently rerun using the Monte Carlo Markov Chain (MCMC) procedures in Program MARK. These parameter estimates from the MCMC procedures were used in subsequent analysis and are described in detail in Appendix E. The selected model, using the lowest Akaike Information Criteria (AIC c ) scores, resulted in a mean survival estimate for the 2002 cohort of 0.42 ± (S.D.) between the time of release and capture in the fall of The 2003, 2004 and 2005 cohorts were pooled and the mean survival estimate between the time of release and the fall capture for these combined age-1 cohorts was 0.21 ± (S.D.) The mean survival rate for all subsequent time after the first six months in the river was estimated for all cohorts combined at 0.97 ± (S.D.). Wild juvenile fish were rarely encountered and are not included in the analysis. The 2003 to 2005 cohorts were pooled because the winning model pooled these cohorts. Time varying models where these cohorts were not pooled were fitted, but due to the low recapture rate these models were not able to converge. As the exact number of fish released and incorporated into the analysis is known, the CJS survival parameters and their confidence intervals were used to develop a crude estimate of abundance for the population of juvenile sturgeon now in the system (Table 3.16). Table 3.16 Survival and abundance estimates (with Confidence Intervals; CI) based on tag recoveries using Program MARK. The abundance estimates are derived from the survival estimates and the number of tagged fish released and included in the analysis (not purposefully removed from the population). Study Year Tagged Fish Released and Included in Analysis Survival Rate in First 6 Months (Fish years of age) Hatchery Juvenile White Sturgeon Survival Rate 95% CI Subsequent Survival Rate (Fish > 1.5 years of age) 95% CI Mean Estimated Abundance as of % CI on Estimated Abundance Total The survival numbers were also used to project survival and abundance of each cohort over 21 years (2002 to 2022; Appendix F, Tables F1 and F2). The overall abundance of all combined cohorts, assuming fish are seeded each year (beyond 2005) from the hatchery program, was projected using the survival estimates obtained from the CJS analysis Analysis of Factors Affecting Size-at-Capture The size selectivity of the gill net mesh panels of a particular mesh size was quite apparent (Figure 3.10; ANOVA p < 0.001). Length frequencies of the groupings were reasonably approximated with normal distributions based on Upper Columbia River Juvenile White Sturgeon Monitoring Phase 4 Investigations, Draft Report Page 45
76
77 GOLDER ASSOCIATES LTD. density plots of the data. This analysis was limited to Keenleyside Reach releases and recaptures where all mesh sizes were deployed. The size of juvenile sturgeon in the Roosevelt and Keenleyside reaches was similar, but statistically different during periods when data from fish collected in the same mesh size (5.1 cm) were compared (ANOVA p = 0.025); the average size was slightly smaller in the Roosevelt Reach. The effect of mesh size on fork length (FL) of captured fish was consistent over all years of data collection (Figure 3.11). 60 Keenleyside Reach (10.2 cm) 40 Count Roosevelt Reach (5.1 cm) Keenleyside Reach (5.1 cm) 20 Keenleyside Reach (15.2 cm) LENGTH Figure 3.10 A normal curve fit to the length-frequency data collected for juvenile white sturgeon using gill net mesh sizes of 5.1 cm (blue = Roosevelt Reach; red = Keenleyside Reach), 10.2 cm and 15.2 cm (Keenleyside Reach only). The age-class selectivity of gear types on the FL of captured juvenile white sturgeon was also explored for fish captured in 2005 at Waneta Eddy using gill nets (3 panels of 5.1, 10.2 and 15.2 cm stretch-measure mesh), angling, and the prototype underwater PIT tag reader. Table 3.17 indicates the proportion of each age class that were captured or recorded by each gear type and the results of the statistical tests. There were no statistical differences between age-class frequencies of the PIT tag reader records and the gill net captures (Chi-square p = 0.19, 3 df, n = 89 gill net; 36 PIT tags). The PIT tag records and gill net captures were grouped for comparison with angling catches. The age-classes of juveniles captured by angling were different from those obtained from the combined gill net catches and PIT tag records (Chi-square p < 0.01, 3 df, n = 125 gill net and PIT tags; 47 angling captures). The age-class selection of the angling catch was strongly biased for the large age-4 fish and against the 1, 2 and 3 age classes. Upper Columbia River Juvenile White Sturgeon Monitoring Phase 4 Investigations, Draft Report Page 46
78
79 GOLDER ASSOCIATES LTD. The geographical distribution of fish captured by gill nets was also examined. Only data from gill nets comprised of all three mesh sizes and juvenile sturgeon that were released in the Keenleyside Reach were used in the analysis. This eliminated any geographical differences that may have been caused by gear type, differences in the numbers of fish from each age-class, or size-at-release that may have occurred between the Roosevelt Reach and Keenleyside Reach releases. Figure 3.12 illustrates the geographical trend in FL for each age-class for fish captured in 2005, which included fish released in the Keenleyside Reach and captured in the Roosevelt Reach. The trends were consistent over ageclasses, which indicated that within the flowing Keenleyside Reach, the size-at-age decreased with distance downstream for all age-classes captured. The opposite trend appeared for fish captured in the Roosevelt Reach, as average size-atage increased with downstream distance in the reservoir. There was also an apparent trend for the distribution of ageclasses to parallel that of FL, with older fish more likely to be encountered further downstream in the Roosevelt Reach. Sample sizes in the Keenleyside Reach upstream of Waneta Eddy were too small to determine if age-class abundance paralleled that of FL. Fish collected in 2005 that met the criteria were limited to the Keenleyside Reach, in this case, the same trend previously noted also occurred (Figure 3.13) and was also the case in 2003 (Figure 3.14) LENGTH LENGTH Mesh Size Mesh Size LENGTH LENGTH Mesh Size Mesh Size Figure 3.11 Box plot of length-frequencies of juvenile white sturgeon captured during each Phase (year) as a function of gill net mesh size (in inches; 2 = 5.1 cm; 4 = 10.2 cm; 6 = 15.2 cm). Upper Columbia River Juvenile White Sturgeon Monitoring Phase 4 Investigations, Draft Report Page 47
80 GOLDER ASSOCIATES LTD. Table 3.17 Summary of comparisons of the age-class frequencies of juvenile white sturgeon captured by gill net and angling, and detected by the underwater PIT tag reader at Waneta Eddy in Age-class Method Gill Net Angling PIT Tag Reader Total n % 4.2% 5.6% 6.4% % 4.2% 25.0% 12.2% % 27.7% 30.6% 37.8% % 63.8% 38.9% 43.6% 75 Total 100% 100% 100% 100% 172 n Comparison of gill nets with PIT tag reader standard deviates [(observed - expected)/square root (expected)]. Age-class Gill Net PIT Tag Reader Test Statistic Value df Probability Pearson Chi-square Likelihood Ratio Chi-square Comparison of gill net and PIT tag reader combined with angling. Age-class Method Gill Net & PIT Tag Reader Angling Total n % 4.3% 6.4% % 4.3% 12.2% % 27.7% 37.8% % 63.8% 43.6% 75 Total 100% 100% 100% 172 n Comparison of gill nets and PIT tag reader combined with angling standard deviates [(observed - expected)/square root (expected)]. Age-class Gill Net & PIT Tag Reader Angling Test Statistic Value df Probability Pearson Chi-square Likelihood Ratio Chi-square Upper Columbia River Juvenile White Sturgeon Monitoring Phase 4 Investigations, Draft Report Page 48
81 GOLDER ASSOCIATES LTD. Length River Km (From HLK Dam) Age at Capture Figure 3.12 Fork length of age-1 to 4 juvenile white sturgeon captured in 2005 (Keenleyside Reach releases only) as a function of age-class and river kilometre. Trend line is a quadratic smoother Fork Length (mm) River Km Age at Capture Figure 3.13 Fork length of age-1 to 3 juvenile white sturgeon captured in 2004 (Keenleyside Reach releases only) as a function of age-class and river kilometre. Trend line is a quadratic smoother. Upper Columbia River Juvenile White Sturgeon Monitoring Phase 4 Investigations, Draft Report Page 49
82
83 GOLDER ASSOCIATES LTD Fork Length (mm) Age at Capture HLK WANETA Figure 3.14 Comparison of Fork length distribution of Age-1,2, 3 and 4 juvenile white sturgeon captured in 2003 (Keenleyside Reach releases only) near the HLK Dam area and the Waneta Area. Only a single age-4 sturgeon was captured in the HLK Dam Area. Box plots indicate Median, Quartiles, and range of the data within 1.5 x the Intra-Quartile distance. Outlier data points beyond this distance are indicated with an asterisk. Upper Columbia River Juvenile White Sturgeon Monitoring Phase 4 Investigations, Draft Report Page 50
84
85 GOLDER ASSOCIATES LTD. 4.0 DISCUSSION 4.1 DISTRIBUTION AND ABUNDANCE In 2005, 385 hatchery juvenile white sturgeon were captured (including 12 that were also captured in previous years and seven that were captured twice in 2005) and approximately 883 were observed using the LBV. The three main capture areas were Waneta Eddy (35.1% of total fish captured by all sample programs in 2005), Little Dalles (14.2%) and the section of the Roosevelt Reach between RKm 84.1 (Marble) and 93.7 (China Bend; 14.2%; Table 3.4). All of the juveniles observed during LBV surveys, with the exception of 19 observed at Fort Shepherd Eddy, were at Waneta Eddy (Appendix B, Table B4). Hatchery juveniles were also captured at HLK Eddy (n = 6), Balfour Bay (n = 2), Kootenay Eddy (n = 2), Sandbar Eddy (n = 1), Genelle Eddy (n = 1), Fort Shepherd Eddy (n = 3), and between Deadman s Eddy and Martin Creek (RKm 67.5 to 135.6) in the Roosevelt Reach (n = 237). Similar to 2002 to 2004 results, juvenile white sturgeon continued to exhibit a clumped distribution within the Keenleyside Reach during Juvenile white sturgeon were recorded in the same areas within the Keenleyside Reach where high use by adult white sturgeon has been documented (HLK to Norns Creek, Kootenay Eddy, Fort Shepherd Eddy, and Waneta Eddy; R.L. & L. 1994, 1998, 2001). The largest numbers of juveniles were recorded in Waneta Eddy, where catch-rates were similar to 2004 (Table 3.1). The low number of juveniles captured at HLK Eddy (6 juveniles; 2.4 fish/net-unit; the lowest since sampling began in 2002) was considered unusual as gill nets were set in the same locations as previous years. The reduced catch-rate at HLK Eddy was attributed to the behaviour of juvenile white sturgeon; specifically, the tendency of these fish to aggregate in large groups in the main eddy habitats within the Keenleyside Reach and the movement of these aggregations. During 2003 to 2005 monitoring, large aggregations of juveniles were observed at Waneta Eddy, the location of the group marked, and same area checked again soon after. In each instance the aggregation of juveniles was no longer in the same location. This indicates that the aggregations regularly move within the eddy habitats. If these aggregations were not located in the same portion of the eddy when gill net sampling was conducted, fish would have a lower likelihood of being captured. The high level of aggregation may effect capture probabilities from year to year. This will generally not bias results of survival estimates from mark/recapture analysis but may lower precision of the estimates. Spatial effects may be a problem however, if capture probabilities are different among sampling areas and age class distributions are not equivalent among areas. A sensitivity analysis of the survival estimates to these assumptions could be completed in the future. During 2004 higher catch-rates in areas other than HLK Eddy and Waneta Eddy were recorded (Golder 2005b). Juveniles were captured at Kootenay Eddy, Sandbar Eddy, Fort Shepherd Eddy, and Rock Eddy, areas where they had not previously been captured results indicated lower catch-rates in these areas compared to 2004 (Table 3.1). Gill net sampling during 2002, 2003, and 2005 was conducted in November of each respective year, whereas two gill net sessions were conducted during 2004 (September and November). The juvenile white sturgeon catch in these areas was higher during September 2004 than in November 2004 and 2005 (Table 4.1). This suggested that juvenile white Upper Columbia River Juvenile White Sturgeon Monitoring Phase 4 Investigations, Draft Report Page 51
86 GOLDER ASSOCIATES LTD. sturgeon exhibit seasonal behaviour similar to adults; i.e., they disperse to feeding and holding areas during the spring and summer and tend to move to overwintering areas in the fall (R.L. & L 1994, 1998, 2001). This also suggested that these fish may be more active during non-winter months, and thus more susceptible to passive sample gear (i.e., gill nets). Table 4.1 Comparison of gill net effort and juvenile white sturgeon catch-rates at Kootenay Eddy, Sandbar Eddy, Fort Shepherd Eddy, and Rock Eddy during Phase 3 (September and November 2004) and Phase 4 (November 2005) monitoring. Location Sep (Phase 3) Nov (Phase 3) Nov (Phase 4) Effort a No. CPUE b Effort a No. CPUE b Effort a No. CPUE b Kootenay Eddy Sandbar Eddy Fort Shepherd Eddy Rock Eddy Total a Effort is in net-units; one net-unit = 100 m 2 of net sampled for 24 hours. b CPUE (catch-per-unit-effort) = number of juvenile white sturgeon captured per net-unit. Juvenile white sturgeon were not captured at Fort Shepherd Eddy during the present study; however, 19 were observed there using the LBV and three juveniles were captured at this location by angling on 13 June 2005 during the Broodstock Collection Program. Of the 21 juveniles implanted with sonic tags and released in May 2004 at Beaver Creek, nine (43%) were detected only in Fort Shepherd Eddy. Of the 10 sonic tagged juveniles released at Beaver Creek in May 2005, five were detected only at Fort Shepherd and Waneta eddies and one was detected only at Fort Shepherd Eddy. This supports last years results that indicated Fort Shepherd Eddy also appears to be an important habitat for juvenile white sturgeon in the study area (but is difficult to effectively sample with gill nets due to currents and depth). During the present study, daytime gill net sets were only conducted in the upper section (HLK Eddy to Kootenay Eddy). Juvenile white sturgeon (or incidental species) were not captured by daytime sets. The total effort expended for daytime sets was 0.50 net-units; overnight effort was 9.52 net-units. During 2002 monitoring, the catch-rate of daytime gill net sets was higher than overnight sets in HLK and Waneta eddies, the only areas where juvenile white sturgeon were captured (8.3 vs. 3.8 fish/net-unit in HLK Eddy and 19.2 vs fish/net-unit in Waneta Eddy; Golder 2003b). Detailed diel comparisons were not conducted during 2003 monitoring, because although 7.1 net-units of overnight sample effort was expended, overnight sets were not conducted in HLK or Waneta eddies to avoid potential mortalities (Golder 2005a). During 2004 monitoring, the catch-rate was higher for daytime gill net sets in Balfour Bay (6.3 fish/net-unit vs. 0.9 for overnight sets), but lower in HLK Eddy (3.0 fish/net-unit vs. 8.9) and the upper section (2.8 fish/net-unit vs. 7.1) of the Keenleyside Reach as a whole. The small sample size of juveniles captured during daytime sets and the inconsistent catch-rates due to the clumped distribution of these fish precluded in-depth diel comparisons. Upper Columbia River Juvenile White Sturgeon Monitoring Phase 4 Investigations, Draft Report Page 52
87 GOLDER ASSOCIATES LTD Habitat Characteristics The results of the present study support the findings of 2002 to 2004 monitoring, which indicated that juvenile white sturgeon exhibit a higher use of deepwater eddy habitats within the Keenleyside Reach, of which HLK Eddy and Waneta Eddy were the two main areas of use. Both areas provided depths in excess of 15 m throughout the year and are characterized by higher counter-current velocities along the eddy margins with calmer velocities in the centre of the eddies. Higher proportions of boulder, cobble, and gravel were present in the substrate along the eddy margins and depositional substrates (silt, sand, fine gravels) were more prevalent in the central portions of the eddies. The LBV survey conducted in Fort Shepherd Eddy on 28 November 2005 provided the first visual record of substrate conditions in the eddy. In the deep (approximately 50 m), central portion of the eddy, substrates were dominated by boulders and cobble. Areas of gravel and fines were also present, often in the spaces between large boulders. Current velocity was estimated at less than 0.5 m/s (conditions preferred by juvenile white sturgeon; see Section ) in the central portion of the eddy. Large woody debris was also noted in several of the areas observed. Habitat conditions in the smaller eddy habitats (Kootenay Eddy, Sandbar Eddy and Rock Eddy) were similar to those in HLK Eddy and Waneta Eddy. Kootenay and Sandbar eddies provided the current velocities (less than 0.5 m/s; Section ) and substrates (Section ) that seem to be preferred by juvenile white sturgeon. The maximum depth in Kootenay Eddy was approximately 13 m and in Sandbar Eddy approximately 11 m, slightly less than the preferred depths of 15 m or more. Rock Eddy appears to provide the least suitable conditions of these three eddies, with maximum depths of about 8 or 9 m and higher velocities than the other eddies. The substrate conditions in Rock Eddy are also currently unknown, but believed to be comprised largely of bedrock and larger cobbles and boulders Depth 2002 to 2005 results suggested that the use of habitats of less than 10 m depth was higher during non-winter months when juveniles were more dispersed and lower during the winter when juveniles tended to concentrate more in the deeper main eddy habitats (i.e., HLK and Waneta eddies). Juvenile white sturgeon were not captured in depths less than 10 m in 2002 or During November 2004 and 2005, two juveniles were captured in this depth stratum, whereas 33 were captured during September Only three juveniles were captured between 10 and 15 m depth in 2002, compared to 28, 27, and 23 during 2003, 2004, and 2005, respectively. During all years sampled the highest catch was in the 15 to 20 m depth strata. In both 2003 and 2004, five juvenile white sturgeon were captured and/or observed at depths of 1 to 3 m during boat electroshocking surveys conducted in shallow, nearshore habitats of the Keenleyside Reach during the LCRFIP (Golder 2004 and 2005d). Similar effort was also expended during the 2002 and 2005 LCRFIP surveys, but juvenile white sturgeon were not captured (Golder 2003c and 2006). These results indicate a low, sporadic use of shallow, nearshore habitats by juvenile white sturgeon during the fall period. The proportion of juveniles released into the Upper Columbia River Juvenile White Sturgeon Monitoring Phase 4 Investigations, Draft Report Page 53
88 GOLDER ASSOCIATES LTD. Keenleyside Reach that utilized shallow, nearshore habitats was lower in 2004 and 2005 than 2003, which suggested the use of these habitats has not increased in relation to the total number of juveniles released into the Keenleyside Reach. The low use of shallow water habitats by juvenile white sturgeon is supported by the results of an ultrasonic telemetry study conducted in the Kootenay River (spelled Kootenai in the United States) in Idaho and British Columbia during the summer and early fall of 1999 and 2000 (hereafter termed the Kootenay River telemetry study). In that study, the minimum depth where juvenile white sturgeon were recorded was 3.1 m (see below and Table 4.2; Young 2002). A 1987 to 1991 study of white sturgeon in the Columbia River downstream from McNary Dam (hereafter termed the lower Columbia study) reported 6 m (impounded areas) and 2 m (unimpounded section below Bonneville Dam) as the minimum depths where juvenile white sturgeon were recorded (Parsley et al. 1993). During the lower Columbia study, juvenile white sturgeon were most often captured within the channel thalweg (Parsley et al. 1993). During the Kootenay River telemetry study, approximately 60% of juvenile white sturgeon detections were made in glides, 52% in the thalweg, 50% in the outside bend of the river channel, and 40% in pools. The high percentage of detections associated with these areas indicated that juvenile white sturgeon actively sought and used deeper areas of the Kootenay River (Young 2002). In 2001, sampling conducted in the Canadian portion of the Kootenay River from Kootenay Lake upstream (hereafter termed the 2001 Kootenay River study) indicated juvenile white sturgeon were generally captured in deep areas associated with river bends; few were captured in the shallow, flat bottom glides between bends (Neufeld and Spence 2002). In 2002, sampling conducted in the same portion of the Kootenay River (hereafter termed the 2002 Kootenay River study) using gill nets also indicated juvenile catches were greatest in deeper water habitats (Neufeld and Spence 2004). During the 2001 Kootenay River study, 58% (223.7 hours) of gill net effort was expended in depths less than 15 m and 42% (164.2 hours) of gill net effort was expended in depths over 15 m, but 84% of juvenile white sturgeon were captured by the deeper sets (Neufeld and Spence 2002; Table 4.2). The mean minimum set depth where juvenile white sturgeon were captured during the 2002 Kootenay River study was 14.1 m and the mean maximum was 20.1 m, within a range of 5 to 30 m (Neufeld and Spence 2004). During the Kootenay River telemetry study, the mean depth for all white sturgeon contacts was 11.5 m (95% C.I. = 10.9 to 12.1 m); the minimum contact depth was 3.1 m and the maximum was 23.0 m (Young 2002). During the lower Columbia study, the median depth where juvenile white sturgeon (150 to 1030 mm FL) were captured in impounded areas was 19 m (range between 6 and 58 m) and in the unimpounded lower river (downstream of Bonneville Dam) was 16 m (range between 2 and 40 m); over 80% were captured in depths over 10 m and over 65% were captured in depths over 15 m (Parsley et al. 1993). The ranges given above may be somewhat misleading because very few fish were captured in depths of less than 5 m and the substantial majority were captured in depths over 10 m. In the present study, the minimum depth where juvenile white sturgeon were captured was 6.5 m (by gill net; average depth of the set); juveniles were not observed under depths of 15 m by the LBV. During the 2001 Kootenay River study, the minimum depth of gill net sets that captured juvenile white sturgeon ranged between 5.2 and 25.5 m, with a Upper Columbia River Juvenile White Sturgeon Monitoring Phase 4 Investigations, Draft Report Page 54
89 GOLDER ASSOCIATES LTD. mean of 15.7 m; the maximum depth of gill net sets that captured juvenile white sturgeon ranged between 10.1 and 29.2 m, with a mean of 19.6 m. Significant differences were noted between the depths of gill net sets that captured juvenile white sturgeon and the depths of all gill net sets (p < 0.001). Of the 97 juvenile white sturgeon captured by gill net sampling during the 2001 study, 84% (81) were captured at depths over 15 m (Neufeld and Spence 2002). During the 2002 Kootenay River study, significant differences were not observed (p > 0.05) between the depths of gill net sets that captured juvenile white sturgeon and all gill net sets. A comparison of mean set depths, however, indicated that proportionally more juvenile white sturgeon were captured between the 14 and 19 m depth range; approximately 30% of captures occurred in this depth range where 15% of the total effort was expended (Neufeld and Spence 2004). Table 4.2 Comparison of depth distribution information for juvenile white sturgeon in the Columbia and Kootenay rivers. Study Sample Method Depth Parameters Data Source Kootenay River Telemetry Mean = 11.5 m (95% C.I. = 10.9 to 12.1 m) Young 2002 Range = 3.1 to 23.0 m 2001 Kootenay River Gill Net Mean minimum = 15.7 m (range = 5.2 to 25.5 m) Neufeld and Spence 2002 Mean maximum = 19.6 m (range = 10.1 to 29.2 m) 2002 Kootenay River Gill Net Mean minimum = 14.1 m; mean maximum = 20.1 m Neufeld and Spence 2004 Range = 5 to 30 m Lower Columbia Various Impounded areas: median = 19 m (range = 6 to 58 m) Parsley et al River Unimpounded: median = 16 m (range = 2 to 40 m) Over 80% captured at depths > 10 m; over 65% at > 15 m Phase 1 Juvenile Sturgeon Gill Net Mean = 16.5 m (range = 11.0 to 20.1 m) Golder 2003b ROV Mean = 12.5 m (range = 8.5 to 19.5 m) Phase 2 Juvenile Sturgeon Gill Net Mean = 15.2 m (range = 10.4 to 19.8 m) Golder 2005a ROV Mean = 19.5 m (range = 10.0 to 25.4 m) Diver Survey Mean = 15 m 2003 LCRFIP Boat Electroshocking Range = 1 to 3 m (5 fish) Golder 2004b Phase 3 Juvenile Sturgeon Gill Net Mean = 13.7 m (range = 7.1 to 20.2 m) Golder 2005b ROV Mean = 17.1 m (range = 10.0 to 22.4) Oct WDFW Juvenile Sturgeon Study Gill Net Mean = 21.2 m (range = 8.4 to 38.3 m) Howell and McLellan Broodstock Collection Angling Waneta Eddy: Mean = 17.0 m (range = 15.0 to 22.2 m) Golder 2005e Program Set Line Fort Shepherd Eddy: Mean = 45.9 m (43.0 to 48.0 m) Waneta Eddy: Range = 14.3 to 17.8 m (2 fish) 2004 LCRFIP Boat Electroshocking Range = 1 to 3 m (1 fish captured, 3 observed) Golder 2005d 2004 TCW-aAERA a Boat Electroshocking 3 m (1 fish) Golder, unpublished data Present Study Gill Net Mean = 16.7 m (range = 6.5 to 21.5 m) Present Study Angling ROV (LBV) Range = 15 to 20 m Waneta Eddy: Range = 15 to 21 m Fort Shepherd Eddy: Range = 37 to 50 m Oct WDFW Juvenile Gill Net Mean = 22.4 m (range = 5.8 to 42.1 m) WDFW, unpublished data Sturgeon Study 2005 Broodstock Collection Program Angling Set Line a TCW-aAERA = Teck Cominco Wide-area Aquatic Ecological Risk Assessment. Note: only 2 were captured in depths < 10m and 18 < 15 m Data not available Range = 15 to 22 m (2 fish) Golder, unpublished data Substrate During the present study, fines were the dominant substrate recorded in areas where juvenile white sturgeon were captured and observed. This was similar to findings from 2002 to 2004 (Golder 2003b, 2005a and 2005b), and to results of other studies in the Columbia, Kootenay, and Snake rivers, where sand was reported as the dominant substrate Upper Columbia River Juvenile White Sturgeon Monitoring Phase 4 Investigations, Draft Report Page 55
90 GOLDER ASSOCIATES LTD. selected by juvenile white sturgeon (Young 2002). During the Kootenay River telemetry study, the majority of juvenile white sturgeon contacts were in areas with sand substrate (61%), followed by clay/silt/mud (26%; i.e., fines = 87%), small cobble (8%), large cobble (3%), gravel (1%), and boulder (1%; Young 2002). During the lower Columbia study, approximately one-third of juvenile white sturgeon recorded in the impounded sections were over sand substrate and 99% of observations in the unimpounded section (downstream of Bonneville Dam) were over sand, although this was the predominant substrate in the lower reach (Parsley et al. 1993) Current Velocity The velocity characteristics of Waneta Eddy in relation to overwintering use by juvenile white sturgeon were examined in late March 2004 by the Waneta Expansion Power Corporation (Golder 2005f). An Aqua-Vu underwater camera and a Price AA current meter were attached to a 100 pound lead fish to determine the presence of juvenile white sturgeon in the area and obtain velocity measurements. Surveys were restricted to 15 m or deeper based on the results of 2002 and 2003 juvenile monitoring. Velocity measurements were taken at 30 locations where juvenile white sturgeon were recorded and another 30 locations where juveniles were not recorded. The mean velocity at locations where juveniles were observed was 0.27 m/s, with a range of 0.08 to 0.55 m/s (S.D. = 0.12); the mean depth at these locations was 18.2 m, with a range of 15.0 to 20.4 m (S.D. = 1.4). The mean velocity at locations where juveniles were not observed was 0.30 m/s, with a range of 0.07 to 0.49 m/s (S.D. = 0.11); the mean depth was 18.1 m, with a range of 15.4 to 21.3 m (S.D. = 2.1). The depth, velocity, substrate, discharge and water temperature data examined during the velocity study did not indicate substantial differences in habitat characteristics between areas where juvenile white sturgeon were or were not present. ASL Environmental Sciences Inc. conducted a COCIRM (Coastal Ocean Circulation Model) numerical model run using these data, to provide further insight into differences between areas where juveniles were present and absent. Locations where juveniles were present were in the central portion of Waneta Eddy (the low speed core), with one group situated near the shear zone between the Pend d Oreille River and the eddy. The juveniles were located in an area of weak upward velocities (< 0.05 m/s), and were absent from areas that exhibited weak downward or near-zero vertical velocities. The similarities in velocity measurements and substrate composition among areas where juveniles were and were not present did not indicate that their location within the 15 m plus depth contour at the time of sampling was strongly related to differences in either of these variables (Golder 2005f). The only consistent finding of this study was that aggregations of juveniles were always recorded at depths of 15 m or greater, at velocities less than 0.5 m/s (one juvenile was recorded at 0.55 m/s), and over substrates with a high proportion of fines. These findings are consistent with the results of 2002 to 2005 juvenile white sturgeon monitoring. The specific locations of juveniles within the low speed core of the eddy did not appear to be strongly related to current velocity, substrate conditions, or water temperature, as these conditions were similar throughout the area. The location of the aggregation at any given time within this area of similar habitat conditions was considered more likely a Upper Columbia River Juvenile White Sturgeon Monitoring Phase 4 Investigations, Draft Report Page 56
91 GOLDER ASSOCIATES LTD. reflection of food entrainment patterns into the eddy, perhaps influenced by vertical velocity vectors and proximity to the shear zone. This assumption is based on one study, which should be repeated to verify that the observations represent a consistent winter use pattern within Waneta Eddy (Golder 2005f) Cover Use of instream cover by juvenile white sturgeon was not specifically assessed during the present study; therefore, the following is based solely on cover present in the immediate area where juveniles were observed. None of the approximately 864 juvenile white sturgeon observed using the LBV at Waneta Eddy were associated with cover. Of the 19 juveniles observed at Fort Shepherd Eddy, 10 (52.6%) were associated with boulders and two (10.5%) were associated with woody debris. These results are consistent with the findings of 2002 to 2004 studies that also showed a low association of juvenile white sturgeon and cover (Golder 2003b, 2005a, and 2005b). These results were also similar to findings of the Kootenay River telemetry study, where juvenile white sturgeon were most often located in habitats without cover (42%), followed by velocity breaks (30%), submerged logs and root wads (9.0%), rock (8%), wood and brush (6%), and submerged non-woody vegetation (6%; Young 2002). Diving observations made during the Kootenay River telemetry study suggested that in many cases, juveniles observed in areas without cover had access to nearby submerged structures that would have provided velocity refugia. The author suggested Kootenay River juvenile white sturgeon may have been using habitats with velocity refugia for energy conservation as well as for feeding. These results suggested that juvenile white sturgeon do not generally actively seek cover, but may use nearby cover if available Movement Based on VR2 detection histories, the majority (62 of 80; 77.5%) of sonic tagged juvenile white sturgeon released in 2004 and 2005 remained within 10 km of their release locations. Of the 40 juveniles released at HLK Eddy in 2004 and 2005, only one (2.5%) was detected further downstream than Sturgeon Island. Of 32 juveniles released at Beaver Creek, 11 (34.4%) exhibited movements greater than 10 km (i.e., moved to locations other than Fort Shepherd and Waneta eddies). Of the eight juveniles released in the Roosevelt Reach in 2005, six (75%) exhibited movements greater than 10 km. The tendency of hatchery reared juvenile white sturgeon to remain near their release location appeared to be related to the habitat characteristics in the immediate vicinity. Juveniles released at HLK Eddy are placed directly into habitats where high use has been recorded (the majority of the 7 km of the Columbia River immediately downstream of HLK provides low velocity, deep water habitat). This area is also believed to provide an abundance of food in the form of Mysis relicta, a freshwater shrimp entrained from Arrow Lakes Reservoir. During juvenile white sturgeon monitoring from 2002 to 2004 (Phase 1 to 3), 57 stomach samples were obtained from age-1 to 3 fish and examined; over 93% of total prey items were Mysis relicta, with a 100% frequency of occurrence in non-empty stomachs (Golder 2003b, 2005a, and 2005b). Upper Columbia River Juvenile White Sturgeon Monitoring Phase 4 Investigations, Draft Report Page 57
92 GOLDER ASSOCIATES LTD. Sonic tagged juveniles released at Beaver Creek tended to move downstream until the habitat conditions described above were encountered. The data suggested that these fish moved downstream with the current; some remained in Fort Shepherd Eddy, the first large area with current velocities less than 0.5 m/s and depths in excess of 15 m. Others continued downstream and some remained in Waneta Eddy, the next such area. Fewer of these fish travelled downstream past Waneta Eddy and remained at Little Dalles, while fewer still travelled downstream of Little Dalles. Of the sonic tagged juveniles released at Beaver Creek in 2004 and 2005, three released in 2004 and none of the fish released in 2005 were detected in the upper section of the Keenleyside Reach. These three fish still moved downstream before moving upstream: two to Fort Shepherd Eddy and one to Little Dalles. The sonic tagged juveniles released at Nancy Creek/Marcus Flats in May 2005 exhibited the greatest average movement range of the release groups examined (36.2 km; Table 4.3). Low velocity, deep water habitats, and fine substrates are abundant in the Roosevelt Reach. However, based on 15 stomach samples of juveniles captured in the Roosevelt Reach in 2004 examined by the WDFW, Mysis relicta comprised a smaller proportion of their diet in this area (51.2% of total prey items; 66.7% frequency of occurrence). The generally greater movement ranges of juveniles in the Roosevelt Reach may be a result of an increased need to actively search for food. Lower current velocities in the reservoir portion of the Roosevelt Reach also may result in a lower likelihood of remaining in areas that provide velocity refugia Net Movement Tagged hatchery juveniles released in both 2004 and 2005 in the Keenleyside Reach exhibited similar net movements (Table 4.3). Mean net movements of juveniles released at HLK Eddy in 2004 (4.3 km) and 2005 (3.0 km), and those released at Beaver Creek in 2004 (21.4 km) and 2005 (21.5 km) were very similar between release years. Juveniles released in the Roosevelt Reach (Nancy Creek/Marcus Flats area) in 2005 exhibited the greatest mean net movement (36.2 km). Table 4.3 Summary of net movements of sonic tagged juvenile white sturgeon monitored during the present study, for which reliable detections were obtained, 2004 to Details n Movement Range (km) Mean Minimum Maximum 2004 Releases Released at HLK Released at Beaver Creek Released in the Keenleyside Reach) Releases Released at HLK Released at Beaver Creek Released in the Keenleyside Reach Released in the Roosevelt Reach All Juveniles released in The majority of movements detected were in a downstream direction (Table 4.4). The movement patterns exhibited by sonic tagged juveniles differed based on the location they were released. This was likely a result of the different habitat Upper Columbia River Juvenile White Sturgeon Monitoring Phase 4 Investigations, Draft Report Page 58
93 GOLDER ASSOCIATES LTD. conditions in the vicinity of the release locations (Section 4.1.2). A summary of upstream and downstream detected movements of juveniles released at the three different release locations and as one group are provided in Table 4.4. Table 4.4 Summary of the detected upstream and downstream movements of sonic tagged juvenile white sturgeon released in the Transboundary Recovery Area in May 2004 and n % Movement Details Released in May 2004 or 2005 at HLK not detected no detected movement (detected only at HLK Eddy) upstream and downstream movement (between HLK Eddy and Sturgeon Island) only downstream movement detected (but detected for relatively short period of time and not downstream of Sturgeon Island) only downstream movement detected (last detected at Rivervale on 25 May 2004) Total Released in May 2004 or 2005 at Beaver Creek not detected only downstream movement detected (4 of these fish moved downstream past Waneta Eddy) upstream and downstream movement (but moved greater distance downstream) upstream and downstream movement (but moved greater distance upstream) Total Released in May 2005 in the Roosevelt Reach upstream and downstream movement (but moved greater distance upstream) only downstream movement detected only upstream movement detected Total All sonic tagged juveniles released in May 2004 and not detected no detected movement (detected only at HLK Eddy) upstream and downstream movement (between HLK Eddy and Sturgeon Island) only downstream movement detected (but detected for relatively short period of time and not downstream of Sturgeon Island) only downstream, movements detected upstream and downstream movement (but moved greater distance downstream) only upstream movements detected upstream and downstream movement (but moved greater distance upstream) Total Movement Within Waneta Eddy The location of the aggregation of juvenile white sturgeon recorded in Waneta Eddy during the LBV survey conducted on 24 March 2006 was marked for deployment of the underwater PIT tag reader system. The aggregation was no longer in the same location on 26 March This was similar to previous surveys, where the aggregation of juvenile white sturgeon recorded in Waneta Eddy during LBV surveys conducted in January and March 2004 was located in different portions of the eddy during each of these surveys. The aggregation was found on 29 March 2004 and its location marked with an anchor and float line. On 30 March 2004, examination using the LBV indicated that the aggregation was no longer present in the same area. The movement of the aggregation(s) to different portions of Waneta Eddy between these surveys indicated that the fish moved as a group, suggestive of schooling behaviour. The differences in the locations of the aggregation may either reflect random movements for feeding and/or holding within Waneta Eddy, or may be in response to habitat conditions not examined during the velocity study (Section ; Golder 2005f). Upper Columbia River Juvenile White Sturgeon Monitoring Phase 4 Investigations, Draft Report Page 59
94 GOLDER ASSOCIATES LTD. 4.2 JUVENILE WHITE STURGEON CONDITION All of the juvenile white sturgeon captured during the present study were in good condition and none succumbed to the sample procedure. Even those fish that had deformed pectoral fins appeared healthy and exhibited growth rates similar to fish without deformities. The pectoral fin deformities appear to have minimal effect on the growth of age-1 to 4 fish. It is still unknown whether these deformities will have a greater effect on these fish as they continue to mature and reach later stages of their life cycle Relative Weight and Growth Although the relative weight index has been used extensively in fisheries management, more extensive investigations into its properties and limitations are only beginning to emerge (e.g., Brenden and Murphy 2003). This index is based on the assumption that there is a universal theoretically optimal population for a species to which all individuals may be compared (Murphy et al. 1991). The mean relative weight for all hatchery juvenile white sturgeon captured from 2002 to 2005, for which relative weight at capture and release could be determined (n = 703), was 104.2% at release and 79.7% at capture. The relative weight at capture was similar to the mean relative weight for juveniles captured during the 2001 (82%) and 2002 (84%) Kootenay River studies (Neufeld and Spence 2002, 2004). Between release and capture, 94.3% (n = 663) of fish captured from 2002 to 2005 exhibited a decrease in relative weight (5.7%; n = 40 exhibited an increase). This was similar to the 2002 Kootenay River study, where 27 of 32 (84%) juveniles captured from the fall 2000 release and 50 of 52 (96%) juveniles captured from the spring 2001 release exhibited a decrease in relative weight (Neufeld and Spence 2002). Relative weight is based on the length vs. weight of a particular fish compared to the population normal. Growth rates or the age of fish are not taken into account. The usefulness of relative weight for inter-population comparisons appeared to be limited and it is better used for comparisons of the same population over time. As an example, an age-3 fish captured in the Kootenay River (31.9 cm TL and 135 g) and an age-1 fish captured in the Columbia (50.8 cm TL and 484 g) both had relative weights of 95%. The relative weights of these fish indicates that they are both in good condition based on their weight at length, but does not provide information on size-at-age or growth rates. All of the juvenile white sturgeon captured during the present study increased in FL, TL, and weight after their initial release. The mean growth rate of age-1 juveniles decreased slightly between 2002 and 2003 monitoring, decreased substantially during 2004 monitoring, and increased slightly during 2005 monitoring (see Section and Appendix C, Tables C3 to C5). The mean growth rate of age-2 fish was slightly lower during 2004 monitoring than during 2003; the mean growth rates were similar during 2004 and 2005 monitoring. The mean growth rate of age-3 fish was lower in 2005 than in Upper Columbia River Juvenile White Sturgeon Monitoring Phase 4 Investigations, Draft Report Page 60
95 GOLDER ASSOCIATES LTD. The mean relative weight (at capture) of age-1 fish captured in 2002 (91.7%) was higher than that of age-1 fish captured in subsequent years (range from 78.9% in 2005 to 82.3% in 2003; Table 3.14). The mean relative weight of age-2 fish captured in 2002 (76.2%) and 2003 (73.8%) was similar, but increased to 82.8% for fish captured in The mean relative weight of age-3 fish captured in 2005 (73.4%) was approximately 5% lower than age-3 fish captured in 2004 (78.6%). The mean relative weight of age-4 fish captured in 2005 was 82.5%. These data suggest that although the growth of juveniles has generally slowed with subsequent releases, fish are still in relatively good condition based on their weight at a particular length. A comparison of the mean growth rates of age-1 to 4 hatchery juveniles captured in the upper, middle, and lower sections of the Keenleyside Reach, and in the Roosevelt Reach indicated growth rates of all age-classes were highest for fish captured in the upper section of the Keenleyside Reach, although only one age-4 fish was captured there during the present study. Age-1 to 3 fish captured in the middle section of the Keenleyside Reach (age-4 fish were not captured in the middle section) were not included in this comparison due to low sample sizes. The mean growth rate of age-1 fish was higher in the lower section of the Keenleyside Reach than in the Roosevelt Reach. The mean growth rates of age-2 to 4 fish were higher in the Roosevelt Reach than in the lower section of the Keenleyside Reach. The reason for the lower growth rates of age-1 fish in the Roosevelt Reach and higher growth rates of age-2 to 4 fish was unknown, but may be due to the time required to adapt to life in the river after release. After the initial year-at-large in the Roosevelt Reach, the increased growth rates in following years may reflect either greater foraging efficiency with age or increased knowledge of better feeding locations. In the Keenleyside Reach, the higher growth rates exhibited by fish captured in the upper section were likely a result of greater food availability (i.e., entrained mysids), as well as less competition for food as a result of lower juvenile densities in the Broadwater area (HLK to Norns Creek Fan) than in the Waneta area monitoring results indicated that the proportion of Mysis relicta in the diet of age-1 to 3 juveniles decreased with increased distance downstream of HLK (Golder 2005b). In age-1 fish, 99.3% of the stomach contents of fish captured in the Keenleyside Reach (n = 4) were mysids, compared to 69.0% for fish captured in the Roosevelt Reach (n = 13). A similar pattern of decreased mysid abundance in the diet with downstream distance from HLK was also observed for age-2 and age-3 juveniles. The availability of Mysis relicta is believed to be a main factor affecting the growth rates of juvenile white sturgeon released in the Transboundary Recovery Area. Results of the present study did not support the apparent trend of declining growth rates for juvenile white sturgeon with each successive release in the Transboundary Recovery Area as reported in the 2004 report (Phase 3; Golder 2005b). The mean growth rate of age-1 fish captured in 2005 was higher than age-1 fish captured in The mean growth rate of age-2 fish captured in 2005 was similar to age-2 fish captured in However, the mean growth rate of age-3 fish captured in 2004 was higher than in Upper Columbia River Juvenile White Sturgeon Monitoring Phase 4 Investigations, Draft Report Page 61
96 GOLDER ASSOCIATES LTD. The growth rates of juvenile white sturgeon released in the Transboundary Recovery Area of the Columbia River continue to be substantially higher than hatchery juveniles released in the Kootenay River. The mean growth rate (calculated from yearly growth rates) for juvenile white sturgeon in the 2001 Kootenay River study was 0.03 cm/day FL and 0.17 g/day; nine fish had lost weight (Neufeld and Spence 2002). The mean growth rate for juveniles captured during the 2002 Kootenay River study was 0.01 cm/day FL and 0.17 g/day (Neufeld and Spence 2004). Data on the growth of hatchery reared juvenile white sturgeon in the Kootenay River since 1990, indicated average growth increments of fish captured after up to 8 years at-large were 0.02 cm/day and 0.56 g/day (calculated based on average yearly growth; Ireland et al. 2002). The condition factor of 77% of hatchery white sturgeon decreased between release and recapture. The lower growth rates of juvenile white sturgeon captured during the 2002 Kootenay River study may have resulted from higher proportions of older fish in the sample (Neufeld and Spence 2004). The decreases in weight of many juvenile white sturgeon captured in the 2001 and 2002 Kootenay River studies were thought to be a result of adaptation time (i.e., the time it takes hatchery sturgeon to adapt to the natural environment). Ireland et al. (2002) stated that growth rates and condition factors within the first 1 to 3 years after release were often poor as many hatchery fish had difficulty adapting to natural conditions. Results of 2002 to 2005 monitoring indicate that in the Columbia River study area juvenile white sturgeon adapt quickly to natural conditions. Decreases in weight between release and recapture were not exhibited by any juvenile white sturgeon captured from 2002 to On average, age-1 fish captured in 2002 and 2003 in the Columbia River exhibited growth rates approximately four times as great in length and approximately 10 times as great in weight compared to fish captured during the 2001 and 2002 Kootenay River studies. On average, age-1 fish captured in 2004 and 2005 in the Columbia River exhibited growth rates approximately double in length and four times as great in weight as Kootenay River fish. These differences in growth rates may also be influenced by food availability. From 2002 to 2005, growth rates of individual juvenile white sturgeon ranged from 0.02 to 0.16 cm/day FL and from 0.10 to 3.77 g/day. The highest (0.11 cm/day FL and 3.77 g/day), third highest (0.10 cm/day FL and 3.64 g/day) and tenth highest (0.10 cm/day FL and 3.19 g/day) growth rates in weight were exhibited by three fish from the group that was held over in the hatchery and raised to a larger size to allow for sonic tag implantation. The larger size-at-release of these fish may have provided a competitive feeding advantage over the fish released at a smaller size Pectoral Fin Deformities The observed incidence of pectoral fin deformities in hatchery juvenile white sturgeon has decreased with each successive brood year. With the exception of 2001 and 2002 brood fish captured in 2004, the incidence of pectoral fin deformities has also decreased with each successive year of sampling (Table 4.5). Upper Columbia River Juvenile White Sturgeon Monitoring Phase 4 Investigations, Draft Report Page 62
97 GOLDER ASSOCIATES LTD. Table 4.5 Summary of the incidence of pectoral fin deformities by brood year, for juvenile white sturgeon (for which deformity data was available) captured in the Transboundary Recovery Area from 2002 to Capture Year a Brood Year No. Def. % No. Def. % No. Def. % No. Def. % No. Def. % unknown b All a No. = number of juvenile white sturgeon captured; Def. = number with deformities; % = percentage of fish captured with deformities. b Unknown = brood year could not be determined by scute removal pattern and PIT tag was not detected of found in release data. The mean daily growth rates of juvenile white sturgeon with pectoral fin deformities were generally similar to fish without deformities (Appendix C, Table C5). This suggested that at least during the initial four years-at-large the deformities did not appear to have a substantial negative effect on successful feeding in the natural environment. The mean growth rate of age-1 juveniles with pectoral fin deformities captured from 2002 to 2005 was actually higher than those without deformities. The mean growth rates of age-2, 3, and 4 juveniles with and without pectoral fin deformities were similar. The severity of pectoral fin deformities (i.e., major or minor) did not have a noticeable effect on the growth of juveniles. The long term (e.g., when these fish switch to a more piscivorous diet and during spawning) effects of these deformities remain unknown and should be monitored over time. The cause(s) of these pectoral fin deformities also remain unknown. Earlier broodstock captures in recent years has hastened and improved the success of spawning in the hatchery. This reduced time spent in the hatchery by adult fish used for broodstock may in turn have resulted in the reduced incidence of pectoral fin deformities noted above Survival The CJS estimates of survival remain tentative. Despite narrower confidence intervals than the 2004 (Phase 3) estimate for the survival rates, uncertainty still exists concerning the assumptions used in the modelling effort. Immigration and emigration are not incorporated into the model as inter-regional tag recovery data is too sparse to effectively model movements. With subsequent years of sampling, the degree of closure of these sturgeon populations to migration should be identified through recapture and telemetry data. The high degree of spatial aggregation of juvenile sturgeon that is apparent from video studies of the winter aggregations suggests that the assumption of equal probability of sampling tagged fish of different cohorts may be easily violated. If different cohorts aggregate in a non-random manner, other aggregations may be undetected and may not be vulnerable to the sampling methods. The models used for determining survival assume equal vulnerability of size/age groups to the sampling gear, and that similar proportions of cohorts among years will occur in the sampling areas proportionate to their abundance. As indicated in the analysis of size selectivity of gill nets, the gear used is inherently selective for size and age-classes. However, the limited comparison of the underwater remote PIT tag reader data with the gill net data suggests that the gill net recovery rates by age-class may reasonably reflect the relative abundance of age classes 1+ through 4+ that are present at the sampling site. Upper Columbia River Juvenile White Sturgeon Monitoring Phase 4 Investigations, Draft Report Page 63
98 GOLDER ASSOCIATES LTD. The geographic data analysis also indicated significant trends in distribution by size within age-classes, and trends are likely present among age-classes. If sufficient recovery data are available in subsequent years as a result of successful deployment of the remote underwater PIT tag reader or other methods, more complex models can be developed to address these issues. However, the data suggests that the hatchery program is highly successful in meeting its objectives. Regardless of biases, based on tag recovery data, juvenile sturgeon from the four age cohorts are very abundant relative to the existing wild stock. It was also noted that once juvenile sturgeon pass through their first 6 months at-large, their survival rates are indistinguishable from those of adult sturgeon, based on the current analysis and associated assumptions. Projections of the fish population into subsequent years are highly speculative. Density dependency will likely impact survival rates as abundances continue to increase. However, based on the limited comparison of gear types and the consistent record of larger (and apparently older) animals downstream from the major concentrations of juvenile sturgeon within the Keenleyside Reach (Figure 3.12), biases associated with the survival of the older age classes should be negative (estimated survival should be lower because of the relative movement of older age class fish out of the sampling areas). With the high (93-99%) estimate of survival this bias would likely be insignificant. In the future, if factors such as time of release, family group, and release location are to be evaluated for their influence on survival, increasing the number of tagged juvenile sturgeon captured is desirable. The pilot underwater remote PIT tag reader system showed promise of providing this increased resolution through the detection of large numbers of tags that will aid in the effective evaluation of capture efficiencies and spatial variation Analysis of Fork Length and Age-Class Selectivity The analysis demonstrates strong effects of gill net mesh size on the size and age-classes of juvenile sturgeon captured by this method. The standardization of multiple panel gill nets of designated mesh size is essential for cross border comparison of results. Recording of the mesh size from where each sturgeon is captured will provide improved precision for subsequent analyses. Preliminary comparison of age-class structure of fish recorded by the underwater PIT tag reader as compared to the three panel gill net catches is promising. Although sample sizes were small, the results indicated similar proportions of age-classes were collected. Angling indicated a strong bias for larger, older age-classes of fish. This suggested that angling methods deployed in this study were clearly not randomly sampling age-classes with equal probability. The use of gear directed towards the capture of larger fish (broodstock) increased this bias. Any use of these data in evaluation of survival or growth would require sufficient recaptures to correct for age and size based biases in capture probabilities. Geographic patterns of FL for each age-class sampled indicated a common trend among age-classes and over sample years. Within the flowing Keenleyside Reach of the Columbia River, there was a tendency for larger fish to be captured upstream in the areas sampled near HLK Eddy and smaller fish of the same age-class to be found downstream at the Upper Columbia River Juvenile White Sturgeon Monitoring Phase 4 Investigations, Draft Report Page 64
99 GOLDER ASSOCIATES LTD. areas sampled near and within Waneta Eddy. Within the Roosevelt Reach, the trend was reversed, with larger fish tending to be found downstream and an apparent distribution of older fish also following this same trend. In the analysis of survival of the juvenile sturgeon for each age class by mark-recapture, recapture probabilities of each age-class were assumed to be similar over the multiple sites sampled, as sufficient recaptures were not available to examine recapture probabilities by age class and location. The evaluation of geographic trends suggested that age-class capture probabilities were likely different at any given location because of the distribution of juvenile sturgeon by size as well as age-class. Although this may result in biases in the mark-recapture analysis, these are likely not large compared the variability in survival measurements as a result of limited numbers of samples. The underwater PIT tag reader data suggested that age-class composition of gill net catches and that recorded by the PIT tag readers was similar, at least within the limited confines of the prototype deployment of this new technology. If further use of this technology is successful in increasing sample sizes by one order of magnitude, sufficient recaptures will be obtained to evaluate spatial and gear type biases that may occur. The strong bias of angling toward larger fish limited the utility of this method to evaluate either growth or survival of juvenile sturgeon during the first three years following release. The strong selectivity of gill nets also suggested that as the cohorts age, the sampling method of gill nets will likely be limited in its effectiveness to collect older juvenile fish. The underwater PIT tag reader may be very useful in monitoring survival by tag recaptures, particularly for these older age-classes. Growth rates will still require either gill net or set line catches to supplement the survival estimates in order to assess future trends in the white sturgeon population. Given the abundance of young sturgeon, this evaluation is important to determine density dependency and ultimately successful recruitment to mature adults of fish from the hatchery program. 5.0 PROPOSED LONG TERM INDEXING PROTOCOL The nature of the released juvenile white sturgeon population in the Transboundary Reach creates difficulties in terms of developing a static long term indexing protocol. Gill nets were the most effective method used to sample juveniles during 2002 to 2004 monitoring. Gill nets continued to be effective during the present study (2005), but the results of the 2004 and 2005 Broodstock Collection Programs and angling conducted during 2005 indicated that hook and line methods will likely become more effective as fish age. If the use of gill nets were continued to the exclusion of hook and line methods, captures would be biased towards smaller, younger fish. The reverse would also be true if the use of hook and line methods were used to the exclusion of gill nets. As younger fish continue to be added to the population and the fish already present continue to grow, it will be necessary to use a greater variety of capture methods and expend more sample effort in order to obtain samples from all cohorts. Upper Columbia River Juvenile White Sturgeon Monitoring Phase 4 Investigations, Draft Report Page 65
100 GOLDER ASSOCIATES LTD. The distribution of juvenile white sturgeon in the study area has also changed during the first four years of these studies. During 2002 and 2003 monitoring, juveniles were encountered almost exclusively in HLK Eddy and Waneta Eddy. During 2004 and 2005 monitoring, juveniles were also recorded in several locations they were not during 2002 and 2003 monitoring (Kootenay Eddy, Sandbar Eddy, Fort Shepherd Eddy, and Rock Eddy). This raises the question as to whether areas where juveniles have not previously been captured should continue to be sampled, or whether effort should be concentrated in the areas of highest density in order to capture the highest number of fish possible. Based on the one sample session not conducted in November (Phase 3 sampling in September 2004), juveniles also appear to be more widely distributed during non-winter months. The catch-rate during 2004 monitoring was higher in September than November and consideration should be given to additional seasonal sampling to determine the most ideal sample times. The clumped distribution of juveniles in the study area also creates difficulties in developing a long term indexing protocol. Sampling can be hit and miss ; a gill net set in the same location may catch 20 fish one day and zero the next. The large aggregations of juveniles in some areas have been shown to move from day to day. If a net is set near a large aggregation of fish and the fish move towards the net, large numbers will likely be captured. Conversely, if the fish move in the other direction or remain stationary, fewer fish will be captured. An example of this was provided by the differences in gill net catch rates in HLK Eddy from 2002 to 2005, specifically the low catch-rate recorded in The majority of effort was expended during overnight sets in 2002, 2004 and 2005, which resulted in catch-rates of 4.5, 8.1 and 2.4 fish/net-unit, respectively. Gill net sampling in HLK Eddy during 2003 consisted of daytime sets only and resulted in a catch-rate of 57 fish/net-unit. These variations in catch-rate likely reflect the behaviour of the aggregations of juvenile white sturgeon in the Keenleyside Reach rather than changes in the density of these fish in HLK Eddy. 5.1 SAMPLE METHODS The analysis of the data suggests that the studies have developed to the point where standardized methods should continue to be employed in subsequent years. These methods should ensure standard release times and locations of the juvenile fish, maintain constant sampling sites each year, and ensure the gear type (e.g., gill net mesh size) deployed and the length of time the gear is deployed are constant. If specific hypotheses are forwarded that are to be subsequently tested by field sampling data, the power to detect an effect of a given magnitude with an assumed sample size should first be determined, prior to field deployment. The current program continues to have too many variables, such as time of release, location of release, location of capture, and capture methodology, to be able to effectively determine the influence of these variables on key life history parameters. Specifics for each of the current and proposed methodologies are discussed. A primary goal of long term indexing will be unbiased collections of large numbers of fish, in order to improve the accuracy of subsequent survival estimates. Survival is one of the key variables in determining the numbers of fish needed to be released to achieve the desired population target of 2500 adults in the Keenleyside Reach as outlined in the UCWSRI Recovery Plan (UCWSRI 2002). Additional objectives will include the use of data obtained for wild juveniles Upper Columbia River Juvenile White Sturgeon Monitoring Phase 4 Investigations, Draft Report Page 66
101 GOLDER ASSOCIATES LTD. to determine the conditions leading to recruitment, the assessment of growth and condition to guide stocking strategies, and to continue to improve our understanding of juvenile white sturgeon behaviour and habitat use Gill Nets Gill nets were the main sample method, as well as the most effective, used to capture juvenile white sturgeon in several studies conducted on the Columbia and Kootenay rivers in Canada and the United States (Elliot and Beamesderfer 1993; Lee and Underwood 2002; Neufeld and Spence 2002 and 2004; Young 2002; Ireland et al. 2002). During a study that compared the efficiency and selectivity of gill nets, set lines, and angling at capturing white sturgeon in The Dalles Reservoir (308 to 347 km upstream from the mouth of the Columbia River), gill nets captured the highest percentage (approximately 60% of the total gill net catch) of juvenile white sturgeon between 30 and 70 cm FL (Elliot and Beamesderfer 1993). Gill nets were used as the basis for juvenile white sturgeon abundance indexing in the lower Columbia River in the United States (B. James, Washington Department of Fish and Wildlife, Vancouver, WA, pers. comm., 2002), on a limited basis from 1998 to 2002 in Lake Roosevelt by the Spokane Tribe of Indians (C. Lee, pers. comm., 2004), and for juvenile indexing in the Roosevelt Reach in 2003 and 2004 by the WDFW (Howell and McLellan 2006, 2007). Gill nets have also been the main capture method used during juvenile white sturgeon sampling in the Kootenay River and in Lake Roosevelt in recent years (Lee and Underwood 2002; Neufeld and Spence 2002 and 2004; C. Lee, pers. comm., 2002). Based on data presented above and the results of 2002 to 2004 monitoring, gill nets were selected as the main method to capture juvenile white sturgeon in Gill nets should continue to be used for 2006 monitoring and will likely form the basis of future indexing programs, at least while there are still high numbers of young fish present in the study area. Gill net sampling is a relatively low cost capture method that can provide substantial numbers of juvenile white sturgeon from which life history data can be obtained. The continued use of gill nets in the study area will allow comparisons of indexing results with previous study years. Gill nets would likely be fished overnight during 2006 studies. Gill net sampling should continue to be standardized with three panels (one of each mesh size; 5.1, 10.2 and 15.2 cm stretch measure) in each net being deployed at all sites. Sampling programs in the U.S. and Canada should have the same exact standards to ensure identical methods are followed in the field. Quality control and assurance measures should be developed and uniformly followed by all contributors to the study program. To minimize spatial effects on key life history parameter estimates, sampling effort should be proportionate to abundance. This stratification of effort should be part of the pre-season study design, based on previous years catches, and should not be modified by in-season gill net catch rates. If additional areas of aggregation of juvenile sturgeon are located by alternative methods, these sites can be added to the sampling program as supplements and should be sampled in all subsequent years of sampling. If subsequent analysis suggests minimal size/age segregation by sampling area, these sampling standards could be relaxed. Upper Columbia River Juvenile White Sturgeon Monitoring Phase 4 Investigations, Draft Report Page 67
102 GOLDER ASSOCIATES LTD Underwater Surveys The LBV proved to be an effective, low disturbance method of observing juvenile white sturgeon, their behaviour, and habitat use in the study area. This was due to the high water clarity of the Columbia River and the concentration of juvenile white sturgeon in localized habitats with deepwater areas and lower velocities relative to mainstem flows. During 2006 monitoring, LBV surveys should again be conducted at Waneta Eddy and Fort Shepherd Eddy for comparison with previous surveys. An extensive LBV survey should also be conducted at HLK Eddy and downstream areas of the river thalweg, if time and budgetary constraints permit Hook and Line Methods Angling and set lines will become more effective as juvenile white sturgeon age and increase in size. The catch of juvenile white sturgeon has increased with each successive year of the Broodstock Collection Program since Set line captures have remained low, but this was likely due to the nature of the set lines used during broodstock collections (larger hooks targeting adults). Captures of age-4 juveniles on set lines used in the 2005 Broodstock Collection Program indicate older juveniles are starting to recruit to the broodstock collection gear. The catch of juvenile white sturgeon using hook and line methods will likely continue to increase as juvenile white sturgeon age and increase in size. Angling and set line sampling will again be assessed using the results of the 2006 Broodstock Collection Program. Angling and sampling using modified set lines (to target juveniles) should also be conducted during 2006 monitoring. This sampling would likely be limited and used mainly as a test of the effectiveness of hook and line methods at capturing older juveniles Underwater Remote PIT Tag Reader The underwater PIT tag reader pilot program was successful in terms of proving that the system will work. During the first four days of successful operation (before problems occurred), the system detected 29 individual PIT tags, of which six were detected twice. This system has the potential to detect hundreds of tags over a one to two month period. This would substantially increase the number of encounters of tagged juveniles and improve the 2006 survival estimate without the increased stress and potential mortality that would be associated with increased gill net (or other) sampling. The system would be deployed during 2006 monitoring with better anchoring and a targeted depth of 18 to 20 m (i.e., in the deepest portion of Waneta Eddy). The system would be downloaded and checked more frequently to aid in preventing problems and the potential loss of data. Upper Columbia River Juvenile White Sturgeon Monitoring Phase 4 Investigations, Draft Report Page 68
103 GOLDER ASSOCIATES LTD. 6.0 LITERATURE CITED Beamesderfer, R.C A standard weight (W s ) equation for white sturgeon. Calif. Fish and Game, 79(2): Brenden, T.O. and B.R. Murphy Statistical properties of the Relative Weight (W r ) Index and an Alternative Procedure for Testing W r differences Between Groups. North American Journal of Fisheries Management, 23: DeVore, J.D., B.W. James, D.R. Gilliland, and B.J. Cady Report B. Pages In D.L. Ward (editor). White sturgeon mitigation and restoration in the Columbia and Snake rivers upstream from Bonneville Dam, Annual Progress Report Report prepared for Bonneville Power Administration, Project No , Portland, Oregon. Elliot, J.C., and R.C. Beamesderfer Comparison of efficiency and selectivity of three gears used to sample white sturgeon in a Columbia River reservoir. Report A. Pages In R.C. Beamesderfer and A.A. Nigro (editors). Volume II. Status and habitat requirements of the white sturgeon populations in the Columbia River downstream from McNary Dam. Final report to Bonneville Power Administration, Portland, Oregon. Golder Associates Ltd White sturgeon spawning at Waneta, 2001 investigations and historical data summary. Report prepared for Columbia Power Corporation, Castlegar, B.C. Golder Report No F: 46 p. + 7 app. Golder Associates Ltd. 2003a. White sturgeon spawning at Waneta, 2003 investigations. Report prepared for Columbia Power Corporation, Castlegar, BC. Golder Report No : 43 p. + 1 app. Golder Associates Ltd. 2003b. Upper Columbia River juvenile white sturgeon monitoring, Phase 1 investigations, fall Report prepared for BC Hydro, Castlegar, B.C. Golder Report No F: 33 p. + 2 app. Golder Associates Ltd. 2003c. Large River Fish Indexing Program - Lower Columbia River 2002 Phase 2 Investigations. Report prepared for BC Hydro, Burnaby, B.C. Golder Report No F: 47 p. + 5 app. Golder Associates Ltd Large River Fish Indexing Program Lower Columbia River 2003 Phase 3 Investigations. Report prepared for BC Hydro, Burnaby, B.C. Golder Report No F: 54 p. + 6 app. Golder Associates Ltd. 2005a. Upper Columbia River juvenile white sturgeon monitoring: Phase 2 investigations, fall spring Draft report prepared for BC Hydro, Castlegar, B.C. Golder Report No D: 43 p. + plates + 2 app. Golder Associates Ltd. 2005b. Upper Columbia River juvenile white sturgeon monitoring: Phase 3 investigations, August 2004 February Draft report prepared for BC Hydro, Castlegar, B.C. Golder Report No D: 68 p. + 6 app. Golder Associates Ltd. 2005c. Upper Columbia White Sturgeon Stock Monitoring and Data Management Program: Annual Report No. 2, 1 April March Report prepared for British Columbia Ministry of Water, Land and Air Protection, Nelson, B.C. Golder Report No A2F: 22 p. + 2 app. Golder Associates Ltd. 2005d. Large River Fish Indexing Program - Lower Columbia River 2004 Phase 4 Investigations. Report prepared for BC Hydro, Burnaby, B.C. Golder Report No F: 57 p. + 6 app. Golder Associates Ltd. 2005e. Upper Columbia River white sturgeon broodstock collection, Data report prepared for BC Hydro, Castlegar, B.C. Golder Report No F: 21 p. Golder Associates Ltd. 2005f. Waneta Expansion Project: Examination of velocity characteristics in Waneta Eddy in relation to overwintering use by juvenile white sturgeon, March Draft report prepared for Waneta Expansion Power Corporation, Castlegar, B.C. Golder Report No D: 19 p. + 1 app. Upper Columbia River Juvenile White Sturgeon Monitoring Phase 4 Investigations, Draft Report Page 69
104 GOLDER ASSOCIATES LTD. Golder Associates Ltd Large River Fish Indexing Program - Lower Columbia River 2005 Phase 5 Investigations. Report prepared for BC Hydro, Burnaby, B.C. Golder Report No F: 56 p. + 6 app. Hildebrand, L., and G. Birch Columbia River white sturgeon: draft stabilization plan. Report prepared for B.C. Ministry of Environment, Lands and Parks by R.L. & L. Environmental Services Ltd. R.L. & L. Report No. 468dD: 52 p. Hildebrand, L., C. McLeod, and S. McKenzie Status and management of white sturgeon in the Columbia River in British Columbia, Canada: an overview. Journal of Applied Ichthyology. 15: Howell, M.D. and J.G. McLellan Lake Roosevelt white sturgeon recovery project, Annual Progress Report, January March Report prepared for the U.S. Department of Energy, Bonneville Power Administration, Environment, Fish and Wildlife. Project Number p. + 4 app. Howell, M.D. and J.G. McLellan Lake Roosevelt white sturgeon recovery project, Annual Progress Report, April March Draft Report prepared for the U.S. Department of Energy, Bonneville Power Administration, Environment, Fish and Wildlife. Project Number p. + 7 app. Ireland, S.C., J.T. Siple, V.L. Paragamian, V.D. Wakkinen, and R.C.P. Beamesderfer Success of hatchery-reared juvenile white sturgeon (Acipenser transmontanus) following release in the Kootenai River, Idaho, USA. Journal of Applied Ichthyology. 18: Lee, C., and K. Underwood Lake Roosevelt white sturgeon juvenile sampling. Report prepared for B.C. Ministry of Water, Land and Air Protection. 8 p. Murphy, B.R., D.W. Willis, T.A. Springer The relative weight index in fisheries management: status and needs. Fisheries, 16(2): Neufeld, M.D., and C.R. Spence Kootenay River white sturgeon studies juvenile sampling, Report prepared for the Bonneville Power Administration (Columbia Basin Fish and Wildlife Authority). 39 p app. Neufeld, M.D., and C.R. Spence Kootenay fisheries investigations sturgeon and burbot progress, Report prepared for the Bonneville Power Administration (Columbia Basin Fish and Wildlife Authority). 52 p app. Parsley, M.J., L.G. Beckman, and G.T. McCabe, Jr Habitat use by spawning and rearing white sturgeon in the Columbia River downstream from McNary Dam. Report I. Pages In R.C. Beamesderfer and A.A. Nigro (editors). Volume I. Status and habitat requirements of the white sturgeon populations in the Columbia River downstream from McNary Dam. Final Report to Bonneville Power Administration, Portland, Oregon. R.L. & L. Environmental Services Ltd Status of white sturgeon in the Columbia River, B.C. Report prepared for BC Hydro, Environmental Resources, Vancouver, B.C. R.L. & L. Report No. 377F: 101 p. + app. R.L. & L. Environmental Services Ltd White sturgeon investigations in the Columbia River, B.C., study results. Report prepared for B.C. Ministry of Environment, Lands and Parks. R.L. & L. Report No. 611F: 17 p. + 5 app. R.L. & L. Environmental Services Ltd White sturgeon investigations in Arrow Reservoir and the Columbia River, B.C study results. Data report prepared for B.C. Ministry of Environment, Lands and Parks. R.L. & L. Report No. 840F: 23 p. + 4 app. Upper Columbia White Sturgeon Recovery Initiative (UCWSRI) Upper Columbia White Sturgeon Recovery Plan. Draft document prepared for the Upper Columbia White Sturgeon Recovery Initiative. 88 p. + app. Young, W.T Juvenile habitat use and growth of white sturgeon in the Kootenai River. M.S. Thesis. University of Idaho. Upper Columbia River Juvenile White Sturgeon Monitoring Phase 4 Investigations, Draft Report Page 70
105 APPENDIX A RELEASE DATA
106 Table A1 Summary of hatchery juvenile white sturgeon released in the Transboundary Recovery Area, 2002 to Release Year Brood Year Release Location a Number of Fish Upper Section 4407 Lower Section 4264 Total 2002 Releases Upper Section 5724 Lower Section 6079 Total 2003 Releases Upper Section 4828 Lower Section 4867 Roosevelt Reach Upper Section b 26 Lower Section b 26 Total 2004 Releases Upper Section 6415 Lower Section 6333 Roosevelt Reach 3755 Total 2005 Releases Total 2002 to 2005 Releases a Upper Section = HLK to the Kootenay River, including the 3 km stretch of the Kootenay River below Brilliant Dam; Lower Section = Beaver Creek to Waneta Eddy; Roosevelt Reach = Canada - U.S. border to Grand Coulee Dam. b These fish were held over from the 2002 brood until they were of sufficient size to be implanted with sonic tags, then released in May 2004.
107 Table A2 Summary of hatchery juvenile white sturgeon (2004 brood) releases by family, February to May Note: Fish from the 2004 brood year that were implanted with sonic tags ( n = 38) are included. Family a Date Released Release Location b No. of Fish Mean FL c (mm) Mean Weight (g) Total Weight (kg) May-05 Beaver Creek HLK Family 04-1 Total May-05 Beaver Creek HLK Family 04-2 Total May-05 Beaver Creek HLK Family 04-3 Total May-05 Beaver Creek HLK Family 04-4 Total May-05 Beaver Creek HLK Family 04-5 Total Feb-05 Nancy Cr./M. Flats North Gorge Northport May-05 Nancy Cr./M. Flats North Gorge Northport Family 04-6 Total Feb-05 Nancy Cr./M. Flats North Gorge Northport May-05 Beaver Creek HLK May-05 Nancy Cr./M. Flats North Gorge Northport Family 04-7 Total Total of All Families a The first 2 digits indicate brood year (i.e. 04 = 2004); the last digit indicates the family number from that brood year. b See Figures 1.1 and 1.2 for release locations. c FL = fork length.
108 Table A3 Summary of hatchery juvenile white sturgeon of the 2004 brood year implanted with sonic tags and released in May Family a PIT Tag No. Release Info b Nano Tag c Date Location FL (cm) Wt (g) Deformities Serial # ID Code May-05 Beaver Creek F (H) May-05 Beaver Creek F (H) May-05 Beaver Creek F (L) May-05 HLK F (L) May-05 HLK F (L) May-05 HLK F (L) 1802 Family 04-1 Means n = Total Weight = 1.3 kg May-05 Beaver Creek F (H) May-05 Beaver Creek F (L) May-05 Beaver Creek F (L) May-05 HLK F (L) May-05 HLK F (L) May-05 HLK F (H) May-05 HLK F (H) May-05 HLK F (H) May-05 HLK F (H) 1826 Family 04-2 Means n = Total Weight = 1.6 kg May-05 Beaver Creek F (H) May-05 Beaver Creek F (H) May-05 HLK F (L) May-05 HLK F (H) 1822 Family 04-3 Means n = Total Weight = 0.8 kg May-05 Beaver Creek F (L) May-05 HLK F (L) 1800 Family 04-4 Means n = Total Weight = 0.4 kg May-05 Beaver Creek F (H) May-05 Beaver Creek F (H) May-05 Beaver Creek F (H) May-05 Beaver Creek F (L) May-05 Beaver Creek F (L) May-05 Beaver Creek F (L) May-05 HLK F (L) May-05 HLK F (H) May-05 HLK F (H) 1830 Family 04-5 Means n = Total Weight = 1.5 kg May-05 Nancy Cr/Marcus Flats F (L) May-05 Nancy Cr/Marcus Flats F (H) May-05 Nancy Cr/Marcus Flats F (L) May-05 Nancy Cr/Marcus Flats F (L) 1816 Family 04-6 Means n = Total Weight = 1.4 kg May-05 Nancy Cr/Marcus Flats F (H) May-05 Nancy Cr/Marcus Flats F (H) May-05 Nancy Cr/Marcus Flats F (H) May-05 Nancy Cr/Marcus Flats F (L) 1818 Family 04-7 Means n = Total Weight = 1.1 kg All Families Means n = Total Weight = 8.2 kg a The first 2 digits indicate brood year (i.e. 04 = 2004); the last digit indicates the family number from that brood year. b See Figures 1.1 and 1.2 for release locations. FL = fork length; Wt = weight. Deformities: 1 = left pecftoral fin; 2 = right pectoral fin; 3 = both pectoral fins. c "(H)" after serial number indicates high-output nano tag; V8SC-2H-F04K coded transmitter; 69.0 khz. "(L)" after serial number indicates low-output nano tag; V8SC-2L-F04K coded transmitter; 69.0 khz. N/A = data not available.
109 Table A4 Summary of hatchery juvenile white sturgeon released May to July 2004; 2003 brood fish and 2002 brood fish implanted with sonic tags. Family a Date Released Release Location b No. of Fish Mean Weight (g) Total Weight (kg) May-04 Beaver Creek/Waneta May-04 HLK Jun-04 Beaver Creek/Waneta Family 03-1 Total May-04 Beaver Creek/Waneta May-04 HLK Jun-04 Beaver Creek/Waneta Family 03-2 Total May-04 Beaver Creek/Waneta May-04 HLK Family 03-3 Total May-04 Beaver Creek/Waneta May-04 HLK Jun-04 Beaver Creek/Waneta Family 03-4 Total May-04 Beaver Creek/Waneta May-04 HLK Jun-04 Beaver Creek/Waneta Family 03-5 Total May-04 Beaver Creek/Waneta May-04 HLK May & July-04 Roosevelt Reach Family 03-6 Total Brood Year Total May-04 Beaver Creek May-04 HLK Family 02-1 Total May-04 Beaver Creek May-04 HLK Family 02-2 Total May-04 Beaver Creek May-04 HLK Family 02-3 Total May-04 Beaver Creek May-04 HLK Family 02-4 Total Brood Year Total a The first 2 digits indicate brood year (i.e. 03 = 2003); the last digit indicates the family number from that brood year. b See Figures 1.1 and 1.2 for release locations.
110 Table A5 Length, weight, and sonic (nano) tag information for juvenile white sturgeon (2002 brood year) held over for sonic tag implantation and released at Beaver Creek in May Family a PIT Tag No. Release Info b Nano Tag c Date Location FL (cm) Wt (g) Deformities Serial # ID Code May-04 Beaver Creek D May-04 Beaver Creek D May-04 Beaver Creek D May-04 Beaver Creek D May-04 Beaver Creek D May-04 Beaver Creek D May-04 Beaver Creek D May-04 Beaver Creek D 1880 Family 02-1 Means n = Total Weight = 2.6 kg May-04 Beaver Creek D May-04 Beaver Creek D May-04 Beaver Creek D May-04 Beaver Creek D May-04 Beaver Creek D May-04 Beaver Creek D 1869 Family 02-2 Means n = Total Weight = 1.9 kg May-04 Beaver Creek D May-04 Beaver Creek D May-04 Beaver Creek D May-04 Beaver Creek D 1883 Family 02-3 Means n = Total Weight = 1.2 kg May-04 Beaver Creek D May-04 Beaver Creek D May-04 Beaver Creek D May-04 Beaver Creek D May-04 Beaver Creek D May-04 Beaver Creek D May-04 Beaver Creek D May-04 Beaver Creek D 1886 Family 02-4 Means n = Total Weight = 2.5 kg All Family Means n = Total Weight = 8.1 kg a The first 2 digits indicate brood year (i.e. 02 = 2002); the last digit indicates the family number from that brood year. b See Figure 1.1 for release location. FL = fork length; Wt = weight. Deformities: 1 = left pecftoral fin; 2 = right pectoral fin. c High output nano tags; V8SC-2H-F04K coded transmitters; 69.0 khz.
111 Table A6 Length, weight, and sonic (nano) tag information for juvenile white sturgeon (2002 brood year) held over for sonic tag implantation and released at HLK on 13 May Family a PIT Tag No. Release Info b Nano Tag c Date Location FL (cm) Wt (g) Deformities Serial # ID Code May-04 HLK D May-04 HLK D May-04 HLK D May-04 HLK D May-04 HLK D 1902 Family 02-1 Means n = Total Weight = 1.6 kg May-04 HLK D May-04 HLK D May-04 HLK D May-04 HLK D May-04 HLK D May-04 HLK D 1895 Family 02-2 Means n = Total Weight = 2.0 kg May-04 HLK D May-04 HLK D May-04 HLK D May-04 HLK D May-04 HLK D May-04 HLK D May-04 HLK D May-04 HLK D 1897 Family 02-3 Means n = Total Weight = 2.7 kg May-04 HLK D May-04 HLK D May-04 HLK D May-04 HLK D May-04 HLK D May-04 HLK D May-04 HLK D 1881 Family 02-4 Means n = Total Weight = 1.9 kg All Family Means n = Total Weight = 8.2 kg a The first 2 digits indicate brood year (i.e. 02 = 2002); the last digit indicates the family number from that brood year. b See Figure 1.1 for release location; FL = fork length; Wt = weight. Deformities: 1 = left pecftoral fin; 2 = right pectoral fin. c High output nano tags; V8SC-2H-F04K coded transmitters; 69.0 khz.
112 Table A7 Summary of hatchery juvenile white sturgeon (2002 brood) releases by family, May and July Family a Release Date(s) Release Site b No. of Fish Mean Length (cm) Mean Weight (g) Total Weight (kg) & 20-May-03 HLK Robson & 20-May-03 Beaver Creek Jul-03 HLK Robson Jul-03 Beaver Creek Family 02-1 Total May-03 HLK Robson May-03 Beaver Creek Jul-03 HLK Robson Jul-03 Beaver Creek Family 02-2 Total & 13-May-03 HLK Robson May-03 Beaver Creek Jul-03 HLK Robson Jul-03 Beaver Creek Family 02-3 Total May-03 HLK Robson May-03 Beaver Creek Jul-03 HLK Robson Jul-03 Beaver Creek Family 02-4 Total Total of All Families a The first 2 digits indicate brood year (i.e. 02 = 2002); the last digit indicates the family number from that brood year. b See Figure 1.1; HLK Robson = released between HLK and Sturgeon Island.
113 Table A8 Summary of hatchery juvenile white sturgeon (2001 brood) releases by family, May and August Family a Date Measured Date Released Release Location b No. of Fish Total Weight (kg) May May-02 Kootenay River May May-02 HLK Robson May May-02 Waneta/Beaver Creek Aug Aug-02 HLK Robson Aug Aug-02 Waneta Eddy Family 01-1 Total May May-02 Kootenay River May May-02 HLK Robson May May-02 Waneta/Beaver Creek Aug Aug-02 HLK Robson Aug Aug-02 Waneta Eddy Family 01-2 Total May May-02 Kootenay River May May-02 HLK Robson May May-02 Waneta/Beaver Creek Aug Aug-02 HLK Robson Aug Aug-02 Waneta Eddy Family 01-3 Total May May-02 Kootenay River May May-02 HLK Robson May May-02 Waneta/Beaver Creek Aug Aug-02 HLK Robson Aug Aug-02 Waneta Eddy Family 01-5 Total May May-02 Kootenay River May May-02 HLK Robson May May-02 Waneta/Beaver Creek Aug Aug-02 HLK Robson Aug Aug-02 Waneta Eddy Family 01-6 Total Wild Fry 10-May May-02 Waneta/Beaver Creek Aug Aug-02 Waneta Eddy Aug Aug-02 HLK Robson Family 01-Wild Fry Total Total of All Families a The first 2 digits indicate brood year (i.e. 01 = 2001); the last digit indicates the family number from that brood year. b See Figure 1.1; HLK Robson = released between HLK and Sturgeon Island.
114 APPENDIX B FISH CAPTURE AND OBSERVATION DATA
115 Table B1 Gill net catch and catch-per-unit-effort (CPUE) in the Columbia River (HLK to Canada-U.S. border) during Phase 4 juvenile white sturgeon sampling, November Set Mesh Panel Sample Number Caught and CPUE (number of fish/net-unit) Location a Set Pull Site Duration Size b Area Effort WSG d (juv) LW CSU LSU PCC All Species Date Time Date Time (h) (cm) (m 2 ) (net-units) c No. CPUE No. CPUE No. CPUE No. CPUE No. CPUE No. CPUE HLK Eddy GN0.1M 7-Nov-05 11:26 7-Nov-05 14: all GN0.1MR 7-Nov-05 11:45 7-Nov-05 14: all GN0.15M 7-Nov-05 11:58 7-Nov-05 14: all GN0.1M 7-Nov-05 14:36 8-Nov-05 10: all GN0.1MR 7-Nov-05 14:45 8-Nov-05 11: all GN0.15M 7-Nov-05 14:59 8-Nov-05 12: all HLK Eddy Total Balfour Bay GN2.4MR 7-Nov-05 12:20 7-Nov-05 15: all GN2.5MR 7-Nov-05 12:27 7-Nov-05 15: all GN2.4MR 7-Nov-05 15:23 8-Nov-05 12: all Continued... a See Figure 1.1 for sample locations. b Mesh size = cm stretch measure; 5.1 = 2 inch; 10.2 = 4 inch; 15.2 = 6 inch c One net-unit = 100 m 2 of net sampled for 24 hours. d WSG = white sturgeon; juv = juvenile; LW = lake whitefish; CSU = largescale sucker; LSU = longnose sucker; PCC = peamouth
116 Table B1 Continued. Set Mesh Panel Sample Number Caught and CPUE (number of fish/net-unit) Location a Set Pull Site Duration Size b Area Effort WSG d (juv) LW CSU LSU PCC All Species Date Time Date Time (h) (cm) (m 2 ) (net-units) c No. CPUE No. CPUE No. CPUE No. CPUE No. CPUE No. CPUE Balfour Bay GN2.5MR 7-Nov-05 15:29 8-Nov-05 13: all Balfour Bay Total Sturgeon Island GN6.4ML 7-Nov-05 12:48 7-Nov-05 15: all GN6.4ML 7-Nov-05 15:44 8-Nov-05 13: all Sturgeon Island Total Kootenay Eddy GN0.1ML-K 7-Nov-05 13:08 7-Nov-05 16: all GN0.12ML-K 7-Nov-05 13:16 7-Nov-05 16: all GN0.1ML-K 7-Nov-05 16:04 8-Nov-05 14: all GN0.12ML-K 7-Nov-05 16:11 8-Nov-05 14: all Balfour Bay Total Sandbar Eddy GN21.0L 8-Nov-05 15:49 9-Nov-05 11: all Continued... a See Figure 1.1 for sample locations. b Mesh size = cm stretch measure; 5.1 = 2 inch; 10.2 = 4 inch; 15.2 = 6 inch c One net-unit = 100 m 2 of net sampled for 24 hours. d WSG = white sturgeon; juv = juvenile; LW = lake whitefish; CSU = largescale sucker; LSU = longnose sucker; PCC = peamouth
117 Table B1 Continued. Set Mesh Panel Sample Number Caught and CPUE (number of fish/net-unit) Location a Set Pull Site Duration Size b Area Effort WSG d (juv) LW CSU LSU PCC All Species Date Time Date Time (h) (cm) (m 2 ) (net-units) c No. CPUE No. CPUE No. CPUE No. CPUE No. CPUE No. CPUE Sandbar Eddy GN21.1ML 8-Nov-05 16:07 9-Nov-05 11: all Sandbar Eddy Total Genelle Eddy GN25.5ML 8-Nov-05 16:23 9-Nov-05 11: all GN25.4ML 8-Nov-05 16:33 9-Nov-05 12: all Genelle Total Beaver Creek Launch GN47.4MR 9-Nov-05 14:24 10-Nov-05 14: Eddy Beaver Creek Launch Eddy Total 24.0 all Trimac Eddy GN50.6MR 9-Nov-05 14:45 10-Nov-05 14: Trimac Eddy Total 23.4 all Fort Shepherd Eddy GN51.6L 9-Nov-05 15:10 10-Nov-05 13: all GN51.3R 9-Nov-05 15:31 10-Nov-05 13: all Fort Shepherd Eddy Total Waneta Eddy GN54.9R 9-Nov-05 15:56 10-Nov-05 12: all Continued... a See Figure 1.1 for sample locations. b Mesh size = cm stretch measure; 5.1 = 2 inch; 10.2 = 4 inch; 15.2 = 6 inch c One net-unit = 100 m 2 of net sampled for 24 hours. d WSG = white sturgeon; juv = juvenile; LW = lake whitefish; CSU = largescale sucker; LSU = longnose sucker; PCC = peamouth
118 Table B1 Continued. Set Mesh Panel Sample Number Caught and CPUE (number of fish/net-unit) Location a Set Pull Site Duration Size b Area Effort WSG d (juv) LW CSU LSU PCC All Species Date Time Date Time (h) (cm) (m 2 ) (net-units) c No. CPUE No. CPUE No. CPUE No. CPUE No. CPUE No. CPUE Waneta Eddy GN55.0MR 9-Nov-05 16:10 10-Nov-05 10: all GN55.0MR 10-Nov-05 13:18 10-Nov-05 15: all GN55.0MR 16-Nov-05 16:20 17-Nov-05 11: all GN55.0M 16-Nov-05 16:31 17-Nov-05 12: all GN54.9MR 16-Nov-05 16:39 17-Nov-05 13: all GN54.9M 16-Nov-05 16:54 17-Nov-05 15: all GN55.0M 17-Nov-05 16:23 18-Nov-05 11: all GN54.9M 17-Nov-05 16:15 18-Nov-05 12: all GN54.9MR 17-Nov-05 16:19 18-Nov-05 13: all Continued... a See Figure 1.1 for sample locations. b Mesh size = cm stretch measure; 5.1 = 2 inch; 10.2 = 4 inch; 15.2 = 6 inch c One net-unit = 100 m 2 of net sampled for 24 hours. d WSG = white sturgeon; juv = juvenile; LW = lake whitefish; CSU = largescale sucker; LSU = longnose sucker; PCC = peamouth
119 Table B1 Concluded. Set Mesh Panel Sample Number Caught and CPUE (number of fish/net-unit) Location a Set Pull Site Duration Size b Area Effort WSG d (juv) LW CSU LSU PCC All Species Date Time Date Time (h) (cm) (m 2 ) (net-units) c No. CPUE No. CPUE No. CPUE No. CPUE No. CPUE No. CPUE Waneta Eddy GN55.0MR 17-Nov-05 16:26 18-Nov-05 13: all Waneta Eddy Total Rock Eddy GN55.5ML 9-Nov-05 16:24 10-Nov-05 13: Rock Eddy Total 20.6 all All Gill Nets Total all All Gill Nets 5.1 cm (2") Mesh Panels Total All Gill Nets 10.2 cm (4") Mesh Panels Total All Gill Nets 15.2 cm (6") Mesh Panels Total All Gill Nets Daytime Set Total 25.3 all All Gill Nets Overnight Set Total all a See Figure 1.1 for sample locations. b Mesh size = cm stretch measure; 5.1 = 2 inch; 10.2 = 4 inch; 15.2 = 6 inch c One net-unit = 100 m 2 of net sampled for 24 hours. d WSG = white sturgeon; juv = juvenile; LW = lake whitefish; CSU = largescale sucker; LSU = longnose sucker; PCC = peamouth
120 Table B2 Summary of gill net catch and catch-per-unit-effort (CPUE = no. of fish/net-unit) in the Roosevelt Reach, October 2005 (data provided by the Washington Department of Fish and Wildlife). Note: gill nets used by the WDFW were 300 feet (91.44 m) long and 12 feet (3.66 m) deep. General Location River Number of Effort Juvenile White Sturgeon Dates Sampled Kilometre a Nets (net-units) b Catch CPUE Deadman's Eddy & 27 Oct Northport & 27 Oct Five-mile Creek & 27 Oct Northport Hole to Onion Creek Oct Little Dalles & 26 Oct Marble Oct China Bend , 21, 24, 25 Oct North Gorge Oct Bossburg Oct Evans Oct Snag Cove/China Creek Oct Seven Devils , 7, Oct Marcus Island , 7, 17, 18 Oct Marcus Flats , 17, 18 Oct Kettle Falls Bridge , 6, 17, 18 Oct Kettle Falls Ramp & 6 Oct Rickey Point & 5 Oct Haag Cove to Martin Creek Oct Barnaby Island & 4 Oct downstream Barnaby Island Oct Gifford Oct downstream Gifford Oct Total Adjusted Total c a River kilometres measured downstream from HLK. b One net-unit = 100 m 2 of net sampled for 24 hours. c Nets treated as 6 feet deep rather than 12 (nets used in the Keenleyside Reach were 6 feet deep).
121 Table B3 Summary of incidental fish species captured by gill net in the Keenleyside Reach during Phase 4 sampling, November Location a Site Date Type Number Condition at Release Species c Pulled of Set b Captured Alive Mortality HLK Eddy GN0.1MR 8-Nov-05 ON LW 1 1 GN0.15M 8-Nov-05 LW 1 1 Sturgeon Island GN6.4ML 8-Nov-05 LW 1 1 LSU Kootenay Eddy GN0.1ML-K 8-Nov-05 CSU LSU 4 4 PCC 1 1 GN0.12ML-K 8-Nov-05 LW 1 1 CSU 2 2 LSU 3 3 Genelle GN25.5ML 9-Nov-05 LSU 1 1 Overnight Sets Total (% of Overnight By-catch) (68%) 7 (32%) Total lake whitefish captured 4 2 (50%) 2 (50%) Total longnose sucker captured (91%) 1 (9%) Total largescale sucker captured 6 3 (50%) 3 (50%) Total peamouth captured (100%) a See Figure 1.1 for sample locations. b ON = overnight; fish were not captured during daytime sets. c LW = lake whitefish; LSU = longnose sucker; CSU = largescale sucker; PCC = peamouth.
122 Table B4 Summary of underwater footage obtained during Phase 4 juvenile white sturgeon monitoring, November 2005 and March Location a Date File Total Footage No. of White Sturgeon No. of Other Species b (mm:ss) Juvenile Sub-Adult Adult WP SU NSC UNID Waneta Eddy 16-Nov-05 AP1 5:32 AP2 52: AP2a 20: T1 8:17 T1a 8: Subtotal 94: Waneta Eddy 24-Mar-06 AP1 3:22 AP1a 3:58 AP2 8:43 AP3 20: Subtotal 36: Waneta Eddy 26-Mar-06 R1 8:07 3 R1a 7: R2 6: R3 6:53 R4 4:02 Subtotal 32: Fort Shepherd 28-Nov-05 FS1 1:59 Eddy FS1a 35: FS2 35: FS3 21:18 12 FS3a 3:54 Ft. Shep. Eddy Total 97: Waneta Eddy Total 163:55 (2.7 hr) Total 261:39 (4.4 hr) a See Figure 1.1 for sample locations. b WP = walleye; SU = sucker species; NSC = northern pikeminnow; UNID = unidentified (unable to identify to species).
123 Table B5 Summary of habitat observations from underwater footage obtained during Phase 4 juvenile white sturgeon monitoring, November 2005 and March Location a Date File Footage No. of White Sturgeon b No. of Other Species c Counter Juv Sub-A Adult WP SU NSC UNID Depth (m) Substrate/Comments d Waneta Eddy 16-Nov-05 AP1 00:00-05:32 Fish not observed AP2 00:26-02: Fines 02:43-02:45 1 Fines 3:28-4: Fines; followed juvenile with small deformed pectoral fin 4:40-5: Fines/gravel 7:00-11: Fines/gravel; most fish over small patches of "cleaned" gravel (fines moved by fish?) 12:00-13: Fines/gravel; most fish over small patches of "cleaned" gravel (fines moved by fish?) 14:40-17: Fines/gravel; most fish over small patches of "cleaned" gravel (fines moved by fish?) 18:27-18: Fines/gravel; most fish over small patches of "cleaned" gravel (fines moved by fish?) 18:52-19: Fines/gravel; most fish over small patches of "cleaned" gravel (fines moved by fish?) 19:23-28: Fines/gravel/small cobble; many fish over small patches of "cleaned" gravel 28:53-34: Fines/gravel/small cobble; many fish over small patches of "cleaned" gravel 34:15-43: Fines/gravel/small cobble; many fish over small patches of "cleaned" gravel AP2a 01:24-01: Fines/slag 02:32-03: Fines/slag 04:25-06: Fines/slag/gravels 07:05-09: Cobbles/gravels/fines 11:19-11: Fines/slag 12:01-14: Fines/slag 14:25-15: Fines/slag/gravels 16:01-16:25 2 ~20 Gravels/fines/slag 16:50-17:32 2 ~20 Gravels/cobbles T1 00:00-08:17 Fish not observed T1a 00:28 1 Fines 03:58-04: Fines 04:35-05: Fines 05: Fines 06:14-06: Fines/gravels/cobbles Waneta Eddy 16-Nov-05 Subtotal Fort Shepherd Eddy 28-Nov-05 FS1 00:00-01:59 Fish not observed FS1a 16: Cobble/gravel/few boulders 24: Boulder/cobble/gravel 29: Boulder/cobble/gravel FS2 02: Fines 04:27-04: Fines with some woody debris 08:16-08: Cobble with some woody debris Continued... a See Figure 1.1 for sample locations. b Juv = juvenile; Sub-A = sub-adult. c WP = walleye; SU = sucker species; NSC = northern pikeminnow; UNID = unidentified (unable to identify to species). d Substrates listed in order of dominance.
124 Table B5 Concluded. Location a Date File Footage No. of White Sturgeon b No. of Other Species c Counter Juv Sub-A Adult WP SU NSC UNID Depth (m) Substrate/Comments d Fort Shepherd Eddy 28-Nov-05 08:32-15: Fines/cobble/gravel 20: Fines (fish might be a rainbow trout) 29:29-29: Fines/slag FS3 02:27-02: Cobble/gravel/boulder 04:57-09: Boulder/fines 14:04-15: Fines/cobbles/gravels 17:36-18: Cobbles/fines/gravels FS3a 00:00-03:54 Fish not observed Ft. Shep. Eddy 28-Nov-05 Subtotal Waneta Eddy 24-Mar-06 AP1 00:00-03:22 Fish not observed AP1a 00:00-03:58 Fish not observed AP2 00:00-08:43 Fish not observed AP3 00:06-00: Fines/slag 00:42-02: Fines/slag/gravel; low relief fines/slag dunes 02:45-05: Fines/slag 05:50-12: Fines/slag/some gravel; low relief dunes; number of juveniles likely > :07-12: Fines/slag/gravel; flat bottom 12:13-12: Fines/slag/gravel/cobble 12:40-16: Fish already tallied (14:30 - low light camera; 15:09-15:35 lasers) 16:44-17: Fines/slag 17:38-20: Fish already tallied Waneta Eddy 24-Mar-06 Subtotal Waneta Eddy 26-Mar-06 R1 06: Fines/slag 07: Fines/slag R1a 01:06-01: Fines/slag (lots of organic debris in water) 02: Fines/slag (lots of organic debris in water) 04: Fines/slag/gravel (slag dunes) R2 01: Fines/ slag (lots of organic debris in water) 02: Fines/ slag (lots of organic debris in water) 03: Fines/ slag (lots of organic debris in water) 04:20-04: Fines/ slag (lots of organic debris in water) 05:05-05: Fines/ slag (lots of organic debris in water) R3 00:00-06:53 Fish not observed R4 00:00-04:02 Fish not observed Waneta Eddy 26-Mar-06 Subtotal Total a See Figure 1.1 for sample locations. b Juv = juvenile; Sub-A = sub-adult. c WP = walleye; SU = sucker species; NSC = northern pikeminnow; UNID = unidentified (unable to identify to species). d Substrates listed in order of dominance.
125 Table B6 Summary of juvenile white sturgeon catch and catch-per-unit-effort (CPUE = no. fish/hook-hour) during angling conducted during the broodstock collection program (June 2005) and Phase 4 juvenile white sturgeon monitoring (November 2005). Location a Kootenay Eddy (0.1K) Rock Island area (42.9) Fort Shepherd Eddy (52.0) Waneta Eddy (55.4) Subtotal Waneta Eddy (55.4) Total Date(s) Effort Number (hook-hours) Captured CPUE 9-Jun Jun ,9,13-16,20,22,23-Jun ,8,13,21,23,24,27-Jun Nov a See Figure 1.1 for sample locations. Number in brackets is river kilometre downstream of HLK; "K" indicates distance upstream from the mouth of the Kootenay River. Table B7 Summary of juvenile white sturgeon catch and catch-per-unit-effort (CPUE = no. fish/100 hook-hours) for set line sampling conducted during the broodstock collection program, June Location a HLK Eddy (0.1) Downstream of Rialto Creek (1.2) Sturgeon Island (6.5) Kootenay Eddy (0.1K) Fort Shepherd Eddy (52.0) Waneta Eddy (55.4) Total Date(s) Effort Number (hook-hours) Captured CPUE Jun , 15-Jun ,10,15,16,28,29-Jun ,10,16,17,28-30-Jun ,20-24,27,28-Jun ,13-17,20-24,27,28-Jun a See Figure 1.1 for sample locations. Number in brackets is river kilometre downstream of HLK; "K" indicates distance upstream from the mouth of the Kootenay River.
126 Table B8 Summary of capture methods and locations of juvenile white sturgeon for which data was obtained from 2002 to Capture Method Location a River Km b Gill Net Angling c Set Line ES d Dive e All Methods No. % No. % No. % No. % No. % No. % HLK Eddy (1) (1) 11.7 Balfour Bay Kootenay Eddy 0.1K 10 (2) (2) 1.7 Kootenay River 1.6K Sandbar Eddy Genelle Eddy u/s Fort Shepherd Eddy (RUB) Fort Shepherd Eddy (1) (1) 1.7 d/s Fort Shepherd Eddy (LUB) Waneta Eddy (11) (4) (15) 35.7 Rock Eddy Keenleyside Reach Subtotal (15) (4) (19) 53.7 Deadman's Eddy to Northport Five-mile Creek area Northport Hole to Onion Creek Little Dalles (1) (1) 10.5 Marble to China Bend (2) (2) 10.1 North Gorge area (1) (1) 3.5 Bossburg to Marcus Island (1) (1) 6.8 Marcus Flats area Kettle Falls to Martin Creek Roosevelt Reach Subtotal (5) (5) 46.3 Combined Total (20) (4) (24) a See Figures 1.1 and 1.2 for sample locations; u/s = upstream; d/s = downstream; RUB = right upstream bank; LUB = left upstream bank. b River kilometres measured downstream from HLK. c The juvenile captured at Kootenay Eddy and one juvenile from Waneta Eddy were actually found wrapped on a VR2 and egg mat, respectively. Hooks were in the mouths of these fish and the attached fishing line was wrapped around the respective gear. d ES = boat electroshocking. e This fish was captured by a diver that grabbed it during a dive survey.
127 APPENDIX C LIFE HISTORY INFORMATION
128
129 Table C1 Life history information of juvenile white sturgeon captured in Includes fish captured during Phase 4 monitoring; juvenile sampling by the WDFW in October; the 2005 broodstock capture program; sampling by the Environmental Protection Agency, the Colv Release Information Capture Information Length (cm) Relative Pectoral Fin Deformity Details h Sample Sample Girth Weight PIT Tag No. at Fin Scutes PIT Tag No. Depth Weight Number Location a Date b Family c Location a Rkm a Date Meth d Site/ID Head Fork Total (cm) (m) e Snout Ray g Removed f Left Right (g) Cap. f Capture Applied (%) % Description % Description Comments i 387 Waneta/Beaver Cr 17-May Waneta Eddy Nov-05 AB AB L1, L Waneta/Beaver Cr 17-May Waneta Eddy Nov-05 AB AB L1, L both nares not divided 389 Beaver Creek 12-May Waneta Eddy Nov-05 AB AB L1, L Waneta/Beaver Cr 17-May Waneta Eddy Nov-05 AB AB L1, L Kootenay R. 14-May Waneta Eddy Nov-05 AB AB L1, L shrunken 40 shrunken 392 Beaver Creek 12-May Waneta Eddy Nov-05 AB AB L1, L shrunken missing left eye (looks like it was never there); moderate shortening of left opercle; also captured 18 Nov. 05 by GN54.9MR 393 Waneta/Beaver Cr 17-May Waneta Eddy Nov-05 AB AB L1, L shrunken 60 shrunken 394 unknown 2002 unknown Waneta Eddy Nov-05 AB AB L1, L3 not detected right outside barbel split 395 North Gorge 12-May Waneta Eddy Nov-05 AB AB L1, L severe split in left pec fin (old wound), notch out of lower caudal fin 396 Beaver Creek 20-May Waneta Eddy Nov-05 AB AB L1, L HLK Robson 20-May Waneta Eddy Nov-05 AB AB L1, L Waneta Eddy 20-Aug Waneta Eddy Nov-05 AB AB L2,4(L1,3) shrunken 40 shrunken scute removals looked more like L2, L4 399 Beaver Creek 4-May Waneta Eddy Nov-05 AB AB L1, L Waneta/Beaver Cr 17-May Waneta Eddy Nov-05 AB AB L1, L wavy blunt nose; also captured by GN54.9MR on 17 Nov 05 (4 splits in caudal fin; 1 in dorsal fin) 401 HLK Robson 20-May Waneta Eddy Nov-05 AB AB L1, L Kootenay R. 14-May Waneta Eddy Nov-05 AB AB L1, L Beaver Creek 12-May Waneta Eddy Nov-05 AB AB L1, L HLK 13-May Waneta Eddy Nov-05 AB AB L1, L curled left pec fin curled up Waneta Eddy 20-Aug Waneta Eddy Nov-05 AB AB L1, L HLK 4-May Waneta Eddy Nov-05 AB AB L1, L shrunken 407 Beaver Creek 12-May Waneta Eddy Nov-05 AB AB L1, L Beaver Creek 12-May Waneta Eddy Nov-05 AB AB L1, L shrunken 30 wavy L4 scute partially regrown 408 HLK Robson 20-May HLK Eddy Nov-05 GN 18.2 GN0.1MR L1, L fins red from stress (internal hemorrhaging); net marks below dorsal fin 409 HLK 4-May HLK Eddy Nov-05 GN 18.2 GN0.1MR L1, L shrunken 50 shrunken moderate shortening of left opercle (notch missing) 410 HLK 4-May HLK Eddy Nov-05 GN 18.2 GN0.1MR L1, L shrunken 70 shrunken 2 splits in dorsal fin from net; sonic tagged fish (1830) 411 Beaver Creek 20-May HLK Eddy Nov-05 GN 18.2 GN0.1MR L1, L slight shortening of left opercle; left gills slightly frayed; upper caudal fin frayed & red (internal hemorrhaging) from net 412 HLK 13-May HLK Eddy Nov-05 GN 18.2 GN0.1MR L1, L HLK Robson 10-Jul HLK Eddy Nov-05 GN 17.3 GN0.15M L1, L splits in caudal fin from net; left pelvic fin red from net 414 HLK 4-May Balfour Bay Nov-05 GN 21.5 GN2.4MR L1, L shrunken constriction mark from net on nose; split in caudal fin from net; fins slightly red (internal hemorrhaging) from net (stress) 415 Waneta/Beaver Cr 17-May Balfour Bay Nov-05 GN 14.3 GN2.5MR L1, L shrunken split in dorsal, caudal & right pelvic fin from net; fins red from stress; constriction mark behind left pectoral fin 416 Beaver Creek 12-May Kootenay Eddy 0.1K 8-Nov-05 GN 10.7 GN0.1ML-K L1, L shrunken 10 shrunken 1 ventral scute scraped off by net 417 Beaver Creek 20-May Kootenay Eddy 0.1K 8-Nov-05 GN 10.7 GN0.1ML-K L1, L shrunken caudal fin split from net 418 Beaver Creek 12-May Sandbar Eddy Nov-05 GN 10.2 GN21.0L L2,6(L1,4) shrunken scute removals were actually L2, L6; L2 partially regrown; split in caudal fin from net 419 HLK Robson 20-May Genelle Nov-05 GN 9.4 GN25.4ML L1, L wavy 90 shrunken several splits in dorsal & caudal fins from net; constriction mark on back above pectoral fins from net 420 HLK Robson 12-May Waneta Eddy Nov-05 GN 21.0 GN55.0MR L1, L wavy 40 wavy scutes partially regrown; moderate shortening of left opercle; 2 splits in caudal from net; belly red (internal hemorrhaging) from stress 421 Waneta Eddy 20-Aug Waneta Eddy Nov-05 GN 21.0 GN55.0MR L1,4(L1,3) shrunken scute removals should be L1, L3; 2 splits in caudal fin & 1 in dorsal fin from net 422 Kootenay R. 14-May Waneta Eddy Nov-05 GN 21.0 GN55.0MR L1, L shrunken constriction mark from net on nose; split in caudal fin from net 423 HLK Robson 20-May Waneta Eddy Nov-05 GN 21.0 GN55.0MR L1, L shrunken scute removals partially regrown; 2 splits in caudal fin from net 424 Waneta/Beaver Cr 17-May Waneta Eddy Nov-05 GN 21.0 GN55.0MR L1,4(L1,3) shrunken 90 shrunken L1 partially regrown; scute removals should be L1, L3; split in caudal fin from net 425 Beaver Creek 12-May Waneta Eddy Nov-05 GN 21.0 GN55.0MR L2,5(L1,4) shrunken scute removals should be L1, L4; extra row of small lateral scutes 426 Waneta/Beaver Cr 12-May Waneta Eddy Nov-05 GN 21.0 GN55.0MR L1, L constriction mark on nose & split in caudal fin from net 427 Beaver Creek 12-May Waneta Eddy Nov-05 GN 21.0 GN55.0MR L2,5(L1,4) shrunken scute removals should be L1, L4; 2 splits in caudal fin & 1 in left pectoral fin from net 428 Beaver Creek 12-May Waneta Eddy Nov-05 GN 21.0 GN55.0MR L1, L scute removals partially regrown; trailing edge of caudal fin red (internal hemorrhaging) from net 429 Beaver Creek 12-May Waneta Eddy Nov-05 GN 21.0 GN55.0MR L1, L split in dorsal fin from net 430 Beaver Creek 20-May Waneta Eddy Nov-05 GN 21.0 GN55.0MR L1, L shrunken split in caudal fin from net 431 HLK 15-May Waneta Eddy Nov-05 GN 21.0 GN55.0MR L3 (L1, L3) shrunken 432 Kootenay R. 14-May Waneta Eddy Nov-05 GN 21.0 GN55.0MR L1, L split in caudal fin from net 433 Waneta/Beaver Cr 17-May Waneta Eddy Nov-05 GN 21.0 GN55.0MR L1, L split in caudal fin & right pectoral fin from net; all fins red from stress 434 unknown 2002 unknown Waneta Eddy Nov-05 GN 21.0 GN55.0MR L1, L3 not detected splits in caudal fin from net; caudal & dorsal fins red; left pectoral fin slightly smaller than right, but treated as not deformed 435 HLK Robson 12-May Waneta Eddy Nov-05 GN 6.5 GN54.9R L1, L shrunken 60 shrunken L4 partially regrown 436 Beaver Creek 12-May Waneta Eddy Nov-05 GN 20.0 GN55.0MR L1, L shrunken 2 constriction marks on nose; left pelvic fin red (slight internal hemorrhaging) 437 HLK 13-May Waneta Eddy Nov-05 GN 20.0 GN55.0MR L1,6 (L1,5) unknown 2003 unknown Waneta Eddy Nov-05 GN 20.0 GN55.0MR L1, L4 not detected shrunken 80 shrunken 439 unknown unknown unknown Waneta Eddy Nov-05 GN 20.0 GN55.0MR L2,4 (L1,?) A 70 shrunken PIT not found in release data; split in dorsal fin from net Continued... a See Figures 1.1 and 1.2; river kilometres measured downstream from HLK (designations with a "K" indicate locations in the Kootenay River, measured upstream from the confluence with the Columbia River). "Unknown" indicates a PIT tag was not detected in the b Release dates that are only a year are based on scute removal patterns; "unknown" indicates a PIT tag was not detected in the fish or the PIT tag number was not found in the release data (and release year could not be determined by scute removals), theref c Numbers before dash indicate brood year, number after dash indicates family number (e.g., 01-3 = 2001 brood year, family 3). "Unknown" indicates a PIT tag was not detected in the fish or the PIT tag number was not found in the release data; therefore fami d Capture methods: AB = angling (with bait); GN = gill net; SSL = sturgeon set line. e Depth values for GN and SSL are the mean of the minimum and maximum set depths. f Marks at capture/scutes removed: letter indicates side of fish (i.e., L = left) and number indicates position (i.e., 1 = 1st scute behind head; 2 = 2nd scute behind head, etc.). Scute removals before brackets indicate those observed, removals in brackets g Left = left pectoral fin ray section taken; right = right pectoral fin ray section taken; both = left and right fin ray sections taken. Right fin rays were only taken if there was a problem with the left (i.e., deformed). h Percentages indicate the percent of normal fin size. i Blanks indicate data was not recorded or unavailable due to various issues. j See comments.
130 Table C1 Continued. Release Information Capture Information Length (cm) Relative Pectoral Fin Deformity Details h Sample Sample Girth Weight PIT Tag No. at Fin Scutes PIT Tag No. Depth Weight Number Site/ID (m) e Snout Head Fork Total (cm) (g) Cap. f Capture Ray g Removed f Left Right Location a Date b Family c Location a Rkm a Date Meth d Applied (%) % Description % Description Comments 440 Beaver Creek 20-May Waneta Eddy Nov-05 GN 20.0 GN55.0MR L1, L blunt nose; 2 splits in caudal fin & 1 in dorsal fin from net 79 Waneta/Beaver Cr 17-May Waneta Eddy Nov-05 GN 20.0 GN55.0MR L1, L shrunken 50 shrunken previously captured Oct. 2003; blunt nose; 2 splits in caudal fin & 1 in dorsal fin from net; fins red (internal hemorrhaging) from stress 441 Beaver Creek 10-Jul Waneta Eddy Nov-05 GN 20.0 GN55.0MR L1, L constriction mark behind pectoral fins from net 442 Beaver Creek 12-May Waneta Eddy Nov-05 GN 20.0 GN55.0MR L1, L shrunken moderate shortening of left opercle 443 Waneta/Beaver Cr 17-May Waneta Eddy Nov-05 GN 20.0 GN55.0MR L1, L shrunken blunt nose; 3 splits in caudal fin from net 444 HLK Robson 20-May Waneta Eddy Nov-05 GN 18.1 GN55.0M L1, L split in caudal fin from net 445 Waneta/Beaver Cr 17-May Waneta Eddy Nov-05 GN 18.1 GN55.0M L1, L curled 60 shrunken 2 splits in caudal fin; leading ray of left pec fin curled up & shortened (notch missing); barbels slightly red (internal hemorrhaging) 446 Beaver Creek 12-May Waneta Eddy Nov-05 GN 18.1 GN55.0M L1, L shrunken 60 shrunken split in caudal fin from net; all fins slightly red (internal hemorrhaging) from stress 447 Kootenay R. 14-May Waneta Eddy Nov-05 GN 18.1 GN55.0M L1, L splits in caudal fin from net 448 Beaver Creek 12-May Waneta Eddy Nov-05 GN 18.1 GN55.0M L1, L fins red (internal hemorrhaging) from stress; split in caudal fin; constriction mark behind 2nd dorsal scute 449 HLK 13-May Waneta Eddy Nov-05 GN 18.1 GN55.0M L1, L split in left pectoral fin; pelvic fins slightly wavy 450 Waneta/Beaver Cr 17-May Waneta Eddy Nov-05 GN 18.1 GN55.0M L1, L both nares not divided 451 Waneta/Beaver Cr 17-May Waneta Eddy Nov-05 GN 18.1 GN55.0M L1, L split in dorsal & caudal fins from net; slight hemorrhaging on ventral scutes near vent 452 Beaver Creek 4-May Waneta Eddy Nov-05 GN 18.1 GN55.0M L1, L constriction mark around middle; yellowish colouration on belly 453 Kootenay R. 14-May Waneta Eddy Nov-05 GN 18.1 GN55.0M L1, L split in caudal fin from net 454 Beaver Creek 10-Jul Waneta Eddy Nov-05 GN 13.1 GN54.9MR L1, L extra row of small lateral scutes 455 Beaver Creek 20-May Waneta Eddy Nov-05 GN 13.1 GN54.9MR j j L1, L upper caudal fin short; relative weight based on total length of 55.8 (fork length x 1.19); split in dorsal fin from net 456 Beaver Creek 12-May Waneta Eddy Nov-05 GN 13.1 GN54.9MR L1, L shrunken 10 shrunken constriction marks on nose; also captured 18 Nov. 05 by GN54.9M (constriction mark in front of pelvic fins); photo taken 18 Nov Beaver Creek 4-May Waneta Eddy Nov-05 GN 13.1 GN54.9MR L1, L shrunken 40 shrunken constriction mark on nose; pec fins not shrivelled, just small (miniature) 458 Waneta/Beaver Cr 12-May Waneta Eddy Nov-05 GN 13.1 GN54.9MR L1, L unknown 2005 unknown Waneta Eddy Nov-05 GN 13.1 GN54.9MR L1, L6 not detected splits in caudal fin from net; scanned for PIT tag repeatedly with 2 different readers 460 Waneta/Beaver Cr 17-May Waneta Eddy Nov-05 GN 13.1 GN54.9MR L1, L shrunken 80 shrunken L1 partially regrown; constriction mark behind 3rd dorsal scute; 1 complete split in caudal finfrom net 461 Beaver Creek 20-May Waneta Eddy Nov-05 GN 13.1 GN54.9MR L1, L constriction mark behind 3rd dorsal scute; 1 split in left pectoral fin; 2 splits in caudal fin 462 unknown 2004 unknown Waneta Eddy Nov-05 GN 13.1 GN54.9MR L1, L5 not detected shrunken 47 Beaver Creek 12-May Waneta Eddy Nov-05 GN 13.1 GN54.9MR L1, L shrunken previously captured Oct. 2003; split in caudal fin from net 463 Beaver Creek 12-May Waneta Eddy Nov-05 GN 13.1 GN54.9MR L1, L split in right pectoral fin, 1 in dorsal fin, 2 in caudal fin; internal hemorrhaging in caudal peduncle 464 Waneta/Beaver Cr 17-May Waneta Eddy Nov-05 GN 13.1 GN54.9MR , L4 (L1, L shrunken split in dorsal fin from net 465 Waneta/Beaver Cr 17-May Waneta Eddy Nov-05 GN 13.1 GN54.9MR L1, L internal hemorrhaging in pelvic fins 213 Beaver Creek 12-May Waneta Eddy Nov-05 GN 13.1 GN54.9MR L1, L previously captured Sep Beaver Creek 20-May Waneta Eddy Nov-05 GN 13.1 GN54.9MR L1, L shrunken previously captured Sep. 2004; extra row of very small lateral scutes 400 Waneta/Beaver Cr 17-May Waneta Eddy Nov-05 GN 13.1 GN54.9MR L1, L wavy previously captured on 2 Nov 05 by angling 466 Beaver Creek 4-May Waneta Eddy Nov-05 GN 16.2 GN54.9M L1, L caudal fin frayed from net 467 Waneta/Beaver Cr 12-May Waneta Eddy Nov-05 GN 16.2 GN54.9M L1, L split in caudal fin from net 468 Beaver Creek 4-May Waneta Eddy Nov-05 GN 16.2 GN54.9M L1, L split in dorsal fin from net 469 Kootenay R. 14-May Waneta Eddy Nov-05 GN 16.2 GN54.9M L1, L pelvic, anal, dorsal, & caudal fins, barbels & vent red from stress; 3 splits in caudal fin, 1 in dorsal, 1 in leading edge of upper caudal fin 470 Beaver Creek 12-May Waneta Eddy Nov-05 GN 16.2 GN54.9M L1, L shrunken moderate shortening of right opercle; moderate intenal hemorrhaging in left pelvic & anal fins; split in caudal & dorsal fins from net 471 HLK Robson 20-May Waneta Eddy Nov-05 GN 16.2 GN54.9M L1, L shrunken 1 split in dorsal & anal fins from net; 4 splits in caudal fin from net 472 Beaver Creek 12-May Waneta Eddy Nov-05 GN 16.2 GN54.9M L1, L split in caudal fin from net 473 Beaver Creek 12-May Waneta Eddy Nov-05 GN 16.2 GN54.9M L1, L constriction mark on nose; split in cuadal fin from net 474 Waneta/Beaver Cr 17-May Waneta Eddy Nov-05 GN 16.2 GN54.9M L1, L shrunken internal hemorrhaging in all fins but pectorals; 1 split in anal fin and dorsal fin from net; 2 splits in caudal fin from net 475 Waneta Eddy 20-Aug Waneta Eddy Nov-05 GN 16.2 GN54.9M L1, L both nares not divided; 3 splits in cuadal fin from net; 1 split in dorsal fin from net 476 Waneta/Beaver Cr 17-May Waneta Eddy Nov-05 GN 16.2 GN54.9M L1, L left nares not divided; constriction mark near left opercle; 1 split in caudal fin from net 477 Kootenay R. 14-May Waneta Eddy Nov-05 GN 17.1 GN55.0M L1, L shrunken 40 shrunken notch out of left opercle; 2 splits in dorsal fin & 2 in caudal fin from net 478 unknown 2003 unknown Waneta Eddy Nov-05 GN 17.1 GN55.0M L1, L4 not detected extra row of small lateral scutes; split in dorsal fin from net 479 Waneta Eddy 20-Aug Waneta Eddy Nov-05 GN 17.1 GN55.0M L1, L shrunken 25 shrunken constriction mark on nose; 3 splits in caudal fin & 1 in dorsal fin from net 480 Beaver Creek 12-May Waneta Eddy Nov-05 GN 17.1 GN55.0M L1, L Waneta/Beaver Cr 17-May Waneta Eddy Nov-05 GN 17.1 GN55.0M L1, L shrunken constriction mark on left opercle; split in dorsal fin from net 482 Waneta/Beaver Cr 17-May Waneta Eddy Nov-05 GN 17.1 GN55.0M L1, L shrunken internal hemorrhage in outside left barbel; 1 split in dorsal fin & caudal fin from net 483 Beaver Creek 20-May Waneta Eddy Nov-05 GN 17.1 GN54.9M L1, L split in dorsal fin & 1 in caudal fin from net 484 Beaver Creek 10-Jul Waneta Eddy Nov-05 GN 17.1 GN54.9M L1, L split in dorsal fin from net 485 Waneta/Beaver Cr 12-May Waneta Eddy Nov-05 GN 17.1 GN54.9M L1, L curled constriction mark on nose; left pectoral fin curled down 486 HLK Robson 12-May Waneta Eddy Nov-05 GN 17.1 GN54.9M L1, L split in caudal fin from net 57 Waneta Eddy 20-Aug Waneta Eddy Nov-05 GN 17.1 GN54.9M L1, L shrunken previously captured Oct. 2003; right nares not divided; 2 minor cuts just behind mouth (hook wounds?); split in caudal fin 456 Beaver Creek 12-May Waneta Eddy Nov-05 GN 17.1 GN54.9M L1, L shrunken 10 shrunken previously captured on 17 Nov 05 by GN54.9MR Continued... a See Figures 1.1 and 1.2; river kilometres measured downstream from HLK (designations with a "K" indicate locations in the Kootenay River, measured upstream from the confluence with the Columbia River). "Unknown" indicates a PIT tag was not detected in the b Release dates that are only a year are based on scute removal patterns; "unknown" indicates a PIT tag was not detected in the fish or the PIT tag number was not found in the release data (and release year could not be determined by scute removals), theref c Numbers before dash indicate brood year, number after dash indicates family number (e.g., 01-3 = 2001 brood year, family 3). "Unknown" indicates a PIT tag was not detected in the fish or the PIT tag number was not found in the release data; therefore fami d Capture methods: AB = angling (with bait); GN = gill net; SSL = sturgeon set line. e Depth values for GN and SSL are the mean of the minimum and maximum set depths. f Marks at capture/scutes removed: letter indicates side of fish (i.e., L = left) and number indicates position (i.e., 1 = 1st scute behind head; 2 = 2nd scute behind head, etc.). Scute removals before brackets indicate those observed, removals in brackets g Left = left pectoral fin ray section taken; right = right pectoral fin ray section taken; both = left and right fin ray sections taken. Right fin rays were only taken if there was a problem with the left (i.e., deformed). h Percentages indicate the percent of normal fin size. i Blanks indicate data was not recorded or unavailable due to various issues. j See comments.
131 Table C1 Continued. Release Information Capture Information Length (cm) Relative Pectoral Fin Deformity Details h Sample Sample Girth Weight PIT Tag No. at Fin Scutes PIT Tag No. Depth Weight Number Site/ID (cm) (g) Cap. f Capture Ray g Removed f Left Right Location a Date b Family c Location a Rkm a Date Meth d Applied (m) e Snout Head Fork Total (%) % Description % Description Comments 392 Beaver Creek 12-May Waneta Eddy Nov-05 GN 13.3 GN54.9MR L1, L shrunken previously captured on 2 Nov 05 by angling, missing left eye; moderate shortening of left opercle 276 Beaver Creek 12-May Waneta Eddy Nov-05 GN 13.3 GN54.9MR L1, L shrunken 60 shrunken previously captured Nov. 2004; right nares not divided; constriction mark on nose; split caudal fin from net 487 Waneta/Beaver Cr 17-May Waneta Eddy Nov-05 GN 13.3 GN54.9MR L1, L slightly wavy 100 slightly wavy 3 splits & internal hemorrhaging in caudal fin from net; pectoral fins slightly wavy, but not considered deformed 217 unknown 2003 unknown Waneta Eddy Nov-05 GN 16.0 GN55.0MR L1, L shrunken 35 shrunken previously captured Sep. 2004; PIT tag # was not found in release data 488 Waneta/Beaver Cr 17-May Waneta Eddy Nov-05 GN 16.0 GN55.0MR L2,4 (L1,3) both nares not divided; constriction mark on nose; right pec fin slightly smaller than left (not considered a deformity) 489 Beaver Creek 12-May Waneta Eddy Nov-05 GN 16.0 GN55.0MR L1, L blunt nose; split in caudal fin from net 490 HLK 4-May Waneta Eddy Nov-05 GN 16.0 GN55.0MR L1, L long, pointy snout; constriction mark on nose 491 Beaver Creek 20-May Waneta Eddy Nov-05 GN 16.0 GN55.0MR L1, L shrunken extra row of small lateral scutes; split in right pectoral fin from net 492 Waneta/Beaver Cr 17-May Waneta Eddy Nov-05 GN 16.0 GN55.0MR L1, L constriction mark on right opercle; 1 split in caudal fin from net 493 North Gorge 12-May Waneta Eddy Nov-05 GN 16.0 GN55.0MR L1, L blunt nose; 2 splits in caudal fin from net; internal hemorrhaging in pelvic fins 494 Beaver Creek 12-May Waneta Eddy Nov-05 GN 16.0 GN55.0MR L1, L constriction mark on back; 2 splits in caudal fin from net; minor internal hemorrhaging in dorsal, pelvic, anal & caudal fins 495 unknown 2003 unknown Waneta Eddy Nov-05 GN 16.0 GN55.0MR L1, L4 not detected constriction mark on back; 2 splits in caudal, 1 in anal fin from net; minor internal hemorrhaging in pelvic, anal & caudal fins 496 Waneta/Beaver Cr 12-May Waneta Eddy Nov-05 GN 16.0 GN55.0MR L1, L pelvic fins very slightly wavy 497 Kettle Falls 12-May Waneta Eddy Nov-05 GN 16.0 GN55.0MR L1, L shrunken 80 shrunken constriction mark on nose; 1 split in caudal fin & each pectoral fin from net 498 Beaver Creek 4-May Waneta Eddy Nov-05 GN 16.0 GN55.0MR L1, L curled right pectoral fin curled up near tip (not considered deformity) 499 Kootenay R. 14-May Waneta Eddy Nov-05 GN 16.0 GN55.0MR L1, L left pelvic fin wavy; 4 splits in caudal fin from net; constriction mark above left pelvic fin 500 Kootenay R. 14-May upstream of Martin Creek Oct-05 GN L1, L captured by WDFW 501 Kettle Falls 12-May Nancy Cr/Marcus Flats Oct-05 GN L1, L captured by WDFW 502 Waneta/Beaver Cr 12-May Kettle Falls Oct-05 GN L1, L captured by WDFW 503 Nancy Cr/Marcus 24-Feb Kettle Falls Oct-05 GN L1, L captured by WDFW 504 Nancy Cr/Marcus 24-Feb Kettle Falls Oct-05 GN L1, L captured by WDFW 505 Sherman Creek 7-Jul Kettle Falls Oct-05 GN L1, L captured by WDFW 506 Nancy Cr/Marcus 24-Feb Kettle Falls Oct-05 GN L1, L captured by WDFW 507 Nancy Cr/Marcus 24-Feb Nancy Cr/Marcus Flats Oct-05 GN L1, L captured by WDFW 508 Nancy Cr/Marcus 24-Feb Nancy Cr/Marcus Flats Oct-05 GN L1, L captured by WDFW 509 Nancy Cr/Marcus 24-Feb Marcus Flats Oct-05 GN L1, L captured by WDFW 510 Nancy Cr/Marcus 24-Feb Marcus Flats Oct-05 GN L1, L captured by WDFW 511 Nancy Cr/Marcus 24-Feb Marcus Flats Oct-05 GN L1, L captured by WDFW 512 Nancy Cr/Marcus 24-Feb Marcus Flats Oct-05 GN L1, L captured by WDFW 513 Nancy Cr/Marcus 24-Feb Marcus Flats Oct-05 GN L1, L captured by WDFW 514 Kettle Falls 12-May Marcus Flats Oct-05 GN L1, L captured by WDFW 515 Kettle Falls 12-May Marcus Flats Oct-05 GN L1, L captured by WDFW 516 Waneta/Beaver Cr 17-May Marcus Flats Oct-05 GN L1, L captured by WDFW 517 Kootenay R. 14-May Marcus Flats Oct-05 GN L1, L captured by WDFW 518 Waneta/Beaver Cr 17-May Marcus Flats Oct-05 GN L1, L captured by WDFW 519 Waneta/Beaver Cr 17-May Marcus Flats Oct-05 GN L1, L captured by WDFW 520 Kettle Falls 12-May Marcus Flats Oct-05 GN L1, L captured by WDFW 521 HLK 15-May Marcus Flats Oct-05 GN L1, L captured by WDFW 522 wild fish wild wild Marcus Flats Oct-05 GN none none left L captured by WDFW; wild fish 523 Waneta/Beaver Cr 17-May Marcus Flats Oct-05 GN L1, L <50 deformed captured by WDFW; nature of left pectoral fin deformity not described 524 HLK 15-May Marcus Flats Oct-05 GN L1, L <50 deformed <50 deformed captured by WDFW; nature of pectoral fin deformities not described 525 wild fish wild wild Marcus Flats Oct-05 GN none none both captured by WDFW; mortality - stomach sample taken 526 Nancy Cr/Marcus 11-May Marcus Flats Oct-05 GN L1, L captured by WDFW 527 HLK 4-May Marcus Flats Oct-05 GN L1, L captured by WDFW 528 Waneta/Beaver Cr 17-May Marcus Flats Oct-05 GN L1, L <50 deformed captured by WDFW; nature of left pectoral fin deformity not described 529 Nancy Cr/Marcus 24-Feb Marcus Flats Oct-05 GN L1, L captured by WDFW 530 Nancy Cr/Marcus 24-Feb Marcus Island Oct-05 GN none (L1,6) captured by WDFW; scute removals not recorded (should have been L1, L6) 531 Nancy Cr/Marcus 24-Feb Marcus Island Oct-05 GN L1, L captured by WDFW 532 Nancy Cr/Marcus 24-Feb Marcus Island Oct-05 GN L1, L captured by WDFW 533 Nancy Cr/Marcus 24-Feb Marcus Island Oct-05 GN L1, L captured by WDFW 534 Sherman Creek 7-Jul Marcus Island Oct-05 GN L1, L captured by WDFW 535 Nancy Cr/Marcus 24-Feb Seven Devils area Oct-05 GN L1, L captured by WDFW 536 Waneta/Beaver Cr 17-May Marcus Flats Oct-05 GN L1, L captured by WDFW; mortality - stomach sample taken 537 Waneta/Beaver Cr 17-May Marcus Flats Oct-05 GN L1, L captured by WDFW Continued... a See Figures 1.1 and 1.2; river kilometres measured downstream from HLK (designations with a "K" indicate locations in the Kootenay River, measured upstream from the confluence with the Columbia River). "Unknown" indicates a PIT tag was not detected in the b Release dates that are only a year are based on scute removal patterns; "unknown" indicates a PIT tag was not detected in the fish or the PIT tag number was not found in the release data (and release year could not be determined by scute removals), theref c Numbers before dash indicate brood year, number after dash indicates family number (e.g., 01-3 = 2001 brood year, family 3). "Unknown" indicates a PIT tag was not detected in the fish or the PIT tag number was not found in the release data; therefore fami d Capture methods: AB = angling (with bait); GN = gill net; SSL = sturgeon set line. e Depth values for GN and SSL are the mean of the minimum and maximum set depths. f Marks at capture/scutes removed: letter indicates side of fish (i.e., L = left) and number indicates position (i.e., 1 = 1st scute behind head; 2 = 2nd scute behind head, etc.). Scute removals before brackets indicate those observed, removals in brackets g Left = left pectoral fin ray section taken; right = right pectoral fin ray section taken; both = left and right fin ray sections taken. Right fin rays were only taken if there was a problem with the left (i.e., deformed). h Percentages indicate the percent of normal fin size. i Blanks indicate data was not recorded or unavailable due to various issues. j See comments.
132 Table C1 Continued. Release Information Capture Information Length (cm) Relative Pectoral Fin Deformity Details h Sample Sample Girth Weight PIT Tag No. at Fin Scutes PIT Tag No. Depth Weight Number Site/ID (cm) (g) Cap. f Capture Ray g Removed f Left Right Location a Date b Family c Location a Rkm a Date Meth d Applied (m) e Snout Head Fork Total (%) % Description % Description Comments 538 Kettle Falls 12-May Marcus Flats Oct-05 GN L1, L Beaver Creek 12-May Marcus Flats Oct-05 GN L1, L <50 deformed nature of left pectoral fin deformity not described; opercle deformed (not described) 540 unknown 2002 unknown Marcus Flats Oct-05 GN L2,4 (L1,3) not detected PIT tag not detected, assumed to be hatchery fish (2001 brood) based on scute removals 541 Kettle Falls 12-May Marcus Flats Oct-05 GN L1, L deformed tail - not described 542 Nancy Cr/Marcus 11-May Marcus Flats Oct-05 GN L5 (L1, L6) unknown 2002 unknown Marcus Island Oct-05 GN L1, L <50 deformed not found in release data; nature of left pectoral fin deformity not described 544 HLK 13-May Seven Devils area Oct-05 GN L1,4 (L1,5) Kettle Falls 12-May Seven Devils area Oct-05 GN L1, L North Gorge 12-May d/s Snag Cove Oct-05 GN L1, L <50 deformed nature of right pectoral fin deformity not described 547 Waneta/Beaver Cr 17-May u/s Snag Cove Oct-05 GN L1, L <50 deformed nature of right pectoral fin deformity not described 548 Kettle Falls 12-May u/s Snag Cove Oct-05 GN L1, L Nancy Cr/Marcus 11-May u/s Snag Cove Oct-05 GN L1, L HLK 4-May Evans area Oct-05 GN L1, L <50 deformed nature of right pectoral fin deformity not described 551 Waneta/Beaver Cr 17-May Bossburg area Oct-05 GN L1,4 (L1,3) Waneta/Beaver Cr 17-May d/s North Gorge Oct-05 GN L1, L Waneta/Beaver Cr 17-May d/s North Gorge Oct-05 GN L1, L <50 deformed nature of right pectoral fin deformity not described 554 Waneta/Beaver Cr 17-May North Gorge Oct-05 GN L1, L <50 deformed nature of left pectoral fin deformity not described 555 Kootenay R. 14-May North Gorge Oct-05 GN L1, L Waneta/Beaver Cr 17-May North Gorge Oct-05 GN L1, L Waneta/Beaver Cr 17-May North Gorge Oct-05 GN L1, L Waneta/Beaver Cr 17-May North Gorge Oct-05 GN L1, L <50 deformed nature of left pectoral fin deformity not described 559 Kettle Falls 12-May North Gorge Oct-05 GN L1, L Beaver Creek 10-Jul North Gorge Oct-05 GN L1, L North Gorge 12-May North Gorge Oct-05 GN L1, L <50 deformed nature of right pectoral fin deformity not described 562 Beaver Creek 4-May North Gorge Oct-05 GN L1, L Beaver Creek 4-May North Gorge Oct-05 GN L1, L Beaver Creek 4-May North Gorge Oct-05 GN L1, L mortality - stomach sample taken 565 Sherman Creek 7-Jul Seven Devils area Oct-05 GN L1, L North Gorge 12-May Snag Cove area Oct-05 GN L1, L <50 deformed nature of left pectoral fin deformity not described 567 North Gorge 12-May Snag Cove area Oct-05 GN L1, L Kettle Falls 12-May Snag Cove area Oct-05 GN L1, L previously captured 20 Oct. 04 in same general area 568 North Gorge 24-Feb Snag Cove area Oct-05 GN L1, L Nancy Cr/Marcus 11-May Snag Cove area Oct-05 GN L1, L North Gorge 12-May Bossburg area Oct-05 GN L1, L Kettle Falls 12-May Bossburg area Oct-05 GN L1, L deformed opercle (not described) 572 North Gorge 12-May d/s North Gorge Oct-05 GN L1, L deformed tail (not described) 573 Kootenay R. 14-May d/s North Gorge Oct-05 GN L1, L North Gorge 12-May u/s Seven Devils Oct-05 GN L1, L <50 deformed nature of right pectoral fin deformity not described 575 Kettle Falls 12-May u/s Seven Devils Oct-05 GN L1, L unknown 2004 unknown u/s Seven Devils Oct-05 GN L1, L <50 deformed <50 deformed not found in release data; nature of pectoral fin deformities not described; deformed opercle (not described) 577 Waneta/Beaver Cr 17-May North Gorge area Oct-05 GN L1, L <50 deformed nature of right pectoral fin deformity not described 578 Kootenay R. 14-May North Gorge area Oct-05 GN L1, L North Gorge 12-May North Gorge area Oct-05 GN L1,6 (L1,5) Beaver Creek 4-May North Gorge area Oct-05 GN L1, L <50 deformed nature of left pectoral fin deformity not described 581 unknown 2002 unknown China Bend area Oct-05 GN L1, L3 not detected <50 deformed PIT tag not detected; 2001 brood based on scute removals (but fish seems a little small) left pectoral fin deformity not described 582 Beaver Creek 4-May China Bend area Oct-05 GN L1, L <50 deformed nature of right pectoral fin deformity not described 583 Beaver Creek 4-May China Bend area Oct-05 GN L1, L HLK 4-May China Bend area Oct-05 GN L1, L Beaver Creek 4-May China Bend area Oct-05 GN L1, L Nancy Cr/Marcus 11-May China Bend area Oct-05 GN L1, L Waneta/Beaver Cr 12-May China Bend area Oct-05 GN L1, L North Gorge 12-May China Bend area Oct-05 GN L1, L North Gorge 11-May China Bend area Oct-05 GN L1, L HLK 4-May China Bend area Oct-05 GN L1, L Continued... a See Figures 1.1 and 1.2; river kilometres measured downstream from HLK (designations with a "K" indicate locations in the Kootenay River, measured upstream from the confluence with the Columbia River). "Unknown" indicates a PIT tag was not detected in the b Release dates that are only a year are based on scute removal patterns; "unknown" indicates a PIT tag was not detected in the fish or the PIT tag number was not found in the release data (and release year could not be determined by scute removals), theref c Numbers before dash indicate brood year, number after dash indicates family number (e.g., 01-3 = 2001 brood year, family 3). "Unknown" indicates a PIT tag was not detected in the fish or the PIT tag number was not found in the release data; therefore fami d Capture methods: AB = angling (with bait); GN = gill net; SSL = sturgeon set line. e Depth values for GN and SSL are the mean of the minimum and maximum set depths. f Marks at capture/scutes removed: letter indicates side of fish (i.e., L = left) and number indicates position (i.e., 1 = 1st scute behind head; 2 = 2nd scute behind head, etc.). Scute removals before brackets indicate those observed, removals in brackets g Left = left pectoral fin ray section taken; right = right pectoral fin ray section taken; both = left and right fin ray sections taken. Right fin rays were only taken if there was a problem with the left (i.e., deformed). h Percentages indicate the percent of normal fin size. i Blanks indicate data was not recorded or unavailable due to various issues. j See comments.
133 Table C1 Continued. Release Information Capture Information Length (cm) Relative Pectoral Fin Deformity Details h Sample Sample Girth Weight PIT Tag No. at Fin Scutes PIT Tag No. Depth Weight Number Location a Date b Family c Location a Rkm a Date Meth d Site/ID (m) e Snout Head Fork Total (cm) (g) Cap. f Ray g Removed f Left Right Capture Applied (%) % Description % Description Comments 591 Nancy Cr/Marcus 11-May China Bend area Oct-05 GN L1, L Beaver Creek 12-May China Bend area Oct-05 GN L1, L <50 deformed nature of right pectoral fin deformity not described 593 North Gorge 11-May China Bend area Oct-05 GN L1, L Waneta/Beaver Cr 17-May China Bend area Oct-05 GN L1, L Waneta/Beaver Cr 17-May China Bend Oct-05 GN L1, L Waneta/Beaver Cr 17-May China Bend Oct-05 GN L1, L <50 deformed <50 deformed nature of pectoral fin deformities not described 597 wild fish wild wild China Bend Oct-05 GN none none left L wild fish 598 Waneta/Beaver Cr 12-May China Bend Oct-05 GN L1, L HLK 4-May China Bend Oct-05 GN L1, L Beaver Creek 4-May China Bend Oct-05 GN L1, L mortality - stomach sample taken 601 Kootenay R. 14-May China Bend Oct-05 GN L1, L North Gorge 12-May China Bend Oct-05 GN L1, L HLK 15-May China Bend Oct-05 GN L1, L Waneta/Beaver Cr 17-May China Bend Oct-05 GN L1, L Beaver Creek 4-May China Bend Oct-05 GN L1, L HLK 4-May China Bend area Oct-05 GN L1, L mortality - stomach sample taken 607 Waneta/Beaver Cr 17-May China Bend area Oct-05 GN L1, L Kettle Falls 12-May China Bend area Oct-05 GN L1, L <50 deformed nature of left pectoral fin deformity not described 609 Beaver Creek 4-May China Bend area Oct-05 GN L1, L Beaver Creek 4-May China Bend area Oct-05 GN L1, L tail deformed (not described) 611 Beaver Creek 4-May China Bend area Oct-05 GN L1, L <50 deformed nature of left pectoral fin deformity not described 612 HLK 4-May China Bend area Oct-05 GN L1, L Kootenay R. 14-May China Bend area Oct-05 GN L1, L Nancy Cr/Marcus 11-May Marble Oct-05 GN L1, L <50 deformed nature of left pectoral fin deformity not described 615 Beaver Creek 4-May Marble Oct-05 GN L1, L <50 deformed nature of right pectoral fin deformity not described 616 HLK 13-May Marble Oct-05 GN L1,6 (L1,5) Kootenay R. 14-May Little Dalles Oct-05 GN L1, L Waneta/Beaver Cr 17-May Little Dalles Oct-05 GN L1, L Kettle Falls 12-May Little Dalles Oct-05 GN L1, L unknown 2004 unknown Little Dalles Oct-05 GN L1, L5 not detected <50 deformed <50 deformed PIT tag not detected in fish at capture; nature of pectoral fin deformities not described 621 Beaver Creek 12-May Little Dalles Oct-05 GN L1, L <50 deformed nature of left pectoral fin deformity not described 622 Beaver Creek 20-May Little Dalles Oct-05 GN L1, L HLK Robson 20-May Little Dalles Oct-05 GN L1, L Beaver Creek 12-May Little Dalles Oct-05 GN L1, L Beaver Creek 20-May Little Dalles Oct-05 GN L1, L <50 deformed nature of right pectoral fin deformity not described 626 Waneta/Beaver Cr 12-May Little Dalles Oct-05 GN L1, L <50 deformed nature of right pectoral fin deformity not described 627 Waneta/Beaver Cr 12-May Little Dalles Oct-05 GN L1, L <50 deformed nature of right pectoral fin deformity not described 628 Northport 12-May Little Dalles Oct-05 GN L1, L Beaver Creek 12-May Little Dalles Oct-05 GN L1, L HLK Robson 20-May Little Dalles Oct-05 GN L1, L <50 deformed nature of right pectoral fin deformity not described 631 HLK Robson 12-May Little Dalles Oct-05 GN L1, L Beaver Creek 4-May Little Dalles Oct-05 GN L1, L Waneta/Beaver Cr 17-May Little Dalles Oct-05 GN L1, L Waneta/Beaver Cr 17-May Little Dalles Oct-05 GN L1, L Kootenay R. 14-May Little Dalles Oct-05 GN L1, L Kootenay R. 14-May Little Dalles Oct-05 GN L1, L Kootenay R. 14-May Little Dalles Oct-05 GN L1, L Waneta/Beaver Cr 17-May Little Dalles Oct-05 GN L1, L HLK Robson 20-May Little Dalles Oct-05 GN L1, L HLK 15-May Little Dalles Oct-05 GN L1, L HLK 15-May Little Dalles Oct-05 GN L1, L Waneta/Beaver Cr 17-May Little Dalles Oct-05 GN L1, L <50 deformed nature of right pectoral fin deformity not described 643 Waneta/Beaver Cr 17-May Little Dalles Oct-05 GN L1, L HLK 15-May Little Dalles Oct-05 GN L1, L <50 deformed nature of right pectoral fin deformity not described a See Figures 1.1 and 1.2; river kilometres measured downstream from HLK (designations with a "K" indicate locations in the Kootenay River, measured upstream from the confluence with the Columbia River). "Unknown" indicates a PIT tag was not detected in the Continued... b Release dates that are only a year are based on scute removal patterns; "unknown" indicates a PIT tag was not detected in the fish or the PIT tag number was not found in the release data (and release year could not be determined by scute removals), theref c Numbers before dash indicate brood year, number after dash indicates family number (e.g., 01-3 = 2001 brood year, family 3). "Unknown" indicates a PIT tag was not detected in the fish or the PIT tag number was not found in the release data; therefore fami d Capture methods: AB = angling (with bait); GN = gill net; SSL = sturgeon set line. e Depth values for GN and SSL are the mean of the minimum and maximum set depths. f Marks at capture/scutes removed: letter indicates side of fish (i.e., L = left) and number indicates position (i.e., 1 = 1st scute behind head; 2 = 2nd scute behind head, etc.). Scute removals before brackets indicate those observed, removals in brackets g Left = left pectoral fin ray section taken; right = right pectoral fin ray section taken; both = left and right fin ray sections taken. Right fin rays were only taken if there was a problem with the left (i.e., deformed). h Percentages indicate the percent of normal fin size. i Blanks indicate data was not recorded or unavailable due to various issues. j See comments.
134 Table C1 Continued. Release Information Capture Information Length (cm) Relative Pectoral Fin Deformity Details h Sample Sample Girth Weight PIT Tag No. at Fin Scutes PIT Tag No. Depth Weight Number Site/ID (m) e Snout Head Fork Total (cm) (g) Cap. f Capture Ray g Removed f Left Right Location a Date b Family c Location a Rkm a Date Meth d Applied (%) % Description % Description Comments 645 Kootenay R. 14-May Little Dalles Oct-05 GN L1, L Kootenay R. 14-May Little Dalles Oct-05 GN L1, L unknown 2003 unknown Little Dalles Oct-05 GN L1, L <50 deformed not found in release data; 2002 brood based on scute removals; nature of left pectoral fin deformity not described 648 unknown 2003 unknown Little Dalles Oct-05 GN L1, L4 not detected PIT tag not detected; 2001 brood based on scute removals 649 Waneta/Beaver Cr 17-May Little Dalles Oct-05 GN L1, L <50 deformed nature of right pectoral fin deformity not described 650 Beaver Creek 12-May Little Dalles Oct-05 GN L1, L HLK 15-May Little Dalles Oct-05 GN L1, L Waneta/Beaver Cr 17-May Little Dalles Oct-05 GN L1, L Beaver Creek 12-May Little Dalles Oct-05 GN L1, L Beaver Creek 12-May Little Dalles Oct-05 GN L1, L Kettle Falls 12-May Little Dalles Oct-05 GN L1, L Waneta/Beaver Cr 12-May Little Dalles Oct-05 GN L1, L North Gorge 12-May Little Dalles Oct-05 GN L1, L HLK 4-May Little Dalles Oct-05 GN L1, L HLK 4-May Little Dalles Oct-05 GN L1, L Kootenay R. 14-May Little Dalles Oct-05 GN L1, L Beaver Creek 12-May Little Dalles Oct-05 GN L1, L Kootenay R. 14-May Little Dalles Oct-05 GN L1, L <50 deformed nature of left pectoral fin deformity not described 663 Kootenay R. 14-May Little Dalles Oct-05 GN L1, L <50 deformed nature of left pectoral fin deformity not described 664 Beaver Creek 12-May Little Dalles Oct-05 GN L1, L HLK Robson 20-May Little Dalles Oct-05 GN L1, L <50 deformed nature of left pectoral fin deformity not described 552 Waneta/Beaver Cr 17-May Little Dalles Oct-05 GN L1, L previously captured 19 Oct. 05 (Sample ID 99, RKm 98.2) 666 Northport 11-May Little Dalles Oct-05 GN L1, L Waneta/Beaver Cr 12-May Little Dalles Oct-05 GN L1, L Beaver Creek 4-May Little Dalles Oct-05 GN L1, L <50 deformed nature of left pectoral fin deformity not described 669 Beaver Creek 4-May Little Dalles Oct-05 GN L1, L Beaver Creek 4-May Little Dalles Oct-05 GN L1, L HLK Robson 20-May Onion Creek area Oct-05 GN L3 (L1, L4) <50 deformed nature of left pectoral fin deformity not described 672 Beaver Creek 12-May Onion Creek area Oct-05 GN L1, L deformed tail (not described) 673 Kettle Falls 12-May Onion Creek area Oct-05 GN L1, L Waneta/Beaver Cr 12-May Onion Creek area Oct-05 GN L1, L Beaver Creek 12-May d/s Northport Hole Oct-05 GN L1, L Kettle Falls 12-May d/s Northport Hole Oct-05 GN L1, L Waneta/Beaver Cr 12-May d/s Northport Hole Oct-05 GN L1, L <50 deformed nature of left pectoral fin deformity not described 678 Kettle Falls 12-May d/s Northport Hole Oct-05 GN L1, L Waneta/Beaver Cr 12-May d/s Northport Hole Oct-05 GN L1, L HLK Robson 12-May d/s Northport Hole Oct-05 GN L1, L Kettle Falls 12-May Five-mile Creek area Oct-05 GN L1, L Kettle Falls 12-May Five-mile Creek area Oct-05 GN L1, L Kootenay R. 14-May Five-mile Creek area Oct-05 GN L1, L <50 deformed nature of right pectoral fin deformity not described 684 Kootenay R. 14-May Five-mile Creek area Oct-05 GN L1, L North Gorge 12-May Five-mile Creek area Oct-05 GN L1, L North Gorge 12-May Five-mile Creek area Oct-05 GN L1, L <50 deformed nature of left pectoral fin deformity not described 687 Kettle Falls 12-May Five-mile Creek area Oct-05 GN L1, L unknown 2004 unknown Five-mile Creek area Oct-05 GN L1, L5 not detected PIT tag not detected at capture; 2003 brood based on scute removals 689 HLK Robson 12-May Five-mile Creek area Oct-05 GN L1, L Kettle Falls 12-May Five-mile Creek area Oct-05 GN L1, L North Gorge 12-May Five-mile Creek area Oct-05 GN L1, L North Gorge 11-May Five-mile Creek area Oct-05 GN L1, L North Gorge 12-May Five-mile Creek area Oct-05 GN L1, L <50 deformed nature of right pectoral fin deformity not described 694 Northport 12-May Five-mile Creek area Oct-05 GN L1, L Northport 11-May Five-mile Creek area Oct-05 GN L1, L HLK 13-May Five-mile Creek area Oct-05 GN L1, L North Gorge 12-May Five-mile Creek area Oct-05 GN L1, L a See Figures 1.1 and 1.2; river kilometres measured downstream from HLK (designations with a "K" indicate locations in the Kootenay River, measured upstream from the confluence with the Columbia River). "Unknown" indicates a PIT tag was not detected in the Continued... b Release dates that are only a year are based on scute removal patterns; "unknown" indicates a PIT tag was not detected in the fish or the PIT tag number was not found in the release data (and release year could not be determined by scute removals), theref c Numbers before dash indicate brood year, number after dash indicates family number (e.g., 01-3 = 2001 brood year, family 3). "Unknown" indicates a PIT tag was not detected in the fish or the PIT tag number was not found in the release data; therefore fami d Capture methods: AB = angling (with bait); GN = gill net; SSL = sturgeon set line. e Depth values for GN and SSL are the mean of the minimum and maximum set depths. f Marks at capture/scutes removed: letter indicates side of fish (i.e., L = left) and number indicates position (i.e., 1 = 1st scute behind head; 2 = 2nd scute behind head, etc.). Scute removals before brackets indicate those observed, removals in brackets g Left = left pectoral fin ray section taken; right = right pectoral fin ray section taken; both = left and right fin ray sections taken. Right fin rays were only taken if there was a problem with the left (i.e., deformed). h Percentages indicate the percent of normal fin size. i Blanks indicate data was not recorded or unavailable due to various issues. j See comments.
135 Table C1 Continued. Release Information Capture Information Length (cm) Relative Pectoral Fin Deformity Details h Sample Sample Girth Weight PIT Tag No. at Fin Scutes PIT Tag No. Depth Weight Number Site/ID (cm) (g) Cap. f Capture Ray g Removed f Left Right Location a Date b Family c Location a Rkm a Date Meth d Applied (m) e Snout Head Fork Total (%) % Description % Description Comments 698 HLK 13-May Five-mile Creek area Oct-05 GN L1, L North Gorge 12-May Northport area Oct-05 GN L1,4 (L1,5) Waneta/Beaver Cr 12-May Northport area Oct-05 GN L1, L HLK Robson 20-May Northport area Oct-05 GN L1, L Beaver Creek 12-May Northport area Oct-05 GN L1, L unknown 2004 unknown Northport area Oct-05 GN L1, L5 not detected PIT not detected at capture; 2003 brood based on scute removals 704 Northport 24-Feb Northport area Oct-05 GN L1, L Beaver Creek 4-May Northport area Oct-05 GN L1, L mortality - stomach sample taken 706 Waneta/Beaver Cr 17-May Deadman's Eddy Oct-05 GN L1, L Kettle Falls 12-May Deadman's Eddy Oct-05 GN L1, L Kettle Falls 12-May Deadman's Eddy Oct-05 GN L1, L Northport 24-Feb Deadman's Eddy Oct-05 GN L1, L Waneta/Beaver Cr 17-May Waneta Eddy Jun-05 AB AB56.0R L1, L Kootenay R. 14-May Waneta Eddy Jun-05 AB AB56.0R L1, L Kootenay R. 14-May Fort Shepherd Eddy Jun-05 AB AB52.3L L1, L HLK Robson 20-May Waneta Eddy Jun-05 AB AB56.0R L1, L Beaver Creek 12-May Waneta Eddy Jun-05 AB AB56.0R L1, L HLK j 4-May-05 j 04-4 j Fort Shepherd Eddy Jun-05 AB AB52.3L 66.0 j 2000 j L1,3 (L1,6) j j PIT # was found in the 04 brood release data, but scute removals (& size) indicate 01 brood. Therefore, the release data may be false. 494 Beaver Creek 12-May Waneta Eddy Jun-05 AB AB56.0R L1, L also captured 18 Nov 05 by GN in Waneta Eddy 716 Beaver Creek 10-Jul Waneta Eddy Jun-05 AB AB56.0R L1, L Waneta/Beaver Cr 17-May Waneta Eddy Jun-05 AB AB56.0R L1, L wavy 100 wavy 718 Waneta/Beaver Cr 17-May Fort Shepherd Eddy Jun-05 AB AB52.3L L1, L Kootenay R. 14-May Waneta Eddy Jun-05 SSL SSL56.0R L1, L Waneta/Beaver Cr 17-May Waneta Eddy Jun-05 AB AB56.0R L1, L Waneta/Beaver Cr 17-May Waneta Eddy Jun-05 AB AB56.0R L1, L wavy 100 wavy previously captured 24 Jun 04 by AB in Waneta Eddy 721 HLK Robson 20-May Waneta Eddy Jun-05 AB AB56.0R L1, L rolled 50 rolled 722 HLK 15-May Waneta Eddy Jun-05 AB AB56.0R L1, L Waneta/Beaver Cr 17-May Waneta Eddy Jun-05 AB AB56.0R L1, L also captured 18 Nov 05 by GN in Waneta Eddy; spring in mouth (removed) 723 Waneta Eddy 20-Aug Waneta Eddy Jun-05 AB AB56.0R L1, L Waneta/Beaver Cr 17-May Waneta Eddy Jun-05 SSL SSL56.0R L1, L Waneta Eddy 20-Aug Waneta Eddy Jun-05 AB AB56.0R L1, L Kootenay R. 14-May Waneta Eddy Jun-05 AB AB56.0R L1, L Waneta/Beaver Cr 17-May Waneta Eddy Jun-05 AB AB56.0R L1, L wavy 100 wavy 728 Waneta/Beaver Cr 17-May Waneta Eddy Jun-05 AB AB56.0R L1, L Kootenay R. 14-May Waneta Eddy Jun-05 AB AB56.0R L1, L wavy 730 Kootenay R. 14-May Waneta Eddy Jun-05 AB AB56.0R L1, L wavy 731 Waneta/Beaver Cr 17-May Waneta Eddy Jun-05 AB AB56.0R L1, L Waneta/Beaver Cr 17-May Waneta Eddy Jun-05 AB AB56.0R L1, L Waneta/Beaver Cr 17-May Waneta Eddy Jun-05 AB AB56.0R L1, L wavy 734 Waneta/Beaver Cr 17-May Lower China Bend Oct-05 GN L1, L <50 deformed captured by EPA/Colville Confederated Tribes 735 Kettle Falls 12-May Lower China Bend Oct-05 GN L1, L captured by EPA/Colville Confederated Tribes 736 HLK 4-May Lower China Bend Oct-05 GN L1, L captured by EPA/Colville Confederated Tribes 737 Waneta/Beaver Cr 17-May Lower China Bend Oct-05 GN L1, L <50 deformed captured by EPA/Colville Confederated Tribes 738 unknown 2005 unknown Lower China Bend Oct-05 GN L1, L6 not detected <50 deformed captured by EPA/Colville Confederated Tribes 739 Kettle Falls 12-May Lower China Bend Oct-05 GN L1, L captured by EPA/Colville Confederated Tribes 364 Beaver Creek 12-May Lower China Bend Oct-05 GN L1, L shrunken captured by EPA/Colville Confederated Tribes; previously captured 27-Oct Kettle Falls 12-May Kettle Flats Oct-05 GN L1, L EPA/Colville Confederated Tribes; deformity recorded in release data (right pec. <50%), but capture data said no deformities 586 Nancy Cr/Marcus 11-May Flat Creek Oct-05 GN L1, L captured by EPA/Colville Confederated Tribes; also captured 21-Oct Nancy Cr/Marcus 24-Feb Flat Creek Oct-05 GN L1, L captured by EPA/Colville Confederated Tribes 742 Kettle Falls 12-May Flat Creek Oct-05 GN L1, L captured by EPA/Colville Confederated Tribes 743 Nancy Cr/Marcus 24-Feb Rickey Point Oct-05 GN L1, L captured during WDFW Limnetic surveys; no deformities according to release data 744 Nancy Cr/Marcus 24-Feb Rickey Point Oct-05 GN L1, L captured during WDFW Limnetic surveys; no deformities according to release data 745 Waneta/Beaver Cr 17-May Upper China Bend 88 8-Sep-05 GN 10 (L1, L3) captured by EPA/Spokane Tribe (ST); fish not measured or weighed; deformities or scute removals not recorded 746 North Gorge 11-May Upper China Bend 88 8-Sep-05 GN 10 (L1, L6) EPA/ST; fish not measured or weighed; deformities or scute removals not recorded; no deformities according to release data Continued... a See Figures 1.1 and 1.2; river kilometres measured downstream from HLK (designations with a "K" indicate locations in the Kootenay River, measured upstream from the confluence with the Columbia River). "Unknown" indicates a PIT tag was not detected in the b Release dates that are only a year are based on scute removal patterns; "unknown" indicates a PIT tag was not detected in the fish or the PIT tag number was not found in the release data (and release year could not be determined by scute removals), theref c Numbers before dash indicate brood year, number after dash indicates family number (e.g., 01-3 = 2001 brood year, family 3). "Unknown" indicates a PIT tag was not detected in the fish or the PIT tag number was not found in the release data; therefore fami d Capture methods: AB = angling (with bait); GN = gill net; SSL = sturgeon set line. e Depth values for GN and SSL are the mean of the minimum and maximum set depths. f Marks at capture/scutes removed: letter indicates side of fish (i.e., L = left) and number indicates position (i.e., 1 = 1st scute behind head; 2 = 2nd scute behind head, etc.). Scute removals before brackets indicate those observed, removals in brackets g Left = left pectoral fin ray section taken; right = right pectoral fin ray section taken; both = left and right fin ray sections taken. Right fin rays were only taken if there was a problem with the left (i.e., deformed). h Percentages indicate the percent of normal fin size. i Blanks indicate data was not recorded or unavailable due to various issues. j See comments.
136 Table C1 Concluded. Release Information Capture Information Length (cm) Relative Pectoral Fin Deformity Details h Sample Sample Girth Weight PIT Tag No. at Fin Scutes PIT Tag No. Depth Weight Number Site/ID (cm) (g) Cap. f Capture Ray g Removed f Left Right Location a Date b Family c Location a Rkm a Date Meth d Applied (m) e Snout Head Fork Total (%) % Description % Description Comments 747 North Gorge 11-May Upper China Bend 88 8-Sep-05 GN 10 (L1, L6) EPA/ST; fish not measured or weighed; deformities or scute removals not recorded; no deformities according to release data 748 North Gorge 12-May Upper China Bend 88 8-Sep-05 GN 10 (L1, L5) EPA/ST; fish not measured or weighed; deformities or scute removals not recorded; no deformities according to release data 749 North Gorge 12-May Upper China Bend 88 8-Sep-05 GN 10 (L1, L5) EPA/ST; fish not measured or weighed; deformities or scute removals not recorded; no deformities according to release data 310 Sherman Creek 7-Jul Upper China Bend 88 8-Sep-05 GN 10 L1, L EPA/ST; fish not measured or weighed; no deformities according to release data and previous capture on 20 Oct Waneta/Beaver Cr 12-May Upper China Bend 88 8-Sep-05 GN 10 (L1, L5) EPA/ST; fish not measured or weighed; deformities or scute removals not recorded; no deformities according to release data 751 North Gorge 12-May Upper China Bend 88 8-Sep-05 GN 10 (L1, L5) EPA/ST; fish not measured or weighed; deform./scute removals not recorded; right pec. deformed (<50%) according to release data 752 Kettle Falls 12-May Upper China Bend 88 9-Sep-05 GN (L1, L5) EPA/ST; scute removals not recorded; tail deformed according to release data 753 Kettle Falls 12-May Upper China Bend 88 8-Sep-05 GN 10 (L1, L5) EPA/ST; fish not measured or weighed; deform./scute removals not recorded; left pec. deformed (<50%) according to release data 754 Waneta/Beaver Cr 12-May Upper China Bend 88 8-Sep-05 GN 10 (L1, L5) EPA/ST; fish not measured or weighed; deformities or scute removals not recorded; no deformities according to release data 755 Waneta/Beaver Cr 12-May Upper China Bend 88 8-Sep-05 GN 10 (L1, L5) EPA/ST; fish not measured or weighed; deformities or scute removals not recorded; no deformities according to release data a See Figures 1.1 and 1.2; river kilometres measured downstream from HLK (designations with a "K" indicate locations in the Kootenay River, measured upstream from the confluence with the Columbia River). "Unknown" indicates a PIT tag was not detected in the b Release dates that are only a year are based on scute removal patterns; "unknown" indicates a PIT tag was not detected in the fish or the PIT tag number was not found in the release data (and release year could not be determined by scute removals), theref c Numbers before dash indicate brood year, number after dash indicates family number (e.g., 01-3 = 2001 brood year, family 3). "Unknown" indicates a PIT tag was not detected in the fish or the PIT tag number was not found in the release data; therefore fami d Capture methods: AB = angling (with bait); GN = gill net; SSL = sturgeon set line. e Depth values for GN and SSL are the mean of the minimum and maximum set depths. f Marks at capture/scutes removed: letter indicates side of fish (i.e., L = left) and number indicates position (i.e., 1 = 1st scute behind head; 2 = 2nd scute behind head, etc.). Scute removals before brackets indicate those observed, removals in brackets g Left = left pectoral fin ray section taken; right = right pectoral fin ray section taken; both = left and right fin ray sections taken. Right fin rays were only taken if there was a problem with the left (i.e., deformed). h Percentages indicate the percent of normal fin size. i Blanks indicate data was not recorded or unavailable due to various issues. j See comments.
137 Table C2 Summary of fork length, total length, and weight for hatchery juvenile white sturgeon captured during sampling in the Transboundary Recovery Area, 2002 to Note: fish for which length or weight data was unavailable and fish captured more than once in 2005 are not included. Capture Fork Length (cm) Total Length (cm) Weight (g) Age n Location a Mean Min. Max. Mean Min. Max. Mean Min. Max. Upper Section Middle Section N/A N/A 42.3 N/A N/A 311 N/A N/A Lower Section Roosevelt Reach All Age 1+ Fish Upper Section Middle Section Lower Section Roosevelt Reach All Age 2+ Fish Upper Section Middle Section Lower Section Roosevelt Reach All Age 3+ Fish Upper Section N/A N/A 78.2 N/A N/A 2437 N/A N/A Lower Section Roosevelt Reach All Age 4+ Fish a See Figures 1.1 and 1.2 for capture locations. Upper section = HLK to mouth of Kootenay River (including the Kootenay River downstream of Brilliant Dam); lower section = Beaver Creek to the Canada - U.S. border; Roosevelt Reach = Canada - U.S. border to Grand Coulee Dam.
138 Table C3 Summary of growth of hatchery juvenile white sturgeon (for which length and weight at release could be determined) by age class captured from 2002 to 2005 in the Transboundary Recovery Area (fish captured twice in 2005 are not included). Brood Year Year Captured Age n Mean Fork Length (cm) Mean Weight (g) At Release At Capture Net Gain % Gain At Release At Capture Net Gain % Gain All Age 1+ Fish All Age 2+ Fish All Age 3+ Fish All Age 4+ Fish Mean Days at Large Fork Length (cm) Mean Daily Growth Rate 95% CI Weight (g) 95% CI
139 Table C4 Summary of growth of hatchery juvenile white sturgeon (for which the required data was available) by age class and capture location for fish captured from 2002 to 2005 in the Transboundary Recovery Area (fish captured twice in 2005 are not included). Mean Fork Length (cm) Mean Weight (g) Mean Daily Growth Rate Capture Mean Days At At % At At % Location a Age n Net Fork Length Net Gain at Large 95% CI Weight (g) 95% CI Release Capture Gain Gain Release Capture Gain (cm) Upper Section Middle Section Lower Section Roosevelt Reach All Age 1+ Fish Upper Section Middle Section Lower Section Roosevelt Reach All Age 2+ Fish Upper Section Middle Section Lower Section Roosevelt Reach All Age 3+ Fish Upper Section Lower Section Roosevelt Reach All Age 4+ Fish a See Figures 1.1 and 1.2 for capture locations. Upper section = HLK to mouth of Kootenay River (including the Kootenay River downstream of Brilliant Dam); lower section = Beaver Creek to the Canada - U.S. border; Roosevelt Reach = Canada - U.S. border to Grand Coulee Dam.
140 Table C5 Comparison of mean growth of hatchery juvenile white sturgeon with and without pectoral fin deformities and of the severity of deformities (for which deformity and growth data was available), for fish captured from 2002 to 2005 in the Transboundary Recovery Area (recaptures are not included). Age Pectoral Fin Deformity Category a n Mean Fork Length (cm) At Release At Capture Net Gain Mean Weight (g) % Gain At Release At Capture Net Gain 1+ with deformities major deformities minor deformities without deformities All Age 1+ Fish b with deformities major deformities minor deformities without deformities All Age 2+ Fish b with deformities major deformities minor deformities without deformities All Age 3+ Fish b with deformities major deformities minor deformities without deformities All Age 4+ Fish b % Gain Mean Days at Large Fork Length (cm) Mean Daily Growth Rate 95% CI Weight (g) 95% CI a Fish with major deformities are defined as those with one or both pectoral fins that are 50% normal size or less. Fish with minor deformities are defined as those with both pectoral fins that are greater than 50% normal size. b The number of fish in the individual categories above may not add up to the total n because only fish whose deformity severity could be determined were used; whereas all fish for which growth rates could be determined were used in the "All Age 1+ to 4+ Fish" totals.
141 Table C6 Comparison of growth rates between release and initial capture, and subsequent re-release and the second capture of juvenile white sturgeon recaptured during Phase 1 to 4 monitoring, 2002 to Release Capture Days at Sample Growth Rate/Day Number a Date FL b (cm) Wt b (g) Date FL b (cm) Wt b (g) Large FL b (cm) Wt b (g) 1 20-Aug Oct Oct Nov Aug Nov May Nov Nov Oct May Oct May Oct Oct Nov May Nov May Oct Oct Sep May Sep Aug Oct Oct Nov Aug Nov May Oct Oct Sep May Sep May Oct Oct Sep May Sep May Oct Oct Nov May Nov May Jun Jun Jun May Jun May Sep Sep Nov May Nov May Sep Sep Nov May Nov May Sep Sep Nov May Nov a 16-Sep Nov May Nov Nov Nov May Nov May Oct Oct Oct May Oct May Oct Oct Oct May Oct a Identifier used in Appendix C, Table C1 and previous reports. Table does not include 7 fish that were captured twice in The PIT tag number of sample number 217 was not found in the release data; therefore its growth rate between release and initial capture could not be determined. b FL = fork length; Wt = weight.
142 Table C7 Summary of the incidence of pectoral fin deformities by family in hatchery juvenile white sturgeon (for which deformity data was available) captured fron 2002 to 2005 (recaptures are not included). Brood 2002 Captures b 2003 Captures b 2004 Captures b All Years b Family a 2005 Captures b Year No. w/ Def. Major Minor % No. w/ Def. % No. w/ Def. % No. w/ Def. % No. w/ Def. % wf unknown All unknown All unknown All unknown All unknown c unknown All All a The first 2 digits represent brood year (e.g., 01 = 2001); last digit represents family ID from that brood year; wf = wild fry family (hatched from captured wild eggs); unknown = could not be found in release data or PIT tag was not detected at capture. b No. = number of juvenile white sturgeon captured; w/ Def. = number captured with pectoral fin deformities; % = percent of juvenile white sturgeon captured with pectoral fin deformities. c Brood year could not be determined by scute removal pattern, PIT tag also not detected or found in release data.
143 Table C8 Summary of the incidence of pectoral fin deformities and the severity of deformities in juvenile white sturgeon captured from 2002 to 2005 in the Transboundary Recovery Area (recaptures are not included). Total No. With Deformity Classification c Brood Year Family a Number Deformity Any Major Minor Unknown b Captured Data b No. % No. % No. % No. % wf unknown All unknown All unknown All unknown All unknown unknown All All Wild Fish N/A d d a The first two digits represent brood year (i.e., 01 = 2001); last digit represents family ID from that brood year; wf = wild fry family (hatched from captured wild eggs); unknown = could not be found in release data or PIT tag was not detected at capture. b Some fish for which data was obtained did not indicate whether the fish had pectoral fin deformities; or if deformities were noted, did not include a description of the deformities. c Major = one or both fins were 50% of normal size or less; Minor = both fins were over 50% of normal size. d The one wild fish with pectoral fin deformities exhibited fins that were slightly curled (a very minor deformity).
144 APPENDIX D MOVEMENT DATA
145 Table D1 Sonic tagged juvenile white sturgeon released in May 2004 that are not included in Figure D1. Pinger Release ID No. Date Location Detection History May-04 Beaver Creek never detected May-04 HLK Eddy single detection at HLK Eddy on 28 Jun May-04 Beaver Creek single detections at HLK Eddy 15 & 27 May 04; Ft. Shep. Eddy 22 May & 26 Oct. 04, 7 & 9 Mar, 2, 3 & 5 Apr May-04 Beaver Creek single detections at HLK Eddy 16 May 04; Balfour Bay 1 & 4 Jun 04 & 21 Mar 06; Kettle Falls Bridge 23 Sep May-04 HLK Eddy detected at HLK Eddy day of release; single detection 31 May May-04 Beaver Creek never detected May-04 Beaver Creek single detections at Fort Shepherd Eddy 18 May 04 & HLK Eddy 24 May May-04 HLK Eddy detected at HLK Eddy day of release; single det. at Ft. Shep. Eddy 27 May 05 & 11 Jan 06, 2 det. 1 Mar 06
146 HLK Kootenay Beaver Waneta Little Kettle Falls Eddy Eddy Creek Eddy Dalles Bridge Hunters 1-Mar-06 1-Jan-06 Sonic Tag ID No Pit tag #: Nov-05 1-Sep-05 1-Jul-05 1-May-05 1-Mar-05 1-Jan-05 1-Nov-04 1-Sep-04 1-Jul-04 1-May-04 Release Location Columbia River Detection Date HLK Kootenay Beaver Waneta Little Kettle Falls Eddy Eddy Creek Eddy Dalles Bridge Hunters 1-Mar-06 1-Jan-06 Sonic Tag ID No Pit tag #: Nov-05 1-Sep-05 1-Jul-05 1-May-05 1-Mar-05 1-Jan-05 1-Nov-04 1-Sep-04 1-Jul-04 1-May-04 Release Location Columbia River Detection Kootenay River Detection River Kilometre Figure D1 Summary of detected movements of sonic tagged (high output) juvenile white sturgeon released in the Keenleyside Reach, Note: Columbia River kilometre 10.5 is equivalent to Kootenay River kilometre zero.
147 HLK Kootenay Beaver Waneta Little Kettle Falls Eddy Eddy Creek Eddy Dalles Bridge Hunters 1-Mar-06 1-Jan-06 Sonic Tag ID No Pit tag #: Nov-05 1-Sep-05 1-Jul-05 1-May-05 1-Mar-05 1-Jan-05 1-Nov-04 1-Sep-04 1-Jul-04 1-May-04 Release Location Columbia River Detection Date HLK Kootenay Beaver Waneta Little Kettle Falls Eddy Eddy Creek Eddy Dalles Bridge Hunters 1-Mar-06 1-Jan-06 Sonic Tag ID No Pit tag #: Nov-05 1-Sep-05 1-Jul-05 1-May-05 1-Mar-05 1-Jan-05 1-Nov-04 1-Sep-04 1-Jul-04 1-May-04 Release Location Columbia River Detection River Kilometre Figure D1 Continued.
148 HLK Kootenay Beaver Waneta Little Kettle Falls Eddy Eddy Creek Eddy Dalles Bridge Hunters 1-Mar-06 1-Jan-06 Sonic Tag ID No Pit tag #: Nov-05 1-Sep-05 1-Jul-05 1-May-05 1-Mar-05 1-Jan-05 1-Nov-04 1-Sep-04 1-Jul-04 1-May-04 Release Location Columbia River Detection Date HLK Kootenay Beaver Waneta Little Kettle Falls Eddy Eddy Creek Eddy Dalles Bridge Hunters 1-Mar-06 1-Jan-06 Sonic Tag ID No Pit tag #: Nov-05 1-Sep-05 1-Jul-05 1-May-05 1-Mar-05 1-Jan-05 1-Nov-04 1-Sep-04 1-Jul-04 1-May-04 Release Location Columbia River Detection River Kilometre Figure D1 Continued.
149 HLK Kootenay Beaver Waneta Little Kettle Falls Eddy Eddy Creek Eddy Dalles Bridge Hunters 1-Mar-06 1-Jan-06 Sonic Tag ID No Pit tag #: Nov-05 1-Sep-05 1-Jul-05 1-May-05 1-Mar-05 1-Jan-05 1-Nov-04 1-Sep-04 1-Jul-04 1-May-04 Release Location Columbia River Detection Date HLK Kootenay Beaver Waneta Little Kettle Falls Eddy Eddy Creek Eddy Dalles Bridge Hunters 1-Mar-06 1-Jan-06 Sonic Tag ID No Pit tag #: Nov-05 1-Sep-05 1-Jul-05 1-May-05 1-Mar-05 1-Jan-05 1-Nov-04 1-Sep-04 1-Jul-04 1-May-04 Release Location Columbia River Detection River Kilometre Figure D1 Continued.
150 HLK Kootenay Beaver Waneta Little Kettle Falls Eddy Eddy Creek Eddy Dalles Bridge Hunters 1-Mar-06 1-Jan-06 Sonic Tag ID No Pit tag #: Nov-05 1-Sep-05 1-Jul-05 1-May-05 1-Mar-05 1-Jan-05 1-Nov-04 1-Sep-04 1-Jul-04 1-May-04 Release Location Columbia River Detection Capture Location Date HLK Kootenay Beaver Waneta Little Kettle Falls Eddy Eddy Creek Eddy Dalles Bridge Hunters 1-Mar-06 1-Jan-06 Sonic Tag ID No Pit tag #: Nov-05 1-Sep-05 1-Jul-05 1-May-05 1-Mar-05 1-Jan-05 1-Nov-04 1-Sep-04 1-Jul-04 1-May-04 Release Location Columbia River Detection River Kilometre Figure D1 Continued.
151 HLK Kootenay Beaver Waneta Little Kettle Falls Eddy Eddy Creek Eddy Dalles Bridge Hunters 1-Mar-06 1-Jan-06 Sonic Tag ID No Pit tag #: Nov-05 1-Sep-05 1-Jul-05 1-May-05 1-Mar-05 1-Jan-05 1-Nov-04 1-Sep-04 1-Jul-04 1-May-04 Release Location Columbia River Detection Date HLK Kootenay Beaver Waneta Little Kettle Falls Eddy Eddy Creek Eddy Dalles Bridge Hunters 1-Mar-06 1-Jan-06 Sonic Tag ID No Pit tag #: Nov-05 1-Sep-05 1-Jul-05 1-May-05 1-Mar-05 1-Jan-05 1-Nov-04 1-Sep-04 1-Jul-04 1-May-04 Release Location Columbia River Detection River Kilometre Figure D1 Continued.
152 HLK Kootenay Beaver Waneta Little Kettle Falls Eddy Eddy Creek Eddy Dalles Bridge Hunters 1-Mar-06 1-Jan-06 Sonic Tag ID No Pit tag #: Nov-05 1-Sep-05 1-Jul-05 1-May-05 1-Mar-05 1-Jan-05 1-Nov-04 1-Sep-04 1-Jul-04 1-May-04 Release Location Columbia River Detection Date HLK Kootenay Beaver Waneta Little Kettle Falls Eddy Eddy Creek Eddy Dalles Bridge Hunters 1-Mar-06 1-Jan-06 Sonic Tag ID No Pit tag #: Nov-05 1-Sep-05 1-Jul-05 1-May-05 1-Mar-05 1-Jan-05 1-Nov-04 1-Sep-04 1-Jul-04 1-May-04 Release Location Columbia River Detection River Kilometre Figure D1 Continued.
153 HLK Kootenay Beaver Waneta Little Kettle Falls Eddy Eddy Creek Eddy Dalles Bridge Hunters 1-Mar-06 1-Jan-06 Sonic Tag ID No Pit tag #: Nov-05 1-Sep-05 1-Jul-05 1-May-05 1-Mar-05 1-Jan-05 1-Nov-04 1-Sep-04 1-Jul-04 1-May-04 Release Location Columbia River Detection Date HLK Kootenay Beaver Waneta Little Kettle Falls Eddy Eddy Creek Eddy Dalles Bridge Hunters 1-Mar-06 1-Jan-06 Sonic Tag ID No Pit tag #: Nov-05 1-Sep-05 1-Jul-05 1-May-05 1-Mar-05 1-Jan-05 1-Nov-04 1-Sep-04 1-Jul-04 1-May-04 Release Location Columbia River Detection Kootenay River Detection River Kilometre Figure D1 Continued.
154 HLK Kootenay Beaver Waneta Little Kettle Falls Eddy Eddy Creek Eddy Dalles Bridge Hunters 1-Mar-06 1-Jan-06 Sonic Tag ID No Pit tag #: Nov-05 1-Sep-05 1-Jul-05 1-May-05 1-Mar-05 1-Jan-05 1-Nov-04 1-Sep-04 1-Jul-04 1-May-04 Release Location Columbia River Detection Kootenay River Detection Date HLK Kootenay Beaver Waneta Little Kettle Falls Eddy Eddy Creek Eddy Dalles Bridge Hunters 1-Mar-06 1-Jan-06 Sonic Tag ID No Pit tag #: Nov-05 1-Sep-05 1-Jul-05 1-May-05 1-Mar-05 1-Jan-05 1-Nov-04 1-Sep-04 1-Jul-04 1-May-04 Release Location Columbia River Detection River Kilometre Figure D1 Continued.
155 HLK Kootenay Beaver Waneta Little Kettle Falls Eddy Eddy Creek Eddy Dalles Bridge Hunters 1-Mar-06 1-Jan-06 Sonic Tag ID No Pit tag #: Nov-05 1-Sep-05 1-Jul-05 1-May-05 1-Mar-05 1-Jan-05 1-Nov-04 1-Sep-04 1-Jul-04 1-May-04 Release Location Columbia River Detection Date HLK Kootenay Beaver Waneta Little Kettle Falls Eddy Eddy Creek Eddy Dalles Bridge Hunters 1-Mar-06 1-Jan-06 Sonic Tag ID No Pit tag #: Nov-05 1-Sep-05 1-Jul-05 1-May-05 1-Mar-05 1-Jan-05 1-Nov-04 1-Sep-04 1-Jul-04 1-May-04 Release Location Columbia River Detection River Kilometre Figure D1 Continued.
156 HLK Kootenay Beaver Waneta Little Kettle Falls Eddy Eddy Creek Eddy Dalles Bridge Hunters 1-Mar-06 1-Jan-06 Sonic Tag ID No Pit tag #: Nov-05 1-Sep-05 1-Jul-05 1-May-05 1-Mar-05 1-Jan-05 1-Nov-04 1-Sep-04 1-Jul-04 1-May-04 Release Location Columbia River Detection Date HLK Kootenay Beaver Waneta Little Kettle Falls Eddy Eddy Creek Eddy Dalles Bridge Hunters 1-Mar-06 1-Jan-06 Sonic Tag ID No Pit tag #: Nov-05 1-Sep-05 1-Jul-05 1-May-05 1-Mar-05 1-Jan-05 1-Nov-04 1-Sep-04 1-Jul-04 1-May-04 Release Location Columbia River Detection River Kilometre Figure D1 Continued.
157 HLK Kootenay Beaver Waneta Little Kettle Falls Eddy Eddy Creek Eddy Dalles Bridge Hunters 1-Mar-06 1-Jan-06 Sonic Tag ID No Pit tag #: Nov-05 1-Sep-05 1-Jul-05 1-May-05 1-Mar-05 1-Jan-05 1-Nov-04 1-Sep-04 1-Jul-04 1-May-04 Release Location Columbia River Detection Date HLK Kootenay Beaver Waneta Little Kettle Falls Eddy Eddy Creek Eddy Dalles Bridge Hunters 1-Mar-06 1-Jan-06 Sonic Tag ID No Pit tag #: Nov-05 1-Sep-05 1-Jul-05 1-May-05 1-Mar-05 1-Jan-05 1-Nov-04 1-Sep-04 1-Jul-04 1-May-04 Release Location Columbia River Detection River Kilometre Figure D1 Continued.
158 HLK Kootenay Beaver Waneta Little Kettle Falls Eddy Eddy Creek Eddy Dalles Bridge Hunters 1-Mar-06 1-Jan-06 Sonic Tag ID No Pit tag #: Nov-05 1-Sep-05 1-Jul-05 1-May-05 1-Mar-05 1-Jan-05 1-Nov-04 1-Sep-04 1-Jul-04 1-May-04 Release Location Columbia River Detection Date HLK Kootenay Beaver Waneta Little Kettle Falls Eddy Eddy Creek Eddy Dalles Bridge Hunters 1-Mar-06 1-Jan-06 Sonic Tag ID No Pit tag #: Nov-05 1-Sep-05 1-Jul-05 1-May-05 1-Mar-05 1-Jan-05 1-Nov-04 1-Sep-04 1-Jul-04 1-May-04 Release Location Columbia River Detection River Kilometre Figure D1 Continued.
159 HLK Kootenay Beaver Waneta Little Kettle Falls Eddy Eddy Creek Eddy Dalles Bridge Hunters 1-Mar-06 1-Jan-06 Sonic Tag ID No Pit tag #: Nov-05 1-Sep-05 1-Jul-05 1-May-05 1-Mar-05 1-Jan-05 1-Nov-04 1-Sep-04 1-Jul-04 1-May-04 Release Location Columbia River Detection Date HLK Kootenay Beaver Waneta Little Kettle Falls Eddy Eddy Creek Eddy Dalles Bridge Hunters 1-Mar-06 1-Jan-06 Sonic Tag ID No Pit tag #: Nov-05 1-Sep-05 1-Jul-05 1-May-05 1-Mar-05 1-Jan-05 1-Nov-04 1-Sep-04 1-Jul-04 1-May-04 Release Location Columbia River Detection River Kilometre Figure D1 Continued.
160 HLK Kootenay Beaver Waneta Little Kettle Falls Eddy Eddy Creek Eddy Dalles Bridge Hunters 1-Mar-06 1-Jan-06 Sonic Tag ID No Pit tag #: Nov-05 1-Sep-05 1-Jul-05 1-May-05 1-Mar-05 1-Jan-05 1-Nov-04 1-Sep-04 1-Jul-04 1-May-04 Release Location Columbia River Detection Date HLK Kootenay Beaver Waneta Little Kettle Falls Eddy Eddy Creek Eddy Dalles Bridge Hunters 1-Mar-06 1-Jan-06 Sonic Tag ID No Pit tag #: Nov-05 1-Sep-05 1-Jul-05 1-May-05 1-Mar-05 1-Jan-05 1-Nov-04 1-Sep-04 1-Jul-04 1-May-04 Release Location Columbia River Detection River Kilometre Figure D1 Continued.
161 HLK Kootenay Beaver Waneta Little Kettle Falls Eddy Eddy Creek Eddy Dalles Bridge Hunters 1-Mar-06 1-Jan-06 Sonic Tag ID No Pit tag #: Nov-05 1-Sep-05 1-Jul-05 1-May-05 1-Mar-05 1-Jan-05 1-Nov-04 1-Sep-04 1-Jul-04 1-May-04 Release Location Columbia River Detection Date HLK Kootenay Beaver Waneta Little Kettle Falls Eddy Eddy Creek Eddy Dalles Bridge Hunters 1-Mar-06 1-Jan-06 Sonic Tag ID No Pit tag #: Nov-05 1-Sep-05 1-Jul-05 1-May-05 1-Mar-05 1-Jan-05 1-Nov-04 1-Sep-04 1-Jul-04 1-May-04 Release Location Columbia River Detection River Kilometre Figure D1 Continued.
162 HLK Kootenay Beaver Waneta Little Kettle Falls Eddy Eddy Creek Eddy Dalles Bridge Hunters 1-Mar-06 1-Jan-06 Sonic Tag ID No Pit tag #: Nov-05 1-Sep-05 1-Jul-05 1-May-05 1-Mar-05 1-Jan-05 1-Nov-04 1-Sep-04 1-Jul-04 1-May-04 Release Location Columbia River Detection Date HLK Kootenay Beaver Waneta Little Kettle Falls Eddy Eddy Creek Eddy Dalles Bridge Hunters 1-Mar-06 1-Jan-06 Sonic Tag ID No Pit tag #: Nov-05 1-Sep-05 1-Jul-05 1-May-05 1-Mar-05 1-Jan-05 1-Nov-04 1-Sep-04 1-Jul-04 1-May-04 Release Location Columbia River Detection River Kilometre Figure D1 Continued.
163 HLK Kootenay Beaver Waneta Little Kettle Falls Eddy Eddy Creek Eddy Dalles Bridge Hunters 1-Mar-06 1-Jan-06 Sonic Tag ID No Pit tag #: Nov-05 1-Sep-05 1-Jul-05 1-May-05 1-Mar-05 1-Jan-05 1-Nov-04 1-Sep-04 1-Jul-04 1-May-04 Release Location Columbia River Detection Date HLK Kootenay Beaver Waneta Little Kettle Falls Eddy Eddy Creek Eddy Dalles Bridge Hunters 1-Mar-06 1-Jan-06 Sonic Tag ID No Pit tag #: Nov-05 1-Sep-05 1-Jul-05 1-May-05 1-Mar-05 1-Jan-05 1-Nov-04 1-Sep-04 1-Jul-04 1-May-04 Release Location Columbia River Detection River Kilometre Figure D1 Continued.
164 HLK Kootenay Beaver Waneta Little Kettle Falls Eddy Eddy Creek Eddy Dalles Bridge Hunters 1-Mar-06 1-Jan-06 Sonic Tag ID No Pit tag #: Nov-05 1-Sep-05 1-Jul-05 1-May-05 1-Mar-05 1-Jan-05 1-Nov-04 1-Sep-04 1-Jul-04 1-May-04 Release Location Columbia River Detection Date HLK Kootenay Beaver Waneta Little Kettle Falls Eddy Eddy Creek Eddy Dalles Bridge Hunters 1-Mar-06 1-Jan-06 Sonic Tag ID No Pit tag #: Nov-05 1-Sep-05 1-Jul-05 1-May-05 1-Mar-05 1-Jan-05 1-Nov-04 1-Sep-04 1-Jul-04 1-May-04 Release Location Columbia River Detection River Kilometre Figure D1 Continued.
165 HLK Kootenay Beaver Waneta Little Kettle Falls Eddy Eddy Creek Eddy Dalles Bridge Hunters 1-Mar-06 1-Jan-06 Sonic Tag ID No Pit tag #: Nov-05 1-Sep-05 1-Jul-05 1-May-05 1-Mar-05 1-Jan-05 1-Nov-04 1-Sep-04 1-Jul-04 1-May-04 Release Location Columbia River Detection Date HLK Kootenay Beaver Waneta Little Kettle Falls Eddy Eddy Creek Eddy Dalles Bridge Hunters 1-Mar-06 1-Jan-06 Sonic Tag ID No Pit tag #: Nov-05 1-Sep-05 1-Jul-05 1-May-05 1-Mar-05 1-Jan-05 1-Nov-04 1-Sep-04 1-Jul-04 1-May-04 Release Location Columbia River Detection River Kilometre Figure D1 Continued.
166 HLK Kootenay Beaver Waneta Little Kettle Falls Eddy Eddy Creek Eddy Dalles Bridge Hunters 1-Mar-06 1-Jan-06 Sonic Tag ID No Pit tag #: Nov-05 1-Sep-05 1-Jul-05 1-May-05 1-Mar-05 1-Jan-05 1-Nov-04 1-Sep-04 1-Jul-04 1-May-04 Release Location Columbia River Detection Capture Location Date HLK Kootenay Beaver Waneta Little Kettle Falls Eddy Eddy Creek Eddy Dalles Bridge Hunters 1-Mar-06 1-Jan-06 Sonic Tag ID No Pit tag #: Nov-05 1-Sep-05 1-Jul-05 1-May-05 1-Mar-05 1-Jan-05 1-Nov-04 1-Sep-04 1-Jul-04 1-May-04 Release Location Columbia River Detection River Kilometre Figure D1 Continued.
167 HLK Kootenay Beaver Waneta Little Kettle Falls Eddy Eddy Creek Eddy Dalles Bridge Hunters 1-Mar-06 1-Jan-06 Sonic Tag ID No Pit tag #: Nov-05 1-Sep-05 1-Jul-05 1-May-05 1-Mar-05 1-Jan-05 1-Nov-04 1-Sep-04 1-Jul-04 1-May-04 Release Location Columbia River Detection Date HLK Kootenay Beaver Waneta Little Kettle Falls Eddy Eddy Creek Eddy Dalles Bridge Hunters 1-Mar-06 1-Jan-06 Sonic Tag ID No Pit tag #: Nov-05 1-Sep-05 1-Jul-05 1-May-05 1-Mar-05 1-Jan-05 1-Nov-04 1-Sep-04 1-Jul-04 1-May-04 Release Location Columbia River Detection River Kilometre Figure D1 Concluded.
168
169 Date 3-Mar-06 1-Feb-06 2-Jan-06 3-Dec-05 3-Nov-05 4-Oct-05 4-Sep-05 5-Aug-05 6-Jul-05 6-Jun-05 7-May-05 7-Apr-05 8-Mar-05 6-Feb-05 7-Jan-05 8-Dec-04 8-Nov-04 9-Oct-04 9-Sep Aug Jul Jun May River Kilometre Figure D2 Dispersal of sonic tagged juvenile white sturgeon released at Beaver Creek in May 2004 that moved beyond Fort Shepherd and Waneta eddies. Note: river kilometre 10.5 corresponds to the mouth of the Kootenay River; 10.5 = mouth, 13.3 = Brilliant Dam.
170
171 Table D2 Sonic tagged juvenile white sturgeon released in May 2005 that are not included in Figure D3. Pinger Release ID No. Date Location Detection History May-05 Beaver Creek single detection at Balfour Bay 21 May May-05 Beaver Creek single detections at Sturgeon Island 7 & 13 Dec May-05 Beaver Creek single detections at Balfour Bay 9 & 12 May May-05 Beaver Creek single detections: Fort Shepherd Eddy 8 May 05, Rickey Point 26 Aug 05, Kettle Falls Bridge 8 Nov 05, Marcus Island 1 Mar 06
172 1-Apr-06 1-Mar-06 HLK Kootenay Beaver Waneta Little Kettle Falls Eddy Eddy Creek Eddy Dalles Bridge Hunters Sonic Tag ID No (L) Pit tag #: Feb-06 1-Jan-06 1-Dec-05 1-Nov-05 1-Oct-05 1-Sep-05 1-Aug-05 1-Jul-05 1-Jun-05 1-May-05 1-Apr-05 1-Mar-05 Release Location Columbia River Detection Date 1-Apr-06 1-Mar-06 HLK Kootenay Beaver Waneta Little Kettle Falls Eddy Eddy Creek Eddy Dalles Bridge Hunters Sonic Tag ID No (L) Pit tag #: Feb-06 1-Jan-06 1-Dec-05 1-Nov-05 1-Oct-05 1-Sep-05 1-Aug-05 1-Jul-05 1-Jun-05 1-May-05 1-Apr-05 1-Mar River Kilometre Release Location Columbia River Detection Figure D3 Summary of detected movements of sonic tagged juvenile white sturgeon released in the Keenleyside and Roosevelt Reaches, Note: Columbia River kilometre 10.5 is equivalent to Kootenay River kilometre zero; (L)= low output sonic tags, (H)= hight output.
173 1-Apr-06 1-Mar-06 HLK Kootenay Beaver Waneta Little Kettle Falls Eddy Eddy Creek Eddy Dalles Bridge Hunters Sonic Tag ID No (L) Pit tag #: Feb-06 1-Jan-06 1-Dec-05 1-Nov-05 1-Oct-05 1-Sep-05 1-Aug-05 1-Jul-05 1-Jun-05 1-May-05 1-Apr-05 1-Mar-05 Release Location Columbia River Detection Date 1-Apr-06 1-Mar-06 HLK Kootenay Beaver Waneta Little Kettle Falls Eddy Eddy Creek Eddy Dalles Bridge Hunters Sonic Tag ID No (L) Pit tag #: Feb-06 1-Jan-06 1-Dec-05 1-Nov-05 1-Oct-05 1-Sep-05 1-Aug-05 1-Jul-05 1-Jun-05 1-May-05 1-Apr-05 1-Mar River Kilometre Release Location Columbia River Detection Figure D3 Continued.
174 1-Apr-06 1-Mar-06 HLK Kootenay Beaver Waneta Little Kettle Falls Eddy Eddy Creek Eddy Dalles Bridge Hunters Sonic Tag ID No (L) Pit tag #: Feb-06 1-Jan-06 1-Dec-05 1-Nov-05 1-Oct-05 1-Sep-05 1-Aug-05 1-Jul-05 1-Jun-05 1-May-05 1-Apr-05 1-Mar-05 Release Location Columbia River Detection Date 1-Apr-06 1-Mar-06 HLK Kootenay Beaver Waneta Little Kettle Falls Eddy Eddy Creek Eddy Dalles Bridge Hunters Sonic Tag ID No (L) Pit tag #: Feb-06 1-Jan-06 1-Dec-05 1-Nov-05 1-Oct-05 1-Sep-05 1-Aug-05 1-Jul-05 1-Jun-05 1-May-05 1-Apr-05 1-Mar River Kilometre Release Location Columbia River Detection Figure D3 Continued.
175 1-Apr-06 1-Mar-06 1-Feb-06 HLK Kootenay Beaver Waneta Little Kettle Falls Eddy Eddy Creek Eddy Dalles Bridge Hunters Sonic Tag ID No (L) Pit tag #: Jan-06 1-Dec-05 1-Nov-05 1-Oct-05 1-Sep-05 1-Aug-05 1-Jul-05 1-Jun-05 1-May-05 1-Apr-05 1-Mar-05 Release Location Columbia River Detection Date 1-Apr-06 1-Mar-06 1-Feb-06 HLK Kootenay Beaver Waneta Little Kettle Falls Eddy Eddy Creek Eddy Dalles Bridge Hunters Sonic Tag ID No (L) Pit tag #: Jan-06 1-Dec-05 1-Nov-05 1-Oct-05 1-Sep-05 1-Aug-05 1-Jul-05 1-Jun-05 1-May-05 1-Apr-05 1-Mar River Kilometre Release Location Columbia River Detection Figure D3 Continued.
176 1-Apr-06 1-Mar-06 1-Feb-06 HLK Kootenay Beaver Waneta Little Kettle Falls Eddy Eddy Creek Eddy Dalles Bridge Hunters Sonic Tag ID No (L) Pit tag #: Jan-06 1-Dec-05 1-Nov-05 1-Oct-05 1-Sep-05 1-Aug-05 1-Jul-05 1-Jun-05 1-May-05 1-Apr-05 1-Mar-05 Release Location Columbia River Detection Date 1-Apr-06 1-Mar-06 1-Feb-06 HLK Kootenay Beaver Waneta Little Kettle Falls Eddy Eddy Creek Eddy Dalles Bridge Hunters Sonic Tag ID No (L) Pit tag #: Jan-06 1-Dec-05 1-Nov-05 1-Oct-05 1-Sep-05 1-Aug-05 1-Jul-05 1-Jun-05 1-May-05 1-Apr-05 1-Mar River Kilometre Release Location Columbia River Detection Figure D3 Continued.
177 1-Apr-06 1-Mar-06 1-Feb-06 HLK Kootenay Beaver Waneta Little Kettle Falls Eddy Eddy Creek Eddy Dalles Bridge Hunters Sonic Tag ID No (L) Pit tag #: Jan-06 1-Dec-05 1-Nov-05 1-Oct-05 1-Sep-05 1-Aug-05 1-Jul-05 1-Jun-05 1-May-05 1-Apr-05 1-Mar-05 Release Location Columbia River Detection Date 1-Apr-06 1-Mar-06 1-Feb-06 HLK Kootenay Beaver Waneta Little Kettle Falls Eddy Eddy Creek Eddy Dalles Bridge Hunters Sonic Tag ID No (L) Pit tag #: Jan-06 1-Dec-05 1-Nov-05 1-Oct-05 1-Sep-05 1-Aug-05 1-Jul-05 1-Jun-05 1-May-05 1-Apr-05 1-Mar River Kilometre Release Location Columbia River Detection Figure D3 Continued.
178 1-Apr-06 1-Mar-06 HLK Kootenay Beaver Waneta Little Kettle Falls Eddy Eddy Creek Eddy Dalles Bridge Hunters Sonic Tag ID No (L) Pit tag #: Feb-06 1-Jan-06 1-Dec-05 1-Nov-05 1-Oct-05 1-Sep-05 1-Aug-05 1-Jul-05 1-Jun-05 1-May-05 1-Apr-05 1-Mar-05 Release Location Columbia River Detection Date 1-Apr-06 1-Mar-06 HLK Kootenay Beaver Waneta Little Kettle Falls Eddy Eddy Creek Eddy Dalles Bridge Hunters Sonic Tag ID No (L) Pit tag #: Feb-06 1-Jan-06 1-Dec-05 1-Nov-05 1-Oct-05 1-Sep-05 1-Aug-05 1-Jul-05 1-Jun-05 1-May-05 1-Apr-05 1-Mar River Kilometre Release Location Columbia River Detection Figure D3 Continued.
179 1-Apr-06 1-Mar-06 1-Feb-06 HLK Kootenay Beaver Waneta Little Kettle Falls Eddy Eddy Creek Eddy Dalles Bridge Hunters Sonic Tag ID No (L) Pit tag #: Jan-06 1-Dec-05 1-Nov-05 1-Oct-05 1-Sep-05 1-Aug-05 1-Jul-05 1-Jun-05 1-May-05 1-Apr-05 1-Mar-05 Release Location Columbia River Detection Date 1-Apr-06 1-Mar-06 1-Feb-06 HLK Kootenay Beaver Waneta Little Kettle Falls Eddy Eddy Creek Eddy Dalles Bridge Hunters Sonic Tag ID No (L) Pit tag #: Jan-06 1-Dec-05 1-Nov-05 1-Oct-05 1-Sep-05 1-Aug-05 1-Jul-05 1-Jun-05 1-May-05 1-Apr-05 1-Mar River Kilometre Release Location Columbia River Detection Figure D3 Continued.
180 1-Apr-06 1-Mar-06 HLK Kootenay Beaver Waneta Little Kettle Falls Eddy Eddy Creek Eddy Dalles Bridge Hunters Sonic Tag ID No (L) Pit tag #: Feb-06 1-Jan-06 1-Dec-05 1-Nov-05 1-Oct-05 1-Sep-05 1-Aug-05 1-Jul-05 1-Jun-05 1-May-05 1-Apr-05 1-Mar-05 Release Location Columbia River Detection Date 1-Apr-06 1-Mar-06 HLK Kootenay Beaver Waneta Little Kettle Falls Eddy Eddy Creek Eddy Dalles Bridge Hunters Sonic Tag ID No (L) Pit tag #: Feb-06 1-Jan-06 1-Dec-05 1-Nov-05 1-Oct-05 1-Sep-05 1-Aug-05 1-Jul-05 1-Jun-05 1-May-05 1-Apr-05 1-Mar River Kilometre Release Location Columbia River Detection Figure D3 Continued.
181 1-Apr-06 1-Mar-06 1-Feb-06 HLK Kootenay Beaver Waneta Little Kettle Falls Eddy Eddy Creek Eddy Dalles Bridge Hunters Sonic Tag ID No (H) Pit tag #: Jan-06 1-Dec-05 1-Nov-05 1-Oct-05 1-Sep-05 1-Aug-05 1-Jul-05 1-Jun-05 1-May-05 1-Apr-05 1-Mar-05 Release Location Columbia River Detection Date 1-Apr-06 1-Mar-06 HLK Kootenay Beaver Waneta Little Kettle Falls Eddy Eddy Creek Eddy Dalles Bridge Hunters Sonic Tag ID No (H) Pit tag #: Feb-06 1-Jan-06 1-Dec-05 1-Nov-05 1-Oct-05 1-Sep-05 1-Aug-05 1-Jul-05 1-Jun-05 1-May-05 1-Apr-05 1-Mar River Kilometre Release Location Columbia River Detection Figure D3 Continued.
182 1-Apr-06 1-Mar-06 1-Feb-06 HLK Kootenay Beaver Waneta Little Kettle Falls Eddy Eddy Creek Eddy Dalles Bridge Hunters Sonic Tag ID No (H) Pit tag #: Jan-06 1-Dec-05 1-Nov-05 1-Oct-05 1-Sep-05 1-Aug-05 1-Jul-05 1-Jun-05 1-May-05 1-Apr-05 1-Mar-05 Release Location Columbia River Detection Date 1-Apr-06 1-Mar-06 1-Feb-06 HLK Kootenay Beaver Waneta Little Kettle Falls Eddy Eddy Creek Eddy Dalles Bridge Hunters Sonic Tag ID No (H) Pit tag #: Jan-06 1-Dec-05 1-Nov-05 1-Oct-05 1-Sep-05 1-Aug-05 1-Jul-05 1-Jun-05 1-May-05 1-Apr-05 1-Mar River Kilometre Release Location Columbia River Detection Figure D3 Continued.
183 1-Apr-06 1-Mar-06 HLK Kootenay Beaver Waneta Little Kettle Falls Eddy Eddy Creek Eddy Dalles Bridge Hunters Sonic Tag ID No (H) Pit tag #: Feb-06 1-Jan-06 1-Dec-05 1-Nov-05 1-Oct-05 1-Sep-05 1-Aug-05 1-Jul-05 1-Jun-05 1-May-05 1-Apr-05 1-Mar-05 Release Location Columbia River Detection Date 1-Apr-06 1-Mar-06 HLK Kootenay Beaver Waneta Little Kettle Falls Eddy Eddy Creek Eddy Dalles Bridge Hunters Sonic Tag ID No (H) Pit tag #: Feb-06 1-Jan-06 1-Dec-05 1-Nov-05 1-Oct-05 1-Sep-05 1-Aug-05 1-Jul-05 1-Jun-05 1-May-05 1-Apr-05 1-Mar River Kilometre Release Location Columbia River Detection Figure D3 Continued.
184 1-Apr-06 1-Mar-06 1-Feb-06 HLK Kootenay Beaver Waneta Little Kettle Falls Eddy Eddy Creek Eddy Dalles Bridge Hunters Sonic Tag ID No (H) Pit tag #: Jan-06 1-Dec-05 1-Nov-05 1-Oct-05 1-Sep-05 1-Aug-05 1-Jul-05 1-Jun-05 1-May-05 1-Apr-05 1-Mar-05 Release Location Columbia River Detection Date 1-Apr-06 1-Mar-06 1-Feb-06 HLK Kootenay Beaver Waneta Little Kettle Falls Eddy Eddy Creek Eddy Dalles Bridge Hunters Sonic Tag ID No (H) Pit tag #: Jan-06 1-Dec-05 1-Nov-05 1-Oct-05 1-Sep-05 1-Aug-05 1-Jul-05 1-Jun-05 1-May-05 1-Apr-05 1-Mar River Kilometre Release Location Columbia River Detection Figure D3 Continued.
185 1-Apr-06 1-Mar-06 1-Feb-06 HLK Kootenay Beaver Waneta Little Kettle Falls Eddy Eddy Creek Eddy Dalles Bridge Hunters Sonic Tag ID No (H) Pit tag #: Jan-06 1-Dec-05 1-Nov-05 1-Oct-05 1-Sep-05 1-Aug-05 1-Jul-05 1-Jun-05 1-May-05 1-Apr-05 1-Mar-05 Release Location Columbia River Detection Date 1-Apr-06 1-Mar-06 1-Feb-06 HLK Kootenay Beaver Waneta Little Kettle Falls Eddy Eddy Creek Eddy Dalles Bridge Hunters Sonic Tag ID No (H) Pit tag #: Jan-06 1-Dec-05 1-Nov-05 1-Oct-05 1-Sep-05 1-Aug-05 1-Jul-05 1-Jun-05 1-May-05 1-Apr-05 1-Mar River Kilometre Release Location Columbia River Detection Figure D3 Continued.
186 1-Apr-06 1-Mar-06 1-Feb-06 HLK Kootenay Beaver Waneta Little Kettle Falls Eddy Eddy Creek Eddy Dalles Bridge Hunters Sonic Tag ID No (H) Pit tag #: Jan-06 1-Dec-05 1-Nov-05 1-Oct-05 1-Sep-05 1-Aug-05 1-Jul-05 1-Jun-05 1-May-05 1-Apr-05 1-Mar-05 Release Location Columbia River Detection Capture Location Date 1-Apr-06 1-Mar-06 1-Feb-06 HLK Kootenay Beaver Waneta Little Kettle Falls Eddy Eddy Creek Eddy Dalles Bridge Hunters Sonic Tag ID No (H) Pit tag #: Jan-06 1-Dec-05 1-Nov-05 1-Oct-05 1-Sep-05 1-Aug-05 1-Jul-05 1-Jun-05 1-May-05 1-Apr-05 1-Mar River Kilometre Release Location Columbia River Detection Figure D3 Continued.
187 1-Apr-06 1-Mar-06 1-Feb-06 HLK Kootenay Beaver Waneta Little Kettle Falls Eddy Eddy Creek Eddy Dalles Bridge Hunters Sonic Tag ID No (H) Pit tag #: Jan-06 1-Dec-05 1-Nov-05 1-Oct-05 1-Sep-05 1-Aug-05 1-Jul-05 1-Jun-05 1-May-05 1-Apr-05 1-Mar-05 Release Location Columbia River Detection Date 1-Apr-06 1-Mar-06 1-Feb-06 HLK Kootenay Beaver Waneta Little Kettle Falls Eddy Eddy Creek Eddy Dalles Bridge Hunters Sonic Tag ID No (H) Pit tag #: Jan-06 1-Dec-05 1-Nov-05 1-Oct-05 1-Sep-05 1-Aug-05 1-Jul-05 1-Jun-05 1-May-05 1-Apr-05 1-Mar River Kilometre Release Location Columbia River Detection Figure D3 Continued.
188 1-Apr-06 1-Mar-06 1-Feb-06 HLK Kootenay Beaver Waneta Little Kettle Falls Eddy Eddy Creek Eddy Dalles Bridge Hunters Sonic Tag ID No (H) Pit tag #: Jan-06 1-Dec-05 1-Nov-05 1-Oct-05 1-Sep-05 1-Aug-05 1-Jul-05 1-Jun-05 1-May-05 1-Apr-05 1-Mar-05 Release Location Columbia River Detection Date 1-Apr-06 1-Mar-06 1-Feb-06 HLK Kootenay Beaver Waneta Little Kettle Falls Eddy Eddy Creek Eddy Dalles Bridge Hunters Sonic Tag ID No (H) Pit tag #: Jan-06 1-Dec-05 1-Nov-05 1-Oct-05 1-Sep-05 1-Aug-05 1-Jul-05 1-Jun-05 1-May-05 1-Apr-05 1-Mar River Kilometre Release Location Columbia River Detection Figure D3 Concluded.
189 Date 8-Mar Feb-06 8-Feb Jan Jan Dec Dec Nov Nov-05 2-Nov Oct-05 5-Oct Sep-05 7-Sep Aug Aug Jul Jul Jun Jun-05 1-Jun May-05 4-May River Kilometre Figure D4 Dispersal of sonic tagged juvenile white sturgeon released at Beaver Creek in May 2005 that moved beyond Fort Shepherd and Waneta eddies. Note: river kilometre 10.5 corresponds to the mouth of the Kootenay River; 10.5 = mouth, 13.3 = Brilliant Dam.
190
191 Date 15-Mar-06 1-Mar Feb-06 1-Feb Jan-06 4-Jan Dec-05 7-Dec Nov-05 9-Nov Oct Oct Sep Sep Aug Aug Aug Jul Jul Jun Jun May May River Kilometre Figure D5 Dispersal of sonic tagged juvenile white sturgeon released in the Roosevelt Reach in May Note: river kilometre 10.5 corresponds to the mouth of the Kootenay River; 10.5 = mouth, 13.3 = Brilliant Dam.
192
193 APPENDIX E PROGRAM MARK SURVIVAL ANALYSIS
194 Juvenile hatchery white sturgeon survival from time of release to time of capture. Parameter estimation by Monte Carlo Markov Chain sampling in Program MARK for selected model. Phi (1) is survival from initial release to fall capture for fish released in 2002; Phi (2) is survival from initial release to fall capture of fish released in 2003, 2004 and 2005; Phi (3) is annual survival rate for all subsequent age groups and cohorts after the first 6 months in the river. Real Function Parameters of {phi (1,2=hatch, 3=all else) p (t with t=4=t=3)}mcmc} Parameter Mean St. Dev. Median Mode Percentile 2.5 th 5 th 10 th 20 th 80 th 90 th 95 th 97.5 th 1:Phi :Phi :Phi :p :p :p
195 APPENDIX F PROJECTIONS OF JUVENILE WHITE STURGEON SURVIVAL AND ABUNDANCE
196 Table F1 Projections by cohort of survival estimates of hatchery juvenile white sturgeon. Tagged Survival Study Fish Fall Fall Fall Fall Fall Fall Fall Fall Fall Fall Fall Fall Fall Fall Fall Fall Fall Fall Fall Fall Fall Year Released
197 Table F2 Projections by cohort of abundance estimates of hatchery juvenile white sturgeon. Tagged Abundance Projections Assuming Constant Survival Study Fish Fall Fall Fall Fall Fall Fall Fall Fall Fall Fall Fall Fall Fall Fall Fall Fall Fall Fall Fall Fall Fall Year Released Total
198 PLATES


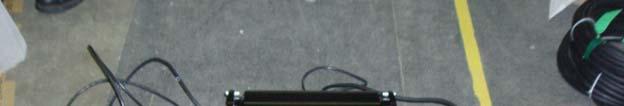


199 Plate 1 Floating platform, box and anchors of remote PIT tag reader system. Plate 2 Underwater housing and antenna of remote PIT tag reader system. Plate 3 Open underwater housing showing PIT tag reader and antenna tuner. Plate 4 Underwater housing attached to metal anchor frame.
200


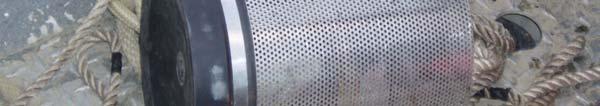


201 Plate 5 Antenna showing protected cable to underwater housing. Plate 6 Deployed remote pit tag reader system. Plate 7 Deployed floating platform with open box where batteries, communication and power cables are stored. Floats were attached to each corner of the platform to provide stability and extra floatation. Plate 8 Bait canister that was deployed near remote pit tag reader system to attract juvenile white sturgeon.
Columbia River Project Water Use Plan
 Columbia River Project Water Use Plan Lower Columbia River Reference: CLBMON #28 (Year 8) Lower Columbia River Adult White Sturgeon Monitoring Program: 2015 Investigations Data Report Study Period: January
Columbia River Project Water Use Plan
 Columbia River Project Water Use Plan Columbia River White Sturgeon Management Plan Lower Columbia River Adult White Sturgeon Monitoring Program: 2016 Investigations Data Report Implementation Year 9 Reference:
Columbia River Project Water Use Plan
 Columbia River Project Water Use Plan Lower Columbia River (Year 1) Reference: CLBMON#45 Columbia River Water Use Plan Monitoring Program: Lower Columbia River Fish Indexing Survey Study Period: 27 Dustin
Columbia River Project Water Use Plan
 Columbia River Project Water Use Plan Lower Columbia River Reference: CLBMON #29 Year 6 and Year 7) Lower Columbia River Juvenile Sturgeon Detection Program: 2013 and 2014 Investigations Data Report Study
LAKE ROOSEVELT WHITE STURGEON RECOVERY PROJECT ANNUAL PROGRESS REPORT. January 2003 March Prepared by. Matthew D. Howell. and. Jason G.
 LAKE ROOSEVELT WHITE STURGEON RECOVERY PROJECT ANNUAL PROGRESS REPORT January 2003 March 2004 Prepared by Matthew D. Howell and Jason G. McLellan Washington Department of Fish and Wildlife Region 1 (Northeast)
Koocanusa Reservoir Kokanee Spawner Index
 Koocanusa Reservoir Kokanee Spawner Index - 2005 Authored by: Harald Manson Fisheries Biologist Updated by: Louise Porto MSc., RPBio. Fisheries Biologist Columbia Basin Fish & Wildlife Compensation Program
Job 1. Title: Estimate abundance of juvenile trout and salmon.
 STUDY PERFORMANCE REPORT State: Michigan Project No.: F-53-R-13 Study No.: 461 Title: Population dynamics of juvenile rainbow trout and coho salmon in Lake Superior tributaries Period Covered: April 1,
ASSESSMENT OF THE STATUS OF NESTUCCA RIVER WINTER STEELHEAD
 ASSESSMENT OF THE STATUS OF NESTUCCA RIVER WINTER STEELHEAD Gary Susac and Steve Jacobs Coastal Salmonid Inventory Project Oregon Department of Fish and Wildlife August 21, 2001 INTRODUCTION This report
Agenda Item Summary BACKGROUND. Public Involvement ISSUE ANALYSIS. Attachment 1
 Agenda Item Summary Attachment BACKGROUND Between 996 and 03 white sturgeon fisheries in the Columbia River downstream from Bonneville Dam were managed under a series of management accords between the
1998 Thompson River Steelhead Angler Survey
 Prepared for: The Ministry of Environment, Lands and Parks Fisheries Branch, Southern Interior Region 1259 Dalhousie Dr. Kamloops, BC V2C 5Z5 Prepared by: Stacy L. Webb (B.NRSc.) and Sean Bennett (R.P.Bio)
KOOCANUSA KOKANEE ENUMERATION (2003) Prepared by: W. T. Westover Fisheries Biologist
 Prepared by: W. T. Westover Fisheries Biologist") KOOCANUSA KOKANEE ENUMERATION (2003) Prepared by: W. T. Westover Fisheries Biologist Ministry of Water, Land and Air Protection 205 Industrial Road G, Cranbrook, B. C. V1C 7G5 December, 2003 INTRODUCTION
KOOCANUSA KOKANEE ENUMERATION (2003) Prepared by: W. T. Westover Fisheries Biologist Ministry of Water, Land and Air Protection 205 Industrial Road G, Cranbrook, B. C. V1C 7G5 December, 2003 INTRODUCTION
NEVADA DEPARTMENT OF WILDLIFE STATEWIDE FISHERIES MANAGEMENT
 NEVADA DEPARTMENT OF WILDLIFE STATEWIDE FISHERIES MANAGEMENT FEDERAL AID JOB PROGRESS REPORTS F-20-52 2016 Lake Tahoe Rainbow Trout Study WESTERN REGION NEVADA DEPARTMENT OF WILDLIFE, FISHERIES DIVISION
Proposed 2018 Fisheries Management Measures to Support Recovery of Interior Fraser River Steelhead
 Proposed 2018 Fisheries Management Measures to Support Recovery of Interior Fraser River Steelhead 22-March-2018 Spawning escapements of two Interior Fraser River steelhead stocks, Thompson and Chilcotin
Steve Hemstrom Sr. Fisheries Biologist Chelan PUD Natural Resources Desk: Cell:
 From: To: Cc: Subject: Date: Attachments: Hemstrom, Steven "Lewis, Stephen" Sokolowski, Rosana 2014 Rocky Reach Bull Trout Report Wednesday, June 18, 2014 3:01:07 PM Final 2014 Rocky Reach Bull Trout Observations
* * * * * * * * * * * *
 Excerpts from Idaho Department of Fish and Game, 2003 Fishery Management Report. Southwest Region Nampa 2003. Brian J. Flatter, Regional Fishery Biologist, Kurtis Plaster, Senior Fishery Technician, Jeff
Status of Northern Pike and Yellow Perch at Goosegrass Lake, Alberta, 2006
 Status of Northern Pike and Yellow Perch at Goosegrass Lake, Alberta, 2006 CONSERVATION REPORT SERIES The Alberta Conservation Association is a Delegated Administrative Organization under Alberta s Wildlife
Preliminary survival estimates for the passage of spring-migrating juvenile salmonids through Snake and Columbia River dams and reservoirs, 2017
 UNITED STATES DEPARTMENT OF COMMERCE National Oceanic and Atmospheric Administration NATIONAL MARINE FISHERIES SERVICE Northwest Fisheries Science Center Fish Ecology Division 2725 Montlake Boulevard East
Preliminary survival estimates for the passage of spring-migrating juvenile salmonids through Snake and Columbia River dams and reservoirs, 2018
 UNITED STATES DEPARTMENT OF COMMERCE National Oceanic and Atmospheric Administration NATIONAL MARINE FISHERIES SERVICE Northwest Fisheries Science Center Fish Ecology Division 2725 Montlake Boulevard East
C R I TFC. Columbia River Inter-Tribal Fish Commission
 Columbia River Inter-Tribal Fish Commission 700 NE Multnomah, Suite 1200 503.238.0667 Portland, OR 97232 www.critfc.org C R I TFC T E CHNI C AL R E P O R T 13-07 Analyses for Effect of Survey Week and
Youngs Creek Hydroelectric Project (FERC No. P 10359)
") Youngs Creek Hydroelectric Project (FERC No. P 10359) Resident Trout Monitoring Plan Annual Report 2010 Survey and Results of Pre Project Monitoring Prepared by: September 2010 Overview The Public Utility
Youngs Creek Hydroelectric Project (FERC No. P 10359) Resident Trout Monitoring Plan Annual Report 2010 Survey and Results of Pre Project Monitoring Prepared by: September 2010 Overview The Public Utility
Coquitlam/Buntzen Project Water Use Plan
 Coquitlam/Buntzen Project Water Use Plan Temperature Monitoring Lower Coquitlam River Project Year 3 Report Reference: COQMON#6 Study Period: March 2008 April 2009 Report Date: April 2009 Trow Associates
Fish Habitat Restoration and Monitoring in Southeast Washington. Andy Hill Eco Logical Research, Inc.
 Fish Habitat Restoration and Monitoring in Southeast Washington Andy Hill Eco Logical Research, Inc. Fish Habitat Restoration and Monitoring in Southeast Washington Talk overview: Restoration projects
CHAPTER 3: ROCKY REACH WHITE STURGEON MANAGEMENT PLAN
 CHAPTER 3: ROCKY REACH WHITE STURGEON MANAGEMENT PLAN TABLE OF CONTENTS CHAPTER 3: ROCKY REACH WHITE STURGEON MANAGEMENT PLAN... 3-1 EXECUTIVE SUMMARY... 3-1 SECTION 1: INTRODUCTION... 3-3 SECTION 2:
STUDY PERFORMANCE REPORT
 STUDY PERFORMANCE REPORT State: Michigan Project No.: F-81-R-3 Study No.: 491 Title: Evaluation of lake sturgeon Acipenser fulvescens populations in the St. Clair River and Lake St. Clair Period Covered:
Lower Coquitlam River Project Water Use Plan. Temperature Monitoring Lower Coquitlam River Project Year 2 Report
 Lower Coquitlam River Project Water Use Plan Temperature Monitoring Lower Coquitlam River Project Year 2 Report COQMON#6 Temperature Monitoring Study Lower Coquitlam River Study Period: Year 2-2007 Report
Nechako White Sturgeon: Conservation Fish Culture; Recruitment Restoration and Harm Reduction
 Nechako White Sturgeon: Conservation Fish Culture; Recruitment Restoration and Harm Reduction Brian Frenkel Freshwater Fisheries Society of BC Chair- NWSRI- Community Working Group www.nechakowhitesturgeon
NEVADA DEPARTMENT OF WILDLIFE STATEWIDE FISHERIES MANAGEMENT
 NEVADA DEPARTMENT OF WILDLIFE STATEWIDE FISHERIES MANAGEMENT FEDERAL AID JOB PROGRESS REPORTS F-2-49 213 RYE PATCH RESERVOIR WESTERN REGION NEVADA DEPARTMENT OF WILDLIFE, FISHERIES DIVISION ANNUAL PROGRESS
Chinook Salmon Spawning Study Russian River Fall 2005
 Chinook Salmon Spawning Study Russian River Fall 2005 Sonoma County Water Agency 2150 West College Avenue Santa Rosa, California 95401 Prepared by David Cook - Senior Environmental Specialist March 27,
Minnesota Department of Natural Resources Fisheries Division, Lake Superior Area
 Minnesota F-9-R(P)- Study 4 Job 616 Minnesota Department of Natural Resources Fisheries Division, Lake Superior Area Coaster Brook Trout Status in Minnesota-Lake Superior Tributaries Following Regulation
Preliminary survival estimates for the passage of spring-migrating juvenile salmonids through Snake and Columbia River dams and reservoirs, 2016
 UNITED STATES DEPARTMENT OF COMMERCE National Oceanic and Atmospheric Administration NATIONAL MARINE FISHERIES SERVICE Northwest Fisheries Science Center Fish Ecology Division 2725 Montlake Boulevard East
Discussion on the Selection of the Recommended Fish Passage Design Discharge
 Discussion on the Selection of the Recommended Fish Passage Design Discharge Introduction The provision of fish passage is a requirement for most proposed culvert and bridge installations in Alberta, depending
Downstream Migrant Trapping in Russian River Mainstem, Tributaries, and Estuary
 Downstream Migrant Trapping in Russian River Mainstem, Tributaries, and Estuary Introduction In September 2008, the National Marine Fisheries Service issued the Russian River Biological Opinion, which
Alberta Conservation Association 2009/10 Project Summary Report. Project Name: North Saskatchewan and Ram Rivers Bull Trout Spawning Stock Assessment
 Alberta Conservation Association 2009/10 Project Summary Report Project Name: North Saskatchewan and Ram Rivers Bull Trout Spawning Stock Assessment Fisheries Program Manager: Peter Aku Project Leader:
Side-scan Sonar Surveys of Potential White Sturgeon (Acipenser transmontanus) Spawning Areas in the Lower Fraser River, 2015
 Spawning Areas in the Lower Fraser River, 2015") Side-scan Sonar Surveys of Potential White Sturgeon (Acipenser transmontanus) Spawning Areas in the Lower Fraser River, 2015 Prepared for: Habitat Conservation Trust Fund 107 19 Dallas Rd Victoria BC V8V
Side-scan Sonar Surveys of Potential White Sturgeon (Acipenser transmontanus) Spawning Areas in the Lower Fraser River, 2015 Prepared for: Habitat Conservation Trust Fund 107 19 Dallas Rd Victoria BC V8V
Dauphin Lake Fishery. Status of Walleye Stocks and Conservation Measures
 Dauphin Lake Fishery Status of Walleye Stocks and Conservation Measures Date: December, 21 Dauphin Lake Fishery Status of Walleye Stocks and Conservation Measures Background: Walleye stocks in Dauphin
Youngs Creek Hydroelectric Project
 Youngs Creek Hydroelectric Project (FERC No. 10359) Resident Trout Monitoring Plan Annual Report 2014 Survey Prepared by: Everett, WA November 2014 Final This document has been prepared for the District.
RESTORING BURBOT IN THE KOOTENAI RIVER: MONITORING AND EVALUATION
 RESTORING BURBOT IN THE KOOTENAI RIVER: MONITORING AND EVALUATION OVERVIEW Objectives and agency roles Field efforts Population updates Looking ahead Summary OBJECTIVES AND AGENCY ROLES Overarching objective
JOINT STAFF REPORT WINTER FACT SHEET NO. 9 Columbia River Compact March 18, 2004
 JOINT STAFF REPORT WINTER FACT SHEET NO. 9 Columbia River Compact March 18, 2004 Purpose: To review ongoing commercial fisheries and consider non-indian commercial fishing seasons for salmon, smelt and
Data Report : Russian River Basin Steelhead and Coho Salmon Monitoring Program Pilot Study
 Data Report 1999-1: Russian River Basin Steelhead and Coho Salmon Monitoring Program Pilot Study Sonoma County Water Agency 215 West College Avenue Santa Rosa, California 951 Prepared by David Cook Senior
Savannah River, Georgia and South Carolina
 Scope of Work for Use of the Fish Bypass at New Savannah Bluff Lock and Dam for the Savannah Harbor Expansion Project Monitoring and Adaptive Management Program Savannah River, Georgia and South Carolina
Aerated Lakes Angler Survey: Swan and Spring Lakes, Alberta, 2015
 Aerated Lakes Angler Survey: Swan and Spring Lakes, Alberta, 2015 The Alberta Conservation Association is a Delegated Administrative Organization under Alberta s Wildlife Act. Aerated Lakes Angler Survey:
Technical Report
 Technical Report 2003-04 Effects of the Shad Fishery on Passage of Adult Chinook Salmon through the Oregon-shore Fishway Ladder at The Dalles Dam 2002 M. A. Jepson, C.L. Williams, and C.A. Peery Idaho
RAMSTM. 360 Riser and Anchor-Chain Integrity Monitoring for FPSOs
 RAMS 360 Riser and Anchor-Chain Integrity Monitoring for FPSOs Introduction to RAMS Tritech s RAMS is a 360 anchor-chain and riser integrity monitoring system for Floating Production Storage and Offloading
Packwood Lake Intake Screen Velocity Test Report for Energy Northwest's Packwood Lake Hydroelectric Project FERC No Lewis County, Washington
 for Energy Northwest's Packwood Lake Hydroelectric Project FERC No. 2244 Lewis County, Washington Submitted to P.O. Box 968 Richland, Washington 99352-0968 Submitted by EES Consulting 1155 North State
A Portable Vertical Gill-Net System
 INTERNAL REPORT 42 A Portable Vertical Gill-Net System N. W. Bartoo, R. G. Hanson, and R. S. Wydoski September 1972 University of Washington FOR REVIEW ONLY NOT FOR PUBLICATION A PORTABLE VERTICAL GILL-NET
Confederated Tribes of the Warm Springs Reservation
 Confederated Tribes of the Warm Springs Reservation PACIFIC LAMPREY STUDIES Cyndi Baker Jen Graham Joel Santos Matt Fox Lamprey Program History 1997: Member of lamprey working group 2002: First lamprey
Okanagan Sockeye Reintroduction
 Okanagan Sockeye Reintroduction Backgrounder Elders accounts, and other forms of Traditional Ecological Knowledge (TEK) tell us that many species of salmon once came into the Okanagan Valley and tell us
Admiralty Inlet Pilot Tidal Project FERC No Appendix C. Derelict Gear Monitoring Plan
 Appendix C Derelict Gear Monitoring Plan ADMIRALTY INLET PILOT TIDAL PROJECT FERC PROJECT NO. 12690 DERELICT GEAR MONITORING PLAN (submitted with the Final Application for a New Pilot Project License)
NEVADA DEPARTMENT OF WILDLIFE STATEWIDE FISHERIES MANAGEMENT
 NEVADA DEPARTMENT OF WILDLIFE STATEWIDE FISHERIES MANAGEMENT FEDERAL AID JOB PROGRESS REPORTS F-2-52 216 CHIMNEY RESERVOIR WESTERN REGION NEVADA DEPARTMENT OF WILDLIFE, FISHERIES DIVISION JOB PROGRESS
Canadian Columbia River Inter-tribal Fisheries. Report Number: R-Rev0 Distribution: Canadian Columbia River Inter-tribal Fisheries
 Chinook Salmon Spawning Habitat Availability in the Lower Columbia River Submitted to: Will Warnock Canadian Columbia River Inter-tribal Fisheries Commission 7468 Mission Rd. Cranbrook, BC V1C 7E5 REPORT
OREGON AND WASHINGTON DEPARTMENTS OF FISH AND WILDLIFE JOINT STAFF REPORT: SUMMER FACT SHEET NO. 1 Columbia River Compact June 13, 2012
 OREGON AND WASHINGTON DEPARTMENTS OF FISH AND WILDLIFE JOINT STAFF REPORT: SUMMER FACT SHEET NO. 1 Columbia River Compact June 13, 2012 Fisheries under consideration: Non-Indian commercial salmon Treaty
2013 WHITE SALMON CHINOOK SALMON VSP MONITORING. Jeremy Wilson Washington Department of Fish and Wildlife
 2013 WHITE SALMON CHINOOK SALMON VSP MONITORING Jeremy Wilson Washington Department of Fish and Wildlife Study Area Outline History of WDFW Chinook Monitoring in WS 2013 Objectives 2013 Study Design 2013
Cedar Lake Comprehensive Survey Report Steve Hogler and Steve Surendonk WDNR-Mishicot
 Cedar Lake- 2006 Comprehensive Survey Report Steve Hogler and Steve Surendonk WDNR-Mishicot ABSTRACT Cedar Lake is a 142 acre lake located in the southwest corner of Manitowoc County. It is a seepage lake
OREGON AND WASHINGTON DEPARTMENTS OF FISH AND WILDLIFE JOINT STAFF REPORT SUMMER FACT SHEET NO.
 OREGON AND WASHINGTON DEPARTMENTS OF FISH AND WILDLIFE JOINT STAFF REPORT SUMMER FACT SHEET NO. 1 Columbia River Compact/Joint State Hearing June 28, 2018 Fisheries under consideration: Treaty commercial
Manual of Fisheries Survey Methods II: with periodic updates. Chapter 22: Guidelines for Sampling Warmwater Rivers with Rotenone
 Manual of Fisheries Survey Methods II: with periodic updates : Guidelines for Sampling Warmwater Rivers with Rotenone P. W. Seelbach, G. L. Towns, and D. D. Nelson Suggested citation: Seelbach, Paul W.,
Yale Reservoir Kokanee (Oncorhynchus nerka) Escapement Report 2016
 Escapement Report 2016") Yale Reservoir Kokanee (Oncorhynchus nerka) Escapement Report 2016 North Fork Lewis River Hydroelectric Project Yale FERC No. 2071 Prepared by: Jeremiah Doyle, PacifiCorp April 4, 2017 1.0 INTRODUCTION
Yale Reservoir Kokanee (Oncorhynchus nerka) Escapement Report 2016 North Fork Lewis River Hydroelectric Project Yale FERC No. 2071 Prepared by: Jeremiah Doyle, PacifiCorp April 4, 2017 1.0 INTRODUCTION
THE CONFEDERATED TRIBES OF THE WARM SPRINGS RESERVATION OF OREGON
 THE CONFEDERATED TRIBES OF THE WARM SPRINGS RESERVATION OF OREGON To: Branch of Natural Resources P.0. Box C, Warm Springs, Oregon 97761 Phone (541) 553-2002/2003 Fax (541) 553-1994 The Independent Science
Application of a New Method for Monitoring Lake Trout Abundance in Yukon: Summer Profundal Index Netting (SPIN)
") Application of a New Method for Monitoring Lake Trout Abundance in Yukon: Summer Profundal Index Netting (SPIN) Prepared by: Lars Jessup Nathan Millar November 2011 Application of a New Method for Monitoring
Application of a New Method for Monitoring Lake Trout Abundance in Yukon: Summer Profundal Index Netting (SPIN) Prepared by: Lars Jessup Nathan Millar November 2011 Application of a New Method for Monitoring
Study Update Fish Distribution and Species Composition
 Study Update Fish Distribution and Species Composition Goals and Study Area Gain a better understanding of fish species composition and abundance in waters associated with the Packwood Lake Hydroelectric
NEVADA DEPARTMENT OF WILDLIFE STATEWIDE FISHERIES MANAGEMENT
 NEVADA DEPARTMENT OF WILDLIFE STATEWIDE FISHERIES MANAGEMENT FEDERAL AID JOB PROGRESS REPORTS F-20-48 2012 LAKE TAHOE WESTERN REGION Contents NEVADA DEPARTMENT OF WILDLIFE, FISHERIES DIVISION ANNUAL PROGRESS
A Sport Fish Stock Assessment of Long Lake, Alberta, 2004
 A Sport Fish Stock Assessment of Long Lake, Alberta, 2004 CONSERVATION REPORT SERIES The Alberta Conservation Association is a Delegated Administrative Organization under Alberta s Wildlife Act. CONSERVATION
Behavior and survival of hatchery reared advanced fingerling largemouth bass using radio telemetry. Brandon Thompson
 Behavior and survival of hatchery reared advanced fingerling largemouth bass using radio telemetry Brandon Thompson Florida largemouth bass Micropterus salmoides floridanus Premier freshwater sportfish
FRASER RIVER STURGEON CONSERVATION SOCIETY BACKGROUNDER RESULTS OF 5-YEAR LOWER FRASER RIVER WHITE STURGEON MONITORING AND ASSESSMENT PROGRAM
 FRASER RIVER STURGEON CONSERVATION SOCIETY BACKGROUNDER RE: RESULTS OF 5-YEAR LOWER FRASER RIVER WHITE STURGEON MONITORING AND ASSESSMENT PROGRAM A 5-year study of the population and distribution of white
Columbia River Project Water Use Plan
 Columbia River Project Water Use Plan Columbia River White Sturgeon Management Plan White Sturgeon Conservation Aquaculture 2017 Annual Report Reference: CLBWORKS-25: Mid-Columbia River White Sturgeon
Nechako White Sturgeon; SARA listing experience for Carrier Sekani First Nations. June 4, 2018 Christina Ciesielski Carrier Sekani Tribal Council
 Nechako White Sturgeon; SARA listing experience for Carrier Sekani First Nations June 4, 2018 Christina Ciesielski Carrier Sekani Tribal Council Overview Overview of Nechako White Sturgeon species Recruitment
Status of Burbot (Lota lota) in Arrow Lakes Reservoir Victoria St., Nelson, B.C.
 in Arrow Lakes Reservoir Victoria St., Nelson, B.C.") Status of Burbot (Lota lota) in Arrow Lakes Reservoir Steve Arndt 1, M.Sc. and James Baxter 2, M.Sc. 1 Columbia Basin Fish & Wildlife Compensation Program 103-333 Victoria St., Nelson, B.C. 2 BC Hydro,
Status of Burbot (Lota lota) in Arrow Lakes Reservoir Steve Arndt 1, M.Sc. and James Baxter 2, M.Sc. 1 Columbia Basin Fish & Wildlife Compensation Program 103-333 Victoria St., Nelson, B.C. 2 BC Hydro,
LAKE DIANE Hillsdale County (T8-9S, R3W, Sections 34, 3, 4) Surveyed May Jeffrey J. Braunscheidel
 Surveyed May Jeffrey J. Braunscheidel") Michigan Department of Natural Resources Status of the Fishery Resource Report No. 2003-4, 2003 LAKE DIANE Hillsdale County (T8-9S, R3W, Sections 34, 3, 4) Surveyed May 2001 Jeffrey J. Braunscheidel Environment
Michigan Department of Natural Resources Status of the Fishery Resource Report No. 2003-4, 2003 LAKE DIANE Hillsdale County (T8-9S, R3W, Sections 34, 3, 4) Surveyed May 2001 Jeffrey J. Braunscheidel Environment
Ecology and control of invasive Northern Pike in the Columbia River, Canada
 Ecology and control of invasive Northern Pike in the Columbia River, Canada Brian Heise, Daniel Doutaz, Matthias Herborg, Matt Neufeld, David Derosa, Jeremy Baxter 19 th International Conference on Aquatic
TESTIMONY OF THE COLUMBIA RIVER TREATY TRIBES BEFORE PACIFIC FISHERIES MANAGEMENT COUNCIL April 12, 2010 Portland, OR
 Agenda Item H.1.f Supplemental Tribal Report 2 April 2010 TESTIMONY OF THE COLUMBIA RIVER TREATY TRIBES BEFORE PACIFIC FISHERIES MANAGEMENT COUNCIL April 12, 2010 Portland, OR Good day Mr. Chairman and
Project Name: Distribution and Abundance of the Migratory Bull Trout Population in the Castle River Drainage (Year 4 of 4)
") Alberta Conservation Association (ACA) Date: 2014-2015 Project Name: Distribution and Abundance of the Migratory Bull Trout Population in the Castle River Drainage (Year 4 of 4) Fisheries Program Manager:
Alberta Conservation Association (ACA) Date: 2014-2015 Project Name: Distribution and Abundance of the Migratory Bull Trout Population in the Castle River Drainage (Year 4 of 4) Fisheries Program Manager:
Jason Blackburn, Paul Hvenegaard, Dave Jackson, Tyler Johns, Chad Judd, Scott Seward and Juanna Thompson
 Alberta Conservation Association (ACA) Date: 2014-2015 Project Name: Owl River Walleye and Aquatic Habitat Assessment Fisheries Program Manager: Peter Aku Project Leader: Tyler Johns Primary ACA staff
STUDY PERFORMANCE REPORT
 STUDY PERFORMANCE REPORT State: Michigan Project No.: F-80-R-2 Study No.: 487 Title: Performance, survival and production of steelhead strains in tributaries of Lake Michigan and Lake Huron. Period Covered:
Upper Columbia Redband Trout: Conservation for the Future
 Upper Columbia Redband Trout: Conservation for the Future Bryan Jones and Holly McLellan Colville Confederated Tribes Fish and Wildlife Department Historic Notes Upper Columbia River Large runs of steelhead,
NEVADA DEPARTMENT OF WILDLIFE STATEWIDE FISHERIES MANAGEMENT
 NEVADA DEPARTMENT OF WILDLIFE STATEWIDE FISHERIES MANAGEMENT FEDERAL AID JOB PROGRESS REPORTS F-20-52 2016 BOULDER RESERVOIR WESTERN REGION NEVADA DEPARTMENT OF WILDLIFE, FISHERIES DIVISION ANNUAL PROGRESS
Ecology of Columbia River redband trout (Oncorhynchus mykiss gairdneri) in high desert streams
 in high desert streams") Ecology of Columbia River redband trout (Oncorhynchus mykiss gairdneri) in high desert streams Dry Creek October 2012 Chris A. Walser Ph.D., Professor of Biology Department of Biology and Environmental
Ecology of Columbia River redband trout (Oncorhynchus mykiss gairdneri) in high desert streams Dry Creek October 2012 Chris A. Walser Ph.D., Professor of Biology Department of Biology and Environmental
Susitna-Watana Hydroelectric Project (FERC No ) Salmon Escapement Study Study Plan Section 9.7
 Salmon Escapement Study Study Plan Section 9.7") (FERC No. 14241) Salmon Escapement Study Study Plan Section 9.7 Part D: Supplemental Information to June 2014 Initial Study Report Prepared for Prepared by LGL Alaska Research Associates, Inc. & Alaska
(FERC No. 14241) Salmon Escapement Study Study Plan Section 9.7 Part D: Supplemental Information to June 2014 Initial Study Report Prepared for Prepared by LGL Alaska Research Associates, Inc. & Alaska
Kootenay White Sturgeon Juvenile Sampling in British Columbia,
 Kootenay White Sturgeon Juvenile Sampling in British Columbia, 2006-07 Matthew D. Neufeld BC Ministry of Environment 401 333 Victoria Street Nelson, BC V1L 4K3 April 2007 This project was funded by the
BURBOT IN THE KOOTENAI RIVER, IDAHO: A STORY OF SUCCESS
 BURBOT IN THE KOOTENAI RIVER, IDAHO: A STORY OF SUCCESS T.J. Ross, Ryan Hardy, and Andy Dux, Idaho Department of Fish and Game Shawn Young, Nate Jensen, and Sue Ireland, Kootenai Tribe of Idaho OVERVIEW
Hatchery Scientific Review Group Review and Recommendations
 Hatchery Scientific Review Group Review and Recommendations Lochsa River Spring Chinook Population and Related Hatchery Programs January 31, 2009 Lochsa River Spring Chinook Population Report Page - 1
Yakima/Klickitat Fisheries Project
 Yakima/Klickitat Fisheries Project Lower Yakima River Supplementation and Research Project Operations and Maintenance Annual Report 2002-2003 March 2004 DOE/BP-00006677-1 This Document should be cited
State of California The Resources Agency DEPARTMENT OF FISH AND GAME
 State of California The Resources Agency DEPARTMENT OF FISH AND GAME FINAL REPORT SHASTA AND SCOTT RIVER JUVENILE SALMONID OUTMIGRATION MONITORING PROJECT Prepared for the Pacific States Marine Fisheries
Near-Field Sturgeon Monitoring for the New NY Bridge at Tappan Zee. Quarterly Report July 1 September 30, 2014
 Near-Field Sturgeon Monitoring for the New NY Bridge at Tappan Zee Quarterly Report July 1 September 30, 2014 Prepared by AKRF, Inc. 7250 Parkway Drive, Suite 210 Hanover, MD 21076 for New York State Thruway
An Overview and Summary of Methodologies of Arctic grayling ( Thymallus arcticus
 PEACE REGION An Overview and Summary of Methodologies of Arctic grayling (Thymallus arcticus) Projects Conducted in the Parsnip, Table, and Anzac rivers from 1995 to 2007 D.M. Cowie and B.G. Blackman September
Executive Summary Gantahaz Lake 2006
 Executive Summary Gantahaz Lake 2006 A stocking assessment was conducted at Gantahaz Lake on September 29, 2006. This was the third assessment completed since the inception of stocking in 1976. The management
Alberta Conservation Association 2011/12 Project Summary Report. Project Name: Walleye Stock Assessment Program 2011/12 Moose and Fawcett Lakes
 Alberta Conservation Association 2011/12 Project Summary Report Project Name: Walleye Stock Assessment Program 2011/12 Moose and Fawcett Lakes Fisheries Program Manager: Peter Aku Project Leader: Clayton
Success through Stewardship: White Sturgeon Monitoring and Assessment in the Lower Fraser River, B.C.
 Success through Stewardship: White Sturgeon Monitoring and Assessment in the Lower Fraser River, B.C. TROY C. NELSON 1,2, WILLIAM J. GAZEY 3, KARL K. ENGLISH 2, AND MARVIN L. ROSENAU 4 1 Fraser River Sturgeon
2011 upper Lewis River Bull Trout Investigations. Jim Byrne
 2011 upper Lewis River Bull Trout Investigations Jim Byrne WDFW 2010 & 2011Muddy River spring, summerandfall flow regimes 2500 2000 1500 1000 Daily Flow (cfs) 500 0 1 May 8 May 15 May 22 May 29 May 5 Jun
MINISTRY OF ENVIRONMENT ENVIRONMENTAL STEWARDSHIP DIVISION FISH AND WILDLIFE BRANCH. Horsefly River Angling Management Plan
 MINISTRY OF ENVIRONMENT ENVIRONMENTAL STEWARDSHIP DIVISION FISH AND WILDLIFE BRANCH Horsefly River Angling Management Plan January 30 th, 2006 Area/Fishery Description The Horsefly River watershed provides
Sontek RiverSurveyor Test Plan Prepared by David S. Mueller, OSW February 20, 2004
 Sontek RiverSurveyor Test Plan Prepared by David S. Mueller, OSW February 20, 2004 INTRODUCTION Sontek/YSI has introduced new firmware and software for their RiverSurveyor product line. Firmware changes
Patterns of migration and delay observed in Summer Steelhead from the Upper Columbia and Snake River Basins from PIT tag data
 West Coast Region Patterns of migration and delay observed in Summer Steelhead from the Upper Columbia and Snake River Basins from PIT tag data Blane Bellerud August, 2015 Columbia River Basin Columbia
Rivers and Streams Investigations
 Rivers and Streams Investigations Brian J. Flatter, Regional Fisheries Biologist Lance Hebdon, Regional Fisheries Biologist Jeff Dillon, Regional Fishery Manager ABSTRACT Three sections of the lower Boise
Columbia River Fishery Notice
 Columbia River Fishery Notice Oregon Department of Fish and Wildlife January 29, 2014 Compact Action The Columbia River Compact agencies of Oregon and Washington met today and took the following actions:
Attachment 1. Agenda Item Summary BACKGROUND
 Attachment 1 Agenda Item Summary BACKGROUND Spring Chinook Salmon: Prior to the late 1970s, non-treaty spring Chinook fisheries in the mainstem Columbia River occurred from February through May and harvested
145 FERC 62,070 UNITED STATES OF AMERICA FEDERAL ENERGY REGULATORY COMMISSION
 145 FERC 62,070 UNITED STATES OF AMERICA FEDERAL ENERGY REGULATORY COMMISSION Public Utility District No. 1 of Douglas County, Washington Project No. 2149-163 ORDER APPROVING BULL TROUT STRANDING, ENTRAPMENT,
Data Collection and Processing: Elwha Estuary Survey, February 2013
 Data Collection and Processing: Elwha Estuary Survey, February 2013 Ian Miller, WA Sea Grant Olympic Peninsula Field Office, 1502 E. Lauridsen Blvd #82, Port Angeles, WA 98362 immiller@u.washington.edu
NEVADA DEPARTMENT OF WILDLIFE STATEWIDE FISHERIES MANAGEMENT
 NEVADA DEPARTMENT OF WILDLIFE STATEWIDE FISHERIES MANAGEMENT FEDERAL AID JOB PROGRESS REPORTS F-20-49 2013 LAKE TAHOE WESTERN REGION NEVADA DEPARTMENT OF WILDLIFE, FISHERIES DIVISION ANNUAL PROGRESS REPORT
Summary of HSRG Findings for Chum Populations in the Lower Columbia River and Gorge
 Summary of HSRG Findings for Chum Populations in the Lower Columbia River and Gorge The Congressionally-established Hatchery and Scientific Review Group (HSRG) developed a foundation of salmon hatchery
Spilling Water at Hydroelectric Projects in the Columbia and Snake Rivers How Does It Benefit Salmon?
 Spilling Water at Hydroelectric Projects in the Columbia and Snake Rivers How Does It Benefit Salmon? Hydropower development in the Columbia and Snake rivers has left its mark on salmonid populations,
NEVADA DEPARTMENT OF WILDLIFE STATEWIDE FISHERIES MANAGEMENT
 NEVADA DEPARTMENT OF WILDLIFE STATEWIDE FISHERIES MANAGEMENT FEDERAL AID JOB PROGRESS REPORTS F-20-49 2013 SQUAW CREEK RESERVOIR WESTERN REGION Contents NEVADA DEPARTMENT OF WILDLIFE, FISHERIES DIVISION
NEVADA DEPARTMENT OF WILDLIFE STATEWIDE FISHERIES MANAGEMENT
 NEVADA DEPARTMENT OF WILDLIFE STATEWIDE FISHERIES MANAGEMENT FEDERAL AID JOB PROGRESS REPORTS F-20-52 2016 LAKE TAHOE WESTERN REGION NEVADA DEPARTMENT OF WILDLIFE, FISHERIES DIVISION ANNUAL PROGRESS REPORT