Rank and Performance in Dynamic Tournaments: Evidence from the PGA Tour
|
|
|
- Joy Elliott
- 5 years ago
- Views:
Transcription
1 Rank and Performance in Dynamic Tournaments: Evidence from the PGA Tour Daniel C. Hickman Assistant Professor of Economics Department of Business University of Idaho Craig Kerr Associate Professor of Economics Department of Economics California State Polytechnic University Pomona Neil Metz Associate Professor of Economics Department of Economics University of Central Oklahoma Abstract Using data from the final round of golf tournaments, we analyze the effect of player rank on performance. The identification of varying levels of pressure is possible due to the detailed nature of the dataset, which allows us to determine the rank of each player just prior to teeing off on each hole. We find that players in the lead tend to underperform, especially near the very end of the tournament and when the lead is closely contested. We also create a measure to rank individual golfers based on how their performance is affected by high-pressure situations. Keywords: tournaments, performance incentives, psychological pressure, choking JEL Classification: D03, J33, L83, Z20 1
2 Rank and Performance in Dynamic Tournaments: Evidence from the PGA Tour 1. Introduction A tournament setting, in which the returns for an individual depend on his or her performance relative to others, is designed to provide incentives that increase effort (Ehrenberg and Bognanno 1990; Lazear 2000; Lazear and Rosen 1981). However, a growing body of evidence suggests that such settings can also create psychological pressure that may lead certain individuals to underperform. Ariely et al. (2009), for example, use an experimental framework to show that very large rewards cause individual performance to decline. The world of sports also provides many forums with which to test the impact of a tournament setting on performance. Previous studies have found evidence that pressure affects performance in soccer (Apesteguia and Palacios-Huerta 2010; Dohmen 2008), basketball (Cao et al. 2011; Deutscher et al. 2013; Toma 2015), hockey (Depken et al. 2012; Kolev et al. 2015), tennis (Gonzalez-Diaz et al. 2012) and golf (Clark 2002a; Clark 2002b; Clark 2007; Hickman and Metz 2015; Hill et al. 2010; Wells and Skowronski 2012; Wright et al. 1991). 1 Researchers have utilized many approaches to examine the relationship between pressure and performance. Within the study of golf, for example, Hickman and Metz (2015) analyze how the amount of money riding on a particular putt impacts the likelihood that putt is made. Kali et al. (2015) study tournament round scores and find that non-monetary incentives (Ryder Cup qualifying points) impact performance in an adverse manner. Brown (2011) finds that playing in a tournament with superstars can also cause performance to decline. Genakos and Pagliero (2012) examine tournaments in weightlifting and develop a novel approach to estimating the relationship between pressure and performance. They utilize a measure of 2
3 interim ranking at each stage of competition to see how relative standing influences both strategic risk-taking and performance. Genakos et al (2015) provide a follow-up study that analyzes performance in diving tournaments. Each of these settings produce results indicating that the more highly ranked a competitor is at the beginning of a stage, the worse that competitor s performance will be during that stage. In this study, we make use of a rich set of data from golf tournaments. The amount of data available, as well as the nature of the game, has drawn researchers to golf in order to examine many aspects of behavioral economics. 2 Here we examine how players perform on each hole during the final round of a golf tournament based on their standing in the tournament at the start of that hole. This provides an interesting comparison to the findings in weightlifting and diving. In each of the latter sports, an individual makes strategic decisions regarding the task he or she will perform in each stage of the tournament. Weightlifters select the weight they will attempt to lift immediately before each round of the tournament. Divers must select their dives prior to the entire competition. In golf, however, each player must attempt the same task at each stage (hole) of the competition. This allows us to hold constant the task being performed and more cleanly estimate the effect of rank on performance. As far as risk is concerned, a golfer may decide to play a hole more or less aggressively, but one cannot directly observe risk in golf as it involves knowing a player s line of play and intent. Also, a recent study by Baldson (2013) on risk taking in golf finds that there is very little to no risk taken by players in the final holes of a tournament. Another important difference is that players are at different stages of the competition simultaneously, so the dynamic ranking process is more complex. This may impact performance differently than other sports where players take 3
4 turns and all complete one stage before proceeding to the next. One additional contribution of our examination of golf tournaments comes from the size of the field during the final round. The large numbers of players in each tournament allows us to examine whether the use of competition-specific player fixed effects utilized in previous studies is appropriate by implementing falsification tests. Our results indicate that there are adverse effects of pressure on performance for highly ranked competitors. However, unlike previous studies in other sports, we find that the decline in performance is primarily for the player that holds the overall lead in the tournament. Performance is estimated to be strongest for the competitor that is ranked second, and is pursuing the leader. The dynamic nature of the tournament may make it difficult for those not ranked near the top of the leaderboard to determine their exact standing, thereby lessening the impact of any associated psychological pressure. This is consistent with the idea in Genakos and Pagliero (2012) that providing less interim ranking information may improve the performance of competitors. Also, our results for the top spots in a tournament may be due to the large stakes in golf which do not exist in weightlifting or diving, as their monetary rewards for first place range from zero to thousands of dollars. For the golf tournaments included in this study, the median first place prize is just over $1 million. 3 There are several potential explanations for why players ranked first in the tournament might underperform. The pressure of maintaining the lead is one possibility. Another is that players may choose to play a hole differently when in the lead to avoid the risk of an extremely poor shot. We explore these theories by examining the relationship between rank and performance at different points in the competition, as well as based on how closely contested 4
5 the lead is. We find underperformance due to psychological pressure to be the most likely explanation. Finally, we create a measure to rank individual players based on how adversely their performance is impacted by the pressure of leading the tournament. 2. Data and Descriptive Statistics The data used in this study come from the PGA Tour ShotLink Data program. 4 Each observation represents a specific hole for each player participating in the tournament. Our sample includes all tournaments that consist of four rounds of play for which ShotLink data is available during the 2003 to 2015 seasons. 5 We focus on the 18 holes played during the final round of each tournament. The final round is when players are likely to be most concerned about their relative standing, as well as when they are likely to face the most psychological pressure. Our final overall sample includes 597,582 player-hole observations. The key variable in this analysis is a player s rank at the time he begins a given hole. In order to construct this variable, we use data on the timing of each shot, as well as the rankings at the beginning of the final round. Using this information, we create a minute-by-minute leaderboard, where each player s ranking is determined by his score relative to the rest of the playing field. The leaderboards created for the analysis match the way in which leaderboards are reported in real-time during the actual playing of the golf tournament. For example, suppose Jordan Spieth has completed four holes in the final round, and is 10 strokes under par for the tournament. At the same time, Charley Hoffman is also 10 under par after playing eight holes. These two players would have the same interim ranking in our dataset as each starts his next hole. The number of holes remaining does not directly factor into our determination of the 5
6 dynamic ranking variable. The rankings are based on time, not each player s standing after all players have completed the same hole on the golf course. To be precise, the rankings are calculated for each minute of the tournament. A player s ranking at the start of a hole is determined by their rank in the minute before he takes his tee shot for the hole. For example, if Jordan Spieth strikes his tee shot on the 5 th hole at 10:42 a.m., his rank to start the hole will be determined by his relative standing as calculated in the leaderboard for 10:41 a.m. We prefer to use the rank at the start of the hole, as the ranking at this point is most likely to impact performance on the hole in question. 6 Tournaments in our sample have between 56 and 89 players in the final round, with the average number per tournament at 74.4 players. 7 The other key piece of information in our analysis is a measure of a player s performance on a given hole. The primary measure we use to characterize the outcome is a player s score, relative to par, for each hole. We refer to this variable as RTP. If a player achieves a score equal to par for a hole, his RTP takes a value of 0. If a player achieves a birdie (scores one stroke below par) on a hole, RTP will take a value of -1. Thus, negative values for RTP represent a higher level of performance. While we will generally focus on RTP as our measure of performance, we also utilize the likelihood of specific scoring outcomes (birdie, par, and bogey) in the course of our analysis. Table 1 displays summary information and provides a preliminary glimpse at the key relationship in our study. The overall average RTP score for all players during the final round is essentially 0. When we look at the relationship between rank at the start of a hole and performance on that hole, some minor differences are evident. Most notably, those that begin a hole more highly ranked (in the top 10) perform better than those that begin with a lower 6
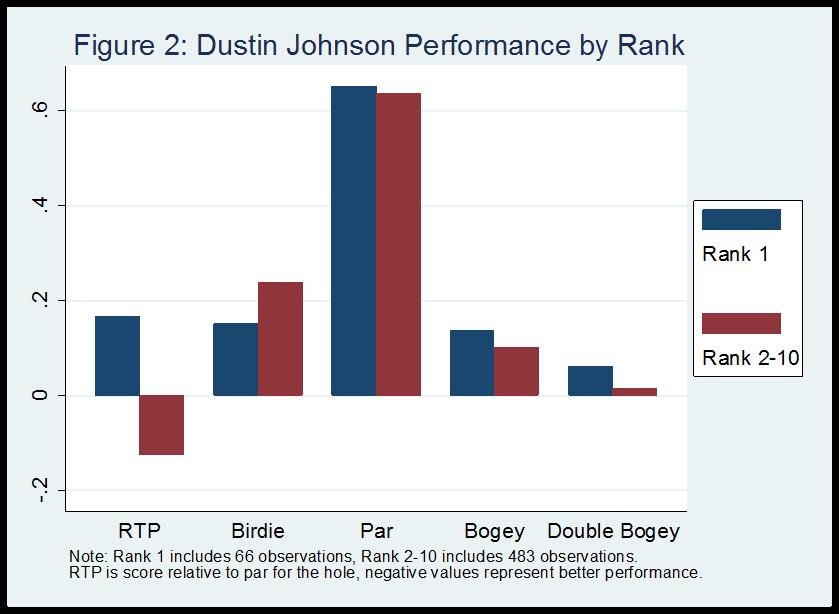
7 rank. This is not surprising, those with a higher rank have been playing better in the tournament. The more interesting questions include, for example, whether or not being in the top position causes a player to perform differently than he otherwise would have. The summary statistics show that the average performance for players ranked first is slightly worse than that of players ranked second through fifth, although this difference is not statistically significant. While the summary statistics do not indicate a strong relationship between a player s rank and his performance, there are two key pieces of information missing in this simple analysis. The first is the difficulty of each specific hole. While the par value gives general information about a hole, the average RTP score for the field can vary greatly between two distinct holes with the same par value. The second factor is information about the player himself. Players that tend to be highly ranked may have different characteristics than those that tend to be lower ranked. The question we have in mind is whether a given individual s performance will change based on differences in his ranking. As an illustrative example of this question, Figures 1 and 2 display relative performance at different rankings for two players: Tiger Woods and Dustin Johnson, respectively. In each case, we compare the performance when the player starts the hole ranked first overall to performance on holes that the player begins with a ranking of second through tenth. 8 For Tiger Woods, we see there is not much difference in his performance when ranked first. In each case, his RTP score shows strong performance, and the likelihood of each specific outcome is virtually the same. If anything, Woods s already strong performance becomes slightly better when in the lead. As seen in Figure 2, there is a very different relationship between rank and performance 7
8 for Dustin Johnson. While his performance is strong when ranked in the top 10, it falls off considerably when he is in first position during the final round. Birdies become less likely, while bogeys and even double bogeys are much more likely when Johnson begins a hole with the overall lead. In the more detailed analysis to follow, we examine more closely which of these relationships is more typical among players overall while controlling for player-specific effects. 3. Empirical Methodology The main goal of our analysis is to determine whether a player s performance on a hole differs based on his relative standing at the beginning of the hole. In order to analyze this relationship, we estimate various permutations of the following general specification 9 : (1) RTPiht = g( Rank i, t 1, 1) + i + h + iht As discussed in the previous section, RTP is the score of player i, relative to par on hole h, at minute t. Note that h here refers to each unique hole in each unique tournament, with 8,064 unique holes in the sample overall. Each regression we estimate includes hole fixed effects. This is done to control for the general difficulty of each hole. We also include some form of individual fixed effects in each specification, to control for characteristics of each player. We estimate regressions with various levels of individual fixed effects (player, player-par value, player-tournament), and discuss the differences in the next section of the paper. Throughout our analysis, we cluster standard errors at the hole level to account for the likelihood that variation in scoring may differ for each unique hole. 10 We estimate various functional forms of the relationship between rank and performance. To begin with, we use rank as a continuous variable and estimate both linear and 8
9 quadratic models. Next, we estimate various specifications in which we use dummy variables to further explore the relationship. It is possible that there is not a linear relationship between rank and performance across the spectrum of rankings, but that a relationship still exists. Perhaps there are certain specific rankings, such as being in the lead, that tend to influence a player s performance one way or the other. Aside from looking at different forms of the relationship between rank and performance, we also utilize various sample restrictions in different specifications. In certain cases, we compare only players within a certain range of the standings, such as the top 10. We also look at how the relationship might change as the end of the tournament approaches by restricting the sample to certain holes within the final round. The nature of our dependent variable means that we could consider using other models, such as a multinomial logit, to generate results. However, the large number of observations, and our belief that both hole and individual-level fixed effects are essential to proper identification, means we need to rely on linear methods for computational reasons. In some of the analysis that follows, we also utilize linear probability models and examine how the likelihood of a specific outcome (such as a birdie) might differ based on the ranking of the player at the start of the hole. 4. Results To begin our look into the relationship between rank and performance, we explore a simple linear model. The results displayed in the first column of Table 2 come from a specification that includes hole and player fixed effects, and includes all players from the final round of the tournament. While the estimated coefficient on rank is highly statistically significant, there is, 9
10 practically speaking, no meaningful relationship between performance and rank. The specification in Column 3 utilizes player-par value fixed effects. Stone and Arkes (2016) suggest that, since players differ in their ability to play long and short holes, the introduction of these fixed effects can improve the model. This yields results similar to those using player fixed effects. We utilize player-tournament fixed effects to generate results displayed in Column 5 of Table 2. These are specific to each individual competition, and are similar to the preferred specifications used in Genakos and Pagliero (2012) and Genakos et al. (2015 ). In this case, we look at how a player s rank varying within a specific tournament affects his performance. For this specification, the coefficient on rank is negative and can be considered both statistically and practically significant. The results indicate that when a player starts a hole more highlyranked, that player s performance is expected to decline. As an example, if a player starts a hole ranked eleventh overall, he can be expected to shoot almost a quarter of a stroke better (relative to par) than when he starts a hole in the same tournament while ranked first. However, we have serious concern over the use of player-tournament fixed effects, an issue which we expand upon in the analyses presented in Tables 3 and 4. As mentioned in the previous section, it seems unlikely that there is a strictly linear relationship between rank and performance. To begin exploring this further, we introduce quadratic specifications in Columns 2, 4, and 6 of Table 2. We again utilize the different levels of individual fixed effects as indicated in the table. Both the player and player-par value fixed effect specifications yield results showing that high rankings may lead to underperformance near the top of the leaderboard, but this effect diminishes as we move further down the rankings. As in the linear models, the magnitude of the estimated impact is very small in these 10
11 results. For the player-tournament fixed effects specification, the quadratic term is not significant in practical or statistical terms. Finally, there are endogeneity concerns in estimating the relationship between performance and rank as pointed out by Genakos and Pagliero (2012). For example, if a player performed well in the previous round of the tournament, then that player s rank in the current round will be better, given that the player is already performing well, they are likely to perform well again. This bias may cause rank to appear to have an impact on performance when in fact, it does not. To address this concern, we implement an instrumental variable model in Column 7 of Table 2 following the methodology outlined in Genakos and Pagliero (2012). We find a result very similar to Genakos and Pagliero (2012), the IV estimate dampens the impact of rank on performance. One issue with the analysis performed in Table 2 may be that we are including the entire field of players in our sample. It is unlikely, for example that any difference in performance that comes from being ranked first as opposed to second is the same as that from being ranked 31 st as opposed to 32 nd. It is also possible that there are certain key positions that tend to influence performance more than others. For example, perhaps being ranked first causes an individual to feel pressure and underperform, while being ranked second does not induce the same effect. For certain rankings that are not near the top, it is likely the player is unaware of his exact positioning, and so there may be little reason for interim ranking to impact performance. In Table 3 we implement a dummy specification replicating what is done in Genakos and Pagliero (2012) for weightlifting and Genakos et al. (2015) for diving, so that we have a point of comparison to their methods and results In this analysis, we restrict the sample to players that 11
12 begin a hole ranked in the top 10 for the tournament. The reference category for our set of dummies is the player(s) ranked first overall. For all three fixed effect specifications, the results indicate that players perform better when ranked second through tenth as compared to when they are ranked first. For the player and player-par value specifications, the player ranked second is estimated to have the strongest performance, with the difference dwindling until it picks up at ranks 9 and 10. For the player-tournament fixed effects model, the performance is estimated to improve linearly as we move down the leaderboard. This pattern is similar to the results in both Genakos and Pagliero (2012) and Genakos et al. (2015). 11 The magnitudes of the coefficients in Column 3 are quite large. A player is estimated to shoot around 0.7 strokes better per hole when ranked tenth as opposed to when he is ranked first. While the results including player-tournament effects are similar to those in past studies, they seem to be almost unbelievably large in magnitude. Our concern is that restricting the analysis to within a specific tournament for a given player creates a severe problem causing a spurious relationship between performance and rank. Consider a hypothetical player s performance during the final round of a tournament. This player s start-of-hole ranking during this round varies between a maximum value of 10 and a minimum value of 1. If we analyze the relationship between the player s rank and performance in this tournament alone, it must be the case that he performs relatively worse when he is highly ranked and relatively better when he is lower ranked. When the player is at his lowest rank during the round (10), he must perform well (relative to the field), else this would not be his lowest rank. In this way, utilizing player-tournament fixed effects could cause the results to be negatively biased, meaning that 12
13 as rank declines performance appears to improve, when in fact there is no relationship between these variables. Thus, it seems likely that these competition-specific effects are driving the results, rather than helping us identify the true relationship between rank and performance. To support this claim, Figure 3 shows the distribution of correlations between rank and score relative to par at the player-tournament level. That is, for each of the 32,955 playertournament combinations observed, we examine how performance and rank are correlated for each player across the 18 holes in the final round of a specific tournament. As previously theorized, there is a prevalent negative relationship between rank and performance at this level, with a mean correlation of This result is surprising considering the fact that we have given no consideration to the specific ranking examined. It is also surprising as one would initially expect player performance to be stronger when the player in more highly ranked, as such a ranking should indicate the player is performing well. Overall, the nature of these playertournament correlations support our concerns about the inclusions of competition-specific fixed effects. As a way to further test whether the results in Column 3 of Table 3 are reliable, we conduct a falsification test using a different subsample of rankings. In the results displayed in Table 4, we focus on the sample of players that began playing a hole ranked between 41 st and 50 th in the tournament. As before, we implement a set of dummy variables for each rank, and omit the highest ranked player in the sample (rank 41). Within this group, we believe there is little reason to suspect that differences in rank at the start of a hole should impact the performance of the player on that hole. There is no added pressure that comes from being 13
14 ranked 41 st as opposed to 42 nd. Furthermore, it is unlikely that a player in this range would even know his specific ranking at the start of each hole. For a player near the top of the leaderboard, it is much more likely he is aware of his relative standing in the field throughout the final round. In the first two columns of Table 4, we find the expected results. Both the player and player-par value fixed effect specifications show no significant differences in performance for a player when his rank varies between 41 and 50. The results for the player-tournament fixed effects, however, follow the same suspicious pattern as those in Table 3. Performance improves linearly as a player s ranking drops. 12 Based on these findings, we believe the use of player-tournament fixed effects are not appropriate in this context. While, player-tournament fixed effects should be a good control for player ability in a more precise time frame, the bias from their use is very troublesome. In subsequent analyses, we focus on specifications using player-par value fixed effects. 13 While the use of player-par fixed effects allows for the possibility that unobserved heterogeneity in player ability from tournament to tournament impacts the results, our particular golf setting and sample are less likely to experience this problem than other studies and our preferred method is less likely to experience bias than that in Genakos and Pagliero (2012) and Genakos et al. (2015). Unobserved heterogeneity is less likely an issue as our study only uses data from the final (4 th ) round of a golf tournament. Tournaments typically start out with approximately 150 golfers and a cut is made to the top 70 and ties after the first 2 rounds. Thus, the players in our dataset are those that played well in the initial rounds. Even if a player s performance varies from tournament to tournament, we are only examining the 14
15 situations in which players are already in a high-performance state. If a player performed poorly in a tournament, he would have missed the cut and would not be included in our dataset. Additionally, the final round of each golf tournament is a time when players are likely to be aware of (and concerned about) their relative position on the leaderboard. As the end of the tournament nears, a player s ranking becomes more clearly associated with his monetary return, so he may be more likely to feel the pressure of maintaining or overtaking a certain position. If this is the case, perhaps the relationship between rank and performance will change within the final round as the end of the tournament approaches. In our next set of results, we look at the entire field of players, but restrict the sample to various holes within the final round of each tournament. For these specifications, we restrict the sample to those tournaments in which all players play the holes in the same sequence. In some tournaments (about 20% of those in our sample), some playing groups will start on the tenth hole while others start on the first hole. Since we want to examine how the ranking might matter at different stages of the round for the whole sample, it is important that all players play in the same order for these specifications. 14 We utilize player-par value fixed effects and use a flexible functional form for the ranking dummies. Ranks 1 through 5 are included individually, while 6 to 10 and 11 to 20 are grouped together. The reference category are those ranked 21 and worse. The results in Table 5 indicate that the relationship between rank and performance is observed only for those at the top of the leaderboard. When we look at the final round overall, the performance is strongest for those that start a hole ranked second in the field. Others that are close to the top and chasing the lead also perform better than those ranked lower. For the final round overall, being ranked first caused performance to significantly decline. The results in 15
16 Columns 4 and 5 show the performances of those ranked first and second are particularly different as the end of the tournament nears. For the last 6 holes, and especially the last 3, being ranked first causes a player s RTP score to increase, meaning his performance declines. The second-ranked player, during the same part of the tournament, is performing at a significantly higher level. The estimated coefficient for rank 3 on the last 3 holes is also relatively large in magnitude, but is not estimated to be significant at any standard level (pvalue = 0.18). To reiterate the earlier discussion, the fact that ranking only affects performance for the few highest rankings is not surprising. Because of the simultaneous nature of the tournament, it may be difficult for those in other positions to determine their specific position at a given point in time. The very top of the leaderboard is also where we expect players to be most influenced by psychological pressure. While there may be a substantial monetary difference between finishing fourth and fifth in the tournament, this may not have the same impact on a player s mentality as the difference between winning the tournament and finishing in second place. Prize money and rewards are quite large for the top two spots. Median payouts for the tournaments included in our sample are $1,035,000 to first and $621,000 to second. Beyond prize money, a tournament win includes an exemption on the PGA Tour for the next two years, which can make a significant impact on a player s career and expected lifetime earnings. Wins also often exempt players into the major tournaments, such as The Masters. Stakes of this magnitude may have an impact on behavior and performance for the very top spots that differs from those observed in the less lucrative sports of weightlifting (Genakos and Pagliero 2012) and diving (Genakos et al. 2015). Perhaps, a player in first thinks about the impending rewards 16
17 associated with a win, which diverts his focus from the task at hand. These results indicate players perform significantly better when they are chasing the lead as opposed to trying to hold a lead. One possible interpretation of the results displayed in Table 5 is that players ranked first are choking under the pressure of leading the tournament. As a result, their performance is worse than those that are trying to catch them. Another interpretation, however, is that the player ranked first can afford to play more conservatively because he has the lead. Perhaps the player is choosing not to take risky shots (that have a possibility of an excellent score) because he simply needs to hold off the competition. In this case, especially if the player holds a significant lead over the field, it may be incorrect to infer that being ranked first causes underperformance. Fortunately, the detailed nature of the data allows us to explore this issue directly. 15 In Table 6, we focus our analysis on the final 3 holes of each tournament, and separate the sample based on the size of the lead held by the player ranked first. In Columns 1 and 2, we compare the impact of rank on RTP for cases in which rank 1 holds a lead of at least 2 strokes to cases when the lead is 1 or less. If the conservative play of the first-ranked player is driving the result, we expect to see a positive coefficient on rank 1 in Column 1. This strategy is most likely to be implemented when a player holds a sizable lead, and is unlikely to be caught unless he makes a big mistake. Instead we see that the significant results for ranks 1 and 2 are being driven by cases where the competition is very close. Here, we speculate on psychological factors which may lead to these results. When there is a large gap between first and second, the player ranked first may not feel as much 17
18 pressure as compared to when he leads by a single stroke. The player in the lead may not feel as if any single mistake is disastrous, he can bogey a hole and still have the lead. This cushion may take the pressure off and allow the first-ranked player to perform comfortably. At the same time, the large gap between first and second may mean that the performance of the second-ranked player is not necessarily stronger. Performing very well and accomplishing a birdie for the hole will not be enough to overtake the leader, so the player may perceive that it is as if the mountain is too high to climb. However, when the second-ranked player is within one shot of first, it is a very different story. The players in each position may now frame the situation in dramatically different ways. The first-ranked player has nothing to gain in terms of additional prizes, while second would gain substantially by moving into first. The first-ranked player may feel additional psychological pressure with the one shot lead, as any mistake could lead to a drop in position, and thus he underperforms. The second-ranked player may feel that first is now attainable, with a birdie they could likely move into a tie for first. To explore the issue further, we look at the likelihood of specific outcomes, by ranking, in cases where the competition is close (lead of one shot or less). We estimate separate linear probability models for the outcomes of birdie, par, and bogey for the final three holes of each tournament. The results are displayed in Columns 3, 4, and 5 of Table 6. We find that being ranked first makes it less likely that a player will achieve a birdie and more likely that he will achieve a score of par or bogey. The probability of scoring a birdie is estimated to be almost 5 percentage points lower for a player when he begins the hole ranked first. While the results for birdie and par could be consistent with either choking or playing it safe, the increased likelihood of a bogey indicates that the more likely story is that first-ranked players are choking 18
19 in high pressure situations. For second-ranked players, one might suspect that they would take on more risk in an effort to birdie holes and reach first. When behind, a player may attempt to hit an approach shot directly at a dangerous flagstick location in an attempt to make a birdie, but slight misses aimed at dangerous flags often lead to bogeys. Results show the relatively strong performance for second-ranked players is primarily due to a decrease in the likelihood of a bogey. This result indicates that second is not merely taking on more risk, but rather improving their overall play, even though they do not have a statistically greater chance of making a birdie. The pervasive underperformance of players ranked first begs the question, are there any factors that might impact the level of performance specifically for first? To explore this, we use information on player age and career earnings. Specifically, we interact these player characteristics with the dummy variable for being ranked first at the start of the hole. The results of this analysis are presented in Table 7. Column 1 is our baseline result and indicates that players ranked first are expected to perform worse, all else equal, by strokes on a given hole. The second column presents the results when career earnings are factored in, and shows that the magnitude of the rank 1 effect declines as earnings increase. In this case, career earnings can also be thought of as a measure of experience, with the results showing less experienced players are more affected by the pressure of being in first. Column 3 shows a similar pattern, as a player ages they tend to perform better when in first, relative to younger players. This result for age is in line the findings of a study by Fried and Tauer (2011) examining performance under pressure in golf as it relates to age. They find that players perform better under pressure as they age, but only up until a certain point, approximately age
20 5. Individual Player Rankings The results of our empirical analysis indicate that there is a relationship between a player s rank in a golf tournament and that player s performance. In particular, performance declines on average for holes in which the individual begins play ranked first overall. However, as seen in Figures 1 and 2, it is not expected that each individual will have the same relationship between relative standing and level of play. Given the frequency of tournaments and the number of years for which ShotLink data has been available, there is a large amount of information for a sizable group of players. In what follows, we estimate how certain individuals perform when facing the high-pressure situation of being ranked first overall during the final round of a golf tournament. These estimates provide some insight as to which golfers tend to be the most clutch and which have a tendency to wilt under the pressure. Our sample for this analysis focuses, as before, on play during the final round of each golf tournament. The idea is to compare how a given player performs on holes which he begins ranked first overall to his performance on holes he begins with any other ranking. 16 As such, we limit the sample of players to ensure we have sufficient observations to determine an overall pattern. We choose to limit the sample to the 50 players that are observed playing the most holes ranked first overall. For each of these players, we observe at least 60 holes that were played while leading the tournament. Tiger Woods played the most holes while ranked first in the final round of the observed tournaments (412). Table 8 presents the estimates from individual regressions, with the coefficients on the rank 1 dummy variable representing the difference between performance while in first and 20
21 performance at all other ranks for that player during the final round of tournaments throughout their career. Players with a negative coefficient on the rank 1 variable could be considered clutch players. That is, the performance of each of these players improves when they are leading the field. Players with a positive value could be considered to be choking (to varying degrees) under the pressure of holding the lead. The top 50 players are split almost evenly between the two categories. Davis Love III is estimated to be the player whose performance improves the most while in the lead, while Dustin Johnson s performance decreases by the largest margin. There are a few caveats that go along with this analysis. First, this measure may understate how clutch a certain player is if that player s performance in the final round always tends to be strong. For example, Tiger Woods won many tournaments over our sample period, but does not have a substantially better performance when ranked first as compared to other ranks. This result is likely due to the fact that he is the strongest player overall throughout the final round, thus his relative performance is not shown to have increased as dramatically when leading. Another issue is that we are comparing players at different stages of their careers. Patrick Reed, for example, is just 25 years old in the most recent tournament in our sample, while Tiger Woods is observed between the ages of 27 and 39. However, the individual rankings do correspond to some of our expectations. For example, a search of news items relating to Dustin Johnson yields articles such as: Dustin Johnson's U.S. Open choke was one of the worst in golf history (Chase 2015) and Dustin Johnson is good enough to keep choking away majors (Cannizzaro 2016). Fortunately for Dustin, he appears to have rid himself of these choking 21
22 demons. In 2016, the year after the end of our sample period, he won 3 tournaments (including a major) and walked away as the PGA TOUR player of the year. 6. Conclusions Sporting events provide a practical opportunity to examine many economic theories, including how individuals respond to the incentives created by a tournament setting. In this study, we examine golf tournaments as another arena to test the relationship between interim ranking and performance found in weightlifting (Genakos and Pagliero 2012) and diving (Genakos et al. 2015). Like these studies, we find rank impacts performance, however we find the nature of the relationship to be different in this case. When we restrict our analysis to those ranked in the top 10 of the tournament, for example, we find that being ranked first leads to underperformance, while being ranked second leads to the highest levels of performance. Unlike the studies in other sports, we do not find that individual performance continues to improve as players move further down the leaderboard. There are several reasons why the results in this study differ from similar studies in other sports. One is the modeling specification that we utilize. While player-competition level fixed effects are appealing in the sense that they may control for unobserved heterogeneity, they also appear to cause a severe endogeneity problem that leads to failing a simple falsification test. It should be noted that our results do follow those in previous studies when this problematic specification is utilized. In addition to differences in modeling specifications, there are also elements of the competitions themselves that might lead to different results. One is the magnitude of the 22
23 stakes of the competition, as the winner of a golf tournament often receives more than $1 million. Another big difference involves the decisions of players within the different tournaments. In weightlifting, for example, players announce what weight they will attempt, and not all players attempt the same amount. In diving, each individual must choose the specific set of dives he or she will perform. Golf provides a unique setting because each player is attempting a task with the same difficulty in each stage of the competition. In this setting, a stage of the competition is defined as each specific hole on the course during the final round of the tournament. The fact that we have many stages observed is another reason why our results differ. In golf, players are at different stages of the competition simultaneously, and it may be difficult for those not near the very top of the rankings to know their exact position at each point in time. The fact that our significant results are concentrated at the very top of the rankings also leads to the question of what might be causing those that are leading to underperform. Certainly, a part of this result comes from the psychological pressure of trying to hold off the competition. This theory aligns with our results indicating that the underperformance occurs most notably as the final round of the tournament comes to a close. Another part of this finding, however, could be due to a strategic decision to not take risks and play it safe. This strategy would seem to be most likely when a player has a larger lead. We find that the underperformance of those in the lead actually occurs in cases where the competition is very close, and thus our result cannot be merely explained by first playing it safe. Due to the amount of data available we are also able to examine heterogeneity in the impact of pressure on performance. Specifically, we find that the degree of underperformance 23
24 while ranked first is significantly lessened as a player ages and/or amasses greater career earnings. Finally, we collect observations for a sample of prominent players and utilize this information to create a ranking of individuals based on their relative performance when ranked first in the tournament. 24
25 Notes 1. A more thorough review of the choking phenomenon in sports can be found in Beilock and Gray (2007) and Hill et al. (2013). 2. See Balsdon (2013), Fearing et al. (2011), Hickman and Metz (2015), Hickman and Metz (2018), Pope and Schweitzer (2011), and Stone and Arkes (2016) as recent examples. 3. Given the correlation between player ranking and monetary prizes, one may consider using monetary stakes as a way to quantify the pressure a player faces when completing a task. We choose to focus on rank here for a few reasons. First, doing so allows us to directly compare with the findings of studies by Genakos and Pagliero (2012) and Genakos et al. (2015). Secondly, using rank allows for an examination of non-linear impacts of pressure at certain thresholds. For example, while moving from 4 th place to 5 th place and moving from 5 th place to 6 th place would each result in a similar monetary loss, perhaps the possibility of finishing in the top 5 for the tournament would cause very different levels of psychological pressure for the typical player. Finally, a study by Hickman and Metz (2015) examines the impact of monetary stakes on player performance on the final hole of golf tournaments. 4. Sponsored by CDW. There are several other studies which have used ShotLink data. Brief summaries of the papers can be found at One of the most notable contributions is the Pope and Schweitzer (2011) study of loss aversion. 5. The dataset contains PGA Tour events. The data does not generally include the major championships (Masters, US Open, The Open, and PGA Championship), with a few exceptions. ShotLink data is not typically recorded for the majors and other non-pga Tour events. We also exclude events with 4 th rounds lasting more than one day, abnormal scoring (modified stableford), and more than the typical 4 rounds (e.g. Bob Hope Classic) which occur a few times in a season. 6. Players have the opportunity to know their rank at the completion of a hole as most holes have an electronic scoreboard at the green which updates in real time. While we have no way of knowing conclusively what rank information a player does or does not have, Hickman and Metz (2015) cite anecdotal evidence from players indicating that they are aware of their standing in the tournament. Those players who might ignore a leaderboard only do it because they are feeling the pressure and knowledge of an exact lead or deficit that may lead to increased pressure and the possibility of underperformance. Most evidence would suggest players know where they stand in a tournament, particularly if they are near the top of the leaderboard. Additionally, the results that follow are in line with the thought that players on the leaderboard know where they stand. 25
26 7. There are a few tournaments each year (Tournament of Champions and TOUR Championship) that only include approximately 30 players during the final round. These tournaments were excluded from the analysis to maintain consistency of tournament field size. Inclusion of these tournaments does not change the results of our analysis in any meaningful way. 8. We choose to compare rank 1 to ranks 2 to 10 for these figures so that we are comparing at times when the player is generally performing well overall. The figures look similar if we compare rank 1 to other sets (ranks 2 to 5, all ranks greater than 1, etc.). 9. This equation is similar to those specified in Genakos and Pagliero (2012) and Genakos et al. (2015). 10. We follow Hickman and Metz (2018) in implementing clustering at the hole level. However, a case could also be made that clustering at the athlete level, as in Genakos and Pagliero (2012) may be appropriate. While we report the results with errors clustered at the hole level, we did run the analysis in each table of results with the alternate clustering strategy. In a few cases the p-value on key coefficients changed from being significant at 5% (**) to being significant at 1% (***) or 10% (***). In no cases did the coefficients go from being significant at one of the above thresholds to insignificant, or vice versa. The alternate tables of results are available from the authors upon request. 11. In results not displayed, we estimated regressions that included the top 15 and top 20 ranked players. The patterns in the results were similar to those seen for the top In results not displayed, but available upon request, we ran the same test for rankings 31 to 40 and 51 to 60. In each case, the player and player-par specifications indicate no significance, while the player-tournament effects yield significant results that follow the same linear pattern. 13. We also estimated specifications involving player-year effects and player-year-par value effects. These specifications are not reported, as they also failed the falsification tests presented in Table This is not an issue when we look at the top 10 sample, for instance, because in cases where some players start on the tenth hole, it will be the lower-ranked portion of the field that plays in a different order. Those ranked in the top 10 will almost always play in the same order in the final round. 15. One way to examine whether strategy is driving our results is to test whether the impact of being ranked first changes on par 5 holes as compared to holes with par values of 3 and 4. 26
27 There is more opportunity for player strategy to differ in par 5 holes, so if the impact of being ranked first differs in a significant way, it may indicate that it is not psychological pressure driving our findings. We implement a model in which a dummy for holes that are par 5 is interacted with each of the ranking dummies. We find there is no significant difference on the impact of being ranking first on par 5 holes (p-value on interaction term is 0.59). The full results of this specification are available from the authors upon request. 16. For the analysis that follows we compare play when ranked first to play on all other holes in order to have as many observations as possible. We also performed the analysis using other comparison sets, such as holes played while ranked in the top 10 (2 through 10) or while ranked in the top 25. The results were very similar in these cases. For example, the correlation between the individual rankings when we use the comparison group all holes with ranking >1 and when we use the comparison group all holes with ranking 2-10 is
28 References Apesteguia, J., and I. Palacios-Huerta. Psychological Pressure in Competitive Environments: Evidence from a Randomized Natural Experiment. American Economic Review, 100(5), 2010, Ariely, D., U. Gneezy, G. Loewenstein, and N. Mazar. Large Stakes and Big Mistakes. Review of Economic Studies, 76(2), 2009, Balsdon, E.M., Risk Management with Tournament Incentives. Journal of Quantitative Analysis in Sports, 9(4), 2013, Beilock, S.L., and R. Gray. Why Do Athletes Choke under Pressure? in Handbook of Sport Psychology (3 rd ed.), edited by G. Tenenbaum, and R.C. Eklund. Hoboken: Wiley & Sons, 2007, Brown, J. Quitters Never Win: the (Adverse) Incentive Effects of Competing with Superstars. Journal of Political Economy, 119(5), 2011, Cannizzaro, M. (2016, June 14). Dustin Johnson is Good Enough to Keep Choking Away Majors. The New York Post. Retrieved from Cao, Z., J. Price, and D.F. Stone. Performance under Pressure in the NBA. Journal of Sports Economics, 12(3), 2011, Chase, C. (2015, June 21). Dustin Johnson s US Open Choke was One of the Worst in Golf History. USA Today. Retrieved from Clark, R.D. Do Professional Golfers Choke? Perceptual and Motor Skills, 94(3c), 2002a, Clark, R.D. Evaluating the Phenomenon of Choking in Professional Golfers. Perceptual and Motor Skills, 95(3f), 2002b, Clark, R.D. A Longitudinal Study of Choking in Professional Golfers. Perceptual and Motor Skills, 105(3), 2007, Depken II, C. A., R. J. Sonora, & D. P. Wilson. Performance under Pressure: Preliminary Evidence from the National Hockey League. International Journal of Sport Finance, 7(3), 2012,
29 Deutscher, C., B. Frick, and J. Prinz. Performance under Pressure: Estimating the Returns to Mental Strength in Professional Basketball. European Sport Management Quarterly, 13(2), 2013, Dohmen, T.J. Do Professionals Choke under Pressure? Journal of Economic Behavior & Organization, 65(3), 2008, Ehrenberg, R.G., and M.L. Bognanno. Do Tournaments Have Incentive Effects? Journal of Political Economy, 98(6), 1990, Fearing, D., J. Acimovic, and S.C. Graves. How to Catch a Tiger: Understanding Putting Performance on the PGA Tour. Journal of Quantitative Analysis in Sports, 7(1), Fried, H.O., and L.W. Tauer. "The Impact of Age on the Ability to Perform under Pressure: Golfers on the PGA Tour." Journal of Productivity Analysis, 35(1), 2011, Genakos, C., and M. Pagliero. Interim Rank, Risk Taking, and Performance in Dynamic Tournaments. Journal of Political Economy, 120(4), 2012, Genakos, C., M. Pagliero, and E. Garbi. When Pressure Sinks Performance: Evidence from Diving Competitions. Economic Letters, 132, 2015, 5-8. González Díaz, J., O. Gossner and B. W. Rogers. Performing Best when it Matters Most: Evidence from Professional Tennis. Journal of Economic Behavior & Organization, 84, 2012, Hickman, D.C., and N.E. Metz. The Impact of Pressure on Performance: Evidence from the PGA Tour. Journal of Economic Behavior and Organization, 116, 2015, Hickman, D. C. and N.E. Metz Peer Effects in a Competitive Environment: Evidence from the PGA Tour. Economic Inquiry, 56(1), 2018, Hill, D.M., S. Hanton, N. Matthews, and S. Fleming. A Qualitative Exploration of Choking in Elite Golf. Journal of Clinical Sport Psychology, 4(3), 2010, Hill, D.M., S. Hanton, N. Matthews, and S. Fleming. Choking in Sport: a Review. International Review of Sport and Exercise Psychology, 3(1), 2013, Kali, R., D. Pastoriza, and J.-F. Plante. The Burden of Glory: Non-monetary Incentives in Rankorder Tournaments. Working paper, Kolev, G. I., G. Pina, and F. Todeschini. Overconfidence in Competitive Environments: Evidence from the National Hockey League. Kyklos, 68(1), 2015,
30 Lazear, E.P. "The Power of Incentives." American Economic Review, 90(2), 2000, Lazear, E.P. and S. Rosen. Rank-order Tournaments as Optimum Labor Contracts. Journal of Political Economy, 89, 1981, Pope, D.G., and M.E. Schweitzer. "Is Tiger Woods Loss Averse? Persistent Bias in the Face of Experience, Competition, and High Stakes." The American Economic Review, 101(1), 2011, Stone, D.F., and J. Arkes. Reference Points, Prospect Theory, and Momentum on the PGA Tour. Journal of Sports Economics, 17(5), 2016, Toma, M. "Missed Shots at the Free-Throw Line Analyzing the Determinants of Choking Under Pressure." Journal of Sports Economics, 2015, doi: / Wells, B.M., and J.J. Skowronski. Evidence of Choking under Pressure on the PGA Tour. Basic and Applied Social Psychology, 34(2), 2012,
31 31
THE IMPACT OF PRESSURE ON PERFORMANCE: EVIDENCE FROM THE PGA TOUR. Daniel C. Hickman a and Neil E. Metz b. August 2014
 THE IMPACT OF PRESSURE ON PERFORMANCE: EVIDENCE FROM THE PGA TOUR Daniel C. Hickman a and Neil E. Metz b August 2014 Abstract Do large rewards lead to psychological pressure causing underperformance? Previous
Kelsey Schroeder and Roberto Argüello June 3, 2016 MCS 100 Final Project Paper Predicting the Winner of The Masters Abstract This paper presents a
 Kelsey Schroeder and Roberto Argüello June 3, 2016 MCS 100 Final Project Paper Predicting the Winner of The Masters Abstract This paper presents a new way of predicting who will finish at the top of the
Is Tiger Woods Loss Averse? Persistent Bias in the Face of Experience, Competition, and High Stakes. Devin G. Pope and Maurice E.
 Is Tiger Woods Loss Averse? Persistent Bias in the Face of Experience, Competition, and High Stakes Devin G. Pope and Maurice E. Schweitzer Web Appendix Appendix Figure 1 replicates Figure 2 of the paper
Regression to the Mean at The Masters Golf Tournament A comparative analysis of regression to the mean on the PGA tour and at the Masters Tournament
 Regression to the Mean at The Masters Golf Tournament A comparative analysis of regression to the mean on the PGA tour and at the Masters Tournament Kevin Masini Pomona College Economics 190 2 1. Introduction
Contingent Valuation Methods
 ECNS 432 Ch 15 Contingent Valuation Methods General approach to all CV methods 1 st : Identify sample of respondents from the population w/ standing 2 nd : Respondents are asked questions about their valuations
Revisiting the Hot Hand Theory with Free Throw Data in a Multivariate Framework
 Calhoun: The NPS Institutional Archive DSpace Repository Faculty and Researchers Faculty and Researchers Collection 2010 Revisiting the Hot Hand Theory with Free Throw Data in a Multivariate Framework
The Project The project involved developing a simulation model that determines outcome probabilities in professional golf tournaments.
 Applications of Bayesian Inference and Simulation in Professional Golf 1 Supervised by Associate Professor Anthony Bedford 1 1 RMIT University, Melbourne, Australia This report details a summary of my
Evaluating the Influence of R3 Treatments on Fishing License Sales in Pennsylvania
 Evaluating the Influence of R3 Treatments on Fishing License Sales in Pennsylvania Prepared for the: Pennsylvania Fish and Boat Commission Produced by: PO Box 6435 Fernandina Beach, FL 32035 Tel (904)
The Burden of Glory: Competing for Non-monetary Incentives in Rank-order Tournaments
 The Burden of Glory: Competing for Non-monetary Incentives in Rank-order Tournaments Suggested running head: The Burden of Glory RAJA KALI Department of Economics. Sam M. Walton College of Business. University
Using Actual Betting Percentages to Analyze Sportsbook Behavior: The Canadian and Arena Football Leagues
 Syracuse University SURFACE College Research Center David B. Falk College of Sport and Human Dynamics October 2010 Using Actual Betting s to Analyze Sportsbook Behavior: The Canadian and Arena Football
Compression Study: City, State. City Convention & Visitors Bureau. Prepared for
 : City, State Prepared for City Convention & Visitors Bureau Table of Contents City Convention & Visitors Bureau... 1 Executive Summary... 3 Introduction... 4 Approach and Methodology... 4 General Characteristics
Performance under Pressure in the NBA. Zheng Cao Oregon State University. Joseph Price Brigham Young University
 Performance under Pressure in the NBA Zheng Cao Oregon State University Joseph Price Brigham Young University Daniel F. Stone Oregon State University June 14, 2010 Abstract We analyze the effects of pressure
When Falling Just Short is a Good Thing: the Effect of Past Performance on Improvement.
 Title: When Falling Just Short is a Good Thing: the Effect of Past Performance on Improvement. Mariya Burdina (corresponding author) Associate Professor of Economics University of Central Oklahoma 100
Effects of Incentives: Evidence from Major League Baseball. Guy Stevens April 27, 2013
 Effects of Incentives: Evidence from Major League Baseball Guy Stevens April 27, 2013 1 Contents 1 Introduction 2 2 Data 3 3 Models and Results 4 3.1 Total Offense................................... 4
Fit to Be Tied: The Incentive Effects of Overtime Rules in Professional Hockey
 Fit to Be Tied: The Incentive Effects of Overtime Rules in Professional Hockey Jason Abrevaya Department of Economics, Purdue University 43 West State St., West Lafayette, IN 4797-256 This version: May
Analysis of performance at the 2007 Cricket World Cup
 Analysis of performance at the 2007 Cricket World Cup Petersen, C., Pyne, D.B., Portus, M.R., Cordy, J. and Dawson, B Cricket Australia, Department of Physiology, Australian Institute of Sport, Human Movement,
Average Runs per inning,
 Home Team Scoring Advantage in the First Inning Largely Due to Time By David W. Smith Presented June 26, 2015 SABR45, Chicago, Illinois Throughout baseball history, the home team has scored significantly
Navigate to the golf data folder and make it your working directory. Load the data by typing
 Golf Analysis 1.1 Introduction In a round, golfers have a number of choices to make. For a particular shot, is it better to use the longest club available to try to reach the green, or would it be better
1. OVERVIEW OF METHOD
 1. OVERVIEW OF METHOD The method used to compute tennis rankings for Iowa girls high school tennis http://ighs-tennis.com/ is based on the Elo rating system (section 1.1) as adopted by the World Chess
Reference Points, Prospect Theory and Momentum on the PGA Tour
 Reference Points, Prospect Theory and Momentum on the PGA Tour Jeremy Arkes Naval Postgraduate School Daniel F. Stone Bowdoin College University of Virginia August 31, 2015 Background Background Pope and
Gamblers Favor Skewness, Not Risk: Further Evidence from United States Lottery Games
 Gamblers Favor Skewness, Not Risk: Further Evidence from United States Lottery Games Thomas A. Garrett Russell S. Sobel Department of Economics West Virginia University Morgantown, West Virginia 26506
Is Home-Field Advantage Driven by the Fans? Evidence from Across the Ocean. Anne Anders 1 John E. Walker Department of Economics Clemson University
 Is Home-Field Advantage Driven by the Fans? Evidence from Across the Ocean Anne Anders 1 John E. Walker Department of Economics Clemson University Kurt W. Rotthoff Stillman School of Business Seton Hall
PREDICTING the outcomes of sporting events
 CS 229 FINAL PROJECT, AUTUMN 2014 1 Predicting National Basketball Association Winners Jasper Lin, Logan Short, and Vishnu Sundaresan Abstract We used National Basketball Associations box scores from 1991-1998
A Novel Approach to Predicting the Results of NBA Matches
 A Novel Approach to Predicting the Results of NBA Matches Omid Aryan Stanford University aryano@stanford.edu Ali Reza Sharafat Stanford University sharafat@stanford.edu Abstract The current paper presents
Is there a gender difference in the ability of dealing with failures? Evidence from professional golf tournaments a
 Is there a gender difference in the ability of dealing with failures? Evidence from professional golf tournaments a by Olof Rosenqvist b April 15, 2016 Abstract Recent experimental evidence suggests that
Is It Truly a Building Ground? A Returns to Skill and Learning by Doing Study of the PGA Tour and the Web.com Tour
 Skidmore College Creative Matter Economics Student Theses and Capstone Projects Economics 2017 Is It Truly a Building Ground? A Returns to Skill and Learning by Doing Study of the PGA Tour and the Web.com
Review of A Detailed Investigation of Crash Risk Reduction Resulting from Red Light Cameras in Small Urban Areas by M. Burkey and K.
 Review of A Detailed Investigation of Crash Risk Reduction Resulting from Red Light Cameras in Small Urban Areas by M. Burkey and K. Obeng Sergey Y. Kyrychenko Richard A. Retting November 2004 Mark Burkey
STAT 625: 2000 Olympic Diving Exploration
 Corey S Brier, Department of Statistics, Yale University 1 STAT 625: 2000 Olympic Diving Exploration Corey S Brier Yale University Abstract This document contains a preliminary investigation of data from
Behavior under Social Pressure: Empty Italian Stadiums and Referee Bias
 Behavior under Social Pressure: Empty Italian Stadiums and Referee Bias Per Pettersson-Lidbom a and Mikael Priks bc* April 11, 2010 Abstract Due to tightened safety regulation, some Italian soccer teams
The Effects of Altitude on Soccer Match Outcomes
 The Effects of Altitude on Soccer Match Outcomes Tyler Williams Massachusetts Institute of Technology Cambridge, MA, United States, 02139 Email: tkwillia@mit.edu Abstract Soccer teams regularly compete
Existence of Nash Equilibria
 Existence of Nash Equilibria Before we can prove the existence, we need to remind you of the fixed point theorem: Kakutani s Fixed Point Theorem: Consider X R n a compact convex set and a function f: X
Performance and Risk Taking Under Threat of Elimination
 Performance and Risk Taking Under Threat of Elimination Nathan R. Adams Glen R. Waddell September 2018 Journal of Economic Behavior & Organization, forthcoming. Abstract We revisit the incentive effects
Table 1. Average runs in each inning for home and road teams,
 Effect of Batting Order (not Lineup) on Scoring By David W. Smith Presented July 1, 2006 at SABR36, Seattle, Washington The study I am presenting today is an outgrowth of my presentation in Cincinnati
Is Tiger Woods Loss Averse? Persistent Bias in the Face of Experience, Competition, and High Stakes*
 Is Tiger Woods Loss Averse? Persistent Bias in the Face of Experience, Competition, and High Stakes* Devin G. Pope The Wharton School University of Pennsylvania Maurice E. Schweitzer The Wharton School
Staking plans in sports betting under unknown true probabilities of the event
 Staking plans in sports betting under unknown true probabilities of the event Andrés Barge-Gil 1 1 Department of Economic Analysis, Universidad Complutense de Madrid, Spain June 15, 2018 Abstract Kelly
Primary Objectives. Content Standards (CCSS) Mathematical Practices (CCMP) Materials
 Mathematical Practices (CCMP) Materials") ODDSBALLS When is it worth buying a owerball ticket? Mathalicious 204 lesson guide Everyone knows that winning the lottery is really, really unlikely. But sometimes those owerball jackpots get really,
ODDSBALLS When is it worth buying a owerball ticket? Mathalicious 204 lesson guide Everyone knows that winning the lottery is really, really unlikely. But sometimes those owerball jackpots get really,
Tigermetrics. Roland Minton
 Tigermetrics Roland Minton The PGA Tour collects data on every stroke of (almost) every golf tournament, with the location of the ball determined to the inch. These data open up exciting possibilities
Wildlife Ad Awareness & Attitudes Survey 2015
 Wildlife Ad Awareness & Attitudes Survey 2015 Contents Executive Summary 3 Key Findings: 2015 Survey 8 Comparison between 2014 and 2015 Findings 27 Methodology Appendix 41 2 Executive Summary and Key Observations
Extreme Shooters in the NBA
 Extreme Shooters in the NBA Manav Kant and Lisa R. Goldberg 1. Introduction December 24, 2018 It is widely perceived that star shooters in basketball have hot and cold streaks. This perception was first
Cabrillo College Transportation Study
 Cabrillo College Transportation Study Planning and Research Office Terrence Willett, Research Analyst, Principle Author Jing Luan, Director of Planning and Research Judy Cassada, Research Specialist Shirley
QED. Queen s Economics Department Working Paper No Correcting for bias in hot hand analysis: Analyzing performance streaks in youth golf
 QED Queen s Economics Department Working Paper No. 1366 Correcting for bias in hot hand analysis: Analyzing performance streaks in youth golf Christopher Cotton Queen s University Frank McIntyre Rutgers
Pair by (how the Scheduler organizes the foursomes):
:") This cheat sheet describes every field in the tournament definition panels. Note: When we use the term foursome below, we are referring to a foursome or a threesome or twosome, as the case may be. Using
This cheat sheet describes every field in the tournament definition panels. Note: When we use the term foursome below, we are referring to a foursome or a threesome or twosome, as the case may be. Using
Percentage. Year. The Myth of the Closer. By David W. Smith Presented July 29, 2016 SABR46, Miami, Florida
 The Myth of the Closer By David W. Smith Presented July 29, 216 SABR46, Miami, Florida Every team spends much effort and money to select its closer, the pitcher who enters in the ninth inning to seal the
1. Answer this student s question: Is a random sample of 5% of the students at my school large enough, or should I use 10%?
 Econ 57 Gary Smith Fall 2011 Final Examination (150 minutes) No calculators allowed. Just set up your answers, for example, P = 49/52. BE SURE TO EXPLAIN YOUR REASONING. If you want extra time, you can
NBA TEAM SYNERGY RESEARCH REPORT 1
 NBA TEAM SYNERGY RESEARCH REPORT 1 NBA Team Synergy and Style of Play Analysis Karrie Lopshire, Michael Avendano, Amy Lee Wang University of California Los Angeles June 3, 2016 NBA TEAM SYNERGY RESEARCH
Lab Report Outline the Bones of the Story
 Lab Report Outline the Bones of the Story In this course, you are asked to write only the outline of a lab report. A good lab report provides a complete record of your experiment, and even in outline form
SPATIAL STATISTICS A SPATIAL ANALYSIS AND COMPARISON OF NBA PLAYERS. Introduction
 A SPATIAL ANALYSIS AND COMPARISON OF NBA PLAYERS KELLIN RUMSEY Introduction The 2016 National Basketball Association championship featured two of the leagues biggest names. The Golden State Warriors Stephen
Dwell Time and Immersion Depth Optimization For Immediate Defect Reduction
 Wave Soldering Dwell Time and Immersion Depth Optimization For Immediate Defect Reduction Studies in dwell time and immersion depth report significant opportunity for rapid improvement of wave solder repeatability
An Application of Signal Detection Theory for Understanding Driver Behavior at Highway-Rail Grade Crossings
 An Application of Signal Detection Theory for Understanding Driver Behavior at Highway-Rail Grade Crossings Michelle Yeh and Jordan Multer United States Department of Transportation Volpe National Transportation
Team 1. Lars Eller vs. Montreal Canadiens. Submissions on behalf of Montreal Canadiens (Team Side)
") Team 1 Lars Eller vs. Montreal Canadiens Submissions on behalf of Montreal Canadiens (Team Side) 1. Player Analysis 1.1. Introduction...1 1.2. Disappointing Offensive Output...1 1.3. Defensive Liability:
Team 1 Lars Eller vs. Montreal Canadiens Submissions on behalf of Montreal Canadiens (Team Side) 1. Player Analysis 1.1. Introduction...1 1.2. Disappointing Offensive Output...1 1.3. Defensive Liability:
STUDY BACKGROUND. Trends in NCAA Student-Athlete Gambling Behaviors and Attitudes. Executive Summary
 STUDY BACKGROUND Trends in NCAA Student-Athlete Gambling Behaviors and Attitudes Executive Summary November 2017 Overall rates of gambling among NCAA men have decreased. Fifty-five percent of men in the
Clutch Hitters Revisited Pete Palmer and Dick Cramer National SABR Convention June 30, 2008
 Clutch Hitters Revisited Pete Palmer and Dick Cramer National SABR Convention June 30, 2008 Do clutch hitters exist? More precisely, are there any batters whose performance in critical game situations
Peer Effect in Sports: A Case Study in Speed. Skating and Swimming
 Peer Effect in Sports: A Case Study in Speed Skating and Swimming Tue Nguyen Advisor: Takao Kato 1 Abstract: Peer effect is studied for its implication in the workplace, schools and sports. Sports provide
The (Adverse) Incentive Effects of Competing with Superstars: A. Reexamination of the Evidence 1
 Incentive Effects of Competing with Superstars: A. Reexamination of the Evidence 1") The (Adverse) Incentive Effects of Competing with Superstars: A Reexamination of the Evidence 1 Robert A. Connolly and Richard J. Rendleman, Jr. February 22, 2013 1 Robert A. Connolly is Associate Professor,
The (Adverse) Incentive Effects of Competing with Superstars: A Reexamination of the Evidence 1 Robert A. Connolly and Richard J. Rendleman, Jr. February 22, 2013 1 Robert A. Connolly is Associate Professor,
Golfers in Colorado: The Role of Golf in Recreational and Tourism Lifestyles and Expenditures
 Golfers in Colorado: The Role of Golf in Recreational and Tourism Lifestyles and Expenditures by Josh Wilson, Phil Watson, Dawn Thilmany and Steve Davies Graduate Research Assistants, Associate Professor
Journal of Quantitative Analysis in Sports
 Journal of Quantitative Analysis in Sports Volume 6, Issue 1 21 Article 5 Age and Winning Professional Golf Tournaments Gizachew Tiruneh University of Central Arkansas, gtiruneh@uca.edu Copyright c 21
Handicap Differential = (Adjusted Gross Score - USGA Course Rating) x 113 / USGA Slope Rating
 x 113 / USGA Slope Rating") FORMULAS Section 10 USGA HANDICAP FORMULA A Handicap Index is the USGA's mark which is used to indicate a measurement of a player's potential scoring ability on a course of standard difficulty. Potential
FORMULAS Section 10 USGA HANDICAP FORMULA A Handicap Index is the USGA's mark which is used to indicate a measurement of a player's potential scoring ability on a course of standard difficulty. Potential
Post impact trajectory of vehicles at rural intersections
 Post impact trajectory of vehicles at rural intersections Doecke SD., Woolley JE. and Mackenzie JR. Centre for Automotive Safety Research Abstract This report describes the path of vehicles after a collision
WHAT CAN WE LEARN FROM COMPETITION ANALYSIS AT THE 1999 PAN PACIFIC SWIMMING CHAMPIONSHIPS?
 WHAT CAN WE LEARN FROM COMPETITION ANALYSIS AT THE 1999 PAN PACIFIC SWIMMING CHAMPIONSHIPS? Bruce Mason and Jodi Cossor Biomechanics Department, Australian Institute of Sport, Canberra, Australia An analysis
The final set in a tennis match: four years at Wimbledon 1
 Published as: Journal of Applied Statistics, Vol. 26, No. 4, 1999, 461-468. The final set in a tennis match: four years at Wimbledon 1 Jan R. Magnus, CentER, Tilburg University, the Netherlands and Franc
Superstar Effects in Golf Tournaments. Zachary Lazow, Colgate University
 Superstar Effects in Golf Tournaments Zachary Lazow, Colgate University Lazow 1 Abstract This paper uses random assignments in golf tournaments to examine superstar and peer effects in high-skill work
Legendre et al Appendices and Supplements, p. 1
 Legendre et al. 2010 Appendices and Supplements, p. 1 Appendices and Supplement to: Legendre, P., M. De Cáceres, and D. Borcard. 2010. Community surveys through space and time: testing the space-time interaction
Going for the Green: A Simulation Study of Qualifying Success. Probabilities in Professional Golf 1
 Going for the Green: A Simulation Study of Qualifying Success Probabilities in Professional Golf 1 Robert A. Connolly and Richard J. Rendleman, Jr. September 20, 2010 1 Robert A. Connolly is Associate
Measuring the Sorting and Incentive Effects of Tournament Prizes
 Measuring the Sorting and Incentive Effects of Tournament Prizes Tim Davies Adrian Stoian 1 April 2007 Abstract Tournaments, where ordinal position determines rewards, are an important component of our
Volume 37, Issue 3. Elite marathon runners: do East Africans utilize different strategies than the rest of the world?
 Volume 37, Issue 3 Elite marathon runners: do s utilize different strategies than the rest of the world? Jamie Emerson Salisbury University Brian Hill Salisbury University Abstract This paper investigates
a) List and define all assumptions for multiple OLS regression. These are all listed in section 6.5
 List and define all assumptions for multiple OLS regression. These are all listed in section 6.5") Prof. C. M. Dalton ECN 209A Spring 2015 Practice Problems (After HW1, HW2, before HW3) CORRECTED VERSION Question 1. Draw and describe a relationship with heteroskedastic errors. Support your claim with
Prof. C. M. Dalton ECN 209A Spring 2015 Practice Problems (After HW1, HW2, before HW3) CORRECTED VERSION Question 1. Draw and describe a relationship with heteroskedastic errors. Support your claim with
The MACC Handicap System
 MACC Racing Technical Memo The MACC Handicap System Mike Sayers Overview of the MACC Handicap... 1 Racer Handicap Variability... 2 Racer Handicap Averages... 2 Expected Variations in Handicap... 2 MACC
Fishery Resource Grant Program Final Report 2010
 Fishery Resource Grant Program Final Report 2010 Project title: Improving Gill net Selectivity by Altering Mesh Characteristics 2010 Name of PI: Robert Weagley Telephone: (804) 855-4112 Address: 10201
Title: Modeling Crossing Behavior of Drivers and Pedestrians at Uncontrolled Intersections and Mid-block Crossings
 Title: Modeling Crossing Behavior of Drivers and Pedestrians at Uncontrolled Intersections and Mid-block Crossings Objectives The goal of this study is to advance the state of the art in understanding
What does it take to produce an Olympic champion? A nation naturally
 Survival of the Fittest? An Econometric Analysis in to the Effects of Military Spending on Olympic Success from 1996-01. Mark Frahill The Olympics are the world s greatest sporting celebrations, seen as
Improving the Australian Open Extreme Heat Policy. Tristan Barnett
 Improving the Australian Open Extreme Heat Policy Tristan Barnett Introduction One of the characteristics of tennis is that you do not know when the match is going to finish, and a long match is a real
Department of Economics Working Paper Series
 Department of Economics Working Paper Series Race and the Likelihood of Managing in Major League Baseball Brian Volz University of Connecticut Working Paper 2009-17 June 2009 341 Mansfield Road, Unit 1063
Tournament Selection Efficiency: An Analysis of the PGA TOUR s. FedExCup 1
 Tournament Selection Efficiency: An Analysis of the PGA TOUR s FedExCup 1 Robert A. Connolly and Richard J. Rendleman, Jr. June 27, 2012 1 Robert A. Connolly is Associate Professor, Kenan-Flagler Business
Professionals Play Minimax: Appendix
 Professionals Play Minimax: Appendix Ignacio Palacios-Huerta Brown University July 2002 In this supplementary appendix we first report additional descriptive statistics in section 1. We begin by reporting
save percentages? (Name) (University)
 (University)") 1 IB Maths Essay: What is the correlation between the height of football players and their save percentages? (Name) (University) Table of Contents Raw Data for Analysis...3 Table 1: Raw Data...3 Rationale
1 IB Maths Essay: What is the correlation between the height of football players and their save percentages? (Name) (University) Table of Contents Raw Data for Analysis...3 Table 1: Raw Data...3 Rationale
Figure 1. Winning percentage when leading by indicated margin after each inning,
 The 7 th Inning Is The Key By David W. Smith Presented June, 7 SABR47, New York, New York It is now nearly universal for teams with a 9 th inning lead of three runs or fewer (the definition of a save situation
DESIGNING PERCEPTUAL MOTOR SKILL DEVELOPMENT PROGRAMS FOR SQUASH
 DESIGNING PERCEPTUAL MOTOR SKILL DEVELOPMENT PROGRAMS FOR SQUASH by Roger Flynn (Grad. Dip. Elite Sports Coaching) Designing Perceptual Motor Skill Development Programs for Squash Introduction by Roger
What Causes the Favorite-Longshot Bias? Further Evidence from Tennis
 MPRA Munich Personal RePEc Archive What Causes the Favorite-Longshot Bias? Further Evidence from Tennis Jiri Lahvicka 30. June 2013 Online at http://mpra.ub.uni-muenchen.de/47905/ MPRA Paper No. 47905,
Analysis of iracing Race Summary and Lap Data
 Executive Summary This document presents initial, exploratory analysis of three seasons of Pro Mazda official racing in order to ascertain causes of incidents (principally off-track driving, collisions
Gizachew Tiruneh, Ph. D., Department of Political Science, University of Central Arkansas, Conway, Arkansas
 Gizachew Tiruneh, Ph. D., Department of Political Science, University of Central Arkansas, Conway, Arkansas [A revised version of the paper is published by the Journal of Quantitative Analysis in Sports,
CEP Discussion Paper No 1345 April When Pressure Sinks Performance: Evidence from Diving Competitions
 ISSN 2042-2695 CEP Discussion Paper No 1345 April 2015 When Pressure Sinks Performance: Evidence from Diving Competitions Christos Genakos Mario Pagliero Eleni Garbi Abstract Tournaments are designed to
Life Transitions and Travel Behaviour Study. Job changes and home moves disrupt established commuting patterns
 Life Transitions and Travel Behaviour Study Evidence Summary 2 Drivers of change to commuting mode Job changes and home moves disrupt established commuting patterns This leaflet summarises new analysis
PLAY DAY Hand Book 2017 Revised 12/26/16
 PLAY DAY Hand Book 2017 Revised 12/26/16 Okay, how teams will be chosen. We will use one of the following methods each play day: a. Random pick from the orange bucket for teams. b. Random pick from 2 bins
Case Study: How Misinterpreting Probabilities Can Cost You the Game. Kurt W. Rotthoff Seton Hall University Stillman School of Business
 Case Study: How Misinterpreting Probabilities Can Cost You the Game Kurt W. Rotthoff Seton Hall University Stillman School of Business Abstract: Using data to make future decisions can increase the odds
6-6d/6 Omission of Penalty on Returned Score Card Discovered Before Close of Competition
 6-6d/6 Omission of Penalty on Returned Score Card Discovered Before Close of Competition Q. A competitor returned a score lower than actually taken for the 12th hole due to failure to include a penalty
2017 Distance Report. A Review of Driving Distance Introduction
 A Review of Driving Distance - 2017 Introduction In May 2002 the USGA/R&A adopted a Joint Statement of Principles. The purpose of this statement was to set out the joint views of the R&A and the USGA,
Student Population Projections By Residence. School Year 2016/2017 Report Projections 2017/ /27. Prepared by:
 Student Population Projections By Residence School Year 2016/2017 Report Projections 2017/18 2026/27 Prepared by: Revised October 31, 2016 Los Gatos Union School District TABLE OF CONTENTS Introduction
CHAPTER 10 TOTAL RECREATIONAL FISHING DAMAGES AND CONCLUSIONS
 CHAPTER 10 TOTAL RECREATIONAL FISHING DAMAGES AND CONCLUSIONS 10.1 INTRODUCTION This chapter provides the computation of the total value of recreational fishing service flow losses (damages) through time
Economic Value of Celebrity Endorsements:
 Economic Value of Celebrity Endorsements: Tiger Woods Impact on Sales of Nike Golf Balls September 27, 2012 On Line Appendix The Golf Equipments Golf Bags Golf bags are designed to transport the golf clubs
Hitting The Driver Made Easy
 Table of Contents Introduction 3 Equipment 4 The Golf Shaft 4 The Golf Grip 5 The Club Head 6 Equipment Summary 7 The Setup And Swing 9 The Grip 10 Ball Position 12 Alignment 12 Posture 14 The Take-Away
Lesson 14: Modeling Relationships with a Line
 Exploratory Activity: Line of Best Fit Revisited 1. Use the link http://illuminations.nctm.org/activity.aspx?id=4186 to explore how the line of best fit changes depending on your data set. A. Enter any
Department of Agricultural and Resource Economics, Fort Collins, CO
 July 2011 EMPR 11-01 Department of Agricultural and Resource Economics, Fort Collins, CO 80523-1172 http://dare.colostate.edu/pubs WHAT IS THE VALUE OF A FISHING TRIP? A COMPARISON OF PUBLIC AND PRIVATE
Gender Differences in Performance in Competitive Environments: Field Evidence from Professional Tennis Players *
 Gender Differences in Performance in Competitive Environments: Field Evidence from Professional Tennis Players * M. Daniele Paserman Hebrew University dpaserma@shum.huji.ac.il August 2006 Abstract This
Golf. By Matthew Cooke. Game Like Training
 Game Like Training for Golf By Matthew Cooke Game Like Training @gltgolf @gltraininggolf Introduction In this quick start guide we dive a little deeper into what it means to train in a Game Like way. Game
A GUIDE TO RISK ASSESSMENT IN SHIP OPERATIONS
 A GUIDE TO RISK ASSESSMENT IN SHIP OPERATIONS Page 1 of 7 INTRODUCTION Although it is not often referred to as such, the development and implementation of a documented safety management system is an exercise
Formats Contained in This WVMC Tournament Format Document Include: (Latest Update was on 7/1/18)
") Formats Contained in This WVMC Tournament Format Document Include: (Latest Update was on 7/1/18) 1. Individual Throw Out the Worst 2 Holes 2. Individual Modified Stableford 3. Individual Match Play versus
Formats Contained in This WVMC Tournament Format Document Include: (Latest Update was on 7/1/18) 1. Individual Throw Out the Worst 2 Holes 2. Individual Modified Stableford 3. Individual Match Play versus
1. A Report to the Attorney General of the State of Alaska I TO THE EXXON VALDEZ OIL SPILL. December 18, 1992 OF RECREATIONAL FISHING LOSSES RELATED
 A PRELIMINARY ECONOMIC ANALYSIS OF RECREATIONAL FISHING LOSSES RELATED TO THE EXXON VALDEZ OIL SPILL Richard T. Carson W. Michael Hanemann December 18, 1992 1. A Report to the Attorney General of the State
Atmospheric Waves James Cayer, Wesley Rondinelli, Kayla Schuster. Abstract
 Atmospheric Waves James Cayer, Wesley Rondinelli, Kayla Schuster Abstract It is important for meteorologists to have an understanding of the synoptic scale waves that propagate thorough the atmosphere
Beyond Central Tendency: Helping Students Understand the Concept of Variation
 Decision Sciences Journal of Innovative Education Volume 6 Number 2 July 2008 Printed in the U.S.A. TEACHING BRIEF Beyond Central Tendency: Helping Students Understand the Concept of Variation Patrick
Summary of SAGA Handicap Manual
 Summary of SAGA Handicap Manual 01/11/2011 Version 004 The following is a summary of important sections of the SAGA Handicapping Manual. Definitions Handicap A handicap is the number of strokes a player