Harvest Data & Population Status Reports
|
|
|
- Teresa Lane
- 6 years ago
- Views:
Transcription


1 Small Game Status 2016
2 Harvest Data & Population Status Reports Compiled by: Shawn P. Espinosa, Upland Game Staff Biologist Russell Woolstenhulme, Waterfowl and Furbearer Staff Biologist Regional Supervising Game Biologists Mike Scott - Tom Donham - Steven Kimble Cover photo of a chukar courtesy of Tim Torell
3 State of Nevada Brian Sandoval, Governor Department of Wildlife Tony Wasley, Director Game Division Brian F. Wakeling, Chief Board of Wildlife Commissioners Grant Wallace, Chairman... Dyer Brad Johnston, Vice Chairman... Yerington Jon Almberg... Ely Thomas Barnes...Elko Jeremy Drew... Reno Kerstan Hubbs... Henderson David McNinch... Reno Paul E. Valentine... Henderson Bill Young... Las Vegas Persons are free to use material in this report for educational or informational purposes. However, since most reports are part of continuing studies, persons intending to use this material in scientific publications should obtain prior permission from the Department of Wildlife. In all cases, tentative conclusions should be identified as such in quotation, and due credit would be appreciated. This publication will be made available in an alternative format upon request. The Nevada Department of Wildlife receives funds from Federal Aid in Fish and Wildlife Restoration Acts. Federal laws prohibit discrimination on the basis of race, color, national origin, age, disability and sex. Individuals with hearing impairments may contact the Department at (775) via a text telephone (TTY) telecommunications device by first calling the State of Nevada Relay Operator at If you believe you ve been discriminated against in any NDOW program, activity, or facility, please write to the following: Diversity Program Manager Director U.S. Fish and Wildlife Service Nevada Department of Wildlife 4401 N. Fairfax Drive, MS: Sierra Center Parkway, Suite 120 Arlington, Virginia Reno, Nevada 89511
4


5 Director's Message Tony Wasley, Director Nevada Department of Wildlife Dear Fellow Sportsmen: I am looking forward to upland game seasons! While big game hunting opportunities are typically dictated by the luck of the draw, upland game opportunities are determined by interest, and will of the hunter. Not getting drawn for a big game hunt can open a wealth of hunting opportunities if a hunter so chooses. Another advantage of upland game hunting is that your hunt need not end the day of your first harvest; liberal bag and seasons allow you to stay in the field and enjoy what Nevada has to offer! The Nevada Department of Wildlife conducts many habitat restoration projects to benefit upland game each year, along with water developments and initiating programs with private landowners to benefit these game animals. Upland game remains an important focus of our wildlife management programs. Wildlife management is dependent upon a lot of variables, not the least of which is climate. At times I feel as though the weather conspires against us it is either too dry or rains too much at the wrong time! Last year we finally received some improved winter precipitation that favored production of grasses and forbs that wildlife often depend on for food and cover. Unfortunately, the precipitation was followed by an extended dry period that turned those vital grasses and forbs into an easily ignited fuel source creating fires that can irreparably damage wildlife habitat. The Department has noted improvements in many upland game populations this year. Sage grouse populations have increased approximately 19% and chukar populations, although variably distributed have increased 5% over last year s numbers. Hunters seeking upland game this year are in luck, but shouldn t expect game to be abundant in every valley or mountain range. Remember, the word "hunt" is an active verb! A common understanding among hunters is that the worst day in the field is better than the best day in the office. I agree, and my hope is that by using the data and reports compiled in this status book, we can help you make a good day even better. Fall days in Nevada are difficult to surpass when family and friends are enjoying one another s company in the pursuit of upland game. As always, the Department wants to ensure that we deliver the best value possible to our customers. We are working to simplify our license structures and our harvest guidelines. We are trying to improve the information and data we provide to our customers to better inform them on everything we do. We are supporting national legislation that can provide substantial funding to implement our State Wildlife Action Plan. I hope this status report proves valuable in your planning for your fall hunts and outdoor excursions this year! Sincerely,
6
7 Table of Contents HUNTING SEASONS & BAG LIMIT REGULATIONS... 1 UPLAND GAME... 1 WILD TURKEY... 6 FALCONRY SEASON FURBEARING ANIMALS BOBCAT PELT SEALING DATES MIGRATORY UPLAND GAME BIRDS STATEWIDE SUMMARIES FOR UPLAND GAME SPECIES GREATER SAGE-GROUSE FOREST GROUSE CHUKAR PARTRIDGE CALIFORNIA QUAIL GAMBEL S QUAIL WILD TURKEY RABBIT HIMALAYAN SNOWCOCK STATEWIDE SUMMARIES FOR MIGRATORY GAME BIRDS WATERFOWL DUCKS AND MERGANSERS GEESE TUNDRA SWAN MOURNING AND WHITE-WINGED DOVE BAND-TAILED PIGEON AMERICAN CROW STATEWIDE SUMMARIES FOR FURBEARER ANIMALS APPENDIX I... A-1 APPENDIX II... Q-1
8
9 HUNTING SEASONS & BAG LIMIT REGULATIONS Commission Regulation (With Amendments #1, #2 and #3) (Units referenced are Game Management Units) UPLAND GAME YOUTH CHUKAR AND HUNGARIAN PARTRIDGE SEASON OPEN AREAS: Statewide* SPECIES ALLOWED: Chukar and Hungarian partridge. SEASON DATES: The last Saturday and Sunday of September. LIMITS: Daily bag limit 6. Possession limit 12. SHOOTING HOURS: Sunrise to sunset daily. Limit singly or in the aggregate. Open to hunters 15 years of age or younger only. Youth must SPECIAL REGULATIONS: be accompanied by an adult who is at least 18 years old. License and stamp requirements apply pursuant to NRS and NRS YOUTH CALIFORNIA AND GAMBEL S QUAIL SEASON OPEN AREAS: Statewide* SPECIES ALLOWED: California, Gambel s and scaled quail SEASON DATES: The last Saturday and Sunday of September. LIMITS: Daily bag limit 10. Possession Limit 20. SHOOTING HOURS: Sunrise to sunset daily. Limit singly or in the aggregate. Open to hunters 15 years of age or younger only. Youth must SPECIAL REGULATIONS: be accompanied by an adult who is at least 18 years old. License and stamp requirements apply pursuant to NRS and NRS
10 OPEN AREAS: SPECIES ALLOWED: SEASON DATES: YOUTH RABBIT SEASON Statewide* Cottontail, pygmy and white-jackrabbits The last Saturday and Sunday of September. LIMITS: Daily bag limit 10. Possession Limit 20. SHOOTING HOURS: SPECIAL REGULATIONS: Sunrise to sunset daily. Limit singly or in the aggregate except for pygmy rabbit where limits may not include more than 2 daily and 4 in possession. Open to hunters 15 years of age or younger only. Youth must be accompanied by an adult who is at least 18 years old. License and stamp requirements apply pursuant to NRS and NRS SAGE-GROUSE OPEN AREAS: Hunt Unit 184 and Hunt Unit 031* SEASON DATES: First Saturday and Sunday in October LIMITS: Daily bag limit 2. Possession limit 4. SHOOTING HOURS: Sunrise to sunset daily. SPECIAL REGULATIONS: Closed to nonresidents. *Please see 2015 Sage-grouse Hunt Units and Seasons Map available at SAGE-GROUSE OPEN AREAS: Hunt Units 061, 062, 064, 065, 066, 067, that portion of Hunt Unit 068 in Elko County, 071, 072, 073, 074, 075, 077, 101, 102, 103, 104, 108, 111, 112, 113, 121, 131, 141, 142, 143, 144, 145, 154, 155, 161, 162, 163, 164, 172, 173 and those portions of Hunt Units 221 and 222 in White Pine County* SEASON DATES: September 25 October 9 LIMITS: Daily bag limit 2. Possession limit 4. SHOOTING HOURS: Sunrise to sunset daily. SPECIAL REGULATIONS: Closed to nonresidents. *Please see 2015 Sage-grouse Hunt Units and Seasons Map available at 2
11 SAGE-GROUSE OPEN AREAS: Hunt Units 011, those portions of hunt unit 012 in Washoe and Humboldt Counties, 013, 014, that portion of Hunt Unit 034 in Humboldt County and hunt unit 051* SEASON DATES: September 25 October 4 LIMITS: Daily bag limit 2. Possession limit 4. SHOOTING HOURS: Sunrise to sunset daily. SPECIAL REGULATIONS: Closed to nonresidents. *Please see 2015 Sage-grouse Hunt Units and Seasons Map available at SHELDON NATIONAL WILDLIFE REFUGE SPECIAL SAGE-GROUSE HUNT Unit 033 of Washoe and Humboldt Counties (Sheldon OPEN AREAS: National Wildlife Refuge) excluding the Little Sheldon and other areas as posted. Hunt Period SEASON DATES: Third Saturday and Sunday in September LIMITS: Daily bag limit 2. Possession limit 4. SHOOTING HOURS: Sunrise to sunset daily. Open to nonresidents. Limited to 75 reservations awarded through random draw. SPECIAL REGULATIONS: Unless his privilege is limited or revoked pursuant to law, any resident or nonresident is eligible to apply once for the Sheldon Special Sage Grouse Hunt in a year. Up to 4 applicants may apply as a party. Parties may be comprised of a combination of residents and nonresidents. Applications for reservations for the Sheldon Special Sage Grouse Hunt must be received by the Nevada Department of Wildlife, Game Division, 1100 Valley Road, Reno NV by 5:00 p.m. on the first Friday in August. Successful applicants will be notified by mail. 3
12 BLUE (DUSKY AND SOOTY) AND RUFFED GROUSE Carson City, Clark, Douglas, Elko, Eureka, Esmeralda, OPEN AREAS: Humboldt, Lander, Lincoln, Lyon, Mineral, Nye, Washoe, White Pine SEASON DATES: September 1 December 31 LIMITS: Daily bag limit 3 Possession limit 6 SHOOTING HOURS: Sunrise to sunset daily. Limit singly or in the aggregate. SPECIAL REGULATIONS: Per NAC , the head or one fully feathered wing must be attached to all dusky, sooty and ruffed grouse until the carcass reaches the possessor s residence or a commercial facility for its preservation. Persons harvesting dusky, sooty or ruffed grouse are requested to deposit one wing from each bird harvested at any Nevada Department of Wildlife office, check station, or with Department employees who contact you in the field. SNOWCOCK OPEN AREAS: Elko and White Pine Counties SEASON DATES: September 1 - November 30 LIMITS: Daily bag limit 2. Possession limit 2. SHOOTING HOURS: Sunrise to sunset daily. Prior to hunting snowcock, persons must obtain a snowcock hunting free-use permit from any Nevada Department of SPECIAL REGULATIONS: Wildlife office. Permits may be faxed to persons planning to hunt snowcock once appropriate information has been collected from the hunter. CHUKAR AND HUNGARIAN PARTRIDGE OPEN AREAS: Statewide* SEASON DATES: Second Saturday in October first Sunday in February LIMITS: Daily bag limit 6. Possession limit 18. SHOOTING HOURS: Sunrise to sunset daily. SPECIAL REGULATIONS: Limit singly or in the aggregate. 4
13 CALIFORNIA, GAMBEL S AND MOUNTAIN QUAIL OPEN AREAS: Statewide* SEASON DATES: Second Saturday in October first Sunday in February LIMITS: Daily bag limit 10. Possession limit 20. SHOOTING HOURS: SPECIAL REGULATIONS: Sunrise to sunset daily. Limit singly or in the aggregate except for mountain quail where limits may not include more than 2 daily and 4 in possession. Persons who harvest mountain quail are requested to report their harvest to the Nevada Department of Wildlife, 1100 Valley Road, Reno, NV 89512, phone (775) PHEASANT OPEN AREAS: Statewide* SEASON DATES: November 1 November 30. LIMITS: Daily bag limit 2. Possession limit 4. SHOOTING HOURS: Sunrise to sunset daily. SPECIAL REGULATIONS: Cocks only COTTONTAIL, PYGMY AND WHITE-TAILED RABBITS OPEN AREAS: Statewide* SEASON DATES: Second Saturday in October February 28. LIMITS: Daily bag limit 10. Possession limit 20. SHOOTING HOURS: Sunrise to sunset daily. SPECIAL REGULATIONS: Limit singly or in the aggregate except for pygmy rabbit where limits may not include more than 2 daily and 4 in possession. Persons who harvest pygmy rabbit are requested to report their harvest to the Nevada Department of Wildlife, 1100 Valley Road, Reno, NV 89512, phone (775)
14 WILD TURKEY APPLICATION PROCEDURES FOR RESIDENT AND NONRESIDENT HUNTS: Unless his privilege is limited or revoked pursuant to law, an eligible person may apply once for a type of hunt for Wild Turkey during a draw period. Only one person may apply on an application. Except for those Wild Turkey hunts requiring the landowner to sign the application, Wild Turkey applications must be submitted online through the Internet at Hand delivered applications will not be accepted. Applications will be accepted until 11:00:00 p.m. on the first Tuesday in February. Applications for bonus points only will be accepted until 11:00:00 p.m. on the second Tuesday in February. The release date will be the fourth Friday in February. Except as specified for the Junior Wild Turkey Hunts and Landowner Hunts, any remaining tags will be available on a first come, first serve basis through the Internet at over the counter during business hours, M F, 8 a.m. to 5 p.m. at Wildlife Administrative Services, 185 N. Maine St., Fallon, Nevada Remaining tags will be sold until 7 weekdays prior to the close of the season. Only one Wild Turkey tag can be awarded to an individual within a calendar year. JUNIOR WILD TURKEY GENERAL SPRING HUNTS 0138 PHYSICAL CHARACTERISTICS: LIMIT: SHOOTING HOURS: SPECIAL REGULATIONS: Bearded Wild Turkey 1 by tag only. One half hour before sunrise to 4:00 p.m. daily Youth must be 12 prior to the opening of the hunt season indicated and not attain their 18 th birthday until after the last day of the hunt season indicated, pursuant to NAC Applications for these tags or bonus points will only be accepted during the draw application periods. Remaining tags will not be issued. Closed to nonresidents. Open Areas: Season Dates Quota Mason Valley Wildlife Management Area Last Saturday in March through first Sunday in May 2 Moapa Valley of Clark County Last Saturday in March through fourth Sunday in April 3 Unit 115 of White Pine County** Last Saturday in March through first Sunday in May 2 * Applicants are advised that a significant portion of the turkey population occurs on private lands and permission should be obtained from a landowner before applying for this hunt. ** Applicants are advised that a significant portion of the turkey population occurs on Great Basin National Park lands. Hunting is not permitted within park boundaries. 6
15 WILD TURKEY 2015 & 2016 SPRING LIMITED ENTRY HUNTS 0131 & 0132 PHYSICAL CHARACTERISTICS: LIMIT: SHOOTING HOURS: Bearded Wild Turkey 1 by tag only One half hour before sunrise to 4:00 p.m. daily UNIT 101 of ELKO COUNTY* Hunt Periods: Seasons Resident Hunt 0131 Tag Quota Nonresident Hunt 0132 Last Saturday in March first Sunday in May 5 - UNITS 102 & 065 of ELKO COUNTY* Hunt Periods: Hunt Periods: Seasons Resident Hunt 0131 Tag Quota Nonresident Hunt 0132 Last Saturday in March first Sunday in May 12 1 UNITS 151 and 152 of LANDER COUNTY* Seasons Resident Hunt 0131 Tag Quota Nonresident Hunt 0132 Last Saturday in March first Sunday in May 1 - MASON VALLEY WILDLIFE MANAGEMENT AREA ONLY OF UNIT 203 Seasons Resident Hunt 0131 Nonresident Hunt 0132 Last Saturday in March first Sunday in April 5 - Hunt Second Saturday in April third Sunday in April 5 - Periods: Fourth Saturday in April first Sunday in May 5 - *Applicants are advised that a significant portion of the turkey population occurs on private lands and permission should be obtained from a landowner before applying for this hunt. 7
16 WILD TURKEY 2015 & 2016 SPRING LIMITED ENTRY HUNTS 0131 & 0132 PHYSICAL CHARACTERISTICS: Bearded Wild Turkey LIMIT: 1 by tag only SHOOTING HOURS: One half hour before sunrise to 4:00 p.m. daily MOAPA VALLEY PORTION OF CLARK COUNTY* Hunt Periods: Seasons Resident Hunt 0131 Tag Quota Nonresident Hunt 0132 Last Saturday in March first Friday in April 4 - First Saturday in April second Friday in April 4 - Second Saturday in April third Friday in April 4 1 PERSHING COUNTY* Hunt Periods: Tag Quota Seasons Resident Hunt 0131 Nonresident Hunt 0132 Last Saturday in March second Sunday in April 8 - Third Saturday in April first Sunday in May 8 - Hunt Periods: UNIT 115 OF WHITE PINE COUNTY** Seasons Resident Hunt 0131 Tag Quota Nonresident Hunt 0132 Last Saturday in March first Sunday in May 23 2 *Applicants are advised that a significant portion of the turkey population occurs on private lands and permission should be obtained from a landowner before applying for this hunt. **Applicants are advised that a significant portion of the turkey population occurs on Great Basin National Park lands. Hunting is not permitted within park boundaries. 8
17 WILD TURKEY 2015 & 2016 SPRING HUNTS & 0137 Unit 192 of Douglas County PHYSICAL CHARACTERISTICS: LIMIT: SHOOTING HOURS: SEASON DATES: QUOTAS: SPECIAL REGULATIONS: Bearded Wild Turkey 1 by tag only. One half hour before sunrise to 4:00 p.m. daily. Last Saturday in March first Sunday in May Resident Hunt 0135 Nonresident Hunt 0137 Open Open UNIT 192 of DOUGLAS COUNTY APPLICATION REGULATIONS: A Douglas County Application Form is required. Hunters can obtain these forms from the participating landowners. A landowner must sign the application form. The form must be submitted through the mail or over the counter during business hours, M-F, 8 a.m. to 5 p.m. at Wildlife Administrative Services, PO Box 1345, Fallon, NV Tags will be available until the close of the season. Internet applications for the Douglas County hunt will not be available. Unless his privilege is limited or revoked pursuant to law, an eligible person may apply once for a type of hunt for Wild Turkey during a draw period. Only one person may apply on an application. Only one Wild Turkey tag per calendar year. WILD TURKEY 2015 & 2016 SPRING HUNTS & 0137 Units 202, 203, 204 and 291 of Lyon County (except the Mason Valley Wildlife Management Area)* PHYSICAL CHARACTERISTICS: Bearded Wild Turkey LIMIT: SHOOTING HOURS: SEASON DATES: QUOTAS: 1 by tag only. One half hour before sunrise to 4:00 p.m. daily. Last Saturday in March first Sunday in May Resident Hunt 0135 Nonresident Hunt 0137 Open Open SPECIAL REGULATIONS: UNITS 202, 203, 204 and 291 OF LYON COUNTY (except the Mason Valley Wildlife Management Area)* APPLICATION REGULATIONS: A Lyon County Application Form is required. Hunters can obtain these forms from the participating landowners. A landowner must sign the application form. The form must be submitted through the mail or over the counter during business hours, M-F, 8 a.m. to 5 p.m. at Wildlife Administrative Services, PO Box 1345, Fallon, NV Tags will be available until the close of the season. Internet applications for the Lyon County hunt will not be available. Unless his privilege is limited or revoked pursuant to law, an eligible person may apply once for a type of hunt for Wild Turkey during a draw period. Only one person may apply on an application. Only one Wild Turkey tag per calendar year. 9
18 WILD TURKEY 2015 & 2016 SPRING HUNTS & 0137 PARADISE VALLEY OF HUMBOLDT COUNTY PHYSICAL CHARACTERISTICS: Bearded Wild Turkey LIMIT: SHOOTING HOURS: SEASON DATES: QUOTAS: 1 by tag only. One half hour before sunrise to 4:00 p.m. daily. Last Saturday in March first Sunday in May Resident Hunt 0135 Nonresident Hunt 0137 Open Open SPECIAL REGULATIONS: PARADISE VALLEY OF HUMBOLDT COUNTY APPLICATION REGULATIONS: A Paradise Valley of Humboldt County Application Form is required. Hunters can obtain these forms from the participating landowners. A landowner must sign the application form. The form must be submitted through the mail or over the counter during business hours, M-F, 8 a.m. to 5 p.m. at Wildlife Administrative Services, PO Box 1345, Fallon, NV Tags will be available until the close of the season. Internet applications for the Paradise Valley of Humboldt County hunt will not be available. Unless his privilege is limited or revoked pursuant to law, an eligible person may apply once for a type of hunt for Wild Turkey during a draw period. Only one person may apply on an application. Only one Wild Turkey tag per calendar year. 10
19 FALCONRY SEASON FALCONRY SEASONS FOR UPLAND GAME BIRDS & RABBITS OPEN AREAS: Statewide* SEASON DATES: September 1 Last day of February LIMITS: Daily bag limit 2. Possession limit 8. SHOOTING HOURS: Sunrise to sunset daily. All resident upland game birds except turkey and sharp-tailed grouse. Cottontail, pygmy and White-tailed jackrabbits. SPECIAL REGULATIONS: The taking of sage grouse by falconry is only allowed in those units where there is an established open season. The daily and possession limit for sage-grouse is 2 and 4. Limits singly or in the aggregate. *except per NAC
20 FURBEARING ANIMALS OPEN AREAS: BEAVER, MINK AND MUSKRAT Statewide SEASON DATES: October 1 April 30 OPEN AREAS: OTTER Elko, Eureka, Humboldt, Lander and Pershing Counties SEASON DATES: October 1 March 31 Carson City, Churchill, Clark, Douglas, Esmeralda, Lincoln, Lyon, Mineral, Nye, Storey, Washoe and White Pine counties are closed to otter trapping. SPECIAL REGULATIONS: If an otter is accidentally trapped or killed in those counties which are closed or outside the prescribed season, the person trapping or killing it shall report the trapping or killing within 48 hours to a representative of the Department of Wildlife. The animal must be disposed of in accordance with the instructions of the representative. OPEN AREAS: SEASON DATES: Statewide KIT AND RED FOX October 1 - Last Day of February BOBCAT SEASON OPEN AREAS: Statewide SEASON DATES: December 1 February 21 SPECIAL REGULATIONS: Closed to Nonresidents. OPEN AREAS: SEASON DATES: SPECIAL REGULATIONS: GRAY FOX SEASON Statewide November 1 Last Day in February Closed to Nonresidents. 12
21 BOBCAT PELT SEALING DATES Pelt sealing will be done only on the dates and during the times specified. Sealing locations will be at Department offices unless otherwise noted. BOBCAT PELT SEALING DATES FOR THE SEASON City Date Time Location NDOW Warehouse Carson City December am-2pm Corner of South Carson at Colorado Street Elko January 19 February 9 8 a.m. 5 p.m. 12p.m. 5 p.m. NDOW Elko Office March 2. 8 a.m. 5 p.m. Ely January 21, February a.m. 3 p.m. NDOW Ely Office Eureka January p.m. 5 p.m. NDOW Eureka Office January a.m. 3 p.m. NDOW Fallon Office Fallon Annually scheduled to coincide Nevada Trappers Association 7 a.m. 11 a.m. with the NTA Fur Sale. Fallon Fur Sale March 2 10 a.m.-3 p.m. NDOW Fallon Office Las Vegas January a.m. 5 p.m. March 2 1 p.m. 5 p.m. NDOW Las Vegas Office Panaca February a.m. 5 p.m. Nevada State Parks - NDOW Office, Panaca Tonopah February a.m. 5 p.m. March 2. 1 p.m. 5 p.m. NDOW Tonopah Office Winnemucca January a.m. 1 p.m. NDOW Winnemucca Office 13
22 MIGRATORY UPLAND GAME BIRDS AMERICAN CROW OPEN AREAS: Statewide SPRING SEASON: March 1 April 15 FALL SEASON: September 1 November 17 LIMITS: Daily bag limit 10 SHOOTING HOURS: SPECIAL REGULATIONS: Sunrise to sunset daily. Shotguns only. All crows must be retrieved and removed from the field. Season closed on ravens Note: pursuant to 50 CFR the maximum number of days a state can allow crow hunting is 124 in a calendar year. OPEN AREAS: MOURNING & WHITE-WINGED DOVE Statewide SEASON: September 1 October 30 LIMITS: Daily bag limit 15. Possession limit 45. SHOOTING HOURS: One half hour before sunrise to sunset daily. SPECIAL REGULATIONS: Limits for mourning dove and white-wing dove are singly or in aggregate. Note: Federal Framework for dove hunting seasons is published in July each year. Identified dates and season length are subject to change. Should the federal framework require alteration of Commission-approved seasons, then an amendment to CR14-11 shall be submitted for Commission action at their August meeting. 14
23 STATEWIDE SUMMARIES FOR UPLAND GAME SPECIES Report by: Shawn Espinosa, Upland Game Staff Specialist GREATER SAGE-GROUSE Season Structure and Limits Seasons for Greater sage-grouse (hereafter referred to as sage-grouse) were split into three separate seasons in 2015, depending on the region or hunt unit in which a season was held, plus a special two-day hunting season within the Sheldon National Wildlife Refuge (SNWR). Within the Eastern and Southern Regions including Elko, Eureka, Lander, Nye, and White Pine Counties, the sage-grouse season lasted 15 days from September 25 October 9, 2015 for those hunt units that were open. In the Western Region, a 10-day season was held from September 25 October 4, 2015 for open hunt units. These hunt units were located within Washoe and Humboldt Counties in the northwestern portion of the state. Additionally, a two-day season was held in both Hunt Unit 184 in Churchill and Lander Counties and Hunt Unit 031 in Humboldt County from October 3 4, Lastly, a two-day season was also held on the SNWR located in Humboldt County from September 19 20, This hunt was a special application hunt limited to 75 reservations only. The daily limit for all seasons was two birds with a possession limit of four. The Nevada Department of Wildlife requested hunters to deposit one wing from each harvested bird into a wing barrel or any Department office to determine age and sex of birds as well as nest success. For the Sheldon National Wildlife Refuge Special Sage-grouse Hunt, 75 reservations were available and successful applicants were randomly drawn. Harvest and Effort During the 2015 sage-grouse season, 28% fewer hunters (n = 1,145) took to the field in pursuit of the species compared to the 2015 season; however, those that did were rewarded for their efforts with improved success and took an estimated 3,472 birds. This represented a 25% increase in harvest over the 2014 season, but was still 25% below the 10-year average of 4,655 birds. Sage-grouse hunters spent 2,775 days in the field in 2015 representing a 19% decline from 2014 and a 54% decline from the 10-year average of 5,593 days. Figure 1 displays sage-grouse harvest and the number of hunters over the last 30-year period. Hunters averaged 3.0 birds during the season and 1.25 birds per day. In comparison, hunters averaged 1.75 birds per hunter and 0.8 birds per day in The 2015 figures were 73% and 54% greater than the 2014 values respectively. The 2015 results were also a substantial improvement over the 10-year average of 1.9 bird per hunter and 0.8 birds per day. For further perspective, the 2015 harvest was 47% less than the 30-year average of 6,519 birds. Additionally, the decline in hunter numbers has been fairly substantial over the last 30-year period with peaks in 1991 (n = 5,608) and 2009 (n = 4,461). The 30-year average for hunter numbers is 3,217 and the 2015 number was 64% below that figure. Sage-grouse hunter numbers have declined each decade since the 1970s; however, much the same could be said for other upland game species as well. 15

24 16,000 Nevada Sage-grouse Harvest Information 14,000 Estimated Harvest and # of hunters 12,000 10,000 8,000 6,000 4,000 2,000 0 Estimated # of Hunters Estimated Sage-grouse Harvest Figure 1. Estimated sage-grouse harvest and hunter numbers from 1986 through Population Status Personnel with the Nevada Department of Wildlife, federal agency personnel such as the Bureau of Land Management, U.S. Forest Service, and U.S. Geological Survey as well as volunteers conducted 1,731 lek counts at 976 leks in Nevada in Analysis of a subset of leks known as trend leks (n = 195), which are counted multiple times each year, indicated a 19.3% increase in male lek attendance over 2015 (Figure 2). The 2016 number of males per lek averaged 28.2 which also represented a 6.5% increase over the long-term average ( ) of 26.5 males per trend lek and was 15.2% greater than the average male attendance for the last 20 years. The estimated production for sage-grouse was 1.52 chicks per hen in 2015, which was consistent with the 2014 production value of The last three years of production has contributed to a stable to slightly increasing sage-grouse population (Figure 3). Preliminary analysis of lek count data and production indicates that production values that exceed 1.5 chicks per adult hen leads to an increasing population growth rate. During the 20-year period from , sage-grouse populations peaked in 2005 and 2006 then declined fairly substantially through 2013 to a period minimum of 18.7 male per trend lek. Since 2013, sage-grouse have experienced a rebound in population trend with the 2016 male attendance rate for trend leks being the highest since

25 Nevada Sage-grouse Trend Lek Attendance ( ) Leks Counted Average Attendance Leks Counted Males per Lek 20-year Average Figure 2. Average trend lek attendance rates and the number of trend leks counted from 1997 through Annual Sage-grouse Production and Nest Success 70% % % 30% 1.00 Chicks per Hen Nest Success 50% 20% % 0% Year Nest Success Production Figure 3. Sage-grouse production and nest success as determined from wing analysis from 2006 through
26 With the observed increase in sage-grouse population trends exhibited in 2016, the upcoming hunting season is expected to improve even though hunter success was considered very good during 2015 with 3.0 birds taken during the season and 1.25 birds per day. Bird numbers should be the highest since the seasons. Production estimated from various research projects occurring throughout the state have provided mixed results with respect to nest success and brood success so far in Some areas have reported very poor nest success such as northern Washoe County and the Santa Rosa-Owyhee study area while others such as the Desatoya Range in central Nevada and the White Pine Range in eastern Nevada have reported good nest and brood success. Still others, such as the Tuscarora study area, have reported average nest success, but below average brood success. Regardless of the mixed results, this should be a very good year to pursue sage-grouse in late September. 18

27 FOREST GROUSE Season Structure and Limits Forest grouse seasons for dusky, sooty, and ruffed grouse extended from September 1 through December 31, The daily and possession limits were 3 and 6 respectively and the limits were for a single species or in the aggregate (any combination of species, but not to exceed the specified daily and possession limits). Blue Grouse (Dusky and Sooty Grouse) Harvest and Effort The harvest of both dusky and sooty grouse declined to 708 birds during the 2015 season along with the number of hunters for the species (Figure 4). The harvest represented a 54% drop-off from the prior season and the number of hunters (n = 562) was down about 41%. Compared to 10-year averages, harvest was 60% lower and hunter numbers were reduced by 58%. These results were somewhat surprising considering a small peak in harvest (1,542), hunter numbers (946), and days spent in the field in 2014 (1,374). Numbers of birds per hunter dropped from 1.63 in 2014 to 1.26 in 2015; however, the 2015 figure was just 3.4% below the 10-year average. Similarly, the number of birds per hunter day was only 3% below the 10-year average at 0.52 birds per day. In 2014, blue grouse hunters averaged 0.59 birds per day. 3,500 Blue Grouse (Dusky and Sooty) Harvest Information 3,000 Harvest and Hunter Days 2,500 2,000 1,500 1, Estimated # of Hunters Year Blue Grouse Harvest Figure 4. Estimated blue grouse harvest and number of hunters from Population Status It is difficult to truly determine the overall population status of either dusky or sooty grouse as no standardized surveys are conducted for either species. An issue of concern is the loss of coniferous species (e.g., limber pine and sub-alpine fir) within the range of dusky grouse in central and eastern Nevada. Several mountain ranges within this region are experiencing die-offs of coniferous species that are an essential forage item during the winter months. These 19

28 die offs may be related to drought-induced stress and susceptibility to various insect infestations. The ultimate effects to dusky grouse are not known at this time. Improved winter snow accumulations throughout much of northern Nevada from the last couple of years, plus above average precipitation, should translate into a better production year for most upland game species. As of May 1, 2016 snowpack ranged from 66% of average in the Owyhee Basin to 127% in Eastern Nevada where the majority of dusky grouse populations are located. From October 1, 2015 through April 30, 2016, water year precipitation ranged from % of average in the region, with Eastern Nevada receiving 161% of average precipitation during the month of April. Again, this should translate into a good production year for dusky grouse in this portion of the state. Populations of sooty grouse in the Carson Range and White Mountains in Esmeralda County should see an increase in the juvenile segment of the population as well. Likewise, stronghold population of dusky grouse within central Nevada mountain ranges such as the Toiyabe, Schell Creek, and Ruby Mountains should experience an increase from last year and provide good hunting opportunities. Ruffed Grouse Harvest and Effort During the 2015 forest grouse season, an estimated 461 ruffed grouse were harvested by 244 hunters (Figure 5). The harvest and number of hunters both declined from 2014 numbers and were 30% and 13.5% lower respectively. Compared to long-term averages though, harvest was up almost 47% while the number of hunters virtually matched the 10-year average of 246 hunters. Ruffed grouse hunters spent 586 days pursuing the species in 2015 which was down almost 27% from the prior year and about 12% less than the 10-year average. The number of birds taken per hunter during the season (1.89) represented a 19% decrease from the 2014 season; however, birds per hunter day was lower by only 4.4% at The number of birds taken by each hunter in 2015 represented a 72.4% increase over the 10-year average of 0.5 birds per hunter. 800 Nevada Ruffed Grouse Harvest ( ) # of Hunters Estimated Harvest Figure 5. Annual ruffed grouse harvest and hunter numbers from
29 Population Status The Nevada Department of Wildlife has continued ruffed grouse trap and transplant efforts to achieve some of the ruffed grouse population objectives identified in the 2008 Upland Game Species Management Plan. The first introduction of ruffed grouse into Nevada occurred in 1963 with the delivery of 13 ruffed grouse from Mink Creek near Pocatello, Idaho to Soldier Creek in the Ruby Mountains. Since then, 14 translocations involving 348 birds have taken place in Nevada and ruffed grouse are now well established in the Ruby, East Humboldt, Bull Run, Independence, Tuscarora, and Merritt Mountains of Elko County, the Santa Rosa Range of Humboldt County, and the northern portion of the Toiyabe Range of Lander County. More recent attempts at establishing populations of ruffed grouse have taken place in the Pine Forest Range of Humboldt County and the southern portion of the Toiyabe Range in Nye County. Additional monitoring will be necessary to determine the success of these translocations. An additional trap and transplant effort is scheduled for 2016 to augment the Pine Forest population in Humboldt County. Improved winter snow accumulations throughout much of northern Nevada during the last couple of years along with above average precipitation should translate into good production for most upland game species. As of May 1, 2016 snowpack ranged from 66% of average in the Owyhee Basin to 127% in Eastern Nevada where the majority of ruffed grouse populations are located. From October 1, 2015 through April 30, 2016, water year precipitation ranged from % of average in the region with Eastern Nevada receiving 161% of average precipitation during the month of April. Again, this should result in good production for ruffed grouse in this portion of the state. 21

 was held from September 26 27, 2015. Daily and possession limits for the youth hunt were 6 and 12 respectively.")
30 CHUKAR PARTRIDGE Season Structure and Limits The season for chukar partridge extend from October 10, 2015 to February 7, 2016 for a total season length of 121 days. The season was seven days longer than the prior season. Daily and possession limits remained at 6 and 18 respectively. Limits applied to a single species or in the aggregate with Gray (Hungarian) Partridge. In addition to the general season, a two day youth season (15 years of age or younger) was held from September 26 27, Daily and possession limits for the youth hunt were 6 and 12 respectively. Harvest and Effort The statewide estimate for chukar partridge harvest was 58,988 birds for the season (Figure 6), which represented a 19% decrease from the previous season and a 24% decline from the 10-year average ( ) of 77,501 birds. This was likely due to the decreased participation in chukar hunting as the number of hunters (n = 8,721) declined by 43% from the year prior and was lower by 33% from the 10-year average of 13,031 hunters. Likewise, the number of days spent in the field decreased from 66,065 in to 41,723 representing a 37% decrease and a 26% decrease from the 10-year average of 56,506 days. However, those who did spend the time to hunt chukars in , were rewarded with the greatest numbers of birds per hunter (6.8) and birds per day (1.4) since Numbers of birds per hunter was up 42% and birds per day was up 28% from the prior season s results. Harvest 140, , ,000 80,000 60,000 40,000 20,000 0 Nevada Chukar Harvest Information ( ) 18,000 16,000 14,000 12,000 10,000 8,000 6,000 4,000 2,000 0 Hunters Year Estimated # of Hunters Estimated Chukar Harvest Figure 6. Estimated chukar harvest and hunter numbers from After conducting the 2015 aerial chukar density surveys, which showed a 6% decline in the observed density of birds statewide from 2014 (Figure 7), the annual Nevada Chukar Forecast suggested that hunters should expect to find similar opportunities to those of the season; however, due to good production noted in many areas, hunters should find better 22

31 success early in the season and, if winter ever returns to Nevada and there is measurable snow accumulation, expect good hunting later in the season as well. This projection apparently did not stimulate hunter participation as the number of hunters dropped by 43% and was the fewest estimated number of chukar hunters since 2001 when just 7,663 hunters took to the field. Harvest 120, ,000 80,000 60,000 40,000 20,000 0 Nevada Chukar Harvest and Count Index Chukar Harvest Avg. Harvest Index Count Avg Index (or Density) of Birds Figure 7. Chukar density estimates from aerial surveys conducted within established plots from (with the exception of when no surveys were conducted). Population Status Northern Nevada experienced an average to above average year for both snowpack and precipitation during October 1, 2015 to date. Additionally, warm temperatures in February brought on a flush of forb growth and annual grass green up that likely improved the body condition of chukar partridge going into the breeding and nesting season. According to the NRCS May 2016 Nevada Water Supply Outlook Report, streamflow forecasts across northern Nevada ranged from % for the May through July period. This is an improvement over the last several years and will provide relief from almost four years of extremely dry conditions. This coupled with above average precipitation in areas such as the Upper Humboldt Basin measuring in at 141% of average, should translate into good production for the species in this region of the state. Habitat conditions have not recovered from the severity of the drought and it is suspected that this will take at least a couple of good water years. Annual aerial chukar density surveys were conducted in mid-august 2016 with funding provided by the Nevada Chukar Foundation. Results were mixed, but overall, observed densities were up 5% from the previous year and were 28% above the long-term average. Notable increases were recorded in the Argenta (+125%), Lava Beds (+88%), Sheep Creek (+86%), and Double H (+64%) transects. In addition to these surveys, brood surveys conducted in other portions of Pershing County, indicated decent production and numbers. Brood surveys conducted in Churchill County indicated good to excellent recruitment this year and should provide improved chukar hunting during the season. 23

32 CALIFORNIA QUAIL Season Structure and Limits California quail season extended from October 10, 2015 to February 7, 2016 and encompassed 121 days. The season was seven days longer than the season due to shifts in the calendar year. The daily and possession limit for California quail was 10 and 20 respectively. A youth California quail season was also held prior to the regular season for two days (September 26 27, 2015) for hunters 15 years of age and younger. The daily and possession limits were the same as those for the general season. Harvest and Effort Harvest of California quail decreased from 12,463 in 2014 to 8,108 during the season, representing a 35% reduction. The harvest was also 67% below the 10-year ( ) average of 24,571 California quail and was the lowest recorded harvest ever (Figure 8). The reduction in harvest does not appear to be a reflection of the actual California quail population as the number of hunters and numbers of hunter days also declined substantially from the prior season. The number of hunters declined by almost 46% from the previous season and was 62% below the 10-year average. Similarly, the number of hunter days (4,697) was 53% lower than the previous season and 65% lower than the 10-year average of 13,480 days. As with chukar partridge, those who did elect to hunt California quail were rewarded with elevated numbers of birds per hunter and birds per hunter day than the season. Hunters averaged 6.9 birds during the season and 1.7 birds per day representing increases of 20% and 39% respectively from the prior season. However, these figures were less than the 10-year average of 7.9 birds per hunter and 1.8 birds per day. Nevada California Quail Harvest Information ( ) Harvest 45,000 40,000 35,000 30,000 25,000 20,000 15,000 10,000 5, ,000 5,000 4,000 3,000 2,000 1,000 0 Hunters Year Estimated # of Hunters California Quail Harvest Figure 8. Estimated harvest of California quail and hunter numbers for the period from

33 Population Status Like other upland game populations, California quail have had to endure four years of drought conditions. The December 1, 2015 U.S. Drought Monitor map indicated that much of the range of California quail was either in severe, extreme, or exceptional drought (Figure 9). Drought conditions have subsided and much of the California quail range in Nevada has now been classified as being in extreme drought according to the May 3, 2016 U.S. Drought Monitor map. The May 1, 2016 Water Supply Outlook report generated by the NRCS shows watershed basins including the Northern Great Basin, Truckee, Carson, and Walker basins being between 82-98% of average snowpack while actual precipitation received within those basins ranged from %. With the Northern Great Basin (encompassing a substantial portion of California quail range) receiving 112% of average annual precipitation during , the outlook for California quail and many other upland game species within this region is positive. Figure 9. Drought conditions throughout the United States as of December 1, The increase in number of birds harvested per day to 1.73 birds per day from 1.24 in , only slightly below the 10-year average of 1.8, indicates that California quail populations may have experienced a slight recovery in With fewer hunters taking to the field in pursuit of California quail during the season along with improved precipitation and habitat conditions, the season should provide hunters with more frequent encounters with coveys and larger covey sizes. 25

34 GAMBEL S QUAIL Season Structure and Limits Gambel s quail season extended from October 10, 2015 to February 7, 2016 and encompassed 121 days. The season was seven days longer than the season due to shifts in the calendar year. The daily and possession limit for California quail was 10 and 20 respectively. A youth California quail season was also held prior to the regular season for two days (September 26 27, 2015) for hunters 15 years of age and younger. The daily and possession limits were the same as those for the general season. Harvest and Effort The estimated Gambel s quail harvest for the season was 4,422 birds. This was the fewest number of Gambel s quail harvested since harvest estimates for the species were initiated in 1976 (Figure 10). Only 2002, when 4,771 birds were taken, can compare. The long-term average harvest is 26,120 quail and the last ten years average harvest is 15,720. The harvest was 34% less than the prior season s take and 72% below the 10-year average. Hunter numbers have continued to decline as well with just 1,057 hunters pursuing the species during the season. This represented a 39% decline in hunter numbers from the prior season and a 56% decline from the 10-year ( ) average. Gambel s quail hunters spent an estimated 4,051 days pursuing the species, which was 47% fewer days than the prior season and 61% less than the 10-year average of 10,313 days. The number of birds per hunter average 4.2 and birds per hunter day average 1.1, which were both increases from the season. During the last ten years, the number of birds harvested per day has fluctuated from a minimum of 0.84 birds in 2007 to a high of 3.04 birds in This metric is likely the most accurate reflection of Gambel s quail population performance. Harvest 50,000 45,000 40,000 35,000 30,000 25,000 20,000 15,000 10,000 5,000 0 Nevada Gambel's Quail Harvest Information ( ) 4,500 4,000 3,500 3,000 2,500 2,000 1,500 1, Hunters Estimated # of Hunters Gambel's Quail Harvest Figure 10. Estimated Gambel s quail harvest and number of hunters from
. 3.")

35 Population Status Without stratified sampling and survey data collected over time, it is difficult to determine the status and trends of Gambel s quail populations. As mentioned earlier, the numbers of birds harvested per day is likely the best metric to determine population trends. From , this metric is exhibiting a declining trend (Figure 11) Gambel's Quail Harvest Information Birds per Day Year Birds per Hunter Day Average Linear (Birds per Hunter Day) Figure 11. The estimated average number of birds harvested each day Gambel s quail hunters are in the field. Unfortunately, these data portray a fairly bleak situation for Nevada Gambel s quail. Multiple years of drought conditions, which in some cases have been extreme, resulted in diminished populations of Gambel s quail which makes a dramatic population increase due to a single year of improved climatic conditions unlikely. Yet data from 2016 is encouraging. Summarized rain gauge data obtained from the Clark County Regional Flood Control District shows decent precipitation from many southern Nevada locales in January (0.80 inches) and good amounts of rainfall during April (1.63 inches). March only received an average of 0.06 inches of precipitation, and March is often thought of as a key month for Gambel s quail production. April may have received enough precipitation to compensate for the poor March conditions and generated enough green plant material to foster adequate production for the upcoming season. Gambel s quail base populations are low enough that it may take several years of above average production to regain the levels observed during , but 2016 is at least somewhat of a reversal from the last few years of poor rainfall during key spring months. 27

36 WILD TURKEY Season Structure The 2016 spring turkey season lasted 37 days, extending from March 26 May 1, 2016 for most open units throughout the state. There were some areas such as the Mason Valley Wildlife Management Area and Moapa Valley of Clark County that had three separate 9-day seasons each within that same 37 day period. Hunters were limited to one bearded wild turkey by tag only during the spring season. Hunting hours were limited to one half hour before sunrise to 4:00 p.m. daily. Harvest and Effort Turkey hunters enjoyed a 66% success rate in 2016 while harvesting 75 bearded turkeys. In comparison, the 2015 success rate was 62% and hunters harvested 63 turkeys. One hundred thirty-eight tags were issued and 119 return card questionnaires were submitted for a return rate of 86%. Of those tagholders, only 6 people (5%) indicated that they did not hunt. Sixty-six toms (88%) and 9 jakes (12%) were taken during the spring season and 5 hunters indicated that they wounded and lost a bird. Ten hunters also indicated that they had an opportunity to take a bearded turkey during the hunt, but elected not to, likely because the bird was an immature male (jake). Of the 75 birds taken, 70 were killed with a shotgun and 5 with archery equipment. Hunters expended 320 days in the field during the 2016 spring hunt and also spent 196 days scouting. Each hunter averaged 2.8 days in the field compared to 3.5 days during the 2015 spring season. Average beard length for all turkeys harvested was 6.6 inches. Complete statistics on the 2016 spring turkey hunt can be found in Appendix I, page A-3. Harvest Spring Wild Turkey Harvest Information ( ) Tags Issued Tags Issued Year Spring Harvest Figure 12. Harvest of wild turkey and the number of tags issued for spring bearded turkey hunts from 2001 through
37 Population Status No formal survey data are collected on turkeys to determine population size, trends, or productivity (e.g. brood counts), so we rely on harvest data to determine the status of the population. Considering that the number of tags issued increased by 20, the success rate (66%) remained well above the long-term average of 44%, and the average number of days spent hunting decreased from 3.5 to 2.8, we believe that turkey populations throughout the state are faring better and the outlook is positive. The trend in harvest has been increasing since 2013 (Figure 12) while opportunity has remained fairly stable. The highest success rate during the 2016 spring hunt was reported from the Lyon County (excluding the Mason Valley Wildlife Management Area) indicating that the Mason Valley population is likely doing well. The lowest success rate (52%) was reported in Paradise Valley; this is still above the long-term statewide average of 44%. Due to improved precipitation throughout much of the state during the winter of and generally wet conditions in April 2016, survival of adults and production of chicks should be improved and the forecast for the spring 2017 is pointing to an even better season than the 2016 season. 29

38 RABBIT Season Structure The season for cottontail, pygmy, and white-tailed jackrabbits extended from October 10, 2015 to February 28, 2016; a total of 143 days. The season was open statewide with a daily limit of 10 and possession limit of 20 rabbits. Limits applied to each species individually or in the aggregate with other rabbit species; however, only 2 pygmy rabbit per day and 4 in possession were allowed. Persons who harvested pygmy rabbits were requested to report their harvest to the Nevada Department of Wildlife. In addition, a two-day youth season for rabbits was held on September 26 27, 2015 for hunters aged 15 years or younger. The same daily and possession limits applied for youth. Harvest and Effort An estimated 5,451 rabbits were taken by 1,049 hunters during the season. These figures represented declines of 14% and 33% from the previous season (see Figure 13). Harvest was substantially lower (-60%) than the 10-year average of 13,763 rabbits. The number of hunters was down almost 47% from the 10-year average. Rabbit hunters spent 5,369 days in the field during the season, which was down 32% from the previous season and was a similar decline to hunter numbers. The number of hunter days was down 48% from the 10-year average, which is also comparable to hunter numbers in relation to the 10-year average. As with most other upland game species, those who did pursue rabbits were rewarded with an increased number of rabbits per hunter (5.2) and increased number of rabbits per day (1.02). These metrics were 28% and 26% greater than the prior season s numbers respectively. However, the average number of rabbits taken per hunter was 2.2 less than the 10-year average and 0.4 rabbits per day less. Harvest 50,000 45,000 40,000 35,000 30,000 25,000 20,000 15,000 10,000 5,000 0 Nevada Rabbit Harvest Information ( ) 7,000 6,000 5,000 4,000 3,000 2,000 1,000 0 Hunter Numbers Year # of Hunters Rabbit Harvest Figure 13. Estimated rabbit harvest and number of hunters from
39 The estimated white-tailed jackrabbit harvest for the season was 226 rabbits, which was down 47% from the prior season s harvest. Just 95 hunters pursued the species during the season, which was a 58% decrease from the number of hunters during the season (227). Each hunter averaged 2.4 rabbits during the season and 0.7 rabbits per day hunted. Both values represented increases from the previous season, which were 1.9 white-tailed jackrabbits for the season and 0.3 rabbits per day. This is consistent with the effort reward for most other upland game species as well. Pygmy rabbit harvest was estimated at 149 for the season with just 41 hunters participating. Those hunters spent 195 days in the field. The harvest was similar to the previous season s number of 155 pygmy rabbits. There were almost 41% fewer hunters than the prior season (69). Each hunter took an estimated 3.7 pygmy rabbits during the season and average 0.8 rabbits per day. Like white-tailed jackrabbits, both values represented increases. This information should be tempered by the relatively small sample size of individuals that hunt the species. Population Status No established, repeatable surveys are conducted for any of the rabbit species so it is difficult to know, with any level of certainty, their distribution and abundance. The number of rabbits taken per hunter day increased 26% over the prior season and represented the greatest value since 2009, when the same number of rabbits were taken per day. This may be indicative of a slight population increase over recent years. Like other upland game species, the improved snowpack and precipitation receipts received throughout the state should improve habitat conditions for rabbit species and they should respond with greater reproduction potential. Concern remains over species such as white-tailed jackrabbit and pygmy rabbit in terms of distribution and abundance compared to historic levels. Hunter harvest is very minimal for both species, and recreational harvest is not considered a threat to their population numbers. Rather, loss or alteration of habitat, particularly for pygmy rabbits where wildfire has reduced overall sagebrush land cover, and subsequently degraded existing habitat (cheatgrass and other invasive species incursion) are primary factors influencing population size and distribution. 31
40 HIMALAYAN SNOWCOCK Report by: Caleb McAdoo, Area 10 Game Division Biologist Season Structure and Limits The 2015 Himalayan Snowcock (hereafter, snowcock) season extended from September 1 - November 30. Hunters were limited to two birds per day and in possession. Harvest and Effort For the 2015 snowcock hunting season, 130 questionnaires were received from 145 known permits issued (90% return rate). Of the 130 questionnaires received, 42 indicated that they did not hunt leaving 88 hunters who reported spending time in the field. Sixteen birds were reported harvested by 12 separate hunters with two additional birds reported as wounding loss. Of the birds harvested, all were taken in Unit 102.Hunters reported seeing 928 snowcock during 93 hunter-days. The number of birds observed was double last year s observations in half the reported hunter days. Past reported snowcock harvest has ranged between 2 and 23 birds annually and has averaged about 8 birds per year since The catch per unit of effort was substantially higher for the 2015 season as compared to Population Status The habits and remote habitat preference of these birds make standard population surveys extremely difficult. Random sightings and observations noted during other wildlife management activities are recorded. Snowcock density and distribution surveys were previously conducted in conjunction with helicopter mountain goat/bighorn sheep surveys. Beginning in 2005, bighorn sheep surveys and Rocky Mountain goat surveys were rescheduled to late winter to better assess lamb and kid recruitment. Generally speaking, because snowcock data were collected incidental to helicopter sheep and goat surveys, summer aerial surveys are no longer being conducted for snowcock. Above average snowpack and precipitation was received in the Ruby Mountains with 119% of average snowpack and 128% of average precipitation being reported as of May 1, 2016 in the Nevada Water Supply Outlook Report provided by NRCS. The resultant habitat conditions should be conducive to ample forb growth, improving pre-laying condition of nesting hens, and good to excellent vegetation conditions once chicks are hatched. Although snowcock had to endure some harsh conditions during the spring with a few winter-like storms, brood survival should be good to excellent this year, providing sportsmen and wildlife viewers with increased opportunities at detection. The current snowcock population appears to be locally abundant in many portions of the range, primarily Unit 102; however, Units 101 and 103 appear to be at very low levels based on limited observations from hunters, no harvest, and the limited numbers of birds observed during incidental helicopter surveys and ground work. More intensive survey work would be needed to adequately assess snowcock population condition and trend. Fall Prediction Habitat preference and the snowcocks wary nature, as well as the current low-population levels in Units 101 and 103 are expected to keep harvest levels low in these areas. Harvest levels for the 2016 season could likely be elevated in Unit 102 based on bird abundance and production. Birds observed per hunter-day were about 10.0 in 2015, as compared to 2.5 in 2014, 10 in 2013 and 1.0 in Bird availability for the 2016 season is expected to be well above average. 32
41 STATEWIDE SUMMARIES FOR MIGRATORY GAME BIRDS Report by: Russell Woolstenhulme, Migratory Bird Staff Specialist WATERFOWL Season Structure and Limits Using the guidelines of Adaptive Harvest Management (AHM) and the frameworks established by the United States Fish and Wildlife Service (FWS), the duck hunting season allowed for a liberal season length and general bag limit, with specific bag limit restrictions for duck species that continue to remain below continental objectives. The Nevada Board of Wildlife Commissioners (Commission) adopted the full number of days (107) for Nevada allowed under the framework. For the duck hunting season, Nevada continued with a three hunt zone configuration. Nevada opted for a split season in all three zones. Each zone closed for a two-day period on October 26 and 27, These closures were statewide and excluded from the following season dates. Nevada s duck hunting season began in the Northeast Zone on September 26 and extended until January 10, The duck hunting season for the remaining two zones (Northwest and South Zones) began October 10 and extended to January 24, The two day closures accommodated days set aside for youth waterfowl hunting, which was two days in each of the three zones (Northeast Zone: September 12 and 13, Northwest Zone: September 26 and February 6, and South Zone: February 6 and 7). Additionally, the South Zone included a special youth hunt day on Overton Wildlife Management Area on October 17. The Commission adopted a later opening date (October 31, 2015) for the Moapa Valley Portion of the South Zone. Species restrictions continue to be in place with hunters allowed to take no more than two hen mallards, two redheads, two pintail and two canvasback of either sex. Scaup restrictions were for the season were set for a three bird daily bag limit and an 86 day season (Northeast Zone: September 26 to October 25, 2015 and October 28 to December 22, 2015, Northwest and all of South Zone: October 31, 2015 through Jan 24, 2016). Harvest and Effort Data obtained through the NDOW s Post-season Questionnaire is reported in Table 1 and in the Appendix of this report. In past reports, FWS harvest information has been reported as a comparison to NDOW harvest numbers. Changes that occurred to the National Flyway System and subsequently, when the FWS generates their data have changed. Because of that change, FWS harvest results will be delayed one year. 33
42 Table 1. Comparisons between HIP and Nevada Post-season Questionnaire estimates. Year Estimated Duck Hunters Estimated Total Duck Harvest HIP (1) NV Questionnaire % Diff. HIP NV Questionnaire % Diff ,600 2,275-13% 29,900 30,396 2% ,500 3,952 13% 41,000 29,091-29% ,600 4,524 26% 48,200 58,592 22% ,200 2,565-20% 63,800 45,746-28% ,900 3,247-9% 51,000 50,892-2% ,600 3,068-15% 38,300 43,700 14% ,700 2,448-9% 30,000 23,810-21% ,337 30,800 (1) Expressed as Active Adult Hunters within the HIP survey. DUCKS AND MERGANSERS The general limit was seven ducks per day with twenty-one in possession with the species restrictions previously described. Table 2 describes harvest and effort statistics compiled through Nevada s post-season questionnaire. Table 2. Statewide duck & merganser harvest from post-season questionnaire. STATEWIDE TOTALS: Percent Change Yr Avg. Prev. yr. vs. Avg. No. of Ducks & Mergs. 30,800 23,810 44, % -30.8% No. of Hunters* 3,001 3,059 3, % -36.0% No. of Days 17,480 16,491 22, % -21.0% Birds / Hunter % -0.2% Birds/Hunter Day % -8.9% Individual Hunters* 2,337 2, % -- * see explanation below In the table above, the number of hunters (second row) represents the sum of all hunters hunting in all counties. The totals at the bottom of the columns for 2014 & 2015 represents the estimated total of all individual hunters, based upon the reported sales of electronic duck stamp privileges and a proportion of all paper duck stamps sold. Figure 1 below describes the trends for duck harvest and hunter numbers in Nevada based upon NDOW s post-season questionnaire data. Peaks are principally attributed to short term precipitation-driven habitat reprieves but again Nevada s habitat is not linked to continental duck numbers. 34
43 Figure 1. Nevada Duck Hunting Statistics Source: Nevada Post-season Questionnaire Duck Harvest 200, , , , , ,000 80,000 60,000 40,000 20, ,000 18,000 16,000 14,000 12,000 10,000 8,000 6,000 4,000 2,000 0 Hunters Harvest Hunters Linear (Hunters) 35
44 GEESE For the goose hunting season, Nevada used a three hunt zone configuration. During the goose hunting season the Northeast zone for dark geese (Canada geese and Brant and White-fronted Geese) began on September 26, 2015 and extended until January 10, The dark goose seasons for both the Northwest and South zones began on October 10, 2015 and extended to January 24, A two day closure was instituted on October 26 and 27, These closures accommodated days set aside for youth waterfowl hunting, which was two days in each of the three zones. The Commission adopted a later opening date (October 31, 2015) for the Moapa Valley portion of Clark County within the South zone. The white goose (snow and Ross goose) season opened in conjunction with the later dates for dark geese to accommodate the late white goose hunt season. Season dates for the Northeast and Northwest zones ran from October 31, 2015 until Jan 24, The Northeast and Northwest Zones opened for a late white goose season from February 20, 2016 until March 9, Snow and Ross goose seasons for the South Zone began on October 10, 2015 and ran until January 24, 2016 with a two day closure on October 26 and 27, Limits for the Canada geese and brant were four daily with twelve in possession. White-fronted geese limits were ten daily with 30 in possession. Limits for white geese (Snow and Ross geese) singly or in the aggregate were 20 daily with 60 in possession. Table 3. Statewide dark and white goose harvest from Post-season Questionnaire. STATEWIDE TOTALS: Percent Change Yr. Avg. Prev. Yr. vs. Avg. Dark Geese Harvest 3,980 2,185 4, % -12.4% No. of Hunters , % -40.7% Light Geese Harvest % -79.7% No. of Hunters % -77.0% TOTAL GEESE: 4,124 3,029 5, % -21.5% Interest in goose hunting increased as hunters sought out alternatives to decreased marsh hunting during the State s prolonged drought. Most of Nevada s Canada geese harvest occurs in western Nevada within those counties with large amounts of cultivated fields or pasture support the greatest abundance of geese. For the second year in a row, Douglas County surpassed Churchill County as the leader in dark goose harvest. Lyon County remained high in kill per hunter and kill per hunter day statistics, While Churchill County nearly dropped from the chart. Within the Pacific Flyway, large-bodied Canada geese (Branta canadensis moffiti) have greatly expanded. Migrating geese that originate from both the relatively sedentary Pacific Population and the more # Geese 12,000 10,000 8,000 6,000 4,000 2,000 0 Figure 2. Canada Goose Harvest in Nevada Goose Harvest No. of Hunters 4,000 3,500 3,000 2,500 2,000 1,500 1, # Hunters 36
45 widespread and migratory Rocky Mountain Population comprise the majority of the hunter s bag in Nevada. There are locally produced geese hatching within Nevada s wetlands and translocated nuisance adult geese and goslings that contribute to the harvest totals but these latter sources pale compared to numerical tide of migratory geese that bred and hatched elsewhere. TUNDRA SWAN The Nevada tundra swan season commenced on October 10, 2015 and concluded on January 3, Permits were available during an initial draw period, which had an application deadline of September 11, A total of 42 applications for the 650 permits (6%) were posted for the initial draw. Remaining permits were available online, over the counter or through the mail after October 9 through the last Friday of the hunting season. An additional 63 permits were sold after the initial draw bringing the total permit sales to 105. This total included 4 second permits, thus there were 101 individual permitees last year. Total sales for the season were lower (55%) than the previous year and the second lowest on record. Continuing a flyway commitment to detect trumpeter swan harvest, NDOW required all successful hunters to have their swan and permit validated within five days of the harvest date. Agency personnel inspected swans at specific NDOW offices where they could examine the birds bills and feather coloration. This scrutiny is necessary to detect occurrence of trumpeter swans. In this manner, take can be documented and its impact to the latter species can be assessed. Table 4. Past ten years of Nevada swan harvest. Year Tags / Permits Percent Reported Expanded Purchased Participating Harvest Hunter Days % 147 2, % 200 1, % 124 1, % 56 1, % 118 1, % 145 2, % 203 2, % 26 1, % % Avg % 105 1,568 For the season, juvenile swans made up 50% of the total swan harvest (n=4), a figure that is above the long-term average of 34%. Because of the extended drought in Nevada, and most marshes having little or no water, swan migrations were mostly across Nevada and with few birds stopping over. Hunt conditions were very limited. Fifty-seven percent of permitees hunted last year. No swans were reported taken at Stillwater NWR, in contrast to the long-term average of 61% of the harvest being from that location. No trumpeter swans were taken in the season. Population Status Major changes to how the U.S. Fish and Wildlife Service and the four administrative Flyways are conducting waterfowl management occurred during These changes resulted in the future management of waterfowl to be based on the data produced from the previous year. The 37

46 data reported for this report is the same as that used for the 2014 year. The shift will be reflected in the Departments future reports. Each year the FWS conducts a continental assessment of the status of waterfowl 1. The FWS follows established survey protocols to evaluate bird abundance and habitat conditions within traditional survey areas in the central and northwest portions of North America, known as the Prairie Pothole Region and the Canadian Parkland Region, and in Northwest Canada and Alaska. Service statisticians then incorporate these data into annual or multi-year population models. Biologists estimated this spring s breeding duck population (BPOP) within the traditional survey area at 49.5 million birds (Figure 3). This total is similar compared to the 2013 estimate (49.2 Million) and is 43% higher than the long term average. This count represents the all-time high breeding duck count. Nevada Breeding pair population estimates for 2015 were 28,500 birds. This number is an increase (20%) from last year s estimate of 23,700 birds Figure 3. Total breeding duck estimates for the traditional survey area Millions U. S. Fish and Wildlife Service Waterfowl population status, U.S Dept. of the Interior, Washington, D.C. USA. 71pp. 38
47 For the traditional survey area, most species showed stable to increasing numbers compared to the previous year, and, most are still above the long term average (Table 5). Table 5. Five-year duck BPOP estimates (in thousands) and long-term average (LTA) for 10 species within the traditional survey area. % change Species LTA v.2014 v LTA Mallard % 51% Gadwall % 100% Pintail % -24% BW Teal % 73% GW Teal % 98% Wigeon % 17% Shoveler % 75% Scaup % -13% Redhead % 71% Canvasback % 30% Redheads again exceeded the million bird mark for the ninth consecutive year while canvasback numbers continue to be above the long-term average. Hunters will want to be in Nevada s marshes when waves of these migrating species pass through. NDOW biologists observed a total of 60,706 waterfowl in Nevada s portion of the Mid-winter Waterfowl Survey (MWS) last January (see appendix). This represents a decrease of 32% compared to the previous year s results. The observed total is 10% below the long-term average. The mid-winter survey is a coordinated effort to inventory the Pacific Flyway s migrating waterfowl. States conduct the survey simultaneously in early January to avoid double counts between proximal geographic areas. Dark and light geese seen during this survey were 17,439 (17,079 western Canada s, 0 lesser Canada s, 5 white-fronted geese, and 360 lesser snow geese). Total observed goose numbers were 7% lower than the previous year s number. Total geese counted on Nevada MWI surveys remains above the long-term average (15,579). The total number of swans encountered during survey efforts was 449 tundra s and 24 trumpeters. Trumpeter swan numbers observed were equivalent to long-term average. All trumpeter swans were observed on Ruby Lake NWR. During the 2015 field season, biologists captured and banded 720 ducks and 220 geese at several sites in the state. The recovery and report of these bands, mostly by hunters, will help estimate waterfowl abundance and distribution patterns. 39
48 MOURNING and WHITE-WINGED DOVE Harvest Nevada s traditional dove season comprised the 60 days, beginning on September 1, 2015 and running until October 30, The bag and possession limits were 15 and 45, respectively. Mourning and white-wing dove hunting was statewide. Similar to waterfowl data, changes to how the FWS and the four administrative Flyways are conducting dove management occurred during These changes resulted in dove management based on data produced from the previous year. The data reported for this report is the same as that used for the 2014 year. The shift will be reflected in the Departments future reports. The FWS conducts harvest surveys through its Harvest Information Program (HIP) survey. The same protocols used to estimate waterfowl harvest are applied to the dove findings collected through this survey. NDOW has been refining its questionnaire by attempting to poll a larger proportion of the hunting public. Data obtained through the NDOW s Post-season Questionnaire is reported in Table 1 and in the Appendix of this report. In past reports, FWS harvest information has been reported as a comparison to NDOW harvest numbers. Changes that occurred to the National Flyway System and subsequently, when the FWS generates their data have changed. Because of that change, FWS harvest results will be delayed one year. Table 6. Comparisons Between Estimated Dove Harvest Statistics for Nevada. Year Estd. Hunter Numbers Estimated Hunter Days Estimated Dove Harvest HIP (1) NV Q (2) % Diff HIP NV Q % Diff HIP NV Q % Diff ,800 3,214 15% 9,600 14,135 47% 38,500 48,629 26% ,900 4,215-14% 12,200 14,840 24% 45,000 51,785 15% ,600 4,184-16% 11,600 13,652-18% 41,500 45,954 11% ,500 4,681 4% 12,700 15,069 18% 60,300 54,405-10% ,500 3,169-9% 8,600 9,315 8% 31,900 33,738 6% ,600 3,822 6% 7,400 11,254 52% 26,900 34,176 27% ,800 2,439-36% 9,900 7,236-27% 31,900 20,510-36% ,700 2,149-20% 6,600 8,026 22% 24,800 21,072 15% ,749 5,154 15,566 (1) Expressed as Active Adult Hunters within the HIP survey. (2) Figures are individual hunters Hunter numbers estimated through Both the HIP process and NDOW s survey describes a decrease in hunter numbers. Dove harvest data obtained through the Nevada Post-season Harvest Questionnaire are as follows: Table 7. Nevada mourning dove harvest from Post-season Questionnaire. STATE TOTALS: Percent Change yr avg. Prev. yr. vs. avg. No. of Birds 15,566 21, % -62.6% No. of Hunters (3) 1,749 2, % -54.7% No. of Days 5,154 8, % -57.7% Birds / Hunter % -0.16% Birds/Hunter Day % -0.10% (3) Figures in the row represent cumulative hunters. 40
49 NDOW s revised questionnaire allows managers to analyze individual hunters the estimated number of license holders that hunted doves, as well as cumulative hunters the total of all the estimated number of persons that hunted in each of the state s 17 counties. It is obvious that some dove hunters actively hunt in more than one county. Harvest and participation levels are some of the lowest on record. Prolonged drought may be responsible for these declines. Table 8. Mourning dove harvest by region from Post-season Questionnaire. WESTERN EASTERN SOUTHERN AVG.* AVG AVG. No. of Birds 8,652 13,524 28,593 1, ,214 5,320 6,555 10,054 No. of Hunters 983 1,413 2, No. of Days ,958 8, ,096 1,771 2,620 3,289 Birds / Hunter Birds/Hunter Day *average is Figure 4. Nevada dove harvest & hunter data. Harvest 180, , , , ,000 80,000 60,000 40,000 20, ,000 12,000 10,000 8,000 6,000 Hunters 4,000 2,000 0 Dove Harvest Dove Hunters 41
50 White-winged Dove For the season, 382 individual questionnaire respondents indicated that they hunted migratory game birds other than waterfowl. Of these, only 10 indicated that they hunted white-winged dove in the states last hunting season. This data was sufficient to perform an extrapolation of harvest. Those harvest figures are depicted in appendix 2 of this report. NDOW cannot do any comparisons between years because the white-winged dove data has been very sporadic. Suffice it to say that this species is not abundant in Nevada and will continue to be somewhat of a novelty among southern Nevada hunters. Eurasian Collared Dove NDOW began asking questionnaire recipients to indicate whether or not they shot Eurasian Collared Doves (ECD) in The ECD is a bird that is expanding its distribution and abundance throughout the nation and in Nevada. Three hundred twenty-six individual questionnaire respondents indicated ECD harvest in all but three of Nevada s 17 counties. Those numbers are down significantly from 622 hunters harvesting in all counties in The data supports an estimated statewide harvest of 2,749 compared to 6,348 in 2014 and 5,168 in The species is unprotected and the questionnaire did not ask which month the birds were shot in. However, it is suspected that most were taken incidental to mourning dove hunting. Managers continue to attempt to gain an understanding of the bird s ecological role. Table 9. Nevada Eurasian collared dove harvest from Post-season Questionnaire. STATE TOTALS: Percent Change avg. Prev. yr. vs. avg. No. of Birds 5,168 6,348 2,749 4,975-57% -45% No. of Hunters (3) % -48% Birds / Hunter % 6% Population Status The FWS collectively with the three mourning dove management units (Flyway based) uses a predictive model to monitor and assess mourning dove populations across the continent. This predictive model utilizes data retrieved from both nation-wide banding efforts as well as parts collection surveys to assess mourning dove populations. The model uses collected data and abundance estimates over time to determine maximum population growth rate and carrying capacity, from which the critical thresholds for harvest are derived. During the 2015 field season, biologists captured and banded 401 dove at several sites in the state. The recovery and report of these bands, mostly by hunters, will help estimate dove abundance and distribution patterns. 42
51 BAND-TAILED PIGEON No survey and inventory activities were conducted for this job during this report period. AMERICAN CROW Harvest Crow hunting was open statewide with two hunt periods. The fall hunt was September 1 to November 17, 2015 and the spring hunt extended from March 1 to April 15, The limit was 10 daily and in possession and hunters were required to retrieve their crows and remove them from the field. NDOW modified its harvest questionnaire to attempt to document crow harvest beginning in 2003, with specific questions incorporated within the 2006 questionnaire. Initially, data was insufficient to merit any analysis but as the agency increased its distribution to a larger base of small game hunters, enough responses came in to affect an estimated harvest (see appendix 2). This year, 9 of 382 (2%) individual respondents that hunted migratory birds also reported harvesting crows. Table 10 depicts harvest data recorded since 2003, with a separation of figures after 2006 to differentiate between raw data collected for four years and estimates modeled for the past six years. The majority of crow harvest occurs in the fall hunt. Table 10. Reported American crow harvest in Nevada. CC CH DO HU LY MN PE ST WA EL EU LA WP CL ES LN NY Since the sample size is still relatively small, some variation in data can be quite significant between years. The harvest estimates are based upon data provided by information provided by a total of 9 questionnaire respondents. Only a greater distribution of questionnaires among theoretical small game hunters, a higher sampling rate, will achieve more statistically reliable estimates. Population Status Crows are not classified as migratory game birds under federal rule thus the FWS does not regulate the take of American Crows. Accordingly, there are no coordinated efforts within the flyways to determine their population status. NDOW does not conduct any population analysis other than an analysis of harvest data. The species is ubiquitous and since it is lightly hunted within a broad statewide distribution, managers feel that the harvest data is not indicative of crow population trends. The extent of the effects of West Nile Virus is not known, although it is recognized that corvids are particularly susceptible to the disease. 43
52 STATEWIDE SUMMARIES FOR FURBEARER ANIMALS Report by: Russell Woolstenhulme, Furbearer Staff Specialist Season Structure The trapping season for most of Nevada s furbearer species (beaver, muskrat, mink, otter, and kit and red fox) began October 1, The seasons extended through April 30, 2016 for beaver, muskrat and mink, March 31, 2016 for otter and February 29, 2016 for kit and red fox. The gray fox season began on November 1, 2015 and ran for 121 days ending February 29, The bobcat season for opened on December 1, 2015 and ran for 83 days ending February 21, Harvest and Prices Statewide bobcat harvest for the season was 1,197 (table 11). This was a 27% decrease from the season. The harvest also showed a decrease of 59% from the 10-year average of 2,932 as well as a 47% decrease from the long-term average of 2,266 bobcats per season. Statewide bobcat production was 94 kittens/100 adult females, an increase of 42% from the production rate of 66 kittens/100 adult females. Bobcat production for 2015 was 74% above the past 10-year average and 42% above the long-term average. During the season, average bobcat pelt prices decreased 28% to $ as compared to the season average of $ Table 1. Bobcat harvest by region. WESTERN EASTERN SOUTHERN Bobcat Harvest No. of Trappers Trap Days Trap Days/cat Bobcats/ Trapper YR AVG YR AVG YR AVG , , ,623 32, , ,653 58,179 99, , Overall, statewide harvest of furbearing animals during the season was 61% below long-term averages. Harvest of all furbearing species decreased 23% when compared to the season (Table 1). Coyote harvest during the season decreased 14% from the previous season. The number of licensed trappers during the season decreased from the previous year by 30% to 934 licenses sold. This number is above the 30-year average of 706 trappers. Fur prices for the past season decreased for nearly every species, which may explain some variation in participation and harvest. Please see furbearer tables in the appendix for complete harvest and fur prices. 44
53 Table 2. Selected Furbearer Harvest Synopsis by Region. Species: yr Average Percent Change Prev. Year 10 Year Avg. Statewide Coyote 2,807 3,591 2,926-22% -4% Gray Fox 614 1,045 1,314-41% -53% Kit Fox % -21% Beaver % -54% Muskrat ,147-17% -61% Mink % -63% Eastern Region Coyote 836 1, % -8% Gray Fox % -70% Kit Fox % 14% Beaver % -75% Muskrat % 96% Mink % -71% Western Region Coyote 1,373 1,681 1,275-18% 8% Gray Fox % -53% Kit Fox % -34% Beaver % -41% Muskrat ,035-27% -69% Mink % -57% Southern Region Coyote % -9% Gray Fox % -51% Kit Fox % -11% Beaver % -42% Muskrat % -83% Mink % 0% Located in the furbearer tables in the appendix of this volume in a table titled Summary of Statewide Fur Harvest which summarizes annual harvest from the season until this reporting ( ). Within this report there are two separate lines depicting harvest data from the season. The first of these two lines, if totaled, show a combined harvest estimate of all species at 9,275. This estimate comes from the initial extrapolation of the post-season questionnaire data with a 72.3% reporting rate. After the initial data reporting which was included in the Department s 2015 Small Game Status Report, additional furbearer harvest questionnaires were received by the Department. These questionnaires came in as a result of changes to NAC requiring compliance with questionnaire return. After application of this NAC, additional responses to the questionnaire brought the response rate to 91.6%. With this additional information the data was reanalyzed and the orange line within the summary table was calculated. This recalculation indicates a 9% decrease in harvest from the original data. This is due primarily because a high percent of late responders did not use their license (no harvest). Questionnaire non-respondents are disproportionately likely to be unsuccessful or 45
54 non-participatory. Because they are estimated to have used the resource at the same rate as users who report, the extrapolations tend to over-estimate the harvest. Populations Population estimates for some of the furbearer species harvested in Nevada were generated by using USGS GAP analysis data. GAP data uses maps that delineate topographical, biological, and geological features to identify various habitats. GAP data for each species is paired with habitat suitability models that specify known habitat requirements. This process provided the Department with maps indicating available statewide habitat for each of the species. The GAP data was then used in conjunction with biological density and home range data for each species to generate population estimates. Density and home range data were derived from research data either in Nevada, or in the absence of Nevada research, from nearby states (Utah and California) with similar habitat types. Those estimates and estimated harvest rates based on expanded trapper harvest data appear in Table 3. Table 3. Estimated Population and Rate of Harvest. Median Population Rate of Species Estimate Harvest Harvest Beaver 71, % Bobcat 27,000 1, % Gray Fox 88, % Kit Fox 83, % Furbearer harvest data are obtained each year by summarizing and expanding postseason questionnaire information obtained from licensed trappers. The Department sends trappers a logbook at the beginning of each season to facilitate their documentation of trapping effort. These data have been comparable for decades. Additionally, the Department obtains bobcat harvest data and trapper effort through a mandatory check-in process. Trappers are required to retain and remit a portion of the lower jaw preserving one or more canine teeth. Biologists can later extract the canines and determine the age classification of the animal, adult or juvenile, based upon tooth characteristics. Various data from harvest and age characteristics of harvested bobcats are used to assess population status and trends. 46
55 APPENDIX I INDEX TO TABLES Table Name Page Upland Game Summary of Upland Game Harvest A-1 Summary of Statewide Turkey Harvest Spring A-3 Summary of Statewide Turkey Harvest A-4 Furbearers Summary of Statewide Fur Harvest A-5 Summary of Fur Harvest by County A-6 Summary of Trappers by Species and County A-7 Fur Harvest Value A-8 Waterfowl Summary of Statewide Waterfowl Harvest A-9 Nevada Mid-Winter Waterfowl Inventory Data...A Breeding Waterfowl Habitat Conditions (figure)...a-11 APPENDIX II SMALL GAME QUESTIONNAIRE DATA Table Name Page Harvest Questionnaire Data by Species, by County...Q-1
56
57 Year Sage Grouse SUMMARY OF STATEWIDE UPLAND GAME HARVEST From Post-season Questionnaire Hunters Blue Grouse Hunters A-1 Chukar Partridge Hunters Hungarian Partridge Hunters ,775 9, ,886 18,615 ND ND ,805 7, ,895 17,127 ND ND ,686 9,099 1, ,520 14,116 ND ND ,930 8,536 2,529 1, ,608 13,936 ND ND ,924 9,348 3,409 1, ,813 17,952 9,625 2, ,376 8,331 2,168 1,534 89,408 14,292 2,671 1, ,902 5,977 1,752 1,047 56,440 9,626 2, ,561 4,230 2,257 1,164 52,245 7,853 1, ,693 6,647 2,663 1, ,775 12,296 2, ,228 8,090 3,123 1, ,270 13,960 2,665 1, ,648 5,895 1,824 1, ,965 15,481 4,895 1, ,522 6,731 2,916 1,560 84,498 11,486 8,671 1, ,015 6,150 1,792 1,501 55,454 10,738 2,151 1, ,495 6, ,379 79,222 10,979 2,999 1, ,555 5,960 1,183 1,043 52,243 9,264 3,299 1, ND ND 1,125 1,063 19,514 6,842 1, ,967 2,361 1, ,555 9,325 1, ,104 3,866 1,694 1,063 52,640 10,200 2, ,564 3,722 1,856 1, ,194 13,065 3,888 1, ,445 4,320 2,303 1,225 82,464 14,545 1, ,697 5,331 2,357 1,291 75,834 10,941 3,829 1, ,371 5,564 1,161 1,285 46,700 11,364 1, ,871 5,126 3,179 1,422 46,780 9, ,782 4,352 1,490 1,141 24,232 7, ,004 4, ,563 6, ,529 4,042 1,606 1,127 62,009 11,613 1, ,111 3,906 1, ,972 11,041 1, ,125 3,471 1,105 1,113 36,950 9,178 1, ,723 3,277 1, ,289 10,742 2, ,070 3,097 1, ,655 15,586 8,759 2, ,728 2, ,310 11,721 4, ,691 1,708 1, ,350 8,905 2, ,940 2,412 1, ,545 10,722 1, ,557 2,177 1, ,738 12,491 2, ,244 2, ,081 9,134 1, ,175 1,526 2,046 1, ,135 14,727 2,767 1, ,701 1,981 2,822 1, ,408 15,654 4,334 1, ,897 3,197 1,699 1,643 61,153 14,448 1,775 1, ,775 3,271 1,936 1,670 61,307 11,735 1,334 1, ,944 4,461 2,807 1,878 76,851 14,197 2,272 1, ,353 3,827 1,599 1,375 83,660 14,770 3,656 1, ,295 2,055 1, ,047 11,273 3,592 1, ,743 1,681 1,241 1,066 44,768 9,766 3,057 1, ,889 1, ,870 12, ,776 1,587 1, ,080 15,382 1, ,472 1, ,988 8,721 1,
58 Year Cal. Quail SUMMARY OF STATEWIDE UPLAND GAME HARVEST From Post-season Questionnaire (page 2) Hunters Gambel s Quail Hunters Pheasant Hunters Rabbit Hunters ,646 13,533 n/a n/a 4,125 3,555 64,181 12, ,027 9,040 n/a n/a 4,357 3,191 49,004 9, ,111 7,636 n/a n/a 5,274 3,441 29,682 7, ,696 6,532 n/a n/a 5,012 2,887 28,059 6, ,674 8,431 n/a n/a 7,188 3,842 45,926 9, ,954 8,790 n/a n/a 8,046 4,117 58,573 9, ,629 8,694 44,036 5,923 5,910 3,469 53,133 8, ,720 7,825 37,546 4,435 4,969 2,987 71,898 9, ,939 9,050 52,313 4,675 5,322 2,946 99,817 10, ,972 11, ,822 6,990 6,072 3, ,502 11, ,863 11,128 83,492 7,432 6,740 3, ,671 9, ,882 9,451 23,723 5,157 5,424 4,031 62,831 8, ,397 9,620 16,275 4,959 3,119 3,325 52,168 9, ,434 9,575 47,330 4,801 2,461 2,412 45,344 7, ,981 8,241 25,726 3,563 3,110 2,839 40,406 6, ,756 7,511 38,547 3,970 2,314 1,928 27,266 5, ,423 7,384 25,702 3,826 2,535 1,731 25,709 5, ,404 6,810 24,326 3,295 1,703 1,223 33,470 5, ,398 6,484 34,190 3,398 2,758 1,359 45,215 6, ,632 5,125 9,067 2,237 1,246 1,178 33,341 5, ,471 4,336 5,686 1,967 1,058 1,054 38,449 5, ,791 5,195 13,396 2,593 1,177 1,373 23,565 5, ,265 4,966 19,249 2,586 1,041 1,129 39,893 4, ,723 5,874 46,805 3, ,817 4, ,044 5,798 21,382 2,604 1,973 1,341 20,035 3, ,223 7,303 30,453 3,241 1, ,962 4, ,989 5,054 5,384 1, ,694 3, ,194 5,569 12,827 2, ,783 3, ,619 6,814 29,295 3,176 1,315 1,047 18,404 3, ,996 6,909 19,098 2, ,058 15,183 3, ,757 5,782 11,413 2, ,114 2, ,718 4,006 17,753 1,905 1, ,672 2, ,420 5,006 4,771 1,715 1, ,554 2, ,422 5,939 19,279 2,351 1, ,638 2, ,353 3,725 18,587 1, ,604 2, ,662 3,352 20,241 1, ,269 1, ,557 4, , ,185 8, , ,150 8,262 16,516 3, ,878 2, ,139 4,426 20,640 3, ,553 3, ,976 3,937 18,863 2, ,805 2, ,928 3,076 25,471 1, ,149 1, ,532 2,756 7,632 1, , ,238 1,841 8,482 1, ,063 1, ,463 2,157 6,715 1, ,345 1, ,108 1,171 4,422 1, ,451 1,049 A-2
59 TURKEY RETURN CARD DATA STATEWIDE SUMMARY SPRING 2016 Tag # # Tags Qstr. % Effort Harvest Hunt Area Quot a Issue d Rtnd Rtn # Succ. %Succ. Hunter Days Scou t DN H To m Jak e Los t Chose Not to Harves t Weapon Type Elko Co. - Unit % 2 67% Elko Co. - Unit 102 & 065** % 9 69% Lander Co. - Units 151 & * % 1 100% Pershing County % 9 69% Mason Valley WMA* % 8 57% Moapa Valley* ** % 10 71% White Pine Co. - Unit 115* ** % 13 68% Lyon County except MVWMA** % 11 85% Douglas County - Unit % 0 0% Paradise Valley** % 12 52% TOTALS: % 75 66% *Includes youth hunt information **Includes Non-resident information Hunt Area Average Days/Hunter Effort Statistics Average Scout Days/Hunter Archer y Bird Statistics % % of Harvest Lost Avg. DNH Ad. M Juv. M Rate Beard Length Elko Co. - Unit % 50% 50% 0.0% 5.5 Elko Co. - Unit 102 & % 100% 0% 0.0% 7.3 Lander Co. - Units 151 & % 100% 0% 0.0% 8.0 Pershing County % 100% 0% 11.1% 6.6 Mason Valley WMA % 75% 25% 37.5% 7.1 Moapa Valley % 90% 10% 0.0% 6.5 White Pine Co. - Unit % 92% 8% 7.7% 6.2 Lyon County except MVWMA % 91% 9% 0.0% 6.7 Douglas Co. - Unit 192 No Tags Issued Paradise Valley % 75% 25% 0.0% 5.3 TOTALS: % 88% 12% 6.7% 6.6 Shotgu n A-3

60 SUMMARY OF STATEWIDE TURKEY HARVEST Year Harvest Tags Issued Hunter Effort (days) Spring Fall Spring Fall Spring Fall No Data No Data No Data No Data No Data 155 No Data No Data No Data 2000 No Data 13 No Data 51 No Data No Data No Data No Data No Data No Data Closed 457 Closed 811 Closed Closed 166 Closed 411 Closed Closed 202 Closed 393 Closed Closed 139 Closed 266 Closed Closed 117 Closed 320 Closed Closed 118 Closed 352 Closed Closed 138 Closed 320 Closed TOTALS: AVERAGE: Harvest Spring Wild Turkey Harvest Information ( ) Tags Issued Tags Issued Year Spring Harvest A-4
61 Summary of Statewide Fur Harvest From post-season Questionnaire Year Trappers R-TCat Weasel Beaver Skunk Otter Muskrat Mink Raccoon Kit Fox Gray Fox Red Fox Badger Bobcat Coyote Total Value , , ,421 1,213 $46, , , ,442 1,464 $79, , , ,517 2,155 $142, , , ,051 4,125 $290, , , ,345 3,730 $173, , , ,334 3,008 $339, , , ,948 7,718 $742, , ,814 6,172 $785, , , ,173 1, ,643 8,458 $2,062, , , , ,306 2,119 1,033 5,513 16,229 $1,883, , , , ,103 1, ,257 10,304 $1,640, , , , , ,392 14,129 $1,545, , , ,786 13,882 $1,499, , , , ,027 10,055 $1,071, , , , ,077 10,306 $1,038, , , , ,373 1, ,657 6,119 $877, , , , ,305 7,745 $830, , , ,458 6,373 $641, , ,189 2,352 $546, , ,489 1,717 $336, ,252 $122, , ,476 3,718 $447, ,175 3,746 $176, ,820 4,477 $348, ,270 3,298 $165, , ,791 $157, , ,509 3,209 $218, , ,705 2,227 $196, , ,003 $183, , ,637 1,202 $172, ,185 $145, ,145 1,071 $229, ,198 1,340 $414, ,744 2,726 $781, ,666 2,003 $644, , ,316 1,776 $1,147, , , ,911 2,956 $1,248, , , ,811 3,245 $1,543, , , ,532 2,425 $726, ,240 1,514 $431, ,527 2,147 $1,150, , , , ,992 3,236 $2,005, , , , , ,333 3,782 $2,311, , , ,105 1, ,063 3,561 $1,593, , , ,641 3,591 $702, , , ,641 3, , , ,641 3,591 $375,451 Average , ,303 4,396 $743,865 A-5
62 Region County Beaver Muskrat Coyote Bobcat Western NEVADA FUR HARVEST Expanded Data Gray Fox Kit Fox Mink Otter Badger Weasel Raccoon Striped Skunk Spotted Skunk Carson Churchill Douglas Humboldt Lyon Mineral Pershing Storey Washoe TOTALS: Ring- Tail Cat Red Fox Eastern Elko Eureka Lander White Pine TOTALS: Southern Clark Esmeralda Lincoln Nye TOTALS: Unknown TOTALS Statewide Totals: A-6
63 Region County Beaver Muskrat Coyote Bobcat Western NEVADA TRAPPERS BY SPECIES AND COUNTY Expanded Data Gray Fox Kit Fox Mink Otter Badger Weasel Raccoon Striped Skunk Spotted Skunk Ring- Tail Cat Carson Churchill Douglas Humboldt Lyon Mineral Pershing Storey Washoe TOTALS: Red Fox Eastern Elko Eureka Lander White Pine TOTALS: Southern Clark Esmeralda Lincoln Nye TOTALS: Unknown Statewide Totals: A-7
64 NEVADA FUR HARVEST VALUE Species % Increase % Decrease - Beaver $3, $11.61 $ % Muskrat $1, $2.11 $ % Mink $ $9.91 $ % Raccoon $ $7.80 $ % Bobcat $260, $ $ % Coyote $89, $32.06 $ % Badger $1, $13.60 $ % Striped Skunk $ $6.06 $ % Ring-tailed Cat $ $7.50 $ % Kit Fox $6, $11.48 $ % Gray Fox $10, $17.09 $ % Red Fox $ $23.83 $ % Total $375, From Post-Season Questionnaire Total Value of Catch AVERAGE PRICE A-8
65 SUMMARY OF STATEWIDE WATERFOWL HARVEST from 1971 From Post-Season Questionnaire Year Duck Stamp Sales Est'd. NV Geese Tundra Federal Nevada Hunters Ducks Dark White Total Swans * , , ,107 7,357 4,655 12, , , , ,565 8,066 1,756 9, , , ,435 97,251 4,047 2,580 6, , , , ,080 5,480 1,498 6, , , , ,863 3,629 1,430 5, , , , ,598 6,379 3,194 9, , , ,190 79,491 4,142 1,606 5, , , , ,840 5, , , ,370 18,799 12, ,150 5, , , ,705 18,300 12, ,765 4, , , ,496 15,489 17,168 90,396 8,897 1,961 10, , ,969 17,250 18,921 97,582 6, , , ,009 16,607 16, ,619 8,901 1,407 10, , ,950 16,451 17, ,570 11,658 1,386 13, , ,421 17,290 8,647 75,890 9,870 1,207 11, , ,749 20,000 8,357 67,615 6, , , ,907 25,000 6,840 76,949 8, , , ,564 28,700 4,432 37,338 8, , , ,703 15,600 4,950 35,722 6, , , ,647 9,050 4,446 35,693 10, , , ,034 9,777 4,803 30,225 5, , , ,303 7,277 3,453 19,589 10, , , ,245 9,162 4,335 32,191 6, , , ,704 8,469 5,112 46,340 8, , , ,347 9,132 6,964 72,259 5, , , ,702 9,127 7,228 83,908 9, , , ,874 11,451 8, ,596 6, , , ,331 11,420 8, ,092 8, , , ,880 10,898 6,918 80,814 7, , , ,000 10,085 6,159 56,579 4, , , ,293 9,016 3,692 31,203 2, , , ,914 8,460 4,028 33,113 4, , , ,896 8,018 4,298 44,022 4, , , ,991 7,501 3,572 38,305 1,479 1,135 2, , ,574 7,956 3,960 56,428 4, , , ,307 8,581 4,525 69,893 6, , , ,718 8,890 4,038 54,459 5, , , ,995 8,807 2,275 30,396 3, , , ,503 9,018 4,201 29,091 6, , , ,053 8,728 4,812 58,592 5,935 1,275 7, , ,360 8,807 2,669 45,746 2, , , ,849 3,247 50,892 3, , , ,674 3,371 43,655 4, , , ,234 2,448 23,810 2, , , ,645 2,337 30,800 3, , ,932 Individual year NV duck stamp sales noted by year beginning in Individual Nevada hunters are calculated beginning in This is the value recorded from 2005 on. A-9 Total Waterfowl
66 NEVADA MID-WINTER WATERFOWL INVENTORY DATA Current year compared to 52 SPECIES Year Year Highest Lowest Average Average Mallard 19,868 25,213 26,344 14,711 22,115 16,103 20,897 14,737 28,950 4,321 Gadwall 3,253 3,450 4,539 5,439 2,750 1,211 3,478 2,963 12, Widgeon 1, , ,592 4,235 2,373 1,404 4, G.W. Teal 7,296 5,405 5,961 5,727 4,530 4,151 5,155 6,362 26, B.W. Teal Cinnamon Teal Shoveler 8,620 8,543 8,189 12,425 11,504 3,848 8,902 3,959 24, Pintail 3,290 4,290 3,660 1, ,015 5,831 24, Wood Duck Redhead 5,857 8,445 1,982 5,260 12,587 3,913 6,437 2,796 13, Canvasback 4,920 8,529 2,590 1,582 3,833 1,575 3,622 2,902 10, Scaup , Ringneck 1, , Goldeneye , , Bufflehead 1,217 1,525 1, , , , Ruddy 9,064 9,656 1,531 7,755 5,202 3,409 5,511 4,803 22, Merganser 558 1, ,593 8, Miscellaneous Total Ducks 68,229 79,575 61,226 57,502 69,765 42,794 62,172 50, ,540 15,739 % Change from Previous Year 24% 17% -23% -6% -6% -39% -31% -14% Dark Geese 18,070 20,120 20,348 15,909 18,362 17,079 18,364 15,775 35,806 3,310 Light Geese , Total Geese 18,557 20,754 20,375 16,235 18,832 17,439 18,727 15,579 33,730 3,651 % Change from Previous Year 6% 12% -2% -20% 16% -7% -7% 12% Trumpeter Swan Tundra Swan 606 1, ,047 10, Total Waterfowl % Change from Previous Year 87, ,818 81,866 73,870 88,998 60,706 81,452 67,697 16% -20% -10% 20% -32% -25% -10% 149,746 22,097 Coot 39,130 42,188 14, ,769 44,273 69,877 54,371 22, ,769 3,926 A-10

67 2015 Breeding Waterfowl Habitat Conditions A-11


68 APPENDIX II SMALL GAME and WATERFOWL HARVEST DATA Derived from Modified Post-season Questionnaire Q-1
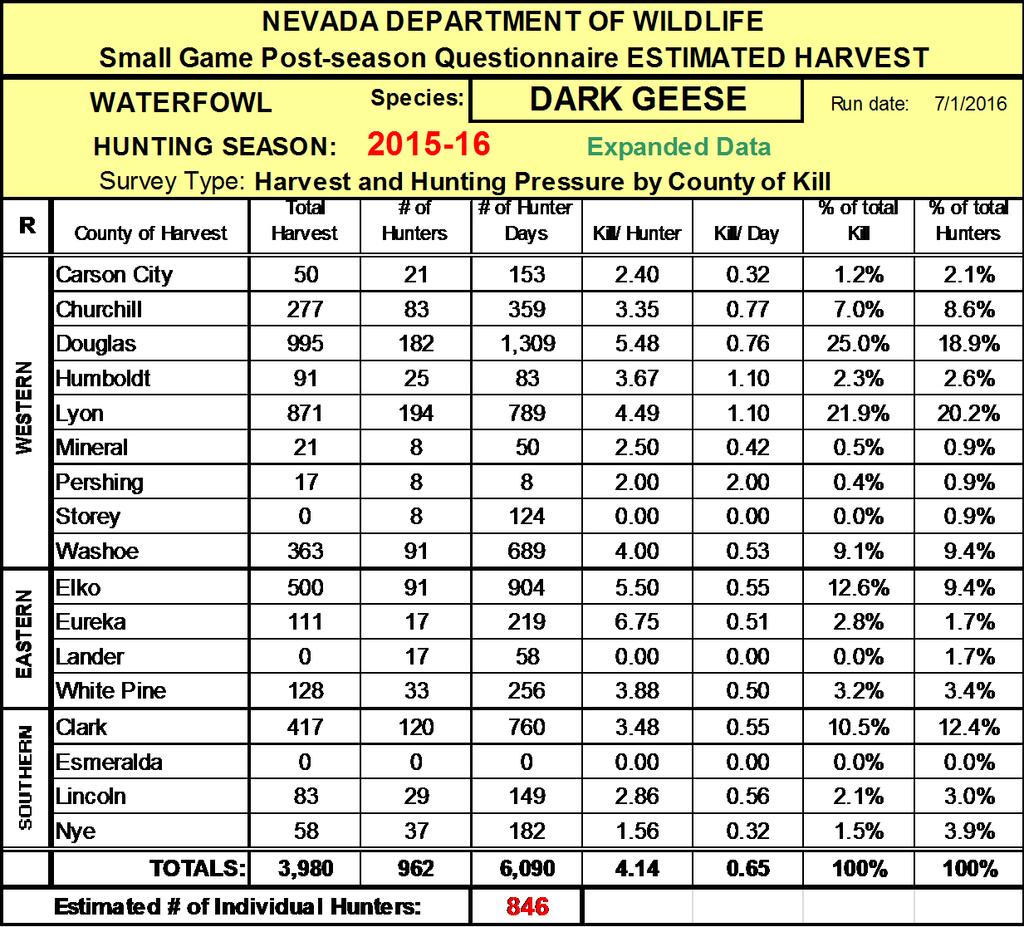
69 Q-2
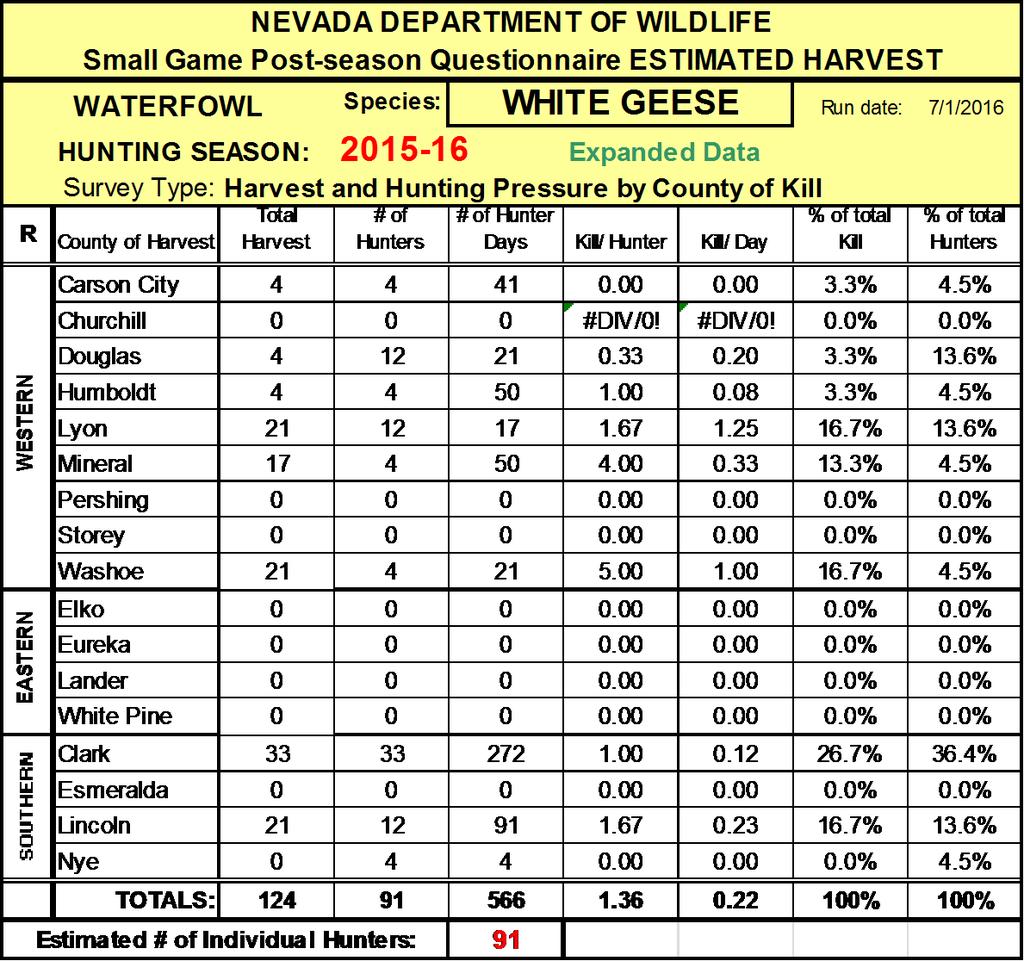

70 Q-3
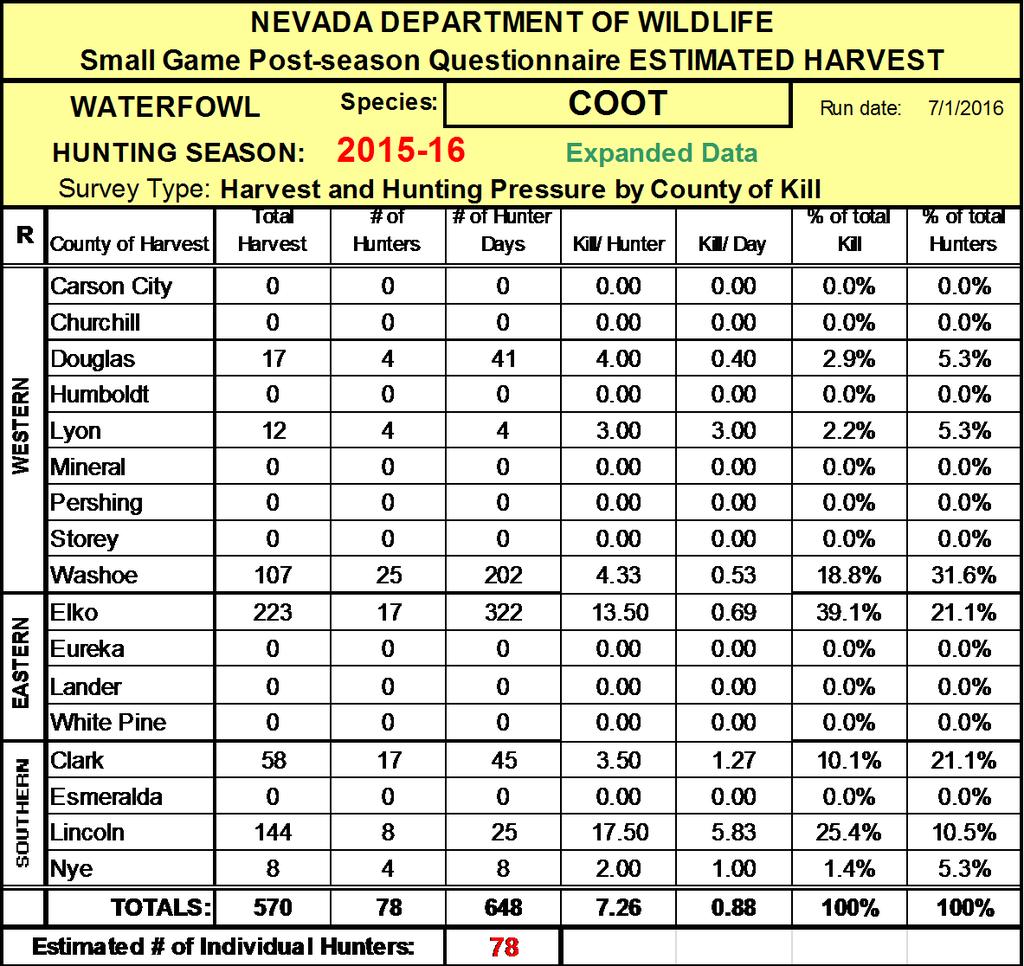
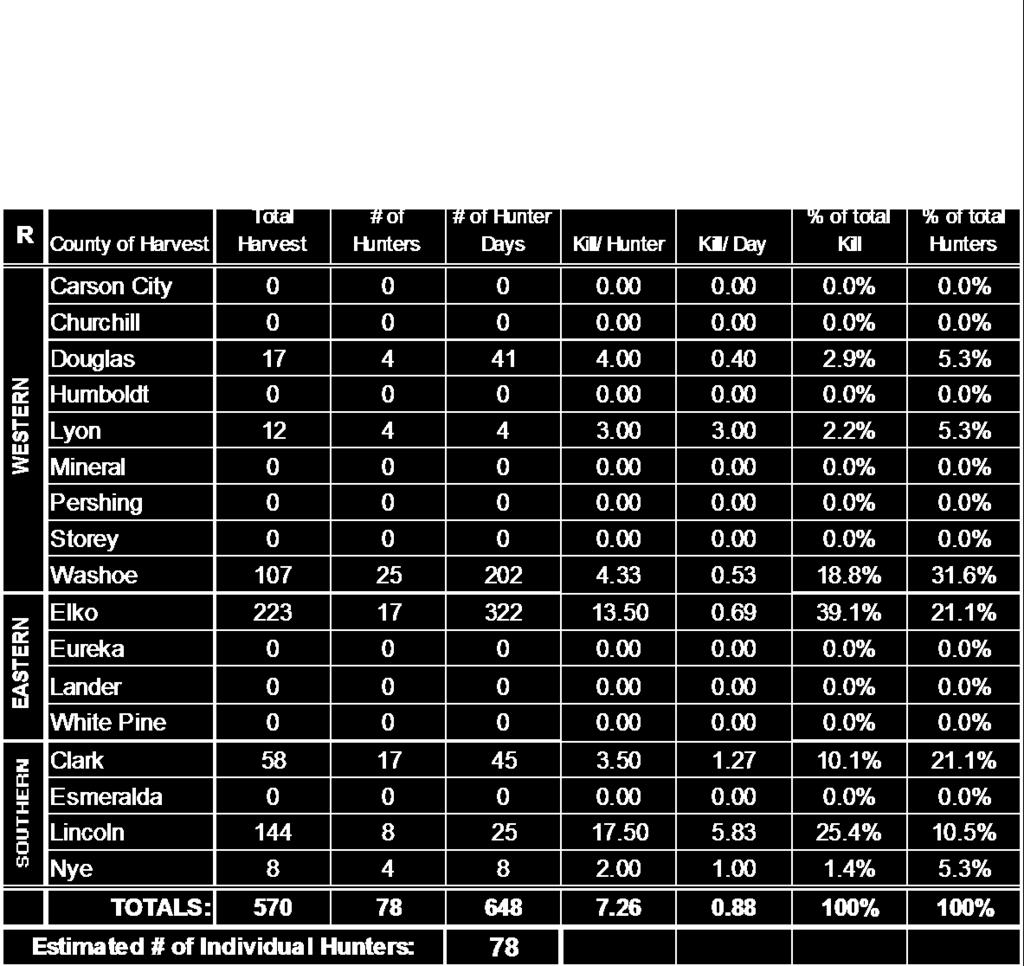
71 Q-4
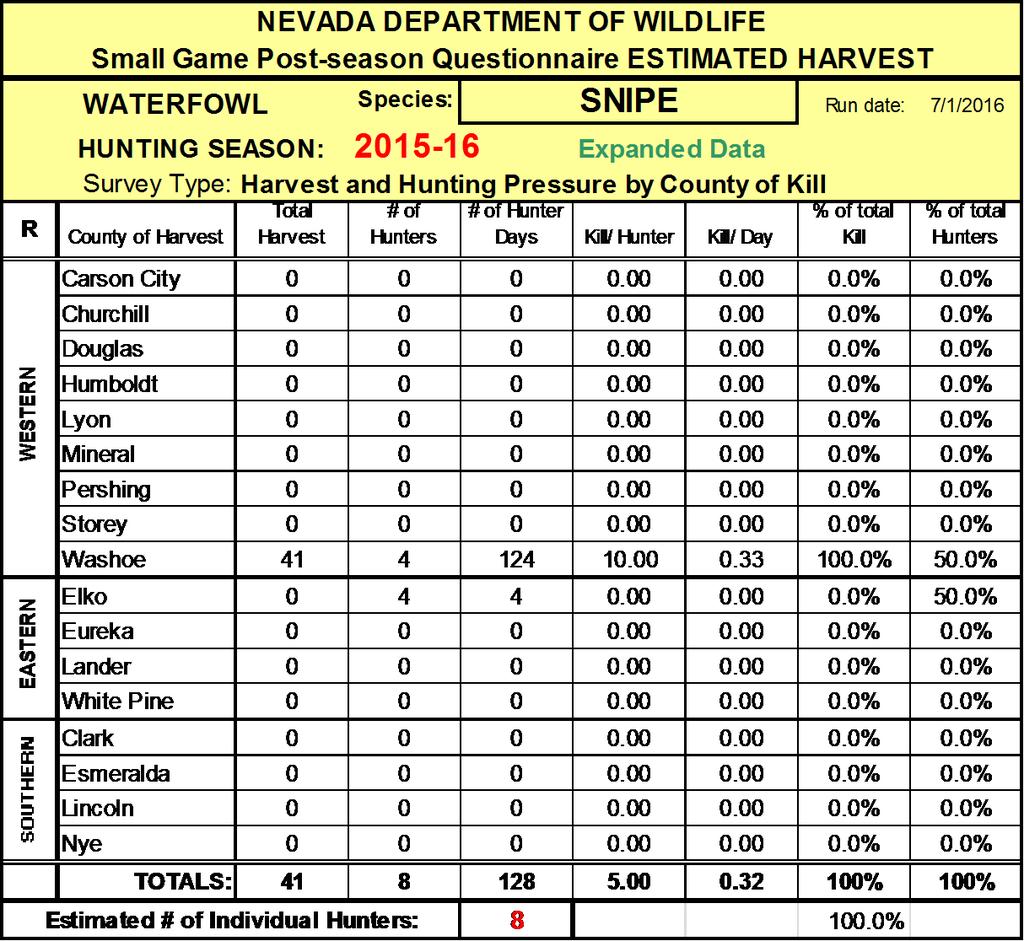
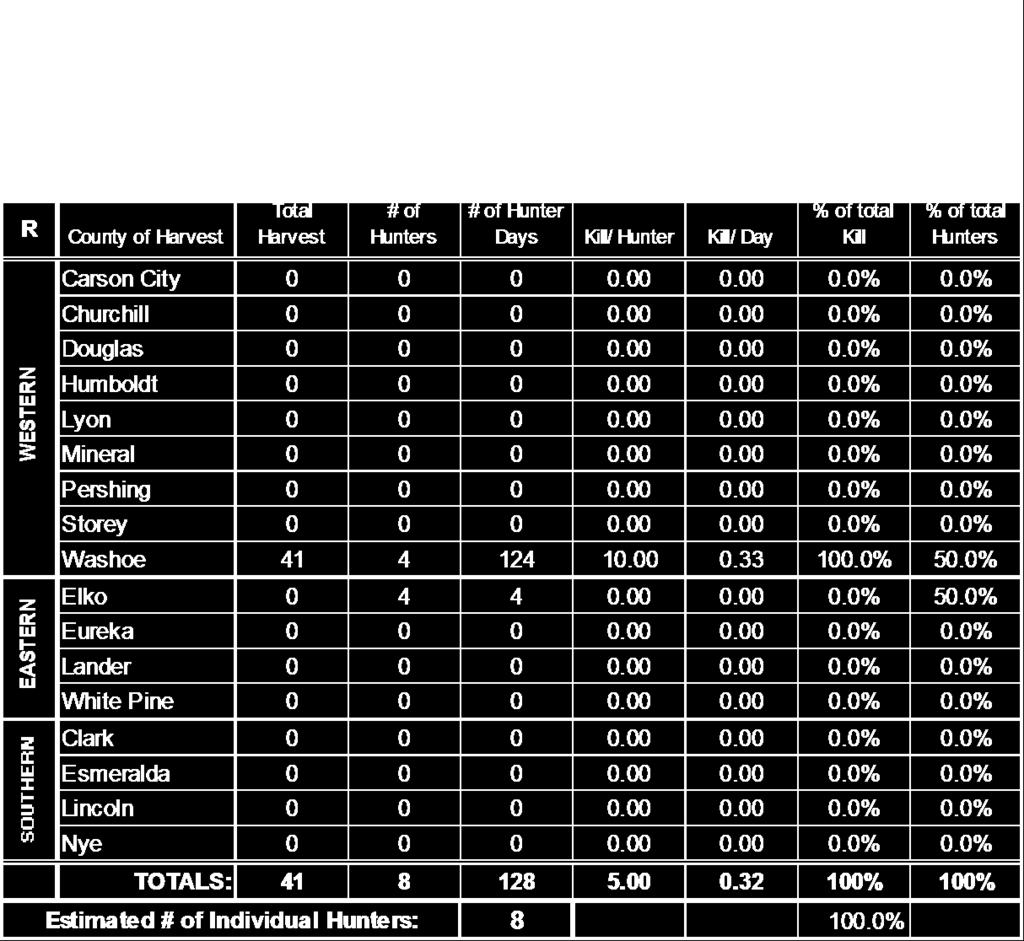
72 Q-5


73 NEVADA DEPARTMENT OF WILDLIFE Small Game Post-season Questionnaire ESTIMATED HARVEST MIGRATORY BIRDS Species: White-winged Dove Run date: 7/5/ HUNTING SEASON: Expanded Data Survey Type: Harvest and Hunting Pressure by County of Kill Total County of Harvest Harvest # of Hunters Kill/ Hunter % of total Kill % of total Hunters Clark % 98.3% Nye % 0.0% Other % 1.7% TOTALS: % 100% Estimated # of Individual Hunters: 57 Q-6
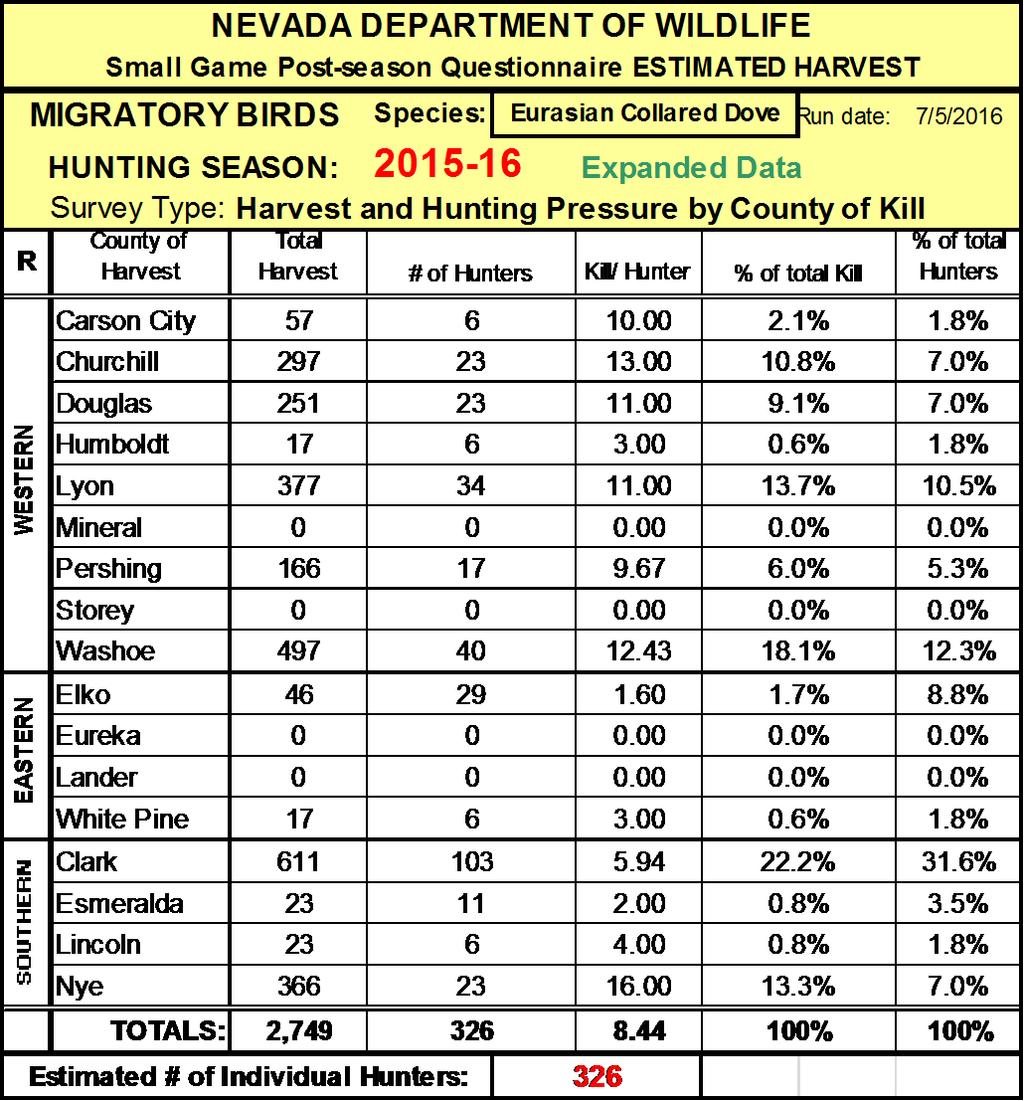
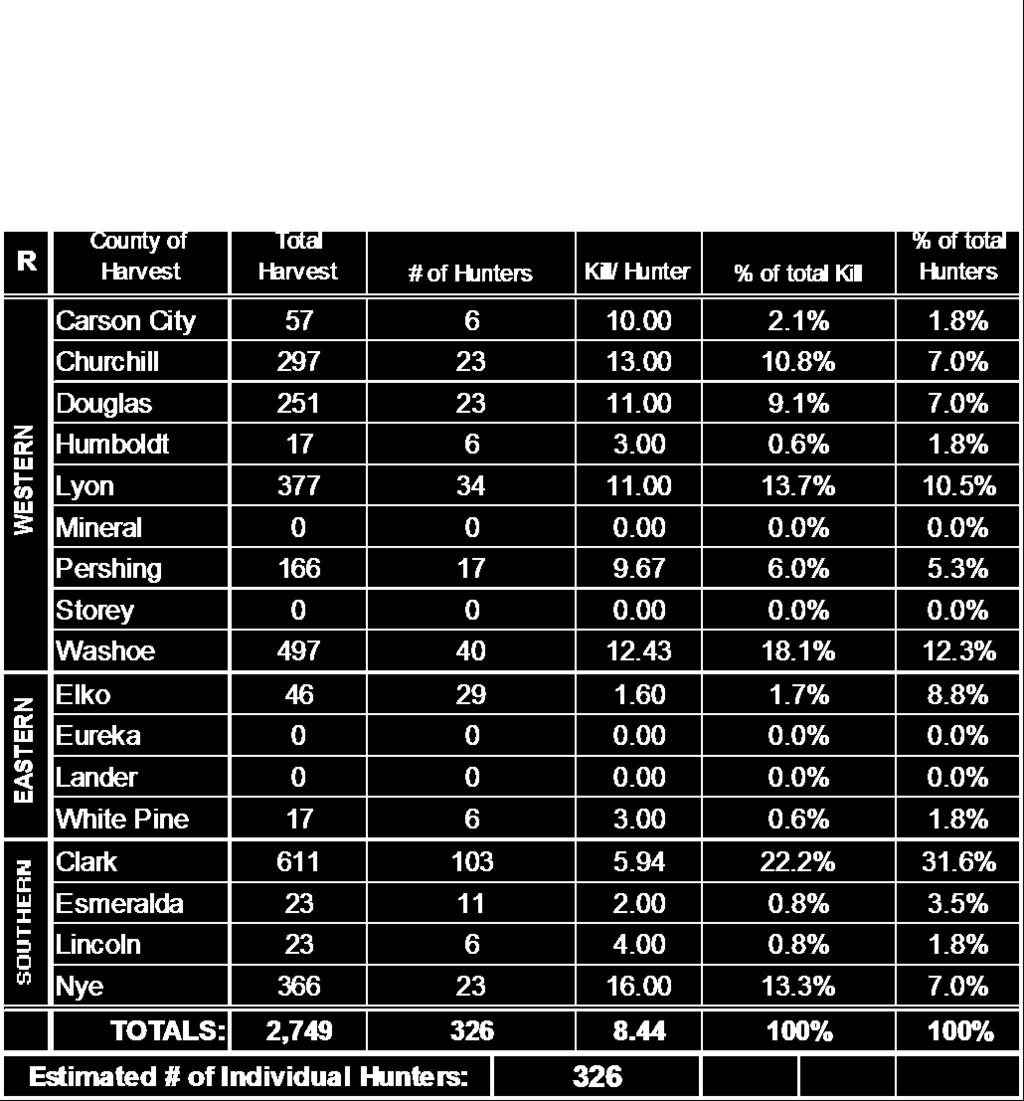
74 Q-7
STATE OF NEVADA BOARD OF WILDLIFE COMMISSIONERS CR 18-12
 STATE OF NEVADA BOARD OF WILDLIFE COMMISSIONERS The Board of Wildlife Commissioners under the authority of Section 501.181, 503.090, 503.140 and 503.245 of the Nevada Revised Statutes, does hereby adopt
June 2017 NBWC Page 1 of 2 #19
 June 2017 NBWC Page 1 of 2 #19 June 2017 NBWC Page 2 of 2 STATE OF NEVADA BOARD OF WILDLIFE COMMISSIONERS The Board of Wildlife Commissioners under the authority of Section 501.181, 503.090, 503.140 and
Harvest Data & Population Status Reports
 Small Game Status 2017 Harvest Data & Population Status Reports Compiled by: Shawn P. Espinosa, Upland Game Staff Biologist Russell Woolstenhulme, Waterfowl and Furbearer Staff Biologist Regional Supervising
Harvest Data & Population Status Reports
 Small Game Status 2018 Harvest Data & Population Status Reports Compiled by: Shawn P. Espinosa, Upland Game Staff Biologist Russell Woolstenhulme, Waterfowl and Furbearer Staff Biologist Regional Supervising
Cover photo of a mountain quail courtesy of Tim Torell
 Nevada Department of Wildlife 2014 Upland and Migratory Game Bird, Rabbit and Furbearing Mammals Harvest Data & Population Status Reports Compiled by: Shawn P. Espinosa, Upland Game Staff Biologist Russell
STATE OF NEVADA BOARD OF WILDLIFE COMMISSIONERS CR SEASONS, BAG LIMITS, AND SPECIAL REGULATIONS FOR MIGRATORY GAME BIRDS
 STATE OF NEVADA BOARD OF WILDLIFE COMMISSIONERS The Board of Wildlife Commissioners under the authority of Section 501.181, 503.090, 503.140 and 503.245 of the Nevada Revised Statutes, does hereby adopt
CR SEASONS, BAG LIMITS, AND SPECIAL REGULATIONS FOR MIGRATORY WATERFOWL
 STATE OF NEVADA BOARD OF WILDLIFE COMMISSIONERS #17 The Board of Wildlife Commissioners under the authority of Section 501.181, 503.090, 503.140 and 503.245 of the Nevada Revised Statutes, does hereby
STATE OF NEVADA BOARD OF WILDLIFE COMMISSIONERS CR SEASONS, BAG LIMITS, AND SPECIAL REGULATIONS FOR MIGRATORY GAME BIRDS
 STATE OF NEVADA BOARD OF WILDLIFE COMMISSIONERS The Board of Wildlife Commissioners under the authority of Section 501.181, 503.090, 503.140 and 503.245 of the Nevada Revised Statutes, does hereby adopt
2017 SPRING WILD TURKEY
 2017 SPRING WILD TURKEY Nevada Department of Wildlife APPLICATION INSTRUCTIONS A Tag is Required to Hunt Wild Turkey in Nevada Hunting Hours and Limits: Spring wild turkey hunting hours are one half hour
2015 SPRING WILD TURKEY Application Instructions and Season Regulations
 NEVADA DEPARTMENT OF WILDLIFE PLEASE NOTE: As with other game species, applicants are advised that a significant portion of the turkey population occurs on PRIVATE LANDS and permission must be secured
NE VA DA DEPARTMENT OF WILDL IFE
 NE VA DA DEPARTMENT OF WILDL IFE 2013 SPRING WILD TURKEY Application Instructions and Season Regulations A TAG IS REQUIRED TO HUNT WILD TURKEY IN NEVADA 2013 Spring Turkey dates and limits are set by the
STATE OF NEVADA NEVADA DEPARTMENT OF WILDLIFE NEVADA BOARD OF WILDLIFE COMMISSIONERS AMENDED NOTICE OF HEARING FOR ADOPTION OF COMMISSION REGULATIONS
 STATE OF NEVADA NEVADA DEPARTMENT OF WILDLIFE NEVADA BOARD OF WILDLIFE COMMISSIONERS AMENDED NOTICE OF HEARING FOR ADOPTION OF COMMISSION REGULATIONS *Changes are italicized. The title of the first Commission
NEVADA DEPARTMENT OF WILDLIFE HARVEST MANAGEMENT GUIDELINES FOR HUNTING SEASONS
 NEVADA DEPARTMENT OF WILDLIFE HARVEST MANAGEMENT GUIDELINES FOR HUNTING SEASONS Draft Page 2 of 15 TABLE OF CONTENTS Schedule for formulating harvest management guidelines..............................................
Minutes of the Meeting of the Mineral County Advisory Board to Manage Wildlife Monday March 12, 2018 at 6:00 PM
 Minutes of the Meeting of the Mineral County Advisory Board to Manage Wildlife Monday March 12, 2018 at 6:00 PM MEETING ROOM, HAWTHORNE LIBRARY Present: Glenn Bunch, Chairman, Members: Billie Williams
Effects of Sage-grouse Hunting in Nevada. Nevada Board of Wildlife Commissioners August 13, 2011
 Effects of Sage-grouse Hunting in Nevada Nevada Board of Wildlife Commissioners August 13, 2011 Current Season Structure Season is from September 25 October 9 (15 days total) Bag Limit = 2, Possession
STATUS OF WILDLIFE POPULATIONS, FALL 2008
 STATUS OF WILDLIFE POPULATIONS, FALL 2008 (Including 1998-2008 Hunting and Trapping Harvest Statistics) edited by Margaret H. Dexter Minnesota Department of Natural Resources Division of Fish and Wildlife
Proposed Upland Game Bird Regulations
 2017-18 Proposed Upland Game Bird Regulations Fish and Wildlife Commission Meeting April 21, 2017, Klamath Falls, Oregon Dave Budeau Upland Game Bird Coordinator Upland Game Bird Regulations Brief Overview:
2014 Oregon Hunting Survey: An effort to better understand the choices Oregon hunters make regarding ammunition
 2014 Oregon Hunting Survey: An effort to better understand the choices Oregon hunters make regarding ammunition Q1. How many years have you lived in Oregon? YEARS LIVED IN OREGON Q2. How many years have
DEPARTMENT OF WILDLIFE Operations Division 6980 Sierra Center Parkway, Ste. 120 Reno, Nevada (775) Fax (775)
 Fax (775)") STATE OF NEVADA # DEPARTMENT OF WILDLIFE Operations Division 6980 Sierra Center Parkway, Ste. 10 Reno, Nevada 89511 (775) 688-1500 Fax (775) 688-1987 MEMORANDUM Date: June 4, 016 To: From: Nevada Board
STATE OF NEVADA # DEPARTMENT OF WILDLIFE Operations Division 6980 Sierra Center Parkway, Ste. 10 Reno, Nevada 89511 (775) 688-1500 Fax (775) 688-1987 MEMORANDUM Date: June 4, 016 To: From: Nevada Board
CARSON CITY ADVISORY BOARD TO MANAGE WILDLIFE PUBLIC NOTICE
 PUBLIC NOTICE The will hold a public meeting at 5:30 p.m. on Monday, July 29, 2013, in the CITY HALL CAPITOL CONFERENCE ROOM, 201 NORTH CARSON STREET, CARSON CITY, NEVADA AGENDA 1. CALL TO ORDER, DETERMINATION
DEPARTMENT OF WILDLIFE Operations Division 6980 Sierra Center Parkway, Ste. 120 Reno, Nevada (775) Fax (775)
 Fax (775)") #9 STATE OF NEVADA DEPARTMENT OF WILDLIFE Operations Division 6980 Sierra Center Parkway, Ste. 0 895 (775) 688-500 Fax (775) 688-987 MEMORANDUM Date: June 3, 07 To: From: Nevada Board of Wildlife Commissioners,
#9 STATE OF NEVADA DEPARTMENT OF WILDLIFE Operations Division 6980 Sierra Center Parkway, Ste. 0 895 (775) 688-500 Fax (775) 688-987 MEMORANDUM Date: June 3, 07 To: From: Nevada Board of Wildlife Commissioners,
WEBLESS MIGRATORY GAME BIRD AND WATERFOWL SEASONS. DOVE (Mourning, White-winged and Eurasian Collared) SORA AND VIRGINIA RAIL
 SORA AND VIRGINIA RAIL") WEBLESS MIGRATORY GAME BIRD AND WATERFOWL SEASONS DOVE (Mourning, White-winged and Eurasian Collared) September 1 - October 31, 2018 and December 1 - December 29, 2018 15 daily, 30 in possession after
WEBLESS MIGRATORY GAME BIRD AND WATERFOWL SEASONS DOVE (Mourning, White-winged and Eurasian Collared) September 1 - October 31, 2018 and December 1 - December 29, 2018 15 daily, 30 in possession after
Proposed Upland Game Bird Regulations
 Fish and Wildlife Commission Meeting April 20, 2018, Astoria Kelly Walton Asst. Game Bird Biologist 2018-19 Proposed Upland Game Bird Regulations Exhibit B 1 Upland Game Bird Regulations Brief Overview:
DOUGLAS COUNTY ADVISORY BOARD TO MANAGE WILDLIFE Minutes of the August 12, 2014 Meeting
 DOUGLAS COUNTY ADVISORY BOARD TO MANAGE WILDLIFE Minutes of the August 12, 2014 Meeting The DOUGLAS COUNTY ADVISORY BOARD TO MANAGE WILDLIFE was scheduled for 5:32 p.m. on TUESDAY, AUGUST 12, 2014 in the
2009 SMALL GAME HUNTER MAIL SURVEY
 INTRODUCTION 2009 SMALL GAME HUNTER MAIL SURVEY Margaret Dexter, Wildlife Research Unit The Minnesota Department of Natural Resources, Division of Fish and Wildlife, Wildlife Research unit annually conducts
Splitting seasons into multiple, shorter ones is preferable to long, crowded seasons.
 COMMENTS FROM TOWN HALL MEETINGS ON HARVEST MANAGEMENT GUIDELINES FOR NEVADA HUNTING SEASONS PUBLIC Reno 31 in attendance comments Avoid overlapping seasons with differing weapon types. For example, rifle
This page intentionally blank
 This page intentionally blank Status of Wildlife Populations, Fall 2015 (Including 2005-2015 Hunting and Trapping Harvest Statistics) edited by Margaret H. Dexter Minnesota Department of Natural Resources
Job Title: Game Management, Subsection B Game Management Predator and Furbearer Management. SPECIES: Predatory and Furbearing Mammals
 Job Title:, Subsection B SPECIES: Predatory and Furbearing Mammals PREDATORY AND FURBEARING MAMMALS APPROACHES (2012 data not summarized at the time of this report.) 1. Provide opportunity for 75,000 hunter
Furbearer Management Newsletter
 West Virginia Division of Natural Resources Furbearer Management Newsletter Fall/Winter 2012/2013 Wildlife Resources Section By this time, we trust you are filling your fur sheds and reminiscing about
PROPOSED REGULATION OF THE BOARD OF WILDLIFE COMMISSIONERS. LCB File No. R112-14
 PROPOSED REGULATION OF THE BOARD OF WILDLIFE COMMISSIONERS LCB File No. R112-14 COMMISSION GENERAL REGULATION 452 EXPLANATION Matter in italics is new; matter in brackets [omitted material] is material
OREGON ADMINISTRATIVE RULES OREGON DEPARTMENT OF FISH AND WILDLIFE DIVISION 046
 DIVISION 046 USE OF WILDLIFE IN COMPETITIVE HUNTING DOG TRIALS AND THE TRAINING OF HUNTING DOGS AND RAPTORS 635-046-0000 Purpose The purpose of these rules is to implement the provisions of Oregon Revised
Proposed Upland Game Bird Regulations
 2016-17 Proposed Upland Game Bird Regulations Fish and Wildlife Commission Meeting April 22, 2016, Bandon, Oregon Dave Budeau Upland Game Bird Coordinator Upland Game Bird Regulations Brief Overview: Population
Hunting Seasons and Bag Limits
 2017-18 Hunting Seasons and Bag Limits These are the seasons and bag limits for most hunting and trapping seasons from July 1, 2017 through June 30, 2018. 2017-18 HUNTING SEASONS AND BAG LIMITS SQUIRRELS,
Draft Nevada Predator Management Plan Fiscal Year 2005 July 1, June 30, 2005
 Draft Nevada Predator Management Plan Fiscal Year 2005 July 1, 2004 - June 30, 2005 Summary Ten predator management projects were approved by the Board of Wildlife Commissioners on September 27, 2003.
Nevada Wildlife Commission. Interim: 2015 Big Game Draw Report by Systems Consultants Reno, Nevada November 14, 2015
 Nevada Wildlife Commission Interim: 2015 Big Game Draw Report by Systems Consultants Reno, Nevada November 14, 2015 1 Agenda Our Agenda 2015 Draw - Interim Stats Big Game Applications PIW Applications
Department of Natural Resources
 Department of Natural Resources Adopted Expedited Emergency Game and Fish Rules STATE GAME REFUGES, WILDLIFE MANAGEMENT AREAS, AND FURBEARER SEASONS Chapters: 6230 6234 PUBLISHED EFFECTIVE 07-20-2012 07-20-2012
FLATHEAD INDIAN RESERVATION
 FLATHEAD INDIAN RESERVATION PHEASANTS, GRAY PARTRIDGE AND MIGRATORY WATERFOWL 2017-18 HUNTING SEASONS, SHOOTING HOURS AND LIMITS Upland Game Birds Gray Partridge Hunting Season: September 1, 2017 through
NEVADA DEPARTMENT OF WILDLIFE STATEWIDE FISHERIES MANAGEMENT FEDERAL AID JOB PROGRESS REPORT F STREAM FISHERIES MANAGEMENT WESTERN REGION
 NEVADA DEPARTMENT OF WILDLIFE STATEWIDE FISHERIES MANAGEMENT FEDERAL AID JOB PROGRESS REPORT F-20-50 2014 STREAM FISHERIES MANAGEMENT WESTERN REGION NEVADA DEPARTMENT OF WILDLIFE, FISHERIES DIVISION ANNUAL
RANCHING Wildlife. Texas White-Tailed Deer 2017 Hunting Forecast
 RANCHING Wildlife Texas White-Tailed Deer 2017 Hunting Forecast During most summers, I take a short break and head to Colorado, Wyoming, or somewhere out west to enjoy a respite from the hot South Texas
Nevada Wildlife Commission. Interim: 2014 Big Game Draw Report by Systems Consultants Reno, Nevada November 15, 2014
 Nevada Wildlife Commission Interim: 2014 Big Game Draw Report by Systems Consultants Reno, Nevada November 15, 2014 1 Agenda Our Agenda 2014 Draw - Interim Stats Big Game Applications PIW Applications
GAME BIRD PROGRAM RECOMMENDATIONS FOR UPLAND and MIGRATORY GAME BIRD SEASONS
 Attachment 3 GAME BIRD PROGRAM RECOMMENDATIONS FOR 2018 19 UPLAND and MIGRATORY GAME BIRD SEASONS FOR CONSIDERATION BY THE OREGON FISH AND WILDLIFE COMMISSION April 20, 2018 Oregon Department of Fish and
Agency Determination [150B- 21.3A(c)(1)a] Implements or Conforms to Federal Regulation [150B-21.3A(e)] Necessary with substantive public interest
![Agency Determination [150B- 21.3A(c)(1)a] Implements or Conforms to Federal Regulation [150B-21.3A(e)] Necessary with substantive public interest](/thumbs/90/104454100.jpg "Agency Determination [150B- 21.3A(c)(1)a] Implements or Conforms to Federal Regulation [150B-21.3A(e)] Necessary with substantive public interest") Public Comment [150B- SECTION.0100 - GENERAL REGULATIONS 15A NCAC 10B.0101 IMPORTATION OF WILD ANIMALS AND BIRDS Amended Eff. August 1, 2010 15A NCAC 10B.0102 IMPORTATION OF GRAY FOXES Eff. February 1,
Public Comment [150B- SECTION.0100 - GENERAL REGULATIONS 15A NCAC 10B.0101 IMPORTATION OF WILD ANIMALS AND BIRDS Amended Eff. August 1, 2010 15A NCAC 10B.0102 IMPORTATION OF GRAY FOXES Eff. February 1,
Nevada Predator Management Plan Fiscal Year 2003 July 1, June 30, 2003
 Summary Nevada Predator Management Plan Fiscal Year 2003 July 1, 2002 - June 30, 2003 Six predator management projects were approved by the Board of Wildlife Commissioners on September 7, 2001. An overview
Ely, Nevada Highway Commercial Office/Warehouse/Industrial Property
 Ely, Nevada Highway Commercial Office/Warehouse/Industrial Property 6,000 + SF Office/Warehouse has 2 half baths, office, and roll up doors on the east and west walls 5.81 acre parcel fronts Highway 93
2017 LATE WINTER CLASSIFICATION OF NORTHERN YELLOWSTONE ELK
 2017 LATE WINTER CLASSIFICATION OF NORTHERN YELLOWSTONE ELK A collaborative survey by the Northern Yellowstone Cooperative Wildlife Working Group Report Prepared by: Karen Loveless, Montana Fish Wildlife
Marrett Grund, Farmland Wildlife Populations and Research Group
 Minnesota s Wild Turkey Harvest - 2013 Marrett Grund, Farmland Wildlife Populations and Research Group Minnesota offers fall and spring turkey hunting seasons. The fall turkey season was 30 days in length
STATE OF NEVADA Jim Gibbons, Governor
 NEVADA DEPARTMENT OF WILDLIFE 2008-2009 BIG GAME STATUS STATE OF NEVADA Jim Gibbons, Governor DEPARTMENT OF WILDLIFE Ken Mayer, Director GAME DIVISION Mark Atkinson, Chief Mike Cox, Big Game Staff Biologist
CARSON CITY ADVISORY BOARD TO MANAGE WILDLIFE PUBLIC NOTICE
 PUBLIC NOTICE The CARSON CITY ADVISORY BOARD TO MANAGE WILDLIFE will hold a public meeting at 5:30 p.m. on Monday, January 27, 2014, in the CITY HALL CAPITOL CONFERENCE ROOM, 201 NORTH CARSON STREET, CARSON
STATE OF NEVADA Jim Gibbons, Governor
 NEVADA DEPARTMENT OF WILDLIFE 2009 2010 BIG GAME STATUS STATE OF NEVADA Jim Gibbons, Governor DEPARTMENT OF WILDLIFE Ken Mayer, Director GAME DIVISION Larry Gilbertson, Chief Mike Cox, Big Game Staff
2018/2019 On-reservation Hunting Season Dates and Rules and Regulation. Hunt Date Summary. Mountain Lion Sept. 24 Nov.1 Aug.
 2018/2019 On-reservation Hunting Season Dates and Rules and Regulation Hunt Date Summary Pick-up Deer and Elk Aug. 13 Early Archery General Season Dates Aug.25 Sept.7 Sept.8 Dec.31 Upland Game Birds Aug.13
Job Title: Game Management, Subsection B Game Management Mountain Lion
 Job Title:, Subsection B Goal: Manage the mountain lion population, its numbers and distribution, as an important part of Arizona s fauna and to provide mountain lion hunting recreation opportunity while
HUNTING HARVEST STATISTICS. Division of Fish and Wildlife 500 Lafayette Road, Box 20 Saint Paul, MN (651)
") HUNTING HARVEST STATISTICS Division of Fish and Wildlife 5 Lafayette Road, Box Saint Paul, MN 5555 - (65) 59-57 9 INTRODUCTION 7 SMALL GAME HUNTER MAIL SURVEY Margaret Dexter, Wildlife Research Unit The
HUNTING HARVEST STATISTICS Division of Fish and Wildlife 5 Lafayette Road, Box Saint Paul, MN 5555 - (65) 59-57 9 INTRODUCTION 7 SMALL GAME HUNTER MAIL SURVEY Margaret Dexter, Wildlife Research Unit The
Nevada County Population Projections 2013 to 2032 Based On The Last Estimate Year of 2012
 Nevada County Population Projections 2013 to 2032 Based On The Last Estimate Year of 2012 Prepared By: The Nevada State Demographer s Office Jeff Hardcastle, AICP NV State Demographer University of NV
BIG GAME STATUS STATEWIDE SUMMARY
 BIG GAME STATUS STATEWIDE SUMMARY MULE DEER The 2013 total statewide mule deer tag quota of 22,656 was 6.5% lower than the 24,257 set in 2012. The decrease in quota and tag sales resulted in a total deer
FINAL REGULATIONS - CHAPTER W-3 - FURBEARERS and SMALL GAME, EXCEPT MIGRATORY BIRDS
 MAILING 03/01/2019 FINAL REGULATIONS - CHAPTER W-3 - FURBEARERS and SMALL GAME, EXCEPT MIGRATORY BIRDS ARTICLE I - GENERAL PROVISIONS #300 - Definitions A. "Canada Lynx Recovery Area" means the area of
Pershing County Advisory Board to Manage Wildlife
 Pershing County Advisory Board to Manage Wildlife Agenda Tuesday January 23, 2018 5:00 P.M. Pershing County Community Center 820 6 th Street Lovelock, NV 89419 Members: Ryan Collins, Randy Scilacci, Gary
Clark County Advisory Board to Manage Wildlife
 Clark County Advisory Board to Manage Wildlife MEETING MINUTES Date: June 20, 2017 Location: Clark County Government Center 500 S. Grand Central Parkway ODC-1 Las Vegas, NV 89155 Time: 5:30 pm Board Members
contents 2004 Big Game Statistics
 2004 Big Game Statistics Introduction How to use this information... 2 Setting regulations... 3 How the information is collected... 4 How the management system works... 5 Making your points work for you...
RESULTS OF THE TRAPPING SEASON
 Trapping Licenses RESULTS OF THE 2016-2017 TRAPPING SEASON The total number of trapping licenses sold dropped this year, which is likely in response to the overall slow fur market and low pelt prices.
FISH AND GAME PROTECTION ACT GENERAL REGULATIONS
 c t FISH AND GAME PROTECTION ACT GENERAL REGULATIONS PLEASE NOTE This document, prepared by the Legislative Counsel Office, is an office consolidation of this regulation, current to December 9, 2006. It
Outdoors NV Made Easy
 Outdoors NV Made Easy First question Why? Customer Service Deliver value Ease confusion Reduce mistakes Make it easier for our customers to engage What about the money? Revenue neutral Difficult to model
Introduced in August public meetings
 Second Reading Introduced in August 2015 10 public meetings November 2015 (95 public, 70 agency) August September 2016 (80 public) Public opinion survey of licensed hunters 2200 mailed, 786 returned, ±4%
TRAPPING HARVEST STATISTICS. Division of Fish and Wildlife 500 Lafayette Road, Box 20 Saint Paul, MN (651)
") TRAPPING HARVEST STATISTICS Division of Fish and Wildlife 500 Lafayette Road, Box 20 Saint Paul, MN 55155-4020 (651) 259-5207 265 266 2007 TRAPPER HARVEST SURVEY Margaret Dexter, Wildlife Research Unit
TRAPPING HARVEST STATISTICS Division of Fish and Wildlife 500 Lafayette Road, Box 20 Saint Paul, MN 55155-4020 (651) 259-5207 265 266 2007 TRAPPER HARVEST SURVEY Margaret Dexter, Wildlife Research Unit
NEW BRUNSWICK FURBEARER HARVEST REPORT
 NEW BRUNSWICK FURBEARER HARVEST REPORT 213-214 FISH AND WILDLIFE BRANCH NATURAL RESOURCES www.gnb.ca/naturalresources Last updated: September 11, 214 213-214 New Brunswick Furbearer Harvest Summary In
Job Title: Game Management, Subsection B Game Management Mountain Lion. SPECIES: Mountain Lion
 SPECIES: Goal: Manage the mountain lion population, its numbers and distribution, as an important part of Arizona s fauna and to provide mountain lion hunting recreation opportunity while maintaining existing
Hunting and Fishing Bag Limits and Seasons
 III Corps & FH Circular 210-13-22 Installations Hunting and Fishing Bag Limits and Seasons Headquarters III Corps and Fort Hood Fort Hood, Texas76544 4 SEPTEMBER 2013 UNCLASSIFIED SUMMARY of CHANGE III
NEW BRUNSWICK FURBEARER HARVEST REPORT FISH AND WILDLIFE BRANCH ENERGY AND RESOURCE DEVELOPMENT
 NEW BRUNSWICK FURBEARER HARVEST REPORT 216-217 FISH AND WILDLIFE BRANCH ENERGY AND RESOURCE DEVELOPMENT www.gnb.ca/erd/naturalresources Cover Photo by: Kevin Craig Photo de couverture: Kevin Craig 216-217
JULY 2017 SUMMARY BULLETS
 FY 2017 Predator Report Appendix Project 21-02 Comments To: From: NV Department of Wildlife, Bureau of Land Management U.S. Geological Survey, WERC Research Team Subject: March July 2017 Progress Update
Washoe County Advisory Board to Manage Wildlife
 Thursday ~ ~ 6:00 p.m. Nevada Department of Wildlife Conference Room B 1100 Valley Road, Reno, Nevada 1. PLEDGE OF ALLEGIANCE (Non-action item) MEMBERS Sean Shea, Chair Miles Humphreys, Jr., Vice-chair
GAME BIRD PROGRAM RECOMMENDATIONS FOR GAME BIRD SEASONS UPLAND GAME BIRDS AND WATERFOWL
 OREGON DEPARTMENT OF FISH AND WILDLIFE 3406 CHERRY AVE NE, SALEM, OR 97303 WILDLIFE DIVISION TELEPHONE: (503) 947-6301 GAME BIRD PROGRAM RECOMMENDATIONS FOR 2008-2009 GAME BIRD SEASONS UPLAND GAME BIRDS
Banded birds Hunters can report recovery of banded birds by calling BAND (2263).
.") Synopsis of federal regulations applicable to migratory bird hunting WEAPON - Migratory game birds may be taken only with a 10 gauge or smaller shotgun capable of holding not more than three shells. Birds
Synopsis of federal regulations applicable to migratory bird hunting WEAPON - Migratory game birds may be taken only with a 10 gauge or smaller shotgun capable of holding not more than three shells. Birds
TRAPPING HARVEST STATISTICS. Division of Fish and Wildlife 500 Lafayette Road, Box 20 Saint Paul, MN (651)
") TRAPPING HARVEST STATISTICS Division of Fish and Wildlife 500 Lafayette Road, Box 20 Saint Paul, MN 55155-4020 (651) 259-5207 289 290 2010 TRAPPER HARVEST SURVEY Margaret Dexter, Wildlife Research Unit
TRAPPING HARVEST STATISTICS Division of Fish and Wildlife 500 Lafayette Road, Box 20 Saint Paul, MN 55155-4020 (651) 259-5207 289 290 2010 TRAPPER HARVEST SURVEY Margaret Dexter, Wildlife Research Unit
Illinois Hunter Harvest Report
 HumanDimensions R e s e a r c h P r o g r a m 2012-2013 Illinois Hunter Harvest Report Illinois Natural History Survey Prairie Research Institute University of Illinois at Urbana-Champaign Federal Aid
2015 Forest Grouse Parts Collection Summary
 2015 Forest Grouse Parts Collection Summary Skyler retrieving a blue grouse in Lake County. Photo by Dave Budeau, ODFW. Upland Game Bird Program Oregon Department of Fish and Wildlife 4034 Fairview Industrial
Enclosed, please find the 2018 Spotlight Deer Survey Report and Recommendations that we have prepared for your review and records.
 July 26, 2018 YO Ranchlands Landowner Association 1323 Whispering Pines Houston, TX 77055 To the Wildlife Committee: Enclosed, please find the 2018 Spotlight Deer Survey Report and Recommendations that
2016 ANNUAL TRAFFIC REPORT
 2016 ANNUAL TRAFFIC REPORT Published by Traffic Information Division NEVADA DEPARTMENT OF TRANSPORTATION www.nevadadot.com Brian Sandoval, Governor Rudy Malfabon, P.E., Director The Annual Traffic Report
FOX AND COYOTE TRAPPING SURVEY
 DNR MICHIG AN EDEPARTMENT OF NATURAL R SOURCES MICHIGAN DEPARTMENT OF NATURAL RESOURCES Wildlife Division Report No. 3430 February 2005 Printed by Authority of: P.A. 451 of 1994 Total Number of Copies
2016 Game Bird Hunting Statistics
 216 Game Bird Hunting Statistics Game Bird Program Oregon Department of Fish and Wildlife 434 Fairview Industrial Dr SE Salem, OR 9732 All photos are courtesy of Keith Kohl, ODFW Table of Contents OREGON
Hunter and Angler Expenditures, Characteristics, and Economic Effects, North Dakota,
 Agribusiness and Applied Economics Report No. 507-S January 2003 Hunter and Angler Expenditures, Characteristics, and Economic Effects, North Dakota, 2001-2002 Dean A. Bangsund and F. Larry Leistritz*
Spring 2012 Wild Turkey Harvest Report
 Spring 2012 Wild Turkey Harvest Report Eric Walberg and Marrett Grund Farmland Wildlife Populations and Research Group Minnesota Department of Natural Resources Madelia, Minnesota July 26, 2012 In Minnesota,
June 23, 2017 Wildlife Heritage Committee Meeting Nevada Board of Wildlife Commissioners Nevada Department of Wildlife
 June 23, 2017 Wildlife Heritage Committee Meeting Nevada Board of Wildlife Commissioners Nevada Department of Wildlife Meeting Location: Clark County Government Center Commission Chambers 500 S. Grand
Department of Natural Resources
 Department of Natural Resources Chapters: Adopted Expedited Emergency Game and Fish Rules: 6230 6234 WILDLIFE MANAGEMENT AREAS; GAME REFUGES; 6240 RUFFED AND SPRUCE GROUSE SEASON; PHEASANT SEASON; GRAY
OREGON DEPARTMENT OF FISH AND WILDLIFE SUMMARY OF COUGAR MANAGEMENT IN NEIGHBORING STATES
 OREGON DEPARTMENT OF FISH AND WILDLIFE SUMMARY OF COUGAR MANAGEMENT The department recently examined the hunting season framework, population monitoring, and damage/public safety response policies (including
PROPOSED REGULATION OF THE BOARD OF WILDLIFE COMMISSIONERS. LCB File No. R May 6, 2002
 PROPOSED REGULATION OF THE BOARD OF WILDLIFE COMMISSIONERS LCB File No. R054-02 May 6, 2002 EXPLANATION Matter in italics is new; matter in brackets [omitted material] is material to be omitted. AUTHORITY:
Job Title: Game Management, Subsection B Game Management Mountain Lion. SPECIES: Mountain Lion
 SPECIES: Goal: Manage the mountain lion population, its numbers and distribution, as an important part of Arizona s fauna and to provide mountain lion hunting recreation opportunity while maintaining existing
Dove and Band-tailed Pigeon
 Arizona Dove and Band-tailed Pigeon Regulations 2009-2010 Synopsis of Federal Regulations Applicable to Migratory Bird Hunting Federal regulations regarding bird hunting are described in the Code of Federal
Nevada Department of Wildlife
 Nevada Department of Wildlife 2010-2011 Big Game Status STATE OF NEVADA Brian Sandoval, Governor DEPARTMENT OF WILDLIFE Ken Mayer, Director GAME DIVISION Larry Gilbertson, Chief Mike Cox, Big Game Staff
Nevada Department of Wildlife Predator Management Plan Fiscal Year 2018
 Nevada Department of Wildlife Predator Management Plan Fiscal Year 2018 Summary on Plans and Reports Just reported on FY 2016 Currently in FY 2017 About to present on FY 2018 All available at www.ndow.org
contents 2009 Big Game Statistics
 2009 Big Game Statistics Introduction How to use this information... 2 Setting regulations... 3 How the information is collected... 4 How the management system works... 5 Making your points work for you...
Department of Natural Resources. Adopted Expedited Emergency Game and Fish Rules: WATERFOWL SEASON 6240
 Department of Natural Resources Chapters: Adopted Expedited Emergency Game and Fish Rules: 6230 6234 2018 WATERFOWL SEASON 6240 PUBLISHED 05-07-2018 EFFECTIVE 05-07-2018 EXPIRES 01-30-2019 Please see the
TRAPPING HARVEST STATISTICS. Division of Fish and Wildlife 500 Lafayette Road, Box 20 Saint Paul, MN (651)
") TRAPPING HARVEST STATISTICS Division of Fish and Wildlife 500 Lafayette Road, Box 20 Saint Paul, MN 55155-4020 (651) 259-5207 285 286 INTRODUCTION 2015 TRAPPER HARVEST SURVEY Margaret Dexter, Wildlife
TRAPPING HARVEST STATISTICS Division of Fish and Wildlife 500 Lafayette Road, Box 20 Saint Paul, MN 55155-4020 (651) 259-5207 285 286 INTRODUCTION 2015 TRAPPER HARVEST SURVEY Margaret Dexter, Wildlife
DMU 005 Antrim County Deer Management Unit
 DMU 005 Antrim County Deer Management Unit Area Description Antrim County Deer Management Unit is in the Northern Lower Peninsula Region (NLP). It has roughly 74 square miles (47,451 acres) of public land
Michael Turnipseed Bob Pohlman Wes Emery Bob Cook. Lorraine Diedrichsen, Recording Secretary
 DOUGLAS COUNTY ADVISORY BOARD TO MANAGE WILDLIFE Minutes of the March 18, 2014 Meeting The DOUGLAS COUNTY ADVISORY BOARD TO MANAGE WILDLIFE was scheduled for 5:30 p.m. on TUESDAY, MARCH 18, 2014 in the
Elko County Wildlife Advisory Board 571 Idaho Street, Room 105, Elko, Nevada Phone Fax
 Elko County Wildlife Advisory Board 571 Idaho Street, Room 105, Elko, Nevada 89801 775-738-5398 Phone 775-753-8535 Fax www.elkocountynv.net PUBLIC MEETING NOTICE The Elko County Wildlife Advisory Board,
SPOTLIGHT DEER SURVEY YO RANCHLANDS LANDOWNERS ASSOCIATION ±10,400 ACRES KERR COUNTY
 SPOTLIGHT DEER SURVEY YO RANCHLANDS LANDOWNERS ASSOCIATION ±10,400 ACRES KERR COUNTY WRITTEN BY: SHANE KIEFER, CWB SARAH KAHLICH, AWB PLATEAU LAND & WILDLIFE MANAGEMENT AUGUST 1, 2016 EXECUTIVE SUMMARY
CHAPTER 11. Article 1 Hunting Regulations, General 2 Special Either-Sex Deer Hunting Regulations. Article 1 General Hunting Regulations
 CHAPTER 11 HUNTING REGULATIONS Article 1 Hunting Regulations, General 2 Special Either-Sex Deer Hunting Regulations Article 1 General Hunting Regulations 11101. Legal Shooting Time. 11102. Hunting License
REVISED PROPOSED REGULATION OF THE BOARD OF WILDLIFE COMMISSIONERS. LCB File No. R July 18, 2018
 REVISED PROPOSED REGULATION OF THE BOARD OF WILDLIFE COMMISSIONERS LCB File No. R151-18 July 18, 2018 EXPLANATION Matter in italics is new; matter in brackets [omitted material] is material to be omitted.
2009 BIG GAME AND FURBEARER HARVEST RECORD FOR THE FOND DU LAC RESERVATION AND CEDED TERRITORIES
 2009 BIG GAME AND FURBEARER HARVEST RECORD FOR THE FOND DU LAC RESERVATION AND CEDED TERRITORIES Mike Schrage Wildlife Biologist Fond du Lac Resource Management Division 1720 Big Lake Rd. Cloquet, MN 55720
2010 BIG GAME AND FURBEARER HARVEST RECORD FOR THE FOND DU LAC RESERVATION AND CEDED TERRITORIES
 2010 BIG GAME AND FURBEARER HARVEST RECORD FOR THE FOND DU LAC RESERVATION AND CEDED TERRITORIES Mike Schrage Wildlife Biologist Fond du Lac Resource Management Division 1720 Big Lake Rd. Cloquet, MN 55720
2007 BIG GAME AND FURBEARER HARVEST RECORD FOR THE FOND DU LAC RESERVATION AND CEDED TERRITORIES
 2007 BIG GAME AND FURBEARER HARVEST RECORD FOR THE FOND DU LAC RESERVATION AND CEDED TERRITORIES Mike Schrage Wildlife Biologist Fond du Lac Resource Management Division 1720 Big Lake Rd. Cloquet, MN 55720