SCIENCE & RESEARCH INTERNAL REPORT NO.132 MONITORING POSSUM NUMBERS FOLLOWING 1080 POISON CONTROL AT MAPARA RESERVE. Theo Stephens
|
|
|
- Dayna Watts
- 5 years ago
- Views:
Transcription
1 SCIENCE & RESEARCH INTERNAL REPORT NO.132 MONITORING POSSUM NUMBERS FOLLOWING 1080 POISON CONTROL AT MAPARA RESERVE by Theo Stephens This is an internal Department of Conservation report and must be cited as Science and Research Internal Report No.132. Permission to use any of its contents must be obtained from the Director (Science & Research), Head Office, Department of Conservation. Published by Head Office, Department of Conservation, P O Box , Wellington New Zealand
2 ISSN ISBN November 1992, Department of Conservation Keywords: Possum, Trichosurus vulpecula, control, monitoring, Mapara Reserve, 1080 poison, sodium monofluoroacetate, kokako
3 CONTENTS ABSTRACT 1 1. INTRODUCTION Study area History of possum control at Mapara 2 2. MEASURES OF POSSUM ABUNDANCE Spotlight counts Bait interference Pellet counts Trapping methods 3 3. METHODS 5 4. RESULTS Spatial variation in possum abundance Variation in catchability Demography Effects of 1080 application 8 5. DISCUSSION Variation in effects of 1080 application Pitfalls in the catch per unit effort as an index of abundance Pitfalls in the removal method as an index of abundance Possum monitoring methods for kokako study areas CONCLUSIONS ACKNOWLEDGEMENTS REFERENCES 12 APPENDIX 1 13 Trap catch data: August 1990 pre-poison trapping 13 Trap catch data: October 1990 post-poison trapping 14 Trap catch data: August 1991 pre-poison trapping 15 Trap catch data: November 1991 post-poison trapping 16 APPENDIX 2 17 Calculations 17
4
5 MONITORING POSSUM NUMBERS FOLLOWING 1080 POISON CONTROL AT MAPARA RESERVE by Theo Stevens Conservancy Advisory Scientist, Waikato Conservancy, Department of Conservation, Private Bag 3072, Hamilton, New Zealand ABSTRACT 1080 poisoned baits (Wanganui No. 7) were aerially spread throughout the three blocks of Mapara reserve in September 1990 and again in October 1991 to control possums. Changes in possum abundance were monitored by trapping, using a modified version of Seber's "removal method". A trapping method was chosen in preference to spotlight counts, bait take and pellet counts because a suitable control area, critical to these methods, was not available; traps were already in place on permanent sets; and trapping contributes to the control objective. The removal index was considered more suitable for monitoring than the simpler catch per unit effort index (number of possums caught per 3 trap-nights) because the latter is affected by variation in possum catchability, as well as possum abundance. The removal method depends on obtaining declining catches on successive nights. There is a significant risk that the method will not give a meaningful result if trapping intensity is inadequate or if nightly variation in catchability is excessive. The catch per unit effort index is still available if an abundance index based on the removal method is unobtainable. The 1990 poison operation reduced possum numbers to 21% of pre-poison abundance (95% Confidence Limits (CL) were 13.8% and 28.2%). During the following year, possum numbers built up to 39.5% (95% CL 28.7% and 50.3%) of pre-poison abundance and 1991 poison operation caused a non-significant reduction to 32.2% (95% CL 21.8% and 42.6%). Thus the September 1991 operation probably did not reduce possum densities to the level attained in October The reason for the poor kill following the 1991 poison drop is unknown, although several possibilities are identified. 1. INTRODUCTION 1.1 Study area The Mapara Wildlife Management Reserve is one study area in an experimental programme designed to test the hypothesis that 'maximum practicable introduced mammal browser and predator control will (in the short term) increase kokako (Callaeas cinerea) chick output and (in the longer term) population density' (Innes 1992). At 1
6 Mapara, most mammals (possums, rats, mustelids, cats and ungulates) are intensively controlled. The aerial 1080 applications were for possum (Trichosurus vulpecula) control (Innes and Williams 1991). Incidental 1080 by-kill probably temporarily reduces ship rat (Rattus rattus), mice, and possibly hedgehogs. This report has two objectives. First, to describe the effect of two 1080 poison control operations on possum abundance and second, to comment on possum monitoring methods considered as options for other kokako study areas. The Mapara possum control programme is unusual in that operations have been maintained annually for four years, and aerial 1080 applications have been repeated in consecutive winters. The effect on possum populations of repeated 1080 application has not been described. 1.2 History of possum control at Mapara Commercial trappers had hunted Mapara reserve on an ad hoc basis until Possum control operations have taken place in one or more of the three blocks (North, Central and South) of the Mapara Reserve every year since 1988, starting with a contracted team of commercial trappers (all blocks, winter 1988), trapping by DOC staff (Central Block, summer 1989), aerial 1080 application (all blocks) in 1990, again in 1991 and a third application is planned for In September 1990 and October 1991, 1080 Wanganui No.7 poisoned baits (green dyed, cinnamon lured cereal pellets) were aerially spread throughout the three blocks of Mapara Reserve and some adjoining private bush (total area 1700 ha) at a nominal density of 8.0 kg.ha -1. Rat control with Talon 50WB (1988 and 1989 only) in several kokako territories and possum by-catch on the stoat line also contributed to a reduction in possum numbers. In 1988, prior to the control operation by contract trappers, possum density was thought to be about 4 possums.ha -1 (Kelton 1989). The contract trappers removed 2.2 possums.ha -1 over the three blocks and the 1989 DOC operation removed a further 2.1 possums.ha -1 from the Central Block. Possum density in August 1990, before the first 1080 drop, was therefore quite low, probably about 2 possums.ha -1 in the North and South blocks and probably less than 1 possums.ha -1 in the Central Block. 2. MEASURES OF POSSUM ABUNDANCE Methods available for monitoring possum abundance include spotlight counts, bait interference, trapping and pellet count indices. There are a number of design options possible within each of these methods to suit different situations. A non-destructive method which does not affect possum numbers would be most appropriate for the kokako study because the programme includes areas where possums are not controlled. Ideally, the same monitoring method should be used in all study areas so that possum ahundances can he compared in different areas. 2.1 Spotlight counts Spotlight counts were rejected as being unsuitable for forested areas and logistically difficult. This method would indicate possum abundance on reserve margins but not 2
7 within the forest. Seasonal variation in possum activity and movement patterns as well as nightly variability in possum activity due to weather and other unknown factors is likely to be considerable. Thus repeated counts would be required. If pre-and poison counts are likely to he more than a week or two apart, then simultaneous observations at one or more control blocks would also he required. This method was rejected, being too demanding logistically and unsuitable for forested areas. 2.2 Bait interference Bait interference methods were rejected because: 1. The cost of acquisition and placement could not he justified when about 900 traps were already in position on permanent sets. 2. There was no suitable control block to correct for any natural changes (perhaps associated with weather, phase of the moon, availability of another food source etc). Mangapehi forest was also to receive 1080 application in 1990 for control of bovine tuberculosis. 3. The relationship between between bait take and possum abundance has yet to be established. A bait take method could be appropriate for all kokako study areas where possums are not controlled because it does not alter possum numbers. 2.3 Pellet counts Pellet counts were used to measure the impact of the 1988 trapping operation. However, this method could not he continued because the control, Mangapehi Forest, was to be the target of possum control. Other possible control blocks in Pureora Forest were also either receiving, or likely to receive, possum control for bovine TB reasons. A control block is essential for pellet count methods because defecation rates and pellet decay rates are known to fluctuate naturally, depending on weather and seasonal food resources. Without a control block, change in population numbers cannot be inferred from change in pellet densities. The change in pellet densities may be due to changes in food and/or weather affecting pellet production and/or changes in decay rates. Additional control blocks and replicate treatment blocks are needed to formally implicate the poison drop as the cause of change in population numbers. A potential problem with the pellet count method is that a high proportion of plots yield zero pellet counts when possum densities are low and consequently the precision of the index will he low in relation to the effort required to obtain it. This could mean that the impact of a control operation on a low density population, such as at Mapara, may not be measurable. 2.4 Trapping methods There were two points in favour of adopting a trapping procedure for monitoring possum abundance at Mapara. 3
8 1. Trapping contributes to the control objective. However this would be inappropriate in other kokako study areas where possum abundance should be monitored and not controlled. 2. Traps on sets were already in place in the southern and central blocks of Mapara Reserve having been used in earlier control operations (1988, 1989). Given the absence of commitment to any particular possum monitoring method for all kokako study areas, use of existing equipment and infrastructure for monitoring seemed the most cost efficient option. However, trapping is not an ideal monitoring system in study areas where possum numbers are to be monitored but not controlled, because the monitoring method alters possum numbers. Furthermore, getting the permanent sets in place is laborious and logistically demanding. Two monitoring methods based on trapping were considered: a simple catch per unit effort rate index (number of possums caught per 3 trap-nights) and the more demanding 'removal' method described by Seber (1973) and modified by Hickling (1989). The key advantage of the removal method is that between survey variation in catchability is accounted for in calculation of the index. This means that, firstly, kill rates can be estimated directly from the index and, secondly, controls are not required to correct for variation in behaviour. The assumptions on which the method depends are: 1. The population is closed. That is, loss from and gain to the population are negligible during the survey. 2. Probability of capture (P) is the same for each possum exposed to capture. 3. P remains constant over the nights within each survey. Immigration and emigration from the reserve during the survey is probably of no significance during the three or four survey nights. Mapara P was probably not the same for all possums exposed to capture because there was geographic variation in past trapping activities. This variation will reduce precision unless a stratified sampling procedure is possible. Two sources of within survey variation in P should be considered. Firstly, P may decline during a prolonged survey because remaining possums may he more trap shy than those caught on the first few nights. If the survey extends over more than about five nights, P should be estimated between nights so that any change over the survey can be accounted for. Secondly, weather and other factors (e.g. mating, seasonal food resources) which influence possum activity will also affect P. Weather related variation in P is best minimised by trapping only on fine nights and other variation reduced by completing the survey as rapidly as weather conditions will allow. 4
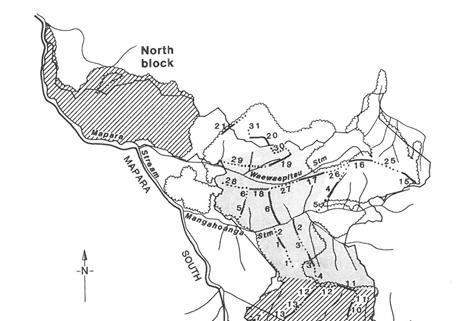
9 3. METHODS The 'removal' index of possum abundance was estimated four times, before and after each of the two poison operations. This method uses trap catches on three fine nights to calculate a measure of possum abundance. Absolute abundance (numbers per unit land area) cannot be estimated because the size of the area sampled by traps is unknown. It is therefore necessary to relate abundance to trapping effort, so that the measure is an index of abundance. The unit of effort chosen is arbitrary. In this study the unit is trappable possums per trap. A mixture of Lanes Ace and Victor leghold traps were located on permanent sets, on a "best set" basis, along routes, mainly ridges, between points of access to the south and central blocks of the reserve (Figure 1). The traps were numbered and divided into consecutive lines of ten. Alternate lines were set on the pre-and post-poison surveys to minimise effects of reduced possum numbers caused by trapping, as distinct from the poison operation. The number of the trap in which a possum was caught as well as the sex and maturity (adult or juvenile) of the catch were recorded. Traps set off or catching animals other than possums were also recorded. Since the sample unit for this method is a line of traps, not an individual trap, the number of traps per line was held at ten to the number of samples and the precision of the result. The total nightly catch (Appendix 1) was used to estimate P (as in Appendix 2) and the abundance index (N i /trap) was calculated for each line (Appendix 1). The mean and variance of these samples were used to estimate survival and associated 95% confidence intervals. For comparison, a catch per unit effort index (number of possums caught per line over three nights) was also calculated. Rain on the second night of the first pre-poisoning survey reduced trapping efficiency by about 65%. Trap data for this night (Appendix 1, data in brackets) were not used in the analysis and trapping was continued for a fourth night, to provide data for three fine nights. All other surveys were completed on three fine nights. 4. RESULTS 4.1 Spatial variation in possum abundance There was significant variation in catches associated with previous trapping history (Table 1). Lines in the central block, which had been hunted by contract trappers in 1988 and intensively trapped by DOC staff in 1989, produced fewer possums (mean = 1.90) than the South Block (mean = 3.90; Student's t-test: p < 0.05), which was hunted only by contract trappers in Probability of capture (P) was lower in the Central Block (0.134) than in the South Block (0.277; p < 0.05) but the abundance indices (60.0 and 66.1 respectively) were similar (P > 0.05). Thus the difference in catches was probably more a consequence of variation in possum catchability, presumably associated with different previous trapping experience, than possum abundance. 5
10 6

11 Lines located in the South Block where some incidental possum control had taken place in association with rat control efforts, caught similar numbers of possums (p 0.05) as other South Block lines. On two occasions, successive catches did not decline on the few lines located in these areas and so it was not possible to estimate P and the abundance index. 4.2 Variation in catchability For all areas combined, P increased from 0.17 in August 1990 to 0.26 after the first 1080 drop, remained at a similar level (0.29) in August 1991 but increased to 0.44 in October after the second 1080 application. The total variation (temporal and spatial) was even greater, ranging from 0.13 in the intensively trapped area (August 1990) to 0.74 in areas covered only by contract trappers (October 1991). This many-fold variation in between areas over the period monitored, illustrates why the catch per unit effort indices, such as the trap-catch rate, are potentially misleading as indices of possum abundance. Catch per unit effort indices will tend to overestimate possum abundance in low density areas and will result in underestimation of kill following a control operation. 4.3 Demography The possum catch was on all occasions dominated by adults, particularly adult males (Table 2). The scarcity of juveniles suggests that leghold traps may preferentially catch adult possums, causing juveniles to be under-represented in the catch. The increase in numbers between October 1990 and August 1991 was almost entirely of adults. Thus the increase seems to have been a result of immigration mature and maturing possums from surrounding areas with little, if any, contribution from-breeding within the Mapara Reserve. 7
12 4.4 Effects of 1080 application The pre-poisoning survey indicated a mean (±95% confidence limits) of ± trappable possums per trap (Figure 2). This estimate is biased low because the kills which occurred on the wet night could not be taken into account. The post-poisoning survey gave a mean of ± trappable possums per trap. The September 1990 poison drop reduced the index to 21.0% of the pre-poisoning level with a possible range (95% confidence limits) from 13.8% to 28.2%. This kill estimate is also biased low by the kills which occurred on the rainy night during the pre-poison trapping. The magnitude of the bias is probably in the range of 5 to 10%. Thus it is reasonable to conclude that the 1080 poison drop at Mapara reserve in September 1990 killed 80 to 85% of the possums. Between October 1990 and August 1991 the index increased to 39.4% of the August 1990 (pre-poison) level, within a possible range of 28.7% to 50.3%. After the 1991 control operation, there was a small (and statistically non-significant) reduction to 32.2% of the August 1990 index, within a possible range of 21.8% to 42.6%. Thus the poison control operation probably did not reduce possum densities to the level attained after the1990 operation. At best, most of the annual increment (immigration plus reproduction) may have been destroyed by the control operation. 5. DISCUSSION 5.1 Variation in effects of 1080 application The 1990 poison drop caused a major reduction in the possum population whereas the 1991 operation had no significant impact. There were a number of factors which differed between the two operations: 1. The 1990 possum population had no previous experience with 1080, whereas those remaining in 1991 were probably experienced and therefore potentially bait shy; 2. The population was much smaller in 1991, so that there may have been relatively more highly preferred foods available and consequently, there may have been less incentive to take the baits; 8
13 3. There was an extended period of fine weather (8 dry days and little rain for 14 days) following the 1990 drop whereas there were only four fine nights following the 1991 operation. 4. Although the baits were stored in cool dry conditions, showed no physical sign of deterioration and actual toxic loading was within specifications (assays indicated 0.071% sodium monofluoroacetate), they were several weeks older for the 1991 operation. Thus, while there are a number of possible reasons for the poor kill following the 1991 operation, there is no basis to ascribe any particular cause to this failure. It would be interesting to know whether maintenance operations for TB control also have little effect on possum populations. Unfortunately, control maintenance operations in the Central North Island do not include rigorous monitoring of effects on possum populations, so the effect of control maintenance operations is unknown. The continued spread of bovine tuberculosis in domestic cattle (e.g., 11 new TB positive herds near Ngaroma in May 1992), despite full implementation of the control maintenance programme, should raise questions about the effectiveness of control maintenance and the need to establish the impact of these operations on possum populations. 5.2 Pitfalls in the catch per unit effort as an index of abundance The index obtained from the removal method, in contrast to catch per unit effort indices, takes variation in catchability into account. It is therefore not as sensitive to factors other than possum abundance. Furthermore, estimation of the percentage kill via the removal method does not require the unrealistic assumption that an individual's catchability remains constant between surveys despite variation in possum abundance. In fact, catchability usually increases as density declines (Batcheler et al. 1967; Frampton pers. comm.). There are two reasons for this: (1) at high densities, another possum is more likely to get caught first, 9
14 rendering the trap inactive, and (2) possums are thought to range further when their population density is low and so would be more likely to encounter a trap. Thus catch per unit effort is not usually proportional to possum density and this confounds estimation of survival following a control operation or comparison of possum abundances in different areas. For example, one cannot assume that a 70% kill was achieved because the catch fell from 10 to 3 possums per 100 trap-nights. 5.3 Pitfalls in the removal method as an index of abundance Successful use of the removal method depends on obtaining declining catches on successive nights. Variation in the number caught on successive nights caused by removal must exceed nightly variation in catchability associated with factors unrelated to abundance. Trapping fine nights helps to reduce this night-to-night variation, but there are likely to be other, less understood sources of variation in catchability (e.g. phase of moon; temperature; cloud cover; wind). Thus the trapping effort must be sufficient to bring about a significant reduction in the number of possums present in the area trapped, otherwise a useful abundance index will be unobtainable. Frampton (pers. comm.) suggests that a 50% reduction after three nights is required. The problem arises when densities are low (e.g. Table 1) and also when possum densities are high (e.g. Speed 1992). Increasing trapping effort by using more traps, or by trapping more nights, will improve the likelihood of obtaining a useful abundance index. Increasing the number of nights trapped will reduce the variance in population estimates more efficiently than increasing the number of traps. A clear decline in captures may not be apparent after very successful control operations. Increasing trapping effort may not solve this problem if captures are random encounters with survivors and immigrants. When possum density is high, large numbers of traps will be required to cause a population reduction from which this abundance index can be calculated. For example, if possum density is quite high, at 20 ha -1, about 12 ha -1 will have to be caught over the three nights to obtain a 95% confidence that is less than about 30% of the If about one third of the traps catch a possum, then at least 12 traps.ha -1 will be needed to obtain a useful abundance index estimate. Clearly, it is not logistically feasible to cover even a moderate sized forest area with this density of traps. However, at Mapara, possum densities were probably less than 2 ha -1 before the first 1080 drop and probably less than 0.5 ha -1 thereafter. Consequently the 300 traps spread over approximately 600 ha provided sufficient trapping effort to achieve the requisite 50% reduction over three nights on all occasions following the first 1080 operation. The need to bring about a significant reduction in the number of possums present in the area trapped and the need for adequate coverage of the area to be monitored are competing objectives. There is a serious risk of spreading the traps to get good coverage of the area but at insufficient density to cause a significant reduction. If this happens, a useful abundance index will not be obtained, but a trap-catch index will be available. One way to resolve these competing objectives would be to trap a few areas of the block to be monitored, each area being a sample of the block. Within each area the trap lines could 10
15 be run out from a central point, like spokes on a wheel. Either alternate lines or separate groups of traps along the same line could be used for pre and post-poison monitoring. Trapping should continue until a 50% or greater reduction is obtained. Calculations for estimating N, P and their variances when more than three nights are trapped are given by Blower et al. (1981). 5.4 Possum monitoring methods for kokako study areas A single monitoring method for all kokako study areas is desirable so that possum abundance can be compared between areas. Any trapping method is not ideal in treatment areas where the study design requires that possum numbers are monitored but not altered. A non-destructive method such as pellet counts, bait take or spotlight counts is appropriate. Spotlight counts are unsuitable for fully forested areas typical of kokako habitats. Pellet counts can give imprecise results when possum densities are low, so that the effect of control operations may be immeasurable. Increasing the number of plots counted will reduce the problem. All three methods require a control and, as with Mapara, a suitable control may not be available, particularly for the full term of the kokako study. 6. CONCLUSIONS 1. The density of possums at Mapara was low before the poison operation. 2. The 1990 poison application caused a major reduction in the possum population but the 1991 application had little effect. 3. The increase in numbers after October 1990 was primarily from immigration, not reproduction. 4. Use of the trap-catch rate as an index of possum abundance is potentially misleading because of significant but unknown variation in catchability. 5. Use of the removal method for monitoring is logistically demanding and there is a real risk that the method will fail if trapping intensity is inadequate or if insufficient nights are trapped. However, the data can always be used to calculate the trap-catch rate which, whilst potentially misleading, may be adequate for some purposes as an index of possum abundance. 6. There is no possum monitoring method available for use in all kokako study areas to allow unbiased comparison of possum abundance over time and between study areas. Given the problem with maintaining control blocks, a monitoring programme based on trapping sample areas and applied in a standard manner is the most appropriate approach. 11
16 7. ACKNOWLEDGEMENTS Special thanks go to Doug Taucher who pulled together the team who got the traps and sets in place, organised the 1080 poison drops, did the pre- and post-poison trapping and collated the data for me to write up. Elaine Murphy, Keith Broome, John Innes and Chris Frampton provided constructive comments on the manuscript. Chris was particularly helpful with advice on statistics and discussion about monitoring methods and his input substantially improved the quality of this report. 8. REFERENCES Batcheler, C L, Darwin, H, and Pracy, L T Estimation of opossum (Trichosurus vulpecula) populations and results of poison trials from trapping data. New Zealand of Science 10(1): Blower, G J, Cook, L M, and Bishop, J A Estimating the size of animal populations. Allen & Unwin, London. 128 pp. Hickling, G J An index of possum numbers from large-scale survey trapping. Unpublished report, Forest Research Institute, PO Box , Christchurch. Innes, J G N.I. Kokako research for 1992/93 - an outline. Unpublished report to the Kokako Recovery Group, Department of Conservation, Wellington. Innes, J G and Williams, D The impact of aerial 1080 poisoning on ship-rat populations at Mapara and Kaharoa. FRI contract report for Department of Conservation, Wellington. Kelton, S The possum control salvage operation summer Unpublished report, Waikato Region, Department of Conservation. Seber, G A F The estimation of animal abundance and related parameters. Charles Griffin, London. 506pp. Speed H Quarterly report (January - March 1992) to Tasman Forestry Ltd. Research by Management programme at Kaharoa Forest. Unpublished report #9. 12
17 13
18 14
19 15
20 16
21 17
22 18
Possum monitoring using raised leg-hold traps
 Possum monitoring using raised leg-hold traps RESEARCH INVESTIGATION NO: 3253 KEY OUTPUT: 4.2 Malcolm. D. Thomas 1 and Jennifer. A. Brown 2 1 PO Box 7223, Christchurch New Zealand Email info@pcr.co.nz
OREGON DEPARTMENT OF FISH AND WILDLIFE SUMMARY OF COUGAR POPULATION MODEL AND EFFECTS OF LETHAL CONTROL
 OREGON DEPARTMENT OF FISH AND WILDLIFE SUMMARY OF COUGAR POPULATION MODEL ODFW is authorized to reduce human-cougar conflict, livestock depredation, and benefit native ungulate populations through the
NOTIFICATION OF IMPENDING COMMENCEMENT OF KARNBACH POERUA POSSUM CONTROL OPERATION Vector Free Marlborough Limited (VFML) has been engaged by TBfree
 has been engaged by TBfree") NOTIFICATION OF IMPENDING COMMENCEMENT OF KARNBACH POERUA POSSUM CONTROL OPERATION Vector Free Marlborough Limited (VFML) has been engaged by TBfree New Zealand to carry out an aerial possum control operation
NOTIFICATION OF IMPENDING COMMENCEMENT OF KARNBACH POERUA POSSUM CONTROL OPERATION Vector Free Marlborough Limited (VFML) has been engaged by TBfree New Zealand to carry out an aerial possum control operation
Pest animal control. Guiding principles for community groups and landowners
 Pest animal control Guiding principles for community groups and landowners Guiding principles for pest animal control When starting a pest animal control project, there are five key principles that will
UMUKARIKARI AERIAL BOVINE TB CONTROL OPERATION
 UMUKARIKARI AERIAL BOVINE TB CONTROL OPERATION The Umukarikari aerial pest control operation is planned for spring 2017, weather dependant. This operation will cover approximately 12,000 hectares and is
MOLESWORTH BOVINE TB CONTROL OPERATION (YEAR 1)
") MOLESWORTH BOVINE TB CONTROL OPERATION (YEAR 1) OSPRI S TBFREE PROGRAMME The TBfree programme aims to control and eventually eradicate bovine tuberculosis (TB) from New Zealand s farmed cattle and deer
MOLESWORTH BOVINE TB CONTROL OPERATION (YEAR 1) OSPRI S TBFREE PROGRAMME The TBfree programme aims to control and eventually eradicate bovine tuberculosis (TB) from New Zealand s farmed cattle and deer
PROJECT AORANGI HAUMANU KIA HAUMAKO PEST CONTROL PROGRAMME
 PROJECT AORANGI HAUMANU KIA HAUMAKO PEST CONTROL PROGRAMME OSPRI, the Department of Conservation (DOC), Aorangi Recreational Hunters (ARH) Group and the Aorangi Restoration Trust (ART) are teaming up again
Project No: R Visual Lures for Possums. Malcolm Thomas and Fraser Maddigan. Pest Control Research Ltd PO Box 7223 Christchurch New Zealand
 Project No: R-80622 Visual Lures for Possums Malcolm Thomas and Fraser Maddigan Ltd PO Box 7223 Christchurch New Zealand Contract Report: 2004/5 PREPARED FOR: Animal Health Board PO Box 3412, Wellington
Summary of discussion
 Tweedsmuir Caribou Modelling Project: Caribou Population Ecology Meeting Notes held March 5, 2008 Participants: Mark Williams, Debbie Cichowski, Don Morgan, Doug Steventon, Dave Daust Purpose: The purpose
Population Parameters and Their Estimation. Uses of Survey Results. Population Terms. Why Estimate Population Parameters? Population Estimation Terms
 Population Parameters and Their Estimation Data should be collected with a clear purpose in mind. Not only a clear purpose, but a clear idea as to the precise way in which they will be analysed so as to
Application of a New Method for Monitoring Lake Trout Abundance in Yukon: Summer Profundal Index Netting (SPIN)
") Application of a New Method for Monitoring Lake Trout Abundance in Yukon: Summer Profundal Index Netting (SPIN) Prepared by: Lars Jessup Nathan Millar November 2011 Application of a New Method for Monitoring
Application of a New Method for Monitoring Lake Trout Abundance in Yukon: Summer Profundal Index Netting (SPIN) Prepared by: Lars Jessup Nathan Millar November 2011 Application of a New Method for Monitoring
Evaluation of the effectiveness of the Waddington backcracker trap for killing stoats
 Evaluation of the effectiveness of the Waddington backcracker trap for killing stoats DOC SCIENCE INTERNAL SERIES 132 N. Poutu and B. Warburton Published by Department of Conservation PO Box 10-420 Wellington,
D. Clifton-Dey M. Walsingham January 1995.
 REPORT ON THE ANALYSIS OF SALMON SCALE SAMPLES RETURNED BY AMGLERS ON THE RIVERS RJBBLE AND HODDER. NRA/NW/FTR/95/ D. CliftonDey M. Walsingham January 995. CONTENTS Page Summary Introduction 2 Methods
IMPROVING POPULATION MANAGEMENT AND HARVEST QUOTAS OF MOOSE IN RUSSIA
 IMPROVING POPULATION MANAGEMENT AND HARVEST QUOTAS OF MOOSE IN RUSSIA Vladimir M. Glushkov Research Institute of Game Management and Fur Farming, Kirov, Russia. ABSTRACT: Annual harvest quotas for moose
Predator R E S P O N S E
 Predator RESPONSE THE PROBLEM 25 million native birds are killed by predators like possums, stoats and rats each year 1 Heavy seeding of trees in our native forests will again this year drive higher than
The effect of recreational hunters on deer populations in Pureora Conservation Park
 The effect of recreational hunters on deer populations in Pureora Conservation Park SCIENCE FOR CONSERVATION: 31 Wayne Fraser Published by Department of Conservation P.O. Box 10-420 Wellington, New Zealand
Status Report on the Yellowstone Bison Population, August 2016 Chris Geremia 1, Rick Wallen, and P.J. White August 17, 2016
 Summary: Status Report on the Yellowstone Bison Population, August 2016 Chris Geremia 1, Rick Wallen, and P.J. White August 17, 2016 The bison population is estimated near 5,500 (range = 5,200-5,800),
Impact on Base Population Density and Hunter Performance of Stocking with Pen-Raised Bobwhite
 National Quail Symposium Proceedings Volume 1 Article 8 1972 mpact on Base Population Density and Hunter Performance of Stocking with Pen-Raised Bobwhite Keith Sexson Jr. Fish and Game Commission, Kansas
Developing a programme to make Taranaki predator-free
 Factsheet: 6 Developing a programme to make Taranaki predator-free The Taranaki Regional Council wants to initiate an innovative change in managing predators to benefit our native plants and wildlife,
Exemplar for Internal Achievement Standard. Geography Level 2
 Exemplar for Internal Achievement Standard Geography Level 2 This exemplar supports assessment against: Achievement Standard 91245 Explain aspects of a contemporary New Zealand geographic issue An annotated
Findings of the Alaska Board of Game BOG
 Findings of the Alaska Board of Game 2004-148-BOG Authorizing Predator Control in the Western Cook Inlet Area in Unit 16B with Airborne or Same Day Airborne Shooting March 10, 2004 Purpose This action
Blue cod 5 (BCO5) pot mesh size review
 pot mesh size review") Blue cod 5 (BCO5) pot mesh size review Discussion Document MPI Discussion Paper No: 2017/01 Prepared for public consultation by the Ministry for Primary Industries ISBN No: 978-1-77665-454-3 (o) ISSN No:
Blue cod 5 (BCO5) pot mesh size review Discussion Document MPI Discussion Paper No: 2017/01 Prepared for public consultation by the Ministry for Primary Industries ISBN No: 978-1-77665-454-3 (o) ISSN No:
Monitoring Population Trends of White-tailed Deer in Minnesota Marrett Grund, Farmland Wildlife Populations and Research Group
 Monitoring Population Trends of White-tailed Deer in Minnesota - 2014 Marrett Grund, Farmland Wildlife Populations and Research Group INTRODUCTION White-tailed deer (Odocoileus virginianus) represent one
E. Agu, M. Kasperski Ruhr-University Bochum Department of Civil and Environmental Engineering Sciences
 EACWE 5 Florence, Italy 19 th 23 rd July 29 Flying Sphere image Museo Ideale L. Da Vinci Chasing gust fronts - wind measurements at the airport Munich, Germany E. Agu, M. Kasperski Ruhr-University Bochum
WORKING WITH COMMUNITIES AND INTEREST GROUPS
 WORKING WITH COMMUNITIES AND INTEREST GROUPS OSPRI is committed to listening and accommodating a wide range of views through thorough and genuine public consultation about the effects of its operations.
Reduction of Speed Limit at Approaches to Railway Level Crossings in WA. Main Roads WA. Presenter - Brian Kidd
 Australasian College of Road Safety Conference A Safe System: Making it Happen! Melbourne 1-2 September 2011 Reduction of Speed Limit at Approaches to Railway Level Crossings in WA Radalj T 1, Kidd B 1
Deer Management Unit 255
 Deer Management Unit 255 Area Description DMU 255 is located primarily in northern Menominee County, but also extends into a small portion of Dickinson, Marquette, and Delta counties. It has totaled 463
Status and Distribution of the Bobcat (Lynx rufus) in Illinois
 in Illinois") Transactions of the Illinois State Academy of Science received 9/14/99 (2000), Volume 93, #2, pp. 165-173 accepted 1/16/00 Status and Distribution of the Bobcat (Lynx rufus) in Illinois Alan Woolf 1, Clayton
Transactions of the Illinois State Academy of Science received 9/14/99 (2000), Volume 93, #2, pp. 165-173 accepted 1/16/00 Status and Distribution of the Bobcat (Lynx rufus) in Illinois Alan Woolf 1, Clayton
2008 WMU 106 mule deer
 2008 WMU 106 mule deer Section Authors: Mike Grue and Kim Morton Suggested citation: Grue, M. and K. Morton. 2009. WMU 106 mule deer. Pages 50 54. In: N. Webb and R. Anderson. Delegated aerial ungulate
Preliminary Report. Note: calculations reported are preliminary and should not be cited without the author s permission. December 21, 2003.
 Preliminary Report Analysis of Total Fishing Mortality for Gulf of Mexico Red Snapper Contributed by Shrimp Trawl Bycatch and Commercial and Recreational Fisheries (Including Discards) Note: calculations
Minnesota Department of Natural Resources Fisheries Division, Lake Superior Area
 Minnesota F-9-R(P)- Study 4 Job 616 Minnesota Department of Natural Resources Fisheries Division, Lake Superior Area Coaster Brook Trout Status in Minnesota-Lake Superior Tributaries Following Regulation
DOC SCIENCE INTERNAL SERIES 24
 Weka- and kiwi-safe possum trap sets DOC SCIENCE INTERNAL SERIES 24 C. Thomson, B. Warburton and L. Moran Published by Department of Conservation P.O. Box 10-420 Wellington, New Zealand DOC Science Internal
Assessment of the effectiveness of. ultrasonic devices for repelling stoats (Mustela erminea)
") Assessment of the effectiveness of Transonic ESP and Yard Gard ultrasonic devices for repelling stoats (Mustela erminea) E B Spurr Manaaki Whenua - Landcare Research PO Box 69 Lincoln New Zealand Published
Assessment of the effectiveness of Transonic ESP and Yard Gard ultrasonic devices for repelling stoats (Mustela erminea) E B Spurr Manaaki Whenua - Landcare Research PO Box 69 Lincoln New Zealand Published
STOCK STATUS OF SOUTHERN BLUEFIN TUNA
 7 th Expert Consultation on Indian Ocean Tunas, Victoria, Seychelles, 9-14 November, 1998 STOCK STATUS OF SOUTHERN BLUEFIN TUNA Tsuji, S. 1 Introduction The Commission for the Conservation of Southern
Survey Techniques For White-tailed Deer. Mickey Hellickson, PhD Orion Wildlife Management
 Survey Techniques For White-tailed Deer Mickey Hellickson, PhD Orion Wildlife Management SURVEYS two basic types: (1) Total Counts best but rarely feasible. may be possible on small, high-fenced areas.
LAKE WASHINGTON SOCKEYE SALMON STUDIES. Richard E. Thorne and James J. Dawson
 FRI-UW-7613 October 1976 LAKE WASHINGTON SOCKEYE SALMON STUDIES 1975 1976 by Richard E. Thorne and James J. Dawson Final Report Service Contract No. 648 Washington State Department of Fisheries For the
Animal pests: faecal pellet counts
 Animal pests: faecal pellet counts Version 1.0 This specification was prepared by Des Smith in 2012. Contents Synopsis... 2 Assumptions... 4 Advantages... 4 Disadvantages... 4 Suitability for inventory...
BRIEFING on IBERIAN LYNX (Lynx pardinus) MANAGEMENT PLAN AT DOÑANA NATIONAL PARK
 MANAGEMENT PLAN AT DOÑANA NATIONAL PARK") BRIEFING on IBERIAN LYNX (Lynx pardinus) MANAGEMENT PLAN AT DOÑANA NATIONAL PARK Doñana, 11 th march 2003. 1. SUMMARY Management Plan approved in 1988 and in implementation since. Jointly drafted by scientific
BRIEFING on IBERIAN LYNX (Lynx pardinus) MANAGEMENT PLAN AT DOÑANA NATIONAL PARK Doñana, 11 th march 2003. 1. SUMMARY Management Plan approved in 1988 and in implementation since. Jointly drafted by scientific
EXAMINING THE EFFECT OF HEAVY VEHICLES DURING CONGESTION USING PASSENGER CAR EQUIVALENTS
 EXAMINING THE EFFECT OF HEAVY VEHICLES DURING CONGESTION USING PASSENGER CAR EQUIVALENTS Ahmed Al-Kaisy 1 and Younghan Jung 2 1 Department of Civil Engineering, Montana State University PO Box 173900,
Biodiversity benefits from NZ s major predator control regimes
 Biodiversity benefits from NZ s major predator control regimes Rachelle Binny Biosecurity Bonanza 23 May 2017 What are the biodiversity benefits from predator control for New Zealand s major control regimes?
Conservation Limits and Management Targets
 Conservation Limits and Management Targets Setting conservation limits The use of conservation limits (CLs) in England and Wales (E&W) has developed in line with the requirement of ICES and NASCO to set
Analysis of performance at the 2007 Cricket World Cup
 Analysis of performance at the 2007 Cricket World Cup Petersen, C., Pyne, D.B., Portus, M.R., Cordy, J. and Dawson, B Cricket Australia, Department of Physiology, Australian Institute of Sport, Human Movement,
MONITORING AND CONTROL OF MUSTELIDS ON CONSERVATION LANDS PART 2. FIELD AND WORKSHOP GUIDE
 DEPARTMENT OF CONSERVATION TECHNICAL SERIES No. 4 MONITORING AND CONTROL OF MUSTELIDS ON CONSERVATION LANDS PART 2. FIELD AND WORKSHOP GUIDE by C.M. King, Colin F.J. O'Donnell, and Stephen M. Phillipson
Bhagwant N. Persaud* Richard A. Retting Craig Lyon* Anne T. McCartt. May *Consultant to the Insurance Institute for Highway Safety
 Review of The Impact of Red Light Cameras (Photo-Red Enforcement) on Crashes in Virginia by Nicholas J. Garber, John S. Miller, R. Elizabeth Abel, Saeed Eslambolchi, and Santhosh K. Korukonda Bhagwant
PREDATOR CONTROL AND DEER MANAGEMENT: AN EAST TEXAS PERSPECTIVE
 PREDATOR CONTROL AND DEER MANAGEMENT: AN EAST TEXAS PERSPECTIVE BEN H. KOERTH, Institute for White-tailed Deer Management and Research, Box 6109, Arthur Temple College of Forestry, Stephen F. Austin State
Analyses of tag return data from the CCSBT SRP tagging program
 Analyses of tag return data from the CCSBT SRP tagging program Tom Polacheck Paige Eveson Prepared for the CCSBT 7 th Meeting of the Stock Assessment Group (SAG7) and the 11 th Meeting of the Extended
Lecture 2: Sampling gear. Ichthyology 3
 Lecture 2: Sampling gear Ichthyology 3 Total samples Total samples Draining Gives a total sample but this is often not practical. Kariega estuary study on salt marshes. Explosives Extremely effective sampling
The University of Newcastle Animal Care and Ethics Committee Methodology Document
 The University of Newcastle Animal Care and Ethics Committee Methodology Document Document Number: ACEC: 22 Document Name: The use of wildlife in research. Date of ACEC Approval: 6 December 2013 Amendment
A REVIEW AND EVALUATION OF NATURAL MORTALITY FOR THE ASSESSMENT AND MANAGEMENT OF YELLOWFIN TUNA IN THE EASTERN PACIFIC OCEAN
 A REVIEW AND EVALUATION OF NATURAL MORTALITY FOR THE ASSESSMENT AND MANAGEMENT OF YELLOWFIN TUNA IN THE EASTERN PACIFIC OCEAN Mark N. Maunder and Alex Aires-da-Silva Outline YFT history Methods to estimate
Secretary Game Animal Panel PO Box 9134 Addington CHRISTCHURCH 8243
 Date: Secretary Game Animal Panel PO Box 9134 Addington CHRISTCHURCH 8243 RE: SUBMISSION TO THE DISCUSSION DOCUMENT MANAGING NUMBERS OF DEER, CHAMOIS, TAHR AND PIGS As a private individual who actively
Science Skills Station
 Science Skills Station Objective 1. Interpret and analyze data so to determine the relationship between resource availability and carrying capacity of a population. 2. Identify biotic and abiotic factors
LYNNWOOD ROAD ARTERIAL STUDY The effect of intersection spacing on arterial operation
 LYNNWOOD ROAD ARTERIAL STUDY The effect of intersection spacing on arterial operation A J Joubert*, S L Burnett**, and T Ueckermann* *PWV Consortium, PO Box 1109, Sunninghill 2157 **Gautrans, Gauteng Department
Anabela Brandão and Doug S. Butterworth
 Obtaining a standardised CPUE series for toothfish (Dissostichus eleginoides) in the Prince Edward Islands EEZ calibrated to incorporate both longline and trotline data over the period 1997-2013 Anabela
PUBLISHED PROJECT REPORT PPR850. Optimisation of water flow depth for SCRIM. S Brittain, P Sanders and H Viner
 PUBLISHED PROJECT REPORT PPR850 Optimisation of water flow depth for SCRIM S Brittain, P Sanders and H Viner Report details Report prepared for: Project/customer reference: Copyright: Highways England,
Eastern and South Shore Nova Scotia Lobster LFAs The Fishery. DFO Atlantic Fisheries Stock Status Report 96/117E.
 Maritimes Region DFO Atlantic Fisheries Stock Status Report 96/117E Eastern and South Shore Nova Scotia Lobster LFAs 31-33 Background Lobsters first entering the fishery in LFAs 31, 32, and 33 are probably
Animal pest control for freshwater wetlands
 R. Morris Dept. of Conservation (1982) An introduction Animal pest control for freshwater wetlands assistance Purpose of module To assist owners of freshwater wetlands, or properties adjacent to these,
Controlled Take (Special Status Game Mammal Chapter)
") Controlled Take (Special Status Game Mammal Chapter) Background of issue: The current Plan contains standards including the use of controlled take as a management response tool to assist in some situations
Controlled Take (Special Status Game Mammal Chapter) Background of issue: The current Plan contains standards including the use of controlled take as a management response tool to assist in some situations
Deer Management Unit 252
 Deer Management Unit 252 Geographic Location: Deer Management Unit (DMU) 252 is 297 miles 2 in size and is primarily in southeastern Marquette, southwestern Alger and northwestern Delta County. This DMU
QUIRK CREEK POPULATION ESTIMATES AND ONE-PASS ELECTROFISHING REMOVAL OF BROOK TROUT, 2005 and 2006
 QUIRK CREEK POPULATION ESTIMATES AND ONE-PASS ELECTROFISHING REMOVAL OF BROOK TROUT, 25 and 26 Alberta Sustainable Resource Development Fish and Wildlife Division Cochrane, Alberta QUIRK CREEK POPULATION
Use of bait stations for possum and feral cat control
 Use of bait stations for possum and feral cat control SCIENCE FOR CONSERVATION: 86 M.D. Thomas, D.A. Wright, J. Mason and K.W. Briden Published by Department of Conservation P.O. Box 10-420 Wellington,
C R I TFC. Columbia River Inter-Tribal Fish Commission
 Columbia River Inter-Tribal Fish Commission 700 NE Multnomah, Suite 1200 503.238.0667 Portland, OR 97232 www.critfc.org C R I TFC T E CHNI C AL R E P O R T 13-07 Analyses for Effect of Survey Week and
USDA APHIS WILDLIFE SERVICES ACTIVITIES SUMMARY REPORT 2013 WHITE-TAILED DEER MANAGEMENT PROGRAM TOWNSHIP OF UPPER ST. CLAIR (September 2013)
") USDA APHIS WILDLIFE SERVICES ACTIVITIES SUMMARY REPORT 2013 WHITE-TAILED DEER MANAGEMENT PROGRAM TOWNSHIP OF UPPER ST. CLAIR (September 2013) USDA APHIS Wildlife Services (WS) was requested by the Township
USDA APHIS WILDLIFE SERVICES ACTIVITIES SUMMARY REPORT 2013 WHITE-TAILED DEER MANAGEMENT PROGRAM TOWNSHIP OF UPPER ST. CLAIR (September 2013) USDA APHIS Wildlife Services (WS) was requested by the Township
ANALYSIS OF SCIENTIFIC INFORMATION ON HECTOR S DOLPHIN
 The following has been complied by Mr J Crossland a marine scientist from Christchurch and although the data presented is centered on the Canterbury area the conclusions pertain to all the so called Dolphin
Observations of Deer and Wolves during the 2017 Moose Survey
 Observations of Deer and Wolves during the 2017 Moose Survey Mike Schrage, Fond du Lac Resource Management Division Introduction Each year, we conduct an aerial survey in northeastern Minnesota in an effort
Domestic Energy Fact File (2006): Owner occupied, Local authority, Private rented and Registered social landlord homes
: Owner occupied, Local authority, Private rented and Registered social landlord homes") Domestic Energy Fact File (2006): Owner occupied, Local authority, Private rented and Registered social landlord homes Domestic Energy Fact File (2006): Owner occupied, Local authority, Private rented
Domestic Energy Fact File (2006): Owner occupied, Local authority, Private rented and Registered social landlord homes Domestic Energy Fact File (2006): Owner occupied, Local authority, Private rented
FACILITATING THE MANAGEMENT OF FOXES ON PRIVATE LAND: ARE LANDHOLDERS INTERESTED?
 13th Australasian Vertebrate Pest Conference Proceedings Keven Drew Te Papa Wellington, New Zealand 2-6 May 2005 Hosted by Manaaki Whenua Landcare Research PO Box 69, Lincoln 8152, New Zealand. www.landcareresearch.co.nz
INTERIM ADVICE NOTE 171/12. Risk Based Principal Inspection Intervals
 INTERIM ADVICE NOTE 171/12 Risk Based Principal Inspection Intervals Summary This Interim Advice Note sets out the requirements and guidance for service providers using risk based inspection intervals.
EASTERN FOX SQUIRRELS FROM AN INTENSIVELY HUNTED POPULATION OF
 FROM AN INTENSIVELY HUNTED POPULATION OF EASTERN FOX SQUIRRELS U.S.D.A. FOREST SERVICE RESEARCH PAPER NE-186 1971 NORTHEASTERN FOREST EPERIMENT STATION, UPPER DARBY, PA. FOREST SERVICE.. U. S. DEPARTMENT
Planning Daily Work Trip under Congested Abuja Keffi Road Corridor
 ISBN 978-93-84468-19-4 Proceedings of International Conference on Transportation and Civil Engineering (ICTCE'15) London, March 21-22, 2015, pp. 43-47 Planning Daily Work Trip under Congested Abuja Keffi
JUVENILE GENETIC EVALUATION AND SELECTION FOR DAIRY GOATS
 JUVENILE GENETIC EVALUATION AND SELECTION FOR DAIRY GOATS INTRODUCTION Traditional genetic improvement schemes for dairy animals involve progeny testing of sires. This traditional approach can give accurate
FOX AND COYOTE TRAPPING SURVEY
 DNR MICHIG AN EDEPARTMENT OF NATURAL R SOURCES MICHIGAN DEPARTMENT OF NATURAL RESOURCES Wildlife Division Report No. 3430 February 2005 Printed by Authority of: P.A. 451 of 1994 Total Number of Copies
An update of the 2015 Indian Ocean Yellowfin Tuna stock assessment for 2016
 IOTC-2016-WPTT18-27 Received: 14 October 2016 An update of the 2015 Indian Ocean Yellowfin Tuna stock assessment for 2016 Adam Langley, IOTC Consultant 1. Introduction A stock assessment of the Indian
2008 WMU 359 moose, mule deer, and white tailed deer
 2008 WMU 359 moose, mule deer, and white tailed deer Section Authors: Dave Stepnisky and Robb Stavne Suggested citation: Stepnisky, D. and R. Stavne. 2009. WMU 359 moose, mule deer, and white tailed deer.
a) Case Study: North American Bison/Wood Buffalo b) Species Diversity/Richness
 Case Study: North American Bison/Wood Buffalo b) Species Diversity/Richness") ENSC 320 Tutorial #2 Critiques due! a) Case Study: North American Bison/Wood Buffalo b) Species Diversity/Richness a) CASE STUDY: North American Bison The Demise of the Bison. Bison antiqua appear in the
ENSC 320 Tutorial #2 Critiques due! a) Case Study: North American Bison/Wood Buffalo b) Species Diversity/Richness a) CASE STUDY: North American Bison The Demise of the Bison. Bison antiqua appear in the
STATE OF MINNESOTA IN COURT OF APPEALS. Court File No. A Petitioners, Respondents.
 STATE OF MINNESOTA IN COURT OF APPEALS Court File No. A12-1680 Center for Biological Diversity, Howling for Wolves, Petitioners, vs. AFFIDAVIT OF JOHN D. ERB Minnesota Department of Natural Resources,
DMU 008 Barry County Deer Management Unit
 DMU 8 Barry County Deer Management Unit Area Description The Barry County Deer Management Unit (DMU) 8 is in the Southwest Region and was once part of the Bellevue deer management unit 38. Bellevue DMU
EXPERIMENTAL STUDY ON THE DISCHARGE CHARACTERISTICS OF SLUICE FOR TIDAL POWER PLANT
 EXPERIMENTAL STUDY ON THE DISCHARGE CHARACTERISTICS OF SLUICE FOR TIDAL POWER PLANT Sang-Ho Oh 1, Kwang Soo Lee 1 and Dal Soo Lee 1 The discharge characteristics of sluice caisson for tidal power plant
EXECUTIVE SUMMARY Feasibility Study on the Reintroduction of Gray Wolves to the Olympic Peninsula
 EXECUTIVE SUMMARY Feasibility Study on the Reintroduction of Gray Wolves to the Olympic Peninsula Prepared by U.S. Fish and Wildlife Service Western Washington Office Introduction Historical records indicate
White-Tailed Deer Management FAQ
 December 6 th, 217 Ministry of Forests, Lands, Natural Resource Operations and Rural Development White-Tailed Deer Management FAQ What are current white-tailed deer management objectives in the Kootenay
Dauphin Lake Fishery. Status of Walleye Stocks and Conservation Measures
 Dauphin Lake Fishery Status of Walleye Stocks and Conservation Measures Date: December, 21 Dauphin Lake Fishery Status of Walleye Stocks and Conservation Measures Background: Walleye stocks in Dauphin
West Coast Rock Lobster. Description of sector. History of the fishery: Catch history
 West Coast Rock Lobster Description of sector History of the fishery: The commercial harvesting of West Coast rock lobster commenced in the late 1800s, and peaked in the early 1950s, yielding an annual
Assessment Summary Report Gulf of Mexico Red Snapper SEDAR 7
 Assessment Summary Report Gulf of Mexico Red Snapper SEDAR 7 Stock Distribution: Red snapper are found throughout the Gulf of Mexico, the Caribbean Sea, and from the U.S. Atlantic Coast to northern South
PACIFIC BLUEFIN TUNA STOCK ASSESSMENT
 PACIFIC BLUEFIN TUNA STOCK ASSESSMENT SUMMARY 19-21 December 2012 Webinar PACIFIC BLUEFIN TUNA STOCK ASSESSMENT SUMMARY 1. Stock Identification and Distribution Pacific bluefin tuna (Thunnus orientalis)
Overview 10/8/2015. October Pelagic Advice Pelagic AC 7 October 2015
 October Pelagic Advice Pelagic AC 7 October 2015 John Simmonds ICES ACOM Vice Chair Overview WG 1 Blue whiting NSS herring North Sea horse makerel WG 2 Stocks Northeast Atlantic mackerel Western horse
Deer Management Unit 249
 Deer Management Unit 249 Geographic Location: DMU 249 lies along the Lake Michigan shoreline and is comprised largely of Mackinac and Chippewa counties with a small portion of southeastern Luce County
Kootenay (Region 4) Mule Deer: Frequently Asked Questions
 Mule Deer: Frequently Asked Questions") 1986 1987 1988 1989 1990 1991 1992 1993 1994 1995 1996 1997 1998 1999 2000 2001 2002 2003 2004 2005 2006 2007 2008 2009 2010 2011 Kills/100 hunter days Kootenay (Region 4) Mule Deer: Frequently Asked Questions
1986 1987 1988 1989 1990 1991 1992 1993 1994 1995 1996 1997 1998 1999 2000 2001 2002 2003 2004 2005 2006 2007 2008 2009 2010 2011 Kills/100 hunter days Kootenay (Region 4) Mule Deer: Frequently Asked Questions
Tennessee Black Bear Public Opinion Survey
 Tennessee Black Bear Public Opinion Survey Executive Summary 2012 Survey TWRA Technical Report 12 02 This electronic publication was developed by the Tennessee Wildlife Resources Agency s Division of Wildlife
Advice October 2014
 5.3.21.3 Advice October 2014 ECOREGION Celtic Sea and West of Scotland STOCK Nephrops on Porcupine Bank (FU 16) Advice for 2015 ICES advises on the basis of the MSY approach that catches from FU 16 in
SPOTLIGHT DEER SURVEY YO RANCHLANDS LANDOWNERS ASSOCIATION ±10,400 ACRES KERR COUNTY
 SPOTLIGHT DEER SURVEY YO RANCHLANDS LANDOWNERS ASSOCIATION ±10,400 ACRES KERR COUNTY WRITTEN BY: SHANE KIEFER, CWB SARAH KAHLICH, AWB PLATEAU LAND & WILDLIFE MANAGEMENT AUGUST 1, 2016 EXECUTIVE SUMMARY
Control Strategies for operation of pitch regulated turbines above cut-out wind speeds
 Control Strategies for operation of pitch regulated turbines above cut-out wind speeds Helen Markou 1 Denmark and Torben J. Larsen, Risø-DTU, P.O.box 49, DK-4000 Roskilde, Abstract The importance of continuing
Into the Al Hajar with the Arabian Tahr 2012 FIELD REPORT
 Into the Al Hajar with the Arabian Tahr 2012 FIELD REPORT Background Information Lead PI: Dr Steve Ross Report completed by: Steve Ross, Mansoor Al Jahdhami, Debbie Winton Period Covered by this report:
Welsh Waters Scallop Strategy 28 th May Summary of research
 Welsh Waters Scallop Strategy 28 th May 2013 Summary of research Introduction This document describes the scallop research being conducted by Bangor University s Fisheries & Conservation Science Group
Effectiveness of the Victor snapback trap for killing stoats
 Effectiveness of the Victor snapback trap for killing stoats DOC SCIENCE INTERNAL SERIES 83 B. Warburton, Nick Poutu, and Ian Domigan Published by Department of Conservation P.O. Box 10-420 Wellington,
Causes of Tiger (Panthera tigris) Population Decline, and Potential Consequences if the Decline Continues
 Population Decline, and Potential Consequences if the Decline Continues") Causes of Tiger (Panthera tigris) Population Decline, and Potential Consequences if the Decline Continues ABSTRACT: The population decline of the Tiger (Panthera tigris) in the past decades has been a
Causes of Tiger (Panthera tigris) Population Decline, and Potential Consequences if the Decline Continues ABSTRACT: The population decline of the Tiger (Panthera tigris) in the past decades has been a
Animal Pest Field Trial Reporting Template
 Animal Pest Field Trial Report for Efficacy of DOC 200 versus Victor Professional Rat traps at catching rats in the Mangaone Core Area of the Te Urewera Mainland Island September 2004 June 2006 Anastacia
A pheasant researcher notebook:
 A pheasant researcher notebook: what we are learning about pheasants and pheasant hunters in Nebraska TJ Fontaine Nebraska Cooperative Fish and Wildlife Research Unit Managing pheasants is challenging
Deer Management Unit 152
 Deer Management Unit 152 Geographic Location: Deer Management Unit (DMU) 152 is 386 miles 2 in size and is primarily in southwestern Marquette County. This DMU falls within the moderate snowfall zone and
The science behind the Department of Conservation s beech mast response and predator control
 The science behind the Department of Conservation s beech mast response and predator control Orange-fronted parakeet, Photo: Sabine Bernert 1 Department of Conservation (DOC) scientist Graeme Elliott
Cariboo-Chilcotin (Region 5) Mule Deer: Frequently Asked Questions
 Mule Deer: Frequently Asked Questions") Harvest Cariboo-Chilcotin (Region 5) Mule Deer: Frequently Asked Questions A number of questions and concerns have been expressed from resident hunters about the change in the mule deer hunting regulations
Harvest Cariboo-Chilcotin (Region 5) Mule Deer: Frequently Asked Questions A number of questions and concerns have been expressed from resident hunters about the change in the mule deer hunting regulations
Appendix E Mangaone Stream at Ratanui Hydrological Gauging Station Influence of IPO on Stream Flow
 NZ Transport Agency Peka Peka to North Ōtaki Expressway Hydraulic Investigations for Expressway Crossing of Mangaone Stream and Floodplain Appendix E Mangaone Stream at Ratanui Hydrological Gauging Station