REPORT OF THE 2013 ICCAT NORTH AND SOUTH ATLANTIC ALBACORE STOCK ASSESSMENT MEETING
|
|
|
- Jeffrey Skinner
- 5 years ago
- Views:
Transcription
1 N & S ALB STOCK ASSESSMENT Sukarrieta 2013` REPORT OF THE 2013 ICCAT NORTH AND SOUTH ATLANTIC ALBACORE STOCK ASSESSMENT MEETING (Sukarrieta, Spain - June 17 to 24, 2013) 1. Opening, adoption of agenda and meeting arrangements The meeting was held at AZTI-Tecnalia in Sukarrieta, Spain June 17 to 24, Dr. Pilar Pallarés, on behalf of the ICCAT Executive Secretary, thanked AZTI for hosting the meeting and providing all logistical arrangements. Dr. Haritz Arrizabalaga (EC-Spain), the Albacore Species Group Rapporteur, chaired the meeting. Dr. Arrizabalaga welcomed meeting participants ( the Group ) and proceeded to review the Agenda which was adopted with some changes (Appendix 1). The List of Participants is included in Appendix 2. The List of Documents presented at the meeting is attached as Appendix 3. The following participants served as Rapporteurs: P. Pallarés Items 1and 7 G. Diaz, H. Arrizabalaga Item 2 G. Scott Item 3 P. de Bruyn, M. Schrripa, G. Merino, M. Lauretta Item 4.1 E. Babcock, T. Matsumoto Item 4.2 L. Kell, G. Merino Item 5 H. Arrizabalaga, G. Scott, M. Keatinge Item 6 H. Arrizabalaga Item 7 2. Summary of available data for assessment The data available for the albacore stock assessment meeting is summarized in the Report of the 2013 ICCAT North and South Atlantic Albacore Data Preparatory Meeting (SCRS/2013/013). The Group reviewed new information that was made available after the data preparatory meeting held in Madrid April 22-26, Biology Document SCRS/2013/113 characterized the oceanographic conditions in the albacore distribution area within the northeast Atlantic Ocean, and attempted to identify the environmental conditions that cause inter-annual fluctuations in the catches of this species. The analysis focused on those years when catches by the Basque fleet were low (i.e., 2000, 2001 and 2009, 2010) compared to other more favorable years (i.e., 2005, 2006). The study presented some preliminary results on the potential importance of the Gulf Stream index for albacore survival and recruitment, and it highlighted the relevance of parameters such as SST, meso-scale structures, and stratification of the water column in the albcore catchability. The Group discussed the need to put the albacore CPUE from the Bay of Biscay into context given the information provided in the document. It was discussed by the Group that the document shows a series of correlations between oceanographic features and albacore catches by the Basque fleet, but the document did not provide any hypothesizes to explain most of the results. However, the Group found the negative correlation between the depth of the mix layer and albacore catchability to be useful information that could be taken into consideration when interpreting CPUEs. It was suggested that the authors explore availability of historical timeseries data on mixed layer depth for possible use in standardizing CPUE. Document SCRS/2013/103 presented preliminary results of a reproductive study of albacore in the southwestern Atlantic Ocean. A total of 14 specimens were analyzed: 10 males and 4 females. The reproductive organs (ovaries and testes) were collected and preserved in 10% formaldehyde. Histological cuts between 8 and 10 μm thick were made with a microtome and dyed with Mayer Haematoxylin and Eosin. In all the male gonads, dark acidophil zones evidencing the accumulation of genetic material (DNA) was observed, indicating that males were in spawning condition. In females, however, only oogonias and oocytes in stages I (immature) and II (resting) were observed, indicating that all females analyzed were mature, but inactive. The result from the 1
2 N & S ALB STOCK ASSESSMENT Sukarrieta 2013` analysis of female gonads is consistent with the hypothesis that spawning occurs at lower latitudes. The Group encouraged the authors to expand the study by increasing the sample size. Document SCRS/2013/126 presented the results of a bibliographical review on the identification of albacore populations among and within oceanic regions (Atlantic, Pacific, and Indian Oceans, and Mediterranean Sea). This document is the first step on a global review of albacore using an international aquatic database (ASFA). The document reviewed 367 publications, mainly composed of articles (64%) but also included the revision of conference papers, proceedings and reports (24%), and books (12%). The authors concluded that, due to the divergence of the results, the concept of stock and its delimitation remains a controversial issue. The authors indicated that there is an urgent need in most regions of the world for further albacore studies to review and improve the current management units used by Regional Fishery Management Organizations. Considering management used for albacore in the Atlantic, the Group discussed the possibility that immature albacore found in South African Atlantic waters are migrants from the Indian Ocean and, therefore, be part of that ocean s stock. The Group recognized that at present there is no quantitative information available to inform the assessment models on this issue. Therefore, any attempts to include this type of information in an assessment should be made as what if scenarios to examine sensitivity of assessments to this hypothesis. The Group also discussed the potential migration of albacore from South African waters to South American waters. It was indicated that the seasonal changes in the areas of operation of the Chinese-Taipei longline fleet in the South Atlantic might be in response of this hypothesized albacore migration. 2.2 Catch, effort, size, and catch-at-age (CAA) Document SCRS/2013/122 presented the albacore CAA prepared by the Secretariat for use in virtual population analysis (VPA). The document described the procedure used to estimate the CAA from catch-at-size, the changes made to the aging algorithm used in the 2009 stock assessment, and the differences between the CAA generated for the 2009 and the current 2013 assessments. The document described that the total number of fish estimated by the CAA was the same between the 2 assessments (2009 and 2013). However, differences were found in the number of fish at age. The author explained that these differences can be mostly, but not completely, explained by 2 main factors: (1) a change in the value of epsilon (controlling the number of iterations) used in the aging protocol, and (2) changes in the definition of the quarter (since fish are assumed to be born on April 1, the quarter April-June was defined as quarter 1). However, the author also indicated that the change in the definition of quarter can be handled with the Mean-Length-at-Age (MLAA) and it recommended that the following steps be taken: a) Continue to use the MLAA as originally developed. b) Use the calendar quarter and inform the VPA model that the month of birth for N-ALB is 4. c) In all cases input the CAA, Catch, WAA, PCAA, maturity, etc. in calendar year Jan-Dec. The estimated CAA is presented in Table 1, Figure 1 and Figure 2. The MLAA are shown in Table Relative abundance estimates In the data preparatory meeting, an update of the Spanish troll CPUE series was presented (SCRS/2013/053), which covered the period In the process of building input files for Multifan (MFCL) analysis, this recent CPUE series was merged to two previous troll series, namely a standardized French troll CPUE series ( ) and a nominal CPUE series between 1931 and 1975 (Bard 1977), to build a composite CPUE series that allowed estimating effort for Fishery 2 between 1930 and The methodology used to produce this composite series is described in Anon. (2010). In this case, a GLM controlling for source of data (fishery), quarter, and year was used to merge the three different sources to a common scale for use in MFCL analyses. In the case of assessment models using annual time scales for fitting, the GLM applied controlled for year and source of information. Figures 3 and 4 show the resulting patterns. The Group discussed the CPUE series corresponding to the Uruguayan pelagic longline fleet that was presented in the data Preparatory Meeting (SCRS/2013/043). After considering the changes on the target species of this fleet over time, the Group agreed to split this series into two time periods: when the fleet was targeting bigeye tuna, and when the target of this fleet was SWO. During the data preparatory meeting, the Group screened the available CPUE series and decided not to use some of them as input in the stock assessment models (e.g., the transition periods for Japan and Chinese Taipei, as 2
3 N & S ALB STOCK ASSESSMENT Sukarrieta 2013` well as South African baitboat and Brazilian longline, see Anon 2013). Still, the Group noted that the Taiwanese and Japanese longline indices, being the main longline indices for both the north and the south, showed some contrasting trends and negative correlations (Figures 5 and 6). The Group noted that including both indices in the assessment models might have a confounding effect and decided to further explore the nature of these indices. In the North Atlantic, both fisheries show clear differences in their areas of operation (Figures 7). In latitude, both fleets overlap mostly within the 20-40ºN, but the Chinese Taipei fleet operates mostly west of 30ºW. The Group noted that the signals provided by both the Chinese Taipei and the Japanese nominal CPUEs were quite similar in this area delimited by 20ºN-40ºN and west of 30ºW (Figure 8). The Group expressed concern that the CPUE standardization might not have fully accounted for spatial effects. Considering that the Chinese Taipei fleet has been targeting albacore more consistently, with a high proportion of their effort having albacore as the dominant catch (Figure 9), and as its area of operation has not changed as much compared to the Japanese fleet, and its level of albacore catches have also remained substantially higher during the last decades, the Group decided to include the Chinese Taipei index in the base run while downweighting the Japanese longline index. In the South Atlantic, the Group inspected the fishing areas for both fleets and observed similarity and consistency in the areas fished by Japan in the early period and Chinese Taipei in subsequent periods (Figure 7 ) when Japan reduced effective albacore fishing area (number of 5ºx5º geographical squares with at least 1 ton of albacore caught) (Figure 10). The Group agreed that the Chinese Taipei index might better reflect albacore abundance in the southern Atlantic given that this fleet targeted albacore more consistently throughout the period with less spatial shifts in their operations (this decision also supports scenarios where CPUEs are weighted by catch). However, the Group also noted that by-catch fisheries, in some cases, can also track population abundance and those spatial aspects needed to be further investigated in the CPUE standardization process. Thus, the Group decided, for continuity purposes, to consider both catch weighted and equally weighted scenarios in the southern Atlantic. 3. Limit and Target Reference Points and Kobe Advice Framework Noting that the Commission has requested SCRS to identify a limit reference point for northern albacore (Rec ), SCRS/2013/120 provided examples of an approach for enhancing dialogue between SCRS and the Commission for advancing the application of Harvest Control Rules (HCR) incorporating limit and target reference points. Additionally, the approach provides advice in the Kobe Strategy Matrix framework consistent with the Commission s decision making policy for development and application of conservation and management measures (Rec ). In combination, the guiding principles in Rec provide a basis for design of HCRs. SCRS has recommended a generic HCR (ICCAT, 2012), upon which stock-specific robustness testing through Management Strategy Evaluation (MSE) can and will be conducted in order to fine-tune HCRs which can achieve the Commission s objectives while considering the uncertainty in assessments that SCRS can quantify. In order to advance the Commission-SCRS dialogue, the Group agreed to provide information to the Commission on the basis of a range of interim HCR parameter values which would meet the Commission s policy based on the assessment outcomes, as paraphrased below (also see Figure 11): 1. For stocks in the green quadrant of the Kobe plot, management measures shall be designed to result in a high probability of maintaining the stock within this quadrant. 2. For stocks that are in the upper right yellow quadrant of the Kobe plot (overfishing), the Commission shall immediately adopt management measures designed to result in a high probability of ending overfishing in as short a period as possible. 3. For stocks in the red quadrant of the Kobe plot (overfishing and overfished), the Commission shall immediately adopt management measures, designed to result in a high probability of ending overfishing in as short a period as possible and the Commission shall adopt a plan to rebuild these stocks, and 4. For stocks in the lower left yellow quadrant of the Kobe plot (overfished but no overfishing), the Commission shall adopt management measures designed to rebuild these stocks in as short a period as possible. The Group noted that different methods for quantifying uncertainty in stock status evaluations can result in different probability expectations (SCRS/2013/117) and, since there is not yet a unified approach across the stock assessment methods applied to quantify uncertainty, it is an important research area to focus upon and to consider in MSE. Nonetheless, the Commission expects management advice based upon the quantified uncertainties in the assessments SCRS conducts (Res ). 3
4 N & S ALB STOCK ASSESSMENT Sukarrieta 2013` The Group decided to provide model probability expectations given the uncertainty the Group was able to quantify for the assessment for a range of interim HCR parameter values (Table 3) in the generic HCR recommended by SCRS (see Figure 12) to guide discussion about the policy decision points: high probability and as short as possible. An interim biomass limit reference point of 0.4B MSY was recommended which is consistent with robust limits recommended for a number of Pacific tuna stocks (e.g. Preece, et al. 2011) and other cases, until a fuller range of MSE testing can be conducted for other candidates. The Group recommended that management advice be provided in HCR (F) K2SMs format described in SCRS/2013/120 in order to promote dialogue on the Commission s policy choices under Rec Stock assessment Document SCRS/2013/036, first presented during the 2013 Meeting of the ICCAT Working Group on Stock Assessment Methods, reported a summary of methods for diagnosing abundance indices fitted as part of stock assessment models. Practical implementation of these techniques is shown in documents SCRS/2013/056 and SCRS/2013/057. Document SCRS/2013/117 provided an evaluation of approaches for modelling uncertainty in the framework of biomass dynamic models. Those approaches included bootstrapping, jackknife, modelling uncertainty based on the covariance matrix, delta method, likelihood profiling and MCMC techniques. The document concluded that estimates of uncertainty obtained from the same data and stock assessment model vary depending on the method used to estimate the uncertainty. Therefore, further evaluations leading to Best Practices are warranted. 4.1 North Atlantic albacore stock SEAPODYM Document SCRS/2013/125 presented the results of the first optimization experiment for the North Atlantic stock using the model SEAPODYM. The model configuration used a coarse grid at 2 x2º and month resolution with environmental inputs from a hindcast simulation driven by an atmospheric reanalysis (NCEP). With this reanalysis (i.e. based on observation), the coupled physical-biogeochemical simulation provided reasonable seasonal to interannual and decadal variability. Nevertheless, other configurations at higher resolution providing more realistic ocean conditions should complete this first study. Document SCRS/2013/121 discussed various potential questions and problems related to the SEAPODYM analysis, such as stock structure, uncertainty in the asymptotic size by sex, natural mortality as a function of age, changes in fishing power of the longline fleet targeting albacore, thermal preferendum of the various ages, etc. The document suggested that some results could be more realistic than those obtained by other stock assessment models. However, there are still a wide range of uncertainties in the present analysis and results should be more carefully explored before being considered for providing advice. The Group welcomed a modeling approach that considered spatial dynamics as well as environmental influences, since these are important elements of albacore population dynamics that are not considered in the models currently used for stock assessment. The group also agreed that the SEAPODYM model could be useful in the process of generating and testing hypotheses Multifan-CL In document SCRS/2013/058 a preliminary stock assessment with Multifan-CL for the northern stock of Atlantic albacore with a suite of exploratory data analysis and diagnostics was presented. The document proposed applying a factorial design for scenarios to analyze the uncertainty associated with the dynamic behaviour of fishing fleets and available data. The document recommended that such designs be incorporated into Best Practices in future stock assessments and MSEs. Although preliminary results for this model were presented, further investigation into the data revealed several serious conflicts in the input data. Firstly, it was noted that several key CPUE series were developed as catch in numbers per unit of effort, whereas the total catch input into the model was in weight. As the Multifan-CL uses the standardized CPUEs and the reported total catch to calculate standardized effort, the difference in units between the CPUE and catch can cause bias in the effort estimations, particularly if the average weight of the 4
5 N & S ALB STOCK ASSESSMENT Sukarrieta 2013` fish in a given fishery has changed significantly over time. As a result, the effort estimations included in the preliminary model were less reliable. In order to overcome this issue, total catch in number was requested for the longline fleets and this information was received making the CPUE and catch information consistent. For the surface fleets, this information was not available and so the catch in weight had to be converted to catch in size using an average weight of fish for each fishery per year. This information was available from the CAS database provided by the Secretariat from 1975 onwards. For fleet 1, these data were sufficient to convert the catch in weight to numbers, as the fishery initiated in For fleet 2, which started in 1930, an average of the average weight for this fleet between 1975 and 1980 was used to convert the catch into numbers prior to Once this had been conducted, new MFCL input files were created with the same units for the catch and CPUE data. A number of model run options were then discussed, proposed and conducted (Table 4). Much discussion was held over the initial model parameterisation and structure. The authors of document SCRS/2013/058 proposed an initial model structure that differed from the model structure used for the 2009 assessment essentially in that the Japanese longline CPUE and the Chinese Taipei longline size frequencies were heavily down-weighted. This structure is detailed and justified in SCRS/2013/058 (see also Section 2 of this report), with the base case run outlined in that document only changing due to the changes in the input files (frq file) noted above. As this formulation differed from the previous assessment model and data structure, several sensitivity runs were conducted to assess the implications of these changes. One of the major discussion issues was the exclusion of the Japanese CPUE series from this updated base assessment. Exploratory data analysis indicated that the Japanese and Chinese Taipei LL CPUE series were negatively correlated in certain overlapping periods. This was further discussed during the 2013 albacore data preparatory meeting which concluded that it would not be appropriate to include both Chinese Taipei and Japanese LL CPUE series in the same model as the MFCL model might not be able to resolve conflicting trends internally. As the Chinese Taipei fishery operates in the core area of the fishing area, whereas the Japanese fleet has shifted either North or South to target other species, its movement away from the core area could mean that this CPUE series no longer provides a reliable index of the population abundance in the core region and thus it was downweighted in the base model (see also agenda item 2) to address this concern. Sensitivity evaluation of the implications of downweighting the Japanese index was also conducted. Similar evaluations of other fleet CPUEs were not conducted owing to time constraints, but could be incorporated into a factorial design in future assessments. Another area of major discussion involved the use of the Chinese Taipei LL size frequency information. In the base case model, this information was heavily downweighted as the mean length of the sampled catch from this fishery was highly variable in certain time periods, but the reasons for such variations were unclear, (Figure 13). Large increases in average size in the most recent years might be related to increases in sampling coverage, but potentially also to biased spatial sampling (samples coming from more equatorial regions and thus less representative of the whole area of distribution). Thus, the recent increase in fish size is probably not consistent with the albacore stock dynamics. As a consequence, the size frequency data may not be representative of the size composition of the underlying population, at least in a way the model s current spatial structure could accommodate. However, it was agreed that a sensitivity run should be conducted to include this Chinese Taipei size frequency information to assess its effect on the model outputs. In fact, these data were poorly fit assuming a logistic selectivity and additional sensitivities were conducted assuming dome shaped selectivity. Sensitivity evaluation of the implications of essentially ignoring the Chinese Taipei size frequency was also conducted. Other sensitivity runs included considering both the Chinese Taipei size frequency and Japanese CPUE, downweighting all the size frequency (SF) series, starting the model in a different year to test the influence the starting assumptions on the population structure had on the model outputs, considering alternative biological assumptions such as age dependent natural mortality, as well as including tagging data. In the latter case, only tagging data from release events occurring between 1988 and 1991 were considered, as this coincided with a period in which, by far, the majority of tags were released as opposed to the rather low level of tagging which has occurred outside this period. Results of the MFCL model Although the growth curve parameters in the Multifan-CL model were fixed (Santiago and Arrizabalaga 2005), the mean lengths of the first 2 age classes were estimated independently in order to accommodate deviations from the von Bertalanffy Growth Function (VBGF). The final growth curve is presented in Figure 14. Figure 15 5
6 N & S ALB STOCK ASSESSMENT Sukarrieta 2013` shows the estimated biomass trajectory for the northern albacore stock over the assessment period, according to the base case. Estimated current biomass was approximately t, with SSB/SSB MSY at Figure 16 provides the estimated recruitments over the assessment period. Unlike the recruitment estimated during the 2009 assessment where recruitments during the first decades remained low compared to the rest of the time period, the recruitments estimated in this assessment appeared to be fairly variable, but with consistent ranges over the assessment period; time series of F by age class are presented in Figure 17. F is estimated to increase sharply in the 1950s, which corresponds to the first period in which size frequency data is available and so more information is available to separate the catches into age classes. This period is also when substantial increases in catch occurred immediately post WWII. Figure 18 shows the effort deviations over time by fishery, as well as the observed and predicted CPUEs. The overall consistency of the model with the observed effort data can be examined in these plots. If the model is coherent with the effort data, an even scatter of effort deviations around zero would be expected (although some outliers can also be expected). If there was an obvious trend in the effort deviations with time, this may indicate that a trend in catchability had occurred and that this had not been sufficiently captured by the model (Hampton 2002). For the majority of fisheries there are no obvious trends in the effort deviations and although this would indicate that the model has extracted most of the information present in the data regarding catchability variation. However, this is not always the case and additional tuning of the model may be appropriate for future runs. Fleet 1 in particular appears to have mainly positive deviations. Estimated selectivities are presented in Figure 19. Although most LL selectivities were constrained to be logistic, the Japanese transition period (fishery 6) and Japanese by-catch period (fishery 7) selectivities were estimated within the model. It is interesting that dome-shaped selectivities were estimated for these fisheries, possibly due to the fleets operation moving to the fringes of the core fishing area and, thus possibly increasing catch of smaller fish, although the estimates could also be the result of confounding with other model structural assumptions. The yield analysis conducted here incorporated the stock-recruitment relationship (Figure 20) into the equilibrium biomass and yield estimates. The steepness was estimated to be 0.83, which is slightly different from the prior mode of The yield curve which estimates a maximum sustainable yield of t at an effort multiplier of 1.38 is presented in Figure 21. The corresponding reference points B/B MSY, SSB/SSB MSY and F/F MSY are shown in Figures 22, 23 and 24, respectively. These would indicate that the current population biomass is below the biomass that can support a MSY (0.80), the spawning stock biomass is also slightly below SSB MSY (0.94) while current F is below the F that would give MSY (0.72). Therefore, these results indicate that the stock is overfished, but not undergoing overfishing. The overall model fits to the SF data are presented in Figure 25 and the residuals in Figure 26. The fits to the size data are not always particularly good and this shows that the structural assumptions regarding selectivity do not fully account for shifts in SF over time or for unusually shaped SF distributions (such as bimodal distributions in the available data). As both the input data and model specification changed substantially between the current assessment and that conducted in 2009, several sensitivity runs were performed to evaluate the effect these changes have on the model outcomes. The major changes include the downweighting or not the Japanese LL CPUE data, the downweighting or not the Chinese Taipei LL SF data and the change in standardized effort due to the use of total catch in numbers for certain fleets in the current assessment as opposed to the use of total catch in weight for those fleets in the past assessment. Run Alt8 specifically deals with the issue of catch in weight or numbers. Table 5 shows the relative SSB/SSB MSY and F/F MSY benchmarks for the current base model along with the relative benchmarks for all the alternate runs. It was clear that the use of catch in weight (as done in 2009), and shown in Run Alt8, results in a more pessimistic view regarding the current stock status. Biomass trajectories over time for the base case and all alternate runs are presented in Figure 27, while key model output parameters such as steepness and reference points are presented in Table 5. Run Alt7 is fairly similar to the model specifications of the B model. It can be seen that the inclusion of both the Japanese LL CPUE and Chinese Taipei LL SF data result in a more pessimistic stock evaluation. This is further reinforced in runs Alt1 and Alt4 which include individually the Chinese Taipei LL SF and the Japanese LL CPUE, respectively. In Run Alt1 the Chinese Taipei LL selectivity was allowed to be non-logistic. This was conducted in order to try and capture the fact that although the selectivity had been constrained to be logistic, the absence of large fish in the SF data resulted in very poor fits to the SF data and if this change was not made the model 6
7 N & S ALB STOCK ASSESSMENT Sukarrieta 2013` would not have converged. This run attempted to allow the model freedom to independently calculate the shape of the selectivity curve based on the actual SF data provided to the model. In addition, the constraint that made selectivities for all fish of age 10 and over the same was removed. The new selectivities calculated for the three Chinese Taipei longline fleets by this alternate run are presented in Figure 28. This still resulted in a pessimistic stock evaluation. The change in the starting year on the model (Alt2) had little effect on either the biomass trajectory or the relative benchmarks. Downweighting all the SF data (Alt3) to assess the influence this information had on the model fit resulted in a slightly more pessimistic stock evaluation, while including an age-specific vector of natural mortality (Alt5) slightly improved the stock status. This natural mortality vector is presented in Figure 29. The inclusion of the tagging data between 1988 and 1991 (tag), resulted in estimates of stock status very similar to the base case model. In order to see what the stock status may have been in 2009 had the corrected data been used along with the current model specification, a variation on the base case was run, but excluding the final 4 years of data (mirroring the time period used in the previous assessment). This run (Alt 6) shows that had the current corrected data and modified model parameterization been used, the stock status relative to benchmarks would have been relatively similar, but slightly more pessimistic than those estimated in We can also infer from this run that there is information in the data over the final four years ( ) of the current model that indicates that the stock condition had improved since In general, the ranges of estimated steepness vary between 0.80 and 0.88, all of which are higher than the median of the prior distribution. This would imply that there is some information in the data regarding a relationship between spawning biomass and recruitment although it may not be particularly strong. For all models, the MSY estimation was similar, ranging between t and t. The majority of runs as well as the base case indicated that the stock is slightly overfished, but is no longer undergoing overfishing. Diagnostics The group noted that the AIC was not useful to compare fits to the data across different models because not all were based on the same datasets. However, the group felt that it might be useful to have some diagnostics regarding how well the different base and sensitivity runs were fitting the different CPUE series. For this purpose, the standard deviation of the effort residuals for each of the CPUE series in each of the models was computed and tabulated (Table 6). While not all runs were fitting to the same indices and so diagnostics which better account for this feature would be more appropriate, this table provided a basis for comparing the relative model-data agreement across the common indices that were fitted in the different runs. This table showed that the base case is amongst runs fitting best to the common indices (the runs with age specific natural mortality and the one including tagging information also showed comparable values). Further evaluation of this kind of diagnostic could be useful in the future to assign objective weights to different runs, e.g., in an MSE approach where a large number of hypotheses are being considered. However, it should be noted that the models like MFCL not only fit to CPUE series, and thus it might be useful to develop similar diagnostics for fits to size frequency data. Likelihood profiling was conducted for the base case run F/F MSY (Figure 30) and SSB/SSB MSY (Figure 31). The profiles showed a fairly wide distribution, especially for the SSB/SSB MSY profile. This would indicate that the uncertainty regarding the current status of SSB/SSB MSY is higher than that for F/F MSY. The profile for SSB/SSB MSY is also skewed to the right. The profile would however indicate that the model did converge to a global solution. The Group did not have available pairs of F/F MSY and B/B MSY estimates to represent the uncertainty around the current stock status, but had available the standard deviations for parameters as well as their correlation. Thus, the Group characterized the uncertainty in a similar way to 2009 and 2007 assessments, i.e., by generating 1000 random numbers from a bi-variate normal distribution with means the last year SSB/SSB MSY and F/F MSY estimates, and covariance matrix: SSB/SSB MSY F/F MSY SSB/SSB MSY F/F MSY
8 N & S ALB STOCK ASSESSMENT Sukarrieta 2013` The generated Kobe plot is presented in Figure 32, and the associated pie chart in Figure 33, suggesting that there is 0.2% probability for the stock to be both overfished and experiencing overfishing, 72.4% probability for the stock to be overfished but not experiencing overfishing, and 27.4% probability the stock is neither overfished or experiencing overfishing. However, the group noted that this was just an approximation to characterize the uncertainty of the current stock status, and decided to perform projections using software other than MFCL, as decided in 2009 and 2007 assessments ASPIC ASPIC 5.34 was used to conduct stock assessment of the North Atlantic albacore. Diagnostic of current stock status The results of 7 scenario runs for North Atlantic albacore are presented in Table 7. The scenarios were built with alternative combinations of catch and CPUE series to inform the assessment model ASPIC v All scenarios impose biomass level at the beginning of the time series at 95%K. Table 8 and Figures 34 and 35, show that all the scenarios estimate that the stock is recovering with only one scenario estimating the current biomass to be lower than 60% B MSY (Sc 4) and two estimating it above B MSY (Sc 2 and Sc 6). Regarding the fishing mortality trend, all scenarios showed that current (2011) fishing mortality is on average below or at F MSY, ranging between 45% and 89% F MSY. The Kobe plots (Figure 35) show that all scenarios follow the same pattern of development-overexploitation and rebuilding, with differences only on the time spent in the red quadrant (overfished and overfishing) (see Sc4) and the final stock status. Only one scenario (Sc2) showed that the Northern albacore stock is predominately in the green quadrant of the Kobe plot. However, Figure 36 shows the probability of the stock being currently at different areas of the Kobe plot by using the bootstrapped estimates across all 7 scenarios. According to this chart, the probability of the stock currently being in the green quadrant of the Kobe plot is 25%, the probability of being in the red quadrant is 13%, and the probability of being in the yellow quadrant is 62%. Figure 37 shows the density plots of the estimated current status of North Atlantic albacore for the 7 scenarios tested. These results are in agreement with those obtained with other models during the assessment session and showed that the assessment results are influenced by the choice of the CPUE series used to inform the model. However, all scenarios estimated that the stock is recovering and that current (2011) fishing mortality is near or below F MSY. Projections Further projections complemented the contribution of this model to the assessment of North Atlantic albacore. Deterministic projections with constant catch and constant fishing mortalities are shown in Figures 38 and 39 for all scenarios. Figure 39 summarizes the implications of alternative quotas for the coming years in the state of exploitation of northern albacore with different ASPIC scenarios. In order to shade light on the unstable projections in scenarios 4 and 5, two additional figures show how some of the projected constant catch value could collapse the stock (Figures 40 and 41) Stock Synthesis Exploratory Phase Model configurations were completed with the stock synthesis model (V3.24L) prior to the assessment meeting and were presented to the Group. The Stock Synthesis (SS) model was configured with twelve fleets, four quarter seasons, and two sexes. For the data exploration phase, the data inputs generated for use in the MFCL model were also used for the SS model. Selectivity for all fisheries was assumed to be length-based and based either on a double-normal function or assumed asymptotic. The unfished recruitment level (R0) and steepness (h) were freely estimated. Eight configurations were presented (Table 9), each with varying degrees of complexities and various uses of the data streams. An effort was made to construct some of the configurations with decreasing complexity so that the effects of the different levels of complexity on model results could be assessed. The 8
9 N & S ALB STOCK ASSESSMENT Sukarrieta 2013` primary objective of the SS modeling effort was to help verify results of the MFCL (and other) models. Results of the exploratory SS models were not formally used for management advice. As such, while some SS model (Run_1) diagnostics were presented to the Group, these diagnostics were documented here on a limited basis. The residual mean square error (RMSE) of each of the CPUE for the ten exploratory SS was used to show the degree of fit to each of the individual series (Table 10 and Figure 42). On average, the SS models had the lowest RMSE (i.e., best fit) with the Chinese Taipei late CPUE and the highest RMSE (i.e., worst fit) to the Portuguese baitboat CPUE time series. In an effort to account for fleet specific variations in RMSE, several runs used variance reweighting to increase/decrease the weighting each of the CPUE time series had on the overall model fit. The variance reweighting tended to decrease the discrepancies in some of the CPUE time series. The range of SS model configurations all inverted the Hessian matrix (a positive attribute). Broadly speaking, removal of the length information (Run 5), while altering the trajectory of the B/B MSY, did not produce a marked difference in that benchmark in the final year (Figure 43). Removal of the lengths tended to increase the response of the model to the annual variations in the CPUE data. The combination of the removal of the lengths and reconfiguration to an annual time step (Run 7) did have a very noticeable effect on the estimate of stock status (Figure 44). The perception given by this set of model runs is that, in general, the length information as whole may not be in conflict with the CPUE information as a whole. Given the time constraints of the meeting it was not possible to conclude how complex the assessment model needed to be, however, a closer examination of the various model diagnostics of the above mentioned runs may help making that determination. Nearly all of the eight SS models reached the same conclusion that the stock was overfished, but not currently experiencing overfishing. Furthermore, all models were in agreement that the stock biomass has increased starting in around the year The exception to this outcome was the age structured production model (ASPM) configuration. The results from the ASPM were so unlike the other runs that they were deemed suspicious and in need of further work. Group discussion suggested that perhaps the model found a local minimum at may not have properly converged. This suggestion was based on experience with the ASPIC model and the same data. One conclusion could be that this model lacked the complexity necessary to adequately capture the dynamics of the fishery. Given all these characteristics, this configuration was not given any further consideration. Post-exploratory phase configurations The Group agreed to explore a total of eleven SS model configurations (Table 11). Many of these configurations were intended to mirror as closely as possible those of the MFCL alternative runs. The majority of the post-exploratory SS configurations resulted in estimates of B/B MSY in the range of 0.5 to 1.0 (Figure 45) and estimates of F/F MSY of between 0.4 and 0.8 (Figure 46). While there were exceptions to this, the exceptions were considered sensitivity analysis and not the base case model. Every model configuration suggested that the stock biomass was continuing to increase and that fishing mortality was continuing to decrease. SS Run 12 was chosen as the preferred model to discuss overall fits and diagnostics. This was a two sex model with a linear ramp on female natural mortality (Figure 47). The estimates of the length-based selectivities and the resulting fit to the length information across years for each of the gears are shown in Figure 48. In general, the information contained in the length compositions was inconsistent with regard to any type of definitive trends in recruitment signal. The Group discussed how this might be the result of the various fleets not fishing in a consistent manner through time and space over the full extent of the assessment period. Banding in some of the residual patterns suggested bimodal patterns in the frequencies and consequently some use of age based selectivity might be useful to consider in the future. It was also apparent from the residual patterns (Figure 49) that time varying selectivity may also be a useful consideration. The models inability to provide good fits to the CPUE time series was evident in the examination of the fit residuals (Figure 50). Several sensitivity runs were conducted to determine the individual influence of the Japanese and Chinese Taipei CPUE series. The exploratory phase of runs showed that the Chinese Taipei CPUE time provided a lower RMSE than did the Japanese CPUE. This was further supported by the fact that the Japanese fleet fished more on the fringe of the stock distribution areas rather than the core areas. This provided some justification for excluding the Japanese CPUE time series from the runs used to provide management advice. 9
10 N & S ALB STOCK ASSESSMENT Sukarrieta 2013` Most model configurations were consistent with their estimates of virgin recruitment and steepness. Even without the use of an informative prior the estimates of steepness remained in the range of 0.75 to 0.85 for most configurations. No trend was apparent in the pattern of recruitment deviations; however there was an unexplained positive deviation the last year of the estimate (Figure 51). If these model fits were used for management advice this would have been investigated in greater detail as this point would have had a very large influence on the projections. Management benchmarks estimated from the MFCL base case and the SS models configured most like the MFCL base case (Run 17) are shown in Figures 52 and 53. Closer inspection of the estimates of recruitment (Figure 54) and spawning stock biomass (Figure 55) revealed differences in SSB, but not recruitment. Neither was there a difference in total biomass (Figure 56). This suggests that MFCL and SS, although calibrated well, are likely using different functions to estimate absolute fecundity. While this is worth noting, it does not have any impact on the management benchmarks or estimates of status of the stock. The MFCL and SS base case model estimates of B/B MSY and F/F MSY from the 2009 assessment and this assessment are shown in Figure 57. The estimates of the management benchmarks were relatively consistent not only between modeling platforms, but also over time Virtual Population Analysis (VPA) Methods A virtual population analysis (VPA) of North Atlantic albacore was conducted using the VPA-2Box software (Porch et al. 2001), version 4.01, for the period 1975 to Relative abundance indices and life-history parameters inputs are described in SCRS/2013/013 and catch-at-age and partial catch-at-age data are described in SCRS/2013/122. Model assumptions included a single stock with no mixing or migration, eight age-classes (age 1 through 8+ with the plus group representing ages 8 through 15), no separation of sexes, spawning period beginning May 1, constraint on vulnerability applied to the terminal 3 years, no constraints applied on recruitment or the stock-recruitment relationship, and no tagging data included. Eight indices of abundance were included in the model: Japan longline (Ages 3 to 8+), Chinese Taipei longline (Ages 2 to 8+), Chinese Taipei longline (Ages 2 to 8+), United States longline (Ages 3 to 8+), French troll (Ages 2 and 3), French troll (Ages 2 and 3), Spanish troll (Ages 2 and 3), Spanish baitboat (Ages 1 to 4), Indices were weighted equally and a multiplicative error structure was assumed. Data sources used in this assessment differed from the previous assessment conducted in 2009 by: (1) inclusion of the Spanish baitboat data referencing ages 1 to 4, (2) splitting of the Chinese Taipei longline index into two periods (1975 to 1987 and 1999 to 2011) to account for changes in species targeting and gear configuration, (3) combining the Spanish troll data to reference ages 2 and 3, as opposed to separate indices for these two age classes, and (4) allowing for selectivity of the Spanish troll indices to be estimated rather than fixed for a single age class. Model parameterization deviated from the 2009 assessment in that a constraint was applied on vulnerability estimates of ages 1 through 8 for the period 2009 to 2011 to penalize large deviations in fishing-mortality-at-age estimates since VPA estimates for the terminal period are generally poorly informed. This constraint was not applied in the previous assessment, and a sensitivity analysis was conducted to determine the effect of this parameterization. Based on a recommendation from the species workgroup, the spawning season was assumed to begin May 1, while the previous assessment assumed a spawning season beginning July 1. It is recommended that this assumption be evaluated in the future, as VPA model parameterization is dependent on the assumption. The base model was parameterized under these assumptions, and a bootstrap analysis (500 iterations) was applied to determine the uncertainty around base model estimates of spawning stock biomass (SSB) and fishing mortality-at-age (FAA). Diagnostics Model fits to indices of abundance and residual patterns were examined to determine the appropriateness of VPA fit to the various indices data. A number of alternative model runs were conducted to determine the sensitivity of 10
11 N & S ALB STOCK ASSESSMENT Sukarrieta 2013` the base model to various assumptions, and to estimate the effect of changing these assumptions on VPA results. Sensitivity analyses included: A relative abundance indices jackknife analysis in which each index was iteratively removed to determine the influence of individual indices on model estimates. An age-varying natural mortality analysis (Age-1 M = 0.63, Age-2 M = 0.46, Age-3 M = 0.38, Age-4 M = 0.34, Age-5 M = 0.31, Age-6 M = 0.29, Age-7 M = 0.31, Age-8+ M = 0.50) was compared to the constant natural mortality across ages equal to 0.3, assumed in the base model. A retrospective analysis in which data from the previous 1 to 5 years were iteratively removed to examine the influence of the most recent years on model estimates, and to compare base model estimated stock status in 2011 with a retrospective estimated stock status from 2001 projected forward to Addition of catch-at-age, partial catch-at-age, and relative abundance index data from the period 1959 to 1974 to determine if inclusion of this historical time series resulted in a difference in estimated stock status and benchmarks (maximum sustainable yield, spawning stock biomass (SSB MSY ) and fishingmortality at maximum sustainable yield (F MSY )). Results Abundance-at-age (NAA) estimates from the VPA base model indicated a sharp decline between 1978 and 1984 (Figures 58 and 59) resulting from a decrease in catch of older age classes (Figure 58) and a decrease in catch per unit effort of the Japanese and Chinese Taipei longline fleets (Figure 60). Fishing mortality-at-age (FAA) estimates ranged between 0.1 and 0.8, with the highest FAA estimated for ages 2, 3, and 4. Fishing mortality on the oldest age classes peaked in 1986, 1995, and 2000, and declined steadily over the last 10 years (Figure 61). The base model demonstrated relatively good fit to the Japanese and Chinese Taipei (early series) longline indices, and relatively poor fit to the United States and Chinese Taipei (late series) longline data (Figures 60 and 61). Model fit to surface fisheries indices (troll and baitboats) were less consistent than early period longline indices, although the estimated trends between indices and model estimates were similar. Bootstrap analyses demonstrated stability in the estimated long-term trends, but illustrated uncertainty in the NAA and FAA estimates of young age classes (ages 1 to 3) during the terminal period, as well as uncertainty in NAA and FAA of the older age classes (ages 6 to 8+) during the early period (Figures 62 and 63). Overall, NAA and FAA estimates were least variable for younger ages (with the exception of the terminal 5 year period), and most variable for the plus group (ages 8+) across bootstrap iterations (Figures 62 and 63). VPA model results were sensitive to the assumption of natural mortality (Figure 64), the Japanese longline indices (Figure 65), and the F-ratio starting parameters; and were less sensitive to terminal F parameters, variance scaling, and vulnerability constraint assumptions. Altering the assumption of natural mortality from constant-at-age (base model) to age-varying mortality resulted in an increase in the estimated magnitude of recruitment, spawner abundance, and spawning stock biomass, but did not alter the long-term population trend (Figure 64). Jackknife analyses demonstrated that the estimated long-term trend was most sensitive to the removal of the Japanese longline index, emphasizing the influence of that index on stock estimates (Figure 65). Removal of the Japanese longline index resulted in a reversal of the estimated long-term trend from stock decline to an increase in stock abundance and biomass from 1975 to The United States longline index had a large influence on the estimated stock trend in the recent time period (2000 to 2011, Figure 65). The Chinese Taipei and surface fleet indices were considerably less influential on stock abundance estimates. Retrospective analysis (removal of recent years catch and relative abundance data) indicated that model estimates of recruitment and SSB were not sensitive to the data from the recent time period (Figure 66). The estimate of current stock status from the base model is overfished and not currently undergoing overfishing (Table 12, Figures 67 and 68), with an estimated probability of SSB<SSB MSY & F<F MSY of 70% (14% estimated probability of being overfished and undergoing overfishing SSB<SSB MSY & F>F MSY, 15% estimated probability of not being overfished and not undergoing overfishing SSB>SSB MSY & F<F MSY, and 1% estimated probability of not being overfished and undergoing overfishing SSB>SSB MSY & F>F MSY ). The estimated 2011 spawning stock biomass was 41,600 metric tons (80% confidence interval of 35,400 to 51,100), with an estimated apical fishing mortality in 2011 of 0.26 (80% confidence interval of 0.23 to 0.30). The estimated MSY was 36,500 metric tons (80% confidence interval of 35,600 to 37,300). Spawning stock biomass that can support maximum sustainable yield (SSB MSY ) was estimated to be 50,800 metric tons (80% confidence interval of 41,800 to 60,300), with an estimated F MSY of 0.35 (80% confidence interval of 0.32 to 0.41). The long-term stock trajectory track (Figure 67) from the base model indicated that SSB was greater than SSB MSY and F was less than F MSY in 1975, F increased above F MSY during 1976 to 2007, and SSB declined below MSY in
12 N & S ALB STOCK ASSESSMENT Sukarrieta 2013` Stock status comparisons across the base model and the influential sensitivity runs highlighted the uncertainty in the estimated SSB 2011 compared to SSB MSY (Table 12, Figures 67 and 68), while estimates of median fishing mortality were more robust across model runs (Table 12, Figures 67 and 68). For example, the base model indicated that SSB 2011 was near SSB MSY, compared to the age-varying mortality and U.S. longline index jackknife runs which estimated SSB greater than SSB MSY in 2011, and also when compared to the historical period run which estimated SSB 2011 below SSB MSY. In contrast, median estimates of F 2011 were below F MSY for all model runs. While removal of the Japanese longline index resulted in a different stock trend than the other model runs, fits of the stock recruitment curve to model estimated recruitment and SSB were poor, resulting in biologically implausible estimates of SSB 2011 /SSB MSY and F 2011 /F MSY. It should be noted that estimates of stock status from the Japanese index jackknife sensitivity are likely to be more optimistic than the other sensitivities. Therefore, the historical period data sensitivity run represents the most pessimistic case of current SSB compared to SSB MSY. This analysis was done post-hoc of the data workshop, and the historical input data and model parameterization were less thoroughly evaluated; therefore, this run should be considered exploratory and more rigorous evaluation is necessary (e.g., accuracy of historical catch data and starting F-ratio parameters). Due to the uncertainty in data input and model parameterization, the historical model was not projected forward. Based on the VPA base model and sensitivities, catches of 32,000 metric tons or lower were predicted to result in decreased fishing mortality and lead to stock rebuilding, and these predictions were robust across model runs taking into account model sensitivity, excluding historical data sensitivity (Figure 69). In summary, while there was considerable uncertainty in the estimated SSB of north Atlantic albacore from the VPA, there was overall consistency in the predicted sustainable harvest strategies Summary of stock status Results for all the various modeling platforms (MFCL, SS, VPA, and ASPIC) were examined for commonalities and differences. Although the range of estimated management benchmarks is relatively wide, nearly all models were in agreement that the stock was overfished, but not currently undergoing overfishing (Figure 70). However, the SS runs were more consistent with each other than with the MFCL base case model. Most models from all the various platforms showed a drop in stock biomass from 1930 to about 1990 and increasing trend in biomass starting in around Likewise, most models within all configurations showed a peak in fishing mortality in around 1990 with a decreasing trend thereafter (Figure 71). Furthermore, most models across the various platforms demonstrated more precise estimates of F/F MSY than they did estimates of B/B MSY. This was also demonstrated by a retrospective projection conducted with VPA over the last 10 years that suggested that F/ F MSY trends were more predictable than SSB/B MSY trends (Figure 72). 4.2 South Atlantic albacore stock ASPIC Methods Document SCRS presented a non-equilibrium surplus-production model for the albacore stock in the southern Atlantic Ocean using the software package ASPIC ver Fleet categorization (Table 13) was similar to that used in the 2009 assessment. Catch for each fleet (Table 14) was calculated based on Task I data prepared at 2013 ICCAT Atlantic Albacore Data Preparatory Meeting. Table 15 shows CPUE indices used for the models. Several CPUE indices used for the last assessment were not used based on the decisions made at the 2013 Albacore Data Preparatory Meeting. Therefore, several fleets do not have CPUE index. Four models were examined (Table 16). The confidence interval of the F/F MSY trajectory for Run07 presented in the document SCRS/2013/118 seemed unusual and therefore model configuration was modified during the meeting which resulted in more reasonable confidence intervals. The Group agreed that the ASPIC model should be updated with the latest catch and CPUE information. Status and diagnostics In general, all the models predicted that at some stage in the recent past the southern albacore stock had been undergoing overfishing and had been overfished. In these cases, except for one (Run07) model, the fishing pressure appears to have decline in recent years which translated into a subsequent increase in stock biomass. The results based on the four base cases suggested that the exploitation level in recent years varied between cases (B 2012 /B MSY ranged from to and F 2011 /F MSY from to 1.301, Figure 82 and Table 17). To generate confidence intervals, 500 bootstrap trials were conducted for each model. The bootstrapped results for 12
13 N & S ALB STOCK ASSESSMENT Sukarrieta 2013` the four cases are shown in Figure 83 (Kobe I plot) and Figure 84. (piechart). For Run07, the majority of realizations ended up in the red quadrant of the Koble plot (overfished and overfishing), while for other runs, the results were more optimistic with some of the realizations occurring in the green quadrant. MSY was estimated to range from 22,620 t to 28,060 t (Table 17) which was close to the total catch for 2011 (24,122t). Several sensitivity and retrospective analyses were conducted for one scenario (Run08) of ASPIC model (Table 18, Figure 73). Scenarios with the Uruguay longline index separated ( and ) are included because this fishery targeted bigeye tuna and swordfish for the first and second period, respectively. As for sensitivity analyses, B-ratio of initial period changed for different B1/K, and using only Uruguay and Japanese (by-catch period) index made results more pessimistic and optimistic, respectively. As for retrospective analyses, large difference was observed when data for the last 6 or more years were removed Bayesian Surplus Production Model (BSP) Document SCRS/2013/123 presented an update of the Bayesian Surplus Production (BSP) model that was applied to the South Atlantic albacore stock in the 2011 assessment using an additional two years of catch data and the CPUE series recommended by the 2013 Albacore Data Preparatory Meeting. The same informative priors were used as in 2011, as well as an alternative prior for r that was less informative. The alternative models were used to predict the probability of the stock achieving a biomass above B MSY under a range of management scenarios. Kobe plots were also produced. Estimates of current status were strongly dependent on which method was used to weight the CPUE data points and with catch weighting being more optimistic. The choice of prior for r did not strongly influence the estimate of stock status, although the less informative prior produced broader credible intervals. Methods The Bayesian Surplus Production Model (BSP) was applied to South Atlantic albacore for the same four base case model scenarios that were used for ASPIC. The models were: (1) equal weighting of indices, Schaefer model; (2) catch weighting, Schaefer model; (3) equal weighting, Fox model with B MSY /K=0.37; and (4) catch weighting, Fox model with B MSY /K=0.37. For all four base case models the same Bayesian prior distributions were used as in the 2011 assessment. The prior for the biomass in 1956 relative to K was lognormal with a mean of 0.9 and a log standard deviation of 0.1 implying that the population was close to unfished in the first year of the fishery. The prior for K was uniform in log space. An informative prior for the intrinsic rate of population increase r was developed as shown in Babcock (2012) and the 2011 assessment, and was approximated by a t distribution with mean 0.2, variance and df 10. The model was fitted to catch data from 1956 to Catches in 2012 and 2013 were assumed to equal the average from years The CPUE indices used were the Japanese longline early, Japanese longline late, Chinese Taipei longline, Uruguay longline early, and Uruguay longline late. In addition to the four base case runs, sensitivity analyses were conducted to evaluate the implications of using different CPUE series and different informative priors on the model parameters (Table 19). Retrospective analyses were also conducted. The BSP software, version 1, available from the ICCAT catalog of methods, was used to estimate the marginal posterior distributions using the sampling-importance resampling (SIR) algorithm. Either the priors or a multivariate-t distribution were used to integrate the posterior distribution, whichever produced adequate convergence diagnostics. A random draw of 5000 samples from the joint posterior distribution was used to estimate the median trajectory and 80% credible intervals, given a range of constant catch strategies and constant fishing mortality rate strategies. A subsample of 500 draws was used for the construction of the Kobe results. Status and diagnostics All four of the base case BSP models estimated a historical decline in the abundance of South Atlantic albacore, followed by an increasing trend over the last 10 years (Figure 74). However, the current status relative to BB MSY and F MSY depended on the model formulation (Figure 82, Table 20). The models with catch weighting were more optimistic than the models with equal weighting. The Schaeffer and Fox model formulations estimated similar trends, and similar depletion since 1956; however, because BB MSY /K is lower in the Fox model, the Fox model estimated higher values of B current /BB MSY. The credible intervals of the estimates if B/BB MSY and F/FB MSY were quite broad, especially in the case with catch weights (Figure 75). 13
14 N & S ALB STOCK ASSESSMENT Sukarrieta 2013` Retrospective analysis was applied to the Schaefer model cases, with both equal and catch weighting (Figure 76). In both cases, the projections generated from models with data through 2005 were quite similar to the current assessment, implying that the model is adequately capturing the dynamics of South Atlantic albacore. Plots of the CPUE residuals against year show that there were trends in the residuals, especially in the early Japanese longline series and the late Uruguay series (Figure 77). The residuals were normally distributed according to the qq-normal plots. When CPUE series were removed from the model, the most optimistic model was the one that included only the Japanese longline fishery and the most pessimistic included both Chinese Taipei and Uruguay (Figure 78). When alternative priors were used, the median biomass trajectory was the same as the base case, except for the cases with uniform priors on r and K, with catch weighting of the indices (Figure 79 and Figure 81). For the case with equal weighting and the Schaeffer model (Figure 80a), the posteriors of r and K had a similar mode for all three priors of K, with more informative priors providing narrow credible intervals. In contrast, the runs with catch weighting (Figure 80b), the posterior of K is very similar to the prior, implying that there is very little information in the data to estimate r and K for the catch weighting case. These results show that the data with equal weighting provide more information to estimate the model parameters. Nevertheless, the model with catch weighting may more accurately reflect the true trends, so all four models continued to be used as base cases Summary of stock status The eight ASPIC and BSP models show fairly consistent trends in B/B MSY and F/F MSY over time (Figure 82). The estimated median current status in 2011is around B/B MSY =1 and F/F MSY =1 for all models (Figure 83). The BSP models were slightly more optimistic in the median than the ASPIC runs, but had a larger range of uncertainty. Kobe pie charts of status in 2011 vary between models (Figure 84). Averaging across all eight models, the probability of both B<B MSY and F>F MSY (red) is 0.57, and the probability of both B>B MSY and F<F MSY (green) is 0.30 and the probability of yellow is Projections In this section, the results of the projections used to provide management advice are described. 5.1 North The results shown in this section were produced by projecting forward the estimated 2011 populations presented in section with alternative harvest control rules (HCR). The seven scenarios investigated in production modeling using 501 bootstrap outcomes each were projected and considered equally plausible. The alternative harvest control rules include alternative target fishing mortalities (Ftarget=[0.7, 0.75, 0.8, 0.85, 0.9 and 1] x FB MSY ), threshold biomass levels of [0.6, 0.8 and 1] x BB MSY and a biomass limit reference point of BB Lim =0.4 x BB MSY. In the forward projections, the HCR is evaluated every three years and the fishing mortality is projected assuming perfect implementation. The outcomes of the projections are shown in Figure 85 and Table 21, which indicate the projected probability of being Green within the time-frame indicated. Expected average catch for the first 3 years, as well as cumulated catch for each future 5 year period are also shown. 5.2 South ASPIC projections Based on bootstrapping (500 times) of each scenario, future projections were conducted. Projection period is 15 years ( ). Constant future catch was set at 14,000 to 36,000t (at 2,000 t interval) or constant F at 0.75*F MSY to 1.00*F MSY (at 0.05*F MSY interval) was assumed. Catch for 2012 and 2013 was assumed to be equal to average (20,937 t) for both constant catch and constant F scenarios. Software package ASPICP ver was used for future projections. The results of these projections under constant catch and constant F are provided in Figures 86 and 87, respectively, which show the median trajectory at the different constant catch scenarios. Figure 88 shows predicted yield under constant F scenario. Kobe II matrixes (probability of not exceeding MSY level) are shown in Table 22 for each ASPIC run. These results 14
15 N & S ALB STOCK ASSESSMENT Sukarrieta 2013` would indicate that catches in excess of 26,000 t or F in excess of 0.85*F MSY would result in the reduction of the resource after 15 years, in almost all model runs. The runs assuming unweighted CPUE series are in general more optimistic than the weighted CPUE series BSP projections Basically projection scenarios are the same as those for ASPIC for south Atlantic. Under a constant catch policy, the median biomass is expected to increase above B MSY within 10 years with 50% probability for TACs from to depending on the scenario (Table 23, Figure 89). With constant harvest rates, harvest rates below F MSY allowed the population to stay above B MSY with a high probability for all scenarios except the case with equal weighting and the Schaeffer model. When F is equal to F MSY, the probability of achieving B MSY is near zero, because the population trajectory asymptotes before reaching B MSY Projections for the South Atlantic Combining all eight ASPIC and BSP model scenarios with equal probability, the Kobe matrix probabilities (Table 24, Figure 90) indicate that a harvest policy of either 0.90 F MSY or a TAC of would reduce F below F MSY with more than 70% probability within three years. Increasing B above B MSY requires greater reductions in fishing mortality. A policy of 0.75 F/F MSY would have a 85% chance of B>B MSY by A TAC of would have 70% probability of rebuilding by The Kobe plot for the South Atlantic stock assessment is presented in Figure Recommendations 6.1 Research and statistics The Group recommended further elaboration of the MSE framework being developed for albacore tuna. Although advances were recognized by the Group, further work should be carried out to permit a better characterization of uncertainty in current and future stock condition. The Group recognizes the need to incorporate environmental studies in albacore and likewise assessments. The Group was exposed to new information suggesting that the mixed layer depth might impact catchability of surface fisheries. The Group recommends further research to confirm this, as well as to inspect sources of historical environmental information that might help integrate this information in CPUE standardizations of surface fisheries. The Group also recommended further research to better characterize the nature and, if possible, quantify potential mixing rates between the Atlantic and the Indian Oceans. The Group recommends increasing efforts to obtain French mid-water trawl and other fisheries historical series of catch, effort, catch at size, geographical distribution and other related fisheries information. The Group expressed concern that spatial shifts in longline fisheries might have affected the trends of their standardized CPUE series. Thus, the Group recommends to more fully explore better ways to incorporate spatial effects on CPUE standardization. The Group noted that the Chinese Taipei longline size sampling data showed some patterns that might not reflect changes in the population. Thus, the group requested to clarify the reasons behind the patterns in the data to the extent possible. Given that spatio-temporal dynamics of longline fisheries appear to affect their selectivity pattern, the group recommends to redefine the fisheries in the Multifan-CL and SS applications in the future, considering the nature of these fisheries. In general, the Group noted that important uncertainties remain in the biology, fisheries and modeling of North Atlantic albacore. Thus, the group continues to recommend that the Albacore Research Program be funded. 6.2 Management advice North Atlantic A range of time-frames and probability levels for achieving the Commission s goals established in Rec are provided in Table Outlook 2. Longer time frames provide more options for HCR parameters that project 15
16 N & S ALB STOCK ASSESSMENT Sukarrieta 2013` higher probabilities of being in the green quadrant of the Kobe Plot. The HCR projections indicate that if, for example, the Commission adopts a high probability of 75% within a 10 year time-frame, then the HCR with a Biomass Threshold at B MSY paired with a Target F of 0.9 F MSY would provide the highest expected 10 year cumulative catch amongst options and the average catch expected from would be approximately 26,200t. In contrast, if the Commission considers a high probability of 60% sufficient within a 5 year timeframe, then the HCR with a Biomass Threshold at B MSY paired with a Target F of 0.9 F MSY would also meet that objective and provide the highest expected cumulative catch amongst options that would provide at least 60% probability within 5 years and the average catch from would remain approximately 26,200 t. Consideration of implementation and other uncertainties in these projections would likely change the probability level estimates. South Atlantic Projections at a level consistent with the 2013 TAC (24,000 t) showed that probabilities of being in the green quadrant of the Kobe plot would exceed 50% only after Similar probabilities could be achieved earlier with lower TAC values. With catches around 20,000 t, probabilities of 50% would be exceeded by 2015, and probabilities of 60% would be exceeded by Further reductions in catches would increase the probability of recovery in those timeframes. Likewise, increases would reduce rebuilding probabilities and extend the timeframes. Catches over the current TAC (24,000 t) will not permit the rebuilding of the stock with at least 50% probability over the projection timeframe. 7. Other matters The Group discussed the convenience of using different approaches to assess the Atlantic albacore stocks status. According to the procedure established in ICCAT, the use of a variety of methods by the SCRS to conduct stock assessment is valuable. However, this procedure requires a significant amount of preparatory work as well as an important request of data, particularly if statistical integrated models are used. In the case of the current North Atlantic albacore assessment, the use of two statistical integrated models, VPA and production models as well as the implementation of MSE, have been only possible because a detailed and tight work plan was prepared by the Albacore Species Group, this plan was well led by the Albacore Rapporteur and strictly followed and two meetings (data preparatory and assessment) have been held. However, the implementation of the work plan has also implied an important amount of preparatory work for both the scientists involved in the assessment and the Secretariat. Taking into account the number of meetings scheduled every year for which the Secretariat must conduct preparatory and posterior work, stock assessments implying such amount of work will be difficult to assume by the Secretariat in the future. The Group also evaluated the advantages and disadvantages of using methods, such as VPA, based in CAA when significant uncertainties in ageing exist. Regarding the statistical integrated models, the Group evaluated positively the use of two models (MFCL and SS3) as a way to test the robustness of these models in assessing the North Atlantic albacore. However, the Group agreed that it would be difficult to maintain such a complex assessment in the future and that further discussions on the best assessment models for North and South Atlantic albacore will be needed. Evaluation of different management procedures within an MSE framework could help the Group in future decisions about this issue. Regarding future work, the Group discussed how the Data Preparatory meeting could be better used to reexamine and evaluate the previous assessment model configurations, assumptions, and the various data fit residuals. The objective of this proposal is to attempt to ensure increased useful continuity from the assessment meeting back to the next data meeting. It was noted that residual plots to data such as length compositions could be quite useful is detecting such things as mis-specified area and/or gear assignments that may exist in the Secretariat database. In a similar manner, residual to CPUE time series may help in the subsequent evaluation of those time series and help provide information with regard to the future inclusion or exclusion of that data. In this manner, the Data Preparatory meeting may be better characterized as a Pre-Assessment Meeting to better reflect a wider objective that could include a more directed revisit of the past assessment efforts. 16
17 N & S ALB STOCK ASSESSMENT Sukarrieta 2013` 8. Adoption of the report and closure The report was adopted and the meeting adjourned. Literature cited Anon. 2010, Report of the 2009 ICCAT Albacore Stock Assessment Session (Madrid, Spain, July 13 to 18, 2009). Collect. Vol. Sci. Pap. ICCAT, 65(4): Anon. 2013, Report of the 2012 ICCAT Working Group on Stock Assessment Methods (Madrid, Spain, April 16 to 20, 2012). Collect. Vol. Sci. Pap. ICCAT, 69 (in press). Anon. 2011, Report of the 2011 joint meeting of the ICCAT Working Group on Stock Assessment Methods and Bluefin tuna Species Group to analyze assessment methods developed under the GBYP and electronic tagging. Bard, F.X. 1981, Le thon germon (Thunnus alalunga) de l OcéanAtlantique. Ph.D. Thesis presented at the University of Paris, 333 p. Domingo, A., Pons, M., Jiménez, S., Miller, P., Barceló, C. and Swimmer, Y. 2012, Circle hook performance in the Uruguayan pelagic longline fishery. Bulletin of Marine Science. 88(3): Farley, J.H., Williams, A.J., Hoyle, S.D., Davies, C.R., Nicol, S.J. 2013, Reproductive Dynamics and Potential Annual Fecundity of South Pacific Albacore Tuna (Thunnus alalunga). PLoS ONE 8(4): e doi: /journal.pone Foreman, T.J. 1980, Synopsis of biological data on the albacore tuna, Thunnus alalunga (Bonnaterre, 1788), in the Pacific Ocean. Inter-Amer. Trop. Tuna Comm., Spec. Rep., 2: ICCAT, 2012, Report for Biennial Period, , Part II. ICCAT, , ICCAT Manual (Chapter 2. Albacore). International Commission for the Conservation of Atlantic Tuna. In: ICCAT Publications [on-line]. Updated [Cited 01/27/]. ISBN (Electronic Edition): ICES 2007, Report of the Study Group on Risk Assessment and Management Advice. ICES CM 2007/RMC: 02. Kell, L., O Brien, C., Smith, M. Stokes, T. and Rackham, B. 1999, An evaluation of management procedures for implementing a precautionary approach in the ICES context for North Sea plaice (Pleuronectes platessa). ICES Journal of Marine Science: Journal du Conseil, 56(6): Kell, L.T., De Oliveira, J.A., Punt, A.E., McAllister, M.K. and Kuikka, S. 2006, Operational management procedures: An introduction to the use of evaluation framework. Developments in Aquaculture and Fisheries Science, 36: Kimura, D.K. and Chikuni, S. 1987, Mixtures of empirical distributions: an iterative application of the agelength key. Biometrics 43: Lee, L.K. and Yeh, S.Y. 2007, Age and growth of South Atlantic albacore a revision after the revelation of otolith daily ring counts. Collect. Vol. Sci. Pap. ICCAT, 60(2): Penney, A Morphometric relationships, annual catch-at-size for South African-caught South Atlantic albacore (Thunnus alalunga). Collect. Vol. Sci. Pap. ICCAT, 42(1): Santiago, J. 1993, A new length-weight relationship for the North Atlantic albacore. Collect. Vol. Sci. Pap, ICCAT, 40(2): Santiago, J. 2004, Dinámica de la población de atún blanco (Thunnus alalunga, Bonaterre 1788) del Atlántico Norte. Tesis Doctoral, Univ. País Vasco, 354 pp. Santiago, J. and Arrizabalaga, H. 2005, "An integrated growth study for North Atlantic albacore (Thunnus alalunga Bonn. 1788)." Ices J. Mar. Sci. 62: Schrippa, M.J. 2009, Construction and evaluation of a two-sex assessment model for North Atlantic albacore (SCRS/2009/148). 17
18 N & S ALB STOCK ASSESSMENT Sukarrieta 2013` Serchuk, F.M. and Grainger, R.J.R. 1992, Development of the basis and form of ICES fisheries management advice: Historical background ( ) and the new form of ACFM advice (1991-??). ICES CM 1992/Assess: 20. Williams, A.J., Farley, J.H., Hoyle, S.D., Davies, C.R., Nicol, S.J. 2012, Spatial and Sex-specific Variation in Growth of Albacore Tuna (Thunnus alalunga) across the South Pacific Ocean. PLoS ONE 7(6): e doi: /journal.pone

19 Table 1. Estimated CAA for N-ALB. 19

20 Table 2. Quarterly mean lengths at age and standard deviations used to generate length at age distributions using Kimura-Chikuni. 20
21 Table 3. Levels of Target F, Biomass threshold, and Biomass limit levels to be used to inform the Commission for its determination of high probability and as soon as possible, subject to the decision framework of Rec FTarget: BThreshold: Blimit:.75F MSY,.8F MSY,.85F MSY,.9F MSY,.95F MSY, F MSY.6B MSY,.8B MSY, B MSY.4B MSY Table 4. MFCL model runs and specifications (all alternate runs are the same as the base run except for the changes specified. Run Specifications Base Model specifications provided in SCRS/2013/058 Alt1 Includes Chinese Taipei LL SF data and allows dome-shaped selectivity for this fleet Alt2 Model starts in 1950 Alt3 All SF data down-weighted Alt4 Japanese LL CPUE data no longer down-weighted Alt5 Includes the Chen and Watanabe age-specific natural mortality vector (Santiago 2004) Alt6 Excludes final 4 years of data ( ) Alt7 Includes equal weights for Japan and Chinese Taipei LL SF and CPUE data (similar to 2009 continuity run) Alt8 Includes total catch in weight but effort calculated from CPUE in numbers (incorrect effort data calculation) Tag Includes tagging data for release events that occurred between 1988 and 1991 Table 5. Key outputs estimated by the MFCL base and alternate runs (Red values indicate the benchmark is below MSY). Values for F/F MSY, B/B MSY and SSB/SSB MSY are averages of the values for the last 3 years of the model estimated trajectories, not including the final year. Run Steepness MSY F/F MSY B/B MSY SSB/SSB MSY Base Alt Alt Alt Alt Alt Alt Alt Alt Tag

22 Table 6. Standard deviation of the effort deviates for each CPUE series for each model. Fishery 1 Fishery 2 Fishery 3 Fishery 4 Fishery 5 Fishery 7 Fishery 8 Fishery 10 Alt Alt Alt Alt Base Tag Table 7. Summary of the CPUE series to inform ASPIC in each scenario. Table 8. Estimated parameters for the Schaefer model for the 7 scenarios tested. Scenario MSY F MSY B MSY K r B/B MSY F/F MSY
23 Table 9. Description of exploratory Stock Synthesis runs. 23
24 Table 10. Residual mean square error from SS exploratory runs. RESIDUAL MEAN SQUARE ERROR (RMSE) Fleet Number Flt Name Run 1 Run 2 Run 3 Run 4 Run 5 Run 6 Run 7 Run 8 Run 10 (ALBN01 ESP_BBrec) (ALBN02 EsFr_TR) (ALBN03 EsFr_BBear) (ALBN04 PRT_BB) (ALBN05 JPN_LLtrg) (ALBN06 JPN_LLtra) (ALBN07 JPN_LLbyc) (ALBN08 TAI_LL) (ALBN09 TAI_LL) (ALBN10 TAI_LL) (ALBN11 KrPaCu_LL) (ALBN12 Other_SU)
25 Table 11. Description of exploratory Stock Synthesis runs. 25
26 Table 12. VPA model estimates of North Atlantic albacore Beverton Holt (BH) stock recruitment parameters, maximum sustainable yield, 2011 stock status, and probability of SSB>SSB MSY and F<F MSY (green quadrant in Kobe phase diagram) from the base model and influential sensitivity runs. Note that benchmarks and stock status estimates for the Japan longline index sensitivity run are not presented due to a lack of fit of the stock recruitment curve from VPA estimates. Run Quantile BH-a BH-b BH-σ MSY SSB/SSB MSY F/F MSY Pr(Green) VPA base model Median 1.1E E E VPA USA longline indices removed VPA age-varying mortality VPA historical period included 80% CI Lower Limit 1.0E E E % CI Upper Limit 1.2E E E Median 1.1E E E % CI Lower Limit 9.8E E E % CI Upper Limit 1.1E E E Median 2.0E E E % CI Lower Limit 1.8E E E % CI Upper Limit 2.3E E E Median 2.0E E E % CI Lower Limit 1.8E E E % CI Upper Limit 2.2E E E
27 Table 13. Fleet descriptions used in the ASPIC models for South Atlantic albacore. Fleet Fleet 1 Fleet 2 ( ) Fleet 3 ( ) Fleet 4 ( ) CPUE Catch Chinese Taipei (LL) Chinese Taipei (LL) Korea (LL) Japan (LL) None ( ) China LL E. C. Spain (LL) E. C. Portugal (LL) Japan (LL) Philippines (LL) St Vincent and Grenadier (LL) USA (LL) USSR (LL) Vanuatu (LL) Honduras (LL) Nei (LL) Côte D'Ivoire (LL) EU. United Kingdom (LL) Seychelles (LL) UK. Sta Helena (LL) Fleet 5 Fleet 6 ( ) Fleet 7 ( ) Fleet 8 None None Uruguay (LL) Brazil (LL, SU) Panama (LL) South Africa (LL, UN) Argentina (LL, TW, UN) Belize (LL) Cambodia (LL) Cuba (LL, UN) Namibia (LL) Brazil (BB, GN, HL, PS, UN) E. C. Spain (PS) E. C. France (PS) E. C. Portugal (BB, PS) Japan (BB, PS) Namibia (BB) Korea (BB) Maroc (PS) Panama (PS) South Africa (BB, HL, PS, RR, SP) USA (PS) USSR (PS, SU) UK St Helena (BB, RR) Chinese Taipei (GN) Nei (PS) Netherlands (PS) Argentina (PS) Belize (PS) Cape Verde (PS) Curaçao (PS) Guatemala (PS) Uruguay (LL) 27
28 Table 14. Catches (t) for each fleet for ASPIC for south Atlantic albacore listed in Table 13. Year Fleet 1 Fleet 2 Fleet 3 Fleet 4 Fleet 5 Fleet 6 Fleet 7 Fleet , ,015 1, ,673 1, ,893 1, ,422 2, ,104 2, ,738 2, ,309 1, ,275 21, ,412 7, ,489 11,857 1, ,732 6, ,255 5, ,323 3, ,640 2, , , , , , , , , , , , ,024 2, , , , ,114 4, , ,360 2, , ,061 4, , ,272 1, , ,263 7, , ,733 9, , , , , , , , ,333 3, ,068 1,001 3,374 9, , ,753 8, , ,684 10, , , , ,165 7, , , , ,098 10, ,391 1,560 1,651 6, ,239 3,041 4,027 6, ,834 5,235 6,834 10, ,321 1,142 3,097 10, , ,641 7, , , ,772 1, , ,359 2,247 3,041 6, ,202 1, , ,054 2, , ,052 2, , ,105 1, , ,102 1,888 1,417 7,
29 Table 11. Standardized CPUE series included in the ASPIC models for South Atlantic albacore. Fleet represented Fleet 1 Fleet 2 Fleet 3 Fleet 4 Fleet 5 Fleet 6 Fleet 7 Fleet 8 CPUE Chinese Uruguay Japan LL1 (None) Japan LL3 (None) (None) (None) series flag Taipei LL LL
30 Table 16. Details of model runs in the ASPIC for South Atlantic albacore. Run Weight B 1 /K Model (fixed) 2 Equal for all fleets 0.9 Logistic 6 Equal for all fleets 0.9 Fox 7 Weighted by catch 0.9 Logistic 8 Weighted by catch 0.9 Fox Table 17. Results of the ASPIC model runs for South Atlantic albacore with those of 2011 assessment. Results 2011 results Model MSY B F run (t) MSY B MSY (t) 2012 / F 2011 / MSY B K (t) r F 2009 / F 2009 / B MSY F MSY (t) MSY B MSY F MSY Run2 28, , , , Run6 25, , , , Run7 22, , , , Run8 24, , , , Table 18. Scenarios of sensitivity analyses for the ASPIC model runs for South Atlantic albacore. Scenario Abbreviation in the graph B1/K fix at 0.8 B1/K 0.8 B1/K fix at 1.0 B1/K 1.0 Uruguay index separated (-1991 and 1992-) sep. Uruguay index Without index of Japan LL1 ( ) no JPLL1 Only with Chinese Taipei LL index only TWLL Only with Chinese Taipei LL and JPN LL1 indices only TWLL&JPLL1 Only with index of Japan LL3 ( ) only JPLL3 Only with Uruguay LL indices (separated) only Uruguay sep. 30
31 Table 19. Model specifications for South Atlantic BSP model runs. Model runs F1-F4 are the base cases. For the sensitivity analyses, specifications are the same as the base cases except where indicated. Run name Weighting Model Series End year priors Note F1 equal Schaefer all 2011 base Base F2 catch Schaefer all 2011 base Base F3 equal Fox all 2011 base Base F4 catch Fox all 2011 base Base S3 equal Schaefer Chinese Taipei 2011 base cpue sensitivity S6 equal Schaefer Uruguay 2011 base cpue sensitivity S7 equal Schaefer Japan 2011 base cpue sensitivity S8 equal Schaefer CHT+URU 2011 base cpue sensitivity S9 equal Schaefer CHT+JLL 2011 base cpue sensitivity S10 equal Schaefer URU+JLL 2011 base cpue sensitivity F1p2 equal Schaefer all 2011 Unif K prior sensitivity F2p2 catch Schaefer all 2011 Unif K prior sensitivity F3p2 equal Fox all 2011 Unif K prior sensitivity F4p2 catch Fox all 2011 Unif K prior sensitivity F1p3 equal Schaefer all 2011 Bo/K mean 1 prior sensitivity F2p3 catch Schaefer all 2011 Bo/K mean 1 prior sensitivity F3p3 equal Fox all 2011 Bo/K mean 1 prior sensitivity F3p3 catch Fox all 2011 Bo/K mean 1 prior sensitivity F1p4 equal Schaefer all 2011 Unif K, r prior sensitivity F2p4 catch Schaefer all 2011 Unif K, r prior sensitivity F3p4 equal Fox all 2011 Unif K, r prior sensitivity F4p4 catch Fox all 2011 Unif K, r prior sensitivity F1R1-F1R6 equal Schaefer all base retrospective F3R1-F3R6 catch Schaefer all base retrospective Table 20. Marginal posterior mean values of the parameters (CVs in parentheses) for the four BSP base cases. Variable SAf 1 SAf 2 SAf 3 SAf 4 K (1000) (0.56) (0.55) (0.55) (0.58) r 0.18(0.62) 0.23(0.61) 0.23(0.83) 0.42(0.85) MSY (1000) 23.23(0.37) 37.33(0.81) 23.58(0.66) 52.24(1.16) Bcur (1000) (0.66) (0.75) (0.64) (0.78) Binit (1000) (0.56) (0.55) (0.55) (0.58) Bcur/Binit 0.47(0.32) 0.68(0.35) 0.45(0.32) 0.67(0.36) Ccur/MSY 1.00(0.42) 0.78(0.57) 1.08(0.58) 0.75(0.82) Bcur/Bmsy 0.87(0.32) 1.25(0.35) 1.13(0.31) 1.68(0.36) Fcur/Fmsy 1.35(0.72) 0.89(1.25) 1.14(0.90) 0.69(1.58) 31
32 Table 21. Kobe 2 Strategy Matrix probability of being Green over time for Northern albacore using the HCR parameters indicated. Kobe II Strategy matrix. Future probability of SSB>SSBMSY and F<FMSY for different combinations of Bthreshold and Ftarget values Average catch over Cumulative catch over: Bthreshold Ftarget years 5 years 10 years 15 years 20 years.6bmsy 0.75Fmsy , , , , ,434.6Bmsy 0.8Fmsy , , , , ,668.6Bmsy 0.85Fmsy , , , , ,774.6Bmsy 0.9Fmsy , , , , ,809.6Bmsy 0.95Fmsy , , , , ,835.6Bmsy Fmsy , , , , ,916.8Bmsy 0.75Fmsy , , , , ,642.8Bmsy 0.8Fmsy , , , , ,152.8Bmsy 0.85Fmsy , , , , ,571.8Bmsy 0.9Fmsy , , , , ,954.8Bmsy 0.95Fmsy , , , , ,359.8Bmsy Fmsy , , , , ,841 Bmsy 0.75Fmsy , , , , ,569 Bmsy 0.8Fmsy , , , , ,882 Bmsy 0.85Fmsy , , , , ,068 Bmsy 0.9Fmsy , , , , ,130 Bmsy 0.95Fmsy , , , , ,030 Bmsy Fmsy , , , , ,587 32
33 Table 22. Kobe II risk matrix for B-ratio and F-ratio (probability of not exceeding MSY level) based on ASPIC results for south Atlantic albacore Run02 Probability B>B MSY Catch (t) ,000 23% 29% 38% 70% 90% 95% 95% 96% 96% 96% 96% 96% 96% 96% 96% 96% 16,000 23% 29% 38% 65% 86% 92% 94% 95% 95% 95% 95% 95% 95% 96% 96% 96% 18,000 23% 29% 38% 61% 81% 90% 93% 94% 94% 94% 94% 94% 94% 94% 95% 95% 20,000 23% 29% 38% 57% 72% 84% 89% 91% 92% 93% 93% 93% 93% 93% 93% 93% 22,000 23% 29% 38% 52% 63% 74% 82% 85% 87% 88% 89% 89% 89% 89% 89% 89% 24,000 23% 29% 38% 49% 54% 61% 68% 73% 75% 79% 80% 80% 80% 80% 80% 80% 26,000 23% 29% 38% 43% 47% 49% 50% 53% 55% 56% 59% 59% 60% 61% 61% 61% 28,000 23% 29% 38% 37% 35% 33% 31% 29% 28% 26% 24% 22% 21% 20% 18% 17% 30,000 23% 29% 38% 34% 28% 22% 17% 12% 9% 7% 5% 3% 1% 1% 0% 0% 32,000 23% 29% 38% 30% 22% 14% 9% 5% 3% 1% 0% 0% 0% 0% 0% 0% 34,000 23% 29% 38% 26% 17% 9% 4% 3% 1% 0% 0% 0% 0% 0% 0% 0% 36,000 23% 29% 38% 23% 12% 5% 3% 1% 1% 0% 0% 0% 0% 0% 0% 0% F *FMSY 23% 29% 38% 56% 65% 70% 75% 76% 77% 78% 78% 79% 79% 79% 79% 79% 0.80*FMSY 23% 29% 38% 52% 61% 66% 68% 70% 72% 73% 74% 74% 74% 74% 74% 74% 0.85*FMSY 23% 29% 38% 51% 57% 61% 64% 66% 67% 67% 68% 68% 68% 68% 68% 69% 0.90*FMSY 23% 29% 38% 48% 53% 56% 58% 59% 60% 61% 62% 62% 62% 62% 62% 63% 0.95*FMSY 23% 29% 38% 44% 48% 50% 52% 54% 55% 55% 56% 56% 56% 56% 56% 57% 1.00*FMSY 23% 29% 38% 40% 42% 43% 44% 44% 45% 45% 45% 45% 46% 46% 46% 46% Run02 Probability F<F MSY Catch (t) ,000 71% 88% 100% 100% 100% 100% 100% 100% 100% 100% 100% 100% 100% 100% 100% 16,000 71% 88% 99% 100% 100% 100% 100% 100% 100% 100% 100% 100% 100% 100% 100% 18,000 71% 88% 98% 99% 100% 100% 100% 100% 100% 100% 100% 100% 100% 100% 100% 20,000 71% 88% 96% 98% 99% 99% 99% 99% 99% 99% 99% 99% 99% 99% 99% 22,000 71% 88% 91% 94% 96% 97% 97% 97% 97% 97% 97% 97% 97% 97% 97% 24,000 71% 88% 74% 85% 89% 91% 92% 92% 92% 92% 91% 91% 91% 90% 90% 26,000 71% 88% 58% 60% 63% 66% 69% 71% 73% 74% 73% 74% 73% 72% 72% 28,000 71% 88% 38% 36% 34% 33% 31% 30% 28% 27% 24% 23% 22% 20% 18% 30,000 71% 88% 26% 21% 16% 11% 9% 7% 4% 3% 1% 1% 0% 0% 0% 32,000 71% 88% 16% 10% 7% 4% 3% 1% 1% 0% 0% 0% 0% 0% 0% 34,000 71% 88% 9% 6% 4% 2% 1% 1% 0% 0% 0% 0% 0% 0% 0% 36,000 71% 88% 6% 4% 2% 1% 1% 0% 0% 0% 0% 0% 0% 0% 0% F *FMSY 71% 88% 89% 89% 89% 89% 89% 89% 89% 89% 89% 89% 89% 89% 89% 0.80*FMSY 71% 88% 81% 81% 81% 81% 81% 81% 81% 81% 81% 81% 81% 81% 81% 0.85*FMSY 71% 88% 73% 73% 73% 73% 73% 73% 73% 73% 73% 73% 73% 73% 73% 0.90*FMSY 71% 88% 66% 66% 66% 66% 66% 66% 66% 66% 66% 66% 66% 66% 66% 0.95*FMSY 71% 88% 60% 60% 60% 60% 60% 60% 60% 60% 60% 60% 60% 60% 60% 1.00*FMSY 71% 88% 52% 52% 52% 52% 52% 52% 52% 52% 52% 52% 52% 52% 52% Run02 Probability of being green 33
34 Catch (t) ,000 23% 29% 38% 70% 90% 95% 95% 96% 96% 96% 96% 96% 96% 96% 96% 16,000 23% 29% 38% 65% 86% 92% 94% 95% 95% 95% 95% 95% 95% 96% 96% 18,000 23% 29% 38% 61% 81% 90% 93% 94% 94% 94% 94% 94% 94% 94% 95% 20,000 23% 29% 38% 57% 72% 84% 89% 91% 92% 93% 93% 93% 93% 93% 93% 22,000 23% 29% 38% 52% 63% 74% 82% 85% 87% 88% 89% 89% 89% 89% 89% 24,000 23% 29% 38% 49% 54% 61% 68% 73% 75% 79% 80% 80% 80% 80% 80% 26,000 23% 29% 38% 43% 47% 49% 50% 53% 55% 56% 59% 59% 60% 61% 61% 28,000 23% 29% 38% 36% 34% 32% 31% 28% 27% 26% 23% 22% 20% 19% 17% 30,000 23% 29% 26% 21% 16% 11% 9% 7% 4% 3% 1% 1% 0% 0% 0% 32,000 23% 29% 16% 10% 7% 4% 3% 1% 1% 0% 0% 0% 0% 0% 0% 34,000 23% 29% 9% 6% 4% 2% 1% 1% 0% 0% 0% 0% 0% 0% 0% 36,000 23% 29% 6% 4% 2% 1% 1% 0% 0% 0% 0% 0% 0% 0% 0% F *FMSY 23% 29% 38% 56% 65% 70% 75% 76% 77% 78% 78% 79% 79% 79% 79% 0.80*FMSY 23% 29% 38% 52% 61% 66% 68% 70% 72% 73% 74% 74% 74% 74% 74% 0.85*FMSY 23% 29% 38% 51% 57% 61% 64% 66% 67% 67% 68% 68% 68% 68% 68% 0.90*FMSY 23% 29% 38% 48% 53% 56% 58% 59% 60% 61% 62% 62% 62% 62% 62% 0.95*FMSY 23% 29% 38% 44% 48% 50% 52% 54% 55% 55% 56% 56% 56% 56% 56% 1.00*FMSY 23% 29% 38% 40% 42% 43% 44% 44% 45% 45% 45% 45% 46% 46% 46% Run06 Probability B>B MSY Catch (t) ,000 24% 28% 33% 50% 73% 90% 98% 100% 100% 100% 100% 100% 100% 100% 100% 100% 16,000 24% 28% 33% 48% 65% 82% 93% 99% 99% 100% 100% 100% 100% 100% 100% 100% 18,000 24% 28% 33% 44% 57% 72% 84% 93% 98% 99% 99% 99% 99% 99% 100% 100% 20,000 24% 28% 33% 41% 50% 60% 72% 81% 88% 94% 96% 98% 98% 99% 99% 99% 22,000 24% 28% 33% 37% 42% 49% 54% 62% 70% 76% 82% 85% 90% 92% 93% 93% 24,000 24% 28% 33% 34% 35% 36% 39% 41% 43% 46% 48% 51% 53% 56% 59% 61% 26,000 24% 28% 33% 31% 30% 28% 27% 26% 24% 23% 22% 20% 19% 17% 17% 16% 28,000 24% 28% 33% 28% 25% 22% 18% 15% 13% 11% 8% 7% 5% 4% 4% 3% 30,000 24% 28% 33% 26% 21% 16% 13% 10% 7% 5% 3% 3% 2% 1% 1% 0% 32,000 24% 28% 33% 25% 18% 12% 9% 6% 4% 3% 2% 1% 0% 0% 0% 0% 34,000 24% 28% 33% 23% 16% 11% 6% 4% 3% 1% 1% 0% 0% 0% 0% 0% 36,000 24% 28% 33% 20% 13% 8% 5% 3% 1% 1% 0% 0% 0% 0% 0% 0% F *FMSY 24% 28% 33% 43% 52% 61% 69% 74% 77% 79% 81% 82% 83% 84% 84% 85% 0.80*FMSY 24% 28% 33% 41% 49% 56% 61% 67% 71% 73% 74% 76% 77% 77% 77% 78% 0.85*FMSY 24% 28% 33% 39% 46% 51% 55% 59% 62% 65% 66% 69% 70% 71% 71% 72% 0.90*FMSY 24% 28% 33% 37% 42% 47% 50% 52% 54% 56% 57% 58% 59% 59% 61% 61% 0.95*FMSY 24% 28% 33% 36% 39% 42% 45% 47% 48% 49% 49% 50% 51% 52% 52% 52% 1.00*FMSY 24% 28% 33% 34% 36% 37% 38% 39% 40% 40% 41% 41% 41% 42% 43% 43% 34
35 Run06 Probability F<F MSY Catch (t) ,000 58% 68% 100% 100% 100% 100% 100% 100% 100% 100% 100% 100% 100% 100% 100% 16,000 58% 68% 100% 100% 100% 100% 100% 100% 100% 100% 100% 100% 100% 100% 100% 18,000 58% 68% 97% 100% 100% 100% 100% 100% 100% 100% 100% 100% 100% 100% 100% 20,000 58% 68% 85% 92% 98% 100% 100% 100% 100% 100% 100% 100% 100% 100% 100% 22,000 58% 68% 66% 74% 81% 88% 92% 96% 98% 98% 99% 99% 99% 99% 99% 24,000 58% 68% 47% 49% 51% 53% 57% 60% 63% 66% 69% 73% 75% 76% 77% 26,000 58% 68% 29% 27% 26% 25% 24% 23% 21% 20% 19% 17% 16% 15% 15% 28,000 58% 68% 19% 17% 14% 12% 10% 8% 7% 5% 4% 3% 3% 2% 2% 30,000 58% 68% 13% 10% 8% 6% 4% 3% 3% 2% 1% 1% 0% 0% 0% 32,000 58% 68% 8% 6% 4% 3% 2% 1% 1% 0% 0% 0% 0% 0% 0% 34,000 58% 68% 6% 4% 2% 2% 1% 0% 0% 0% 0% 0% 0% 0% 0% 36,000 58% 68% 4% 2% 1% 1% 0% 0% 0% 0% 0% 0% 0% 0% 0% F *FMSY 58% 68% 89% 89% 89% 89% 89% 89% 89% 89% 89% 89% 89% 89% 89% 0.80*FMSY 58% 68% 81% 81% 81% 81% 81% 81% 81% 81% 81% 81% 81% 81% 81% 0.85*FMSY 58% 68% 74% 74% 74% 74% 74% 74% 74% 74% 74% 74% 74% 74% 74% 0.90*FMSY 58% 68% 63% 63% 63% 63% 63% 63% 63% 63% 63% 63% 63% 63% 63% 0.95*FMSY 58% 68% 53% 53% 53% 53% 53% 53% 53% 53% 53% 53% 53% 53% 53% 1.00*FMSY 58% 68% 45% 45% 45% 45% 45% 45% 45% 45% 45% 45% 45% 45% 45% Run06 Probability of being green Catch (t) ,000 24% 28% 33% 50% 73% 90% 98% 100% 100% 100% 100% 100% 100% 100% 100% 16,000 24% 28% 33% 48% 65% 82% 93% 99% 99% 100% 100% 100% 100% 100% 100% 18,000 24% 28% 33% 44% 57% 72% 84% 93% 98% 99% 99% 99% 99% 99% 100% 20,000 24% 28% 33% 41% 50% 60% 72% 81% 88% 94% 96% 98% 98% 99% 99% 22,000 24% 28% 33% 37% 42% 49% 54% 62% 70% 76% 82% 85% 90% 92% 93% 24,000 24% 28% 33% 34% 35% 36% 39% 41% 43% 46% 48% 51% 53% 56% 59% 26,000 24% 28% 29% 27% 26% 25% 24% 23% 21% 20% 19% 17% 16% 15% 15% 28,000 24% 28% 19% 17% 14% 12% 10% 8% 7% 5% 4% 3% 3% 2% 2% 30,000 24% 28% 13% 10% 8% 6% 4% 3% 3% 2% 1% 1% 0% 0% 0% 32,000 24% 28% 8% 6% 4% 3% 2% 1% 1% 0% 0% 0% 0% 0% 0% 34,000 24% 28% 6% 4% 2% 2% 1% 0% 0% 0% 0% 0% 0% 0% 0% 36,000 24% 28% 4% 2% 1% 1% 0% 0% 0% 0% 0% 0% 0% 0% 0% F *FMSY 24% 28% 33% 43% 52% 61% 69% 74% 77% 79% 81% 82% 83% 84% 84% 0.80*FMSY 24% 28% 33% 41% 49% 56% 61% 67% 71% 73% 74% 76% 77% 77% 77% 0.85*FMSY 24% 28% 33% 39% 46% 51% 55% 59% 62% 65% 66% 69% 70% 71% 71% 0.90*FMSY 24% 28% 33% 37% 42% 47% 50% 52% 54% 56% 57% 58% 59% 59% 60% 0.95*FMSY 24% 28% 33% 36% 39% 42% 45% 47% 48% 49% 49% 50% 51% 51% 51% 1.00*FMSY 24% 28% 33% 34% 36% 37% 38% 39% 40% 40% 40% 40% 40% 41% 41% 35
36 Run07 Probability B>B MSY Catch (t) ,000 24% 24% 24% 25% 27% 29% 32% 36% 42% 53% 63% 68% 75% 79% 82% 87% 16,000 24% 24% 24% 24% 26% 27% 28% 31% 33% 38% 42% 50% 60% 66% 70% 75% 18,000 24% 24% 24% 24% 24% 25% 26% 27% 28% 29% 31% 32% 35% 38% 41% 48% 20,000 24% 24% 24% 23% 23% 23% 24% 23% 24% 24% 24% 24% 24% 24% 25% 25% 22,000 24% 24% 24% 23% 22% 22% 21% 20% 20% 19% 18% 17% 16% 15% 14% 13% 24,000 24% 24% 24% 23% 21% 20% 19% 17% 16% 15% 13% 12% 11% 11% 10% 10% 26,000 24% 24% 24% 22% 20% 18% 16% 15% 13% 12% 11% 11% 10% 9% 8% 6% 28,000 24% 24% 24% 21% 19% 16% 14% 13% 12% 11% 10% 9% 8% 6% 5% 4% 30,000 24% 24% 24% 21% 18% 15% 13% 11% 11% 10% 8% 7% 6% 5% 3% 3% 32,000 24% 24% 24% 20% 16% 14% 12% 11% 10% 8% 7% 5% 5% 4% 3% 2% 34,000 24% 24% 24% 19% 16% 13% 11% 10% 8% 7% 5% 5% 4% 3% 2% 1% 36,000 24% 24% 24% 19% 15% 12% 10% 9% 7% 6% 5% 4% 3% 2% 1% 0% F *FMSY 24% 24% 24% 25% 27% 29% 30% 34% 38% 42% 47% 55% 60% 65% 67% 70% 0.80*FMSY 24% 24% 24% 24% 26% 28% 29% 32% 34% 38% 41% 45% 52% 56% 60% 64% 0.85*FMSY 24% 24% 24% 24% 26% 27% 28% 29% 32% 33% 36% 39% 42% 46% 50% 55% 0.90*FMSY 24% 24% 24% 24% 25% 26% 27% 28% 29% 31% 33% 34% 36% 38% 40% 42% 0.95*FMSY 24% 24% 24% 24% 25% 26% 26% 27% 28% 29% 29% 30% 32% 32% 33% 35% 1.00*FMSY 24% 24% 24% 24% 24% 24% 25% 26% 26% 27% 28% 28% 29% 29% 29% 31% Run07 Probability F<F MSY Catch (t) ,000 29% 29% 90% 94% 95% 97% 99% 99% 100% 100% 100% 100% 100% 100% 100% 16,000 29% 29% 79% 81% 84% 89% 92% 94% 96% 97% 98% 98% 99% 100% 100% 18,000 29% 29% 61% 65% 68% 71% 74% 77% 79% 82% 85% 88% 91% 93% 93% 20,000 29% 29% 36% 37% 38% 39% 40% 41% 43% 44% 47% 52% 56% 59% 61% 22,000 29% 29% 25% 25% 24% 24% 23% 23% 22% 21% 20% 19% 19% 18% 17% 24,000 29% 29% 17% 16% 16% 14% 14% 12% 12% 11% 11% 10% 10% 9% 8% 26,000 29% 29% 12% 11% 11% 10% 10% 9% 8% 7% 6% 6% 5% 4% 3% 28,000 29% 29% 10% 9% 8% 7% 7% 6% 5% 5% 4% 3% 3% 2% 1% 30,000 29% 29% 7% 7% 6% 5% 5% 4% 3% 3% 3% 2% 1% 1% 0% 32,000 29% 29% 6% 6% 5% 4% 3% 3% 2% 1% 1% 0% 0% 0% 0% 34,000 29% 29% 5% 5% 3% 3% 2% 2% 1% 1% 0% 0% 0% 0% 0% 36,000 29% 29% 4% 3% 2% 2% 1% 1% 0% 0% 0% 0% 0% 0% 0% F *FMSY 29% 29% 86% 86% 86% 86% 86% 86% 86% 86% 86% 86% 86% 86% 86% 0.80*FMSY 29% 29% 81% 81% 81% 81% 81% 81% 81% 81% 81% 81% 81% 81% 81% 0.85*FMSY 29% 29% 78% 78% 78% 78% 78% 78% 78% 78% 78% 78% 78% 78% 78% 0.90*FMSY 29% 29% 70% 70% 70% 70% 70% 70% 70% 70% 70% 70% 70% 70% 70% 0.95*FMSY 29% 29% 63% 63% 63% 63% 63% 63% 63% 63% 63% 63% 63% 63% 63% 1.00*FMSY 29% 29% 51% 51% 51% 51% 51% 51% 51% 51% 51% 51% 51% 51% 51% 36
37 Run07 Probability of being green Catch (t) ,000 24% 24% 24% 25% 27% 29% 32% 36% 42% 53% 63% 68% 75% 79% 82% 16,000 24% 24% 24% 24% 26% 27% 28% 31% 33% 38% 42% 50% 60% 66% 70% 18,000 24% 24% 24% 24% 24% 25% 26% 27% 28% 29% 31% 32% 35% 38% 41% 20,000 24% 24% 24% 23% 23% 23% 24% 23% 24% 24% 24% 24% 24% 24% 25% 22,000 24% 24% 24% 23% 22% 22% 21% 20% 20% 19% 18% 17% 16% 15% 14% 24,000 24% 24% 17% 16% 16% 14% 14% 12% 12% 11% 11% 10% 10% 9% 8% 26,000 24% 24% 12% 11% 11% 10% 10% 9% 8% 7% 6% 6% 5% 4% 3% 28,000 24% 24% 10% 9% 8% 7% 7% 6% 5% 5% 4% 3% 3% 2% 1% 30,000 24% 24% 7% 7% 6% 5% 5% 4% 3% 3% 3% 2% 1% 1% 0% 32,000 24% 24% 6% 6% 5% 4% 3% 3% 2% 1% 1% 0% 0% 0% 0% 34,000 24% 24% 5% 5% 3% 3% 2% 2% 1% 1% 0% 0% 0% 0% 0% 36,000 24% 24% 4% 3% 2% 2% 1% 1% 0% 0% 0% 0% 0% 0% 0% F *FMSY 24% 24% 24% 25% 27% 29% 30% 34% 38% 42% 47% 55% 60% 65% 67% 0.80*FMSY 24% 24% 24% 24% 26% 28% 29% 32% 34% 38% 41% 45% 52% 56% 60% 0.85*FMSY 24% 24% 24% 24% 26% 27% 28% 29% 32% 33% 36% 39% 42% 46% 50% 0.90*FMSY 24% 24% 24% 24% 25% 26% 27% 28% 29% 31% 33% 34% 36% 38% 40% 0.95*FMSY 24% 24% 24% 24% 25% 26% 26% 27% 28% 29% 29% 30% 32% 32% 33% 1.00*FMSY 24% 24% 24% 24% 24% 24% 25% 26% 26% 27% 28% 28% 29% 29% 29% Run08 Probability B>B MSY Catch (t) ,000 44% 46% 49% 57% 66% 77% 88% 94% 97% 99% 99% 100% 100% 100% 100% 100% 16,000 44% 46% 49% 55% 62% 73% 81% 89% 93% 96% 98% 99% 99% 99% 99% 99% 18,000 44% 46% 49% 53% 58% 64% 74% 79% 86% 91% 94% 95% 97% 98% 99% 99% 20,000 44% 46% 49% 52% 55% 58% 63% 69% 74% 79% 83% 88% 90% 92% 95% 95% 22,000 44% 46% 49% 50% 52% 55% 56% 57% 59% 63% 66% 69% 71% 74% 77% 79% 24,000 44% 46% 49% 49% 49% 48% 48% 48% 48% 48% 47% 47% 47% 47% 46% 46% 26,000 44% 46% 49% 47% 45% 44% 41% 40% 38% 37% 36% 34% 30% 28% 25% 23% 28,000 44% 46% 49% 46% 42% 38% 37% 34% 31% 28% 25% 21% 18% 16% 14% 11% 30,000 44% 46% 49% 44% 39% 35% 33% 29% 25% 21% 17% 14% 11% 9% 8% 6% 32,000 44% 46% 49% 43% 36% 33% 29% 24% 19% 14% 12% 10% 8% 6% 4% 3% 34,000 44% 46% 49% 41% 35% 30% 24% 20% 15% 12% 9% 6% 5% 4% 3% 2% 36,000 44% 46% 49% 40% 33% 28% 22% 15% 12% 9% 6% 5% 4% 3% 2% 1% F *FMSY 44% 46% 49% 54% 58% 61% 66% 71% 74% 76% 78% 81% 83% 84% 85% 85% 0.80*FMSY 44% 46% 49% 52% 56% 58% 62% 65% 67% 71% 74% 74% 75% 76% 78% 78% 0.85*FMSY 44% 46% 49% 51% 54% 56% 58% 60% 62% 63% 65% 67% 69% 70% 71% 72% 0.90*FMSY 44% 46% 49% 50% 53% 54% 55% 56% 57% 58% 59% 60% 61% 61% 62% 62% 0.95*FMSY 44% 46% 49% 49% 50% 51% 52% 54% 54% 55% 55% 55% 55% 55% 56% 56% 1.00*FMSY 44% 46% 49% 49% 49% 49% 49% 49% 49% 49% 50% 50% 49% 50% 49% 50% 37
38 Run08 Probability F<F MSY Catch (t) ,000 65% 69% 100% 100% 100% 100% 100% 100% 100% 100% 100% 100% 100% 100% 100% 16,000 65% 69% 99% 100% 100% 100% 100% 100% 100% 100% 100% 100% 100% 100% 100% 18,000 65% 69% 93% 96% 99% 100% 100% 100% 100% 100% 100% 100% 100% 100% 100% 20,000 65% 69% 82% 86% 90% 93% 96% 97% 98% 99% 100% 100% 100% 100% 100% 22,000 65% 69% 63% 67% 71% 74% 76% 79% 82% 85% 88% 90% 91% 93% 94% 24,000 65% 69% 50% 50% 50% 50% 51% 51% 51% 50% 50% 49% 49% 49% 48% 26,000 65% 69% 38% 36% 35% 34% 33% 31% 30% 28% 25% 22% 21% 19% 17% 28,000 65% 69% 30% 28% 26% 24% 22% 19% 15% 14% 12% 11% 9% 8% 6% 30,000 65% 69% 24% 21% 19% 15% 13% 11% 9% 8% 6% 5% 4% 3% 3% 32,000 65% 69% 19% 15% 13% 11% 9% 7% 5% 4% 4% 4% 2% 2% 1% 34,000 65% 69% 14% 12% 10% 7% 5% 4% 4% 3% 2% 2% 1% 1% 1% 36,000 65% 69% 12% 8% 6% 5% 4% 4% 3% 2% 2% 1% 1% 0% 0% F *FMSY 65% 69% 89% 89% 89% 89% 89% 89% 89% 89% 89% 89% 89% 89% 89% 0.80*FMSY 65% 69% 83% 83% 83% 83% 83% 83% 83% 83% 83% 83% 83% 83% 83% 0.85*FMSY 65% 69% 74% 74% 74% 74% 74% 74% 74% 74% 74% 74% 74% 74% 74% 0.90*FMSY 65% 69% 64% 64% 64% 64% 64% 64% 64% 64% 64% 64% 64% 64% 64% 0.95*FMSY 65% 69% 58% 58% 58% 58% 58% 58% 58% 58% 58% 58% 58% 58% 58% 1.00*FMSY 65% 69% 51% 51% 51% 51% 51% 51% 51% 51% 51% 51% 51% 51% 51% Run08 Probability of being green Catch (t) ,000 44% 46% 49% 57% 66% 77% 88% 94% 97% 99% 99% 100% 100% 100% 100% 16,000 44% 46% 49% 55% 62% 73% 81% 89% 93% 96% 98% 99% 99% 99% 99% 18,000 44% 46% 49% 53% 58% 64% 74% 79% 86% 91% 94% 95% 97% 98% 99% 20,000 44% 46% 49% 52% 55% 58% 63% 69% 74% 79% 83% 88% 90% 92% 95% 22,000 44% 46% 49% 50% 52% 55% 56% 57% 59% 63% 66% 69% 71% 74% 77% 24,000 44% 46% 49% 49% 49% 48% 48% 48% 48% 48% 47% 47% 47% 47% 45% 26,000 44% 46% 38% 36% 35% 34% 33% 31% 30% 28% 25% 22% 21% 19% 17% 28,000 44% 46% 30% 28% 26% 24% 22% 19% 15% 14% 12% 11% 9% 8% 6% 30,000 44% 46% 24% 21% 19% 15% 13% 11% 9% 8% 6% 5% 4% 3% 3% 32,000 44% 46% 19% 15% 13% 11% 9% 7% 5% 4% 4% 4% 2% 2% 1% 34,000 44% 46% 14% 12% 10% 7% 5% 4% 4% 3% 2% 2% 1% 1% 1% 36,000 44% 46% 12% 8% 6% 5% 4% 4% 3% 2% 2% 1% 1% 0% 0% F *FMSY 44% 46% 49% 54% 58% 61% 66% 71% 74% 76% 78% 81% 83% 84% 85% 0.80*FMSY 44% 46% 49% 52% 56% 58% 62% 65% 67% 71% 74% 74% 75% 76% 78% 0.85*FMSY 44% 46% 49% 51% 54% 56% 58% 60% 62% 63% 65% 67% 69% 70% 71% 0.90*FMSY 44% 46% 49% 50% 53% 54% 55% 56% 57% 58% 59% 60% 60% 61% 62% 0.95*FMSY 44% 46% 49% 49% 50% 51% 52% 54% 54% 55% 55% 55% 55% 55% 55% 1.00*FMSY 44% 46% 49% 49% 49% 49% 49% 49% 49% 49% 49% 49% 49% 49% 49% Table 23. Kobe II strategy matrices for each BSP model run. (a) Run 1 Probability F<F MSY Harvest
39 Probability B>B MSY Harvest Fmsy Fmsy Fmsy Fmsy Fmsy Fmsy Probability of being green Harvest Fmsy Fmsy Fmsy Fmsy Fmsy Fmsy
40 (b) Run 2 Probability F<F MSY Harvest Probability B>B MSY Harvest Fmsy Fmsy Fmsy Fmsy Fmsy Fmsy Probability of being green Harvest
41 (c) Run 3 Probability F<F MSY Harvest Probability B>B MSY Harvest Fmsy Fmsy Fmsy Fmsy Fmsy Fmsy
42 Probability of being green Harvest Fmsy Fmsy Fmsy Fmsy Fmsy Fmsy (d) Run 4 Probability F<F MSY Harvest Probability B>B MSY Harvest Fmsy Fmsy Fmsy Fmsy Fmsy Fmsy
43 Probability of being green Harvest Fmsy Fmsy Fmsy Fmsy Fmsy Fmsy Table 24. Kobe II matrices for the 8 scenarios combined in the South Atlantic (a) Probability F<F MSY Harvest
44 (b) Probability B>B MSY Harvest Fmsy Fmsy Fmsy Fmsy Fmsy Fmsy (c) Probility of green status (B>B MSY and F<F MSY ). Harvest Fmsy Fmsy Fmsy Fmsy Fmsy Fmsy

45 Figure 1. Total N-ALB catch-at-age (CAA). 45

46 Figure 2. Partial catch-at-age by fleet. 46
47 Relative CPUE (scaled to time-series mean) Scaled CPUE (relative to time series mean) 4 3,5 3 2,5 2 1,5 1 0, Time Figure 3. Composite troll CPUE on a quarterly time step constructed using the methodology applied in Anon (2009), but using a GLM to adjust for overlapping time periods. 2,5 2 1,5 1 0, Year Figure 4 Composite troll CPUE on an annual time step constructed using the methodology applied in Anon (2009), but using a GLM to adjust for overlapping time-periods. 47
48 Figure 5. Correlation matrix for the northern stock indices. Blue indicates a positive correlation and red, a negative correlation. The order of the indices and the rectangular boxes are chosen based on a hierarchical cluster analysis using a set of dissimilarities for the indices being clustered. Figure 6. Correlation matrix for the southern stock indices. Blue indicates a positive correlation and red, a negative correlation. The order of the indices and the rectangular boxes are chosen based on a hierarchical cluster analysis using a set of dissimilarities for the indices being clustered. 48
49 a) MAX Y LL Taiwan b) Max ALB MAX Y LL Japan Figure 7. Map of the 3 best monthly catches of albacore (1) during the early period, and (2) during recent years showing the approximate main areas of major ALB catches of the (a) Chinese Taipei, and )b) Japanese longline fleets in the North and South Atlantic (all the albacore monthly catches of each period are randomly plotted within each 5 square). 49
50 7 North Atlantic ALB nominal CPUE TW 6 Japan 8 per. Mov. Avg. (TW) Nominal CPUE (sum catch/sum effort) per. Mov. Avg. (Japan) Figure 8 Nominal CPUE for Chinese Taipei and Japan between 20ºN-40ºN and west of 30ºW. N Atl ALB: % of effort with dominant ALB catches in weight Yearly sizes of ALB fished area N Atl Surface 1000 miles % ALB effort Japan China Chinese Taipei Year Year 50
51 Surface 1000 miles S Atl ALB: % of effort with dominant ALB catches in weight Yearly sizes of ALB fished area N Atl Year Japan China Chinese Taipei Figure 9. Percent of fishing effort with more than 50% ALB catch for the North (9a) and South (9b) Atlantic stocks Fished area ALB Atl Sud (Y>1t/5 ) Yearly sizes of ALB fished area N Atl Surface 1000 miles Surface 1000 miles Year Year Figure 10. Sizes of the areas fished for albacore by longliners in the northern and southern Atlantic: number of 5x5 quadrants with at least 1 t of ALB catch in a month for the South Atlantic stock, for the Chinese Taipei and Japanese longliners China Taipei Japan Japan China Chinese Taipei 51
. Figure 12. Generic form of the HCR recommended by SCRS (SCRS, 2011).")

52 Figure 11 Schematic representation of the key elements of the Recommendation by ICCAT on the principles of decision making for ICCAT conservation and management measures (Rec ). Figure 12. Generic form of the HCR recommended by SCRS (SCRS, 2011). Blimit is the limit biomass reference point, BThreshold is the biomass point at which increasingly strict management actions should be taken as biomass decreases and Ftarget, the target fishing mortality rate to be applied such that it is lower than FMSY with high probability (Rec [11-13]). 52
53 Figure 13. Change in size distributions (Y axis, in cm.) of catch in the Chinese Taipei fleet over time (X axis, in years). 53

54 Figure 14. Growth curve used in the MULTIFAN-CL base model. Figure 15. MFCL base model estimated biomass over time. 54
55 Figure 16. MFCL base model estimated recruitment over time. Figure 17. MFCL base model estimated F per age group over time. 55
 56")
56 a) Fishery 1 Fishery Fishery Fishery 10 Normalised CPUE Fishery Observed Predicted b) 56
")

57 Figure 18. MFCL base model a) normalised CPUE and b) effort deviations for fleets used in the model fitting. 57


58 Figure 19. MFCL base model estimated selectivities for each fishery. 58
59 Figure 20. MFCL base model estimated Stock recruitment relationship. Figure 21. MFCL base model estimated yield curve. 59
60 Figure 22. Current biomass relative to biomass at MSY. Figure 23. Current spawning stock biomass relative to spawning stock biomass at MSY. 60
61 Figure 24. Current F relative to F at MSY. Figure 25. Base case model fit to the length frequency data by fishery. 61

62 Figure 26. Base case model residuals for the fit to the length frequency data by fishery. Figure 27. Model estimated biomass trajectories over time for the base case and alternate runs. 62


63 Figure 28. MFCL alt1 model estimated selectivities for the three Chinese Taipei LL fisheries. Figure 29. Age specific vector of natural mortality included in run alt5. 63
64 Figure 30. F/F MSY likelihood profile for the MFCL base case. Figure 31. SSB/SSB MSY likelihood profile for the MFCL base case. 64

65 Figure 32. The Kobe plot generated from the base case MFCL model. The black dot indicates the most recent model estimated benchmarks while the blue cloud of points represent the uncertainty around the current estimate. 65

66 Figure 33. The Kobe pie chart, characterizing the probability that current stock status is within each of the Kobe plot quadrants. Figure 34. Estimated B/B MSY and F/F MSY for the 7 scenarios tested. 66


67 Figure 35. In blue: Estimated trends in B/B MSY and F/F MSY with the 7 scenarios tested. In grey: Bootstrapped 2011 B/B MSY and F/F MSY coordinates Figure 36. Probability of being in different zones in the Kobe plot for bootstrapped estimates of the 7 tested scenarios. 67


68 Figure 37. Density plots of the bootstrapped B/B MSY and F/F MSY with the 7 scenarios tested. Figure 38. Constant fishing mortality 20 year projections for the 7 scenarios considered. 68
69 Figure 39. Constant catch 20 year projections for the 7 scenarios considered. 69


70 Figure 40. Constant catch projections for scenario 4. Figure 41 Constant catch projections for scenario 5. 70
71 Figure 42. Residual mean square error (RMSE) for the CPUE time series used in the SS exploratory runs (note that CPUEs of fleets 11 and 12 were not used). Figure 43. Management benchmark B/Bmsy for the ten SS exploratory runs 71
72 Figure 44. Management benchmark F/F MSY for the ten SS exploratory runs. Figure 45. Management benchmark B/B MSY for the eleven post exploratory SS configurations. 72
73 Figure 46. Management benchmark F/F MSY for the eleven post exploratory SS configuration. 73
74 Figure 47. Growth and natural mortality used for SS Run

75 Figure 48. Estimated selectivities and resulting fit to overall length compositions, sexes combined, for SS Run 12. Note that fleets 11 and 12 were not included in the model fit. 75


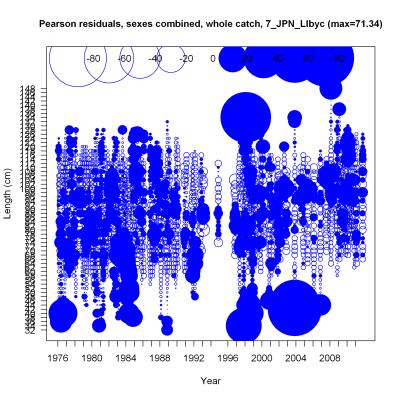


76 Figure 49. Pearson residuals, sexes combined, for SS Run

77 Figure 50. Fit to CPUE time series used in SS Run
78 Figure 51. Spawning stock biomass (lower left), recruitment (upper left), stock-recruitment function (lower right), and recruitment residuals (upper right) for SS Run
79 Figure 52. Estimates of B/B MSY for the MFCL base case and SS Runs 17, 17B, and 17C. Figure 53. Estimates of F/F MSY for SS Run 15 (the SS "MFCL-like" run), and SS Runs 17, 17B, and 17C. 79
80 Figure 54. Estimates of recruitment for the MFCL base case and the SS Runs 17, 17B, and 17C. Figure 55. Estimates of spawning stock biomass for the MFCL base case and the SS Runs 17, 17B, and 17C. 80
81 Figure 56. Estimates of total stock biomass for the MFCL base case and the SS Runs 17, 17B, and
82 Figure 57. Comparison B/B MSY (top) and F/F MSY (bottom) of the SS MFCL base case, SS Run 12, SS from the 2009 assessment, and MFCL from the 2009 assessment. These represent the final runs considered from SS and MFCL in 2009 and
83 Northern Albacore -VPA Results- Base Model F N e e+07 CATCH 0e+00 3e+06 6e Age 1 Age 2 Age 3 Age 4 Age 5 Age 6 Age 7 Age 8 + Mean Figure 58. Catch-at-age data, estimated abundance-at-age, and estimated fishing mortality-at-age from the base model virtual population analysis of North Atlantic albacore. 83
84 Northern Albacore -VPA Results- Base Model Recruits 1.4e e e e e e e e+00 Spawners SSB Recruits Spawner Abundance Spawning Stock Biomass Figure 59. Estimated recruitment, spawning stock abundance, and spawning stock biomass from the virtual population analysis base model of North Atlantic albacore. 84
85 JPN_LL CTP_LL_ CTP_LL_3 Year USA_LL Year Index of Abundance ESP_TROLL Year FRA_TROLL_1 Year FRA_TROLL_2 Year ESP_BB Year Year Year Year Figure 60. Virtual population analysis base model fits to indices of abundance of north Atlantic albacore. JPN_LL = Japan longline, CTP_LL_1 = Chinese Taipei longline period 1, CTP_LL_3 = Chinese Taipei longline period 3, USA_LL = United States longline, ESP_TROLL = Spain troll, FRA_TROLL = French troll, ESP_BB = Spain baitboat. 85
86 JPN_LL CTP_LL_ Year CTP_LL_3 Year USA_LL VPA Residuals Year ESP_TROLL Year FRA_TROLL_ Year FRA_TROLL_2 Year ESP_BB Year Year Year Figure 61. Residual error to VPA base model fits to indices of abundance. 86
87 Figure 62. Bootstrap analysis of North Atlantic albacore VPA base model estimates of abundance-at-age. Black line shows the deterministic run, bootstraps are shown as blue lines. 87
88 Figure 63. Bootstrap analysis of North Atlantic albacore VPA base model estimates of fishing mortality-at-age. Black line shows the deterministic run, bootstraps are shown as blue lines. 88
89 Northern Albacore -VPA Results- Mortality Sensitivity Spawners 0e+00 2e+06 4e+06 SSB 0e+00 6e+04 Recruits 0.0e e Age-varying natural mortality Constant mortality (base model) Figure 64. Virtual population analysis of North Atlantic albacore natural mortality sensitivity analysis. Age-varying mortality: Age- 1=0.63, Age-2=0.46, Age-3=0.38, Age-4=0.34, Age-5=0.31, Age-6=0.29, Age-7=0.31, Age-8+=0.50; constant natural mortality = 0.3 across ages. 89
90 Northern Albacore -VPA Results- Indices Jackknife 15 Recruits (millions) SSB (1000 mt) Base JPN_LL removed CTP_LL removed ESP_BB removed ESP_TR removed FRA_TR removed USA_LL removed Figure 65. Virtual population analysis of North Atlantic albacore indices sensitivity analysis. JPN_LL = Japan longline, CTP_LL = Chinese Taipei longline, USA_LL = United States longline, ESP_TROLL = Spain troll, FRA_TROLL = French troll, ESP_BB = Spain baitboat. 90
91 Northern Albacore -VPA Results- Retrospective Analysis Recruitment 1.4e e e e e e e e SSB Year Figure 66. Retrospective sensitivity analysis of estimated recruitment and spawning stock biomass (SSB) from the VPA base model of North Atlantic albacore, iteratively removing 1 to 5 most recent years of data. 91

92 Figure 67. Kobe phase plot of North Atlantic albacore stock status from the VPA model. The blue X indicates the stock status at the beginning of the time series, the blue point indicates the stock status in 2011, and the light blue points show the stock status estimates from bootstrap iterations. 92
93 Base model USA Index Removed Age-varying M Historical Period Included B>B MSY :F<F MSY B>B MSY :F>F MSY,B<B MSY :F<F MSY B<B MSY :F>F MSY Figure 68. Kobe phase chart illustrating the relative probability of the stock status of North Atlantic albacore from the VPA model. 93
94 VPA Base Model SSB/SSB MSY SSB/SSB MSY SSB/SSB MSY F/F MSY VPA USA Indices Jackknife F/F MSY VPA Age-varying Mortality F/F MSY mt mt mt mt mt mt mt mt mt mt mt mt mt mt Figure 69. Projections of North Atlantic albacore stock status from the VPA models. From top to bottom: base model, base model with the U.S. longline indices removed, and base model with age-dependent natural mortality. 94

95 Figure 70. Summary of stock status estimates using different models and runs. 95
96 Figure 71. Comparison SSB/SSB MSY (top) and F/F MSY (bottom) of the base case models from the four modeling platforms. In the case of ASPIC, run 5 is represented, which includes all CPUE series. 96
97 Figure 72. Retrospective projection from VPA analysis. 97
98 Figure 73. Results of sensitivity and retrospective analyses for ASPIC Run08 for South Atlantic albacore. 98
99 Biomass 0e+00 3e+05 6e+05 0e+00 3e+05 SAf SAf e+00 3e+05 6e+05 0e+00 2e+05 4e+05 Year Figure 74. Fit of the BSP model to the four base case scenarios. SAf SAf 4 Uruguay Uruguay Chinese.Taipei Japan Japan Fit
100 SAf K r bcur /bmsy fcur /fmsy Probability SAf SAf 3 K K r r bcur /bmsy bcur /bmsy fcur /fmsy fcur /fmsy SAf K r bcur /bmsy fcur /fmsy Figure 75. Posterior (solid) and prior (dashed) distributions from the four base case BSP model runs for the South Atlantic. Equal weights Catch weights B/Bmsy B/Bmsy Year Year Figure 76. Retrospective analysis, with projection after the last year of data using real catches, for the Schaeffer model (run F1 left, F2, right) of BSP for South Atlantic albacore. 100
101 SAf SAf Log-residuals SAf SAf Uruguay Uruguay Chinese.Taipei Year Japan Japan Sample quantiles Theoretical quantiles Figure 77. CPUE residuals (left) and residual qq-normal plots (right) for the four BSP base case runs for the South Atlantic. B/Bmsy Series included: All-catch wt. All-equal wt. Chinese Taipei Uruguay Japan Ch. Taipei + Uruguay Ch. Taipei + Japan Uruguay + Japan Year 101
102 Figure 78. BSP South Atlantic sensitivity analyses removing some CPUE series, compared to the base cases with equal or catch weighting. The Schaeffer functional form was used in all cases. SAf 1 SAf 2 B/Bmsy B/Bmsy Year SAf 3 Year SAf 4 B/Bmsy B/Bmsy Base Unif Unif(K) Bo/K= Year Year Figure 79. Median biomass trajectories for the BSP South Atlantic model runs with alternative priors. Base is the base case. Unif is uniform priors on r and K, and Bo/K fixed at 0.9, similar to the ASPIC runs. Unif(K) has uniform prior on K. 102
103 (a) Run F1 (Schaeffer model, equal weighting) Base priors Probability K (b) Run F2 (Schaeffer model, catch weighting) Base priors Probability Uniform priors r and K, fixed Bo/K K Base except uniform K K K r r r Uniform priors r and K, fixed Bo/K K Base except uniform K K r r r bcur /bmsy bcur /bmsy bcur /bmsy bcur /bmsy bcur /bmsy bcur /bmsy Figure 80. Priors and marginal posteriors for r and K for alternative prior formulations, and current B/B MSY and F/F MSY for runs with alterative priors fcur /fmsy fcur /fmsy fcur /fmsy fcur /fmsy fcur /fmsy fcur /fmsy 103
104 SAf 1 uniform SAf 2 uniform B/Bmsy (red) and F/Fmsy (blue) SAf 3 uniform SAf 4 uniform Year Figure 81. Median trajectories with 80% credible intervals, from the four alternative prior cases of the BSP model with uniform priors on r and K, and Bo/K fixed at 0.9 for South Atlantic albacore. B/Bmsy or F/Fmsy ASPIC BSP ASPIC BSP Year ASPIC BSP Figure 82. Biomas and fishing mortality rate trajectories for South Atlantic albacore ASPIC BSP
105 4 ASPIC 2 ASPIC 6 ASPIC 7 ASPIC F F MSY 0 4 BSP 1 BSP 3 BSP 2 BSP SSB B MSY Figure 83. Kobe phase plots for South Atlantic albacore. End year is 2011 (black triangle). ASPIC 2 ASPIC 6 ASPIC 7 ASPIC 8 Combined Kobe Quadrant B<Bmsy and F>Fmsy BSP 1 BSP 3 BSP 2 BSP 4 B<Bmsy or F>Fmsy B>Bmsy and F<Fmsy Figure 84. Kobe pie charts of status in 2011, for all eight models separately, and for all models combined for South Atlantic albacore. 105
106 Figure 85. Projected probability of being Green within different time scales for various combinations of HCR parameters, as indicated. The left column represents a 20 year time frame (1 mean Generation + 10 years a value sometimes used for heavily depleted stocks). The center column, a 9 year time-frame (1 mean generation), and the rightmost column, a 5 year time-frame. The rows represent Bthresh levels (0.6 B MSY, 0.8 B MSY and B MSY for top, middle and bottom raws, respectively). 106
 of B-ratio (B/B MSY ) and F-ratio (F/F MSY ) for")
107 Figure 86. Future projection (15 years) of B-ratio (B/B MSY ) and F-ratio (F/F MSY ) for 4 ASPIC runs for South Atlantic albacore under constant catch. 107
108 Figure 87. Future projection (15 years) of B-ratio (B/B MSY ) and F-ratio (F/F MSY ) for 4 ASPIC runs for south Atlantic albacore under constant F. 108

109 Figure 88. Predicted yield for future projection (15 years) for 4 ASPIC runs for South Atlantic albacore under constant F. B/Bmsy SAf 1 Constant TAC SAf 2 Constant TAC SAf 3 Constant TAC SAf 1 Constant F SAf 2 Constant F SAf 3 Constant F SAf 4 Constant TAC SAf 4 Constant F Year Figure 89. Median projections with the four base case BSP runs for South Atlantic albacore, with either a constant catch or a constant F harvest policy. 109
ICCAT Secretariat. (10 October 2017)
") ICCAT Secretariat (10 October 2017) Bluefin tuna: Background information Managed by International Commission for the Conservation of Atlantic Tunas (ICCAT): Two stocks (mixing occurring, but extent not
ICCAT Secretariat (10 October 2017) Bluefin tuna: Background information Managed by International Commission for the Conservation of Atlantic Tunas (ICCAT): Two stocks (mixing occurring, but extent not
An update of the 2015 Indian Ocean Yellowfin Tuna stock assessment for 2016
 IOTC-2016-WPTT18-27 Received: 14 October 2016 An update of the 2015 Indian Ocean Yellowfin Tuna stock assessment for 2016 Adam Langley, IOTC Consultant 1. Introduction A stock assessment of the Indian
PACIFIC BLUEFIN TUNA STOCK ASSESSMENT
 PACIFIC BLUEFIN TUNA STOCK ASSESSMENT SUMMARY 19-21 December 2012 Webinar PACIFIC BLUEFIN TUNA STOCK ASSESSMENT SUMMARY 1. Stock Identification and Distribution Pacific bluefin tuna (Thunnus orientalis)
Paper prepared by the Secretariat
 COMMISSION FOURTEENTH REGULAR SESSION Manila, Philippines 3 7 December 2017 REFERENCE DOCUMENT FOR REVIEW OF CMM 2005-03 AND FOR THE DEVELOPMENT OF HARVEST STRATEGIES UNDER CMM 2014-06 North Pacific Albacore
STOCK ASSESSMENT OF ALBACORE TUNA IN THE NORTH PACIFIC OCEAN IN 2011
 STOCK ASSESSMENT OF ALBACORE TUNA IN THE NORTH PACIFIC OCEAN IN 2011 Report of the ISC-Albacore Working Group Stock Assessment Workshop 3rd Science Advisory Committee Meeting Inter-American Tropical Tuna
2017 North Pacific Albacore Stock Assessment
 2017 North Pacific Albacore Stock Assessment 13 th Regular Session of the Northern Committee August 28-September 1, 2017 Busan, Republic of Korea ISC-Albacore Working Group 2017 North Pacific Albacore
8.9 SWO-ATL ATLANTIC SWORDFISH
 EXECUTIVE SUMMARY SWO-ATL 8.9 SWO-ATL ATLANTIC SWORDFISH The status of the North and swordfish stocks was assessed in 2017, by means of applying statistical modelling to the available data up to 2015.
Assessment Summary Report Gulf of Mexico Red Snapper SEDAR 7
 Assessment Summary Report Gulf of Mexico Red Snapper SEDAR 7 Stock Distribution: Red snapper are found throughout the Gulf of Mexico, the Caribbean Sea, and from the U.S. Atlantic Coast to northern South
STOCK ASSESSMENT OF YELLOWFIN TUNA IN THE EASTERN PACIFIC OCEAN UPDATE OF 2011 STOCK ASSESSMENT. January 1975 December 2011
 STOCK ASSESSMENT OF YELLOWFIN TUNA IN THE EASTERN PACIFIC OCEAN UPDATE OF 2011 STOCK ASSESSMENT January 1975 December 2011 Outline Stock assessment (base case model) Methodology (Stock Synthesis) Fishery
STOCK STATUS OF SOUTHERN BLUEFIN TUNA
 7 th Expert Consultation on Indian Ocean Tunas, Victoria, Seychelles, 9-14 November, 1998 STOCK STATUS OF SOUTHERN BLUEFIN TUNA Tsuji, S. 1 Introduction The Commission for the Conservation of Southern
A REVIEW AND EVALUATION OF NATURAL MORTALITY FOR THE ASSESSMENT AND MANAGEMENT OF YELLOWFIN TUNA IN THE EASTERN PACIFIC OCEAN
 A REVIEW AND EVALUATION OF NATURAL MORTALITY FOR THE ASSESSMENT AND MANAGEMENT OF YELLOWFIN TUNA IN THE EASTERN PACIFIC OCEAN Mark N. Maunder and Alex Aires-da-Silva Outline YFT history Methods to estimate
Preliminary analysis of yellowfin tuna catch, effort, size and tagging data using an integrated age-structured model
 Preliminary analysis of yellowfin tuna catch, effort, size and tagging data using an integrated age-structured model Introduction John Hampton Secretariat of the Pacific Community Noumea, New Caledonia
Pacific Blue Marlin Stock Assessment Update in ISC Billfish Working Group
 Pacific Blue Marlin Stock Assessment Update in 2016 ISC Billfish Working Group Overview Overview of the 2013 Pacific Blue Marlin Stock Assessment 2016 Assessment Data and Model Blue Marlin Life History
16 06 ALB RECOMMENDATION BY ICCAT ON A MULTI ANNUAL CONSERVATION AND MANAGEMENT PROGRAMME FOR NORTH ATLANTIC ALBACORE
 16 06 ALB RECOMMENDATION BY ICCAT ON A MULTI ANNUAL CONSERVATION AND MANAGEMENT PROGRAMME FOR NORTH ATLANTIC ALBACORE RECALLING the Recommendation by ICCAT Concerning the Limitation of Fishing Capacity
Preliminary results of SEPODYM application to albacore. in the Pacific Ocean. Patrick Lehodey
 SCTB15 Working Paper ALB-6 Preliminary results of SEPODYM application to albacore in the Pacific Ocean Patrick Lehodey Oceanic Fisheries Programme Secretariat of the Pacific Community Noumea, New Caledonia
ISC Pacific Bluefin tuna Stock Assessment 2016
 ISC Pacific Bluefin tuna Stock Assessment 2016 Completed in 2016-Feb. 29 th to 2016-Apr. 12 th at La Jolla, USA ISC Pacific Bluefin tuna Working Group 2016/5/10 San Diego Marriott La Jolla -IATTC SAC 07-
Indian Ocean Tuna Commission (IOTC) Stock assessment of Indian Ocean bigeye tuna using integrated
 Stock assessment of Indian Ocean bigeye tuna using integrated") Working paper for 19 th Session of the Working Party on Tropical Tunas (WPTT19) Indian Ocean Tuna Commission (IOTC) Victoria, Seychelles 17-22 October 2017 Stock assessment of Indian Ocean bigeye tuna
Working paper for 19 th Session of the Working Party on Tropical Tunas (WPTT19) Indian Ocean Tuna Commission (IOTC) Victoria, Seychelles 17-22 October 2017 Stock assessment of Indian Ocean bigeye tuna
ICCAT SCRS Report Panel 2- Temperate tunas North
 2016 ICCAT SCRS Report Panel 2- Temperate tunas North 1 Activities in 2016 Summary of recent assessment of Albacore North Summary of last stock status for Bluefin tuna Responses to the Commission General
ICCAT SCRS Report. Panel 4-Swordfish, sharks, small tunas and billfish. ICCAT Commission Marrakech
 ICCAT SCRS Report 2017 Panel 4-Swordfish, sharks, small tunas and billfish 1 Overview of stock status species not assessed in 2017 Results of Shortfin 2017 mako assessment Results of Swordfish (north and
REVISION OF THE WPTT PROGRAM OF WORK
 REVISION OF THE WPTT PROGRAM OF WORK IOTC 2016 WPTT18 08 Rev 1 PREPARED BY: IOTC SECRETARIAT 1, 3 OCTOBER 2016 PURPOSE To ensure that the participants at the 18 th Working Party on Tropical Tunas (WPTT18)
A. SOUTHERN NEW ENGLAND / MID-ATLANTIC (SNE/MA) WINTER FLOUNDER ASSESSMENT SUMMARY FOR 2011
 WINTER FLOUNDER ASSESSMENT SUMMARY FOR 2011") A. SOUTHERN NEW ENGLAND / MID-ATLANTIC (SNE/MA) WINTER FLOUNDER ASSESSMENT SUMMARY FOR 2011 State of Stock: In 2010 the SNE/MA winter flounder stock was overfished but overfishing was not occurring. The
A. SOUTHERN NEW ENGLAND / MID-ATLANTIC (SNE/MA) WINTER FLOUNDER ASSESSMENT SUMMARY FOR 2011 State of Stock: In 2010 the SNE/MA winter flounder stock was overfished but overfishing was not occurring. The
Plaice (Pleuronectes platessa) in Division 7.e (western English Channel)
 in Division 7.e (western English Channel)") Celtic Seas and Greater North Sea ecoregions Published 30 June 2016 Version 2: 15 May 2017 5.3.51 Plaice (Pleuronectes platessa) in Division 7.e (western English Channel) ICES stock advice ICES advises
Celtic Seas and Greater North Sea ecoregions Published 30 June 2016 Version 2: 15 May 2017 5.3.51 Plaice (Pleuronectes platessa) in Division 7.e (western English Channel) ICES stock advice ICES advises
17-06 BFT RECOMMENDATION BY ICCAT FOR AN INTERIM CONSERVATION AND MANAGEMENT PLAN FOR WESTERN ATLANTIC BLUEFIN TUNA
 17-06 BFT RECOMMENDATION BY ICCAT FOR AN INTERIM CONSERVATION AND MANAGEMENT PLAN FOR WESTERN ATLANTIC BLUEFIN TUNA RECALLING the Recommendation by ICCAT to Establish a Rebuilding Program for Western Atlantic
Rebuilding International Fisheries The Examples of Swordfish in the North and South Atlantic
 Rebuilding International Fisheries The Examples of Swordfish in the North and South Atlantic John D. Neilson, Ph.D. Large Pelagics Program Science, DFO Gerry P. Scott, Ph.D. NMFS, Miami (Chairman, Standing
Status of yellowfin tuna in the eastern Pacific Ocean in 2001 and outlook for 2002
 SCTB15 Working Paper YFT-3 Status of yellowfin tuna in the eastern Pacific Ocean in 2001 and outlook for 2002 Mark N. Maunder Inter-American Tropical Tuna Commission (IATTC) La Jolla, California, USA STATUS
ICES Advice on fishing opportunities, catch, and effort Celtic Seas and Greater North Sea Ecoregions Published 24 October 2017
 ICES Advice on fishing opportunities, catch, and effort Celtic Seas and Greater North Sea Ecoregions Published 24 October 2017 DOI: 10.17895/ices.pub.3334 Seabass (Dicentrarchus labrax) in divisions 4.b
A PRELIMINARY STOCK ASSESSMENT FOR NORTHERN ALBACORE USING THE FULLY INTEGRATED STOCK ASSESSMENT MODEL, MULTIFAN-CL
 SCRS/2013/058 Collect. Vol. Sci. Pap. ICCAT, 70(3): 1094-1107 (2014) A PRELIMINARY STOCK ASSESSMENT FOR NORTHERN ALBACORE USING THE FULLY INTEGRATED STOCK ASSESSMENT MODEL, MULTIFAN-CL Gorka Merino 1,
PRELIMINARY ESTIMATES OF BLUE AND MAKO SHARKS BYCATCH AND CPUE OF TAIWANESE LONGLINE FISHERY IN THE ATLANTIC OCEAN
 PRELIMINARY ESTIMATES OF BLUE AND MAKO SHARKS BYCATCH AND CPUE OF TAIWANESE LONGLINE FISHERY IN THE ATLANTIC OCEAN Kwang-Ming Liu 1, Shoou-Jeng Joung, and Wen-Pei Tsai 3 1 Institute of Marine Affairs and
Horse mackerel (Trachurus trachurus) in Division 9.a (Atlantic Iberian waters)
 in Division 9.a (Atlantic Iberian waters)") Bay of Biscay and the Iberian Coast Ecoregion Published 13 July 2018 https://doi.org/10.17895/ices.pub.4496 Horse mackerel (Trachurus trachurus) in Division 9.a (Atlantic Iberian waters) ICES advice on
Bay of Biscay and the Iberian Coast Ecoregion Published 13 July 2018 https://doi.org/10.17895/ices.pub.4496 Horse mackerel (Trachurus trachurus) in Division 9.a (Atlantic Iberian waters) ICES advice on
Figure 1. Total western central Pacific Ocean (WCPO) tuna catch by species (SKJ; skipjack, YFT; yellowfin, BET; bigeye tuna, ALB; albacore)
 tuna catch by species (SKJ; skipjack, YFT; yellowfin, BET; bigeye tuna, ALB; albacore)") The tuna fisheries in the Pacific Ocean have economical importance for the majority of Pacific countries. The 1999 Pacific tuna catch (2,380,271 mt) represented 67% of the provisional estimate of world
The tuna fisheries in the Pacific Ocean have economical importance for the majority of Pacific countries. The 1999 Pacific tuna catch (2,380,271 mt) represented 67% of the provisional estimate of world
Albacore Tuna, South Pacific, Troll, Pole and Line
 Albacore Tuna, South Pacific, Troll, Pole and Line Content last updated 8th Mar 2016 Stock: South Pacific Albacore Tuna, South Pacific, Troll, Pole and Line Management: Inter-American Tropical Tuna Commission
Recommendations to the 25 th Regular Meeting of the International Commission for the Conservation of Atlantic Tunas (ICCAT)
") tel. 902.429.2202 fax. 902.405.3716 2705 Fern Lane, Halifax, NS, B3K 4L3 Recommendations to the 25 th Regular Meeting of the International Commission for the Conservation of Atlantic Tunas (ICCAT) 14-22
tel. 902.429.2202 fax. 902.405.3716 2705 Fern Lane, Halifax, NS, B3K 4L3 Recommendations to the 25 th Regular Meeting of the International Commission for the Conservation of Atlantic Tunas (ICCAT) 14-22
WORKING GROUP ON STOCK ASSESSMENTS 5 TH MEETING DOCUMENT SAR-5-08 TARGET SIZE FOR THE TUNA FLEET IN THE EASTERN PACIFIC OCEAN
 INTER-AMERICAN TROPICAL TUNA COMMISSION COMISIÓN INTERAMERICANA DEL ATÚN TROPICAL WORKING GROUP ON STOCK ASSESSMENTS 5 TH MEETING LA JOLLA, CALIFORNIA (USA) 11-13 MAY 2004 DOCUMENT SAR-5-08 TARGET SIZE
Report on Biology, Stock Status and Management of Southern Bluefin Tuna: 2017
 Attachment 11 Report on Biology, Stock Status and Management of Southern Bluefin Tuna: 2017 The CCSBT Extended Scientific Committee (ESC) updated the stock assessment and conducted a review of fisheries
Consequences of environmentally driven uncertainty in productivity for management of North Pacific Albacore tuna
 Consequences of environmentally driven uncertainty in productivity for management of North Pacific Albacore tuna September 22, 2017 PICES Annual Meeting, Vladivostok Desiree Tommasi University of California
WORKING GROUP TO REVIEW STOCK ASSESSMENTS 8 TH MEETING. DOCUMENT SAR-8-09a STATUS OF BIGEYE TUNA IN THE EASTERN PACIFIC OCEAN
 INTER-AMERICAN TROPICAL TUNA COMMISSION WORKING GROUP TO REVIEW STOCK ASSESSMENTS 8 TH MEETING LA JOLLA, CALIFORNIA (USA) 7- MAY 7 DOCUMENT SAR-8-9a STATUS OF BIGEYE TUNA IN THE EASTERN PACIFIC OCEAN Alexandre
Overview 10/8/2015. October Pelagic Advice Pelagic AC 7 October 2015
 October Pelagic Advice Pelagic AC 7 October 2015 John Simmonds ICES ACOM Vice Chair Overview WG 1 Blue whiting NSS herring North Sea horse makerel WG 2 Stocks Northeast Atlantic mackerel Western horse
Advice June 2014
 5.3.23 Advice June 2014 ECOREGION STOCK Celtic Sea and West of Scotland Plaice in Division VIIa (Irish Sea) Advice for 2015 Based on ICES approach to data-limited stocks, ICES advises that catches should
9.4.5 Advice September Widely distributed and migratory stocks Herring in the Northeast Atlantic (Norwegian spring-spawning herring)
") 9.4.5 Advice September 212 ECOREGION STOCK Widely distributed and migratory stocks Herring in the Northeast Atlantic (Norwegian spring-spawning herring) Advice for 213 ICES advises on the basis of the
9.4.5 Advice September 212 ECOREGION STOCK Widely distributed and migratory stocks Herring in the Northeast Atlantic (Norwegian spring-spawning herring) Advice for 213 ICES advises on the basis of the
ISC 1 Billfish Working Group
 SCIENTIFIC COMMITTEE TWELFTH REGULAR SESSION Bali, Indonesia 3-11 August 2016 Stock Assessment Update for Blue Marlin (Makaira nigricans) in the Pacific Ocean through 2014 WCPFC-SC12-2016/ SA WP-12 ISC
Updated and revised standardized catch rate of blue sharks caught by the Taiwanese longline fishery in the Indian Ocean
 Updated and revised standardized catch rate of blue sharks caught by the Taiwanese longline fishery in the Indian Ocean Wen-Pei Tsai 1,3 and Kwang-Ming Liu 2 1 Department of Fisheries Production and Management,
ASSESSMENT OF THE WEST COAST OF NEWFOUNDLAND (DIVISION 4R) HERRING STOCKS IN 2011
 HERRING STOCKS IN 2011") Canadian Science Advisory Secretariat Science Advisory Report 212/24 ASSESSMENT OF THE WEST COAST OF NEWFOUNDLAND (DIVISION 4R) HERRING STOCKS IN 211 Context Figure 1. Map of unit areas of NAFO Division
Canadian Science Advisory Secretariat Science Advisory Report 212/24 ASSESSMENT OF THE WEST COAST OF NEWFOUNDLAND (DIVISION 4R) HERRING STOCKS IN 211 Context Figure 1. Map of unit areas of NAFO Division
Pacific Fishery Management Council Initial Concepts for North Pacific Albacore Management Strategy Evaluation
 Pacific Fishery Management Council Initial Concepts for North Pacific Albacore Management Strategy Evaluation Introduction The ISC s Albacore Working Group has been tasked with developing a management
Spurdog (Squalus acanthias) in the Northeast Atlantic
 in the Northeast Atlantic") ICES Advice on fishing opportunities, catch, and effort Northeast Atlantic Published 11 October 2016 9.3.17 Spurdog (Squalus acanthias) in the Northeast Atlantic ICES stock advice ICES advises that when
ICES Advice on fishing opportunities, catch, and effort Northeast Atlantic Published 11 October 2016 9.3.17 Spurdog (Squalus acanthias) in the Northeast Atlantic ICES stock advice ICES advises that when
INTER-AMERICAN TROPICAL TUNA COMMISSION SCIENTIFIC ADVISORY COMMITTEE FOURTH MEETING. La Jolla, California (USA) 29 April - 3 May 2013
 29 April - 3 May 2013") INTER-AMERICAN TROPICAL TUNA COMMISSION SCIENTIFIC ADVISORY COMMITTEE FOURTH MEETING La Jolla, California (USA) 29 April - 3 May 2013 DOCUMENT SAC-04-04c INDICES OF RELATIVE ABUNDANCE OF YELLOWFIN TUNA
INTER-AMERICAN TROPICAL TUNA COMMISSION SCIENTIFIC ADVISORY COMMITTEE FOURTH MEETING La Jolla, California (USA) 29 April - 3 May 2013 DOCUMENT SAC-04-04c INDICES OF RELATIVE ABUNDANCE OF YELLOWFIN TUNA
An update of the application of the A-SCALA method to bigeye tuna in the western and central Pacific Ocean
 SCTB15 Working Paper BET-6 An update of the application of the A-SCALA method to bigeye tuna in the western and central Pacific Ocean Chi-Lu Sun 1, Mark Maunder, George Watters, and Su-Zan Yeh 1 1 Institute
SCIENTIFIC COMMITTEE TWELFTH REGULAR SESSION. Bali, Indonesia 3-11 August 2016
 SCIENTIFIC COMMITTEE TWELFTH REGULAR SESSION Bali, Indonesia 3-11 August 216 Relative impacts of FAD and free-school purse seine fishing on skipjack tuna stock status, incorporating non-linear purse seine
ASMFC Stock Assessment Overview: Red Drum
 Purpose The purpose of this document is to improve the understanding and transparency of the Commission s stock assessment process and results. It is the first of several that will be developed throughout
8.5 BFT ATLANTIC BLUEFIN TUNA
 EXECUTIVE SUMMARY BFTE 8.5 BFT ATLANTIC BLUEFIN TUNA Recent assessments of both the eastern and western stocks have attempted to develop Kobe plots and matrices depicting the status of the stock relative
Tuna [211] 86587_p211_220.indd 86587_p211_220.indd /30/04 12/30/04 4:53:37 4:53:37 PM PM
![Tuna [211] 86587_p211_220.indd 86587_p211_220.indd /30/04 12/30/04 4:53:37 4:53:37 PM PM](/thumbs/85/92584906.jpg "Tuna [211] 86587_p211_220.indd 86587_p211_220.indd /30/04 12/30/04 4:53:37 4:53:37 PM PM") Tuna [] highlights Ocean and Climate Changes The catches of Pacific bluefin tuna and North Pacific albacore tuna have fluctuated considerably from year to year, but no upward or downward trends are apparent
Tuna [] highlights Ocean and Climate Changes The catches of Pacific bluefin tuna and North Pacific albacore tuna have fluctuated considerably from year to year, but no upward or downward trends are apparent
ICES Advice on fishing opportunities, catch, and effort Celtic Seas and Greater North Sea ecoregions Published 30 June 2016
 ICES Advice on fishing opportunities, catch, and effort Celtic Seas and Greater North Sea ecoregions Published 30 June 2016 5.3.57 Sea bass (Dicentrarchus labrax) in divisions 4.b c, 7.a, and 7.d h (central
IOTC 2015 SC18 ES06[E]
![IOTC 2015 SC18 ES06[E]](/thumbs/84/89124577.jpg "IOTC 2015 SC18 ES06[E]") DRAFT EXECUTIVE SUMMARY: BULLET TUNA Status of the Indian Ocean bullet tuna (BLT: Auxis rochei) resource TABLE 1. Bullet tuna: Status of bullet tuna (Auxis rochei) in the Indian Ocean. Area 1 Indicators
DRAFT EXECUTIVE SUMMARY: BULLET TUNA Status of the Indian Ocean bullet tuna (BLT: Auxis rochei) resource TABLE 1. Bullet tuna: Status of bullet tuna (Auxis rochei) in the Indian Ocean. Area 1 Indicators
Proposal for biomass and fishing mortality limit reference points based on reductions in recruitment. Mark N. Maunder and Richard B.
 Proposal for biomass and fishing mortality limit reference points based on reductions in recruitment Mark N. Maunder and Richard B. Deriso IATTC Limit Reference Points: Background Triggering an LRP should
ICCAT SCRS Report (PLE-104) Panel 1- Tropical tunas. ICCAT Commission Marrakech
 Panel 1- Tropical tunas. ICCAT Commission Marrakech") ICCAT SCRS Report (PLE-104) Panel 1- Tropical tunas 1 ICCAT Stock Status Report card 2017 Tropical tunas 3 species, 4 stocks inhabiting similar areas, caught together by same gears but with different stock
ICCAT SCRS Report (PLE-104) Panel 1- Tropical tunas 1 ICCAT Stock Status Report card 2017 Tropical tunas 3 species, 4 stocks inhabiting similar areas, caught together by same gears but with different stock
SCIENTIFIC COMMITTEE THIRTEENTH REGULAR SESSION. Rarotonga, Cook Islands 9 17 August 2017
 SCIENTIFIC COMMITTEE THIRTEENTH REGULAR SESSION Rarotonga, Cook Islands 9 17 August 2017 Stock Assessment of Albacore in the North Pacific Ocean in 2017 WCPFC-SC13-2017/ SA-WP-09 Rev 2 (15 August 2017)
92 ND MEETING DOCUMENT IATTC-92 INF-C
 INTER-AMERICAN TROPICAL TUNA COMMISSION 92 ND MEETING Mexico City, Mexico 24-28 July 2017 DOCUMENT IATTC-92 INF-C POTENTIAL EFFECTS ON TUNA STOCKS OF ALTERNATIVE MANAGEMENT SCHEMES At the request of a
Sprat (Sprattus sprattus) in Subarea 4 (North Sea)
 in Subarea 4 (North Sea)") ICES Advice on fishing opportunities, catch, and effort Greater North Sea Ecoregion Published 30 June 2016 6.3.51 Sprat (Sprattus sprattus) in Subarea 4 (North Sea) ICES stock advice ICES provides catch
ICES Advice on fishing opportunities, catch, and effort Greater North Sea Ecoregion Published 30 June 2016 6.3.51 Sprat (Sprattus sprattus) in Subarea 4 (North Sea) ICES stock advice ICES provides catch
Monitoring the length structure of commercial landings of albacore tuna during the fishing year
 SCTB15 Working Paper ALB-5 Monitoring the length structure of commercial landings of albacore tuna during the 2001 2002 fishing year Linda Griggs National Institute of Water and Atmospheric Research Ltd.
ICES advice on fishing opportunities. ICES advises that when the MSY approach is applied, total removals in 2018 should be no more than 880 tonnes.
 ICES Advice on fishing opportunities, catch, and effort Celtic Seas and Greater North Sea ecoregions bss.27.4bc7ad-h Published 29 June 2018 Version 2: 2 July 2018 https://doi.org/10.17895/ices.pub.4472
Advice June 2012
 2.4.1 Advice June 212 ECOREGION STOCK Iceland and East Greenland Beaked redfish (Sebastes mentella) in Subareas V, XII, and XIV and NAFO Subareas 1+2 (Deep pelagic stock > 5 m) Advice for 213 The advice
WESTERN AND CENTRAL PACIFIC FISHERIES COMMISSION (WCPFC) NORTHERN COMMITTEE (NC) MEETING OUTCOMES
 NORTHERN COMMITTEE (NC) MEETING OUTCOMES") Agenda Item J.3 Supplemental Attachment 2 September 2017 WESTERN AND CENTRAL PACIFIC FISHERIES COMMISSION (WCPFC) NORTHERN COMMITTEE (NC) MEETING OUTCOMES The WCPFC NC adopted the following documents for
Agenda Item J.3 Supplemental Attachment 2 September 2017 WESTERN AND CENTRAL PACIFIC FISHERIES COMMISSION (WCPFC) NORTHERN COMMITTEE (NC) MEETING OUTCOMES The WCPFC NC adopted the following documents for
Fishing mortality in relation to highest yield. Fishing mortality in relation to agreed target
 3.4 Stock summaries 3.4. Northeast Arctic cod State of the stock Spawning biomass in relation to precautionary limits Full reproductive capacity Fishing mortality in relation to precautionary limits/management
3.4.3 Advice June Barents Sea and Norwegian Sea Cod in Subareas I and II (Norwegian coastal waters cod)
") 3.4.3 Advice June 2013 ECOREGION STOCK Barents Sea and Norwegian Sea Cod in Subareas I and II (Norwegian coastal waters cod) Advice for 2014 ICES advises on the basis of the Norwegian rebuilding plan,
3.4.3 Advice June 2013 ECOREGION STOCK Barents Sea and Norwegian Sea Cod in Subareas I and II (Norwegian coastal waters cod) Advice for 2014 ICES advises on the basis of the Norwegian rebuilding plan,
Herring (Clupea harengus) in subdivisions and 32 (central Baltic Sea, excluding Gulf of Riga)
 in subdivisions and 32 (central Baltic Sea, excluding Gulf of Riga)") ICES Advice on fishing opportunities, catch, and effort Baltic Sea Ecoregion Published 31 May 2016 8.3.14 Herring (Clupea harengus) in subdivisions 25 29 and 32 (central Baltic Sea, excluding Gulf of Riga)
ICES Advice on fishing opportunities, catch, and effort Baltic Sea Ecoregion Published 31 May 2016 8.3.14 Herring (Clupea harengus) in subdivisions 25 29 and 32 (central Baltic Sea, excluding Gulf of Riga)
ICES advises that when the MSY approach is applied, catches in 2019 should be no more than tonnes.
 ICES Advice on fishing opportunities, catch, and effort Greater Northern Sea, Celtic Seas, and Bay of Biscay and Iberian Coast Published 29 June 2018 ecoregions https://doi.org/10.17895/ices.pub.4463b
A non-equilibrium surplus production model of black grouper (Mycteroperca bonaci) in southeast United States waters
 in southeast United States waters") SEDAR19-AW-05 A non-equilibrium surplus production model of black grouper (Mycteroperca bonaci) in southeast United States waters Introduction Robert G. Muller Florida Fish and Wildlife Conservation Commission
SEDAR19-AW-05 A non-equilibrium surplus production model of black grouper (Mycteroperca bonaci) in southeast United States waters Introduction Robert G. Muller Florida Fish and Wildlife Conservation Commission
NOMINAL CPUE FOR THE CANADIAN SWORDFISH LONGLINE FISHERY
 SCRS/2008/178 NOMINAL CPUE FOR THE CANADIAN SWORDFISH LONGLINE FISHERY 1988-2007 S. Smith and J. D. Neilson SUMMARY An update is presented of the nominal catch rate series and fishery distributions for
Haddock (Melanogrammus aeglefinus) in divisions 7.b k (southern Celtic Seas and English Channel)
 in divisions 7.b k (southern Celtic Seas and English Channel)") ICES Advice on fishing opportunities, catch, and effort Celtic Seas, Greater North Sea, and Oceanic Northeast Atlantic ecoregions Published 29 June 2018 https://doi.org/10.17895/ices.pub.4453 Haddock (Melanogrammus
ICES Advice on fishing opportunities, catch, and effort Celtic Seas, Greater North Sea, and Oceanic Northeast Atlantic ecoregions Published 29 June 2018 https://doi.org/10.17895/ices.pub.4453 Haddock (Melanogrammus
REVIEW OF BIGEYE TUNA CATCH INCLUDING FISH SIZE BY JAPANESE LONGLINE FISHERY IN THE ATLANTIC OCEAN
 1. Introduction Longline is the only tuna-fishing gear deployed by Japan at present in the Atlantic Ocean. Other two types of fishery, baitboat and purse seine fisheries, stopped fishing in the Atlantic
STANDARDIZED CATCH RATE OF SAILFISH (Istiophorus platypterus) CAUGHT BY BRAZILIAN LONGLINERS IN THE ATLANTIC OCEAN ( )
 CAUGHT BY BRAZILIAN LONGLINERS IN THE ATLANTIC OCEAN ( )") SCRS/2008/079 STANDARDIZED CATCH RATE OF SAILFISH (Istiophorus platypterus) CAUGHT BY BRAZILIAN LONGLINERS IN THE ATLANTIC OCEAN (1986-2006) Catarina Wor 12 ; Bruno L. Mourato 1,3 ; Humberto G. Hazin 1
SCRS/2008/079 STANDARDIZED CATCH RATE OF SAILFISH (Istiophorus platypterus) CAUGHT BY BRAZILIAN LONGLINERS IN THE ATLANTIC OCEAN (1986-2006) Catarina Wor 12 ; Bruno L. Mourato 1,3 ; Humberto G. Hazin 1
SCIENTIFIC COMMITTEE THIRTEENTH REGULAR SESSION. Rarotonga, Cook Islands 9-17 August 2017
 SCIENTIFIC COMMITTEE THIRTEENTH REGULAR SESSION Rarotonga, Cook Islands 9-17 August 2017 Updating indicators of effort creep in the WCPO purse seine fishery WCPFC-SC13-2017/MI-IP-04 Graham Pilling 1, the
Review on Size Sampling Frameworks for North Atlantic Albacore of Taiwanese Logline Fleets
 International Journal of Research in Engineering and cience (IJRE) I (Online): 23-9364, I (Print): 23-9356 Volume 6 Issue 4 Ver. I ǁ 18 ǁ PP. 27-41 Review on ize ampling Frameworks for orth Atlantic Albacore
Sprat (Sprattus sprattus) in subdivisions (Baltic Sea)
 in subdivisions (Baltic Sea)") ICES Advice on fishing opportunities, catch, and effort Baltic Sea Ecoregion Published 31 May 2016 8.3.18 Sprat (Sprattus sprattus) in subdivisions 22 32 (Baltic Sea) ICES stock advice ICES advises that
ICES Advice on fishing opportunities, catch, and effort Baltic Sea Ecoregion Published 31 May 2016 8.3.18 Sprat (Sprattus sprattus) in subdivisions 22 32 (Baltic Sea) ICES stock advice ICES advises that
Mackerel (Scomber scombrus) in subareas 1 8 and 14, and in Division 9.a (the Northeast Atlantic and adjacent waters)
 in subareas 1 8 and 14, and in Division 9.a (the Northeast Atlantic and adjacent waters)") ICES Advice on fishing opportunities, catch, and effort Ecoregions in the Northeast Atlantic and Arctic Ocean Published 29 September 2017 DOI: 10.17895/ices.pub.3023 Mackerel (Scomber scombrus) in subareas
ICES Advice on fishing opportunities, catch, and effort Ecoregions in the Northeast Atlantic and Arctic Ocean Published 29 September 2017 DOI: 10.17895/ices.pub.3023 Mackerel (Scomber scombrus) in subareas
Research Priorities of the SPC Oceanic Fisheries Programme. John Hampton Oceanic Fisheries Programme Secretariat of the Pacific Community
 Research Priorities of the SPC Oceanic Fisheries Programme John Hampton Oceanic Fisheries Programme Secretariat of the Pacific Community Outline Tuna fishery and stocks OFP Strategic Plan 2006-2008 Research
Size and spatial distribution of the blue shark, Prionace glauca, caught by Taiwanese large-scale. longline fishery in the North Pacific Ocean
 1 ISC/16/SHARKWG-1/21 Size and spatial distribution of the blue shark, Prionace glauca, caught by Taiwanese large-scale longline fishery in the North Pacific Ocean Kwang-Ming Liu 1,2, Kuang-Yu Su 1,2,
USING DELTA-GAMMA GENERALIZED LINEAR MODELS TO STANDARDIZE CATCH RATES OF YELLOWFIN TUNA CAUGHT BY BRAZILIAN BAIT-BOATS
 SCRS/2008/166 USING DELTA-GAMMA GENERALIZED LINEAR MODELS TO STANDARDIZE CATCH RATES OF YELLOWFIN TUNA CAUGHT BY BRAZILIAN BAIT-BOATS Humber A. Andrade 1 SUMMARY In order to standardize catch per unit
Advice June Sole in Division IIIa and Subdivisions (Skagerrak, Kattegat, and the Belts)
") 6.3.26 Advice June 2014 ECOREGION STOCK North Sea Sole in Division IIIa and Subdivisions 22 24 (Skagerrak, Kattegat, and the Belts) Advice for 2015 ICES advises on the basis of the MSY approach that catches
6.3.26 Advice June 2014 ECOREGION STOCK North Sea Sole in Division IIIa and Subdivisions 22 24 (Skagerrak, Kattegat, and the Belts) Advice for 2015 ICES advises on the basis of the MSY approach that catches
Prospects for effective conservation of bigeye tuna stocks in the Western Central Pacific Ocean
 PFRP Page 1 7 th regular session of the Scientific Committee Western Central Pacific Fisheries Commission Ponhpei, Micronesia, 8-17 August 2011 Ref.: WCPFC-SC7-2011/ Prospects for effective conservation
Advice October 2013
 5.4.21.3 Advice October 213 ECOREGION Celtic Sea and West of Scotland STOCK Nephrops on Porcupine Bank (FU 16) Advice for 214 ICES advises on the basis of the MSY approach that catches from FU 16 in 214
REPORT OF THE 2011 ICCAT YELLOWFIN TUNA STOCK ASSESSMENT SESSION
 YFT ASSESSMENT SAN SEBASTIAN REPORT OF THE ICCAT YELLOWFIN TUNA STOCK ASSESSMENT SESSION (San Sebastián, Spain - September 5 to, ). Opening, adoption of agenda and meeting arrangements The Meeting was
Cod (Gadus morhua) in subdivisions 24 32, eastern Baltic stock (eastern Baltic Sea) *
 in subdivisions 24 32, eastern Baltic stock (eastern Baltic Sea) *") ICES Advice on fishing opportunities, catch, and effort Baltic Sea Ecoregion Published 31 May 2017 Version 2: 1 June 2017 Version 3: 8 June 2017 Version 4: 8 March 2018 DOI: 10.17895/ices.pub.3096 Cod
ICES Advice on fishing opportunities, catch, and effort Baltic Sea Ecoregion Published 31 May 2017 Version 2: 1 June 2017 Version 3: 8 June 2017 Version 4: 8 March 2018 DOI: 10.17895/ices.pub.3096 Cod
Cod (Gadus morhua) in subareas 1 and 2 (Northeast Arctic)
 in subareas 1 and 2 (Northeast Arctic)") ICES Advice on fishing opportunities, catch, and effort Arctic Ocean, Barents Sea, Faroes, Greenland Sea, Published 13 June 2018 Icelandic Waters, and Norwegian Sea ecoregions https://doi.org/10.17895/ices.pub.4412
ICES Advice on fishing opportunities, catch, and effort Arctic Ocean, Barents Sea, Faroes, Greenland Sea, Published 13 June 2018 Icelandic Waters, and Norwegian Sea ecoregions https://doi.org/10.17895/ices.pub.4412
Red Sea bream in Subareas VI, VII and VIII
 Stock Annex; Red Sea bream in Subareas VI, VII and VIII Stock specific documentation of standard assessment procedures used by ICES. Stock sbr-678_sa Working Group Red Sea bream (Pagellus bogaraveo) in
CPUE standardization of black marlin (Makaira indica) caught by Taiwanese large scale longline fishery in the Indian Ocean
 caught by Taiwanese large scale longline fishery in the Indian Ocean") CPUE standardization of black marlin (Makaira indica) caught by Taiwanese large scale longline fishery in the Indian Ocean Sheng-Ping Wang Department of Environmental Biology and Fisheries Science, National
CPUE standardization of black marlin (Makaira indica) caught by Taiwanese large scale longline fishery in the Indian Ocean Sheng-Ping Wang Department of Environmental Biology and Fisheries Science, National
Dauphin Lake Fishery. Status of Walleye Stocks and Conservation Measures
 Dauphin Lake Fishery Status of Walleye Stocks and Conservation Measures Date: December, 21 Dauphin Lake Fishery Status of Walleye Stocks and Conservation Measures Background: Walleye stocks in Dauphin
Indian Ocean Tuna Commission (IOTC) Victoria, Seychelles, 5-10 November Stock assessment of Indian Ocean bigeye tuna (Thunnus obesus) using
 Victoria, Seychelles, 5-10 November Stock assessment of Indian Ocean bigeye tuna (Thunnus obesus) using") Working paper for the 18 th Session of the Working Party on Tropical Tunas Indian Ocean Tuna Commission (IOTC) Victoria, Seychelles, 5-10 November 2016 Stock assessment of Indian Ocean bigeye tuna (Thunnus
Working paper for the 18 th Session of the Working Party on Tropical Tunas Indian Ocean Tuna Commission (IOTC) Victoria, Seychelles, 5-10 November 2016 Stock assessment of Indian Ocean bigeye tuna (Thunnus
Beaked redfish (Sebastes mentella) in subareas 1 and 2 (Northeast Arctic)
 in subareas 1 and 2 (Northeast Arctic)") ICES Advice on fishing opportunities, catch, and effort Arctic Ocean, Barents Sea, Faroes, Greenland Sea, Published 28 September 2018 Icelandic Waters, and Norwegian Sea Ecoregions DOI: 10.17895/ices.pub.4538
ICES Advice on fishing opportunities, catch, and effort Arctic Ocean, Barents Sea, Faroes, Greenland Sea, Published 28 September 2018 Icelandic Waters, and Norwegian Sea Ecoregions DOI: 10.17895/ices.pub.4538
9.4.5 Advice October Widely Distributed and Migratory Stocks Herring in the Northeast Atlantic (Norwegian spring-spawning herring)
") 9.4.5 Advice October 21 ECOREGION STOCK Widely Distributed and Migratory Stocks Herring in the Northeast Atlantic (Norwegian spring-spawning herring) Advice for 211 Management Objective (s) Landings in
9.4.5 Advice October 21 ECOREGION STOCK Widely Distributed and Migratory Stocks Herring in the Northeast Atlantic (Norwegian spring-spawning herring) Advice for 211 Management Objective (s) Landings in
Draft. Tom Nishida and Hiroki Yokoi. National Research Institute of Far Seas Fisheries, Fisheries Research Agency, Shimizu, Shizuoka, Japan ABSTRACT
 IOTC 26 WPB4 26 Draft Stock assessments of blue marlin (makaira nigricans) in the Indian Ocean using A Stock-Production Model Incorporating Covariates (ASPIC) (95-25) Tom Nishida and Hiroki Yokoi National
YELLOWFIN TUNA (Thunnus albacares)
") WETJENS DIMMLICH / W FACTSHEET APRIL 2015 WF SFI Smart Fishing Initiative (SFI): species overview YELLOWFIN TUNA (Thunnus albacares) Region: Indian Ocean IOTC status 2014: not subject to overfishing [1]
WETJENS DIMMLICH / W FACTSHEET APRIL 2015 WF SFI Smart Fishing Initiative (SFI): species overview YELLOWFIN TUNA (Thunnus albacares) Region: Indian Ocean IOTC status 2014: not subject to overfishing [1]
Proposals for improved figures in the tropical tunas executive summaries
 IOTC 21 SC18 13 Proposals for improved figures in the tropical tunas executive summaries By Alain Fonteneau 1 and Francis Marsac 2 Summary In this paper, we undertake a critical review of the figures included
West Coast Rock Lobster. Description of sector. History of the fishery: Catch history
 West Coast Rock Lobster Description of sector History of the fishery: The commercial harvesting of West Coast rock lobster commenced in the late 1800s, and peaked in the early 1950s, yielding an annual
Standardized catch rates of U.S. blueline tilefish (Caulolatilus microps) from commercial logbook longline data
 from commercial logbook longline data") Standardized catch rates of U.S. blueline tilefish (Caulolatilus microps) from commercial logbook longline data Sustainable Fisheries Branch, National Marine Fisheries Service, Southeast Fisheries Science
Standardized catch rates of U.S. blueline tilefish (Caulolatilus microps) from commercial logbook longline data Sustainable Fisheries Branch, National Marine Fisheries Service, Southeast Fisheries Science
An update of longline Catch Per-Unit-Effort indices for snapper in SNA 1 New Zealand Fisheries Assessment Report 2016/59
 An update of longline Catch Per-Unit-Effort indices for snapper in SNA 1 New Zealand Fisheries Assessment Report 2016/59 A.D. Langley ISSN 1179-5352 (online) ISBN 978-1-77665-412-3 (online) October 2016
Advice May Herring in Subdivisions and 32 (excluding Gulf of Riga herring)
") 8.3.10 Advice May 2014 ECOREGION STOCK Baltic Sea Herring in Subdivisions 25 29 and 32 (excluding Gulf of Riga herring) Advice for 2015 ICES advises on the basis of the MSY approach that catches in 2015
8.3.10 Advice May 2014 ECOREGION STOCK Baltic Sea Herring in Subdivisions 25 29 and 32 (excluding Gulf of Riga herring) Advice for 2015 ICES advises on the basis of the MSY approach that catches in 2015
SWG-11-JM-10. F Limit Reference Points about Preventing Recruitment Overfishing and its Uncertainty
 11th Meeting of the Science Working Group Lima, Peru, 1-19 October 01 F Limit Reference Points about Preventing Recruitment Overfishing and its Uncertainty One of the purposes of reference points (RPs)
Atlantic Striped Bass Draft Addendum V. Atlantic Striped Bass Board May 9, 2017
 Atlantic Striped Bass Draft Addendum V Atlantic Striped Bass Board May 9, 2017 Timeline May 2017: Consider Approval of Draft Addendum V for Public Comment May July 2017: Public Comment period August 2017:
SCIENTIFIC COMMITTEE ELEVENTH REGULAR SESSION. Pohnpei, Federated States of Micronesia 5-13 August 2015
 SCIENTIFIC COMMITTEE ELEVENTH REGULAR SESSION Pohnpei, Federated States of Micronesia 5-13 August 2015 Stock assessment update for striped marlin (Kajikia audax) in the western and central North Pacific
SCIENTIFIC COMMITTEE TENTH REGULAR SESSION. Majuro, Republic of the Marshall Islands 6-14 August 2014
 SCIENTIFIC COMMITTEE TENTH REGULAR SESSION Majuro, Republic of the Marshall Islands 6-14 August 2014 Stock Assessment of Albacore Tuna in the North Pacific Ocean in 2014 WCPFC-SC10-2014/ SA-WP-12 Report