! " " # $% $ % % & %
|
|
|
- Audrey Skinner
- 5 years ago
- Views:
Transcription

1 !" "#$%%&
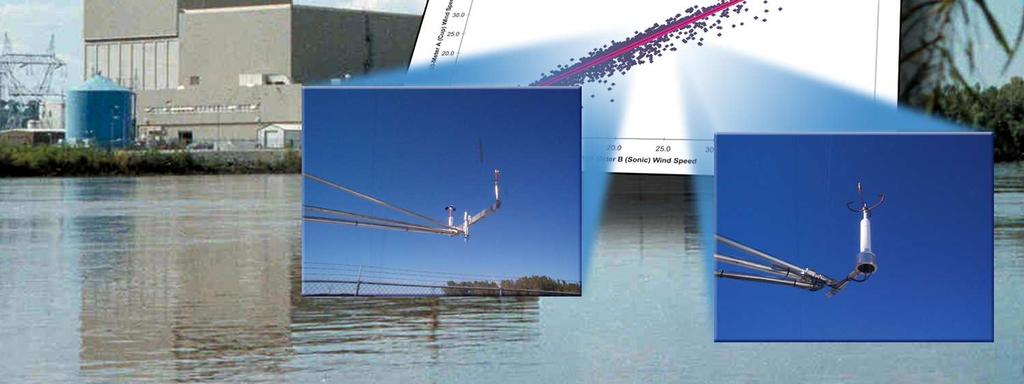
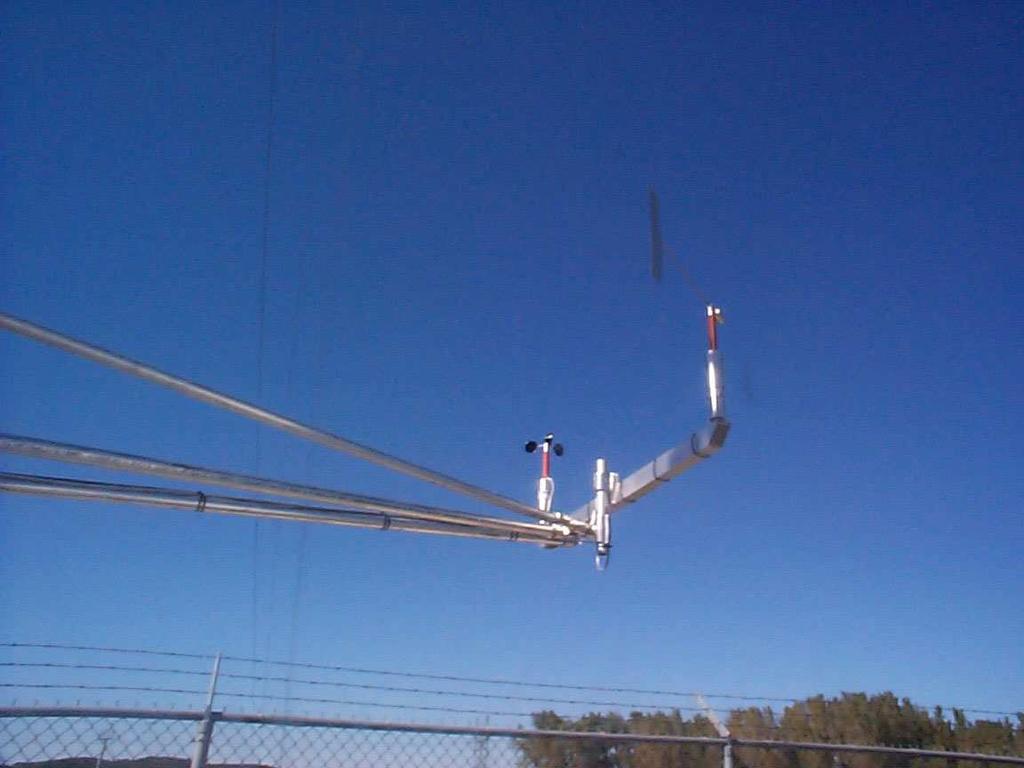
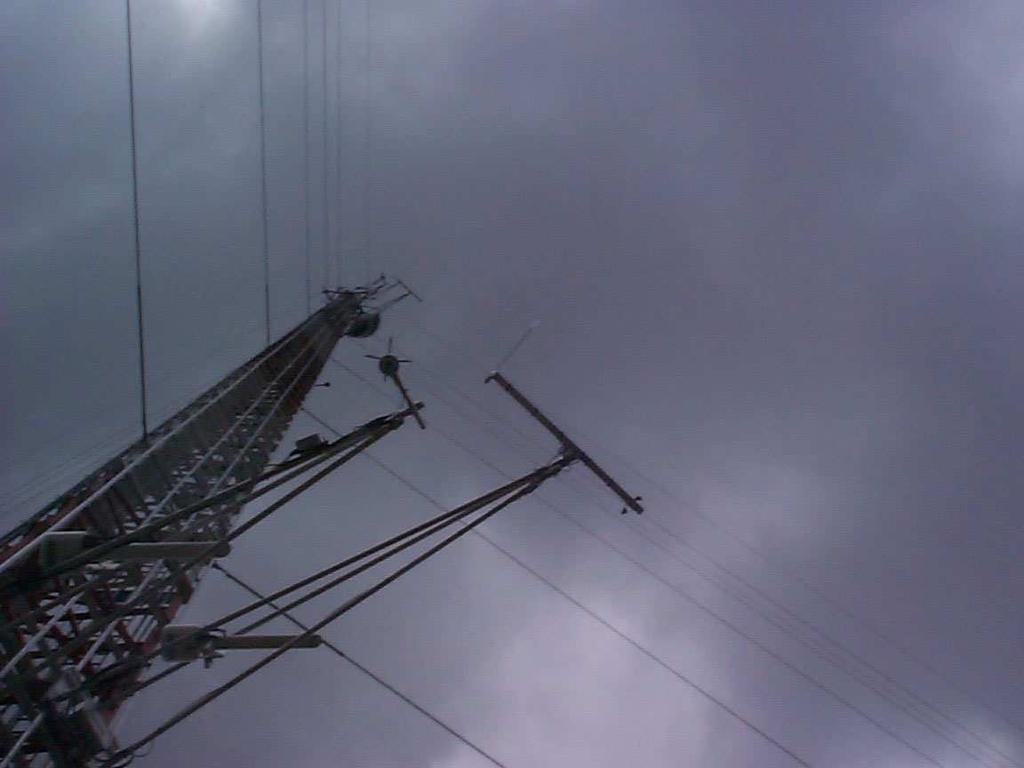
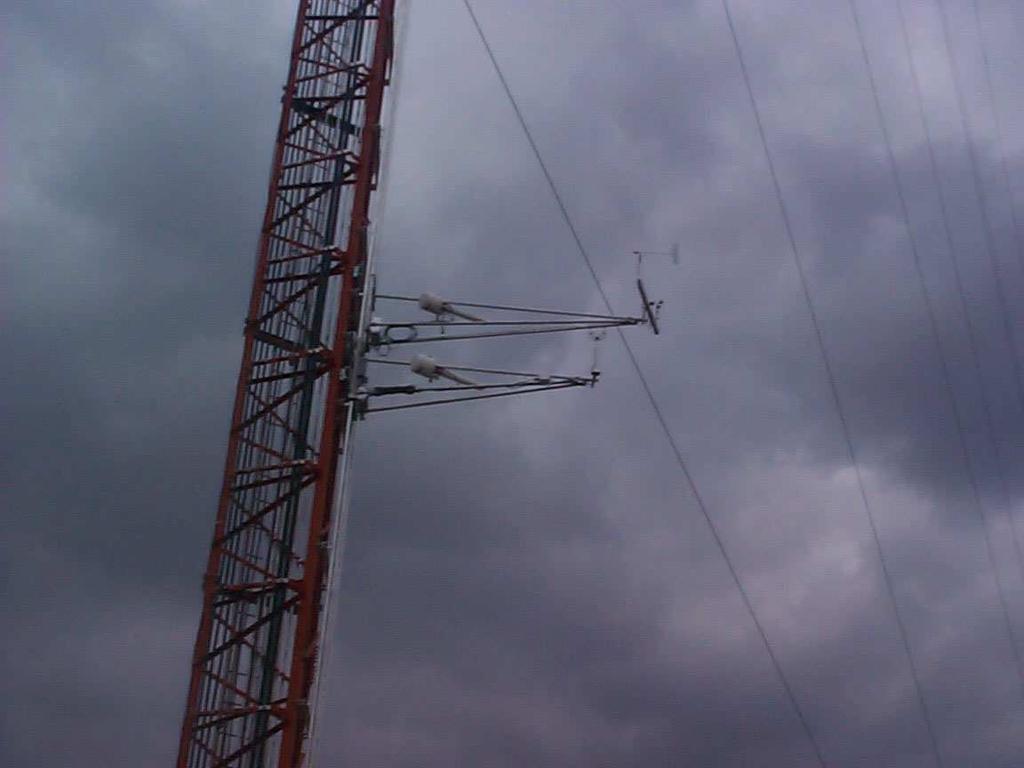
2 CNS Meteorological System Upgraded 100-meter tower in 2004 to include a dual elevator on the same tower face Dual monitoring systems with independence from sensor to Plant Computer Wind Sensors have Cups/Vanes on one side and Sonic on the other
3 Meteorological Parameters Systems A and B 10, 60, and 100 meter wind speed and direction 3 Delta-ts (60m-10m, 100m-10m, 100m-60m) 10, 60, and 100 meter temperatures System A only 10 meter dew point Station Pressure Precipitation
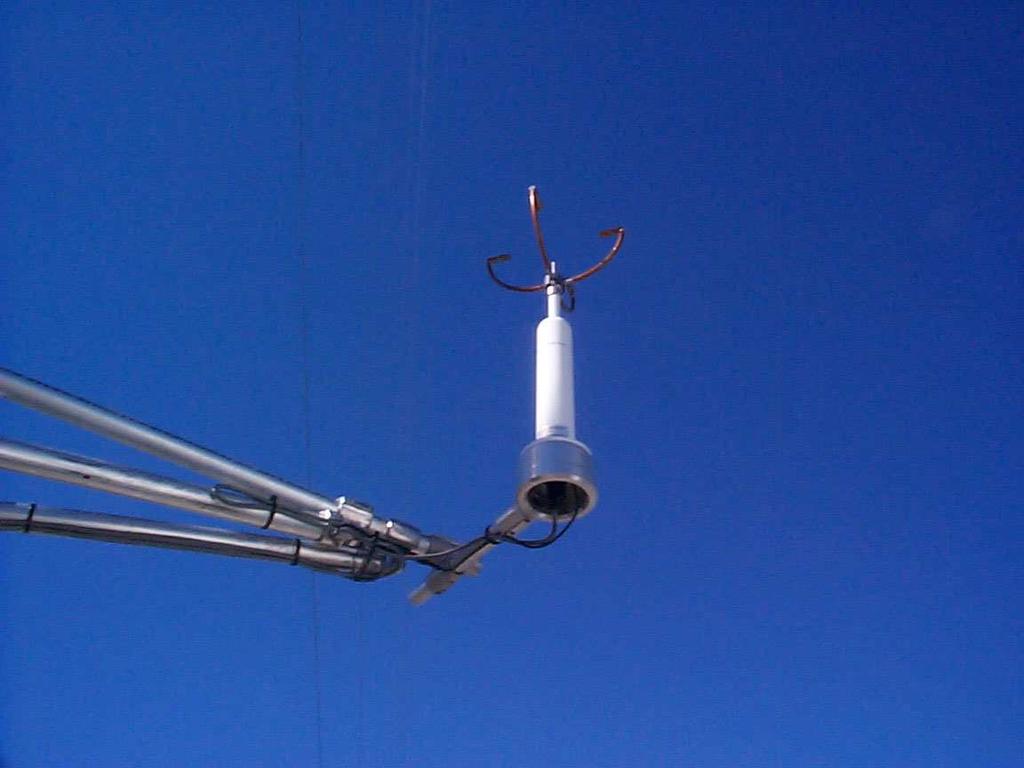
4 Meteorological Equipment System A Climatronics F460 Wind speed and Direction Sensors Climatronics Temperature Sensors Tower Systems Elevator Climatronics Dew Point Sensor Climatronics Tipping Bucket Rain gauge with Wind Shield Campbell Scientific 23X Micro Dataloggers Climatronics Pressure Sensor
5
6 Meteorological Equipment System B Met One 50.5 Sonic Wind speed and Direction Sensors Climatronics Temperature Sensors Tower Systems Elevator Campbell Scientific 23X Micro Dataloggers
7
8
9
10 Purpose Independently verify wind data collected from both systems are not statistically different Data from System A (cup/vane) can be interchanged with data from System B (sonic) Demonstrate the impact of the tower structure on meteorological data
11 Data Set One year of onsite validated hourly meteorological data (October 31, 2004 October 30, 2005) 8784 possible hourly values for each parameter for both Systems A and B on the 100-meter tower
12 Methodology Remove bad data from System A and System B files including calibrations, frozen sensors, failed sensors, bad data spikes, etc Remove wind directions when wind speeds less than 3 mph and/or wind directions are through tower Remove wind speeds when wind directions are through tower
13 Table 3 1 Invalid Data for CNS Onsite Meteorological Program October 31, 2004 October 30, 2005 Parameter Missing/Bad Data Hours Problem All Parameters (A&B) 3/ / / / Spring Calibration All Parameters (A System Only) 8/ / Troubleshoot All 3 levels down All Parameters (A&B) 9/ / Fall Calibration 100 Meter Wind Speed (A) 1/ / / / (B) 1/ Frozen Sensor Bad Data-Spike 60 Meter Wind Speed (A)1/ /9/ / / / / (B) 1/ Frozen Sensor/Sensor Failure Bad Data-Spike 10 Meter Wind Speed (A)1/ / Frozen Sensor 100 Meter Wind Direction (B) 1/ Bad Data-Spike 60 Meter Wind Direction (B) 1/ Bad Data-Spike
14
15
16
17
18 Wind Directions from degrees blow through tower Window is 25 degrees for vane and cup sensors and 30 degrees for sonic sensor
19 Data Availability 100- meter wind speed 82% 60-meter wind speed 87% 10-meter wind speed 88% 100-meter wind direction 84% 60-meter wind direction 45% 10-meter wind direction 70%
20 Results Unobstructed with no tower influence
21 Wind Speed Averages Hours A Avg. B Avg. Diff. Abs. 100-M WS 60-M WS 10-M WS
22 Wind Speed Correlation Hours Diff. Slope Y-int. Corr. 100-M WS 60-M WS 10-M WS
23 Figure 1: 100-Meter Wind Speed Regression y = x Observations: 7183 Correlation: Meter A (Cup) Wind Speed Meter B (Sonic) Wind Speed
24 Figure 2: 60-Meter Wind Speed Regression y = x Observations: 7637 Correlation: Meter A (Cup) Wind Speed Meter B (Sonic) Wind Speed
25 Figure 3: 10-Meter Wind Speed Regression y = x Observations: Correlation: Meter A (Cup) Wind Speed Meter B (Sonic) Wind Speed
26 Wind Direction Averages Hours A Avg. B Avg. Diff. Abs. 100-M WD 60-M WD 10-M WD
27 Wind Direction Correlation Hours Diff. Slope Y-int. Corr. 100-M WD 60-M WD 10-M WD
28 Figure 4: 100-Meter Wind Direction Regression y = x Observations: 7375 Correlation: Meter A (Vane) Wind Direction Tower interference Meter B (Sonic) Wind Direction
29 Figure 5: 60-Meter Wind Direction Regression y = x Observations: 3970 Correlation: Meter A (Vane) Wind Direction Tower interference Meter B (Sonic) Wind Direction
30 Figure 6: 10-Meter Wind Direction Regression y = x Observations: 6148 Correlation: Meter A (Vane) Wind Direction Tower interference Meter B (Sonic) Wind Direction
31 Tower Impacts Wind Speed and Direction
32 Wind Directions from degrees blow through tower Window is 25 degrees for vane and cup sensors and 30 degrees for sonic sensor
33 100-m Wind Speed Averages Tower Impact Hours A Avg. B Avg. Diff. Abs. 100-M WS-A 100-M WS-B
34 100-m Wind Speed Correlation Tower Impact Hours Diff. Slope Y-int. Corr. 100-M WS-A 100-M WS-B
35 Figure 10: 100-meter Wind Speed Regression When Tower Impacts System A (Cups) y = x Observations: 409 Correlation: Meter A (Cup) Wind Speed Meter B (Sonic) Wind Speed
36 Figure 11: 100-Meter Wind Speed Regression When Tower Impacts System B (Sonic) Meter System A (Cup) Wind Speed y = 1.681x Observations: 268 Correlation: Meter B (Sonic) Wind Speed
37 60-m Wind Speed Averages Tower Impact Hours A Avg. B Avg. Diff. Abs. 60-M WS-A 60-M WS-B
38 60-m Wind Speed Correlation Tower Impact Hours Diff. Slope Y-int. Corr. 60-M WS-A 60-M WS-B
39 Figure 12: 60-Meter Wind Speed Regression When Tower Impacts System A (Cups) y = x Observations: 364 Correlation: Meter A (Cup) Wind Speed Meter B (Sonic) Wind Speed
40 Figure 13: 60-Meter Wind Speed Regression When Tower Impacts System B (Sonic) Meter B (Sonic) Wind Speed y = x Observations: 285 Correlation: MeterA (Cup) Wind Speed
41 10-m Wind Speed Averages Tower Impact Hours A Avg. B Avg. Diff. Abs. 10-M WS-A 10-M WS-B
42 10-m Wind Speed Correlation Tower Impact Hours Diff. Slope Y-int. Corr. 10-M WS-A 10-M WS-B
43 Figure 14: 10-Meter Wind Speed Regression When Tower Impacts System A (Cups) 25.0 y = 0.801x Observations: 394 Correlation: Meter A (Cup) Wind Speed Meter B (Sonic) Wind Speed
44 Figure 15: 10-Meter Wind Speed Regression When Tower Impacts System B (Sonic) Meter A (Cup) Wind Speed y = x Observations: 225 Correlation: Meter B (Sonic) Wind Speed
45 100-m Wind Direction Averages Tower Impact Hours A Avg. B Avg. Diff. Abs. 100-M WD-A 100-M WD-B
46 100-m Wind Direction Correlation Tower Impact Hours Diff. Slope Y-int. Corr. 100-M WD-A 100-M WD-B
47 Figure 16: 100-Meter Wind Direction Regression When Tower Impacts System A (Vane) y = x Observations: Meter A (Vane) Wind Direction Correlation: Meter B (Sonic) Wind Direction
48 Figure 17: 100-Meter Wind Direction Regression When Tower Impacts System B (Sonic) y = x Observations: Meter A (Vane) Wind Direction Correlation: Meter B (Sonic) Wind Direction
49 10-m Wind Direction Averages Tower Impact Hours A Avg. B Avg. Diff. Abs. 10-M WD-A 10-M WD-B
50 10-m Wind Direction Correlation Tower Impact Hours Diff. Slope Y-int. Corr. 10-M WD-A 10-M WD-B
51 Figure 18: 10-Meter Wind Direction Regression When Tower Impacts System A (Vane) Meter A (Vane) Wind Direction y = x Observations: 402 Correlation: Meter B (Sonic) Wind Direction
52 Figure 19: 10-Meter Wind Direction Regression When Tower Impacts System B (Sonic) Meter A (Vane) Wind Direction y = x Observations: 80 Correlation: Meter B (Sonic) Wind Direction
53 Conclusions Outside of Tower wake impacts, Systems A and B are statistically the same for WS/WD. Outside of Tower wake impacts, all differences are small. WD small bias likely due to alignment errors during calibration.
54 Conclusions (cont d) Cup anemometer records wind speed on average 1mph higher than sonic likely due to overspeeding. Tower wake has greatest impact on wind speed. Differences up to 10 mph seen at wind speeds above 25 mph. Appears the wind speed tower impact is largest on sonic sensors but is it? Data from either system are interchangeable
55 Conclusions (cont d) Tower wake has little to no impact on wind direction on either vane or sonic sensors. Data from either System A (cups/vanes) or System B (sonic) are interchangeable outside of tower wake. Within wake, data scrutiny is needed either manually or with software.
Validation of long-range scanning lidars deployed around the Høvsøre Test Station
 Downloaded from orbit.dtu.dk on: Dec 18, 2017 Validation of long-range scanning lidars deployed around the Høvsøre Test Station Lea, Guillaume; Courtney, Michael Publication date: 2016 Link back to DTU
Meteorological Measurements OWEZ
 Meteorological Measurements OWEZ Half year report - 01-07-2008-31-12-2008 H. Korterink P.J. Eecen J.W. Wagenaar ECN-E--09-018 OWEZ_R_121_20080701-20081231_WIND_RESOURCE_2008_2 Abstract NoordzeeWind carries
Meteorological Measurements OWEZ
 Meteorological Measurements OWEZ Half year report 01-01-2008-30-06-2008 H. Korterink P.J. Eecen ECN-E--08-062 OWEZ_R_121_20080101-20080630_wind_resource_2008_1 Abstract NoordzeeWind carries out an extensive
LONG TERM SITE WIND DATA QUARTERLY REPORT. Bishop and Clerks
 LONG TERM SITE WIND DATA QUARTERLY REPORT Bishop and Clerks April 1, 2012 June 30, 2012 Prepared for Massachusetts Clean Energy Center 55 Summer Street, 9th Floor Boston, MA 02110 by Frederick Letson James
LONG TERM SITE WIND DATA QUARTERLY REPORT. Bishop and Clerks
 LONG TERM SITE WIND DATA QUARTERLY REPORT Bishop and Clerks January 1, 2012 March 31, 2012 Prepared for Massachusetts Clean Energy Center 55 Summer Street, 9th Floor Boston, MA 02110 by Frederick Letson
LONG TERM SITE WIND DATA ANNUAL REPORT WBZ
 LONG TERM SITE WIND DATA ANNUAL REPORT WBZ July 1, 2012 June 30, 2013 Prepared for Massachusetts Clean Energy Center 55 Summer Street, 9th Floor Boston, MA 02110 by Dylan D. Chase James F. Manwell Anthony
The OWEZ Meteorological Mast
 The OWEZ Meteorological Mast Analysis of mast-top displacements P.J. Eecen E. Branlard ECN-E--08-067 OWEZ_R_121_mast_top_movement Acknowledgement/Preface The Off Shore wind Farm Egmond aan Zee has a subsidy
WIND DATA REPORT. Mt. Tom
 WIND DATA REPORT Mt. Tom September 1, 2003 November 31, 2003 Prepared for Massachusetts Technology Collaborative 7 North Drive Westborough, MA 0181 by James F. Manwell Anthony F. Ellis Taylor Geer January
WIND DATA REPORT. Paxton, MA
 WIND DATA REPORT Paxton, MA July 1, 2011 September 30, 2011 Prepared for Massachusetts Clean Energy Center 55 Summer Street, 9th Floor Boston, MA 02110 by Eric Morgan James F. Manwell Anthony F. Ellis
VALIDATION OF WIND SPEED DISTURBANCES TO CUPS AT THE METEORLOCICAL MAST ON THE OFFSHORE PLATFORM FINO1 USING WIND-LIDAR MEASUREMENTS.
 VALIDATION OF WIND SPEED DISTURBANCES TO CUPS AT THE METEORLOCICAL MAST ON THE OFFSHORE PLATFORM FINO1 USING WIND-LIDAR MEASUREMENTS Authors: Detlef Kindler K.-W.-Koog GmbH Andy Oldroyd Oldbaum Services
Wind Project Siting & Resource Assessment
 Wind Project Siting & Resource Assessment David DeLuca, Project Manager AWS Truewind, LLC 463 New Karner Road Albany, NY 12205 ddeluca@awstruewind.com www.awstruewind.com AWS Truewind - Overview Industry
WIND DATA REPORT. Vinalhaven
 WIND DATA REPORT Vinalhaven January - December, 2003 Prepared for Fox Islands Electric Cooperative by Anthony L. Rogers May 12, 2004 Report template version 1.1 Renewable Energy Research Laboratory 160
LONG TERM SITE WIND DATA ANNUAL REPORT. Bishop & Clerks
 LONG TERM SITE WIND DATA ANNUAL REPORT Bishop & Clerks July 1, 2012 June 30, 2013 Prepared for Massachusetts Clean Energy Center 55 Summer Street, 9th Floor Boston, MA 02110 by Frederick Letson James F.
National Renewable Energy Laboratory. Wind Resource Data Summary Guam Naval Ordnance Annex Data Summary and Retrieval for November 2009
 National Renewable Energy Laboratory Wind Resource Data Summary Guam Naval Ordnance Annex Data Summary and Retrieval for November 2009 Prepared for: National Renewable Energy Laboratory 1617 Cole Boulevard
WIND DATA REPORT. Paxton, MA
 WIND DATA REPORT Paxton, MA September 1 2003 November 30 2003 by James F. Manwell Anthony F. Ellis Kai Wu April 15, 2004 Renewable Energy Research Laboratory 160 Governors Drive, www.ceere.org/rerl (413)
WIND DATA REPORT. Mt. Tom
 WIND DATA REPORT Mt. Tom June 1, 2003 August 31, 2003 Prepared for Massachusetts Technology Collaborative 7 North Drive Westborough, MA 0181 by James F. Manwell Anthony F. Ellis Taylor Geer October 30,
Comparison of Wind Measurements at Nuchek Heights, Hinchinbrook Island, and at Seal Rocks NOAA Data Buoy in Hinchinbrook Entrance, Alaska
 653.43.627.HnchinbrkWx.pdf Comparison of Wind Measurements at Nuchek Heights, Hinchinbrook Island, and at Seal Rocks NOAA Data Buoy in Hinchinbrook Entrance, Alaska Richard M. Brown Micro Specialties,
7 YEARS METEOMAST AMRUMBANK WEST
 7 YEARS METEOMAST AMRUMBANK WEST Joerg Bendfeld(1), Jens Krieger(2) (1) University of Paderborn, Kompetenzzentrum für nachhaltige Energietechnik KET, Pohlweg 55, 33098 Paderborn, Germany, (2) airwerk GmbH,
LONG TERM SITE WIND DATA QUARTERLY REPORT. Bishop and Clerks
 LONG TERM SITE WIND DATA QUARTERLY REPORT Bishop and Clerks July 1, 2010 September 30, 2010 Prepared for Massachusetts Clean Energy Center 55 Summer Street, 9th Floor Boston, MA 02110 by Frederick Letson
WIND DATA REPORT. Bourne Water District
 WIND DATA REPORT Bourne Water District July to September 2010 Prepared for Massachusetts Clean Energy Center 55 Summer Street, 9th Floor Boston, MA 02110 by Dylan Chase James F. Manwell Utama Abdulwahid
WIND DATA REPORT. Bishop and Clerks
 WIND DATA REPORT Bishop and Clerks March 1, 2004 May 31, 2004 Prepared for Massachusetts Technology Collaborative 75 North Drive Westborough, MA 01581 by James F. Manwell Anthony L. Rogers Anthony F. Ellis
WIND DATA REPORT. Mt. Lincoln Pelham, MA
 WIND DATA REPORT Mt. Lincoln Pelham, MA May 2009 to April 2010 Prepared for Massachusetts Department of Energy Resources 100 Cambridge Street, Suite 1020 Boston, MA 02114 by Jonathan D. Black James F.
LONG TERM SITE WIND DATA ANNUAL REPORT. Mass Turnpike Authority Blandford, MA
 LONG TERM SITE WIND DATA ANNUAL REPORT Mass Turnpike Authority Blandford, MA July 1, 2012 June 30, 2013 Prepared for Massachusetts Clean Energy Center 55 Summer Street, 9th Floor Boston, MA 02110 by Dylan
WIND DATA REPORT. Quincy DPW, MA
 WIND DATA REPORT Quincy DPW, MA March 1 st 2007 to May 31 st 2007 Prepared for Massachusetts Technology Collaborative 75 North Drive Westborough, MA 01581 by James R. Browning James F. Manwell Anthony
WIND DATA REPORT. Swan s Island, ME
 WIND DATA REPORT Swan s Island, ME June 1, 2009 August 31, 2009 Prepared for US Department of Energy by Daniel T. Grip Utama Abdulwahid James F. Manwell Anthony F. Ellis September 17, 2009 Report template
The Wind Resource: Prospecting for Good Sites
 The Wind Resource: Prospecting for Good Sites Bruce Bailey, President AWS Truewind, LLC 255 Fuller Road Albany, NY 12203 bbailey@awstruewind.com Talk Topics Causes of Wind Resource Impacts on Project Viability
WIND DATA REPORT. Mass Turnpike Authority Blandford, MA
 WIND DATA REPORT Mass Turnpike Authority Blandford, MA April 2012 June 2012 Prepared for Massachusetts Clean Energy Center 55 Summer Street, 9th Floor Boston, MA 02110 by Preeti Verma James F. Manwell
Reality Flow Monitoring:
 Reality Flow Monitoring: Lessons Learned Pipes Half Full or Half Empty? MWEA Collection Systems Seminar October 2, 200 Steve Kalinowski, PE Flow Monitoring Realities Metering is not an exact science Metering
ATOC Meteorological Tower (6 meter-4 level) Guide
 Guide") ATOC Meteorological Tower (6 meter-4 level) Guide SETUP Outline 1. Siting 2. Components 3. Transportation 4. The Tower 5. The Cables and Data Logger Siting Selecting an appropriate site for the weather
ATOC Meteorological Tower (6 meter-4 level) Guide SETUP Outline 1. Siting 2. Components 3. Transportation 4. The Tower 5. The Cables and Data Logger Siting Selecting an appropriate site for the weather
7 th International Conference on Wind Turbine Noise Rotterdam 2 nd to 5 th May 2017
 7 th International Conference on Wind Turbine Noise Rotterdam 2 nd to 5 th May 2017 Sound power level measurements 3.0 ir. L.M. Eilders, Peutz bv: l.eilders@peutz.nl ing. E.H.A. de Beer, Peutz bv: e.debeer@peutz.nl
Technology: WebCAM at 30 fps / VGA resolution. Sensor with 4 LED emitter sensors. Software with picture analysis.
 Test of the TOMI device 04.11.2007 Technology: WebCAM at 30 fps / VGA resolution. Sensor with 4 LED emitter sensors. Software with picture analysis. Functionality: The 4 LED signals are received by a Web
Wind Engineering Research Field Laboratory Selected Data Sets for Comparison to Model-Scale, Full-Scale and Computational Fluid Dynamics Simulations
 Wind Engineering Research Field Laboratory Selected Data Sets for Comparison to Model-Scale, Full-Scale and Computational Fluid Dynamics Simulations Douglas A. Smith, Ph.D., P.E., F.SEI, F. ASCE Stephen
USING THE CS400/CS405 (KPSI SERIES 169/173) SUBMERSIBLE PRESSURE TRANSDUCER WITH CAMPBELL SCIENTIFIC DATALOGGERS INSTRUCTION MANUAL
 SUBMERSIBLE PRESSURE TRANSDUCER WITH CAMPBELL SCIENTIFIC DATALOGGERS INSTRUCTION MANUAL") USING THE CS400/CS405 (KPSI SERIES 169/173) SUBMERSIBLE PRESSURE TRANSDUCER WITH CAMPBELL SCIENTIFIC DATALOGGERS INSTRUCTION MANUAL REVISION: 11/02 COPYRIGHT (c) 2000-2002 CAMPBELL SCIENTIFIC, INC. This
USING THE CS400/CS405 (KPSI SERIES 169/173) SUBMERSIBLE PRESSURE TRANSDUCER WITH CAMPBELL SCIENTIFIC DATALOGGERS INSTRUCTION MANUAL REVISION: 11/02 COPYRIGHT (c) 2000-2002 CAMPBELL SCIENTIFIC, INC. This
On- and Offshore Assessment of the ZephIR Wind-LiDAR
 On- and Offshore Assessment of the ZephIR Wind-LiDAR Detlef Kindler Kaiser-Wilhelm-Koog GmbH Andy Oldroyd Oldbaum Services Ltd. IEA R&D Task 11, Wind Energy 51 st Topical Expert Meeting on Remote Sensing
Technical Bulletin. Seametrics Smart Sensors: Barometric Compensation (with optional DTW setting) Introduction. How Pressure is Measured
 Introduction. How Pressure is Measured") Seametrics Smart Sensors: Precision Environmental Sensors An ONICON Brand The Barometric Compensation Utility is specifically for the PT2X and LevelSCOUT sensors. It uses barometric data to compensate
Seametrics Smart Sensors: Precision Environmental Sensors An ONICON Brand The Barometric Compensation Utility is specifically for the PT2X and LevelSCOUT sensors. It uses barometric data to compensate
WIND DATA REPORT. Mass Turnpike Authority Blandford, MA
 WIND DATA REPORT Mass Turnpike Authority Blandford, MA October 2011 December 2011 Prepared for Massachusetts Clean Energy Center 55 Summer Street, 9th Floor Boston, MA 02110 by Preeti Verma James F. Manwell
Wind Assessment Basics
 Wind Assessment Basics 120 Power curve for Northwind 100 100 80 60 40 kwh For Island Institute Fall 2013 by Mick Womersley 20 0 1 2 3 4 5 6 7 8 9 1011121314151617181920212223 Wind speed in M/S A misspent
Q2: Which instruments are necessary for monitoring the groundwater level?
 Micro-Diver 1. Q: What do Divers actually do? 2. Q: Which instruments are necessary for monitoring the groundwater level? 3. Q: Can I place the Diver close to an electrical pump? 4. Q: How should I install
Completion of Hydrometric Survey Notes (HSN)
") Completion of Hydrometric Survey Notes (HSN) Hydrometric Survey Notes provide a place to record results and applied proper procedures for tasks undertaken in the field, such as levelling, measurements,
Completion of Hydrometric Survey Notes (HSN) Hydrometric Survey Notes provide a place to record results and applied proper procedures for tasks undertaken in the field, such as levelling, measurements,
TESTING AND CALIBRATION OF VARIOUS LiDAR REMOTE SENSING DEVICES FOR A 2 YEAR OFFSHORE WIND MEASUREMENT CAMPAIGN
 TESTING AND CALIBRATION OF VARIOUS LiDAR REMOTE SENSING DEVICES FOR A 2 YEAR OFFSHORE WIND MEASUREMENT CAMPAIGN D Kindler 1 WINDTEST Kaiser Wilhelm Koog detlef.kindler@wtk.windtest.com 1 Corresponding
Windcube FCR measurements
 Windcube FCR measurements Principles, performance and recommendations for use of the Flow Complexity Recognition (FCR) algorithm for the Windcube ground-based Lidar Summary: As with any remote sensor,
WIND DATA REPORT. Ragged Mt Maine
 WIND DATA REPORT Ragged Mt Maine December 1 st 2007 to February 29 th 2007 by James R. Browning James F. Manwell Utama Abdulwahid Anthony F. Ellis April 10, 2008 Report template version 3.1 Renewable Energy
Power curves - use of spinner anemometry. Troels Friis Pedersen DTU Wind Energy Professor
 Power curves - use of spinner anemometry Troels Friis Pedersen DTU Wind Energy Professor Spinner anemometry using the airflow over the spinner to measure wind speed, yaw misalignment and flow inclination
Meteorological Measurements of Mangalore Region for ARMEX Programme: Observations and Data Analysis
 Meteorological Measurements of Mangalore Region for ARMEX Programme: Observations and Data Analysis K M Balakrishna (PI) Y Narayana (Co-PI) and Anitha Kumari (RS) Department of Physics Mangalore University
2. Determine how the mass transfer rate is affected by gas flow rate and liquid flow rate.
 Goals for Gas Absorption Experiment: 1. Evaluate the performance of packed gas-liquid absorption tower. 2. Determine how the mass transfer rate is affected by gas flow rate and liquid flow rate. 3. Consider
Wind Flow Modeling Software Comparison
 Wind Flow Modeling Software Comparison John Vanden Bosche AWEA Wind Resource Assessment Workshop Minneapolis, MN September 30, 2009 Issues With Wind Flow Modeling Impractical to measure the wind at the
Reliable, accurate groundwater Diver dataloggers and software. Diver-Suite
 Reliable, accurate groundwater Diver dataloggers and software Diver-Suite SMART MONITORING TECHNOLOGY Diver-Suite* from Schlumberger Water Services provides a robust line of Diver* dataloggers for groundwater
K V A L I F I K. Our accreditation number: NAH /2015. Valid to:
 KVALIFIK Ltd. has founded in 1991. In 1993 our calibration laboratory has get the accredited status and we have calibrated standards for the generally used physical parameters. Our standards are traceable
WIND CONDITIONS MODELING FOR SMALL WIND TURBINES
 U.P.B. Sci. Bull., Series C, Vol. 77, Iss. 2, 2015 ISSN 2286-3540 WIND CONDITIONS MODELING FOR SMALL WIND TURBINES Viorel URSU 1, Sandor BARTHA 2 Wind energy systems are a solution which became cost effective
HOUTEN WIND FARM WIND RESOURCE ASSESSMENT
 CIRCE CIRCE Building Campus Río Ebro University de Zaragoza Mariano Esquillor Gómez, 15 50018 Zaragoza Tel.: 976 761 863 Fax: 976 732 078 www.fcirce.es HOUTEN WIND FARM WIND RESOURCE ASSESSMENT CIRCE AIRE
Diver-Suite. Reliable, accurate groundwater Diver dataloggers and software
 Diver-Suite Reliable, accurate groundwater Diver dataloggers and software Diver-Suite SMART MONITORING TECHNOLOGY Diver-Suite* from Van Essen Instruments provides a robust line of Diver* dataloggers for
WBEA Standard Operating Procedure
 Page 1 WBEA Standard Operating Procedure SOP Title Temperature and Relative Humidity Author Gary Cross Implementation date March 2, 2013 Revision History Revision # Date Description Author Page 2 Table
LONG TERM SITE WIND DATA ANNUAL REPORT. Paxton, MA
 LONG TERM SITE WIND DATA ANNUAL REPORT Paxton, MA July 1, 2012 June 30, 2013 Prepared for Massachusetts Clean Energy Center Summer Street, 9th Floor Boston, MA 021 by Dylan D. Chase James F. Manwell Anthony
Lake Michigan Wind Assessment Project Data Summary and Analysis: October 2012
 Grand Valley State University ScholarWorks@GVSU Monthly Buoy Report Offshore Wind Project 1-1- Lake Michigan Wind Assessment Project Data Summary and Analysis: October Lake Michigan Offshore Wind Assessment
Site Summary. Wind Resource Summary. Wind Resource Assessment For King Cove Date Last Modified: 8/6/2013 By: Rich Stromberg & Holly Ganser
 Site Summary Wind Resource Assessment For King Cove Date Last Modified: 8/6/2013 By: Rich Stromberg & Holly Ganser Station ID: 2857 Latitude: 55 7 45.8 N Longitude: 162 16 10.6 W Tower Type: 30 m NRG Tall
Characterization of winds through the rotor plane using a phased array SODAR and recommendations for future work
 Publications (E) Energy 2-2010 Characterization of winds through the rotor plane using a phased array SODAR and recommendations for future work Regina Anne Deola Sandia National Laboratories Follow this
Wind Resource Assessment for FALSE PASS, ALASKA Site # 2399 Date last modified: 7/20/2005 Prepared by: Mia Devine
 813 W. Northern Lights Blvd. Anchorage, AK 99503 Phone: 907-269-3000 Fax: 907-269-3044 www.aidea.org/wind.htm Wind Resource Assessment for FALSE PASS, ALASKA Site # 2399 Date last modified: 7/20/2005 Prepared
Kestrel LiNK Ballistics For Android and iphone - Kestrel 5700 Elite & Sportsman with LiNK
 Kestrel LiNK Ballistics For Android and iphone - Kestrel 5700 Elite & Sportsman with LiNK The Kestrel LiNK Ballistics App is the most versatile, accurate and user friendly dual purpose app available. This
3D Turbulence at the Offshore Wind Farm Egmond aan Zee J.W. Wagenaar P.J. Eecen
 3D Turbulence at the Offshore Wind Farm Egmond aan Zee J.W. Wagenaar P.J. Eecen OWEZ_R_121_3Dturbulence_20101008 ECN-E--10-075 OCTOBER 2010 Abstract NoordzeeWind carries out an extensive measurement and
Kodiak, Alaska Site 1 Wind Resource Report
 Kodiak, Alaska Site 1 Wind Resource Report Report written by: Douglas Vaught, P.E., V3 Energy LLC, Eagle River, AK Date of report: March 16, 2007 Photo by Doug Vaught, V3 Energy LLC Summary Information
Validation Study of the Lufft Ventus Wind Sensor
 Weather Forecasts Renewable Energies Air and Climate Environmental Information Technology METEOTEST Cooperative Fabrikstrasse 14, CH-3012 Bern Tel. +41 (0)31 307 26 26 Fax +41 (0)31 307 26 10 office@meteotest.ch,
Analysis of Traditional Yaw Measurements
 Analysis of Traditional Yaw Measurements Curiosity is the very basis of education and if you tell me that curiosity killed the cat, I say only the cat died nobly. Arnold Edinborough Limitations of Post-
NOVALYNX CORPORATION MODEL RAIN GAUGE CALIBRATOR INSTRUCTION MANUAL
 NOVALYNX CORPORATION MODEL 260-2595 RAIN GAUGE CALIBRATOR INSTRUCTION MANUAL REVISION DATE: August 2018 Receiving and Unpacking Carefully unpack all components and compare to the packing list. Notify NovaLynx
P.O.Box 43 Blindern, 0313 Oslo, Norway Tel.: , Fax: Statkraft,Postboks 200 Lilleaker, 0216 Oslo, Norway ABSTRACT
 A NEW TESTSITE FOR WIND CORRECTION OF PRECIPITATION MEASUREMENTS AT A MOUNTAIN PLATEAU IN SOUTHERN NORWAY Mareile Wolff 1, Ragnar Brækkan 1, Ketil Isaaksen 1, Erik Ruud 2 1 Norwegian Meteorological Institute,
Tex-1001-S, Operating Inertial Profilers and Evaluating Pavement Profiles. Chapter 10 Special Procedures. Overview
 Overview Effective dates: August 2002 October 2004. Test Method Tex-1001-S covers use of an inertial profiler to implement Special Specifications 5440 and 5880 for ride quality measurements using Surface
Meso- and Micro-scale modelling in China: Wind measurements at 12 meteorological stations in NE China (Dongbei)
") Downloaded from orbit.dtu.dk on: Nov 15, 2018 Meso- and Micro-scale modelling in China: Wind measurements at 12 meteorological stations in NE China (Dongbei) Lindelöw, Per Jonas Petter; Enevoldsen, Karen
Downloaded from orbit.dtu.dk on: Nov 15, 2018 Meso- and Micro-scale modelling in China: Wind measurements at 12 meteorological stations in NE China (Dongbei) Lindelöw, Per Jonas Petter; Enevoldsen, Karen
Site Description: LOCATION DETAILS Report Prepared By: Tower Site Report Date
 Wind Resource Summary for Holyoke Site Final Report Colorado Anemometer Loan Program Monitoring Period:: 6/21/26 /6/27 Report Date: December 2, 27 Site Description: The site is 17.4 miles south of the
nvisti Kestrel Companion Pro For Android
 nvisti Kestrel Companion Pro For Android The nvisti Kestrel Companion App is the most versatile, accurate and user friendly dual purpose app available. This app allows for both remote viewing for firing
LES* IS MORE! * L ARGE E DDY S IMULATIONS BY VORTEX. WindEnergy Hamburg 2016
 LES* IS MORE! * L ARGE E DDY S IMULATIONS BY VORTEX WindEnergy Hamburg 2016 OUTLINE MOTIVATION Pep Moreno. CEO, BASIS Alex Montornés. Modelling Specialist, VALIDATION Mark Žagar. Modelling Specialist,
Workshop on Short-Term Weather Forecasting for Probabilistic Wake-Vortex Prediction. WakeNet3-Europe DLR Oberpfaffenhofen, Germany
 NWRA NorthWest Research Associates, Inc. Redmond, WA Analysis of the Short-Term Variability of Crosswind Profiles Workshop on Short-Term Weather Forecasting for Probabilistic Wake-Vortex Prediction WakeNet3-Europe
WCA Wind Research Project Report
 WCA Wind Research Project Report Steven Selvaggio Hasz Consulting Company Whitestone Community Association Presented to: Alaska Energy Authority September 25 Table of Contents I. Project Overview II. Results
OFFSHORE CREDENTIALS. Accepted for wind resource assessment onshore and offshore by leading Banks Engineers, globally
 OFFSHORE CREDENTIALS Accepted for wind resource assessment onshore and offshore by leading Banks Engineers, globally ZEPHIR OFFSHORE CREDENTIALS Accepted for wind resource assessment onshore and offshore
Quick Guide. SGX-CA500 Cycle Computer SGY-PM Series Power Meters
 Quick Guide SGX-CA500 Cycle Computer SGY-PM Series Power Meters Easy Installation and Advanced Functionality Fast Facts: Pioneer Power Meter Cranksets and arms ship pre-set in the ANT+ Format Simply install
Information Technology for Monitoring of Municipal Gas Consumption, Based on Additive Model and Correlated for Weather Factors
 ISSN 1746-7659, England, UK Journal of Information and Computing Science Vol. 11, No. 3, 2016, pp.180-187 Information Technology for Monitoring of Municipal Gas Consumption, Based on Additive Model and
Comparison of flow models
 Comparison of flow models Rémi Gandoin (remga@dongenergy.dk) March 21st, 2011 Agenda 1. Presentation of DONG Energy 2. Today's presentation 1. Introduction 2. Purpose 3. Methods 4. Results 3. Discussion
Pitka s Point, Alaska Wind Resource Report
 Pitka s Point, Alaska Wind Resource Report Pitka s Point met tower, photo by Doug Vaught April 25, 2012 Douglas Vaught, P.E. V3 Energy, LLC Eagle River, Alaska Page 2 Summary The wind resource measured
Site Description: Tower Site
 Wind Resource Summary for Elizabeth Site Final Report Colorado Anemometer Loan Program Monitoring Period: 7/3/6 /15/7 Report Date: December 22, 7 Site Description: The site is.6 miles northeast of the
Declining Weight Blending System Quick Start Manual E Main St Marshall, IL Phone: Fax: Website:
 Declining Weight Blending System Quick Start Manual 12285 E Main St Marshall, IL 62441 Phone: 217-826-6352 Fax: 217-826-8551 Website: www.yargus.com P a g e 2 MAIN SCREEN The MAIN SCREEN on the cover page
In addition to reading this assignment, also read Appendices A and B.
 1 Kinematics I Introduction In addition to reading this assignment, also read Appendices A and B. We will be using a motion detector to track the positions of objects with time in several lab exercises
STD-3-V1M4_1.7.1_AND_ /15/2015 page 1 of 6. TNI Standard. EL-V1M4 Sections and September 2015
 page 1 of 6 TNI Standard EL-V1M4 Sections 1.7.1 and 1.7.2 September 2015 Description This TNI Standard has been taken through all of the voting stages and has received consensus approval by the TNI membership.
Weather and Climate. Climate the situation of the atmosphere during a long period of time and a big surface.
 Weather and Climate Weather and Climate Weather the situation of the atmosphere during a short period of time and a small surface of the Earth. It is very irregular and changes a lot. Climate the situation
Ambient Weather WS-03 Thermo-Hygrometer
 Ambient Weather WS-03 Thermo-Hygrometer Table of Contents 1. Introduction... 1 2. Parts List... 1 2.1 Display Console Set Up... 1 2.2 Sensor Operation Verification... 2 2.3 Display Features... 3 2.3.1
Torrild - WindSIM Case study
 Torrild - WindSIM Case study Note: This study differs from the other case studies in format, while here another model; WindSIM is tested as alternative to the WAsP model. Therefore this case should be
Water budgets of the two Olentangy River experimental wetlands in 1998
 Water budgets of the two Olentangy River experimental wetlands in 1998 Naiming Wang and William J. Mitsch School of Natural Resources The Ohio State University Water Budgets 17 Introduction An understanding
Wind Resource Assessment for NOME (ANVIL MOUNTAIN), ALASKA Date last modified: 5/22/06 Compiled by: Cliff Dolchok
, ALASKA Date last modified: 5/22/06 Compiled by: Cliff Dolchok") 813 W. Northern Lights Blvd. Anchorage, AK 99503 Phone: 907-269-3000 Fax: 907-269-3044 www.akenergyauthority.org SITE SUMMARY Wind Resource Assessment for NOME (ANVIL MOUNTAIN), ALASKA Date last modified:
813 W. Northern Lights Blvd. Anchorage, AK 99503 Phone: 907-269-3000 Fax: 907-269-3044 www.akenergyauthority.org SITE SUMMARY Wind Resource Assessment for NOME (ANVIL MOUNTAIN), ALASKA Date last modified:
Wind shear coefficients and energy yield for Dhahran, Saudi Arabia
 Renewable Energy 32 (2007) 738 749 www.elsevier.com/locate/renene Wind shear coefficients and energy yield for Dhahran, Saudi Arabia Shafiqur Rehman a,, Naif M. Al-Abbadi b a Center for Engineering Research,
Validation of Measurements from a ZephIR Lidar
 Validation of Measurements from a ZephIR Lidar Peter Argyle, Simon Watson CREST, Loughborough University, Loughborough, United Kingdom p.argyle@lboro.ac.uk INTRODUCTION Wind farm construction projects
Technical note: Averaging wind speeds and directions
 Technical note: Averaging wind speeds and directions Stuart K. Grange a,b a School of Environment, the University of Auckland, Auckland, New Zealand b School of Population Health, the University of Auckland,
Installation & Commissioning Report
 Installation & Commissioning Report Client: XXXX Site: XXXX City: XXXX Provinces: XXXX Country: XXXX 2 Ge:Net GmbH confirms that all facts in this installation report are written to the best of one's knowledge.
MA PHIT- Food Certificate Program
 Proper inspection equipment and the knowledge of how to use and care for the equipment is necessary for an inspector to be able to identify food safety hazards which could lead to foodborne illness. Day
E. Agu, M. Kasperski Ruhr-University Bochum Department of Civil and Environmental Engineering Sciences
 EACWE 5 Florence, Italy 19 th 23 rd July 29 Flying Sphere image Museo Ideale L. Da Vinci Chasing gust fronts - wind measurements at the airport Munich, Germany E. Agu, M. Kasperski Ruhr-University Bochum
USCGC HEALY WAGB-20 Final Report RD Instruments Inc. Ocean Surveyor 75 khz Prepared by: Ron Hippe Commissioning Dates: 3/27/2002-3/30/2002
 USCGC HEALY WAGB-20 Final Report Inc. Ocean Surveyor 75 khz Prepared by: Ron Hippe Commissioning Dates: 3/27/2002-3/30/2002 This report outlines the tests performed, and the results of Harbor and Sea testing
10m-130mm Tubular Tower. Technical Specifications
 10m-130mm Tubular Tower Technical Specifications ENALLAKTIKI ENERGIAKI 2006 Y 1 0 m / 1 0 m T U B U L A R T O W E R T E C H N I C A L S P E C S Index 1 Contact Details....3 2 Tubular Meteorological Towers....4
OPERATIONAL TEST OF SONIC WIND SENSORS AT KNMI
 OPERATIONAL TEST OF SONIC WIND SENSORS AT KNMI Wiel M.F. Wauben 1 and Rob van Krimpen 2 1 R&D Information and Observation Technology, 2 Observation Systems Operations Royal Netherlands Meteorological Institute
ONSITE PROVING OF GAS METERS. Daniel J. Rudroff WFMS Inc West Bellfort Sugar Land, Texas. Introduction
 ONSITE PROVING OF GAS METERS Daniel J. Rudroff WFMS Inc. 13901 West Bellfort Sugar Land, Texas Introduction With the increased use of Natural Gas as a fuel, and higher natural gas prices buyers and sellers
Air Pressure Test to EN13829:2000
 Air Pressure Test to EN13829:2000 16 Kilgarron Park Enniskerry Co. Wicklow 2014-03-04 Pre-Renovation Test Directors: G Ó Sé, J Uí Shé 1 Table of Contents Introduction... 3 Pressure Test Result Summary...
Standard Procedure. for using ConfiRM with the SoloVPE. Slope
 Standard Procedure R for using ConfiRM with the SoloVPE Confirming SoloVPE System Readiness with NIST Traceable Slope Reference Material (mrm TM ) The Originators of Slope spectroscopy R Revision Date:
Redesign of Centrifugal PLACE FOR Compressor TITLE. Impeller by means of Scalloping
 Redesign of Centrifugal PLACE FOR Compressor TITLE AUTHORS Impeller by means of Scalloping Kirill Grebinnyk, Aerodynamics Engineer, Sulzer (USA) Rob Widders, Engineering Manager, BOC (Australia) Kirill
Measuring power performance with a Wind Iris 4- beam in accordance with EUDP procedure
 Measuring power performance with a Wind Iris 4- beam in accordance with EUDP procedure This document evaluates the applicability of the EUDP procedure for wind turbine measuring power performance using
Siting classification for Surface. Michel Leroy, Météo-France
 Siting classification for Surface Observing Stations ti on Land Michel Leroy, Météo-France Content of the presentation Quality factors of a measurement Site representativeness Siting classification Experience