Muscular strategy shift in human running: dependence of running speed on hip and ankle muscle performance
|
|
|
- Grant Collins
- 5 years ago
- Views:
Transcription
1 Erratum Muscular strategy shift in human running: dependence of running speed on hip and ankle muscle performance Tim W. Dorn, Anthony G. Schache and Marcus G. Pandy 1.14/jeb.7551 There was an error published in J. Exp. Biol. 15, In Fig. B, the units for the right-hand y-axis were incorrect. The correct version of the figure is given below. Stride length (m) A B Stride length Stride frequency 3% increase 17% increase 1% increase 1% increase 3% increase 5% increase Stride frequency (Hz) Time (s).3..1 Ground contact time Aerial time Effective vertical ground impulse Running speed (m s 1 ).1 Impulse (BW s) We apologise to the authors and readers for any inconvenience caused. 1. Published by The Company of Biologists Ltd
2 1944 The Journal of Experimental Biology 15, Published by The Company of Biologists Ltd doi:1.14/jeb.6457 RESEARCH ARTICLE Muscular strategy shift in human running: dependence of running speed on hip and ankle muscle performance Tim W. Dorn, Anthony G. Schache and Marcus G. Pandy* Department of Mechanical Engineering, University of Melbourne, Victoria 31, Australia *Author for correspondence to Accepted 13 February 1 SUMMARY Humans run faster by increasing a combination of stride length and stride frequency. In slow and medium-paced running, stride length is increased by exerting larger support forces during ground contact, whereas in fast running and sprinting, stride frequency is increased by swinging the legs more rapidly through the air. Many studies have investigated the mechanics of human running, yet little is known about how the individual leg muscles accelerate the joints and centre of mass during this task. The aim of this study was to describe and explain the synergistic actions of the individual leg muscles over a wide range of running speeds, from slow running to maximal sprinting. Experimental gait data from nine subjects were combined with a detailed computer model of the musculoskeletal system to determine the forces developed by the leg muscles at different running speeds. For speeds up to 7 m s 1, the ankle plantarflexors, soleus and gastrocnemius, contributed most significantly to vertical support forces and hence increases in stride length. At speeds greater than 7 m s 1, these muscles shortened at relatively high velocities and had less time to generate the forces needed for support. Thus, above 7 m s 1, the strategy used to increase running speed shifted to the goal of increasing stride frequency. The hip muscles, primarily the iliopsoas, gluteus maximus and hamstrings, achieved this goal by accelerating the hip and knee joints more vigorously during swing. These findings provide insight into the strategies used by the leg muscles to maximise running performance and have implications for the design of athletic training programs. Supplementary material available online at Key words: gait biomechanics, musculoskeletal modelling, muscle coordination, stride length, stride frequency. INTRODUCTION Humans increase their running speed by taking longer strides and swinging their legs more quickly through the air. Running speed (v), stride length (l) and stride frequency (f) are related by the simple equation v lf. Although faster running speeds can be achieved by increasing either stride length or stride frequency, changing these parameters is difficult in practice because these two variables are not independent. Stride length is inversely proportional to stride frequency (Cavagna et al., 1988; Cavagna et al., 1991; Hunter et al., 4; Kaneko, 199; Luhtanen and Komi, 1978; Salo et al., 11; Weyand et al., ), and so running speed can be increased only when an increase in stride length is not accompanied by a similar decrease in stride frequency and vice versa. Runners appear to use two different strategies to increase their speed. Up to ~7 m s 1, running speed is increased by exerting larger support forces during ground contact, which has been shown to correlate with increases in stride length (Derrick et al., 1998; Frederick, 1986; Mercer et al., 5; Mercer et al., ; Weyand et al., ). Using a simple point-mass model of running, it is relatively straightforward to show that a larger support force produces a larger stride length because the body spends more time in the air (see Appendix). Larger ground forces can be generated at lower running speeds because the leg muscles have enough time to develop the forces needed to lift and accelerate the body during stance (Weyand et al., ). At speeds near 7 m s 1, however, ground contact times become very small (Kunz and Kaufmann, 1981; Mann and Herman, 1985; Mann, 1981), limiting the ability of the leg muscles to generate the ground forces needed to increase running speed still further (Weyand et al., ). Of particular interest in this respect is the behaviour of the ankle plantarflexors, which undergo significant periods of stretch shortening during stance (Hennessy and Kilty, 1; Ishikawa and Komi, 7; Komi, 1984; Komi, ; Kubo et al., ; Lichtwark et al., 7). Greater rates of shortening of the plantarflexors because of reduced ground contact times decrease the power output of these muscles (Cavagna et al., 1971; Miller et al., 11; Volkov and Lapin, 1979), and may limit their ability to generate the required thrust during terminal stance. Above ~7 m s 1, the primary strategy used to increase running speed shifts from the goal of increasing stride length to that of increasing stride frequency, which is achieved by accelerating the legs more rapidly through the air. Peak hip-flexor, hip-extensor and knee-flexor moments all increase significantly at speeds above 7 m s 1 (Belli et al., ; Schache et al., 11). Increases in the work performed at the hip and knee during the swing phase also correlate with running speed above 7 m s 1, as does the mechanical energy delivered by the leg muscles to the thigh and shank (Cavagna, 9; Cavagna et al., 8; Chapman and Caldwell, 1983). Although many studies have calculated the net torques, power and work performed by the lower-limb joints during running (Novacheck, 1998; Biewener et al., 4; McIntosh et al., 6; Devita et al., 7), little is known about how the actions
3 Muscular strategy shift in human running 1945 of individual leg muscles coordinate motion of the lower-limb joints and the centre of mass, particularly across a wide range of running speeds. Computational modelling is the only means available for studying the contributions of individual muscles to joint and body-segment accelerations, hereafter referred to as muscle function (Pandy and Andriacchi, 1). Detailed musculoskeletal models of the body have been used to quantify the function of individual muscles in various tasks, including walking, running and jumping (Delp et al., 7; Erdemir et al., 7; Heintz and Gutierrez-Farewik, 7; Pandy, 1; Pandy and Andriacchi, 1; Pandy et al., 1). In studies of walking, model simulations have shown that five muscle groups gluteus maximus, gluteus medius, vasti, soleus and gastrocnemius contribute most significantly to the accelerations of the centre of mass in the vertical, fore aft and mediolateral directions (Anderson and Pandy, 3; Liu et al., 8; Pandy et al., 1). However, only two computer-based musculoskeletal modelling studies have characterised the function of the individual leg muscles during running (Hamner et al., 1; Sasaki and Neptune, 6). Sasaki and Neptune (Sasaki and Neptune, 6) generated muscle-actuated simulations of running at 1.96 m s 1 using a two-dimensional model of the body to calculate the individual contributions of leg muscles to the acceleration of the centre of mass. Hamner et al. (Hamner et al., 1) also calculated how individual muscles accelerate the centre of mass by generating a threedimensional running simulation for a single subject at a more typical running speed of 3.96 m s 1. No studies to our knowledge have evaluated lower-limb muscle function in running at speeds greater than 4 m s 1. The overall goal of the present study was to better understand how the leg muscles coordinate motion of the body segments during running. Our specific aim was to determine the contributions of individual leg muscles to increases in stride length and stride frequency by evaluating muscle contributions to the ground reaction force and joint angular accelerations throughout the stride. Experimental gait data were combined with a detailed model of the musculoskeletal system to determine the forces developed by the leg muscles over a wide range of running speeds, from slow running to maximal sprinting. The model calculations were used to evaluate two hypotheses: (1) the ankle plantarflexors are mainly responsible for increasing stride length during stance; and () the hip flexors and extensors are mainly responsible for increasing stride frequency during swing. MATERIALS AND METHODS Ethical approval The study was approved by the Human Research Ethics Committees of The University of Melbourne and The Australian Institute of Sport, and all participants gave their written informed consent prior to testing. All human testing procedures undertaken conformed to the standards of the Declaration of Helsinki. Experimental protocol Nine subjects (five males, four females; age, 7.7±8. years; mass, 73.1±8.6 kg; height, 176±7 cm; leg length 93±5 cm) volunteered to participate in the study (Table 1). All subjects were experienced runners and at the time of testing were not suffering from any musculoskeletal injury likely to adversely affect their sprinting ability. All experiments were conducted on a straight indoor synthetic running track in the Biomechanics Laboratory at the Australian Institute of Sport. Prior to data collection, a test leg, henceforth referred to as the ipsilateral leg (right 4; left 5), was randomly chosen by tossing a coin. Each subject was asked to run at four steady-state target speeds: slow running at 3.5 m s 1 (N 9), medium-paced running at 5. m s 1 (N 9), fast running at 7. m s 1 (N 8) and maximal sprinting at 8. m s 1 or greater (N 7). The total track was 11 m long, which provided subjects with up to 6 m to accelerate to a steady-state speed, m to maintain the steady-state speed and 3 m to safely decelerate to rest. All data were collected inside the volume where subjects were required to maintain steady-state speeds. Timing gates (Speedlight Telemetry Timing, Swift Performance Equipment, Walcol, QLD, NSW, Australia) were positioned at m intervals at each end of the data collection volume to monitor the average steady-state speed of each runner. Verbal feedback was provided after each trial to ensure the subject attained the desired target speed. Adequate recovery time was provided between trials to prevent fatigue. Marker-derived kinematic data were acquired using a threedimensional video motion capture system (VICON, Oxford Metrics, Oxford, UK). Small reflective markers (14 mm in diameter) were mounted over specific locations on the trunk, legs and arms (see supplementary material Table S1, Figs S1, S). Marker trajectories were recorded using optical infrared cameras sampling at 5 Hz over a distance of 11.5 m. Ground reaction force and centre-of-pressure data were measured using eight force plates (Kistler Instrument Corp., Amherst, NY, USA) Table 1. Subject characteristics, measured running speeds and foot-strike patterns measured for each target running speed Slow running Medium-paced Fast running Sprinting (3.5 m s 1 ) running (5. m s 1 ) (7. m s 1 ) (>8. m s 1 ) Leg Measured Measured Measured Measured Mass Height Age length Test speed speed speed speed Subject (kg) Gender (m) (years) (m) leg (m s 1 ) Strike (m s 1 ) Strike (m s 1 ) Strike (m s 1 ) Strike M Right 3.5 R 5. F 7.7 F 9.38 F 74.9 M Left 3.31 R 4.9 R 6.93 F 8.37 F M Left 3.68 R 5.1 F 6.73 F 9.43 F F Right 3.48 R 5.16 F 6.86 F 8.1 F F Left 3.35 F 5.9 F 6.89 F F Left 3.41 R 5.7 R F Right 3.61 F 5.41 F 7.13 F 8.53 F M Left 3.46 F 5.4 F 7.7 F 9.73 F M Right 3.56 F 5. F 7. F 9.49 F Mean±s.d. 73.1± ±.7 7.7±8..93± ± ± ± ±.67 F, forefoot-strike; R, rearfoot-strike.

 Concentric Eccentric v M v M,max B Musculotendon model Tendon lt l M l M,opt Insertion Fig. 1. Three-dimensional musculoskeletal model used in the present study.")
4 1946 T. W. Dorn, A. G. Schache and M. G. Pandy D A Foot ground contact model Musculoskeletal model Origin F M F M,peak a M FM Eccentric C Passive Force length velocity surface of muscle Concentric Muscle Active lm cos(αm) αm lmt F M =f (a M, l M, v M ) Concentric Eccentric v M v M,max B Musculotendon model Tendon lt l M l M,opt Insertion Fig. 1. Three-dimensional musculoskeletal model used in the present study. (A) The skeleton was modelled as a multi-body linkage comprised of 31 degrees of freedom, and was actuated by 9 musculotendon units. The arms were actuated by 1 ideal torque motors. (B) Each musculotendon actuator was represented as a Hill-type muscle in series with tendon. Muscle fibre length, l M, and tendon length, l T, were governed by the distance between the origin and insertion sites of the musculotendon unit, l MT, muscle pennation angle, M, and muscle force, F M. (C) The active forcelength-velocity surface of muscle was defined by the muscleʼs optimal fibre length, l M,opt, maximum shortening velocity, v M,max, and peak isometric force, F M,peak. Active muscle force generation was constrained to this surface and was scaled by the level of muscle activation, a M. (D) Foot ground contact was assumed to occur at five discrete contact points distributed over the sole of the foot in the model. sampling at 15 Hz. Ground reaction forces were low-pass filtered at 6 Hz using a fourth-order Butterworth filter to remove high frequency noise. Muscle electromyographic (EMG) data were sampled at 15 Hz using a telemetered system (Noraxon Telemyo 4T G, Noraxon USA Inc., Scottsdale, AZ, USA). Pairs of Ag/AgCl surface electrodes were mounted on the skin to measure the activity of 11 lower-limb muscle groups: gluteus maximus, gluteus medius, medial hamstrings (i.e. combined signals from semimembranosus and semitendinosus), lateral hamstrings (i.e. combined signals from biceps femoris long head and short head), rectus femoris, vastus medialis, vastus lateralis, medial gastrocnemius, lateral gastrocnemius, soleus and tibialis anterior. Electrodes were placed according to previously published guidelines (Hermans et al., ), and all signals were checked for clarity and strength of signal during isolated limb movements. EMG onset and offset times were determined by applying a Teager Kaiser energy (TKE) filter to the raw EMG signal (Li et al., 7; Solnik et al., 1). Running sandals (Nike Straprunner IV, Nike, Beaverton, OR, USA) rather than traditional shoes or spikes were worn by the subjects so that markers could be placed directly onto the foot. Stride length, stride frequency, ground contact time, aerial time and effective vertical ground impulse were calculated for a single stride for each trial. Stride length was defined as the anterior distance travelled by consecutive ipsilateral foot-strikes, calculated from the heel marker at the time of initial foot ground contact. Stride frequency was calculated by dividing running speed by stride length. Ground contact time was calculated by dividing the number of video frames for which the ipsilateral foot was in contact with the ground by the video sample frequency. Similarly, aerial time was determined by dividing the number of video frames for which both feet were off the ground by the sample frequency. Effective vertical ground impulse, which represents the net impulse responsible for accelerating the body upwards (Hunter et al., 5; Weyand et al., ), was determined by calculating the area between the vertical ground reaction force time curve and the horizontal line representing the subject s body weight (BW). A Gait-Extract toolbox (freely available from home/c3dtoolbox) was used to extract and process the raw kinematic marker, ground reaction force and muscle EMG data from each trial into a format suitable for input to the musculoskeletal model. Musculoskeletal model The generic musculoskeletal model described below was implemented in OpenSim (Delp et al., 7) and is freely available with sample running data obtained from one subject at The skeleton was represented as a three-dimensional, 1- segment, 31-degree-of-freedom articulated linkage (Fig. 1A). The head and torso were lumped together as a single rigid body that articulated with the pelvis via a ball-and-socket joint. Each hip was modelled as a ball-and-socket joint, each knee as a translating hinge joint (Seth et al., 1), each ankle as a universal joint comprised of two non-intersecting hinge joints, each shoulder as a ball-and-socket joint, and each elbow as a universal joint. The lower-limb joints were actuated by 9 musculotendon units (Thelen, 3), each unit represented as a Hill-type muscle in series with an elastic tendon (Fig. 1B,C). Muscle lines of action were identical to those in Hamner et al. (Hamner et al., 1); however, the optimal fibre lengths and pennation angles of some muscles were modified according to mean values reported in a recent cadaver study (Ward et al., 9). The shoulder and elbow joints were actuated by 1 ideal torque motors. Ground contact model Five discrete points located on the sole of the model foot (Fig. 1D) were used to simulate the interaction between the foot and the ground (Dorn et al., 1; Lin et al., 11). Two ground contact points were located at the heel, two at the metatarsal joint and one at the end of the toe segment. During periods of ground contact, the measured centre of pressure was used to control the stiffness of each contact point relative to the ground according to rules governing the heel-strike, foot-flat and toe-off phases of stance (Lin et al., 11). In this way, the ground contact model was naturally adapted
5 Muscular strategy shift in human running 1947 to the contact patterns exhibited by both rearfoot- and forefoot-strike runners. Data analysis OpenSim was used to perform all model analyses (Delp et al., 7). Subject-specific musculoskeletal models were developed by scaling the generic musculoskeletal model using the scale tool in OpenSim. Specifically, individual body-segment scaling factors were found using the ratio of the distances between two markers measured on the segment during a static standing trial (see supplementary material Fig. S) and the distances between the same two markers located on the model. These scaling factors were then used to scale segment lengths, segment inertial properties, muscle attachment points, optimal fibre lengths and tendon slack lengths. The peak isometric force of each muscle was not scaled, and so the same values were assumed across all subjects and speeds. Joint angles were computed at each time instant in the model using the inverse kinematics tool in OpenSim. The marker locations on the model were optimally matched to the trajectories of the corresponding marker locations measured on the subject, so that the sum of the squared error distances between the two marker sets was minimised, thereby yielding the optimal set of joint kinematics (Lu and O Connor, 1999). Net joint moments were computed using the inverse dynamics tool in OpenSim. The measured ground reaction forces were applied directly to the feet of the model, and joint moments were iteratively calculated by solving the equations of motion for each segment of the model, starting from the foot segment and moving upwards (Winter, 9). The net joint moments were then decomposed into individual musculotendon forces using the static optimisation tool in OpenSim. This procedure was used to solve an optimisation problem that minimised the sum of the squares of all muscle activations, which is analogous to minimising total muscle stress (Crowninshield and Brand, 1981). The optimisation solution was constrained to the force-length-velocity surface of each muscle (Gordon et al., 1966; Katz, 1939; Zajac, 1989) (Fig. 1C). Mechanical power developed by each muscle was found by taking the product of musculotendon force and musculotendon velocity. Mechanical work was determined by calculating the area under the power time curve. Concentric contractions represented energy generated by the muscle (positive work), whereas eccentric contractions represented energy absorbed (negative work). Lower-limb muscle function was quantified by calculating the contributions of each muscle to the ground reaction force and the lower-limb joint accelerations derived from experiment. This was performed using a pseudo-inverse induced acceleration analysis (Lin et al., 11), which was implemented in OpenSim as a customdesigned plugin (freely available from tims_plugins). Each muscle force obtained from the static optimisation solution was successively applied to the model in isolation. As the isolated muscle force is transmitted to all of the body segments, it simultaneously induces: (1) a ground reaction force at the foot (via the foot ground contact model shown in Fig. 1D); and () angular accelerations of all the body joints (Zajac and Gordon, 1989). This approach for calculating muscle contributions to ground reaction forces and lower-limb joint accelerations has been previously validated against gait data obtained for walking and running (Dorn et al., 1; Lin et al., 11). Muscle contributions to the vertical ground reaction force were used to identify the muscle groups that contributed most significantly to increases in stride length. Similarly, muscle contributions to the sagittal-plane hip- and knee-joint accelerations were used to identify the muscle groups that contributed most significantly to increases Stride length (m) Time (s) A B Stride length Stride frequency 3% increase 17% increase 1% increase 1% increase 3% increase 5% increase.1 Ground contact time Aerial time Effective vertical ground impulse Running speed (m s 1 ) Fig.. (A) Measured stride length and stride frequency plotted against running speed. (B) Ground contact time, aerial time and effective vertical ground impulse measured for each running speed. Effective vertical ground impulse was defined as the area bounded by the vertical ground reaction force and the horizontal line representing the subjectʼs body weight. For each running speed, results were calculated for each subject and then averaged. Error bars represent mean ± s.d. in stride frequency. Ankle-joint acceleration was neglected because its contribution to swinging the legs forward in running was presumed to be negligible. Data presentation and statistical analysis All trials were analysed over a single stride cycle beginning and ending at ipsilateral foot-strike. Results were time-normalised to a full stride cycle and then averaged across all subjects for each running speed. Ground reaction forces were normalised by the mean body weight of the subjects, and joint moments were normalised by the mean body mass. Muscle data (i.e. force, work and contributions to ground forces and joint accelerations) were combined into functional muscle groups by summing the contributions from each muscle line-of-action within the group, specifically: ILPSO (iliacus and psoas), GMAX (superior, middle and inferior gluteus maximus), GMED (anterior, middle and posterior compartments of gluteus medius), HAMS (biceps femoris long head, semimembranosus and semitendinosus), RF (rectus femoris), VAS (vastus medialis, vastus intermedius and vastus lateralis), GAS (medial and lateral compartments of gastrocnemius), SOL (soleus) and TIBANT (tibialis anterior). One-way repeated-measures ANOVAs were used to identify the muscles that: (1) developed significantly greater peak forces during the stride cycle with running speed; () contributed significantly greater peak forces to the vertical ground reaction force with running speed; and (3) performed a significantly greater amount of swing phase work with running speed. When significant F-ratios were obtained, post hoc pairwise comparisons (paired t-tests) were used to determine differences between each of the running speeds. A conservative level of significance was set at P<.1 for all tests, which was determined by a Bonferroni correction to a significance level of P<.6 (i.e. a total of six post hoc pairwise comparisons was performed per dependent variable). The statistical association between running Stride frequency (Hz) Impulse (BW s 1 )
6 1948 T. W. Dorn, A. G. Schache and M. G. Pandy speed and work performed by the major muscle groups was also calculated. Linear and second-order polynomial trend lines were fitted to the mechanical work generated and absorbed by the leg muscles and corresponding coefficients of determination (R ) were determined. RESULTS Dependence of stride length and stride frequency on running speed Mean running speeds recorded across subjects were 3.5±.1 m s 1 (slow running), 5.±.1 m s 1 (medium-paced running), 7.±.1 (fast running) and 9.±.7 m s 1 (sprinting) (Table 1; see also supplementary material Fig. S3). The percentage increase in stride length was greater than that in stride frequency as running speed increased from 3.5 to 7. m s 1, but the opposite effect was observed at speeds above 7. m s 1 (Fig. A, Table ). Ground contact time decreased monotonically as running speed increased (P<.1; Fig. B, Table ). Aerial time and effective vertical ground impulse both reached their maxima at 7. m s 1 before decreasing at higher speeds (Fig. B). Lower-limb muscle forces in running Model predictions of muscle forces were in temporal agreement with the patterns of measured EMG activity across all running speeds (Fig. 3; see also supplementary material Fig. S4). The one exception was the hamstrings, which were only lightly activated in the model during stance. As speed increased, ILPSO, GMAX, GMED, HAMS and RF all developed significantly larger peak forces throughout the stride cycle (P<.1) (Table ). In particular, the peak forces of GMAX and HAMS doubled during terminal swing, increasing from 1. and 4.6 BW, respectively, at 7. m s 1 to. and 9. BW at 9. m s 1. The peak force developed by GAS increased as speed increased from 3.5 to 7. m s 1 (P<.1), but showed no significant speed effects thereafter. The peak force developed by SOL also increased from 3.5 to 7. m s 1, but then decreased as running speed increased from 7. to 9. m s 1 (P<.1). VAS showed no significant speed effects during stance. The bi-articular muscles played a large role in generating the net joint moments needed to drive the motion of the lower limbs at all running speeds (Fig. 4). HAMS force increased with speed to satisfy the increase in hip-extensor and knee-flexor moments present during terminal swing. RF exhibited a biphasic force pattern; in the first half of swing, RF force increased with running speed (P<.1) in response to larger moments required in hip flexion and knee extension, whereas during stance, RF produced a knee-extensor moment to complement the action of VAS. GAS and RF were simultaneously activated during stance because GAS was required to produce a plantarflexor moment about the ankle at this time. Muscle function during stance The peak vertical ground force increased from.7 BW at 3.5 m s 1 to 3.6 BW at 7. m s 1 and did not change thereafter (P<.1; Fig. 5, Table. Mean (±1 s.d.) magnitudes of stride length, stride frequency, ground contact time, peak muscle forces and peak muscle contributions to the vertical ground reaction force Variable Speed ±.1 m s 1 (N=9) Speed 5.17±.13 m s 1 (N=9) Speed ±.13 m s 1 (N=8) Speed ±.67 m s 1 (N=7) Stride characteristics Stride length (m).6±.1 b,c,d 3.4±.13 a,c,d 3.99±. a,b 4.1±.6 a,b Stride frequency (s 1 ) 1.31±.3 b,c,d 1.47±.5 a,c,d 1.75±.1 a,b,d.18±.1 a,b,c Ground contact time (s).43±. b,c,d.188±.15 a,c,d.145±.9 a,b,d.118±.11 a,b,c Peak forces developed by muscles (BW) ILPSO (swing) 1.97±.37 b,c,d 3.49±.51 a,c,d 5.91±.98 a,b,d 9.4±1.71 a,b,c GMAX (swing).38±.1 b,c,d.64±.17 a,c,d 1.3±.9 a,b,d.±.6 a,b,c HAMS (swing).1±.38 b,c,d.66±.31 a,c,d 4.61±.74 a,b,d 8.95±1.66 a,b,c RF (swing).67±.6 b,c,d 1.19±.17 a,c,d 1.81±.8 a,b,d.8±.39 a,b,c VAS (stance) 4.7± ± ± ±.89 GAS (stance) 1.94±.5 b,c,d.65±.44 a,c 3.3±.49 a,b.97±.34 a SOL (stance) 6.7±.66 b,c,d 7.9±.8 a,c,d 8.71±.83 a,b,d 7.34±.7 a,b,c TIBANT (swing).17±.14 d.±.16 d.31±.1 d.5±.11 a,b,c Peak muscle contributions to the vertical ground force (BW) VAS 1.1±.6 1.±.9.9±.3.74±.1 GAS.53±.1 b,c,d.73±.16 a.81±.1 a.74±.8 a SOL 1.61±.3 b,c,d 1.98±.53 a.4±.55 a.3±.59 a Total vertical ground force.71±.46 b,c,d 3.14±.55 a,c,d 3.58±.67 a,b 3.59±.71 a,b Mechanical work produced by hip muscles in swing phase (J kg 1 ) ILPSO (1st half of swing).36±.7 b,c,d.64±.8 a,c,d.85±.9 a,b,d 1.1±.17 a,b,c RF (1st half of swing).11±. b,c,d.1±.4 a,c,d.31±.4 a,b,d.41±.5 a,b,c GMAX (nd half of swing).7±. b,c,d.19±.6 a,c,d.43±.8 a,b,d.77±.11 a,b,c HAMS (nd half of swing).7±.4 b,c,d.53±.1 a,c,d.95±.15 a,b,d 1.75±.31 a,b,c Forces are normalised by body weight (BW) and mechanical work is normalised by body mass. Positive work represents energy generation; negative work represents energy absorption. Grey shaded rows indicate variables that displayed significant changes in absolute magnitude for all running speed increments. ILPSO, iliacus and psoas combined; GAS, medial and lateral compartments of gastrocnemius combined; GMAX, superior, middle and inferior gluteus maximus; HAMS, biceps femoris long head, semimembranosus and semitendinosus combined; RF, rectus femoris; SOL, soleus; TIBANT, tibialis anterior; VAS, vastus medialis, vastus intermedius and vastus lateralis combined. a Significantly different from running speed 1 (P<.1). b Significantly different from running speed (P<.1). c Significantly different from running speed 3 (P<.1). d Significantly different from running speed 4 (P<.1).
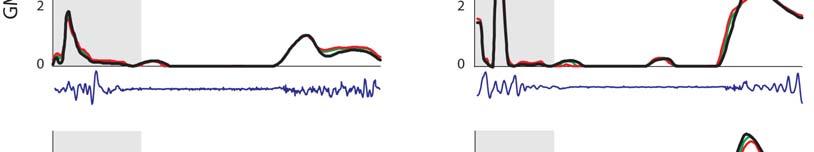
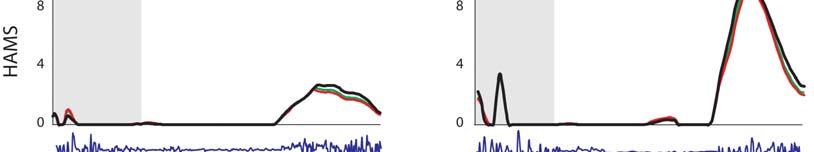
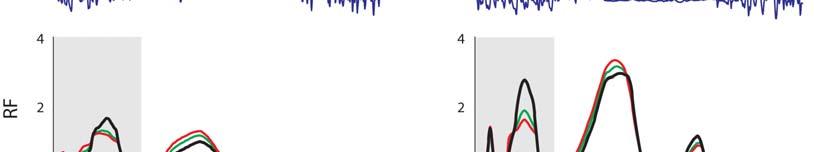
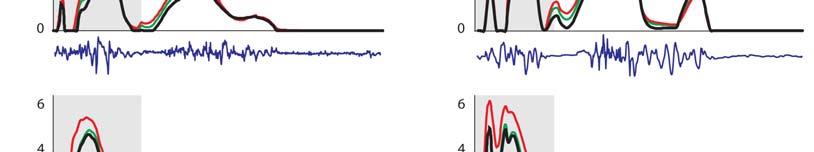
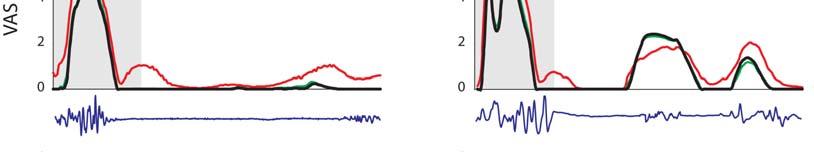
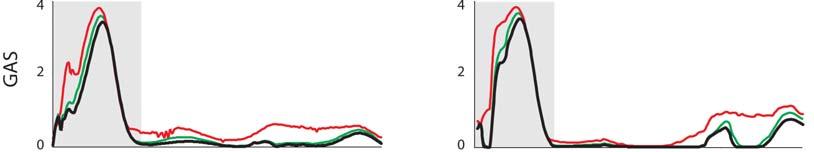
7 Muscular strategy shift in human running 1949 MT force (BW) ifs ILPSO No EMG recorded EMG ifs 6 GMED HAMS RF VAS GAS SOL TIBANT EMG ifs ifs 3 GMAX EMG EMG Stride cycle (%) EMG ifs 4 EMG EMG EMG ifs Fig. 3. Musculotendon forces calculated for each running speed. Horizontal bars shown below each plot indicate the periods of electromyographic (EMG) activity recorded for each muscle as determined by Teager Kaiser energy filtering of the raw EMG signal. Results were averaged across all trials for all subjects and are shown over a full stride cycle. Forces are normalised by body weight. ifs, ipsilateral foot-strike; ILPSO, iliacus and psoas combined (no EMG data recorded); GAS, medial and lateral compartments of gastrocnemius combined (medial gastrocnemius EMG shown); GMAX, superior, middle and inferior gluteus maximus; GMED, anterior, middle and posterior compartments of gluteus medius; HAMS, biceps femoris long head, semimembranosus and semitendinosus combined (medial hamstring EMG shown); RF, rectus femoris; SOL, soleus; TIBANT, tibialis anterior; VAS, vastus medialis, vastus intermedius and vastus lateralis combined (vastus lateralis EMG shown). Percentage values below the speed legend indicate when, during the stride cycle, the ipsilateral foot-strike and foot-off events occur, respectively. 3.5±.1 m s 1 5.±.1 m s 1 7.±.1 m s 1 9.±.7 m s 1 Foot-strike: % Foot-strike: % Foot-strike: % Foot-strike: % Foot-off: 31.8% Foot-off: 7.% Foot-off: 5.% Foot-off: 5.4% Table ). Across all running speeds, SOL, GAS and VAS provided roughly 75% of the total vertical support impulse needed to accelerate the body upward, with SOL contributing as much as 5%. For speeds up to 7. m s 1, increases in the vertical ground reaction force were due almost entirely to the action of SOL. The contribution of VAS to the vertical ground force did not increase as running speed increased. The ankle plantarflexors shortened at increasingly higher rates as running speed increased (Fig. 6A). At the times that SOL and GAS developed their peak forces during sprinting, the muscle fibres were contracting at 37 and 3% of their maximum shortening velocities, respectively. As a result, the peak forces that could potentially be developed by SOL and GAS during sprinting were only 3 and 4% of their peak isometric forces, respectively (Fig. 6B). Both SOL and GAS operated higher on their force length curves as running speed increased, but this effect was discounted by the high contraction velocities of these muscles. Muscle function during swing The mechanical work performed by the hip muscles during swing increased as running speed increased (P<.1; Fig. 7, Table ). In particular, ILPSO generated more work at the hip during the first half of swing (linear trend, R.9457), GMAX generated more work at the hip in the second half of swing (second-order polynomial trend, R.943), RF absorbed more work at the hip and the knee in the first half of swing (linear trend, R.988) and HAMS absorbed more work at the hip and knee in the second half of swing (second-order polynomial trend, R.974). The muscles of both the ipsilateral and contralateral legs induced larger accelerations of the ipsilateral hip and knee joints as running speed increased (Fig. 8). In the first half of swing, the ipsilateral hip was accelerated into flexion by the ipsilateral ILPSO, and this action was opposed by the contralateral HAMS and GMAX. In the second half of swing, the ipsilateral hip was accelerated into extension by the ipsilateral HAMS and GMAX, and this action was opposed by the contralateral ILPSO (Fig. 8A). Similarly, the ipsilateral knee was accelerated into flexion by the ipsilateral ILPSO during the first half of swing, and this action was opposed by the contralateral HAMS and GMAX. In the second half of swing, the ipsilateral knee was accelerated into extension by the ipsilateral GMAX and VAS, and these actions were opposed by the ipsilateral HAMS and contralateral ILPSO (Fig. 8B). ILPSO, HAMS and GMAX contributed to greater hip and knee accelerations as running speed increased (P<.1), especially between 7. and 9. m s 1, when these muscles produced an almost twofold increase in hip- and knee-joint acceleration. The ankle plantarflexors, despite producing considerable forces throughout the stance phase of running (Fig. 3), did not contribute to hip- and knee-joint accelerations during swing (not shown). DISCUSSION The overall goal of the present study was to better understand how the individual leg muscles coordinate motion of the body segments during running. Our specific aim was to determine the contributions of the individual leg muscles to increases in stride length and stride frequency and hence running speed. Experimental gait data were combined with a detailed musculoskeletal model of the body to evaluate two hypotheses: (1) the ankle plantarflexors are mainly responsible for increasing stride length during the stance phase of running; and () the hip flexors and extensors are mainly responsible for increasing stride frequency during swing.
8 195 T. W. Dorn, A. G. Schache and M. G. Pandy Hip moment (Nm kg 1 ) ±.1 m s 1 5.±.1 m s 1 7.±.1 m s 1 9.±.7 m s 1 ifs ifo cfs cfo ifs ifs ifo cfs cfo ifs ifs ifo cfs cfo ifs ifs ifo cfs cfo ifs Flex. ILPSO Ext. GMAX HAMS RF Knee moment (Nm kg 1 ) Ext. Flex. VAS GAS HAMS RF Ankle moment (Nm kg 1 ) 1 3 Dorsi. Plantar. SOL GAS TIBANT Stride cycle (%) Fig. 4. Contributions of individual muscles to the net sagittal-plane joint moments (shaded regions) for each running speed. Positive joint moments represent hip flexion, knee extension and ankle dorsiflexion; negative joint moments represent hip extension, knee flexion and ankle plantarflexion. Results were averaged across all trials for all subjects and are plotted for a full stride cycle. Moments are normalised by body mass. Muscle abbreviations are defined in the legend for Fig. 3. cfo, contralateral foot-off; cfs, contralateral foot-strike; ifo, ipsilateral foot-off; ifs, ipsilateral foot-strike. Musculoskeletal modelling is a powerful tool for studying muscle function during movement because it allows individual muscle outputs such as length, force and power to be determined noninvasively (Pandy and Andriacchi, 1). The accuracy of the model used to calculate lower-limb muscle forces during running has been evaluated in a number of previous studies undertaken by various groups (Erdemir et al., 7; Hamner et al., 1; Kim et al., 9; Pandy and Andriacchi, 1). Further, muscle morphological parameters assumed in the model were updated with the most recent data obtained from a comprehensive cadaver dissection study (Ward et al., 9). In particular, the peak isometric forces assumed for the lower-limb muscles are consistent with measurements of physiological cross-sectional areas obtained from cadaver specimens. This is particularly important in relation to the model predictions of muscle forces as the distribution of forces between synergistic muscles is highly dependent on the anatomical arrangement of muscle fibres within a muscle s volume (Powell et al., 1984; Wilson and Lichtwark, 11). To verify the convergence of the static optimisation analysis, we compared the net joint moments computed from inverse dynamics against those obtained by taking the product of muscle force and moment arm and summing across all muscles spanning each joint. With the exception of the transverse-plane hip rotation moment, the average r.m.s. difference between the optimisation-based and inverse-dynamics-based net joint moments was less than.5 Nm kg 1 (supplementary material Fig. S5). The difference between the optimisation-based and inverse-dynamics-based net joint moments obtained for the transverse-plane hip moment was most likely attributable to errors in the joint kinematic data (e.g. soft tissue artefacts), which are exacerbated in fast dynamic activities that involve large muscle contractions (Akbarshahi et al., 1; Cappozzo et al., 1996). However, across all running speeds, the discrepancy (average r.m.s. difference) between the optimisationand inverse-dynamics-based net joint moments was never greater than.5 Nm kg 1, which was considered reasonable for the purposes of evaluating muscle function during running. The results from the induced acceleration analysis were also evaluated using the superposition principle (Anderson and Pandy, 3): the sum of all individual muscle contributions to the vertical ground reaction force and hip- and knee-joint accelerations predicted by the model matched the corresponding experimental data with errors of less than 5% r.m.s. for all running speeds (supplementary material Fig. S6). To our knowledge, this is the first study to determine the contributions of individual muscle forces to performance-related biomechanical variables, specifically, joint moments, joint accelerations and ground reaction forces, across a wide range of running speeds. Although only sagittal-plane dynamics are reported here, the analysis performed was three-dimensional and included muscle contributions in the coronal and transverse planes as well.
9 Muscular strategy shift in human running ±.1 m s 1 5.±.1 m s 1 7.±.1 m s 1 9.±.7 m s 1 ifs ifo ifs ifo ifs ifo ifs ifo Vertical ground reaction force (BW) ms 188 ms 145 ms 118 ms Stance phase (%) SOL GAS VAS All other muscles Fig. 5. Contributions of individual muscles to the net vertical ground reaction force (shaded regions) for each running speed. Positive ground reaction forces are directed upwards. Results were averaged across all trials for all subjects and are shown for the stance phase of the stride cycle. Forces are normalised by body weight. Muscle abbreviations are defined in the legend for Fig. 3. ʻAll other musclesʼ represents the contributions of all muscles, except SOL, GAS and VAS; ifo, ipsilateral foot-off; ifs, ipsilateral foot-strike. This is also the first study to quantify the mechanical work performed by the individual leg muscles during running. Previous studies investigating the energetics of running have used inverse dynamics to determine muscular work at the joint level (Biewener et al., 4; Devita et al., 7; McIntosh et al., 6; Novacheck, 1998; Schache et al., 11; Swanson and Caldwell, ). Calculations of joint work do not account for the contributions of individual muscles, particularly those that cross more than one joint. For example, because the hip joint acts as an energy generator and the knee joint as an energy absorber (Sawicki et al., 9; Schache et al., 11), it is not possible to determine whether a biarticular muscle spanning both of these joints, such as HAMS, is absorbing energy from, or generating energy to, the skeleton. Finally, the results of the present study are based on novel experimental data recorded for overground running. Although treadmills enable gait experiments to be performed more easily in a laboratory setting, biomechanical differences between treadmill and overground running have been identified under certain circumstances (Elliott and Blanksby, 1976; Frishberg, 1983; Nelson et al., 197; Nigg et al., 1995; Riley et al., 8). Also, it is not known whether kinetic differences exist between treadmill and overground running at faster speeds of locomotion. Because accurate measurement of joint kinetics is crucial for accurate estimates of muscle forces, a key feature of our experimental design was recording gait biomechanics during overground running. Hypothesis 1: the ankle plantarflexors are mainly responsible for increasing stride length during stance As running speed increased from 3.5 to 7. m s 1, SOL and GAS were mainly responsible for increasing stride length by generating higher support forces during ground contact (Fig. A, Fig. 5). Above 7. m s 1, however, peak forces developed by SOL and GAS decreased (Fig. 3), whereas their contributions to the vertical ground force remained roughly the same (Fig. 5). Peak forces developed by the ankle plantarflexors decreased at the higher running speeds for two possible reasons. First, the muscles may have been operating at lengths much shorter or longer than the muscles optimum fibre lengths (Close, 197; Gordon et al., 1966; Woledge et al., 1985); and second, the contractile velocities may have been too high to allow the muscles to develop high forces (Abbott and Wilkie, 1953; Bahler et al., 1968; A B 3.5±.1 m s 1 5.±.1 m s 1 7.±.1 m s 1 9.±.7 m s 1 vm Muscle fibre velocity ( ) vm,max Shortening Lengthening ) FM FM,peak ( Force SOL Peak force (9. m s 1 ) Peak force.4 (3.5 m s 1 ) Stance phase (%) GAS/SOL (9. m s 1 ) GAS (3.5 m s 1 ) SOL (3.5 m s 1 ) Length ) GAS.5 Peak force (9. m s 1 ).5 Peak force.5 (3.5 m s 1 ) Stance phase (%) Shortening Lengthening GAS (3.5 m s 1 ) SOL (3.5 m s 1 ) GAS (9. m s 1 ) SOL (9. m s 1 ) l M Velocity l M,opt ( v M v M,max) ( Fig. 6. (A) Normalised muscle-fibre velocities of the soleus (SOL) and gastrocnemius (GAS) muscles calculated for the stance phase of the stride cycle at each running speed. The time instant of peak force production is labelled for running speeds of 3.5 and 9. m s 1. (B) Normalised force length and force velocity curves for SOL and GAS at running speeds of 3.5 and 9. m s 1. The force length curve of muscle was normalised by the muscleʼs peak isometric force, F M,peak, and its optimal fibre length, l M,opt. The force velocity curve of muscle was normalised by F M,peak and its maximum shortening velocity, v M,max. Points are displayed for the instants when the muscles developed their peak forces (see panel A).
10 195 T. W. Dorn, A. G. Schache and M. G. Pandy Work (J kg 1 ) ILPSO R = Speed (m s 1 ) RF R =.988 1st half of swing phase GMAX R =.943 HAMS R =.974 nd half of swing phase Fig. 7. Hip muscle work trends for the swing phase of running. Muscle abbreviations are defined in the legend for Fig. 3. ILPSO work generation is shown for the first half of swing and follows a linear trend. GMAX work generation is shown for the second half of swing and follows a second-order polynomial trend. RF work absorption is shown for the first half of swing and follows a linear trend. HAMS work absorption is shown for the second half of swing and follows a second-order polynomial trend. Katz, 1939). The model calculations showed that even though SOL and GAS operated at more favorable positions on their force length curves as running speed increased, the peak forces that could potentially be developed by these muscles decreased because of their high contraction velocities (Fig. 6A). For example, in running at 3.5 m s 1, SOL developed its peak force while contracting isometrically, whereas in sprinting at 9. m s 1 SOL developed its peak force while shortening at 37% of its maximum shortening velocity. As running speed increased from 3.5 to 9. m s 1, the force-generating capacity of SOL decreased from 1 to 3% of its peak isometric force, whereas that of GAS reduced from 14 to 4% of its peak isometric force (Fig. 6B). The plantarflexors shortened at higher rates as running speed increased because the time available for ground contact diminished (Fig. B), which meant that these muscles had less time to generate the support forces needed during stance. Indeed, the force velocity relationship has been shown to have the greatest limiting effect on maximum running speed amongst all the contractile properties of skeletal muscle (Miller et al., 11). The relationship between maximum running speed and performance of the leg muscles during stance has also been studied in both bipeds (Rubenson et al., 11) and quadrupeds (Higham, 11; Roberts et al., 1997). For example, lizards are able to generate relatively large horizontal accelerations during the ground contact phase of running because of the increased size (i.e. fibre diameter) of the gastrocnemius muscle in these reptiles; an increase in fibre diameter confers a higher maximum shortening velocity on the muscle (Rome et al., 199). Similarly, ultrasound studies in humans indicate that sprinters have significantly longer gastrocnemius fibre lengths and smaller pennation angles compared with distance runners, properties that enhance the ability of the gastrocnemius to generate force at higher shortening velocities (Abe et al., ; Kumagai et al., ). These architectural features highlight the importance of the gastrocnemius muscle in running and are consistent with the following two observations. First, that humans reach faster top speeds by applying greater support forces to the ground (Weyand et al., ); and second, that the ankle plantarflexors contribute significantly to the pattern of support force generated in running (Fig. 5). These results suggest that the performance of the ankle plantarflexors may limit maximum running speeds in humans. Weyand et al. (Weyand et al., ) also showed that the effective vertical impulse exerted on the ground increases up to a speed of 7. m s 1 and then decreases, signifying a deficiency in the force-generating capacities of the ankle plantarflexors. We conclude that the ability of the ankle plantarflexors to increase stride length is limited when running speed approaches 7. m s 1, and that an alternative strategy is needed to increase running speed beyond this mark. Hypothesis : the hip muscles are mainly responsible for increasing stride frequency during swing We found that second-order polynomial trends adequately described the relationships between the swing phase work performed by the hip-extensor muscles (GMAX and HAMS) and running speed (Fig. 7). Second-order polynomial trends have also been used to describe the relationship between stride frequency and running speed (Mercer et al., ). Taken together, these results suggest a causal link between the actions of the hip muscles and stride frequency. The model calculations showed that stride frequency was increased by increasing the forces generated by the hip-spanning muscles, primarily ILPSO, GMAX and HAMS, as these muscles contributed significantly to the larger hip- and knee-joint accelerations observed at higher running speeds (Fig. 8). Although a given muscle can only generate a moment about a joint that it spans, the same muscle can induce angular accelerations of all the joints in the body, including those not spanned by that muscle. This is a consequence of dynamic coupling, whereby the force applied by a muscle is transmitted to all the body segments simultaneously (Zajac and Gordon, 1989). Indeed, we found that the contralateral leg muscles are just as important as the ipsilateral leg muscles in controlling the accelerations of the ipsilateral hip and knee joints (Fig. 8). During the swing phase of running, the ipsilateral HAMS accelerated the ipsilateral knee into flexion and the contralateral knee into extension. The latter result may seem counter-intuitive because: (i) HAMS is classified anatomically as a knee flexor, and (ii) the ipsilateral HAMS does not span any of the joints in the contralateral leg. Similarly, the contralateral HAMS accelerated the ipsilateral knee into extension to oppose the knee-flexor acceleration induced by the ipsilateral ILPSO. We note here that although the ILPSO does not span the knee, it nonetheless contributed significantly to knee-joint acceleration. As running speed increased, particularly above 7. m s 1, the hip muscles played a more substantial role in increasing stride frequency by accelerating the leg forward more vigorously during swing. Limitations of the analysis There are a number of limitations associated with the present study. First, our results apply only to steady-state running, and hence do
11 Muscular strategy shift in human running 1953 Ipsilateral muscle acceleration (rad s ) Contralateral muscle acceleration (rad s ) Net joint acceleration (rad s ) Ipsilateral muscle acceleration (rad s ) 3.5±.1 m s A 1 5.±.1 m s 1 7.±.1 m s 1 9.±.7 m s 1 ifs ifo cfs cfo ifs ifs ifo cfs cfo ifs ifs ifo cfs cfo ifs ifs ifo cfs cfo ifs B Flex. Ext. Flex. Ext. Flex. Ext. Ext. Flex. ILPSO HAMS GMAX VAS Fig. 8. Contributions of the individual muscles of the ipsilateral and contralateral legs to the net sagittal-plane angular accelerations of the ipsilateral (A) hip and (B) knee joints. The shaded regions represent the total joint acceleration induced by the ipsilateral and contralateral leg muscles. Results are shown for each running speed. Positive joint accelerations represent hip flexion and knee extension; negative joint accelerations represent hip extension and knee flexion. Results were averaged across all trials for all subjects and are plotted for the full stride cycle. Muscle abbreviations are defined in the legend for Fig. 3. cfo, contralateral footoff; cfs, contralateral footstrike; ifo, ipsilateral foot-off; ifs, ipsilateral foot-strike. Contralateral muscle acceleration (rad s ) Ext. Flex. Net joint acceleration (rad s ) 4 Ext. Flex Stride cycle (%) not reflect the coordination strategies used during the initial burst of acceleration needed to reach a constant speed. Although it is possible that a single continuous acceleration from 3.5 up to 9. m s 1 may involve different mechanical strategies to those observed when analysing a number of discrete steady-state running trials ranging between the same two speeds, practical considerations prevented the collection of experimental data for a single continuous acceleration phase of running. For example, subjects were given the first 6 m of the running track to accelerate to maximum speed at their self-selected rate. Capturing markerbased kinematics and ground reaction forces over this length of the track would require a prodigious amount of laboratory equipment. In addition, controlling the acceleration rate of individuals in overground running is almost impossible, whereas steady-state speeds can be more easily managed. Indeed, previous modelling studies investigating human locomotion over a range of speeds have been based on multiple steady-state trials (Liu et al., 8; Pandy and Andriacchi, 1). Further work is required to test whether strategies for increasing running speed differ when they are based on analyses of multiple steady-state trials

12 1954 T. W. Dorn, A. G. Schache and M. G. Pandy (as in the present study) versus a single continuous acceleration phase. Second, we assumed the same cost function in calculating muscle forces across all running speeds. At self-selected speeds of walking and running, a minimum muscle-stress criterion yields muscular loading patterns that are consistent with measured EMG activity (Dorn et al., 1; Glitsch and Baumann, 1997; Raikova and Prilutsky, 1). However, minimum muscle stress may not be the most appropriate criterion to use at the fastest running speeds. For example, one objective of sprinting may be to maximise the average horizontal velocity of the centre of mass throughout the stride cycle, which could be achieved by maximising muscular effort over time, irrespective of the metabolic cost of transport (Cavagna et al., 1971; Ward-Smith, 1985). However, it is unlikely that such a cost function would apply to running at submaximal speeds. We therefore used the same cost function (i.e. minimum muscle stress) to calculate leg-muscle forces at all running speeds, an approach that has been followed in previous attempts to model running biomechanics (Chumanov et al., 11; Glitsch and Baumann, 1997; Hamner et al., 1). We evaluated the sensitivity of muscle force predictions for a single subject using different exponents of the cost function and found no significant differences in the shapes and magnitudes of the predicted muscle forces (supplementary material Fig. S4). These findings are in agreement with those of Glitsch et al. (Glitsch et al., 1997). Future work should be directed at quantifying the performance criteria applicable to running at different speeds and their concomitant effects on model predictions of muscle forces. Third, activation dynamics was neglected in the formulation of the static optimisation problem posed in this study. Although activation dynamics does not have a significant effect at slow running speeds (Lin et al., 1), its role in faster running may be more pronounced. For example, Neptune and Kautz (Neptune and Kautz, 1) emphasised the importance of the electromechanical delay by showing that it is needed to realistically simulate the optimal cadence performance in high frequency pedalling. However, the values of activation and deactivation time constants used in model simulations reported in the literature have ranged from 1 to ms and 3 to ms, respectively (Anderson and Pandy, 1; Chumanov et al., 7; Seth and Pandy, 7; Zajac, 1989). Future work should be directed at gaining a better understanding of: (1) the dynamics of the rise and fall of active muscle force using isolated muscle-fibre experiments; and () the extent to which different values of activation and deactivation time constants affect model predictions of muscle force, particularly in simulations of ballistic motor tasks. In any event, we do not believe the conclusions obtained in this study are affected by neglecting muscle activation dynamics in the model because the patterns of predicted muscle activations and muscle forces agree, at least qualitatively, with the sequence and timing of measured EMG activity (supplementary material Fig. S4). Fourth, because the model of each subject was developed by scaling a generic musculoskeletal model to the subject s anthropometry, the subject-specific model did not explicitly include anatomical features that could enhance athletic performance. For example, elite sprinters possess smaller Achilles tendon moment arms and longer ankle plantarflexor fascicle lengths compared with the average population, which allow them to generate larger ground reaction forces and impulses during stance (Lee and Piazza, 9). Elite sprinters are also believed to possess more compliant Achilles tendons, which enable them to store and utilise greater amounts of elastic strain energy, thereby reducing the mechanical work performed by the ankle plantarflexors (Lichtwark and Barclay, 1; Roberts, ; Roberts and Scales, ). Such architectural features of muscle and tendon must be accurately measured for each individual in the cohort of study participants before they can be incorporated with confidence into subject-specific models of movement (Ishikawa and Komi, 7; Lichtwark and Wilson, 7; Thelen et al., 5). Finally, we assumed that joint moments were satisfied in their entirety by muscle forces alone. It is likely that several non-muscular structures also contribute to the moment exerted about each joint. For example, foot and shoe deformation during ground contact (Webb et al., 1988), the plantar fascia (Kibler et al., 1991) and the anterior cruciate ligament (Hart et al., 1) all exert moments about the joints they span, but these contributions are likely to be negligible compared with the moments exerted by the muscles. CONCLUSIONS The ankle plantarflexors soleus and gastrocnemius contribute most significantly to vertical support forces, and hence increases in stride length, during slow and medium-paced running (up to 7. m s 1 ). At speeds near 7. m s 1, the contractile conditions for these muscles deteriorate because of increased shortening velocities, requiring a change in the strategy used by runners to increase their speed still further. The strategy used to increase running speed beyond 7. m s 1 shifts from the goal of increasing stride length to one of increasing stride frequency. This new goal is achieved by the synergistic actions of the ipsilateral and contralateral hip muscles, primarily ILPSO, GMAX and HAMS, which accelerate the leg more vigorously through the air and provide the high stride frequencies needed to reach the fastest running speeds possible. APPENDIX Relationship between effective vertical impulse and stride length in running Using a simple point-mass model of running, we derived a relationship between the effective vertical ground impulse (I v,eff ) generated by the leg muscles during stance and stride length (L) achieved by the body during running (see Fig. A1). Assume that the body is represented by a point mass m and consider the stride cycle divided into a stance phase (t to t i) and a swing phase (t i to t f). Furthermore, assume that the vertical velocity of the body at y Fv t a y = 9.8 m s a x = m s I v,eff t t=t t=t i t=t f t i BW Fig. A1. Point-mass model used to derive the relationship between effective vertical ground impulse (I v,eff ) and stride length (L). Symbols appearing in the diagram are defined in the Appendix. L x
13 Muscular strategy shift in human running 1955 foot-strike (t and t f) is equal and opposite to the vertical velocity of the body at foot-off (t i), thus: v f v v i. (A1) Applying the impulse-momentum theorem in the vertical direction, a relationship can be found between the effective vertical ground impulse (I v,eff ) and the vertical velocity at foot-off: Iv,eff vi =. (A3) m Furthermore, assuming that (1) the vertical position of the body is the same at foot-strike and foot-off, and () the vertical acceleration of the body is only due to the force of gravity (a y 9.8 m s ), the kinematic equations governing motion of the body in the vertical direction can be used to solve for the time spent in the air (t aerial ) as follows: Given that running speed (v run ) is constant and applying the kinematic equations of motion in the horizontal direction, stride length (L) can be defined as a function of the effective vertical ground impulse (I v,eff ): vrun Iv,eff L= vrun taerial =. (A6) 9.8m Eqns A5 and A6 show that increases in the effective vertical ground impulse will increase aerial time and produce larger stride lengths during running. BW cfo cfs EMG GAS GMAX GMED HAMS ifo ifs ILPSO RF SOL TIBANT TKE VAS t= i v v,eff ( i ) t= F dt = I = m v v = mv, (A) 4.9 I t v,eff aerial = m t aerial, (A4) t aerial Iv,eff =. (A5) 9.8m LIST OF ABBREVIATIONS body weight contralateral foot-off contralateral foot-strike electromyography medial and lateral gastrocnemius combined superior, middle and inferior gluteus maximus combined anterior, middle and posterior gluteus medius combined biceps femoris long head, semimembranosus and semitendinosus combined ipsilateral foot-off ipsilateral foot-strike iliacus and psoas combined rectus femoris soleus tibialis anterior Teager Kaiser energy vastus medialis, vastus intermedius and vastus lateralis combined ACKNOWLEDGEMENTS We thank Doug Rosemond for his help with experimental data collection, and Yi- Chung Lin, Michael Sherman and Ayman Habib for their help in coding and implementing the ʻpseudo-inverse induced acceleration analysisʼ plugin for OpenSim. FUNDING This work was supported by a Victorian Endowment for Science Knowledge and Innovation Fellowship to M.G.P., Australian Research Council Discovery Project i Grants [DP77838 and DP87875] to M.G.P. and an Australian Research Council Linkage Project Grant [LP1116] to A.G.S. and M.G.P. REFERENCES Abbott, B. C. and Wilkie, D. R. (1953). The relation between velocity of shortening and the tension-length curve of skeletal muscle. J. Physiol. 1, Abe, T., Kumagai, K. and Brechue, W. F. (). Fascicle length of leg muscles is greater in sprinters than distance runners. Med. Sci. Sports Exerc. 3, Akbarshahi, M., Schache, A. G., Fernandez, J. W., Baker, R., Banks, S. and Pandy, M. G. (1). Non-invasive assessment of soft-tissue artifact and its effect on knee joint kinematics during functional activity. J. Biomech. 43, Anderson, F. C. and Pandy, M. G. (1). Dynamic optimization of human walking. J. Biomech. Eng. 13, Anderson, F. C. and Pandy, M. G. (3). Individual muscle contributions to support in normal walking. Gait Posture 17, Bahler, A. S., Fales, J. T. and Zierler, K. L. (1968). The dynamic properties of mammalian skeletal muscle. J. Gen. Physiol. 51, Belli, A., Kyrolainen, H. and Komi, P. V. (). Moment and power of lower limb joints in running. Int. J. Sports Med. 3, Biewener, A. A., Farley, C. T., Roberts, T. J. and Temaner, M. (4). Muscle mechanical advantage of human walking and running: implications for energy cost. J. Appl. Physiol. 97, Cappozzo, A., Catani, F., Leardini, A., Benedetti, M. G. and Croce, U. D. (1996). Position and orientation in space of bones during movement: experimental artefacts. Clin. Biomech. 11, 9-1. Cavagna, G. A. (9). The two asymmetries of the bouncing step. Eur. J. Appl. Physiol. 17, Cavagna, G. A., Komarek, L. and Mazzoleni, S. (1971). The mechanics of sprint running. J. Physiol. 17, Cavagna, G. A., Franzetti, P., Heglund, N. C. and Willems, P. (1988). The determinants of the step frequency in running, trotting and hopping in man and other vertebrates. J. Physiol. 399, Cavagna, G. A., Willems, P. A., Franzetti, P. and Detrembleur, C. (1991). The two power limits conditioning step frequency in human running. J. Physiol. 437, Cavagna, G. A., Legramandi, M. A. and Peyre-Tartaruga, L. A. (8). Old men running: mechanical work and elastic bounce. Proc. Biol. Sci. 75, Chapman, A. E. and Caldwell, G. E. (1983). Kinetic limitations of maximal sprinting speed. J. Biomech. 16, Chumanov, E. S., Heiderscheit, B. C. and Thelen, D. G. (7). The effect of speed and influence of individual muscles on hamstring mechanics during the swing phase of sprinting. J. Biomech. 4, Chumanov, E. S., Heiderscheit, B. C. and Thelen, D. G. (11). Hamstring musculotendon dynamics during stance and swing phases of high-speed running. Med. Sci. Sports Exerc. 43, Close, R. I. (197). Dynamic properties of mammalian skeletal muscles. Physiol. Rev. 5, Crowninshield, R. D. and Brand, R. A. (1981). A physiologically based criterion of muscle force prediction in locomotion. J. Biomech. 14, Delp, S. L., Anderson, F. C., Arnold, A. S., Loan, P., Habib, A., John, C. T., Guendelman, E. and Thelen, D. G. (7). OpenSim: open-source software to create and analyze dynamic simulations of movement. IEEE Trans. Biomed. Eng. 54, Derrick, T. R., Hamill, J. and Caldwell, G. E. (1998). Energy absorption of impacts during running at various stride lengths. Med. Sci. Sports Exerc. 3, Devita, P., Helseth, J. and Hortobagyi, T. (7). Muscles do more positive than negative work in human locomotion. J. Exp. Biol. 1, Dorn, T. W., Lin, Y. C. and Pandy, M. G. (1). Estimates of muscle function in human gait depend on how foot-ground contact is modelled. Comput. Methods Biomech. Biomed. Engin. 15, Elliott, B. C. and Blanksby, B. A. (1976). A cinematographic analysis of overground and treadmill running by males and females. Med. Sci. Sports 8, Erdemir, A., McLean, S., Herzog, W. and van den Bogert, A. J. (7). Modelbased estimation of muscle forces exerted during movements. Clin. Biomech., Frederick, E. C. (1986). Factors affecting peak vertical ground reaction forces in running. J. Appl. Biomech., Frishberg, B. A. (1983). An analysis of overground and treadmill sprinting. Med. Sci. Sports Exerc. 15, Glitsch, U. and Baumann, W. (1997). The three-dimensional determination of internal loads in the lower extremity. J. Biomech. 3, Gordon, A. M., Huxley, A. F. and Julian, F. J. (1966). The variation in isometric tension with sarcomere length in vertebrate muscle fibres. J. Physiol. 184, Hamner, S. R., Seth, A. and Delp, S. L. (1). Muscle contributions to propulsion and support during running. J. Biomech. 43, Hart, J. M., Ko, J.-W. K., Konold, T. and Pietrosimione, B. (1). Sagittal plane knee joint moments following anterior cruciate ligament injury and reconstruction: a systematic review. Clin. Biomech. 5, Heintz, S. and Gutierrez-Farewik, E. M. (7). Static optimization of muscle forces during gait in comparison to EMG-to-force processing approach. Gait Posture 6, Hennessy, L. and Kilty, J. (1). Relationship of the stretch-shortening cycle to sprint performance in trained female athletes. J. Strength Cond. Res. 15, Hermens, H. J., Freriks, B., Disselhorst-Klug, C. and Rau, G. (). Development of recommendations for SEMG sensors and sensor placement procedures. J. Electromyogr. Kinesiol. 1, Higham, T. E. (11). How muscles define maximum running performance in lizards: an analysis using swing-and stance-phase muscles. J. Exp. Biol. 14, Hunter, J. P., Marshall, R. N. and McNair, P. J. (4). Interaction of step length and step rate during sprint running. Med. Sci. Sports Exerc. 36,
14 1956 T. W. Dorn, A. G. Schache and M. G. Pandy Hunter, J. P., Marshall, R. N. and McNair, P. J. (5). Relationships between ground reaction force impulse and kinematics of sprint-running acceleration. J. Appl. Biomech. 1, Ishikawa, M. and Komi, P. V. (7). The role of the stretch reflex in the gastrocnemius muscle during human locomotion at various speeds. J. Appl. Physiol. 13, Kaneko, M. (199). Mechanics and energetics in running with special reference to efficiency. J. Biomech. 3 Suppl. 1, Katz, B. (1939). The relationship between force and speed in muscular contraction. J. Physiol. (Lond.) 96, Kibler, W. B., Goldberg, C. and Chandler, T. J. (1991). Functional biomechanical deficits in running athletes with plantar fasciitis. Am. J. Sports Med. 19, Kim, H. J., Fernandez, J. W., Akbarshahi, M., Walter, J. P., Fregly, B. J. and Pandy, M. G. (9). Evaluation of predicted knee-joint muscle forces during gait using an instrumented knee implant. J. Orthop. Res. 7, Komi, P. V. (1984). Physiological and biomechanical correlates of muscle function: effects of muscle structure and stretch-shortening cycle on force and speed. Exerc. Sport Sci. Rev. 1, Komi, P. V. (). Stretch-shortening cycle: a powerful model to study normal and fatigued muscle. J. Biomech. 33, Kubo, K., Kanehisa, H., Takeshita, D., Kawakami, Y., Fukashiro, S. and Fukunaga, T. (). In vivo dynamics of human medial gastrocnemius muscle-tendon complex during stretch-shortening cycle exercise. Acta Physiol. Scand. 17, Kumagai, K., Abe, T., Brechue, W. F., Ryushi, T., Takano, S. and Mizuno, M. (). Sprint performance is related to muscle fascicle length in male 1-m sprinters. J. Appl. Physiol. 88, Kunz, H. and Kaufmann, D. A. (1981). Biomechanical analysis of sprinting: decathletes versus champions. Br. J. Sports Med. 15, Lee, S. S. and Piazza, S. J. (9). Built for speed: musculoskeletal structure and sprinting ability. J. Exp. Biol. 1, Li, X., Zhou, P. and Aruin, A. S. (7). Teager-Kaiser energy operation of surface EMG improves muscle activity onset detection. Ann. Biomed. Eng. 35, Lichtwark, G. A. and Barclay, C. J. (1). The influence of tendon compliance on muscle power output and efficiency during cyclic contractions. J. Exp. Biol. 13, Lichtwark, G. A. and Wilson, A. M. (7). Is Achilles tendon compliance optimised for maximum muscle efficiency during locomotion? J. Biomech. 4, Lichtwark, G. A., Bougoulias, K. and Wilson, A. M. (7). Muscle fascicle and series elastic element length changes along the length of the human gastrocnemius during walking and running. J. Biomech. 4, Lin, Y. C., Kim, H. J. and Pandy, M. G. (11). A computationally efficient method for assessing muscle function during human locomotion. Int. J. Numer. Method. Biomed. Eng. 7, Lin, Y. C., Dorn, T. W., Schache, A. G. and Pandy, M. G. (1). Comparison of different methods for estimating muscle forces in human movement. Proc. Inst. Mech. Eng. H 6, Liu, M. Q., Anderson, F. C., Schwartz, M. H. and Delp, S. L. (8). Muscle contributions to support and progression over a range of walking speeds. J. Biomech. 41, Lu, T. W. and OʼConnor, J. J. (1999). Bone position estimation from skin marker coordinates using global optimisation with joint constraints. J. Biomech. 3, Luhtanen, P. and Komi, P. V. (1978). Mechanical factors influencing the running speed. In Biomechanics VI-B (ed. E. Asmussen and K. Jörgensen), pp Baltimore, MD: University Park Press. Mann, R. V. (1981). A kinetic analysis of sprinting. Med. Sci. Sports Exerc. 13, Mann, R. and Herman, J. (1985). Kinematic analysis of Olympic sprint performance: menʼs meters. Int. J. Sport Biomech. 1, McIntosh, A. S., Beatty, K. T., Dwan, L. N. and Vickers, D. R. (6). Gait dynamics on an inclined walkway. J. Biomech. 39, Mercer, J. A., Vance, J., Hreljac, A. and Hamill, J. (). Relationship between shock attenuation and stride length during running at different velocities. Eur. J. Appl. Physiol. 87, Mercer, J. A., Bezodis, N. E., Russell, M., Purdy, A. and DeLion, D. (5). Kinetic consequences of constraining running behavior. J. Sports Sci. Med. 4, Miller, R. H., Umberger, B. R. and Caldwell, G. E. (11). Limitations to maximum sprinting speed imposed by muscle mechanical properties. J. Biomech. 45, Nelson, R. C., Dillman, C. J., Lagasse, P. and Bickett, P. (197). Biomechanics of overground versus treadmill running. Med. Sci. Sports 4, Neptune, R. R. and Kautz, S. A. (1). Muscle activation and deactivation dynamics: the governing properties in fast cyclical human movement performance? Exerc. Sport Sci. Rev. 9, Nigg, B. M., De Boer, R. W. and Fisher, V. (1995). A kinematic comparison of overground and treadmill running. Med. Sci. Sports Exerc. 7, Novacheck, T. F. (1998). The biomechanics of running. Gait Posture 7, Pandy, M. G. (1). Computer modeling and simulation of human movement. Annu. Rev. Biomed. Eng. 3, Pandy, M. G. and Andriacchi, T. P. (1). Muscle and joint function in human locomotion. Annu. Rev. Biomed. Eng. 1, Pandy, M. G., Lin, Y. C. and Kim, H. J. (1). Muscle coordination of mediolateral balance in normal walking. J. Biomech. 43, Powell, P. L., Roy, R. R., Kanim, P., Bello, M. A. and Edgerton, V. R. (1984). Predictability of skeletal muscle tension from architectural determinations in guinea pig hindlimbs. J. Appl. Physiol. 57, Raikova, R. T. and Prilutsky, B. I. (1). Sensitivity of predicted muscle forces to parameters of the optimization-based human leg model revealed by analytical and numerical analyses. J. Biomech. 34, Riley, P. O., Dicharry, J., Franz, J., Croce, U. D., Wilder, R. P. and Kerrigan, D. C. (8). A kinematics and kinetic comparison of overground and treadmill running. Med. Sci. Sports Exerc. 4, Roberts, T. J. (). The integrated function of muscles and tendons during locomotion. Comp. Biochem. Physiol. 133A, Roberts, T. J. and Scales, J. A. (). Mechanical power output during running accelerations in wild turkeys. J. Exp. Biol. 5, Roberts, T. J., Marsh, R. L., Weyand, P. G. and Taylor, C. R. (1997). Muscular force in running turkeys: the economy of minimizing work. Science 75, Rome, L. C., Sosnicki, A. A. and Goble, D. O. (199). Maximum velocity of shortening of three fibre types from horse soleus muscle: implications for scaling with body size. J. Physiol. 431, Rubenson, J., Lloyd, D. G., Heliams, D. B., Besier, T. F. and Fournier, P. A. (11). Adaptations for economical bipedal running: the effect of limb structure on three-dimensional joint mechanics. J. R. Soc. Interface 8, Salo, A. I., Bezodis, I. N., Batterham, A. M. and Kerwin, D. G. (11). Elite sprinting: are athletes individually step frequency or step length reliant? Med. Sci. Sports Exerc. 43, Sasaki, K. and Neptune, R. R. (6). Differences in muscle function during walking and running at the same speed. J. Biomech. 39, Sawicki, G. S., Lewis, C. L. and Ferris, D. P. (9). It pays to have a spring in your step. Exerc. Sport Sci. Rev. 37, Schache, A. G., Blanch, P. D., Dorn, T. W., Brown, N. A., Rosemond, D. and Pandy, M. G. (11). Effect of running speed on lower-limb joint kinetics. Med. Sci. Sports Exerc. 43, Seth, A. and Pandy, M. G. (7). A neuromusculoskeletal tracking method for estimating individual muscle forces in human movement. J. Biomech. 4, Seth, A., Sherman, M., Eastman, P. and Delp, S. (1). Minimal formulation of joint motion for biomechanisms. Nonlinear Dyn. 6, Solnik, S., Rider, P., Steinweg, K., DeVita, P. and Hortobagyi, T. (1). Teager- Kaiser energy operator signal conditioning improves EMG onset detection. Eur. J. Appl. Physiol. 11, Swanson, S. C. and Caldwell, G. E. (). An integrated biomechanical analysis of high speed incline and level treadmill running. Med. Sci. Sports Exerc. 3, Thelen, D. G. (3). Adjustment of muscle mechanics model parameters to simulate dynamic contractions in older adults. J. Biomech. Eng. 15, Thelen, D. G., Chumanov, E. S., Best, T. M., Swanson, S. C. and Heiderscheit, B. C. (5). Simulation of biceps femoris musculotendon mechanics during the swing phase of sprinting. Med. Sci. Sports Exerc. 37, Volkov, N. I. and Lapin, V. I. (1979). Analysis of the velocity curve in sprint running. Med. Sci. Sports 11, Ward-Smith, A. J. (1985). A mathematical theory of running, based on the first law of thermodynamics, and its application to the performance of world-class athletes. J. Biomech. 18, Ward, S. R., Eng, C. M., Smallwood, L. H. and Lieber, R. L. (9). Are current measurements of lower extremity muscle architecture accurate? Clin. Orthop. Relat. Res. 467, Webb, P., Saris, W. H., Schoffelen, P. F., Van Ingen Schenau, G. J. and Ten Hoor, F. (1988). The work of walking: a calorimetric study. Med. Sci. Sports Exerc., Weyand, P. G., Sternlight, D. B., Bellizzi, M. J. and Wright, S. (). Faster top running speeds are achieved with greater ground forces not more rapid leg movements. J. Appl. Physiol. 89, Wilson, A. and Lichtwark, G. (11). The anatomical arrangement of muscle and tendon enhances limb versatility and locomotor performance. Philos. Trans. R. Soc. Lond. B 366, Winter, D. A. (9). Biomechanics and Motor Control of Human Movement. New York: John Wiley & Sons, Inc. Woledge, R. C., Curtin, N. A. and Homsher, E. (1985). Energetic aspects of muscle contraction. Monogr. Physiol. Soc. 41, Zajac, F. E. (1989). Muscle and tendon: properties, models, scaling, and application to biomechanics and motor control. Crit. Rev. Biomed. Eng. 17, Zajac, F. E. and Gordon, M. E. (1989). Determining muscleʼs force and action in multi-articular movement. Exerc. Sport Sci. Rev. 17,
15 MUSCULAR STRATEGY SHIFT IN HUMAN RUNNING Supplementary Figure S1: Anterior and posterior views of the marker set used in the running gait trials. Forty-six markers were attached to the subject (15 markers on each leg, 4 markers on each arm, and 8 markers on the torso/pelvis). Dorn/Schache/Pandy
16 MUSCULAR STRATEGY SHIFT IN HUMAN RUNNING Supplementary Figure S: Isometric and posterior views of the left lower-limb showing the locations of the skin-mounted markers. Additional markers were placed on the medial malleolus and medial epicondyle of each leg when recording the static standing trial. These additional markers were used to compute the mediolateral femur, tibia and foot lengths. Scale factors were derived from the segment lengths in the axial and mediolateral directions and then used to scale the femur, tibia and foot segments of the model. Dorn/Schache/Pandy 3
17 MUSCULAR STRATEGY SHIFT IN HUMAN RUNNING Dorn/Schache/Pandy 4
18 MUSCULAR STRATEGY SHIFT IN HUMAN RUNNING Supplementary Figure S3: Sagittal plane view of the joint kinematics and ground reaction forces measured during the stance phase of the stride for one representative subject at the four running speeds tested. Snapshots were taken at equal intervals of the stance phase with the right leg in contact with the ground. The vertical scale represents the peak magnitude of the vertical ground reaction force measured in multiples of body weight (BW). Dorn/Schache/Pandy 5


19 MUSCULAR STRATEGY SHIFT IN HUMAN RUNNING Dorn/Schache/Pandy 6
Supplementary Figure S1
 Supplementary Figure S1: Anterior and posterior views of the marker set used in the running gait trials. Forty-six markers were attached to the subject (15 markers on each leg, 4 markers on each arm, and
25 Lower-Limb Muscle Function in Human Running
 25 Lower-Limb Muscle Function in Human Running Anthony G. Schache, Tim W. Dorn, and Marcus G. Pandy * Abstract. This paper provides a brief summary of work completed to date in our research laboratory
Muscle force redistributes segmental power for body progression during walking
 Gait and Posture 19 (2004) 194 205 Muscle force redistributes segmental power for body progression during walking R.R. Neptune a,b,, F.E. Zajac b,c,d, S.A. Kautz b,e,f,g a Department of Mechanical Engineering,
Positive running posture sums up the right technique for top speed
 Positive running, a model for high speed running Frans Bosch positive running posture sums up the right technique for top speed building blocks in running: Pelvic rotation for- and backward and hamstring
Gait. Kinesiology RHS 341 Lecture 12 Dr. Einas Al-Eisa
 Gait Kinesiology RHS 341 Lecture 12 Dr. Einas Al-Eisa Definitions Locomotion = the act of moving from one place to the other Gait = the manner of walking Definitions Walking = a smooth, highly coordinated,
INTERACTION OF STEP LENGTH AND STEP RATE DURING SPRINT RUNNING
 INTERACTION OF STEP LENGTH AND STEP RATE DURING SPRINT RUNNING Joseph P. Hunter 1, Robert N. Marshall 1,, and Peter J. McNair 3 1 Department of Sport and Exercise Science, The University of Auckland, Auckland,
Current issues regarding induced acceleration analysis of walking using the integration method to decompose the GRF
 Current issues regarding induced acceleration analysis of walking using the integration method to decompose the GRF George Chen May 17, 2002 Stanford Neuromuscular Biomechanics Lab Group Muscle contribution
Muscles that support the body also modulate forward progression during walking
 ARTICLE IN PRESS Journal of Biomechanics 39 (6) 63 63 www.elsevier.com/locate/jbiomech www.jbiomech.com Muscles that support the body also modulate forward progression during walking May Q. Liu a,b, Frank
Tendon elastic strain energy in the human ankle plantar-flexors and its role with increased running speed
 24. Published by The Company of Biologists Ltd (24) 27, 359-368 doi:.242/jeb.826 RESEARCH ARTICLE Tendon elastic strain energy in the human ankle plantar-flexors and its role with increased running speed
GROUND REACTION FORCE DOMINANT VERSUS NON-DOMINANT SINGLE LEG STEP OFF
 GROUND REACTION FORCE DOMINANT VERSUS NON-DOMINANT SINGLE LEG STEP OFF Sara Gharabaghli, Rebecca Krogstad, Sara Lynch, Sofia Saavedra, and Tamara Wright California State University, San Marcos, San Marcos,
A Pilot Study on Electromyographic Analysis of Single and Double Revolution Jumps in Figure Skating
 Journal of Exercise Science and Physiotherapy, Vol. 5, No. 1: 14-19, 2009 A Pilot Study on Electromyographic Analysis of Single and Double Revolution Jumps in Figure Skating Taylor¹, C. L. and Psycharakis²,
-Elastic strain energy (duty factor decreases at higher speeds). Higher forces act on feet. More tendon stretch. More energy stored in tendon.
. Higher forces act on feet. More tendon stretch. More energy stored in tendon.") As velocity increases ( ) (i.e. increasing Froude number v 2 / gl) the component of the energy cost of transport associated with: -Internal kinetic energy (limbs accelerated to higher angular velocity).
As velocity increases ( ) (i.e. increasing Froude number v 2 / gl) the component of the energy cost of transport associated with: -Internal kinetic energy (limbs accelerated to higher angular velocity).
Does Ski Width Influence Muscle Action in an Elite Skier? A Case Study. Montana State University Movement Science Laboratory Bozeman, MT 59717
 Does Ski Width Influence Muscle Action in an Elite Skier? A Case Study John G. Seifert 1, Heidi Nunnikhoven 1, Cory Snyder 1, Ronald Kipp 2 1 Montana State University Movement Science Laboratory Bozeman,
Transformation of nonfunctional spinal circuits into functional states after the loss of brain input
 Transformation of nonfunctional spinal circuits into functional states after the loss of brain input G. Courtine, Y. P. Gerasimenko, R. van den Brand, A. Yew, P. Musienko, H. Zhong, B. Song, Y. Ao, R.
HOW DO WE ACCELERATE WHILE RUNNING? Daniel J. Schuster. April 2015
 HOW DO WE ACCELERATE WHILE RUNNING? by Daniel J. Schuster April 2015 Director of Thesis: Dr. Paul DeVita Major Department: Kinesiology Running biomechanics are well established in terms of lower extremity
ARTICLE IN PRESS. Journal of Biomechanics
 Journal of Biomechanics 42 (2009) 1282 1287 Contents lists available at ScienceDirect Journal of Biomechanics journal homepage: www.elsevier.com/locate/jbiomech www.jbiomech.com Modular control of human
NIH Public Access Author Manuscript J Biomech. Author manuscript; available in PMC 2014 April 08.
 NIH Public Access Author Manuscript Published in final edited form as: J Biomech. 2013 February 22; 46(4): 780 787. doi:10.1016/j.jbiomech.2012.11.024. Muscle contributions to fore-aft and vertical body
Effects of Mass and Momentum of Inertia Alternation on Individual Muscle Forces During Swing Phase of Transtibial Amputee Gait
 Kobe J. Med. Sci., Vol. 56, No. 3, pp. E92-E97, 21 Effects of Mass and Momentum of Inertia Alternation on Individual Muscle Forces During Swing Phase of Transtibial Amputee Gait YAGHOUB DABIRI 1, SIAMAK
An investigation of kinematic and kinetic variables for the description of prosthetic gait using the ENOCH system
 An investigation of kinematic and kinetic variables for the description of prosthetic gait using the ENOCH system K. OBERG and H. LANSHAMMAR* Amputee Training and Research Unit, University Hospital, Fack,
Modelling the stance leg in 2D analyses of sprinting: inclusion of the MTP joint affects joint
 1 Technical Note 2 3 4 5 Title: Modelling the stance leg in 2D analyses of sprinting: inclusion of the MTP joint affects joint kinetics (corrected version) 6 7 8 9 10 11 Authors: Neil E. Bezodis a,b, Aki
KICKBIKE Your key to optimum sports performance
 KICKBIKE Your key to optimum sports performance Efficient Running is essential to optimum performance of most sports we play. Whether we want to maximize our speed, maximize our endurance, or both, an
CHAPTER IV FINITE ELEMENT ANALYSIS OF THE KNEE JOINT WITHOUT A MEDICAL IMPLANT
 39 CHAPTER IV FINITE ELEMENT ANALYSIS OF THE KNEE JOINT WITHOUT A MEDICAL IMPLANT 4.1 Modeling in Biomechanics The human body, apart of all its other functions is a mechanical mechanism and a structure,
Denny Wells, Jacqueline Alderson, Kane Middleton and Cyril Donnelly
 11:45 am-12:00 pm Denny Wells. Assessing the accuracy of inverse kinematics in OpenSim to estimate elbow flexionextension during cricket bowling: Maintaining the rigid linked assumption. (201) ASSESSING
Increasing ankle push-off work with a powered prosthesis does not necessarily reduce metabolic rate for transtibial amputees
 Supplementary Materials Increasing ankle push-off work with a powered prosthesis does not necessarily reduce metabolic rate for transtibial amputees Roberto E. Quesada, Joshua M. Caputo,, and Steven H.
1. Hip flexion Muscles: Iliopsoas (psoas major + iliacus)
") Chap. 5 Testing the muscles of the Lower Extremity Part I. Manual Muscle Testing of the hip joint muscles 1. Hip flexion Muscles: Iliopsoas (psoas major + iliacus) Rectus femoris Sartorius Tensor fascia
Chap. 5 Testing the muscles of the Lower Extremity Part I. Manual Muscle Testing of the hip joint muscles 1. Hip flexion Muscles: Iliopsoas (psoas major + iliacus) Rectus femoris Sartorius Tensor fascia
Simulation-based design to reduce metabolic cost
 Simulation-based design to reduce metabolic cost Overview: Lecture + Hands On Exercise 1. Generating and evaluating a muscledriven simulation of walking 2. Metabolics 101 3. Designing and evaluating devices
Normal and Abnormal Gait
 Normal and Abnormal Gait Adrielle Fry, MD EvergreenHealth, Division of Sport and Spine University of Washington Board Review Course March 6, 2017 What are we going to cover? Definitions and key concepts
Steffen Willwacher, Katina Fischer, Gert Peter Brüggemann Institute of Biomechanics and Orthopaedics, German Sport University, Cologne, Germany
 P01-3 ID126 SURFACE STIFFNESS AFFECTS JOINT LOADING IN RUNNING Steffen Willwacher, Katina Fischer, Gert Peter Brüggemann Institute of Biomechanics and Orthopaedics, German Sport University, Cologne, Germany
ASSISTED AND RESISTED METHODS FOR SPEED DEVELOPMENT (PART 1)
") ASSISTED AND RESISTED METHODS FOR SPEED DEVELOPMENT (PART 1) By Adrian Faccioni Adrian Faccioni, a lecturer at the Centre of Sports Studies, University of Canberra, Australia, presents a detailed evaluation
ASSISTED AND RESISTED METHODS FOR SPEED DEVELOPMENT (PART 1) By Adrian Faccioni Adrian Faccioni, a lecturer at the Centre of Sports Studies, University of Canberra, Australia, presents a detailed evaluation
by Michael Young Human Performance Consulting
 by Michael Young Human Performance Consulting The high performance division of USATF commissioned research to determine what variables were most critical to success in the shot put The objective of the
Contributions of muscle forces and toe-off kinematics to peak knee flexion during the swing phase of normal gait: an induced position analysis
 Journal of Biomechanics 37 (2004) 731 737 Contributions of muscle forces and toe-off kinematics to peak knee flexion during the swing phase of normal gait: an induced position analysis Frank C. Anderson
Available online at Prediction of energy efficient pedal forces in cycling using musculoskeletal simulation models
 Available online at www.sciencedirect.com Engineering 2 00 (2010) (2009) 3211 3215 000 000 Engineering www.elsevier.com/locate/procedia 8 th Conference of the International Sports Engineering Association
Muscle force distribution during forward and backward locomotion
 Acta of Bioengineering and Biomechanics Vol. 15, No. 3, 2013 Original paper DOI: 10.5277/abb130301 First award of Morecki & Fidelus Scientific Awards Muscle force distribution during forward and backward
The Starting Point. Prosthetic Alignment in the Transtibial Amputee. Outline. COM Motion in the Coronal Plane
 Prosthetic Alignment in the Transtibial Amputee The Starting Point David C. Morgenroth, MD, Department of Rehabilitation Medicine University of Washington VAPSHCS Outline COM Motion in the Coronal Plane
Posture influences ground reaction force: implications for crouch gait
 University of Tennessee, Knoxville From the SelectedWorks of Jeffrey A. Reinbolt July 14, 2010 Posture influences ground reaction force: implications for crouch gait H. X. Hoang Jeffrey A. Reinbolt, University
Brian Snyder MD/PhD Children s Hospital Harvard Medical School
 Brian Snyder MD/PhD Children s Hospital Harvard Medical School Observe patient s gait pattern as walk into room Systematic musculoskeletal exam (range of motion, joint alignment while standing) Neurologic
EXSC 408L Fall '03 Problem Set #2 Linear Motion. Linear Motion
 Problems: 1. Once you have recorded the calibration frame for a data collection, why is it important to make sure the camera does not shut off? hat happens if the camera automatically shuts off after being
Biomechanics and Models of Locomotion
 Physics-Based Models for People Tracking: Biomechanics and Models of Locomotion Marcus Brubaker 1 Leonid Sigal 1,2 David J Fleet 1 1 University of Toronto 2 Disney Research, Pittsburgh Biomechanics Biomechanics
Normal Gait and Dynamic Function purpose of the foot in ambulation. Normal Gait and Dynamic Function purpose of the foot in ambulation
 Normal Gait and Dynamic Function purpose of the foot in ambulation Edward P. Mulligan, PT, DPT, OCS, SCS, ATC Assistant Professor; Residency Chair UT Southwestern School of Health Professions Department
REPORT. A comparative study of the mechanical and biomechanical behaviour of natural turf and hybrid turf for the practise of sports
 REPORT A comparative study of the mechanical and biomechanical behaviour of natural turf and hybrid turf for the practise of sports Addressed to: PSF - PALAU TURF Date: May 2015 Table of Contents SHEET
RUNNING SHOE STIFFNESS: THE EFFECT ON WALKING GAIT
 RUNNING SHOE STIFFNESS: THE EFFECT ON WALKING GAIT Stephen N Stanley, Peter J M c Nair, Angela G Walker, & Robert N Marshall Auckland Institute of Technology, Auckland, New Zealand University of Auckland,
INTRODUCTION TO GAIT ANALYSIS DATA
 INTRODUCTION TO GAIT ANALYSIS DATA 1. Phases of gait a. Stance (% gc) i. Loading response (10%) ii. Mid- and terminal stance (%) iii. Pre-swing (10%) b. Swing (% gc) i. Initial swing ii. Mid-swing iii.
Coaching the Triple Jump Boo Schexnayder
 I. Understanding the Event A. The Run and Its Purpose B. Hip Undulation and the Phases C. Making the Connection II. III. IV. The Approach Run A. Phases B. Technical Features 1. Posture 2. Progressive Body
The Influence of High Heeled Shoes on Kinematics, Kinetics, and Muscle EMG of Normal Female Gait
 JOURNAL OF APPLIED BIOMECHANICS, 2000, 16, 309-319 2000 by Human Kinetics Publishers, Inc. The Influence of High Heeled Shoes on Kinematics, Kinetics, and Muscle EMG of Normal Female Gait Darren J. Stefanyshyn,
Journal of Biomechanics
 Journal of Biomechanics 45 (2012) 2157 2163 Contents lists available at SciVerse ScienceDirect Journal of Biomechanics journal homepage: www.elsevier.com/locate/jbiomech www.jbiomech.com Three-dimensional
video Purpose Pathological Gait Objectives: Primary, Secondary and Compensatory Gait Deviations in CP AACPDM IC #3 1
 s in CP Disclosure Information AACPDM 71st Annual Meeting September 13-16, 2017 Speaker Names: Sylvia Ounpuu, MSc and Kristan Pierz, MD Differentiating Between, Secondary and Compensatory Mechanisms in
A New Approach to Modeling Vertical Stiffness in Heel-Toe Distance Runners
 Brigham Young University BYU ScholarsArchive All Faculty Publications 2003-12-01 A New Approach to Modeling Vertical Stiffness in Heel-Toe Distance Runners Iain Hunter iain_hunter@byu.edu Follow this and
A Biomechanical Approach to Javelin. Blake Vajgrt. Concordia University. December 5 th, 2012
 A Biomechanical Approach to Javelin Blake Vajgrt Concordia University December 5 th, 2012 The Biomechanical Approach to Javelin 2 The Biomechanical Approach to Javelin Javelin is one of the four throwing
Assessments SIMPLY GAIT. Posture and Gait. Observing Posture and Gait. Postural Assessment. Postural Assessment 6/28/2016
 Assessments 2 SIMPLY GAIT Understanding movement Evaluations of factors that help therapist form professional judgments Include health, palpatory, range of motion, postural, and gait assessments Assessments
Section Section 4. Muscles and Movements Dr. Larry Van Such.
 Section 4 25 Section 4 Muscles and Movements Section 4 26 HIP ABDUCTORS Gluteus Medius Gluteus Minimus Tensor Fascia Lata Gluteus Maximus Figure 4-1. Hip Abductors. The hip abductors are a group of four
A Musculoskeletal Driven Forward Dynamics Simulation of Swing Phase of Transfemoral Amputee Gait
 Australian Journal of Basic and Applied Sciences, 4(2): 187-196, 2010 ISSN 1991-8178 A Musculoskeletal Driven Forward Dynamics Simulation of Swing Phase of Transfemoral Amputee Gait 1 2 3 4 5 Y. Dabiri,
+ t1 t2 moment-time curves
 Part 6 - Angular Kinematics / Angular Impulse 1. While jumping over a hurdle, an athlete s hip angle was measured to be 2.41 radians. Within 0.15 seconds, the hurdler s hip angle changed to be 3.29 radians.
Artifacts Due to Filtering Mismatch in Drop Landing Moment Data
 Camenga et al. UW-L Journal of Undergraduate Research XVI (213) Artifacts Due to Filtering Mismatch in Drop Landing Moment Data Elizabeth T. Camenga, Casey J. Rutten, Brendan D. Gould, Jillian T. Asmus,
The Influence of Load Carrying Modes on Gait variables of Healthy Indian Women
 The Influence of Load Carrying Modes on Gait variables of Healthy Indian Women *Guha Thakurta A, Iqbal R and De A National Institute of Industrial Engineering, Powai, Vihar Lake, Mumbai-400087, India,
Biomechanical analysis of the medalists in the 10,000 metres at the 2007 World Championships in Athletics
 STUDY Biomechanical analysis of the medalists in the 10,000 metres at the 2007 World Championships in Athletics by IAAF 23:3; 61-66, 2008 By Yasushi Enomoto, Hirosuke Kadono, Yuta Suzuki, Tetsu Chiba,
Muscles force and joints load simulation of bicycle riding using multibody models
 Available online at www.sciencedirect.com Procedia Engineering 13 (2011) 81 87 5 th Asia-Pacific Congress on Sports Technology (APCST) Muscles force and joints load simulation of bicycle riding using multibody
NIH Public Access Author Manuscript J Biomech. Author manuscript; available in PMC 2011 October 19.
 NIH Public Access Author Manuscript Published in final edited form as: J Biomech. 2010 October 19; 43(14): 2709 2716. doi:10.1016/j.jbiomech.2010.06.025. Muscle contributions to propulsion and support
TECHNICAL CONSIDERATIONS FOR THE 100M HURDLES
 TECHNICAL CONSIDERATIONS FOR THE 100M HURDLES Thanks & Appreciation Vince Anderson, Texas A&M Andreas Behm, ALTIS Andy Eggerth, Kennesaw State University Erik Jenkins, University of Western Kentucky Glenn
Motion Analysis on Backward Walking: Kinetics, Kinematics, and Electromyography
 Motion Analysis on Backward Walking: Kinetics, Kinematics, and Electromyography Min Hyeon Lee The Graduate School Yonsei University Department of Biomedical Engineering Motion Analysis on Backward Walking:
Athlete Profiling. Injury Prevention
 Athlete Profiling Injury Prevention Fraser McKinney Physiotherapist Special interest in: Basketball Athletics Race Walking Research Performance markers (screening / HR assessments / biomechanics) Athlete
Running Gait Mechanics. Walking vs Running. Ankle Joint Complex Sagittal Plane. As speed increases, when has walking ended and running begun?
 Running Gait Mechanics Walking vs Running As speed increases, when has walking ended and running begun? Ankle Joint Complex Sagittal Plane 1 Ankle Joint Complex Sagittal Plane Pos. @FS 5 o DF Absorption
The effect of walking speed on muscle function and mechanical energetics
 Available online at www.sciencedirect.com Gait & Posture 28 (2008) 135 143 www.elsevier.com/locate/gaitpost The effect of walking speed on muscle function and mechanical energetics Richard R. Neptune a,
10/22/15. Walking vs Running. Normal Running Mechanics. Treadmill vs. Overground Are they the same? Importance of Gait Analysis.
 2 angle (deg) 1/22/1 Normal Running Mechanics Walking vs Running Irene Davis, PhD, PT, FACSM, FAPTA, FASB Director, Spaulding National Running Center Walking Periods of DOUBLE SUPPORT Running Periods of
RESEARCH ARTICLE Modulation of joint moments and work in the goat hindlimb with locomotor speed and surface grade
 22 The Journal of Experimental Biology 26, 22-222 23. Published by The Company of Biologists Ltd doi:.242/jeb.8249 RESEARCH ARTICLE Modulation of joint moments and work in the goat hindlimb with locomotor
MUSCLE COORDINATION OF SUPPORT, PROGRESSION AND BALANCE DURING STAIR AMBULATION. Yi-Chung Lin, Laurence A. Fok, Anthony G. Schache and Marcus G.
 *Manuscript Click here to view linked References MUSCLE COORDINATION OF SUPPORT, PROGRESSION AND BALANCE DURING STAIR AMBULATION Yi-Chung Lin, Laurence A. Fok, Anthony G. Schache and Marcus G. Pandy Dept
Serve the only stroke in which the player has full control over its outcome. Bahamonde (2000) The higher the velocity, the smaller the margin of
 The higher the velocity, the smaller the margin of") Lower Extremity Performance of Tennis Serve Reporter: Chin-Fu Hsu Adviser: Lin-Hwa Wang OUTLINE Introduction Kinetic Chain Serve Types Lower Extremity Movement Summary Future Work INTRODUCTION Serve the
Lower Extremity Performance of Tennis Serve Reporter: Chin-Fu Hsu Adviser: Lin-Hwa Wang OUTLINE Introduction Kinetic Chain Serve Types Lower Extremity Movement Summary Future Work INTRODUCTION Serve the
SPRINTING CHARACTERISTICS OF WOMEN S 100 METER FINALS AT THE IAAF WORLD CHAMPIONSHOPS DAEGU 2011
 9:30-9:45 am Sang-Kyoon Park. Sprinting characteristics of women's 100 meter finals at the IAAF world championships Daegu 2011. (228) SPRINTING CHARACTERISTICS OF WOMEN S 100 METER FINALS AT THE IAAF WORLD
Biomechanics and the Rules of Race Walking. Brian Hanley
 Biomechanics and the Rules of Race Walking Brian Hanley Biomechanics and the Rules of Race Walking Brian Hanley b.hanley@leedsmet.ac.uk www.evaa.ch The rules and judging Judging is probably the most contentious
Research Article Joint Torque and Mechanical Power of Lower Extremity and Its Relevance to Hamstring Strain during Sprint Running
 Hindawi Healthcare Engineering Volume 2017, Article ID 8927415, 7 pages https://doi.org/10.1155/2017/8927415 Research Article Joint Torque and Mechanical Power of Lower Extremity and Its Relevance to Hamstring
Biomechanical Analysis of Race Walking Compared to Normal Walking and Running Gait
 University of Kentucky UKnowledge Theses and Dissertations--Kinesiology and Health Promotion Kinesiology and Health Promotion 2015 Biomechanical Analysis of Race Walking Compared to Normal Walking and
Mutual and asynchronous anticipation and action in sports as globally competitive
 1 Supplementary Materials Mutual and asynchronous anticipation and action in sports as globally competitive and locally coordinative dynamics Keisuke Fujii, Tadao Isaka, Motoki Kouzaki and Yuji Yamamoto.
Mechanics and energetics of level walking with powered ankle exoskeletons
 142 The Journal of Experimental Biology 211, 142-1413 Published by The Company of Biologists 28 doi:1.1242/jeb.9241 Mechanics and energetics of level walking with ed ankle exoskeletons Gregory S. Sawicki
Metabolic cost of generating muscular force in human walking: insights from load-carrying and speed experiments
 J Appl Physiol 95: 172 183, 2003; 10.1152/japplphysiol.00944.2002. Metabolic cost of generating muscular force in human walking: insights from load-carrying and speed experiments Timothy M. Griffin, 1
Injury Mechanism of Bi-articular Muscle Hamstring during Sprint Running. Yu Liu School of Kinesiology, Shanghai University of Sport, China
 Injury Mechanism of Bi-articular Muscle Hamstring during Sprint Running Yu Liu School of Kinesiology, Shanghai University of Sport, China Many mechanisms and risk factors of hamstring injury were implicated.
Running Injuries in Adolescents Jeffrey Shilt, M.D. Part 1 Page 1
 Running Injuries in Adolescents Jeffrey Shilt, M.D. Chief Surgical Officer, The Woodlands, Texas Children's Hospital Associate Professor, Orthopedic and Scoliosis Surgery, Baylor College of Medicine Part
Effects of walking speed and age on the muscle forces of unimpaired gait subjects
 Journal of Physics: Conference Series PAPER OPEN ACCESS Effects of walking speed and age on the muscle forces of unimpaired gait subjects To cite this article: Carlos G. Fliger et al 2016 J. Phys.: Conf.
USA Track & Field Heptathlon Summit- November
 USA Track & Field Heptathlon Summit- November 1994 1 I. Technical considerations in the sprint hurdles Practical Biomechanics For the 100m Hurdles By Gary Winckler University of Illinois A. General flow
A QUALITATIVE ANALYSIS OF THE HIGH RACQUET POSITION BACKHAND DRIVE OF AN ELITE RACQUETBALL PLAYER
 A QUALITATIVE ANALYSIS OF THE HIGH RACQUET POSITION BACKHAND DRIVE OF AN ELITE RACQUETBALL PLAYER John R. Stevenson Wayne P. Hollander Since 1950, when Joe Sobek put strings on his paddleball paddle, the
UvA-DARE (Digital Academic Repository) Hip and groin pain in athletes Tak, I.J.R. Link to publication
 Hip and groin pain in athletes Tak, I.J.R. Link to publication") UvA-DARE (Digital Academic Repository) Hip and groin pain in athletes Tak, I.J.R. Link to publication Citation for published version (APA): Tak, I. J. R. (2017). Hip and groin pain in athletes: Morphology,
UvA-DARE (Digital Academic Repository) Hip and groin pain in athletes Tak, I.J.R. Link to publication Citation for published version (APA): Tak, I. J. R. (2017). Hip and groin pain in athletes: Morphology,
Analysis of lower limb internal kinetics and electromyography in elite race
 Analysis of lower limb internal kinetics and electromyography in elite race walking Brian Hanley and Athanassios Bissas School of Sport, Carnegie Faculty, Headingley Campus, Leeds Metropolitan University,
Kinematic and Spatiotemporal Analysis Between Sprint Drills and Maximal Sprinting
 Sacred Heart University DigitalCommons@SHU PTHMS Undergraduate Publications Physical Therapy & Human Movement Science Spring 2013 Kinematic and Spatiotemporal Analysis Between Sprint Drills and Maximal
Kinematic, Kinetic & Electromyographic Characteristics of the Sprinting Stride of Top Female Sprinters
 Kinematic, Kinetic & Electromyographic Characteristics of the Sprinting Stride of Top Female Sprinters Milan Coh, Ales Dolenec & Bojan Jost University of Ljubljana, Slovenia The main purpose of this study
Rehabilitation of Non-operative Hamstring Injuries
 Rehabilitation of Non-operative Hamstring Injuries 12 th Annual Colorado University Sports Medicine Fall Symposium Robert A. Panariello MS, PT, ATC, CSCS Founding Partner, Chief Clinical Officer Professional
Supplementary,Material,!
 Supplementary,Material, MTJ,Tracking,Methods, WeestimatedAT,muscle,andMTUlengthchangesusingpreviouslypublishedMTJtrackingmethods (Hoffrén et al., 212; Lichtwark, 25; Lichtwark and Wilson, 26). The ultrasound
Gait & Posture 33 (2011) Contents lists available at ScienceDirect. Gait & Posture. journal homepage:
 Contents lists available at ScienceDirect. Gait & Posture. journal homepage:") Gait & Posture 33 (2011) 562 567 Contents lists available at ScienceDirect Gait & Posture journal homepage: www.elsevier.com/locate/gaitpost Braking and propulsive impulses increase with speed during accelerated
Gait & Posture 33 (2011) 562 567 Contents lists available at ScienceDirect Gait & Posture journal homepage: www.elsevier.com/locate/gaitpost Braking and propulsive impulses increase with speed during accelerated
Ground Reaction Forces and Lower Extremity Kinematics When Running With Suppressed Arm Swing
 Ground Reaction Forces and Lower Extremity Kinematics When Running With Suppressed Arm Swing Ross H. Miller 1 e-mail: rhmiller@kin.umass.edu Graham E. Caldwell Richard E. A. Van Emmerik Brian R. Umberger
NIH Public Access Author Manuscript J Biomech. Author manuscript; available in PMC 2011 August 10.
 NIH Public Access Author Manuscript Published in final edited form as: J Biomech. 2010 August 10; 43(11): 2099 2105. doi:10.1016/j.jbiomech.2010.04.003. Muscle contributions to support and progression
Purpose. Outline. Angle definition. Objectives:
 Disclosure Information AACPDM 69 th Annual Meeting October 21-24, 2015 Speaker Names: Sylvia Õunpuu, MSc and Kristan Pierz, MD Gait Analysis Data Interpretation: Understanding Kinematic Relationships Within
(2) BIOMECHANICS of TERRESTRIAL LOCOMOTION
 BIOMECHANICS of TERRESTRIAL LOCOMOTION") (2) BIOMECHANICS of TERRESTRIAL LOCOMOTION Questions: - How does size influence the mode and speed of locomotion? - What determines the energy cost of locomotion? - Why do humans walk and run the way we
(2) BIOMECHANICS of TERRESTRIAL LOCOMOTION Questions: - How does size influence the mode and speed of locomotion? - What determines the energy cost of locomotion? - Why do humans walk and run the way we
Analysis of ankle kinetics and energy consumption with an advanced microprocessor controlled ankle foot prosthesis.
 Analysis of ankle kinetics and energy consumption with an advanced microprocessor controlled ankle foot prosthesis. D.Moser, N.Stech, J.McCarthy, G.Harris, S.Zahedi, A.McDougall Summary This study reports
Ankle plantar flexor force production is an important determinant of the preferred walk-to-run transition speed
 The Journal of Experimental Biology 28, 799-88 Published by The Company of Biologists 25 doi:.242/jeb.435 799 Ankle plantar flexor force production is an important determinant of the preferred walk-to-run
Impact Points and Their Effect on Trajectory in Soccer
 Proceedings Impact Points and Their Effect on Trajectory in Soccer Kaoru Kimachi 1, *, Sungchan Hong 2, Shuji Shimonagata 3 and Takeshi Asai 2 1 Doctoral Program of Coaching Science, University of Tsukuba,
Running injuries - what are the most important factors
 Created as a free resource by Clinical Edge Based on Physio Edge podcast 59 with Greg Lehman, Tom Goom and Dr Christian Barton Get your free trial of online Physio education at Why do runners get injured?
Sprinting: A Biomechanical Approach By Tom Tellez
 Sprinting: A Biomechanical Approach By Tom Tellez World class male sprinters stride approximately forty-three times for a 100 meter race. If a mechanical error costs one-one thousandth of a second per
Pre-Swing Deficits in Forward Propulsion, Swing Initiation and Power Generation by Individual Muscles in Hemiparetic Walking
 University of Dayton ecommons Mechanical and Aerospace Engineering Faculty Publications Department of Mechanical and Aerospace Engineering 8-2010 Pre-Swing Deficits in Forward Propulsion, Swing Initiation
BIOMECHANICAL MOVEMENT
 SECTION PART 5 5 CHAPTER 12 13 CHAPTER 12: Biomechanical movement Practice questions - text book pages 169-172 1) For which of the following is the athlete s centre of mass most likely to lie outside of
THE INITIAL STAGE THE FINAL STAGE
 THE JAVELIN RUN-UP By Hans Torim A detailed description of the author s views on the javelin run-up from the initial stages to the impulse stride and the pre-delivery position. The article is a slightly
The Effect of Military Load Carriage on Ground Reaction Forces. Technical Note. Stewart A Birrell 1 Robin H Hooper 1 Roger A Haslam 1
 The Effect of Military Load Carriage on Ground Reaction Forces Technical Note Stewart A Birrell 1 Robin H Hooper 1 Roger A Haslam 1 1 Department of Human Sciences, Loughborough University, Leicestershire,
DYNAMIC SIMULATION OF MUSCULOTENDON MECHANICS DURING HIGH SPEED RUNNING
 DYNAMIC SIMULATION OF MUSCULOTENDON MECHANICS DURING HIGH SPEED RUNNING By Elizabeth Schmerr Chumanov A dissertation submitted in partial fulfillment of the requirements for the degree of Doctor of Philosophy
A COMPARISON OF SELECTED BIOMECHANICAL PARAMETERS OF FRONT ROW SPIKE BETWEEN SHORT SET AND HIGH SET BALL
 A COMPARISON OF SELECTED BIOMECHANICAL PARAMETERS OF FRONT ROW SPIKE BETWEEN SHORT SET AND HIGH SET BALL PAPAN MONDAL a AND SUDARSAN BHOWMICK b,* a Assistant Professor, Department of Physical Education,