THESIS. Presented in Partial Fulfillment of the Requirements for the Degree Master of Science in the Graduate School of The Ohio State University
|
|
|
- Erin Henry
- 5 years ago
- Views:
Transcription
1 An Investigation of Simulated Core Muscle Activation during Running and its Effect on Knee Loading and Lower Extremity Muscle Activation Using OpenSim THESIS Presented in Partial Fulfillment of the Requirements for the Degree Master of Science in the Graduate School of The Ohio State University By Justin Michael Creps Graduate Program in Mechanical Engineering The Ohio State University 2014 Master's Examination Committee: Ajit M.W. Chaudhari, Advisor Robert A. Siston
2 Copyright by Justin Michael Creps 2014
3 Abstract Running is a popular activity that 9% of the U.S. population participates in at least once per week. There is a risk associated with running, as 37-65% of runners experience injury annually. Patellofemoral pain syndrome (PFPS), iliotibial band syndrome (ITBS), and tibial stress fractures (TSF) are three common injuries. Previous studies have identified relationships between loading parameters and these injuries. Core musculature, and its role in injury prevention, is a popular topic in the biomechanical community. However, few studies have focused on the core s relation to knee injuries during running, specifically. This thesis had three objectives: (1) to investigate how decreasing core activation during running would affect knee loading and lower extremity muscle activation; (2) to observe how different running kinematic styles were affected by decreased core activation, using representative subject specific motion capture data; and (3) to establish the feasibility of creating forward dynamic simulations of running to enable future simulation-based running research. Representative running trials from six subjects, each representing a kinematic style of running (high and low normalized stride length, lumbar rotation range, and lumbar flexion/extension range) were simulated in OpenSim. Core muscle activation was constrained, and the effects on knee loading and lower extremity muscle activations were analyzed. ii
4 The average external rotation impulse acting on the tibia increased from 0.16 Nm*s to 0.19 Nm*s when core activation was decreased. Since external rotation of the femur relative to the tibia has been linked with PFPS and ITBS, this result suggests that decreased core activation may increase injury risk. Axial tibial force has been linked to TSF, and average axial force on the tibia increased from 4,947 N to 5,078 N when core activation was decreased, suggesting a link between reduced core activation and TSF. Swing leg muscle activation increased by 16.67% when core activation was decreased. Increased lower extremity muscle activation may cause faster fatigue, and increase injury risk. Hip abductor muscles averaged a 20.58% increase in activation, suggesting an increased risk of ITBS. Analysis of different running styles demonstrated that tibial abduction angular impulse was seven times higher in the high stride length subject than the low stride length subject. Tibial abduction angular impulse has been identified as a contributing factor to PFPS, suggesting that running with a long stride length may increase injury risk. Forward dynamic simulations of all six subjects were successfully generated. To our knowledge, this was the first time that forward dynamic simulations of running have been generated, and this work will enable future study of how kinematics and kinetics change as perturbations or muscle activation variations are applied. Overall, these results provide targets for additional biomechanical investigation of the role of core musculature deficiencies in running injuries, and a new simulation tool for performing these investigations. iii
5 Acknowledgments I would not have been able to complete this project without the help of many people. The first person I should mention is my advisor, Ajit Chaudhari. His guidance, advice, knowledge, patience, understanding, and positive attitude were critical to my eventual success in this project. I don t think I can count how many days I was feeling discouraged about this project, but then I would meet with Ajit, and I would always feel better about the direction I was heading. I am also very thankful for my other committee member, Robert Siston. Rob is an outstanding teacher, and played a vitally important part in my decision to attend graduate school. If I had not had the privilege of working with him during my undergraduate studies, I probably never would have pursued this project. There were so many times when Julie Thompson provided me with much needed help on this project. She was always happy to give me advice, provide OpenSim examples, and help in troubleshooting encountered problems. I am extremely grateful for her guidance, and was lucky to have such a kind and talented person to ask for help. I would also like to acknowledge the entire Movement Analysis and Performance lab at Ohio State. I was lucky to work in such a friendly lab full of helpful and extremely intelligent people. I would specifically like to thank Greg Freisinger, Mike Mcnally, and Margaret Raabe, who each provided their time to helping me specifically with this iv
6 project. Jackie Lewis, Scott Monfort, Louise Thoma, Sarah Schloemer, Dustin Grooms, and Chris Nagelli may not have worked with me specifically on the project, but they were all excellent friends (and intramural teammates). Stave Jamison also deserves credit. Although, unfortunately, my time and Steve s time in the lab did not overlap for very long, he played a huge part in collecting the data used in this project. I also want to acknowledge Tim Dorn of Stanford University. His C3D Extraction Toolbox allowed me to convert our lab s data into a useable format in OpenSim. Samuel Hamner, also of Stanford, made this project possible by originally creating the OpenSim model for jogging that was used in this study. Last, but certainly not least, I would like to thank my friends and family. My father, Michael Creps, constantly pushed and encouraged me which certainly helped in getting me through to the finish line. My mother, Traci Frankart, always provided support in whatever way she could. I would also like to thank Melissa Pfeifer for keeping me sane throughout the entire graduate school process, and being very patient with the nature of a graduate student s life. There are many other friends from my hometown of Maumee, Ohio who deserve to be mentioned. Their love, support, and genuine interest in my work were indescribably important to my eventual success. v
7 Vita April Born Toledo, OH June Maumee High School June B.S. Mechanical Engineering, The Ohio State University September 2011 to May Graduate Teaching Associate, Department of Mechanical Engineering, The Ohio State University Fields of Study Major Field: Mechanical Engineering vi
8 Table of Contents Abstract... ii Acknowledgments... iv Vita... vi List of Tables... x List of Figures... xiii Chapter 1: Introduction Running Activity and Injury Background and Statistics Mechanisms of Common Overuse Running Injury The Core and its Relation to Running OpenSim Capabilities Focus of Thesis Significance of Research Overview of Thesis Chapter 2: Methods Experimental Data Collection vii
9 2.2 Simulation Procedure, Prior to Constraining Muscles Constraining Core Muscle Activations Analyses of Results Chapter 3: Results Assessment of Forward Dynamic Simulations Knee Loading Results Comparison of Lower Extremity Activation of Stance and Swing Leg Investigation of Hip Abduction Activation as Core Activation is Constrained Unconstrained Core Activation Comparison Analysis of the Validity of the Simulations Evaluation of the Constraint of Core Activation Chapter 4: Discussion Discussion of Knee Loading Results Discussion of Lower Extremity Muscle Activation Results Discussion of the Hip Abductor Group Muscle Activations Discussion of Unconstrained Core Activation Results Discussion of Validity of Results Chapter 5: Conclusion Limitations and Future Work viii
10 5.2 Summary and Closing Comments References Appendix A: Scaling Ratios for All Subjects Appendix B: All Knee Loading Bar Graphs Appendix C: All Knee Loading Line Graphs, Direct Output from OpenSim Appendix D: Tables Quantifying and Summarizing Knee Loading for All Subjects Appendix E: All Uncapped Core Muscle Activation Line Graphs, for Each Subject Pair, Direct Output from OpenSim Appendix F: All Core Muscle Activation Line Graphs, Displaying the Effect of the Constraining Process, Direct Output from OpenSim ix
11 List of Tables Table 1: Overview of Running Injury Literature... 2 Table 2: Objectives of Thesis Table 3: Kinematic Data of Selected Subjects Table 4: Sex, Height, and Mass of Selected Subjects Table 5: Measurement Sets Used During Scaling Table 6: Example of Scaling Ratios Table 7: Marker Weights Used During Scaling Table 8: Marker Weights Used During Inverse Kinematics Table 9: SimTK Thresholds for Evaluating RRA Results. Reproduced from SimTK Website [49] Table 10: SimTK Thresholds for Evaluating CMC Results. Reproduced from SimTK Website [49] Table 11: Comparison of Summed Knee and Hip Muscle Activation Integrals of the Stance and Swing Legs in the Low Stride Length Subject Table 12: Comparison of Summed Knee and Hip Muscle Activation Integrals of the Stance and Swing Legs in the High Stride Length Subject Table 13: Comparison of Summed Knee and Hip Muscle Activation Integrals of the Stance and Swing Legs in the Low Lumbar Rotation Subject x
12 Table 14: Comparison of Summed Knee and Hip Muscle Activation Integrals of the Stance and Swing Legs in the High Lumbar Rotation Subject Table 15: Comparison of Summed Knee and Hip Muscle Activation Integrals of the Stance and Swing Legs in the Low Lumbar Flexion/Extension Subject Table 16: Comparison of Summed Knee and Hip Muscle Activation Integrals of the Stance and Swing Legs in the High Lumbar Flexion/Extension Subject Table 17: The Low Stride Length Subject s Hip Abductor Results Table 18: The High Stride Length Subject s Hip Abductor Results Table 19: The Low Lumbar Rotation Subject s Hip Abductor Results Table 20: The High Lumbar Rotation Subject s Hip Abductor Results Table 21: The Low Lumbar Flexion/Extension Subject s Hip Abductor Results Table 22: The High Lumbar Flexion/Extension Subject s Hip Abductor Results Table 23: Comparison of the Uncapped Core Activation Integrals of the Ten Core Muscles Table 24: Assessment of the Validity of the Low Lumbar Flexion/Extension Subject s Simulations Table 25: Assessment of the Validity of the High Lumbar Flexion/Extension Subject s Simulations Table 26: Assessment of the Validity of the Low Lumbar Rotation Subject s Simulations Table 27: Assessment of the Validity of the High Lumbar Rotation Subject s Simulations xi
13 Table 28: Assessment of the Validity of the Low Stride Length Subject s Simulations.. 62 Table 29: Assessment of the Validity of the High Stride Length Subject s Simulations. 63 Table 30: Scaling and Inverse Kinematics Errors Table 31: Evaluation of Core Constraint Results Table 32: Thesis Objectives and Outcomes Table 33: Low Stride Length Subject's Scaling Ratios Table 34: High Stride Length Subject's Scaling Ratios Table 35: Low Lumbar Rotation Subject's Scaling Ratios Table 36: High Lumbar Rotation Subject's Scaling Ratios Table 37: Low Lumbar Flexion/Extension Subject's Scaling Ratios Table 38: High Lumbar Flexion/Extension Subject's Scaling Ratios Table 39: The Low Stride Length Subject's Numerical Knee Joint Reaction Loads Table 40: The High Stride Length Subject's Numerical Knee Joint Reaction Loads Table 41: The Low Lumbar Rotation Subject's Numerical Knee Joint Reaction Loads 111 Table 42: The High Lumbar Rotation Subject's Numerical Knee Joint Reaction Loads 112 Table 43: The Low Lumbar Flexion/Extension Subject's Numerical Knee Joint Reaction Loads Table 44: The High Lumbar Flexion/Extension Subject's Numerical Knee Joint Reaction Loads xii
14 List of Figures Figure 1: Force Diagram of Patellofemoral Contact and Surrounding Area. Reproduced from Scott & Winter [4]... 4 Figure 2: Illustration of Iliotibial Band and Lateral Femoral Epicondyle Contact during Knee Flexion. Reproduced from Whiting & Zernicke [17]... 6 Figure 3: Core Musculature on OpenSim Model... 9 Figure 4: Marker Set on Subject [41] Figure 5: Marker Set on OpenSim Model Figure 6: Workflow of OpenSim Pipeline Figure 7: OpenSim Model with Global Axes Figure 8: Example of Suggested Body Segment Mass Changes, Output after RRA Figure 9: Result of Accumulating Errors In Forward Dynamics Figure 10: Possible Outcomes of Limiting Core Muscle Activation Figure 11: Conceptual Illustration of Core Constraint Analogy Figure 12: Graphical Representation of Core Constraining Process Figure 13: Example of "Grades" for Assessing Core Constraint Success Figure 14: Definition of Moment Directions Figure 15: Overlaid Models, One Following Motion Used during CMC and One Following Motion Generated by Forward Dynamic Simulations xiii
15 Figure 16: Forward Dynamic Generated Motion Errors Figure 17: Exterior Rotation Angular Impulse on Tibia Figure 18: Peak Downward Axial Force on Tibia Figure 19: Peak Abduction Moment on Tibia Figure 20: Abduction Angular Impulse on Tibia Figure 21: Adduction Angular Impulse on Tibia Figure 22: Peak Posterior Force on Tibia Figure 23: Comparison of Summed Knee and Hip Muscle Activation Integrals of the Stance and Swing Legs Over a Single Stance Phase Figure 24: Summed Hip Muscle Activation Integrals Figure 25: Comparison of Uncapped Core Activation Integrals of the Ten Core Muscles in the Stride Length Pair Figure 26: Comparison of Uncapped Core Activation Integrals of the Ten Core Muscles in the Lumbar Rotation Pair Figure 27: Comparison of Uncapped Core Activation Integrals of the Ten Core Muscles in the Lumbar Flexion/Extension Pair Figure 28: Comparison of the Sum of Uncapped Core Activation Integrals of the Ten Core Muscles Figure 29: Definitions of Lumbar Degrees of Freedom Figure 30: The Low Stride Length Subject's Lumbar Reserve Moments Figure 31: The High Stride Length Subject's Lumbar Reserve Moments Figure 32: The Low Lumbar Rotations Subject's Lumbar Reserve Moments xiv
16 Figure 33: The High Lumbar Rotations Subject's Lumbar Reserve Moments Figure 34: The Low Lumbar Flexion/Extension Subject's Lumbar Reserve Moments Figure 35: The High Lumbar Flexion/Extension Subject's Lumbar Reserve Moments Figure 36: Peak Anterior Force on Tibia Figure 37: Anterior Impulse on Tibia Figure 38: Peak Posterior Force on Tibia Figure 39: Posterior Impulse on Tibia Figure 40: Peak Downward Force on Tibia Figure 41: Peak Downward Impulse on Tibia Figure 42: Peak Medial Force on Tibia Figure 43: Medial Impulse on Tibia Figure 44: Peak Adduction Moment on Tibia Figure 45: Adduction Angular Impulse on Tibia Figure 46: Peak Abduction Moment on Tibia Figure 47: Abduction Angular Impulse on Tibia Figure 48: Peak Interior Rotation Moment on Tibia Figure 49: Interior Rotation Angular Impulse on Tibia Figure 50: Peak Exterior Rotation Moment on Tibia Figure 51: Exterior Rotation Angular Impulse on Tibia Figure 52: Peak Extension Moment on Tibia Figure 53: Extension Angular Impulse on Tibia Figure 54: The Low Stride Length Subject's Knee Joint Reaction Loads xv
17 Figure 55: The High Stride Length Subject's Knee Joint Reaction Loads Figure 56: The Low Lumbar Rotation Subject's Knee Joint Reaction Loads Figure 57: The High Lumbar Rotation Subject's Knee Joint Reaction Loads Figure 58: The Low Lumbar Flexion/Extension Subject's Knee Joint Reaction Loads. 107 Figure 59: The High Lumbar Flexion/Extension Subject's Knee Joint Reaction Loads 108 Figure 60: Stride Length Subjects Unconstrained Iliacus Activation Comparisons Figure 61: Stride Length Subjects Unconstrained Psoas Activation Comparisons Figure 62: Stride Length Subjects Unconstrained Erector Spinae Activation Comparisons Figure 63: Stride Length Subjects Unconstrained Interior Oblique Activation Comparisons Figure 64: Stride Length Subjects Unconstrained Exterior Oblique Activation Comparisons Figure 65: Lumbar Rotation Subjects Unconstrained Iliacus Activation Comparisons 118 Figure 66: Lumbar Rotation Subjects Unconstrained Psoas Activation Comparisons. 118 Figure 67: Lumbar Rotation Subjects Unconstrained Erector Spinae Activation Comparisons Figure 68: Lumbar Rotation Subjects Unconstrained Interior Oblique Activation Comparisons Figure 69: Lumbar Rotation Subjects Unconstrained Exterior Oblique Activation Comparisons xvi
18 Figure 70: Lumbar Flexion/Extension Subjects Unconstrained Iliacus Activation Comparisons Figure 71: Lumbar Flexion/Extension Subjects Unconstrained Psoas Activation Comparisons Figure 72: Lumbar Flexion/Extension Subjects Unconstrained Erector Spinae Activation Comparisons Figure 73: Lumbar Flexion/Extension Subjects Unconstrained Interior Oblique Activation Comparisons Figure 74: Lumbar Flexion/Extension Subjects Unconstrained Exterior Oblique Activation Comparisons Figure 75: The Low Stride Length Subject's Core Muscle Activations, All Simulations Figure 76: The High Stride Length Subject's Core Muscle Activations, All Simulations Figure 77: The Low Lumbar Rotation Subject's Core Muscle Activations, All Simulations Figure 78: The High Lumbar Rotation Subject's Core Muscle Activations, All Simulations Figure 79: The Low Lumbar Flexion/Extension Subject's Core Muscle Activations, All Simulations Figure 80: The High Lumbar Flexion/Extension Subject's Core Muscle Activations, All Simulations xvii
19 Chapter 1: Introduction 1.1 Running Activity and Injury Background and Statistics Whether it was to increase personal fitness, relieve stress, pursue competition, or to belong to a tight knit community, in 2011 nearly 28 million Americans, approximately 9% of the population, ran once per week throughout the year. [1,2] Furthermore, interest appears to be growing, as the number of U.S. race finishers increased by 80% from 2000 to 2012, including an 11.2% increase from 1.6 million to 1.8 million between 2011 and 2012 [3]. During running, each step can cause forces as high as 7.6 times the subject s body weight in the knee. [4] Repeated loads of that intensity often lead to overuse injuries in the lower extremities. Table 1 summarizes the literature about injury rates, showing that between 37% and 65% of runners experience some type of running injury if they continue running for an extended period of time. [5-12]. Out of those overuse injuries; approximately 18% to 42% are located within the knee. [5-7,9-14]. There is a relatively wide range of results between these studies because many variables have an effect on running injury, such as mileage, experience, and previous injury. [6,7,13] One common type of overuse knee injury is known as patellofemoral pain syndrome (PFPS). According to the literature, between 5.4% and 16.63% of all overuse running injuries and 20.7% and 42.8% of knee overuse injuries are cases of PFPS. [7,13-1
20 15]. This is very painful injury which can cause runners to miss an extended amount of time, as only 28.6% to 77% of runners who experience PFPS are symptom free a year after the injury first occurred. [13,15] Another common knee injury in runners is iliotibial band syndrome (ITBS). Between 2.56% and 8.39% of all overuse running injuries and 14.29% to 19.95% of knee overuse injuries are caused by ITBS [7,14,16] Table 1: Overview of Running Injury Literature Although many of the injuries this thesis will focus on are located in the knee, it is important to remember that there are other common lower extremity overuse injuries linked to running. One such overuse injury worth mentioning is tibial stress fracture, which occurred in 3.34% of runners according to Taunton et al. [14] 2
21 Because of the large, increasing, population of runners, and the high percentage of injuries attributed to running, it is important we understand what causes, and how to best prevent, these injuries. 1.2 Mechanisms of Common Overuse Running Injury In order to minimize the risk of injuries such as PFPS and ITBS, the biomechanical causes for these injuries must first be understood. There are several physical constraints which makes observing the causes of these injuries difficult. First, it is challenging to measure some internal loadings, such as patellofemoral contact area or stress, directly. To address this problem, simulations can be run to estimate internal loadings which cannot be measured in vivo. Alternatively, experiments can be designed to identify more easily measured biomechanical parameters that are statistically linked to common running injuries. The connection between the results of this type of study and the injury may be less obvious, and requires more background in knee injury mechanisms. The patella serves a very important purpose during knee extension; it displaces the tendon line of action away from the joint. This increases the moment arm of the muscle force, allowing the quadriceps to create a greater torque for a given amount of muscle force. [17] However, as shown in Figure 1, because the patella acts as a fulcrum between the quadriceps tensile force (F q ) and the patellar tendon tensile force (F pt ) it is pulled back against the femur, resulting in a compressive patellofemoral force (F pf ). [4] As the knee 3
22 bends, the patella moves along the anterior surface of the femur s distal end. At full extension, the patella sits relatively high on the femur, slightly above the distal end. As the knee flexes, the patella moves downward and, ideally, slides into the intercondylar groove. This process is called patellar tracking. [17] Figure 1: Force Diagram of Patellofemoral Contact and Surrounding Area. Reproduced from Scott & Winter [4] Scott & Winter calculated patellofemoral force can be as high as 7.6 times body weight. [4] Stress increases with increasing force and decreasing contact area. The contact area between the patella and femur changes as the patella moves in relation to the femur. [18] If the patella deviates from the ideal tracking pattern, contact area may decrease, which would increase patellofemoral stress. Many studies agree that patellar maltracking is one of the key causes of PFPS, but the reason why the patella may not track correctly is less clear. One common suggestion is that maltracking is caused by an 4
23 imbalance between the quadriceps force and patellar tendon force. [4,17] Another theory is that anatomical features such as intercondylar groove shape, or an abnormally high starting position of the patella might decrease contact area between the femur and patella, thus increasing stress. [17,19] A third suggestion is that high loads or abnormal kinematics may affect patellar tracking. In 2006, Stefanyshyn reported that abduction impulse was significantly higher (p =.026) in subjects with PFPS, [20] while in 1997 Nadeau reported no major changes in knee loadings such as moments and impulses. [21] In 2008, Besier found high levels of knee rotation within the transverse plane are significantly linked to PFPS, possibly meaning that the femur twisting out of position affected the path of the patella. [22] The injury mechanism for ITBS is a little clearer, though still not completely agreed upon. Figure 2 shows one possible interaction between the IT band and the lateral femoral epicondyle during knee flexion. As the knee flexes, the IT band passes over the lateral femoral epicondyle, creating friction between the two surfaces. [17] Fairclough et al. contends that the IT band is not a discrete structure, but rather a thickened part of the fascia lata which envelops the thigh. Also, the IT band is connected to the femur, including the epicondyle, by coarse fibrous bands. Therefore, the perception of movement across the IT band is an illusion because of changing tension in its anterior and posterior fibers, and no frictional force is present. Fairclough et al. suggests that ITBS is caused by compression of a loose layer of fat and connective tissue, rather than by friction between the epicondyle and IT band. [23] 5

24 Figure 2: Illustration of Iliotibial Band and Lateral Femoral Epicondyle Contact during Knee Flexion. Reproduced from Whiting & Zernicke [17] Figure 2 shows that if the tibia were to rotate inwards, or if the hip or knee were to be at a greater adduction angle, the IT band would be pulled tighter against the epicondyle, creating more friction, or compression of connective tissue. Several studies have found evidence that these kinematic attributes likely play a role in ITBS. [24-26] Regardless of whether the mechanism of ITBS is caused by friction or compression of connective tissues, these kinematic phenomena magnify the effect of the potential cause. Fredericson et al., in a study featuring twenty four subjects with ITBS, showed that hip abductor torque was significantly lower in the injured limb. After six weeks of rehabilitation on the injured limb, strength increased significantly for most subjects, and twenty two of the twenty four were pain free, providing more evidence between hip abductor weakness and ITBS. [27] This agrees with Noehren et al. s study which showed 6
25 hip adduction angle is a predictor for ITBS [26], as someone with weak hip abductors may experience more hip adduction during running. Another study, by Farrell et al., showed that ITBS is still prevalent among cyclists despite the foot to pedal contact being only 18% of typical running ground reaction forces. [28] This evidence suggests ITBS is due to the repeated friction, or compressive forces, experienced from continually entering and exiting the impingement zone (at about 30⁰ knee flexion), rather than because of specific knee loadings. Tibial stress fractures are much easier to conceptualize. According to Wolfe s law, bones continually adapt by remodeling. Resorption of bone occurs in areas of bone experiencing low loads, and reinforcement of bone occurs in areas where it is needed because of higher loads. However, if a bone experiences a loading pattern so frequent or high in magnitude that it is unable to adapt at the needed rate, such as when someone abruptly starts running longer distances, the bone can experience a chronic fracture. [17] In the tibia, high magnitude loading usually is a result of axial force during stance phase. Milner et al. found evidence that tibial acceleration values, which are related to vertical loading, [29] were able to predict stress fractures 70% of the time. [30] This agrees with Messier et al, who claimed increased axial force in the tibia during running correlates with more frequent lower extremity overuse injuries. [31] 1.3 The Core and its Relation to Running Several recent studies have shown evidence of the core s importance during athletic activity, both to optimize performance and to prevent injuries. [32-34] However, 7
26 there is little is in the literature about the core s role during jogging, specifically. Sato et al. tested a cohort which underwent core strength conditioning against a control group and found that the athletes who underwent core strength conditioning performed better in a 5,000 meter race. However, that same study attempted to find some evidence of a change in lower extremity stability or loading, and found no difference from the control group. [35] Before proceeding with this thesis, it is important to define the core for the purposes of this study. There is no consistent definition on what muscles constitute the core. Typically, the abdominal and lower back muscles are included in the muscle grouping. Hip muscles are more controversial, with some studies ruling them out [32] and other studies including them. [33,36] Usually, the function of the core is primarily to stabilize the trunk and pelvis, in order to allow the distal extremities to perform more precise movements. For the model in this study, it was decided that the lumbar spinae, internal obliques, and external obliques were primarily responsible for stabilizing the torso body segment. The psoai and iliaci were identified as the muscles primarily responsible for the stability of the pelvis in the sagittal plane. Therefore, as Figure 3 shows on the OpenSim model, the definition of the core musculature for this study included the erector spinae, interior and exterior obliques, psoai, and iliaci. 8
 are not present.")
27 Figure 3: Core Musculature on OpenSim Model It is important to acknowledge that this is a simplified musculature of the core, and several muscles (rectus abdominis, transversus abdominis, and quadratus lumborum) are not present. Though a better represented core musculature would certainly be an area of improvement for future studies, this model was still useful for the exploratory nature of this thesis. 1.4 OpenSim Capabilities The OpenSim program allowed me to approach the question of What would happen if I reduced core muscle activation during running? in a way that would not otherwise be possible. OpenSim is a freely available software system which allows the user to build musculoskeletal models and create dynamic simulations. This allows for the 9
28 analysis of movement and performance while also calculating internal variables, such as muscle activation, which cannot be easily measured. [37,38] A simulation study by Hamner et al., who developed the model adapted for this study, validated the program s ability to recreate muscle activation patterns similar to the subject s recorded EMG for running trials. [39] This study utilizes OpenSim s capabilities to constrain muscle activation, similar to the way Thompson et al. did in a simulation of quadriceps activation failure. [40] OpenSim also allowed this study to investigate how lower extremity muscle activation and joint loading could change based on constrained core muscle activation patterns, which is very difficult to simulate in a laboratory environment. Another objective of this study was to establish the feasibility of creating forward dynamic simulations of running to enable future simulation-based running research. To our knowledge, forward dynamic simulations of running have not been previously generated. The ability to generate forward dynamic simulations would allow future studies to investigate how kinematics and kinetics change as perturbations or muscle activations are applied. For this study, no constraints were placed on core activation during forward dynamics, specifically. The tool was simply used to generate muscle driven simulations of previously calculated motions, to validate the feasibility of using the tool in future running studies. 10
29 1.5 Focus of Thesis This thesis had three objectives, which are summarized in Table 2. The first was to investigate how decreasing core activation during running would affect knee loading and lower extremity muscle activation. The second was to observe how different running kinematic styles are affected by decreased core activation, using representative subject specific motion capture data. The third was to establish the feasibility of creating forward dynamic simulations of running to enable future simulation-based running research. Table 2: Objectives of Thesis Representative running trials from six subjects, each of whom represents a kinematic style of running (high and low normalized stride length, lumbar rotation range, and lumbar flexion/extension range) were simulated in OpenSim. Decreased core 11
30 activation during running was simulated by constraining maximum core muscle activation over specific time intervals. After generating the constrained simulations, the core musculature s effects on knee loading and lower extremity muscle activations were analyzed. Ideally, my findings will provide targets for additional biomechanical investigation of running injuries and a new simulation tool for performing these investigations. 1.6 Significance of Research Running is a large and growing activity that 28 million Americans participate in at least once a week. Although there are many healthy benefits to running, there is also a significant risk of painful chronic injuries, with 37% - 65% of most habitual runners experiencing an overuse injury annually. Painful injuries like PFPS, ITBS, and tibial stress fractures occur frequently, yet there is still much left to be known about their respective injury mechanisms. Core stability has been shown to have an effect on knee loadings during athletic activities, yet there is little in the literature addressing the core s effect on the lower extremity during running, specifically. Although this project has several important limitations to acknowledge when considering its results (discussed in Chapter 5), it nevertheless provides several novel insights into how core activation, or lack thereof, affects knee loading and lower extremity muscle activation. This study intends to establish the feasibility of generating forward dynamic simulations, a potentially useful tool, during running. This thesis also aims to identify trends which will provide targets for additional biomechanical 12
31 investigation, which will hopefully lead to a reduction in frequent, painful, chronic injuries to runners in the future. 1.7 Overview of Thesis This thesis contains four ensuing chapters. Chapter 2 describes the procedure used, both for running the complete simulation pipeline, and for analyzing the results of those simulations. Chapter 3 summarizes the important results found in this study, namely knee loads, lower extremity muscle activation, uncapped core muscle activation comparisons, and evaluation of the validity of the simulations. Chapter 4 discusses the results presented in Chapter 3. Chapter 5 outlines limitations and possible improvements for future studies, as well as summarizes and concludes the document. To enable future studies expanding upon this one, I have included several appendices located at the end of the document to provide the reader more context, if desired, without interrupting the flow of the text. 13
32 Chapter 2: Methods 2.1 Experimental Data Collection This project utilized previously collected data from a large scale study done in the movement analysis and performance lab at The Ohio State University. The original study contained forty-six subjects (23M, 23F; height = 1.75 ±.98m; mass = 70.9 ±12.5kg; age = 22.9 ± 4.2 years), a convenience sample from the university and surrounding community, none of which had any previous history of serious lower extremity injury (ligament, meniscus, tendon, or muscle tear), abdominal hernia, lower extremity surgery, or abdominal surgery. Persons with a BMI greater than 30 were also excluded due to excessive soft tissue artifacts. Subjects self-reported an average of three exercise sessions per week for the three months preceding testing. [41] Marker data was collected at 300 Hz using eight Vicon MX-F40 cameras (Vicon; Oxford, UK) and filtered using Woltring filter with generalized cross-validation (GCV) [42]. Ground reaction forces were sampled at 300 Hz (to match the marker data) from two Bertec force plates (Bertec Corp; Columbus, OH). Lower body Point- Cluster marker set [43] and upper body Plug-In Gait marker set [44] were used, and are shown in Figure 4 and Figure 5 (in OpenSim). 14


33 Figure 4: Marker Set on Subject [41] Figure 5: Marker Set on OpenSim Model 15
34 The subjects were asked to perform several physical activities as part of the original study. One of the physical activities performed was jogging at a self selected speed in a straight line across three force plates. These jogging trials were examined for this OpenSim study. From the forty-six subjects used in the original study, fourteen were deemed acceptable for converting into a format useable in OpenSim. The other thirty-two subjects all either had large gaps in marker data, lacked clean foot strikes on force plates, or were not yet fully processed at the time of data selection. One of the objectives of this study was to observe different kinematic styles of running gait, and how each of those styles are affected by decreasing core muscle activation. The three kinematic styles this study investigated were: lumbar flexion/extension range, lumbar rotation range, and stride length normalized by height. From the fourteen subjects with useable data trials, the subject with either the maximum or minimum value in each of the three categories was chosen as a representative subject. The six subjects that were chosen and used for OpenSim simulations are shown with their kinematic data in Table 3 and with their physical characteristics in Table 4. 16

 using the gaitextract toolbox developed by Tim Dorn [45] with slight modifications to")
35 Table 3: Kinematic Data of Selected Subjects Table 4: Sex, Height, and Mass of Selected Subjects 2.2 Simulation Procedure, Prior to Constraining Muscles Each subject s Vicon Nexus data (.c3d files) were converted into various files useable in OpenSim (.trc files,.xml files, and.mot files) using the gaitextract toolbox developed by Tim Dorn [45] with slight modifications to allow for the point cluster 17
36 marker set used in our lab, and the full body Hamner OpenSim model. The Hamner model for running [39] was used and modified to have the marker formation used during data capture, so the model and motion capture data could be matched to fit. After the model was updated and all data was converted to a useable format, the OpenSim pipeline used in this study (shown in Figure 6) was followed for each subject. Figure 6: Workflow of OpenSim Pipeline The first step in the simulation process is scaling the OpenSim model so each body segment is approximately the same size, proportion, and mass as the corresponding 18
37 part of the subject s body. Static calibration motion capture data files were used as a reference to scale the generic OpenSim models. Measurement sets were created to assign which anatomical markers would define each body segment s dimensions in each of the three planes. This was done by first defining pairs of points in the OpenSim GUI to be used for scaling. The distance between the pair of points, in the designated plane, was calculated from the motion capture data, and compared to the distance between the same pair of virtual markers on the generic, un-scaled, OpenSim model. Ratios of the distance between the specified motion capture markers and the markers on the generic model were made. These ratios were used to scale each body segment in the corresponding plane. If multiple pairs of markers were used to define a body segment in a plane, the ratios of each pair were averaged, and the average ratio was used to scale the segment. The measurement sets used in this study are summarized in Table 5, and an example of a subject s scaling ratios can be seen in Table 6. The scaling ratios for all subjects can be found in Appendix A. 19

38 Table 5: Measurement Sets Used During Scaling Table 6: Example of Scaling Ratios 20

39 Each marker was also given a weight to prioritize important anatomical landmarks. The higher the weight of a marker, the more it is fixed to its position relative to the body segment it is assigned to. The lower the weight of a marker, the more it is able to be moved in relation to the body segment without affecting the size and shape of the segment. The marker weights used for this study are summarized in Table 7. Table 7: Marker Weights Used During Scaling 21
40 A new, scaled, OpenSim model file was output upon successful completion of the scaling step. This file was utilized in later steps of the procedure, and the generic model was no longer needed. After the subject specific models were scaled, the inverse kinematics (IK) tool was used to generate body segment motion based on motion capture marker data. Since the body segments were now scaled to the subject s marker orientation, a position of best fit could be calculated in OpenSim to find the model s position and joint angles for each frame of the motion capture data. A perfect fit is not realistically attainable, as markers move in relation to the body segments due to soft tissue artifact. Because of this, markers must again be prioritized using a weighting system. A summary of the marker weights I used can be seen in Table 8. Comparing Table 8 to Table 7 (the marker weights used for scaling), one can see that the mesh markers on the lower extremities were given a much higher weight during inverse kinematics. This is because the mesh markers are not anatomical landmarks and should not be given priority when scaling. However, when tracking motion in IK the mesh markers are very effective, and help to reduce the error caused by soft tissue artifact. Lathrop et al. showed that the choice to use the mesh rather than the resulting vectors is acceptable. [46] The medial markers were removed on the knee and ankle, because medial lower extremity markers would often become unattached due to contact with the opposite leg during dynamic testing. 22

41 Table 8: Marker Weights Used During Inverse Kinematics From inverse kinematics, OpenSim generates a motion file which gives the joint angles throughout the trial that best fit the model s virtual markers to the experimental markers from data collection. This file and the model file from scaling were used as inputs for future steps in the simulation process. The raw motion capture marker data was not used in future steps. After the model s motion has been calculated, kinetics are introduced into the equation. Measured ground reaction forces are taken from experimental force plate data, and the model s force output against the ground is calculated in OpenSim, based on the model s mass and movement. Ideally, these values should be equivalent, but inevitably 23
42 errors exist in the segment masses and kinematics. Errors exist in body segment mass properties because each segment s proportion of the total body weight is estimated in OpenSim, resulting in errors. Kinematic errors exist because the OpenSim model cannot move in the exact same way the subject s body can. Limitations such as a stiff torso segment and lack of degrees of freedom in certain joints contribute to errors in kinematics, and will be discussed further later in the report. These errors in segment mass and kinematics result in an inequality between measured and calculated kinetics. Essentially, the force OpenSim calculates the foot is outputting on the ground does not equal the normal ground reaction force measured by the force plates. OpenSim calculates and applies external forces and moments which act on the pelvis on or about each axis, in order to balance the equation. For clarity, the OpenSim axis orientation is shown in Figure 7. The residual reduction algorithm (RRA) tool makes slight changes to the body segments masses and sizes within the model and to the joint angles defined in the motion file to minimize residual forces. Ideally, these residual forces would be as low as possible, as they are not representative of anything that is happening in reality, which is why a step is needed to reduce them. 24

43 Figure 7: OpenSim Model with Global Axes Two iterations of RRA were run for each subject. The first iteration makes slight changes to the model and motion, and outputs suggestions for more drastic mass changes to be done to the model manually between iterations. An example of suggested mass changes can be seen in Figure 8. The suggested changes were made manually using OpenSim s body segment editor and RRA was run again. The new model and motion, now optimized to reduce residual forces as much as possible, were used in future steps. 25
 tool.")
44 Figure 8: Example of Suggested Body Segment Mass Changes, Output after RRA The next step in the simulation process is to calculate a muscle activation pattern using OpenSim s computed muscle control (CMC) tool. CMC computes a muscle activation pattern which would allow the model s muscles to drive the body segments in the desired motion, while optimally minimizing the sum of all muscle activations squared. [47] Unlike static optimization, CMC also takes muscle activation and 26
![contraction dynamics into account. [48] The model s musculature cannot always activate in a way that perfectly simulates the force needed for certain join movements.](/docs-images/89/99989448/images/45-0.jpg "As a result, reserve moments, which are external moments applied to each joint, are added during this step. Like residual forces, reserve moments should be minimized.")
45 contraction dynamics into account. [48] The model s musculature cannot always activate in a way that perfectly simulates the force needed for certain join movements. As a result, reserve moments, which are external moments applied to each joint, are added during this step. Like residual forces, reserve moments should be minimized. The most important output of this step was each subject s calculated muscle activation pattern. This pattern is output in a states file, and was used in future steps. The final step in the simulation procedure is called forward dynamics (FD). In this step, rather than calculating a muscle activation pattern from an input motion, OpenSim calculates a motion based on an input muscle activation pattern (output from CMC) and externally applied forces and moments (gravity, ground reaction forces, residual forces, and reserve moments). In other words, the body segments in the model are being driven by the force generated by the model s muscles, rather than a preset motion file. When the simulation is being guided by muscle forces acting on the body segments, and not by a preset motion file, errors can accumulate and lead to incorrect results, as shown in Figure 9. Figure 9: Result of Accumulating Errors In Forward Dynamics 27
46 As stated in the objectives, this study aimed to successfully generate forward dynamic simulations, which, to our knowledge, has not been done previously, in order to validate the tool s feasibility with running trials. In order to successfully generate forward dynamic simulations, many iterations of the previous steps in the pipeline were run to adjust variables with the goal of reducing residual forces and reserve moments. Subject selection, marker locations, scaling marker weights, measurement set definitions, IK marker weights, RRA constraints, CMC constraints, trial length, and the chosen forward dynamic analyses all were adjusted to improve forward dynamic simulations. Joint reaction loads, output from forward dynamics, allowed for kinetic analysis of the knee in the six subjects, as core activation was changed. 2.3 Constraining Core Muscle Activations After each subject was run through the OpenSim simulation procedure, the results of the subject s ten core muscles (left and right erector spinae, psoas, iliacus, internal oblique, and external oblique) activation levels, output from the CMC step, were reviewed. Code was created to constrain those muscles activation levels to 80% and 60% of their initial results. The CMC and FD steps were simulated again, with the new code constraining muscle activation, to investigate how decreased core activation would affect the rest of the simulation s outputs. Unfortunately, in OpenSim there is not currently a way to input and lock a muscle s activation pattern. Ideally, it would be possible to input a specific muscle s activation pattern in CMC, and solve for the rest of the model s muscle activation pattern, 28
47 given the locked inputs. Instead, the user can only input maximum and minimum values for a given muscle over certain time frames within a script known as the constraint file. This lack of control leads to a cumbersome process of attempting to limit certain peaks in activation, without having much control of how the model will account for it. There were three potential ways the simulation would compensate for constrained muscle activation (summarized in Figure 10): the required coping force would be generated by external reserve moments, the core muscle being capped would have higher activation levels in areas that were previously low and thus uncapped, or the lower extremity muscles and joints would change their activation or loads picking up the slack of the constrained core muscles. The first outcome was not desired, because reserve moments are not representative of a real physical force. The second outcome was not ideal, as it undermines the stated objective of constraining core activation levels by simply shifting when the core activates, rather than lowering overall activation. The third outcome was desired, as it represented what the body may do to compensate for reduced core activation. 29
48 Figure 10: Possible Outcomes of Limiting Core Muscle Activation Initially, peaks in activation level were identified from the unconstrained CMC output, and values at 80% and 60% of the peak activation level were calculated. Time intervals were set to begin when the activation levels crossed above the 60% threshold and end when they crossed below it, or if a clear new peak had begun. A modification to this procedure became necessary as I observed many new peaks in activation being simulated between the original, and now capped, activation peaks. The first adaptation was to extend each capped time interval so that they were touching and at no point was a specific muscle s activation completely unconstrained. The midpoint was found between each start and end time, and that midpoint was used as both the end time for the previous maximum value constraint, and the start time for the ensuing maximum value constraint. 30
49 This alteration to the procedure reduced the magnitude of the problem, but still allowed for peaks to emerge in areas that previously had very low muscle activation, up to the now capped level of the corresponding peak. For example: if a peak of 0.5 activation level was capped to 0.4, and there was a large area preceding the peak hovering around 0.1 activation level, a new peak could emerge in the 0.1 area up to the level of 0.4. The only way to eliminate these peaks was to locate them, and manually insert constraints to limit activation to the level it was previously simulated to be. However, problems still persisted. Many times, code would be created to constrain a certain peak before an iteration of CMC, only to have a new peak, outside of the constrained area, appear in the output. An analogy could be made which compares constraining this under defined core musculature to plugging a leaky wall with your finger; many times plugging one leak would result in another appearing somewhere else, as demonstrated in Figure

50 Figure 11: Conceptual Illustration of Core Constraint Analogy After many iterations of constraining, some simulation results began to ignore the constraint commands in the code. This likely meant that the musculature had reached a point where it was over constrained and couldn t achieve the needed force levels within the given parameters. Figure 12 shows the procedure for constraining the core graphically, along with examples of the process working correctly (lower left), and core constraint code being ignored (lower right). 32
51 Figure 12: Graphical Representation of Core Constraining Process Each of the six subjects ten core muscle activations were evaluated, to assess how well the muscle s original calculated activation was capped during the ensuing two simulations. Each muscle s constraint results were evaluated and quantitatively rated from 1-4, with 4 being the best. Points were deducted whenever one of the constrained muscle activations activated more than the unconstrained muscle. Point deductions were based upon: number and height of peaks outside of the capped maximum value, time interval spent outside of the capped maximum value, and total muscle activation level 33
52 during the time which errors occurred. Examples of a 4, 3, 2, and 1 can be seen in Figure 13. After the plots were evaluated, each subject s scores were averaged, to allow for evaluation of core constraint success. Figure 13: Example of "Grades" for Assessing Core Constraint Success Once core activation had been sufficiently constrained within the code, the final two steps of the pipeline (CMC and FD) were rerun with core muscle activation capped 34
53 at approximately 80% and 60% of the former peak activation levels inside the final control constraint files. 2.4 Analyses of Results To satisfy the first objective, this study closely investigated knee loading during stance phase. Peak forces of the knee acting on the tibia in four of the six directions (no peak upward or lateral forces) and peak moments in every plane and direction, excluding flexion, were found and compared. Using the trapezoidal rule for numerical integration, the impulse of each force and angular impulse of each moment were also calculated. This yielded eighteen numerical values of interest within the knee for each of the six subjects. Results were compiled into bar graphs with three grouping variables (100%, 80%, and 60% core activation levels), allowing the reader to compare kinematic styles and core activation levels simultaneously in each of the eighteen areas of interest. This study also aimed to observe lower extremity muscle activation in the hip and knee muscle groups. Again, utilizing the trapezoidal method for numerical integration, I summed muscle activation over time for the thirty one muscles in the hip and knee muscle groups defined in OpenSim, for both the stance and swing leg. Data was organized in bar graphs with two grouping variables (stance and swing leg) for visual comparison. Because of Fredericson et al. s results linking hip abductor strength is to ITBS [27], the exact same procedure was followed again, this time focusing only on the muscles in OpenSim s hip abductor muscle group. 35

54 This study also compares uncapped core activation levels in opposite kinematic running styles. The trapezoidal method was used to numerically integrate activation over time, for each of the ten core muscles, so the data could be quantified and compared. It is important to evaluate the validity of OpenSim simulations by observing the magnitude of the externally applied forces and moments. Residual forces/moments, reserve moments, and positional errors were compared to SimTK standards, which outlined on their website, and shown in Tables 9 and 10. [49] Table 9: SimTK Thresholds for Evaluating RRA Results. Reproduced from SimTK Website [49] 36

55 Table 10: SimTK Thresholds for Evaluating CMC Results. Reproduced from SimTK Website [49] A MATLAB code was created to plot all of the above criteria, along with lines indicating the threshold limits for each category. This allowed for quick analysis of results which were then compiled into tables and evaluated. Although the figures above only indicate three levels of simulation success, I added a fourth, which I called a soft fail, which has a maximum threshold 10% above the maximum okay threshold. This was added to allow for a better conceptualization of how badly some categories were failing, and as a soft allowance for the fact that running trials would have larger simulation errors than walking trials. 37

56 Chapter 3: Results This chapter will present results deemed pertinent for discussion concerning the study s three objectives. The remaining data will be organized in the appendices, to provide context for future studies to expand upon my results. All reported forces, moments, and angular impulses are internal, and can be conceptualized as the knee acting on the tibia, as shown in Figure 14. Figure 14: Definition of Moment Directions 3.1 Assessment of Forward Dynamic Simulations Though validating the feasibility of forward dynamics is this study's third stated objective, the corresponding results will be presented first, because many of the results 38

57 related to the first two stated objectives were generated from this simulation tool. A forward dynamic simulation was generated for each subject at each level of core muscle activation. Those eighteen simulations were visually confirmed to match the corresponding previously calculated motion. The motion generated from forward dynamic simulations and the motion used during CMC simulations were observed at the same time, on identical models overlaid on top of one another. Figure 15 shows frames from the motion comparison, and it can be seen that the two follow very similar motions, as desired. Figure 16 (which zooms in on certain segments and highlight the CMC motion model in red) shows that there were some small differences between forward dynamic generated motion and the previously calculated motion. Overall, the motion generated by the forward dynamic tool closely followed the motion derived from experimental data. This validated the feasibility of using forward dynamics in future studies, and achieved one of this study s main objectives. Figure 15: Overlaid Models, One Following Motion Used during CMC and One Following Motion Generated by Forward Dynamic Simulations 39

58 Figure 16: Forward Dynamic Generated Motion Errors 3.2 Knee Loading Results The first objective of this study was to observe how core activation affects knee loading and lower extremity muscle activation during jogging. Focusing specifically at the stance leg s knee loading results, there were several interesting changes observed in this study. All of the knee loading results are shown in totality in the appendices. Appendix B contains bar graphs of all knee loadings that were investigated, 40
59 Appendix C contains line graphs of raw data output from OpenSim for each loading in the knee, and Appendix D contains tables summarizing numerical knee loading results for all six subjects. The highlights of those appendices will be shown in this subsection. The external rotation angular impulse results, which can be seen in Figure 17, are worth discussing. Five of the six subjects, excluding only the low stride length subject, experienced an increase in exterior rotation angular impulse when core activation was decreased to approximately 80%. The average angular impulse of all six subjects was 0.16 ± 0.07 Nm*s when the core was uncapped and 0.18 ± 0.09 Nm*s when the core was limited to approximately 80% activation, an 11.43% increase. When core activation was decreased further, three of the five subjects (high lumbar flexion/extension, low lumbar rotation, and high stride length) experienced further increases in exterior rotation angular impulse. The average angular impulse of all six subjects increased further to 0.19 ± 0.08 Nm*s, an 18.85% increase from the uncapped simulation, when core activation was approximately 60%. It is also worth noting that the high lumbar rotation subject had a much higher angular impulse, 0.31 Nm*s uncapped, than the other subjects, which averaged 0.13 ± 0.02 Nm*s uncapped. 41
60 Subject External Rotation Angular Impulse on Tibia High Lumbar Flex/Ext Low Lumbar Flex/Ext High Lumbar Rotation Low Lumbar Rotation High Stride Length 100% Core Activation 80% Core Activation 60% Core Activation Low Stride Length Angular Impulse (Nm*s) Figure 17: Exterior Rotation Angular Impulse on Tibia The peak axial force increased when core activation was decreased in five of the six subjects, as shown in Figure 18. The high lumbar rotation subject saw especially high increases of 9.03% with approximately 80% core activation and 10.5% with approximately 60% core activation, compared to the unconstrained simulation. Overall, the six subject s average peak axial force in the knee was 4,947.3 ± N when there were no constraints placed on the core. When the core was constrained to approximately 80%, the average peak axial force was 5,055.7 ± N, an increase of 2.19%. When the core was constrained further to approximately 60%, the average peak axial force was 5,078.6 ± N, an increase of 2.65% when compared to the unconstrained simulations. 42
61 Subject Peak Downward Axial Force on Tibia High Lumbar Flex/Ext Low Lumbar Flex/Ext High Lumbar Rotation Low Lumbar Rotation High Stride Length 100% Core Activation 80% Core Activation 60% Core Activation Low Stride Length Force (N) Figure 18: Peak Downward Axial Force on Tibia The second objective of this study was to investigate how kinematic styles affect knee loading and lower extremity muscle activation. There was a very large difference in peak abduction moment and angular impulse between the minimum and maximum stride length subjects, as can be seen in Figure 19 and Figure 20. Looking at only the uncapped core activation simulations, the high stride length subject experienced a peak moment of Nm and angular impulse of Nm*s, while the low stride length subject experienced a peak moment of only Nm and angular impulse of 1.67 Nm*s. The other four subjects were fairly consistent with each other, with all values between the two 43
62 Subject extreme stride length subjects, and having an average peak moment of ± 7.99 Nm and an average angular impulse of 5.84 ± 1.22 Nm*s. Peak Abduction Moment on Tibia High Lumbar Flex/Ext Low Lumbar Flex/Ext High Lumbar Rotation 100% Core Activation Low Lumbar Rotation 80% Core Activation 60% Core Activation High Stride Length Low Stride Length Moment (Nm) Figure 19: Peak Abduction Moment on Tibia 44
63 Subject Abduction Angular Impulse on Tibia High Lumbar Flex/Ext Low Lumbar Flex/Ext High Lumbar Rotation Low Lumbar Rotation High Stride Length 100% Core Activation 80% Core Activation 60% Core Activation Low Stride Length Angular Impulse (Nm*s) Figure 20: Abduction Angular Impulse on Tibia The adduction angular impulse results, found in Figure 21, are also worth discussing. Five of the six subjects experienced increased adduction angular impulse when core activation was constrained to approximately 80%. Those five subjects experienced an average internal adduction angular impulse of 0.46 ± 0.22 Nm*s when core muscle activation was uncapped and 0.50 ± 0.24 Nm*s when core muscle activation was capped to approximately 80%, an increase of 9.34%. The only subject that didn t, the low stride length subject, experienced a large decrease of 24.27%. Of the five subjects that experienced an increase after the 80% constraint level, only the high stride length and low lumbar rotation subjects experienced continued increases when the core activation was constrained further to 60%. 45
64 Subject Adduction Angular Impulse on Tibia High Lumbar Flex/Ext Low Lumbar Flex/Ext High Lumbar Rotation Low Lumbar Rotation High Stride Length 100% Core Activation 80% Core Activation 60% Core Activation Low Stride Length Angular Impulse (N-m*s) Figure 21: Adduction Angular Impulse on Tibia Another change in knee loading can be seen in peak shear force in the posterior direction for the low lumbar rotation subject, as can be seen in Figure 22. The force increased by 20.98% when the subject s core activation was reduced to approximately 80% and 29.4% when core activation was reduced to approximately 60%. What s also interesting about this result is the relatively low change for the other five subjects, as the average force actually decreased by 0.79% when core muscle activation was decreased to approximately 80% and increased by only 1.37% when core muscle activation was decreased to approximately 60%. 46
65 Subject Peak Posterior Force on Tibia High Lumbar Flex/Ext Low Lumbar Flex/Ext High Lumbar Rotation 100% Core Activation Low Lumbar Rotation 80% Core Activation 60% Core Activation High Stride Length Low Stride Length Force (N) Figure 22: Peak Posterior Force on Tibia 3.3 Comparison of Lower Extremity Activation of Stance and Swing Leg Knee loading was not the only way in which the lower extremities were affected by decreased core activation; overall lower extremity muscle activation also changed. The muscles included in the OpenSim model s hip internal/external rotation, flexion/extension, adduction/abduction, and knee flexion/extension muscle groups were targeted, and their activation levels summed. A large difference can be seen (in Figure 23) when comparing the sums of the stance and swing legs, especially in regards to how they were affected by core activation. 47

66 Figure 23: Comparison of Summed Knee and Hip Muscle Activation Integrals of the Stance and Swing Legs Over a Single Stance Phase It is important to note that the integrals were taken over the same time period, so this is not a comparison of stance phase to swing phase, but rather a comparison of one leg s muscle activation to the other s during a single stance phase. Although the stance leg s overall activation integral averaged higher than the swing leg s (3.27 ± 0.69 compared to 2.24 ± 0.81 when unconstrained), there was a large difference in how the lower extremity muscle activations changed as core activation was decreased. The swing leg muscle activation increased to an average of 2.43 ± 0.72 (an increase of 8.26%) when core activation was decreased to approximately 80% and to 2.62 ± 0.62 (an increase of 16.67%) when core activation was decreased to approximately 60%. Conversely, the 48
 when core activation was decreased to approximately 80% and to 3.33 ± 0.65 (an increase of 1.")

67 stance leg muscle activation only increased to an average of 3.30 ± 0.7 (an increase of 0.99%) when core activation was decreased to approximately 80% and to 3.33 ± 0.65 (an increase of 1.93%) when core activation was decreased to approximately 60%. Tables summarize the results numerically. Table 11: Comparison of Summed Knee and Hip Muscle Activation Integrals of the Stance and Swing Legs in the Low Stride Length Subject Table 12: Comparison of Summed Knee and Hip Muscle Activation Integrals of the Stance and Swing Legs in the High Stride Length Subject 49

68 Table 13: Comparison of Summed Knee and Hip Muscle Activation Integrals of the Stance and Swing Legs in the Low Lumbar Rotation Subject Table 14: Comparison of Summed Knee and Hip Muscle Activation Integrals of the Stance and Swing Legs in the High Lumbar Rotation Subject 50


69 Table 15: Comparison of Summed Knee and Hip Muscle Activation Integrals of the Stance and Swing Legs in the Low Lumbar Flexion/Extension Subject Table 16: Comparison of Summed Knee and Hip Muscle Activation Integrals of the Stance and Swing Legs in the High Lumbar Flexion/Extension Subject 3.4 Investigation of Hip Abduction Activation as Core Activation is Constrained When investigating the hip abduction muscle group specifically, the results are similar to the overall lower extremity muscle activation results. As can be seen in Figure 24, the swing leg hip abductor muscle activations increased noticeably while the stance 51
70 leg stayed relatively steady. Numerically, the average sum of swing leg hip abductor activation integrals were 0.76 ± 0.33 when uncapped, 0.83 ± 0.28 when core activation was constrained to approximately 80% (an increase of 9.86%), and 0.91 ± 0.23 when core activation was constrained to approximately 60% (an increase of 20.58%). Conversely, the average sum of stance leg hip abductor activation integrals were 1.60 ± 0.40 when uncapped, 1.61 ± 0.50 when core activation was constrained to approximately 80% (an increase of 0.5%), and 1.64 ± 0.38 when core activation was constrained to approximately 60% (an increase of 2.27%). Tables display the numerical results individually for each subject. Figure 24: Summed Hip Muscle Activation Integrals 52


71 Table 17: The Low Stride Length Subject s Hip Abductor Results Table 18: The High Stride Length Subject s Hip Abductor Results Table 19: The Low Lumbar Rotation Subject s Hip Abductor Results 53


72 Table 20: The High Lumbar Rotation Subject s Hip Abductor Results Table 21: The Low Lumbar Flexion/Extension Subject s Hip Abductor Results Table 22: The High Lumbar Flexion/Extension Subject s Hip Abductor Results 54
73 3.5 Unconstrained Core Activation Comparison The uncapped core activation levels between the kinematic style pairings were also investigated. Comparisons of all ten core muscles in each specific pairing can be seen in Figures 25, 26, and 27. Figure 28 displays the sum of all ten core muscle activation integrals, for each of the six subjects, and Table 23 displays all of the results numerically. The largest disparity between kinematic pairs was 0.38, between the high and low lumbar rotation subjects. This was also the only kinematic pairing in which all ten core muscles activation levels were higher for one subject. The lumbar flexion/extension pair had the smallest discrepancy, 0.11, and the stride length pair differed by In the lumbar flexion/extension pair, the two erector spinae muscles were the only two which activated more in the low lumbar flexion/extension subject. Graphs of each muscle over time for all six subjects can be found in Appendix E. 55
74 Core Muscle Integrals of Uncapped Core Activations Swing Exterior Oblique Stance Exterior Oblique Swing Interior Oblique Stance Interior Oblique Swing Erector Spinae Stance Erector Spinae Swing Psoas High Stride Length Low Stride Length Stance Psoas Swing Iliacus Stance Iliacus Integral (Muscle Activation * Time) Figure 25: Comparison of Uncapped Core Activation Integrals of the Ten Core Muscles in the Stride Length Pair 56
75 Core Muscle Integrals of Uncapped Core Activations Swing Exterior Oblique Stance Exterior Oblique Swing Interior Oblique Stance Interior Oblique Swing Erector Spinae Stance Erector Spinae Swing Psoas High Lumbar Rotation Low Lumbar Rotation Stance Psoas Swing Iliacus Stance Iliacus Integral (Muscle Activation * Time) Figure 26: Comparison of Uncapped Core Activation Integrals of the Ten Core Muscles in the Lumbar Rotation Pair 57
76 Core Muscle Integrals of Uncapped Core Activations Swing Exterior Oblique Stance Exterior Oblique Swing Interior Oblique Stance Interior Oblique Swing Erector Spinae Stance Erector Spinae Swing Psoas High Lumbar Flexion/Extension Low Lumbar Flexion/Extension Stance Psoas Swing Iliacus Stance Iliacus Integral (Muscle Activation * Time) Figure 27: Comparison of Uncapped Core Activation Integrals of the Ten Core Muscles in the Lumbar Flexion/Extension Pair 58
 Figure 28: Comparison of the Sum of Uncapped Core Activation Integrals of the Ten Core Muscles Table 23: Comparison of the Uncapped Core Activation Integrals of")
77 Integrals of Uncapped Core Activations High Lumbar Flexion/Extension Low Lumbar Flexion/Extension High Lumbar Rotation Low Lumbar Rotation High Stride Length Low Stride Length Integral (Muscle Activation * Time) Figure 28: Comparison of the Sum of Uncapped Core Activation Integrals of the Ten Core Muscles Table 23: Comparison of the Uncapped Core Activation Integrals of the Ten Core Muscles 59


78 3.6 Analysis of the Validity of the Simulations It is very important to contextualize the results with an evaluation of the simulations in this study. Tables 9 and 10 in Chapter 2 outline guidelines from the OpenSim developers for acceptable levels of error within a simulation. Each subject was evaluated in 209 different areas. For clarity the results are summarized in Tables Table 24: Assessment of the Validity of the Low Lumbar Flexion/Extension Subject s Simulations Table 25: Assessment of the Validity of the High Lumbar Flexion/Extension Subject s Simulations 60


79 Table 26: Assessment of the Validity of the Low Lumbar Rotation Subject s Simulations Table 27: Assessment of the Validity of the High Lumbar Rotation Subject s Simulations The parameters that failed to stay within the outlined acceptable limits for the high lumbar rotation subject were residual forces along the y and z axis. The highest error was the force along the z axis, which was N, just higher than the limit for an acceptable simulation of 25 N. 61
80 Table 28: Assessment of the Validity of the Low Stride Length Subject s Simulations During first iteration of RRA in the low stride length subject, pelvis translations in the y and z directions were higher than acceptable, but upon making the changes suggested by the RRA tool, the errors were resolved. The residual moment about the z axis was above the acceptable limit of 75 Nm throughout all three CMC simulations, peaking during the 60% core activation simulation at Nm. There were also higher than acceptable residual forces in the y and z direction during the simulation with core activation capped at 60%. Interestingly, the lumbar bending reserve moment was unacceptable during 100% activation, measuring Nm, easily above the acceptable limit of 50 Nm, but the error reduced as the core activation was decreased until it was within the acceptable limit during the simulation where core activation was capped at 60%. This can be seen in more detail in Figure 27 in the next section. 62

81 Table 29: Assessment of the Validity of the High Stride Length Subject s Simulations During the first iteration of RRA in the high stride length subject, pelvis translation in the y direction and residual moments about the x and z axes were higher than acceptable, but upon making the suggested changes, the errors were resolved. During all of the CMC simulations, the residual force along the z axis was higher than acceptable. Positional errors for right ankle angle and left hip rotation were high enough to register as soft fails. Reserve moments for right hip adduction, right hip rotation, left hip adduction, right ankle angle, and left ankle angle were all higher than acceptable at different points throughout the simulation procedure. The most egregious error was the right ankle reserve moment, which peaked at Nm during the 60% core activation simulation, greatly eclipsing the acceptable level of 50 Nm. Errors were higher than acceptable for all of the subjects during scaling and inverse kinematics, the results of which can be seen in Table 30. The reasons for these results will be mentioned in later chapters. 63
82 Table 30: Scaling and Inverse Kinematics Errors 3.7 Evaluation of the Constraint of Core Activation As previously discussed, it was not possible to perfectly constrain core activation to precisely the desired levels of 80% and 60% of the unconstrained activation. Line graphs displaying core muscle activation results for all three levels of activation, for each muscle, for each subject, can be found in Appendix F. Each attempt at constraining a muscle was assessed and scored from 1-4 (4 being the best), and the results of those evaluations were compiled to give each subject an average overall score. A summary of each subject s scores can be found in Table 31. The high and low stride length subjects each had an average overall score of 3.57, which was the highest, while the low lumbar flexion/extension subject had an average overall score of 3.11, which was the lowest. 64

83 Table 31: Evaluation of Core Constraint Results Another set of parameters to consider when evaluating how effectively the core muscles activation levels were constrained are the reserve moments about the lumbar joint. Figure 29 shows how each lumbar degree of freedom is defined. Although a large majority of these reserves were deemed good by the standards shown in Table 10 in Chapter 2, it is still important to observe if the reserve moments increased while staying within the acceptable threshold. As can be seen in Figures 30 35, that scenario was often the case. The only real exception can be seen in the center image of Figure 30, where the lumbar bending reserve moment actually decreased the more core activation was constrained in the low stride length subject. 65

84 Figure 29: Definitions of Lumbar Degrees of Freedom 66


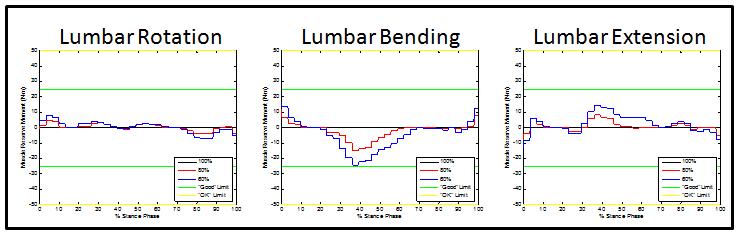
85 Figure 30: The Low Stride Length Subject's Lumbar Reserve Moments Figure 31: The High Stride Length Subject's Lumbar Reserve Moments Figure 32: The Low Lumbar Rotations Subject's Lumbar Reserve Moments 67


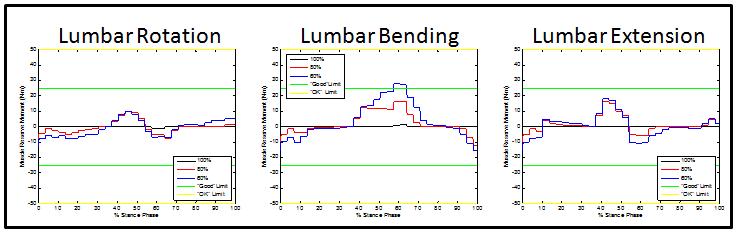
86 Figure 33: The High Lumbar Rotations Subject's Lumbar Reserve Moments Figure 34: The Low Lumbar Flexion/Extension Subject's Lumbar Reserve Moments Figure 35: The High Lumbar Flexion/Extension Subject's Lumbar Reserve Moments 68
87 Unfortunately, it was not possible to directly compute each muscle s contribution to a specific joint s degree of freedom. As a result, I am unable to quantify how these reserve moments compare to the overall magnitude of the moment lost due to capping the core muscles acting on the lumbar joint. The consistent increases in reserve moments dampen some, but not all, of the effects of reduced core muscle activation. Therefore, even if I was able to perfectly constrain core muscle activation to exactly 80% and 60%, the increase in reserve moments would compensate for some of the effects, and the lower extremities would not experience a core constrained to 80% and 60%. Unfortunately, it was not possible to calculate the exact percentage which the lower extremities were experiencing. 69
88 Chapter 4: Discussion 4.1 Discussion of Knee Loading Results Patellofemoral stress, patellofemoral contact force, and IT band friction (or compression) are difficult to measure for in vivo studies. Therefore, much of the literature (outlined in Chapter 1) has found other parameters which have been statistically linked to ITBS and PFPS. Because there is no iliotibial band or patella in the model used in this study, I investigated those parameters to create connections from my simulations knee loading and lower extremity muscle activation to ITBS and PFPS injury risk. In this study, five out of six subjects experienced an increase in external tibia rotation angular impulse, with the average of all six subjects increasing by 11.43% when core activation was reduced to 80% and by 18.85% when reduced to 60%. The parameter is relevant because several studies showed significant links between internal tibia rotation angle, ITBS, [24,25,26] and PFPS. [22] The knee, in this model, cannot have an internal rotation angle, because it is modeled as a 1 degree of freedom hinge joint. If, with decreased core activation, the lower extremity musculature s activation pattern changed in such a way that would cause the knee to internally rotate, there would be a resulting moment in the knee joint. The observed increase in external tibia rotation angular impulse may be an internal loading response to the musculature activating in a way that would internally rotate the tibia, which is closely linked to ITBS and PFPS. 70
89 Five of the six subjects experienced an increase in axial force on the tibia as core activation was decreased. The average axial force acting on the tibia for all six subjects grew from 4,947.3 N to 5,055.7 N at 80% core activation to 5,078.6 N at 60% core activation. The literature established that higher axial forces through the tibia could lead to stress fractures, if the frequency and magnitude are too much for bone remodeling to account for. [17, 29-31] An average increase of N in axial force acting on the tibia, each step, suggests lower core activation may lead to an increased risk for tibial stress fractures. The high stride length subject s peak abduction moment (80.49 Nm) was four times larger than the low stride length subject s (20.43 Nm), and the high stride length subject s abduction angular impulse (11.56 Nm*s) was nearly seven times larger than the low stride length subject s (1.67 Nm*s). None of the other four subjects were near either of these extreme values, with an average peak abduction moment of ± 7.99 Nm and an average angular impulse of 5.84 ± 1.22 Nm*s. A study by Stefanyshyn et al. showed subjects with PFPS had a significantly higher knee abduction impulse. [20] Therefore, when viewing the results of this study with the context provided by Stefanyshyn et al. s study, the results show evidence indicating that there may be a link between normalized stride length and knee abduction impulse, and therefore PFPS. Knee adduction angular impulse increased in five of the six subjects when core activation was decreased to 80%. Although this result was not connected to injury risk within the literature, this impulse may have a cumulative effect on the cartilage and/or 71
90 meniscus in the lateral compartment of the tibiofemoral joint, suggesting a potential role of reduced core muscle activation in injury or osteoarthritis of the lateral compartment. The large increase in peak posterior force in the low lumbar rotation subject (increased by 20.98% at 80% core activation, and 29.4% at 60% core activation) is notable. Although peak posterior shear force is not directly related to PFPS in the literature, it is possible that, if the femur is providing a peak posterior force on the tibia, it could be moving away from the patella, which could decrease contact area, and that would have implications for injury risk of PFPS. [19] 4.2 Discussion of Lower Extremity Muscle Activation Results As expected, the lower extremity muscle activations were lesser in the swing leg than the stance leg (2.24 ± 0.81 compared to 3.27 ± 0.69), but the swing leg experienced much greater increases as core activation was decreased (8.26% and 16.67%) than the stance leg (0.99% and 1.93%). Why would the swing leg be affected by decreased core muscle activation so much more than the stance leg? During a single stance phase, the stance leg is in contact with the ground, and the swing leg is being pulled about the stance leg. It is possible that the core musculature plays a large role in pulling that leg forward, especially since the psoai and iliaci were included in this study s definition of the core. If this is the case, then constraining core muscle activation would require the other lower extremity muscles in the swing leg to activate more to pull the leg forward, due to the torque lost from constraining the core. 72
91 The high lumbar rotation subject and high stride length subject did not experience the high increase in swing leg activation that the other four subjects experienced. Those two subjects swing leg activations were already much higher than the other four subjects to begin with. Perhaps the swing leg muscles were already accounting for the majority of the leg s motion before the core was constrained in those subjects. It is also possible that, because the swing leg s lower extremity muscles were already activated relatively highly, the mathematical nature of the simulation didn t place a high priority on increasing the activation of those muscles after the core was constrained. Future studies could utilize OpenSim s induced acceleration analysis tool to further investigate the core musculature s contribution to the swing leg. If the lower extremity muscles are forced activate more during each swing phase, they will fatigue faster. Evidence in the literature suggests that lower extremity muscle fatigue may affect they dynamic stability of the knee and could possibly put a runner at greater risk of injury. [50] Also, if the runner is concerned with their performance level, increased lower extremity muscle fatigue should be avoided. This is more evidence of why core activation is important for runners, and deserves further investigation. 4.3 Discussion of the Hip Abductor Group Muscle Activations The hip abductor group results mirrored those of the overall lower extremity muscle group. The low stride length, low lumbar rotation, low lumbar flexion/extension, and high lumbar flexion/extension swing leg activations all experienced large increases with decreased core activation, while all the other values stayed relatively the same. 73
92 Those four subjects hip abductor integral summations increased by 48.39%, 35.53%, 45.53%, and 42.52%, respectively, when core muscle activation was decreased to 60%. These results have important implications for ITBS, given the findings of Fredericson et al., which suggested that hip abductor weakness is a predictor of ITBS. [27] Although the hip abductor muscles do not get weaker with decreased core activation in this study s simulation, they are required to activate more to maintain the same motion, making them relatively weaker for the given task. Farrell et al. showed that cyclists still commonly experience ITBS experience foot to pedal loads only 18% of ground reaction forces during running. [28] Though (even reduced) extremity loading may still contribute to ITBS, Farrell et al. s findings suggest repeated movement of the IT band through the impingement zone, which occurs during swing phase, may be more important. A combination of these results shows a possible trend linking core muscle activation to required hip abductor muscle activation, and therefore ITBS. It is also worth noting that the high stride length subject experienced very high reserve moments contributing to hip adduction. This is one possible explanation as to why that subject did not share the same large increase in hip abduction activation as the four subjects discussed in this subsection; the subject s simulation was already struggling to provide hip adduction and could not account for any increase in hip abductor muscle activation. 74
93 4.4 Discussion of Unconstrained Core Activation Results When comparing unconstrained core muscle activation results, the higher extreme for each of the three subject pairs experienced a greater sum of muscle activation integrals. This result may not be surprising, as higher muscle activation is often associated with a wider range of movement, but a closer looks reveals a few unexpected results. The lumbar rotation pair had the greatest difference in the sum of muscle activation integrals, and each of the ten core muscles experienced greater activation level in the high lumbar rotation subject. This means that the core muscles are likely responsible for driving that lumbar rotation motion. This is not a surprise, but the lumbar flexion/extension results were a little different. One might expect the gap in summed muscle activation to be high for this pair as well. However, this was not the case, and the lumbar flexion/extension pair actually had the smallest difference between subjects total core muscle activation of the three pairs. A closer look at the integrals of individual muscle activation levels also reveals that the erector spinae muscles were actually activated more during the low lumbar flexion/extension trial. This could be an indication that the lumbar flexion/extension motion is caused by the natural momentum of the body segments, and parts of the core musculature (specifically, the erector spinae) may actually be working against that momentum, to limit range of motion and stabilize the trunk. These results show that some of the core, specifically the erector spinae out of the ten muscles in this model, may actually be working to stabilize the core in the sagittal plane, whereas the entire core is likely driving the motion in the transverse plane. 75
94 4.5 Discussion of Validity of Results It is always important to discuss the validity of any simulation s results. Errors and imperfections in the simulation procedure have been identified and reported: two subjects experienced several residual and reserves forces outside of the acceptable range, core muscle activation was not consistently constrained to exactly 80% and 60% of original activation levels, and reserve moments about the lumbar joint partially counteracted the effect of constraining core muscle activation. However, four of the six subjects did not require a large amount of residual forces or moments to complete the simulations, and even the lowest scoring subjects core muscles were constrained well enough to average higher than a 3.1 according to the scoring system described in this document. The main objective of this study was to simulate a less activated core, and see if any trends could be discovered in knee loads and lower extremity muscle activations in six subjects representing extreme kinematic styles of running. While the core musculature was not capped to exactly 80% and 60% of original muscle activation levels, and two subjects experienced higher than desired residual forces and moments, reductions of muscle activations were nevertheless achieved, so the changes observed in compensation for these reduced muscle activations still address the objective of identifying trends in knee loads and lower extremity muscle activations. This thesis aimed to identify results which could provide target biomechanical parameters of interest 76
95 for future studies into the relationship between core activation, running kinematic styles, and loading in the lower extremity, and that goal was achieved. 77
96 Chapter 5: Conclusion 5.1 Limitations and Future Work Several limitations were identified throughout this study. Because this thesis aims to be a guide for future research efforts, it is essential to outline this study s limitations and offer suggestions for future work in this area. The simplest limitations were due to the model itself. First, the core musculature is under defined. The transversus abdominis, rectus abdominis, and quadratus lumborum are some examples of important core muscles that were not included in the model. Though gathering the data to model these muscles and implementing them correctly in the model is difficult, future studies would be wise to include them. Adding more muscles to the core could potentially allow a similar core constraining study to be more successful. Because the core muscles in this study were already compensating for missing muscles, it was easier for them to become overwhelmed, which resulted in the occurrences of unwanted core muscle activation increases and lumbar reserve moment increases, which have been discussed previously in this document. Essentially, I was constraining an already under represented core. With more muscles in the core, those unwanted occurrences should be reduced, or possibly even eliminated. Thinking back to the leaking water analogy, adding more muscles would reduce the water pressure behind the wall. 78
97 Another way the model could be improved would be to make the torso segment of the model more flexible. The model used in this study was rigid throughout the entire torso segment, which included the head. The torso is not at all rigid during running, and certain resulting marker orientations were impossible for the model to match, resulting in high IK errors. Future studies should make another joint between the head and torso, to allow for the motion to track head movement without it affecting simulated torso motion. Allowing the spine and shoulders to bend would also decrease errors during IK. Another improvement would be to add a second elbow marker opposite the one in this marker set during static calibration motion capture. In this study, the humerus was only defined by two anatomical landmark markers (on the shoulder and elbow) which is under defined for scaling, as the orientation of the segment could not be matched exactly with only two markers. Though there is a third marker (upper arm) used for tracking motion, is not an anatomical landmark and cannot be used for scaling. A third anatomical marker would likely reduce scaling errors, and therefore inverse kinematic errors, in the arms. The ability to fully prescribe certain muscles activations in OpenSim could make studies like this one much more feasible. If the user could directly input and lock certain muscle activations, prior to running CMC, it would have had a huge impact on this study. First, it would have allowed for the constraining procedure to be much simpler and more effective. If I could have simply entered the output from the unconstrained CMC step into MATLAB, multiplied it by 0.8 and 0.6, respectively, and entered those resulting vectors as locked inputs in the next iteration of CMC, it would have reduced simulation 79
98 time dramatically, and made the process more accurate. Furthermore, this capability would allow the user to input EMG results from data collection, which would allow the simulation to better recreate the subject s actual muscle activation pattern. Simulation studies investigating PFPS and ITBS would yield more results if a patella or IT band were included in the model. Being able to calculate parameters such as patellofemoral contact area and stress, patellar translation, iliotibial band strain, and iliotibial band line of action, would enable much more clinically-relevant interpretation. Adapting the model to allow three degrees of freedom in the knee would also be helpful for future studies investigating PFPS and ITBS, as knee rotation and adduction/abduction angles would be useful to know. Another major limitation for this study is that a specific kinematic area of interest could not be isolated. So, even though each subject had the highest or lowest value in its designated kinematic parameter, some were also relatively high or low in other kinematic parameters. For example, the low stride length subject also had a fairly high lumbar flexion/extension range. The best case scenario, for comparison, would involve each subject being significantly high or low in their kinematic area, and being close to average in the other two parameters. The easiest way to achieve this would be to have more useable subjects, which would allow for either being more selective when choosing a representative subject, or simply running more total simulations to find a statistical correlation between kinematic styles and OpenSim results. A future study could be designed to better simulate core fatigue, if more was known about how core activation is affected by fatigue. In this study, I attempted to 80
99 constrain the entire core at 80% and 60% of original muscle activation in order to identify trends. If more is known about how specific muscles fatigue in relation to each other, it may be best to cap those individual muscles at different levels to better simulate core fatigue, and give more clinically relevant results. Another limitation for this study was that I was working with another study s data. This saved a large amount of time in the early stages of this project, but it did cause some problems. The most notable of these problems was that over half of the forty six subjects in the study were not useable for OpenSim, because at the time of data collection, some of the criteria needed to be met for the subject to be used in OpenSim were not given consideration. Future studies intending to utilize OpenSim should put a very high priority on eliminating all gaps in marker data, and confirm each stance phase is recorded on an individual force plate. Also, although I was able to ask some questions of fellow lab members who had involvement in the original data collection, there were times where my lack of direct knowledge slowed progress. The high T10 markers errors in scaling can be traced to this issue, as I learned the marker was often placed without much care during the analysis stage. Had I known earlier, I could have adjusted scaling marker weight appropriately to address the issue. The final limitation is a concern for most OpenSim studies: the muscle properties were the same for all subjects. This limitation isn t completely negative in this study, as I was able to isolate the variable of kinematic style between subjects while holding as many other parameters constant as possible. That being said, it is always best to try and simulate subject trials as accurately as possible. If, for example, one of the subjects was 81
100 stronger in a certain muscle than another subject, OpenSim would have to compensate for that increased strength with increased muscle activation. This could lead to inaccurate or misleading results. 5.2 Summary and Closing Comments This thesis had three objectives. The first was to investigate how decreasing core muscle activation during running would affect knee loading and lower extremity muscle activation. The second was to observe how different running kinematic styles were affected by decreased core activation, using representative subject specific motion capture data. The third was to establish the feasibility of creating forward dynamic simulations of running to enable future simulation-based running research. The objectives and resulting outcomes are summarized in Table

101 Table 32: Thesis Objectives and Outcomes Five of six subjects experienced increased external tibial angular impulse with a decreased core activation, which could be a sign that the tibia would rotate inward, if it were able, which has been linked with PFPS. Five of six subjects experienced an increase in axial force on the tibia with a decreased core activation, which has been linked to tibial stress fractures. As core activation was decreased, a noticeable increase in swing leg muscle activation was observed in four of six subjects, which indicates muscle fatigue would happen faster and increase injury risk. More specifically, the hip abductor 83
102 muscles in those subjects saw a very large (36-48%) increase in activation, which could be an indication of increased risk of ITBS. A trend linking normalized stride length knee abduction moment and angular impulse was identified in this study. Knee abduction impulse has been linked as a potential contributing factor to PFPS, indicating that running with a long normalized stride length may increase injury risk. From comparing unconstrained core muscle activation levels, this study found that all core muscles play a large role in driving lumbar rotation motion. However, when investigating lumbar flexion/extension motion, it was found that the erector spinae muscles may provide stabilization rather than drive motion Forward dynamic simulations of representative running trials for all six subjects were successfully generated. To our knowledge, this was the first time that forward dynamic simulations of running have been generated, and this work will enable future study of how kinematics and kinetics change as perturbations or muscle activation variations are applied. This study validated that subject specific running data can be used with OpenSim to execute forward dynamic simulations. This study also identified several interesting trends between decreasing core activation and changes in knee loading and lower extremity muscle activation. Many of these results can be linked to trends commonly observed in certain running injuries. These results provide targets for additional biomechanical investigation of running injuries, and a new simulation tool for performing these investigations. 84
103 References State of the Sport Part II: Running Industry. Running USA. Available at: Accessed August 2, The 2012 Statistical Abstract. Population. Available at: Accessed August 2, State of the Sport Part III: U.S. Race Trends. Running USA. Available at: Accessed August 2, Scott, S. H., & Winter, D. A. (1990). Internal forces at chronic running injury sites. Medicine & Science in Sports & Exercise, 22(3), Jacobs, S. J., & Berson, B. L. (1986) Injuries to Runners: A Study of Entrants to a 10,000 Meter Race. The American Journal of Sports Medicine, 14(2): Koplan, J. P., Powell, K. E., Sikes, R. K., Shirley, R. W., & Cambel, C. C. (1982). An Epidemiologic Study of the Benefits and Risks of Running. JAMA: The Journal of the American Medical Association, 248(23), Lysholm, J., & Wiklander, J. (1987). Injuries in runners. The American Journal of Sports Medicine, 15(2),
104 8. Macera, C. A., Pate, R. R., Powell, K. E., Jackson, K. L., Kendrick, J. S., & Craven, T. E. (1989). Predicting Lower-Extremity Injuries Among Habitual Runners. Archives of Internal Medicine, 149(11), Jacobs, S. J., & Berson, B. L. (1986). Injuries to runners: A study of entrants to a 10,000 meter race. The American Journal of Sports Medicine, 14(2), Ristolainen, L., Heinonen, A., Turunen, H., Mannström, H., Waller, B., Kettunen, J. A., & Kujala, U. M. (2010). Type of sport is related to injury profile: A study on cross country skiers, swimmers, long-distance runners and soccer players. A retrospective 12-month study. Scandinavian Journal of Medicine & Science in Sports, 20(3), Middelkoop, M. V., Kolkman, J., Ochten, J. V., Bierma-Zeinstra, S. M., & Koes, B. (2008). Prevalence and incidence of lower extremity injuries in male marathon runners. Scandinavian Journal of Medicine & Science in Sports, 18(2), Walter, S. D., Hart, L. E., McIntosh, J. M., & Sutton, J. R. (1989). The Ontario Cohort Study of Running-Related Injuries. Archives of Internal Medicine, 149(11), Devereaux, M. D., & Lachmann, S. M. (1984). Patello-femoral arthralgia in athletes attending a Sports Injury Clinic. British Journal of Sports Medicine, 18(1), Taunton, J. E. (2002). A retrospective case-control analysis of 2002 running injuries. British Journal of Sports Medicine, 36(2),
105 15. Malek, M. M., & Mangine, R. E. (1981). Patellofemoral Pain Syndromes: A Comprehensive and Conservative Approach. Journal of Orthopaedic & Sports Physical Therapy, 2(3), Sutker, A. N., Barber, F. A., Jackson, D. W., & Pagliano, J. W. (1985). Iliotibial Band Syndrome in Distance Runners. Sports Medicine, 2(6), Whiting, W. C., & Zernicke, R. F. (2008). Biomechanics of musculoskeletal injury. Champaign, IL: Human Kinetics. 18. Besier, T. F., Draper, C. E., Gold, G. E., Beaupré, G. S., & Delp, S. L. (2005). Patellofemoral joint contact area increases with knee flexion and weight-bearing. Journal of Orthopaedic Research, 23(2), Brechter, J. H., & Powers, C. M. (2002). Patellofemoral stress during walking in persons with and without patellofemoral pain. Medicine & Science in Sports & Exercise, 34(10), Stefanyshyn, D. J., Stergiou, P., Lun, V. M., Meeuwisse, W. H., & Worobets, J. T. (2006). Knee Angular Impulse as a Predictor of Patellofemoral Pain in Runners. American Journal of Sports Medicine, 34(11), Nadeau, S., Gravel, D., Hébert, L. J., Arsenault, A., & Lepage, Y. (1997). Gait study of patients with patellofemoral pain syndrome. Gait & Posture, 5(1), Besier, T. F., Gold, G. E., Delp, S. L., Fredericson, M., & Beaupré, G. S. (2008). The influence of femoral internal and external rotation on cartilage stresses within the patellofemoral joint. Journal of Orthopaedic Research, 26(12),
106 23. Fairclough, J., Hayashi, K., Toumi, H., Lyons, K., Bydder, G., Phillips, N.,... Benjamin, M. (2007). Is iliotibial band syndrome really a friction syndrome? Journal of Science and Medicine in Sport, 10(2), Ferber, R., Noehren, B., Hamill, J., & Davis, I. (2010). Competitive Female Runners With a History of Iliotibial Band Syndrome Demonstrate Atypical Hip and Knee Kinematics. Journal of Orthopaedic & Sports Physical Therapy, 40(2), Miller, R. H., Lowry, J. L., Meardon, S. A., & Gillette, J. C. (2007). Lower extremity mechanics of iliotibial band syndrome during an exhaustive run. Gait & Posture, 26(3), Noehren, B., Davis, I., & Hamill, J. (2007). ASB Clinical Biomechanics Award Winner 2006.Clinical Biomechanics, 22(9), Fredericson, M., Cookingham, C. L., Chaudhari, A. M., Dowdell, B. C., Oestreicher, N., & Sahrmann, S. A. (2000). Hip Abductor Weakness in Distance Runners with Iliotibial Band Syndrome. Clinical Journal of Sport Medicine, 10(3), Farrell, K. C., Reisinger, K. D., & Tillman, M. D. (2003). Force and repetition in cycling: Possible implications for iliotibial band friction syndrome. The Knee, 10(1), Hennig, E., Milani T., & Lafortune, M. (1993). Use of ground reaction force parameters in predicting peak tibial accelerations in running. Journal of Applied Biomechanics, 9(4),
107 30. Milner, C. E., Ferber, R., Pollard, C. D., Hamill, J., & Davis, I. S. (2006). Biomechanical Factors Associated with Tibial Stress Fracture in Female Runners. Medicine & Science in Sports & Exercise, 38(2), Messier, S. P., Legault, C., Schoenlank, C. R., Newman, J. J., Martin, D. F., & Devita, P. (2008). Risk Factors and Mechanisms of Knee Injury in Runners. Medicine & Science in Sports & Exercise, 40(11), Chaudhari, A. M. W., Jamison, S. T., & Best, T. M. (2012). Proximal Risk Factors for ACL Injury: Role of Core Stability. In ACL Injuries in the Female Athlete (pp ). Berlin, Heidelberg: Springer-Verlag. 33. Leetun, D. T., Ireland, M. L., Willson, J. D., Ballantyne, B. T., & Davis, I. M. (2004). Core Stability Measures as Risk Factors for Lower Extremity Injury in Athletes. Medicine & Science in Sports & Exercise, 36(6), Zazulak, B. T., Hewett, T. E., Reeves, N. P., Goldberg, B., & Cholewicki, J. (2007). Deficits in Neuromuscular Control of the Trunk Predict Knee Injury Risk: A Prospective Biomechanical-Epidemiologic Study. The American Journal of Sports Medicine, 35(7), Sato, K., & Mokha, M. (2009). Does Core Strength Training Influence Running Kinetics, Lower-Extremity Stability, and 5000-m Performance in Runners? Journal of Strength and Conditioning Research, 23(1), Kibler, W. B., Press, J., & Sciascia, A. (2006). The Role of Core Stability in Athletic Function. Sports Medicine, 36(3),
108 37. Delp, S. L., Anderson, F. C., Arnold, A. S., Loan, P., Habib, A., John, C. T.,... Thelen, D. G. (2007). OpenSim: Open-Source Software to Create and Analyze Dynamic Simulations of Movement. IEEE Transactions on Biomedical Engineering, 54(11), Reinbolt, J. A., Seth, A., & Delp, S. L. (2011). Simulation of human movement: Applications using OpenSim. Procedia IUTAM, 2, Hamner, S. R., Seth, A., & Delp, S. L. (2010). Muscle contributions to propulsion and support during running. Journal of Biomechanics, 43(14), Thompson, J. A., Chaudhari, A. M. W., Schmitt, L. C., Best, T. M., Siston, R. A. (2013). Gluteus maximus and soleus compensate for simulated quadriceps atrophy and activation failure during walking. Journal of Biomechanics, 46(13), Jamison, S. T., Mcnally, M. P., Schmitt, L. C., & Chaudhari, A. M. (2013). The effects of core muscle activation on dynamic trunk position and knee abduction moments: Implications for ACL injury. Journal of Biomechanics, 46(13), Woltring, H. J. (1986). A Fortran package for generalized, cross-validatory spline smoothing and differentiation. Advances in Engineering Software (1978), 8(2), Andriacchi, T. P., Alexander, E. J., Toney, M. K., Dyrby, C., & Sum, J. (1998). A Point Cluster Method for In Vivo Motion Analysis: Applied to a Study of Knee Kinematics. Journal of Biomechanical Engineering, 120(6),
109 44. Gutierrez, E. M., Bartonek, Å, Haglund-Åkerlind, Y., & Saraste, H. (2003). Centre of mass motion during gait in persons with myelomeningocele. Gait & Posture, 18(2), Dorn, T.W. (2008). Gait Extract Toolbox for Matlab, Version 1.71 (2008) 46. Lathrop, R. L., Chaudhari, A. M., & Siston, R. A. (2011). Comparative Assessment of Bone Pose Estimation Using Point Cluster Technique and OpenSim. Journal of Biomechanical Engineering, 133(11), Crowninshield, R. D., & Brand, R. A. (1981). A physiologically based criterion of muscle force prediction in locomotion. Journal of Biomechanics, 14(11), Zajac, F. E. (1989). Muscle and tendon: properties, models, scaling, and application to biomechanics and motor control. Critical Reviews in Biomedical Engineering, 17(4) Hicks, J., Seth, A., Hamner, S., DeMers, M., Higginson, J., Knarr, B., Collins, A., Schrank, E., & Henderson, C. (2012, June 20). Simulation with OpenSim - Best Practices. OpenSim Confluence. Available at: confluence.stanford.edu:8080/display/opensim/simulation+with+opensim+- +Best+Practices. Accessed January 15, Wojtys, E. M., Wylie B. B., & Huston L. J. (1996). "The Effects of Muscle Fatigue on Neuromuscular Function and Anterior Tibial Translation in Healthy Knees." The American Journal of Sports Medicine 24(5)


110 Appendix A: Scaling Ratios for All Subjects Table 33: Low Stride Length Subject's Scaling Ratios Table 34: High Stride Length Subject's Scaling Ratios 92

111 Table 35: Low Lumbar Rotation Subject's Scaling Ratios Table 36: High Lumbar Rotation Subject's Scaling Ratios 93


112 Table 37: Low Lumbar Flexion/Extension Subject's Scaling Ratios Table 38: High Lumbar Flexion/Extension Subject's Scaling Ratios 94
113 Appendix B: All Knee Loading Bar Graphs Peak Anterior Force on Tibia High Lumbar Flex/Ext Low Lumbar Flex/Ext High Lumbar Rotation Low Lumbar Rotation High Stride Length 100% Core Activation 80% Core Activation 60% Core Activation Low Stride Length Force (N) Figure 36: Peak Anterior Force on Tibia 95
114 Anterior Impulse on Tibia High Lumbar Flex/Ext Low Lumbar Flex/Ext High Lumbar Rotation Low Lumbar Rotation High Stride Length 100% Core Activation 80% Core Activation 60% Core Activation Low Stride Length Impulse (N*s) Figure 37: Anterior Impulse on Tibia Peak Posterior Force on Tibia High Lumbar Flex/Ext Low Lumbar Flex/Ext High Lumbar Rotation Low Lumbar Rotation High Stride Length 100% Core Activation 80% Core Activation 60% Core Activation Low Stride Length Force (N) Figure 38: Peak Posterior Force on Tibia 96
115 Posterior Impulse on Tibia High Lumbar Flex/Ext Low Lumbar Flex/Ext High Lumbar Rotation Low Lumbar Rotation High Stride Length 100% Core Activation 80% Core Activation 60% Core Activation Low Stride Length Impulse (N*s) Figure 39: Posterior Impulse on Tibia Peak Downward Force on Tibia High Lumbar Flex/Ext Low Lumbar Flex/Ext High Lumbar Rotation Low Lumbar Rotation High Stride Length 100% Core Activation 80% Core Activation 60% Core Activation Low Stride Length Force (N) Figure 40: Peak Downward Force on Tibia 97
116 Downward Impulse on Tibia High Lumbar Flex/Ext Low Lumbar Flex/Ext High Lumbar Rotation Low Lumbar Rotation High Stride Length 100% Core Activation 80% Core Activation 60% Core Activation Low Stride Length Impulse (N*s) Figure 41: Peak Downward Impulse on Tibia Peak Medial Force on Tibia High Lumbar Flex/Ext Low Lumbar Flex/Ext High Lumbar Rotation Low Lumbar Rotation High Stride Length 100% Core Activation 80% Core Activation 60% Core Activation Low Stride Length Force (N) Figure 42: Peak Medial Force on Tibia 98
117 Medial Impulse on Tibia High Lumbar Flex/Ext Low Lumbar Flex/Ext High Lumbar Rotation Low Lumbar Rotation High Stride Length 100% Core Activation 80% Core Activation 60% Core Activation Low Stride Length Impulse (N*s) Figure 43: Medial Impulse on Tibia Peak Adduction Moment on Tibia High Lumbar Flex/Ext Low Lumbar Flex/Ext High Lumbar Rotation Low Lumbar Rotation High Stride Length 100% Core Activation 80% Core Activation 60% Core Activation Low Stride Length Moment (Nm) Figure 44: Peak Adduction Moment on Tibia 99
118 Adduction Angular Impulse on Tibia High Lumbar Flex/Ext Low Lumbar Flex/Ext High Lumbar Rotation Low Lumbar Rotation High Stride Length 100% Core Activation 80% Core Activation 60% Core Activation Low Stride Length Angular Impulse (Nm*s) Figure 45: Adduction Angular Impulse on Tibia Peak Abduction Moment on Tibia High Lumbar Flex/Ext Low Lumbar Flex/Ext High Lumbar Rotation Low Lumbar Rotation High Stride Length 100% Core Activation 80% Core Activation 60% Core Activation Low Stride Length Moment (Nm) Figure 46: Peak Abduction Moment on Tibia 100
119 Abduction Angular Impulse on Tibia High Lumbar Flex/Ext Low Lumbar Flex/Ext High Lumbar Rotation Low Lumbar Rotation High Stride Length 100% Core Activation 80% Core Activation 60% Core Activation Low Stride Length Angular Impulse (Nm*s) Figure 47: Abduction Angular Impulse on Tibia Peak Interior Rotation Moment on Tibia High Lumbar Flex/Ext Low Lumbar Flex/Ext High Lumbar Rotation Low Lumbar Rotation High Stride Length 100% Core Activation 80% Core Activation 60% Core Activation Low Stride Length Moment (Nm) Figure 48: Peak Interior Rotation Moment on Tibia 101
120 Interior Rotation Angular Impulse on Tibia High Lumbar Flex/Ext Low Lumbar Flex/Ext High Lumbar Rotation Low Lumbar Rotation High Stride Length 100% Core Activation 80% Core Activation 60% Core Activation Low Stride Length Angular Impulse (Nm)*s Figure 49: Interior Rotation Angular Impulse on Tibia Peak Exterior Rotation Moment on Tibia High Lumbar Flex/Ext Low Lumbar Flex/Ext High Lumbar Rotation Low Lumbar Rotation High Stride Length 100% Core Activation 80% Core Activation 60% Core Activation Low Stride Length Moment (Nm) Figure 50: Peak Exterior Rotation Moment on Tibia 102
121 Exterior Rotation Angular Impulse on Tibia High Lumbar Flex/Ext Low Lumbar Flex/Ext High Lumbar Rotation Low Lumbar Rotation High Stride Length 100% Core Activation 80% Core Activation 60% Core Activation Low Stride Length Angular Impulse (Nm*s) Figure 51: Exterior Rotation Angular Impulse on Tibia Peak Extension Moment on Tibia High Lumbar Flex/Ext Low Lumbar Flex/Ext High Lumbar Rotation Low Lumbar Rotation High Stride Length 100% Core Activation 80% Core Activation 60% Core Activation Low Stride Length Moment (Nm) Figure 52: Peak Extension Moment on Tibia 103
122 Extension Angular Impulse on Tibia High Lumbar Flex/Ext Low Lumbar Flex/Ext High Lumbar Rotation Low Lumbar Rotation High Stride Length 100% Core Activation 80% Core Activation 60% Core Activation Low Stride Length Angular Impulse (Nm*s) Figure 53: Extension Angular Impulse on Tibia 104
123 Appendix C: All Knee Loading Line Graphs, Direct Output from OpenSim Figure 54: The Low Stride Length Subject's Knee Joint Reaction Loads 105
124 Figure 55: The High Stride Length Subject's Knee Joint Reaction Loads Figure 56: The Low Lumbar Rotation Subject's Knee Joint Reaction Loads 106
125 Figure 57: The High Lumbar Rotation Subject's Knee Joint Reaction Loads Figure 58: The Low Lumbar Flexion/Extension Subject's Knee Joint Reaction Loads 107
126 Figure 59: The High Lumbar Flexion/Extension Subject's Knee Joint Reaction Loads 108

127 Appendix D: Tables Quantifying and Summarizing Knee Loading for All Subjects Table 39: The Low Stride Length Subject's Numerical Knee Joint Reaction Loads 109

128 Table 40: The High Stride Length Subject's Numerical Knee Joint Reaction Loads 110

129 Table 41: The Low Lumbar Rotation Subject's Numerical Knee Joint Reaction Loads 111

130 Table 42: The High Lumbar Rotation Subject's Numerical Knee Joint Reaction Loads 112

131 Table 43: The Low Lumbar Flexion/Extension Subject's Numerical Knee Joint Reaction Loads 113

132 Table 44: The High Lumbar Flexion/Extension Subject's Numerical Knee Joint Reaction Loads 114
CHAPTER IV FINITE ELEMENT ANALYSIS OF THE KNEE JOINT WITHOUT A MEDICAL IMPLANT
 39 CHAPTER IV FINITE ELEMENT ANALYSIS OF THE KNEE JOINT WITHOUT A MEDICAL IMPLANT 4.1 Modeling in Biomechanics The human body, apart of all its other functions is a mechanical mechanism and a structure,
Simulation-based design to reduce metabolic cost
 Simulation-based design to reduce metabolic cost Overview: Lecture + Hands On Exercise 1. Generating and evaluating a muscledriven simulation of walking 2. Metabolics 101 3. Designing and evaluating devices
The Effect of a Seven Week Exercise Program on Golf Swing Performance and Musculoskeletal Screening Scores
 The Effect of a Seven Week Exercise Program on Golf Swing Performance and Musculoskeletal Screening Scores 2017 Mico Hannes Olivier Bachelor of Sport Science Faculty of Health Sciences and Medicine Bond
Supplementary Figure S1
 Supplementary Figure S1: Anterior and posterior views of the marker set used in the running gait trials. Forty-six markers were attached to the subject (15 markers on each leg, 4 markers on each arm, and
A bit of background. Session Schedule 3:00-3:10: Introduction & session overview. Overarching research theme: CPTA
 A Cognitive-Biomechanical Perspective for the Management of Common Chronic Musculoskeletal Conditions Skulpan Asavasopon, PT, PhD Loma Linda University Christopher M. Powers, PT, PhD, FAPTA University
Chapter 1 - Injury overview Chapter 2 - Fit for Running Assessment Chapter 3 - Soft Tissue Mobilization... 21
 Table of Contents Introduction Chapter 1 - Injury overview... 6 Chapter 2 - Fit for Running Assessment... 13 Chapter 3 - Soft Tissue Mobilization... 21 Chapter 4 - Dynamic Warm-up... 28 Chapter 5 - Strengthening...
Assessments SIMPLY GAIT. Posture and Gait. Observing Posture and Gait. Postural Assessment. Postural Assessment 6/28/2016
 Assessments 2 SIMPLY GAIT Understanding movement Evaluations of factors that help therapist form professional judgments Include health, palpatory, range of motion, postural, and gait assessments Assessments
Does Changing Step Width Alter Lower Extremity Biomechanics During Running?
 University of Tennessee, Knoxville Trace: Tennessee Research and Creative Exchange Masters Theses Graduate School 5-2012 Does Changing Step Width Alter Lower Extremity Biomechanics During Running? Richard
An investigation of kinematic and kinetic variables for the description of prosthetic gait using the ENOCH system
 An investigation of kinematic and kinetic variables for the description of prosthetic gait using the ENOCH system K. OBERG and H. LANSHAMMAR* Amputee Training and Research Unit, University Hospital, Fack,
In memory of Dr. Kevin P. Granata, my graduate advisor, who was killed protecting others on the morning of April 16, 2007.
 Acknowledgement In memory of Dr. Kevin P. Granata, my graduate advisor, who was killed protecting others on the morning of April 16, 2007. There are many others without whom I could not have completed
Artifacts Due to Filtering Mismatch in Drop Landing Moment Data
 Camenga et al. UW-L Journal of Undergraduate Research XVI (213) Artifacts Due to Filtering Mismatch in Drop Landing Moment Data Elizabeth T. Camenga, Casey J. Rutten, Brendan D. Gould, Jillian T. Asmus,
The Starting Point. Prosthetic Alignment in the Transtibial Amputee. Outline. COM Motion in the Coronal Plane
 Prosthetic Alignment in the Transtibial Amputee The Starting Point David C. Morgenroth, MD, Department of Rehabilitation Medicine University of Washington VAPSHCS Outline COM Motion in the Coronal Plane
Steffen Willwacher, Katina Fischer, Gert Peter Brüggemann Institute of Biomechanics and Orthopaedics, German Sport University, Cologne, Germany
 P01-3 ID126 SURFACE STIFFNESS AFFECTS JOINT LOADING IN RUNNING Steffen Willwacher, Katina Fischer, Gert Peter Brüggemann Institute of Biomechanics and Orthopaedics, German Sport University, Cologne, Germany
Association between Iliotibial Band Syndrome Status and Running Biomechanics in Women
 University of Tennessee, Knoxville Trace: Tennessee Research and Creative Exchange Doctoral Dissertations Graduate School 8-2013 Association between Iliotibial Band Syndrome Status and Running Biomechanics
ASSESMENT Introduction REPORTS Running Reports Walking Reports Written Report
 ASSESMENT REPORTS Introduction Left panel Avatar Playback Right Panel Patient Gait Parameters Report Tab Click on parameter to view avatar at that point in time 2 Introduction Software will compare gait
Posture influences ground reaction force: implications for crouch gait
 University of Tennessee, Knoxville From the SelectedWorks of Jeffrey A. Reinbolt July 14, 2010 Posture influences ground reaction force: implications for crouch gait H. X. Hoang Jeffrey A. Reinbolt, University
The importance of physical activity throughout an individual's life is indisputable. As healthcare
 What to Expect When They re Expecting: A Look at Biomechanical Changes in Walking/Running During Pregnancy Jennifer Bruer-Vandeweert, Megan Hotchkiss, Jamie Kronenberg, Kristin Olson Dr. Rumit Singh Kakar,
INTRODUCTION TO GAIT ANALYSIS DATA
 INTRODUCTION TO GAIT ANALYSIS DATA 1. Phases of gait a. Stance (% gc) i. Loading response (10%) ii. Mid- and terminal stance (%) iii. Pre-swing (10%) b. Swing (% gc) i. Initial swing ii. Mid-swing iii.
Denny Wells, Jacqueline Alderson, Kane Middleton and Cyril Donnelly
 11:45 am-12:00 pm Denny Wells. Assessing the accuracy of inverse kinematics in OpenSim to estimate elbow flexionextension during cricket bowling: Maintaining the rigid linked assumption. (201) ASSESSING
Purpose. Outline. Angle definition. Objectives:
 Disclosure Information AACPDM 69 th Annual Meeting October 21-24, 2015 Speaker Names: Sylvia Õunpuu, MSc and Kristan Pierz, MD Gait Analysis Data Interpretation: Understanding Kinematic Relationships Within
KICKBIKE Your key to optimum sports performance
 KICKBIKE Your key to optimum sports performance Efficient Running is essential to optimum performance of most sports we play. Whether we want to maximize our speed, maximize our endurance, or both, an
Running injuries - what are the most important factors
 Created as a free resource by Clinical Edge Based on Physio Edge podcast 59 with Greg Lehman, Tom Goom and Dr Christian Barton Get your free trial of online Physio education at Why do runners get injured?
GROUND REACTION FORCE DOMINANT VERSUS NON-DOMINANT SINGLE LEG STEP OFF
 GROUND REACTION FORCE DOMINANT VERSUS NON-DOMINANT SINGLE LEG STEP OFF Sara Gharabaghli, Rebecca Krogstad, Sara Lynch, Sofia Saavedra, and Tamara Wright California State University, San Marcos, San Marcos,
Ankle biomechanics demonstrates excessive and prolonged time to peak rearfoot eversion (see Foot Complex graph). We would not necessarily expect
. We would not necessarily expect") Case Study #1 The first case study is a runner presenting with bilateral shin splints with pain and tenderness along the medial aspect of the tibia. The symptoms have increased significantly over the last
Case Study #1 The first case study is a runner presenting with bilateral shin splints with pain and tenderness along the medial aspect of the tibia. The symptoms have increased significantly over the last
1. Hip flexion Muscles: Iliopsoas (psoas major + iliacus)
") Chap. 5 Testing the muscles of the Lower Extremity Part I. Manual Muscle Testing of the hip joint muscles 1. Hip flexion Muscles: Iliopsoas (psoas major + iliacus) Rectus femoris Sartorius Tensor fascia
Chap. 5 Testing the muscles of the Lower Extremity Part I. Manual Muscle Testing of the hip joint muscles 1. Hip flexion Muscles: Iliopsoas (psoas major + iliacus) Rectus femoris Sartorius Tensor fascia
Gait. Kinesiology RHS 341 Lecture 12 Dr. Einas Al-Eisa
 Gait Kinesiology RHS 341 Lecture 12 Dr. Einas Al-Eisa Definitions Locomotion = the act of moving from one place to the other Gait = the manner of walking Definitions Walking = a smooth, highly coordinated,
Biomechanics and Models of Locomotion
 Physics-Based Models for People Tracking: Biomechanics and Models of Locomotion Marcus Brubaker 1 Leonid Sigal 1,2 David J Fleet 1 1 University of Toronto 2 Disney Research, Pittsburgh Biomechanics Biomechanics
REPORT. A comparative study of the mechanical and biomechanical behaviour of natural turf and hybrid turf for the practise of sports
 REPORT A comparative study of the mechanical and biomechanical behaviour of natural turf and hybrid turf for the practise of sports Addressed to: PSF - PALAU TURF Date: May 2015 Table of Contents SHEET
Normal Gait and Dynamic Function purpose of the foot in ambulation. Normal Gait and Dynamic Function purpose of the foot in ambulation
 Normal Gait and Dynamic Function purpose of the foot in ambulation Edward P. Mulligan, PT, DPT, OCS, SCS, ATC Assistant Professor; Residency Chair UT Southwestern School of Health Professions Department
Biomechanical Analysis of a Sprint Start. Anna Reponen JD Welch
 Biomechanical Analysis of a Sprint Start Anna Reponen JD Welch Introduction Our presentation will cover the Key Elements of our project. They will be presented along with the methods, results and discussion
Normal and Abnormal Gait
 Normal and Abnormal Gait Adrielle Fry, MD EvergreenHealth, Division of Sport and Spine University of Washington Board Review Course March 6, 2017 What are we going to cover? Definitions and key concepts
video Purpose Pathological Gait Objectives: Primary, Secondary and Compensatory Gait Deviations in CP AACPDM IC #3 1
 s in CP Disclosure Information AACPDM 71st Annual Meeting September 13-16, 2017 Speaker Names: Sylvia Ounpuu, MSc and Kristan Pierz, MD Differentiating Between, Secondary and Compensatory Mechanisms in
EDUCATION COURSES. Stride. Initial Swing (high knee) Mid stance Toe off Mid swing Initial contact
 Mid stance Toe off Mid swing Initial contact") EDUCATION COURSES RUNNING ANALYSIS Our purpose is performance enhancement. Improving speed and acceleration is the key to success in most ground-based sports. The ability to run from 0-5-10-20m as fast
EDUCATION COURSES RUNNING ANALYSIS Our purpose is performance enhancement. Improving speed and acceleration is the key to success in most ground-based sports. The ability to run from 0-5-10-20m as fast
Serve the only stroke in which the player has full control over its outcome. Bahamonde (2000) The higher the velocity, the smaller the margin of
 The higher the velocity, the smaller the margin of") Lower Extremity Performance of Tennis Serve Reporter: Chin-Fu Hsu Adviser: Lin-Hwa Wang OUTLINE Introduction Kinetic Chain Serve Types Lower Extremity Movement Summary Future Work INTRODUCTION Serve the
Lower Extremity Performance of Tennis Serve Reporter: Chin-Fu Hsu Adviser: Lin-Hwa Wang OUTLINE Introduction Kinetic Chain Serve Types Lower Extremity Movement Summary Future Work INTRODUCTION Serve the
+ t1 t2 moment-time curves
 Part 6 - Angular Kinematics / Angular Impulse 1. While jumping over a hurdle, an athlete s hip angle was measured to be 2.41 radians. Within 0.15 seconds, the hurdler s hip angle changed to be 3.29 radians.
Supplementary Figure 1 An insect model based on Drosophila melanogaster. (a)
") Supplementary Figure 1 An insect model based on Drosophila melanogaster. (a) Side and ventral images of adult female flies used to calculate the sizes of body and leg segments. Scale bar is 0.3 mm. Green,
Supplementary Figure 1 An insect model based on Drosophila melanogaster. (a) Side and ventral images of adult female flies used to calculate the sizes of body and leg segments. Scale bar is 0.3 mm. Green,
Comparison of Kinematics and Kinetics During Drop and Drop Jump Performance
 schouweiler, hess UW-L Journal of Undergraduate Research XIII (21) Comparison of Kinematics and Kinetics During Drop and Drop Jump Performance Ryan Schouweiler, Karina Hess Faculty Sponsor: Thomas Kernozek,
Sample Biomechanical Report
 Sample Biomechanical Report To identify the root cause of an injury, and thus determine the optimal treatment for that injury, many pieces of your injury puzzle must be considered. At the Running Injury
WHO ARE WE? Eric Marriott Registered Physiotherapist Master of Physical Therapy, Bachelor of Human Kinetics
 Capilano Golf Club May 26, 2014 WHO ARE WE? Dana Ranahan Registered Physiotherapist B.Sc., B.Sc.P.T., Fellow of the Canadian Academy of Manual and Manipulative Therapy (FCAMT), Diploma Sports Physiotherapy,
Equine Trust Summer Scholarship
 Development of 3D gait model Student: Nicola Wichtel Supervisor: Dr Robert Colborne Equine Trust Summer Scholarship In 2015, The Equine Trust funded the purchase of a 6-camera infrared kinematic system
Running from injury 2
 Created as a free resource by Clinical Edge Based on Physio Edge podcast 049 with Dr Rich Willy Get your free trial of online Physio education by clicking here Running injuries & assessment Running assessment
C-Brace Orthotronic Mobility System
 C-Brace Orthotronic Mobility System You ll always remember your first step Information for practitioners C-Brace Orthotics reinvented Until now, you and your patients with conditions like incomplete spinal
Analysis of Gait Characteristics Changes in Normal Walking and Fast Walking Of the Elderly People
 IOSR Journal of Engineering (IOSRJEN) ISSN (e): 2250-3021, ISSN (p): 2278-8719 Vol. 08, Issue 7 (July. 2018), V (V) 34-41 www.iosrjen.org Analysis of Gait Characteristics Changes in and Of the Elderly
THE ANKLE-HIP TRANSVERSE PLANE COUPLING DURING THE STANCE PHASE OF NORMAL WALKING
 THE ANKLE-HIP TRANSVERSE PLANE COUPLING DURING THE STANCE PHASE OF NORMAL WALKING Thales R. Souza, Rafael Z. Pinto, Renato G. Trede, Nadja C. Pereira, Renata N. Kirkwood and Sérgio T. Fonseca. Movement
Running Injuries in Adolescents Jeffrey Shilt, M.D. Part 1 Page 1
 Running Injuries in Adolescents Jeffrey Shilt, M.D. Chief Surgical Officer, The Woodlands, Texas Children's Hospital Associate Professor, Orthopedic and Scoliosis Surgery, Baylor College of Medicine Part
Ground Forces Impact on Release of Rotational Shot Put Technique
 Brigham Young University BYU ScholarsArchive All Theses and Dissertations 2014-12-01 Ground Forces Impact on Release of Rotational Shot Put Technique Niklas B. Arrhenius Brigham Young University - Provo
Gait Analysis at Your Fingertips:
 Gait Analysis at Your Fingertips: Enhancing Observational Gait Analysis Using Mobile Device Technology and the Edinburgh Visual Gait Scale Jon R. Davids, MD; Shriners Hospitals for Children Northern California;
Putting Report Details: Key and Diagrams: This section provides a visual diagram of the. information is saved in the client s database
 Quintic Putting Report Information Guide Putting Report Details: Enter personal details of the client or individual who is being analysed; name, email address, date, mass, height and handicap. This information
PROPER PITCHING MECHANICS
 PROPER PITCHING MECHANICS While each pitcher is a different person and can display some individuality in his mechanics, everyone has similar anatomy (the same muscles, bones and ligaments in the same locations)
A QUALITATIVE ANALYSIS OF THE HIGH RACQUET POSITION BACKHAND DRIVE OF AN ELITE RACQUETBALL PLAYER
 A QUALITATIVE ANALYSIS OF THE HIGH RACQUET POSITION BACKHAND DRIVE OF AN ELITE RACQUETBALL PLAYER John R. Stevenson Wayne P. Hollander Since 1950, when Joe Sobek put strings on his paddleball paddle, the
BASKETBALL INJURY PREVENTION
 BASKETBALL INJURY PREVENTION Basketball is listed as one of the highest injury producing sports due to the constant change of direction as well as the large amount of jumping and landing. The injury prevention
Current issues regarding induced acceleration analysis of walking using the integration method to decompose the GRF
 Current issues regarding induced acceleration analysis of walking using the integration method to decompose the GRF George Chen May 17, 2002 Stanford Neuromuscular Biomechanics Lab Group Muscle contribution
Notes Session #2. The second gravity organization system is the relationship of the feet with the ground.
 Notes Session #2 The first gravity organization system is the relationship of the head with space. The inner ear and the suboccipital muscles are critical here. The second gravity organization system is
THE IMPULSE-STEP IN THE JAVELIN THROW
 THE IMPULSE-STEP IN THE JAVELIN THROW Terseus Liebenberg North-West University Potchefstroom South Africa The most important biomechanical principle ultimately determining throwing distance is the release
Fall Prevention Midterm Report. Akram Alsamarae Lindsay Petku 03/09/2014 Dr. Mansoor Nasir
 Fall Prevention Midterm Report Akram Alsamarae Lindsay Petku 03/09/2014 Dr. Mansoor Nasir Updates to timeline Last semester we created a timeline that included important milestones. We have narrowed down
Palacký Univerzity in Olomouc Faculty of Physical Culture
 Project: Sophisticated biomechanic diagnostics of human movement Registration number: CZ.1.07/2.3.00/09.0209 Palacký Univerzity in Olomouc Faculty of Physical Culture Tento projekt je spolufinancován Evropským
Motion Control of a Bipedal Walking Robot
 Motion Control of a Bipedal Walking Robot Lai Wei Ying, Tang Howe Hing, Mohamed bin Hussein Faculty of Mechanical Engineering Universiti Teknologi Malaysia, 81310 UTM Skudai, Johor, Malaysia. Wylai2@live.my
Giovanni Alfonso Borelli Father of Biomechanics
 Giovanni Alfonso Borelli Father of Biomechanics 1608-1679 Peter Guy BSc DCh Private practice Whitby and Peterborough Professor Chiropody Faculty Michener Institute of Education at UHN Advisory Board Member
A Biomechanical Assessment of Gait Patterns and Risk of Associated Overuse Conditions among Mature Female Runners.
 A Biomechanical Assessment of Gait Patterns and Risk of Associated Overuse Conditions among Mature Female Runners. Submitted by Kim Louise Lilley to the University of Exeter as a thesis for the degree
Joint Torque Evaluation of Lower Limbs in Bicycle Pedaling
 11th conference of the International Sports Engineering Association, ISEA 216 Delft University of Technology; July 12 th Joint Torque Evaluation of Lower Limbs in Bicycle Pedaling Hiroki Yamazaki Akihiro
Equine Cannon Angle System
 Equine Cannon System How to interpret the results December 2010 Page 1 of 14 Table of Contents Introduction... 3 The Sagittal Plane... 4 The Coronal Plane... 5 Results Format... 6 How to Interpret the
BIOMECHANICAL MOVEMENT
 SECTION PART 5 5 CHAPTER 12 13 CHAPTER 12: Biomechanical movement Practice questions - text book pages 169-172 1) For which of the following is the athlete s centre of mass most likely to lie outside of
The Influence of Load Carrying Modes on Gait variables of Healthy Indian Women
 The Influence of Load Carrying Modes on Gait variables of Healthy Indian Women *Guha Thakurta A, Iqbal R and De A National Institute of Industrial Engineering, Powai, Vihar Lake, Mumbai-400087, India,
Goodyear Safety Research Project 2008 Presentation by Competitive Measure at the FEI Eventing Safety Forum. Presented by Tim Deans and Martin Herbert
 Goodyear Safety Research Project 2008 Presentation by Competitive Measure at the FEI Eventing Safety Forum Presented by Tim Deans and Martin Herbert The presentation discusses the Goodyear Safety Research
video Outline Pre-requisites of Typical Gait Case Studies Case 1 L5 Myelomeningocele Case 1 L5 Myelomeningocele
 Outline Evaluation of Orthosis Function in Children with Neuromuscular Disorders Using Motion Analysis Outcomes Terminology Methods Typically developing Case examples variety of pathologies Sylvia Õunpuu,
by Michael Young Human Performance Consulting
 by Michael Young Human Performance Consulting The high performance division of USATF commissioned research to determine what variables were most critical to success in the shot put The objective of the
Development of an end-effector to simulate the foot to ball interaction of an instep kick in soccer
 Available online at www.sciencedirect.com Procedia Engineering 34 (2012 ) 284 289 9 th Conference of the International Sports Engineering Association (ISEA) Development of an end-effector to simulate the
Does isolated hip abductor fatigue lead to biomechanical changes of trunk, pelvis and lower leg during single-leg landing?
 Does isolated hip abductor fatigue lead to biomechanical changes of trunk, pelvis and lower leg during single-leg landing? Yu Iwama 1, Kengo Harato 1, Satoshi Imai 2, Aiko Sakurai 1, Yutaro Morishige 1,
The Mechanics of Modern BREASTSTROKE Swimming Dr Ralph Richards
 The Mechanics of Modern BREASTSTROKE Swimming Dr Ralph Richards Breaststroke is the least efficient of the four competition strokes because a large amount of water resistance is created due to body position
Impact Points and Their Effect on Trajectory in Soccer
 Proceedings Impact Points and Their Effect on Trajectory in Soccer Kaoru Kimachi 1, *, Sungchan Hong 2, Shuji Shimonagata 3 and Takeshi Asai 2 1 Doctoral Program of Coaching Science, University of Tsukuba,
PREVIEW ONLY SWIMMING FAST SWIMMING IN AUSTRALIA PHYSIOTHERAPY ASSESSMENT OF SWIMMERS. Cameron Elliott. These notes are a preview. Slides are limited.
 Be sure to convert to your own time zone at Cameron Elliott B.App.Sc (Physio) PHYSIOTHERAPY ASSESSMENT OF SWIMMERS Cameron Elliott SWIMMING IN AUSTRALIA Over 160,000 adults participate in organised swimming
Humanoid Robots and biped locomotion. Contact: Egidio Falotico
 Humanoid Robots and biped locomotion Contact: Egidio Falotico e.falotico@sssup.it Outline What is a Humanoid? Why Develop Humanoids? Challenges in Humanoid robotics Active vs Passive Locomotion Active
RUNNING SHOE STIFFNESS: THE EFFECT ON WALKING GAIT
 RUNNING SHOE STIFFNESS: THE EFFECT ON WALKING GAIT Stephen N Stanley, Peter J M c Nair, Angela G Walker, & Robert N Marshall Auckland Institute of Technology, Auckland, New Zealand University of Auckland,
HVORFOR OPSTÅR LØBESKADER?
 HVORFOR OPSTÅR LØBESKADER? PT, MHSc, PhD Post Doc at Section for Sport Science, Department of Public Health, Aarhus Universitet. Idrætsskader, epidemiologi og statistik OUR RESEARCH GROUP: Research coordinator
Back Pain in swimmers Aetiology
 Back Pain in swimmers Aetiology Risk factors: Suboptimal technique Inadequate core stability Tight paraspinal musculature Excessive load and abrupt changes in load 52 Back Pain in swimmers Aetiology Deconditioning
Kinetic chain checkpoints
 Kinetic chain checkpoints Observations: Foot/ankle Knee Lumbo-Pelvic-Hip-Complex (LPHC) Shoulder and Cervical Spine (upper body) Each joint region has a specific and optimal motion based on its structure
TITLE: Biomechanical Factors in the Etiology of Tibial Stress Fractures. CONTRACTING ORGANIZATION: University of Delaware Delaware, DE
 AD Award Number: DAMD17-00-1-0515 TITLE: Biomechanical Factors in the Etiology of Tibial Stress Fractures PRINCIPAL INVESTIGATOR: Irene S Davis Ph.D. CONTRACTING ORGANIZATION: University of Delaware Delaware,
KINEMATICS OF ELLIPTICAL AND TREADMILL EXERCISE. Bethany Lemanski Massachusetts Institute of Technology Cambridge, MA
 2.671 Measurement and Instrumentation Monday PM Lab Jason Sen May 15, 2012 KINEMATICS OF ELLIPTICAL AND TREADMILL EXERCISE Bethany Lemanski Massachusetts Institute of Technology Cambridge, MA ABSTRACT
Complex movement patterns of a bipedal walk
 1 Complex movement patterns of a bipedal walk Objectives After completing this lesson, you will be able to: Describe the complex movement patterns of a bipedal walk. Describe the biomechanics of walking
Element DS. Product Manual
 Element DS Product Manual Instructions The Element DS is designed to be maintenance free. The foot is water resistant; however, if the foot is submerged in water, the foot and foot shell should be rinsed
NHL & NHLPA Future Goals Program Hockey Scholar TM
 Curriculum Guide NHL & NHLPA Future Goals Program Hockey Scholar TM Your local NHL team has made it all the way to the Stanley Cup Final and now you just need to win 4 games to bring home the cup! You
IRC IRCOBI Conference 2016
 IRC-16-98 IRCOBI Conference 216 Development and Evaluation of the Advanced Pedestrian Legform Impactor Prototype which can be Applicable to All Types of Vehicles Regardless of Bumper Height Part 1: Finite
Sample Solution for Problem 1.a
 Sample Solution for Problem 1.a 1 Inverted Pendulum Model (IPM) 1.1 Equations of Motion and Ground Reaction Forces Figure 1: Scheme of the Inverted Pendulum Model (IPM). The equations of motion of this
Myths and Science in Cycling
 Myths and Science in Cycling John McDaniel, PhD Kent State University Jim Martin, PhD - U of Utah Steve Elmer, PhD- Michigan Tech Who am I PhD in Exercise Physiology under Dr. Jim Martin at the University
Running Gait Mechanics. Walking vs Running. Ankle Joint Complex Sagittal Plane. As speed increases, when has walking ended and running begun?
 Running Gait Mechanics Walking vs Running As speed increases, when has walking ended and running begun? Ankle Joint Complex Sagittal Plane 1 Ankle Joint Complex Sagittal Plane Pos. @FS 5 o DF Absorption
Dynamic Warm up. the age of the athlete current physical condition and prior exercise experience
 Dynamic Warm up 10-20 minutes May be dependent on: the age of the athlete current physical condition and prior exercise experience Prepares the body for the demands of a work out or practice Increases
ASB Clinical Biomechanics Award Winner 2006 Prospective study of the biomechanical factors associated with iliotibial band syndrome
 Clinical Biomechanics 22 (2007) 951 956 www.elsevier.com/locate/clinbiomech ASB Clinical Biomechanics Award Winner 2006 Prospective study of the biomechanical factors associated with iliotibial band syndrome
Rules of Hurdling. Distance Between Hurdles
 The Hurdle Events Introduction Brief discussion of rules, safety practices, and talent demands for the hurdles. Examine technical and training considerations for the hurdle events. 100 Meter Hurdles for
AEROBIC GYMNASTICS Code of Points APPENDIX II Guide to Judging Execution and Difficulty
 FÉDÉRATION INTERNATIONALE DE GYMNASTIQUE FONDÉE EN 1881 AEROBIC GYMNASTICS Code of Points 2009 2012 DRAFT OCTOBER 2008 APPENDIX II Guide to Judging Execution and Difficulty Page 1 of 80 INTRODUCTION This
Coaching the Triple Jump Boo Schexnayder
 I. Understanding the Event A. The Run and Its Purpose B. Hip Undulation and the Phases C. Making the Connection II. III. IV. The Approach Run A. Phases B. Technical Features 1. Posture 2. Progressive Body
PREDICTED CHANGES IN THE KNEE ADDUCTION TORQUE DUE TO GAIT MODIFICATIONS
 PREDICTED CHANGES IN THE KNEE ADDUCTION TORQUE DUE TO GAIT MODIFICATIONS By KELLY L. ROONEY A THESIS PRESENTED TO THE GRADUATE SCHOOL OF THE UNIVERSITY OF FLORIDA IN PARTIAL FULFILLMENT OF THE REQUIREMENTS
Modeling of Hydraulic Hose Paths
 Mechanical Engineering Conference Presentations, Papers, and Proceedings Mechanical Engineering 9-2002 Modeling of Hydraulic Hose Paths Kurt A. Chipperfield Iowa State University Judy M. Vance Iowa State
A Biomechanical Approach to Javelin. Blake Vajgrt. Concordia University. December 5 th, 2012
 A Biomechanical Approach to Javelin Blake Vajgrt Concordia University December 5 th, 2012 The Biomechanical Approach to Javelin 2 The Biomechanical Approach to Javelin Javelin is one of the four throwing
GOLF SPECIFIC DYNAMIC WARM UP
 GOLF SPECIFIC DYNAMIC WARM UP Golf-related injury is common. The three most common areas injured include: 1. The back 2. The wrists, and 3. The elbows. A golf-specific dynamic warm-up is recommended by
ROSE-HULMAN INSTITUTE OF TECHNOLOGY Department of Mechanical Engineering. Mini-project 3 Tennis ball launcher
 Mini-project 3 Tennis ball launcher Mini-Project 3 requires you to use MATLAB to model the trajectory of a tennis ball being shot from a tennis ball launcher to a player. The tennis ball trajectory model
Modeling Human Movement
 CS 4732: Computer Animation Modeling Human Movement Robert W. Lindeman Associate Professor Department of Computer Science Worcester Polytechnic Institute gogo@wpi.edu Modeling Human Movement: It s Hard!
Improving Your Golf Swing Mechanics With Active Release Technique
 Edgemont Chiropractic Soft Tissue Management Systems The focus of our clinic is treatment of soft tissue injuries and the improvement of athletic performance. Our patients range from Olympic athletes to
ScienceDirect. Improvement of three-dimensional motion analyzer system for the development of Indonesian gait database
 Available online at www.sciencedirect.com ScienceDirect Procedia Manufacturing 2 (2015 ) 268 274 2nd International Materials, Industrial, and Manufacturing Engineering Conference, MIMEC2015, 4-6 February
GCD Variables. Steps and Strides. Walking Speed. Cadence. Stride Length
 Variables Steps and Strides Each time a leg goes forward, it makes a step the right leg moves forward to make a right step and then the left leg moved forward for a left step. When a right and left step
Walking Tall - What Your Client's Gait Can
 Session # 488 Walking Tall - What Your Client's Gait Can Tell You Before They Even Speak! Presented by, CHEK Faculty What is Gait? Gait is the scientific term that describes walking. Also one of the seven