Fall Prevention Midterm Report. Akram Alsamarae Lindsay Petku 03/09/2014 Dr. Mansoor Nasir
|
|
|
- Tabitha Weaver
- 5 years ago
- Views:
Transcription
1 Fall Prevention Midterm Report Akram Alsamarae Lindsay Petku 03/09/2014 Dr. Mansoor Nasir
2 Updates to timeline Last semester we created a timeline that included important milestones. We have narrowed down locations of sensors based upon data we have acquired and analyzed in MATLAB, as well as based upon literature related to gait analysis. We began with sensors on the lower legs (the gastrocnemius muscle) and the upper leg in the front (rectus femoris), as well as in the back (biceps femoris), and in addition two sensors were placed on either side of the abdomen (rectus abdominis). These are the main muscles in the lower and upper extremities and were chosen to produce the strongest signal. Graphs of the results for these sensors are located in the appix. Based on the reproducibility of the graphs and the amplitude of the signals, or the lack-thereof, we have narrowed down the location of the sensors to the lower leg, and the abdomen. In the next two weeks we will bring people into the lab and run full trials as explained in our completed protocol: the trials we are planning are in the proposal section of this document. Gathering trials from subjects should be completed by the of March. Older adults will be used for the trials, and in order to achieve a large amount of data, some other students have volunteered to be subjects for our trials. Once the trials are completed and the data is analyzed, we will begin to write an algorithm which can assess the risk for falling. Once the algorithm is created we can assess its validity by running a few more trials and inputting the new data into the algorithm. We then will write the final report and create the final presentation. Concurrently, Akram will be taking a lead on writing a paper on our findings to be submitted to IEEE-EMBS (time permitting) or to BMES. Weekly Timeline Week of 3/10 Data gathering with subjects IEEE paper (Time permitting 03/17/14) Week of 3/17 Analysis with Matlab IEEE paper (Due 03/17/14) Week of 3/24 Write algorithm Week of 3/31 Write algorithm BMES paper (Due 04/23/14) Week of 4/07 Write algorithm BMES paper (Due 04/23/14) Write final paper Week of 4/14 BMES paper finalize (Due 4/23/14) Write final paper Prepare poster (Due 4/24/14) Week of 4/21 Poster presentation finalize (Due 4/24/14)
3 Submit BMES paper (Due 04/23/14 Write Final Paper (Due 05/7/14) Final presentation (05/02/14) Week of 4/28 Finalize paper (Due 05/7/14) Presentation (05/02/14) Explanation for any major changes in project outcomes The main project has remained relatively the same. We are however taking a more research based approach versus a commercial product. Our goal remains that we should have a basic design for what would be included in this system; this includes a program for assessing risks, a way to write this program to a microprocessor, as well as a design for the main components of the system. Our research shall be looking for different patterns in the data we collect, and looking to see if there is an accurate way to assess fall risk. Due to the fact that we are not able to collect fall data, we will need to compare our data to literature based on statistical analysis comparing fallers and non-fallers. Another major aspect of our project has emerged: if our device cannot detect a fall that is inevitable to occur, it may be able to generate reports that a doctor can look at and see how your gait is changing over time. This has always been an important aspect to us, and we shall determine the parameters which can be reported to the doctor or care provider. This aspect may be able to prevent a fall days before it will occur, due to a possible change in your gait days before it actually causes you to fall down. This concept is already being used today; when someone goes to the doctors they might take some kind of data from the patient about their gait. Our approach is different in the fact that this data will be continuously taken, every day, and even slight changes can be seen far in advance. This may seem like overkill, but if this is your LIFE, then this may be just the step we need. Many athletes use devices that can tell them how they are training, our device will be geared toward the elderly. Completed Tasks Create an experimental protocol Lindsay - Subject preparation Akram- DELSYS operation Master DELSYS system Akram Learn MATLAB Uploading file Creating plots
4 Measuring number of peaks Getting rid of offset in X acceleration data Looking at FFT with signal processing toolbox; investigated some low pass filters-data from accelerometer can be cleaned up nicely with 1-10Hz low pass filters Test system with many sensors Narrow down sensor placement to key areas Lindsay-accelerometer data on lower leg and torso as opposed to using upper leg Akram- EMG on lower leg and torso Revise experimental protocol based on findings Current Tasks Test on many subjects Plan on running a test with many subjects during spring break and afterwards as well Lindsay: in charge of subject preparation and instruction Akram: in charge of running DELSYS and exporting data into a usable file Write paper for IEEE or BMES Fall detection indicators based on EMG/Accelerometer Sensor placement evaluation to determine which sensor site provide a reliable fall risk assessment Continue with literature search for fall data Lindsay: will continue to look at what people have done with accelerometers Akram: will look at EMG Finish writing algorithm to determine fall risk Lindsay: will focus on accelerometer data Matlab Tasks Categorize different steps (small, medium, large, etc.) Calculate moving average/overlay steps to compare Investigate RMS for various individuals at various walking speeds (compare to literature Narrow down which axis is most important Based on any relevant literature, Akram will look at how EMG can be used to assess fall risk Akram will correlate EMG data with Accelerometer data
5 Accomplishments and tasks done since the start of this semester Since last semester we have made progress on a number of fronts. We have analyzed enough data using sensors at various locations to determine where desired sensors should be placed. We began by placing sensors on the lower leg (gastrocnemius) and compared it to the upper leg (rectus femoris). Studying the results of this trial we found that the lower leg had much better data with regards to reproducibility as compared to the upper leg; this is based on graphs generated in MATLAB which show that the lower leg has a waveform which remains the same in shape as well as amplitude. We further studied placing sensors on the torso and found that we got good signal from both accelerometer and EMG. To ensure consistency in trials, we created a belt that had locations for two sensors on either side of the torso. Another reason to use the sensors at this location is based upon literature; studies have been done relating the root mean square value (RMS) of the torso acceleration to an increased fall risk and we will be assessing the validity of these studies in our own trials. We have also been able to connect the DELSYS sensing system to our laptops which will allow us greater portability. We are no longer tethered to the biomechanics lab and we can take the device to wherever we would like to test. We have gathered a lot of data and we are currently analyzing it using Matlab. With Matlab, we are taking raw data and running scripts to plot and display the data and to determine aspects such as step frequency and RMS. Code for these is contained in the appix. With this data, we are creating an algorithm to highlight when risky gait is detected. Detail for projected tasks / experiments / tests (Planned) The following protocol highlights the study setup that we will be testing on individuals. We plan on doing several trials with various older adults as well as other students who wish to volunteer, in order to gather substantial amounts of data. In order to determine that there is indeed a walking pattern that remains the same for different individuals we will need to gather enough data to prove significant. We will be utilizing the DELSYS sensor system to capture real-time acceleration and EMG data. Two sensors will be attached to a belt and two to the lower legs; participants will be instructed to perform pre-determined tasks. Each participant s demographic data will be taken (ger, age, height, weight) and they will have to perform the following tasks:
6 1. For trial 1, the subject will be asked to walk normally for 5 minutes. He/she will walk continuously along the pre-measured distances. Note: Each individual may walk a different distance but it is important that the total distance is recorded. 2. For trial 2, the subject will sit for 3 minutes in a chair and then will get up from the chair (in any way comfortable to the subject) and walk for 2 minutes. 3. For trial 3, the subject will be directed to walk up a flight of stairs and then back down a flight of stairs. The process will also be recorded on video, with the individual s consent, to make it easier to correspond to the data being captured by DELSYS. List of items bought and their application We are utilizing a belt brace to secure the DELSYS sensors on the torso. The belt also protects the sensors as well as ensures a similar location for sensor placement from person to person. Due to the fact that we are using DELSYS and MATLAB, both provided by LTU, we did not need to purchase any accelerometers or other electronics. Our goal is to develop an algorithm and determine how it will be implemented into a device, as well as a design for various components of the device. For this reason we will not need to purchase any microprocessors or other components; but we will have a detailed plan of what should be the next step if this device is created. Any awards and updates to business plan (if applicable) We submitted a grant proposal to NCIIA on February. The E-team Program focuses on entrepreneurship with funding, training, coaching and investment. Our proposal titled Gait Buddy described the value proposition, timeline, and other aspects of the project. Meeting minutes / Communication with advisors We have met weekly with Dr. Nasir to discuss progress. We have also been communicating biweekly with Dr. Abdullah to provide updates and input on our progress. We have kept a notebook with notes regarding our progress as well as meeting minutes.
7 Appix
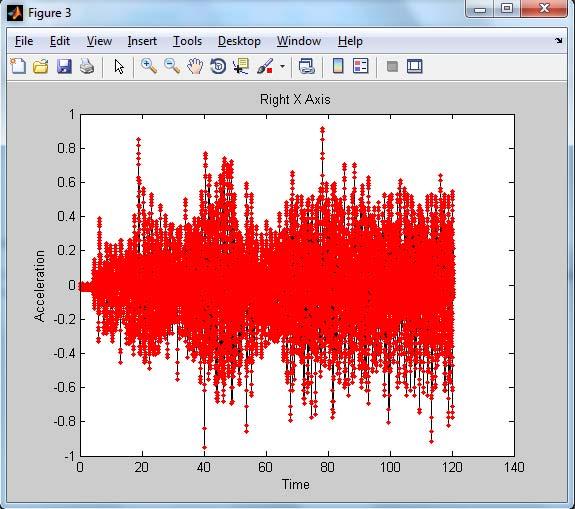
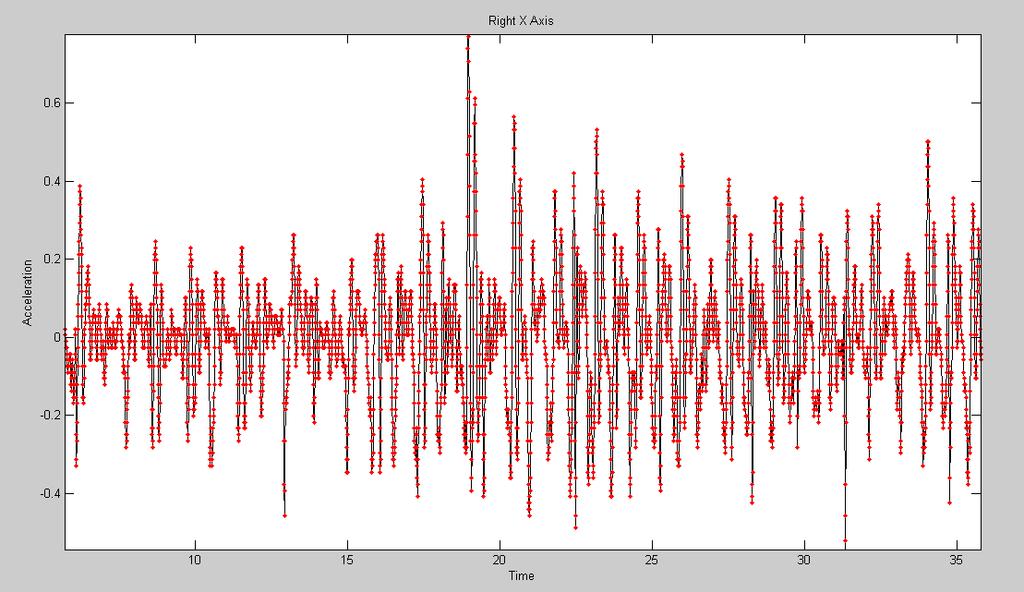
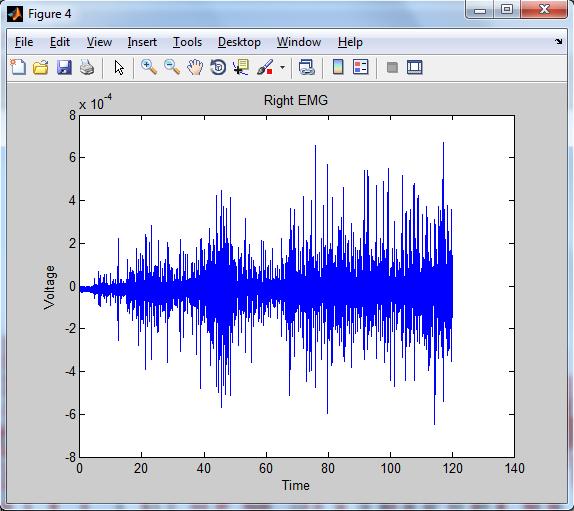
8 Treadmill Trial: Graphs of EMG and Acceleration For this trial, we wished to narrow down the location of sensors which we will focus on. We used a treadmill to ensure consistent speed during the trial and we were looking for which sensors show the most reproducible results. Figure 1: Right Gastrocnemius Figure 2: Right Rectus Femoris

9 Figure 3: Right Semitinosus Figure 4: Left Gastrocnemius

10 Figure 5: Left Rectus Femoris Figure 6: Left Semitinosus

11 Figure 7: Right Gastrocnemius Figure 8: Right Rectus Femoris

12 Figure 9: Right Semitinosus Figure 10: Left Gastrocnemius

13 Figure 11: Left Rectus Femoris Figure 12: Left Semitinosus
14 Treadmill Trial: Code %This is for 6 sensors! clear all; close all; % Get file, make sure path name is the folder where the data is stored [FileName PathName] = uigetfile({'*.txt', 'Text data (*.txt)';'*.*', 'All Files (*.*)'}) ; cd ('C:\Users\lpetku\Desktop\Preliminary Sensor Placement') [Time, EMG_S1, x_s1, y_s1, z_s1, EMG_S2, x_s2, y_s2, z_s2, EMG_S3, x_s3, y_s3, z_s3, EMG_S4, x_s4, y_s4, z_s4, EMG_S5, x_s5, y_s5, z_s5, EMG_S6, x_s6, y_s6, z_s6] = textread('trial_tredmill.txt','%f %f %f %f %f %f %f %f %f %f %f %f %f %f %f %f %f %f %f %f %f %f %f %f %f','headerlines',1); %Correcting for varying sample rate %Number of data points in accelerometer data numofdataptsa=find((x_s1)==0,1)-1; %Number of data points in EMG data numofdataptse=length(emg_s1); %sample rate sampleratea=numofdataptsa/max(time); sampleratee=numofdataptse/max(time); %Fixing acceleration plot time Time2=linspace(0,max(Time),numOfDataPtsA); %Fixing acceleration variables x_s1a=x_s1(1:numofdataptsa)-mean(x_s1(1:numofdataptsa)); y_s1a=y_s1(1:numofdataptsa); z_s1a=z_s1(1:numofdataptsa); x_s2a=x_s2(1:numofdataptsa)-mean(x_s2(1:numofdataptsa)); y_s2a=y_s2(1:numofdataptsa); z_s2a=z_s2(1:numofdataptsa); x_s3a=x_s3(1:numofdataptsa)-mean(x_s3(1:numofdataptsa)); y_s3a=y_s3(1:numofdataptsa); z_s3a=z_s3(1:numofdataptsa); x_s4a=x_s4(1:numofdataptsa)-mean(x_s4(1:numofdataptsa)); y_s4a=y_s4(1:numofdataptsa); z_s4a=z_s4(1:numofdataptsa); x_s5a=x_s5(1:numofdataptsa)-mean(x_s5(1:numofdataptsa)); y_s5a=y_s5(1:numofdataptsa); z_s5a=z_s5(1:numofdataptsa); x_s6a=x_s6(1:numofdataptsa)-mean(x_s6(1:numofdataptsa)); y_s6a=y_s6(1:numofdataptsa); z_s6a=z_s6(1:numofdataptsa);
15 %%Show plots of EMG figure plot(time,emg_s1,'b'); xlabel('time(s)'); ylabel('voltage'); title('muscle Activation of Right Gastrocnemius Muscle During Normal Walking'); title('sensor 1'); figure plot(time,emg_s2,'b'); xlabel('time (s)'); ylabel('voltage'); title('sensor 2'); figure plot(time,emg_s3,'b'); xlabel('time (s)'); ylabel('voltage'); title('sensor 3'); figure plot(time,emg_s4,'b'); xlabel('time (s)'); ylabel('voltage'); title('sensor 4'); figure plot(time,emg_s5,'b'); xlabel('time (s)'); ylabel('voltage'); title('sensor 5'); figure plot(time,emg_s6,'b'); xlabel('time (s)'); ylabel('voltage'); title('sensor 6'); %%Plot acceleration figure plot(time2,x_s1a,'k',time2,y_s1a,'r',time2,z_s1a,'m'); xlabel('time (s)'); ylabel('acceleration (g)'); title('sensor 1'); leg('x','y','z'); figure plot(time2,x_s2a,'k',time2,y_s2a,'r',time2,z_s2a,'m'); xlabel('time (s)'); ylabel('acceleration (g)'); title('sensor 2'); leg('x','y','z'); figure
16 plot(time2,x_s3a,'k',time2,y_s3a,'r',time2,z_s3a,'m'); xlabel('time (s)'); ylabel('acceleration (g)'); title('sensor 3'); leg('x','y','z'); figure plot(time2,x_s4a,'k',time2,y_s4a,'r',time2,z_s4a,'m'); xlabel('time (s)'); ylabel('acceleration (g)'); title('sensor 4'); leg('x','y','z'); figure plot(time2,x_s5a,'k',time2,y_s5a,'r',time2,z_s5a,'m'); xlabel('time (s)'); ylabel('acceleration (g)'); title('sensor 5'); leg('x','y','z'); figure plot(time2,x_s6a,'k',time2,y_s6a,'r',time2,z_s6a,'m'); xlabel('time (s)'); ylabel('acceleration (g)'); title('sensor 6'); leg('x','y','z');


17 Trial with Belt This trial is focused on the only the two sensors on the torso. Due to the variability of this trial, it seems that it will be necessary to use the 4 sensor set up.
18
19

20 Analysis of RMS based on the two sensors in the belt Variables labeled RMSnorm are parts of the data that are normal. With RUN 26 FINAL, Akram simulated a loss of balance incident by simply tripping over his own feet. This alone changed the peak to peak value of the signal and it can be seen in the graphs. RMSabnorm is the part of the data that contains the loss of balance incident.

21 RMS for data between 0 and 25 seconds: RMSnormRX = RMSnormRY = RMSnormRZ = RMSnormLX = RMSnormLY = RMSnormLZ = RMS for data between 25 and 30 seconds
22 RMSabnormRX = RMSabnormRY = RMSabnormRZ = RMSabnormLX = RMSabnormLY = RMSabnormLZ = x y z Left Normal Right Normal Left Abnormal Right Abnormal
23 Sensor placement determination involves looking at many factors each with pros and cons. The following two graphs are comparing the EMG signal between the gastrocnemius muscle and rectus femoris. When scaled, we see that the top graph has strong signal from the left leg while the right leg is quite diminished. Comparing those results to the rectus femoris we see that signal is stronger in both and is easier to distinguish R GASTROCNEMIUS MEDIAL HEAD (1): EMG 5->Scale, L GASTROCNEMIUS MEDIAL HEAD (1): [Volts] R GASTROCNEMIUS MEDIAL HEAD (1): EMG 5->Scale L GASTROCNEMIUS MEDIAL HEAD (1): EMG 6->Scale [s] R RECTUS FEMORIS: EMG 1->Scale, L RECTUS FEMORIS: EMG 2->Scale [Volts] R RECTUS FEMORIS: EMG 1->Scale L RECTUS FEMORIS: EMG 2->Scale [s]
24 Analyzing mean average values we see similar results as compared to the scaled values above. We note that the gastrocnemius seems to have strong signal output for just the left leg. We believe the poor results in this trial can be attributed to improper placement of the sensor on the right leg. We can see in the graph of the femoris muscle, we have very nice graph output for both right and left leg R GASTROCNEMIUS MEDIAL HEAD (1): EMG 5->MAV, L GASTROCNEMIUS MEDIAL HEAD (1): E [Volts] R GASTROCNEMIUS MEDIAL HEAD (1): EMG 5->MAV L GASTROCNEMIUS MEDIAL HEAD (1): EMG 6->MAV [s] R RECTUS FEMORIS: EMG 1->MAV, L RECTUS FEMORIS: EMG 2->MAV [Volts] e-005 6e-005 4e-005 2e R RECTUS FEMORIS: EMG 1->MAV L RECTUS FEMORIS: EMG 2->MAV [s]
25 When comparing the moving average data we see that in the first graph with sensors placed on rectus femoris, we have very clear EMG data from both legs. Unfortunately in the second graph, we see that the gastrocnemius muscle has strong EMG signal in the left leg but not in the right leg. The most likely explanation for this result is the improper placement of the sensor on the right leg. 2e-005 R RECTUS FEMORIS: EMG 1->MOV, L RECTUS FEMORIS: EMG 2->MOV 1e e-005 [Volts] -2e-005-3e-005-4e-005-5e-005 R RECTUS FEMORIS: EMG 1->MOV L RECTUS FEMORIS: EMG 2->MOV [s] R GASTROCNEMIUS MEDIAL HEAD (1): EMG 5->MOV, L GASTROCNEMIUS MEDIAL HEAD (1): E e-005 [Volts] 0-5e R GASTROCNEMIUS MEDIAL HEAD (1): EMG 5->MOV L GASTROCNEMIUS MEDIAL HEAD (1): EMG 6->MOV [s]
26 Peak Detector This is the code for detecting peaks. It works well for the first sensor but for the rest it does not. This helps us determine that the first sensor is very useful, in terms of the amplitude of the peaks. For the rest, the amplitude of the peaks varies too greatly to use. The first sensor is the right gastrocnemius. Ultimately this can be used to find the peak for any set of data; however, the threshold must be adjusted to ensure accuracy, and this must be done by looking at each set of data individually. %This will be used to find step frequency/muscle activation frequency %It works well for the first but for the rest it does not %Make sure OpenandPlot file is in same folder as data and this script %Opening Data OpenandPlot %Count the number of beats for EMG %APM is the activations per minute of each sensor %For the first sensor a threshold of.0008 works well beat_count1=0; for k=2:length(emg_s1)-1 if (EMG_S1(k)>EMG_S1(k-1) && EMG_S1(k)>EMG_S1(k+1) && EMG_S1(k)>.0008) beat_count1=beat_count1+1; APM1=beat_count1/(max(Time)/60) beat_count2=0; for k=2:length(emg_s2)-1 if (EMG_S2(k)>EMG_S2(k-1) && EMG_S2(k)>EMG_S2(k+1) && EMG_S2(k)>.0002) beat_count2=beat_count2+1; APM2=beat_count2/(max(Time)/60) beat_count3=0; for k=2:length(emg_s3)-1 if (EMG_S3(k)>EMG_S3(k-1) && EMG_S3(k)>EMG_S3(k+1) && EMG_S3(k)>.0002) beat_count3=beat_count3+1; APM3=beat_count3/(max(Time)/60) beat_count4=0; for k=2:length(emg_s4)-1 if (EMG_S4(k)>EMG_S4(k-1) && EMG_S4(k)>EMG_S4(k+1) && EMG_S4(k)>.0004) beat_count4=beat_count4+1;
27 APM4=beat_count4/(max(Time)/60) beat_count5=0; for k=2:length(emg_s5)-1 if (EMG_S5(k)>EMG_S5(k-1) && EMG_S5(k)>EMG_S5(k+1) && EMG_S5(k)>.0005) beat_count5=beat_count5+1; APM5=beat_count5/(max(Time)/60) beat_count6=0; for k=2:length(emg_s6)-1 if (EMG_S6(k)>EMG_S6(k-1) && EMG_S6(k)>EMG_S6(k+1) && EMG_S6(k)>.0002) beat_count6=beat_count6+1; APM6=beat_count6/(max(Time)/60)
28 Step Count This is similar to the peak detector, though it is based on acceleration. It takes the average of the steps per minute of each acceleration (x, y and z) and determines the steps per minute. This same script can be used to determine the count for each sensor. close all clear all OpenandPlot %Sensor 1 step_countx1=0; for k=2:length(x_s1a)-1 if (x_s1a(k)<x_s1a(k-1) && x_s1a(k)<x_s1a(k+1) && x_s1a(k)<-1.7) step_countx1=step_countx1+1; step_county1=0; for k=2:length(y_s1a)-1 if (y_s1a(k)>y_s1a(k-1) && y_s1a(k)>y_s1a(k+1) && y_s1a(k)>.5) step_county1=step_county1+1; step_countz1=0; for k=2:length(z_s1a)-1 if (z_s1a(k)>z_s1a(k-1) && z_s1a(k)>z_s1a(k+1) && z_s1a(k)>.5) step_countz1=step_countz1+1; %Sensor 2 step_countx2=0; for k=2:length(x_s2a)-1 if (x_s2a(k)<x_s2a(k-1) && x_s2a(k)<x_s2a(k+1) && x_s2a(k)<-1.7) step_countx2=step_countx2+1; step_county2=0; for k=2:length(y_s2a)-1 if (y_s2a(k)>y_s2a(k-1) && y_s2a(k)>y_s2a(k+1) && y_s2a(k)>.5) step_county2=step_county2+1; step_countz2=0; for k=2:length(z_s2a)-1 if (z_s2a(k)>z_s2a(k-1) && z_s2a(k)>z_s2a(k+1) && z_s2a(k)>.5) step_countz2=step_countz2+1;
29 %Steps per minute %Take average of all step counts SPM1=((step_countx1+step_county1+step_countz1)/3)/(max(Time)/60) SPM2=((step_countx2+step_county2+step_countz2)/3)/(max(Time)/60)
siot-shoe: A Smart IoT-shoe for Gait Assistance (Miami University)
") siot-shoe: A Smart IoT-shoe for Gait Assistance (Miami University) Abstract Mark Sullivan, Casey Knox, Juan Ding Gait analysis through the Internet of Things (IoT) is able to provide an overall assessment
siot-shoe: A Smart IoT-shoe for Gait Assistance (Miami University) Abstract Mark Sullivan, Casey Knox, Juan Ding Gait analysis through the Internet of Things (IoT) is able to provide an overall assessment
How Do You Swing? You should be working with new lab partners starting with this lab.
 You should be working with new lab partners starting with this lab. Exploration: Swinging your arms and legs back and forth Discuss and try out the following questions within your lab group. After you
Stride Time Calculation from EMG and Foot Switch Data and Finding Corelation between Them for Prosthetic Control
 2012 International Conference on Environment Science and Engieering IPCBEE vol.3 2(2012) (2012)IACSIT Press, Singapoore Stride Time Calculation from EMG and Foot Switch Data and Finding Corelation between
Treadmill and daily life
 4 Treadmill and daily life Fall-related gait characteristics on the treadmill and in daily life, SM Rispens, JH van Dieën, KS van Schooten, LE Cofre Lizama, A Daffertshofer, PJ Beek, M Pijnappels, Journal
In addition to reading this assignment, also read Appendices A and B.
 1 Kinematics I Introduction In addition to reading this assignment, also read Appendices A and B. We will be using a motion detector to track the positions of objects with time in several lab exercises
Datalogging Shirt for Baseball Pitchers
 Datalogging Shirt for Baseball Pitchers Design Team Marcus Moché, Alexandra Morgan, David Schmidt Design Advisor Prof. M. Taslim Abstract Baseball pitcher elbow injuries have been increasing in frequency
TRAINING WITH! PHYSICLO RESISTANCE GEAR. Testing & Validation
 TRAINING WITH! PHYSICLO RESISTANCE GEAR Testing & Validation WHAT IS PHYSICLO? Physiclo is a novel type of compression pants with built-in resistance bands, designed to enhance training efficiency by increasing
Towards determining absolute velocity of freestyle swimming using 3-axis accelerometers
 Towards determining absolute velocity of freestyle swimming using 3-axis accelerometers Author Stamm, Andy, Thiel, David, Burkett, Brendan, James, Daniel Published 2011 Journal Title Procedia Engineering
SHUFFLE TURN OF HUMANOID ROBOT SIMULATION BASED ON EMG MEASUREMENT
 SHUFFLE TURN OF HUMANOID ROBOT SIMULATION BASED ON EMG MEASUREMENT MASANAO KOEDA, TAKAYUKI SERIZAWA, AND YUTA MATSUI Osaka Electro-Communication University, Faculty of Information Science and Arts, Department
Smart-Walk: An Intelligent Physiological Monitoring System for Smart Families
 Smart-Walk: An Intelligent Physiological Monitoring System for Smart Families P. Sundaravadivel 1, S. P. Mohanty 2, E. Kougianos 3, V. P. Yanambaka 4, and M. K. Ganapathiraju 5 University of North Texas,
Neuromuscular Reflexes
 Name: Neuromuscular Reflexes Experiment 14A The automatic response of a muscle to a stimulus is called a reflex. The patellar reflex results from tapping the patellar tendon below the knee with a reflex
Centre for Transport Studies
 Centre for Transport Studies University College London Research Progress Report Evaluation of Accessible Design of Public Transport Facilities Taku Fujiyama Centre for Transport Studies University College
Ranger Walking Initiation Stephanie Schneider 5/15/2012 Final Report for Cornell Ranger Research
 1 Ranger Walking Initiation Stephanie Schneider sns74@cornell.edu 5/15/2012 Final Report for Cornell Ranger Research Abstract I joined the Biorobotics Lab this semester to gain experience with an application
Transformation of nonfunctional spinal circuits into functional states after the loss of brain input
 Transformation of nonfunctional spinal circuits into functional states after the loss of brain input G. Courtine, Y. P. Gerasimenko, R. van den Brand, A. Yew, P. Musienko, H. Zhong, B. Song, Y. Ao, R.
Second Generation Bicycle Charging Station. Engineering Analysis
 Second Generation Bicycle Charging Station By Jonathan Jerome, Michael Klinefelter, Connor Kroneberger, Kori Molever, and Robert Rosenberg Team 22B Engineering Analysis Document Submitted towards partial
Line Following with RobotC Page 1
 Line Following with RobotC Page 1 Line Following with By Michael David Lawton Introduction Line following is perhaps the best way available to VEX Robotics teams to quickly and reliably get to a certain
A CO 2 Waveform Simulator For Evaluation and Testing of Respiratory Gas Analyzers
 2011 ROCKY MOUNTAIN NASA SPACE GRANT CONSORTIUM 1 A CO 2 Waveform Simulator For Evaluation and Testing of Respiratory Gas Analyzers Christina Long, and Joseph Orr, Ph.D. Department of Bioengineering, University
Electromyographic (EMG) Decomposition. Tutorial. Hamid R. Marateb, PhD; Kevin C. McGill, PhD
 Decomposition. Tutorial. Hamid R. Marateb, PhD; Kevin C. McGill, PhD") Electromyographic (EMG) Decomposition Tutorial Hamid R. Marateb, PhD; Kevin C. McGill, PhD H. Marateb is with the Biomedical Engineering Department, Faculty of Engineering, the University of Isfahan, Isfahan,
Electromyographic (EMG) Decomposition Tutorial Hamid R. Marateb, PhD; Kevin C. McGill, PhD H. Marateb is with the Biomedical Engineering Department, Faculty of Engineering, the University of Isfahan, Isfahan,
CS 528 Mobile and Ubiquitous Computing Lecture 7a: Applications of Activity Recognition + Machine Learning for Ubiquitous Computing.
 CS 528 Mobile and Ubiquitous Computing Lecture 7a: Applications of Activity Recognition + Machine Learning for Ubiquitous Computing Emmanuel Agu Applications of Activity Recognition Recall: Activity Recognition
Using Accelerometry: Methods Employed in NHANES
 Using Accelerometry: Methods Employed in NHANES Richard Troiano, Ph.D. David Berrigan, Ph.D. National Cancer Institute Overview NHANES Accelerometry Accelerometry Analytic Issues Decisions and data cleaning
DEVELOPMENT OF REAL-TIME EMG SONIFICATION SYSTEM FOR GAIT
 The 24 th International Conference on Auditory Display (ICAD 218) June 1-15, 218, Michigan Technological University DEVELOPMENT OF REAL-TIME EMG SONIFICATION SYSTEM FOR GAIT ABSTRACT We developed a system
WALKING MOTION ANALYSIS USING SMALL ACCELERATION SENSORS
 WALKING MOTION ANALYSIS USING SMALL ACCELERATION SENSORS Teruaki Ito Institute of Technology and Science University of Tokushima Tokushima, Japan e-mail: ito@me.tokushima-u.ac.jp Abstract Human walking
Does Ski Width Influence Muscle Action in an Elite Skier? A Case Study. Montana State University Movement Science Laboratory Bozeman, MT 59717
 Does Ski Width Influence Muscle Action in an Elite Skier? A Case Study John G. Seifert 1, Heidi Nunnikhoven 1, Cory Snyder 1, Ronald Kipp 2 1 Montana State University Movement Science Laboratory Bozeman,
Open Research Online The Open University s repository of research publications and other research outputs
 Open Research Online The Open University s repository of research publications and other research outputs Developing an intelligent table tennis umpiring system Conference or Workshop Item How to cite:
Electromyography Study on Lower Limb Muscle Synchronizations Strategies during Walking and Sitto-Stand Tasks on High-Heeled Shoes
 Electromyography Study on Lower Limb Muscle Synchronizations Strategies during Walking and Sitto-Stand Tasks on High-Heeled Shoes A Dissertation submitted for The partial fulfillment of Master of Engineering
D-Case Modeling Guide for Target System
 D-Case Modeling Guide for Target System 1/32 Table of Contents 1 Scope...4 2 Overview of D-Case and SysML Modeling Guide...4 2.1 Background and Purpose...4 2.2 Target System of Modeling Guide...5 2.3 Constitution
Standing Waves in a String
 Standing Waves in a String OBJECTIVE To understand the circumstances necessary to produce a standing wave. To observe and define the quantities associated with a standing wave. To determine the wavelength
Supplementary Figure S1
 Supplementary Figure S1: Anterior and posterior views of the marker set used in the running gait trials. Forty-six markers were attached to the subject (15 markers on each leg, 4 markers on each arm, and
14A. Neuromuscular Reflexes. Experiment
 Experiment 14A The automatic response of a muscle to a stimulus is called a reflex. The patellar reflex results from tapping the patellar tendon below the knee with a reflex hammer. This causes contraction
2600T Series Pressure Transmitters Plugged Impulse Line Detection Diagnostic. Pressure Measurement Engineered solutions for all applications
 Application Description AG/266PILD-EN Rev. C 2600T Series Pressure Transmitters Plugged Impulse Line Detection Diagnostic Pressure Measurement Engineered solutions for all applications Increase plant productivity
A Novel Approach to Predicting the Results of NBA Matches
 A Novel Approach to Predicting the Results of NBA Matches Omid Aryan Stanford University aryano@stanford.edu Ali Reza Sharafat Stanford University sharafat@stanford.edu Abstract The current paper presents
ME 8843-Advanced Mechatronics. Project Proposal-Automatic Bike Transmission
 ME 8843-Advanced Mechatronics Project Proposal-Automatic Bike Transmission 1/21/09 Razid Ahmad Brandon Borm Todd Sifleet Project Proposal: Our goal for the semester long project is to create and automatic
BLOOD PRESSURE SENSOR BT17i USER S GUIDE
 BLOOD PRESSURE SENSOR BT17i USER S GUIDE CENTRE FOR MICROCOMPUTER APPLICATIONS http://www.cma-science.nl Short description The Blood Pressure sensor BT17i allows measuring arterial blood pressure. The
RM-80 respiration monitor
 RM-80 respiration monitor User Manual September 18, 2015 0025-003M 950 North Hague Avenue Columbus, Ohio 43204-2121 USA Sales: sales@colinst.com Service: service@colinst.com Phone: (614) 276-0861 Fax:
Overview. 2 Module 13: Advanced Data Processing
 2 Module 13: Advanced Data Processing Overview This section of the course covers advanced data processing when profiling. We will discuss the removal of the fairly gross effects of ship heave and talk
Mobility Lab provides sensitive, valid and reliable outcome measures.
 Mobility Lab provides sensitive, valid and reliable outcome measures. ith hundreds of universities and hospitals using this system worldwide, Mobility Lab is the most trusted wearable gait and balance
SmartMan Code User Manual Section 5.0 Results
 SmartMan Code User Manual Section 5.0 Results For SmartMan Code, Megacode and Megacode Low Volume Table of Contents SmartMan Code User Manual Section 5.0 Results... 1 SMARTMAN CODE MEGACODE MEGACODE LOW
Use of On-Body Sensors to Support Elite Sprint Coaching
 Use of On-Body Sensors to Support Elite Sprint Coaching Kuntze, G. 1, Pias, M.R. 2, Bezodis, I.N. 1, Kerwin, D.G. 1, Coulouris, G. 2 and Irwin, G. 1 Cardiff School of Sport, University of Wales Institute,
Bicycle Safety Map System Based on Smartphone Aided Sensor Network
 , pp.38-43 http://dx.doi.org/10.14257/astl.2013.42.09 Bicycle Safety Map System Based on Smartphone Aided Sensor Network Dongwook Lee 1, Minsoo Hahn 1 1 Digital Media Lab., Korea Advanced Institute of
A Pilot Study on Electromyographic Analysis of Single and Double Revolution Jumps in Figure Skating
 Journal of Exercise Science and Physiotherapy, Vol. 5, No. 1: 14-19, 2009 A Pilot Study on Electromyographic Analysis of Single and Double Revolution Jumps in Figure Skating Taylor¹, C. L. and Psycharakis²,
FIG: 27.1 Tool String
 Bring up Radioactive Tracer service. Click Acquisition Box - Edit - Tool String Edit the tool string as necessary to reflect the tool string being run. This is important to insure proper offsets, filters,
Ball Toss. Vernier Motion Detector
 Experiment 6 When a juggler tosses a ball straight upward, the ball slows down until it reaches the top of its path. The ball then speeds up on its way back down. A graph of its velocity vs. time would
A Conceptual Approach for Using the UCF Driving Simulator as a Test Bed for High Risk Locations
 A Conceptual Approach for Using the UCF Driving Simulator as a Test Bed for High Risk Locations S. Chundi, M. Abdel-Aty, E. Radwan, H. Klee and E. Birriel Center for Advanced Transportation Simulation
Gait Analysis by High School Students
 Gait Analysis by High School Students André Heck 1 and Caroline van Dongen 2 1 AMSTEL Institute, University of Amsterdam, Amsterdam, The Netherlands, heck@science.uva.nl 2 St. Antoniuscollege, Gouda, The
Statistics of Bicycle Rider Motion
 Procedia Engineering 002 (2010) 1 62937 2942 Procedia Engineering www.elsevier.com/locate/procedia Statistics of Bicycle Rider Motion Jason K. Moore a,, Mont Hubbard a, A. L. Schwab b, J. D. G. Kooijman
Application Note AN-107
 SPEC Sensor TM Characterization & Calibration Considerations Scope This document is provided to describe the considerations needed to characterize, calibrate, verify and validate the measurement performance
User Activity Related Data Sets for Context Recognition
 User Activity Related Data Sets for Context Recognition Holger Junker 1, Paul Lukowicz 1,2, Gerhard Tröster 1 1 Wearable Computing Lab, ETH Zurich, Switzerland 2 Institute for Computer Systems and Networks,
Standard 3.1 The student will plan and conduct investigations in which
 Teacher Name: Tammy Heddings Date: April 04, 2009 Grade Level: 3-6 Subject: Science Time: 30 minutes Concept: Scientific Investigation Topic: Variables SOLs: Standard 3.1 The student will plan and conduct
Lab 1. Adiabatic and reversible compression of a gas
 Lab 1. Adiabatic and reversible compression of a gas Introduction The initial and final states of an adiabatic and reversible volume change of an ideal gas can be determined by the First Law of Thermodynamics
b
 Empirically Derived Breaking Strengths for Basket Hitches and Wrap Three Pull Two Webbing Anchors Thomas Evans a and Aaron Stavens b a Montana State University, Department of Earth Sciences, PO Box 173480,
Detecting change in behaviour in walking, using the accelerometer of a smartphone
 Eindhoven University of Technology MASTER Detecting change in behaviour in walking, using the accelerometer of a smartphone van der Meijden, M.F. Award date: 2016 Link to publication Disclaimer This document
Opleiding Informatica
 Opleiding Informatica Determining Good Tactics for a Football Game using Raw Positional Data Davey Verhoef Supervisors: Arno Knobbe Rens Meerhoff BACHELOR THESIS Leiden Institute of Advanced Computer Science
QUICK WARM UP: Thursday 3/9
 Name: pd: Unit 6, QUICK WARM UP: Thursday 3/9 1) The slope of a distance vs. time graph shows an object s. 2) The slope of a position vs. time graph shows an object s. 3) Can an object have a constant
Gait Analysis System. User Manual and Outcome parameters Patent WO2012/ A1
 Gait Analysis System User Manual and Outcome parameters Patent WO212/7855 A1 Thank you for purchasing our Gait Analysis Package. Gait Up s goal is to provide you with a user-friendly setup to measure accurately
Goodyear Safety Research Project 2008 Presentation by Competitive Measure at the FEI Eventing Safety Forum. Presented by Tim Deans and Martin Herbert
 Goodyear Safety Research Project 2008 Presentation by Competitive Measure at the FEI Eventing Safety Forum Presented by Tim Deans and Martin Herbert The presentation discusses the Goodyear Safety Research
Accelerometers: An Underutilized Resource in Sports Monitoring
 Accelerometers: An Underutilized Resource in Sports Monitoring Author Neville, Jono, Wixted, Andrew, Rowlands, David, James, Daniel Published 2010 Conference Title Proceedings of the 2010 Sixth International
The three steps for biomechanical assessment are the following: > Periodically verify the results and the efficacy of treatment
 ENG After having carried out and saved a test, two reports are immediately available: > Gait/Run report: specific report for gait or running tests, with average values, standard deviation and variability
BME 4202 Projects II Midterm Report. Project Therma-STAT! Team Temp Watch. Dana Novak, Sarah Hill. Lawrence Technological University
 BME 4202 Projects II Midterm Report Project Therma-STAT! Team Temp Watch Dana Novak, Sarah Hill Lawrence Technological University Advisors: Dr. Mansoor Nasir, Dr. Michael Lancina March 2, 2018 Contents
Exploring the relationship between the pressure of the ball and coefficient of restitution.
 Exploring the relationship between the pressure of the ball and coefficient of restitution. When I started thinking about possible investigations I knew I wanted to create a lab that was related to sports.
Video Based Accurate Step Counting for Treadmills
 Proceedings Video Based Accurate Step Counting for Treadmills Qingkai Zhen, Yongqing Liu, Qi Hu and Qi Chen * Sport Engineering Center, China Institute of Sport Science, Beijing 100061, China; zhenqingkai@ciss.cn
STATE OF NEW YORK PUBLIC SERVICE COMMISSION. At a session of the Public Service Commission held in the City of Albany on August 20, 2003
 STATE OF NEW YORK PUBLIC SERVICE COMMISSION At a session of the Public Service Commission held in the City of Albany on August 20, 2003 COMMISSIONERS PRESENT: William M. Flynn, Chairman Thomas J. Dunleavy
Improving the Bus Network through Traffic Signalling. Henry Axon Transport for London
 Improving the Bus Network through Traffic Signalling Henry Axon Transport for London Improving the Bus Network through Traffic Signalling Introduction Transport for London (TfL) operates the most frequent
Boyle s Law: Pressure-Volume Relationship in Gases. PRELAB QUESTIONS (Answer on your own notebook paper)
") Boyle s Law: Pressure-Volume Relationship in Gases Experiment 18 GRADE LEVEL INDICATORS Construct, interpret and apply physical and conceptual models that represent or explain systems, objects, events
Boyle s Law: Pressure-Volume Relationship in Gases Experiment 18 GRADE LEVEL INDICATORS Construct, interpret and apply physical and conceptual models that represent or explain systems, objects, events
DIAGNOSTICS OF IMPULSE LINE BLOCKAGE WITH A MULTI-SENSING DIFFERENTIAL PRESSURE TRANSMITTER AT THE AIR LINE
 DIAGNOSTICS OF IMPULSE LINE BLOCKAGE WITH A MULTI-SENSING DIFFERENTIAL PRESSURE TRANSMITTER AT THE AIR LINE Akira Uehara, Jyun-ichi Eino, Takumi Hashizume 3, Tetsuya Wakui 3, Nobuo Miyaji 4, Yoshitaka
The effects of a suspended-load backpack on gait
 Industrial and Manufacturing Systems Engineering Publications Industrial and Manufacturing Systems Engineering 2009 The effects of a suspended-load backpack on gait Xu Xu North Carolina State University
DIFFERENCE BETWEEN TAEKWONDO ROUNDHOUSE KICK EXECUTED BY THE FRONT AND BACK LEG - A BIOMECHANICAL STUDY
 268 Isas 2000! Hong Kong DIFFERENCE BETWEEN TAEKWONDO ROUNDHOUSE KICK EXECUTED BY THE FRONT AND BACK LEG - A BIOMECHANICAL STUDY Pui-Wah Kong, Tze-Chung Luk and Youlian Hong The Chinese University of Hong
b
 Empirically Derived Breaking Strengths for Basket Hitches and Wrap Three Pull Two Webbing Anchors Thomas Evans a and Aaron Stavens b a Montana State University, Department of Earth Sciences, PO Box 173480,
Mutual and asynchronous anticipation and action in sports as globally competitive
 1 Supplementary Materials Mutual and asynchronous anticipation and action in sports as globally competitive and locally coordinative dynamics Keisuke Fujii, Tadao Isaka, Motoki Kouzaki and Yuji Yamamoto.
Lab 4: Root Locus Based Control Design
 Lab 4: Root Locus Based Control Design References: Franklin, Powell and Emami-Naeini. Feedback Control of Dynamic Systems, 3 rd ed. Addison-Wesley, Massachusetts: 1994. Ogata, Katsuhiko. Modern Control
Walking with coffee: when and why coffee spills
 Walking with coffee: when and why coffee spills Hans C. Mayer and Rouslan Krechetnikov Department of Mechanical Engineering University of California at Santa Barbara February 20-24, 2012 Page 1/25 Motivation
5.1. Data Displays Batter Up. My Notes ACTIVITY
 SUGGESTED LEARNING STRATEGIES: Activating Prior Knowledge, Marking the Text, Group Presentation, Interactive Word Wall Henry Hank Aaron and Harmon Killebrew are among the alltime leaders in home runs in
IEEE RAS Micro/Nano Robotics & Automation (MNRA) Technical Committee Mobile Microrobotics Challenge 2016
 Technical Committee Mobile Microrobotics Challenge 2016") IEEE RAS Micro/Nano Robotics & Automation (MNRA) Technical Committee Mobile Microrobotics Challenge 2016 OFFICIAL RULES Version 2.0 December 15, 2015 1. THE EVENTS The IEEE Robotics & Automation Society
IEEE RAS Micro/Nano Robotics & Automation (MNRA) Technical Committee Mobile Microrobotics Challenge 2016 OFFICIAL RULES Version 2.0 December 15, 2015 1. THE EVENTS The IEEE Robotics & Automation Society
Gait Analyser. Description of Walking Performance
 Gait Analyser Description of Walking Performance This brochure will help you to understand clearly the parameters described in the report of the Gait Analyser, provide you with tips to implement the walking
CHAPTER 3 POSTURAL THREAT
 CHAPTER 3 POSTURAL THREAT Postural threat during walking: effects on energy cost and accompanying gait changes IJmker T, Lamoth CJ, Houdijk H, Van der Woude LH, Beek PJ. Journal of Neuroengineering and
The Criticality of Cooling
 Reliability Solutions White Paper January 2016 The Criticality of Cooling Utilities, power plants, and manufacturing facilities all make use of cooling towers for critical heat transfer needs. By cycling
Analysis of Traditional Yaw Measurements
 Analysis of Traditional Yaw Measurements Curiosity is the very basis of education and if you tell me that curiosity killed the cat, I say only the cat died nobly. Arnold Edinborough Limitations of Post-
(Lab Interface BLM) Acceleration
 Acceleration") Purpose In this activity, you will study the concepts of acceleration and velocity. To carry out this investigation, you will use a motion sensor and a cart on a track (or a ball on a track, if a cart
Purpose In this activity, you will study the concepts of acceleration and velocity. To carry out this investigation, you will use a motion sensor and a cart on a track (or a ball on a track, if a cart
Analysis of Highland Lakes Inflows Using Process Behavior Charts Dr. William McNeese, Ph.D. Revised: Sept. 4,
 Analysis of Highland Lakes Inflows Using Process Behavior Charts Dr. William McNeese, Ph.D. Revised: Sept. 4, 2018 www.spcforexcel.com Author s Note: This document has been revised to include the latest
Ambulatory monitoring of gait quality with wearable inertial sensors
 Ambulatory monitoring of gait quality with wearable inertial sensors Dr. Philippe Terrier, PhD June 2016 Summary 1. Why? Reasons for measuring gait in real life conditions 2. What? Real-life assessment
Boyle s Law: Pressure-Volume Relationship in Gases
 Boyle s Law: Pressure-Volume Relationship in Gases The primary objective of this experiment is to determine the relationship between the pressure and volume of a confined gas. The gas we will use is air,
LOW PRESSURE EFFUSION OF GASES revised by Igor Bolotin 03/05/12
 LOW PRESSURE EFFUSION OF GASES revised by Igor Bolotin 03/05/ This experiment will introduce you to the kinetic properties of low-pressure gases. You will make observations on the rates with which selected
Questions & Answers About the Operate within Operate within IROLs Standard
 Index: Introduction to Standard...3 Expansion on Definitions...5 Questions and Answers...9 Who needs to comply with this standard?...9 When does compliance with this standard start?...10 For a System Operator
iphone as a Physical Activity Measurement Platform
 iphone as a Physical Activity Measurement Platform Yuichi Fujiki Compuational Physiology Lab University of Houston 4800 Calhoun Rd Houston TX, 77204, USA yfujiki@uh.edu Abstract iphone is emerging as a
Journal of Emerging Trends in Computing and Information Sciences
 A Study on Methods to Calculate the Coefficient of Variance in Daily Traffic According to the Change in Hourly Traffic Volume Jung-Ah Ha Research Specialist, Korea Institute of Construction Technology,
Jogging and Walking Analysis Using Wearable Sensors *
 Engineering, 2013, 5, 20-24 doi:10.4236/eng.2013.55b005 Published Online May 2013 (http://www.scirp.org/journal/eng) Jogging and Walking Analysis Using Wearable Sensors * Ching ee ong, Rubita Sudirman,
Center of Mass Acceleration as a Surrogate for Force Production After Spinal Cord Injury Effects of Inclined Treadmill Walking
 Center of Mass Acceleration as a Surrogate for Force Production After Spinal Cord Injury Effects of Inclined Treadmill Walking Mark G. Bowden, PhD, PT Research Health Scientist, Ralph H. Johnson VA Medical
ROSE-HULMAN INSTITUTE OF TECHNOLOGY Department of Mechanical Engineering. Mini-project 3 Tennis ball launcher
 Mini-project 3 Tennis ball launcher Mini-Project 3 requires you to use MATLAB to model the trajectory of a tennis ball being shot from a tennis ball launcher to a player. The tennis ball trajectory model
MRI-2: Integrated Simulation and Safety
 MRI-2: Integrated Simulation and Safety Year 3 2 nd Quarterly Report Submitted by: Dr. Essam Radwan, P.E. (PI), Ahmed.Radwan@ucf.edu Dr. Hatem Abou-Senna, P.E., habousenna@ucf.edu Dr. Mohamed Abdel-Aty,
Was John Adams more consistent his Junior or Senior year of High School Wrestling?
 Was John Adams more consistent his Junior or Senior year of High School Wrestling? An investigation into my Dad s high school Wrestling Career Amanda Adams Period 1 Statistical Reasoning in Sports December
Prediction of Crossing Driveways of a Distracted Pedestrian from Walking Characteristics
 International Journal of Internet of Things 2018, 7(1): 1-9 DOI: 10.5923/j.ijit.20180701.01 Prediction of Crossing Driveways of a Distracted Pedestrian from Walking Characteristics Hiroki Kitamura 1,*,
Advanced PMA Capabilities for MCM
 Advanced PMA Capabilities for MCM Shorten the sensor-to-shooter timeline New sensor technology deployed on off-board underwater systems provides navies with improved imagery and data for the purposes of
Users Group Conference 2018
 Users Group Conference 2018 Compressor Analysis Special Circumstances Tracy Wimberly Sr. Reciprocating Equipment Analyst, Windrock 1 Topics, top compressor questions Ultrasound Baseline Cat Eyes Leak Index
Analysis of Backward Falls Caused by Accelerated Floor Movements Using a Dummy
 Original Article Analysis of Backward Falls Caused by Accelerated Floor Movements Using a Dummy Hisao NAGATA 1 * and Hisato OHNO 2 1 National Institute of Occupational Safety and Health, 1 4 6 Umezono,
Using sensory feedback to improve locomotion performance of the salamander robot in different environments
 Using sensory feedback to improve locomotion performance of the salamander robot in different environments João Lourenço Silvério Assistant: Jérémie Knüsel Structure of the presentation: I. Overview II.
The Biomechanical Specificity of Running Drills to Sprint Performance
 The Biomechanical Specificity of Running Drills to Sprint Performance Niamh Whelan B.Sc. A thesis submitted to the University of Limerick in fulfilment of the requirements of the degree of Doctor of Philosophy
Available online at ScienceDirect. Energy Procedia 53 (2014 )
") Available online at www.sciencedirect.com ScienceDirect Energy Procedia 53 (2014 ) 156 161 EERA DeepWind 2014, 11th Deep Sea Offshore Wind R&D Conference Results and conclusions of a floating-lidar offshore
Available online at www.sciencedirect.com ScienceDirect Energy Procedia 53 (2014 ) 156 161 EERA DeepWind 2014, 11th Deep Sea Offshore Wind R&D Conference Results and conclusions of a floating-lidar offshore
Movement-Type Classification Using Acceleration Sensor
 Movement-Type Classification Using Acceleration Sensor Chu-Hui Lee and Jyun-Han Liou Abstract The most common moving processes include walking, running, going up stairs, and going down stairs. People distinguish
How is SkyTrak different from other launch monitors?
 SkyTrak : The Drilldown If you re looking for a concise and brief overview of SkyTrak, what it is, how it works and what all the data elements indicate, then please watch our educational video series,
INSTRUMENT INSTRUMENTAL ERROR (of full scale) INSTRUMENTAL RESOLUTION. Tutorial simulation. Tutorial simulation
 INSTRUMENTAL RESOLUTION. Tutorial simulation. Tutorial simulation") Lab 1 Standing Waves on a String Learning Goals: To distinguish between traveling and standing waves To recognize how the wavelength of a standing wave is measured To recognize the necessary conditions
Lab 1 Standing Waves on a String Learning Goals: To distinguish between traveling and standing waves To recognize how the wavelength of a standing wave is measured To recognize the necessary conditions
Protection against Impact with the Ground Using Wearable Airbags
 Industrial Health 2008, 46, 59 65 Original Article Protection against Impact with the Ground Using Wearable Airbags Kiyoshi FUKAYA 1 * and Mitsuya UCHIDA 2 1 National Institute of Occupational Safety and