Author version: Deep-Sea Res.(I: Oceanogr. Res. Pap.),vol.57;2009;1-13
|
|
|
- John McCoy
- 5 years ago
- Views:
Transcription
1 Author version: Deep-Sea Res.(I: Oceanogr. Res. Pap.),vol.57;2009;1-13 Interannual variability of Kelvin wave propagation in the wave guides of the equatorial Indian Ocean, the coastal Bay of Bengal and the southeastern Arabian Sea during R. R. Rao 1, M. S. Girish Kumar 2, M. Ravichandran 2, A. R. Rao 3, V.V.Gopalakrishna 4 and P.Thadathil 5 1 Japan Marine Earth Science & Technology, Yokosuka , Japan 2 Indian National Centre for Ocean Information Services, Hyderabad , India 3 Naval Physical & Oceanographic Laboratory, Kochi , India 4 National Institute of Oceanography, Goa , India 5 Embassy of India, Tokyo , Japan Abstract The observed variability of the Kelvin waves and their propagation in the equatorial wave guide of the Indian Ocean and in the coastal wave guides of the Bay of Bengal (BoB) and the southeastern Arabian Sea (AS) on seasonal to interannual time scales during the years is examined utilizing all the available satellite and insitu measurements. The Kelvin wave regime inferred from the satellite-derived sea surface height anomalies (SSHA) shows a distinct annual cycle composed of two pairs of alternate upwelling (first one occurring during January-March and the second one occurring during August-September) and downwelling (first one occurring during April- June and the second one occurring during October-December) Kelvin waves that propagate eastward along the equator and hit the Sumatra coast and bifurcate. The northern branches propagate counterclockwise over varied distances along the coastal waveguide of the BoB. The potential mechanisms that contribute to the mid-way termination of the first upwelling and the first downwelling Kelvin waves in the wave guide of the BoB are hypothesized. The second downwelling Kelvin wave alone reaches the southeastern AS, and it shows large interannual variability caused primarily by similar variability in the equatorial westerly winds during boreal fall. The westward propagating downwelling Rossby waves triggered by the second downwelling Kelvin wave off the eastern rim of the BoB also shows large interannual variability in the near surface thermal structure derived from SODA analysis. The strength of the equatorial westerlies driven by the east-west gradient of the heat sources in the troposphere appears to be a critical factor in determining the observed interannual variability of the second downwelling Kelvin wave in the wave guides of the equatorial Indian Ocean, the coastal BoB, and the southeastern AS. 1
2 1. Introduction The observed near-surface circulation in the equatorial Indian Ocean (EIO), the Arabian Sea (AS) and the Bay of Bengal (BoB) manifests itself primarily through Ekman and geostrophic adjustments and responds rapidly to the seasonal changes in the monsoonal surface wind and buoyancy forcings (Duing et al, 1970, Wyrtki, 1973, Cutler and Swallow, 1984, Luther and O Brien, 1985, Reverdin 1987, Woodbury et al, 1989, Molinari et al, 1990, Hastenrath and Greischar, 1991, Schiller et al, 1998, Shetye and Gouveia, 1998, Shenoi et al, 1999, Schott and McCreary, 2001, Shankar et al, 2002, Somayajulu et al, 2003, Sengupta et al, 2004, Masumoto et al, 2005, Schott et al, 2007, Hase et al, 2008, Nagura and McPhaden, 2008, Ogata et al, 2008, Masumoto et al, 2008, Horii et al, 2008, Iskandar et al, 2009). In addition, the planetary scale waves - Rossby, Yanai, equatorial and coastal Kelvin waves driven by the surface wind and buoyancy flux fields -- also influence the near-surface circulation of these basins through both local and remote effects (Lighthill, 1969, Cane, 1980, Gent et al, 1983, Kindle and Thompson, 1989, Moore and McCreary, 1990, Potemra et al, 1991, Yu et al, 1991, Tsai et al, 1992, Periguad and Delecluse, 1992 and 1993, McCreary et al, 1993 and 1996, Bruce et al, 1994 and 1998, Prasannakumar and Unnikrishnan, 1995, Yamagata et al, 1996, Vinayachandran et al, 1996, Shankar and Shetye, 1997, Vinayachandran and Yamagata, 1998, Chambers et al, 1999, Murtugudde and Busalacchi, 1999, White, 2000, Eigenheer and Quadfasel, 2000, Basu et al, 2000, Murtugudde et al, 2000, Sprintall et al, 2000, Gopalan et al, 2000, Le Blanc and Boulanger, 2001, Schott and McCreary, 2001, Shankar et al, 2002, Haugen et al, 2002, Han and Webster, 2002, Brandt et al, 2002, Yu, 2003, Han, 2005, Miyama et al, 2006, and Yuan and Han, 2006, Schott et al, 2007). With the availability of high-resolution and accurate satellite altimetry measurements, considerable interest is evinced in the recent literature on the planetary scale wave propagation and its potential influence on basin-scale and coastal circulation regimes. The signature of the 2
3 westward propagating Rossby waves as seen in altimetry measurements and in the numerical model simulations for the tropical Indian Ocean is very well documented in the literature. Polito and Liu (2003) have characterized the spectral nature of the Rossby waves in the global ocean. They have reported that the clearest and most energetic wave signals are generally observed for the annual and that the semiannual Rossby waves often have the largest amplitudes near the tropics. In the EIO, the zonal winds, semiannual in nature, remotely generate corresponding semiannual sea-level fluctuations near the eastern equator (Clark and Liu, 1993). The observed interannual sea-level signal along the eastern and northern Indian Ocean boundary is generated remotely by interannual equatorial zonal winds (Clark and Liu, 1994). Along the equatorial wave guide in the Indian Ocean, Yu et al (1991) have shown that the eastward propagating annual Kelvin wave, on reflection from the eastern boundary, propagates along the coastal wave guide of the BoB as a coastal Kelvin wave, radiating westward propagating Rossby waves into the interior BoB and influencing the East India Coastal Current (EICC). McCreary et al (1993) have further shown that the winds along the eastern rim of the BoB also trigger similar Kelvin waves, which not only influence the EICC, but also turn around Sri Lanka to propagate poleward along the west coast of India, influencing West India Coastal Current (WICC). The observed annual cycle of Lakshadweep High and Low in the geopotential topography (Wyrtki, 1971, Bruce et al, 1994 and Peter and Mizuno, 2000) and satellite altimetry (Ali et al, 1998, Gopalan et al, 2000) is attributed to the Rossby wave radiation by these coastal Kelvin waves off the southwest coast of India (McCreary et al, 1993, Bruce et al, 1994, and Shankar and Shetye, 1997 and Shankar et al 2002). Shankar et al. (2002) have carried out a detailed study highlighting the relative 3
4 importance of both local and remote processes that modulate the sea level and circulation in the northern Indian Ocean. Their study has clearly revealed that the equatorial zonal winds and the alongshore winds off the Myanmar coast have a weaker role in modulating the upwelling and downwelling cycles observed along the southwest coast of India. Prasad and Ikeda (2001) have shown the westward propagation of both Arabian Sea High and Lakshadweep High during January-March as the manifestations of Rossby waves. Basu et al (2000) have shown that the annual signal in the Indian Ocean north of 10 S is composed of propagating and non-propagating modes. Subrahmanyam et al (2001) have shown that the downwelling Kelvin waves play an important role by way of reflected and radiated Rossby waves. They have also shown the propagation of poleward coastal Kelvin waves along the west coast of India and the associated radiation of Rossby waves. Han and Webster (2002) have shown that in the BoB, the SSH anomalies near the eastern and northern boundaries are predominantly caused by equatorial wind variability, which generates coastal Kelvin waves that propagate into the bay along the eastern boundary. Hareesh Kumar and Sanilkumar (2004) have reported dominant variability in the SSHA field with day, 3-4, 6 and 12 month periods in the coastal regions of the northern Indian Ocean. In a 1.5-layer reduced gravity model simulation, Rahul et al (2004) have shown the occurrence of westward propagating twin gyres on either side of the equator as the reflected Rossby waves during June-August and November-December in response to the impinging equatorial jets on the coast of Sumatra. In the southern tropical Indian Ocean in the latitudinal band of 8ºS 20ºS, Masumoto and Meyers (1998) have shown the occurrence of westward propagating annual Rossby wave both in the XBT data and in a model simulation. Wang et al (2001) have explained the mechanisms that cause the 4
5 breakup in the westward propagation of the annual Rossby wave in the mid-ocean resulting in two local maxima. Thus these modeling studies have shown that in the northern Indian Ocean the coastal Kelvin waves play an important role in the coupling of the EICC and the WICC and triggering westward propagating Rossby waves across the basin. However, the propagation of these boundary waves into the southeastern AS has not been confirmed by observations (Schott and McCreary, 2001). In this study utilizing all the available satellite and in-situ measurements the following issues are addressed: Identification of pathways of two pairs of alternate upwelling and downwelling Kelvin waves in the wave guides of the EIO, the coastal BoB, and the southeastern AS and the possible reasons for their mid-way termination before reaching the southeastern AS with the lone exception of the second downwelling Kelvin wave Observed interannual variability of the second downwelling Kelvin wave in the wave guides of the equator, the coastal BoB, and the southeastern AS and its possible mechanism Observed interannual variability of the westward propagation of Rossby waves in the northern EIO Potential mechanism of stronger equatorial westerlies (during boreal fall) when the second downwelling Kelvin wave and its interannual variability are more pronounced It would be interesting to see the propagation signatures of the Kelvin waves in the waveguides of the EIO, the coastal BoB, and the southeastern AS in the observations. The recently-blended high-resolution Topex-Poseidon satellite altimetry measurements provide a unique opportunity to identify and track the propagation of these Kelvin waves in the wave guides of the equator, the coastal BoB, and the southeastern AS. In Section 2, all the data sets utilized to address the above issues are described. In Section 3, the 5
6 signatures of the Kelvin wave trajectories and the probable governing mechanisms that terminate the propagation of both the upwelling and first downwelling Kelvin waves are suggested. The observed interannual variability of the second downwelling Kelvin wave in the wave guides of the EIO, the coastal BoB, and the southeastern AS is examined. The potential influence of this interannual variability of these Kelvin waves on the westward propagation of Rossby waves in the northern EIO is examined. The potential mechanism of stronger equatorial westerlies observed during strong second downwelling Kelvin wave regime is examined. 2. Observations Several types of archived historic satellite and in-situ measurements are assembled and exploited to describe and understand the observed variability of the Kelvin waves in the northern Indian Ocean. The AVISO merged and blended SSHA data are utilized to characterize the signature of the propagating Kelvin and Rossby waves. The QuikSCAT surface winds (Wentz et al, 2001) are utilized to assess their impact on the observed equatorial and coastal Kelvin waves. The depth of the 20 C isotherm (D20) derived from the near-surface temperature climatology of Locarnini et al (2006) is utilized to characterize Kelvin wave propagation along the equator. The multi-year averages of TRMM TMI SST (Wentz et al, 2002) are utilized to characterize the background SST at the head of the BoB during boreal winter when the clockwise eddy circulation is present. The D20 derived from the data collected by a JAMSTEC mooring at 1.5 S and 90 E is utilized to seek its relationship with the surface zonal wind speed in the central EIO. The tide gauge data collected at three representative coastal stations - Visakhapatnam, Chennai, and Cochin - are utilized to characterize the observed in-situ sea-level 6
7 variability along the east and southwest coasts of India. The near-surface thermal structure derived from SODA analysis (Carton et al, 2000) is utilized to characterize the westward propagation of Rossby waves in the north EIO during the following six months (October-March) of the second downwelling Kelvin wave generation. The outgoing longwave radiation data of NOAA are utilized as a proxy to atmospheric convection to explain the observed variability of the strong westerly winds over the equatorial region. The sources, periods, accuracies and resolutions of the data sets utilized in this study are shown in Table Analysis 3.1 Annual cycle of SSHA in the northern Indian Ocean The satellite-altimeter-derived SSHA field characterizes dynamic topography that is related to circulation and density field of the entire water column. The SSHA field in the ocean contains information of both steric effects and the effects of stationary and propagating planetary scale waves (Fu, 2001). The monsoon driven northern Indian Ocean shows a distinct annual cycle in the multi-year averaged SSHA field (Subrahmanyam and Robinson, 2000) (Figure 1a). During a year, in the EIO, two pairs of upwelling and downwelling Kelvin waves alternately propagate eastward. In response to this, the thermocline in the eastern EIO shows large-amplitude vertical excursions with semi-annual periodicity (Rao and Sivakumar, 2000, Hase et al, 2008). The eastern equatorial region shows the signatures of these upwelling (downwelling) Kelvin waves during January-March and August-September (April-June and October-December). Both these two pairs of Kelvin waves hit the Sumatra coast and bifurcate as northward and southward propagating coastally trapped waves (Iskandar et al, 2009). The northern 7
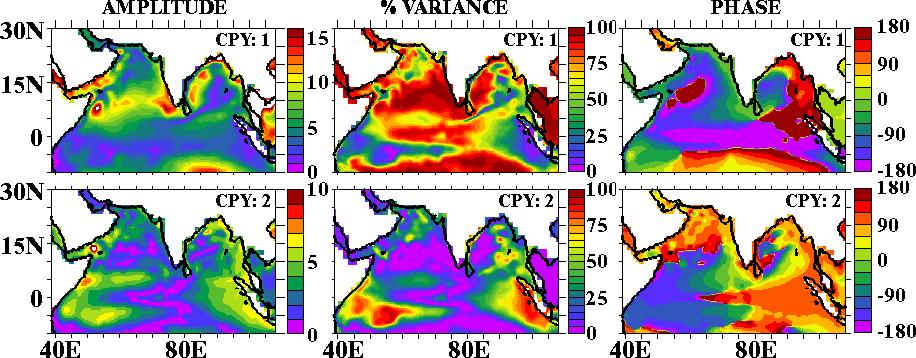
8 branches propagate over varied distances along the coastal wave guide of the BoB. These Kelvin waves also trigger Rossby waves from the eastern rim of the BoB that propagate westward in the northern EIO and in the BoB (McCreary et al, 1993, Iskandar et al, 2009). The AS is characterized by the westward propagating downwelling (upwelling) Rossby waves triggered off the southwest coast of India and further reinforced by the local wind stress curl forcing during December-April (June-October). These downwelling (upwelling) Rossby waves produce large positive (negative) anomalies in the SSHA field in the southwestern AS during March-April (December- January). The AS shows large variability in the SSHA field in response to the summer monsoonal wind forcing. The associated strong negative (positive) surface wind stress curl results in strong positive (negative) SSHA in the south-central (coastal) AS. In the southwestern BoB, strong negative (positive) SSHA occurs in response to strong positive (negative) surface wind stress curl during September-December (January-April). South of the equator, in the east, the signature of the westward propagating upwelling (downwelling) Rossby wave is clearly seen during February-May (August-December) (Reverdin and Luyten, 1986). The Fourier analysis of mean monthly SSHA clearly shows the geographic regions where the annual (CPY: 1) and semi-annual (CPY: 2) modes are most dominant (Figure 1b). The annual mode shows largest amplitude with large percent variance off the southwest coast of India, in the southern AS, off the Arabia coast, off the southwestern rim of the BoB and south of the equator in the east due to westward Rossby wave propagation. The semi-annual mode shows largest amplitude off the Sumatra coast due to impinging Kelvin waves along the equator from the west and the radiated Rossby waves towards the west. The western EIO also shows large signals on either side of the 8
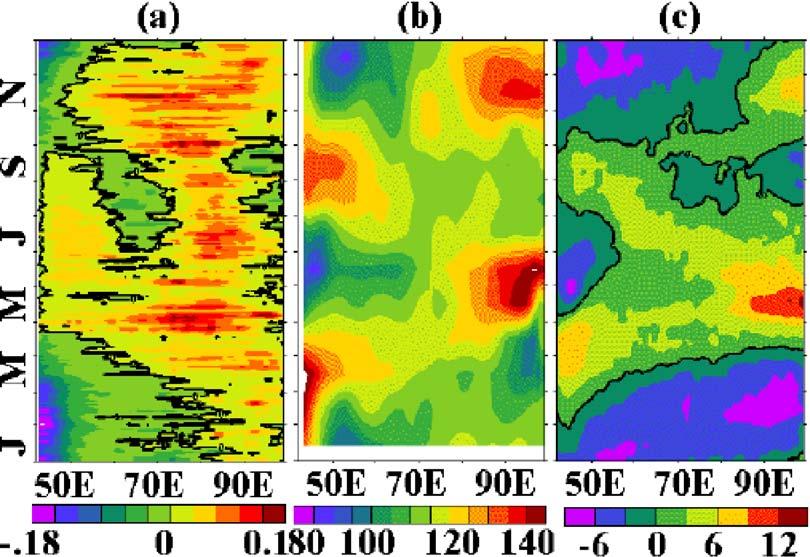
9 equator caused by the westward-propagating Rossby waves (Peter and Mizuno, 2000, Rao and Sivakumar, 2000). The coastal wave guide of the BoB also shows large values due to propagating Kelvin wave activity on both annual and semi-annual modes. 3.2 Kelvin waves in the EIO The recent modeling studies have clearly revealed that the surface winds over the EIO play an important role in modulating the circulation features of the northern Indian Ocean through remote effects (Potemra et al., 1991, Yu et al., 1991, McCreary et al., 1993, 1996, Shankar et al., 2002). Changes in thermocline depth can be directly driven by the local winds as well as by the remote effects through the propagating baroclinic waves in the ocean. When westerly (easterly) winds blow over the equator, downwelling- (upwelling-) favorable equatorially trapped Kelvin waves radiate into the eastern ocean, deepening (shoaling) the thermocline there. These waves reflect from the eastern boundary as packets of coastally trapped Kelvin and Rossby waves, spreading the deepening/shoaling well off the equator. Waves can also be generated in off-equatorial regions through forcing by a patch of anticyclonic (downwelling) Ekman pumping in the eastern ocean. Then downwelling-favorable Rossby waves radiate from the forcing region, deepening the thermocline in the western ocean (Schott et al, 2007). In the Indian Ocean, the energy imparted by the surface wind field is carried eastward along the equatorial wave guide as both downwelling and upwelling Kelvin waves and traverse around the rim of the BoB. In addition, the alongshore winds in the coastal BoB also trigger and modulate these propagating Kelvin waves. The signature of this wave propagation along the equator is examined with the satellite-derived altimetry and surface wind measurements. The observed climatology of the zonal wind stress (Figure 2a) 9
10 shows that the zonal winds are mostly westerly throughout the year with stronger magnitudes over the east-central equatorial region. Strong intraseasonal variability with pronounced peaks during the monsoon transitions is also noticed when spring and fall Wyrtki jets occur (Sengupta et al, 2001, Senan et al, 2003). These westerly wind bursts produce downwelling Kelvin waves that propagate eastward along the equator (O Brien et al, 1974, McPhaden et al, 1982, Visbeck and Schott, 1992, Jensen, 1993, Han et al, 1999, 2001, Miyama et al, 2006). When these westerly wind bursts weaken during July- August or are replaced by easterlies during boreal winter, the upwelling Kelvin waves are triggered and propagate eastward along the equator. In a year, two pairs of upwelling and downwelling Kelvin waves propagate alternately eastward. The signatures of these upwelling and downwelling Kelvin waves are also very well captured in the longitudetime fields of D20 extracted from the temperature climatology of Locarnini et al (2006) (Figure 2b) and SSHA climatology (Figure 2c). Both these fields show a strong eastward propagating semi-annual signals along the equator. The deepening (shoaling) of D20 and increase (decrease) of SSHA during February-May (November-March) and August- November (May-September) is a clear manifestation of the downwelling (upwelling) Kelvin waves. In addition, these Kelvin waves also reflect (trigger) Rossby waves that propagate westward both along and off the equator (Potemra et al, 1991 and Yu et al, 1991). 3.3 Annual cycle of the Kelvin wave regime in the coastal wave guides of the BoB and the southeastern AS The observed signatures of the Kelvin waves in the coastal wave guides of the BoB and the southeastern AS over a year are examined utilizing the SSHA climatology. Two pairs 10
11 of the equatorial upwelling (downwelling) Kelvin waves show their counterclockwise propagation northward from the Sumatra coast over varied distances in the coastal wave guide of the BoB. In the BoB, the first upwelling (downwelling) Kelvin wave occurs during January-March (May-August) and the second upwelling (downwelling) Kelvin wave occurs during August-September (October-December) as shown in Figure 3. All the four Kelvin waves show distinct life cycles geographically limited to the coastal wave guide of the BoB with only the exception of the second downwelling Kelvin wave. The first upwelling Kelvin wave while propagating along the wave guide radiates Rossby waves off the southeastern rim of the BoB. It attains its peak amplitude at the head of the bay during mid-february to mid-march. However, it weakens off the western rim of the BoB and terminates off the southeast coast of India (Figure 3a). This suggests that this first upwelling Kelvin wave appears to have no significant role in remotely triggering coastal upwelling observed off the southwest coast of India as early as February/March. In tune with the modeling study of Shankar et al (2002), the recent observational study of Gopalakrishna et al (2008) has clearly revealed that the alongshore wind stress off the southwest coast of India and the remote forcing from south of Sri Lanka are more important forcings compared to the equatorial forcing influencing the upwelling signal in the Lakshadweep Sea during the summer monsoon season. The propagation of the first downwelling Kelvin wave also terminates mid-way in the coastal wave guide off the head of the BoB (Figure 3b). Large positive values seen off the mouths of major rivers Ganges-Brahmaputra and Irrawady suggest the influence of fresh water flux on the observed SSHA. Among all the four Kelvin waves, the second upwelling Kelvin wave is the least developed and is only limited to southeastern rim of the BoB. Among both the 11
12 pairs of upwelling and downwelling Kelvin waves, only the second downwelling Kelvin wave is the most pronounced. Among all these four waves, this wave alone propagates all through the coastal wave guide of the BoB, turns around Sri Lanka, and then propagates along the west coast of India. The signatures of the propagation trajectories of both the upwelling and downwelling Kelvin waves along the equator and in the coastal wave guides of the BoB and the southeastern AS are schematically summarized in Figure 3e. It is important to understand the reasons for the mid-way termination of both the upwelling Kelvin waves and the first downwelling Kelvin wave before they reach the coastal southeastern AS. The probable mechanisms that govern the mid-way termination of both the upwelling Kelvin waves and the first downwelling Kelvin wave and the entry of the second downwelling Kelvin wave into the coastal southeastern AS are examined. A careful examination of the observed climatology of the annual cycle of the surface zonal winds along the equator shows an oscillatory nature on intraseasonal time scales (Figure 3f). In general the westerly (easterly) winds occur over relatively longer (shorter) durations and are relatively stronger (weaker). During December-February along the equator the easterly winds are stronger than those during August-September, clearly explaining the difference in the pathways of the upwelling Kelvin waves in the coastal wave guide of the BoB (Figure 3e). The patch of westerly winds is stronger and wider in spatio-temporal extent during the fall transition than during the spring transition (Figure 3f). In view of this differential forcing, the first downwelling Kelvin wave terminates at the head of the bay while the second downwelling Kelvin wave enters the coastal southeastern AS. At the head of the BoB, during December-February, a clockwise rotating eddy (inferred from circulation Ekman component estimated from QuikSCAT 12
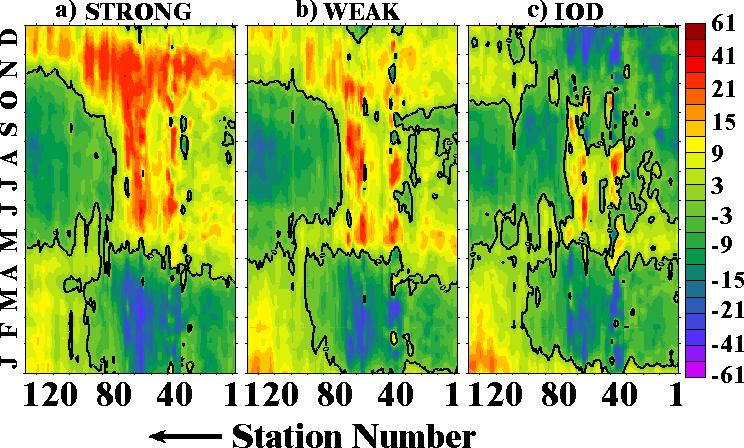
13 winds and geostrophic component estimated from SSHA) spins up (Figure 3g). The western flank of this eddy moves poleward along the east coast of India opposing the equatorward propagating first upwelling Kelvin wave. In addition, during April-May, the EICC also flows pole ward along the east coast of India (Figure 3h). Both these systems appear to block or weaken the propagation of the first upwelling Kelvin wave in the coastal wave guide of the western BoB. The EICC appears to continue to have its influence in arresting the propagation of the first downwelling Kelvin wave (left panel of Figure 3h). As mentioned earlier, the second upwelling Kelvin wave is least developed and is limited to the southeastern rim of the BoB. The signature of this wave along the equator is also weaker, as seen in the SSHA and D20 anomaly fields shown in Figure 2. On the other hand, during October-December, the EICC flowing towards the equator along the east coast of India favours the reinforcement of the equatorward propagation of the second downwelling Kelvin wave (Figure 3h). Thus the prevailing clockwise eddy at the head of the BoB and the associated circulation along the east coast of India appear to play a key role in modulating the propagation of the Kelvin waves in the western coastal wave guide of the BoB. 3.4 Interannual variability of the Kelvin waves in the EIO Along the equator, the observed SSHA field shows considerable interannual variability in the eastward propagation of both the upwelling and the downwelling Kelvin waves (Figure 4a). As the second downwelling Kelvin wave only reaches the southwest coast of India, the interannual variability of this wave is of greater interest and significance for this study. The maxima in the SSHA manifested by this downwelling Kelvin wave in the eastern EIO also show large interannual variability. The SSHA in the eastern EIO 13
14 averaged for October-December representing the period of second downwelling wave are stratified into strong (>10 cm), weak (0-10cm) and Indian Ocean Dipole (IOD) (< 0 cm) regimes. During the period , the second downwelling Kelvin wave is stronger (weaker) during the years 1995, 1996, 1998, 2001 and 2005 (1993, 1999, 2000, 2002, 2003 and 2004). On the other hand the signature of this downwelling Kelvin wave is completely absent during the IOD years 1994, 1997 and The composites of the strong, the weak and the IOD regimes show significant differences in the signatures of the second downwelling Kelvin wave (Figure 4b). During the IOD years, the first downwelling Kelvin wave is much weaker and the second downwelling Kelvin wave is completely absent as the upwelling signal in the eastern EIO is most pronounced (Saji et al, 1999, Webster et al, 1999, Vinayachandran et al, 2002, Rao et al, 2002, Feng and Meyers, 2003, Gnanaseelan et al, 2003, and Prasad and McClean, 2004). The zonal winds along the equator also show strong intraseasonal and interannual variability that is more pronounced during boreal fall (Figure 3f). The composites of zonal winds along the equator for all three regimes also show striking differences during boreal fall (Figure 4b). The zonal winds are stronger along the eastern equator during the strong regime compared to the weak regime. These stronger winds have resulted in stronger downwelling Kelvin waves as seen in the larger positive values of SSHA in the eastern EIO during October-December. However, during the IOD regime, the equatorial westerlies are replaced by strong easterlies resulting in large negative SSHA in the eastern EIO. Thus it is clear that the observed interannual variability seen in the equatorial zonal winds distinctly shows its signature in the SSHA field through eastward propagating Kelvin waves. 14
15 Changes in thermocline depth can be directly driven by the local winds as well as by remote effects through the propagating waves in the equatorial ocean. The continuous time series measurements of near-surface thermal structure made from a mooring deployed in the eastern EIO by JAMSTEC have provided a unique data set to examine the observed interannual variability of D20 forced by the local winds and the propagating Kelvin waves (Figure 4c). The time series of both the temporally smoothed QuikSCAT surface zonal wind speed averaged over a rectangular box in the central EIO and D20 at a station located in the eastern EIO show strong semi-annual periodicity with maxima coinciding with the monsoon transitions during the observational record of In general the surface zonal wind speed and D20 are phase locked with a correlation coefficient of 0.83, when the D20 lags the surface zonal wind speed by three weeks in close agreement with Hase et al (2008). Large year-to-year variability is also seen in the surface zonal wind speed and D20 maxima during the fall transition. Clearly the surface zonal wind speed and D20 during the fall transition are higher (lower) during 2001 and 2005 (2002, 2003 and 2004) years of strong ( weak ) second downwelling Kelvin wave activity. However, during 2006 the observed pattern of surface zonal wind speed and D20 is anomalous because of active IOD. 3.5 Interannual variability of the Kelvin waves in the coastal wave guides of the BoB and the southeastern AS Numerical experiments (McCreary et al, 1996, Shankar et al, 1996) have suggested that the coastal Kelvin waves can also have significant impact on the EICC in the BoB. As large interannual variability is noticed in the second downwelling Kelvin wave activity along the eastern EIO, a corresponding variability is also expected in the coastal wave 15
16 guides of the BoB and the coastal southeastern AS. The observed SSHA data extracted for 129 boxes (starting from the box located on the easternmost equator) closest to the coast well within the Rossby radius of deformation in the BoB and the southeastern AS (wave track shown in Figure 5a) are utilized to construct the wave track-time fields for the individual years. The observed annual cycle of SSHA clearly depicts the signature of the two pairs of propagating upwelling and downwelling Kelvin waves along the coastal waveguide of the BoB (Figure 5b). The observed negative (positive) values of SSHA along the eastern and the northern rims of the BoB depict the signatures of the upwelling (downwelling) Kelvin waves during January-March and August-September (April-June and October-December) propagating counterclockwise. As seen over the equator, large interannual variability in the Kelvin wave activity is also noticed in the coastal wave guides of the BoB and the southeastern AS (Figure 5b). The composites of these three categories of years have also correspondingly shown significant differences in the second downwelling Kelvin wave signatures and in some measure for the first downwelling Kelvin wave during May-June (Figure 5c). During the strong regime the amplitude of the second downwelling Kelvin wave is greater in the coastal BoB, clearly indicating the importance of local alongshore wind stress as suggested by the modeling study of McCreary et al (1993). But it is also interesting to note the weakening amplitude of this wave as it approaches the wave guide of the southeastern AS. During the IOD years, the first downwelling Kelvin wave is also much weaker and the second downwelling Kelvin wave is completely absent as the upwelling signal in the eastern EIO is more pronounced. As these Kelvin waves are driven by the equatorial zonal winds, it would be appropriate to examine their corresponding 16
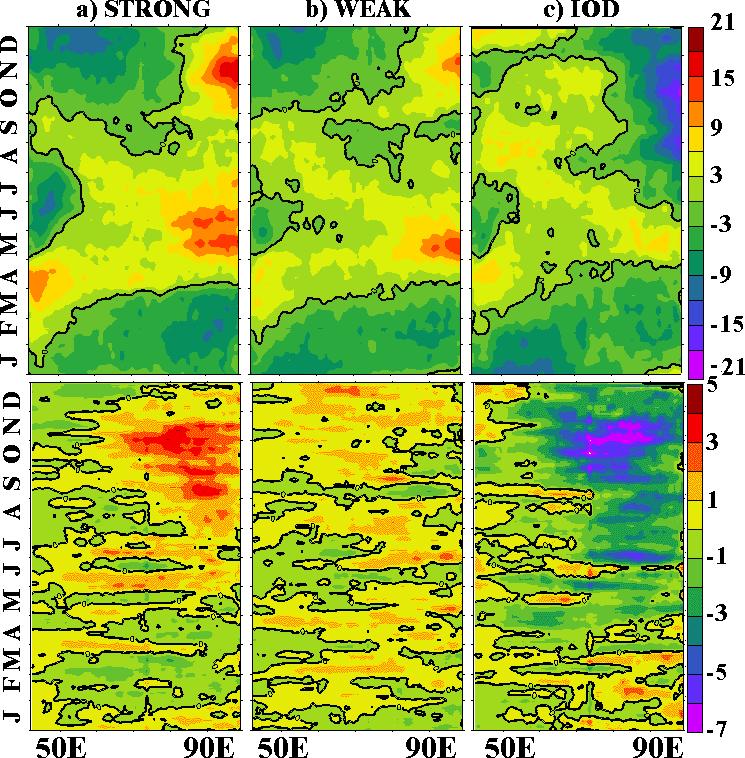
17 composites for all three regimes. The observed anomalies of the zonal wind speed for these three categories of years also show large differences during the second half of the year over the eastern EIO (Figure 4b). During the strong regime, the anomalies are positive and stronger during September-November in the eastern region. During the weak regime, the anomalies are positive but are much weaker during September- November. During the IOD regime, the anomalies are negative and stronger from May- June onwards, peaking during October-November. Thus it is clear that the zonal winds in the eastern EIO play a very important role in determining the strength of both the upwelling and downwelling Kelvin waves that propagate into the wave guides of the coastal BoB in accordance with Han and Webster (2002). In general, in close agreement with the observed interannual variability in the eastern EIO, the strong and the weak regimes of the second downwelling Kelvin wave are also seen during October-December in the coastal wave guides of the BoB and the southeastern AS with a very high degree of correspondence (Figure 5d). The correlation between the SSHA in the eastern EIO and the SSHA along the eastern rim of the BoB is 0.97, and the corresponding correlation between SSHA in the eastern EIO and the SSHA along the western rim of the BoB and along the southwest coast of India is There is also a close resemblance in the second downwelling Kelvin wave activity along the equator and along the eastern rim of the BoB during the IOD years. However, a big reduction in the amplitude of SSHA is seen along the western rim of the BoB and along the southwest coast of India during the IOD years. The increase in the positive values during the non-iod years along the eastern rim of the BoB is clearly consistent with the role of alongshore wind stress in the BoB (McCreary et al, 1993). 17
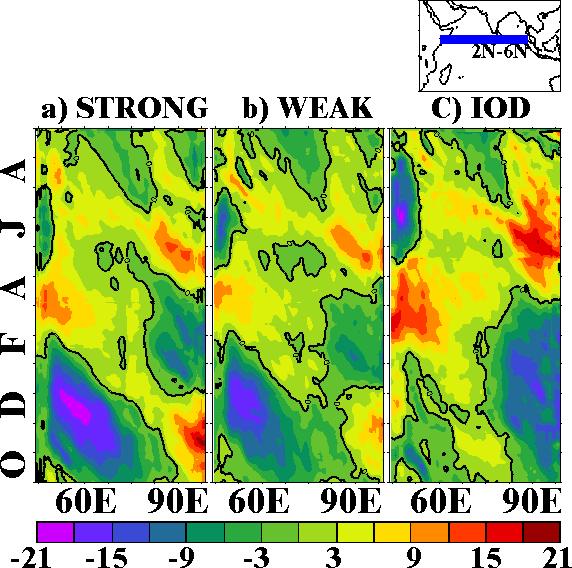
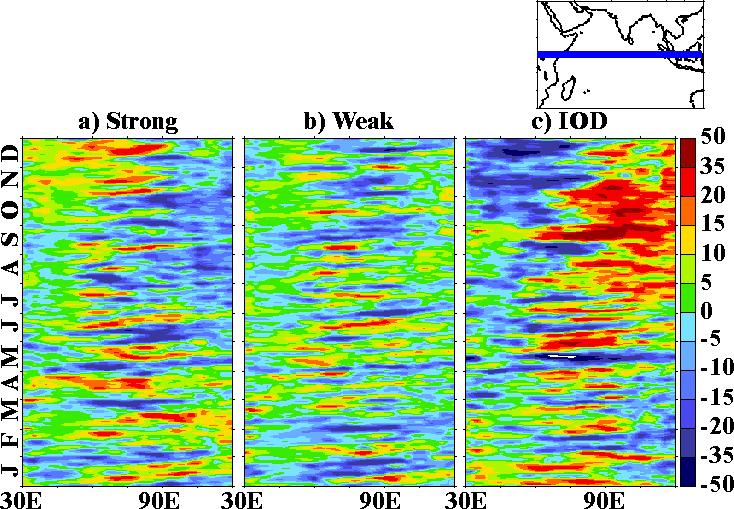
18 The observed sea-level data as recorded by tide gauge stations on the east coast of India (Visakhapatnam and Chennai) composited for strong, weak and IOD regimes during October-December also show significant differences (Figure 5f). During September- November, the sea level is highest during the strong regime and lowest during the IOD regime. Interestingly, the observed differences between the strong and the weak regimes at a station on the southwest coast of India (Cochin) are negligible, although the observed sea level is lowest during the IOD regime. 3.6 Interannual variability of the westward propagating Rossby waves in the northern EIO It is well known that the poleward propagating upwelling (downwelling) Kelvin waves along the eastern rim of the BoB also trigger upwelling (downwelling) Rossby waves that propagate westward with latitude-dependent phase speed (Chelton et al, 1998). In response to the triggering of the Kelvin waves, two pairs of upwelling and downwelling Rossby waves propagate westward alternately in a year. Among the two upwelling and two downwelling Rossby waves it is shown that the second downwelling Rossby wave is the most pronounced. In the latitude band 2ºN-6ºN, the westward propagation of Rossby wave triggered by the northward propagating second downwelling wave is therefore examined in the SSHA field (Figure 6a). The composites for all the three regimes show large differences in the amplitude of this wave. Clearly the westward propagating Rossby wave is more pronounced during the strong regime than during the weak regime. On the other hand, the westward propagation during the IOD regime is not seen from the eastern rim of the BoB, as the upwelling off the Sumatra coast overwhelms the regular second downwelling Kelvin wave, as shown in Figure 4b and Figure 5b. Yu (2003) has 18
19 also shown how the observed interannual variability of the 20 C isotherm topography along 6 N in the BoB is most sensitive to remote interannual wind variability along the equator. Thus it is clear that the interannual variability of the westward propagating Rossby wave is determined by the corresponding interannual variability of the second downwelling Kelvin wave that propagates along the equator and along the southeastern rim of the BoB, in close agreement with Yu (2003). As the signatures of the Rossby waves can be clearly seen in the subsurface thermal structure, the composites of monthly anomalies of near-surface thermal structure (annual mean removed) derived from SODA analysis (Carton et al, 2000) for the same latitude band during October-March, corresponding to all the three regimes is examined (Figure 6b). Large differences are clearly seen among the three regimes. It is clearly evident that the positive anomaly in the thermal field and its westward propagation from the eastern boundary is more pronounced during the strong regime compared to that of the weak regime. However, during the IOD regime the anomaly is negative with large amplitude in the eastern region because of intense upwelling. 3.7 Interannual variability of equatorial westerlies in relation to moist atmospheric convection A warm ocean surface has the potential to trigger organized moist convection under favorable meteorological conditions that generate heat in the troposphere. The zonal wind field over the EIO responds to such a heat source over the warm pool in the eastern EIO and the western equatorial Pacific Ocean. The strength of the westerlies and the magnitude of the OLR anomalies are dynamically coupled over this equatorial region (Saji et al, 1999). The composites of OLR anomalies for all the three regimes over the 19
20 eastern EIO show distinct differences (Figure 7). Over the eastern EIO, during the strong regime the intraseasonal moist convection signals are more pronounced during July-October than they are during the weak regime. During the IOD regime, the eastwest reversal of convection maxima during the second half of the year is also distinctly seen in tune with the reversal of SST maxima. Thus it is clear that during the boreal fall the strength of the zonal winds over the equator driven by the east-west gradient of the heat sources in the troposphere is a critical factor in determining the observed interannual variability of the second downwelling Kelvin wave in the eastern EIO, the coastal BoB, and the southeastern AS. 4 Conclusions The satellite-altimeter-derived SSHA fields in the tropical Indian Ocean show a distinct annual cycle in response to local Ekman pumping and the propagating waves that are remotely forced with differential importance in the spatio-temporal domain. Along the equator, during a year, two pairs of upwelling and downwelling Kelvin waves propagate alternately eastward. After hitting the Sumatra coast, they bifurcate and propagate as two coastally-trapped Kelvin waves, one northward and the other southward. The northern branches propagate over varied distances along the coastal wave guide of the BoB. In the BoB, the first upwelling (downwelling) Kelvin wave occurs during January-March (May- August) and the second upwelling (downwelling) Kelvin wave occurs during August- September (October-December). All four Kelvin waves show distinct life cycles limited to the coastal wave guide of the BoB, the only exception being the second downwelling Kelvin wave. The first upwelling Kelvin while propagating along the wave guide 20
21 weakens off the western rim of the BoB and terminates off the southeast coast of India. This suggests that this first upwelling Kelvin wave has a limited role in remotely triggering coastal upwelling observed off the southwest coast of India as early as February/March. The propagation of the first downwelling Kelvin wave also terminates mid-way in the coastal wave guide of the head of the BoB. Among the two the pairs of upwelling and downwelling Kelvin waves, the second downwelling Kelvin wave is the most pronounced. It propagates all through the coastal wave guide of the BoB, turns around Sri Lanka, and enters the southeastern AS. The westerly winds in the equatorial region are stronger and wider in spatio-temporal extent during the boreal fall transition than during the boreal spring transition. This differential forcing partially accounts for the differences in the pathways of the first and second downwelling Kelvin waves in the coastal wave guide of the BoB. At the head of the BoB, during December-February, the western flank of a clockwise rotating eddy circulation opposes the equatorward propagating first upwelling Kelvin wave. In addition, during April-May, the EICC also flows poleward along the east coast of India. Thus both these systems appear to arrest or weaken the propagation of the first upwelling and first downwelling Kelvin waves in the coastal wave guide of the western BoB. On the other hand, the equatorward flowing EICC during October-December favours the propagation of the second downwelling Kelvin wave into the southeastern AS. The SSHA in both the equatorial and coastal wave guides show significant differences in the signatures of the second downwelling Kelvin wave for all the three regimes, strong, weak and IOD. The maxima in the SSHA manifested by the second downwelling Kelvin wave in the eastern EIO show large interannual variability. The zonal winds along 21
22 the equator also show strong intraseasonal and interannual variability. These winds are stronger along the eastern EIO during the strong regime than during the weak regime. Thus it is clear that the observed interannual variability seen in the equatorial zonal winds distinctly shows its influence on the SSHA field through eastward propagating Kelvin waves. The D20 derived from the east central EIO mooring has also shown an excellent correspondence with the surface zonal wind speed in the central EIO during the boreal fall transition on an interannual time scale suggesting the important role of the eastward propagating second downwelling Kelvin wave. As seen along the equator, large interannual variability in the Kelvin wave activity is also noticed in the coastal wave guides of the BoB and the southeastern AS. The observed anomalies of the zonal wind speed for these three categories of years also show large differences during the second half of the year over the eastern EIO. The sea-level data recorded by tide gauge stations on the east coast of India (Visakhapatnam and Chennai), composited for all the three regimes during October-December, also show significant differences. These Kelvin waves also trigger Rossby waves from the eastern rim of the BoB that propagate westward in the BoB and in the northern EIO. It is also clear that the interannual variability of the westward propagating Rossby wave is determined by the corresponding interannual variability of the second downwelling Kelvin wave that propagates along the equator and off the southeastern rim of the BoB. The composites of anomalies of near-surface thermal structure derived from SODA analysis for the northern EIO during October-March also show large differences for all three regimes in both the sign and the amplitude of the westward propagating Rossby wave. The composites of OLR anomalies for all three regimes over the eastern EIO also show distinct differences. 22
23 During July-October, over the eastern EIO, greater moist convection is noticed during the strong regime than during the weak regime. During the IOD regime, the east-west reversal of convection maxima during the second half of the year is also distinctly seen in tune with the reversal of SST maxima. Thus it is clear that the strength of the zonal winds over the equator driven by the east-west gradient of the tropospheric heat sources is a critical factor in determining the observed interannual variability of the second downwelling Kelvin wave in the eastern EIO and in the coastal wave guides of the BoB and the southeastern AS. 5 Acknowledgements Highest appreciation is placed on record for the excellent compilation by several persons and organization of all the data sets utilized in this study. Graphics were generated using Ferret. The encouragement and the facilities provided by the Directors of NPOL, INCOIS, and NIO are gratefully appreciated. The comments from three anonymous reviewers were very helpful in improving the quality of the paper. Special thanks to the Editor for his useful editorial corrections and comments. This research is supported through INDOMOD-SATCORE Project of Ministry of Earth Sciences, Govt. of India. References Ali, M.M., R.Sharma and R. Chenny, 1998, An atlas of the north Indian Ocean eddies from TOPEX altimeter derived sea surface heights, Indian Space Research Organization Special Publication, ISRO-SAC-SP-69-98, 8pp and 39 plates Basu S, S.D.Meyers and J.J.O Brien, 2000, Annual and interannual sea level variations in the Indian Ocean from TOPEX/Poseidon observations and ocean model simulations, Journal of Geophysical Research, 105, C1, Brandt P. L.Stramma, F.Schott, J.Fischer, M.Dengler and D.Quadfasel, 2002, Annual Rossby waves in the Arabian Sea from TOPEX/POSEIDON altimeter and in-situ data, Deep-Sea Research II, 49,
24 Bruce J.G., D.R.Johnson and J.C.Kindle, 1994, Evidence for eddy formation in the eastern Arabian Sea during the northeast monsoon, Journal of Geophysical Research, 99, C4, Bruce J.G., J.C.Kindle, L.H.Kantha, J.L.Kerling, and J.F.Bailey, 1998, Recent observations and modeling in the Arabian Sea Laccadive High region, Journal of Geophysical Research, 103, C4, Cane M, 1980, On the dynamics of the equatorial currents, with application to the Indian Ocean, Deep-Sea Research 27A, Carton J., G.Chepurin, X.Cao and B Giese, 2000, A simple ocean data assimilation analysis of the global upper ocean Part-I Method, Journal of Physical Oceanography, 30, Chambers D P, B D Tapley and R H Stewart, 1999, Anomalous warming in the Indian Ocean coincident with El Nino, Journal of Geophysical Research, 104, Chelton D B, R A Deszoeke and M G Schlax, 1998, Geographic variability of the first baroclinic Rossby wave deformation, Journal of Physical Oceanography, 28, Clark A.J. and X.Liu, 1993, Observations and dynamics of semiannual and annual sea levels near the eastern equatorial Indian Ocean boundary, Journal of Physical Oceanography, 23, 2, Clark A.J. and X.Liu, 1994, Interannual sea level northern and eastern Indian Ocean, Journal of Physical Oceanography, 24, 6, Cutler, A.N., Swallow, J.C., Surface currents of the Indian Ocean (to 25N, 100E): compiled from historic data archived by the Meteorological Office, Bracknell, UK, Institute of Ocean Science. Report No. 187, pp. 8 and 36 charts Duing W, 1970, The Monsoon Regime of the Currents in the Indian Ocean, International Indian Ocean Expedition Oceanographic Monographs Number 1, East-West Center Press, Honolulu, 68 pp Eigenheer A. and D. Quadfasel, 2000, Seasonal variability of the BoB circulation inferred from TOPEX/Poseidon altimetry, Journal of Geophysical Research, 105, C2, Feng M and G Meyers, 2003, Interannual variability in the tropical Indian Ocean: A two year time scale of Indian Ocean Dipole, Deep-Sea Research II, 50, Fu, L. L. 2001, Ocean circulation and variability from satellite altimetry, Chapter 3, Ocean Circulation and Climate, Observing and Modelling the Global Ocean, Ed: G Siedler, J Church and J Gould, International Geophysics Series Number, 77, and Plates
25 Gent P K., O Neill, and M Cane, 1983, A model of the semi-annual oscillation in the equatorial Indian Ocean, Journal of Physical Oceanography, 13, Gnanaseelan C., J.S.Chowdary, A.K.Misra and P.S.Salvekar, 2003, Indian Ocean dipole mode events in a simple mixed layer ocean model, Indian Journal of Marine Sciences, 32, 4, Gopalakrishna, V. V., R. R. Rao, K. Nisha, M. S. Girishkumar, T. Pankajakshan, M. Ravichandran, Z. Johnson, K. Girish, N. Aneeshkumar, M. Srinath, S. Rajesh, and C. K. Rajan, 2008, Observed anomalous upwelling in the Lakshadweep Sea during the summer monsoon season of 2005, Journal of Geophysical Research, 113, C05001, doi: /2007/jc Gopalan A K S, V V Gopalakrishna, M M Ali and R Sharma, 2000, Detection of BoB eddies from TOPEX and sea truth observations, Journal of Marine Research, 58, Han W, 2005, Origins and dynamics of the 90-day and day variations in the equatorial Indian Ocean, Journal of Physical Oceanography, 35, Han W., J.P.McCreary, D.L.T.Anderson, and A.J.Mariano, 1999, On the dynamics of the eastward surface jets in the equatorial Indian Ocean, Journal of Physical Oceanography, 29, Han W., D.M.Lawrance and P.J.Webster, 2001, Dynamical response of equatorial Indian Ocean to intraseasonal winds: zonal flow, Geophysical Research Letters, 28, 22, Han W. and P.J.Webster, 2002, Forcing mechanisms of sea level interannual variability in the BoB, Journal of Physical Oceanography, 32, 1, Hareesh Kumar and Sanilkumar, 2004, Long period waves in the coastal regions of north Indian Ocean, Indian Journal of Marine Science, 33, 2, Hase H, Y Masumoto, Y Kuroda, and K Mizuno, 2008, Semiannual variability in temperature and salinity observed by Triangle Trans-Ocean Buoy Netwok (TRITON) buoys in eastern tropical Indian Ocean, Journal of Geophysical Research, 113, C01016, doi: ,/2006JC Hastenrath S. and L. Greischar, 1991, The monsoonal current regimes of the tropical Indian Ocean: Observed surface flow fields and their geostrophic and wind components, Journal of Geophysical Research, 96, C7, 12,619-12,633 Haugen, V. E., O. M. Johannessen, and G. Evensen, 2002, Indian Ocean: Validation of the Miami Isopycnic Coordinate Ocean Model and ENSO events during , J. Geophys. Res., 107(C5), 3043, doi: /2000jc
26 Horri T., H Hase, I Ueki, and Y Masumoto, 2008, Oceanic precondition and evolution of the 2006 Indian Ocean Dipole, Geophysical Research Letters, 35, L03607, doi: 1029/2007GL Iskandar I., Y Masumoto, and K Mizuno, 2009, Subsurface equatorial zonal current in the eastern Indian Ocean, Journal of Geophysical Research 114, C06005, doi: /2008jc Jensen, T.G., 1993, Equatorial variability and resonance in a wind driven Indian Ocean model, Journal of Geophysical Research, 98, C12, Kindle J C and J D Thompson, 1989, The days oscillation in the western Indian Ocean: Model results, Journal of Geophysical Research, 94, Le Blanc J L and J P Boulanger, 2001, Propagation and reflection of long equatorial waves in the Indian Ocean from TOPEX/Poseidon data during the period, Climate Dynamics, 17, Lighthill, M.J.,1969, Dynamic response of the Indian Ocean to the onset of the southwest monsoon, Philosophical Transactions of the Royal Meteorological Society, A, A265, Locarnini, R.A., A. V. Mishonov, J.I. Antonov, T.P. Boyer, and H.E. Garcia, 2006, World Ocean Atlas 2005, Volume 1: Temperature, S. Levitus, Ed. NOAA Atlas NESDIS 61, U.S. Government Printing Office, Washington, D.C., 182 pp. Luther M.E. and J.J.O Brien, 1985, A model of the seasonal circulation in the Arabian Sea forced by observed winds, Progress in Oceanography, 14, Masumoto Y and G Meyers, 1998, Forced Rossby waves in the southern tropical Indian Ocean, Journal of Geophysical Research, 103, C12, 27,589-27,602 Masumoto Y, H Hase, Y Kuroda, H Matsuura and K Takeuchi, 2005, Intraseasonal variability in the upper layer currents observed in the eastern equatorial Indian Ocean, Geophysical Research Letters, 32, L02607, doi: /2004GL Masumoto Y, T Horii, I Ueki, H Hase, K Ando and K Mizuno, 2008, Short-term upper ocean variability in the central equatorial Indian Ocean during 2006 Indian Ocean Dipole event, Geophysical Research Letters, 35, L14S09, doi: /2008GL McCreary J.P., P.K.Kundu, and R.L.Molinari, 1993, A numerical investigation of dynamics, thermodynamics and the mixed layer processes in the Indian Ocean, Progress in Oceanography, 31,
27 McCreary, J.P., W.Han, D.Shankar and S.R.Shetye, 1996, Dynamics of the East India Coastal Current. 2. Numerical solutions, Journal of Geophysical Research, 101, McPhaden M., 1982, Variability in the central Indian Ocean. Part I: Ocean dynamics, Journal of Marine Research, 40, Miyama T, J P McCreary, D Sengupta and R Senan, 2006, Dynamics of biweekly oscillations in the equatorial Indian Ocean, Journal of Physical Oceanography, 36, 5, Molinari R., D.Olson and G.Reverdin, 1990, Surface current distributions in the tropical Indian Ocean derived from compilations of surface buoy trajectories, Journal of Geophysical Research, 95, C5, Moore D W and J P McCreary, 1990, Excitation of intermediate frequency equatorial waves at a western ocean boundary: With application to observations from the western Indian Ocean, Journal of Geophysical Research, 95, C4, Murtugudde R. and A.J.Busalacchi, 1999, Interannual variability of the dynamics and thermodynamics of the Indian Ocean, Journal of Climate, 12, Murtugudde R., J P McCreary and A.J.Busalacchi, 2000, Oceanic processes associated with anomalous events in the Indian Ocean with relevance to , Journal of Geophysical Research, 105, Nagura M and M J McPhaden, 2008, The dynamics of zonal current variations in the central equatorial Indian Ocean, Geophysical Research Letters, 35, L23603, doi: /2008GL O Brien, J.J., and H.E. Hurlburt, 1974, An equatorial jet in the Indian Ocean: Theory, Science, 184, Periguad C. and P. Delecluse, 1992, Annual sea level variations in the southern tropical Indian Ocean from Geosat and shallow-water simulations, Journal of Geophysical Research, 97, C12, 20,169-20,178 Periguad C. and P. Delecluse, 1993, Interannual sea level variations in the tropical Indian Ocean from Geosat and shallow-water simulations, Journal of Physical Oceanography, 23,9, Peter, B. N. and K Mizuno, 2000, Annual cycle of steric height in the Indian Ocean estimated from thermal field, Deep-Sea Research I, 47,
28 Polito P.S. and W.T.Liu, 2003, Global characterization of Rossby waves at several spectral bands, Journal of Geophysical Research, 108, C1, 3018, doi: /2000jc Potemra J.T., M.E.Luther and J.J.O Brien, 1991, The seasonal circulation of the upper ocean in the BoB, Journal of Geophysical Research, 96, 12,667-12,683 Prasad T.G. and M.Ikeda, 2001, Spring evolution of Arabian Sea High in the Indian Ocean, Journal of Geophysical Research, 106, C11, 31,085-31,098 Prasad T.G and J L McClean, 2004, Mechanisms of anomalous warming in the western Indian Ocean during dipole mode events, Journal of Geophysical Research, 109, C02019, Doi: /2003JC Prasannakumar S.P., and A.S.Unnikrishnan, 1995, Seasonal cycle of temperature and associated wave phenomena in the upper layers of the BoB, Journal of Geophysical Research,100, 13,585-13,593 Rahul P.C.R., P.S.Salvekar, A.A.Deo and D.W.Ganer, 2004 Westward propagating twin gyres in the equatorial Indian Ocean, Geophysical Research Letters, 31, L01304, doi: /2003gl Rao A.S., S K Behera, Y Masumoto, and T Yamagata, 2002, Interannual subsurface variability in the tropical Indian Ocean with a special emphasis on the Indian Ocean Dipole, Deep-Sea Research II, 49, Rao R R and R Sivakumar, 2000, Seasonal variability of near-surface thermal structure and heat budget of the mixed layer of the tropical Indian Ocean from a new global ocean temperature climatology, Journal of Geophysical Research, 105, C1, Reverdin G., 1987, The upper equatorial Indian Ocean: the multi-year averaged seasonal cycle, Journal of Physical Oceanography, 17, Reverdin G and J Luyten, 1986, Near-surface meanders in the equatorial Indian Ocean, Journal of Physical Oceanography, 16, Saji N.H., B.N.Goswami, P.N.Vinayachandran and T.Yamagata, 1999, A dipole mode in the tropical Indian Ocean, Nature, 401, Schiller A., S.Godfrey, P.C.McIntosh, G.Meyers and S.E.Wijffels, 1998, Seasonal nearsurface dynamics and thermodynamics of the Indian Ocean and Indonesian Throughflow in a global general circulation model, Journal of Physical Oceanography, 28, Schott F.A., and J.P. McCreary, 2001, The monsoon circulation of the Indian Ocean, Progress in Oceanography, 51,
29 Schott F.A., S P Xie and J.P. McCreary, 2009, Indian Ocean circulation and climate variability, Reviews of Geophysics, 47, RG1002, doi: /2007rg Sengupta D., R. Senan and B.N.Goswami, 2001, Origin of intraseasonal variability of circulation in the tropical central Indian Ocean, Geophysical Research Letters, 28, 7, Sengupta D., R Senan, V S N Murty and V Fernando, 2004, A biweekly mode in the equatorial Indian Ocean, Journal of Geophysical Research, 109, C10003, doi: /2004jc Senan R., Sengupta D., and B.N.Goswami, 2003, Intraseasonal Monsoon Jets in the equatorial Indian Ocean, Geophysical Research Letters, 30(14), 1750, doi: /2003gl Shankar D., J.P.McCreary, W.Han, and S.R. Shetye, 1996, Dynamics of the East India Coastal Current. 1. Analytical solutions forced by interior Ekman pumping and local alongshore winds, Journal of Geophysical Research, 101, Shankar D. and S.R. Shetye, 1997, On the dynamics of the Lakshadweep high and low in the southeastern Arabian Sea, Journal of Geophysical Research, 102, C6, 12,551-12,562 Shankar D, P N Vinayachandran and A S Uniikrishnan, 2002, The monsoon currents in the north Indian Ocean, Progress in Oceanography, 52, Shenoi S.S.C., P.K.Saji, A.M.Almeida, 1999, Near-surface circulation and kinetic energy in the tropical Indian Ocean derived from Lagrangian drifters, Journal of Marine Research, 57, Shetye S.R. and A.D.Gouveia, 1998, Coastal circulation in the north Indian Ocean, The Sea, Vol 11, edited by A R Robinson and K H Brink, John Wiley & Sons, Inc, Somayajulu, Y.K., V.S.N. Murty, and Y.V.B. Sarma, 2003, Seasonal and inter-annual variability of surface circulation in the Bay of Bengal from TOPEX/Poseidon altimetry, Deep-Sea Research II, 50, Sprintall J., A.Gordon, R.Murtugudde, and D.Susanto, 2000, A semi-annual Indian Ocean forced Kelvin wave observed in the Indonesian Seas in May 1997, Journal of Geophysical Research, 105, Subrahmanyam B. and I.S.Robinson, 2000, Sea surface height variability in the Indian Ocean from TOPEX /POSEIDON altimetry and model simulations, Marine Geodessy, 23,
30 Subrahmanyam B., I.S.Robinson, J.R.Blundell and P.G.Challenor, 2001, Indian Ocean Rossby waves observed in TOPEX/POSEIDON altimeter data and in model simulations, International Journal of Remote Sensing, 22, 1, Tsai P.T.H., J.J.O Brien and M.E.Luther, 1992, The 26-day oscillation in the satellite sea surface temperature measurements in the equatorial western Indian Ocean, Journal of Geophysical Research, 97, C6, Vinayachandran P.N., S.R.Shetye, D.Sengupta and S.Gadgil, 1996, Forcing mechanisms of the BoB circulation, Current Science, 71, 10, Vinayachandran P.N. and T.Yamagata, 1998, Monsoon response of the sea around Sri Lanka: Generation of thermal domes and anticyclonic vortices, Journal of Physical Oceanography, 28, 10, Vinayachandran P.N., Y.Masamoto, T.Mikawa, and T.Yamagata, 1999, Intrusion of the Southwest Monsoon Current into the BoB, Journal of Geophysical Research, 104, Vinayachandran P.N., S.Iizuka and T.Yamagata, 2002, Indian Ocean dipole mode events in an ocean general circulation model, Deep-Sea Research I I, 49, Visbeck M and F Schott, 1992, Analysis of seasonal current variations in the western equatorial Indian Ocean: Direct measurements and GFDL model comparison, Journal of Physical Oceanography, 22, 10, Wang L, C.J.Koblinsky and S. Howden, 2001, Annual Rossby wave in the southern Indian Ocean: Why does it appear to break down in the middle ocean, Journal of Physical Oceanography, 31, 1, Webster P.J., A.M.Moore, J.P.Loschnigg and R.R.Leben, 1999, Coupled oceanatmosphere dynamics in the Indian Ocean during , Nature, 401, Wentz, F.J., Gentemann, C., Smith, D., and Chelton, D., Satellite measurements of sea surface temperature through clouds, Science, 288, Wentz, F.J., Smith, D.K., Mears, C.A., and Gentemann, C.L., Advanced algorithms for QuikSCAT and SeaWinds/AMSR Geoscience and Remote Sensing Symposium, IGARSS Vol.3, IEEE 2001 International, White W., 2000, Coupled Rossby waves in the Indian Ocean on interannual time scales, Journal of Physical Oceanography, 30, 11, Woodbury K E, M E Luther and J J O Brien, 1989, The wind driven seasonal circulation in the southern tropical Indian Ocean, Journal of Geophysical Research, 94, 17,985-18,002 30
31 Wyrtki, K, 1971, Oceanographic Atlas of the International Indian Ocean Expedition, National Science Foundation, Washington D.C., 531pp Wyrtki, K, 1973, An equatorial jet in the Indian Ocean, Science, 181, Yamagata T, K Mizuno and Y Masumoto, 1996, Seasonal variations in the equatorial Indian Ocean with their impacts on the Lombok Throughflow, Journal of Geophysical Research, 101, Yu L., J.J.O Brien and J.Yang, 1991, On the remote forcing of the circulation in the BoB, Journal of Geophysical Research, 96, C11, 20,449-20,454 Yu L., 2003, Variability of the depth of the 20 C isotherm along 6 N in the BoB: its response to remote and local forcing and its relation to satellite SSH variability, Deep-Sea Research II, 50, Yuan D and W Han, 2006, Roles of equatorial waves and western boundary reflection in the seasonal circulation of the equatorial Indian Ocean, Journal of Physical Oceanography, 36, 5,
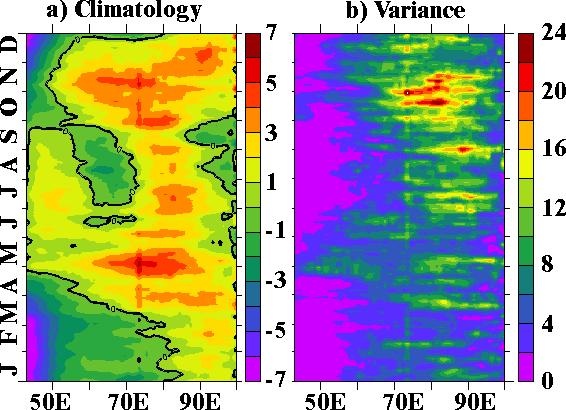
32 Legends of figure Figure 1a: Observed annual cycle of multi-year ( ) averaged SSHA in the north Indian Ocean. Figure 1b: Fourier fields of amplitude (cm), percent variance (%) and phase (degrees) for CPY: 1 (upper panel) and CPY: 2 (lower panel) of SSHA in the north Indian Ocean Figure 2: Longitude-time sections of multi-year averages of (a) surface zonal wind stress (N/m**2), (b) D20 (m) and (c) SSHA (cm) along the equator (1 N-1 S averages) in the Indian Ocean (zero contour is shown with thick black line) Figure 3a: Evolution of the observed life cycle of the first upwelling Kelvin wave as seen from the multi-year averages of SSHA (cm) (only negative values are mapped) in the BoB at 10-day interval during 5 January - 25 April. Figure 3b: Evolution of the observed life cycle of the first downwelling Kelvin wave as seen from the multi-year averages of SSHA (cm) (only positive values are mapped) in the BoB at 10-day interval during 25 Apr - 13 August Figure 3c: Evolution of the observed life cycle of the second upwelling Kelvin wave as seen from the multi-year averages of SSHA (cm) (only negative values are mapped) in the BoB at 10-day interval during 23 August - 22 September Figure 3d: Evolution of the observed life cycle of the second downwelling Kelvin wave as seen from the multi-year averages of SSHA (cm) (only positive values are mapped) in the BoB and the southeastern AS at 10 day interval during 2 October - 29 December Figure 3e: Schematic of the observed annual cycle of the propagating upwelling (blue wriggled arrows) and downwelling (red wriggled arrows) Kelvin waves along the wave guides of the equator, coastal BoB and coastal southeastern AS Figure 3f: Longitude-time sections of observed multi-year averaged annual cycle of surface zonal wind speed (m/s) (left panel) and its interannual variance (m**2/s**2) (right panel) along the equator in the Indian Ocean Figure 3g: Evolution of the clockwise eddy over the head of the BoB in the multi-year averaged near-surface circulation (Ekman + geostrophic) and the TMI SST (ºC) during December-March Figure 3h: Evolution of the multi-year averaged East India Coastal Current (Ekman + geostrophic) off the east coast of India during April-June and October-December (arrow head shows the direction of the current and the arrow length and the background colour show the current speed in cm/s) 32
33 Figure 4a: Longitude-time plots of the interannual variability of SSHA (cm) along the equator in the Indian Ocean during January-December for the years Figure 4b: Composite longitude-time plots of SSHA (cm) (top panel) and zonal wind speed anomalies (m/s) (bottom panel) along the equator in the Indian Ocean during January-December for the years when the second downwelling Kelvin wave is (a) strong (b) weak and (c) absent during the IOD years Figure 4c: Time series of QuikSCAT surface wind speed (m/s) (averaged over the red box bounded by 70 E, 90 E, 1 N and 1 S shown in the map) and D20 (m) from JAMSTEC mooring located at 1.5 S and 90 E (blue dot shown in the map) during Figure 5a: Distribution of one degree boxes along the coastal wave guides of the BoB and southeastern AS (station 1 starts at the eastern edge of the equator and the numbers are shown at an interval of 30) where SSHA data are utilized to track the propagation of the coastal Kelvin waves Figure 5b: Wave track-time plots of the interannual variability of SSHA (cm) off the coasts of the BoB and southeastern AS during (wave track shown in Figure 5a) Figure 5c: Composite wave track-time plots of SSHA (cm) from the eastern equator to the southwest coast of India (wave track shown in Figure 5a) during the years when the second downwelling Kelvin wave is (a) strong (b) weak and (c) absent during the IOD years Figure 5d: Interannual variability of October-December averaged SSHA (cm) in the eastern equatorial region (average of the green boxes shown in the inset map of the bottom panel) and along the coastal wave guides of the BoB and the southeastern AS (average of the green boxes shown in the inset map of the upper panels) Figure 5e: Observed monthly composites of sea level data (mm) recorded by tide gauges at Visakhapatnam, Chennai, and Cochin (station locations shown in Figure 3e) Figure 6a: Composite longitude-time fields of SSHA (cm) along the latitudinal band 2 N- 6 N in the north EIO (shown as blue band in the top inset map) during the following year from October when the second downwelling Kelvin wave is (a) strong (b) weak and (c) absent during the IOD years Figure 6b: Composite of vertical thermal structure anomaly ( C) in the topmost 150 m of the water column along 2 N-6 N in the north Indian Ocean (shown as blue band in the top map) during October-March (in the following years) when the second downwelling Kelvin wave is (a) strong (b) weak and (c) absent during the IOD years 33
34 Figure 7: Composites of longitude-time plots of OLR anomalies (W/m**2) along the equator in the Indian Ocean (shown as the blue band in the map) during January- December when the second downwelling Kelvin wave is (a) strong (b) weak and (c) absent during the IOD years 34
35 Table -1 Parameter Source Period Accuracy Spatial Resolution ERS1/2 Winds m/s & QuikSCAT Winds m/s 0.25 AVISO Blended SSHA com 2006 cm TMI SST Depth of 20 0 C isotherm 2006 Tide gauge sea level Near-surface vertical thermal structure edu 2005 (SODA V1.4.2 for the period and V2.0.4 for the period ) Outgoing Long wave Radiation c/data.interp_olr.ht ml 2006 ~ 0.5 C 0.25 unknown cm --- ~ 0.5 C W/m**

36 Figure 1a: Figure 1b: 1
37 Figure 2:

38 Figure 3a:

39 Figure 3b:

40 Figure 3c:

41 Figure 3d:

42 Figure 3e: Figure 3f:

43 Figure 3g:

44 Figure 3h:

45 Figure 4a: Figure 4b:
46 Figure 4c: Figure 5a:

47 Figure 5b: Figure 5c:

48 Figure 5d:

49 Figure 5e: Figure 6a:

50 Figure 6b: Figure 7:
Long period waves in the coastal regions of north Indian Ocean
 Indian Journal of Marine Sciences Vol. 33(2), June 2004, pp 150-154 Long period waves in the coastal regions of north Indian Ocean *P V Hareesh Kumar & K V Sanilkumar Naval Physical & Oceanographic Laboratory,
3 The monsoon currents in an OGCM
 3 The monsoon currents in an OGCM The observations show that both Ekman drift and geostrophy contribute to the surface circulation in the north Indian Ocean. The former decays rapidly with depth, but the
Subsurface equatorial zonal current in the eastern Indian Ocean
 Click Here for Full Article JOURNAL OF GEOPHYSICAL RESEARCH, VOL. 114,, doi:10.1029/2008jc005188, 2009 Subsurface equatorial zonal current in the eastern Indian Ocean Iskhaq Iskandar, 1,2 Yukio Masumoto,
Analysis of 2012 Indian Ocean Dipole Behavior
 Analysis of 2012 Indian Ocean Dipole Behavior Mo Lan National University of Singapore Supervisor: Tomoki TOZUKA Department of Earth and Planetary Science, University of Tokyo Abstract The Indian Ocean
The monsoon currents in the north Indian Ocean
 The monsoon currents in the north Indian Ocean D. Shankar a, P. N. Vinayachandran b, and A. S. Unnikrishnan a a Physical Oceanography Division, National Institute of Oceanography, Dona Paula, Goa 403 004,
Altimetric Observations and model simulations of Coastal Kelvin waves in the Bay of Bengal
 Author version: Mar. Geod., vol.35(s1); 2012; 190-216 Altimetric Observations and model simulations of Coastal Kelvin waves in the Bay of Bengal Matthew J. Nienhaus 1, Bulusu Subrahmanyam 1,2, V.S.N. Murty
Sea surface salinity variability during the Indian Ocean Dipole and ENSO events in the tropical Indian Ocean
 JOURNAL OF GEOPHYSICAL RESEARCH, VOL. 116,, doi:10.1029/2011jc007456, 2011 Sea surface salinity variability during the Indian Ocean Dipole and ENSO events in the tropical Indian Ocean Gary Grunseich, 1
MODELING INDIAN OCEAN CIRCULATION: BAY OF BENGAL FRESH PLUME AND ARABIAN SEA MINI WARM POOL
 MODELING INDIAN OCEAN CIRCULATION: BAY OF BENGAL FRESH PLUME AND ARABIAN SEA MINI WARM POOL P. N. Vinayachandran* 1 1, *2 and J. Kurian* * 1 Centre for Atmospheric and Oceanic Sciences, Indian Institute
2 Observations. 2.1 Ekman drift
 2 Observations To define the monsoon currents and the associated circulation in the north Indian Ocean, we use climatological wind-stress data to estimate the surface Ekman drift, and hydrography and altimeter
Behavior of the Wyrtki Jet observed with surface drifting buoys and satellite altimeter
 GEOPHYSICAL RESEARCH LETTERS, VOL. 36, L18607, doi:10.1029/2009gl039120, 2009 Behavior of the Wyrtki Jet observed with surface drifting buoys and satellite altimeter Yun Qiu, 1 Li Li, 1 and Weidong Yu
Intraseasonal response of Northern Indian Ocean coastal. waveguide to the Madden-Julian Oscillation
 1 2 3 Intraseasonal response of Northern Indian Ocean coastal waveguide to the Madden-Julian Oscillation 4 5 6 J. Vialard 1 2, S.S.C Shenoi 2, J.P. McCreary 3, D. Shankar 2, F. Durand 4, V. Fernando 2
Equatorial Oceanic Waves and the Evolution of 2007 Positive Indian Ocean Dipole
 Terr. Atmos. Ocean. Sci., Vol. 25, No. 6, 847-856, December 2014 doi: 10.3319/TAO.2014.08.25.01(Oc) Equatorial Oceanic Waves and the Evolution of 2007 Positive Indian Ocean Dipole Iskhaq Iskandar 1, 4,
Intraseasonal variability of equatorial Indian Ocean zonal currents
 Intraseasonal variability of equatorial Indian Ocean zonal currents Debasis Sengupta 1, Retish Senan 2 and B. N. Goswami Centre for Atmospheric and Oceanic Sciences Indian Institute of Science, Bangalore,
Wind-Driven Response of the Northern Indian Ocean to Climate Extremes*
 2978 J O U R N A L O F C L I M A T E VOLUME 20 Wind-Driven Response of the Northern Indian Ocean to Climate Extremes* TOMMY G. JENSEN International Pacific Research Center, University of Hawaii at Manoa,
Ocean dynamic processes responsible for the interannual. variability of the tropical Indian Ocean SST. associated with ENSO
 Ocean dynamic processes responsible for the interannual variability of the tropical Indian Ocean SST associated with ENSO Jong Seong Kug 1 and Soon Il An 2, Korea Ocean Research and Development Institute
RECTIFICATION OF THE MADDEN-JULIAN OSCILLATION INTO THE ENSO CYCLE
 RECTIFICATION OF THE MADDEN-JULIAN OSCILLATION INTO THE ENSO CYCLE By William S. Kessler and Richard Kleeman Journal of Climate Vol.13, 1999 SWAP, May 2009, Split, Croatia Maristella Berta What does give
Lecture 33. Indian Ocean Dipole: part 2
 Lecture 33 Indian Ocean Dipole: part 2 Understanding the processes I continue the discussion of the present understanding of the processes involved in the evolution of the mean monthly SST, and convection
Hui Wang, Mike Young, and Liming Zhou School of Earth and Atmospheric Sciences Georgia Institute of Technology Atlanta, Georgia
 Water Cycle between Ocean and Land and Its Influence on Climate Variability over the South American-Atlantic Regions as Determined by SeaWinds Scatterometers Rong Fu Hui Wang, Mike Young, and Liming Zhou
The monsoon currents in the north Indian Ocean
 The monsoon currents in the north Indian Ocean D. Shankar a, P. N. Vinayachandran b, A. S. Unnikrishnan a, and S. R. Shetye a a Physical Oceanography Division, National Institute of Oceanography, Dona
Indian Ocean Seasonal Cycle Jérôme Vialard (IRD) LOCEAN Paris France From Schott & McCreary (Prog. Oc.
 LOCEAN Paris France From Schott & McCreary (Prog. Oc.") Indian Ocean Seasonal Cycle Jérôme Vialard (IRD) LOCEAN Paris France jerome.vialard@ird.fr From Schott & McCreary (Prog. Oc. 2001) Outline The monsoon cycle The basin-scale dynamical response Thermocline
Indian Ocean Seasonal Cycle Jérôme Vialard (IRD) LOCEAN Paris France jerome.vialard@ird.fr From Schott & McCreary (Prog. Oc. 2001) Outline The monsoon cycle The basin-scale dynamical response Thermocline
Role of Equatorial Oceanic Waves on the Activation of the 2006 Indian Ocean Dipole
 ITB J. Sci., Vol. 44 A, No. 2, 2012, 113-128 113 Role of Equatorial Oceanic Waves on the Activation of the 2006 Indian Ocean Dipole Iskhaq Iskandar 1,2 1 Jurusan Fisika, Fakultas MIPA, Universitas Sriwijaya
Intraseasonal Variability of Equatorial Indian Ocean Zonal Currents
 3036 J O U R N A L O F C L I M A T E VOLUME 20 Intraseasonal Variability of Equatorial Indian Ocean Zonal Currents DEBASIS SENGUPTA Centre for Atmospheric and Oceanic Sciences, Indian Institute of Science,
Intrusion of the Southwest Monsoon Current into the Bay of Bengal
 JOURNAL OF GEOPHYSICAL RESEARCH, VOL. 104, NO. C5, PAGES 11,077 11,085, MAY 15, 1999 Intrusion of the Southwest Monsoon Current into the Bay of Bengal P. N. Vinayachandran, 1 Yukio Masumoto, 1,2 Tetsuya
Monsoon Systems Valsavarenche Val d Aosta, Italy
 Dynamics of IO annual and interannual circulation Jay McCreary Alpine Summer School: Monsoon Systems Valsavarenche Val d Aosta, Italy June 8 13, 2009 References 1) (MKM93) McCreary, J.P., P.K. Kundu, and
Roles of Equatorial Waves and Western Boundary Reflection in the Seasonal Circulation of the Equatorial Indian Ocean
 930 J O U R N A L O F P H Y S I C A L O C E A N O G R A P H Y VOLUME 36 Roles of Equatorial Waves and Western Boundary Reflection in the Seasonal Circulation of the Equatorial Indian Ocean DONGLIANG YUAN
The Setting - Climatology of the Hawaiian Archipelago. Link to Video of Maui Waves
 The Setting - Climatology of the Hawaiian Archipelago Link to Video of Maui Waves What caused this week s weather? What caused this weekend s weather? Today s Objective: Provide overview and description
PROC. ITB Eng. Science Vol. 36 B, No. 2, 2004,
 PROC. ITB Eng. Science Vol. 36 B, No. 2, 2004, 133-139 133 Semiannual Kelvin Waves Propagation along the South Coast of Sumatra-Jawa-Bali and the Lesser Sunda Islands Observed by TOPEX/POSEIDON and ERS-1/2
Lecture 18: El Niño. Atmosphere, Ocean, Climate Dynamics EESS 146B/246B
 Lecture 18: El Niño Atmosphere, Ocean, Climate Dynamics EESS 146B/246B El Niño Transient equatorial motions: Kelvin and Rossby waves. Positive feedback mechanism associated with air-sea coupling. Atmospheric
West India Coastal Current and Lakshadweep High/Low
 Sadhand, Vol. 23, Parts 5 & 6, Oct & Dec 1998, pp. 637~i51. Indian Academy of Sciences West India Coastal Current and Lakshadweep High/Low SATISH R SHETYE National Institute of Oceanography, Dona Paula,
The monsoon currents in the north Indian Ocean
 Progress in Oceanography 52 (2002) 63 120 www.elsevier.com/locate/pocean The monsoon currents in the north Indian Ocean D. Shankar a,, P.N. Vinayachandran b, A.S. Unnikrishnan a a Physical Oceanography
Intraseasonal Variability in Sea Level Height in the Bay of Bengal: Remote vs. local wind forcing & Comparison with the NE Pacific Warm Pool
 Intraseasonal Variability in Sea Level Height in the Bay of Bengal: Remote vs. local wind forcing & Comparison with the NE Pacific Warm Pool Shang-Ping Xie 1,3, Xuhua Cheng 2,3, Julian P. McCreary 3 1.
Characteristics of Bay of Bengal Water mass in South Eastern Arabian Sea during
 Indian Journal of Geo-Marine Sciences Vol. 43(1), January 2014, pp. 27-32 Characteristics of Bay of Bengal Water mass in South Eastern Arabian Sea during 2001-2002 G Nageswara Rao, K Anil Kumar, PSV Jagadeesh
Goal: Develop quantitative understanding of ENSO genesis, evolution, and impacts
 The Delayed Oscillator Zebiak and Cane (1987) Model Other Theories Theory of ENSO teleconnections Goal: Develop quantitative understanding of ENSO genesis, evolution, and impacts The delayed oscillator
Influence of El Nino Southern Oscillation and Indian Ocean Dipole in biennial oscillation of Indian summer monsoon
 Influence of El Nino Southern Oscillation and Indian Ocean Dipole in biennial oscillation of Indian summer monsoon 4.1 Introduction The main contributors to the interannual variability of Indian summer
Surface chlorophyll bloom in the Southeastern Tropical Indian Ocean during boreal summer-fall as reveal in the MODIS dataset
 Surface chlorophyll bloom in the Southeastern Tropical Indian Ocean during boreal summer-fall as reveal in the MODIS dataset Iskhaq Iskandar 1 and Bruce Monger 2 1 Jurusan Fisika, Fakultas MIPA, Universitas
Basin-wide warming of the Indian Ocean during El Niño and Indian Ocean dipole years
 INTERNATIONAL JOURNAL OF CLIMATOLOGY Int. J. Climatol. 7: 141 1438 (7) Published online 1 February 7 in Wiley InterScience (www.interscience.wiley.com) DOI: 1.1/joc.148 Basin-wide warming of the Indian
Regional Oceanography: an Introduction
 176 Regional Oceanography: an Introduction Fig. 11.1. Topography of the Indian Ocean. The 1000, 3000, and 5000 m isobaths are shown, and regions less than 3000 m deep are shaded. South of Australia the
Subsurface Ocean Indices for Central-Pacific and Eastern-Pacific Types of ENSO
 Subsurface Ocean Indices for Central-Pacific and Eastern-Pacific Types of ENSO Jin-Yi Yu 1*, Hsun-Ying Kao 1, and Tong Lee 2 1. Department of Earth System Science, University of California, Irvine, Irvine,
5. El Niño Southern Oscillation
 5. El Niño Southern Oscillation Copyright 2006 Emily Shuckburgh, University of Cambridge. Not to be quoted or reproduced without permission. EFS 5/1 Ocean-Atmosphere Coupling Tropical atmosphere/ocean,
Biennial Oscillation of Tropical Ocean-Atmosphere System Associated with Indian Summer Monsoon
 Biennial Oscillation of Tropical Ocean-Atmosphere System Associated with Indian Summer Monsoon 2.1 Introduction The Indian summer monsoon displays substantial interannual variability, which can have profound
Data Analysis of the Seasonal Variation of the Java Upwelling System and Its Representation in CMIP5 Models
 Data Analysis of the Seasonal Variation of the Java Upwelling System and Its Representation in CMIP5 Models Iulia-Mădălina Ștreangă University of Edinburgh University of Tokyo Research Internship Program
Dynamics of wind forced intraseasonal zonal current variations in the equatorial Indian Ocean
 JOURNAL OF GEOPHYSICAL RESEARCH, VOL. 116,, doi:10.1029/2010jc006864, 2011 Dynamics of wind forced intraseasonal zonal current variations in the equatorial Indian Ocean Iskhaq Iskandar 1,2 and Michael
Investigation of Common Mode of Variability in Boreal Summer Intraseasonal Oscillation and Tropospheric Biennial Oscillation
 Investigation of Common Mode of Variability in Boreal Summer Intraseasonal Oscillation and Tropospheric Biennial Oscillation 5. Introduction The Asian summer monsoon is one of the most vigorous and energetic
Satellite observations of intense intraseasonal cooling events in the tropical south Indian Ocean
 Click Here for Full Article GEOPHYSICAL RESEARCH LETTERS, VOL. 33, L14704, doi:10.1029/2006gl026525, 2006 Satellite observations of intense intraseasonal cooling events in the tropical south Indian Ocean
Understanding El Nino-Monsoon teleconnections
 Understanding El Nino-Monsoon teleconnections Dr Neena Joseph Mani Earth & Climate Science INSA Anniversary General meeting, Session: Science in IISER Pune 27 th December 2017 Mean State of the equatorial
ENSO Cycle: Recent Evolution, Current Status and Predictions. Update prepared by Climate Prediction Center / NCEP 8 March 2010
 ENSO Cycle: Recent Evolution, Current Status and Predictions Update prepared by Climate Prediction Center / NCEP 8 March 2010 Outline Overview Recent Evolution and Current Conditions Oceanic Niño Index
Annual Adjustment of the Thermocline in the Tropical Pacific Ocean
 596 JOURNAL OF CLIMATE Annual Adjustment of the Thermocline in the Tropical Pacific Ocean BIN WANG, RENGUANG WU, AND ROGER LUKAS Department of Meteorology and International Pacific Research Center,* School
Monsoon Response of the Sea around Sri Lanka: Generation of Thermal Domes and Anticyclonic Vortices
 1946 JOURNAL OF PHYSICAL OCEANOGRAPHY Monsoon Response of the Sea around Sri Lanka: Generation of Thermal Domes and Anticyclonic Vortices P. N. VINAYACHANDRAN* AND TOSHIO YAMAGATA Department of Earth and
Week 6-7: Wind-driven ocean circulation. Tally s book, chapter 7
 Week 6-7: Wind-driven ocean circulation Tally s book, chapter 7 Recap so far Our goal (since week 3) has been to understand large-scale ocean circulation and its underlying physics, and to learn how to
APPENDIX B NOAA DROUGHT ANALYSIS 29 OCTOBER 2007
 APPENDIX B NOAA DROUGHT ANALYSIS 29 OCTOBER 2007 ENSO Cycle: Recent Evolution, Current Status and Predictions Update prepared by Climate Prediction Center / NCEP October 29, 2007 Outline Overview Recent
Interannual variation of northeast monsoon rainfall over southern peninsular India
 Indian Journal of Geo-Marine Science Vol. 40(1), February 2011, pp 98-104 Interannual variation of northeast monsoon rainfall over southern peninsular India * Gibies George 1, Charlotte B. V 2 & Ruchith
Lecture 13 El Niño/La Niña Ocean-Atmosphere Interaction. Idealized 3-Cell Model of Wind Patterns on a Rotating Earth. Previous Lecture!
 Lecture 13 El Niño/La Niña Ocean-Atmosphere Interaction Previous Lecture! Global Winds General Circulation of winds at the surface and aloft Polar Jet Stream Subtropical Jet Stream Monsoons 1 2 Radiation
A dynamic link between the basin-scale and zonal modes in the Tropical Indian Ocean
 Theor. Appl. Climatol. 78, 203 215 (2004) DOI 10.1007/s00704-003-0027-2 International Pacific Research Center, SOEST, University of Hawaii at Manoa, Honolulu, HI, USA A dynamic link between the basin-scale
Mechanistic links between the tropical Atlantic and the Indian monsoon in the absence of El Nino Southern Oscillation events
 Mechanistic links between the tropical Atlantic and the Indian monsoon in the absence of El Nino Southern Oscillation events Vijay Pottapinjara 1*, Roxy Mathew Koll2, Raghu Murtugudde3, Girish Kumar M
Trade winds How do they affect the tropical oceans? 10/9/13. Take away concepts and ideas. El Niño - Southern Oscillation (ENSO)
") El Niño - Southern Oscillation (ENSO) Ocean-atmosphere interactions Take away concepts and ideas What is El Niño, La Niña? Trade wind and Walker circulation. What is the Southern Oscillation? Tropical
El Niño - Southern Oscillation (ENSO) Ocean-atmosphere interactions Take away concepts and ideas What is El Niño, La Niña? Trade wind and Walker circulation. What is the Southern Oscillation? Tropical
ENSO Cycle: Recent Evolution, Current Status and Predictions. Update prepared by Climate Prediction Center / NCEP 4 September 2012
 ENSO Cycle: Recent Evolution, Current Status and Predictions Update prepared by Climate Prediction Center / NCEP 4 September 2012 Outline Overview Recent Evolution and Current Conditions Oceanic Niño Index
Seasonal Currents in the Bay of Bengal and Andaman Sea Revealed by Reprocessed Observations
 2012 International Conference on Environment Science and Engieering IPCBEE vol.3 2(2012) (2012)IACSIT Press, Singapoore Seasonal Currents in the Bay of Bengal and Andaman Sea Revealed by Reprocessed Observations
AN ABSTRACT OF THE THESIS OF
 AN ABSTRACT OF THE THESIS OF Laxmikant Dhage for the degree of Master of Science in Ocean, Earth and Atmospheric Sciences presented on March 20, 2014. Title: Intra-seasonal Sea Level Variability along
Wind Driven Circulation Indian Ocean and Southern Ocean
 Wind Driven Circulation Indian Ocean and Southern Ocean Lecture 18 MAR 350 Spring 2017 Reading: Knauss Chapter 7 ECCO2 model animation ecco2_sst_flow (2).mp4 Mean surface height and currents DPO Fig. 11.1
Variability in the tropical oceans - Monitoring and prediction of El Niño and La Niña -
 Variability in the tropical oceans - Monitoring and prediction of El Niño and La Niña - Jun ichi HIROSAWA Climate Prediction Division Japan Meteorological Agency SST anomaly in Nov. 1997 1 ( ) Outline
On some aspects of Indian Ocean Warm Pool
 Indian Journal of Geo-Marine Sciences Vol. 44(4), April 2015, pp. 475-479 On some aspects of Indian Ocean Warm Pool Saji P. K. *, A. N. Balchand & M. R. Ramesh Kumar 1 Department of Physical Oceanography,
Effect of late 1970 s Climate Shift on Interannual Variability of Indian Summer Monsoon Associated with TBO
 Effect of late 97 s Climate Shift on Interannual Variability of Indian Summer Monsoon Associated with TBO 7. Introduction Biennial variability has been identified as one of the major modes of interannual
Effects of the seasonal cycle on the development and termination of the Indian Ocean Zonal Dipole Mode
 Click Here for Full Article JOURNAL OF GEOPHYSICAL RESEARCH, VOL. 111,, doi:10.1029/2005jc003247, 2006 Effects of the seasonal cycle on the development and termination of the Indian Ocean Zonal Dipole
Impact of Atmospheric Intraseasonal Oscillations on the Indian Ocean Dipole during the 1990s*
 670 J O U R N A L O F P H Y S I C A L O C E A N O G R A P H Y VOLUME 36 Impact of Atmospheric Intraseasonal Oscillations on the Indian Ocean Dipole during the 1990s* WEIQING HAN Program in Atmospheric
Observational Studies on Association between Eastward Equatorial Jet and Indian Ocean Dipole
 Journal of Oceanography, Vol. 66, pp. 429 to 434, 2 Short Contribution Observational Studies on Association between Eastward Equatorial Jet and Indian Ocean Dipole PETER C. CHU* Department of Oceanography,
Wind-driven driven Response of the Northern Indian Ocean to Climate Extremes
 Wind-driven driven Response of the Northern Indian Ocean to Climate Extremes Tommy G. Jensen International Pacific Research Center CLIVAR Indian Ocean Workshop Dec 1, 2004 1 Motivation Pathways of water
(20 points) 1. ENSO is a coupled climate phenomenon in the tropical Pacific that has both regional and global impacts.
 1. ENSO is a coupled climate phenomenon in the tropical Pacific that has both regional and global impacts.") SIO 210 Problem Set 4 Answer key December 1, 2014 Due Dec. 12, 2014 (20 points) 1. ENSO is a coupled climate phenomenon in the tropical Pacific that has both regional and global impacts. (2 points) a)
SIO 210 Problem Set 4 Answer key December 1, 2014 Due Dec. 12, 2014 (20 points) 1. ENSO is a coupled climate phenomenon in the tropical Pacific that has both regional and global impacts. (2 points) a)
Lecture 24. El Nino Southern Oscillation (ENSO) Part 1
 Part 1") Lecture 24 El Nino Southern Oscillation (ENSO) Part 1 The most dominant phenomenon in the interannual variation of the tropical oceanatmosphere system is the El Nino Southern Oscillation (ENSO) over the
Lecture 24 El Nino Southern Oscillation (ENSO) Part 1 The most dominant phenomenon in the interannual variation of the tropical oceanatmosphere system is the El Nino Southern Oscillation (ENSO) over the
Impacts of intraseasonal oscillation on the onset and interannual variation of the Indian summer monsoon
 Chinese Science Bulletin 2009 SCIENCE IN CHINA PRESS Springer Impacts of intraseasonal oscillation on the onset and interannual variation of the Indian summer monsoon QI YanJun 1,2,3, ZHANG RenHe 2, LI
Observed Intraseasonal Oceanic Variations in the Eastern Equatorial Indian Ocean and in the Outflow Straits of the Indonesian Throughflow
 ITB J. Sci. Vol. 42 A, No. 2, 2010, 107-126 107 Observed Intraseasonal Oceanic Variations in the Eastern Equatorial Indian Ocean and in the Outflow Straits of the Indonesian Throughflow Iskhaq Iskandar
Causes of the Intraseasonal SST Variability in the Tropical Indian Ocean
 ATMOSPHERIC AND OCEANIC SCIENCE LETTERS, 2008, VOL. 1, NO. 1, 1 6 Causes of the Intraseasonal SST Variability in the Tropical Indian Ocean Tim Li 1, Francis Tam 1, Xiouhua Fu 1, ZHOU Tian-Jun 2, ZHU Wei-Jun
HIGH-RESOLUTION SURFACE CIRCULATION OF THE BAY OF BENGAL DERIVED FROM SATELLITE OBSERVATION DATA
 656 Journal of Marine Science and Technology, Vol. 24, No. 3, pp. 656-668 (26) DOI:.69/JMST-5-25-2 HIGH-RESOLUTION SURFACE CIRCULATION OF THE BAY OF BENGAL DERIVED FROM SATELLITE OBSERVATION DATA Mridula
Remote influence of Interdecadal Pacific Oscillation on the South Atlantic Meridional Overturning Circulation variability
 Remote influence of Interdecadal Pacific Oscillation on the South Atlantic Meridional Overturning Circulation variability 2017 US AMOC Science Team Meeting May 24 th, 2017 Presenter: Hosmay Lopez 1,2 Collaborators:
The Air-Sea Interaction. Masanori Konda Kyoto University
 2 The Air-Sea Interaction Masanori Konda Kyoto University 2.1 Feedback between Ocean and Atmosphere Heat and momentum exchange between the ocean and atmosphere Atmospheric circulation Condensation heat
Chapter 10. Thermohaline Circulation
 Chapter 10. Thermohaline Circulation Main References: Schloesser, F., R. Furue, J. P. McCreary, and A. Timmermann, 2012: Dynamics of the Atlantic meridional overturning circulation. Part 1: Buoyancy-forced
IX. Upper Ocean Circulation
 IX. Upper Ocean Circulation World Ocean Covers 71% of Earth s surface Contains 97% of surface water Arctic Ocean NH: 61% ocean, 39% land Pacific Ocean Atlantic Ocean Southern Ocean Indian Ocean SH: 81%
3. Climatic Variability. El Niño and the Southern Oscillation Madden-Julian Oscillation Equatorial waves
 Georges (1998) 3. Climatic Variability El Niño and the Southern Oscillation Madden-Julian Oscillation Equatorial waves ENVIRONMENTAL CONDITIONS FOR TROPICAL CYCLONES TO FORM AND GROW Ocean surface waters
Keywords: XBT data, Arabian Sea, Lakshadweep Sea, Inter-annual variability, Intra-seasonal variability, WICC.
 Author version: Deep-Sea Research I, vol.57(6); 2010; 739-754 Observed intra-seasonal to interannual variability of the upper ocean thermal structure in the southeastern Arabian Sea during 2002 2008 V.
How rare are the positive Indian Ocean Dipole events? An IPCC AR4 climate model perspective
 GEOPHYSICAL RESEARCH LETTERS, VOL. 36, L08702, doi:10.1029/2009gl037982, 2009 How rare are the 2006 2008 positive Indian Ocean Dipole events? An IPCC AR4 climate model perspective W. Cai, 1 A. Sullivan,
Asymmetry in zonal phase propagation of ENSO sea surface temperature anomalies
 Click Here for Full Article GEOPHYSICAL RESEARCH LETTERS, VOL. 36, L13703, doi:10.1029/2009gl038774, 2009 Asymmetry in zonal phase propagation of ENSO sea surface temperature anomalies Michael J. McPhaden
Intra-seasonal variability of the coastal currents around India: A review of the evidences from new observations
 Indian Journal of Geo-Marine Sciences Vol. 39(4), December 2010, pp. 489-496 Intra-seasonal variability of the coastal currents around India: A review of the evidences from new observations S S C Shenoi
Ebenezer Nyadjro NRL/UNO. Collaborators: Dr. George Wiafe University of Ghana Dr. Subrahmanyam Bulusu University of South Carolina 1
 Satellite applications in tropical oceanography: perspectives from the Atlantic & Indian Oceans Ebenezer Nyadjro NRL/UNO Collaborators: Dr. George Wiafe University of Ghana Dr. Subrahmanyam Bulusu University
Lecture 14. Heat lows and the TCZ
 Lecture 14 Heat lows and the TCZ ITCZ/TCZ and heat lows While the ITCZ/TCZ is associated with a trough at low levels, it must be noted that a low pressure at the surface and cyclonic vorticity at 850 hpa
Lecture 13. Global Wind Patterns and the Oceans EOM
 Lecture 13. Global Wind Patterns and the Oceans EOM Global Wind Patterns and the Oceans Drag from wind exerts a force called wind stress on the ocean surface in the direction of the wind. The currents
SEASONAL SEA LEVEL VARIABILITY AND ANOMALIES IN THE SINGAPORE STRAIT
 Proceedings of International Conference in Ocean Engineering, ICOE Proceedings 2009 of ICOE 2009 Seasonal IIT sea Madras, level Chennai, variability India. and anomalies in the Singapore Strait 1-5 Feb.
The warm pool in the Indian Ocean
 Proc. Indian Acad. Sci. (Earth Planet. Sci.), Vol., No. 2, June 1991, pp. 165-1. Printed in India. The warm pool in the Indian Ocean P N VINAYACHANDRAN* and S R SHETYE 1 ' National Institute of Oceanography,
 1 2 http://ds.data.jma.go.jp/tcc/tcc/index.html http://ds.data.jma.go.jp/tcc/tcc/index.html Climate in Japan World Climate Extratropics Tropics Oceanograhpic conditions World Climate Page 2 Extratropics
Local vs. Remote SST Forcing in Shaping the Asian-Australian Monsoon Variability
 Local vs. Remote SST Forcing in Shaping the Asian-Australian Monsoon Variability Tim Li IPRC and Dept. of Meteorology, Univ. of Hawaii Acknowledgement. B. Wang, C.-P. Chang, P. Liu, X. Fu, Y. Zhang, Kug
Introduction to Oceanography OCE 1001
 Introduction to Oceanography OCE 1001 Lecture Notes Chantale Bégin & Jessica Fry Version 2.1 10. Ocean Circulation (Trujillo, Chapter 7) Major ocean currents are stable and predictable; they have been
Influence of mechanical mixing on a low summertime SST in the western North Pacific ITCZ region
 GEOPHYSICAL RESEARCH LETTERS, VOL. 33,, doi:10.1029/2006gl025997, 2006 Influence of mechanical mixing on a low summertime SST in the western North Pacific ITCZ region N. Sato, 1 H. Tokinaga, 1 R. Shirooka,
Imprints of Coastal Mountains on Ocean Circulation and Variability
 Imprints of Coastal Mountains on Ocean Circulation and Variability Shang-Ping Xie 1 with C.-H. Chang 1, W. Zhuang 2, N. Schneider 1, J. Small 3, B. Taguchi 4, and H. Sasaki 4 1 IPRC, University of Hawaii
The Surface Currents OCEA 101
 The Surface Currents OCEA 101 Why should you care? - the surface ocean circulation controls the major ocean biomes - variations in ocean circulation control the supply of nutrients for marine organisms
Mesoscale air-sea interaction and feedback in the western Arabian Sea
 Mesoscale air-sea interaction and feedback in the western Arabian Sea Hyodae Seo (Univ. of Hawaii) Raghu Murtugudde (UMD) Markus Jochum (NCAR) Art Miller (SIO) AMS Air-Sea Interaction Workshop Phoenix,
ATMS 310 Tropical Dynamics
 ATMS 310 Tropical Dynamics Introduction Throughout the semester we have focused on mid-latitude dynamics. This is not to say that the dynamics of other parts of the world, such as the tropics, are any
Chapter 19. El Niño and the Southern Oscillation (ENSO)
") Chapter 19 El Niño and the Southern Oscillation (ENSO) The previous chapter stressed the importance of the tropics for the coupling between ocean and atmosphere and showed how positive feedback between
Chapter 19 El Niño and the Southern Oscillation (ENSO) The previous chapter stressed the importance of the tropics for the coupling between ocean and atmosphere and showed how positive feedback between
Western Pacific Interannual Variability Associated with the El Nino Southern Oscillation
 University of South Florida Scholar Commons Marine Science Faculty Publications College of Marine Science 3-15-1999 Western Pacific Interannual Variability Associated with the El Nino Southern Oscillation
Variance-Preserving Power Spectral Analysis of Current, Wind and 20º Isothermal Depth of RAMA Project from the Equatorial Indian Ocean
 Variance-Preserving Power Spectral Analysis of Current, Wind and 20º Isothermal Depth of RAMA Project from the Equatorial Indian Ocean Vivek Kumar Pandey K. Banerjee Centre of Atmospheric and Ocean Studies
Increasing intensity of El Niño in the central equatorial Pacific
 Click Here for Full Article GEOPHYSICAL RESEARCH LETTERS, VOL. 37,, doi:10.1029/2010gl044007, 2010 Increasing intensity of El Niño in the central equatorial Pacific Tong Lee 1 and Michael J. McPhaden 2
Interannual Variability in an Indian Ocean Basin Model
 Interannual Variability in an Indian Ocean Basin Model Johannes Loschnigg y International Pacific Research Center z School of Ocean and Earth Science and Technology University of Hawaii at Manoa, Honolulu,
Semiannual Cycle in Zonal Wind over the Equatorial Indian Ocean
 15 DECEMBER 2011 O G A T A A N D X I E 6471 Semiannual Cycle in Zonal Wind over the Equatorial Indian Ocean TOMOMICHI OGATA AND SHANG-PING XIE International Pacific Research Center, University of Hawaii