Altimetric Observations and model simulations of Coastal Kelvin waves in the Bay of Bengal
|
|
|
- Herbert Gibson
- 5 years ago
- Views:
Transcription
1 Author version: Mar. Geod., vol.35(s1); 2012; Altimetric Observations and model simulations of Coastal Kelvin waves in the Bay of Bengal Matthew J. Nienhaus 1, Bulusu Subrahmanyam 1,2, V.S.N. Murty 3 1 Marine Science Program, University of South Carolina, Columbia, SC ,2 Department of Earth and Ocean Sciences, University of South Carolina, Columbia, SC National Institute of Oceanography Regional Center (CSIR), Visakhapatnam , India Contact Information: Matthew J. Nienhaus, mnienhaus@geol.sc.edu Abstract Kelvin waves originating in the equatorial Indian Ocean propagate along the equatorial wave guide until reaching the Sumatra coast and follow the coastal waveguide counter clockwise around the perimeter of the Bay of Bengal (BoB). We observed these Kelvin waves using sea surface height (SSH) anomalies derived from satellite altimeter observations for the period, the Simple Ocean Data Assimilation (SODA) reanalysis for the period and the HYbrid Coordinate Ocean Model (HYCOM) simulations for the period. Wavelet analyses of each time series of SSH data at five selected locations revealed a dominant annual period in the equatorial Indian Ocean, progressing to a semiannual period off the Sumatra coast, and transitions into both annual and semi-annual period around the perimeter of the BoB and along the east coast of India. In this study, we discuss the variability in the propagation of the upwelling Kelvin waves during the winter monsoon (January- March) and summer monsoon (July-September) and the downwelling Kelvin waves during the summer monsoon transition (April June) and winter monsoon transition (October December). The associated variability in the surface circulation is also discussed. The winter transition downwelling Kelvin wave showed progressive propagation all along the equatorial region, coastal BoB and west coast of India to its northern edge, thus affecting India s coastal circulation. Under its influence, the equatorward flowing East India Coastal Current (EICC) and the poleward flowing West India Coastal Current (WICC) with an embedded Lakshadweep High (anticyclonic eddy) in the southeastern Arabian Sea are well developed. Key Words: Coastal Kelvin waves, Indian Ocean, altimetry, HYCOM, SODA. 1
2 1. Introduction Kelvin waves in the Indian Ocean originate off the coast of Somalia and eastern Africa as a result of seasonal monsoon wind forcing. The waves propagate along the equatorial waveguide, crossing the Indian Ocean until colliding with the west coast of Sumatra. The waves split and propagate south along the Sumatra coast into the Indonesian Throughflow and north around the perimeter of the Bay of Bengal (BoB) and eventually into the Arabian Sea. The equatorial Indian Ocean experiences strong westerlies during the monsoon transitions (April-May and October-November) and results in the generation of eastward-flowing strong equatorial jets (Wyrtki, 1973, Han et al., 1999) during these transitions. The dynamics associated with these westerlies explain the generation of downwelling Kelvin waves during the monsoon transitions (McCreary et al., 1993, 1994, Shankar et al., 2002, Vinayachandran et al., 1996; 1998) and upwelling Kelvin waves during the monsoon periods (June-September and December February) in the upper ocean and their propagation in the equatorial wave guide and as the coastally trapped waves. These studies of coastal Kelvin waves in the BoB examined at the seasonality of the upwelling and downwelling modes of the Kelvin waves and their formation from seasonal monsoon winds and currents. Rao et al. (2010) described the annual cycle of sea surface height anomalies (SSHA) in the Indian Ocean and studied the variability of SSHA in association with the two sets of upwelling Kelvin waves (January March and July - September) and two sets of downwelling Kelvin waves (April August and September December). These authors identified pathways of these alternating upwelling and downwelling Kelvin waves along the coastal waveguide of the BoB and west coast of India. An upwelling Kelvin wave is associated with a large negative SSHA, while the downwelling Kelvin wave with that of large positive SSHA in the equatorial wave guide and along the coast. Further, the negative (positive) SSHA coincides with the cyclonic (anticyclonic) circulation. Potemra et al., (1991) analyzed a multilayer numerical model of the upper Indian Ocean circulation. Their model was in general agreement with observations and interpretations of Indian Ocean features, including coastal Kelvin waves propagation year-round around the perimeter of the BoB. Hareesh Kumar and Sanilkumar, (2004) studied long period waves along the coastal northern Indian Ocean and performed wavelet analyses at several locations. They found areas of high sea level associated with downwelling equatorial Kelvin waves. Vialard et al, (2009) looked at the intraseasonal upper ocean currents on the west coast of India near 15 N. They found a minimum period of approximately 90 days 2
3 for planetary waves and intraseasonal energy mostly trapped near the coast in the form of northward propagating Kelvin waves, while lower energy signals radiate offshore. Nethery and Shankar, (2007) looked at vertical propagation of Kelvin waves along the west coast of India, and determined that Kelvin waves from the BoB followthe coastal waveguide up to the west coast of India with periods less than 120 days. Paul et al., (2009) used an Ocean General Circulation Model (OGCM) to analyze circulation features in the BoB. Coastal Kelvin waves were observed propagating throughout the BoB. Luyten and Roemmich (1982) observed a Kelvin wave with a zonal wavelength of 24,000 km and equatorial trapping of about 400 km and downward energy flux. Le Blanck and Boulanger (2001) used T/P satellite altimetry data for the period to observe the propagation and reflection of long equatorial waves in the Indian Ocean. A decomposition technique described in Boulanger and Menkes (1995) is used to compute the Kelvin wave and first-rossby modes. T/P data have been used previously by Yang et al. (1998) who showed both Kelvin and Rossby waves forced by the Indian Ocean monsoon are primarily responsible for the seasonal sea level change in the tropical and sub tropical Indian Ocean. Understanding the coastal Kelvin wave propagation and the associated coastal circulation in the BoB is important because of its effect on energy propagation and mass transport around the basin. Also, coastal Kelvin waves in the BoB generate westward-propagating Rossby waves that also transport mass and energy. Both Kelvin waves and Rossby waves impact surface circulation and currents throughout the Indian Ocean. In this paper, we examine the satellite altimetric SSHA (Topex/Poseidon and Jason-1&2) data, HYCOM simulations, SODA reanalysis SSHA and the associated surface currents and comparison between satellite observations and model simulations. We also discuss the variability in the propagation of the upwelling Kelvin waves (January-March and July - September) and the downwelling Kelvin waves (April-June and October - December) and the associated variability in the surface circulation. 2. Altimetry data and Model simulations 2.1 Altimetry data SSH data from satellite altimetry was obtained with a 7-day temporal resolution on a 1/4 O grid from AVISO over the time period from January 1993 to December
4 2.2 Hybrid Coordinate Ocean Model In this study, we use the same version of the model used by Heffner et al. (2008) and Subrahmanyam et al. (2009) over the period. It uses global HYCOM simulations with a daily temporal resolution, a 1/12 horizontal resolution (~7 km at mid-latitudes) and 32 hybrid vertical layers. The model is configured on a Mercator grid from 78 S to 47 N, with a bipolar grid used north of 47 N. Monthly mean temperature and salinity from the Generalized Digital Environmental Model (GDEM) climatology in August were used to initialize the model. This model was forced by 3 hourly Navy Operational Global Atmospheric Prediction System (NOGAPS) winds, heat fluxes and precipitation fields. This version of the model uses the NASA Goddard Institute for Space Studies level 2 (GISS) mixed layer scheme and includes monthly river runoff from 986 global rivers. There is a weak relaxation to monthly mean sea surface salinity (SSS) from the Polar science center Hydrographic Climatology (PHC). There is no assimilation of any ocean data, including SST, and no relaxation to any other data except SSS to keep the evaporation - precipitation balance deviating far from reality. The actual SSS relaxation e-folding time depends on the mixed layer depth (MLD) and is (30 days x MLD m / 30 m) days, i.e. it is more rapid when the mixed layer is shallow and less so when it is deep. 2.3 Simple Ocean Data Assimilation For this study we use SODA version that spans the period from 1871 to 2008 [Giese and Ray, 2011]. However, for this study we only used the period (same as that of altimetry data) at a 5-day temporal resolution and a 1/2 spatial resolution. The SODA methodology is described by Carton and Giese [2008] and so we include just a brief description. SODA combines an ocean model based on POP version numerics [Smith et al., 1992] with the assimilation of hydrographic temperature and salinity data and observed SST. The ocean model has a horizontal resolution that is on average 0.4 o x 0.25 o and with 40 vertical levels. 2.4 Wavelet Analyses We used the wavelet analysis technique, in which a one-dimensional time series is decomposed into its frequency components based on the convolution of the original time series with a set of wavelet functions (Graps, 1995; Torrence and Compo, 1998). The wavelet analysis was earlier used by Subrahmanyam et al. (2009) to study the Rossby waves characteristics in the Indian Ocean. The wavelet 4
5 method allows one to analyze localized power variations within a discrete time series at a range of scales (Foufoula-Georgiou and Kumar, 1994). The local wavelet power spectrum is the square of the wavelet coefficients (Torrence and Compo, 1998). The global wavelet spectrum is the average spectrum over the complete time series, equivalent to the Fourier spectrum. This technique allows us to separate out the annual and semi-annual coastal Kelvin wave signals and help locate how the various wave period components might be changing in time and space. Wavelet analysis was carried out for each of the AVISO blended altimetric SSHA data, SODA reanalysis and HYCOM simulations to determine Kelvin wave period and energy at five different locations (Figure 1a) covering the equatorial Indian Ocean (0, 77 E & 1 N, 96 E) and coastal BoB (15 N, 92 E; 18 N, 85 E and 13 N, 81 E). These five locations correspond to five different regions in the Indian Ocean/BoB; the equatorial region south of India, the equatorial region off the west coast of Sumatra, the northeastern edge of the BoB near the Andaman Sea, the northwestern edge of the BoB off the east coast of India and the southwestern edge of the BoB off the east coast of India. These data sets were analyzed to detect the signatures of upwelling and downwelling Kelvin waves in the equatorial wave guide and coastal waveguide in the BoB. We have considered SODA reanalysis and altimetry data for the time period from 1993 to 2006, and HYCOM simulations covering the time period from 2003 to HYCOM SSHA was derived daily, SODA reanalysis SSHA was derived every five days and the Altimetric SSHA data at weekly intervals. The zonal (u) and meridional (v) currents derived from HYCOM, SODA and altimetry data were used to display average sea surface current vector anomalies during the same time period as SSHA was measured in order to track the surface patterns of the Kelvin waves as they propagate. Altimetry current anomalies were measured from geostrophic currents, while HYCOM and SODA current anomalies were measured from absolute currents. 3. Results Previous studies (Le Blanc and Boulanger, 2001; Yang et al, 1998) have calculated the equatorial Kelvin wave speed average for both upwelling and downwelling waves to be approximately 2 m/s, and take anywhere from 1 to 1.5 months to propagate across the equatorial Indian Ocean. As the Kelvin wave propagates across the Indian Ocean and around the BoB, its period fluctuates between annual, semiannual and 120-day periods along perimeter of the BoB and the Indian east coast. Figure 2 shows the comparison of the annual cycle of SSHA from the altimetry observations, SODA and HYCOM simulations at Equator, 77 E. All three curves show similar variation with a large negative SSHA in 5
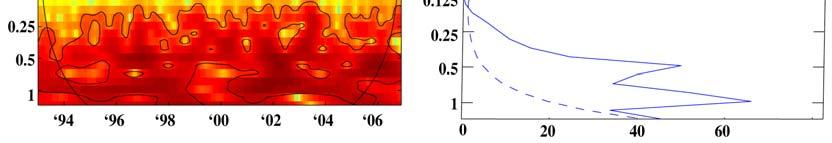
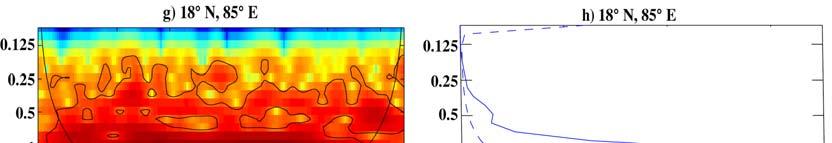
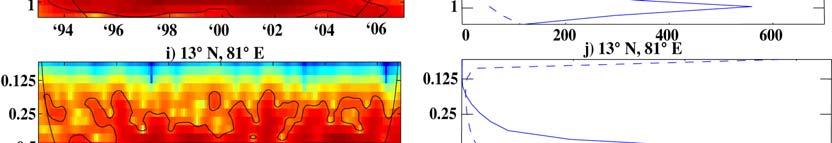
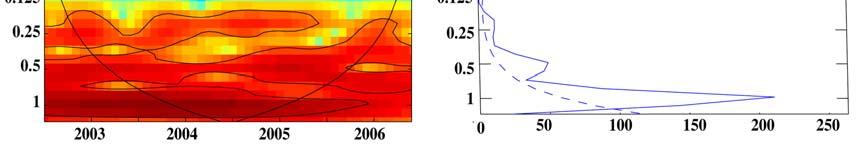
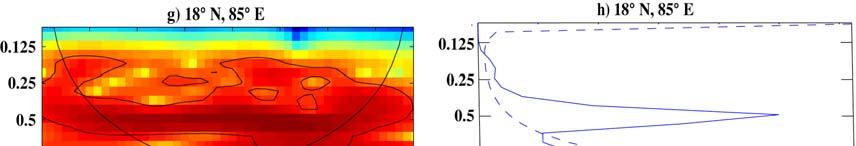
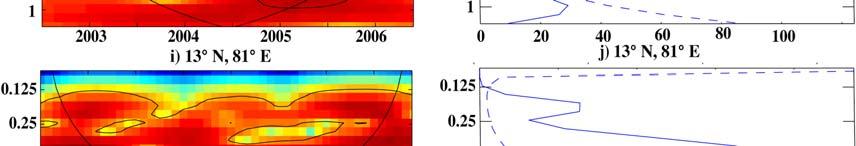
6 winter season (January March), large positive SSHA during summer transition (April June), a secondary low SSHA in September and a secondary higher SSHA in October. The HYCOM SSHA curve is closely coinciding with that of altimetry SSHA curve. The annual variation of SSHA can be regarded as the occurrence of the alternating equatorial upwelling and downwelling Kelvin waves in a year. In this study, we present the first upwelling Kelvin wave during winter monsoon (January March) and second upwelling Kelvin wave during summer monsoon (July September) and the first downwelling Kelvin wave during summer-transition period (April June) and the second downwelling Kelvin wave during winter transition period (October December) from each data set. Before proceeding further, we performed the wavelet analysis of the SSHA for each data set to document the dominant period of the wave propagation in the study area. 3.1 Wavelet analyses of the SSHA data sets from satellite altimetry, SODA and HYCOM Wavelet analyses of the Kelvin waves through five locations (Figure 1) in the equatorial Indian Ocean and BoB reveal several features of Kelvin wave period and energy. Along the equator south of India (Figures 3, 4, 5 a & b), wave period is shown to be predominantly annual. Off the coast of Sumatra (Figures 3, 4, 5 c & d), the dominant wave period is semiannual. During the period from , there was a significant increase in wave period visible in the altimetry wavelet (Figure 3c &d), likely as a result of Indian Ocean Dipole (IOD) events and co-occurred with El Nino and La Nina (ENSO) events impacting the Indian Ocean circulation (Rao et al., 2002, Vinaychandran et al., 2002, Gnanaseelan et al., 2008, Shenoi, et al., 2010). Dominant wave energy is mainly in the 1-2 year (biennial) period with a large peak, although there is significant wave energy in the semiannual period as well. The energy contained at the annual period is less than that at semiannual and biennial periods. Earlier researchers (Rao et al., 2002 and Vinaychandran et al., 2002) showed that the biennial period is associated with the IOD and co-occurring ENSO events. Near the Andaman Sea (Figures 3, 4, 5 e & f), the wave period becomes more variable, fluctuating between quarter- annual and semi-annual periods, possibly due to the effects of westward radiating Rossby waves generated by the coastal Kelvin waves (Subrahmanyam and Robinson, 2000; Subrahmanyam et al., 2001; 2009; Vialard et al., 2009). Similar to the observation point near the coast of Sumatra, there is a significant increase in wave period, up to a period of 1-2 years, around as a result of IOD and co-occurring ENSO events. Wave energy near the Andaman Sea is less at both the semiannual and annual periods, due to the energy loss from radiated Rossby waves. Off the northwest coast of India (location 4 in Figure 1), wave period splits 6
7 between 120 day period and annual period (Figures 3, 4,5 g & h). At the southwest location (location 5 in Figure 1) of the coastal BoB, the wavelet analysis (Figures 3, 4, 5 i & j) showed the dominant signals once again at semi-annual (there is no 120 day peak as conspicuous) and annual period. This 120-day period shows variation between each upwelling and downwelling Kelvin wave (a strong upwelling and downwelling wave followed by a weak upwelling and downwelling wave), and the annual period corresponds to the arrival of the westward propagating annual Rossby wave radiated from the eastern coast of BoB. Kelvin wave observations were taken every two to three weeks in order to show better the features of the propagating wave. All three datasets (altimetry, SODA and HYCOM) are comparable in displaying the upwelling and downwelling Kelvin wave in the equatorial Indian Ocean and BoB. However, since HYCOM covers only a 4-year period compared to the 13-year time period covered by altimetry and SODA, the magnitude of SSHA and current velocity field in HYCOM simulation is different in some instances and displays minor inconsistencies when compared to the other datasets. Despite this, the trends displayed in the HYCOM dataset are similar enough to be considered approximately equivalent to the trends displayed in altimetry and SODA. 3.2 Propagation of first upwelling Kelvin Wave and surface circulation (January-March) In early January (Figures 6, 7, 8 a), SSHA shows regions of lower-than-average sea level (negative SSHA) in the latitudes along the equatorial Indian Ocean, as well as along the coasts of the Andaman Sea and northern BoB. In the western BoB, the region of low SSHA is likely due to the presence of a cyclonic eddy which commonly occurs in winter (Paul et al, 2009). The surface currents in the patches of low and high SSHA in the western BoB confirm them as eddies, with cyclonic current patterns over negative SSHA areas and anticyclonic current patterns over positive SSHA areas. As the upwelling Kelvin waves propagate along the equatorial waveguide, the surface currents show a uniform westward direction north of the equator, due to the shifting surface winds and thermocline depth (Potemra et al, 1991; Paul et al, 2009; Kumar et al, 2010; Rao et al., 2010). In late January (Figures 6, 7, 8 b), the Kelvin wave has propagated around the perimeter of the BoB and is near the northern edge of the Bay. The cyclonic eddy off the east coast of India steadily diminishes with the rising thermocline in the BoB caused by the arrival of the upwelling Kelvin wave from the equatorial Indian Ocean, along with the winter monsoon changing wind direction and surface current. In mid-february (Figures 6, 7, 8 c) the 7
8 Kelvin wave has continued around the perimeter of the BoB and the front of the wave is along the Indian east coast and nearing Sri Lanka. An anticyclonic eddy begins to form in the northwestern BoB with an apparent poleward current with higher magnitude current velocities. This eddy continues to grow into a basin scale anticyclonic gyre due to the continually rising thermocline near the coast under the influence of the propagating upwelling Kelvin wave (Potemra et al, 1991, Babu et al., 2003). In March (Figures 6, 7, 8 d) the rising SSHA along the equator signals the weakening of the upwelling Kelvin wave, and the propagation slows after the upwelling wave reaches the northern tip of Sri Lanka. By late March (Figures 6, 7, 8 e), positive SSHA begins appearing along the equator and in the southern Arabian Sea, showing the transition. The surface currents establish the large-scale anticylonic circulation gyre in the Bay of Bengal by late March with the established poleward flowing East India Coastal Current (EICC). From January to March, one can see the westward flowing Winter Monsoon Current (WMC) in the southern Bay of Bengal and its strength increases by late March and then feeds the poleward EICC (Figures 6, 7, 8 e). The intense cyclonic eddy in the southeastern BoB in February also weakens by late March. Surface currents near the equator also begin to weaken and change direction, now flowing eastward. The regions of low SSHA along the northern and western edges of the BoB have weakened considerably and no longer propagate with the same energy along the coastline. The anticyclonic gyre in the center of the BoB has continued to gain strength with the continually rising thermocline and is more fully formed. As the first downwelling wave arrives, the upwelling wave will continue to dissipate along the eastern edge of the BoB. The propagation of the upwelling Kelvin wave and the associated surface circulation features are also clearly depicted in the SODA and HYCOM simulations. The surface circulation in the HYCOM simulations are less established due to the length of simulation period (4 years). In the HYCOM simulations, the upwelling Kelvin wave appears at the northwestern edge of BoB in late January and affects the surface circulation similar to that in SODA and altimetry observations. Further, the extent of the anticyclonic gyre gets limited due to the presence of meso-scale eddy features in HYCOM simulations (Figures 8d-e). 3.3 Propagation of first downwelling Kelvin Wave and surface circulation (April - June) By April (Figures 9, 10, 11 a) the downwelling equatorial Kelvin wave has reached the Sumatra coast and has begun flowing into the Andaman Sea. Surface currents are now following the propagation of the downwelling wave, and are steadily increasing in magnitude. The large anticyclonic gyre persists through April in the center of the BoB, with the core clearly off the Indian coast in the southwestern 8
9 BoB. This anticyclonic gyre is generated due to the propagation of the fist upwelling Kelvin wave as seen in Figures 6, 7 and 8. By early May (Figures 9, 10, 11 b), the downwelling Kelvin wave has continued to propagate past the Andaman Sea and is reaching the northern portions of the BoB. The anticyclonic eddy is at its largest extent by this time, and equatorial surface currents are at their maximum magnitude. In mid-may (Figures 9, 10, 11 c), the downwelling Kelvin wave has reached the northern edge of the BoB. However, the surface currents have also begun slowing down, and the eddy in the center of the Bay has begun to dissipate. This is due to the arrival of the first downwelling Kelvin wave affecting the thermocline depth along the east coast of India. This and the southwest monsoon winds would further change direction of ocean currents and upwelling along the Indian coast. In early June (Figures 9, 10, 11 d) the downwelling Kelvin wave continues its southward propagation along the coastline and stalled the upwelling along the Indian coast due to deepening of thermocline. The eddy in the central BoB continues to diminish, and in the equator falling SSHA signals the arrival of the second upwelling Kelvin wave. By the end of June (Figures 9, 10, 11 e) the second upwelling Kelvin wave has reached the Sumatra coast, as evidenced by the decreased (albeit still positive) SSHA. Propagation of the first downwelling Kelvin wave is halted along the northern edge of the BoB and the Southwest Monsoon Current flowing from the eastern Arabian Sea, south of Sri Lanka and then entering from the southwestern Bay towards central Bay is evident. The occurrence of the Sri Lanka dome (cyclonic eddy) off eastern Sri Lanka associated with the negative SSHA is evident by end of June (Figure 9e). In the SODA simulations, the eastward flowing Spring Equatorial Jet is seen strengthening from April to mid- May and then started weakening and changing direction of flow by end of June (Figures 10a-e). It is interesting to notice the meandering nature of the spring equatorial jet from 14 April to 19 May (Figures 10 a-c). Also, the Southwest Monsoon Current from the eastern Arabian Sea continues to flow eastward in the southern BoB, as that seen in SODA simulations. 3.4 Propagation of second upwelling Kelvin Wave and surface circulation (July - September) Figures 12a-e show the variation of the altimetry SSHA during the second upwelling Kelvin wave propagation during the summer monsoon period (July September). The Kelvin wave propagation is seen in August and its extent is limited to the Andaman Sea by the end of September. However, the western Bay of Bengal and off of the east coast of Sri Lanka are dominated by cyclonic eddies, paving the way for the Southwest Monsoon Current (SMC) entering the central BoB from the southwestern Bay of Bengal. The second upwelling Kelvin wave propagation is also limited to the Andaman Sea in 9
10 the SODA simulations (Figures 13a-e), however, the circulation patterns deviate from that of altimetry derived circulation (Figures 12a-e). The Sri Lanka cyclonic eddy is merged with that of the cyclonic eddy off the east coast of India giving rise to a broader area of negative SSHA. The SMC enters the southwestern Bay and moves eastward in the southern Bay of Bengal. The surface circulation appears under the influence of the net Ekman drift and geostrophic circulation (Shankar et al., 2002). However, under the influence of the upwelling Kelvin wave, surface circulation in the equatorial region is broadly westward from July to early September. The HYCOM simulated SSHA variation and the associated surface circulation (Figures 14a-e) are different from those of altimetry SSHA and SODA SSHA. This deviation might be the result of the realistic consideration of freshwater flux from the rivers and precipitation minus evaporation during the southwest monsoon season in the model forcing besides the surface wind forcing. Further examination of the data is essential in this aspect. 3.5 Propagation of second downwelling Kelvin Wave and surface circulation (October December) Figures 15, 16 and 17 represent the SSHA variation from Altimetric observations, SODA and HYCOM simulations during the second downwelling Kelvin wave propagation. In the altimetry SSHA variation, one would notice the progressive increase in the SSHA from the equatorial region to the coastal Andaman Sea, northern BoB, then along the east coast of India and in the southeastern Arabian Sea from October to December (Figures 15a-e). The surface circulation in October shows the continuation of the SMC into the central BoB and its joining into the equatorward flowing EICC, thus a large scale cyclonic gyre is present in the western BoB (Figure 15a). The EICC became more evident and strong with time and by early December, the EICC bends around the Sri Lanka coast to flow westward and into the southeastern Arabian Sea, wherein a clockwise eddy is formed (Figure 15d), and flows poleward as the West India Coastal Current (WICC) (Figures 15d-e). Thus the second downwelling Kelvin wave during the winter monsoon transition has a tremendous impact on the coastal circulation along the coast of India. The variability in the SODA SSHA during October December (Figure 16a-e) is similar to that noticed in the altimetric SSHA simulation. The surface circulation in the equatorial region shows a progressive eastward extent of the strong equatorial jet during winter transition and the progression of the equatorial downwelling Kelvin wave into the coastal BoB which is manifested as the equatorward flowing EICC and its continuation along the west coast of India. The anticyclonic eddy in the southeastern Arabian Sea is not well noticed in the SODA assimilation. The surface circulation in the BoB is directed as northwestward flow under the influence the net Ekman drift 10
11 and geostrophic circulation. SODA SSHA once again shows the dominant impact of the surface wind forcing. The HYCOM SSHA and the associated surface circulation are different from those of altimetry and SODA SSHA under the influence of the downwelling Kelvin wave. However, the coastal Kelvin wave showed progression from the equatorial Indian Ocean, along the east coast of India to the west coast of India during October December (Figures 17a-e). Flow reversal is noticed in the southern BoB from the eastward flow in October to westward flow by end December. 4. Discussion and Conclusions The observations of average SSHA, current speed and direction, and wave period and energy in the equatorial and coastal northern Indian Ocean over the course of the 13-year period reveal several important features of planetary waves in the region. Wavelet analyses show the average wave period decreases and wave energy increases over the entire 13-year period as the Kelvin waves propagate. Wave period alternates between annual and semiannual as the coastal Kelvin wave propagates, and can be influenced by local current circulation differences, freshwater flux and wind forcing. Observations of the coastal Kelvin waves in the BoB show the typical paths when propagating along the coastal waveguides. The clearly recognizable first upwelling Kelvin wave occurs from January to March, and a well-developed second downwelling Kelvin wave occurs from October to December. Throughout each year, the Kelvin waves follow a predictable and similar path along the Indian Ocean waveguide (Figure 18). They start from the east coast of Africa and follow the equator through the Indian Ocean until splitting at the coast of Sumatra. The first upwelling Kelvin waves during winter months propagate north along the coastal waveguide of the Andaman Sea, around the northernmost point of the BoB, and tail off on the east coast of India, just before passing Sri Lanka. The upwelling wave is followed by the first downwelling Kelvin wave along a similar path, continues along the coastal waveguide, and instead dissipates along the northern BoB. The second downwelling Kelvin wave during the winter transition (October December) showed a greater impact on the SSHA variation and the surface circulation in the equatorial region and strong coastal currents well defined in their flow pattern both at the east coast of India and west coast of India. The SODA SSHA derived surface circulation during monsoon periods showed the greater impact of wind forcing (Ekman transport) over the BoB with southeastward flow during southwest monsoon months and northwestward flow during winter monsoon months. The slightly different HYCOM SSHA derived surface circulation, compared to that in the Altimetric SSHA and the SODA SSHA derived surface circulation, may be due to combined impact of the wind forcing 11
12 and the consideration of the realistic freshwater flux due to rivers and precipitation minus evaporation. (After modifying the HYCOM vectors, is there any difference with SODA and altimetry circulation). At 0 N, 77 E, zonal velocity anomalies (U, Figure 19a) range from m/s to m/s. The westward (negative) zonal velocity in January, boreal winter season, is a manifestation of the first upwelling Kelvin wave, followed by the first downwelling (eastward, positive zonal velocity) in April/May, the second upwelling Kelvin wave in August-September. The second downwelling Kelvin wave first appears at the thermocline during September-October and then progresses towards the surface by November-December and is stronger than the first downwelling Kelvin wave. This higher strength in the second downwelling Kelvin wave has an impact on its persistent propagation from the equatorial Indian Ocean to the west coast of India, as has been noticed in the previous paragraphs. Similarly, the alongshore current velocity anomalies at 2 N, 94 E (off northern Sumatra, Figure 19b) also shows the first and second downwelling Kelvin waves associated with the northward (positive) alongshore velocity anomaly during April-May and October-December at thermocline depths. The alongshore southward velocity associated with the first and second upwelling Kelvin waves is weaker and limited to shallow layer only. Thus, the alongshore velocity off the northern Sumatra has a close relation to the extent of the progressive propagation of the Kelvin waves around the coastal periphery of the Bay of Bengal. These coastal Kelvin waves have a propagating horizontal speed of ~2.5 m/s and a vertical speed of ~1.2 m/day. By having a record of the 13-year average of the Kelvin wave period along the BoB coast, further studies can be done to determine additional effects on and from coastal Kelvin wave speed and energy. One such study could be the understanding of the role of the coastal Kelvin waves and their radiating Rossby waves in the Bay of Bengal on the maintenance of the warmer sea surface temperature throughout the year that in turn contributes to the cyclogenesis over the Bay of Bengal and the interannual variability of the tropical weather disturbances. Acknowledgements This work was supported by the Office of Naval Research (ONR) Award# N awarded to BS. We thank Benjamin Giese for making available the Simple Ocean Data Assimilation (SODA) reanalysis, and Jay F. Shriver for providing HYCOM simulations. The altimeter products were distributed by AVISO. V.S.N. Murty is thankful to the Director, NIO for his keen interest in the collaborative work with the USC. This has the NIO contribution No. xxxx. 12
13 References Babu, M.T., Y.V.B. Sarma, V.S.N. Murty, and P. Vethamony (2003). On the circulation in the Bay of Bengal during Northern spring inter-monsoon (March-April 1987), Deep-Sea Res., 50: Boulanger, J.P. and C. Menkes (1995). Propagation and reflection of long equatorial waves in the Pacific Ocean during the El Nino, J. Geophys. Res., 100(12): Carton, J.A., and B.S. Giese (2008), A Reanalysis of Ocean Climate Using Simple Ocean Data Assimilation (SODA), Monthly Weather Rev., 136, Foufoula-Georgiou, E. and Kumar, P.: Wavelets in Geophysics, San Diego, Academic Press, Giese, B.S., and S. Ray (2011), El Niño variability in simple ocean data assimilation (SODA), , J. Geophys. Res., 116, C02024, doi: /2010jc Gnanaseelan, C., B.H. Vaid, and P.S. Polito (2008). Impact of Biannual Rossby Waves on the Indian Ocean Dipole, Geos. Rem. Sens. Lett., 5(3): Graps, A (1995), An Introduction to Wavelets, IEEE Comp. Sci. and Eng., 2, Han, W., J.P. McCreary Jr., D.L.T. Anderson, and A.J. Mariano (1999). Dynamics of the Eastern Surface Jets in the Equatorial Indian Ocean, J. Phys. Oceanogr., 29: Hareesh Kumar, P.V., and K.V. Sanilkumar, (2004). Long Period Waves in the Coastal Regions of North Indian Ocean, Ind. J. Mar. Sciences, 33(2): Kumar, B., S. Sourav, P.C. Pandey, and A. Chakraborty (2010). Seasonal and Monthly Variation of Vertical Structure of Temperature, Salinity and Heat Flux of the Bay of Bengal, Marine Geodesy, 33: Le Blanc, J.L. and J.P. Boulanger (2001). Propagation and reflection of long equatorial waves in the Indian Ocean from TOPEX/POSEIDON data during the period, Climate Dynamics, 17, Luyten, J. R. and D.H. Roemmich (1982). Equatorial Currents at Semi-Annual Period in the Indian Ocean, J. Phys. Oceanogr., 12: McCreary, J.P., P.K. Kundu, and R.L. Molinari, (1993). A numerical investigation of dynamics, thermodynamics and the mixed layer processes in the Indian Ocean. Prog. In Oceanog., 31: McCreary Jr., J.P. and P. Lu, (1994). Interaction between the Subtropical and Equatorial Ocean Circulations: The Subtropical Cell, J. Phys. Oceanogr., 24: Meyers, S. D., B. G., Kelly, and J. J. O Brien (1993), An introduction to wavelet analysis in oceanography and meteorology: with application to the dispersion of Yanai waves, Monthly Weather Review, 121, Nethery, D. and D. Shankar (2007). Vertical Propagation of Baroclinic Kelvin Waves along the West Coast of India, J. Earth Syst. Sci., 116: Paul, S., A. Chakraborty, P.C. Pandey, S. Basu, S.K. Satsangi, and M. Ravichandran (2009). Numerical Simulation of Bay of Bengal Circulation Features from Ocean General Circulation Model, Marine Geodesy, 32:
14 Potemra, J. T., M.E. Luther., and J.J. O Brien (1991). The Seasonal Circulation of the Upper Ocean in the Bay of Bengal, J. Geophys. Res., 96(C7): Rao, R.R., M.S. Girish Kumar, M. Ravichandran, A.R. Rao, V.V. Gopalakrishna, and P. Thadathil (2010). Interannual variability of Kelvin wave propagation in the wave guides of the equatorial Indian Ocean, the coastal Bay of Bengal and the southeastern Arabian Sea during , Deep-Sea Res., I: 57, Schott, F. A. and J.P. McCreary Jr., (2001). The monsoon circulation of the Indian Ocean, Prog. Oceanogr., 82 (12): Shankar, D. (2000). Seasonal cycle of sea level and currents along the coast of India, Current Science, 78(3): Shankar, D., P.N. Vinayachandran, and A.S. Uniikrishnan, (2002). The monsoon currents in the north Indian Ocean, Prog. Oceanogr., 52: Shenoi, S.S.C. (2010). Intra-seasonal variability of the coastal currents around India: A review of the evidences from new observations, Ind. J. Marine Science, 39(4): Smith, R.D., J.K. Dukowicz and R.C. Malone (1992), Parallel ocean general circulation modeling. Physica D, 60, Subrahmanyam, B. and I.S. Robinson (2000). Sea Surface Height Variability in the Indian Ocean from TOPEX/POSEIDON Altimetry and Model Simulations, Marine Geodesy, 23: Subrahmanyam, B., D.M. Heffner, D. Cromwell, and J.F. Shriver (2009). Detection of Rossby waves in multi-parameters in multi-mission satellite observations and HYCOM simulations in the Indian Ocean, Rem. Sens. Envir., 113: Subrahmanyam, B., I.S. Robinson, J.R. Blundell, and P.G. Challenor (2001). Indian Ocean Rossby Waves observed in TOPEX/POSEIDON altimeter data and in model simulations, Int. J. Remote Sensing, 22: Torrence C., and G. P. Compo (1998), A Practical Guide to Wavelet Analysis, Bull. of the American Met. Soc., 79, Vialard, J., S.S.C. Shenoi, J.P. McCreary Jr., D. Shankar, F. Durand, V. Fernando, and S.R. Shetye (2009). Intraseasonal response of the northern Indian Ocean coastal waveguide to the Madden-Julian Oscillation, Geo. Phys. Res. Letts., 36, L14606, doi: /2009GL Vinayachandran, P.N., S.R. Shetye, D. Sengupta, and S. Gadgil (1996). Forcing mechanisms of the BoB circulation, Current Science, 71(10): Vinayachandran, P.N. and T. Yamagata (1998). Monsoon Response of the Sea around Sri Lanka: Generation of Thermal Domes and Anticyclonic Vortices, J. Phys. Oceangr.,, 28(10): Wyrtki, K.(1973). Physical Oceanography of the Indian Ocean, Ecological Studies, 3: Yang, J., L. Yu, C.J. Koblinsky, and D. Adamec (1998). Dynamics of the seasonal variations in the Indian Ocean from TOPEX/POSEIDON sea surface height and an ocean model, Geophys. Res. Letts., 25 (11),
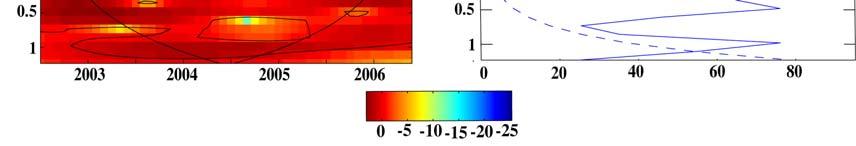
15 Figure Captions Figure 1: Figure 2: Figure 3: Figure 4: Figure 5: Figure 6: Figure 7: Figure 8: Figure 9: Map of Indian Ocean showing the locations of the five wavelet analyses calculated using altimetry, SODA and HYCOM simulations. Annual variation of sea surface height anomaly (cm) at 0 N, 77 E from altimetry observations, SODA and HYCOM simulations. Wavelet analyses of altimetry SSHA from five locations in the Bay of Bengal. Figures 3a, c, e, g and i have axes of time in years and period in years (horizontally and vertically, respectively), and Figures 3b, d f, h and j have axes of power in cm 2 and period in years (horizontally and vertically, respectively). The colored fields represent normalized variance, where the lowest variance (dark red, outlined in solid black lines) signifies the dominant wave period signal. The dashed bowl-shaped line in Figures 3a, c, e, g and i and the dashed curved line in Figures 3b, d, f, h and j are the 95% significance level cone of influence, where anything above the line is significant. Same as Figure 3, but using SODA reanalysis. Same as Figure 3, but using HYCOM simulations. 13 year weekly average sea surface height anomaly (SSHA) data (measured in cm) from altimetry in the Indian Ocean, displayed at 2-3 week intervals from January-March. Only negative values of SSHA are displayed to show the propagation of the first upwelling Kelvin wave. Overlaid are the weekly averaged geostrophic sea surface current vectors calculated using U and V from altimetry data. Geostrophic currents from 3 N to 3 S were removed. Same as Figure 6, but using SODA reanalysis. 4 year weekly average sea surface height anomaly (SSHA) from HYCOM in the Indian Ocean, displayed at 2-3 week intervals from January-March. Only negative values of SSHA are displayed to show the propagation of the first upwelling Kelvin wave. Overlaid are the weekly averaged absolute sea surface current vectors calculated using U and V from HYCOM. 13 year weekly average sea surface height anomaly (SSHA) data (cm) from altimetry in the Indian Ocean, displayed at 2-3 week intervals from April-June. 15
16 Figure 10: Figure 11: Figure 12: Figure 13: Figure 14: Figure 15: Figure 16: Figure 17: Only positive values of SSHA are displayed to show the propagation of the first downwelling Kelvin wave. Overlaid are the weekly averaged geostrophic sea surface current vectors calculated using U and V from altimetry data. Geostrophic currents from 3 N to 3 S were removed. Same as Figure 9, but using SODA reanalysis. 4 year weekly average sea surface height anomaly (SSHA) from HYCOM in the Indian Ocean, measured at 2-3 week intervals from April-June. Only positive values of SSHA are displayed to show the propagation of the first downwelling Kelvin wave. Overlaid are the weekly averaged absolute sea surface current vectors calculated using U and V from HYCOM. 13 year weekly average sea surface height anomaly (SSHA) data (cm) from altimetry in the Indian Ocean, displayed at 2-3 week intervals from July- September. Only negative values of SSHA are displayed to show the propagation of the second upwelling Kelvin wave. Overlaid are the weekly averaged geostrophic sea surface current vectors calculated using U and V from altimetry data. Geostrophic currents from 3 N to 3 S were removed. Same as Figure 12, but using SODA reanalysis. 4 year weekly average sea surface height anomaly (SSHA) from HYCOM in the Indian Ocean, displayed at 2-3 week intervals from July-September. Only negative values of SSHA are displayed to show the propagation of the second upwelling Kelvin wave. Overlaid are the weekly averaged absolute sea surface current vectors calculated using U and V from HYCOM. 13 year weekly average sea surface height anomaly (SSHA) data (cm) from altimetry in the Indian Ocean, displayed at 2-3 week intervals from October December. Only positive values of SSHA are displayed to show the propagation of the second downwelling Kelvin wave. Overlaid are the weekly averaged geostrophic sea surface current vectors calculated using U and V from altimetry data. Geostrophic currents from 3 N to 3 S were removed. Same as Figure 15, but using SODA reanalysis. 4 year weekly average sea surface height anomaly (SSHA) data from HYCOM in the Indian Ocean, displayed at 2-3 week intervals from October - December. Only 16
17 Figure 18: Figure 19. positive values of SSHA are displayed to show the propagation of the second downwelling Kelvin wave. Overlaid are the weekly averaged absolute sea surface current vectors calculated using U and V from HYCOM. Schematic diagram of the observed propagation of the upwelling (January-March in blue, July-September in green) and downwelling (April June in red, October December in orange) Kelvin wave phases and where the wave signals dissipate. Time series of (a) zonal (U) current velocity anomalies (m/s) averaged from SODA reanalysis at 0 N, 77 E (south of India on equator) and (b) alongshore current velocity (V) anomalies (m/s) averaged from SODA reanalysis at 2 N, 94 E (near Sumatra coast) over the period from The top 12 layers of SODA reanalysis correspond to a depth of about 148 m. 17

 at 0 N, 77 E")
18 Figure 1: Map of Indian Ocean showing the locations of the five wavelet analyses calculated using altimetry, SODA and HYCOM simulations. Figure 2. Annual variation of sea surface height anomaly (cm) at 0 N, 77 E from altimetry observations, SODA and HYCOM simulations. 18

 in years, and Figures 3b, d f, h and j")


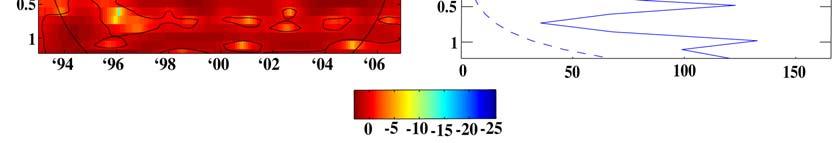
19 Figure 3: Wavelet analyses of altimetry SSHA from five locations in the Bay of Bengal. Figures 3a, c, e, g and i have axes of time in years (abscissa) and period (ordinate) in years, and Figures 3b, d f, h and j have axes of power in cm 2 (abscissa) period (ordinate) in years. The colored fields represent normalized variance, where the lowest variance (dark red, outlined in solid black lines) signifies the dominant wave period signal. The dashed bowl-shaped line in Figures 3a, c, e, g and i and the dashed curved line in Figures 3b, d, f, h and j are the 95% significance level cone of influence, where anything above the line is significant. 19


20 Figure 4: Same as Figure 3, but using SODA reanalysis. 20


21 Figure 5: Same as Figure 3, but using HYCOM simulations. 21
22 Figure 6: 13 year weekly average sea surface height anomaly (SSHA) data (measured in cm) from altimetry in the Indian Ocean, displayed at 2-3 week intervals from January-March. Only negative values of SSHA are displayed to show the propagation of the first upwelling Kelvin wave. Overlaid are the weekly averaged geostrophic sea surface current vectors calculated using U and V from altimetry data. Geostrophic currents from 3 N to 3 S were removed. 22
23 Figure 7: Same as Figure 6, but using SODA reanalysis. 23
24 Figure 8: 4 year weekly average sea surface height anomaly (SSHA) from HYCOM in the Indian Ocean, displayed at 2-3 week intervals from January-March. Only negative values of SSHA are displayed to show the propagation of the first upwelling Kelvin wave. Overlaid are the weekly averaged absolute sea surface current vectors calculated using U and V from HYCOM. 24
25 Figure 9: 13 year weekly average sea surface height anomaly (SSHA) data (cm) from altimetry in the Indian Ocean, displayed at 2-3 week intervals from April-June. Only positive values of SSHA are displayed to show the propagation of the first downwelling Kelvin wave. Overlaid are the weekly averaged geostrophic sea surface current vectors calculated using U and V from altimetry data. Geostrophic currents from 3 N to 3 S were removed. 25
26 Figure 10: Same as Figure 9, but using SODA reanalysis. 26
27 Figure 11: 4 year weekly average sea surface height anomaly (SSHA) from HYCOM in the Indian Ocean, measured at 2-3 week intervals from April-June. Only positive values of SSHA are displayed to show the propagation of the first downwelling Kelvin wave. Overlaid are the weekly averaged absolute sea surface current vectors calculated using U and V from HYCOM. 27
28 Figure 12: 13 year weekly average sea surface height anomaly (SSHA) data (cm) from altimetry in the Indian Ocean, displayed at 2-3 week intervals from July-September. Only negative values of SSHA are displayed to show the propagation of the second upwelling Kelvin wave. Overlaid are the weekly averaged geostrophic sea surface current vectors calculated using U and V from altimetry data. Geostrophic currents from 3 N to 3 S were removed. 28
29 Figure 13: Same as Figure 12, but using SODA reanalysis. 29
30 Figure 14: 4 year weekly average sea surface height anomaly (SSHA) from HYCOM in the Indian Ocean, displayed at 2-3 week intervals from July-September. Only negative values of SSHA are displayed to show the propagation of the second upwelling Kelvin wave. Overlaid are the weekly averaged absolute sea surface current vectors calculated using U and V from HYCOM. 30
31 Figure 15: 13 year weekly average sea surface height anomaly (SSHA) data (cm) from altimetry in the Indian Ocean, displayed at 2-3 week intervals from October - December. Only positive values of SSHA are displayed to show the propagation of the second downwelling Kelvin wave. Overlaid are the weekly averaged geostrophic sea surface current vectors calculated using U and V from altimetry data. Geostrophic currents from 3 N to 3 S were removed. 31
32 Figure 16: Same as Figure 15, but using SODA reanalysis. 32
33 Figure 17: 4 year weekly average sea surface height anomaly (SSHA) data from HYCOM in the Indian Ocean, displayed at 2-3 week intervals from October - December. Only positive values of SSHA are displayed to show the propagation of the second downwelling Kelvin wave. Overlaid are the weekly averaged absolute sea surface current vectors calculated using U and V from HYCOM. 33
 Kelvin wave phases.")

34 Figure 18: Schematic diagram of the observed propagation of the upwelling (January-March in blue, July-September in green) and downwelling (April June in red, October December in orange) Kelvin wave phases. Dissipation of wave signals is seen along the Mynamar coast, east coast of India and west coast of India. Only the 2 nd downwelling Kelvin wave propagates up to the northern extent of the west coast of India. [Subrahmanyam: please turn the blocks opposite by 180 degrees off Sumtra coast onwards upto southern east coast of India] 34
 zonal")
 averaged")


35 Figure 19. Time series of (a) zonal (U) current velocity anomalies (m/s) averaged from SODA reanalysis at 0 N, 77 E (south of India on equator) and (b) alongshore current velocity (V) anomalies (m/s) averaged from SODA reanalysis at 2 N, 94 E (near Sumatra coast) over the period from The top 12 layers of SODA reanalysis correspond to a depth of about 148 m. 35
Long period waves in the coastal regions of north Indian Ocean
 Indian Journal of Marine Sciences Vol. 33(2), June 2004, pp 150-154 Long period waves in the coastal regions of north Indian Ocean *P V Hareesh Kumar & K V Sanilkumar Naval Physical & Oceanographic Laboratory,
3 The monsoon currents in an OGCM
 3 The monsoon currents in an OGCM The observations show that both Ekman drift and geostrophy contribute to the surface circulation in the north Indian Ocean. The former decays rapidly with depth, but the
2 Observations. 2.1 Ekman drift
 2 Observations To define the monsoon currents and the associated circulation in the north Indian Ocean, we use climatological wind-stress data to estimate the surface Ekman drift, and hydrography and altimeter
Sea surface salinity variability during the Indian Ocean Dipole and ENSO events in the tropical Indian Ocean
 JOURNAL OF GEOPHYSICAL RESEARCH, VOL. 116,, doi:10.1029/2011jc007456, 2011 Sea surface salinity variability during the Indian Ocean Dipole and ENSO events in the tropical Indian Ocean Gary Grunseich, 1
Characteristics of Bay of Bengal Water mass in South Eastern Arabian Sea during
 Indian Journal of Geo-Marine Sciences Vol. 43(1), January 2014, pp. 27-32 Characteristics of Bay of Bengal Water mass in South Eastern Arabian Sea during 2001-2002 G Nageswara Rao, K Anil Kumar, PSV Jagadeesh
PROC. ITB Eng. Science Vol. 36 B, No. 2, 2004,
 PROC. ITB Eng. Science Vol. 36 B, No. 2, 2004, 133-139 133 Semiannual Kelvin Waves Propagation along the South Coast of Sumatra-Jawa-Bali and the Lesser Sunda Islands Observed by TOPEX/POSEIDON and ERS-1/2
The monsoon currents in the north Indian Ocean
 The monsoon currents in the north Indian Ocean D. Shankar a, P. N. Vinayachandran b, and A. S. Unnikrishnan a a Physical Oceanography Division, National Institute of Oceanography, Dona Paula, Goa 403 004,
The monsoon currents in the north Indian Ocean
 The monsoon currents in the north Indian Ocean D. Shankar a, P. N. Vinayachandran b, A. S. Unnikrishnan a, and S. R. Shetye a a Physical Oceanography Division, National Institute of Oceanography, Dona
Indian Ocean Seasonal Cycle Jérôme Vialard (IRD) LOCEAN Paris France From Schott & McCreary (Prog. Oc.
 LOCEAN Paris France From Schott & McCreary (Prog. Oc.") Indian Ocean Seasonal Cycle Jérôme Vialard (IRD) LOCEAN Paris France jerome.vialard@ird.fr From Schott & McCreary (Prog. Oc. 2001) Outline The monsoon cycle The basin-scale dynamical response Thermocline
Indian Ocean Seasonal Cycle Jérôme Vialard (IRD) LOCEAN Paris France jerome.vialard@ird.fr From Schott & McCreary (Prog. Oc. 2001) Outline The monsoon cycle The basin-scale dynamical response Thermocline
Analysis of 2012 Indian Ocean Dipole Behavior
 Analysis of 2012 Indian Ocean Dipole Behavior Mo Lan National University of Singapore Supervisor: Tomoki TOZUKA Department of Earth and Planetary Science, University of Tokyo Abstract The Indian Ocean
Investigation of Common Mode of Variability in Boreal Summer Intraseasonal Oscillation and Tropospheric Biennial Oscillation
 Investigation of Common Mode of Variability in Boreal Summer Intraseasonal Oscillation and Tropospheric Biennial Oscillation 5. Introduction The Asian summer monsoon is one of the most vigorous and energetic
Author version: Deep-Sea Res.(I: Oceanogr. Res. Pap.),vol.57;2009;1-13
,vol.57;2009;1-13") Author version: Deep-Sea Res.(I: Oceanogr. Res. Pap.),vol.57;2009;1-13 Interannual variability of Kelvin wave propagation in the wave guides of the equatorial Indian Ocean, the coastal Bay of Bengal and
Author version: Deep-Sea Res.(I: Oceanogr. Res. Pap.),vol.57;2009;1-13 Interannual variability of Kelvin wave propagation in the wave guides of the equatorial Indian Ocean, the coastal Bay of Bengal and
Wind Driven Circulation Indian Ocean and Southern Ocean
 Wind Driven Circulation Indian Ocean and Southern Ocean Lecture 18 MAR 350 Spring 2017 Reading: Knauss Chapter 7 ECCO2 model animation ecco2_sst_flow (2).mp4 Mean surface height and currents DPO Fig. 11.1
RECTIFICATION OF THE MADDEN-JULIAN OSCILLATION INTO THE ENSO CYCLE
 RECTIFICATION OF THE MADDEN-JULIAN OSCILLATION INTO THE ENSO CYCLE By William S. Kessler and Richard Kleeman Journal of Climate Vol.13, 1999 SWAP, May 2009, Split, Croatia Maristella Berta What does give
Lecture 13 El Niño/La Niña Ocean-Atmosphere Interaction. Idealized 3-Cell Model of Wind Patterns on a Rotating Earth. Previous Lecture!
 Lecture 13 El Niño/La Niña Ocean-Atmosphere Interaction Previous Lecture! Global Winds General Circulation of winds at the surface and aloft Polar Jet Stream Subtropical Jet Stream Monsoons 1 2 Radiation
AN ABSTRACT OF THE THESIS OF
 AN ABSTRACT OF THE THESIS OF Laxmikant Dhage for the degree of Master of Science in Ocean, Earth and Atmospheric Sciences presented on March 20, 2014. Title: Intra-seasonal Sea Level Variability along
Subsurface Ocean Indices for Central-Pacific and Eastern-Pacific Types of ENSO
 Subsurface Ocean Indices for Central-Pacific and Eastern-Pacific Types of ENSO Jin-Yi Yu 1*, Hsun-Ying Kao 1, and Tong Lee 2 1. Department of Earth System Science, University of California, Irvine, Irvine,
ENSO Cycle: Recent Evolution, Current Status and Predictions. Update prepared by Climate Prediction Center / NCEP 8 March 2010
 ENSO Cycle: Recent Evolution, Current Status and Predictions Update prepared by Climate Prediction Center / NCEP 8 March 2010 Outline Overview Recent Evolution and Current Conditions Oceanic Niño Index
West India Coastal Current and Lakshadweep High/Low
 Sadhand, Vol. 23, Parts 5 & 6, Oct & Dec 1998, pp. 637~i51. Indian Academy of Sciences West India Coastal Current and Lakshadweep High/Low SATISH R SHETYE National Institute of Oceanography, Dona Paula,
Effect of late 1970 s Climate Shift on Interannual Variability of Indian Summer Monsoon Associated with TBO
 Effect of late 97 s Climate Shift on Interannual Variability of Indian Summer Monsoon Associated with TBO 7. Introduction Biennial variability has been identified as one of the major modes of interannual
Lecture 33. Indian Ocean Dipole: part 2
 Lecture 33 Indian Ocean Dipole: part 2 Understanding the processes I continue the discussion of the present understanding of the processes involved in the evolution of the mean monthly SST, and convection
Influence of El Nino Southern Oscillation and Indian Ocean Dipole in biennial oscillation of Indian summer monsoon
 Influence of El Nino Southern Oscillation and Indian Ocean Dipole in biennial oscillation of Indian summer monsoon 4.1 Introduction The main contributors to the interannual variability of Indian summer
Intraseasonal Variability in Sea Level Height in the Bay of Bengal: Remote vs. local wind forcing & Comparison with the NE Pacific Warm Pool
 Intraseasonal Variability in Sea Level Height in the Bay of Bengal: Remote vs. local wind forcing & Comparison with the NE Pacific Warm Pool Shang-Ping Xie 1,3, Xuhua Cheng 2,3, Julian P. McCreary 3 1.
Intra-seasonal variability of the coastal currents around India: A review of the evidences from new observations
 Indian Journal of Geo-Marine Sciences Vol. 39(4), December 2010, pp. 489-496 Intra-seasonal variability of the coastal currents around India: A review of the evidences from new observations S S C Shenoi
MODELING INDIAN OCEAN CIRCULATION: BAY OF BENGAL FRESH PLUME AND ARABIAN SEA MINI WARM POOL
 MODELING INDIAN OCEAN CIRCULATION: BAY OF BENGAL FRESH PLUME AND ARABIAN SEA MINI WARM POOL P. N. Vinayachandran* 1 1, *2 and J. Kurian* * 1 Centre for Atmospheric and Oceanic Sciences, Indian Institute
Intraseasonal response of Northern Indian Ocean coastal. waveguide to the Madden-Julian Oscillation
 1 2 3 Intraseasonal response of Northern Indian Ocean coastal waveguide to the Madden-Julian Oscillation 4 5 6 J. Vialard 1 2, S.S.C Shenoi 2, J.P. McCreary 3, D. Shankar 2, F. Durand 4, V. Fernando 2
Intrusion of the Southwest Monsoon Current into the Bay of Bengal
 JOURNAL OF GEOPHYSICAL RESEARCH, VOL. 104, NO. C5, PAGES 11,077 11,085, MAY 15, 1999 Intrusion of the Southwest Monsoon Current into the Bay of Bengal P. N. Vinayachandran, 1 Yukio Masumoto, 1,2 Tetsuya
The Setting - Climatology of the Hawaiian Archipelago. Link to Video of Maui Waves
 The Setting - Climatology of the Hawaiian Archipelago Link to Video of Maui Waves What caused this week s weather? What caused this weekend s weather? Today s Objective: Provide overview and description
The monsoon currents in the north Indian Ocean
 Progress in Oceanography 52 (2002) 63 120 www.elsevier.com/locate/pocean The monsoon currents in the north Indian Ocean D. Shankar a,, P.N. Vinayachandran b, A.S. Unnikrishnan a a Physical Oceanography
Interannual variation of northeast monsoon rainfall over southern peninsular India
 Indian Journal of Geo-Marine Science Vol. 40(1), February 2011, pp 98-104 Interannual variation of northeast monsoon rainfall over southern peninsular India * Gibies George 1, Charlotte B. V 2 & Ruchith
Biennial Oscillation of Tropical Ocean-Atmosphere System Associated with Indian Summer Monsoon
 Biennial Oscillation of Tropical Ocean-Atmosphere System Associated with Indian Summer Monsoon 2.1 Introduction The Indian summer monsoon displays substantial interannual variability, which can have profound
ENSO Cycle: Recent Evolution, Current Status and Predictions. Update prepared by Climate Prediction Center / NCEP 4 September 2012
 ENSO Cycle: Recent Evolution, Current Status and Predictions Update prepared by Climate Prediction Center / NCEP 4 September 2012 Outline Overview Recent Evolution and Current Conditions Oceanic Niño Index
Monsoon Systems Valsavarenche Val d Aosta, Italy
 Dynamics of IO annual and interannual circulation Jay McCreary Alpine Summer School: Monsoon Systems Valsavarenche Val d Aosta, Italy June 8 13, 2009 References 1) (MKM93) McCreary, J.P., P.K. Kundu, and
APPENDIX B NOAA DROUGHT ANALYSIS 29 OCTOBER 2007
 APPENDIX B NOAA DROUGHT ANALYSIS 29 OCTOBER 2007 ENSO Cycle: Recent Evolution, Current Status and Predictions Update prepared by Climate Prediction Center / NCEP October 29, 2007 Outline Overview Recent
Remote influence of Interdecadal Pacific Oscillation on the South Atlantic Meridional Overturning Circulation variability
 Remote influence of Interdecadal Pacific Oscillation on the South Atlantic Meridional Overturning Circulation variability 2017 US AMOC Science Team Meeting May 24 th, 2017 Presenter: Hosmay Lopez 1,2 Collaborators:
Variability in the tropical oceans - Monitoring and prediction of El Niño and La Niña -
 Variability in the tropical oceans - Monitoring and prediction of El Niño and La Niña - Jun ichi HIROSAWA Climate Prediction Division Japan Meteorological Agency SST anomaly in Nov. 1997 1 ( ) Outline
Monsoon Response of the Sea around Sri Lanka: Generation of Thermal Domes and Anticyclonic Vortices
 1946 JOURNAL OF PHYSICAL OCEANOGRAPHY Monsoon Response of the Sea around Sri Lanka: Generation of Thermal Domes and Anticyclonic Vortices P. N. VINAYACHANDRAN* AND TOSHIO YAMAGATA Department of Earth and
5. El Niño Southern Oscillation
 5. El Niño Southern Oscillation Copyright 2006 Emily Shuckburgh, University of Cambridge. Not to be quoted or reproduced without permission. EFS 5/1 Ocean-Atmosphere Coupling Tropical atmosphere/ocean,
Mechanistic links between the tropical Atlantic and the Indian monsoon in the absence of El Nino Southern Oscillation events
 Mechanistic links between the tropical Atlantic and the Indian monsoon in the absence of El Nino Southern Oscillation events Vijay Pottapinjara 1*, Roxy Mathew Koll2, Raghu Murtugudde3, Girish Kumar M
Wind-driven driven Response of the Northern Indian Ocean to Climate Extremes
 Wind-driven driven Response of the Northern Indian Ocean to Climate Extremes Tommy G. Jensen International Pacific Research Center CLIVAR Indian Ocean Workshop Dec 1, 2004 1 Motivation Pathways of water
Behavior of the Wyrtki Jet observed with surface drifting buoys and satellite altimeter
 GEOPHYSICAL RESEARCH LETTERS, VOL. 36, L18607, doi:10.1029/2009gl039120, 2009 Behavior of the Wyrtki Jet observed with surface drifting buoys and satellite altimeter Yun Qiu, 1 Li Li, 1 and Weidong Yu
ATMS 310 Tropical Dynamics
 ATMS 310 Tropical Dynamics Introduction Throughout the semester we have focused on mid-latitude dynamics. This is not to say that the dynamics of other parts of the world, such as the tropics, are any
Regional Oceanography: an Introduction
 176 Regional Oceanography: an Introduction Fig. 11.1. Topography of the Indian Ocean. The 1000, 3000, and 5000 m isobaths are shown, and regions less than 3000 m deep are shaded. South of Australia the
CHAPTER 7 Ocean Circulation
 1 2 3 4 5 6 7 8 9 10 11 12 13 14 CHAPTER 7 Ocean Circulation Words Ocean currents Moving seawater Surface ocean currents Transfer heat from warmer to cooler areas Similar to pattern of major wind belts
Winds and Ocean Circulations
 Winds and Ocean Circulations AT 351 Lab 5 February 20, 2008 Sea Surface Temperatures 1 Temperature Structure of the Ocean Ocean Currents 2 What causes ocean circulation? The direction of most ocean currents
McKnight's Physical Geography 11e
 Chapter 2 Lecture McKnight's Physical Geography 11e Lectures Chapter 5 Atmospheric Pressure and Wind Michael Commons Ohio Northern University Atmospheric Pressure and Wind The Nature of Atmospheric Pressure
3. Climatic Variability. El Niño and the Southern Oscillation Madden-Julian Oscillation Equatorial waves
 Georges (1998) 3. Climatic Variability El Niño and the Southern Oscillation Madden-Julian Oscillation Equatorial waves ENVIRONMENTAL CONDITIONS FOR TROPICAL CYCLONES TO FORM AND GROW Ocean surface waters
Influence of enhanced convection over Southeast Asia on blocking ridge and associated surface high over Siberia in winter
 5th Session of the East Asia winter Climate Outlook Forum (EASCOF-5), 8-10 November 2017, Tokyo, Japan Influence of enhanced convection over Southeast Asia on blocking ridge and associated surface high
Lecture 14. Heat lows and the TCZ
 Lecture 14 Heat lows and the TCZ ITCZ/TCZ and heat lows While the ITCZ/TCZ is associated with a trough at low levels, it must be noted that a low pressure at the surface and cyclonic vorticity at 850 hpa
Basin-wide warming of the Indian Ocean during El Niño and Indian Ocean dipole years
 INTERNATIONAL JOURNAL OF CLIMATOLOGY Int. J. Climatol. 7: 141 1438 (7) Published online 1 February 7 in Wiley InterScience (www.interscience.wiley.com) DOI: 1.1/joc.148 Basin-wide warming of the Indian
Roles of Equatorial Waves and Western Boundary Reflection in the Seasonal Circulation of the Equatorial Indian Ocean
 930 J O U R N A L O F P H Y S I C A L O C E A N O G R A P H Y VOLUME 36 Roles of Equatorial Waves and Western Boundary Reflection in the Seasonal Circulation of the Equatorial Indian Ocean DONGLIANG YUAN
(20 points) 1. ENSO is a coupled climate phenomenon in the tropical Pacific that has both regional and global impacts.
 1. ENSO is a coupled climate phenomenon in the tropical Pacific that has both regional and global impacts.") SIO 210 Problem Set 4 Answer key December 1, 2014 Due Dec. 12, 2014 (20 points) 1. ENSO is a coupled climate phenomenon in the tropical Pacific that has both regional and global impacts. (2 points) a)
SIO 210 Problem Set 4 Answer key December 1, 2014 Due Dec. 12, 2014 (20 points) 1. ENSO is a coupled climate phenomenon in the tropical Pacific that has both regional and global impacts. (2 points) a)
Trade winds How do they affect the tropical oceans? 10/9/13. Take away concepts and ideas. El Niño - Southern Oscillation (ENSO)
") El Niño - Southern Oscillation (ENSO) Ocean-atmosphere interactions Take away concepts and ideas What is El Niño, La Niña? Trade wind and Walker circulation. What is the Southern Oscillation? Tropical
El Niño - Southern Oscillation (ENSO) Ocean-atmosphere interactions Take away concepts and ideas What is El Niño, La Niña? Trade wind and Walker circulation. What is the Southern Oscillation? Tropical
2) I think that the paper does not convincingly demonstrate some of the mechanisms it hypothetizes
 I think that the paper does not convincingly demonstrate some of the mechanisms it hypothetizes") Please see the list of changes below (red text) in response to the reviewer comments. Both reviewers have made substantial comments and suggestions to improve the paper which we have addressed these below.
Please see the list of changes below (red text) in response to the reviewer comments. Both reviewers have made substantial comments and suggestions to improve the paper which we have addressed these below.
Ebenezer Nyadjro NRL/UNO. Collaborators: Dr. George Wiafe University of Ghana Dr. Subrahmanyam Bulusu University of South Carolina 1
 Satellite applications in tropical oceanography: perspectives from the Atlantic & Indian Oceans Ebenezer Nyadjro NRL/UNO Collaborators: Dr. George Wiafe University of Ghana Dr. Subrahmanyam Bulusu University
Impact of the tides, wind and shelf circulation on the Gironde river plume dynamics
 Impact of the tides, wind and shelf circulation on the Gironde river plume dynamics F. Toublanc 1, N. Ayoub 2, P. Marsaleix 3, P. De Mey 2 1 CNES/LEGOS 2 CNRS/LEGOS 3 CNRS/LA, Toulouse, France 5th GODAE
ESCI 485 Air/sea Interaction Lesson 9 Equatorial Adjustment and El Nino Dr. DeCaria
 ESCI 485 Air/sea Interaction Lesson 9 Equatorial Adjustment and El Nino Dr. DeCaria Reference: El Nino, La Nina, and the Southern Oscillation, Philander THE TWO-LAYER SHALLOW WATER MODEL The ocean can
Understanding El Nino-Monsoon teleconnections
 Understanding El Nino-Monsoon teleconnections Dr Neena Joseph Mani Earth & Climate Science INSA Anniversary General meeting, Session: Science in IISER Pune 27 th December 2017 Mean State of the equatorial
Introduction to Oceanography OCE 1001
 Introduction to Oceanography OCE 1001 Lecture Notes Chantale Bégin & Jessica Fry Version 2.1 10. Ocean Circulation (Trujillo, Chapter 7) Major ocean currents are stable and predictable; they have been
Wind-Driven Response of the Northern Indian Ocean to Climate Extremes*
 2978 J O U R N A L O F C L I M A T E VOLUME 20 Wind-Driven Response of the Northern Indian Ocean to Climate Extremes* TOMMY G. JENSEN International Pacific Research Center, University of Hawaii at Manoa,
Geostrophic and Tidal Currents in the South China Sea, Area III: West Philippines
 Southeast Asian Fisheries Development Center Geostrophic and Tidal Currents in the South China Sea, Area III: West Philippines Anond Snidvongs Department od Marine Science, Chulalongkorn University, Bangkok
Impacts of intraseasonal oscillation on the onset and interannual variation of the Indian summer monsoon
 Chinese Science Bulletin 2009 SCIENCE IN CHINA PRESS Springer Impacts of intraseasonal oscillation on the onset and interannual variation of the Indian summer monsoon QI YanJun 1,2,3, ZHANG RenHe 2, LI
IX. Upper Ocean Circulation
 IX. Upper Ocean Circulation World Ocean Covers 71% of Earth s surface Contains 97% of surface water Arctic Ocean NH: 61% ocean, 39% land Pacific Ocean Atlantic Ocean Southern Ocean Indian Ocean SH: 81%
Propagation of planetary-scale zonal mean wind anomalies and polar oscillations
 Article Atmospheric Science July 2012 Vol.57 No.20: 2606 261 doi: 10.1007/s113-012-5168-1 SPECIAL TOPICS: Propagation of planetary-scale zonal mean wind anomalies and polar oscillations QIAN WeiHong *
ENSO Wrap-Up. Current state of the Pacific and Indian Ocean
 18-11-2014 ENSO Wrap-Up Current state of the Pacific and Indian Ocean Tropical Pacific Ocean moves closer to El Niño The Pacific Ocean has shown some renewed signs of El Niño development in recent weeks.
Observational Studies on Association between Eastward Equatorial Jet and Indian Ocean Dipole
 Journal of Oceanography, Vol. 66, pp. 429 to 434, 2 Short Contribution Observational Studies on Association between Eastward Equatorial Jet and Indian Ocean Dipole PETER C. CHU* Department of Oceanography,
Data Analysis of the Seasonal Variation of the Java Upwelling System and Its Representation in CMIP5 Models
 Data Analysis of the Seasonal Variation of the Java Upwelling System and Its Representation in CMIP5 Models Iulia-Mădălina Ștreangă University of Edinburgh University of Tokyo Research Internship Program
Week 6-7: Wind-driven ocean circulation. Tally s book, chapter 7
 Week 6-7: Wind-driven ocean circulation Tally s book, chapter 7 Recap so far Our goal (since week 3) has been to understand large-scale ocean circulation and its underlying physics, and to learn how to
Ocean dynamic processes responsible for the interannual. variability of the tropical Indian Ocean SST. associated with ENSO
 Ocean dynamic processes responsible for the interannual variability of the tropical Indian Ocean SST associated with ENSO Jong Seong Kug 1 and Soon Il An 2, Korea Ocean Research and Development Institute
The Surface Currents OCEA 101
 The Surface Currents OCEA 101 Why should you care? - the surface ocean circulation controls the major ocean biomes - variations in ocean circulation control the supply of nutrients for marine organisms
The Child. Mean Annual SST Cycle 11/19/12
 Introduction to Climatology GEOGRAPHY 300 El Niño-Southern Oscillation Tom Giambelluca University of Hawai i at Mānoa and Pacific Decadal Oscillation ENSO: El Niño-Southern Oscillation PDO: Pacific Decadal
Hui Wang, Mike Young, and Liming Zhou School of Earth and Atmospheric Sciences Georgia Institute of Technology Atlanta, Georgia
 Water Cycle between Ocean and Land and Its Influence on Climate Variability over the South American-Atlantic Regions as Determined by SeaWinds Scatterometers Rong Fu Hui Wang, Mike Young, and Liming Zhou
The General Circulation and El Niño. Dr. Christopher M. Godfrey University of North Carolina at Asheville
 The General Circulation and El Niño Dr. Christopher M. Godfrey University of North Carolina at Asheville Global Circulation Model Air flow broken up into 3 cells Easterlies in the tropics (trade winds)
Review for the second quarter. Mechanisms for cloud formation
 Review for the second quarter Mechanisms for cloud formation 1 Rising air expands and cools; Sinking air compresses and warms. (18) (24) Dry adiabatic lapse rate (10 o C/km): the rate of temperature decrease
How fast will be the phase-transition of 15/16 El Nino?
 How fast will be the phase-transition of 15/16 El Nino? YOO-GEUN HAM D E P A R T M E N T O F O C E A N O G R A P H Y, C H O N N A M N A T I O N A L U N I V E R S I T Y 2015/16 El Nino outlook One of strongest
OCN 201 Lab Fall 2009 OCN 201. Lab 9 - El Niño
 OCN 201 Lab Fall 2009 OCN 201 Lab 9 - El Niño El Niño is probably one of the most widely publicized oceanic phenomena. If there s one single reason for that it s probably the fact that El Niño s presence
Imprints of Coastal Mountains on Ocean Circulation and Variability
 Imprints of Coastal Mountains on Ocean Circulation and Variability Shang-Ping Xie 1 with C.-H. Chang 1, W. Zhuang 2, N. Schneider 1, J. Small 3, B. Taguchi 4, and H. Sasaki 4 1 IPRC, University of Hawaii
The Air-Sea Interaction. Masanori Konda Kyoto University
 2 The Air-Sea Interaction Masanori Konda Kyoto University 2.1 Feedback between Ocean and Atmosphere Heat and momentum exchange between the ocean and atmosphere Atmospheric circulation Condensation heat
SEASONAL SEA LEVEL VARIABILITY AND ANOMALIES IN THE SINGAPORE STRAIT
 Proceedings of International Conference in Ocean Engineering, ICOE Proceedings 2009 of ICOE 2009 Seasonal IIT sea Madras, level Chennai, variability India. and anomalies in the Singapore Strait 1-5 Feb.
Subsurface Ocean Temperature Indices for Central-Pacific and Eastern-Pacific Types of El Niño and La Niña Events
 Subsurface Ocean Temperature Indices for Central-Pacific and Eastern-Pacific Types of El Niño and La Niña Events Jin-Yi Yu 1*, Hsun-Ying Kao 2, Tong Lee 3, and Seon Tae Kim 1 1 Department of Earth System
Goal: Develop quantitative understanding of ENSO genesis, evolution, and impacts
 The Delayed Oscillator Zebiak and Cane (1987) Model Other Theories Theory of ENSO teleconnections Goal: Develop quantitative understanding of ENSO genesis, evolution, and impacts The delayed oscillator
Lecture 18: El Niño. Atmosphere, Ocean, Climate Dynamics EESS 146B/246B
 Lecture 18: El Niño Atmosphere, Ocean, Climate Dynamics EESS 146B/246B El Niño Transient equatorial motions: Kelvin and Rossby waves. Positive feedback mechanism associated with air-sea coupling. Atmospheric
Lecture 24. El Nino Southern Oscillation (ENSO) Part 1
 Part 1") Lecture 24 El Nino Southern Oscillation (ENSO) Part 1 The most dominant phenomenon in the interannual variation of the tropical oceanatmosphere system is the El Nino Southern Oscillation (ENSO) over the
Lecture 24 El Nino Southern Oscillation (ENSO) Part 1 The most dominant phenomenon in the interannual variation of the tropical oceanatmosphere system is the El Nino Southern Oscillation (ENSO) over the
SIO 210 Problem Set 3 November 4, 2011 Due Nov. 14, 2011
 SIO 210 Problem Set 3 November 4, 2011 Due Nov. 14, 2011 1. At 20 N, both the ocean and the atmosphere carry approximately 2 PW of heat poleward, for a total of about 4 PW (see figure). If (at this latitude)
The Coriolis force, geostrophy, Rossby waves and the westward intensification
 Chapter 3 The Coriolis force, geostrophy, Rossby waves and the westward intensification The oceanic circulation is the result of a certain balance of forces. Geophysical Fluid Dynamics shows that a very
Modification of the Stratification and Velocity Profile within the Straits and Seas of the Indonesian Archipelago
 DISTRIBUTION STATEMENT A. Approved for public release; distribution is unlimited. Modification of the Stratification and Velocity Profile within the Straits and Seas of the Indonesian Archipelago Amy Ffield
Effects of the seasonal cycle on the development and termination of the Indian Ocean Zonal Dipole Mode
 Click Here for Full Article JOURNAL OF GEOPHYSICAL RESEARCH, VOL. 111,, doi:10.1029/2005jc003247, 2006 Effects of the seasonal cycle on the development and termination of the Indian Ocean Zonal Dipole
Observations and Modeling of Coupled Ocean-Atmosphere Interaction over the California Current System
 Observations and Modeling of Coupled Ocean-Atmosphere Interaction over the California Current System Cape Blanco Dudley Chelton 1, Xin Jin 2, Jim McWilliams 2 & Tracy Haack 3 1 Oregon State University
 1 2 http://ds.data.jma.go.jp/tcc/tcc/index.html http://ds.data.jma.go.jp/tcc/tcc/index.html Climate in Japan World Climate Extratropics Tropics Oceanograhpic conditions World Climate Page 2 Extratropics
Changes of The Hadley Circulation Since 1950
 Changes of The Hadley Circulation Since 1950 Xiao-Wei Quan, Henry F. Diaz, Martin P. Hoerling (NOAA-CIRES CDC, 325 Broadway, Boulder, CO 80305) Abstract The Hadley circulation is changing in response to
ATS150: Global Climate Change. Oceans and Climate. Icebergs. Scott Denning CSU 1
 The Oceans Wind-Driven Gyre Circulations Icebergs Scott Denning CSU 1 Surface Balance of Forces friction coriolis wind stress resultant current Wind stress accelerates surface water Friction couples surface
Intraseasonal variability of equatorial Indian Ocean zonal currents
 Intraseasonal variability of equatorial Indian Ocean zonal currents Debasis Sengupta 1, Retish Senan 2 and B. N. Goswami Centre for Atmospheric and Oceanic Sciences Indian Institute of Science, Bangalore,
Chapter 19. El Niño and the Southern Oscillation (ENSO)
") Chapter 19 El Niño and the Southern Oscillation (ENSO) The previous chapter stressed the importance of the tropics for the coupling between ocean and atmosphere and showed how positive feedback between
Chapter 19 El Niño and the Southern Oscillation (ENSO) The previous chapter stressed the importance of the tropics for the coupling between ocean and atmosphere and showed how positive feedback between
Local vs. Remote SST Forcing in Shaping the Asian-Australian Monsoon Variability
 Local vs. Remote SST Forcing in Shaping the Asian-Australian Monsoon Variability Tim Li IPRC and Dept. of Meteorology, Univ. of Hawaii Acknowledgement. B. Wang, C.-P. Chang, P. Liu, X. Fu, Y. Zhang, Kug
Currents. History. Pressure Cells 3/13/17. El Nino Southern Oscillation ENSO. Teleconnections and Oscillations. Neutral Conditions
 Teleconnections and Oscillations Teleconnection climate anomalies being related to each other over a large scale Oscillations: Macroscale movement of atmospheric systems that can influence weather, climate,
Interannual Variability in an Indian Ocean Basin Model
 Interannual Variability in an Indian Ocean Basin Model Johannes Loschnigg y International Pacific Research Center z School of Ocean and Earth Science and Technology University of Hawaii at Manoa, Honolulu,
HIGH-RESOLUTION SURFACE CIRCULATION OF THE BAY OF BENGAL DERIVED FROM SATELLITE OBSERVATION DATA
 656 Journal of Marine Science and Technology, Vol. 24, No. 3, pp. 656-668 (26) DOI:.69/JMST-5-25-2 HIGH-RESOLUTION SURFACE CIRCULATION OF THE BAY OF BENGAL DERIVED FROM SATELLITE OBSERVATION DATA Mridula
Surface chlorophyll bloom in the Southeastern Tropical Indian Ocean during boreal summer-fall as reveal in the MODIS dataset
 Surface chlorophyll bloom in the Southeastern Tropical Indian Ocean during boreal summer-fall as reveal in the MODIS dataset Iskhaq Iskandar 1 and Bruce Monger 2 1 Jurusan Fisika, Fakultas MIPA, Universitas
Mesoscale modeling study of the oceanographic conditions off the southwest coast of India
 Mesoscale modeling study of the oceanographic conditions off the southwest coast of India Vibeke E Haugen, Ola M Johannessen and Geir Evensen Nansen Environmental and Remote Sensing Center, Edvard Griegs
Seasonal Currents in the Bay of Bengal and Andaman Sea Revealed by Reprocessed Observations
 2012 International Conference on Environment Science and Engieering IPCBEE vol.3 2(2012) (2012)IACSIT Press, Singapoore Seasonal Currents in the Bay of Bengal and Andaman Sea Revealed by Reprocessed Observations