Impact of the cold water band and the Sri Lanka Dome on the Biogenic fluxes in the Southern Bay of Bengal
|
|
|
- Florence Welch
- 6 years ago
- Views:
Transcription
1 Impact of the cold water band and the Sri Lanka Dome on the Biogenic fluxes in the Southern Bay of Bengal M. Anil kumar Abstract Department of Meteorology and Hydrology, Arba Minch University Time series of biogenic fluxes from sediment trap samples collected at a water depth of 1518 m in the southern Bay of Bengal (5 N, 87 E) during 5 February 16 December 1992 showed a significant seasonality with higher ( mg m -2 d -1 ) fluxes during South West Monsoon (SWM). The Ocean General Circulation Model (OGCM) for Earth Simulator (OFES) simulated temperature and currents in the upper 100 m, observed data on surface winds and nutrients and satellite derived chlorophylla revealed advection of cold (<27 C), nutrient and chlorophyll-a rich waters from southeastern Arabian Sea and Sri Lanka Dome (SLD, Vinayachandran et al., 2004) into the southern Bay which facilitated high primary productivity resulting in the observed higher biogenic fluxes during SWM. Key words: South West Monsoon, OFES, Sri Lanka Dome, Sea Surface Temperature, Bay of Bengal, chlorophyll-a, biogenic fluxes, dissolved oxygen (DO), 1. Introduction The monthly maps of climatological Sea Surface Temperature (SST) in the Indian Ocean [Hastenrath and Greischar, 1989] and the near-synoptic distribution of SST during SWM in the Bay of Bengal [Murty et al., 1992] documented the presence of a cold water band in the southern Bay of Bengal during SWM. The recent studies, based on satellite remote sensing data products, by Joseph et al. [2005] and Rao et al. 163
2 [2006] also reported the presence of a cold water band (or mini cold pool) at the sea surface in the southern Bay of Bengal during SWM. Murty et al. [1992] opined that the upwelling of cold waters from the southeastern Arabian Sea and their eastward advection through the Southwest Monsoon Current (SMC) might be responsible for the observed lower SST (<26.5 C) during September. Joseph et al. [2005] proposed that the cold water band affected the atmospheric convection over the southern Bay and contributed to the active and break cycles of the SWM. Smitha et al. [2006] reported SST cooling due to tangential wind-stress-driven coastal upwelling off Kanyakumari coast (southern tip of India) and the elevated chlorophyll-a during SWM. Based on OGCM simulations, Vinayachandran et al. [2004] demonstrated the presence of SLD represented by the upward rise of isotherms from the midthermocline which was manifested as cold water cell off the east coast of Sri Lanka during SWM. Several authors [Nair et al., 1989; Ittekkot et al., 1991; Rixen et al., 1996; Guptha et al., 1997; Unger et al., 2003; Mergulhao, 2006; Mergulhao et al., 2006] studied the seasonal and interannual variability of particulate fluxes comprising the biogenic fluxes, collected as part of the Indo-German collaborative program on Biogeochemical Processes in the northern Indian Ocean using many sediment trap moorings with two traps located at varying depths between 1000 and 3000 m in each mooring in the Arabian Sea and the Bay of Bengal during The particulate fluxes settling in the sediment traps comprised largely of aggregates i.e., marine snow and fecal pellets formed in the upper ocean with the sinking rates ranging from 400 m day -1 to >1000 m day -1 and could reach a 3 km water column in about a week [Alldredge and Silver, 1988]. Mergulhao [2006] reported that biogenic fluxes measured at three trap locations in the Bay of Bengal during 5 February
3 December 1992 contributed immensely to the total particulate fluxes which increased from northern to southern Bay, and documented further that the biogenic fluxes at the Southern Bay of Bengal Trap (SBBT: 5 N, 87 E) were about 4-5 times higher during SWM of 1992 compared to the fluxes measured simultaneously at the central and northern Bay sediment traps. In this study, we demonstrate the impact of the southern Bay of Bengal cold water band (or mini cold pool) and the SLD, affecting the biogeochemistry of the southern Bay of Bengal, on the observed higher biogenic fluxes during SWM of 1992 at SBBT. For this purpose, we made use of the time series of biogenic fluxes and fluxes of planktic foraminferal and coccolithophore species at SBBT during 1992, the OFES monthly simulations of temperature and currents in the Bay of Bengal in the upper 100 m during , the Sea-viewing Wide Field-of-view Sensor (SeaWiFs) derived surface chlorophyll-a during ( the optimally interpolated (OI) monthly averaged SST data in 1 x1 grids [Reynolds and Smith, 1994] during ( the National Centre for Environmental Prediction (NCEP) archived reanalysis of surface winds during ( and the measured nutrients and dissolved oxygen in the upper 200 m during SWMs of 1984 and Data Samples were collected by using the PARFLUX Mark VI time-series sediment traps deployed at the Northern Bay of Bengal Trap (NBBT: 16 N, 89 E), Central Bay of Bengal Trap (CBBT: 11 N, 84 E) and at SBBT during 5 February 16 December The methods of collection and analyses of biogenic fluxes, foraminifera and coccolithophores were adopted from Unger et al. [2003] and Mergulhao et al. [2006]. 165
4 The wind stress curl in 2.5 x2.5 grids was computed using the NCEP archived monthly mean surface winds [Kalnay et al., 1996]. We also analyzed the Modular Ocean Model version 3 (MOM 3) [Pacanowski and Griffies, 2000] based OFES simulated monthly mean temperature and currents [Masumoto et al., 2004; Sasaki et al., 2006] at 5 levels (2.5 m, 7.4 m, 24.3 m, 54 m and 95.6 m depths) for the years The model ocean was driven by wind stress, and the calculated surface heat flux from the atmospheric fields and the simulated SST using the same bulk formula of Rosati and Miyakoda [1988]. The salinity flux was obtained from the rates of precipitation and evaporation data obtained using the bulk formula. In addition to the salinity flux, the surface salinity was restored to the climatological monthly mean value of the World Ocean Atlas 1998 (WOA98) [Antonov et al., 1998a,b,c and Boyer et al., 1998a,b,c], with the restoring time-scale of 6 days. Impact from river run-off was adjusted by restoring the surface salinity field. The spin-up integration was forced by monthly mean atmospheric fields averaged for of the NCEP reanalysis products [Kalnay et al., 1996], but the hindcast simulation for the period from 1950 to 2003 was forced by the reanalysis daily mean fields. 3. Results and Discussion 3.1. Seasonal variation of biogenic fluxes at the SBBT location Figure 1a shows the temporal (26 day interval) variation of biogenic fluxes in the shallow trap of SBBT (1588 m) during 5 February 16 December The biogenic fluxes obtained in the shallow traps at the CBBT (1518 m) and NBBT (1156 m) were also included for comparison. The fluxes displayed a distinct seasonality at all three trap locations. Biogenic fluxes at SBBT exhibited a bimodal distribution with relatively higher fluxes (~90 mg m -2 d -1 ) during North East Monsoon (NEM) 166
5 (February), and very higher fluxes during SWM (June September) with a peak abundance (280 mg m -2 d -1 ) in September. During intermonsoon periods (March June and October November) the fluxes were low and uniform. The bimodal distribution in the fluxes was less prominent at NBBT and CBBT. Interestingly, the fluxes at SBBT were about 4-5 times higher than those at NBBT and CBBT during SWM. Figure 1b displays a temporal variation of Globigerina bulloides and Gephyrocapsa oceanica fluxes only at SBBT, resembling the pattern of biogenic fluxes. Gg. bulloides, a planktic foraminiferal species and an indicator of upwelling [Guptha et al., 1997 and references therein] showed a greater preference for SWM with a prominent peak flux associated with the SWM (July-August). Similarly, coccolithophore species, G. oceanica was commonly found in the tropical subtropical waters in a temperature range of 12 to 30 C and showing its affinity for high-nutrient environments such as upwelling areas [Guptha et al., 2005; Mergulhao et al., 2006]. The G. oceanica also displayed a distinct seasonality with higher fluxes occurring during SWM. Thus, it was inferred that the elevated occurrences of these species together with biogenic fluxes were due to high productivity resulted from various surface layer processes that were prevalent during SWM of Seasonal variation of OFES simulated upper ocean temperature and currents We examined the OFES simulated monthly mean temperature and currents at the above 5 depths in the upper 100 m during years. Figures 2a and 2b display the seasonal cycles of OFES temperature at 2.5 m depth and OI SST at SBBT during Both the OFES temperature and the OI SST showed similar seasonal cycle during all the 3 years, but the OFES temperature at 2.5 m depth was found cooler by ~1.5 C than OI SST, for the obvious depth difference. Both the seasonal cycles showed warmer temperature (>27 C) during March-May, corresponding to the Indian 167
6 Ocean Warm Pool in the southern Bay of Bengal [Vinayachandran and Shetye, 1991]. During SWM, surface layer cooling was evident in both the OFES temperature and OI SST from May through August. Figures 3a-b show the OFES temperature superimposed on simulated currents at 2.5 m depth in the Bay of Bengal during January (North East Monsoon) and July (SWM), In January 1992, the SST gradient was northward with warmer (>27 C) waters in the southern Bay of Bengal (Figure 3a). The lower SST (<25 C) in the northern Bay was due to net heat loss across air-sea interface under the influence of reduced incoming solar radiation and increased latent heat flux when the cold, dry northeasterlies blew over the Bay of Bengal. The northeasterly winds drive a southerly flow in the Andaman Sea which in turn feeds the westward flow in the eastern Bay to form the westward flowing Winter Monsoon Current (WMC) between 4 and 8 N (Figure 3a). A part of the west/northwestward flow east of 88 E from equatorial region joined the WMC encompassing SBBT. The WMC bifurcated into the western Bay feeding the poleward flowing East India Coastal Current (EICC) [Shankar et al., 2002] and also continued as the WMC south of Sri Lanka. The simulated currents during March showed intense anticyclonic circulation in the central Bay (not shown). In April 1992, a cold water (<28 C) cell occurred south of Sri Lanka, while a large warm (>28.5 C) water cell occurred in the central Bay covering CBBT. By May, the temperature gradient reversed southward (from northern to southern Bay) with the cold water band (<27.6 C) extending from south of Sri Lanka towards east along 5 N. With the advent of SWM, the WMC in the southern Bay was replaced by the eastward flowing SMC encompassing SBBT. By July, the cold-water band in the southern Bay intensified and extended eastward up to SBBT (Figure 3b). During this period, the simulated currents displayed a strong eastward flow south of 168
7 Sri Lanka emerging from the southeastern Arabian Sea. This southeastward flow together with the southerly flow off the east coast of Sri Lanka intensified the SMC between 5 N and 8 N (Figure 3b). The surface conditions of temperature and currents with cold water band south of Sri Lanka and the SMC were discerned up to the simulated depth of 25 m. Whereas the simulated temperature and currents at the depth of 54 m during NEM exhibited the occurrence of warm waters (~26.5 C) within the WMC between 2 N and 10 N in January 1992 (Figure 3c). On the contrary, an intense cold water cell (~19 C), representing the SLD, appeared off the east coast of Sri Lanka in July (Figure 3d). The monthly mean wind stress curl fields during May July indicated divergence (positive curl) from the base of Ekman layer in the southern Bay (not shown). The centers of maximum divergence and the associated sub-surface cold water cell shifted from southern Bay to the east coast of Sri Lanka by July, coinciding with the SLD [Vinayachandran et al., 2004]. At the same time, field of negative curl (convergence) encompassed SBBT. The computed vertical velocity from the curl field showed maximum upward velocity (upwelling) of about 10 m/day in the SLD in July The OFES simulated currents at and below 25 m depth showed the southeastward flow emerging from the SLD advecting the upwelled cold waters towards SBBT. Further, the wider cold water band which occurred at shallow depths tapered downward, as cold waters from the SLD spread outward into the southern Bay up to SBBT. This is more evident from the simulated currents at 54 m depth wherein a narrow SMC at 5 N and a cyclonic circulation associated with the SLD were noticed (Figure 3d). The simulations at 54 m depth during August September also showed the cold-water cell associated with the SLD and cyclonic circulation off the east coast of Sri Lanka (Figures not shown). The SBBT experienced relatively lower temperatures and the presence of SMC up to September. 169
8 The curl-induced divergence in the SLD brings in upwelling of cold, nutrient rich waters to the surface, and the prevalent cyclonic circulation off Sri Lanka coast and the SMC effected the advection of upwelled waters towards SBBT during July - September. 3.3 Seasonal variation of surface chlorophyll-a and nutrients An examination of SeaWiFs derived monthly mean sea surface chlorophyll-a during July 1997 December 2000 revealed the presence of a band of higher chlorophyll-a emerging from the western part of Nicobar Islands (4-7 N) up to SBBT during NEM (January February) and from south of Sri Lanka towards SBBT and central Bay during SWM. This is further substantiated by the seasonal distributions of chlorophyll-a during January and July 1998 and 2000 (Figures 4a-d). Owing to the fact that the entire northern Indian Ocean experienced a large scale influence of the Indian Ocean Dipole (IOD) event during [Saji et al., 1999], the SeaWiFs surface chlorophyll for a non-iod year (2000) was also included. The concentration of chlorophyll-a was relatively high in 1998 compared to that in 1999 and It is interpreted that the prevailing surface currents at 2.5 m depth in January 1992 (Figure 3a) and February 1992 advected the nutrient rich waters with elevated chlorophyll-a from the Nicobar Islands through WMC between 5 and 8 N which triggered high primary productivity leading to higher biogenic fluxes at SBBT during NEM (February) (Figures 1a-b). Despite the fact that the WMC continued until April/May, the advected chlorophyll-a depleted waters after February hampered the primary productivity resulting in lower biogenic fluxes at SBBT during March June (Figure 1a). Nevertheless, the surface waters replenished with higher concentrations of chlorophyll-a during SWM (July August) in a wide band (Figures 4b & 4d) that extended from south of Sri Lanka up to SBBT and northward into central Bay. The 170
9 high chlorophyll-a band coincided with the cold-water band that emerged from south of Sri Lanka and the SLD with eastward/southeastward currents flowing towards SBBT. The available in situ profiles of measured nutrients (nitrate, silicate, phosphate) and dissolved oxygen (DO) at the hydrographic stations in the vicinity of SBBT during the SWMs of 1984 and 1993 (Figures 5a-d) were assumed to be the representative of the general nutrient distributional patterns in the southern Bay of Bengal during the SWM. Figures 5a-d showed the availability of higher concentrations of nutrients (2 μm in nitrates) in the euphotic layer in the southern Bay of Bengal during SWM. 4. Conclusions The OFES simulated cold water band and the SMC, the measured high nutrients and the SeaWiFS derived higher chlorophyll-a in the southern Bay of Bengal during SWM confirmed that the SMC advected the upwelled nutrient-rich and chlorophyll elevated waters from the southeastern Arabian Sea (including the southern tip of India) during May June and from the east coast of Sri Lanka (SLD) during July September. Besides, the higher concentrations of DO in September (Figure 5d) suggested the enhancement of primary productivity (oxygen is released to the water column) in the southern Bay of Bengal during SWM. Thus, it is concluded that the prevailing surface layer processes obtained from the wind induced divergence and OFES simulated cold water band, the SLD and the SMC showed their tremendous influence on the biogeochemistry of the southern Bay of Bengal which was well evident from the measured higher biogenic fluxes during the SWM of 1992 in the southern Bay of Bengal. 171
10 5. Acknowledgement The Corresponding Author, M. Anil Kumar has been working as a Council of Scientific and Industrial (CSIR) University Grant Commission (UGC)- National Eligibility Test (NET)-Senior Research Fellow (SRF), funded by Council of Scientific and Industrial Research (CSIR), India. 6. References Alldredge, A. L., and M. W. Silver (1988), Characteristics, dynamics, and significance of marine snow, Progr. Oceanogr., 20, Antonov, J., S. Levitus, T. P. Boyer, M. Conkright, T. Oâ Brien, and C. Stephens (1998a), World Ocean Atlas 1998, vol. 1, Temperature of the Atlantic Ocean, NOAA Atlas NESDIS 27, 166 pp., U.S. Gov. Print. Off., Washington, D. C. Antonov, J., S. Levitus, T. P. Boyer, M. Conkright, T. Oâ Brien and C. Stephens (1998b), World Ocean Atlas 1998, vol. 2, Temperature of the Pacific Ocean, NOAA Atlas NESDIS 28, 166 pp., U.S. Gov. Print. Off., Washington, D. C. Antonov, J., S. Levitus, T. P. Boyer, M. Conkright, T. Oâ Brien, C. Stephens, and B. Trotsenko (1998c), World Ocean Atlas 1998, vol. 3, Temperature of the Indian Ocean, NOAA Atlas NESDIS 29, U.S. Gov. Print. Off., 166 pp., Washington, D.C. Boyer, T. P., S. Levitus, J. I. Antonov, M. E. Conkright, T. D. OxBrien, and C. Stephens, (1998a), World Ocean Atlas 1998, vol. 3, Temporal Distribution of Expendable Bathythermograph Profiles, NOAA Atlas NESDIS 20, 170 pp., U.S. Gov. Print. Off., Washington, D. C. Boyer, T.P., M.E. Conkright, S. Levitus, C. Stephens, T. OxBrien, D.Johnson, R. Gelfeld, (1998b), World Ocean Database 1998, vol. 4, Temporal Distribution of Conductivity- Temperature-Depth Profiles. NOAA Atlas NESDIS 21, 163 pp., U.S. Govt. Print. Off., Washington, D. C. 172
11 Boyer, T.P., M.E. Conkright, S. Levitus, D. Johnson, J. Antonov, T. OxBrien, C. Stephens, R. Gelfeld (1998c), World Ocean Database 1998, vol. 5, Temporal Distribution of Ocean Station Data (Bottle) Temperature Profiles. NOAA Atlas NESDIS 22, 108 pp., U.S. Govt. Print. Off., Washington, D. C. Guptha, M. V. S., W. B. Curry, V. Ittekkot, and A. S. Muralinath (1997), Seasonal variation in the flux of planktonic Foraminifera: Sediment trap results from the Bay of Bengal, Northern Indian Ocean, J. Foraminiferal Res., 27, Guptha, M. V. S., L. P. Mergulhao, V. S. N. Murty, and D. M. Shenoy (2005), Living coccolithophores during the northeast monsoon from the Equatorial Indian Ocean: Implications on hydrography, Deep Sea-Res. II, 52, Hastenrath, S., and L. L. Greischar (1989), Climatic Atlas of the Indian Ocean, Part III: Upper-Ocean Structure. The University of Wisconsin Press, Madison, 247 charts. Ittekkot, V., R.R. Nair, S. Honjo, V. Ramaswamy, M. Bartsch, S. Manganini, and B.N. Desai (1991), Enhanced particle fluxes in Bay of Bengal induced by injection of fresh water, Nature, 351, Joseph, P.V., K.P. Sooraj, C.A. Babu, and T.P. Sabin (2005), A cool pool in the Bay of Bengal and its interaction with the active-break cycle of the monsoon, CLIVAR Exchanges 34, 10(3), Kalnay, E. and 21 co-authors, (1996), The NCEP/NCAR 40-year reanalysis project. Bull. Am. Meteorol. Soc., 77, Masumoto, Y., H. Sasaki, T. Kagimoto, N. Komori, A. Ishida, Y. Sasai, T. Miyama, T. Motoi, H. Mitsudera, K. Takahashi, H. Sakuma, and T. Yamagata (2004), A Fifty- Year Eddy-Resolving Simulation of the World Ocean Preliminary Outcomes of OFES (OGCM for the Earth Simulator), J. Earth Sim., 1,
12 Mergulhao, L. P., Rahul Mohan, V. S. N. Murty, M. V. S. Guptha, and D. K. Sinha (2006), Extant coccolithophores from the central Arabian Sea: Sediment trap results, J. Earth Sys. Sci. 115, Mergulhao, L.P., (2006), Seasonal variation of the flux of living coccolithophore communities in the Bay of Bengal and their implication on hydrography, Ph.D. Thesis, submitted to Goa University, India, 167 pp (Unpubl.). Murty, V. S. N, Y. V. B. Sarma, D. P. Rao, and C. S. Murty (1992), Water characteristics, mixing and circulation in the Bay of Bengal during southwest monsoon, J. Mar. Res., 50, Nair, R. R., V. Ittekkot, S. J. Manganini, V. Ramaswamy, B. Haake, E. T. Degens, B. N. Desai, and S. Honjo (1989), Increased particle flux to the deep ocean related to monsoons, Nature, 338, Pacanowski, R.C. and M. Griffies (2000), The MOM3 Mannual, GFDL Ocean Group Technical Report, 4, Princeton, NJ, NOAA/GFDL, 680pp. Rao, R. R., M. S. Girish Kumar, M. Ravichandran, and B. K. Samala (2006), Observed mini-cool pool off the southern tip of India and its intrusion into the south central Bay of Bengal during summer monsoon season, Geophys. Res. Lett., 33, L06607, doi: /2005gl Reynolds, R. W., and T. M. Smith, (1994), Improved global sea surface temperature analyses using optimum interpolation, J. Clim., 7, Rixen, T., B. Haake, V. Ittekkot, M. V. S. Guptha, R. R. Nair, and P. Schlüssel (1996), Coupling between SW monsoon-related surface and deep ocean processes as discerned from continuous particle flux measurements and correlated satellite data, J. Geophys. Res., 101, 28,569 28,
13 Rosati, A. and K. Miyakoda (1988), A general circulation model for upper ocean circulation, J. Phys. Oceanogr., 18, Saji, N. H., B. N. Goswami, P. N. Vinaychandran, and T. Yamagata (1999), A dipole mode in the tropical Indian Ocean, Nature, 401, Sasaki, H., M. Nonaka, Y. Masumoto, Y. Sasai, H. Uehara, and H. Sakuma (2006), An eddy-resolving hindcast simulation of the quasi-global ocean from 1950 to 2003 on the Earth Simulator, in High Resolution numerical Modeling of the Atmosphere and Ocean, Ed. K. Hamilton and W. Ohfuchi, Springer, New York, (in press) Shankar, D., P. N. Vinayachandran, and A. S. Unnikrishnan (2002), The monsoon currents in the Arabian Sea and Bay of Bengal, Prog. Oceanogr., 52, Smitha, B. R., V. N. Sanjeevan, K. G.Vimalkumar, and C. Revichandran (2006), An analysis of the upwelling process along the southwest coast of India with special reference to Kanyakumari. Submitted to Cont. Shelf Res. Unger, D., V. Ittekkot, P. Schäfer, J. Tiemann, and S. Reschke (2003), Seasonality and interannual variability of particle fluxes to the deep Bay of Bengal: influence of riverine input and oceanographic processes, Deep-Sea Res. II, 50, Vinayachandran, P. N, and S. R. Shetye (1991), The warm pool in the Indian Ocean. Proc. Indian Acad. Sci., 100, Vinayachandran, P. N., P. Chauhan, M. Mohan, and S. Nayak (2004), Biological response of the sea around Sri Lanka to summer monsoon, Geophys. Res. Lett., 31, L01302, doi: /2003GL Figures Captions: Figure 1. (a) Study area showing the sediment trap locations in the Bay of Bengal. The two rectangles (A & B) in (a) represent the boxes wherein the seasonal variation 175
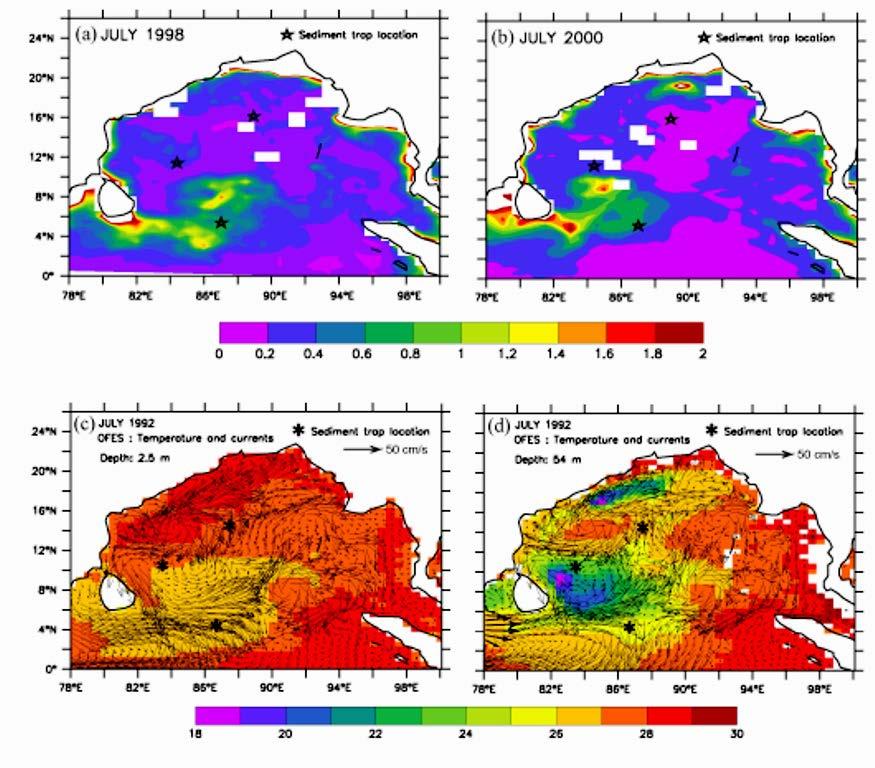
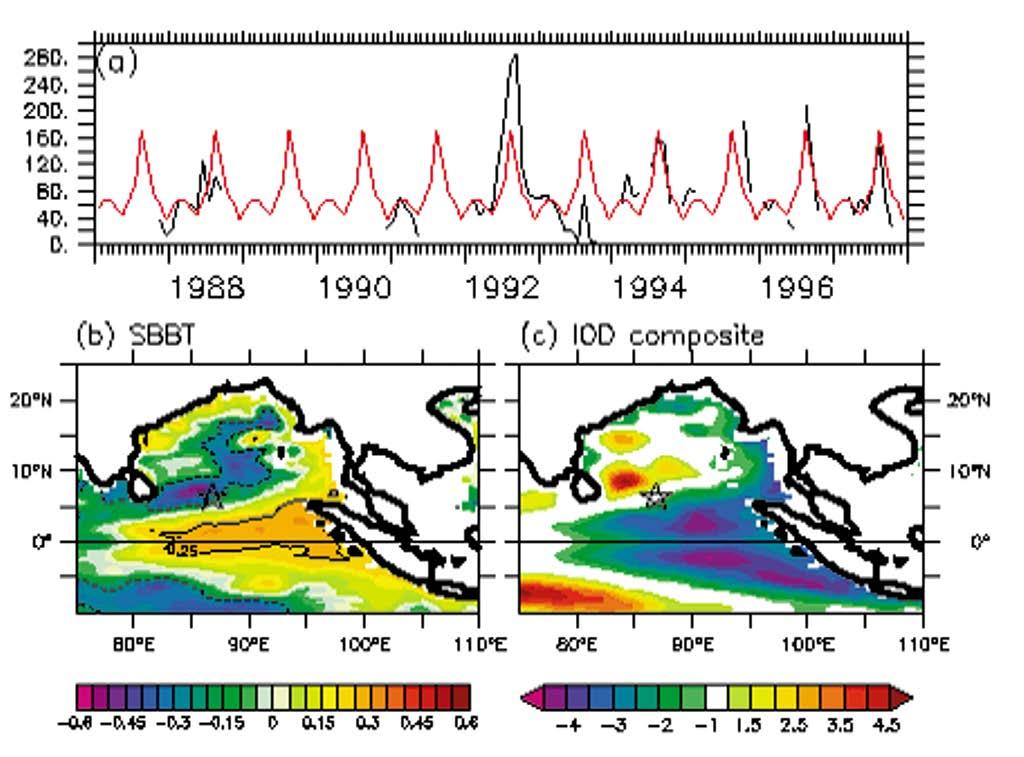
14 of the parameters are presented for period, but surface chlorophyll-a is presented for , (b-c) seasonal variation of (b) biogenic fluxes at NBBT, CBBT and SBBT and (c) fluxes of G. oceanica and Gg. bulloides at SBBT only, and (d-h) seasonal variation of (d) OI SST and OFES temperature at 2.5 m depth, (e) surface chlorphyll, (f) Ekman pumping velocity (WE) in boxes A & B, (g) vertical velocity (W) at 100 m depth in boxes A & B, (h) OFES zonal currents at 2.5 m and 100 m depths in box B. The shaded band represents the SW monsoon period (June- September). Positive (negative) values of WE and W represent upwelling (sinking). Figure 2. (a & b) SeaWiFs derived surface chlorophyll-a (mg m-3) during (a) July 1998 and (b) July 2000, (c & d) OFES simulated current vectors and temperature (color shading) during July 1992 at (c) 2.5 m depth and (d) 54 m depth. For clarity, alternate current vector in the adjacent grid (0.5 x 0.5 ) is suppressed. The magnitude of the current vector is shown by arrow in the right top corner in (c & d). Figure 3. Profiles of (a) nitrate, (b) silicate and (c) dissolved oxygen at the hydrographic stations close to SBBT in August 1993 and September [Source: Indian National Oceanographic Data Center, National Institute of Oceanography, Goa]. Figure 4. (a) Time series of total biogenic fluxes (black curve) and mean seasonal cycle (red curve) at SBBT (b) spatial correlations between the anomalies of biogenic flux at SSBT with OFES temperature anomalies at 100 m (correlation coefficients above 95% are bounded by curves) and (c) composite temperature anomaly (June - November) at 100 m depth during summer 1994 and 1997 IOD events. Location of SBBT is shown as star. 176
15 177
16 178
17 179
MODELING INDIAN OCEAN CIRCULATION: BAY OF BENGAL FRESH PLUME AND ARABIAN SEA MINI WARM POOL
 MODELING INDIAN OCEAN CIRCULATION: BAY OF BENGAL FRESH PLUME AND ARABIAN SEA MINI WARM POOL P. N. Vinayachandran* 1 1, *2 and J. Kurian* * 1 Centre for Atmospheric and Oceanic Sciences, Indian Institute
3 The monsoon currents in an OGCM
 3 The monsoon currents in an OGCM The observations show that both Ekman drift and geostrophy contribute to the surface circulation in the north Indian Ocean. The former decays rapidly with depth, but the
Interannual variation of northeast monsoon rainfall over southern peninsular India
 Indian Journal of Geo-Marine Science Vol. 40(1), February 2011, pp 98-104 Interannual variation of northeast monsoon rainfall over southern peninsular India * Gibies George 1, Charlotte B. V 2 & Ruchith
Marine ecosystem simulation in the eastern tropical Pacific with a global eddy resolving coupled physical-biological model
 GEOPHYSICAL RESEARCH LETTERS, VOL. 34, L23601, doi:10.1029/2007gl031507, 2007 Marine ecosystem simulation in the eastern tropical Pacific with a global eddy resolving coupled physical-biological model
Intrusion of the Southwest Monsoon Current into the Bay of Bengal
 JOURNAL OF GEOPHYSICAL RESEARCH, VOL. 104, NO. C5, PAGES 11,077 11,085, MAY 15, 1999 Intrusion of the Southwest Monsoon Current into the Bay of Bengal P. N. Vinayachandran, 1 Yukio Masumoto, 1,2 Tetsuya
Analysis of 2012 Indian Ocean Dipole Behavior
 Analysis of 2012 Indian Ocean Dipole Behavior Mo Lan National University of Singapore Supervisor: Tomoki TOZUKA Department of Earth and Planetary Science, University of Tokyo Abstract The Indian Ocean
Lecture 14. Heat lows and the TCZ
 Lecture 14 Heat lows and the TCZ ITCZ/TCZ and heat lows While the ITCZ/TCZ is associated with a trough at low levels, it must be noted that a low pressure at the surface and cyclonic vorticity at 850 hpa
Lecture 33. Indian Ocean Dipole: part 2
 Lecture 33 Indian Ocean Dipole: part 2 Understanding the processes I continue the discussion of the present understanding of the processes involved in the evolution of the mean monthly SST, and convection
Wind Driven Circulation Indian Ocean and Southern Ocean
 Wind Driven Circulation Indian Ocean and Southern Ocean Lecture 18 MAR 350 Spring 2017 Reading: Knauss Chapter 7 ECCO2 model animation ecco2_sst_flow (2).mp4 Mean surface height and currents DPO Fig. 11.1
The warm pool in the Indian Ocean
 Proc. Indian Acad. Sci. (Earth Planet. Sci.), Vol., No. 2, June 1991, pp. 165-1. Printed in India. The warm pool in the Indian Ocean P N VINAYACHANDRAN* and S R SHETYE 1 ' National Institute of Oceanography,
Lecture 13 El Niño/La Niña Ocean-Atmosphere Interaction. Idealized 3-Cell Model of Wind Patterns on a Rotating Earth. Previous Lecture!
 Lecture 13 El Niño/La Niña Ocean-Atmosphere Interaction Previous Lecture! Global Winds General Circulation of winds at the surface and aloft Polar Jet Stream Subtropical Jet Stream Monsoons 1 2 Radiation
Characteristics of Bay of Bengal Water mass in South Eastern Arabian Sea during
 Indian Journal of Geo-Marine Sciences Vol. 43(1), January 2014, pp. 27-32 Characteristics of Bay of Bengal Water mass in South Eastern Arabian Sea during 2001-2002 G Nageswara Rao, K Anil Kumar, PSV Jagadeesh
2 Observations. 2.1 Ekman drift
 2 Observations To define the monsoon currents and the associated circulation in the north Indian Ocean, we use climatological wind-stress data to estimate the surface Ekman drift, and hydrography and altimeter
Monsoon Response of the Sea around Sri Lanka: Generation of Thermal Domes and Anticyclonic Vortices
 1946 JOURNAL OF PHYSICAL OCEANOGRAPHY Monsoon Response of the Sea around Sri Lanka: Generation of Thermal Domes and Anticyclonic Vortices P. N. VINAYACHANDRAN* AND TOSHIO YAMAGATA Department of Earth and
The Air-Sea Interaction. Masanori Konda Kyoto University
 2 The Air-Sea Interaction Masanori Konda Kyoto University 2.1 Feedback between Ocean and Atmosphere Heat and momentum exchange between the ocean and atmosphere Atmospheric circulation Condensation heat
RECTIFICATION OF THE MADDEN-JULIAN OSCILLATION INTO THE ENSO CYCLE
 RECTIFICATION OF THE MADDEN-JULIAN OSCILLATION INTO THE ENSO CYCLE By William S. Kessler and Richard Kleeman Journal of Climate Vol.13, 1999 SWAP, May 2009, Split, Croatia Maristella Berta What does give
Indian Ocean Seasonal Cycle Jérôme Vialard (IRD) LOCEAN Paris France From Schott & McCreary (Prog. Oc.
 LOCEAN Paris France From Schott & McCreary (Prog. Oc.") Indian Ocean Seasonal Cycle Jérôme Vialard (IRD) LOCEAN Paris France jerome.vialard@ird.fr From Schott & McCreary (Prog. Oc. 2001) Outline The monsoon cycle The basin-scale dynamical response Thermocline
Indian Ocean Seasonal Cycle Jérôme Vialard (IRD) LOCEAN Paris France jerome.vialard@ird.fr From Schott & McCreary (Prog. Oc. 2001) Outline The monsoon cycle The basin-scale dynamical response Thermocline
Investigation of Common Mode of Variability in Boreal Summer Intraseasonal Oscillation and Tropospheric Biennial Oscillation
 Investigation of Common Mode of Variability in Boreal Summer Intraseasonal Oscillation and Tropospheric Biennial Oscillation 5. Introduction The Asian summer monsoon is one of the most vigorous and energetic
On some aspects of Indian Ocean Warm Pool
 Indian Journal of Geo-Marine Sciences Vol. 44(4), April 2015, pp. 475-479 On some aspects of Indian Ocean Warm Pool Saji P. K. *, A. N. Balchand & M. R. Ramesh Kumar 1 Department of Physical Oceanography,
IX. Upper Ocean Circulation
 IX. Upper Ocean Circulation World Ocean Covers 71% of Earth s surface Contains 97% of surface water Arctic Ocean NH: 61% ocean, 39% land Pacific Ocean Atlantic Ocean Southern Ocean Indian Ocean SH: 81%
Mesoscale air-sea interaction and feedback in the western Arabian Sea
 Mesoscale air-sea interaction and feedback in the western Arabian Sea Hyodae Seo (Univ. of Hawaii) Raghu Murtugudde (UMD) Markus Jochum (NCAR) Art Miller (SIO) AMS Air-Sea Interaction Workshop Phoenix,
Wind-driven driven Response of the Northern Indian Ocean to Climate Extremes
 Wind-driven driven Response of the Northern Indian Ocean to Climate Extremes Tommy G. Jensen International Pacific Research Center CLIVAR Indian Ocean Workshop Dec 1, 2004 1 Motivation Pathways of water
Influence of El Nino Southern Oscillation and Indian Ocean Dipole in biennial oscillation of Indian summer monsoon
 Influence of El Nino Southern Oscillation and Indian Ocean Dipole in biennial oscillation of Indian summer monsoon 4.1 Introduction The main contributors to the interannual variability of Indian summer
Data Analysis of the Seasonal Variation of the Java Upwelling System and Its Representation in CMIP5 Models
 Data Analysis of the Seasonal Variation of the Java Upwelling System and Its Representation in CMIP5 Models Iulia-Mădălina Ștreangă University of Edinburgh University of Tokyo Research Internship Program
Influence of mechanical mixing on a low summertime SST in the western North Pacific ITCZ region
 GEOPHYSICAL RESEARCH LETTERS, VOL. 33,, doi:10.1029/2006gl025997, 2006 Influence of mechanical mixing on a low summertime SST in the western North Pacific ITCZ region N. Sato, 1 H. Tokinaga, 1 R. Shirooka,
Altimetric Observations and model simulations of Coastal Kelvin waves in the Bay of Bengal
 Author version: Mar. Geod., vol.35(s1); 2012; 190-216 Altimetric Observations and model simulations of Coastal Kelvin waves in the Bay of Bengal Matthew J. Nienhaus 1, Bulusu Subrahmanyam 1,2, V.S.N. Murty
Long period waves in the coastal regions of north Indian Ocean
 Indian Journal of Marine Sciences Vol. 33(2), June 2004, pp 150-154 Long period waves in the coastal regions of north Indian Ocean *P V Hareesh Kumar & K V Sanilkumar Naval Physical & Oceanographic Laboratory,
Impacts of intraseasonal oscillation on the onset and interannual variation of the Indian summer monsoon
 Chinese Science Bulletin 2009 SCIENCE IN CHINA PRESS Springer Impacts of intraseasonal oscillation on the onset and interannual variation of the Indian summer monsoon QI YanJun 1,2,3, ZHANG RenHe 2, LI
Wind-Driven Response of the Northern Indian Ocean to Climate Extremes*
 2978 J O U R N A L O F C L I M A T E VOLUME 20 Wind-Driven Response of the Northern Indian Ocean to Climate Extremes* TOMMY G. JENSEN International Pacific Research Center, University of Hawaii at Manoa,
Influence of alongshore wind in the bio-productivity of coastal waters of Somalia and South peninsular India
 Influence of alongshore wind in the bio-productivity of coastal waters of Somalia and South peninsular India C.A. Babu and P.N. Sreelekha Department of Atmospheric Sciences, Cochin University of Science
Mechanistic links between the tropical Atlantic and the Indian monsoon in the absence of El Nino Southern Oscillation events
 Mechanistic links between the tropical Atlantic and the Indian monsoon in the absence of El Nino Southern Oscillation events Vijay Pottapinjara 1*, Roxy Mathew Koll2, Raghu Murtugudde3, Girish Kumar M
Lecture 24. El Nino Southern Oscillation (ENSO) Part 1
 Part 1") Lecture 24 El Nino Southern Oscillation (ENSO) Part 1 The most dominant phenomenon in the interannual variation of the tropical oceanatmosphere system is the El Nino Southern Oscillation (ENSO) over the
Lecture 24 El Nino Southern Oscillation (ENSO) Part 1 The most dominant phenomenon in the interannual variation of the tropical oceanatmosphere system is the El Nino Southern Oscillation (ENSO) over the
Winds and Ocean Circulations
 Winds and Ocean Circulations AT 351 Lab 5 February 20, 2008 Sea Surface Temperatures 1 Temperature Structure of the Ocean Ocean Currents 2 What causes ocean circulation? The direction of most ocean currents
Effect of late 1970 s Climate Shift on Interannual Variability of Indian Summer Monsoon Associated with TBO
 Effect of late 97 s Climate Shift on Interannual Variability of Indian Summer Monsoon Associated with TBO 7. Introduction Biennial variability has been identified as one of the major modes of interannual
Biennial Oscillation of Tropical Ocean-Atmosphere System Associated with Indian Summer Monsoon
 Biennial Oscillation of Tropical Ocean-Atmosphere System Associated with Indian Summer Monsoon 2.1 Introduction The Indian summer monsoon displays substantial interannual variability, which can have profound
The monsoon currents in the north Indian Ocean
 The monsoon currents in the north Indian Ocean D. Shankar a, P. N. Vinayachandran b, and A. S. Unnikrishnan a a Physical Oceanography Division, National Institute of Oceanography, Dona Paula, Goa 403 004,
What determines the spatial pattern in summer upwelling trends on the U.S. West Coast?
 What determines the spatial pattern in summer upwelling trends on the U.S. West Coast? Hyodae Seo Woods Hole Oceanographic Institution (hseo@whoi.edu) Climate Trends and Projections in the Coastal Environment
Variability in the tropical oceans - Monitoring and prediction of El Niño and La Niña -
 Variability in the tropical oceans - Monitoring and prediction of El Niño and La Niña - Jun ichi HIROSAWA Climate Prediction Division Japan Meteorological Agency SST anomaly in Nov. 1997 1 ( ) Outline
Surface chlorophyll bloom in the Southeastern Tropical Indian Ocean during boreal summer-fall as reveal in the MODIS dataset
 Surface chlorophyll bloom in the Southeastern Tropical Indian Ocean during boreal summer-fall as reveal in the MODIS dataset Iskhaq Iskandar 1 and Bruce Monger 2 1 Jurusan Fisika, Fakultas MIPA, Universitas
Ocean Circulation. Si Hui Lee and Frances Wen. You can access ME at
 Ocean Circulation Si Hui Lee and Frances Wen You can access ME at http://tinyurl.com/oceancirculation Earth - the blue planet - 71% area covered by the oceans - 3/4 of ocean area between 3000-6000m deep
Validation of SST and Windspeed from TRMM using North Indian Ocean Moored Buoy Observations
 Centre for Atmospheric and Oceanic Sciences INDIAN INSTITUTE OF SCIENCE BANGALORE 560 012 Validation of SST and Windspeed from TRMM using North Indian Ocean Moored Buoy Observations Retish Senan, Anitha
Climatology of the 10-m wind along the west coast of South American from 30 years of high-resolution reanalysis
 Climatology of the 10-m wind along the west coast of South American from 30 years of high-resolution reanalysis David A. Rahn and René D. Garreaud Departamento de Geofísica, Facultad de Ciencias Físicas
Effect of Orography on Land and Ocean Surface Temperature
 Present and Future of Modeling Global Environmental Change: Toward Integrated Modeling, Eds., T. Matsuno and H. Kida, pp. 427 431. by TERRAPUB, 2001. Effect of Orography on Land and Ocean Surface Temperature
Seasonal Currents in the Bay of Bengal and Andaman Sea Revealed by Reprocessed Observations
 2012 International Conference on Environment Science and Engieering IPCBEE vol.3 2(2012) (2012)IACSIT Press, Singapoore Seasonal Currents in the Bay of Bengal and Andaman Sea Revealed by Reprocessed Observations
Influence of atmospheric circulation on the Namibian upwelling system and the oxygen minimum zone
 International Liege colloquium Influence of atmospheric circulation on the Namibian upwelling system and the oxygen minimum zone Nele Tim, Eduardo Zorita, Birgit Hünicke 09.05.2014 / University of Liège
(20 points) 1. ENSO is a coupled climate phenomenon in the tropical Pacific that has both regional and global impacts.
 1. ENSO is a coupled climate phenomenon in the tropical Pacific that has both regional and global impacts.") SIO 210 Problem Set 4 Answer key December 1, 2014 Due Dec. 12, 2014 (20 points) 1. ENSO is a coupled climate phenomenon in the tropical Pacific that has both regional and global impacts. (2 points) a)
SIO 210 Problem Set 4 Answer key December 1, 2014 Due Dec. 12, 2014 (20 points) 1. ENSO is a coupled climate phenomenon in the tropical Pacific that has both regional and global impacts. (2 points) a)
Review for the second quarter. Mechanisms for cloud formation
 Review for the second quarter Mechanisms for cloud formation 1 Rising air expands and cools; Sinking air compresses and warms. (18) (24) Dry adiabatic lapse rate (10 o C/km): the rate of temperature decrease
3. Climatic Variability. El Niño and the Southern Oscillation Madden-Julian Oscillation Equatorial waves
 Georges (1998) 3. Climatic Variability El Niño and the Southern Oscillation Madden-Julian Oscillation Equatorial waves ENVIRONMENTAL CONDITIONS FOR TROPICAL CYCLONES TO FORM AND GROW Ocean surface waters
Sea surface salinity variability during the Indian Ocean Dipole and ENSO events in the tropical Indian Ocean
 JOURNAL OF GEOPHYSICAL RESEARCH, VOL. 116,, doi:10.1029/2011jc007456, 2011 Sea surface salinity variability during the Indian Ocean Dipole and ENSO events in the tropical Indian Ocean Gary Grunseich, 1
ENSO and monsoon induced sea level changes and their impacts along the Indian coastline
 Indian Journal of Marine Sciences Vol. 35(2), June 2006, pp. 87-92 ENSO and monsoon induced sea level changes and their impacts along the Indian coastline O.P.Singh* Monsoon Activity Centre, India Meteorological
Air Pressure and Wind
 Air Pressure and Wind 19.1 Understanding Air Pressure Air Pressure Defined Air pressure is the pressure exerted by the weight of air. Air pressure is exerted in all directions down, up, and sideways. The
Climatic and marine environmental variations associated with fishing conditions of tuna species in the Indian Ocean
 Climatic and marine environmental variations associated with fishing conditions of tuna species in the Indian Ocean Kuo-Wei Lan and Ming-An Lee Department of Environmental Biology and Fisheries Science,
Lecture 20. Active-weak spells and breaks in the monsoon: Part 1
 Lecture 20 Active-weak spells and breaks in the monsoon: Part 1 Although the summer monsoon season is the rainy season over most of the Indian region, it does not rain every day, at any place, during the
Atmospheric Forcing and the Structure and Evolution of the Upper Ocean in the Bay of Bengal
 DISTRIBUTION STATEMENT A. Approved for public release; distribution is unlimited. Atmospheric Forcing and the Structure and Evolution of the Upper Ocean in the Bay of Bengal J. Thomas Farrar and Robert
CHAPTER 7 Ocean Circulation
 1 2 3 4 5 6 7 8 9 10 11 12 13 14 CHAPTER 7 Ocean Circulation Words Ocean currents Moving seawater Surface ocean currents Transfer heat from warmer to cooler areas Similar to pattern of major wind belts
Upwelling and Phytoplankton Productivity
 Name: Date: Guiding Questions: Upwelling and Phytoplankton Productivity How does nutrient concentration influence phytoplankton growth in coastal and open ocean waters? What and where are the upwelling
Influence of enhanced convection over Southeast Asia on blocking ridge and associated surface high over Siberia in winter
 5th Session of the East Asia winter Climate Outlook Forum (EASCOF-5), 8-10 November 2017, Tokyo, Japan Influence of enhanced convection over Southeast Asia on blocking ridge and associated surface high
Chapter. Air Pressure and Wind
 Chapter Air Pressure and Wind 19.1 Understanding Air Pressure Air Pressure Defined Air pressure is the pressure exerted by the weight of air. 19.1 Understanding Air Pressure Air Pressure Defined Air pressure
The monsoon currents in the north Indian Ocean
 The monsoon currents in the north Indian Ocean D. Shankar a, P. N. Vinayachandran b, A. S. Unnikrishnan a, and S. R. Shetye a a Physical Oceanography Division, National Institute of Oceanography, Dona
The Ocean is a Geophysical Fluid Like the Atmosphere. The Physical Ocean. Yet Not Like the Atmosphere. ATS 760 Global Carbon Cycle The Physical Ocean
 The Physical Ocean The Ocean is a Geophysical Fluid Like the Atmosphere Three real forces: Gravity Pressure gradients Friction Two apparent forces: Coriolis and Centrifugal Geostrophic & Hydrostatic balances
Atlantic warm pool, Caribbean low-level jet, and their potential impact on Atlantic hurricanes
 GEOPHYSICAL RESEARCH LETTERS, VOL. 34, L02703, doi:10.1029/2006gl028579, 2007 Atlantic warm pool, Caribbean low-level jet, and their potential impact on Atlantic hurricanes Chunzai Wang 1 and Sang-ki Lee
EL NIÑO AND ITS IMPACT ON CORAL REEF ECOSYSTEM IN THE EASTERN INDIAN OCEAN
 CHAPTER C H A P T E R 0334 EL NIÑO AND ITS IMPACT ON CORAL REEF ECOSYSTEM IN THE EASTERN INDIAN OCEAN Lix J. K. 1, Sajeev R. 1, Grinson George 2, Santosh K. M. 1 and Phiros Shah 2 1 Cochin University of
Equatorial upwelling. Example of regional winds of small scale
 Example of regional winds of small scale Sea and land breezes Note on Fig. 8.11. Shows the case for southern hemisphere! Coastal upwelling and downwelling. Upwelling is caused by along shore winds, that
SERIES ARTICLE The Indian Monsoon
 The Indian Monsoon 4. Links to Cloud Systems over the Tropical Oceans Sulochana Gadgil Sulochana Gadgil is an honorary Professor at the Centre for Atmospheric and Oceanic Sciences at the Indian Institute
Remote influence of Interdecadal Pacific Oscillation on the South Atlantic Meridional Overturning Circulation variability
 Remote influence of Interdecadal Pacific Oscillation on the South Atlantic Meridional Overturning Circulation variability 2017 US AMOC Science Team Meeting May 24 th, 2017 Presenter: Hosmay Lopez 1,2 Collaborators:
Observational Studies on Association between Eastward Equatorial Jet and Indian Ocean Dipole
 Journal of Oceanography, Vol. 66, pp. 429 to 434, 2 Short Contribution Observational Studies on Association between Eastward Equatorial Jet and Indian Ocean Dipole PETER C. CHU* Department of Oceanography,
Increasing trend of break-monsoon conditions over India - Role of ocean-atmosphere processes in the Indian Ocean
 Author versions: IEEE Geosci. Remote Sens. Lett.: 6(2); 2009; 332-336 Increasing trend of break-monsoon conditions over India - Role of ocean-atmosphere processes in the Indian Ocean M.R.Ramesh Kumar 1,
TEACHER VERSION: Suggested Student Responses Included. Upwelling and Phytoplankton Productivity
 Name: Date: TEACHER VERSION: Suggested Student Responses Included Guiding Questions: Upwelling and Phytoplankton Productivity How does nutrient concentration influence phytoplankton growth in coastal and
ATMS 310 Tropical Dynamics
 ATMS 310 Tropical Dynamics Introduction Throughout the semester we have focused on mid-latitude dynamics. This is not to say that the dynamics of other parts of the world, such as the tropics, are any
LONG- TERM CHANGE IN PRE- MONSOON THERMAL INDEX OVER CENTRAL INDIAN REGION AND SOUTH WEST MONSOON VARIABILITY
 LONG- TERM CHANGE IN PRE- MONSOON THERMAL INDEX OVER CENTRAL INDIAN REGION AND SOUTH WEST MONSOON VARIABILITY *S.S. Dugam Indian Institute of Tropical Meteorology, Pune-411008 *Author for Correspondence
The Setting - Climatology of the Hawaiian Archipelago. Link to Video of Maui Waves
 The Setting - Climatology of the Hawaiian Archipelago Link to Video of Maui Waves What caused this week s weather? What caused this weekend s weather? Today s Objective: Provide overview and description
Indian Ocean Dipole - ENSO - monsoon connections and Overcoming coupled model systematic errors
 Indian Ocean Dipole - ENSO - monsoon connections and Overcoming coupled model systematic errors Hilary Spencer, Rowan Sutton and Julia Slingo CGAM, Reading University h.spencer@reading.ac.uk Monsoon -
Monsoon Systems Valsavarenche Val d Aosta, Italy
 Dynamics of IO annual and interannual circulation Jay McCreary Alpine Summer School: Monsoon Systems Valsavarenche Val d Aosta, Italy June 8 13, 2009 References 1) (MKM93) McCreary, J.P., P.K. Kundu, and
Far Eastern Pacific Fresh Pool surface salinity variability observed by SMOS and Aquarius sensors over. the period
 Far Eastern Pacific Fresh Pool surface salinity variability observed by SMOS and Aquarius sensors over Nicolas Reul 1, Gael Alory 2, Christophe Maes 3, Serena Illig 3 and Bertrand Chapron 1 1 IFREMER,
Wednesday, September 27, 2017 Test Monday, about half-way through grading. No D2L Assessment this week, watch for one next week
 Wednesday, September 27, 2017 Test Monday, about half-way through grading No D2L Assessment this week, watch for one next week Homework 3 Climate Variability (due Monday, October 9) Quick comment on Coriolis
SUPPLEMENTARY INFORMATION
 doi: 1.138/nature877 Background The main sis of this paper is that topography produces a strong South Asian summer monsoon primarily by insulating warm and moist air over India from cold and dry extratropics.
Influence of a Southern Shift of the ITCZ from Quick Scatterometer Data on the Pacific North Equatorial Countercurrent
 ADVANCES IN ATMOSPHERIC SCIENCES, VOL. 29, NO. 6, 2012, 1292 1304 Influence of a Southern Shift of the ITCZ from Quick Scatterometer Data on the Pacific North Equatorial Countercurrent WU Fanghua 1,2,3
Increasing intensity of El Niño in the central equatorial Pacific
 Click Here for Full Article GEOPHYSICAL RESEARCH LETTERS, VOL. 37,, doi:10.1029/2010gl044007, 2010 Increasing intensity of El Niño in the central equatorial Pacific Tong Lee 1 and Michael J. McPhaden 2
ATS150: Global Climate Change. Oceans and Climate. Icebergs. Scott Denning CSU 1
 The Oceans Wind-Driven Gyre Circulations Icebergs Scott Denning CSU 1 Surface Balance of Forces friction coriolis wind stress resultant current Wind stress accelerates surface water Friction couples surface
Why is the Bay of Bengal less productive during summer monsoon compared to the Arabian Sea?
 Why is the Bay of Bengal less productive during summer monsoon compared to the Arabian Sea? S. Prasanna Kumar, P.M. Muraleedharan, T.G. Prasad 1, M. Gauns, N. Ramaiah, S.N. de Souza, S. Sardesai and M.
INFLUENCE OF ENVIRONMENTAL PARAMETERS ON FISHERY
 Chapter 5 INFLUENCE OF ENVIRONMENTAL PARAMETERS ON FISHERY 5. Introduction Environmental factors contribute to the population dynamics and abundance of marine fishery. The relationships between weather,
2) I think that the paper does not convincingly demonstrate some of the mechanisms it hypothetizes
 I think that the paper does not convincingly demonstrate some of the mechanisms it hypothetizes") Please see the list of changes below (red text) in response to the reviewer comments. Both reviewers have made substantial comments and suggestions to improve the paper which we have addressed these below.
Please see the list of changes below (red text) in response to the reviewer comments. Both reviewers have made substantial comments and suggestions to improve the paper which we have addressed these below.
 1 2 http://ds.data.jma.go.jp/tcc/tcc/index.html http://ds.data.jma.go.jp/tcc/tcc/index.html Climate in Japan World Climate Extratropics Tropics Oceanograhpic conditions World Climate Page 2 Extratropics
Trade winds How do they affect the tropical oceans? 10/9/13. Take away concepts and ideas. El Niño - Southern Oscillation (ENSO)
") El Niño - Southern Oscillation (ENSO) Ocean-atmosphere interactions Take away concepts and ideas What is El Niño, La Niña? Trade wind and Walker circulation. What is the Southern Oscillation? Tropical
El Niño - Southern Oscillation (ENSO) Ocean-atmosphere interactions Take away concepts and ideas What is El Niño, La Niña? Trade wind and Walker circulation. What is the Southern Oscillation? Tropical
Haibo Hu Jie He Qigang Wu Yuan Zhang
 J Oceanogr (2011) 67:315 321 DOI 10.1007/s10872-011-0039-y ORIGINAL ARTICLE The Indian Ocean s asymmetric effect on the coupling of the Northwest Pacific SST and anticyclone anomalies during its spring
Subsurface Ocean Indices for Central-Pacific and Eastern-Pacific Types of ENSO
 Subsurface Ocean Indices for Central-Pacific and Eastern-Pacific Types of ENSO Jin-Yi Yu 1*, Hsun-Ying Kao 1, and Tong Lee 2 1. Department of Earth System Science, University of California, Irvine, Irvine,
OCN 201 Lab Fall 2009 OCN 201. Lab 9 - El Niño
 OCN 201 Lab Fall 2009 OCN 201 Lab 9 - El Niño El Niño is probably one of the most widely publicized oceanic phenomena. If there s one single reason for that it s probably the fact that El Niño s presence
Satellite observations of intense intraseasonal cooling events in the tropical south Indian Ocean
 Click Here for Full Article GEOPHYSICAL RESEARCH LETTERS, VOL. 33, L14704, doi:10.1029/2006gl026525, 2006 Satellite observations of intense intraseasonal cooling events in the tropical south Indian Ocean
Introduction to Oceanography OCE 1001
 Introduction to Oceanography OCE 1001 Lecture Notes Chantale Bégin & Jessica Fry Version 2.1 10. Ocean Circulation (Trujillo, Chapter 7) Major ocean currents are stable and predictable; they have been
Spatial Distribution of Sound Channel and Its Parameters in North Indian Ocean
 Journal of Shipping and Ocean Engineering 5 (2015) 334-340 doi 10.17265/2159-5879/2015.06.007 D DAVID PUBLISHING Spatial Distribution of Sound Channel and Its Parameters in North Indian Ocean K.Ashalatha
332 IEEE GEOSCIENCE AND REMOTE SENSING LETTERS, VOL. 6, NO. 2, APRIL X/$ IEEE
 332 IEEE GEOSCIENCE AND REMOTE SENSING LETTERS, VOL. 6, NO. 2, APRIL 2009 Increasing Trend of Break-Monsoon Conditions Over India Role of Ocean Atmosphere Processes in the Indian Ocean M. R. Ramesh Kumar,
THE northward-propagating intraseasonal oscillations
 206 IEEE GEOSCIENCE AND REMOTE SENSING LETTERS, VOL. 8, NO. 2, MARCH 2011 Diurnal Cycle Induced Amplification of Sea Surface Temperature Intraseasonal Oscillations Over the Bay of Bengal in Summer Monsoon
Advection of deep-sea and coastal water into the HNLC region of the northeast Pacific Ocean
 Advection of deep-sea and coastal water into the HNLC region of the northeast Pacific Ocean William Crawford, Nick Bolingbroke William Crawford, Nick Bolingbroke Inst. Ocean Sciences, Sidney, BC, Canada
Intraseasonal Variability in Sea Level Height in the Bay of Bengal: Remote vs. local wind forcing & Comparison with the NE Pacific Warm Pool
 Intraseasonal Variability in Sea Level Height in the Bay of Bengal: Remote vs. local wind forcing & Comparison with the NE Pacific Warm Pool Shang-Ping Xie 1,3, Xuhua Cheng 2,3, Julian P. McCreary 3 1.
Pathways and Effects of Indonesian Throughflow water in the Indian Ocean using Trajectory and Tracer experiments in an OGCM
 Pathways and Effects of Indonesian Throughflow water in the Indian Ocean using Trajectory and Tracer experiments in an OGCM Vinu K V Ph.D Student Division of Ocean And Atmospheric Sciences, Hokkaido University,
The monsoon currents in the north Indian Ocean
 Progress in Oceanography 52 (2002) 63 120 www.elsevier.com/locate/pocean The monsoon currents in the north Indian Ocean D. Shankar a,, P.N. Vinayachandran b, A.S. Unnikrishnan a a Physical Oceanography
Changes of The Hadley Circulation Since 1950
 Changes of The Hadley Circulation Since 1950 Xiao-Wei Quan, Henry F. Diaz, Martin P. Hoerling (NOAA-CIRES CDC, 325 Broadway, Boulder, CO 80305) Abstract The Hadley circulation is changing in response to
ENSO Cycle: Recent Evolution, Current Status and Predictions. Update prepared by Climate Prediction Center / NCEP 8 March 2010
 ENSO Cycle: Recent Evolution, Current Status and Predictions Update prepared by Climate Prediction Center / NCEP 8 March 2010 Outline Overview Recent Evolution and Current Conditions Oceanic Niño Index
Lightning distribution with respect to the monsoon trough position during the Indian summer monsoon season
 JOURNAL OF GEOPHYSICAL RESEARCH: ATMOSPHERES, VOL. 8, 4780 4787, doi:0.00/jgrd.508, Lightning distribution with respect to the monsoon trough position during the Indian summer monsoon season Ramesh Kumar
Section 6. The Surface Circulation of the Ocean. What Do You See? Think About It. Investigate. Learning Outcomes
 Chapter 5 Winds, Oceans, Weather, and Climate Section 6 The Surface Circulation of the Ocean What Do You See? Learning Outcomes In this section, you will Understand the general paths of surface ocean currents.