Quantitative Risk Assessment Study (QRA) For North of Giza Thermal Power Plant. November Submitted to Ministry of Electricity & Energy
|
|
|
- Justin Elliott
- 6 years ago
- Views:
Transcription


 For")


1 Public Disclosure Authorized Public Disclosure Authorized Public Disclosure Authorized Public Disclosure Authorized Submitted to Ministry of Electricity & Energy Egyptian Electricity Holding Co. Planning, Research, and Electric Service Companies Affairs Counsellor for Environmental Management & Studies Quantitative Risk Assessment Study (QRA) For North of Giza Thermal Power Plant November El Saleh Ayoub St., Zamalek, Cairo, Egypt Tel: Fax: genena@ecoconserv.com URL:
2 TABLE OF CONTENTS 1. Executive Summary General Consequence Modelling Results Risk Assessment Results Risk Reduction Measures Final Conclusion Introduction General Objectives Scope of Work Terms of Reference Report Structure Project Description General Project Details Technical Definitions QRA Methodology Hazardous Events Scenarios Generic Release Scenarios Specific Release Scenarios Hazard Identification (HAZID) Impairment Criteria Flammability Assessment General Suggested Hazard Identification Health Hazard Rating: Flammability Hazard Rating: Reactivity Hazard Rating: Process Hydrocarbons Electrical Fires FRED Consequence Modelling Software Input Consequence Modelling Cases Consequence Analysis Consequence Modelling Cases Identification Major Hazardous Consequences (Graphical Plot Display) Fire and Explosion Consequence Effects Gas Jet Fires Flammable Gas Dispersion (Flash Fire) Flammable Liquid Spill and Pool Fire Explosion Electrical Fire Likelihood Data Process Release Ignition Probability Risk Assessment Introduction to Risk Assessment Individual Risk Societal Risk Page 2/ 165
3 15. Risk Evaluation Risk Reduction Measures (Recommendations) Risk Reduction Measures Uncertainty Analysis References Appendix-1: North Giza Table of Contents Pressurised Release [Fuel Gas] Scenario Summary Jet Fire Pool Chart Dispersion Warnings Pressurised Release [H2 Generation] Scenario Summary Jet Fire Pool Chart Dispersion Warnings Pressurised Release [Fuel Oil Transfer] Scenario Summary Jet Fire Pool Chart Dispersion Warnings Pressurised Release [Fuel Oil Unloading] Scenario Summary Jet Fire Pool Chart Dispersion Warnings Tank Top Fire [Fuel Oil 1] Scenario Summary Tank Top Fire Warnings Tank Top Fire [Fuel Oil 2] Scenario Summary Tank Top Fire Warnings Explosion [Natural Gas inside Turbine Building] Scenario Summary Pressure Decay with Distance Chart Warnings Explosion [NG Building] Scenario Summary Pressure Decay with Distance Chart Warnings Explosion [Natural Gas inside Turbine Building] Scenario Summary Pressure Decay with Distance Chart Warnings Explosion [H2 Building] Scenario Summary Pressure Decay with Distance Chart Warnings Page 3/ 165
4 19.12 Vessel Burst [Steam Drum] Scenario Summary Vessel Burst Vessel Damage Vessel Fire Damage Warnings Vessel Burst [Steam Drum] Scenario Summary Vessel Burst Vessel Damage Vessel Fire Damage Warnings Vessel Burst [Steam Drum] Scenario Summary Vessel Burst Vessel Damage Vessel Fire Damage Warnings Vessel Burst [Steam Drum] Scenario Summary Vessel Burst Vessel Damage Vessel Fire Damage Warnings Fire [Switchgear] Scenario Summary Trench Fire Warnings Fire [Switchgear Control] Scenario Summary Trench Fire Warnings Fire [Control / Electrical Building] Scenario Summary Trench Fire Warnings Fire [Control / Electrical Building] Scenario Summary Trench Fire Warnings Fire [Electrical Building] Scenario Summary Trench Fire Warnings Fire [Transformer] Scenario Summary Trench Fire Warnings Fire [Transformer] Scenario Summary Trench Fire Warnings Fire [Transformer] Scenario Summary Trench Fire Warnings Page 4/ 165
5 19.24 Fire [Transformer] Scenario Summary Trench Fire Warnings Fire [Transformer] Scenario Summary Trench Fire Warnings Fire [Transformer] Scenario Summary Trench Fire Warnings Fire [Warehouse / Workshop] Scenario Summary Trench Fire Warnings Fire [Electrical Building] Scenario Summary Trench Fire Warnings Fire [Office Building] Scenario Summary Trench Fire Warnings Fire [Turbine] Scenario Summary Trench Fire Warnings Fire [Turbine] Scenario Summary Trench Fire Warnings Model Versions Page 5/ 165
6 1. Executive Summary 1.1 General Egyptian Electricity Authority (Ministry Of Electricity) will operate a (2 x 750 MW) Combined Cycle Power Plant at North Giza Area within Cairo geographical area in Egypt. This report presents the Quantitative Risk Assessment (QRA) carried out by EcoConServ for this Combined Cycle Thermal Power plant. EcoConServ is commissioned to perform the Quantitative Risk Assessment (QRA) to identify major risk issues and contributors with a best estimate of the associated levels of risk. This study will be designed to perform main functions: To provide a clear risk knowledge and awareness such that management decisions can be well formed. To act as a coherent stage in, and to define the final scope of the full risk assessment. Conduct the work to provide a full risk assessment in compliance with defined and applied Standards and Guidelines. The QRA study starts by general project description, definitions of technical terms used all through the study and the QRA methodology used in this study. Preliminary hazard identification has been performed in order to identify credible hazards to be further assessed in the Quantitative Risk Assessment (QRA) study. Different types of hazardous event scenarios have been described in details as generic scenarios. Furthermore, specific release scenarios have been identified from different process equipment to be further assessed in details. The materials involved in the different processes have been investigated from flammability and toxicity point of views, in order to identify the most hazardous materials that need to be further assessed in the QRA. The impairment criteria for the effects of different types of fires (involving heat radiation and overpressure waves) on humans and equipment as well as exposure to gases have been adopted for the quantification of risks via impact analysis and vulnerability assumptions. For the purpose of the analysis it has been assumed that the area is an open area, which is not normally manned (unattended) but will be frequently visited by operations and maintenance teams comprising at least two personnel for pre-defined specific tasks. FRED has been selected for the consequence modeling of different types of hazardous consequences mainly flammable and toxic gas dispersion, flash fire, jet fire and explosion simulation. Page 6/ 165
7 FRED is Shell s stat of the art consequence modeling software stands for Fire, Release, Explosion and Dispersion models used to predict the hazardous consequences from accidental release of materials from process, storage or distribution operations. The ignited release scenarios have been identified including the causes of release, causes of ignition, summary of release scenarios as well as current mitigation measures provided in the design. Hydrocarbon release and subsequent immediate and delayed ignition scenarios have been investigated in details comprising gas release, flash fire, unobstructed jet fire, obstructed jet fire, pool fire and explosion (as applicable). 1.2 Consequence Modelling Results The summary of different types of releases and hazardous consequences has been identified in the hazard identification (HAZID) section and are summarized in the following tables: Table 1.1: Summary of Potential Release and Fire Types Material Fire Potential? (Yes / No) Dispersion Jet Fire Flash Fire Explosion Pool Fire Natural Gas Yes Yes Yes Yes No Hydrogen Yes Yes Yes Yes No Fuel Oil (Diesel) No Yes No No Yes Table 1.2: Hazardous Scenarios for Consequence Modelling Scenario Application Flammable Gas Dispersion Natural Gas Hydrogen Jet Fire Natural Gas Hydrogen Fuel Oil Pool fire Fuel Oil Vessel Burst Hydrogen Vessel Steam Vessel Explosion Natural Gas Hydrogen Tank Top Fire Diesel (Fuel Oil) Electrical Fire Switch-Gear Building Switch-Gear Control Building Electrical Building Electrical Control Building Transformer Warehouse Office Building From the HAZID task, two types of hazardous consequences have been identified, mainly the hydrocarbon fires and the non- hydrocarbon fires. Both of them have been included in the consequence modelling. A range of process leak hole size distribution has been selected to be the controlling cases modelled in the QRA. 2-hole sizes have been selected, 1.0 inch hole size representing small leak and 4-inch hole size representing large leak (corresponds to 25-mm and 100-mm). Page 7/ 165
8 Two wind speeds have been selected for modelling the hazardous consequences. 2 m/s and Pasquil stability class "F" representing very stable weather conditions [2F] and wind speed of 10 m/s and Pasquil stability class "D" representing turbulent weather conditions [10D] has been selected to represent extreme weather conditions (stable and turbulent weather conditions respectively). However, only the worst case wind speed has been considered in risk assessment and calculations. The flame lengths and heat radiation distances for (1.58, 4.73, 6.31, 9.46, kw/m²) are selected based on API guidelines. The jet frustum and heat radiation distances are measured in meters from the point of release. Table 1.3 Jet Frustum Length (Jet Flame Lengths) Distances Material Pressure (Bara) Hole Size Jet Flame Lengths (mm) (Meter) Natural Gas Hydrogen Solar (Fuel Oil) The flammable gas dispersion distances have been calculated in terms of Lower Flammability Limits (LFL) and Upper Flammability Limits (UFL). Effects from flash and jet fires have been investigated against impairment criteria adopted. The flammable gas dispersion has been presented as release contours plotted graphically on the process plan. Table 1.4 Flammable Gas Dispersion Distances (Flash Fires) Flammability distances (Meter) Material Pressure (Bara) [100mm and 10D] LFL UFL Fuel Gas Natural Gas Hydrogen The pool fire heat radiation distances are modelled in terms of (1.58, 4.73, 6.31, 9.46, kw/m²) measured in meters based on the flame base length. Table 1.5 Pool Fire Flame Distances (Meters) Material Pressure (Bara) Hole Size (mm) Flame Lengths (Meter) Fuel Oil (Diesel) The overpressure wave's distances are measured in terms of (mbar). From the consequence simulation results, the distances of the overpressure waves are presented in the following table: Table 1.6 Overpressure waves Distances for Fuel Gas Compressors Overpressure (mbar) Distances in Meters Page 8/ 165
9 Table 1.7 Overpressure waves Distances for Fuel Gas Turbines Overpressure (mbar) Distances in Meters Table 1.8 Overpressure waves Distances for Hydrogen Overpressure (mbar) Distances in Meters The electrical fire (flame length) and heat radiation distances (1.58, 4.73, 6.31, 9.46, kw/m²) are measured in meters. Table 1.9 Electrical Fire Flame Distances Scenario Flame Base Length (Distances in Meters) Switch Gear Building Electrical Fire 20 Switch Gear Control Building Electrical Fire 5 Electrical Building Electrical Fire 5 Electrical Control Building Electrical Fire 10 Transformer Electrical Fire 10 Warehouse Electrical Fire 20 Office Building Electrical Fire Risk Assessment Results Only the worst case release scenarios resulted from largest leak sizes have been included in the calculations in order to present conservative results. Generic process release failure frequencies (failure rates), have been identified in details from past case history and published equipment failure data books in order to be utilized in the release scenario development. Risks have been calculated based on the FRED software consequence modelling output adopting the international risk acceptance criteria and the international risk management guidelines as a reference. Both individual and societal risks have been assessed in the risk assessment. Then the individual risk assessment has been calculated and summarized as follows: Table 1.10: Individual Risk Assessment No. Scenario Location Individual Risk 1.0 Loss of containment In-site 1.77E Loss of containment Off-site Not Reached Page 9/ 165
10 The societal risk / group risk has been derived from the individual risk considering the group exposure values. Hence, the societal risk has been calculated and summarized as follows: Table 1.11: Societal Risk Assessment No. Scenario Location Societal Risk 1.0 Loss of containment In-site 3.54E Loss of containment Off-site Not Reached Based on international risk acceptance criteria and the calculated risk figures, it has been observed that the risk to the individual (worker) and to the societal (public / group of workers) falls within the (ALARP) region. Both individual and societal risk acceptance criteria can be summarized as follows: Table 1.12: Risk Acceptance Criteria Individual Risk Risk Acceptance Societal Risk Risk Acceptance 1.77E-04 ALARP 3.54E-04 ALARP Uncertainty analysis has been performed to define the uncertainty data in the input model, underestimation of consequences, neglected items, assumed points, exaggeration or overestimation. As a result, there is no uncertainty in the QRA calculations and all the calculated risks are certain. 1.4 Risk Reduction Measures Since the calculated risks fall within the ALARP region, hence there is a need for risk reduction measures required to reduce the calculated risks. These risk reduction measures (recommendations) are proposed and summarized as follows: Assuming the prevailing wind direction for the proposed location is within the range from the North to North West (300 o to 360 o ), the current proposed plot plan is not complying with international codes and standards (I.e. Global Asset Protection GAP Guidelines) from equipment location, arrangements and safe spacing point of view. As a minimum the following shall be considered in the layout design: - All normally occupied buildings and critical services building shall be located in the upwind direction (e.g. administration, offices, control, firefighting, switchgear, electrical etc). - All sources of spark and ignition shall be located in the upwind direction (same as above). - All sources of leaks, fires and explosions shall be in the located downwind direction (e.g. all process areas and all storage areas). - All equipment spacing (safe distance between equipment and adjacent equipment) and unit spacing (safe distance between unit and adjacent unit) to comply with international codes and standards (I.e. Global Asset Protection GAP Guidelines). Ensure that emergency shutdown system ESD (I.e. block isolation valves) are connected to fire and gas detection system, and placed in a safe strategic place protected from hazardous Page 10/ 165
11 consequences (e.g. fires or explosions) for personnel intervention in case of emergency in order to isolate the process equipment as soon as possible. Ensure emergency response plans (contingency plans) are in place and including scenario specific response actions for all potential major hazardous scenarios. It is recommended to have an elevated wind sock installed at the site, which can be seen from the control room and from outside the fence to determine the direction of gas migration in case of major gas leak. Ensure smoke detectors are provided within electrical enclosures in order to provide early detection of electrical fires. Ensure rotating equipment vendor (e.g. turbine, generator etc supplier) will deliver failure mode and effect analysis study for each equipment. Ensure key project drawings (piping and instrumentation diagrams P&IDs) are subjected to design review and HAZOP by expert third party. Ensure periodical emergency drills (fire, escape and evacuation drills) are performed on regular basis for workers. It is recommended to have a bund wall (dike area) surrounding all storage areas to prevent spread of liquid spills in case of emergency. First aid kits, safety shower, eye wash and dilute solutions to be available in all processing points to be applied in case of chemical spillage. Ensure portable gas detectors are provided within the site in order to facilitate manual gas leak monitoring and regular leakage checks. Special personal protective equipment (PPE) suitable for hazardous chemicals according to the MSDS to be provided. As a minimum, full suit (coverall), gloves, goggles, safety helmet and safety boots. 1.5 Final Conclusion As a final conclusion, the risk from the new facilities are within the ALARP limits for the industrial and public areas and risk reduction measures (recommendations) have been proposed in order to reduce the risk to the lowest practical limit. By ensuring that all risk reduction measures (recommendations) are in place and emergency procedures are strictly followed, it is assumed that the risk will be within the tolerable limits and (safeto-operate). Page 11/ 165
12 2. Introduction 2.1 General Egyptian Electricity Authority (Ministry Of Electricity) will operate a (2 x 750 MW) Combined Cycle Power Plant at North Giza Area within Cairo geographical area in Egypt. This report presents the Quantitative Risk Assessment (QRA) carried out by EcoConServ for this Combined Cycle Thermal Power plant. EcoConServ is commissioned to perform the Quantitative Risk Assessment (QRA) to identify major risk issues and contributors with a best estimate of the associated levels of risk. 2.2 Objectives EcoConServ has set out the main objectives of the risk assessment to include the following: To identify, assess and quantify risks to the general public, Client operations stuff and others. To comprehensively examine the ways in which the identified risks can be eliminated or reduced. To recommend practical risk reduction and/or mitigation measures for consideration. To determine the residual risks and recommend practical control measures as necessary. 2.3 Scope of Work In general, the work will cover, but not be limited to the following: Define data to be provided by Client. Review available process data provided. Perform physical survey of the process area and adjacent areas. Define possible accident scenarios and events. Conduct a full consequence analysis in relation to gas leaks and fire/explosion scenarios. Perform quantitative / quantitative risks assessment. Conduct calculations for individual and societal risks as well as ALARP demonstration. Page 12/ 165
13 Define possible risk elimination / reduction measures. Propose residual risk control measures. 2.4 Terms of Reference EcoConServ will perform a quantitative risk assessment to identify the major risk issues and contributors with a best estimate of the associated levels of risk. This study will be designed to perform main functions: To provide a clear risk knowledge and awareness such that management decisions can be well formed. To act as a coherent stage in, and to define the final scope of the full risk assessment. Conduct the work to provide a full risk assessment in compliance with defined and applied International Standards and Guidelines. 2.5 Report Structure The report structure is as follows: 1. Executive Summary 2. Introduction 3. Project Description 4. Technical Definitions 5. QRA Methodology 6. Hazardous Events Scenarios 7. Hazard Identification (HAZID) 8. Impairment Criteria 9. Flammability Assessment 10. FRED Consequence Modelling Software Input 11. Consequence Modelling Cases 12. Fire and Explosion Consequence Effects 13. Likelihood Data Page 13/ 165
14 14. Risk Assessment 15. Risk Evaluation 16. Risk Reduction Measures (Recommendations) 17. Uncertainty Analysis 18. References 19. Appendix-1: FRED Simulation Cases Detailed Results Page 14/ 165
. The remaining heat (e.g. hot exhaust fumes) from combustion is generally wasted.")
15 3. Project Description 3.1 General A combined cycle is characteristic of a power producing engine or plant that employs more than one thermodynamic cycle. Heat engines are only able to use a portion of the energy their fuel generates (usually less than 50%). The remaining heat (e.g. hot exhaust fumes) from combustion is generally wasted. Combining two or more "cycles" such as the Brayton cycle and Rankine cycle results in improved overall efficiency. It can also work with the Otto, diesel, and Crower cycles which may allow it to be suited to automotive use. Aside from the Rankine cycle, the Stirling cycle could also be used to re-use waste heat in automotive or aeronautical applications, for the simple reason that there is less weight (water) to carry and that stirling engines or turbines can be made to operate with low temperature differences. In a combined cycle power plant (CCPP), or combined cycle gas turbine (CCGT) plant, a gas turbine generator generates electricity and the waste heat is used to make steam to generate additional electricity via a steam turbine; this last step enhances the efficiency of electricity generation. The gas turbine cycle has a compressor, a combustor and a turbine. For gas turbines the amount of metal that must withstand the high temperatures and pressures is small, and lower quantities of expensive materials can be used. In this type of cycle, the input temperature to the turbine (the firing temperature), is relatively high (900 to 1,400 C). The output temperature of the flue gas is also high (450 to 650 C). This is therefore high enough to provide heat for a second cycle which uses steam as the working fluid; (a Rankine cycle). In a combined cycle power plant, the heat of the gas turbine's exhaust is used to generate steam by passing it through a heat recovery steam generator (HRSG) with a live steam temperature between 420 and 580 C. The condenser of the Rankine cycle is usually cooled by water from a lake, river, sea or cooling towers. This temperature can be as low as 15 C. Figure 3.1: Working principle of a combined cycle power plant Page 15/ 165
16 Figure 3.2: Combined cycle power plant main components 3.2 Project Details Egyptian Electricity Authority (Ministry Of Electricity) will operate a (2 x 750 MW) Combined Cycle Power Plant at North Giza Area within Cairo geographical area in Egypt. The facility will be designed to include a power block consisting of two Combustion Turbine Generator (CTG), each feeding exhaust gases to its respective Heat Recovery Steam Generators (HRSG). Steam from the two HRSGs will be fed to one condensing steam turbine generator (STG). An inlet air filtration system will be included to supply suitably filtered combustion air to CTG's. The steam exhausted from the steam turbine will be fed into once-through cooling, single-pass, divided water box condenser. Power will be generated at manufacturer's standards voltage in the CTGs and the STG. Stepped up through main transformers, and fed to the utility grid via a 220 KV. The proposed plot plan is presented in the figure below: Page 16/ 165

17 Figure 3.3: Proposed Plot Plan Page 17/ 165
18 The process pressures are summarized in the following table: Table 3.1: Process Conditions No. Description Real Value Modelled Value 1. Fuel Gas (Natural Gas) Compressor discharge pressure 27 Bar Fuel Oil (or Diesel) Pump discharge pressure 15 Bar Hydrogen Generation (H2 Bottles) maximum pressure 126 Bar Steam Drum pressure (Maximum steam pressure in the overall loop) 156 Bar 160 Page 18/ 165
19 4. Technical Definitions Confinement A qualitative or quantitative measure of the enclosure or partial enclosure areas where vapors cloud may be contained. Congestion A qualitative or quantitative measure of the physical layout, spacing, and obstructions within a facility that promote development of a vapor cloud explosion. ESD Emergency Shut Down FRA Fire Risk Assessment Gas cloud dispersion Gas cloud air dilution naturally reduces the concentration to below the LEL or no longer considered ignitable (typically defined as 50% of the LEL). Hazard An inherent physical or chemical characteristic (flammability, toxicity, corrosivity, stored chemical or mechanical energy) or set of conditions that has the potential for causing harm to people, property, or the environment. Individual risk The risk to a single person inside a particular building. Maximum individual risk is the risk to the most-exposed person and assumes that the person is exposed. QRA Quantitative Risk Assessment Risk Relates to the probability of exposure to a hazard, which could result in harm to personnel, the environment or general public. Risk is a measure of potential for human injury or economic loss in terms of both the incident likelihood and the magnitude of the injury or loss. Risk assessment The identification and analysis, either qualitative or quantitative, of the likelihood and outcome of specific events or scenarios with judgments of probability and consequences. Vapor cloud explosion (VCE) An explosion in air of a flammable material cloud Page 19/ 165
20 5. QRA Methodology The QRA study shall be performed according to the general methodology presented in the following figure: Data Failure Case Definition Identify Hazards Scenario Development Frequency Analysis Analysis of Consequences Impact Assessment Estimate/ Measure Risks Evaluate Risks Tolerability Criteria Verify Decide Risk Reduction Measures Figure 5.1: Quantitative Risk Assessment Methodology (Flow Chart) Page 20/ 165
21 The QRA Study will address the identification, analysis and subsequent assessment of major hazards associated with the proposed facilities under study, and make judgment on the tolerability of risks to personnel associated with these hazards and the public. Scenarios that could result in major hazards will be identified and evaluated using Quantitative Risk Assessment "QRA". This technique is used to establish the expected frequency of such incidents and their consequences. Several commercial software tools are available for consequences modeling of dispersion, fire and explosion will be selected for modeling flammable/toxic hydrocarbon leaks. FRED is the state of the art Shell's consequence modeling software will be used to predict the consequences of the accidental release of hydrocarbon. A consequence modeling is one of the key steps in Quantified Risk Assessment QRA. It provides the link between identifying potential loss of containment incidents and determining the impact of these incidents. The consequence models developed are based on the hazards identified as resulting from different release scenarios, i.e. Un-ignited flammable/toxic releases; Jet flames; Explosion overpressure / Vessel burst. The hazard ranges are dependent upon the condition of the release pressure and rate of release. Detailed study and review of all aspects related to the facility will be made where risks will be evaluated which in turn becomes an important input in determining the requirements for any remedial work. Review would cover: Company Policy, Standards and Design Criteria. The Sources of hazards. Events which are capable to cause major accidents. Analysis of the consequences and their effects on employees and the public. Evaluation of individual and societal risks. Measures to prevent, control and minimize likely consequences. Emergency procedures and emergency systems. From these studies, risk reduction measures are identified and improvements to management systems are considered. Page 21/ 165
22 6. Hazardous Events Scenarios 6.1 Generic Release Scenarios Events associated with release, dispersion and ignition of flammable releases considered in this study can be summarized in the following figure. Release Yes Ignites? No Dispersing cloud Yes Ignites? No More obstacles Greater confinement Flame acceleration Jet fire Pool fire Cloud fire Fast flame Internal explosion Safe dispersion Impinge? Yes Structural Failure BLEVE These events can be more detailed as follows: Figure 6.1 Hazardous events Jet fires A jet fire will result from an ignited pressurized hydrocarbon gas release. The consequence of jet fires is directional depending on the on release orientation. Jet fires typically have flame temperature of about 2,200 o F and can produce high intensity thermal radiation. The high temperature poses a hazard from direct effects of heat on humans and also from possibility of escalation. If a jet flame impinges upon a target such as a vessel, pipe or structural member, it can cause failure of the item to fail within several minutes. Jet (spray) fire will also result from ignited continuous releases of pressurized flammable liquid. The momentum of the release carries the material forwards in a plume entraining air to give a flammable mixture as gas is released from the plume. Page 22/ 165
23 Flash fires If flammable gas accumulates in an unconfined area and is ignited, then the result will be a flash fire within the flammable limits of the vapour cloud. Explosions Ignition of accumulated gas in semi-confined areas may also be accompanied by an explosion; the overpressure generated will depend on the degree of congestion and confinement of the process area, and the gas cloud size. Pool fires If a liquid release is ignited after it has time to form a pool, a pool fire results. Because they are less well aerated, pool fires tend to have lower flame temperatures and produce lower levels of thermal radiation than jet fires. They also produce more smoke. Although a pool fire can still lead to structure failure of items within the flame, this would take longer than in a jet fire. An additional hazard of pool fires is their ability to flow. A burning liquid pool can spread along horizontal surface or run down a vertical surface to give a running fire. BLEVE (Fire Ball) BLEVE stands for Boiling Liquid Expanding Vapour Explosion. A fire ball can occur if a vessel containing fuel ruptures in the presence of an ignition source (usually a jet or pool fire). A fraction of the liquefied fuel subsequently released will evaporate immediately and take part in a huge fireball, which has the shape of a hemispherical burning cloud or ball of fire. High degree of turbulent mixing and rapid air entrainment allows large quantities of fuel to be consumed in a short period of time. Structural failure Loss of structure integrity due to overheating of structure members. The structure shall collapse under much lower load than the designed due to increased temperature. Safe dispersion Dilution of the released gases beyond the lower flammability limits (LFL) leading to safe dispersion situation. Page 23/ 165
24 6.2 Specific Release Scenarios The following are the different types of hazardous scenarios envisaged in the new facility: Leakage of gas from equipment / pipe flanges, followed by immediate ignition resulting in a gas jet fire. The jet fire is a high momentum directed fire. Fighting such jet fires (with fire water or other fighting media) is not effective. Details of the ESD system needs to be provided, as if the ESD System will automatically shut-off the gas supply on confirmed gas or fire detection, duration of this scenario will be relatively short depending on the isolation time. If ESD system is not provided, the expected duration of such fires is considerably long due to high trapped inventory which shall feed the fire (considered as un-isolatable section). Leakage of gas from equipment / pipe flanges, if un-ignited, can result in the formation of a vapour cloud. This cloud is likely to remain partly in the area depending on weather conditions and wind velocity and direction. Subsequently, if this stagnant cloud finds a source of ignition and if the composition of the cloud is within the flammability limits of the gas, explosion or flash fire can occur. Fire protection is not suitable for this scenario, as the explosion or flash fire scenario is estimated to be very short in terms of seconds. The over-pressure created by such explosion is considered negligible if the proposed facilities are outdoor due to very low congestion in an unconfined open area. However if the explosion occur indoors, the over-pressure created by such confined explosion is considerable due to congestion in confined area. Leakage of liquid from equipment / pipe flanges, if un-ignited, can result in the formation of a liquid pool. This pool is likely to remain in the area depending on the area topography and provision of bunding / diking. Subsequently, if this pool finds a source of ignition, pool fire can occur. Fire protection is suitable for this scenario, as the pool fire will be under control. Summary of different types of releases and hazardous consequences are summarized in the following table: Table 6.1: Summary of Potential Fire Source Locations by Fire Type Material Fire Potential? (Yes / No) Dispersion Jet Fire Flash Fire Explosion Pool Fire Natural Gas Yes Yes Yes Yes No Hydrogen Yes Yes Yes Yes No Fuel Oil (Diesel) No Yes No No Yes Page 24/ 165
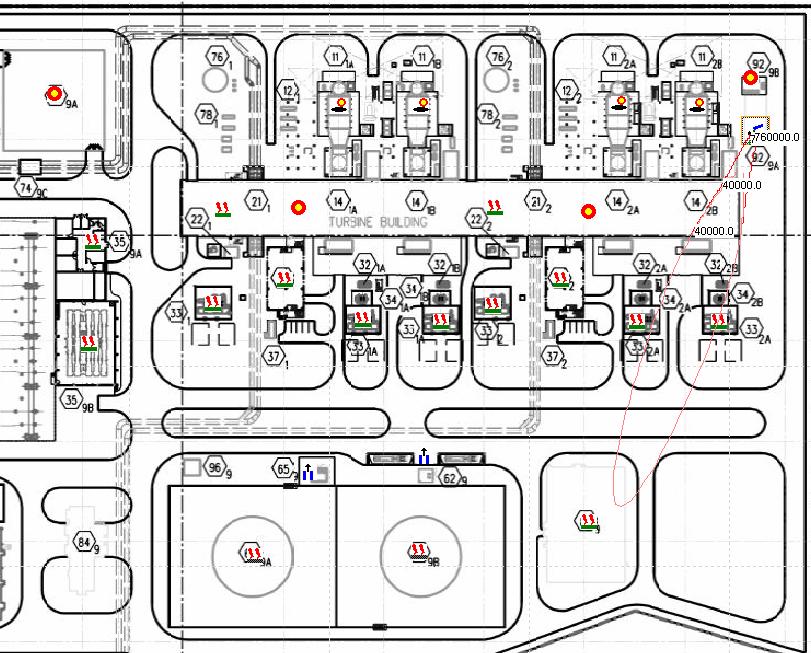
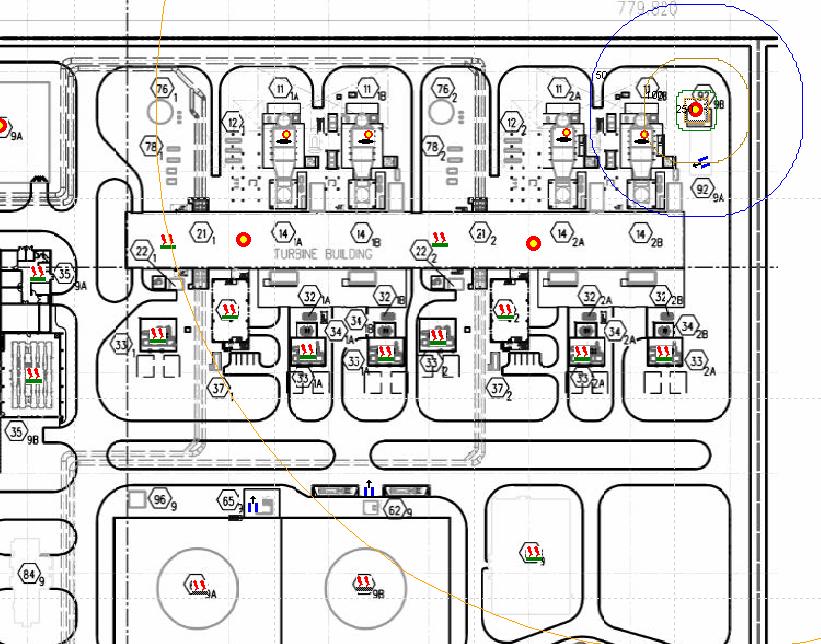
25 7. Hazard Identification (HAZID) HAZID is a general term used to describe an exercise whose goal is to identify hazards and associated events that have the potential to result in a significant consequence. HAZID may be conducted to identify potential hazards, which could result in consequences to personnel (e.g. injuries and fatalities), environmental (oil spills and pollution), and financial assets (e.g., production loss/delay). HAZID technique can be applied to all or part of a facility or vessel or it can be applied to analyze operational procedures. The following table represents the HAZID performed for this project. Table 7.1: Hazard Identification (HAZID) System Cause Consequence Fuel Gas Loss of High pressure flammable gas will form gas cloud if not ignited. Compressors containment due to equipment / pipe High pressure flammable gas may lead to jet fire if ignited leak or total instantaneously. rupture. Flammable gas cloud lead may lead to flash fire if ignited after some time. Hydrogen Generation System Loss of containment due to equipment / pipe leak or total rupture. Flammable gas cloud lead may lead to an explosion if ignited after some time within congested area. High pressure flammable gas will form gas cloud if not ignited. High pressure flammable gas may lead to jet fire if ignited instantaneously. Flammable gas cloud lead may lead to flash fire if ignited after some time. Flammable gas cloud lead may lead to an explosion if ignited after some time within congested area. Fuel Oil Loss of Flammable liquid will form flammable liquid pool if not ignited. Pumps containment due to equipment / pipe Flammable liquid will form pool fire if ignited. leak or total rupture. High pressure flammable liquid will form flammable liquid jet fire if ignited instantaneously. Fuel Oil Ignition at the tank Tank top fire. Storage Tanks roof. Steam Drum Overpressure Vessel burst scenario with no flammable materials released. Electrical Enclosures Short circuit, spark Electrical fire. or failure The identified hazardous scenarios are graphically plotted on the plot plan as appears in the following figure: Page 25/ 165

26 Figure 7.1: Graphical Plot of Potential Hazardous Scenarios The identified hazardous scenarios will be further analyzed in the consequence modelling and risk assessment sections. Page 26/ 165
27 8. Impairment Criteria This section defines the human injury and asset impairment criteria in caring out the consequence analysis of the identified hazardous events scenarios on the proposed facilities. The following table represents standard human impact criteria as applied in consequence modelling. Table 8.1: API Recommended Design Total Radiation Permissible Design Level (K) British Thermal Kilowatts per Units Square per Hour per Meter Square Foot (BTU/hr/ft 2 ) (KW/m 2 ) Conditions Heat intensity on structures and in areas where operators are not likely to be performing duties and where shelter from radiant heat is available (for example, behind equipment). Value of K at design flare release at any location to which people have access (for example. at grade below the flare or a service platform of a nearby tower); exposure should be limited to a few seconds, sufficient for escape only. Heat intensity in areas where emergency actions lasting up to 1 minute may be required by personnel with out shielding but with appropriate clothing. Heat intensity in areas where emergency actions lasting several minutes may be required by personnel without shielding but with appropriate clothing Value of K at any location where personnel with appropriate clothing may be continuously exposed The criteria applied for assessment of the effects of fire on assets are summarised in the following table: Table 8.2: Criteria for Assessment of Fire Effects on Humans Radiation Heat Flux Time to Pain Threshold Time for Second-Degree Burns Btu/hr-ft 2 kw/m 2 Sec Sec Note: Burns occur relatively quickly once the pain threshold is achieved Page 27/ 165
28 Both jet fires and explosions can lead to structure failure of items, though this will take several times longer for jet fires than for explosions. The following table presents indicative failure times under hydrocarbon fire impact conditions, where times to failure refer to burn through or loss of load bearing capacity. Table 8.3: Structure Failure times in Fires (Indicative) Component Time to Failure (Min) Jet Fire Pool Fire Unprotected structural steel beam Unprotected steel plate 5 10 A-60 firewall H-120 firewall The following table reports published information on the explosion overpressure effects. Table 8.4: Explosion Overpressure Effects Explosion Overpressure Bar(g) Damage No structural damage Loud noise similar to sonic boom, occasional glass breakage % Window shattering % Window shattering Most windows shattered, occasional damage to frames 0.07 Collapse of roof of a tank Connection failure of corrugated paneling Slight distortion of steel framework of clad building Wall of concrete blocks shattered 0.2 Collapse of steel framework Collapse of self-framing steel panel building Ripping of empty oil tanks Small deformations on pipe bridge Big trees topple over 0.3 Paneling torn-off Displacement of pipe bridge, failure of piping Damage to distillation columns Collapse of pipe bridge 0.5 Brick wall ( m thick) shattered Movement of round tank, failure of connecting piping The gas dispersion, flash fire diameters (the distance to the lower flammability limits), heat radiation contours and overpressure contours are estimated using FRED consequence modelling software package. Page 28/ 165
29 9. Flammability Assessment 9.1 General An assessment of all flammable and combustible materials present on the facilities is required to determine those materials that can be excluded from further assessment in the QRA due to low flammability and hence the low probability of ignition. In order for a fire to start there must be an ignition source of sufficient heat intensity to cause ignition. However, after a fire has started, the heat necessary to sustain combustion is typically supplied by the combustion process. A flammable gas or vapour burns in air only over a limited concentration range. Below a certain concentration in air, the Lower Flammability Limit (LFL), the mixture is too lean, and above a certain concentration in air, the Upper Flammability limit (UFL), the mixture is too rich to sustain combustion. The concentrations between these limits constitute the flammable range. Flammability limits vary between hydrocarbon gases. For example, methane is flammable between 5-15% v/v and propane between % v/v. Process streams consist of a mixture of hydrocarbons have different flammability limits depending on the composition of the hydrocarbon mixture that is released to air. The flash point of a flammable liquid is the temperature at which the vapour pressure is sufficient to result in a concentration of vapour in air above the liquid corresponding to the lower flammable limit. On loss of containment or where open to the atmosphere, a hydrocarbon liquid that has a flash point below ambient temperature is readily ignitable. A liquid with a high flash point, could also ignite if raised in temperature above its flash point by an external heat source, if released as a high pressure spray that promotes vaporisation, or if soaked into lagging (insulating materials). Flash point is the main parameter in the hazard classification of flammable liquids. 9.2 Suggested Hazard Identification The increased use of chemicals, many of which introduced hazards other than flammability, led to the need for a simple hazard identification system that could be immediately recognized by emergency response personnel. This need led to the development of the Hazard Identification System. This system is a standard system for the Identification of the Fire Hazards of Materials. The system provides simple, readily recognized, and easily understood markings that give, at a glance, a general idea of the inherent hazards of the material and the order of severity of these hazards, as they relate to fire protection, exposure, and control. The system's objectives are to provide an appropriate alert signal and on-the-spot information to safeguard the lives of both public and private emergency response personnel. The system also assists in planning for effective fire fighting operations and may be used by plant design engineers and plant protection and safety personnel. The system identifies the hazards of a material in terms of three categories: "Health," "Flammability," and "Reactivity." It indicates the order of severity of these hazards by means of a numerical rating of 0, indicating no special hazard, to 4, indicating extreme hazard. The five degrees of hazard were Page 29/ 165
30 decided upon as necessary to give the required information. Finally, the system had to be relatively simple and readily understood. Degree of Hazard: The columns under "suggested Hazard Identification" in this method give the severity ratings for each of the hazard categories for which information was available. Blank spaces indicate that sufficient information was not available for a severity rating to be assigned. It should be understood that the assignment of the ratings is based on judgment and that extenuating circumstances in plants and processes may dictate a change in any individual rating. The following commentary on the degrees of hazard is an interpretation of the Standard System for the Identification of the Fire Hazards of Materials, and is specifically related to fire protection. Page 30/ 165
31 9.3 Health Hazard Rating: In general, the health hazard in fire fighting is that of a single exposure that may vary from a few seconds to as much as an hour. The physical exertion demanded in fire fighting operations or other emergencies may be expected to intensify the effects of any exposure. Only hazards arising out of the inherent properties of the material are considered. The following information on five degrees of hazard relate to the protective equipment normally available to fire fighters. Table 9.1: Health Hazard Rating 4 Materials that, on very short exposure, could cause death or major injury, including those that are too dangerous to be approached without specialized protective equipment. A few whiffs if the vapour or gas can cause death, or contact with the vapour or liquid may be fatal, if it penetrates the fire fighter's normal protective gear. The normal full protective clothing and breathing apparatus available to the typical fire fighter will not provide adequate protection against inhalation or skin contact with these materials. 3 Materials that, on short exposure, could cause serious or temporary or residual injury, including those requiring protection from all bodily contact. Fire fighters may enter the area only if they are protected from all contact with the material. Full protective clothing, including self-contained breathing apparatus, coat, pants, gloves, boots, and bands around legs, arms, and waist, should be provided. No skin surface should be exposed. 2 Materials that, on intense or continued (but not chronic) exposure, could cause temporary incapacitation or possible residual injury, including those requiring the use of respiratory protective equipment that has an independent air supply. These materials are hazardous to health, but areas may be entered freely if personnel are provided with full-face mask selfcontained breathing apparatus that provides complete eye protection. 1 Materials that, on exposure, could cause irritation, but only minor residual injury, including those requiring the use of an approved air-purifying respirator. These materials are only slightly hazardous to health and only breathing protection are needed. 0 Materials that, on exposure under fire conditions, offer no hazard beyond that of ordinary combustible material. Page 31/ 165
32 9.4 Flammability Hazard Rating: Susceptibility to ignition and burning is the basis for assigning the degree of hazard within this category. The method of attacking the fire influenced by this susceptibility factor. The following information is based on the definition of Flammability Hazard Rating, Standard System for the Identification of the Fire Hazards of Materials. Table 9.2: Flammability Hazard Rating 4 This degree includes flammable gases, pyrophoric liquids, and Class IA flammable liquids. The preferred method of fire attack is to stop the flow of material or to protect exposures while allowing the fire to burn itself out. 3 This degree includes Class IB and IC flammable liquids and materials that can be easily ignited under almost all normal temperature conditions. Water may be ineffective in controlling or extinguishing fires in such materials. 2 This degree includes materials that must be moderately heated before ignition will occur and includes Class II and IIIA combustible liquids and solids and semi-solids that readily give off ignitable vapours. Water spray may be used to extinguish fires in these materials because the materials can be cooled below their flash points. 1 This degree includes materials that must be preheated before ignition will occur, such as Class IIIB combustible liquids and solids and semi-solids whose flash point exceeds 200 F (93.4 C), as well as most ordinary combustible materials. Water may cause frothing if it sinks below the surface of the burning liquid and turns to steam. However, a water fog that is gently applied to the surface of the liquid will cause frothing that will extinguish the fire. 0 This degree includes any material that will not burn. Page 32/ 165
33 9.5 Reactivity Hazard Rating: The assignment of the degree of reactivity hazard is based on the potential of the material to release energy either by itself or when in contact with water. In assigning this rating, fire exposure was considered, along with exposure to shock and pressure. The following information is based on the definitions of Reactivity Hazard Rating contained in the Standard System for the Identification of the Fire Hazards of Materials. Table 9.3: Reactivity Hazard Rating 4 This degree includes those materials that, in themselves, are readily capable of denotation, explosive decomposition, or explosive reaction at normal temperatures and pressures. This includes materials that are sensitive to localized mechanical or thermal shock. If a material having this Reactivity Hazard Rating is involved in an advanced or massive fire, the area should be immediately evacuated. 3 This degree materials that, in themselves, are capable of denotation, explosive decomposition, or explosive reaction, but require a strong initiating source or heating under confinement. This includes materials that are sensitive to thermal and mechanical shock at elevated temperatures and pressures and materials that react explosively with water. Fires involving these materials should be fought from a protected location. 2 This degree includes materials that are normally unstable and readily undergo violent chemical change, but are not capable of denotation. This includes materials that can undergo chemical change with rapid release of energy at normal temperatures and pressures and materials that can undergo violent chemical changes at elevated temperatures and pressures. This also includes materials that may react violently with water or that may form potentially explosive mixtures with water. In advanced or massive fires involving these materials, fire fighting should be done from a safe distance or from a protected location. 1 This degree includes materials that are normally stable, but that may become unstable at elevated temperatures and pressures and materials that will react with water with some release of energy, but not violently. Fires involving these materials should be approached with caution. 0 This degree includes materials that are normally stable, even under fire exposure conditions, and that do not react with water. Normal fire fighting procedures may be used. Page 33/ 165
34 9.6 Process Hydrocarbons The process materials proposed in this project are listed as follows: Natural Gas, Fuel oil (Diesel), Hydrogen, Sodium hypo-chlorite. The properties of the various flammable materials present on the facilities are summarised in the Table below. The flammability of the various inventories is discussed in further detail in the following sections. Table 9.4 Hazard Classification and Physical Properties of Process Inventories Material Flash Point Ignition Temp. Flammable Limits (% Vol.) Sp. Gr. Vapour Density Boiling Point F (C) F (C) Lower Higher Water=1 Air=1 F (C) Water Soluble Extinguishing Method Health Hazard Identification Flammability Reactivity Natural Gas (537) (-162) No Fuel Oil (Diesel) 150 (66) 640 (338) <1-700 (371) No Hydrogen - Sodium hypochlorite 932 (500) (-252) 214 (101) Slight Yes The major components of the process inventories are Natural Gas, Fuel oil (Diesel), Hydrogen and Sodium Hypochlorite. As a result of the hazard classification of the process hydrocarbon inventories, Fuel oil (Diesel) is classified as flammable while Hydrogen and Natural Gas are classified as highly flammable, the Sodium Hypochlorite is classified as not flammable corresponding to NFPA Flammability Index rating, hence will not be considered in the consequence modelling. Based on this rating the fire, explosion and toxicity hazards associated with the process inventories will be further assessed in the QRA. 9.7 Electrical Fires NFPA Flammability Index = N/A Electrical faults can cause overheating, sparking and a fire. However, electrical fires are only likely to have minor, localised impact. Smoke/fire detection and active fire protection should be effective in controlling such incidents. Escalation of electrical fires to process areas is unlikely, because the electrical equipment are segregated by enclosures from other areas and hence the risk from electrical fires is assessed as insignificant and does not warrant further assessment within the QRA study. However, electrical faults will be considered as a potential cause of ignition of hydrocarbon releases. Page 34/ 165
35 10. FRED Consequence Modelling Software Input Consequence modelling will be used to simulate the Major Accident Events (MAE) raised from the scenario identification. The consequence modelling will be carried out using FRED. FRED consequence modeling software stands for Fire, Release, Explosion and Dispersion developed by SHELL global solutions. This software calculates in graphical displays and detailed reports the previously mentioned hazardous consequences and presents their extent and degree of danger. FRED determines the heat radiation contours from different fire scenarios depending on the amount of fuel burning, type of fuel and wind direction. It calculates a fluid release flow rate depending on the fluid pressure, the size and location of the hole. Also, it calculates the explosion overpressure contours resulting from the ignition of released gas inside confined space depending on the type of the fuel exploding and the degree of confinement. Finally it performs gas dispersion calculation and calculates the gas concentration contours in fraction of the lower explosive limits depending on the type of gas released, release rate, wind stability, wind speed and surface roughness. FRED has the following simulation modules (detailed list): Tank Top Fire Pool Fire Trench Fire Gas Jet Flame (known reservoir pressure) Gas Jet Flame (Known mass flow rate) Shell BLEVE BLEVE (TNO) Temperature Rise Pressurised release (known reservoir pressure) Pressurised release (known mass flow rate) Pressure relief valve Blowdown Two-Phase Blowdown LPG two-phase Explosion CAM Explosion TNO Explosion TNT Dense gas dispersion Gaussian dispersion (instantaneous) Gaussian dispersion (Continuous) Gaussian dispersion (Non boiling liquid pool) Heat Up Vessel Burst Bubble Plume This hazardous consequence simulation is normally carried out in order to optimize the design, while on the other hand it will be used in this study to estimate the degree of danger raised from the hazardous events on the facilities under study in order to assess the associated risks. The FRED input file is detailed as follows: Page 35/ 165
36 Process conditions: Natural Gas / Fuel Oil / Hydrogen Temperature = 35 / 568 C Pressure = 30 / 15 / 130 / 160 bara Pressure downstream of release = bara Use standard atmospheric pressure = yes Release source = Vapor space / Liquid Hole & release geometry: Hole geometry: Failure type = Custom Hole diameter = 1.0 / 4.0 Inch (25mm and 100mm) Discharge coefficient = 0.8 for gas release / 0.6 for liquid release Pipe: Pipe length = 100 m (0.1 Km) Pipe diameter = 0.2 / 0.05 m (8 / 3 Inch) Pipe surface roughness = 4.6e-005 m Sum loss coefficient = 0 Release: Release height = 1 / 15 m Release angle from vertical = 90 deg (Worst Case) Release angle, clockwise from North = 90 deg Weather: Temperature = 20 C Relative humidity = 70 % Wind speed = 2 & 10 m/s Direction wind is going to = 90 deg (measured clockwise from North) Atmospheric stability conditions define by = Pasquill class = "D" Neutral and "F" Very Stable Thermal radiation: Radiation contours = 1.58, 4.73, 6.31, 9.46, kw/m² (complying with API requirements) Height at which plan view contours to be plotted = 1 / 15 m Cross flame distance at which side view contours to be plotted = 0 m Dispersion: Surface roughness = 0.3 m (process area) Contours to plot: Plot type = LFL/UFL and PPM Sampling time = Instantaneous Page 36/ 165
37 11. Consequence Modelling Cases 11.1 Consequence Analysis The following hazardous scenarios have been identified for consequence modelling: Table 11.1: Hazardous Scenarios for Consequence Modelling Scenario Application Flammable Gas Dispersion Natural Gas Hydrogen Jet Fire Natural Gas Hydrogen Fuel Oil Pool fire Fuel Oil Vessel Burst Hydrogen Vessel Steam Vessel Explosion Natural Gas Hydrogen Tank Top Fire Diesel (Fuel Oil) Electrical Fire Switch-Gear Building Switch-Gear Control Building Electrical Building Electrical Control Building Transformer Warehouse Office Building The hazardous consequences are classified mainly as: - Hydrocarbon Fires. - Non- Hydrocarbon Fires. Based on the above mentioned cases, the consequence modelling simulation cases are identified as presented as follows: Page 37/ 165
38 11.2 Consequence Modelling Cases Identification [1] Hydrocarbon Fires: Fuel Gas Compressors: FuelGasCompressor-NaturalGas-1Inch-10D-FlammableGasDispersion FuelGasCompressor-NaturalGas-1Inch-10D-JetFire FuelGasCompressor-NaturalGas-4Inch-10D-FlammableGasDispersion FuelGasCompressor-NaturalGas-4Inch-10D-JetFire FuelGasCompressor-NaturalGas-Explosion Combustion Turbines: FuelGasTurbine-NaturalGas-Explosion Fuel Oil Pumps: FuelOilPumps-Solar-1Inch-10D-JetFire FuelOilPumps-Solar-1Inch-10D-PoolFire FuelOilPumps-Solar-4Inch-10D-JetFire FuelOilPumps-Solar-4Inch-10D-PoolFire Fuel Oil Storage Tanks: FuelOilTank1-Solar-10D-TankTopFire FuelOilTank2-Solar-10D-TankTopFire Hydrogen Generation: HydrogenGeneration-Hydrogen-1Inch-10D-FlammableGasDispersion HydrogenGeneration-Hydrogen-1Inch-10D-JetFire HydrogenGeneration-Hydrogen-4Inch-10D-FlammableGasDispersion HydrogenGeneration-Hydrogen-4Inch-10D-JetFire HydrogenGeneration-Hydrogen-Explosion [2] Non- Hydrocarbon Fires: SwitchGearBuilding-ElectricalFire SwitchGearControlBuilding-ElectricalFire ElectricalBuilding-ElectricalFire ElectricalControlBuilding-ElectricalFire Transformer-ElectricalFire Warehouse-ElectricalFire OfficeBuilding-ElectricalFire Page 38/ 165

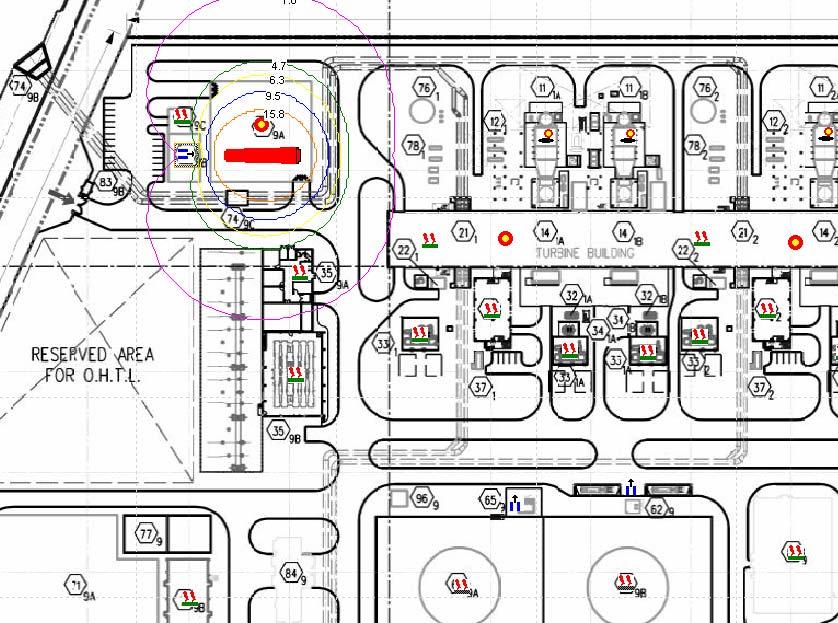
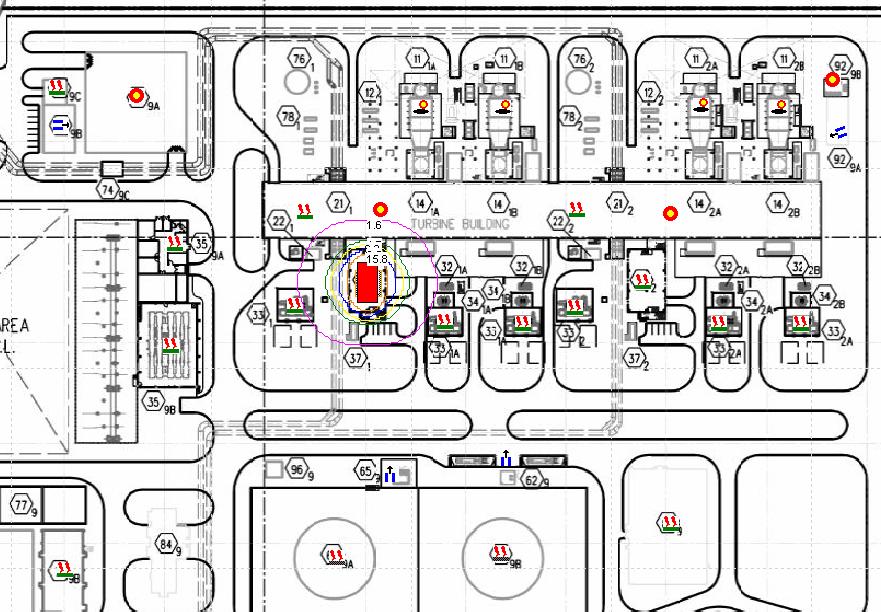
39 11.3 Major Hazardous Consequences (Graphical Plot Display) FuelGasCompressors-NaturalGas-4Inch-10D-FlammableGasDispersion: Page 39/ 165
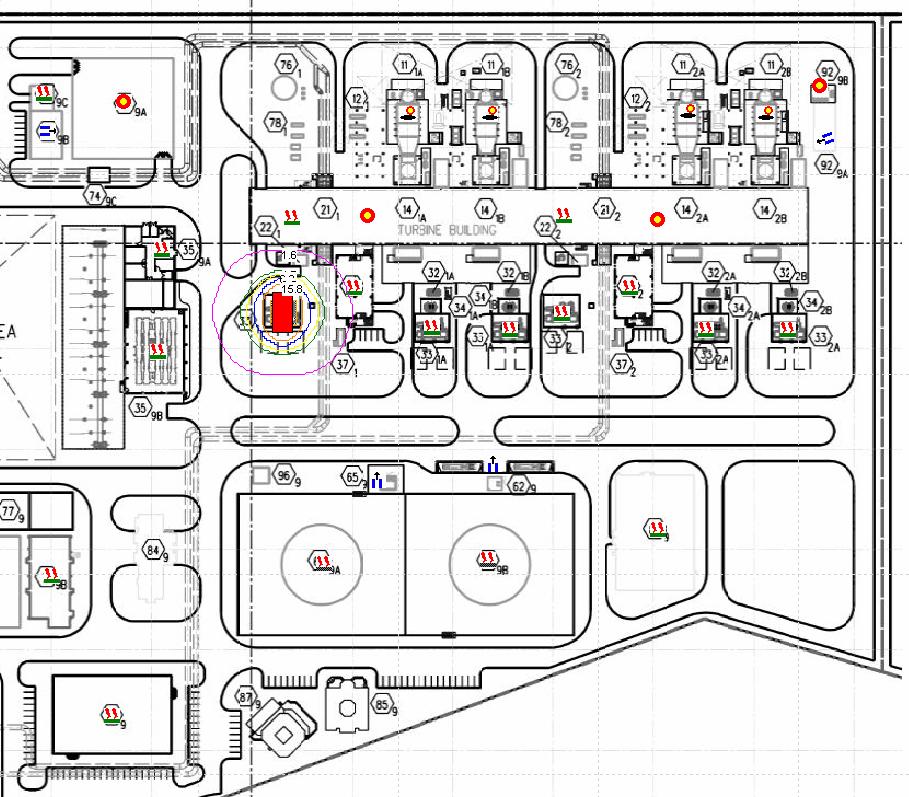
40 FuelGasCompressors-NaturalGas-4Inch-10D-JetFire: Page 40/ 165
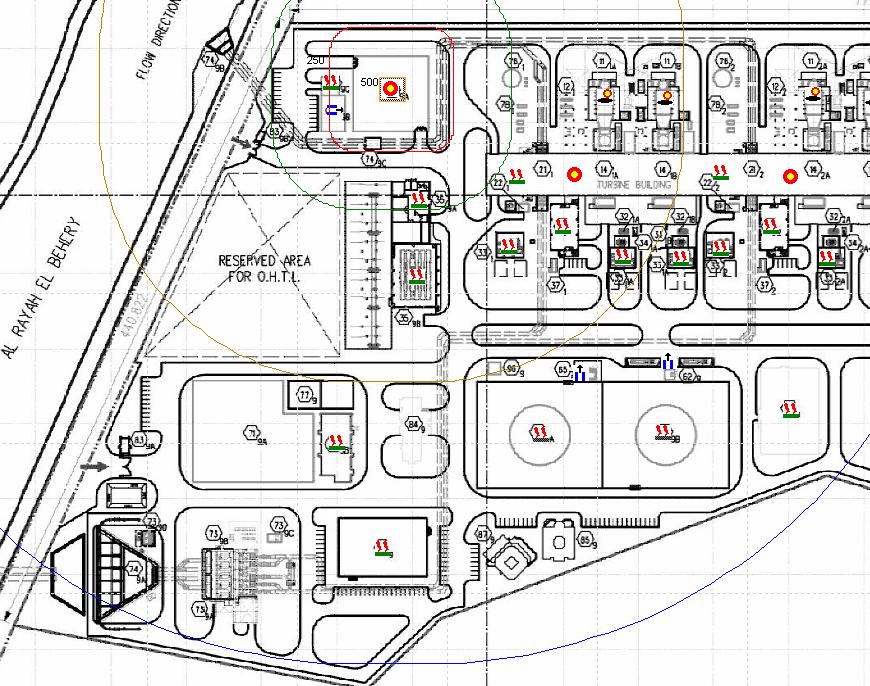
41 FuelGasCompressors-NaturalGas-Explosion: Page 41/ 165

42 FuelGasTurbine- NaturalGas-Explosion: Page 42/ 165
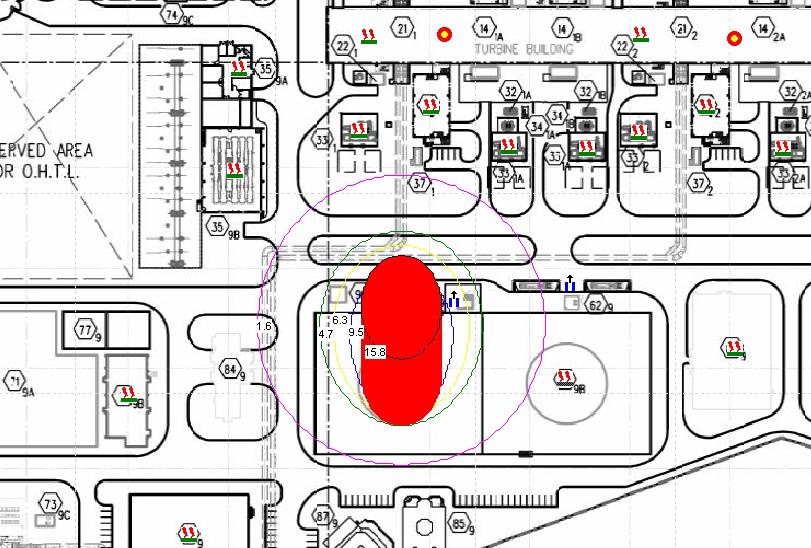
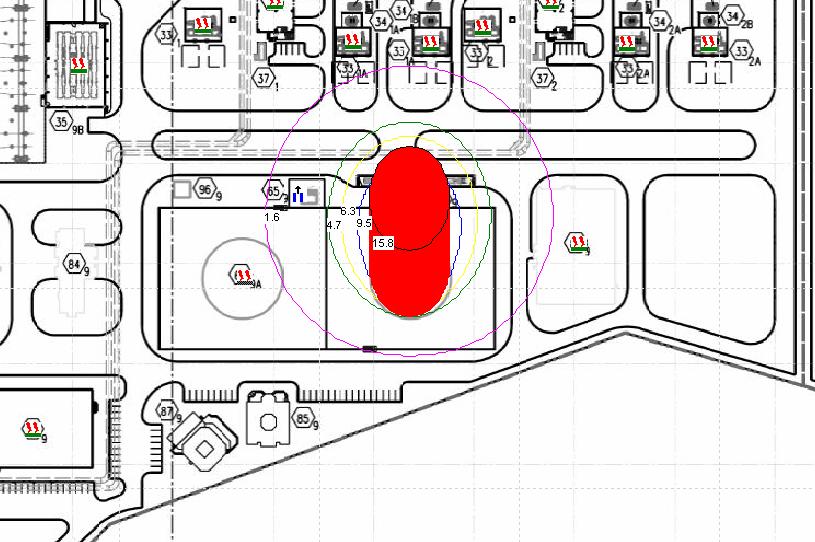
43 FuelOilPumps-FuelOil-4Inch-10D-JetFire: Page 43/ 165
44 FuelOilPumps-FuelOil-4Inch-10D-PoolFire: Page 44/ 165
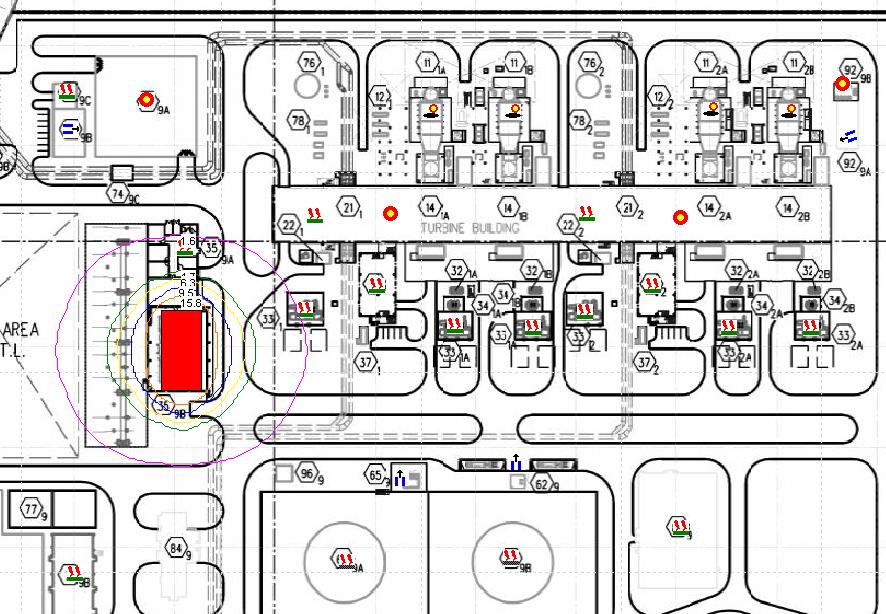
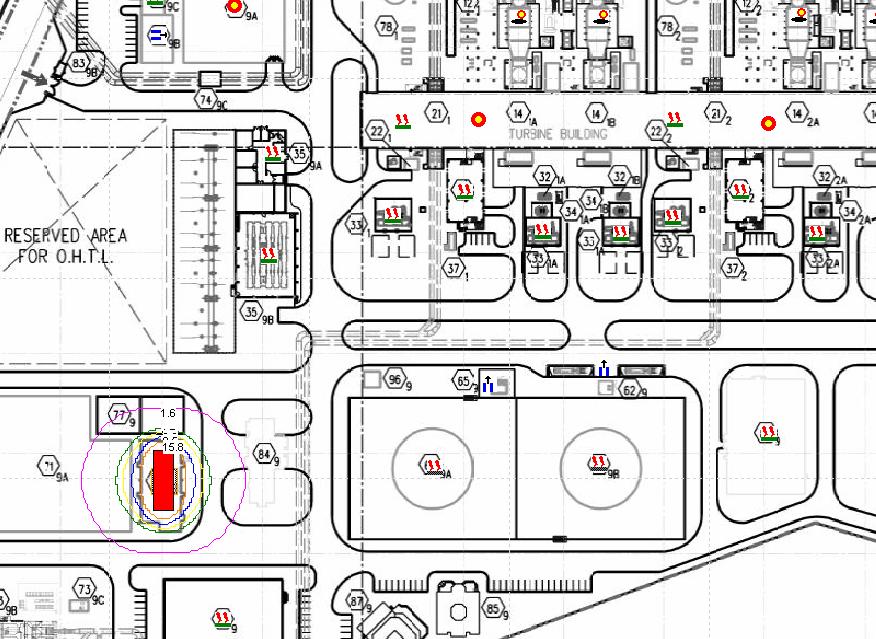
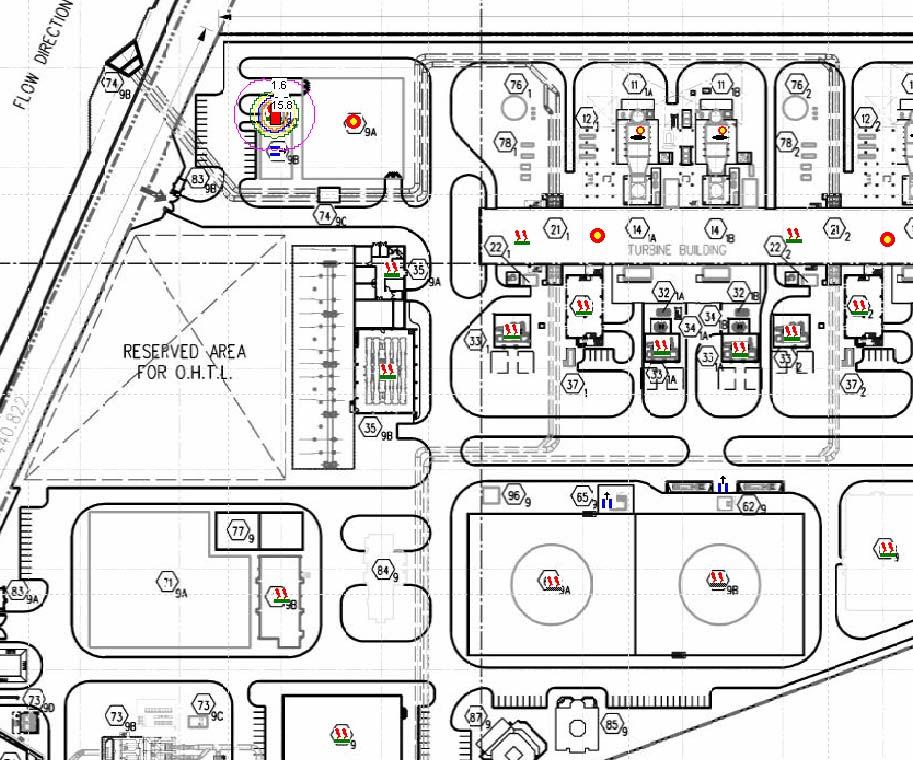
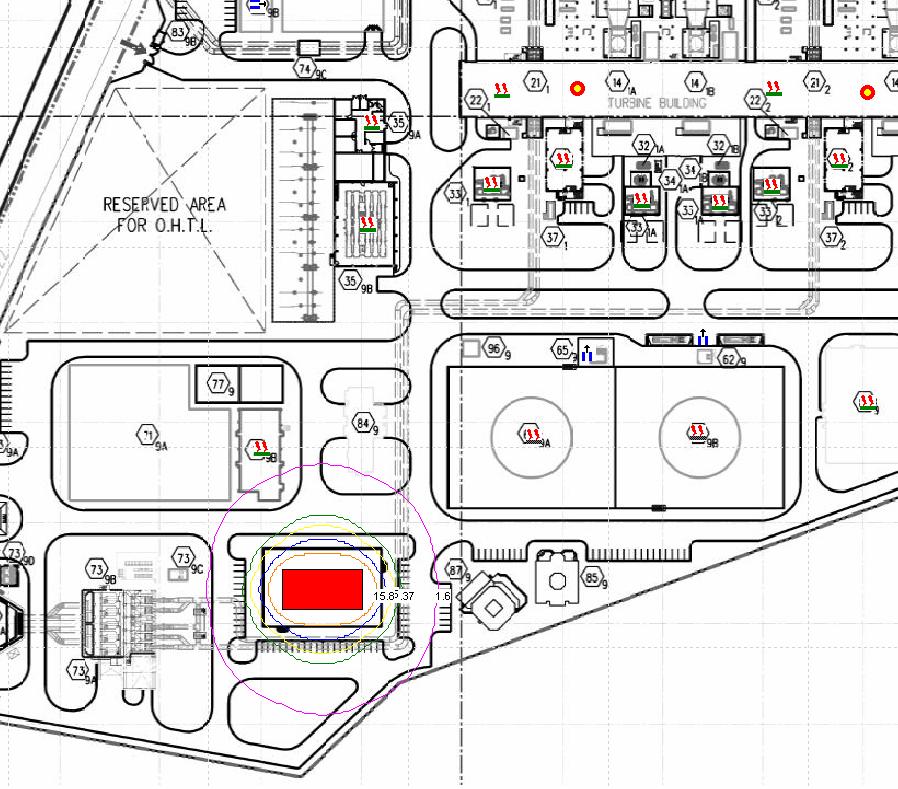
45 FuelOilTank1-FuelOil-10D-TankTopFire: Page 45/ 165
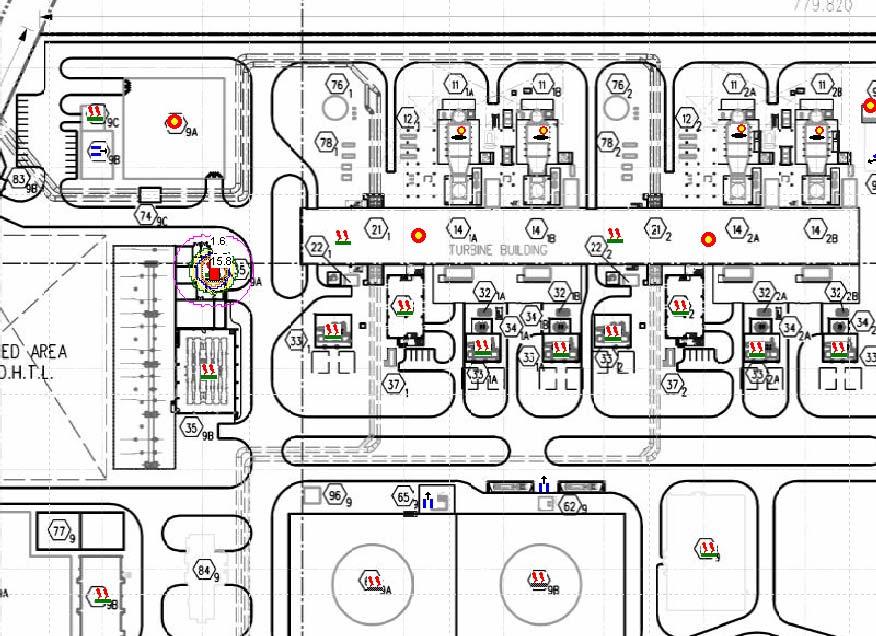
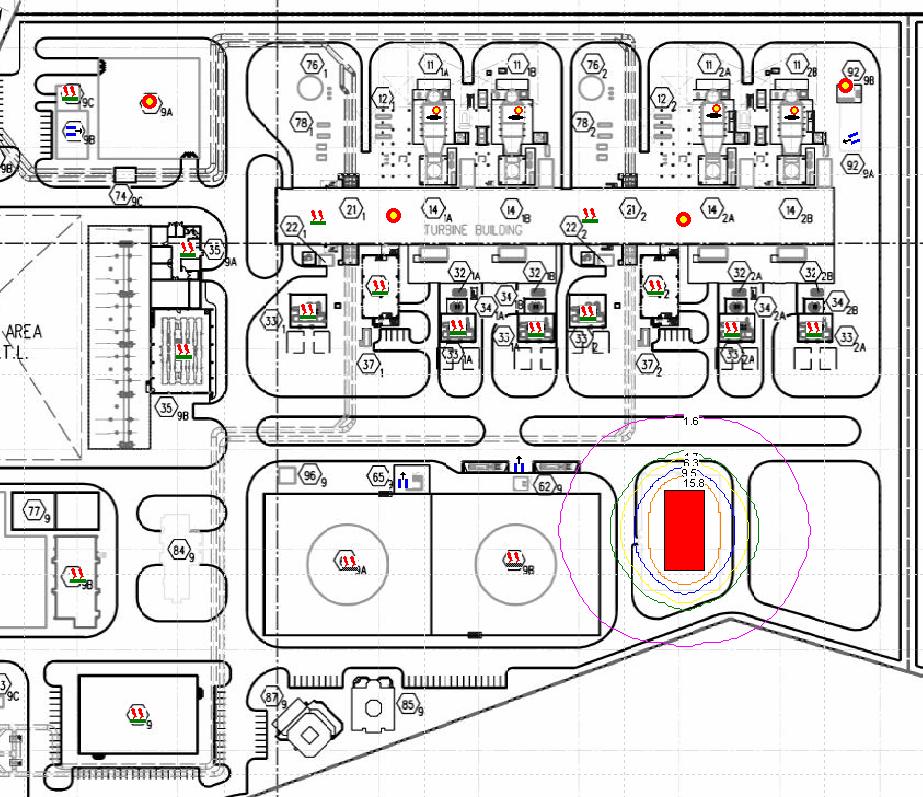
46 FuelOilTank2-FuelOil-10D-TankTopFire: Page 46/ 165
47 HydrogenGeneration-Hydrogen-4Inch-10D-FlammableGasDispersion: Page 47/ 165
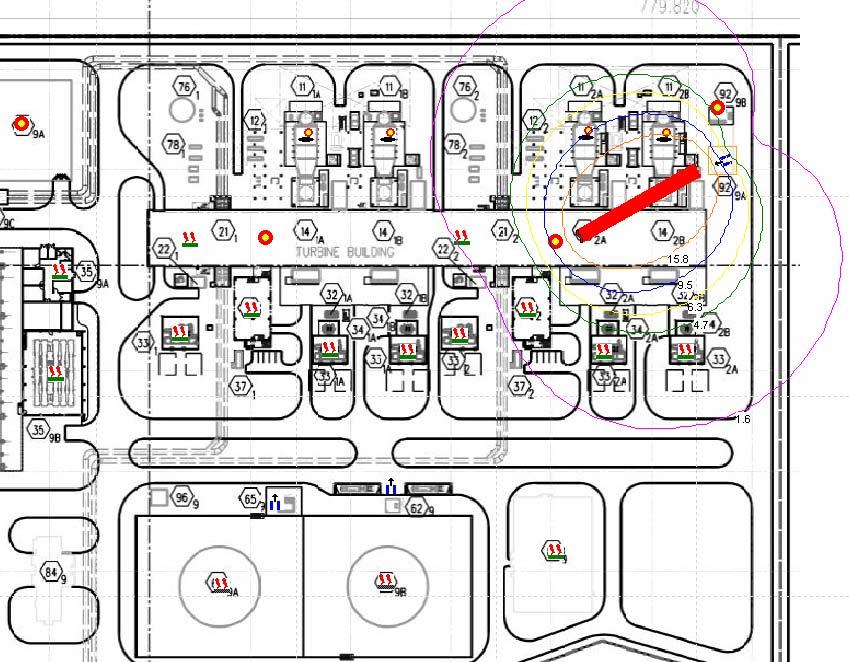
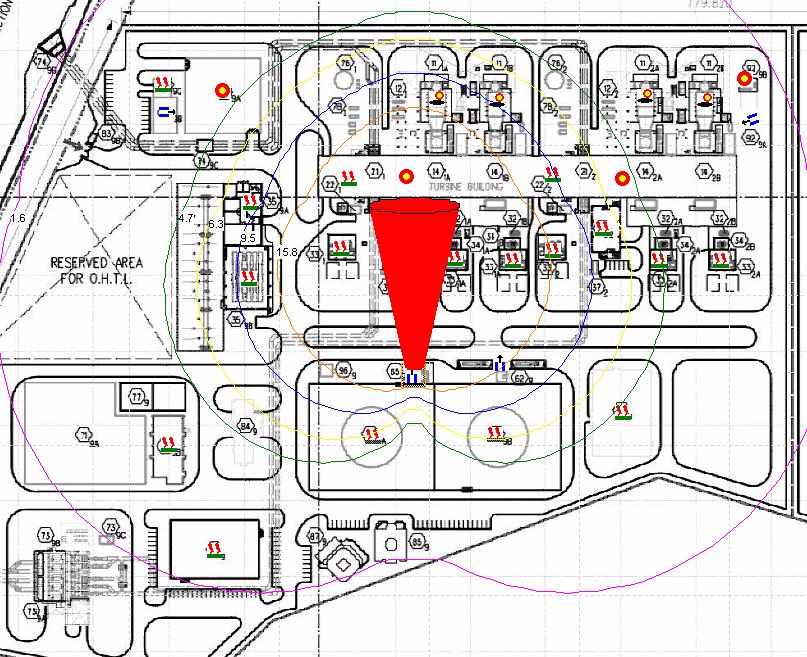
48 HydrogenGeneration-Hydrogen-4Inch-10D-JetFire: Page 48/ 165
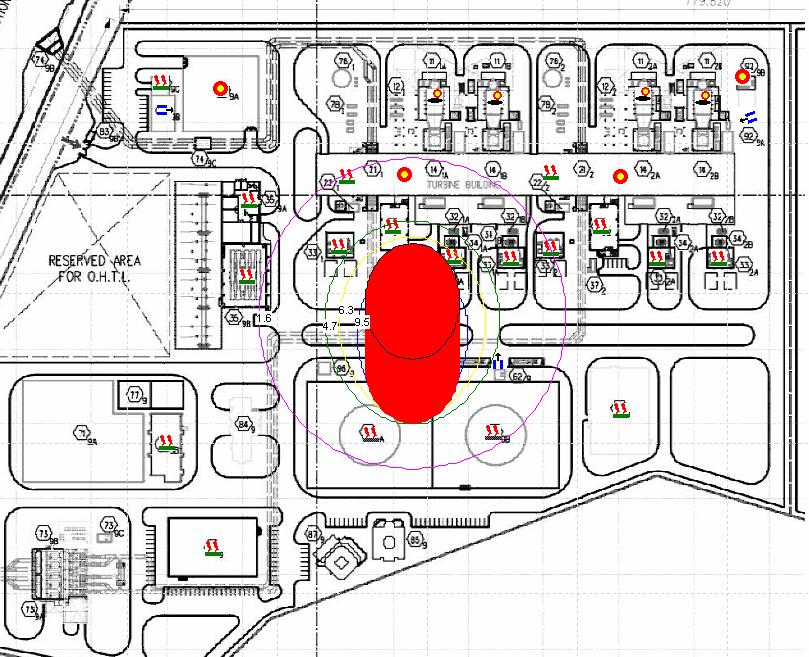
49 HydrogenGeneration-Hydrogen-Explosion: Page 49/ 165
50 SwitchGearBuilding-ElectricalFire: Page 50/ 165
51 SwitchGearControlBuilding-ElectricalFire: Page 51/ 165
52 ElectricalBuilding-ElectricalFire: Page 52/ 165
53 ElectricalControlBuilding-ElectricalFire: Page 53/ 165
54 Transformer-ElectricalFire: Page 54/ 165
55 ElectricalBuilding-ElectricalFire: Page 55/ 165
56 Warehouse-ElectricalFire: Page 56/ 165
57 OfficeBuilding-ElectricalFire: Page 57/ 165
58 12. Fire and Explosion Consequence Effects 12.1 Gas Jet Fires The jet fire has been simulated based on 2-hole sizes, 1.0 inch representing small pipe leak and 4- inch hole size representing large pipe leak (corresponds to 25mm and 100mm) according to pipes diameters, with wind speed of 2 m/s and Pasquil stability class "F" representing very stable weather conditions [2F] and wind speed of 10 m/s and Pasquil stability class "D" representing turbulent weather conditions [10D] has been selected. The jet frustum fire (flame length) and heat radiation distances (1.58, 4.73, 6.31, 9.46, kw/m²) are measured in meters. Since the jet fire is originally a high momentum directed jet release, the effects of wind direction, wind speed or atmospheric stability on the jet flame are minimal, however the higher wind speeds (10 m/s) representing unstable weather conditions results in longer jet flames (longer frustum length), which is the case considered in the results in order to present the worst case scenario. The heat radiation limits presented by the frustum length (flame lengths) for different release scenarios are presented in the tables below. Table 12.1 Jet Frustum Length (Jet Flame Lengths) Distances Material Pressure (Bara) Hole Size Jet Flame Lengths (mm) (Meter) Natural Gas Hydrogen Solar (Fuel Oil) The jet fire may cause fatality, injury or damage to equipment depending on the direction and duration of the jet fire. For jet fires, the fire fighting systems (firewater or other fire fighting agents) are not efficient to fight such types of fires due to the high momentum release initiating such jet fires. Hence, the only way to control jet fires is to limit the isolatable inventory feeding the jet fire. The jet fire will deplete by time due to the decrease in driving force across the release point "the hole", consequently the jet flame is expected to be reduced by time. For jet fires, it is essential to predict the approximate jet fire time duration in order to assess the extent of the hazardous consequences. Based on the isolatable section inventory within the system analysis and the assumption that all operators are aware and trained to deal with such emergency situations, the approximate jet fire duration can be estimated as short duration fires. Page 58/ 165
59 12.2 Flammable Gas Dispersion (Flash Fire) The heat radiation from flash fires will not significantly affect equipment and structure due to the short duration of flash fires. Flash fires are represented by the extent of the flammability limits of the released gases. The flammable gas dispersion distances (flash fires) shall be simulated based on 2-hole sizes (25mm and 100mm) according to pipes diameters and 2-wind cases (2F and 10D). The gas dispersion distances are calculated in terms of Lower Flammability Limits (LFL) and Upper Flammability Limits (UFL). The LFL and UFL limits for different release scenarios are presented in the table below. Table 12.2 Flammable Gas Dispersion Distances (Flash Fires) Flammability distances (Meter) Material Pressure (Bara) [100mm and 10D] LFL UFL Fuel Gas Natural Gas Hydrogen From the above table, obviously it can be concluded that the 100-mm leak sizes present the worst case scenario in the area as can be seen from the dispersion contours. It is proposed that all hazardous area classification of all electrical equipment in the area is in accordance with international codes and standards, which reduces the ignition of potential releases, which consequently reduces the likelihood of such flash fires. Page 59/ 165
60 12.3 Flammable Liquid Spill and Pool Fire The flammable liquid spill and pool fire distances have been simulated based on 2-hole sizes (25mm and 100mm) and 2-wind cases (2F and 10D). The heat radiation distances are calculated in terms of Flame base length. The pool fire heat radiation distances are measures in terms of (1.58, 4.73, 6.31, 9.46, kw/m²) are measured in meters. Table 12.3 Pool Fire Flame Distances (Meters) Material Pressure (Bara) Hole Size (mm) Flame Lengths (Meter) Fuel Oil (Diesel) The pool fire is either a tank top fire or pool fire. The tank top fire is limited to the tank circumference and is very unlikely to impact any of the personnel within the area, as well as it is very unlikely to spread to adjacent areas affecting other assets. The pool fire is limited to the surrounding bund or dike and is unlikely to impact any of the personnel within the area, as well as it is unlikely to spread to adjacent areas affecting other assets. Active fire protection using foam system is effective in fighting such fires and resulting in quick suppressions of such pool fires. Page 60/ 165
61 12.4 Explosion From the consequence simulation results, the distances to the overpressure waves are presented in the following table: Table 12.4 Overpressure waves Distances for Fuel Gas Compressors Overpressure (mbar) Distances in Meters Table 12.5 Overpressure waves Distances for Fuel Gas Turbines Overpressure (mbar) Distances in Meters Table 12.6 Overpressure waves Distances for Hydrogen Overpressure (mbar) Distances in Meters Explosions can greatly affect the adjacent areas and can easily result in fatalities, personnel injuries and asset damage depending on the strength of the overpressure wave. There is no effective method to fight an explosion, but only measures to prevent it. It is proposed that all hazardous area classification of all electrical equipment in the area is in accordance with international codes and standards, which reduces the ignition of potential releases, which consequently reduces the likelihood of such explosion scenarios. Page 61/ 165
62 12.5 Electrical Fire The Electrical fire has been simulated based on wind speed of 2 m/s and Pasquil stability class "F" representing very stable weather conditions [2F] and wind speed of 10 m/s and Pasquil stability class "D" representing turbulent weather conditions [10D] has been selected. The heat radiation limits presented by the fire lengths (flame lengths) for different fire scenarios are presented in the table below. Table 12.7 Electrical Fire Flame Distances Scenario Flame Base Length (Distances in Meters) Switch Gear Building Electrical Fire 20 Switch Gear Control Building Electrical Fire 5 Electrical Building Electrical Fire 5 Electrical Control Building Electrical Fire 10 Transformer Electrical Fire 10 Warehouse Electrical Fire 20 Office Building Electrical Fire 20 The electrical fire is limited to the enclosure and is unlikely to impact any of the personnel within the area, as well as it is unlikely to spread to adjacent areas affecting other assets. Active fire protection using gaseous system is effective in fighting such fires and resulting in quick suppressions of such electrical fires. Page 62/ 165
63 13. Likelihood Data 13.1 Process Release The detailed Generic values for equipment failure frequencies are summarized in the following table (based on API Failure Data): Table 13.1: API Failure Rate Data Equipment Type Reference Failure Frequency 0.25 Inch 1.0 Inch 4.0 Inch Rupture Based on the above mentioned hole size distribution and data indicated by the API, the failure data for various equipment are indicated in the following tables. Table 13.2: Process Equipment Failure Rate / Year Data Atmospheric No. Hole Size Pressure Vessel Storage Pump Compressor Tank 1 Medium leak of 1 inch 1 X X X X Rupture equivalent 4 inch 1 X X X X 10-4 Page 63/ 165
64 13.2 Ignition Probability The probability of ignition depends on the availability of a flammable mixture, the flammable mixture reaching an ignition source and the type of ignition source (energy etc.). The ignition sources on the facilities include: Hot work Faults in electrical equipment Faults in rotating equipment Ignition caused by combustion engines or hot surfaces Automatic ignition in the event of a fracture or rupture Static electricity Flare / open flame Ignition probability data (generic) are provided for both gas and oil releases based on mass release rate. Typical ignition probability data are given in the following table. Table 13.3: Ignition Probability Data Mass Release Category Mass Release Rate (Kg / Sec) Ignition Probability Gas Oil Minor < Major Massive > Page 64/ 165
65 14. Risk Assessment 14.1 Introduction to Risk Assessment All identified hazards should be subject to an evaluation for risk potential. This means analysing the hazard for its probability to actually progress to a loss event, as well as the likely consequences of this event. Risk criteria are required to promote consistency in evaluating the results of relevant studies and to formulate a proactive approach to accident prevention. The quantitative risk assessment [QRA] principle has been adopted for this project due to the high flammability nature presented in the process. Quantitative Risk Assessment [QRA] criteria fall into 2 categories, namely risk to an "Individual" and "Societal" in terms of frequency of multiple fatality incidents. For both categories, there are 3 general categories of risk, unacceptable, tolerable and acceptable. Risk shall be calculated based on the FRED software consequence modelling output adopting the international risk acceptance criteria and the international risk management guidelines as a reference. The calculated risks shall be compared with the international risk acceptance criteria [detailed in the risk evaluation section]. Basically, risk will be calculated as presented in the following equation: Risk = Frequency X Severity Where: Frequency: is the likelihood of a hazardous event occurring. Severity: is the likelihood that the specific person will be fatally injured by the effect of the event (determined from the consequence modelling software). For each specific area, the individual and societal risk shall be firmly calculated based on FRED modelling output. For equipment processing flammable materials, hazardous event consequences have been determined and listed as follows for each piece of equipment: Flammable gas cloud (Flash fire). Jet fire. Tank Top Fire Vessel Burst BLEVE Pool Fire Explosion. Page 65/ 165
66 In order to calculate the risk in each area, the worst case scenario (i.e. the highest frequency of occurrence with the most hazardous scenario) for each process equipment for each of these hazardous consequences shall be selected in order to present the worst case scenario which in turn leads to achieve conservative calculations. The frequency shall be assumed to be the highest frequency of occurrence. The severity shall be assumed based on the consequence modelling simulation for each release case Individual Risk The individual risk is the summation of different types of risks envisaged within certain boundaries. Then the individual risk assessment shall be calculated as follows: Table 14.1 Individual Risk Assessment No. Scenario Location Individual Risk 1.0 Loss of containment In-site 1.77E Loss of containment Off-site Not Reached 14.3 Societal Risk The societal risk / group risk has been derived from the individual risk. The societal risk / group risk levels at any facility can be estimated by combining the individual risks and the group fractional exposure values. It can be assumed that the proposed facilities will be occupied by a maximum number of 5 operators, supervisors and engineers at a time on site (open process area outside enclosures). It is worth notice that specific operators are well-trained and competent personnel in case of emergency as well as the provision of PPE, which reduces their potential harm from such hazardous scenarios. Hence, the societal risk shall be calculated as follows: Table 14.2 Societal Risk Assessment No. Scenario Location Societal Risk 1.0 Loss of containment In-site 3.54E Loss of containment Off-site Not Reached These risks will be evaluated against the international risk acceptance criteria in the risk evaluation section. Page 66/ 165
67 15. Risk Evaluation The risks assessed will be evaluated based on the international risk acceptance criteria. The ALARP principle has been adopted for risk evaluation. The ALARP region is that point at which the time, effort difficulty and cost of further risk reduction become out of proportion compared with the amount of risk reduction achieved. Risks lower than the ALARP region risks will be considered minor risk and consequently they will not be considered. Risks higher than the ALARP region risks will be considered major risk and consequently they will be not acceptable and further reduction measures are required as mandatory corrective actions. The international risk acceptance criteria are presented in the following figure. Unacceptable region Risk cannot be justified save in extraordinary circumstances The ALARP or Tolerable region (Risk is undertaken only if a benefit is desired) Tolerable only if risk reduction is impracticable or if the cost is grossly disproportionate to the improvement gained Broadly acceptable region (No need for detailed working to demonstrate ALARP) Necessary to maintain assurance that risk remains at this level Figure 15.1: International Risk Acceptance Criteria From the risk assessment and the international risk acceptance criteria the conclusion is presented in the following table. Page 67/ 165
68 Table 15.1: Risk Acceptance Criteria Individual Risk Risk Acceptance Societal Risk Risk Acceptance 1.77E-04 ALARP 3.54E-04 ALARP Page 68/ 165
69 16. Risk Reduction Measures (Recommendations) 16.1 Risk Reduction Measures Risk reduction measures (corrective actions or recommendations) may include reducing the risk by several technically feasible methods, generally are as follows: Measures to eliminate the risk. Measures to reduce the exposure of personnel to the hazards. Measures to reduce the frequency of occurrence. Measures to mitigate the consequences if the event does occur. Measures to improve evacuation in case of emergency (event occurs). Based on the calculated risk figures, it was observed that the individual and societal risks fall within the ALARP region for the industrial areas. The workers in the industrial areas are present most of the time but with the existence of the safety precautions and procedures and the protection within the industrial facilities. Since the calculated risk is within the ALARP regions, hence risk reduction measures are required to reduce the calculated risk to the minimum practical limit. These risk reduction measures (recommendations) are proposed and summarized as follows: Assuming the prevailing wind direction for the proposed location is within the range from the North to North West (300 o to 360 o ), the current proposed plot plan is not complying with international codes and standards (I.e. Global Asset Protection GAP Guidelines) from equipment location, arrangements and safe spacing point of view. As a minimum the following shall be considered in the layout design: - All normally occupied buildings and critical services building shall be located in the upwind direction (e.g. administration, offices, control, firefighting, switchgear, electrical etc). - All sources of spark and ignition shall be located in the upwind direction (same as above). - All sources of leaks, fires and explosions shall be in the located downwind direction (e.g. all process areas and all storage areas). - All equipment spacing (safe distance between equipment and adjacent equipment) and unit spacing (safe distance between unit and adjacent unit) to comply with international codes and standards (I.e. Global Asset Protection GAP Guidelines). Ensure that emergency shutdown system ESD (I.e. block isolation valves) are connected to fire and gas detection system, and placed in a safe strategic place protected from hazardous Page 69/ 165
70 consequences (e.g. fires or explosions) for personnel intervention in case of emergency in order to isolate the process equipment as soon as possible. Ensure emergency response plans (contingency plans) are in place and including scenario specific response actions for all potential major hazardous scenarios. It is recommended to have an elevated wind sock installed at the site, which can be seen from the control room and from outside the fence to determine the direction of gas migration in case of major gas leak. Ensure smoke detectors are provided within electrical enclosures in order to provide early detection of electrical fires. Ensure rotating equipment vendor (e.g. turbine, generator etc supplier) will deliver failure mode and effect analysis study for each equipment. Ensure key project drawings (piping and instrumentation diagrams P&IDs) are subjected to design review and HAZOP by expert third party. Ensure periodical emergency drills (fire, escape and evacuation drills) are performed on regular basis for workers. It is recommended to have a bund wall (dike area) surrounding all storage areas to prevent spread of liquid spills in case of emergency. First aid kits, safety shower, eye wash and dilute solutions to be available in all processing points to be applied in case of chemical spillage. Ensure portable gas detectors are provided within the site in order to facilitate manual gas leak monitoring and regular leakage checks. Special personal protective equipment (PPE) suitable for hazardous chemicals according to the MSDS to be provided. As a minimum, full suit (coverall), gloves, goggles, safety helmet and safety boots. Page 70/ 165
71 17. Uncertainty Analysis Uncertainty analysis is performed to define the uncertainty data in the input model, underestimation of consequences, neglected items, assumed points, exaggeration points or overestimation. In this QRA study all input data have been selected based on the worst case scenarios. The selection of worst case scenarios shall result in conservative design leading to conservative results. A list of worst case scenarios and conservative assumptions include the following: Selection of the minimum wind speed of 2 m/s with stability class "F" in order to represent a still weather conditions in the consequence modelling calculations. Selection of the maximum wind speed of 10 m/s with stability class "D" in order to represent a turbulent weather conditions in the consequence modelling calculations. Selection of the ambient temperature of 35 C in the consequence modelling calculations. Selection of the relative humidity of 70% in the consequence modelling calculations. The maximum discharge pressure has been selected as the simulation pressure. The maximum discharge temperature has been selected as the simulation temperature. The mixture of flammable and non-flammable materials have been considered as flammable if the concentration of flammable components are more that half the mixture content. Simulation sampling time has been selected as "Instantaneous" in stead of 10-minutes sampling to investigate the maximum plume length in order to achieve conservative results. Selection of a wide range of process leak hole size distribution to be the controlling case from the selected 2-hole sizes of 1.0 inch representing medium pipe leak and 4.0 inches leak representing large pipe leak. The release direction (release orientation) has been selected in the same direction of the prevailing wind direction in order to present the maximum down wind dispersion distances. Assumption that jet fires can happen in all directions in order to define the maximum extent of impact (the jet fire flame length is the radius of the maximum impact circle). Assumption that ignited gas cloud leading to flash fires can happen in all directions in order to define the maximum extent of impact (the gas dispersion plume length is the radius of the maximum impact circle). The hazardous consequences effects are based on the maximum impacts on personnel, escape/evacuation routes, structures, equipment supports, fire protection systems, adjacent process equipment and escalation potential (Domino Effect). The highest safety systems failure probability has been selected for all safety systems failure probability data. Page 71/ 165
72 The highest ignition probability has been selected for all ignition probability data. The lowest fire detection probability has been selected for all fire detection probability data. The lowest flammable gas detection probability has been selected for all flammable gases detection probability data. The most hazardous scenario has been selected in the scenario development, as the basis for hazardous event scenario frequency of occurrence. The individual risk calculation has been based on the summation of the most hazardous scenarios resulted from all potential release scenarios. The vulnerability of all hazardous events has been selected on the worst case scenario. The assumption of "No Double Jeopardy" has been adopted in the QRA calculations. Hence, there is no uncertainty in the QRA calculations and all the calculated risks are certain. Page 72/ 165
73 18. References 1. NFPA, National Fire Protection Association. 2. SHELL FRED documentation. 3. Loss Prevention in the Process Industries. 4. API, American Petroleum Institute. 5. Guidelines for Quantitative Risk Assessment. 6. Project documentation. Page 73/ 165
74 19. Appendix-1: North Giza North Giza Power Station Author Tamer Said Company EcoConServ Department Hazard and Risk Management Revision 0 Notes said.tamer@gmail.com Revision date Wednesday, October 21, Table of Contents Pressurised Release [Fuel Gas] Pressurised Release [H2 Generation] Pressurised Release [Fuel Oil Transfer] Pressurised Release [Fuel Oil Unloading] Tank Top Fire [Fuel Oil 1] Tank Top Fire [Fuel Oil 2] Explosion [Natural Gas inside Turbine Building] Explosion [NG Building] Explosion [Natural Gas inside Turbine Building] Explosion [H2 Building] Vessel Burst [Steam Drum] Vessel Burst [Steam Drum] Vessel Burst [Steam Drum] Vessel Burst [Steam Drum] Fire [Switchgear] Fire [Switchgear Control] Fire [Control / Electrical Building] Fire [Control / Electrical Building] Fire [Electrical Building] Fire [Transformer] Fire [Transformer] Fire [Transformer] Fire [Transformer] Fire [Transformer] Fire [Transformer] Fire [Warehouse / Workshop] Fire [Electrical Building] Fire [Office Building] Fire [Turbine] Fire [Turbine] 19.2 Pressurised Release [Fuel Gas] Page 74/ 165
75 Scenario Summary Scenario Scenario = Pressurised Release [Fuel Gas] Fluid = Natural gas Process conditions Calculate at = User input pressure Temperature = 25 C Pressure = 30 bara Pressure downstream of release Pressure = bara Use standard atmospheric pressure = yes Release from Release source = Vapour space Hole & release geometry Hole geometry Failure type = Custom Hole diameter = 0.1 m Discharge coefficient = 0.8 Pipe Pipe length = 1 m Pipe diameter = 0.1 m Pipe surface roughness = 4.6e-005 m Sum loss coefficient = 0 Release Release height = 1 m Release angle from vertical = 90 deg Release angle, clockwise from North = 90 deg Weather Ambient conditions Temperature = 20 C Relative humidity = 70 % Wind speed = 10 m/s Direction wind is going to = 90 deg (measured clockwise from North) Atmospheric stability conditions Define by = Pasquill class Pasquill class = D Neutral Page 75/ 165
76 Thermal radiation Radiation contours = 1.58, 4.73, 6.31, 9.46, kw/m² Height at which plan view contours to be plotted = 0 m Cross flame distance at which side view contours to be plotted = 0 m Dispersion Surface roughness = 0.1 m Contours to plot: ppm ppm Plot type = LFL/UFL Sampling time = Instantaneous Release summary Mass flow rate = kg/s Flux = kg/m²/s Static exit pressure = 15.9 bara Exit temperature = C Exit density = 14.9 kg/m³ Exit velocity = m/s Residence time = 0 s Vapour fraction at exit = 1 mol/mol Expanded exit velocity = m/s Air equivalent source diameter = m Release Composition Molecular Weight of Release = kg/kmol Component Weight Mole Critical Fraction Fraction Temp C norm norm Critical Pressure bara Molecular Weight kg/kmol Atmos BP C Freeze Pt C Heat of Comb kj/kg n-butane Propane Ethane Methane Nitrogen Carbon dioxide Reservoir summary (at reservoir pressure) Bubble point temperature = C Dew point temperature = n/a Vapour fraction = 1 Properties of phases Vapour Liquid Molecular weight (kg/kmol) Density (kg/m³) Enthalpy (kj/kmol) Entropy (kj/kmol*k) Page 76/ 165

77 Cv (kj/kg*k) Cp (kj/kg*k) Sound velocity (m/s) Viscosity (e-3 kg/m*s) Surface tension (e-3 N/m) 0 0 Jet Fire Jet Fire Summary Flame length (of frustum) = m Cone width of flame base = m Cone width of flame end = m Flame lift-off = m Flame angle from vertical = deg Flame angle, clockwise from North = 90 deg Surface emissive power = kw/m² Fraction of heat radiated = Total combustion power = MW Heat of combustion = kj/kg Side view Raw plot data Page 77/ 165

78 Top view Raw plot data Impingement Raw plot data Pool Chart Page 78/ 165
79 No pool can form Page 79/ 165
80 Dispersion Dispersion Summary Contour value (ppm) Downwind distance (m) Height above ground (m) 0 0 Mass in plume between specified limits = kg Volume of plume containing this mass = m³ Pollutant-only mass in this volume = kg Specified minimum = vol% Specified maximum = 100 vol% Jet - side Raw plot data Page 80/ 165
81 Jet - top Raw plot data Warnings 1 - Temperature outside experimental range -5 to 15 C 2 - Pressure outside experimental range 0 to 20 bara 3 - Pressure downstream parameter has not been experimentally determined 4 - Pipe surface roughness parameter has not been experimentally determined 5 - Warning: some vapour condenses - assume metastable flow 6 - Dew point calculation not possible at requested pressure 7 - Ambient temperature outside experimental range 0 to 15 C 8 - Mass flow rate outside experimental range 0 to 30 kg/s 9 - Ambient pressure parameter has not been experimentally determined Page 81/ 165
82 top 19.3 Pressurised Release [H2 Generation] Scenario Summary Scenario Scenario = Pressurised Release [H2 Generation] Fluid = Hydrogen Process conditions Calculate at = User input pressure Temperature = 25 C Pressure = 130 bara Pressure downstream of release Pressure = bara Use standard atmospheric pressure = yes Release from Release source = Vapour space Hole & release geometry Hole geometry Failure type = Custom Hole diameter = 0.1 m Discharge coefficient = 0.8 Pipe Pipe length = 1 m Pipe diameter = 0.1 m Pipe surface roughness = 4.6e-005 m Sum loss coefficient = 0 Release Release height = 5 m Release angle from vertical = 90 deg Release angle, clockwise from North = 250 deg Weather Ambient conditions Temperature = 20 C Relative humidity = 70 % Wind speed = 10 m/s Direction wind is going to = 200 deg (measured clockwise from North) Page 82/ 165
83 Atmospheric stability conditions Define by = Pasquill class Pasquill class = D Neutral Thermal radiation Radiation contours = 1.58, 4.73, 6.31, 9.46, kw/m² Height at which plan view contours to be plotted = 0 m Cross flame distance at which side view contours to be plotted = 0 m Dispersion Surface roughness = 0.1 m Contours to plot: ppm ppm Plot type = LFL/UFL Sampling time = Instantaneous Release summary Mass flow rate = kg/s Flux = kg/m²/s Static exit pressure = bara Exit temperature = C Exit density = kg/m³ Exit velocity = m/s Residence time = 0 s Vapour fraction at exit = 1 mol/mol Expanded exit velocity = m/s Air equivalent source diameter = m Release Composition Molecular Weight of Release = kg/kmol Component Weight Mole Critical Fraction Fraction Temp C norm norm Critical Pressure bara Molecular Weight kg/kmol Atmos BP C Freeze Pt C Heat of Comb kj/kg Hydrogen Reservoir summary (at reservoir pressure) Bubble point temperature = n/a Dew point temperature = n/a Vapour fraction = 1 Properties of phases Vapour Liquid Molecular weight (kg/kmol) Density (kg/m³) Enthalpy (kj/kmol) Entropy (kj/kmol*k) Cv (kj/kg*k) Cp (kj/kg*k) Sound velocity (m/s) Page 83/ 165

84 Viscosity (e-3 kg/m*s) Surface tension (e-3 N/m) 0 0 Jet Fire Jet Fire Summary Flame length (of frustum) = m Cone width of flame base = m Cone width of flame end = m Flame lift-off = m Flame angle from vertical = 79 deg Flame angle, clockwise from North = deg Surface emissive power = kw/m² Fraction of heat radiated = Total combustion power = MW Heat of combustion = kj/kg Side view Raw plot data Page 84/ 165

85 Top view Raw plot data Impingement Raw plot data Pool Chart Page 85/ 165
86 No pool can form Page 86/ 165
87 Dispersion Dispersion Summary Contour value (ppm) Downwind distance (m) Height above ground (m) Mass in plume between specified limits = kg Volume of plume containing this mass = m³ Pollutant-only mass in this volume = kg Specified minimum = 4 vol% Specified maximum = 100 vol% Jet - side Raw plot data Page 87/ 165
88 Jet - top Raw plot data Warnings 1 - Temperature outside experimental range -5 to 15 C 2 - Pressure outside experimental range 0 to 20 bara 3 - Pressure downstream parameter has not been experimentally determined 4 - Pipe surface roughness parameter has not been experimentally determined 5 - Dew point calculation not possible at requested pressure 6 - Ambient temperature outside experimental range 0 to 15 C 7 - Mass flow rate outside experimental range 0 to 30 kg/s 8 - Ambient pressure parameter has not been experimentally determined 9 - Release will be modelled as if in downwind direction Page 88/ 165
89 top 19.4 Pressurised Release [Fuel Oil Transfer] Scenario Summary Scenario Scenario = Pressurised Release [Fuel Oil Transfer] Fluid = Fuel oil Process conditions Calculate at = User input pressure Temperature = 25 C Pressure = 15 bara Pressure downstream of release Pressure = bara Use standard atmospheric pressure = yes Release from Release source = Liquid space Liquid head = 0 m Releasable liquid volume = 250 m³ Hole & release geometry Hole geometry Failure type = Custom Hole diameter = 0.1 m Discharge coefficient = 0.6 Pipe Pipe length = 1 m Pipe diameter = 0.1 m Pipe surface roughness = 4.6e-005 m Sum loss coefficient = 0 Release Release height = 5 m Release angle from vertical = 90 deg Release angle, clockwise from North = 0 deg Weather Ambient conditions Temperature = 20 C Relative humidity = 70 % Wind speed = 10 m/s Page 89/ 165
90 Direction wind is going to = 0 deg (measured clockwise from North) Atmospheric stability conditions Define by = Pasquill class Pasquill class = D Neutral Thermal radiation Radiation contours = 1.58, 4.73, 6.31, 9.46, kw/m² Height at which plan view contours to be plotted = 0 m Cross flame distance at which side view contours to be plotted = 0 m Dispersion Surface roughness = 0.1 m Contours to plot: LFL estimated ppm ppm Plot type = LFL/UFL Sampling time = Instantaneous Release summary Mass flow rate = kg/s Flux = kg/m²/s Static exit pressure = bara Exit temperature = 25 C Exit density = kg/m³ Exit velocity = m/s Residence time = s Vapour fraction at exit = 0 mol/mol Expanded exit velocity = 67.4 m/s Air equivalent source diameter = m Release Composition Molecular Weight of Release = kg/kmol Component Weight Mole Critical Fraction Fraction Temp C norm norm 1- Tetracosene n- Hexadecane Critical Pressure bara Molecular Weight kg/kmol Atmos BP C Freeze Pt C Heat of Comb kj/kg Reservoir summary (at reservoir pressure) Bubble point temperature = n/a Dew point temperature = n/a Vapour fraction = 0 Properties of phases Vapour Liquid Molecular weight (kg/kmol) Density (kg/m³) Page 90/ 165
 = 109.7 m Cone width of flame base = 11.45 m Cone width of flame end = 61.31 m Flame lift-off = 4.823 m Flame angle from vertical = 80.")
91 Enthalpy (kj/kmol) Entropy (kj/kmol*k) Cv (kj/kg*k) Cp (kj/kg*k) Sound velocity (m/s) Viscosity (e-3 kg/m*s) Surface tension (e-3 N/m) Jet Fire Jet Fire Summary Flame length (of frustum) = m Cone width of flame base = m Cone width of flame end = m Flame lift-off = m Flame angle from vertical = deg Flame angle, clockwise from North = 0 deg Surface emissive power = kw/m² Fraction of heat radiated = Total combustion power = MW Heat of combustion = kj/kg Side view Raw plot data Page 91/ 165


92 Top view Raw plot data Impingement Raw plot data Page 92/ 165

93 Pool Chart Liquid Pool Summary Released volume = 250 m³ Pool equivalent diameter = m Pool surface area = m² Pool depth = 0.08 m Pool Fire Summary Flame length = m Flame angle from vertical = deg Flame base length = m Surface emissive power = kw/m² Estimated burning time = minutes Side view Raw plot data Page 93/ 165

94 Top view Raw plot data Dispersion Fluid is not capable of dispersion Page 94/ 165
95 Warnings 1 - Temperature outside experimental range -5 to 15 C 2 - Pressure downstream parameter has not been experimentally determined 3 - Pipe surface roughness parameter has not been experimentally determined 4 - Dew point calculation not possible at requested pressure 5 - Mass flow rate outside extrapolated range 0 to 100 kg/s 6 - Ambient temperature outside experimental range 0 to 15 C 7 - Mass flow rate outside experimental range 0 to 30 kg/s 8 - Releasable liquid volume parameter has not been experimentally determined Page 95/ 165
96 top 19.5 Pressurised Release [Fuel Oil Unloading] Scenario Summary Scenario Scenario = Pressurised Release [Fuel Oil Unloading] Fluid = Fuel oil Process conditions Calculate at = User input pressure Temperature = 25 C Pressure = 15 bara Pressure downstream of release Pressure = bara Use standard atmospheric pressure = yes Release from Release source = Liquid space Liquid head = 0 m Releasable liquid volume = m³ Hole & release geometry Hole geometry Failure type = Custom Hole diameter = m Discharge coefficient = 0.6 Pipe Pipe length = 1 m Pipe diameter = 0.1 m Pipe surface roughness = 4.6e-005 m Sum loss coefficient = 0 Release Release height = 5 m Release angle from vertical = 90 deg Release angle, clockwise from North = 0 deg Weather Ambient conditions Temperature = 20 C Relative humidity = 70 % Wind speed = 10 m/s Page 96/ 165
97 Direction wind is going to = 0 deg (measured clockwise from North) Atmospheric stability conditions Define by = Pasquill class Pasquill class = D Neutral Thermal radiation Radiation contours = 1.58, 4.73, 6.31, 9.46, kw/m² Height at which plan view contours to be plotted = 0 m Cross flame distance at which side view contours to be plotted = 0 m Dispersion Surface roughness = 0.1 m Contours to plot: LFL estimated ppm ppm Plot type = LFL/UFL Sampling time = Instantaneous Release summary Mass flow rate = kg/s Flux = kg/m²/s Static exit pressure = bara Exit temperature = 25 C Exit density = kg/m³ Exit velocity = m/s Residence time = 0 s Vapour fraction at exit = 0 mol/mol Expanded exit velocity = 67.4 m/s Air equivalent source diameter = m Release Composition Molecular Weight of Release = kg/kmol Component Weight Mole Critical Fraction Fraction Temp C norm norm 1- Tetracosene n- Hexadecane Critical Pressure bara Molecular Weight kg/kmol Atmos BP C Freeze Pt C Heat of Comb kj/kg Reservoir summary (at reservoir pressure) Bubble point temperature = n/a Dew point temperature = n/a Vapour fraction = 0 Properties of phases Vapour Liquid Molecular weight (kg/kmol) Density (kg/m³) Page 97/ 165
 = 36.19 m Cone width of flame base = 3.777 m Cone width of flame end = 15.33 m Flame lift-off = 1.591 m Flame angle from vertical = 82.")
98 Enthalpy (kj/kmol) Entropy (kj/kmol*k) Cv (kj/kg*k) Cp (kj/kg*k) Sound velocity (m/s) Viscosity (e-3 kg/m*s) Surface tension (e-3 N/m) Jet Fire Jet Fire Summary Flame length (of frustum) = m Cone width of flame base = m Cone width of flame end = m Flame lift-off = m Flame angle from vertical = deg Flame angle, clockwise from North = 0 deg Surface emissive power = kw/m² Fraction of heat radiated = Total combustion power = MW Heat of combustion = kj/kg Side view Raw plot data Page 98/ 165


99 Top view Raw plot data Impingement Raw plot data Page 99/ 165
100 Pool Chart Liquid Pool Summary Released volume = m³ Pool equivalent diameter = m Pool surface area = m² Pool depth = 0.08 m Pool/tank diameter must be between 1 and 250 m Page 100/ 165
101 Dispersion Fluid is not capable of dispersion Page 101/ 165
102 Warnings 1 - Temperature outside experimental range -5 to 15 C 2 - Pressure downstream parameter has not been experimentally determined 3 - Pipe surface roughness parameter has not been experimentally determined 4 - Dew point calculation not possible at requested pressure 5 - Ambient temperature outside experimental range 0 to 15 C 6 - Releasable liquid volume outside extrapolated range 0.1 to 5000 m3 7 - Releasable liquid volume parameter has not been experimentally determined Page 102/ 165
103 top 19.6 Tank Top Fire [Fuel Oil 1] Scenario Summary Scenario Scenario = Tank Top Fire [Fuel Oil 1] Fluid = Fuel oil Tank Diameter = 40 m Height = 20 m Weather Ambient conditions Temperature = 20 C Relative humidity = 70 % Wind speed = 10 m/s Direction wind is going to = 0 deg (measured clockwise from North) Atmospheric stability conditions Define by = Pasquill class Pasquill class = D Neutral Thermal radiation Radiation contours = 1.58, 4.73, 6.31, 9.46, kw/m² Height at which plan view contours to be plotted = 20 m Cross flame distance at which side view contours to be plotted = 0 m Tank Top Fire Tank Top Fire Summary Flame length = m Flame angle from vertical = deg Flame base length = m Surface emissive power = 22.2 kw/m² Page 103/ 165
104 Side view Raw plot data Top view Raw plot data Page 104/ 165
105 Warnings 1 - For pool/tank fire models wind speed outside experimental range 2 to 8 m/s 2 - Pool/tank diameter outside experimental range 1 to 35 m 3 - Height for contour plots outside experimental range 0 to 3 m Page 105/ 165
106 top 19.7 Tank Top Fire [Fuel Oil 2] Scenario Summary Scenario Scenario = Tank Top Fire [Fuel Oil 2] Fluid = Fuel oil Tank Diameter = 40 m Height = 20 m Weather Ambient conditions Temperature = 20 C Relative humidity = 70 % Wind speed = 10 m/s Direction wind is going to = 0 deg (measured clockwise from North) Atmospheric stability conditions Define by = Pasquill class Pasquill class = D Neutral Thermal radiation Radiation contours = 1.58, 4.73, 6.31, 9.46, kw/m² Height at which plan view contours to be plotted = 20 m Cross flame distance at which side view contours to be plotted = 0 m Tank Top Fire Tank Top Fire Summary Flame length = m Flame angle from vertical = deg Flame base length = m Surface emissive power = 22.2 kw/m² Page 106/ 165


107 Side view Raw plot data Top view Raw plot data Page 107/ 165
108 Warnings 1 - For pool/tank fire models wind speed outside experimental range 2 to 8 m/s 2 - Pool/tank diameter outside experimental range 1 to 35 m 3 - Height for contour plots outside experimental range 0 to 3 m Page 108/ 165
109 top 19.8 Explosion [Natural Gas inside Turbine Building] Scenario Summary Scenario Scenario = Explosion [Natural Gas inside Turbine Building] Fluid = Methane Congested region Region size, m Number of grids Blockage ratio Length Width Height Complexity level = 1 With roof = yes Partially filled = no Angle of congested region length = 0 deg (measured clockwise from North) Pulse at a distance from edge of congested region Distance = 20 m Overpressure = bar Duration = 77.5 ms Rise time = 0.0 ms Source properties Overpressure = bar Radius = m Response at distances from edge of congested region Distance to 50% window breaking (0.020 bar) = m Distance to glass damage causing injury (0.050 bar) = m Distance to repairable damage to buildings (0.100 bar) = m Distance to heavy damage buildings/plant (0.340 bar) = 53.5 m Custom Contour Values Overpressure (mbar) Distance (m) Page 109/ 165
110 Exceedance Fuel Equivalant exceedance fuel = Methane Fuel Factor = Pressure Decay with Distance Chart Overpressure Raw plot data Warnings 1 - Congested region length outside experimental range 1 to 8 m 2 - Congested region width outside experimental range 1 to 8 m 3 - Congested region height outside experimental range 1 to 4 m 4 - Number of grids for length outside experimental range 4 to Number of grids for width outside experimental range 4 to Number of grids for height outside experimental range 2 to Blockage ratio for length outside experimental range 0.18 to Blockage ratio for width outside experimental range 0.18 to Blockage ratio for height outside experimental range 0.18 to 0.55 Page 110/ 165
111 top 19.9 Explosion [NG Building] Scenario Summary Scenario Scenario = Explosion [NG Building] Fluid = Methane Congested region Region size, m Number of grids Blockage ratio Length Width Height 10 Complexity level = 1 With roof = yes Partially filled = no Angle of congested region length = 0 deg (measured clockwise from North) Pulse at a distance from edge of congested region Distance = 20 m Overpressure = bar Duration = 60.6 ms Rise time = 0.0 ms Source properties Overpressure = bar Radius = m Response at distances from edge of congested region Distance to 50% window breaking (0.020 bar) = m Distance to glass damage causing injury (0.050 bar) = m Distance to repairable damage to buildings (0.100 bar) = m Distance to heavy damage buildings/plant (0.340 bar) = 34.4 m Custom Contour Values Overpressure (mbar) Distance (m) Page 111/ 165
112 Exceedance Fuel Equivalant exceedance fuel = Methane Fuel Factor = Pressure Decay with Distance Chart Overpressure Raw plot data Warnings 1 - Congested region length outside experimental range 1 to 8 m 2 - Congested region width outside experimental range 1 to 8 m 3 - Congested region height outside experimental range 1 to 4 m 4 - Number of grids for length outside experimental range 4 to Number of grids for width outside experimental range 4 to Number of grids for height outside experimental range 2 to Blockage ratio for length outside experimental range 0.18 to Blockage ratio for width outside experimental range 0.18 to 0.55 Page 112/ 165
113 top Explosion [Natural Gas inside Turbine Building] Scenario Summary Scenario Scenario = Explosion [Natural Gas inside Turbine Building] Fluid = Methane Congested region Region size, m Number of grids Blockage ratio Length Width Height Complexity level = 1 With roof = yes Partially filled = no Angle of congested region length = 0 deg (measured clockwise from North) Pulse at a distance from edge of congested region Distance = 20 m Overpressure = bar Duration = 77.5 ms Rise time = 0.0 ms Source properties Overpressure = bar Radius = m Response at distances from edge of congested region Distance to 50% window breaking (0.020 bar) = m Distance to glass damage causing injury (0.050 bar) = m Distance to repairable damage to buildings (0.100 bar) = m Distance to heavy damage buildings/plant (0.340 bar) = 53.5 m Custom Contour Values Overpressure (mbar) Distance (m) Page 113/ 165
114 Exceedance Fuel Equivalant exceedance fuel = Methane Fuel Factor = Pressure Decay with Distance Chart Overpressure Raw plot data Warnings 1 - Congested region length outside experimental range 1 to 8 m 2 - Congested region width outside experimental range 1 to 8 m 3 - Congested region height outside experimental range 1 to 4 m 4 - Number of grids for length outside experimental range 4 to Number of grids for width outside experimental range 4 to Number of grids for height outside experimental range 2 to Blockage ratio for length outside experimental range 0.18 to Blockage ratio for width outside experimental range 0.18 to Blockage ratio for height outside experimental range 0.18 to 0.55 Page 114/ 165
115 top Explosion [H2 Building] Scenario Summary Scenario Scenario = Explosion [H2 Building] Fluid = Hydrogen Congested region Region size, m Number of grids Blockage ratio Length Width Height 5 Complexity level = 1 With roof = yes Partially filled = no Angle of congested region length = 0 deg (measured clockwise from North) Pulse at a distance from edge of congested region Distance = 20 m Overpressure = bar Duration = 29.6 ms Rise time = 9.8 ms Source properties Overpressure = bar Radius = m Response at distances from edge of congested region Distance to 50% window breaking (0.020 bar) = m Distance to glass damage causing injury (0.050 bar) = 48.4 m Distance to repairable damage to buildings (0.100 bar) = 21.3 m Distance to heavy damage buildings/plant (0.340 bar) = 2.2 m Custom Contour Values Overpressure (mbar) Distance (m) Page 115/ 165
116 500 0 Exceedance Fuel Equivalant exceedance fuel = Hydrogen Fuel Factor = Pressure Decay with Distance Chart Overpressure Raw plot data Warnings 1 - Congested region length outside experimental range 1 to 8 m 2 - Congested region width outside experimental range 1 to 8 m 3 - Congested region height outside experimental range 1 to 4 m 4 - Number of grids for length outside experimental range 4 to Number of grids for width outside experimental range 4 to Number of grids for height outside experimental range 2 to Requested contour is greater than source pressure Page 116/ 165
117 top Vessel Burst [Steam Drum] Scenario Summary Scenario Scenario = Vessel Burst [Steam Drum] Fluid = Water Vessel Properties Pressure = 160 bara Tempertaure = 600 C Vessel Volume = m³ Gas Volume = 500 m³ Liquid Volume = 500 m³ Inerts Volume = 0 m³ Catalyst Volume = 0 m³ Vessel Burst Parameters Cylinder, High level Receptor distance = 40 m Receptor height = 0 m Brode Energy = 0.6 Fuel Composition Fluid = Water Component Component Fraction norm Water 1 Vessel Burst Vessel Burst Summary Receptor Overpressure = mbar Impulse = mbar * s Duration = s Overpressure may be under estimated. Shepherd Input Values Overpressure (P0) = mbar Impulse = mbar * s Duration = s Source Radius = 48.2 m Page 117/ 165
118 Pressure Raw plot data Impulse Raw plot data Page 118/ 165
119 Vessel Damage Injuries Raw plot data Fatalities Raw plot data Page 119/ 165
120 Structural Raw plot data Vessel Fire Damage Fluid is not capable of generating fireball Warnings 1 - Unable to calculate fireball properties - no fire damage results available 2 - Probits for head and body displacement are not valid above 4 bar Page 120/ 165
121 top Vessel Burst [Steam Drum] Scenario Summary Scenario Scenario = Vessel Burst [Steam Drum] Fluid = Water Vessel Properties Pressure = 160 bara Tempertaure = 600 C Vessel Volume = m³ Gas Volume = 500 m³ Liquid Volume = 500 m³ Inerts Volume = 0 m³ Catalyst Volume = 0 m³ Vessel Burst Parameters Cylinder, High level Receptor distance = 40 m Receptor height = 0 m Brode Energy = 0.6 Fuel Composition Fluid = Water Component Component Fraction norm Water 1 Vessel Burst Vessel Burst Summary Receptor Overpressure = mbar Impulse = mbar * s Duration = s Overpressure may be under estimated. Shepherd Input Values Overpressure (P0) = mbar Impulse = mbar * s Duration = s Source Radius = 48.2 m Page 121/ 165
122 Pressure Raw plot data Impulse Raw plot data Page 122/ 165
123 Vessel Damage Injuries Raw plot data Fatalities Raw plot data Page 123/ 165
124 Structural Raw plot data Vessel Fire Damage Fluid is not capable of generating fireball Warnings 1 - Unable to calculate fireball properties - no fire damage results available 2 - Probits for head and body displacement are not valid above 4 bar Page 124/ 165
125 top Vessel Burst [Steam Drum] Scenario Summary Scenario Scenario = Vessel Burst [Steam Drum] Fluid = Water Vessel Properties Pressure = 160 bara Tempertaure = 600 C Vessel Volume = m³ Gas Volume = 500 m³ Liquid Volume = 500 m³ Inerts Volume = 0 m³ Catalyst Volume = 0 m³ Vessel Burst Parameters Cylinder, High level Receptor distance = 40 m Receptor height = 0 m Brode Energy = 0.6 Fuel Composition Fluid = Water Component Component Fraction norm Water 1 Vessel Burst Vessel Burst Summary Receptor Overpressure = mbar Impulse = mbar * s Duration = s Overpressure may be under estimated. Shepherd Input Values Overpressure (P0) = mbar Impulse = mbar * s Duration = s Source Radius = 48.2 m Page 125/ 165
126 Pressure Raw plot data Impulse Raw plot data Page 126/ 165
127 Vessel Damage Injuries Raw plot data Fatalities Raw plot data Page 127/ 165
128 Structural Raw plot data Vessel Fire Damage Fluid is not capable of generating fireball Warnings 1 - Unable to calculate fireball properties - no fire damage results available 2 - Probits for head and body displacement are not valid above 4 bar Page 128/ 165
129 top Vessel Burst [Steam Drum] Scenario Summary Scenario Scenario = Vessel Burst [Steam Drum] Fluid = Water Vessel Properties Pressure = 160 bara Tempertaure = 600 C Vessel Volume = m³ Gas Volume = 500 m³ Liquid Volume = 500 m³ Inerts Volume = 0 m³ Catalyst Volume = 0 m³ Vessel Burst Parameters Cylinder, High level Receptor distance = 40 m Receptor height = 0 m Brode Energy = 0.6 Fuel Composition Fluid = Water Component Component Fraction norm Water 1 Vessel Burst Vessel Burst Summary Receptor Overpressure = mbar Impulse = mbar * s Duration = s Overpressure may be under estimated. Shepherd Input Values Overpressure (P0) = mbar Impulse = mbar * s Duration = s Source Radius = 48.2 m Page 129/ 165
130 Pressure Raw plot data Impulse Raw plot data Page 130/ 165
131 Vessel Damage Injuries Raw plot data Fatalities Raw plot data Page 131/ 165
132 Structural Raw plot data Vessel Fire Damage Fluid is not capable of generating fireball Warnings 1 - Unable to calculate fireball properties - no fire damage results available 2 - Probits for head and body displacement are not valid above 4 bar Page 132/ 165
133 top Fire [Switchgear] Scenario Summary Scenario Scenario = Fire [Switchgear] Fluid = Lubricating oil (turbine) Trench Width = 20 m Length = 40 m Angle from north = 0 deg Weather Ambient conditions Temperature = 20 C Relative humidity = 70 % Wind speed = 10 m/s Direction wind is going to = 0 deg (measured clockwise from North) Atmospheric stability conditions Define by = Pasquill class Pasquill class = D Neutral Thermal radiation Radiation contours = 1.58, 4.73, 6.31, 9.46, kw/m² Height at which plan view contours to be plotted = 0 m Cross flame distance at which side view contours to be plotted = 0 m Trench Fire Trench Fire Summary Flame length = m Flame angle from vertical = 0 deg Flame base length = 20 m Surface emissive power (top) = 22.2 kw/m² Surface emissive power (bottom) = 130 kw/m² Clear flame height = m Page 133/ 165
134 Side view Raw plot data Top view Raw plot data Warnings 1 - Ambient temperature outside experimental range 0 to 15 C 2 - For trench fire models wind speed outside experimental range 1 to m/s 3 - Trench width outside experimental range 0.82 to 4 m Page 134/ 165
135 top Fire [Switchgear Control] Scenario Summary Scenario Scenario = Fire [Switchgear Control] Fluid = Lubricating oil (turbine) Trench Width = 5 m Length = 10 m Angle from north = 0 deg Weather Ambient conditions Temperature = 20 C Relative humidity = 70 % Wind speed = 10 m/s Direction wind is going to = 0 deg (measured clockwise from North) Atmospheric stability conditions Define by = Pasquill class Pasquill class = D Neutral Thermal radiation Radiation contours = 1.58, 4.73, 6.31, 9.46, kw/m² Height at which plan view contours to be plotted = 0 m Cross flame distance at which side view contours to be plotted = 0 m Trench Fire Trench Fire Summary Flame length = m Flame angle from vertical = 0 deg Flame base length = 5 m Surface emissive power (top) = 22.2 kw/m² Surface emissive power (bottom) = 130 kw/m² Clear flame height = m Page 135/ 165
136 Side view Raw plot data Top view Raw plot data Warnings 1 - Ambient temperature outside experimental range 0 to 15 C 2 - For trench fire models wind speed outside experimental range 1 to m/s 3 - Trench width outside experimental range 0.82 to 4 m Page 136/ 165
137 top Fire [Control / Electrical Building] Scenario Summary Scenario Scenario = Fire [Control / Electrical Building] Fluid = Lubricating oil (turbine) Trench Width = 10 m Length = 20 m Angle from north = 0 deg Weather Ambient conditions Temperature = 20 C Relative humidity = 70 % Wind speed = 10 m/s Direction wind is going to = 0 deg (measured clockwise from North) Atmospheric stability conditions Define by = Pasquill class Pasquill class = D Neutral Thermal radiation Radiation contours = 1.58, 4.73, 6.31, 9.46, kw/m² Height at which plan view contours to be plotted = 0 m Cross flame distance at which side view contours to be plotted = 0 m Trench Fire Trench Fire Summary Flame length = 10.3 m Flame angle from vertical = 0 deg Flame base length = 10 m Surface emissive power (top) = 22.2 kw/m² Surface emissive power (bottom) = 130 kw/m² Clear flame height = m Page 137/ 165
138 Side view Raw plot data Top view Raw plot data Warnings 1 - Ambient temperature outside experimental range 0 to 15 C 2 - For trench fire models wind speed outside experimental range 1 to m/s 3 - Trench width outside experimental range 0.82 to 4 m Page 138/ 165
139 top Fire [Control / Electrical Building] Scenario Summary Scenario Scenario = Fire [Control / Electrical Building] Fluid = Lubricating oil (turbine) Trench Width = 10 m Length = 20 m Angle from north = 0 deg Weather Ambient conditions Temperature = 20 C Relative humidity = 70 % Wind speed = 10 m/s Direction wind is going to = 0 deg (measured clockwise from North) Atmospheric stability conditions Define by = Pasquill class Pasquill class = D Neutral Thermal radiation Radiation contours = 1.58, 4.73, 6.31, 9.46, kw/m² Height at which plan view contours to be plotted = 0 m Cross flame distance at which side view contours to be plotted = 0 m Trench Fire Trench Fire Summary Flame length = 10.3 m Flame angle from vertical = 0 deg Flame base length = 10 m Surface emissive power (top) = 22.2 kw/m² Surface emissive power (bottom) = 130 kw/m² Clear flame height = m Page 139/ 165
140 Side view Raw plot data Top view Raw plot data Warnings 1 - Ambient temperature outside experimental range 0 to 15 C 2 - For trench fire models wind speed outside experimental range 1 to m/s 3 - Trench width outside experimental range 0.82 to 4 m Page 140/ 165
141 top Fire [Electrical Building] Scenario Summary Scenario Scenario = Fire [Electrical Building] Fluid = Lubricating oil (turbine) Trench Width = 5 m Length = 10 m Angle from north = 0 deg Weather Ambient conditions Temperature = 20 C Relative humidity = 70 % Wind speed = 10 m/s Direction wind is going to = 0 deg (measured clockwise from North) Atmospheric stability conditions Define by = Pasquill class Pasquill class = D Neutral Thermal radiation Radiation contours = 1.58, 4.73, 6.31, 9.46, kw/m² Height at which plan view contours to be plotted = 0 m Cross flame distance at which side view contours to be plotted = 0 m Trench Fire Trench Fire Summary Flame length = m Flame angle from vertical = 0 deg Flame base length = 5 m Surface emissive power (top) = 22.2 kw/m² Surface emissive power (bottom) = 130 kw/m² Clear flame height = m Page 141/ 165


142 Side view Raw plot data Top view Raw plot data Warnings 1 - Ambient temperature outside experimental range 0 to 15 C 2 - For trench fire models wind speed outside experimental range 1 to m/s 3 - Trench width outside experimental range 0.82 to 4 m Page 142/ 165
143 top Fire [Transformer] Scenario Summary Scenario Scenario = Fire [Transformer] Fluid = Lubricating oil (turbine) Trench Width = 10 m Length = 20 m Angle from north = 0 deg Weather Ambient conditions Temperature = 20 C Relative humidity = 70 % Wind speed = 10 m/s Direction wind is going to = 0 deg (measured clockwise from North) Atmospheric stability conditions Define by = Pasquill class Pasquill class = D Neutral Thermal radiation Radiation contours = 1.58, 4.73, 6.31, 9.46, kw/m² Height at which plan view contours to be plotted = 0 m Cross flame distance at which side view contours to be plotted = 0 m Trench Fire Trench Fire Summary Flame length = 10.3 m Flame angle from vertical = 0 deg Flame base length = 10 m Surface emissive power (top) = 22.2 kw/m² Surface emissive power (bottom) = 130 kw/m² Clear flame height = m Page 143/ 165
144 Side view Raw plot data Top view Raw plot data Warnings 1 - Ambient temperature outside experimental range 0 to 15 C 2 - For trench fire models wind speed outside experimental range 1 to m/s 3 - Trench width outside experimental range 0.82 to 4 m Page 144/ 165
145 top Fire [Transformer] Scenario Summary Scenario Scenario = Fire [Transformer] Fluid = Lubricating oil (turbine) Trench Width = 10 m Length = 20 m Angle from north = 0 deg Weather Ambient conditions Temperature = 20 C Relative humidity = 70 % Wind speed = 10 m/s Direction wind is going to = 0 deg (measured clockwise from North) Atmospheric stability conditions Define by = Pasquill class Pasquill class = D Neutral Thermal radiation Radiation contours = 1.58, 4.73, 6.31, 9.46, kw/m² Height at which plan view contours to be plotted = 0 m Cross flame distance at which side view contours to be plotted = 0 m Trench Fire Trench Fire Summary Flame length = 10.3 m Flame angle from vertical = 0 deg Flame base length = 10 m Surface emissive power (top) = 22.2 kw/m² Surface emissive power (bottom) = 130 kw/m² Clear flame height = m Page 145/ 165
146 Side view Raw plot data Top view Raw plot data Warnings 1 - Ambient temperature outside experimental range 0 to 15 C 2 - For trench fire models wind speed outside experimental range 1 to m/s 3 - Trench width outside experimental range 0.82 to 4 m Page 146/ 165
147 top Fire [Transformer] Scenario Summary Scenario Scenario = Fire [Transformer] Fluid = Lubricating oil (turbine) Trench Width = 10 m Length = 20 m Angle from north = 0 deg Weather Ambient conditions Temperature = 20 C Relative humidity = 70 % Wind speed = 10 m/s Direction wind is going to = 0 deg (measured clockwise from North) Atmospheric stability conditions Define by = Pasquill class Pasquill class = D Neutral Thermal radiation Radiation contours = 1.58, 4.73, 6.31, 9.46, kw/m² Height at which plan view contours to be plotted = 0 m Cross flame distance at which side view contours to be plotted = 0 m Trench Fire Trench Fire Summary Flame length = 10.3 m Flame angle from vertical = 0 deg Flame base length = 10 m Surface emissive power (top) = 22.2 kw/m² Surface emissive power (bottom) = 130 kw/m² Clear flame height = m Page 147/ 165
148 Side view Raw plot data Top view Raw plot data Warnings 1 - Ambient temperature outside experimental range 0 to 15 C 2 - For trench fire models wind speed outside experimental range 1 to m/s 3 - Trench width outside experimental range 0.82 to 4 m Page 148/ 165
149 top Fire [Transformer] Scenario Summary Scenario Scenario = Fire [Transformer] Fluid = Lubricating oil (turbine) Trench Width = 10 m Length = 20 m Angle from north = 0 deg Weather Ambient conditions Temperature = 20 C Relative humidity = 70 % Wind speed = 10 m/s Direction wind is going to = 0 deg (measured clockwise from North) Atmospheric stability conditions Define by = Pasquill class Pasquill class = D Neutral Thermal radiation Radiation contours = 1.58, 4.73, 6.31, 9.46, kw/m² Height at which plan view contours to be plotted = 0 m Cross flame distance at which side view contours to be plotted = 0 m Trench Fire Trench Fire Summary Flame length = 10.3 m Flame angle from vertical = 0 deg Flame base length = 10 m Surface emissive power (top) = 22.2 kw/m² Surface emissive power (bottom) = 130 kw/m² Clear flame height = m Page 149/ 165
150 Side view Raw plot data Top view Raw plot data Warnings 1 - Ambient temperature outside experimental range 0 to 15 C 2 - For trench fire models wind speed outside experimental range 1 to m/s 3 - Trench width outside experimental range 0.82 to 4 m Page 150/ 165
151 top Fire [Transformer] Scenario Summary Scenario Scenario = Fire [Transformer] Fluid = Lubricating oil (turbine) Trench Width = 10 m Length = 20 m Angle from north = 0 deg Weather Ambient conditions Temperature = 20 C Relative humidity = 70 % Wind speed = 10 m/s Direction wind is going to = 0 deg (measured clockwise from North) Atmospheric stability conditions Define by = Pasquill class Pasquill class = D Neutral Thermal radiation Radiation contours = 1.58, 4.73, 6.31, 9.46, kw/m² Height at which plan view contours to be plotted = 0 m Cross flame distance at which side view contours to be plotted = 0 m Trench Fire Trench Fire Summary Flame length = 10.3 m Flame angle from vertical = 0 deg Flame base length = 10 m Surface emissive power (top) = 22.2 kw/m² Surface emissive power (bottom) = 130 kw/m² Clear flame height = m Page 151/ 165
152 Side view Raw plot data Top view Raw plot data Warnings 1 - Ambient temperature outside experimental range 0 to 15 C 2 - For trench fire models wind speed outside experimental range 1 to m/s 3 - Trench width outside experimental range 0.82 to 4 m Page 152/ 165
153 top Fire [Transformer] Scenario Summary Scenario Scenario = Fire [Transformer] Fluid = Lubricating oil (turbine) Trench Width = 10 m Length = 20 m Angle from north = 0 deg Weather Ambient conditions Temperature = 20 C Relative humidity = 70 % Wind speed = 10 m/s Direction wind is going to = 0 deg (measured clockwise from North) Atmospheric stability conditions Define by = Pasquill class Pasquill class = D Neutral Thermal radiation Radiation contours = 1.58, 4.73, 6.31, 9.46, kw/m² Height at which plan view contours to be plotted = 0 m Cross flame distance at which side view contours to be plotted = 0 m Trench Fire Trench Fire Summary Flame length = 10.3 m Flame angle from vertical = 0 deg Flame base length = 10 m Surface emissive power (top) = 22.2 kw/m² Surface emissive power (bottom) = 130 kw/m² Clear flame height = m Page 153/ 165


154 Side view Raw plot data Top view Raw plot data Warnings 1 - Ambient temperature outside experimental range 0 to 15 C 2 - For trench fire models wind speed outside experimental range 1 to m/s 3 - Trench width outside experimental range 0.82 to 4 m Page 154/ 165
155 top Fire [Warehouse / Workshop] Scenario Summary Scenario Scenario = Fire [Warehouse / Workshop] Fluid = Lubricating oil (turbine) Trench Width = 20 m Length = 40 m Angle from north = 0 deg Weather Ambient conditions Temperature = 20 C Relative humidity = 70 % Wind speed = 10 m/s Direction wind is going to = 0 deg (measured clockwise from North) Atmospheric stability conditions Define by = Pasquill class Pasquill class = D Neutral Thermal radiation Radiation contours = 1.58, 4.73, 6.31, 9.46, kw/m² Height at which plan view contours to be plotted = 0 m Cross flame distance at which side view contours to be plotted = 0 m Trench Fire Trench Fire Summary Flame length = m Flame angle from vertical = 0 deg Flame base length = 20 m Surface emissive power (top) = 22.2 kw/m² Surface emissive power (bottom) = 130 kw/m² Clear flame height = m Page 155/ 165
156 Side view Raw plot data Top view Raw plot data Warnings 1 - Ambient temperature outside experimental range 0 to 15 C 2 - For trench fire models wind speed outside experimental range 1 to m/s 3 - Trench width outside experimental range 0.82 to 4 m Page 156/ 165
157 top Fire [Electrical Building] Scenario Summary Scenario Scenario = Fire [Electrical Building] Fluid = Lubricating oil (turbine) Trench Width = 10 m Length = 30 m Angle from north = 0 deg Weather Ambient conditions Temperature = 20 C Relative humidity = 70 % Wind speed = 10 m/s Direction wind is going to = 0 deg (measured clockwise from North) Atmospheric stability conditions Define by = Pasquill class Pasquill class = D Neutral Thermal radiation Radiation contours = 1.58, 4.73, 6.31, 9.46, kw/m² Height at which plan view contours to be plotted = 0 m Cross flame distance at which side view contours to be plotted = 0 m Trench Fire Trench Fire Summary Flame length = m Flame angle from vertical = 0 deg Flame base length = 10 m Surface emissive power (top) = 22.2 kw/m² Surface emissive power (bottom) = 130 kw/m² Clear flame height = m Page 157/ 165


158 Side view Raw plot data Top view Raw plot data Warnings 1 - Ambient temperature outside experimental range 0 to 15 C 2 - For trench fire models wind speed outside experimental range 1 to m/s 3 - Trench width outside experimental range 0.82 to 4 m Page 158/ 165
159 top Fire [Office Building] Scenario Summary Scenario Scenario = Fire [Office Building] Fluid = Lubricating oil (turbine) Trench Width = 20 m Length = 40 m Angle from north = 90 deg Weather Ambient conditions Temperature = 20 C Relative humidity = 70 % Wind speed = 10 m/s Direction wind is going to = 90 deg (measured clockwise from North) Atmospheric stability conditions Define by = Pasquill class Pasquill class = D Neutral Thermal radiation Radiation contours = 1.58, 4.73, 6.31, 9.46, kw/m² Height at which plan view contours to be plotted = 0 m Cross flame distance at which side view contours to be plotted = 0 m Trench Fire Trench Fire Summary Flame length = m Flame angle from vertical = 0 deg Flame base length = 20 m Surface emissive power (top) = 22.2 kw/m² Surface emissive power (bottom) = 130 kw/m² Clear flame height = m Page 159/ 165

160 Side view Raw plot data Top view Raw plot data Warnings 1 - Ambient temperature outside experimental range 0 to 15 C 2 - For trench fire models wind speed outside experimental range 1 to m/s 3 - Trench width outside experimental range 0.82 to 4 m Page 160/ 165
161 top Fire [Turbine] Scenario Summary Scenario Scenario = Fire [Turbine] Fluid = Lubricating oil (turbine) Trench Width = 10 m Length = 20 m Angle from north = 90 deg Weather Ambient conditions Temperature = 20 C Relative humidity = 70 % Wind speed = 1 m/s Direction wind is going to = 0 deg (measured clockwise from North) Atmospheric stability conditions Define by = Pasquill class Pasquill class = D Neutral Thermal radiation Radiation contours = 1.58, 4.73, 6.31, 9.46, kw/m² Height at which plan view contours to be plotted = 0 m Cross flame distance at which side view contours to be plotted = 0 m Trench Fire Trench Fire Summary Flame length = m Flame angle from vertical = 20.6 deg Flame base length = 10 m Surface emissive power (top) = 22.2 kw/m² Surface emissive power (bottom) = 130 kw/m² Clear flame height = m Page 161/ 165
162 Side view Raw plot data Top view Raw plot data Warnings 1 - Ambient temperature outside experimental range 0 to 15 C 2 - Trench width outside experimental range 0.82 to 4 m Page 162/ 165
163 top Fire [Turbine] Scenario Summary Scenario Scenario = Fire [Turbine] Fluid = Lubricating oil (turbine) Trench Width = 10 m Length = 20 m Angle from north = 90 deg Weather Ambient conditions Temperature = 20 C Relative humidity = 70 % Wind speed = 1 m/s Direction wind is going to = 0 deg (measured clockwise from North) Atmospheric stability conditions Define by = Pasquill class Pasquill class = D Neutral Thermal radiation Radiation contours = 1.58, 4.73, 6.31, 9.46, kw/m² Height at which plan view contours to be plotted = 0 m Cross flame distance at which side view contours to be plotted = 0 m Trench Fire Trench Fire Summary Flame length = m Flame angle from vertical = 20.6 deg Flame base length = 10 m Surface emissive power (top) = 22.2 kw/m² Surface emissive power (bottom) = 130 kw/m² Clear flame height = m Page 163/ 165

164 Side view Raw plot data Top view Raw plot data Warnings 1 - Ambient temperature outside experimental range 0 to 15 C 2 - Trench width outside experimental range 0.82 to 4 m Page 164/ 165
Practical Modelling & Hazard Assessment of LPG & LNG Spills
 Practical Modelling & Hazard Assessment of LPG & LNG Spills UKELG 3 rd April 2012 Tony Ennis Introduction Refrigerated or pressurised Release scenarios & release rate Vaporisation Gas dispersion Consequences
Identification and Screening of Scenarios for LOPA. Ken First Dow Chemical Company Midland, MI
 Identification and Screening of Scenarios for LOPA Ken First Dow Chemical Company Midland, MI 1 Layers of Protection Analysis (LOPA) LOPA is a semi-quantitative tool for analyzing and assessing risk. The
PRAGMATIC ASSESSMENT OF EXPLOSION RISKS TO THE CONTROL ROOM BUILDING OF A VINYL CHLORIDE PLANT
 PRAGMATIC ASSESSMENT OF EXPLOSION RISKS TO THE CONTROL ROOM BUILDING OF A VINYL CHLORIDE PLANT L.P. Sluijs 1, B.J. Haitsma 1 and P. Beaufort 2 1 Vectra Group Ltd. 2 Shin-Etsu (contact details: Vectra Group
INTRODUCTION. NFPA 704 Hazard Identification System INTRODUCTION INTRODUCTION. Health Flammability Instability INTRODUCTION INTRODUCTION
 NFPA 70 Hazard Identification System Introduction to Section 70 Hazard Identification System of the National Fire Protection Association. NFPA 70 Standard System for the Identification of the Hazards of
Using Consequence Modeling to Help Make Emergency Decisions
 Using Consequence Modeling to Help Make Emergency Decisions Della Wong / Nova Chemicals & Robert B. Gerow / SAFER-ERMC CSChE 2002 Conference October 20-23, 23, 2002 Vancouver B.C. If auto safety was like
Gerga Pressure Reduction Station
 The Quantitative Risk Assessment QRA Study For Gerga Pressure Reduction Station Prepared By Petroleum Safety and Environmental Services Company December 2015 Page 2 of 151 CONTENTS Executive Summary 12/151
USE OF THE EXCEEDANCE CURVE APPROACH IN OCCUPIED BUILDING RISK ASSESSMENT
 USE OF THE EXCEEDANCE CURVE APPROACH IN OCCUPIED BUILDING RISK ASSESSMENT Kieran J Glynn, Advisor Major Accident Risk, BP, UK The exceedance curve approach was developed following the issue of the 2003
Tema Pressure Reduction Station
 The Quantitative Risk Assessment QRA Study For Tema Pressure Reduction Station Prepared By Petroleum Safety and Environmental Services Company January 2016 EGAS.HSE.QRA.Study.PRS.02/Tema.No.02/2015/QRA/MG/MS/DNV-PHAST.7.0--Final
Improving Accuracy of Frequency Estimation of Major Vapor Cloud Explosions for Evaluating Control Room Location through Quantitative Risk Assessment
 Improving Accuracy of Frequency Estimation of Major Vapor Cloud Explosions for Evaluating Control Room Location through Quantitative Risk Assessment Naser Badri 1, Farshad Nourai 2 and Davod Rashtchian
Class 2 Gases Learning Tool
 Class 2 Gases Learning Tool This work has been produced by DGL (Aust) Pty Ltd This Learner s Guide is about the skills and knowledge required to store and warehouse Class 2 Gases at DGL (Aust) facilities.
Annexure 2: Rapid Risk Assesment RISK ANALYSIS
 RISK ANALYSIS (I) Catastrophic Rupture of LPG Bullet Truck (18 MT) At the LPG bottling plant, LPG will be transported by Bullet Truck tank. In the event of fire in LPG bullet truck in parking area, BLEVE
INHERENTLY SAFER DESIGN CASE STUDY OF RAPID BLOW DOWN ON OFFSHORE PLATFORM
 INHERENTLY SAFER DESIGN CASE STUDY OF RAPID BLOW DOWN ON OFFSHORE PLATFORM Volton Edwards bptt Angus Lyon DNV Energy Alastair Bird DNV Energy INTRODUCTION A term now in common usage within the oil & gas
BASF Flash Fire FRC Assessment Tool
 BASF Flash Fire FRC Assessment Tool Introduction The assessment tool offered in this document was developed to assist BASF manufacturing units in evaluating the potential for flash fire occurrence and
ANNEX AMENDMENTS TO THE INTERNATIONAL CODE FOR FIRE SAFETY SYSTEMS (FSS CODE) CHAPTER 15 INERT GAS SYSTEMS
 CHAPTER 15 INERT GAS SYSTEMS") Annex 3, page 2 ANNEX AMENDMENTS TO THE INTERNATIONAL CODE FOR FIRE SAFETY SYSTEMS (FSS CODE) CHAPTER 15 INERT GAS SYSTEMS The text of existing chapter 15 is replaced by the following: "1 Application This
Annex 3, page 2 ANNEX AMENDMENTS TO THE INTERNATIONAL CODE FOR FIRE SAFETY SYSTEMS (FSS CODE) CHAPTER 15 INERT GAS SYSTEMS The text of existing chapter 15 is replaced by the following: "1 Application This
SECTION 1: IDENTIFICATION OF THE SUBSTANCE/MIXTURE AND OF THE COMPANY
 Sonoma Expanded PVC Revision Date: 12/20/2013 Version: 1.0 SECTION 1: IDENTIFICATION OF THE SUBSTANCE/MIXTURE AND OF THE COMPANY 1.1. Product Identifier Product Form: Mixture Product Name: Sonoma PVC Synonyms:
1. PRODUCT INFORMATION
 Page 1 of 6 Date Prepared: January 10, 2004 Supersedes: January 09, 2004 MSDS Number: 6436 1. PRODUCT INFORMATION Product Identifier: Application and Use: Aviation synthetic lubricant Product Description:
3 rd Year Design Module Scope
 LOSS PREVENTION & Process Safety PROCESS HAZARDS ANALYSIS -3 rd Year Design Module - 3 rd Year Design Module Scope Hazard Identification In the Process 1. Identify the major hazards that are present 2.
Part 2.5 Dispersion Modeling Using ALOHA
 Part 2.5 Dispersion Modeling Using ALOHA Dr. Arshad Ahmad Email: arshad@utm.my 1 Software Commonly used for Risk Analysis Software SAFETI SFU CAFTAN ETRA HAZSEC. HAZTRAC. PHAST. WHAZAN EFFECTS. DAMAGE
POTENTIAL HAZARDS OF VARIOUS SUBSTANCES
 POTENTIAL HAZARDS OF CLASS 1 EXPLOSIVES For those Divisions and Compatibility Groups acceptable for carriage by air, little immediate health hazard. Should any explosives consignment become involved in
 Title of Paper Interpretation of IP15 in Process Plant Design: a Commonsense Approach ---------------------------------------------------------------------------------------------------------------------------
Absorption - The process of contacting a vapor and gas stream with an absorbing liquid to remove specific materials from the gas stream.
 Sufe Design and Optvation ofpi-oc.ess Vents and Emission Contid $wteins by Center for Chemical Process Safety Copyright 0 2006 John Wiley & Sons, Tnc. APPENDIX B GLOSSARY Absorption - The process of contacting
DIGITAL SOLUTIONS TRAINING CATALOGUE. QRA and CFD simulation. Phast, Safeti and KFX SAFER, SMARTER, GREENER
 DIGITAL SOLUTIONS TRAINING CATALOGUE QRA and CFD simulation Phast, Safeti and KFX SAFER, SMARTER, GREENER 02 PHAST, SAFETI AND KFX Training catalogue Global training Our increased focus on global training,
Product Name:Heat Sink Compound 1801 Morgan Street MSDS Number:148
 Section 4 - Fire & Explosion Hazard Data Flash Point (method): Flammable Limits-LEL: Flammable Limits-UEL: Extinguishing Agents: Fire Fighting Procedures and Equipment: Decomposition Products May Include:
A large Layer of Protection Analysis for a Gas terminal scenarios/ cause consequence pairs
 A large Layer of Protection Analysis for a Gas terminal 2000+ scenarios/ cause consequence pairs Richard Gowland European process Safety Centre The scope of the study was a large gas terminal handling
Hazard Communication Program. San José State University
 San José State University One Washington Square San José, California Facilities Development and Operations Department July 11, 2012 Page intentionally left blank SJSU_Hazard Communication Program_2012-0711.docx
MATERIAL SAFETY DATA SHEET
 Page 1 Identification Use: Automatic Transmission Fluid (all types) Not Classified as hazardous according to criteria of Worksafe Australia Company: Coast and Valley Oil Distributors UN No: Not assigned
API MPMS Chapter 17.6 Guidelines for Determining the Fullness of Pipelines between Vessels and Shore Tanks
 API MPMS Chapter 17.6 Guidelines for Determining the Fullness of Pipelines between Vessels and Shore Tanks 1. Scope This document describes procedures for determining or confirming the fill condition of
SAFETY TRAINING LEAFLET 06 CARBON DIOXIDE
 SAFETY TRAINING LEAFLET 06 CARBON DIOXIDE Doc 23.06/18 EUROPEAN INDUSTRIAL GASES ASSOCIATION AISBL AVENUE DES ARTS 3-5 B 1210 BRUSSELS Tel: +32 2 217 70 98 Fax: +32 2 219 85 14 E-mail: info@eiga.eu Internet:
MATERIAL SAFETY DATA SHEET
 MATERIAL SAFETY DATA SHEET 24 Madison Road, Fairfield, New Jersey 07004, USA MANUFACTURER: JEEN INTERNATIONAL CORPORATION 24 MADISON ROAD FAIRFIELD, NJ 07004 Telephone # 973-439-1401 Chemtrec Emergency
EXPLOSIVE ATMOSPHERES - CLASSIFICATION OF HAZARDOUS AREAS (ZONING) AND SELECTION OF EQUIPMENT
 AND SELECTION OF EQUIPMENT") EXPLOSIVE ATMOSPHERES - CLASSIFICATION OF HAZARDOUS AREAS (ZONING) AND SELECTION OF EQUIPMENT OVERVIEW ASSESSING THE RISK RELATIONSHIP BETWEEN FIRES AND EXPLOSIONS CLASSIFYING HAZARDOUS AREAS INTO ZONES
EXPLOSIVE ATMOSPHERES - CLASSIFICATION OF HAZARDOUS AREAS (ZONING) AND SELECTION OF EQUIPMENT OVERVIEW ASSESSING THE RISK RELATIONSHIP BETWEEN FIRES AND EXPLOSIONS CLASSIFYING HAZARDOUS AREAS INTO ZONES
Introduction to Emergency Response & Contingency Planning
 & Contingency Planning Rationale Why is it important for you to learn this material? Designed for those who may witness a release, this is an introductory course designed to help ensure those who are likely
GUIDANCE FOR MANAGING THE RISKS ASSOCIATED WITH END OF LIFE LPG VEHICLES
 GUIDANCE FOR MANAGING THE RISKS ASSOCIATED WITH END OF LIFE LPG VEHICLES NSW QUAD BIKE SAFETY IMPROVEMENT PROGRAM SNAPSHOT 2016 17 Disclaimer This publication may contain information about the regulation
Polypropylene Safety Data Sheet
 SECTION 1: IDENTIFICATION OF THE SUBSTANCE 1. Intended Use of the Product Use of the Substance/Mixture: For professional use only SECTION 2: HAZARDS IDENTIFICATION 2.1. Classification of the Substance
QUANTITATIVE RISK ASSESSMENT (QRA) REPORT
 REPORT") Report No.:- GCI/V/RMS/2017-18/BG/QRA/R00/1097 QUANTITATIVE RISK ASSESSMENT (QRA) REPORT Prepared For M/s. VADIVARHE SPECIALITY CHEMICALS LTD. Gat No. 204, Nashik-Mumbai Highway, Vadivarhe, Taluka: Igatpuri,
Report No.:- GCI/V/RMS/2017-18/BG/QRA/R00/1097 QUANTITATIVE RISK ASSESSMENT (QRA) REPORT Prepared For M/s. VADIVARHE SPECIALITY CHEMICALS LTD. Gat No. 204, Nashik-Mumbai Highway, Vadivarhe, Taluka: Igatpuri,
Controlling Benzene Exposure
 Controlling Benzene Exposure Agenda What is Benzene? How Could Benzene Affect Me? Where is Benzene Found? Where Might I be Exposed to Benzene? How do I Control Exposure? 2 What is Benzene? Benzene: A 6
Material Safety Data Sheet. Helmar Crystal Kote Picture Varnish Gloss
 IDENTIFICATION OF THE MATERIAL AND SUPPLIER Company Name Helmar Australia Pty Ltd ABN 28 003 425 796 Address 54-56 Brisbane Road, Riverstone NSW 2765 Emergency Tel: 0418 230 719 Tel / Fax: (02) 9627 4666
MATERIAL SAFETY DATA SHEET
 Lyden Oil ProGuard EDM Fluid MATERIAL SAFETY DATA SHEET 1. CHEMICAL PRODUCT AND COMPANY IDENTIFICATION Product Identification Product Name: ProGuard EDM Fluid Synonyms: Petroleum Lubricating Oil, Petroleum
Refined Glycerine Kosher 99.50% Minimum CAS No
 Material Safety Data Sheet Effectivity Date : 26 August 2008 Page 1 of 6 Revision No. : 01 Refined Glycerine Kosher 99.50% Minimum CAS No. 56-81-5 1. Chemical Identification & Company Information Chemical
Responding to Natural Gas Pipeline Emergencies
 Responding to Natural Gas Pipeline Emergencies Who is Florida Gas Transmission? Florida Gas Transmission operates nearly 5,000-miles of interstate natural gas transmission pipelines, a system that extends
: ASP50F Adhesive Side Powder, Fluorescent
 SECTION 1: Identification 1.1. Identification Product form Substance name Product code : Substance : ASP50F Adhesive Side Powder, Fluorescent : ASP50F 1.2. Relevant identified uses of the substance or
SAFETY DATA SHEET INDUSTRIAL EP COMPOUND HEAVY DUTY GEAR LUBRICANTS Revision Date:
 SAFETY DATA SHEET INDUSTRIAL EP COMPOUND HEAVY DUTY GEAR LUBRICANTS Revision Date: 06-01-2018 Section 1. Identification Product Identifier Product Name Industrial EP Compound Heavy Duty Gear Lubricants
MAJOR INDUSTRIAL HAZARDS
 MAJOR INDUSTRIAL HAZARDS Compilation: Dr. Asit Patra, DMI - 2009 Introduction Chemical industries are growing very fast. Major installations such as Gas processing complexes, Petroleum Refineries, Fertilizers
: MCM100CA Mikrosil Catalyst
 SECTION 1: Identification 1.1. Identification Product form Product name Product code : Mixture : MCM100CA Mikrosil Catalyst : MCM100CA 1.2. Relevant identified uses of the substance or mixture and uses
SAFETY MANUAL PURGING, VENTING & DRAINING PROCEDURE TABLE OF CONTENTS 1. INTRODUCTION SCOPE DEFINITIONS PROCEDURE...
 Page 1 of 11 TABLE OF CONTENTS 1. INTRODUCTION... 2 2. SCOPE... 2 3. DEFINITIONS... 2 4.... 3 5. RESPONSIBILTIES... 10 6. REFERENCES... 10 7. ATTACHMENTS... 11 8. APPENDICES... 11 Rev. Issue Date Amendment
The Right to Know Laws and Assessment of Risks & Hazards 2004
 The Right to Know Laws and Assessment of Risks & Hazards 2004 Both the federal and state governments require that employers provide information to their employees (and students) information about the potential
EMERGENCY RESPONDER INFORMATION
 EMERGENCY RESPONDER INFORMATION Ammonia is a Toxic Gas When released can come out as liquid and as a vapor cloud at the same time. Vapor cloud can be heavier than air Vapor cloud can be white or invisible
THE SIGNIFICANCE OF HAZARD ENDPOINTS IN QUANTITATIVE RISK ANALYSIS
 THE SIGNIFICANCE OF HAZARD ENDPOINTS IN QUANTITATIVE RISK ANALYSIS John B. Cornwell and Jeffrey D. Marx Presented At 6 Process Plant Safety Symposium Houston, Texas April -2, 6 Presented By Quest Consultants
KENYA STANDARD KS 2386: PART 8: 2018 Emergency procedure guide- Transport (Road, Rail) Part 8: Gases
 Part 8: Gases") KENYA STANDARD KS 2386: PART 8: 2018 Emergency procedure guide- Transport (Road, Rail) Part 8: Gases No copying of this standard without KEBS permission except as permitted by copyright law TECHNICAL COMMITTEE
KENYA STANDARD KS 2386: PART 8: 2018 Emergency procedure guide- Transport (Road, Rail) Part 8: Gases No copying of this standard without KEBS permission except as permitted by copyright law TECHNICAL COMMITTEE
SAFETY DATA SHEET V4 in accordance with Regulation (EC) 1907/2006 (REACH) amеnded with Commission Regulation(EU) 2015/830
 1907/2006 (REACH) amеnded with Commission Regulation(EU) 2015/830") Page 1 of 6 SAFETY DATA SHEET V4 in accordance with Regulation (EC) 1907/2006 (REACH) amеnded with Commission Regulation(EU) 2015/830 V4 amendments in this revision SECTION 1: IDENTIFICATION OF THE SUBSTANCE/MIXTURE
Page 1 of 6 SAFETY DATA SHEET V4 in accordance with Regulation (EC) 1907/2006 (REACH) amеnded with Commission Regulation(EU) 2015/830 V4 amendments in this revision SECTION 1: IDENTIFICATION OF THE SUBSTANCE/MIXTURE
HAZARD COMMUNICATION & THE GLOBAL HARMONIZING SYSTEM EMPLOYEE TRAINING. Leader s Guide. ERI Safety Videos
 2876 HAZARD COMMUNICATION & THE GLOBAL HARMONIZING SYSTEM EMPLOYEE TRAINING Leader s Guide ERI Safety Videos HAZARD COMMUNICATION & THE GLOBAL HARMONIZING SYSTEM EMPLOYEE TRAINING This easy-to-use Leader
Hazard Communication
 Hazard Communication You Have A Right To Know This standard was designed to protect employees who use hazardous materials on the job The HCS states that companies which use hazardous materials must provide
MATERIAL SAFETY DATA SHEET
 MATERIAL SAFETY DATA SHEET Product: HELIUM Chemical Name Helium Chemical Family: Inert Rare Gas Identification: Symbol : He UN 1046 Synonyms: Helium -4, refrigerant gas R-704, laser Star helium, Medipure
SAFETY DATA SHEET GAS MIXTURES ARGON 75% CARBON DIOXIDE 25%
 PAGE NO. 1 of 10 1 PRODUCT AND COMPANY IDENTIFICATION 1.1 PRODUCT IDENTIFIER : 1.1.1 PRODUCT NAME 75% Argon, 25% Carbon Dioxide 1.1.2 SYNONYMS 1.1.3 CAS NUMBER 1.1.4 CHEMICAL FORMULA Argon: 7440371 Carbon
FIRE AND EXPLOSION HAZARD MANAGEMENT
 FIRE AND EXPLOSION HAZARD MANAGEMENT Toolbox Talk Practical Applications (Part 2) Setting the standard in oil and gas safety 1 WHAT SHOULD I KNOW ABOUT FIRES AND EXPLOSIONS» One-size-fits-all solution
Health & Safety Policy and Procedures Manual SECTION 34 HYDROGEN SULFIDE (H2S) PROGRAM
 PROGRAM") SECTION 34 HYDROGEN SULFIDE (H2S) PROGRAM 1. REGULATORY STANDARD: OSHA - 29 CFR 1910.1200 and 1926.55 Purpose: The purpose of this program is to inform interested persons, including employees, that Maul
SECTION 34 HYDROGEN SULFIDE (H2S) PROGRAM 1. REGULATORY STANDARD: OSHA - 29 CFR 1910.1200 and 1926.55 Purpose: The purpose of this program is to inform interested persons, including employees, that Maul
Engineering Safety into the Design
 Engineering safety into the design Peter Scantlebury P.Eng Technical Safety Manager Amec Foster Wheeler, Oil & Gas Canada Abstract Safety by design is Amec Foster Wheeler s systematic approach to engineering
Safety Engineering - Hazard Identification Techniques - M. Jahoda
 Safety Engineering - Hazard Identification Techniques - M. Jahoda Hazard identification The risk management of a plant 2 Identification of the hazards involved in the operation of the plant, due to the
Purpose Written Program Hazard Classifications (GHS) SDS Sheets (GHS) Labels (GHS) Employee Training Chemical Safety Questions
 SDS Sheets (GHS) Labels (GHS) Employee Training Chemical Safety Questions") Purpose Written Program Hazard Classifications (GHS) SDS Sheets (GHS) Labels (GHS) Employee Training Chemical Safety Questions Rights Reserved. 2 Purpose: Ensure that the hazards of all chemicals produced
Purpose Written Program Hazard Classifications (GHS) SDS Sheets (GHS) Labels (GHS) Employee Training Chemical Safety Questions Rights Reserved. 2 Purpose: Ensure that the hazards of all chemicals produced
SAFETY DATA SHEET 49N SYNTHETIC GLOBAL ATF Revision Date:
 SAFETY DATA SHEET 49N SYNTHETIC GLOBAL ATF Revision Date: 06-26-2018 Section 1. Identification Product Identifier Product Name 49N Synthetic Global ATF Common Name Transmission Fluid Product Code(s) 32499
HAZMAT. Advancement Module 03 Dallas CERT
 HAZMAT Advancement Module 03 Dallas CERT Materials for this unit: You should have a copy of the Emergency Response Guidebook, either in print or online, plus - paper and a pen or pencil The current electronic
Shell Material Safety Data Sheet
 MSDS sheet for SOLVENT D Page 1 Shell Material Safety Data Sheet Infosafe No. BAC8P Issue Date: June 1999 ISSUED by SHELL Product Name: SOLVENT D Classified as hazardous according to criteria of NOHSC
1. PRODUCT INFORMATION
 Page 1 of 6 Date Prepared: March 22, 2003 Supersedes: November 08, 2002 MSDS Number: 15046 1. PRODUCT INFORMATION Product Identifier: ESSOLUBE HDX PLUS ENGINE OIL 10W-30 Application and Use: Mineral oil
Drum / cylinder handling
 Page 1 of 8 Drum / cylinder handling This Technical Measures Document covers the storage and handling of toxic and flammable substances in drums and cylinders and refers to relevant codes of practice and
SAFETY DATA SHEET. TRD Revision 01/30/ PRODUCT AND COMPANY IDENTIFICATION 2. HAZARDOUS IDENTIFICATION
 1. PRODUCT AND COMPANY IDENTIFICATION Product Identifier Recommended use Distributed by: Antifoam DyChem International 560 North 500 West Salt Lake City, UT 84116 (800) 453-4606 Emergency Contact # (24
MATERIAL SAFETY DATA SHEET COMPANY: HAYCARB HOLDINGS (AUST) PTY LTD
 PTY LTD") MATERIAL SAFETY DATA SHEET COMPANY: HAYCARB HOLDINGS (AUST) PTY LTD PRODUCT: ACTIVATED CARBON SECTION 1 IDENTIFICATION OF THE MATERIAL & THE SUPPLIER Haycarb Holdings (Aust) Pty Ltd Emergency Telephone
MATERIAL SAFETY DATA SHEET COMPANY: HAYCARB HOLDINGS (AUST) PTY LTD PRODUCT: ACTIVATED CARBON SECTION 1 IDENTIFICATION OF THE MATERIAL & THE SUPPLIER Haycarb Holdings (Aust) Pty Ltd Emergency Telephone
Challenges in Relief Design for Pilot Plants
 Challenges in Relief Design for Pilot Plants Published on July 5, 2017 Michael Trainor Relief system design at the pilot scale presents unique challenges that don t always apply at the commercial scale.
SAFETY DATA SHEET. Section 1: Company and Product Identification. Section 2: Hazard(s) Identification. Section 3: Product Composition
 Identification. Section 3: Product Composition") This Safety Data Sheet contains environmental, health and toxicology information for your employees. Please make sure this information is given to them. It also contains information to help you meet community
This Safety Data Sheet contains environmental, health and toxicology information for your employees. Please make sure this information is given to them. It also contains information to help you meet community
Material Safety Data Sheet
 Material Safety Data Sheet MSDS: 760 SECTION 1: CHEMICAL PRODUCT AND COMPANY INFORMATION Company: HAZARD RATING SCALE IDQ Operating, Inc. Health 1 0 = Insignificant 2901 W Kingsley Rd. Fire: 2 1 = Slight
PURPOSE OF THE POLICY
 Title: Safe Storage, Handling, Use and Disposal Procedures of Compressed Gas Cylinders Effective Date: November 2005 Revision Date: March 1, 2017 Issuing Authority: Responsible Officer: VP, Capital Projects
Revision Date 26-Sep IDENTIFICATION OF THE SUBSTANCE/MIXTURE AND OF THE COMPANY/UNDERTAKING. No information available
 Issuing date No data available Safety Data Sheet Version 4 1.1 Product identifier 1. IDENTIFICATION OF THE SUBSTANCE/MIXTURE AND OF THE COMPANY/UNDERTAKING Product Code(s) Product name AB143080 1.2 Relevant
: Cleaners, liquids (all purpose cleaners, sanitary products, floor cleaners, glass cleaners, carpet cleaners, metal cleaners)
") SECTION 1: Identification 1.1. Identification Product form Product name Date of issue: 07/16/2018 Revision date: 03/16/2016 : Mixture : Product code : 2019-2152 1.2. Recommended use and restrictions on
SECTION 1: Identification 1.1. Identification Product form Product name Date of issue: 07/16/2018 Revision date: 03/16/2016 : Mixture : Product code : 2019-2152 1.2. Recommended use and restrictions on
SAFETY DATA SHEET 1. IDENTIFICATION 2. HAZARDS IDENTIFICATION. Product Identifier. Additional Identification Product Code: Synonyms: 19015
 1. IDENTIFICATION Product Identifier Product Name: CPG Clean Additional Identification Product Code: 15037 Synonyms: 19015 Recommended use of the chemical and restrictions on use Recommended use: Acid
Class 1 (Explosive) Hazmat: The Hazardous Materials Table. Hazard Classifications Used in Hazmat Table, Column 3
 Hazmat: The Hazardous Materials Table. Hazard Classifications Used in Hazmat Table, Column 3") Hazard Classifications Used in Hazmat Table, Column 3 Class Number None None Division Number (if any) Name of class or division... Forbidden Material... Forbidden Explosives Class 1 (Explosive) Known hazards
Hazard Classifications Used in Hazmat Table, Column 3 Class Number None None Division Number (if any) Name of class or division... Forbidden Material... Forbidden Explosives Class 1 (Explosive) Known hazards
CONTRACTOR WHS HAZARD STANDARD HAZARDOUS CHEMICALS EXTERNAL USE ONLY
 CONTRACTOR WHS HAZARD STANDARD HAZARDOUS CHEMICALS EXTERNAL USE ONLY Principles in the Optus Contractor WHS management process CONTRACTOR MANAGEMENT STAGES PRINCIPLES THIS STANDARD REQUISITION Requisition
SAFETY DATA SHEET. Section 1: Identification of the substance/mixture and of the company/undertaking. Section 2: Hazards identification
 Page: 1 Compilation date: 23/08/2005 Revision date: 04/01/2016 Revision No: 4 Section 1: Identification of the substance/mixture and of the company/undertaking 1.1. Product identifier Product name: Synonyms:
SAFETY DATA SHEET PRODUCT NAME Sulfur hexafluoride 1.2 RELEVANT IDENTIFIED USES OF THE SUBSTANCE OR MIXTURE AND USES ADVISED AGAINST :
 SULFUR HEXAFLUORIDE PAGE NO. 1 of 10 1 PRODUCT AND COMPANY IDENTIFICATION 1.1 PRODUCT IDENTIFIER : 1.1.1 PRODUCT NAME Sulfur hexafluoride 1.1.2 SYNONYMS Sulfur fluoride (SF6), (OC-6-11)-; Sulfur fluoride
Personal Protective Equipment 29 CFR 1926
 Personal Protective Equipment 29 CFR 1926 OSHA- PPE http://www.osha.gov/publications/osha31 51.html NIOSH s Protective Clothing Web Page http://www.cdc.gov/niosh/npptl/topics/prot clothing/ 1926.95 PPE
PREMIUM LITHIUM COMPLEX
 MATERIAL SAFETY DATA SHEET PREMIUM LITHIUM COMPLEX SECTION 1: Product Name Supplier Product Type PRODUCT AND COMPANY IDENTIFICATION PREMIUM LITHIUM COMPLEX PETRON CORPORATION JESUS ST., PANDACAN, MANILA
Safety Data Sheet according to Federal Register / Vol. 77, No. 58 / Monday, March 26, 2012 / Rules and Regulations Revision date: 11/11/2015
 SECTION 1: Identification 1.1. Identification Product form Product name Revision date: 11/11/2015 : Mixture : Product code : 2019-2153 1.2. Relevant identified uses of the substance or mixture and uses
3.0 Manage. hazardous substances. risks IN THIS SECTION:
 3.0 Manage hazardous substances risks IN THIS SECTION: 3.1 Hazardous substances can damage your health 3.2 Applying substance controls 3.3 Prepare an inventory of your hazardous substances 3.4 Find and
Flammability Chart. Gas Formula Ignition
 Leak Detection 101 Investigating a leak is simplified if you know the basics. By J. Scott Kleppe Sensit (J and N Enterprises, Inc.) Every day new gas services are added to provide economical energy to
5.0 Store. safely IN THIS SECTION: 5.1 Decanting or transferring
 5.0 Store hazardous substances safely IN THIS SECTION: 5.1 Decanting or transferring hazardous substances 5.2 Incompatibles 5.3 Store only what you need, store it safely 5.4 Gas cylinders 5.5 Oxy-acetylene
SAFETY DATA SHEET ENVY 1. IDENTIFICATION OF THE MATERIAL AND SUPPLIER 2. HAZARDS IDENTIFICATION 3. COMPOSITION / INFORMATION ON INGREDIENTS
 1. IDENTIFICATION OF THE MATERIAL AND SUPPLIER Product Name Envy Other Means of - Identification Other Names - Product Use Crop environmental protection Company Name AgroBest Australia Pty Ltd Address
1. PRODUCT AND COMPANY IDENTIFICATION
 Issuing date no data available Safety Data Sheet Version 3 1. PRODUCT AND COMPANY IDENTIFICATION Product name Recommended use Budesonide For research use only Supplier Address E-mail address Emergency
HAZARDOUS MATERIALS OPERATIONS NFPA 472, 2008 Edition
 5.2 Core Competencies Analyzing the Incident JPR - HMO #1 5.2.1 Surveying the Hazardous Materials/WMD Incidents Revised: June 30, 2011 Standard Area: Competencies Analyzing the Incident STANDARD: 5.2.1.3.2
ESCONDIDO FIRE DEPT TRAINING MANUAL Section Truck Module Page 1 of 5 Utilities Gas Emergencies Revised
 Truck Module Page 1 of 5 GAS EMERGENCIES Introduction Natural gas and Liquid Propane Gas (LPG) are flammable gases. Many households and commercial buildings utilize these gases for everything from heating
TABLE OF CONTENTS PART 2 - CONFINED SPACES
 May 11, 2006 TABLE OF CONTENTS PART 2 - CONFINED SPACES Page DEFINITIONS... 2-1 GENERAL... 2-2 RESPONSIBILITIES... 2-2 HAZARD ASSESSMENT AND WORK PROCEDURES... 2-3 IDENTIFICATION AND ENTRY PERMITS... 2-3
: Perma Gloss Floor Finish
 SECTION 1: Identification 1.1. Identification Product form Product name Date of issue: 02/09/2018 Revision date: 04/15/2015 : Mixture Product code : 1273-1023 1.2. Recommended use and restrictions on use
Material Safety Data Sheet. Helmar Crystal Kote Fixative
 IDENTIFICATION OF THE MATERIAL AND SUPPLIER Company Name Helmar Australia Pty Ltd ABN 28 003 425 796 Address 54-56 Brisbane Road, Riverstone, NSW 2765 Emergency Tel: 0418 230 719 Tel / Fax: (02) 9627 4666
Revision Date 13-Jul IDENTIFICATION OF THE SUBSTANCE/MIXTURE AND OF THE COMPANY/UNDERTAKING. No information available
 Issuing date no data available Safety Data Sheet Version 1 1.1 Product identifier 1. IDENTIFICATION OF THE SUBSTANCE/MIXTURE AND OF THE COMPANY/UNDERTAKING Product Code(s) Product name AB120764 Aripiprazole
MATERIAL SAFETY DATA SHEET
 Page 1 Distributed by: International Stoneworks, Inc. 2523 Fairway Park Drive, suite 510 Houston, TX 77092 800-775-TILE sales@intlstoneworks.com http://www.intlstoneworks.com MATERIAL SAFETY DATA SHEET
MAXIMUM CREDIBLE LOSS SCENARIO (MCLS)
") 1 MAXIMUM CREDIBLE LOSS SCENARIO (MCLS) CLEAN SCIENCE AND TECHNOLOGY PRIVATE LIMITED PLOT NO. D-26/3, MIDC KURKUMBH, DIST.-PUNE 413 802 AUGUST 2016 PREPARED BY S A CONSUTANT NAVI MUMBAI 2 CONTENT AREAS
1 MAXIMUM CREDIBLE LOSS SCENARIO (MCLS) CLEAN SCIENCE AND TECHNOLOGY PRIVATE LIMITED PLOT NO. D-26/3, MIDC KURKUMBH, DIST.-PUNE 413 802 AUGUST 2016 PREPARED BY S A CONSUTANT NAVI MUMBAI 2 CONTENT AREAS
SAFETY DATA SHEET FOR FALK GMAX 6000
 Product Name: G MAX 6000 Product Code: 425065 Trade Name: Industrial Oil Benz Oil Company 2724 W. Hampton Ave. Milwaukee, WI 53209 Telephone Numbers During normal business hours call (44)442-2900 Outside
Material Safety Data Sheet
 Material Safety Data Sheet Conforms to ISO 11014:2009 MAGIC BRICK CLEANER 1. IDENTIFICATION OF THE SUBSTANCE/PREPARATION AND OF THE COMPANY Product name : MAGIC BRICK CLEANER Use/description of product
: Red Caries Indicator
 SECTION 1: Identification 1.1. Product identifier Red Caries Indicator Revision date: 09/05/2014 Date of issue: 09/05/2014 Version: 1.0 Product form : Mixture Product name : Red Caries Indicator Other
Material Safety Data Sheet WPF
 Page 1 of 6 1.- Identification of the preparation and of the company 1.1 - Name: 1.2 - Product Applications: Fluidification of the mass of the crude oil that contains paraffins and paraffins separator.
Section 3 Physical Data
 Section 3 Physical Data Boiling Point: > 200 F Evaporation Rate (Butyl Acetate=1) Weight Per Gallon (25 C): 9.054 lbs/gl Vapor Density (Air=1): Volatile by Weight: 50.0% Volatile by Volume: 63.0% Specific
NORMAL OPERATING PROCEDURES Operating Parameter Information
 Operating Parameter Information Each operator performing the normal operating procedures (routine checks) of the facility should be familiar with the current normal operating parameters of all systems
Process Safety Management Of Highly Hazardous Chemicals OSHA 29 CFR
 Process Safety Management Of Highly Hazardous Chemicals OSHA 29 CFR 1910.119 PSM - Definition Not all refining hazards are caused by the same factors or involve ve the same degree of potential damage.
SAFETY DATA SHEET. Issue Date: Revision Date: Spectrum Adhesives, Inc Universal Dr. Memphis, Tn 38118
 SAFETY DATA SHEET Available Exclusively through Veneersupplies.com 1. IDENTIFICATION Issue Date: 10-16-15 Revision Date: 06-01-1 5 Product name: Recommended use of the chemical and restrictions on use