Physical Modelling of A-Jacks Units in Wave Flume Stage 2
|
|
|
- Brent Berry
- 5 years ago
- Views:
Transcription


1 Physical Modelling of A-Jacks Units in Wave Flume Stage 2 Report MHL1901 March 2009
2 PHYSICAL MODELLING OF A-JACKS UNITS IN WAVE FLUME STAGE 2 Report No. MHL1901 Department of Commerce Manly Hydraulics Laboratory
3 Document Control Issue/ Reviewed Approved for Issue Author Revision Name Signed Name Signed Date mhl1901v4 draft Indra Jayewardene Rob Jacobs RJ Final Indra Jayewardene E Couriel EC 12/03/09 Report No. MHL1901 Commerce Report No MHL File CME First published March 2009 Crown copyright 2009 This work is copyright. Apart from fair dealings for the purposes of private study, research, criticism or review as permitted under the Copyright Act 1968, no part may be reproduced by any process without written permission. Enquiries should be directed to the Publications Officer, Manly Hydraulics Laboratory, 110B King Street, Manly Vale, NSW, Manly Hydraulics Laboratory is Quality System Certified to AS/NZS ISO 9001:2000.
4 Foreword The report was prepared by the Department of Commerce s Manly Hydraulics Laboratory (MHL) for A-Jacks Marine Pty Ltd and Rocla Pty Ltd. The testing and reporting was carried out by Indra Jayewardene of MHL. Drafting and publishing was done by Megan Jensen. The report presents the details and results of the model testing. MHL i
5 Summary In December 2008 Manly Hydraulics Laboratory was commissioned by A-Jacks Marine Pty Ltd and Rocla Pty Ltd to undertake testing of a modified (tapered) A-Jacks unit (Figure 1.1). During testing carried out in 2003 (Stage 1) MHL undertook a physical model study to assess the performance characteristics of the A-Jacks armour unit (MHL 2003). This second series of tests was designed to evaluate the influence of a design modification on the performance of the original unit. The Stage 1 testing of the Ajacks unit involved testing a slender unit and a stubby unit which resulted in K D values higher than those obtained from testing existing units such as rock, Hanbars, Antifer cubes and Accropodes. The second stage involved testing a unit which was not as slender or as stubby as the original units tested. The initial test program was undertaken to assess the capability of A-Jacks units to replace other units for the repair of large areas, new construction and for patch repairs. Stage 2 of the testing was undertaken to simulate construction of a new construction and the A-Jacks unit was the only unit under test. The A-Jacks units were placed in a single layer for all the test series. Jonswap wave spectra with 8 s wave peak period were used in the testing. In this study, the surf similarity parameter (ξ) varied from 2.6 to This indicates that the wave breaking process went from plunging to surging waves. Ahrens (1975) and van der Meer (1988) suggest that rock armour stability is a minimum during this breaker transition phase. The following conclusions can be drawn based on the model testing described in the study. 5.2 TF A-Jacks Unit - Random Placed Unit Test Series Results After 2000 waves at 4.2 m wave height, the single layer 2.33 tonne A-Jacks armour resulted in less than 1% damage. The estimated K D value was 29. The armour was placed at approximately 54 units/100 m TF A-Jacks Unit - Bundled Random Placed Unit - Test Series Results After 2000 waves at 6.5 m wave height, the single layer 2.33 tonne A-Jacks armour resulted in less than 1% damage. If the bundled A-Jacks unit is considered to be a unit of 9.33 tonnes (4 times the mass of a single unit ) then the K D value is estimated to be 27. The armour was placed at approximately 66 units/100 m TF A-Jacks Unit Relaxed Bundled Placed Unit - Test Series Results After 2000 waves at 5.5 m wave height, the single layer 2.33 tonne A-Jacks armour resulted in less than 1% damage. The relaxed bundled A-Jacks placed unit is evaluated as a single independent unit of 2.33 tonnes, the K D value was estimated to be 65. The armour was placed at approximately 66 units/100 m 2. MHL ii
6 Some general considerations regarding the A-Jacks unit follow: Due to the A-Jacks unit being placed in a single layer, early repair strategies have to be planned in order to prevent damage to the secondary armour and core. All the tests were carried out at a slope of 1V:1.5H. In addition to the coefficient of damage, the density of placement, wave climate, type of breaking wave, type of placement, permeability and hence core material have to be considered when considering the A-Jacks armour unit for design purposes. It is recommended that the ability of the A-Jacks unit as an interface be tested in the event that it is utilised with other larger breakwater units due its high K D value. It is recommended that the modified A-Jacks unit be further tested under 3D conditions in a wave basin in order to assess the unit s performance under the joint action of currents and waves. The following is a comparison of K D values obtained during testing and historic values obtained for other armour units. Estimates for K D Values for Commonly Utilised Armour Units Armour Unit K D Source Rock 2-4 CERC (1984) Core-Loc 16 CLI (2002) Accropode 12 CLI (2002) A-Jacks MHL (2003) A-Jacks Random Placed 29 MHL (2009) A-Jacks Bundled Random Placed 27 MHL (2009) A-Jacks Relaxed Bundled Placed 65 MHL (2009) MHL iii
7 Contents 1. INTRODUCTION Background to Project Scope of Works and Study Objectives Description of the A-Jacks Unit 2 2. TEST FACILITY General Model Wave and Water Level Conditions Simulation of Wave Groups 3 3. MODEL SCALING AND TEST SCHEDULE Model Scales Model Description and Layout Armour Units Model Inspection and Test Regime Test Schedule Stability Test Methodology and Criteria for Damage 7 4. TEST RESULTS TF A-Jacks Unit - Random Placed Unit Test Series Results TF A-Jacks Unit - Bundled Random Placed Unit - Test Series Results TF A-Jacks Unit Relaxed Bundled Placed Unit - Test Series Results CONCLUSIONS AND RECOMMENDATIONS REFERENCES 16 APPENDICES A Wave Measurement Example Time Series Tests B Model Cross-section Details C Model Secondary Armour Distribution MHL iv
8 Tables 1.1 Estimates for K D Values for Commonly Utilised Armour Units Densities, Nominal Weight and Nominal Diameter for Model A-Jacks Units Details of Model Rock Armour Test Schedule A-Jacks Testing - Random Placed A-Jacks Armour Units A-Jacks Testing - Bundled Random Placed A-Jacks Armour Units A-Jacks Testing - Relaxed Bundled Placed A-Jacks Armour Units Estimates for K D A-Jacks Armour Placement During Tests 13 A1 Wave Statistics 18 C1 Distribution Statistics Model (Rock) Secondary Armour Units 21 Figures 1.1 Schematic of the A-Jacks Tapered Unit 1.2 The A-Jacks Bundled Unit 2.1 Flume Layout 4.1 Random Placed Unit Cumulative Damage History 4.2 Random Placed Unit Cumulative Damage History 4.3 Random Placed Unit Cumulative Damage History 4.4 Random Placed Bundled Unit Cumulative Damage History 4.5 Bundled Unit Cumulative Damage History 4.6 Bundled Unit Cumulative Damage History 4.7 Relaxed Bundled Unit Cumulative Damage History 4.7 Relaxed Bundled Unit Cumulative Damage History A1 Example of Probe Time Series A2 Example of Probe Time Series B1 Test Cross-section B2 Estimation of the Nominal Diameter of an A-Jacks Unit C1 Model Secondary Armour Distribution MHL v
9 Symbols and Abbreviations D 50 = Equivalent diameter of M 50 rock armour H sig = Significant wave height of time series L = Wave length T P = Peak period of spectrum W 50 = Mass of 50% percentile in rock armour distribution ν = Kinematic viscosity Re = Reynolds number Δ = Relative mass density (ρ a - ρ w )/ ρ w ρ a = Mass density of armour ρ w = Mass density of fluid in which armour is immersed ξ = surf similarity parameter MHL vi
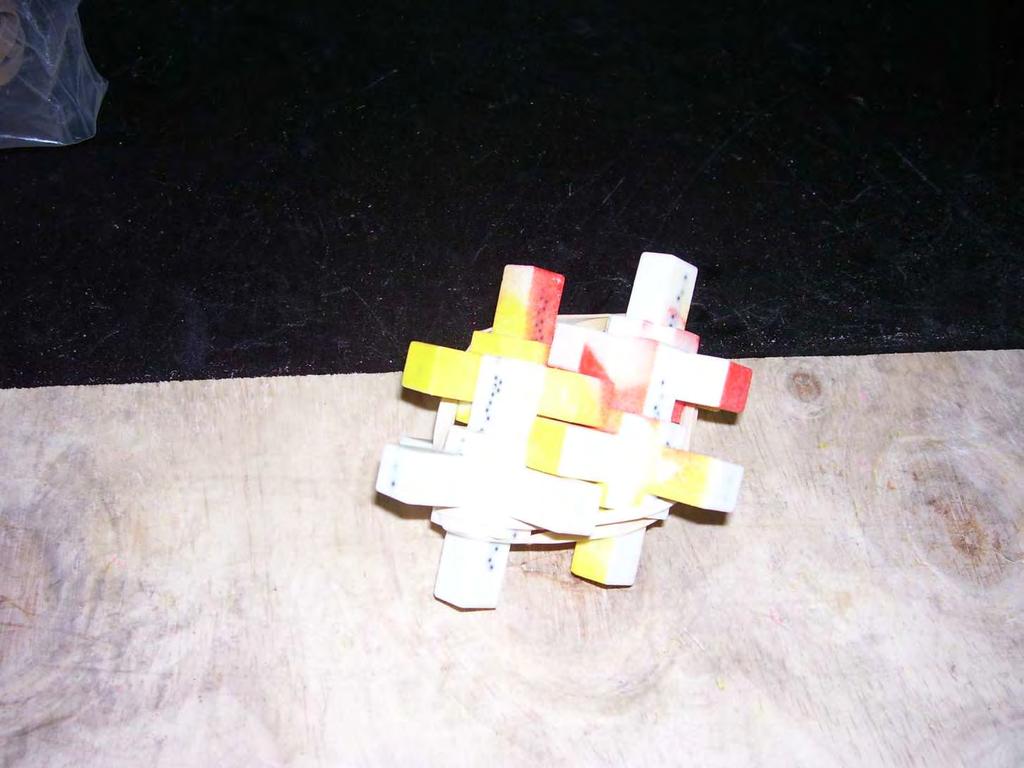
10 1. Introduction 1.1 Background to Project Manly Hydraulics Laboratory (MHL) undertook a physical model study in 2003 to assess the performance characteristics of the A-Jacks armour unit (MHL Stage 1 Testing). In December 2008 MHL was commissioned by A-Jacks Marine Pty Ltd and Rocla Pty Ltd to undertake a second stage of testing of a 5.2 TF A-Jacks unit (Figure 1.1). This second series of tests was designed to evaluate the influence of design modifications on the performance of the unit. Many formulae are used to assess the hydraulic performance of breakwater units. One of the more accepted formulae is the Hudson equation (CERC 1984). In this series of tests (Stage 2) the Hudson equation was utilised (as in previous testing) to compare the performance of the A-Jacks breakwater unit with other units such as rock armour, Hanbars and Core-loc. When comparing units the nature of the placement of the unit must be considered, as placement in a prototype situation could add costs to a construction project and be constrained by the specific site. For the 5.2 TF A-Jacks unit three types of placement were tested. They were: Random Placed as opposed to pattern placed Bundled as pictured in Figure 1.2 four units are placed together. The dimensions of the unit enhance this capability. When the axes of these bundles are not in the same direction the placement was classified as bundled and random placed. In the prototype construction the units would be bundled together utilising stainless steel ties. In the model rubber bands were utilised Relaxed Bundled in order to simulate the loosening of ties around the bundles, the rubber bands around the placed bundles were cut. This is to simulate conditions when the ties came loose. The previous A-Jacks unit tests (MHL 2003) resulted in a K D values in the range of when the toe was fixed using bundled A-Jacks units. Only irregular waves were used for these tests. The K D values obtained at the O.H. Hinsdale Laboratory at Oregon State University (OSU) varied from 24 to 292 (Amortech 1999). Both regular waves and irregular waves were used for the tests carried out by OSU. Selection of a single K D for general design purposes is not recommended. Important parameters to define a range of appropriate values for design include packing density, wave steepness, breaking versus non-breaking waves, including type of breaking wave, armour slope and core material. Table 1.1 tabulates K D values quoted in the literature. MHL1901-1
11 Table 1.1 Estimates for K D Values for Commonly Utilised Armour Units Armour Unit K D Source Rock 2-4 Foster (1973), SPM (1984), MHL (1996) Core-Loc 16 CLI (2002) Accropode 12 CLI (2002) A-Jacks MHL (2003) The test programme was developed in consultation with Mr Frank Atkinson, the inventor of the unit. Mr Atkinson of A-Jacks Marine and Mr Michael Carnell, Product Manager of Rocla Pty Ltd, were present for the testing. 1.2 Scope of Works and Study Objectives The brief for the physical model study specified the following testing: the A-Jacks unit s performance with random placement on trunk and bundled placement at toe the A-Jacks units with the units bundled and placed randomly on trunk with bundled placement at toe the units with the bundles initially placed in a regular manner and then the bundles cut free (relaxed bundled). 1.3 Description of the A-Jacks Unit All values specified in the report are in prototype units unless mention is made of model units. Figure 1.1 indicates a schematic of the A-Jacks unit. The unit is dimensionally characterised by two ratios, specifically the waist ratio and the fillet ratio: r = T/C where s = F/T r = waist ratio T = arm thickness C = end to end length of unit s = fillet ratio F = fillet length along the axis of an arm The size to weight ratio varies with design (waist ratio and fillet ratio, etc.) and the concrete density. The waist ratio for the modified A-Jacks unit is 1/5.2. The fillet ratio is 1/2. Stage 1 tests (MHL 2003) were carried out for waist ratios of 1/6.3 and 1/4.1 and fillet ratios of 11/13 and 2/5.2. MHL1901-2
12
13
14 2. Test Facility 2.1 General The physical model testing was carried out in MHL s random wave facility (Figure 2.1). The flume is 30 m long, 1.8 m deep and 1 m wide. In the MHL flume, regular and random waves are generated by a sliding wedge wave paddle driven by a servo-hydraulic system. A dissipative beach was constructed at the opposite end of the flume. The floor of the flume was constructed in 1.2 m plywood segments to replicate the bathymetry slopes utilised in Stage 1 of the testing. The design cross-section was built in the 10 m glass section of the flume for model inspection, photography and video filming. 2.2 Model Wave and Water Level Conditions Random waves were generated according to a Jonswap-type energy spectrum. During this model study the spectrum was defined by the wave height and periods described in Section 3. The selected design wave conditions resulted in both plunging and surging breakers on the breakwater model. All model tests were undertaken for a duration of 2,000 waves. A water level of 0.0 m AHD was utilised for all the tests to represent mean sea level. For this testing 2000 waves represents a storm duration of 5 hours, which is representative of a recorded extreme storm. The testing cycle was broken into 1000 and 2000 wave cycles so as to observe any incremental damage for each wave height tested. A sample of measured wave statistics for Jonswap spectra is provided in Appendix A. 2.3 Simulation of Wave Groups The importance of examining the wave groups of a wave regime has long been recognised when testing structures in the ocean. The Department of Public Works and Services (DPWS), as part of its coastal program, initiated a study to investigate and compute the groupiness of wave conditions measured along the NSW coast (Jayewardene et al. 1993). In the flume the groupiness factor was used to measure the grouping effect of waves measured in deeper water. As a part of this investigation, only a qualitative study was carried out on the effect of grouping on the structure. A time series that resulted in high grouping effects was used for all the tests. MHL1901-3
15
16 3. Model Scaling and Test Schedule 3.1 Model Scales A length scale of 30 was selected for the test program. The length scale was selected on the basis of the dimensions of the structure to be modelled, armour sizes, water levels, wave heights and the need to minimise scale effects. The time scale was determined from the length scale using Froudian similitude (Hughes 1993). The mass scale takes into account the differences in density between sea water in the prototype and fresh water used in the model. In order to satisfy the stability number criterion (Hughes 1993) M r = (H p / H m ) 3 (ρ p / ρ m )(Δ m / Δ p ) 3 the ratio (ρ p / ρ m ) is the ratio of prototype armour density to model armour density. Δ is the relative density (ρ a / ρ w - 1). ρ a is the density of the A-Jacks armour and ρ w is the density of water. Length scale L r = 30 Time scale T r = L r = 5.58 Mass scale M r = L 3 r ρ r / Δ 3 r = 30,820 Several investigators have provided indicators of the limiting size of models for reduced Reynolds number effects or scale effects (Dai and Kamel 1969). More recently Cornett (1995) determined the condition for negligible scale effect as: H sig > (ν Re / D 50 ) 2 / g = m where H sig = Significant wave height ν = Kinematic viscosity = 1.14 x 10⁻⁶ m 2 /s Re = Reynolds number = 2.5 x 10 4 D 50 = Nominal diameter of A-Jacks primary armour (Appendix A) = 0.48L D 50 = Nominal diameter of A-Jacks bundled armour = 0.76L L = Length of A-Jacks armour unit The smallest armour unit used on the breakwater head was the 2.33-tonne Taper Fit A-Jacks armour that had an equivalent model diameter of 3.2 cm. All tests were undertaken with a model H sig greater than 10 cm. The water depth in the vicinity of a coastal structure has a significant influence on the amount of offshore wave energy reaching the structure. It also influences wave runup, drawdown and overtopping forces acting on the structure. It is not only the elevated high water levels during a storm that can affect a coastal structure. During times of low water, damage to the toe of the breakwater can also occur during a storm event. MHL1901-4
17 The water depths to be used in the estimation of breakwater armour size are dependent on the still water level (SWL), the mean water level including any wave setup, and the bed levels surrounding the structure. During the first stage of testing it was evident that waves were plunging on the cross-section toe as well as overtopping the structure, therefore to replicate these conditions the same cross-section dimensions (Appendix B) and the same water level were maintained (0.0 m AHD) throughout the testing. 3.2 Model Description and Layout The study was undertaken in the MHL random wave flume. The operator defines the peak frequency and wave height of a Jonswap spectrum to be generated. The computer controls the data acquisition from the wave recording probes. The transfer function of the flume was obtained prior to constructing the test section in order to obtain estimates of incident wave height. The incident wave height was obtained by utilising the transfer function of the wave generator prior to constructing the test cross-section in the flume. The bottom slope utilised for Stage 2 was identical to that used in Stage 1of the testing in order to compare test results. An 8 m depth was simulated at the breakwater section in the flume. The depth fell away sharply due to a 1:5 slope a short distance from the toe. The constructed breakwater crosssections for all the tests are indicated in Appendix B. All the tests were carried out at a test structure slope of 1V:1.5H. Extensive testing carried out by van der Meer (1988) indicates that the permeability of the core has an influence on the stability of the breakwater. Within limits discussed by van der Meer, the more permeable the breakwater core, the higher the stability. Since this investigation compares the performance of differing placements of the same armour unit it was necessary to ensure that the core and the toe conditions remained similar during all model testing. 6 mm diameter blue metal was used for the core. The distribution for secondary armour used in the testing was stipulated by the client and is included in Appendix C. The secondary armour was approximately 10% by weight of the primary armour. 3.3 Armour Units For the A-Jacks unit the nominal diameter was considered to be D n where; ρd n 3 = W 50 and ρ is the density of the unit and W 50 the nominal weight. Table 3.1 indicates the values for density and nominal diameter for the model A-Jacks units utilised in the modelling. The equivalent prototype weight and equivalent diameter are 2.33 tonnes and 0.96 m respectively. Table 3.1 Densities, Nominal Weight and Nominal Diameter for Model A-Jacks Units Type of Unit Specific Gravity Nominal Weight W 50 (gms) Nominal Diameter D n (cm) A-Jacks Unit Bundled A-Jacks Unit Details of the rock armour used in the model testing are described in Table 3.2. Grading curves for the secondary rock armour are included in Appendix C. The equivalent prototype weight is 0.26 tonnes. MHL1901-5
18 Table 3.2 Details of Model Rock Armour Armour Unit Rock (Secondary Armour - Small) Nominal Secondary Armour Weight W 50 (gms) Specific Gravity Linear Scale Details of Model Armour Weight and Grading Curve W 85 / W 15 of 2.42 * * see Appendix C for grading curves of model rock armour 3.4 Model Inspection and Test Regime Representatives of A-Jacks and Rocla were present throughout the testing and assisted MHL in all facets of the testing. The model arrangement and layout were confirmed and the testing set-up and procedure were approved by both representatives. 3.5 Test Schedule Table 3.3 presents the schedule of tests that were conducted. All values are expressed in prototype units. Test No. 1(a) 1(d) 2(a) 2(e) Repair Strategy Armour Table 3.3 Test Schedule 2.33 tonne single layer random placed A-Jacks at a density of 52 units/ 100 m 2. A specially constructed toe with bundled units was used 2.33 tonne single layer random bundled A-Jacks at a density of 66 units/100 m 2 to test interface 3(a) 3(d) 2.33 tonne single layer relaxed bundled but placed A-Jacks at a placement density of 66 units/100 m 2 using a stone and Stubby interface Wave Height (m) * Comments After bedding in the test cross-section at a wave height of 2 m, a wave height of 3.0 m was used for the start of the tests After bedding in the test cross-section at a wave height of 2 m, a wave height of 4.2 m was used for the start of the tests After bedding in the test cross-section at a wave height of 2 m, a wave height of 3.5 m was used for the start of the tests *water level was maintained at 0.0 m AHD and the peak period of the Jonswap spectrum was maintained at 8.0 s MHL1901-6
19 3.7 Stability Test Methodology and Criteria for Damage Bedding-in Tests A bedding-in test of 500 waves using a wave height of 2 m was completed prior to testing the cross-sections under more extreme wave conditions. This procedure was undertaken to ensure that conditions similar to the development of storm wave conditions were simulated and the newly constructed structure was not subject to extreme wave attack without adequate settlement of the armour units Damage Measurement Two damage definitions are used in breakwater modelling. One uses the erosion area (S) and requires the use of a cross-section profiler. The other definition, used in this investigation, relates damage to the movement of a primary armour unit. If the unit moved more than the distance of one nominal diameter (D n ) it is considered to be damaged. For the A-Jacks unit the nominal diameter was considered to be D n (Appendix A) where ρ D 3 n = W 50, and ρ is the density of the unit and W 50 the nominal weight. Table 3.1 indicates the values for weights and nominal diameters obtained for the model units as supplied by A-Jacks Marine Pty Ltd. Percentage damage is defined to be the percentage of displaced armour. The total number of units is taken to be the total number of units subject to wave action. For this investigation the total number of units on the cross-section were counted. It should be noted that for milder wave conditions where runup and rundown do not affect the total length of cross-section, conservative estimates of damage may result when the total number of units on the cross-section are counted. During testing in Stage 1, it was noted that some armour units, particularly at the toe of the structure, were observed to have rocking motions. This rocking motion, although not contributing to an increase in damage of the structure, would increase the impact loadings on the adjacent individual units. Structural testing of the individual units was beyond the scope of this study. Damage due to this rocking is unknown. Tests carried out by van der Meer (1988) indicate damage to a section built with rock armour is dependent on the duration of the storm. No data exists to establish if the stability of A-Jacks units is dependent on storm duration, hence in this investigation each test run was carried out for a total of 2000 waves or an equivalent of a four- to five-hour storm. After each series of 1000 waves the damage was noted and the test section was videoed and photographed. The test waves were generated from a selected time series to ensure high grouping effects on the structure. Hudson s equation was used to obtain the relationship between dimensionless wave height or stability number (H sig / ΔD n ) and K D as follows: H sig / ΔD n = (K D Cot α) 1/3 where H sig = significant wave height Δ = relative mass density K D = coefficient of damage D n = nominal diameter of M 50 armour (Appendix A) α = angle of breakwater slope MHL1901-7
20 Also ξ = surf similarity parameter = tanα Hsig LO where a value of less than 2.5 indicates plunging breakers, a value greater than 4 indicates surging breakers and intermediate values indicate a mixture of plunging and surging breakers α = structure slope H sig = significant wave height at toe of structure L o = wave length in deep water The value of K D at a given level of damage to a structure was used to compare the efficiency of the A-Jacks unit with armour units such as quarry rock, Accropodes and Core-loc. In addition to the coefficient of damage, the density of placement, structure slope, wave climate, type of breaking wave, type of placement and core material have to be considered when comparing the A-Jacks armour unit with other units for design purposes. MHL1901-8
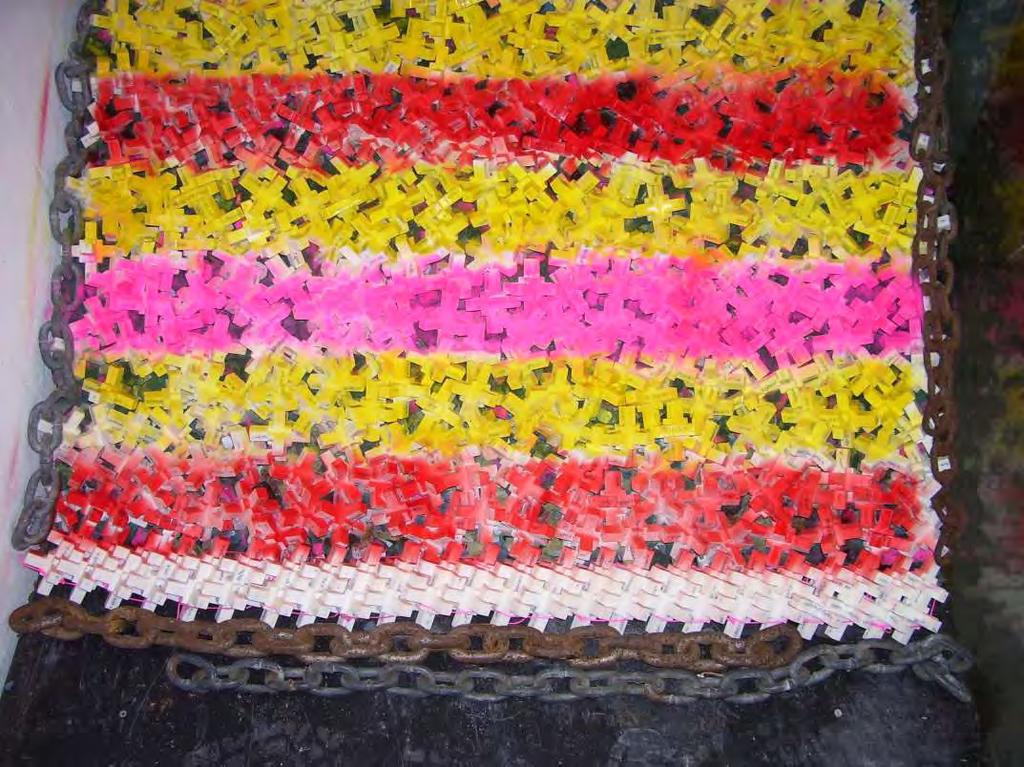
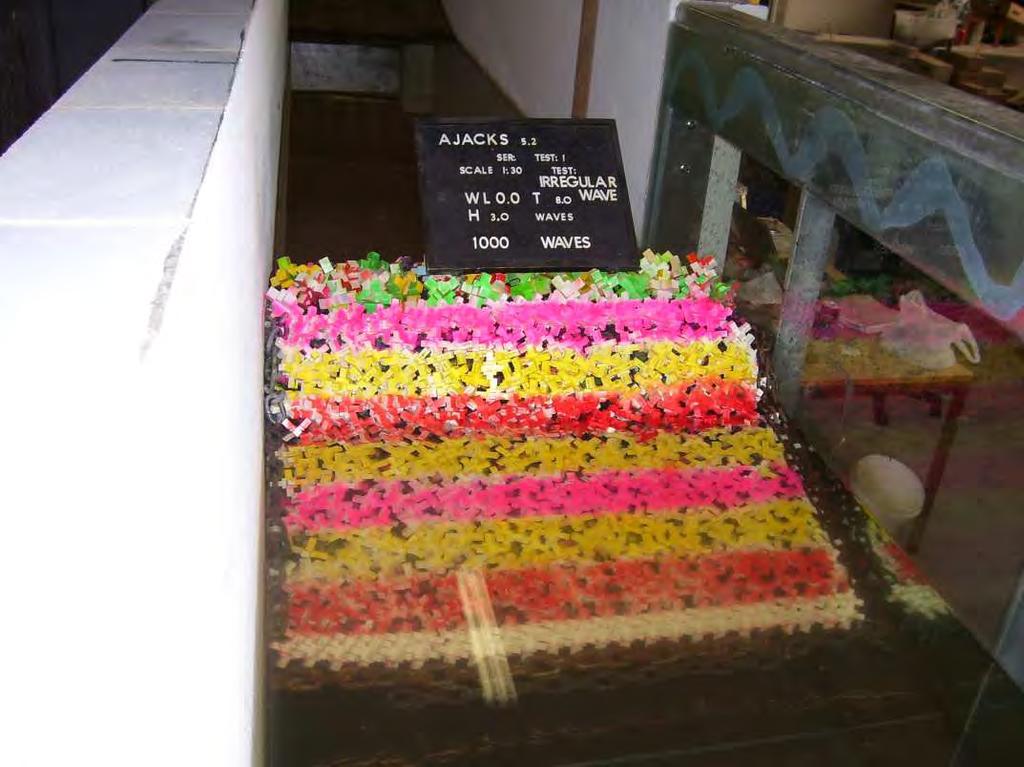
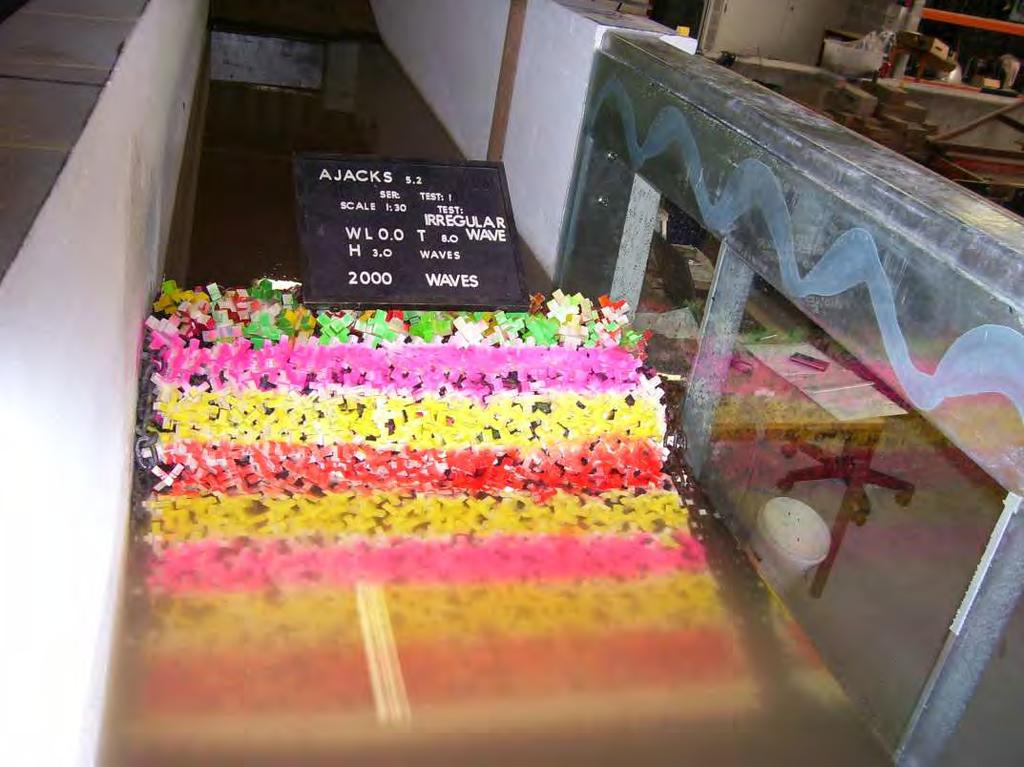
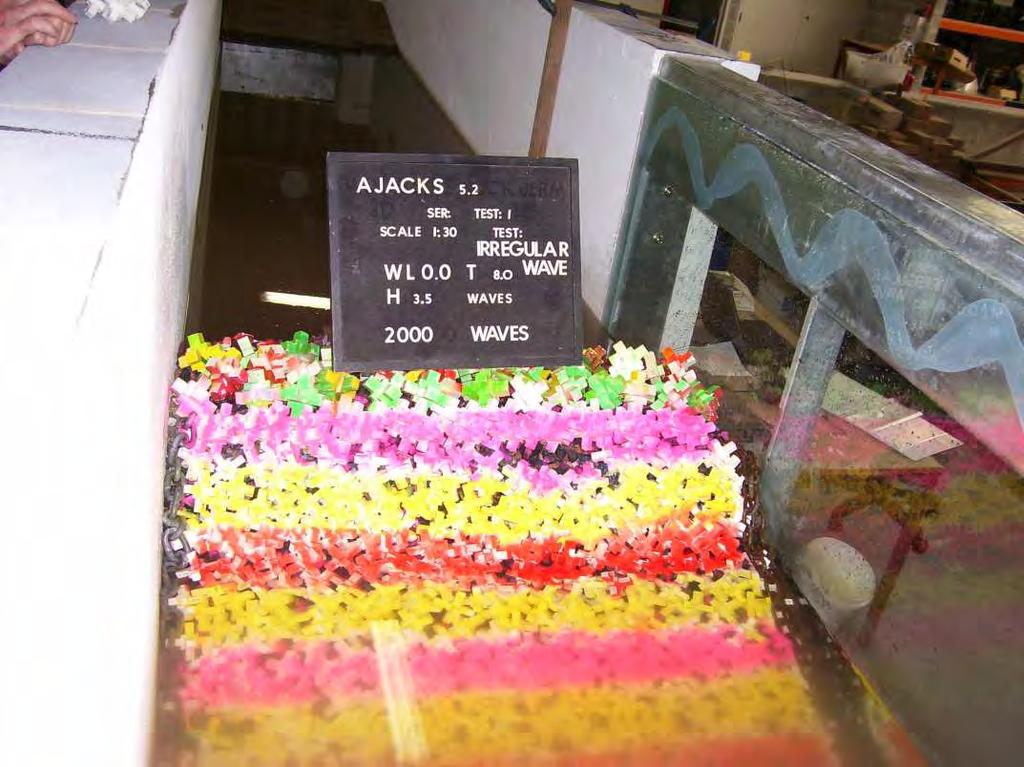
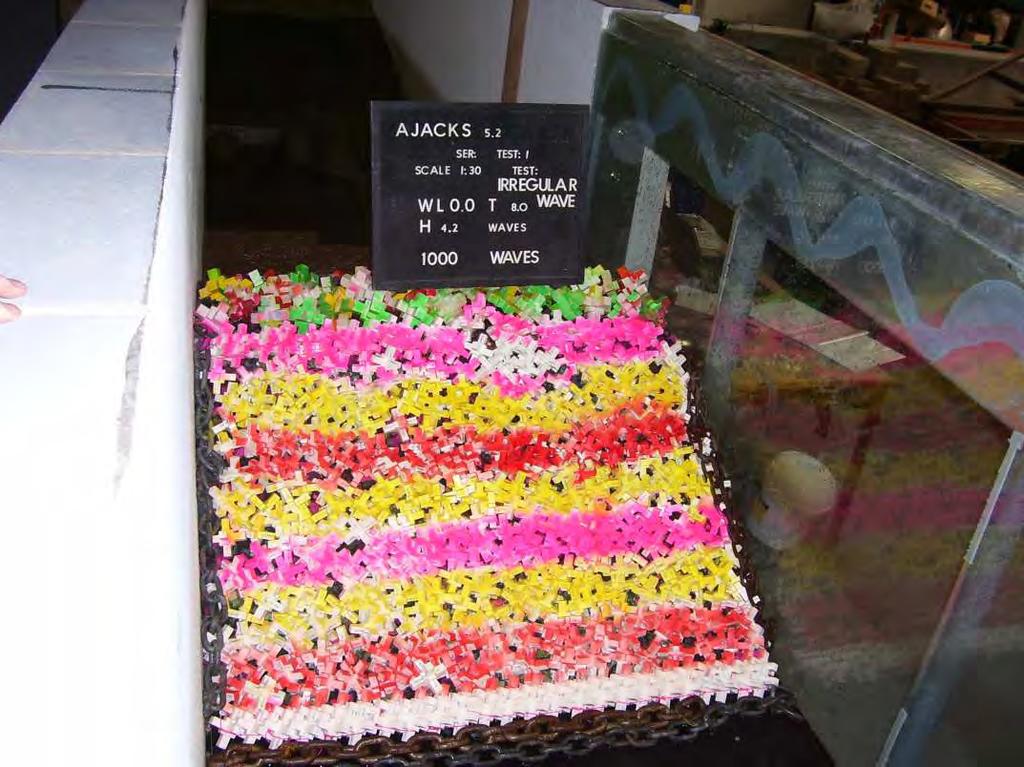
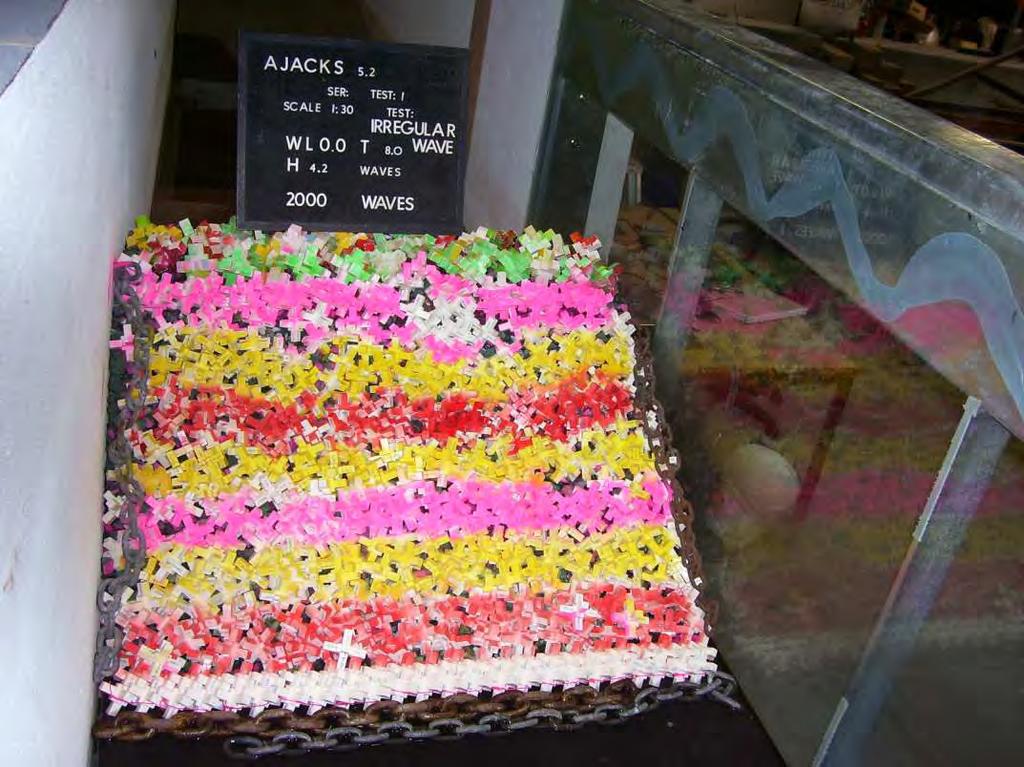
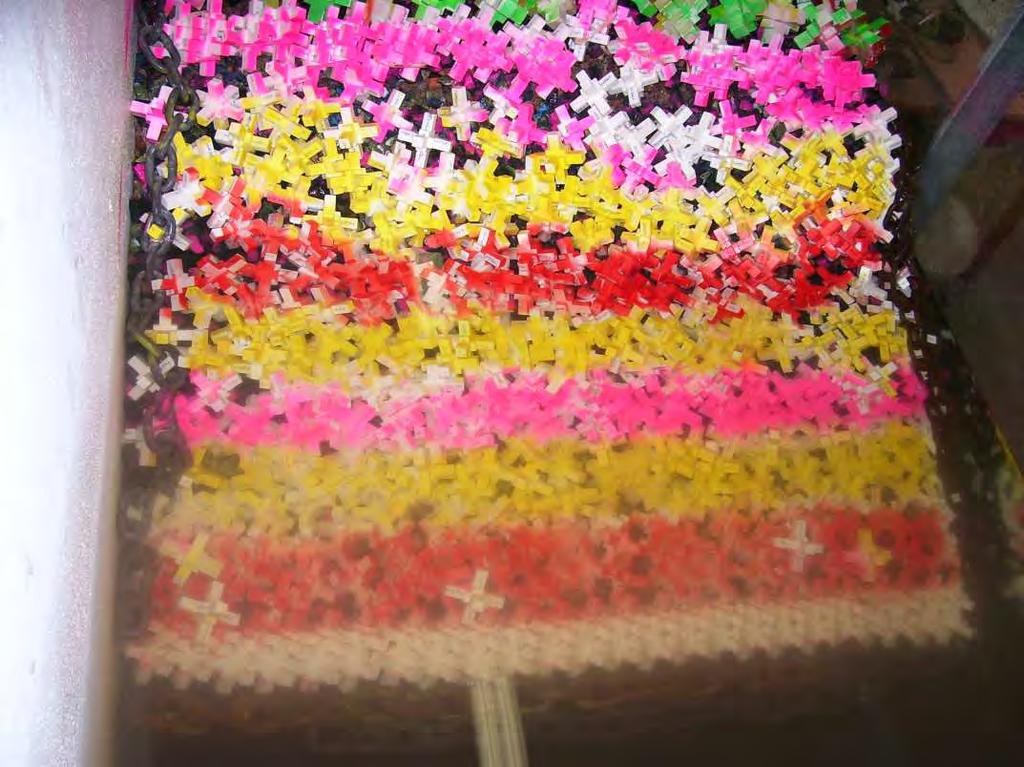
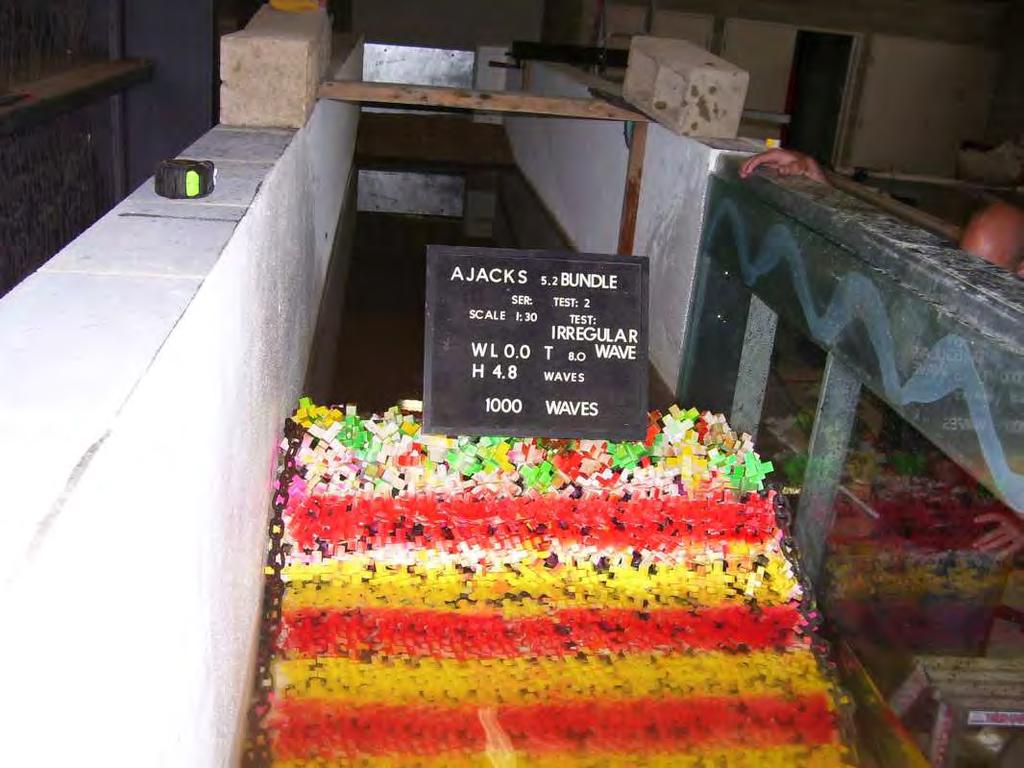
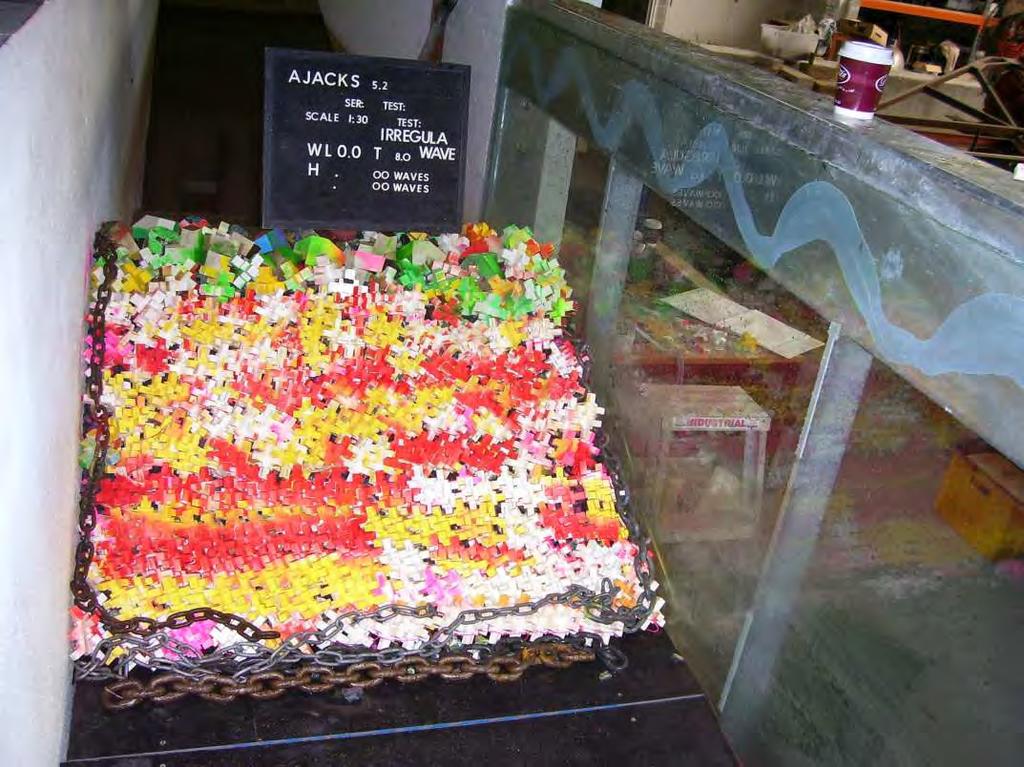
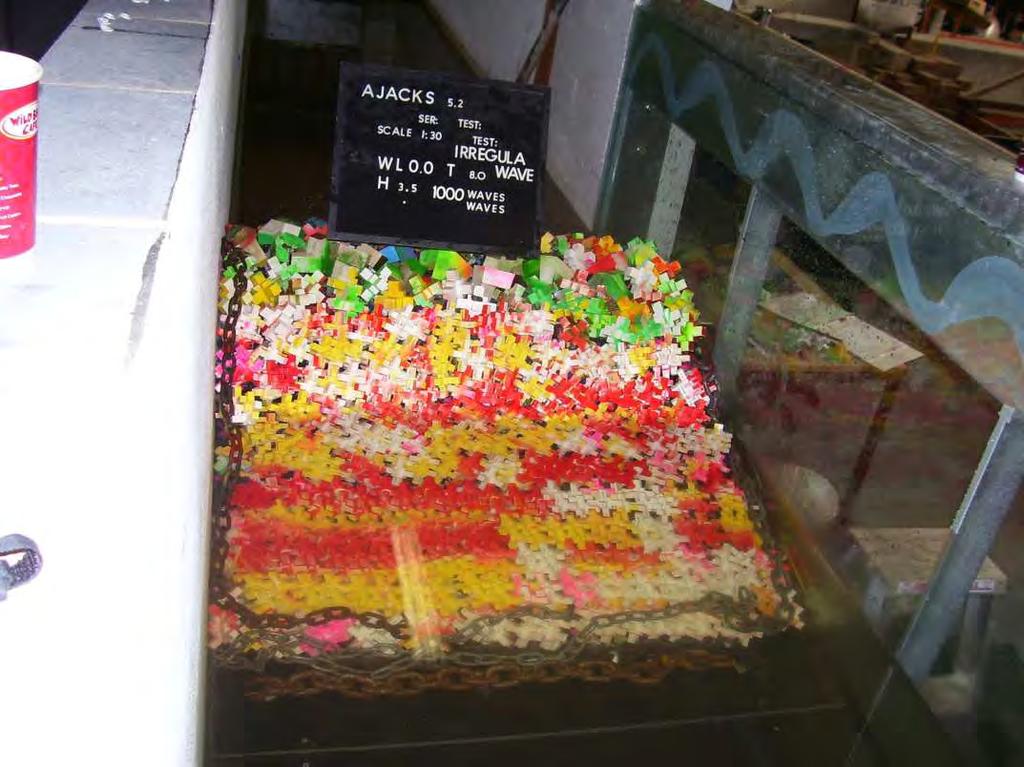
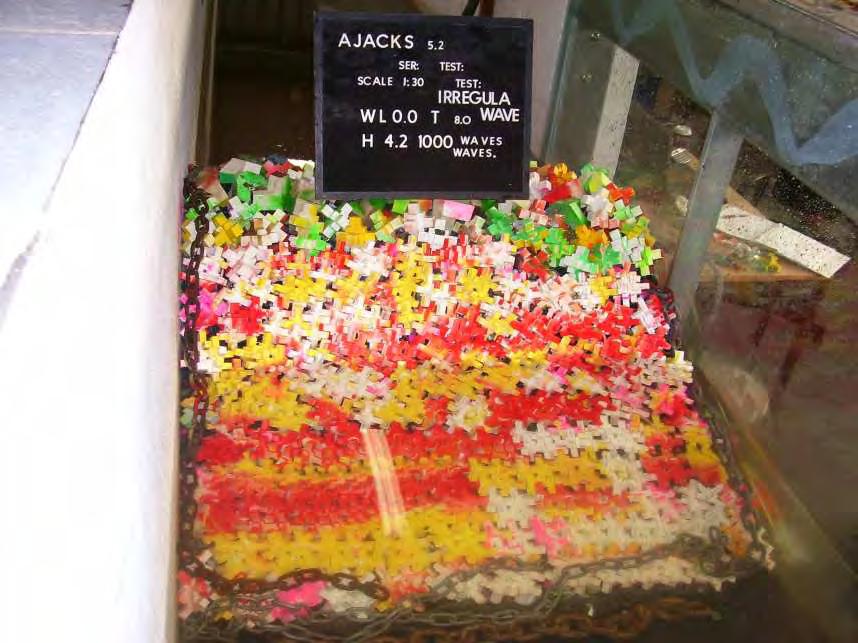
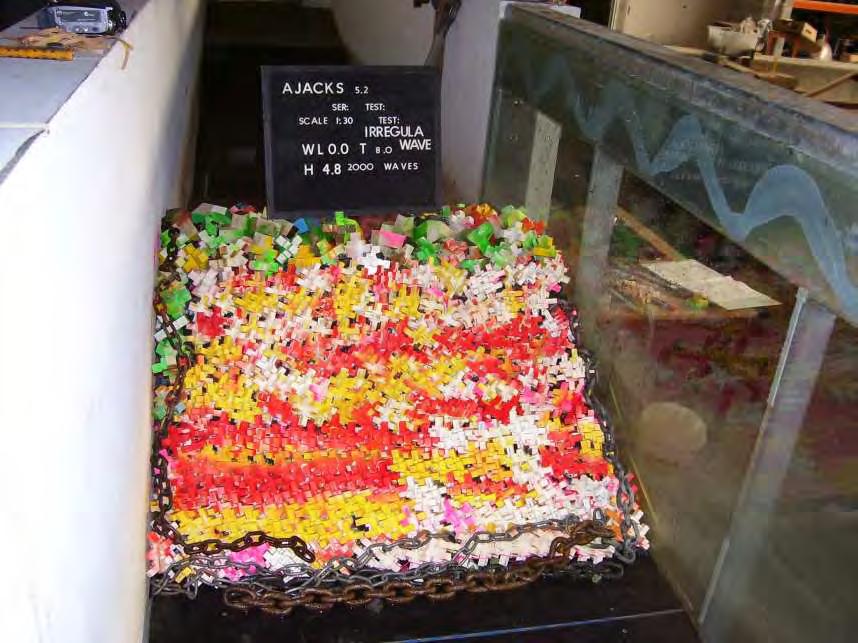
21 4. Test Results TF A-Jacks Unit - Random Placed Unit Test Series Results The details of each individual test run undertaken for the A-Jacks physical model study are provided in Table 4.1. Figures 4.1 to 4.8 present a selection of photographs taken during the model tests. Appendix B indicates the cross-section utilised in the testing. Test No. Table 4.1 A-Jacks Testing - Random Placed A-Jacks Armour Units Type of Armour tonne single layer A-Jacks at a density of 54 units/100 m units were used in the construction. The toe was constructed utilising bundled units. The crest was reinforced with larger units Wave Height (m) tonne single layer A-Jacks at a density of 54 units/100 m 2. The toe was constructed utilising bundled units. The crest was reinforced with larger units tonne single layer A-Jacks at a density of 54 units/100 m 2. This included 8 additional units. The toe was constructed utilising bundled units tonne single layer A-Jacks at a density of 54 units/100 m 2. This included 8 additional units. The toe was constructed utilising bundled units 4.8 Comments * After 2000 waves at 3.0 m no damage was recorded (Figure 3.1) After 1000 waves no units were displaced. After 2000 waves at 3.5 m no units were displaced, however the units had become compacted and secondary armour was visible. 8 units were added to fill the gap (Figure 4.2b) After 1000 waves at 4.2 m, 2 units were displaced (Figure 4.3a). After 2000 waves at 4.8 m 6 units were displaced. After 1000 waves at 4.8 m, 13 units were displaced (Figure 4.4a). After 2000 waves at 4.8 m 18 units were displaced. The crosssection was considered to be sufficiently damaged to stop further testing *water level was maintained at 0.0 m AHD and the peak period of the Jonswap spectrum was maintained at 8.0 s MHL1901-9
22 In this series of tests, the surf similarity parameter (ξ) varied from 3.25 to This indicates that the wave breaking process went from plunging to surging waves. Ahrens (1975) and van der Meer (1988) suggest that rock armour stability is at a minimum during this breaker transition phase The results of the testing program outlined in Table 4.1 can be summarised as follows: An initial test was carried out on the A-Jacks unit after bedding in the units using 500 waves at 2 m wave height. After 2000 waves at 3.0 m and 3.5 m wave heights no damage was visible. After 2000 waves at 3.5 m wave height, the single layer 2.33 tonne A-Jacks armour resulted in less than 1% damage. The estimated K D value was 17. After 2000 waves at 4.2 m wave height, the single layer 2.33 tonne A-Jacks armour resulted in less than 1% damage. The estimated K D value was 29. The armour was placed at approximately 54 units/100 m 2. After 1000 waves at 4.8 m wave height 6 units were displaced and after 2000 waves 13 units were displaced. The damage increased rapidly and at 2100 waves 18 units were displaced. At this point in the testing it was deemed that the cross-section was damaged. Details of the armour damage and aspects of the testing are provided in Figures 4.1 to 4.4(b) and Appendix B TF A-Jacks Unit - Bundled Random Placed Unit - Test Series Results The bundled unit simulates four A-Jacks units tied using stainless steel wire in prototype. In the model the units were bundled utilising rubber bands. The total weight of the four units was gms. The bundling of the units enabled placement at a higher density than the 52 units per 100 m 2 achieved when placement was random and single. The bundling resulted in a placement density of 66 units per 100 m 2. Details of each individual test run undertaken as part of this type of placement of the A-Jacks unit tests are provided in Table 4.2. Table 4.2 A-Jacks Testing - Bundled Random Placed A-Jacks Armour Units Test No. Type of Armour tonne bundled A-Jacks at a density of 66 units/100 m 2. The toe was constructed utilising bundled units. The crest was reinforced with larger units tonne bundled A-Jacks at a density of 66 units/100 m 2. The toe was constructed utilising bundled units. The crest was reinforced with larger units tonne bundled A-Jacks at a density of 66 units/100 m 2.This included 8 additional units. The toe was constructed utilising bundled units Wave Height (m) Comments * After 2000 waves at 4.2 m no damage was recorded (Figure 3.1) After 2000 waves at 4.8 m no damage was recorded however the units had become compacted and secondary armour was visible (Figure 4.4(b)) After 2000 waves at 5.5 m, damage was recorded on the crest but no damage was recorded on the trunk (Figure 4.5) MHL
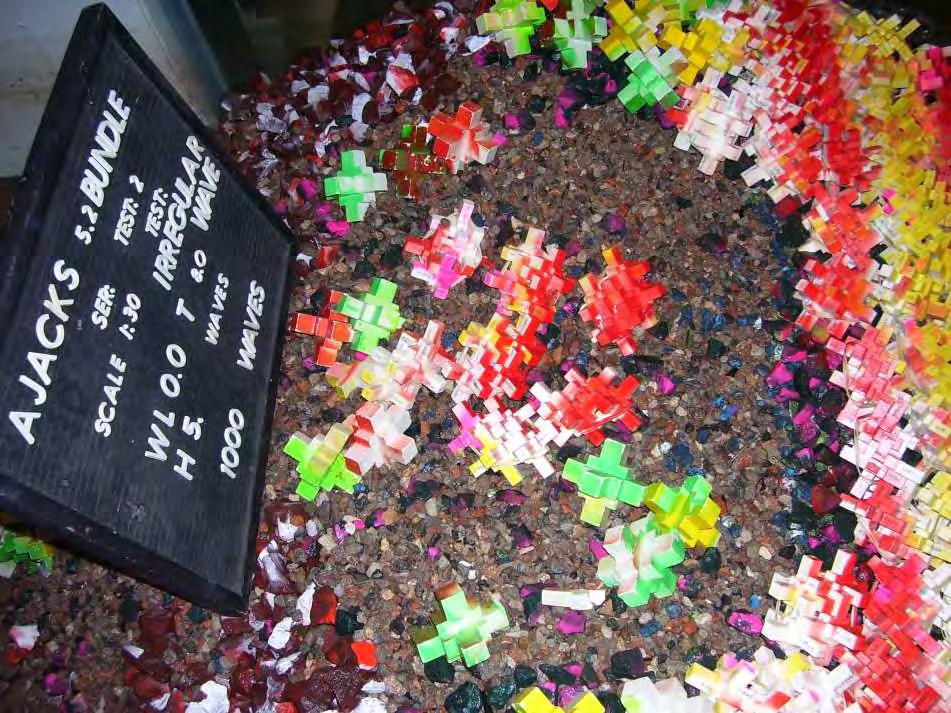
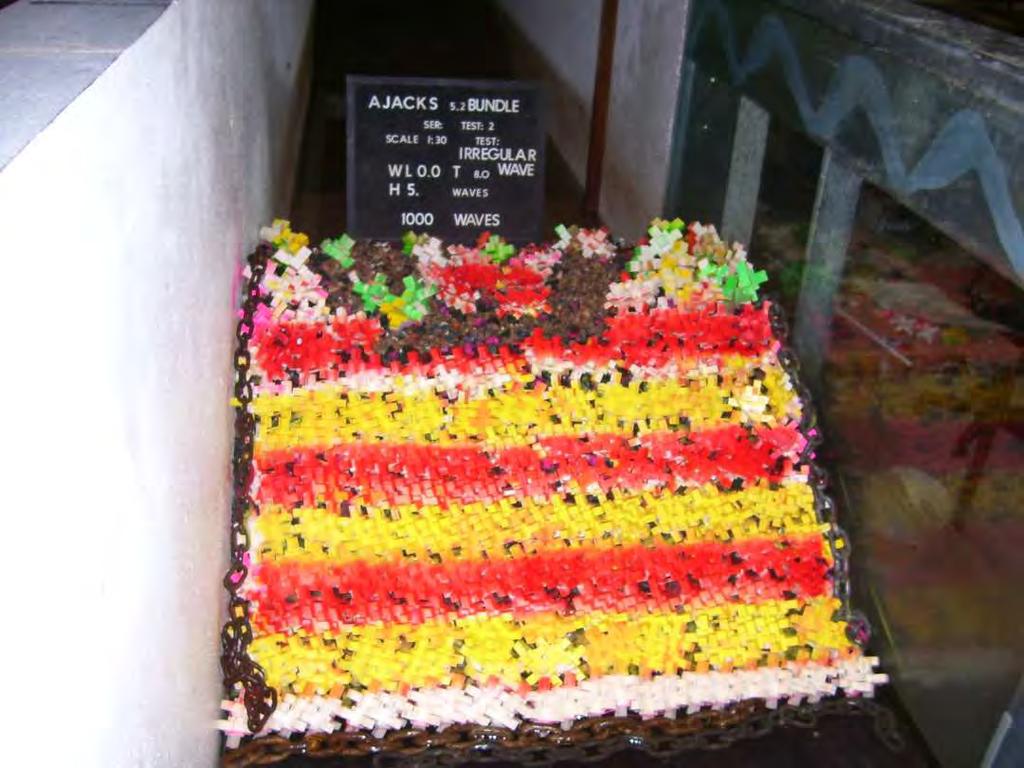
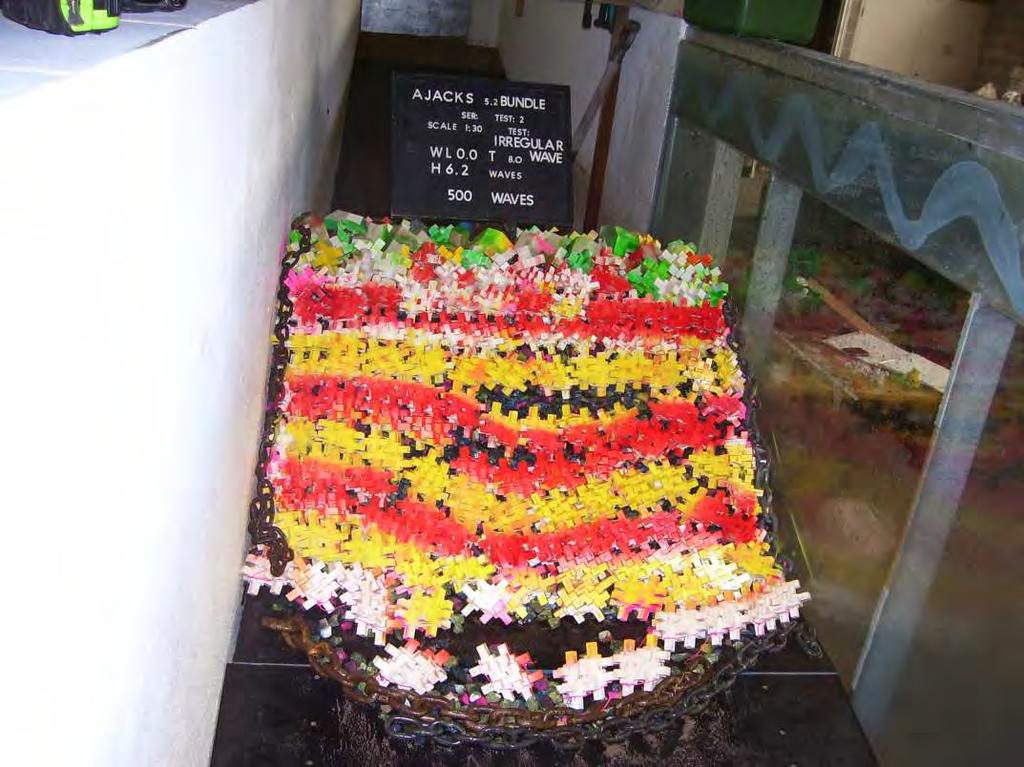
23 Test No. Type of Armour tonne single layer A-Jacks at a density of 66 units/100 m 2. The toe was constructed utilising bundled units Wave Height (m) tonne single layer A-Jacks at a density of 66 units/100 m 2. The toe was constructed utilising bundled units tonne single layer A-Jacks at a density of 66 units/100 m 2. The toe was constructed utilising bundled units 6.7 Comments * After 500 waves the toe was reinforced and testing was continued to 2000 waves. No damage was observed on the trunk After 500 waves the toe was reinforced and testing was continued to 2000 waves. No significant damage was observed on the trunk After 500 waves at 6.7 m, the toe was badly damaged and the secondary armour layer was visible at several locations (Figure 4.6) *water level was maintained at 0.0 m AHD and the peak period of the Jonswap spectrum was maintained at 8.0 s In this study, the surf similarity parameter (ξ) varied from 2.6 to This indicates that the wave breaking process was transitioning a mixture from surging to plunging waves. The results of the testing program outlined in Table 4.2 can be summarised as follows: An initial test was carried out on the A-Jacks units using 500 waves at 2 m wave height. Subsequently 2000 waves, at each of the wave heights from 4.2 m to 6.5 m, resulted in minor or no significant visible damage. After 500 waves at 6.7 m wave height, the single layer 2.33 tonne A-Jacks armour resulted in damage to the trunk resulting in exposure of the secondary armour and visible damage to the toe. If the bundled A-Jacks unit is considered to be a unit of 9.33 tonnes (4 times the single unit and an equivalent diameter of 1.52 m) then the K D value is estimated to be 27. The armour was placed at approximately 66 units/100 m 2. Details of the armour damage and aspects of the bundled armour are provided in Figures 4.4(b)-4.6. MHL
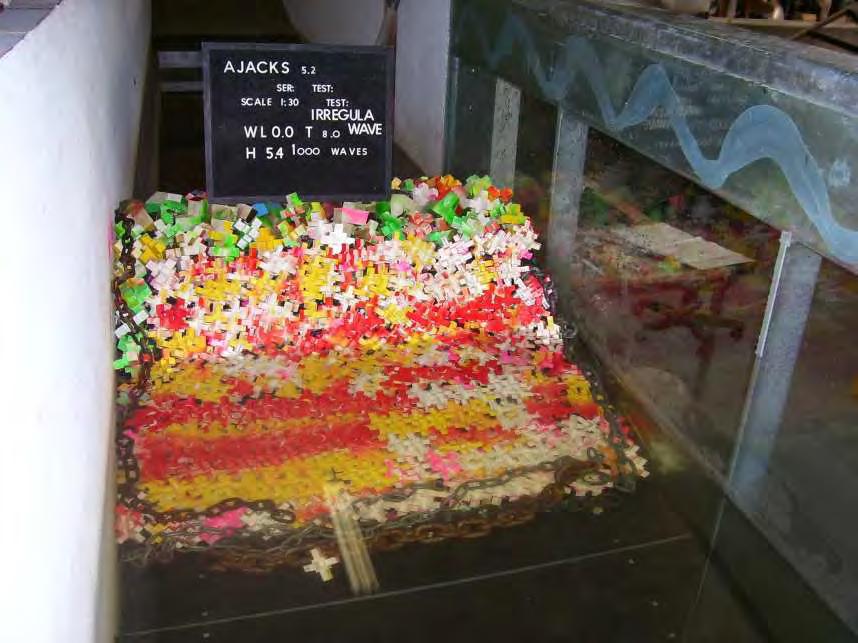
24 TF A-Jacks Unit Relaxed Bundled Placed Unit - Test Series Results The details of each individual test run undertaken as part of Stage 2 of the A-Jacks unit tests are provided in Table 4.3. Table 4.3 A-Jacks Testing - Relaxed Bundled Placed A-Jacks Armour Units Test No. Type of Armour tonne single layer A-Jacks at a density of 66 units/100 m 2. The toe was constructed utilising bundled units. The crest was reinforced with larger units tonne single layer A-Jacks at a density of 66 units/100 m 2. The toe was constructed utilising bundled units tonne single layer A-Jacks at a density of 66 units/100 m 2. The toe was constructed utilising bundled units tonne single layer A-Jacks at a density of 66 units/100 m 2. The toe was constructed utilising bundled units tonne single layer A-Jacks at a density of 66 units/100 m 2. The toe was constructed utilising bundled units Wave Height (m) Comments * After 2000 waves at 3.5 m no damage was recorded (Figure 4.7(b)) After 2000 waves at 4.2 m, no damage was recorded (Figure 4.8(a)) After 2000 waves at 4.8 m, 2 units were displaced (Figure 4.8(b)) After 2000 waves at 5.5 m, 4 units were displaced (Figure 4.8(c )) After 2000 waves at 5.5 m, 8 units were displaced and the structure was considered to be damaged. *water level was maintained at 0.0 m AHD and the peak period of the Jonswap spectrum was maintained at 8.0 s In this study, the surf similarity parameter (ξ) varied from 2.85 to This indicates that the wave breaking process went from plunging to surging waves. The results of the testing program outlined in Table 4.3 can be summarised as follows: An initial test was carried out on the A-Jacks units using 500 waves at 2 m wave height. Subsequently 2000 waves, at each of the wave heights from 3.5 m to 5.5 m, resulted in minor or no significant visible damage, with two units being displaced. After 2000 waves at 6.0 m wave height, the single layer 2.33 tonne A-Jacks armour resulted in damage to the trunk. The relaxed bundled A-Jacks placed unit is evaluated as a single independent unit of 2.33 tonnes, the K D value was estimated to be 66. The armour was placed at approximately 66 units/100 m 2. Estimates for K D values obtained during the testing are given in Table 4.4. MHL
25 Table 4.4 Estimates for K D A-Jacks Armour Placement During Tests A-Jacks Armour Unit Placement Estimates of A-Jacks K D for Different Armour Placements During Tests Placement Density (units/100 m 2 ) Random Bundled Random Placed Relaxed Bundled Placed MHL
26
27
28
29
30
31
32
33
34 5. Conclusions and Recommendations The Stage 1 testing of the A-Jacks unit (MHL 2003) involved testing a slender unit and a stubby unit which resulted in K D values higher than those obtained from testing other units such as rock, Hanbars, Antifer cubes and Accropodes. The second stage involved testing a unit which was not as slender or as stubby as the original units tested. The initial test program was undertaken to assess the capability of A-Jacks units to replace other units for the repair of large areas, new construction and for patch repairs. Stage 2 of the testing was undertaken to simulate construction of a new structure and the A-Jacks unit was the only unit under test. The A-Jacks units were placed in a single layer. In this study, the surf similarity parameter (ξ) varied from 2.6 to This indicates that the wave breaking process went from plunging to surging waves. Ahrens (1975) and van der Meer (1988) suggest that rock armour stability is a minimum during this breaker transition phase. The following conclusions can be drawn based on the model testing described in the study. 5.2 TF A-Jacks Unit - Random Placed Unit Test Series Results After 2000 waves at 4.2 m wave height, the single layer 2.33 tonne A-Jacks armour resulted in less than 1% damage. The estimated K D value was 29. The armour was placed at approximately 54 units/100 m TF A-Jacks Unit - Bundled Random Placed Unit - Test Series Results After 2000 waves at 6.5 m wave height, the single layer 2.33 tonne A-Jacks armour resulted in less than 1% damage. If the bundled A-Jacks unit is considered to be a unit of 9.33 tonnes (4 times the single unit ) then the K D value is estimated to be 27. The armour was placed at approximately 66 units/100 m TF A-Jacks Unit Relaxed Bundled Placed Unit - Test Series Results After 2000 waves at 5.5 m wave height, the single layer 2.33 tonne A-Jacks armour resulted in less than 1% damage. The relaxed bundled A-Jacks placed unit is evaluated as a single independent unit of 2.33 tonnes, the K D value was estimated to be 65. The armour was placed at approximately 66 units/100 m 2. MHL
35 Some general considerations regarding the A-Jacks unit follow: Due to the A-Jacks unit being placed in a single layer, early repair strategies have to be planned in order to prevent damage to the secondary armour and core. In addition to the coefficient of damage, the density of placement, wave climate, type of breaking wave, type of placement, permeability and hence core material have to be considered when considering the A-Jacks armour unit for design purposes. It is recommended that the ability of the modified A-Jacks unit as an interface be tested in the event that it is utilised with other larger breakwater units due to its high K D value. It is recommended that the 5.2 TF A-Jacks unit be further tested under 3D conditions in a wave basin in order to assess the unit s performance under the joint action of currents and waves. The following is a summary of K D values obtained during testing and comparison with historic values obtained for other armour units. Estimates for K D Values for Commonly Utilised Armour Units Armour Unit K D Source Rock 2-4 CERC (1984) Core-Loc 16 CLI (2002) Accropode 12 CLI (2002) A-Jacks MHL (2003) A-Jacks Random Placed 29 MHL (2009) A-Jacks Bundled Random Placed 27 MHL (2009) A-Jacks Relaxed Bundled Placed 65 MHL (2009) MHL
36 6. References Ahrens, J.P. 1975, Large Wave Tank Tests on Rip Rap Stability, Coastal Engineering Research Centre, Technical Memorandum No. 51, US Army Corps of Engineers. Amortec, 1999, A-Jacks Concrete Armour Units, Technical Report Moffatt & Nichol Engineers. Coastal Engineering Research Centre, 1984, Shore Protection Manual, Department of the Army, USA, 4 th Edition, Core-Loc International 2002, Historical Overview of Armour Units. Cornett, A. 1995, A Study of Forcing and Damage of Rock Armour on Rubble Mound Breakwaters, PhD Thesis, Technical Report HYD-TR-005, National Research Council, Canada. Dai, Y. B. and Kamel, A. M. 1969, Scale Effect Tests for Rubble Mound Breakwaters, Waterways Experiment Station, Research Report H-69-2, Department of the Army, USA. Manly Hydraulics Laboratory 1996, Laboratory Measurement of Oblique Irregular Waves on a Rubble Mound Breakwater, MHL Report No. 782 (draft). Manly Hydraulics Laboratory 2003, Physical Modelling of A-Jacks Units in Wave Flume Stage 1, MHL Report No Foster, D. and Gordon, A. D. 1973, Stability of Armour Units Against Breaking Waves, 1 st Australian Conference on Coastal and Ocean Engineering, Institution of Engineers Australia. Hughes S A, 1993, Physical Models and Laboratory Techniques in Coastal Engineering, Advanced Series on Ocean Engineering, Volume 7, World Scientific-pp 183. Jayewardene, I. F. W., Haradasa, D. K. C. and Tainsh, J. 1993, Analysis of Wave Groupiness, 11 th Australasian Conference on Coastal and Ocean Engineering, Institution of Engineers, Australia, Townsville, August van der Meer, J.W 1988, Deterministic and Probabilistic Design of Breakwater Armour Layers, Journal of Waterway Port and Coastal Engineering, January MHL
37 Appendix A Wave Measurement Example Time Series Tests
38 Appendix A Wave Measurement Random Wave Facility and Model Construction In the MHL random wave flume waves are generated by a sliding wedge wave paddle driven by a servo-hydraulic system. The flume transfer function is used during the tests to differentiate between the incoming wave and the reflected wave. The floor of the flume is adjustable in 1.2 m segments. The floor was adjusted at the start of the project to best approximate the slopes utilised in stage 1 of the testing. The design crosssection was built in the 10 m glass section of the flume for model inspection, photography and video filming. The toe of the cross-section was at a level of 0.0 m CD. The waves were generated at a level of m CD. The floor slope gradually increased from being flat at the point of generation to a slope of approximately 1:7 at the structure. Wave Conditions Random waves were generated according to a specified Jonswap energy spectrum defined by the wave height and peak spectral wave period. All model tests for stability were undertaken up to a total durations up to 2000 waves. Wave Statistics Wave statistics are provided in Table A1. Time Series (m ) 1 gamma = 3.3 Table A1 Wave Statistics T p (s) Wave Peak Period 1 Hmax/Hs H s (m) Jonswap Spectrum Wave Probes The wave probes were calibrated at the start and end of testing. The probe closest to the structure (P1) was placed 4.5 m away from the structure. The distance from probe P1 to P2 was 3.30 m, from P2 to P3 was 0.8 m and from P3 to P4 was 0.6 m (Figure 2.1). Sample wave forms for probe P1 to P4 are provided in Figures A1 and A2. These wave heights were recorded when a Jonswap spectrum was generated (for time series 1 and 2). MHL
39 A-JACKS Testing: Wave Time Series Hs = 3.5 Tp = Probe 1 (closest to paddle) Probe 2 Probe 3 Probe 4 (closest to structure) 4 3 Amplitude (m) Time (243 s) MHL Report 1901 EXAMPLE OF PROBE TIME SERIES Figure A1 DRAWING 1901-A1.cdr
40 A-JACKS Testing: Wave Time Series Hs = 4.2 Tp = Probe 1 (closest to paddle) Probe 2 Probe 3 Probe 4 (closest to structure) 4 3 Amplitude (m) Time (243 s) MHL Report 1901 EXAMPLE OF PROBE TIME SERIES Figure A2 DRAWING 1901-A2.cdr
41 Appendix B Model Cross-Section Details
42
43
44 Appendix C Model Secondary Armour Distribution
45 Pluto 3D Model Weight Distribution for Secondary Armour Passing (%) Weight(g) Figure C1 Model Secondary Armour Distribution Table C1 Distribution Statistics Model (Rock) Secondary Armour Units Mass W 15 (gms) Mass W 50 (gms) Mass W 85 (gms) MHL
46 110b King Street Manly Vale NSW 2093 T F TTY
Simulating Long Waves in a Coffs Harbour 3D Physical Model Using Short Wave Spectra
 Journal of Shipping and Ocean Engineering 6 (2016) 15-21 doi 10.17265/2159-5879/2016.01.002 D DAVID PUBLISHING Simulating Long Waves in a Coffs Harbour 3D Physical Model Using Short Wave Spectra Indra
Australian Journal of Basic and Applied Sciences
 AENSI Journals Australian Journal of Basic and Applied Sciences ISSN:1991-8178 Journal home page: www.ajbasweb.com Developing a Stability Formula for Breakwater-An Overview 1,2 Nur Aini Mohd Arish, 2 Othman
LABORATORY EXPERIMENTS FOR WAVE RUN-UP ON THE TETRAPOD ARMOURED RUBBLE MOUND STRUCTURE WITH A STEEP FRONT SLOPE
 Proceedings of the 6 th International Conference on the Application of Physical Modelling in Coastal and Port Engineering and Science (Coastlab16) Ottawa, Canada, May 10-13, 2016 Copyright : Creative Commons
Stability of Cubipod Armoured Roundheads in Short Crested Waves Burcharth, Hans Falk; Andersen, Thomas Lykke; Medina, Josep R.
 Aalborg Universitet Stability of Cubipod Armoured Roundheads in Short Crested Waves Burcharth, Hans Falk; Andersen, Thomas Lykke; Medina, Josep R. Published in: Coastal Engineering 2010 Publication date:
CHAPTER 132. Roundhead Stability of Berm Breakwaters
 CHAPTER 132 Roundhead Stability of Berm Breakwaters Jergen Juhl 1, Amir Alikham, Peter Sloth, Renata Archetti Abstract Three-dimensional (3D) model tests were carried out for studying the stability of
CHAPTER 68. RANDOM BREAKING WAVES HORIZONTAL SEABED 2 HANS PETER RIEDEl. & ANTHONY PAUL BYRNE
 CHAPTER 68 RANDOM BREAKING WAVES HORIZONTAL SEABED 2 HANS PETER RIEDEl. & ANTHONY PAUL BYRNE ABSTRACT According to wave theories the depth limited wave height over a horizontal seabed has a wave height
Large scale wave run-up tests on a rubble mound breakwater
 Large scale wave run-up tests on a rubble mound breakwater Van de Walle Björn 1, De Rouck Julien 2, Grüne Joachim 3, Helgason Einar 4 Introduction Large scale wave run-up tests have been performed in the
CHAPTER 135. Influence of the core configuration on the stability of berm breakwaters. Nikolay Lissev 1 AlfT0rum 2
 CHAPTER 135 Influence of the core configuration on the stability of berm breakwaters Nikolay Lissev 1 AlfT0rum 2 Abstract An experimental study has been carried out to investigate the concept of extending
REVETMENTS. Purposes and Operational Constraints. Purposes Erosion control o o. Revetment Design 4/5/2016. CE A676 Coastal Engineering
 REVETMENTS Ijsseldam, the Netherlands Orson P. Smith, PE, Ph.D. Instructor Purposes and Operational Constraints Purposes Erosion control o o Embankment Toe protection for a seawall, retaining wall or other
Update: UNSW s Research Program for Extreme Waves on Fringing Reefs. Matt Blacka,Kristen Splinter, Ron Cox
 Update: UNSW s Research Program for Extreme Waves on Fringing Reefs Matt Blacka,Kristen Splinter, Ron Cox Overview Research Area 1: Extreme wave and water level processes for fringing reef coastlines Research
WAVE OVERTOPPING OF RUBBLE MOUND BREAKWATERS
 WAVE OVERTOPPING OF RUBBLE MOUND BREAKWATERS Mogens Hebsgaard 1, Peter Sloth 1, and tegen Juhl 2 Abstract A general expression for the overtopping discharge of a rubble mound breakwater has been derived
CASE STUDIES IN DAMAGE AND REPAIR STRATEGIES FOR TRAINING WALLS AND BREAKWATERS ON THE NSW COASTLINE POST-JUNE 2016 STORM
 CASE STUDIES IN DAMAGE AND REPAIR STRATEGIES FOR TRAINING WALLS AND BREAKWATERS ON THE NSW COASTLINE POST-JUNE 2016 STORM I Jayewardene 1, B Blumberg 1, E Couriel 1, A Hartley 2, R Main 2, K Morton 2,
BILLY BISHOP TORONTO CITY AIRPORT PRELIMINARY RUNWAY DESIGN COASTAL ENGINEERING STUDY
 Bâtiment Infrastructures municipales Transport Industriel Énergie Environnement BILLY BISHOP TORONTO CITY AIRPORT PRELIMINARY RUNWAY DESIGN COASTAL ENGINEERING STUDY N. Guillemette 1, C. Glodowski 1, P.
Risk Awareness Key to a Sustainable Design Approach for Breakwater Armouring
 Risk Awareness Key to a Sustainable Design Approach for Breakwater Armouring J.S. Reedijk, Delta Marine Consultants, Gouda, The Netherlands M. Muttray, Delta Marine Consultants, Gouda, The Netherlands
Steven A. Hughes. Ph.D., P.E. David R. Basco. Ph.D., P.E.
 Steven A. Hughes. Ph.D., P.E. Coastal and Hydraulics Laboratory US Army Engineer Research and Development Center David R. Basco. Ph.D., P.E. Coastal Engineering Center Old Dominion University Overview
FINAL-REPORT for the M.Sc.Thesis. Influence of foreshore steepness on wave velocity and acceleration at the breakwater interface
 FINAL-REPORT for the M.Sc.Thesis Influence of foreshore steepness on wave velocity and acceleration at the breakwater interface Student: Supervisors: N.J.Oortman prof.dr.ir.m.j.f.stive ir.h.j.verhagen
PARAMETRIZATION OF WAVE TRANSFORMATION ABOVE SUBMERGED BAR BASED ON PHYSICAL AND NUMERICAL TESTS
 Proceedings of the 6 th International Conference on the Application of Physical Modelling in Coastal and Port Engineering and Science (Coastlab16) Ottawa, Canada, May 10-13, 2016 Copyright : Creative Commons
+)) Lower Churchill Project RIPRAP DESIGN FOR WIND-GENERATED WAVES SNC LAVALIN. SLI Document No HER
) Lower Churchill Project RIPRAP DESIGN FOR WIND-GENERATED WAVES SNC LAVALIN. SLI Document No HER") +)) SNC LAVALIN Lower Churchill Project RIPRAP DESIGN FOR SLI Document No. 505573-3001-4HER-0011-00 Nalcor Reference No. MFA-SN-CD-0000-CV-RP-0006-01 Rev. 81 Date: 07 -Dec-2012 Prepared by: Checked by:
+)) SNC LAVALIN Lower Churchill Project RIPRAP DESIGN FOR SLI Document No. 505573-3001-4HER-0011-00 Nalcor Reference No. MFA-SN-CD-0000-CV-RP-0006-01 Rev. 81 Date: 07 -Dec-2012 Prepared by: Checked by:
CHAPTER ONE HUNDRED SIXTY SIX
 CHAPTER ONE HUNDRED SIXTY SIX ABSTRACT STABILITY OF BREAKWATERS WITH VARIATIONS IN CORE PERMEABILITY G.W. Timco*, E.P.D. Mansard* and J. Ploeg* In setting-up a breakwater test in a laboratory flume, the
Present Practices in Design of Rubblemound Breakwaters for Coastal Harbours-A Review
 International Journal of Current Engineering and Technology E-ISSN 2277 4106, P-ISSN 2347 5161 2018 INPRESSCO, All Rights Reserved Available at http://inpressco.com/category/ijcet Review Article Present
WAVE REFLECTION AND WAVE RUN-UP AT RUBBLE MOUND BREAKWATERS
 WAVE REFLECTION AND WAVE RUN-UP AT RUBBLE MOUND BREAKWATERS Markus Muttray, ocine Oumeraci, Erik ten Oever Wave reflection and wave run-up at rubble mound breakwaters with steep front slope were investigated
PHYSICAL MODELLING OF EMERGENCY REPAIRS TO THE MAIN BREAKWATER OF CALSHOT HARBOUR ON TRISTAN DA CUNHA ISLAND
 Proceedings of the 6 th International Conference on the Application of Physical Modelling in Coastal and Port Engineering and Science (Coastlab16) Ottawa, Canada, May 10-13, 2016 Copyright : Creative Commons
WAVE OVERTOPPING AND RUBBLE MOUND STABILITY UNDER COMBINED LOADING OF WAVES AND CURRENT
 WAVE OVERTOPPING AND RUBBLE MOUND STABILITY UNDER COMBINED LOADING OF WAVES AND CURRENT Sepehr Eslami A. and Marcel R.A. van Gent Coastal structures such as breakwaters are usually studied under wave loading
Technical Brief - Wave Uprush Analysis Island Harbour Club, Gananoque, Ontario
 Technical Brief - Wave Uprush Analysis RIGGS ENGINEERING LTD. 1240 Commissioners Road West Suite 205 London, Ontario N6K 1C7 October 31, 2014 Table of Contents Section Page Table of Contents... i List
LABORATORY EXPERIMENTS ON WAVE OVERTOPPING OVER SMOOTH AND STEPPED GENTLE SLOPE SEAWALLS
 Asian and Pacific Coasts 23 LABORATORY EXPERIMENTS ON WAVE OVERTOPPING OVER SMOOTH AND STEPPED GENTLE SLOPE SEAWALLS Takayuki Suzuki 1, Masashi Tanaka 2 and Akio Okayasu 3 Wave overtopping on gentle slope
INVESTIGATION OF WAVE AGITATION INSIDE THE NEW FISHERY PORT (CASE STUDY: NEW MRZOUKA FISHERY PORT, LIBYA)
") INVESTIGATION OF WAVE AGITATION INSIDE THE NEW FISHERY PORT (CASE STUDY: NEW MRZOUKA FISHERY PORT, LIBYA) Abdelazim M. Ali Researcher, The Hydraulics Research Institute, National Water Research Center,
INVESTIGATION OF WAVE AGITATION INSIDE THE NEW FISHERY PORT (CASE STUDY: NEW MRZOUKA FISHERY PORT, LIBYA) Abdelazim M. Ali Researcher, The Hydraulics Research Institute, National Water Research Center,
Aalborg Universitet. Published in: Proceedings of Offshore Wind 2007 Conference & Exhibition. Publication date: 2007
 Aalborg Universitet Design Loads on Platforms on Offshore wind Turbine Foundations with Respect to Vertical Wave Run-up Damsgaard, Mathilde L.; Gravesen, Helge; Andersen, Thomas Lykke Published in: Proceedings
PHYSICAL AND NUMERICAL MODELLING OF WAVE FIELD IN FRONT OF THE CONTAINER TERMINAL PEAR - PORT OF RIJEKA (ADRIATIC SEA)
") PHYSICAL AND NUMERICAL MODELLING OF WAVE FIELD IN FRONT OF THE CONTAINER TERMINAL PEAR - PORT OF RIJEKA (ADRIATIC SEA) DALIBOR CAREVIĆ (1), GORAN LONČAR (1), VLADIMIR ANDROČEC (1) & MARIN PALADIN (1) 1.
PHYSICAL AND NUMERICAL MODELLING OF WAVE FIELD IN FRONT OF THE CONTAINER TERMINAL PEAR - PORT OF RIJEKA (ADRIATIC SEA) DALIBOR CAREVIĆ (1), GORAN LONČAR (1), VLADIMIR ANDROČEC (1) & MARIN PALADIN (1) 1.
Chapter 4 EM THE COASTAL ENGINEERING MANUAL (Part I) 1 August 2008 (Change 2) Table of Contents. Page. I-4-1. Background...
 1 August 2008 (Change 2) Table of Contents. Page. I-4-1. Background...") Chapter 4 EM 1110-2-1100 THE COASTAL ENGINEERING MANUAL (Part I) 1 August 2008 (Change 2) Table of Contents I-4-1. Background... Page I-4-1 a. Shore Protection Planning and Design, TR 4... I-4-1 b. Shore
Chapter 4 EM 1110-2-1100 THE COASTAL ENGINEERING MANUAL (Part I) 1 August 2008 (Change 2) Table of Contents I-4-1. Background... Page I-4-1 a. Shore Protection Planning and Design, TR 4... I-4-1 b. Shore
Influence of Relative Water Depth on Wave Run-up Over Costal Structures; Smooth Slopes
 ENGINEER - Vol. XXXVIII, No. 03, pp. 7-13, 2005 The Institution of Engineers, Sri Lanka Influence of Relative Water Depth on Wave Run-up Over Costal Structures; Smooth Slopes D. A. Peiris and J. J. Wijetunga
Comparison of Predicted and Measured Shoaling at Morro Bay Harbor Entrance, California
 Comparison of Predicted and Measured Shoaling at Morro Bay Harbor Entrance, California by Edward F. Thompson, Inocencio P. DiRamos, and Robert R. Bottin, Jr. PURPOSE: This Coastal and Hydraulics Engineering
STABILITY OF RUBBLE MOUND BREAKWATERS IN SHALLOW WATER AND SURF ZONE : AN EXPERIMENTAL STUDY
 STABILITY OF RUBBLE MOUND BREAKWATERS IN SHALLOW WATER AND SURF ZONE : AN EXPERIMENTAL STUDY Guirec PREVOT 1, Olivier BOUCHER 1, Maryline LUCK 2 and Michel BENOIT 2 Rubble-mound breakwaters are often pre-designed
Sea State Analysis. Topics. Module 7 Sea State Analysis 2/22/2016. CE A676 Coastal Engineering Orson P. Smith, PE, Ph.D.
 Sea State Analysis Module 7 Orson P. Smith, PE, Ph.D. Professor Emeritus Module 7 Sea State Analysis Topics Wave height distribution Wave energy spectra Wind wave generation Directional spectra Hindcasting
Ballina Accropode Breakwater Flume Testing. Report MHL795 March 1997
 Ballina Accropode Breakwater Flume Testing Report MHL795 March 1997 BALLINA ACCROPODE BREAKWATER FLUME TESTING Department of Public Works and Services Manly Hydraulics Laboratory Report MHL 795 PW Report
BEACH EROSION COUNTERMEASURE USING NEW ARTIFICIAL REEF BLOCKS
 BEACH EROSION COUNTERMEASURE USING NEW ARTIFICIAL REEF BLOCKS Kyuhan Kim 1, Sungwon Shin 1, Chongkun Pyun 2, Hyundong Kim 3, and Nobuhisa Kobayashi 4 Two-dimensional and three-dimensional laboratory experiments
Low-crested offshore breakwaters: a functional tool for beach management
 Environmental Problems in Coastal Regions VI 237 Low-crested offshore breakwaters: a functional tool for beach management K. Spyropoulos & E. Andrianis TRITON Consulting Engineers, Greece Abstract Beach
COST EFFECTIVE STORAGE CAPACITY INCREASE FOR ALUMINA TAILINGS DISPOSAL AREA THROUGH SPILLWAY OPTIMISATION
 COST EFFECTIVE STORAGE CAPACITY INCREASE FOR ALUMINA TAILINGS DISPOSAL AREA THROUGH SPILLWAY OPTIMISATION Abstract Lonie I * Tailings and Dams, GHD Brisbane, QLD, Australia Queensland Alumina Limited operates
CMS Modeling of the North Coast of Puerto Rico
 CMS Modeling of the North Coast of Puerto Rico PRESENTED BY: Dr. Kelly Rankin Legault, Ph.D., P.E. 1 Dr. Alfredo Torruella, Ph.D. 2 1 USACE Jacksonville District 2 University of Puerto Rico October 2016
Appendix M: Durras Lake Tailwater Conditions
 Appendix M: Durras Lake Tailwater Conditions M.1 Preamble WRL has completed a tailwater condition assessment for the entrance to Durras Lake, to be used as an ocean boundary condition for a future flood
USE OF SEGMENTED OFFSHORE BREAKWATERS FOR BEACH EROSION CONTROL
 .. CETN-III-22 4/84 PURPOSE: USE OF SEGMENTED OFFSHORE BREAKWATERS FOR BEACH EROSION CONTROL To provide information on the functional application of and general design considerations for using offshore
PHYSICAL MODELING SUPPORTING DESIGN AND CONSTRUCTION OF LOW CRESTED BREAKWATER FOR THE AYIA NAPA MARINA, CYPRUS
 PHYSICAL MODELING SUPPORTING DESIGN AND CONSTRUCTION OF LOW CRESTED BREAKWATER FOR THE AYIA NAPA MARINA, CYPRUS M. WESSON 1, M. PROVAN 2, J. COX 3,P. KNOX 4 1 SmithGroupJJR, Madison, USA, Mauricio.Wesson@SmithgroupJJR.com
WIND WAVES REFLECTIONS - A CASE STUDY
 WIND WAVES REFLECTIONS - A CASE STUDY J. Rytktinen Rak enteiden Mekaniikka, Vol 1 No 1 1988, s. 55... 65 This study describes s ome o f t h e wa v e r eflection measur ements conducted at the Hydraulic
Shoreline Evolution Due to Oblique Waves in Presence of Submerged Breakwaters. Nima Zakeri (Corresponding Author), Mojtaba Tajziehchi
, Mojtaba Tajziehchi") Shoreline Evolution Due to Oblique Waves in Presence of Submerged Breakwaters Nima Zakeri (Corresponding Author), Mojtaba Tajziehchi Department of Civil Engineering, Faculty of Engineering, University
Shoreline Evolution Due to Oblique Waves in Presence of Submerged Breakwaters Nima Zakeri (Corresponding Author), Mojtaba Tajziehchi Department of Civil Engineering, Faculty of Engineering, University
WAVE PRESSURE DISTRIBUTION ON PERMEABLE VERTICAL WALLS
 Abstract WAVE PRESSURE DISTRIBUTION ON PERMEABLE VERTICAL WALLS Hendrik Bergmann, Hocine Oumeraci The pressure distribution at permeable vertical walls is investigated within a comprehensive large-scale
INTRODUCTION TO COASTAL ENGINEERING AND MANAGEMENT
 Advanced Series on Ocean Engineering Volume 16 INTRODUCTION TO COASTAL ENGINEERING AND MANAGEMENT J. William Kamphuis Queen's University, Canada World Scientific Singapore New Jersey London Hong Kong Contents
MODELING OF CLIMATE CHANGE IMPACTS ON COASTAL STRUCTURES - CONTRIBUTION TO THEIR RE-DESIGN
 Proceedings of the 14 th International Conference on Environmental Science and Technology Rhodes, Greece, 3-5 September 2015 MODELING OF CLIMATE CHANGE IMPACTS ON COASTAL STRUCTURES - CONTRIBUTION TO THEIR
INTRODUCTION TO COASTAL ENGINEERING
 The University of the West Indies Organization of American States PROFESSIONAL DEVELOPMENT PROGRAMME: COASTAL INFRASTRUCTURE DESIGN, CONSTRUCTION AND MAINTENANCE A COURSE IN COASTAL DEFENSE SYSTEMS I CHAPTER
SPH applied to coastal engineering problems
 2 nd Iberian Workshop Ourense, 3 rd and 4 th December 2015 SPH applied to coastal engineering problems (validating the SPH concept) ALTOMARE, CRESPO, DOMINGUEZ, SUZUKI http://www.flandershydraulicsresearch.be/
Wave Breaking and Wave Setup of Artificial Reef with Inclined Crown Keisuke Murakami 1 and Daisuke Maki 2
 Wave Breaking and Wave Setup of Artificial Reef with Inclined Crown Keisuke Murakami 1 and Daisuke Maki 2 Beach protection facilities are sometimes required to harmonize with coastal environments and utilizations.
WAVE MECHANICS FOR OCEAN ENGINEERING
 Elsevier Oceanography Series, 64 WAVE MECHANICS FOR OCEAN ENGINEERING P. Boccotti Faculty of Engineering University of Reggio-Calabria Feo di Vito 1-89060 Reggio-Calabria Italy 2000 ELSEVIER Amsterdam
LABORATORY EXPERIMENTS ON EROSION CONTROL PERFORMANCE OF AN L- SHAPED PERMEABLE STRUCTURE. Abstract
 LABORATORY EXPERIMENTS ON EROSION CONTROL PERFORMANCE OF AN L- SHAPED PERMEABLE STRUCTURE Yuuji Maeda 1, Masayuki Unno 2, Masafumi Sato 2, Takao Kurita 2, Takaaki Uda 3 and Shinji Sato 4 Abstract A new
Modelling of Extreme Waves Related to Stability Research
 Modelling of Extreme Waves Related to Stability Research Janou Hennig 1 and Frans van Walree 1 1. Maritime Research Institute Netherlands,(MARIN), Wageningen, the Netherlands Abstract: The paper deals
ITTC Recommended Procedures and Guidelines
 Page 1 of 6 Table of Contents 1. PURPOSE...2 2. PARAMETERS...2 2.1 General Considerations...2 3 DESCRIPTION OF PROCEDURE...2 3.1 Model Design and Construction...2 3.2 Measurements...3 3.5 Execution of
Reducing Public Safety Risk at a NSW Breakwater
 Reducing Public Safety Risk at a NSW Breakwater E Watterson 1, S Driscoll 2 1 SMEC Ports and Marine, Newcastle, NSW 2 NSW Crown Lands Minor Ports Unit, Newcastle, NSW Observations, photographs, physical
SACO RIVER AND CAMP ELLIS BEACH SACO, MAINE SECTION 111 SHORE DAMAGE MITIGATION PROJECT APPENDIX F ECONOMIC ASSESSMENT
 SACO RIVER AND CAMP ELLIS BEACH SACO, MAINE SECTION 111 SHORE DAMAGE MITIGATION PROJECT APPENDIX F ECONOMIC ASSESSMENT Department of the Army New England District, Corps of Engineers 696 Virginia Road
COFFS HARBOUR BOAT RAMP LONG WAVE DATA COLLECTION TO EVALUATE PERFORMANCE OF BASIN EXTENSION WORKS
 COFFS HARBOUR BOAT RAMP LONG WAVE DATA COLLECTION TO EVALUATE PERFORMANCE OF BASIN EXTENSION WORKS M Kulmar 1, I Jayewardene 1, M Glatz 1, M Robertson 2 1 NSW Government, Manly Hydraulics Laboratory (MHL),
Technical Note AN EMPIRICAL. METHOD FOR DESIGN OF BREAKWATERS AS SHORE PROTECTION STRUCTURES
 CETN III-23 (Rev 3/95) Coastal Engineering Technical Note AN EMPIRICAL. METHOD FOR DESIGN OF BREAKWATERS AS SHORE PROTECTION STRUCTURES PURPOSE: To present an empirical method that can be used for preliminary
Longshore sediment transport
 and Orson P. Smith, PE, Ph.D., Professor Emeritus Longshore transport Waves breaking at an angle to shore Sediment under breakers lifted by saltation Drops back to sea bed a little down drift Swash (runup)
INTERACTION BETWEEN WIND-DRIVEN AND BUOYANCY-DRIVEN NATURAL VENTILATION Bo Wang, Foster and Partners, London, UK
 INTERACTION BETWEEN WIND-DRIVEN AND BUOYANCY-DRIVEN NATURAL VENTILATION Bo Wang, Foster and Partners, London, UK ABSTRACT Ventilation stacks are becoming increasingly common in the design of naturally
Nearshore Placed Mound Physical Model Experiment
 Nearshore Placed Mound Physical Model Experiment PURPOSE: This technical note describes the migration and dispersion of a nearshore mound subjected to waves in a physical model. The summary includes recommendations
FEMA Region V. Great Lakes Coastal Flood Study. Pilot Study Webinar. Berrien County, Michigan. February 26, 2014
 FEMA Region V Great Lakes Coastal Flood Study Pilot Study Webinar Berrien County, Michigan February 26, 2014 2 Pilot Study Webinar Agenda Great Lakes Coastal Flood Study Background Demonstration Project
STRUCTURAL STABILITY OF CUBE AND ROCK-ARMOURED SUBMERGED BREAKWATERS FOR BEACH PROTECTION
 STRUCTURAL STABILITY OF CUBE AND ROCK-ARMOURED SUBMERGED BREAKWATERS FOR BEACH PROTECTION José F. Sánchez-González 1, Joaquín Garrido Checa 2 ; Mª Dolores Ortiz Sánchez 3 and Manuel Martín Huescar 1 This
Model Test Setup and Program for Experimental Estimation of Surface Loads of the SSG Kvitsøy Pilot Plant from Extreme Wave Conditions
 Model Test Setup and Program for Experimental Estimation of Surface Loads of the SSG Kvitsøy Pilot Plant from Extreme Wave Conditions according to Co-operation Agreement (phase 4) between WAVEenergy (Norway)
OECS Regional Engineering Workshop September 29 October 3, 2014
 B E A C H E S. M A R I N A S. D E S I G N. C O N S T R U C T I O N. OECS Regional Engineering Workshop September 29 October 3, 2014 Coastal Erosion and Sea Defense: Introduction to Coastal/Marine Structures
International Journal of Innovative Research in Advanced Engineering (IJIRAE) ISSN:
 ISSN:") RANSMISSION COEFFICIEN (K) AND REFLECION COEFFICIEN () ON BREAKWAER YPE CUBE Setiyawan Department of Civil Engineering, adulako University, Palu, Central Sulawesi, Indonesia setiyawanvip@yahoo.co.id; Manuscript
RANSMISSION COEFFICIEN (K) AND REFLECION COEFFICIEN () ON BREAKWAER YPE CUBE Setiyawan Department of Civil Engineering, adulako University, Palu, Central Sulawesi, Indonesia setiyawanvip@yahoo.co.id; Manuscript
Stability of Rock Armoured Beach Control Structures
 Stability of Rock Armoured Beach Control Structures Allsop NW H Jones R J Report SR 289 December 1994 {revised October 1995) Stability of Rock Armoured Beach Control Structures Allsop NW H Jones R J Report
CHAPTER 131. Breakwater Stability under Regular and Irregular Wave Attack
 CHAPTER 131 Breakwater Stability under Regular and Irregular Wave Attack Abstract Thomas Jensen*, Henning Andersen*, John Grenbech** Etienne P.D. Mansard and Michael H. Davies The main objective of the
PHYSICAL MODELLING INVESTIGATION FOR DIKKOWITA FISHERY HARBOUR
 8 th INTERNATIONALCONFERENCEONCOASTALANDPORT ENGINEERINGINDEVELOPINGCOUNTRIES COPEDEC2012,IITMadras,Chennai,INDIA. 2024Feb.2012 PHYSICAL MODELLING INVESTIGATION FOR DIKKOWITA FISHERY HARBOUR I. G. I. Kumara
# Post Consultation and Submissions Resource Consent Conditions for Surfing Impact Mitigation August 2016
 # Post Consultation and Submissions Resource Consent Conditions for Surfing Impact Mitigation August 2016 Surf Mitigation Management Plan 1 1 Not less than 6 months prior to the commencement of the construction
Evaluation of June 9, 2014 Federal Emergency Management Agency Flood Insurance Study for Town of Weymouth, Norfolk, Co, MA
 Evaluation of June 9, 2014 Federal Emergency Management Agency Flood Insurance Study for Town of Weymouth, Norfolk, Co, MA Prepared For: Woodard & Curran 95 Cedar Street, Suite 100 Providence, RI 02903
Using sea bed roughness as a wave energy dissipater
 Island Sustainability II 203 Using sea bed roughness as a wave energy dissipater T. Elgohary 1, R. Elgohary 1 & M. Hagrass 2 1 Department of Civil Engineering (Irrigation and Hydraulic), The Tenth of Ramadan
A: Formalities. DELOS WP 1.1 Inventory on LCS, questionnaire, detailed description, revision D AUTH GR. Participant code and who to contact.
 A: Formalities Participant code and who to contact. AUTH GR J. Avgeris E-mail iavgeris@civil.auth.gr This date (today, mm:dd:yyyy) and revision number (A..Z). 17/09/01 Rev A Location of LCS. Patras Gulf,
Wave Transmission on Submerged Rubble Mound Breakwater Using L-Blocks
 2011 2nd International Conference on Environmental Science and Technology IPCEE vol.6 (2011) (2011) IACSIT Press, Singapore Wave Transmission on Submerged Rubble Mound reakwater Using L-locks Dayat Indri
Appendix D: SWAN Wave Modelling
 Appendix D: SWAN Wave Modelling D.1 Preamble The Eurobodalla Shire Council area is subject to extreme waves originating from offshore storms. When swell waves approach the coast, they are modified by the
Wave Dragon A slack moored wave energy converter
 Wave Dragon A slack moored wave energy converter J. P. KOFOED 1, P. FRIGAARD 1, H. C. SØRENSEN 2 and E. FRIIS-MADSEN 3 1 Hydraulics and Coastal Engineering Laboratory, Aalborg University, Aalborg, Denmark.
Greenup Lock Filling and Emptying System Study
 Fourth LACCEI International Latin American and Caribbean Conference for Engineering and Technology (LACCET 2006) Breaking Frontiers and Barriers in Engineering: Education, Research and Practice 21-23 June
2. Water levels and wave conditions. 2.1 Introduction
 18 2. Water levels and wave conditions 2.1 Introduction This Overtopping Manual has a focus on the aspects of wave run-up and wave overtopping only. It is not a design manual, giving the whole design process
Hydraulic stability of rubble mound breakwaters in breaking wave conditions: a comparative study of existing prediction formulas
 Hydraulic stability of rubble mound breakwaters in breaking wave conditions: a comparative study of existing prediction formulas Sander Franco Supervisor: Prof. Josep R. Medina Co-supervisor: Prof. dr.
Undertow - Zonation of Flow in Broken Wave Bores
 Lecture 22 Nearshore Circulation Undertow - Zonation of Flow in Broken Wave Bores In the wave breaking process, the landward transfer of water, associated with bore and surface roller decay within the
Coastal and Hydraulics Laboratory ERDC/CHL TR-03- Overtopping Studies of a Stepped Revetment for City of Chicago, Illinois. Donald L.
 ERDC/CHL TR-03- Overtopping Studies of a Stepped Revetment for City of Chicago, Illinois Donald L. Ward August 2003 Coastal and Hydraulics Laboratory Approved for public release; distribution is unlimited.
CHAPTER ONE HUNDRED SEVENTY EIGHT
 CHAPTER ONE HUNDRED SEVENTY EIGHT Reef Type Breakwaters John P. Ahrens, Aff. M. ASCE* Introduction Reef type breakwaters refers to a low-crested rubble mound breakwater without the traditional multilayer
IMPACTS OF COASTAL PROTECTION STRATEGIES ON THE COASTS OF CRETE: NUMERICAL EXPERIMENTS
 IMPACTS OF COASTAL PROTECTION STRATEGIES ON THE COASTS OF CRETE: NUMERICAL EXPERIMENTS Tsanis, I.K., Saied, U.M., Valavanis V. Department of Environmental Engineering, Technical University of Crete, Chania,
SUPERGEN Wind Wind Energy Technology Rogue Waves and their effects on Offshore Wind Foundations
 SUPERGEN Wind Wind Energy Technology Rogue Waves and their effects on Offshore Wind Foundations Jamie Luxmoore PhD student, Lancaster University SUPERGEN Wind II - 7 th training seminar 3 rd - 4 th September
Wave Overtopping of Seawalls. Design and Assessment Manual. HR Wallingford Ltd. February R&D Technical Report W178. R&D Technical Report W178
 Wave Overtopping of Seawalls Design and Assessment Manual HR Wallingford Ltd February 1999 R&D Technical Report W178 R&D Technical Report W178 Commissioning Organisation Environment Agency Rio House Waterside
Coastal and Hydraulics Laboratory. Wave Runup Prediction for Flood Hazard Assessment ERDC/CHL TR-12-X. Jeffrey A. Melby DRAFT May 2012
 Coastal and Hydraulics Laboratory ERDC/CHL TR-12-X Wave Runup Prediction for Flood Hazard Assessment Jeffrey A. Melby DRAFT May 2012 Great Lakes Coastal Flood Study, 2012 Federal Inter-Agency Initiative
PERFORMANCE OF VERTICAL COMPOSITE BREAKWATER MODEL OF BOX-BEAMS, ROCK AND PILES
 International Journal of Civil Engineering and Technology (IJCIET) Volume 9, Issue 13, December 2018, pp.1319 1329, Article ID: IJCIET_09_13_135 Available online at http://www.ia aeme.com/ijciet/issues.asp?jtype=ijciet&vtype=
AFT'LICATION OF M3vABLE-RED F'HYSICAL MODHIS To FBED1crslWM-INDUCED ERmIoN
 CETN-II-18 6189 AFT'LICATION OF M3vABLE-RED F'HYSICAL MODHIS To FBED1crslWM-INDUCED ERmIoN PURKSE: This note provides guidance and nomograms for determining if twodimensional, movable-bed physical models
HRPP 464. Wave pressures in and under rubble mound breakwaters. Clemente Cantelmo, William Allsop and Scott Dunn
 HRPP 464 Wave pressures in and under rubble mound breakwaters Clemente Cantelmo, William Allsop and Scott Dunn Reproduced from a paper published in: Proceedings of the Fifth International Conference on
Wave Propagation and Shoaling
 Wave Propagation and Shoaling Focus on movement and natural alteration of the characteristics of waves as they travel from the source region toward shore Waves moving from deep to intermediate/shallow
Wave Transmission Testing of the Martin Ecosystems BioHaven Floating Breakwater
 Wave Transmission Testing of the Martin Ecosystems BioHaven Floating Breakwater March 14, 2014 Submitted by: Bret M. Webb, Ph.D., P.E. Assistant Professor Department of Civil Engineering University of
Metocean criteria for fatigue assessment. Rafael V. Schiller 5th COPEDI Seminar, Oct 8th 2014.
 Metocean criteria for fatigue assessment Rafael V. Schiller 5th COPEDI Seminar, Oct 8th 2014. Metocean requirements along the lifecycle of a project Metocean criteria for fatigue Analysis techniques and
Physical Modeling of Nearshore Placed Dredged Material Rusty Permenter, Ernie Smith, Michael C. Mohr, Shanon Chader
 Physical Modeling of Nearshore Placed Dredged Material Rusty Permenter, Ernie Smith, Michael C. Mohr, Shanon Chader Research Hydraulic Engineer ERDC-Coastal Hydraulics Laboratory October 25,2012 Study
SAMPLE MAT Proceedings of the 10th International Conference on Stability of Ships
 and Ocean Vehicles 1 Application of Dynamic V-Lines to Naval Vessels Matthew Heywood, BMT Defence Services Ltd, mheywood@bm tdsl.co.uk David Smith, UK Ministry of Defence, DESSESea-ShipStab1@mod.uk ABSTRACT
EXPERIMENTAL MEASUREMENT OF THE WASH CHARACTERISTICS OF A FAST DISPLACEMENT CATAMARAN IN DEEP WATER
 EXPERIMENTAL MEASUREMENT OF THE WASH CHARACTERISTICS OF A FAST DISPLACEMENT CATAMARAN IN DEEP WATER A.F. Molland, P.A. Wilson and D.J. Taunton Ship Science Report No. 124 University of Southampton December
A New Strategy for Harbor Planning and Design
 A New Strategy for Harbor Planning and Design Xiuying Xing, Ph.D Research Associate Sonny Astani Department of Civil and Environmental Engineering University of Southern California Los Angeles, CA 90089-2531
Numerical Simulation of Wave Loads on Static Offshore Structures
 Numerical Simulation of Wave Loads on Static Offshore Structures Hrvoje Jasak, Inno Gatin, Vuko Vukčević Wikki Ltd, United Kingdom Faculty of Mechanical Engineering and Naval Architecture University of
Available online at ScienceDirect. Procedia Engineering 116 (2015 )
") Available online at www.sciencedirect.com ScienceDirect Procedia Engineering 116 (2015 ) 320 325 8th International Conference on Asian and Pacific Coasts (APAC 2015) Department of Ocean Engineering, IIT
Available online at www.sciencedirect.com ScienceDirect Procedia Engineering 116 (2015 ) 320 325 8th International Conference on Asian and Pacific Coasts (APAC 2015) Department of Ocean Engineering, IIT
LONG WAVES IN FLUME EXPERIMENTS
 LONG WVES IN FLUME EPERIMENTS J. William Kamphuis, M.SCE 1 bstract This paper addresses the influence of long waves on the design wave height of structures in shallow water. Wave heights, wave periods,
DualSPHysics in Coastal Engineering
 DualSPHysics in Coastal Engineering Dr Corrado Altomare Universiteit Gent - Flanders Hydraulics Research, Belgium Dr Alex Crespo University of Vigo, SPAIN 2 nd DualSPHysics Users Workshop, 6-7 December
Bob Battalio, PE Chief Engineer, ESA September 8, 2016
 RELATING FUTURE COASTAL CONDITIONS TO EXISTING FEMA FLOOD HAZARD MAPS Technical Methods Manual Bob Battalio, PE Chief Engineer, ESA September 8, 2016 FMA 2016 Sacramento, California DWR-OST-SIO PILOTING