COMPARISON OF CONTEMPORANEOUS WAVE MEASUREMENTS WITH A SAAB WAVERADAR REX AND A DATAWELL DIRECTIONAL WAVERIDER BUOY
|
|
|
- Thomasina Hill
- 5 years ago
- Views:
Transcription

1 COMPARISON OF CONTEMPORANEOUS WAVE MEASUREMENTS WITH A SAAB WAVERADAR REX AND A DATAWELL DIRECTIONAL WAVERIDER BUOY Scott Noreika, Mark Beardsley, Lulu Lodder, Sarah Brown and David Duncalf rpsmetocean.com
2 MOTIVATION Investigate why such a significant difference (~5%) exists between nearby offshore wave heights measured with a DWR and SAAB. Better understand the differences and limitations of the two different instruments. To attend this conference. This study compares DWR and SAAB measured data for: Total, sea and swell waves; For operational and limited tropical cyclone storm conditions; and For omni-directional, easterly and westerly conditions.
3 STUDY METHODOLOGY The methodology used for this study was as follows: A 2 year period (2008 to 2010) of continuous overlapping DWR and SAAB raw wave profile data, was chosen for operational analyses; Also, from the 4.8 year total period (2006 to 2011) of overlapping DWR and SAAB wave data, 12 tropical cyclone events were chosen for storm analysis; All individual logged raw wave profiles from the DWR and SAAB were visually inspected and QC d; Similar data sampling schemes for the DWR and SAAB were chosen to allow for better data comparison. Spectral analysis was conducted on the QC d DWR and SAAB wave profiles to produce total, sea and swell wave parameters for comparison; Correlation and ambient statistical analyses were conducted on the DWR and SAAB wave parameters; Results of the analyses were interpreted and conclusions were made.
4 SUMMARY OF CONCLUSIONS The following conclusions were reached as a result of this study: Compared to the DWR, the SAAB under estimates total and sea wave heights during both ambient and tropical cyclone storm conditions (from 4 to10%); SAAB under estimation increases as the wave heights increase; Worst at the peak of the 12 storms, with an average under estimation of ~16% (as much as 25% under the largest storm); Wave direction makes no significant difference to the comparison results, with correlation slopes typically within +/- 1%, for omni-directional, easterly and westerly waves; SAAB and DWR measured essentially the same for swell wave heights (slopes typically within 1%) under both ambient and storm conditions; and SAAB and DWR compared quite well for wave periods (slopes typically within +/- 4%).
5 STUDY BACKGROUND A previous study, compared the NRA DWR (125 m) waves against another DWR (83 m) located about 50 km to the WSW; For the period of interest there was a gap in the NRA DWR wave data, so the NRA SAAB wave data was used to fill the gap; SAAB data had not previously been used for any wave analysis, so a brief comparison was conducted (with 2.5 months of data); It showed that the SAAB total waves were ~5% less than those measured by the nearby (<3 km away) DWR; Result was somewhat surprising, as from previous work we had found that:» Total waves from the NRA DWR (125 m) only differed by 5 to 6% from a DWR (83 m) ~50 km away and a second DWR (71 m) ~90 km away.

6 Study Area ~135 km Offshore Dampier, WA on the Southern North West Shelf rpsmetocean.com

7 Wave measurement sites offshore, where total wave heights are within 5-6% rpsmetocean.com
8 LOCAL WAVE CLIMATE AND CYCLONES Total seastate is strongly dominated by the long period WSW swell from the Southern Indian Ocean; Ambient seas alternate, approaching mostly from the WSW and SW in the summer (Sep to Mar) and from the WSW, ENE and E in the winter (Apr to Aug); Main swell direction is from the WSW throughout the year (~75%); with peak periods of 14 seconds or more occurring about 1/3rd of the time; Tropical cyclones (2 to 3 per season) occur in the months of Dec to Apr; Cyclones approach mostly from the N E directions (~90%) and occasionally from the NW (~10%); Majority of tropical cyclone generated waves (~50%) will approach the NRA platform from a roughly NE direction.
9 DWR WAVE COMPASS ROSES rpsmetocean.com
10 DWR monthly time history plot for June 2008, showing typical winter wave conditions (i.e. easterly seas and a west-southwest background swell) rpsmetocean.com
11 DWR monthly time history plot for December 2008, showing typical summer wave conditions (i.e. seas and swell from the west- southwest and a brief period of easterly waves due to a weak cyclone) rpsmetocean.com

12 TC SPATIAL DISTRIBUTION rpsmetocean.com
13 Tropical cyclone approach directions to the North Rankin Platform offshore study area NE rpsmetocean.com
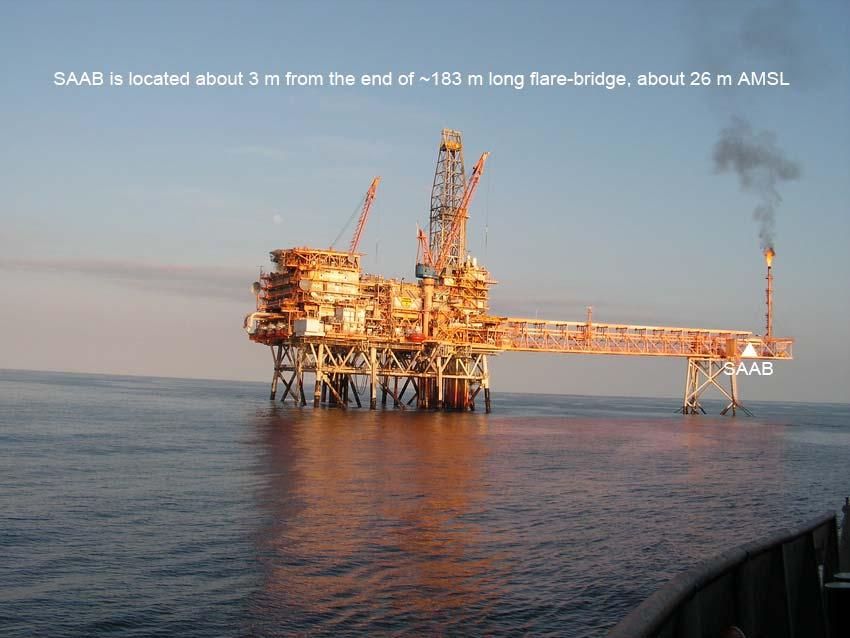
14 WAVE INSTRUMENTS DWR a 0.9 m diameter heave, pitch and roll buoy with an internal data logger and Argos top hatch; deployed in 125 m water depth, ~3 km SW of the NRA Platform (and SAAB); SAAB a downward-looking microwave radar, mounted underneath (at +26m AMSL) and several metres from the end of the North oriented ~183 m long flare-bridge on the NRA Platform; DWR and SAAB were supplied calibrated by manufacturers; DWR was also additionally calibrated prior to deployment in-house (i.e. rotated in a 2 m diameter wheel at periods of 5, 10, 15, 20 and 25 sec); DWR and SAAB had similar wave height resolution (0.01 m and m, respectively); SAAB had a beam width of 10 degrees (at +26 m AMSL), which gave a surface coverage of ~4.6 m (diameter) and 2.4 sec was the shortest wave period resolvable (i.e. very similar to the DWR);

15 Datawell Directional Waverider Buoy and WaveRadar Rex

16 NRA Platform Schematic Showing metocean measurements locations and the North oriented flare-bridge
17
18 DATA PROCESSING, QC & SAMPLING SCHEMES All individual logged raw wave profiles from DWR and SAAB were visually inspected and QC d using in-house software; DWR and SAAB QC d wave profiles were then processed, to get the most similar data sampling schemes, for subsequent comparison/analysis;» Original frequency bin widths for the DWR and SAAB were Hz and ~0.008 Hz and final processed values used in this study were Hz and ~0.004 Hz, respectively; and» Original record intervals for the DWR and SAAB were 30 minutes and 20 minutes, respectively, and a 60 minute record interval was used in this study.
19 DATA ANALYSES DWR and SAAB QC d wave profiles were spectrally analysed using a Fast Fourier transform technique. Resulted in the following parameters for total, sea and swell waves (Hs, T p, T m, T z and Theta p for DWR only); A sea/swell separation frequency of Hz (9 seconds) was selected from past review of numerous wave spectra; The 2 years of continuous wave data were also separated into easterly (1 to 179 ) and westerly (180 to 359 ) data sets for analysis; From the 4.8 years of overlapping wave data, 12 tropical cyclone events were selected for some analysis;» They had peak wave heights ranging from ~3.5 to 8.0 m; and» They consisted of 3 to 6 days of data spanning the storm peaks. Correlation and ambient statistical analysis was conducted on the DWR and SAAB wave parameters:» Linear regression, with vertical least squares;» DWR was placed on the x-axis, because it was considered the benchmark wave instrument for the offshore industry and it was able to be additionally calibrated inhouse; and» ambient statistics produced included: min, mean, max, std dev and exceedence percentiles.

20 Overlay plot of measured DWR (blue) and SAAB (red) total wave data for the 2 year period May 2008 to May 2010 rpsmetocean.com
21 Typical Wave Spectra Plot (with 0.111Hz or 9 sec Sea/Swell split) rpsmetocean.com
22 RESULTS For Ambient or Operational Waves (2008 to 2010) Produced numerous correlation cross-plots for SAAB versus DWR for total, sea and swell wave heights and periods (mean and peak) for omni-directional, easterly and westerly cases using all ambient data and data when wave heights > 2 m; Produced ambient statistics for SAAB and DWR for omni-directional total, sea and swell wave heights and periods (mean, zero-crossing and peak); Produced summary tables of the correlation and statistical analysis results:» Correlation results included: number of data points used, correlation coefficients, slopes for line of best fit and standard deviations; and» Statistical results included: minimums, maximums, means, standard deviations, 20, 5 and 1 exceedence percentiles.
23 RESULTS (cont d) For 12 Tropical Cyclone Storm Wave Events (2006 to 2011) Produced numerous correlation cross-plots for SAAB versus DWR for total, sea and swell wave heights and periods (mean and peak) for omni-directional cases using all storm data (3 to 6 days per storm event) and data when wave heights > 4 m; Produced summary tables of the correlation analysis results:» Correlation results included: number of data points used, correlation coefficients, slopes for line of best fit and standard deviations; Also found the maximum wave heights (total) measured at the peak of each storm by the SAAB and DWR and compared the results (averaged and individual for the 12 storms);
24 Tropical Cyclone Event expanded overlay plot rpsmetocean.com
25 Tropical Cyclone Event expanded overlay plot rpsmetocean.com
26 CONCLUDING REMARKS Compared to the DWR, the SAAB under estimates total and sea wave heights during both ambient and tropical cyclone storm conditions (from 4 to 10%); SAAB under estimation increases as the wave heights increase; Worst at the peak of the 12 storms (average under estimation of ~16%), and for the largest storm under estimation was ~25%; SAAB wave data is not considered suitable for extreme analysis purposes, but is usable for operational purposes; SAAB and DWR measured essentially the same for swell wave heights (slopes typically within 1%) under both ambient and storm conditions; SAAB and DWR compared quite well for wave periods (slopes typically within +/- 4%); and Wave direction makes no significant difference to the comparison results, with correlation slopes typically within +/- 1%, for omni-directional, easterly and westerly waves.
27 ACKNOWLEDGEMENTS For permission to publish the measured DWR and SAAB wave data used in this presentation/study, Woodside Energy Limited, and their joint venture participants in the North West Shelf Venture, are gratefully acknowledged.
COMPARISON OF CONTEMPORANEOUS WAVE MEASUREMENTS WITH A SAAB WAVERADAR REX AND A DATAWELL DIRECTIONAL WAVERIDER BUOY
 31 Bishop Street, Jolimont Western Australia 6014 T +61 8 9387 7955 F +61 8 9387 6686 E info@rpsmetocean.com W rpsmetocean.com & rpsgroup.com.au COMPARISON OF CONTEMPORANEOUS WAVE MEASUREMENTS WITH A SAAB
PUV Wave Directional Spectra How PUV Wave Analysis Works
 PUV Wave Directional Spectra How PUV Wave Analysis Works Introduction The PUV method works by comparing velocity and pressure time series. Figure 1 shows that pressure and velocity (in the direction of
COMPARISON OF DEEP-WATER ADCP AND NDBC BUOY MEASUREMENTS TO HINDCAST PARAMETERS. William R. Dally and Daniel A. Osiecki
 COMPARISON OF DEEP-WATER ADCP AND NDBC BUOY MEASUREMENTS TO HINDCAST PARAMETERS William R. Dally and Daniel A. Osiecki Surfbreak Engineering Sciences, Inc. 207 Surf Road Melbourne Beach, Florida, 32951
TRIAXYS Acoustic Doppler Current Profiler Comparison Study
 TRIAXYS Acoustic Doppler Current Profiler Comparison Study By Randolph Kashino, Axys Technologies Inc. Tony Ethier, Axys Technologies Inc. Reo Phillips, Axys Technologies Inc. February 2 Figure 1. Nortek
Inter-comparison of wave measurement by accelerometer and GPS wave buoy in shallow water off Cuddalore, east coast of India
 Indian Journal of Geo-Marine Sciences Vol. 43(1), January 2014, pp. 45-49 Inter-comparison of wave measurement by accelerometer and GPS wave buoy in shallow water off Cuddalore, east coast of India Sisir
Minimal influence of wind and tidal height on underwater noise in Haro Strait
 Minimal influence of wind and tidal height on underwater noise in Haro Strait Introduction Scott Veirs, Beam Reach Val Veirs, Colorado College December 2, 2007 Assessing the effect of wind and currents
IDENTIFICATION OF WIND SEA AND SWELL EVENTS AND SWELL EVENTS PARAMETERIZATION OFF WEST AFRICA. K. Agbéko KPOGO-NUWOKLO
 Workshop: Statistical models of the metocean environment for engineering uses IDENTIFICATION OF WIND SEA AND SWELL EVENTS AND SWELL EVENTS PARAMETERIZATION OFF WEST AFRICA K. Agbéko KPOGO-NUWOKLO IFREMER-
Sea State Analysis. Topics. Module 7 Sea State Analysis 2/22/2016. CE A676 Coastal Engineering Orson P. Smith, PE, Ph.D.
 Sea State Analysis Module 7 Orson P. Smith, PE, Ph.D. Professor Emeritus Module 7 Sea State Analysis Topics Wave height distribution Wave energy spectra Wind wave generation Directional spectra Hindcasting
Wave research at Department of Oceanography, University of Hawai i
 Wave research at Department of Oceanography, University of Hawai i Hawaii wave climate. Directional waverider buoys around Hawaii. Past and present wave-related research projects. Effect of tides on wave
of monsoon waves off U ran, west coast of India
 Indian Journal of Marine Sciences Vol. 18, June 1989,pp.1I3-1I7 Characteristics of monsoon waves off U ran, west coast of India B U Nayak, P Chandramohan & S Mandai National Institute of Oceanography,
Metocean criteria for fatigue assessment. Rafael V. Schiller 5th COPEDI Seminar, Oct 8th 2014.
 Metocean criteria for fatigue assessment Rafael V. Schiller 5th COPEDI Seminar, Oct 8th 2014. Metocean requirements along the lifecycle of a project Metocean criteria for fatigue Analysis techniques and
Wave Transformation, Prediction, and Analysis at Kaumalapau Harbor, Lanai, Hawaii
 Wave Transformation, Prediction, and Analysis at Kaumalapau Harbor, Lanai, Hawaii Jessica H. Podoski, P.E. Coastal Engineer, USACE Honolulu District Christopher Goody, P.E. Sea Engineering, Inc. Thomas
Draft Kivalina Wind Resource Report
 Draft Kivalina Wind Resource Report Kivalina aerial photo by Doug Vaught, July 2011 May 31, 2012 Douglas Vaught, P.E. dvaught@v3energy.com V3 Energy, LLC Eagle River, Alaska Draft Kivalina Wind Resource
SCIENTIFIC COMMITTEE SEVENTH REGULAR SESSION August 2011 Pohnpei, Federated States of Micronesia
 SCIENTIFIC COMMITTEE SEVENTH REGULAR SESSION 9-17 August 2011 Pohnpei, Federated States of Micronesia CPUE of skipjack for the Japanese offshore pole and line using GPS and catch data WCPFC-SC7-2011/SA-WP-09
MOTUS Wave Buoys. Powered By the Aanderaa MOTUS Directional Wave Sensor
 MOTUS Wave Buoys Powered By the Aanderaa MOTUS Directional Wave Sensor Two Buoys, One Brain The Aanderaa MOTUS directional wave sensor factory calibrated and currently available on two proven buoy platforms:
Nortek Technical Note No.: TN-021. Chesapeake Bay AWAC Evaluation
 Nortek Technical Note No.: TN-021 Title: Chesapeake Bay AWAC Evaluation Last Edited: October 5, 2004 Authors: Eric Siegel-NortekUSA, Chris Malzone-NortekUSA, Torstein Pedersen- Number of Pages: 12 Chesapeake
Compiled by Uwe Dornbusch. Edited by Cherith Moses
 REPORT ON WAVE AND TIDE MEASUREMENTS Compiled by Uwe Dornbusch. Edited by Cherith Moses 1 Aims...1 2 Summary...1 3 Introduction...1 4 Site selection...1 5 Wave recorder settings...2 6 Results...2 6.1 Water
On the Challenges of Analysis and Design of Turret-Moored FPSOs in Squalls
 On the Challenges of Analysis and Design of Turret-Moored FPSOs in Squalls Arun Duggal Amir Izadparast Yu Ding 19th SNAME Offshore Symposium 6 February 2014 Overview Squalls, History & Current Practice
Regional Analysis of Extremal Wave Height Variability Oregon Coast, USA. Heidi P. Moritz and Hans R. Moritz
 Regional Analysis of Extremal Wave Height Variability Oregon Coast, USA Heidi P. Moritz and Hans R. Moritz U. S. Army Corps of Engineers, Portland District Portland, Oregon, USA 1. INTRODUCTION This extremal
Long-Term Performance of an AWAC Wave Gage, Chesapeake Bay, VA
 Long-Term Performance of an AWAC Wave Gage, Chesapeake Bay, VA P. T. Puckette G. B. Gray Evans-Hamilton, Inc. 3319 Maybank Highway Johns Is, SC 29455 USA Abstract- Evans-Hamilton, Inc. deployed a Nortek
WIND DATA REPORT. Bourne Water District
 WIND DATA REPORT Bourne Water District July to September 2010 Prepared for Massachusetts Clean Energy Center 55 Summer Street, 9th Floor Boston, MA 02110 by Dylan Chase James F. Manwell Utama Abdulwahid
Sea State Report. Chapel Point wave buoy, RP037/L/2013 December Title here in 8pt Arial (change text colour to black) i
 i") Sea State Report Chapel Point wave buoy, 2012-2013 RP037/L/2013 December 2013 Title here in 8pt Arial (change text colour to black) i We are the Environment Agency. We protect and improve the environment
Sea State Report Chapel Point wave buoy, 2012-2013 RP037/L/2013 December 2013 Title here in 8pt Arial (change text colour to black) i We are the Environment Agency. We protect and improve the environment
2 Wave storm characterization
 Wave storm characterization Wave storm characterization.1 The region of study The Southern Catalan coast is located on the NW Mediterranean Sea (Figure -1).The area is characterized by a complex coastal
Quantifying Wave Measurement Differences in Historical and Present Wave Buoy Systems
 Quantifying Wave Measurement Differences in Historical and Present Wave Buoy Systems R. E. Jensen 1, V. Swail 2, R.H. Bouchard 3, and B. Bradshaw 2 1 Coastal and Hydraulics Laboratory 2 Environment and
Crew Transfer Vessel (CTV) Performance Benchmarking. Presented by Stephen Phillips of Seaspeed Marine Consulting Ltd
 Performance Benchmarking. Presented by Stephen Phillips of Seaspeed Marine Consulting Ltd") Crew Transfer Vessel (CTV) Performance Benchmarking Presented by Stephen Phillips of Seaspeed Marine Consulting Ltd BACKGROUND - CT OWA : The Carbon Trust Offshore Wind Accelerator (OWA) brings together
Crew Transfer Vessel (CTV) Performance Benchmarking Presented by Stephen Phillips of Seaspeed Marine Consulting Ltd BACKGROUND - CT OWA : The Carbon Trust Offshore Wind Accelerator (OWA) brings together
Field Evaluation of the Wave Module for NDBC s New Self-Contained Ocean Observing Payload (SCOOP) on Modified NDBC Hulls
 on Modified NDBC Hulls") Field Evaluation of the Wave Module for NDBC s New Self-Contained Ocean Observing Payload (SCOOP) on Modified NDBC Hulls Richard H. Bouchard 1, Rodney R. Riley 1, Lex A. LeBlanc 1, Michael Vasquez 1, Michael
Field Evaluation of the Wave Module for NDBC s New Self-Contained Ocean Observing Payload (SCOOP) on Modified NDBC Hulls Richard H. Bouchard 1, Rodney R. Riley 1, Lex A. LeBlanc 1, Michael Vasquez 1, Michael
Carbon Trust Offshore Wind Accelerator. OWA floating LiDAR campaign: Babcock trial at Gwynt Y Môr Copenhagen, 11 March 2015 Megan Smith
 Carbon Trust Offshore Wind Accelerator OWA floating LiDAR campaign: Babcock trial at Gwynt Y Môr Copenhagen, 11 March 2015 Megan Smith 1 Trial Overview Using RWE s Gwynt y Mor mast in the Irish Sea MeasNet-calibrated
Currents measurements in the coast of Montevideo, Uruguay
 Currents measurements in the coast of Montevideo, Uruguay M. Fossati, D. Bellón, E. Lorenzo & I. Piedra-Cueva Fluid Mechanics and Environmental Engineering Institute (IMFIA), School of Engineering, Research
Torrild - WindSIM Case study
 Torrild - WindSIM Case study Note: This study differs from the other case studies in format, while here another model; WindSIM is tested as alternative to the WAsP model. Therefore this case should be
CHAPTER 22. Abstract
 CHAPTER 22 DIRECTIONAL SEA STATE NEAR THE ISLAND OF SYLT by Daniel Schade 1) 2), Karl-Friedrich Daemrich Abstract In the scope of a joint research program dealing with erosion problems of the island of
Coastal Wave Energy Dissipation: Observations and Modeling
 Coastal Wave Energy Dissipation: Observations and Modeling Jeffrey L Hanson US Army Corps of Engineers Field Research Facility USACE Field Research Facility Kent K. Hathaway US Army Corps of Engineers
Wave data recording program. Tweed Heads/Brisbane wave climate annual summary May 2012 April 2013
 Wave data recording program Tweed Heads/Brisbane wave climate annual summary May 2012 April 2013 Department of Science, Information Technology, Innovation and the Arts Prepared by Coastal Impacts Unit
A Wind Profiling Platform for Offshore Wind Measurements and Assessment. Presenter: Mark Blaseckie AXYS Technologies Inc.
 A Wind Profiling Platform for Offshore Wind Measurements and Assessment Presenter: Mark Blaseckie AXYS Technologies Inc. Any Sensor, Any Telemetry, Any Environment Founded in 1974 Part of the AXYS Group
APPENDIX C: Wind and Wave Modelling
 APPENDIX C: Wind and Wave Modelling Wind data collected by Environment Canada was obtained and reviewed for 3 nearby recording stations; Hamilton Airport, Hamilton RBG (Botanical Gardens) and Burlington
Appendix D: SWAN Wave Modelling
 Appendix D: SWAN Wave Modelling D.1 Preamble The Eurobodalla Shire Council area is subject to extreme waves originating from offshore storms. When swell waves approach the coast, they are modified by the
Coastal Wave Studies FY13 Summary Report
 DISTRIBUTION STATEMENT A. Approved for public release; distribution is unlimited. Coastal Wave Studies FY13 Summary Report Jeffrey L. Hanson US Army Corps of Engineers, Field Research Facility 1261 Duck
Monitoring the length structure of commercial landings of albacore tuna during the fishing year
 SCTB15 Working Paper ALB-5 Monitoring the length structure of commercial landings of albacore tuna during the 2001 2002 fishing year Linda Griggs National Institute of Water and Atmospheric Research Ltd.
A Comparison of Two Methods for Determining Wave Heights from a Discus Buoy with a Strapped-Down Accelerometer
 A Comparison of Two Methods for Determining Wave Heights from a Discus Buoy with a Strapped-Down Accelerometer L. C. Bender III Geochemical & Environmental Research Group Texas A&M University College Station,
Wind Data Verification Report Arriga 50m
 Page 1 of 11 Site Name Site Details 9531 - Arriga 5m Arriga 5m Date/Time of report generation 27/11/212 4:22 PM Site Number 9531 Mast Height 5m Mast Location 32568 E 811256 N Coordinate System UTM 55K
WIND DATA REPORT. Swan s Island, ME
 WIND DATA REPORT Swan s Island, ME June 1, 2009 August 31, 2009 Prepared for US Department of Energy by Daniel T. Grip Utama Abdulwahid James F. Manwell Anthony F. Ellis September 17, 2009 Report template
LONG TERM SITE WIND DATA ANNUAL REPORT. Mass Turnpike Authority Blandford, MA
 LONG TERM SITE WIND DATA ANNUAL REPORT Mass Turnpike Authority Blandford, MA July 1, 2012 June 30, 2013 Prepared for Massachusetts Clean Energy Center 55 Summer Street, 9th Floor Boston, MA 02110 by Dylan
July Interim Report. National Institute of Wind Energy (NIWE) Wind Resource Assessment & Offshore Unit Chennai, India.
 Wind Resource Assessment & Offshore Unit Chennai, India.") Interim Report (First Offshore Lidar wind data analysis) July 2018 Prepared by National Institute of Wind Energy (NIWE) Wind Resource Assessment & Offshore Unit Chennai, India. W I N D R E S O U R C E
Interim Report (First Offshore Lidar wind data analysis) July 2018 Prepared by National Institute of Wind Energy (NIWE) Wind Resource Assessment & Offshore Unit Chennai, India. W I N D R E S O U R C E
An IOOS Operational Wave Observation Plan Supported by NOAA IOOS Program & USACE
 An IOOS Operational Wave Observation Plan Supported by NOAA IOOS Program & USACE R.E. Jensen, W.A. Birkemeier and W. Burnett JCOMM-Workshop on Wave Measurements from Buoys Wave Information to Application
SEA-LEVEL AND SEA-STATE MEASUREMENTS WITH RADAR LEVEL SENSORS. Dr. Ulrich Barjenbruch 1 and Jens Wilhelmi 2
 SEA-LEVEL AND SEA-STATE MEASUREMENTS WITH RADAR LEVEL SENSORS Dr. Ulrich Barjenbruch 1 and Jens Wilhelmi 2 The German Federal Institute of Hydrology (BfG) developed a cost-efficient method to monitor the
WIND DATA REPORT. Bishop and Clerks
 WIND DATA REPORT Bishop and Clerks March 1, 2004 May 31, 2004 Prepared for Massachusetts Technology Collaborative 75 North Drive Westborough, MA 01581 by James F. Manwell Anthony L. Rogers Anthony F. Ellis
WIND DATA REPORT. Paxton, MA
 WIND DATA REPORT Paxton, MA July 1, 2011 September 30, 2011 Prepared for Massachusetts Clean Energy Center 55 Summer Street, 9th Floor Boston, MA 02110 by Eric Morgan James F. Manwell Anthony F. Ellis
Nanortalik A preliminary analysis of the wind measurements rev 1
 Nanortalik A preliminary analysis of the wind measurements rev 1 Introduction Note pr 14.08.2009 Tove Risberg, Kjeller Vindteknikk AS A 50 m met mast has been measuring the wind speed at Nanortalik Heliport
South Bay Coastal Ocean Observing System California Clean Beaches Initiative
 South Bay Coastal Ocean Observing System California Clean Beaches Initiative Quarterly Report September 2003 to City of Imperial Beach Eric Terrill 1 1 Scripps Institution of Oceanography, University of
Mango Bay_Resort. Fiji nearshore wave hindcast ' ' 19 00'
 Mango Bay_Resort Fiji nearshore wave hindcast 1 00' 1 30' 1 00' 177 00' 177 30' 17 00' 17 30' Figure 1. Location maps of the site. The map on the left shows the region. The map on the right shows the island
THE WAVE CLIMATE IN THE BELGIAN COASTAL ZONE
 THE WAVE CLIMATE IN THE BELGIAN COASTAL ZONE Toon Verwaest, Flanders Hydraulics Research, toon.verwaest@mow.vlaanderen.be Sarah Doorme, IMDC, sarah.doorme@imdc.be Kristof Verelst, Flanders Hydraulics Research,
Kavala Bay. Fiji nearshore wave hindcast ' ' 19 00'
 Kavala Bay Fiji nearshore wave hindcast 1 00' 19 00' 1 30' 19 00' 1 00' 1 30' 1 00' 1 30' 1 30' Figure 1. Location maps of the site. The map on the left shows the region. The map on the right shows the
Wave energy converter effects on wave and sediment circulation
 Wave energy converter effects on wave and sediment circulation Grace Chang and Craig Jones Integral Consulting Inc. cjones@integral-corp.com; gchang@integral-corp.com Jesse Roberts, Kelley Ruehl, and Chris
Available online at ScienceDirect. Energy Procedia 53 (2014 )
") Available online at www.sciencedirect.com ScienceDirect Energy Procedia 53 (2014 ) 156 161 EERA DeepWind 2014, 11th Deep Sea Offshore Wind R&D Conference Results and conclusions of a floating-lidar offshore
Available online at www.sciencedirect.com ScienceDirect Energy Procedia 53 (2014 ) 156 161 EERA DeepWind 2014, 11th Deep Sea Offshore Wind R&D Conference Results and conclusions of a floating-lidar offshore
Robert Jones Bandage Report
 Robert Jones Bandage Report Zach Browning Daniel Elsbury Nick Frazey December 13, 011 Table of Contents Abstract:... 3 Introduction:... 3 Background:... 3 Motivation:... 3 Objective:... 4 Methodology:...
Air-Sea Interaction Spar Buoy Systems
 DISTRIBUTION STATEMENT A: Distribution approved for public release; distribution is unlimited Air-Sea Interaction Spar Buoy Systems Hans C. Graber CSTARS - University of Miami 11811 SW 168 th Street, Miami,
Modelling of Extreme Waves Related to Stability Research
 Modelling of Extreme Waves Related to Stability Research Janou Hennig 1 and Frans van Walree 1 1. Maritime Research Institute Netherlands,(MARIN), Wageningen, the Netherlands Abstract: The paper deals
Wind Resource Assessment for NOME (ANVIL MOUNTAIN), ALASKA Date last modified: 5/22/06 Compiled by: Cliff Dolchok
, ALASKA Date last modified: 5/22/06 Compiled by: Cliff Dolchok") 813 W. Northern Lights Blvd. Anchorage, AK 99503 Phone: 907-269-3000 Fax: 907-269-3044 www.akenergyauthority.org SITE SUMMARY Wind Resource Assessment for NOME (ANVIL MOUNTAIN), ALASKA Date last modified:
813 W. Northern Lights Blvd. Anchorage, AK 99503 Phone: 907-269-3000 Fax: 907-269-3044 www.akenergyauthority.org SITE SUMMARY Wind Resource Assessment for NOME (ANVIL MOUNTAIN), ALASKA Date last modified:
Wind Resource Assessment for FALSE PASS, ALASKA Site # 2399 Date last modified: 7/20/2005 Prepared by: Mia Devine
 813 W. Northern Lights Blvd. Anchorage, AK 99503 Phone: 907-269-3000 Fax: 907-269-3044 www.aidea.org/wind.htm Wind Resource Assessment for FALSE PASS, ALASKA Site # 2399 Date last modified: 7/20/2005 Prepared
WAVE IMPACTS DUE TO STEEP FRONTED WAVES
 WAVE IMPACTS DUE TO STEEP FRONTED WAVES Bas Buchner and Arjan Voogt Maritime Research Institute Netherlands (MARIN) b.buchner@marin.nl, a.j.voogt@marin.nl INTRODUCTION It is the question whether Rogue
Tutorial for the. Total Vertical Uncertainty Analysis Tool in NaviModel3
 Tutorial for the Total Vertical Uncertainty Analysis Tool in NaviModel3 May, 2011 1. Introduction The Total Vertical Uncertainty Analysis Tool in NaviModel3 has been designed to facilitate a determination
CHAPTER 6 DISCUSSION ON WAVE PREDICTION METHODS
 CHAPTER 6 DISCUSSION ON WAVE PREDICTION METHODS A critical evaluation of the three wave prediction methods examined in this thesis is presented in this Chapter. The significant wave parameters, Hand T,
NORCOWE met-ocean measurement campaigns
 NORCOWE met-ocean measurement campaigns Kumer V.-M., Reuder J., Furevik B.,, Båserud L., Svardal B., Sæter C., Flügge M., Bakhoday Paskyabi M., Eecen P. University of Bergen, Norway, CMR, Norway, Meteorological
WIND DATA REPORT. Mt. Tom
 WIND DATA REPORT Mt. Tom September 1, 2003 November 31, 2003 Prepared for Massachusetts Technology Collaborative 7 North Drive Westborough, MA 0181 by James F. Manwell Anthony F. Ellis Taylor Geer January
Sand Bank Passage. Fiji nearshore wave hindcast ' ' 19 00'
 Sand Bank Passage Fiji nearshore wave hindcast 1 00' 1 00' 1 30' 1 00' 177 00' 177 30' 17 00' 17 30' 17 30' Figure 1. Location maps of the site. The map on the left shows the region. The map on the right
Spatial Methods for Road Course Measurement
 Page 1 of 10 CurtinSearch Curtin Site Index Contact Details Links LASCAN Spatial Sciences WA Centre for Geodesy COURSE MEASUREMENT This page is a summary of results of some of the research we have recently
JCOMM Technical Workshop on Wave Measurements from Buoys
 JCOMM Technical Workshop on Wave Measurements from Buoys Val Swail Chair, JCOMM Expert Team on Wind Waves and Storm Surges Neville Smith Vincent Cardone Peter Janssen Gerbrand Komen Peter Taylor WIND WAVES
Characterizing Ireland s wave energy resource
 Snapshots of Doctoral Research at University College Cork 2011 Characterizing Ireland s wave energy resource Brendan Cahill Hydraulics & Maritime Research Centre, UCC Introduction In theory, the energy
Certification of AMS acc. EN 15267, Part 3 - Overview and First Experience -
 Certification of AMS acc. EN 15267, Part 3 - Overview and First Experience - Dr. Wolfgang Jockel, Martin Schneider, TÜV Rheinland Group, D-51105 Cologne / Germany 1. Introduction A new basis for the certification
7 YEARS METEOMAST AMRUMBANK WEST
 7 YEARS METEOMAST AMRUMBANK WEST Joerg Bendfeld(1), Jens Krieger(2) (1) University of Paderborn, Kompetenzzentrum für nachhaltige Energietechnik KET, Pohlweg 55, 33098 Paderborn, Germany, (2) airwerk GmbH,
The Seventh International Colloquium on Bluff Body Aerodynamics and Applications (BBAA7) Shanghai, China; September 2-6, 2012 Wind tunnel measurements
 Shanghai, China; September 2-6, 2012 Wind tunnel measurements") The Seventh International Colloquium on Bluff Body Aerodynamics and Applications (BBAA7) Shanghai, China; September 2-6, 2012 Wind tunnel measurements of aeroelastic guyed mast models a, Tomasz Lipecki
The Seventh International Colloquium on Bluff Body Aerodynamics and Applications (BBAA7) Shanghai, China; September 2-6, 2012 Wind tunnel measurements of aeroelastic guyed mast models a, Tomasz Lipecki
The OWEZ Meteorological Mast
 The OWEZ Meteorological Mast Analysis of mast-top displacements P.J. Eecen E. Branlard ECN-E--08-067 OWEZ_R_121_mast_top_movement Acknowledgement/Preface The Off Shore wind Farm Egmond aan Zee has a subsidy
Rimatara. French Polynesia
 Rimatara French Polynesia 8 22 00' 16 22 30' 20 23 00' 24 23 30' 28 152 8 4 0 136 153 30' 153 00' 152 30' 152 00' Figure 1. Location maps of the site. The map on the left shows the region. The map on the
On the assimilation of SAR wave spectra of S-1A in the wave model MFWAM
 On the assimilation of SAR wave spectra of S-1A in the wave model MFWAM Lotfi Aouf and Alice Dalphinet Météo-France, Département Marine et Océanographie,Toulouse 14 th wave forecasting and hindcasting,
Ocean Wave Forecasting
 Ocean Wave Forecasting Jean-Raymond Bidlot* Marine Prediction Section Predictability Division of the Research Department European Centre for Medium-range Weather Forecasts (E.C.M.W.F.) Reading, UK * With
Kodiak, Alaska Site 1 Wind Resource Report
 Kodiak, Alaska Site 1 Wind Resource Report Report written by: Douglas Vaught, P.E., V3 Energy LLC, Eagle River, AK Date of report: March 16, 2007 Photo by Doug Vaught, V3 Energy LLC Summary Information
Avaavaroa passage. Rarotonga nearshore wave hindcast 21 09' 21 12' 21 15' 21 18' ' ' ' '
 Avaavaroa passage Rarotonga nearshore wave hindcast 21 09' 21 ' Fuel Pipeline Avatiu Passage Black Rock Avarua Passage Pue Tupapa Papua Passage Avaavaroa Passage 21 15' Ngatangiia Passage onga Wave Hotspot
High-Resolution Measurement-Based Phase-Resolved Prediction of Ocean Wavefields
 DISTRIBUTION STATEMENT A. Approved for public release; distribution is unlimited. High-Resolution Measurement-Based Phase-Resolved Prediction of Ocean Wavefields Dick K.P. Yue Center for Ocean Engineering
WIND DATA REPORT. Quincy DPW, MA
 WIND DATA REPORT Quincy DPW, MA March 1 st 2007 to May 31 st 2007 Prepared for Massachusetts Technology Collaborative 75 North Drive Westborough, MA 01581 by James R. Browning James F. Manwell Anthony
3D Nacelle Mounted Lidar in Complex Terrain
 ENERGY 3D Nacelle Mounted Lidar in Complex Terrain PCWG Hamburg, Germany Paul Lawson 25.03.2015 1 DNV GL 125.03.2015 SAFER, SMARTER, GREENER Agenda Introduction and Project Background Lidar Specifications
Wave climate in the Baltic Sea 2014
 Wave climate in the Baltic Sea 2014 Authors: Heidi Pettersson, Marine Research, Finnish Meteorological Institute Helma Lindow, Swedish Meteorological and Hydrological Institute Thorger Brüning, Bundesamt
What is True Sea State?
 What is True Sea State? Anne Karin Magnusson Norwegian Meteorological Institute, division Western Norway Allégaten 70, Bergen, Norway Email: a.k.magnusson@met.no 1. INTRODUCTION Availability of wave measurements
Honiara. Solomon Islands
 Honiara Solomon Islands 8 30' 9 00' 8 9 9 30' 10 11 10 00' 12 19 10 11 12 13 14 1 1 1 19 00' 19 30' 10 00' 10 30' Figure 1. Location maps of the site. The map on the left shows the region. The map on the
The Capabilities of Doppler Current Profilers for Directional Wave Measurements in Coastal and Nearshore Waters
 The Capabilities of Doppler Current Profilers for Directional Wave Measurements in Coastal and Nearshore Waters Rick Birch, David B. Fissel, Keath Borg, Vincent Lee and David English ASL Environmental
Meteorological Measurements OWEZ
 Meteorological Measurements OWEZ Half year report - 01-07-2008-31-12-2008 H. Korterink P.J. Eecen J.W. Wagenaar ECN-E--09-018 OWEZ_R_121_20080701-20081231_WIND_RESOURCE_2008_2 Abstract NoordzeeWind carries
Field measurements of coastal waves and currents in Portugal and Greece
 Ž. Coastal Engineering 40 2000 285 296 www.elsevier.comrlocatercoastaleng Field measurements of coastal waves and currents in Portugal and Greece Michel Paillard a, Marc Prevosto a,), Stephen F. Barstow
(Refer Slide Time: 0:36)
") Port and Harbour Structures. Professor R. Sundaradivelu. Department of Ocean Engineering. Indian Institute of Technology, Madras. Module-2. Lecture-8B. Wave Rose Diagram. (Refer Slide Time: 0:36) We will
Port and Harbour Structures. Professor R. Sundaradivelu. Department of Ocean Engineering. Indian Institute of Technology, Madras. Module-2. Lecture-8B. Wave Rose Diagram. (Refer Slide Time: 0:36) We will
Available online at ScienceDirect. Procedia Engineering 116 (2015 )
") Available online at www.sciencedirect.com ScienceDirect Procedia Engineering 116 (2015 ) 398 405 8th International Conference on Asian and Pacific Coasts (APAC 2015) Department of Ocean Engineering, IIT
Available online at www.sciencedirect.com ScienceDirect Procedia Engineering 116 (2015 ) 398 405 8th International Conference on Asian and Pacific Coasts (APAC 2015) Department of Ocean Engineering, IIT
BUYER S GUIDE AQUAlogger 520
 OCEAN & ENVIRONMENTAL BUYER S GUIDE AQUAlogger 520 Mini Temperature and Pressure Logger AQUAlogger 520 Aquatec s primary temperature and depth model, the AQUAlogger 520, combines years of product development
Technical Brief - Wave Uprush Analysis 129 South Street, Gananoque
 Technical Brief - Wave Uprush Analysis 129 South Street, Gananoque RIGGS ENGINEERING LTD. 1240 Commissioners Road West Suite 205 London, Ontario N6K 1C7 June 12, 2013 Table of Contents Section Page Table
Meteorological Measurements OWEZ
 Meteorological Measurements OWEZ Half year report 01-01-2008-30-06-2008 H. Korterink P.J. Eecen ECN-E--08-062 OWEZ_R_121_20080101-20080630_wind_resource_2008_1 Abstract NoordzeeWind carries out an extensive
Little Spokane River Stream Gage Report: Deadman Creek, Dragoon Creek, and the West Branch of the Little Spokane River
 Little Spokane River Stream Gage Report: Deadman Creek, Dragoon Creek, and the West Branch of the Little Spokane River June 2010 Spokane County Conservation District N. 210 Havana St. Spokane, WA 99202
An Atlas of Oceanic Internal Solitary Waves (February 2004) by Global Ocean Associates Prepared for Office of Naval Research Code 322 PO
 by Global Ocean Associates Prepared for Office of Naval Research Code 322 PO") Overview The is located in the North Atlantic Ocean between southern Ireland and southwest England (Figure 1). The Sea s western edge covers a continental shelf region characterized by rough and irregular
Overview The is located in the North Atlantic Ocean between southern Ireland and southwest England (Figure 1). The Sea s western edge covers a continental shelf region characterized by rough and irregular
Nuku alofa. Tonga. A copy of this report is available at ' 21 00' 21 30' 22 00' ' ' ' '
 Nuku alofa Tonga 16 20 30' 18 21 00' 20 21 30' 176 174 172 22 00' 176 00' 175 30' 175 00' 174 30' Figure 1. Location maps of the site. The map on the left shows the region. The map on the right shows the
WIND DATA REPORT. Paxton, MA
 WIND DATA REPORT Paxton, MA September 1 2003 November 30 2003 by James F. Manwell Anthony F. Ellis Kai Wu April 15, 2004 Renewable Energy Research Laboratory 160 Governors Drive, www.ceere.org/rerl (413)
Marine Renewables Industry Association. Marine Renewables Industry: Requirements for Oceanographic Measurements, Data Processing and Modelling
 Marine Renewables Industry Association Marine Renewables Industry: Requirements for Oceanographic Measurements, Data Processing and Modelling October 2009 Table of Contents 1. Introduction... 1 2. Measurements
Wave Energy Atlas in Vietnam
 Wave Energy Atlas in Vietnam Nguyen Manh Hung, Duong Cong Dien 1 1 Institute of Mechanics, 264 Doi Can Str. Hanoi, Vietnam nmhungim@gmail.com; duongdienim@gmail.com Abstract Vietnam has achieved remarkable
139 South Meals, Suite 202 Drive, P.O. Box 3089 Valdez, Alaska / Fax 907/
 139 South Meals, Suite 202 Drive, P.O. Box 3089 Valdez, Alaska 99686 907/835-5957 Fax 907/835-5926 Date: March 9, 2010 Subject: Analysis of SAFETUG Wave Spectra with Respect to PWS Wave Conditions Project
WIND DATA REPORT. Mass Turnpike Authority Blandford, MA
 WIND DATA REPORT Mass Turnpike Authority Blandford, MA October 2011 December 2011 Prepared for Massachusetts Clean Energy Center 55 Summer Street, 9th Floor Boston, MA 02110 by Preeti Verma James F. Manwell
Specifications for Synchronized Sensor Pipe Condition Assessment (AS PROVIDED BY REDZONE ROBOTICS)
") Specifications for Synchronized Sensor Pipe Condition Assessment (AS PROVIDED BY REDZONE ROBOTICS) A. Scope of Work The work covered by these specifications consists of furnishing all materials, labor,
Specifications for Synchronized Sensor Pipe Condition Assessment (AS PROVIDED BY REDZONE ROBOTICS) A. Scope of Work The work covered by these specifications consists of furnishing all materials, labor,
STRIDE PROJECT Steel Risers in Deepwater Environments Achievements
 STRIDE PROJECT Steel Risers in Deepwater Environments Achievements 1999-21 Neil Willis Principal Engineer 2H Offshore Engineering 6 th Annual Deepwater Technologies and Developments Conference 21 The presentation