Capacity analysis of pedestrian facilities involving individuals with disabilities FINAL REPORT
|
|
|
- Asher Cunningham
- 6 years ago
- Views:
Transcription


1 TRCLC August 31, 2015 Capacity analysis of pedestrian facilities involving individuals with disabilities FINAL REPORT Mohammad Sadra Sharifi, Keith Christensen, Anthony Chen. Utah State University Logan, UT Western Michigan University University of Texas at Arlington Utah State University Wayne State University Tennessee State University
2 1. Report No. TRCLC Technical Report Documentation Page 2. Government Accession No. N/A 4. Title and Subtitle Capacity analysis of pedestrian facilities involving individuals with disabilities 7. Author(s) Mohammad Sadra Sharifi, Keith Christensen, Anthony Chen. 9. Performing Organization Name and Address Utah State University 4110 Old Main Hill Logan, UT Sponsoring Agency Name and Address Transportation Research Center for Livable Communities (TRCLC) 1903 W. Michigan Ave., Kalamazoo, MI Supplementary Notes 3. Recipient s Catalog No. N/A 5. Report Date August 31, Performing Organization Code N/A 8. Performing Org. Report No. N/A 10. Work Unit No. (TRAIS) N/A 11. Contract No. TRCLC Type of Report & Period Covered Final Report 6/3/2013-8/1/ Sponsoring Agency Code N/A 16. Abstract Walking facilities are important infrastructures that must be designed to accommodate the behavior of pedestrians in order to be effective. Heterogeneity in pedestrian composition is one important factor generally overlooked in walking facility design guidelines. Particularly, individuals with disabilities are often ignored due to lack of available data on their pedestrian behaviors. A controlled, large-scaled walking experiment involving individuals with disabilities was conducted at Utah State University to observe individual pedestrian behaviors in various walking facilities; these facilities include passageway and bottleneck formations. The purpose of this report is twofold: (1) to model time headway between different individual types using a mixed distribution model, and (2) to estimate passageway and bottleneck capacities and to identify the impacts of involving individuals with disabilities on capacity estimations. Results showed that the proposed model had good performance for pedestrian time headway modeling. Analysis also revealed that visual impaired individuals and individuals using motorized wheelchairs had the minimum and maximum capacity reduction effect on passageways and bottlenecks. The findings are expected to improve the facility capacity estimations required and to meet a preferred level-of-service for heterogeneous populations. 17. Key Words Pedestrian walking behavior, individuals with disabilities, pedestrian facilities, capacity analysis 19. Security Classification - report Unclassified Unclassified 20. Security Classification - page 18. Distribution Statement No restrictions. 21. No. of Pages Price N/A
3 Disclaimer The contents of this report reflect the views of the authors, who are solely responsible for the facts and the accuracy of the information presented herein. This publication is disseminated under the sponsorship of the U.S. Department of Transportation s University Transportation Centers Program, in the interest of information exchange. This report does not necessarily reflect the official views or policies of the U.S. government, or the Transportation Research Center for Livable Communities, who assume no liability for the contents or use thereof. This report does not represent standards, specifications, or regulations. Acknowledgments This research was funded by the US Department of Transportation through the Transportation Research Center for Livable Communities (TRCLC), a Tier 1 University Transportation Center. ii
4 Table of Contents Executive Summary Introduction Literature Review Confirmatory review on existing regulations and guidelines Highway Capacity Manual (HCM) International Building Code (IBC) Americans with Disabilities Act Accessibility Guidelines (ADAAG) Literature review on pedestrian facilities capacity analysis Criticism on existing capacity analysis approaches Data Collection Methodology Instantaneous time headway definition Time headway modeling Data Processing Results and Discussions Descriptive data analysis Time Headway modeling Capacity analysis Summary and Conclusion References APPENDIX: GUI Code
5 List of Tables Table 1. Summary of capacity analysis specifications in manuals and pedestrian studies Table 2. Followers' speed and spacing descriptive statistics Table 3. Summary of Gamma-GQM estimation results Table 4. Mean empty zone and capacity estimation results List of Figures Figure 1. Relationships between pedestrian flow and space for different populations. (TRB, 2010)... 7 Figure 2. Required sizing for a corridor considering wheelchair dimensions. (ADAAG, 2002).. 9 Figure 3. Layout of the circuit with passageway and bottleneck facilities Figure 4. Tracking hardware: (a) Power-over-Ethernet (POE) camera, (b) encoded tracking pattern, and (c) camera gimbal Figure 5. Personal space definition Figure 6. GUI structure Figure 7. Snapshot of GUI Figure 8. Observed follower speed and spacing distributions in passageway and bottleneck respect to different leader types. (a) individuals without disabilities, (b) visual impairment, (c) motorized wheelchair, (d) non-motorized wheelchair/walker, and (e) individuals with mobility canes Figure 9. Results of headway estimations considering individuals without disabilities leader type for (a) passageway, and (b) bottleneck Figure 10. Lane formation pattern in (a) passageway, and (b) bottleneck
6 Executive Summary Walking facilities are important infrastructures that must be designed to accommodate the behavior of pedestrians in order to be effective. Heterogeneity in pedestrian composition is one important factor generally overlooked in walking facility design guidelines. Particularly, individuals with disabilities are often ignored due to lack of available data on their pedestrian behaviors. A controlled, large-scaled walking experiment involving individuals with disabilities was conducted at Utah State University to observe individual pedestrian behaviors in various walking facilities; these facilities include passageway and bottleneck formations. The purpose of this report is twofold: (1) to model time headway between different individual types using a mixed distribution model, and (2) to estimate passageway and bottleneck capacities and to identify the impacts of involving individuals with disabilities on capacity estimations. Results showed that the proposed model had good performance for pedestrian time headway modeling. Analysis also revealed that visual impaired individuals and individuals using motorized wheelchairs had the minimum and maximum capacity reduction effect on passageways and bottlenecks. The findings are expected to improve the facility capacity estimations required and to meet a preferred level-of-service for heterogeneous populations. 3
7 1. Introduction The design of pedestrian infrastructure is an important process usually achieved by means of supply/demand analysis. Facility designers are needed to project pedestrian demands and to estimate the capacity required to meet a preferred level-of-service (LOS). Critical to this process is correctly estimating infrastructure supply levels or capacities. Presently, facility designers use guidelines found in the Highway Capacity Manual (HCM) (TRB, 2010) and the International Building Code (IBC) (ICC, 2012) based on pedestrian flow characteristics obtained through empirical research. However, the walking design guidelines have assumed typical homogenous population characteristics. Heterogeneity in pedestrian composition is an important factor because different types of pedestrians act in different ways. While individuals with disabilities constitute a significant portion of the population in the United States, accounting for 12.6% (or about 30.2 million) of the working age population and 16.7% (or about 51.5 million) of the total population (U.S. Census Bureau, 2010), pedestrian facilities do not account for diversity in physical abilities. Current walking design guidelines limit the disabled, non-conforming subset of the population to facility capacities for homogeneous populations. To account for the needs of individuals with disabilities, the Americans with Disabilities Act (ADA, 1990) and Americans with Disabilities Act Accessibility Guidelines (ADAAG, 2002) provide rules and guidelines for the design of pedestrian facilities. These codes are based only on physical properties and do not consider the heterogeneity in pedestrian flow characteristics. On the other hand, existing researches studied limited number of geometric walking designs and there is a significant lack of investigation focused on analyzing the capacities of different walking facilities encountering homogenous and heterogeneous population scenarios. Therefore, it is worthwhile to address and analyze the relationships of basic traffic flow variables for different walking environments. To overcome the limitations, a controlled large-scaled walking experiment involving individuals with disabilities was conducted at Utah State University (USU) to explore the impacts of walking behaviors on capacity of various walking facilities. This report presents a mixed time headway distribution model to study the interaction behaviors of different individual types in uni-directional pedestrian flow. Moreover, behavior effects on capacity of passageway 4
8 and bottleneck were investigated. The remainder of this report is organized as follows. The next section briefly describes the experimental design process and the data collection method. Afterwards, methodology including pedestrian time headway definition and mixed time headway distribution is discussed. The research outcomes including trajectory, time headway modeling, and capacity analysis are presented in subsequent sections. Finally, concluding remarks are presented. The findings are expected to improve estimation of facility capacity, which is a required process to meet a preferred level-of-service for heterogeneous populations. Furthermore, the results of the research may be used to develop well-characterized individualbased theories. 2. Literature Review 2.1. Confirmatory review on existing regulations and guidelines Planners generally use existing regulations and guidelines for designing and assessing public pedestrian facilities. The Highway Capacity Manual (HCM) (TRB, 2010), the International Building Code (IBC) (ICC, 2012), and the Americans with Disabilities Act Accessibility Guidelines (ADAAG, 2002) are three reference manuals generally used in the United States to design and evaluate capacities of different outdoor walking facilities (i.e. sidewalks with different geometrics) and indoor walking facilities (i.e. sizing building components). This section provides a review on these design guidelines to identify the properties of different references Highway Capacity Manual (HCM) The Highway Capacity Manual (HCM), published by Transportation Research Board (TRB), is extensively used for designing and assessing transportation facilities in the United States. While HCM has been viewed as a reference document in engineering analysis process, it doesn t constitute a legal standard for transportation facility design. Originally published in 1950, this guideline was the first manual to define and quantify the concept of capacity for different transportation facilities. (TRB, 2010). This measure assists planners, designers, and operators in evaluating the adequacy of transportation facility supplies to meet the predicted demand. In early versions, only methodologies to evaluate capacity of roadway elements (i.e. 5
9 freeway, highway, streets, etc.) were provided. However, the fourth edition was exted to enable the evaluation of different pedestrian facilities including walkways, pedestrian queuing areas (i.e. elevators, transit platforms), shared off-street paths, pedestrian crosswalks, and pedestrian facilities along urban streets. The following macroscopic traffic flow definitions were used in the HCM for pedestrian capacity analysis (TRB, 2010): Pedestrian flow rate: Pedestrian flow rate is the number of pedestrians passing a line across the width of a walkway perpicular to the pedestrian path per unit of time. Pedestrian flow rate can be determined for unit of effective width expressed as pedestrian per minute per meter (P/min/m). Pedestrian density: Pedestrian density is defined as the average number of pedestrians per unit of area within a walkway expressed as pedestrians per square meter (P/m 2 ). Pedestrian space: Pedestrian space is the inverse of density and it determines the average area provided for each pedestrian in a walkway. Space unit is expressed as square meters per pedestrians (m 2 /P). The proposed capacity analysis methods in HCM guidelines are mainly based on the relationships among macroscopic traffic flow variables (i.e. flow, density, space). These relationships can be presented using fundamental traffic flow diagrams. HCM adopts several basic research efforts on these diagrams for capacity analysis purposes. Fundamental diagrams presented in the guideline are generally obtained from basic empirical studies by Fruin (1987), Older (1968), Oeding (1963), Navin and Wheeler (1969), and Pushkarev and Zupan (1975). Figure 1 shows relationships between pedestrian flow and space for different populations, extracted from different empirical studies. 6
10 Figure 1. Relationships between pedestrian flow and space for different populations. (TRB, 2010) Generally, pedestrian flow increases with increasing pedestrian space up to a certain range of space. Then, flow rates decline because of existing too much space between pedestrians. HCM determines the capacity of walking facilities specifying maximum observed pedestrian flow. Figure 1 indicates that the maximum pedestrian flow (i.e. capacity) varies between 65 p/min/m to 110 p/min/m and it lies within a certain range of space from 0.4 m 2 /p to 0.9 m 2 /p. Although the HCM guideline provides a systematic way for capacity analysis, there is a limitation in the proposed method. HCM analyzes the capacity of walkways using macroscopic properties of pedestrian flow. It does not consider microscopic behavior of pedestrians. Therefore, it is not possible to study on the impact of heterogeneity in pedestrian compositions and behaviors on the capacity of walking facilities. Also, the fundamental diagrams provided in the guidelines are limited for straight walkways and different walking geometrics were not studied International Building Code (IBC) The International Building Code (IBC), which is published by the International Code Council (ICC), is a standard reference addressing design and building systems requirements. This manual establishes the minimum requirements to guarantee the performance of buildings during emergency situations. The sizing requirements are mainly based on past experiences in consequence of some hazardous situations. The manual contains 35 chapters defining regulations for different building components. Chapter 10, Means of egress, mainly focuses on designing 7
11 indoor walking facilities in buildings including corridors, ramps, and stairways. This chapter defines minimum sizing for different building elements in order to provide an effective means of egress (i.e. unobstructed egress path from occupied portion of a building to a public way). The code classifies the buildings into different types, including residential buildings, business buildings, and high rise buildings, and establishes the minimum sizing with respect to building categories. For example, it requires that corridor widths should be at least 36 inches for buildings with occupant loads lower than 50. This code also determines the capacity (i.e. maximum occupant loads) for different built environments with respect to building category. For instance, it considers requirements of 100 gross floor area (GFA) for each occupant in business area. Thus, a 120,000 sq. ft. building used for business occupancy can accommodate a maximum 1200 people. It can be found that pedestrian flow characteristics and occupant specifications were not investigated and requirements were established only based on safety considerations. Therefore, this code may either overestimate or underestimate the capacity of built environments Americans with Disabilities Act Accessibility Guidelines (ADAAG) While vulnerable groups of people (including individuals with disabilities) are a significant portion of the population of United States, most walking facility and building design guidelines overlook them in their design considerations. To account for the needs of individuals with disabilities in society, U.S. Congress established a federal act called Americans with Disabilities Act (ADA) in 1990 (ADA, 1990). This law prohibits discrimination based on disability in the United States. Americans with Disabilities Act Accessibility Guidelines (ADAAG) is a manual containing requirements for building and walking facility designs to accommodate the needs of individuals with disabilities. This guideline includes 15 chapters containing regulations for different public environments. Chapter 4, Accessible elements and spaces: scope and technical requirements, mainly describes sizing requirements for different building components such as corridors, ramps, stairs, etc. Figure 2 presents the required sizing for a corridor to consider people with wheelchair specifications. 8
12 Figure 2. Required sizing for a corridor considering wheelchair dimensions. (ADAAG, 2002) Although ADAAG considers vulnerable pedestrian groups in indoor walking facility design, the regulations are not able to account for interactions between people with and without disabilities. On the other hand, this guideline does not provide any systematic way to determine the capacity of different walking environments considering individuals with disabilities. Therefore, whether this regulatory standard can accommodate all walking needs of individuals with disabilities is questionable Literature review on pedestrian facilities capacity analysis In order to provide effective walking infrastructure, designers should have insight into the capacity of walking facilities to meet the preferred level of service for planned walking demands. In the pedestrian literature, many researchers have extensively explored macroscopic pedestrian traffic flow characteristics to study walkway capacities and operational performance of walking facilities. These studies began in 1963 with an attempt to study on pedestrian flow characteristics in Germany. Oeding (1963) collected pedestrian volumes, densities and speeds in a shopping street and examined relationships between them. Five years later, he collected and analyzed macroscopic characteristics of pedestrian flow in a shopping street in London, United Kingdom (Older 1968). He then developed a fundamental diagram to specify the performance of walkways. Navin and Wheeler (1969) recorded pedestrian flow variables on walkways at three 9
13 locations on the University of Missouri campus in Columbia. They provided fundamental relationships between pedestrian speed, density, and flow. Polous et al. (1983) collected pedestrian data in the central business district of Haifa, Israel, using a videotape recorder and a digital clock. They analyzed properties of pedestrian flow on sidewalks and calibrated pedestrian traffic flow models. Tanariboon et al. (1991) conducted research on several sidewalks in Singapore and recorded pedestrian movements using a video recorder. They extracted macroscopic pedestrian flow variables using photographic techniques and proposed mathematical models for fundamental flow relationships (i.e. speed-density, speed-flow, and flow, density). Calibrated models revealed that the optimal pedestrian space and maximum observed flow (i.e. capacity) were about 0.7 m 2 /p and 90 p/min/min, respectively. Other primary efforts on pedestrian flow modeling can be found in studies by Pushkarev and Zupan (1975), Khisty (1985), Tanaboriboon and Guyano (1991), Daly et al. (1991), Ando et al. (1988), and Virkler and Elayadath (1994). Later, more advanced technologies were used to collect pedestrian stream characteristics. Lam and Cheung (2000) empirically investigated the effects of bi-directional pedestrian flows on freeflow walking speed, at-capacity walking speed, and effective capacity for a selected indoor walkway in Hong Kong. Helbing et al. (2007) analyzed a crowd disaster in Makkah, Saudi Arabia during the Hajj pilgrimage using video recording data. They explored relationships between macroscopic fundamental variables and analyzed various self-organization phenomena during the disaster. Ye et al. (2008) collected data for longitudinal pedestrian flows (i.e. unidirectional and multidirectional flows) in a metro station in Shanghai, China using video recordings. They calibrated pedestrian fundamental traffic flow diagrams for different indoor walking facilities including level passageway and stairs (ascing, descing and two-way). Based on calibration results, they concluded that the capacity of ascing stairways are slightly higher than descing stairways and two-way stairs have considerable lower capacities than one-way stairs. Most of the mentioned studies have been conducted in in urban areas. Pedestrian traffic density on sidewalks does not regularly reach to high extreme levels. Therefore, there is a significant lack of observations in density ranges in which the walking facility is operating at its capacity level. In response, controllable walking experiments have been conducted by many researches to collect pedestrian data for extreme conditions such as highly congested situations. 10
14 Daamen and Hoogoorn (2003) conducted walking experiments at Delft University of Technology in Netherlands to derive walking behavior in passageways and bottlenecks under different pedestrian flow scenarios such as un-directional, bi-directional, and cross pedestrian flows. A sample representative for the Dutch population with 80 participants was invited and ten experiments were performed to observe pedestrian walking behavior in standard, station, and shopping conditions. They observed and analyzed pedestrian stream characteristics for a wide range of density levels, from free-flow conditions to extremely congested situations. A fundamental diagram was developed to analyze operation performance of the walking facilities. Specifically, they found that the capacity of the bottleneck facility was approximately 90 p/min/m for uni-directional pedestrian flow. Another set of controlled walking experiments was administered in Germany to analyze and evaluate performance of various walking facilities such as circular passageway (Seyfried et al., 2005), a corridor (Kretz et al., 2006 (a)), a bottleneck (Kretz et al., 2006 (b)), a T-junction (Zhang et al., 2011), and a set of stairs (Burghardt et al., 2013). Seyfried et al. (2009) examined the capacity of bottlenecks with different widths under uni-directional pedestrian stream. 18 runs of experiments were conducted using 20, 40 and 60 pedestrians. Data analysis revealed that the bottleneck capacity grew linearly with increasing width. Wong et al. (2010) developed and calibrated a bidirectional pedestrian model with an oblique intersecting angle through controlled walking experiments. They used the calibrated model to explore pedestrian flow characteristics in oblique angle environment Criticism on existing capacity analysis approaches As summarized above, a great deal of study has been conducted on pedestrian stream characteristics and capacity of different walking environments. However, there are two limitations embedded in the existing regulations and pedestrian studies: (1) these studies did not address the pedestrian flow characteristics involving people with mobility and visual constraints, and (2) the proposed capacity estimation methods were not able to account for pedestrian microscopic behaviors. While individuals with disabilities constitute a significant proportion of the population of United States, little is understood concerning the effect of involving such individuals (the 11
15 heterogeneous crowd) on the capacity and flow conductibility of different build environments. Most of existing walking facility guidelines and regulations such as the HCM and the IBC code overlook individuals with disabilities as part of pedestrian stream and they do not account for the impact of individuals with disabilities on walkway capacity evaluations. Only the ADAAG manual proposes building facility design considering individuals with disability needs. However, this code establishes the sizing of the walking facilities based only on dimensions and space needs of individuals with disabilities; it does not account for interactions between individuals and built environments. In addition, the guideline does not provide a systematic way to evaluate the capacity of walking environments in presence of individuals with disabilities. There is a limited number of studies considering people with low mobility, including individuals with disabilities in capacity analysis process. Daamen and Hoogoorn (2011) conducted a research experiment in the Netherlands to investigate the capacity of doorways with consideration of elderly and disabled people. They analyzed the relation between doorway capacities, population compositions, and stress level during emergency situations. Generally, proposed capacity estimation approaches use macroscopic fundamental diagrams to estimate the capacities. These diagrams are developed based on macroscopic flow characteristics. Therefore, these approaches are incapable of capturing the impacts of any one individual s behavior on the capacity of walking facilities. Only one study by Hoogoorn (2004) investigated pedestrian behavior implications for bottleneck capacities. However, the study did not include individuals with disabilities. The presence of special components in the pedestrian flow stream, such as individuals with mobility and visual constraints, may have a substantial impact on walkway capacities. In this case, walking design requirements need to be modified accordingly to consider walking needs of all types of pedestrians. Table 1 summarizes some existing walking facility guidelines and pedestrian studies and their approaches in walking capacity analysis. 12
16 Table 1. Summary of capacity analysis specifications in manuals and pedestrian studies. Reference Macroscopic Approach Microscopic Considering Individuals with disabilities Facility types HCM No Crosswalk IBC No Building components ADAAG Yes Building components, crosswalk Oeding (1963) No Crosswalk Older (1968) No Crosswalk Navin and Wheeler (1969) No Crosswalk Polous et al. (1983) No Crosswalk Tanariboon et al. (1991) No Crosswalk Lam and Cheung (2000) No Indoor walkways Helbing et al. (2007) No Circular passageway Ye et al. (2008) No Daamen and Hoogoorn (2003) Level passageway, stairs No Passageway, bottleneck kretz et al. (2006) No Corridor Zhang et al. (2011) T-junction Burghardt et al. (2013) Stair Seyfried et al. (2009) No Bottleneck Wong et al. (2010) Oblique angle Daamen and Hoogoorn (2011) Yes Doorway Hoogoorn (2004) No Bottleneck 13

17 3. Data Collection The research goal was to study the pedestrian stream, including people with disabilities, in a variety of walking facilities at varying congestion levels. To accomplish this goal, a largescale walking experiment was conducted at Utah State University. To conduct the experiments, a temporary circuit was constructed using six-foot, self-standing wall panels. This circuit constitutes the desired walking facilities (level passageway and bottleneck). Figure 3 shows the circuit layout. Entrance/Exit m 6 m Passageway Bottleneck Figure 3. Layout of the circuit with passageway and bottleneck facilities. Five classifications of individuals participated in the experiment: individuals without disabilities, individuals with visual impairments, individuals who use mobility canes, individuals who use non-motorized devices for walking (e.g., wheelchair/roller walker), and individuals using motorized wheelchairs. In total, 202 participants (180 without disabilities and 42 with disabilities) were recruited for the experiments. The circuit experiments were conducted over three days (November 2 nd, 9 th, and 15 th, 2012). Experiments were categorized into two groups: uni-directional and bi-directional. In the first case all participants walked in the same direction but, in the latter case, the experiments were done with different flow composition scenarios (90% major stream, 10% minor stream, 80 14


18 major 20% minor, 70% major 30% minor, 60% major 40% minor, and 50% major 50% minor). Each scenario was split into 10-minute data collection with four hours of data collection each day. Note that only data collected from the uni-directional stream, the 90% major stream, and the 10% minor stream was used in this study. The minor stream was assumed to not have substantial impacts. Automated video identification and tracking technology were used for data collection. The technology can locate participant positions with an average accuracy of 0.3 meters or a footstep, which enables tracking and collection of each individual participant's walking trajectory. Derived for augmented reality, ARToolKitPlus (ARTKP) is a software library that allows the tracking of up to 512 identifiable markers in a camera field at once (Wagner and Schmalstieg, 2007). A system was designed using this technology to track and separably identify participants. To utilize this system, markers were attached to participants using mortar boards, or graduation caps, which were then read by cameras susped above the experimental area. Power-over-Ethernet (POE) cameras, which only need one cable for power and communication, were used. The chosen POE camera is compact at 29 x 29 x 41 mm, but still affords a high resolution of 1280x1024 pixels at a maximum frame rate of 50 frames per second. Twelve cameras provided full coverage with overlap for the circuit experiments. A sample of a camera, encoded tracking pattern, and the camera gimbal can be found in Figure 4. (a) (b) (c) Figure 4. Tracking hardware: (a) Power-over-Ethernet (POE) camera, (b) encoded tracking pattern, and (c) camera gimbal. 15
19 4. Methodology 4.1. Instantaneous time headway definition In vehicle traffic flow, the time headway is defined as the time that elapses between the arrival of the leading vehicle and following vehicle at a designated cross section. This concept can be slightly modified and exted for pedestrian flow. The first step is to define a personal space for each individual. This space determines a region surrounding each individual to specify pedestrian groups which potentially can have substantial effects on their walking behaviors. The personal space can be considered as a rectangular space defining the lateral and longitudinal boundaries. Considering the width of the human shoulders, body sway, and avoidance of contact with others, Fruin suggested minimum lateral space of 0.71 m (28 in) to 0.76 m (30 in), and 2.5 m (8 ft) to 3 m (10 ft) for lateral and longitudinal space, respectively (Fruin, 1971). In this study, the latitude personal space is assumed to be 0.71 m and the longitudinal personal space is considered to be 2.5 m. Two groups of pedestrians can have influence on a particular pedestrian s walking behavior: 1) Leader group and 2) Collider group. The Leader group is defined as the set of pedestrians who are effectively being followed by individuals. The Collider group is the set of pedestrians walking toward individuals. Figure 5 depicts the concept of personal space and illustrates the leader/collider definitions. In this study, instantaneous time headway is proposed as a temporal distance measure between followers and leaders. Trajectory data makes it possible to differentiate leader and collider groups and compute the instantaneous time headway for each individual using the following basic relationship: rf( t) rl( t) TH f( t) v f( t) > 0 (1) v () t f Where rf () t, r() t, and vf () t stand for follower position in time t, leader position in time l t, and instantaneous follower speed in time t, respectively. The relationship implies that the instantaneous time headway for each time frame can be obtained by spacing between follower and leaders divided by the follower walking speed. Note that the definition is slightly different 16
 by keeping track of follower and leader")
20 than the time headway concept used in highway traffic. While time headway is directly measured in highway traffic at a specific location, the proposed method computes instantaneous time headway (temporal distances) by keeping track of follower and leader trajectories in each time frame Time headway modeling Figure 5. Personal space definition. A large number of simple headway distribution models have been proposed in traffic flow studies. However, the main problem of the simple distributions is their inability to identify minimum or adequate time headways for capacity estimation purposes. Therefore, a mixed headway distribution model, distinguishing between unconstrained (or freely moving) and constrained (or following) time headways, was applied in this study. The Generalized Queuing Model (GQM), proposed by Cowan (1975) and Branston (1976), is a mixed probabilistic distribution model handling time headway as a sum of two mutually indepent variables: the constrained and the free flowing headway. The general form of GQM can be defined as follow: f ( t) g( t) (1 ) h( t) (2) Where f(t) = time headway probability density function = fraction of constrained time headways g(t) = probability density function of the constrained headway (empty zone distribution) 17
21 h(t) = probability density function of the free flowing headway Cowan (1975) derived the model, assuming that the empty zone distribution (constrained time headways) could be represented by Gamma distribution while free flowing time headways can be represented by Poisson distribution. The model is called Gamma-GQM. t f ( t) e (1 ) e x e dx 1 t t t 1 x( ) ( ) ( ) (3) 0 Where,, denote shape and scale parameters of Gamma distribution, respectively. stands for average arrival rate in Poisson distribution, and is the gamma function. The parameters can be estimated using the Maximum Likelihood Estimation (MLE) method. The likelihood function of Gamma-GQM can be obtained using the following equation: [, t( )] LL t n t e e (4) n ( ) ln ( ) 1 t j t ln[ ( j ) (1 )( ) ] j 1 ( ) st Where n stands for total number of observations, and represents incomplete gamma function. To examine the performance of the model, the Kolmogorov-Smirnov (K-S test) was used to measure the goodness of fit of the model to the observed time headway data. This test examines the null hypothesis that observed data is drawn from Gamma-GQM distribution quantifying the maximum distance between observed and Gamma-GQM cumulative distribution function. The Gamma-GQM parameters can be used for capacity estimation purposes where capacity of a walking facility equals the inverse of minimum pedestrian time headways. The empty zone reflects the minimum time headway that a pedestrian adopts to follow the leaders. Therefore, capacity can be estimated by inversing the mean empty zone distribution, assuming that in capacity-flow conditions all pedestrians maintain constrained time headways respect to their leaders. Cap 1 W E(X) (5) 18
22 Where W and E(X) stand for average pedestrian lane width [m] and mean empty zone distribution [s], respectively. In fact, inverse of mean empty zone yields the capacity per pedestrian lane width unit and it can be converted to capacity per meter unit by dividing to pedestrian lane width. In the proposed method, time headway model can be separately calibrated for each leader type and impacts of different leader types on capacity estimation can be identified using corresponded empty zone distribution. 5. Data Processing To control the large amount of collected trajectory data, a tool with database management and visualization capability was developed using MATLAB software. This user-frily GUI is able to manage, process, and visualize the video data collected from the walking experiments. The developed GUI consists of three main components: visualization, processing, and behavioral data extraction. To visualize the experimental process, a simple CAD drawing of the study area was incorporated into the GUI. This map replicates pedestrian movements using their identification IDs during the experiments. The processing component makes it possible to extract the raw trajectory data for a selective area or selected time duration for all pedestrians or for a selective group of pedestrians (e.g. pedestrians with disabilities). In addition, microscopic behavioral variables (e.g., instantaneous speed and acceleration longitudinal and lateral spacing, time headway, orientation, local speed, flow and density) can be extracted using the GUI. The software is able to pull out the behavioral data for all pedestrians or for a particular target pedestrian. Figure 6 presents the GUI structure and components. 19

 of tracked patterns in relation to the camera s center.")
23 Figure 6. GUI structure. Figure 7 shows a snapshot of the developed GUI. Detailed applications of the developed components including preview circuit map, toolbar, and analysis functions of the GUI are illustrated as follows. Loading experimental data: After each experimental session, each of the 14 cameras was processed and 14 text files of the raw trajectory data were generated. These text files include IDs of each tracked participant and the positions (x, y, z) of tracked patterns in relation to the camera s center. Each file was named using the session time and camera number. To further process these raw data, the data needed to be loaded in the GUI. Data loading can be done by entering the session time and camera number into Session time and Cam Num fields respectively. 20
.")
24 Figure 7. Snapshot of GUI. Visualization: A preview of the circuit map was incorporated into the GUI to graphically observe pedestrian interactions during the experiments. The map shows positions of observed pedestrian IDs for selected time frames (current time field). Pedestrian movements and their interactions can be tracked by gradually increasing the time using the time bar. Toolbar: The toolbar provides functions to adjust the circuit map. It allows users to view the circuit map closer or view more of the map by using the zoom in and zoom out buttons. In addition, the current view can be moved to any desired direction by using the pan button. The desired view can be saved using save button. Study area and time duration selection: Defining proper spatial scales (i.e., area unit for computing density, speed and flow) is crucial in the processing procedures for obtaining reasonable results. The GUI makes it possible to process the raw trajectory data for a selective area and time duration. The desired area can be specified either by drawing the region on the map using the Region draw button or by inserting coordinates of the corners of selective area in the Set region box. The selective time duration of data process can be determined by defining Time Start and Time End. Target group analysis: Sometimes it may be important to study on the behavior of a particular group (i.e. pedestrian with motorized wheelchair). Users can create up to five groups of 21
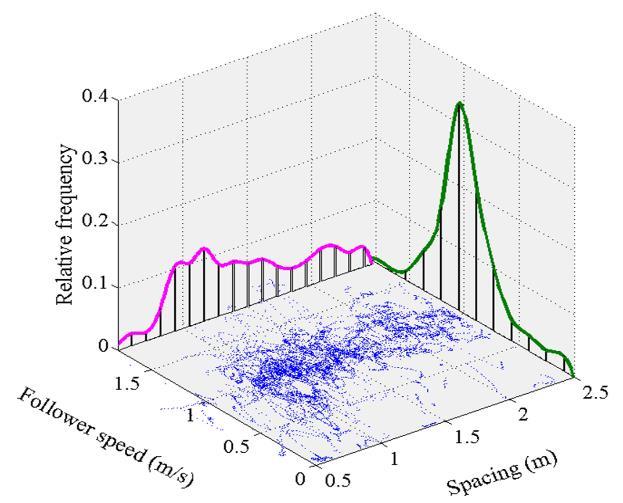
25 pedestrians using their IDs. The GUI can pull out and analyze the trajectory data for the target group for specified region and time duration. In addition, it is possible to smooth the walking trajectory data for each group by removing errors from the data set. The GUI provides different filtering procedures including average, interpolation, and Savitzky-Golay filtering method to smooth the data. Users can insert the desired time step into the Delim field and select the filtering method to obtain the trajectory data with less noise. Target ID analysis: In addition to group analysis, the GUI is able to extract microscopic behavioral data for a particular pedestrian in a pre-defined time duration. This can be done by inserting the pedestrian ID and defining personal space, relative space, and interval time. The GUI reports the mean value of behavioral variables for the selected interval time. 6. Results and Discussions This section presents the findings of the research. First, a descriptive analysis on observed follower speed and spacing distributions are presented to examine how these components contribute to time headways between followers and different leader types in passageway and bottleneck facilities. Then, the Gamma-GQM model estimation results are discussed. Finally, the capacity analysis of passageway and bottleneck is presented and the impacts of including different individuals with disabilities on capacity of facilities are discussed Descriptive data analysis To explore the interactions between different pedestrian groups, follower speeds and spacing data were extracted for passageway and bottleneck facilities. These time headway components can clearly show how pedestrians changed their walking behavior with respect to their leaders. Figure 8 shows the observed distributions for different leader types and Table 2 presents some basic descriptive statistics including number of observations, mean, and standard deviation. In the Figure 8, the points on the horizontal surface show the joint observed distribution of spacing and follower speed distribution; the projected histograms show the observed marginal distributions. It can be seen that pedestrians behaved differently in different facilities and with respect to different leader types. By comparing observations for pedestrians who followed individuals without disability leaders in the passageway and bottleneck 22
26 formations, it can be shown that followers in passageway walked with higher mean speed and they maintained higher spacing respect to their leaders. Specifically, switching from passageway to bottleneck leads to a mean speed reduction from 1.19 m/s (3.9 ft/s) to 1.07 m/s (3.51 ft/s) (about 10% reduction) and mean spacing reduction from 1.52 m (4.99 ft) to 1.2 m (3.94 ft) (about 23% reduction). Analysis revealed that leaders with varying disabilities changed their followers behaviors differently. While visually impaired leaders had minimum impacts on followers speed and spacing, individuals who use motorized wheelchair and individuals with mobility canes changed the followers behaviors considerably in the passageway facility. Observations indicated that followers reduced their walking speed and kept substantially higher spacing when they had leaders with disabilities. Results showed that while follower mean speed reduced by 29% and 35%, mean spacing increased by 12% and 2% for leaders with mobility canes and leaders who use motorized wheelchairs, respectively. In the bottleneck facility, analysis showed that followers had marginal changing in spacing with respect to individuals who use ambulatory devices (e.g., non-motorized wheelchair/walker) leaders and they maintained higher spacing with respect to individuals using motorized wheelchairs and individuals with mobility canes. Specifically, the spacing between followers and leaders using motorized wheelchairs and with mobility canes was about 5% and 12% higher compared to individuals without disability leaders. Overall, the observations show that walking facility configurations and leader types may significantly change the follower speed and spacing. The next section examines the hypothesis that these behavior changes are effective on pedestrian time headways. 23


27 Passageway Bottleneck (a) (b) (c) 24

 individuals without disabilities, (b) visual impairment, (c) motorized wheelchair, (d) non-motorized")


28 (d) (e) Figure 8. Observed follower speed and spacing distributions in passageway and bottleneck respect to different leader types. (a) individuals without disabilities, (b) visual impairment, (c) motorized wheelchair, (d) non-motorized wheelchair/walker, and (e) individuals with mobility canes. Table 2. Followers' speed and spacing descriptive statistics. Followers speed Spacing Facility Leader type N Mean (m/s) Std (m/s) Mean (m) Std (m) Without disabilities Visual Passageway Motorized Non-motorized/walker Cane Without disabilities Visual Bottleneck Motorized Non-motorized/walker Cane
29 Relative frequency (%) Relative frequency (%) Capacity analysis of pedestrian facilities involving individuals with disabilities 6.2. Time Headway modeling Parameters of the Gamma-GQM model need to be properly estimated before this model can be applied for capacity estimations. In this study, the maximum likelihood estimation method was used. The non-linear likelihood function presented in Eq. (4) was maximized using the Generalized Reduced Gradient (GRG) method (Lasdon et al., 1974) which is recognized as one of the most precise and accurate methods for solving nonlinear programming problems (Lee et al., 2004). Figure 9 presents the results of applying the estimation method to the passageway and bottleneck facilities only for individuals without disability leaders. The histograms show the observed time headway distribution with the bin size of 0.2 sec and the curves present the estimated model. The figures indicate that the model fitted to observed data well and it verifies that the model performance is acceptable for pedestrian time headway modeling. Observations revealed that a sharp peak can be identified in time headway ranges from 0.5 sec to 1.3 sec in the passageway facility but this peak is slightly sharper in the bottleneck facility. In other words, larger portions of pedestrians in the bottleneck followed their leaders in lower time headway ranges comparing to passageway. This observation indicates that the physical configuration of the walking environment can have a significant impact on time headway variable. 30% 30% 25% 20% = = % 20% = = % 15% 10% 5% 0% Headway [s] 10% 5% 0% Headway [s] (a) Figure 9. Results of headway estimations considering individuals without disabilities leader type for (a) passageway, and (b) bottleneck. (b) 26
30 Table 3 summarizes the estimation results of the Gamma-GQM model for different facilities and different leader types. The columns of this table respectively presents the estimation results including number of observations (N), fraction of constrained time headways ( ), Gamma distribution shape parameter ( ), Gamma distribution scale parameter ( ), and P- values for the Kolmogorov-Smirnov test (K-S test). Estimation results reveal that all P-values for the K-S test are significantly higher than 0.05 indicating the K-S test null hypothesis cannot be rejected. In other words, the model provided a good fit to observed data for all cases. Analysis showed that the constrained time headway fractions ( ) are close to 1 for both the passageway and bottleneck as well as all leader types which is a plausible result considering dimensions of personal space. Note that the personal space for a follower pedestrian was defined as an area which other pedestrians impact on his/her movement and it is plausible to observe that the follower pedestrian is constrained by leaders in most of times. Therefore, the results verify that the initial personal space dimension choices were rational. Estimation results shows that there are significance differences in estimated model parameters for different facilities as well as different leader types. These differences support the hypothesis that time headways change significantly respect to facility configuration and leader types. Note that except in some cases, estimated shape and scale parameters do not reflect any straightforward interpretation from a traffic flow theory point of view. Table 3. Summary of Gamma-GQM estimation results. Facility Leader type N Passageway Bottleneck K-S test (p-value) Without disabilities Visual Motorized Non-motorized/walker Cane Without disabilities Visual Motorized Non-motorized/walker Cane


 and personal latitude personal spacing (0.")
31 6.3. Capacity analysis To estimate capacity, it is necessary to estimate the width of formed lanes (see Eq. 5). Video data showed that lane formation patterns are different when compared to passageway and bottleneck. The sketch in Figure 10 presents the walking patterns, expressing that pedestrians walked in staggered fashion in the passageway and used the available space optimally compared to the bottleneck. In other words, pedestrians need more lateral space in bottleneck formations due to space constraints. Analysis revealed that the average distance of lateral centers of tracked pedestrians were about 0.3 m and 0.21 m in the passageway and bottleneck, respectively. Therefore, lane width for passageway considered to be equal to distance of lateral centers (0.3 m) and personal latitude personal spacing (0.76 m) was considered for bottleneck accounting for additional safety and comfort distances. The number of lanes obtained from selected lane width for bottleneck (Number of lanes = Facility width Lane width expressing that the assumption was a rational choice. ) was verified using video observations (a) (b) Figure 10. Lane formation pattern in (a) passageway, and (b) bottleneck Empty zone parameters can be used to analyze the capacity of different facilities. The parameters also make it possible to explore the impacts of different leader types on walking facilities performance. The results of the estimations can be found in Table 4, which includes empty zone mean (E(x)) [s], capacity per pedestrian lane width (C) [ped/lane/s], and capacity per meter width (Cap) [ped/m/s] for all leader types. Results revealed that the empty zone mean of the passageway was much larger compared to the empty zone mean of the bottleneck for most of leader types. In comparing disabled leader types in the passageway and bottleneck formations, it is revealed that mean empty zone for the visually impaired was the lowest (1.53 sec and 1.69 sec, 28
Title: Modeling Crossing Behavior of Drivers and Pedestrians at Uncontrolled Intersections and Mid-block Crossings
 Title: Modeling Crossing Behavior of Drivers and Pedestrians at Uncontrolled Intersections and Mid-block Crossings Objectives The goal of this study is to advance the state of the art in understanding
Saturation Flow Rate, Start-Up Lost Time, and Capacity for Bicycles at Signalized Intersections
 Transportation Research Record 1852 105 Paper No. 03-4180 Saturation Flow Rate, Start-Up Lost Time, and Capacity for Bicycles at Signalized Intersections Winai Raksuntorn and Sarosh I. Khan A review of
Chapter 5 DATA COLLECTION FOR TRANSPORTATION SAFETY STUDIES
 Chapter 5 DATA COLLECTION FOR TRANSPORTATION SAFETY STUDIES 5.1 PURPOSE (1) The purpose of the Traffic Safety Studies chapter is to provide guidance on the data collection requirements for conducting a
A Traffic Operations Method for Assessing Automobile and Bicycle Shared Roadways
 A Traffic Operations Method for Assessing Automobile and Bicycle Shared Roadways A Thesis Proposal By James A. Robertson Submitted to the Office of Graduate Studies Texas A&M University in partial fulfillment
#19 MONITORING AND PREDICTING PEDESTRIAN BEHAVIOR USING TRAFFIC CAMERAS
 #19 MONITORING AND PREDICTING PEDESTRIAN BEHAVIOR USING TRAFFIC CAMERAS Final Research Report Luis E. Navarro-Serment, Ph.D. The Robotics Institute Carnegie Mellon University November 25, 2018. Disclaimer
PREPARED TESTIMONY OF NICK CONNOR. Q. Please state your name, professional position, and business address.
 Application 06-12-005 et al. Exhibit Date: August, 2008 PREPARED TESTIMONY OF NICK CONNOR Q. Please state your name, professional position, and business address. A. My name is Nick Connor. I presently
TRAFFIC CHARACTERISTICS. Unit I
 TRAFFIC CHARACTERISTICS Unit I Traffic stream Characteristics Overview Overview of Traffic Stream Components To begin to understand the functional and operational aspects of traffic on streets and highways
Designing a Traffic Circle By David Bosworth For MATH 714
 Designing a Traffic Circle By David Bosworth For MATH 714 Abstract We all have had the experience of sitting in a traffic jam, or we ve seen cars bunched up on a road for some no apparent reason. The use
Probabilistic Models for Pedestrian Capacity and Delay at Roundabouts
 Probabilistic Models for Pedestrian Capacity and Delay at Roundabouts HEUNGUN OH Doctoral Candidate VIRGINIA P. SISIOPIKU Assistant Professor Michigan State University Civil and Environmental Engineering
Chapter 4 Traffic Analysis
 Chapter 4 Traffic Analysis PURPOSE The traffic analysis component of the K-68 Corridor Management Plan incorporates information on the existing transportation network, such as traffic volumes and intersection
DOI /HORIZONS.B P23 UDC : (497.11) PEDESTRIAN CROSSING BEHAVIOUR AT UNSIGNALIZED CROSSINGS 1
 PEDESTRIAN CROSSING BEHAVIOUR AT UNSIGNALIZED CROSSINGS 1") DOI 10.20544/HORIZONS.B.03.1.16.P23 UDC 656.142.054:159.922(497.11) PEDESTRIAN CROSSING BEHAVIOUR AT UNSIGNALIZED CROSSINGS 1 JelenaMitrovićSimić 1, Valentina Basarić, VukBogdanović Department of Traffic
DOI 10.20544/HORIZONS.B.03.1.16.P23 UDC 656.142.054:159.922(497.11) PEDESTRIAN CROSSING BEHAVIOUR AT UNSIGNALIZED CROSSINGS 1 JelenaMitrovićSimić 1, Valentina Basarić, VukBogdanović Department of Traffic
MEASURING PASSENGER CAR EQUIVALENTS (PCE) FOR LARGE VEHICLES AT SIGNALIZED INTERSECTIONS
 FOR LARGE VEHICLES AT SIGNALIZED INTERSECTIONS") MEASURING PASSENGER CAR EQUIVALENTS (PCE) FOR LARGE VEHICLES AT SIGNALIZED INTERSECTIONS Md. Mizanur RAHMAN Doctoral Student Graduate School of Engineering Department of Civil Engineering Yokohama National
MEASURING PASSENGER CAR EQUIVALENTS (PCE) FOR LARGE VEHICLES AT SIGNALIZED INTERSECTIONS Md. Mizanur RAHMAN Doctoral Student Graduate School of Engineering Department of Civil Engineering Yokohama National
Recommended Roadway Plan Section 2 - Land Development and Roadway Access
 Recommended Roadway Plan Section 2 - Land Development and Roadway Access SECTION 2 Land Development and Roadway Access 2.1 Land Use and Access Management The Federal Highway Administration (FHWA) defines
Traffic circles. February 9, 2009
 Traffic circles February 9, 2009 Abstract The use of a traffic circle is a relatively common means of controlling traffic in an intersection. Smaller Traffic circles can be especially effective in routing
Pedestrian traffic flow operations on a platform: observations and comparison with simulation tool SimPed
 Pedestrian traffic flow operations on a platform: observations and comparison with simulation tool SimPed W. Daamen & S. P. Hoogendoorn Department Transport & Planning, Delft University of Technology,
Crash Analysis of I-64 Closure in St. Louis County
 Report # MATC-MST: 341 Final Report 25-1121-0001-341 Crash Analysis of I-64 Closure in St. Louis County Ghulam H. Bham, Ph.D. Professor Department of Civil, Architectural, and Environmental Engineering
Analysis of the Interrelationship Among Traffic Flow Conditions, Driving Behavior, and Degree of Driver s Satisfaction on Rural Motorways
 Analysis of the Interrelationship Among Traffic Flow Conditions, Driving Behavior, and Degree of Driver s Satisfaction on Rural Motorways HIDEKI NAKAMURA Associate Professor, Nagoya University, Department
Management of Multi-Lane Highways in Jordan (Case Study)
") Management of Multi-Lane Highways in Jordan (Case Study) Basim Jrew 1), Nidal Hussein 2) and Rami Al-Kouz 3) 1) Isra University, Jordan. E-Mail: basim.jrew@iu.edu.jo 2) Isra University, Jordan. E-Mail:
Management of Multi-Lane Highways in Jordan (Case Study) Basim Jrew 1), Nidal Hussein 2) and Rami Al-Kouz 3) 1) Isra University, Jordan. E-Mail: basim.jrew@iu.edu.jo 2) Isra University, Jordan. E-Mail:
WHY AND WHEN PEDESTRIANS WALK ON CARRIAGEWAY IN PRESENCE OF FOOTPATH? A BEHAVIORAL ANALYSIS IN MIXED TRAFFIC SCENARIO OF INDIA.
 WHY AND WHEN PEDESTRIANS WALK ON CARRIAGEWAY IN PRESENCE OF FOOTPATH? A BEHAVIORAL ANALYSIS IN MIXED TRAFFIC SCENARIO OF INDIA. Sobhana Patnaik, Mukti Advani, Purnima Parida. There are reasons for walking
An Analysis of Reducing Pedestrian-Walking-Speed Impacts on Intersection Traffic MOEs
 An Analysis of Reducing Pedestrian-Walking-Speed Impacts on Intersection Traffic MOEs A Thesis Proposal By XIAOHAN LI Submitted to the Office of Graduate Studies of Texas A&M University In partial fulfillment
Evaluation of pedestrians speed with investigation of un-marked crossing
 Evaluation of pedestrians speed with investigation of un-marked crossing Iraj Bargegol, Naeim Taghizadeh, Vahid Najafi Moghaddam Gilani Abstract Pedestrians are one of the most important users of urban
Evaluation of service quality for pedestrian crossing flow at signalized intersection
 Evaluation of service quality for pedestrian crossing flow at signalized intersection Assist. Prof. Dr. Mehdi Al-Kubaisi Republic of Iraq University of Anbar-College of Engineering- Civil Department Email:
AN APPROACH FOR ASSESSMENT OF WEAVING LENGTH FOR MID-BLOCK TRAFFIC OPERATIONS
 International Journal for Traffic and Transport Engineering, 215, 5(4): 442-45 UDC: 625.739 DOI: http://dx.doi.org/1.778/ijtte.215.5(4).8 AN APPROACH FOR ASSESSMENT OF WEAVING LENGTH FOR MID-BLOCK TRAFFIC
The calibration of vehicle and pedestrian flow in Mangalore city using PARAMICS
 Urban Transport XX 293 The calibration of vehicle and pedestrian flow in Mangalore city using PARAMICS S. K. Prusty, R. Phadnis & Kunal National Institute Of Technology Karnataka, India Abstract This paper
ROUNDABOUTS/TRAFFIC CIRCLES
 GENERAL 1. Description This standard identifies minimum requirements that shall be met for Roundabouts and Neighborhood Traffic Circles in the design and construction of elements for Arlington County Horizontal
Introduction Roundabouts are an increasingly popular alternative to traffic signals for intersection control in the United States. Roundabouts have a
 HIGH-CAPACITY ROUNDABOUT INTERSECTION ANALYSIS: GOING AROUND IN CIRCLES David Stanek, PE and Ronald T. Milam, AICP Abstract. Roundabouts have become increasingly popular in recent years as an innovative
Verification and Validation Pathfinder
 403 Poyntz Avenue, Suite B Manhattan, KS 66502 USA +1.785.770.8511 www.thunderheadeng.com Verification and Validation Pathfinder 2015.1 Release 0504 x64 Disclaimer Thunderhead Engineering makes no warranty,
ENHANCED PARKWAY STUDY: PHASE 2 CONTINUOUS FLOW INTERSECTIONS. Final Report
 Preparedby: ENHANCED PARKWAY STUDY: PHASE 2 CONTINUOUS FLOW INTERSECTIONS Final Report Prepared for Maricopa County Department of Transportation Prepared by TABLE OF CONTENTS Page EXECUTIVE SUMMARY ES-1
EVALUATION OF METHODOLOGIES FOR THE DESIGN AND ANALYSIS OF FREEWAY WEAVING SECTIONS. Alexander Skabardonis 1 and Eleni Christofa 2
 EVALUATION OF METHODOLOGIES FOR THE DESIGN AND ANALYSIS OF FREEWAY WEAVING SECTIONS Alexander Skabardonis 1 and Eleni Christofa 2 1: University of California, Berkeley, Institute of Transportation Studies,
TRAFFIC IMPACT STUDY CRITERIA
 Chapter 6 - TRAFFIC IMPACT STUDY CRITERIA 6.1 GENERAL PROVISIONS 6.1.1. Purpose: The purpose of this document is to outline a standard format for preparing a traffic impact study in the City of Steamboat
Planning and Design of Proposed ByPass Road connecting Kalawad Road to Gondal Road, Rajkot - Using Autodesk Civil 3D Software.
 Planning and Design of Proposed ByPass Road connecting Kalawad Road to Gondal Road, Rajkot - Using Autodesk Civil 3D Software. 1 Harshil S. Shah, 2 P.A.Shinkar 1 M.E. Student(Transportation Engineering),
CAPACITY ESTIMATION OF URBAN ROAD IN BAGHDAD CITY: A CASE STUDY OF PALESTINE ARTERIAL ROAD
 VOL. 13, NO. 21, NOVEMBER 218 ISSN 1819-668 26-218 Asian Research Publishing Network (ARPN). All rights reserved. CAPACITY ESTIMATION OF URBAN ROAD IN BAGHDAD CITY: A CASE STUDY OF PALESTINE ARTERIAL ROAD
Exploration of design solutions for the enhancement of crowd safety
 Australasian Transport Research Forum 2011 Proceedings 28-30 September 2011, Adelaide, Australia Publication website: http://www.patrec.org/atrf.aspx Exploration of design solutions for the enhancement
CHAPTER 2G. PREFERENTIAL AND MANAGED LANE SIGNS
 2011 Edition - Revision 2 Page 275 Section 2G.01 Scope CHAPTER 2G. PREFERENTIAL AND MANAGED LANE SIGNS 01 Preferential lanes are lanes designated for special traffic uses such as high-occupancy vehicles
City of Homewood Transportation Plan
 City of Homewood Transportation Plan Prepared for: City of Homewood, Alabama Prepared by: Skipper Consulting, Inc. May 2007 TABLE OF CONTENTS INTRODUCTION... 1 BACKGROUND INFORMATION... 1 EXISTING TRANSPORTATION
ALLEY 24 TRAFFIC STUDY
 ALLEY 24 TRAFFIC STUDY in City of Frostburg, Maryland January 2013 3566 Teays Valley Road Hurricane, WV Office: (304) 397-5508 www.denniscorporation.com Alley 24 Traffic Study January 2013 Frostburg, Maryland
Figure 1: Vicinity Map of the Study Area
 ARIZONA TEXAS NEW MEXICO OKLAHOMA May 5, 2016 Mr. Anthony Beach, P.E. BSP Engineers 4800 Lakewood Drive, Suite 4 Waco, Texas 76710 Re: Intersection and Access Analysis along Business 190 in Copperas Cove
Module 3 Developing Timing Plans for Efficient Intersection Operations During Moderate Traffic Volume Conditions
 Module 3 Developing Timing Plans for Efficient Intersection Operations During Moderate Traffic Volume Conditions CONTENTS (MODULE 3) Introduction...1 Purpose...1 Goals and Learning Outcomes...1 Organization
Measurement of Pedestrian Flow Parameters Case study of Dakor, Gujarat
 Measurement of Pedestrian Flow Parameters Case study of Dakor, Gujarat Chhaya Brahmbhatt 1, Dr. L. B. Zala 2, Dr. Mukti Advani 3 1 IInd Year M.Tech(TSE) Student, Civil Engineering Department, B V M Engineering
The Application of Pedestrian Microscopic Simulation Technology in Researching the Influenced Realm around Urban Rail Transit Station
 Journal of Traffic and Transportation Engineering 4 (2016) 242-246 doi: 10.17265/2328-2142/2016.05.002 D DAVID PUBLISHING The Application of Pedestrian Microscopic Simulation Technology in Researching
At each type of conflict location, the risk is affected by certain parameters:
 TN001 April 2016 The separated cycleway options tool (SCOT) was developed to partially address some of the gaps identified in Stage 1 of the Cycling Network Guidance project relating to separated cycleways.
Integrated Pedestrian Simulation in VISSIM
 Integrated Pedestrian Simulation in VISSIM PTV worldwide MUGS Conference October 30-31, 2008 Wellington Founded > 1979 30 years fast approaching Employees > Approximately 800 persons in the PTV Group worldwide
Capacity and Level of Service LOS
 Chapter 21 Capacity and Level of Service LOS 21.1 Introduction Often it is required to ascertain how much a transport facility can accommodate. Such information is useful in the design of traffic facility.
ANALYSIS OF SATURATION FLOW RATE FLUCTUATION FOR SHARED LEFT-TURN LANE AT SIGNALIZD INTERSECTIONS *
 ANALYSIS OF SATURATION FLOW RATE FLUCTUATION FOR SHARED LEFT-TURN LANE AT SIGNALIZD INTERSECTIONS * By Peng CHEN**, Hideki NAKAMURA*** and Miho ASANO**** 1. Introduction In urban corridor performance evaluation,
METHODOLOGY. Signalized Intersection Average Control Delay (sec/veh)
") Chapter 5 Traffic Analysis 5.1 SUMMARY US /West 6 th Street assumes a unique role in the Lawrence Douglas County transportation system. This principal arterial street currently conveys commuter traffic
Chapter 5 Traffic Analysis 5.1 SUMMARY US /West 6 th Street assumes a unique role in the Lawrence Douglas County transportation system. This principal arterial street currently conveys commuter traffic
Highway 111 Corridor Study
 Highway 111 Corridor Study June, 2009 LINCOLN CO. HWY 111 CORRIDOR STUDY Draft Study Tea, South Dakota Prepared for City of Tea Sioux Falls Metropolitan Planning Organization Prepared by HDR Engineering,
THIS PAGE LEFT BLANK INTENTIONALLY
 GA SR 25 Spur at Canal Road Transportation Impact Analysis PREPARED FOR GLYNN COUNTY, GEORGIA 1725 Reynolds Street, Suite 300 Brunswick, Georgia 31520 PREPARED BY 217 Arrowhead Boulevard Suite 26 Jonesboro,
A GIS APPROACH TO EVALUATE BUS STOP ACCESSIBILITY
 Advanced OR and AI Methods in Transportation A GIS APPROACH TO EVALUATE BUS STOP ACCESSIBILITY Giuseppe SALVO 1, Simona SABATINI 2 Abstract. This paper proposes a methodology to assess public transportation
Topic No January 2000 Manual on Uniform Traffic Studies Revised July Chapter 8 GAP STUDY
 Chapter 8 8.1 PURPOSE GAP STUDY (1) The Gap Study is used to determine the size and the number of gaps in the vehicular traffic stream for unsignalized intersections and access points, pedestrian studies,
Defining Purpose and Need
 Advanced Design Flexibility Pilot Workshop Session 4 Jack Broz, PE, HR Green May 5-6, 2010 Defining Purpose and Need In your agency s project development process, when do design engineers typically get
Chapter 5 FUNCTIONAL CLASSIFICATION
 Chapter 5 FUNCTIONAL CLASSIFICATION Functional classification is a system by which streets and roadways may be distinguished by types according to their function within the entire transportation network.
International Journal of Innovative Research in Science, Engineering and Technology. (A High Impact Factor, Monthly, Peer Reviewed Journal)
") A Preliminary Study on Possible Alternate Roadways to Reduce Traffic Hazards at Velachery Township in Chennai Traffic Flow Minimization- a Prelimary Study Deepak R, Gangha G Department of Civil Engineering,
A Preliminary Study on Possible Alternate Roadways to Reduce Traffic Hazards at Velachery Township in Chennai Traffic Flow Minimization- a Prelimary Study Deepak R, Gangha G Department of Civil Engineering,
Comparison of Turning Movement Count Data Collection Methods for a Signal Optimization Study. White Paper
 Comparison of Turning Movement Count Data Collection Methods for a Signal Optimization Study White Paper Grand Rapids Southfield Traverse City www.urscorp.com May 2011 Comparison of Turning Movement Count
Pedestrian Level of Service at Intersections in Bhopal City
 Pedestrian Level of Service at Intersections in Bhopal City 1 Rakesh Wahane 1 M.E. Student 1 Department of Civil Engineering 1 Samrat Ashok Technological Institute Vidisha MP 464001 Abstract - This study
Road Data Input System using Digital Map in Roadtraffic
 Data Input System using Digital Map in traffic Simulation Namekawa,M 1., N.Aoyagi 2, Y.Ueda 2 and A.Satoh 2 1 College of Management and Economics, Kaetsu University, Tokyo, JAPAN 2 Faculty of Engineering,
Evaluation of M-99 (Broad Street) Road Diet and Intersection Operational Investigation
 Road Diet and Intersection Operational Investigation") Evaluation of M-99 (Broad Street) Road Diet and Intersection Operational Investigation City of Hillsdale, Hillsdale County, Michigan June 16, 2016 Final Report Prepared for City of Hillsdale 97 North Broad
Evaluation of M-99 (Broad Street) Road Diet and Intersection Operational Investigation City of Hillsdale, Hillsdale County, Michigan June 16, 2016 Final Report Prepared for City of Hillsdale 97 North Broad
Traffic Parameter Methods for Surrogate Safety Comparative Study of Three Non-Intrusive Sensor Technologies
 Traffic Parameter Methods for Surrogate Safety Comparative Study of Three Non-Intrusive Sensor Technologies CARSP 2015 Collision Prediction and Prevention Approaches Joshua Stipancic 2/32 Acknowledgements
3 ROADWAYS 3.1 CMS ROADWAY NETWORK 3.2 TRAVEL-TIME-BASED PERFORMANCE MEASURES Roadway Travel Time Measures
 ROADWAYS Approximately 6 million trips are made in the Boston metropolitan region every day. The vast majority of these trips (80 to percent, depending on trip type) involve the use of the roadway network
Pedestrian Speed-Flow Relationship for. Developing Countries. Central Business District Areas in
 TRANSPORTATION RESEARCH RECORD 1396 69 Pedestrian Speed-Flow Relationship for Central Business District Areas in Developing Countries HASHEM R. AL-MASAEID, TURK! I. AL-SULEIMAN, AND DONNA C. NELSON Pedestrian
On street parking manoeuvres and their effects on design
 On street parking manoeuvres and their effects on design Purnawan, and Yousif, S Title Authors Type URL Published Date 1999 On street parking manoeuvres and their effects on design Purnawan, and Yousif,
On-Road Parking A New Approach to Quantify the Side Friction Regarding Road Width Reduction
 On-Road Parking A New Regarding Road Width Reduction a b Indian Institute of Technology Guwahati Guwahati 781039, India Outline Motivation Introduction Background Data Collection Methodology Results &
Sensitivity of Equilibrium Flows to Changes in Key Transportation Network Parameters
 Sensitivity of Equilibrium Flows to Changes in Key Transportation Network Parameters Sara Moridpour Department of Civil Engineering Monash University, Melbourne, Victoria, Australia 1 Introduction In transportation
Evaluation of the Wisconsin DOT Walking Profiler
 Final Report Evaluation of the Wisconsin DOT Walking Profiler March 2007 U.S. Department of Transportation Federal Highway Administration Notice This document is disseminated under the sponsorship of the
Trial 3: Interactions Between Autonomous Vehicles and Pedestrians and Cyclists
 Trial 3: Interactions Between Autonomous Vehicles and Pedestrians and Cyclists What is VENTURER? VENTURER is a 5m research and development project funded by government and industry and delivered by Innovate
BLOSSOM AT PICKENS SIGNALIZED INTERSECTION IMPROVEMENT STUDY
 BLOSSOM AT PICKENS SIGNALIZED INTERSECTION IMPROVEMENT STUDY Class Project Report for ECIV 542 Traffic Engineering Submitted by Omor Sharif Muchun Song Narges Kaveshgar Quyen Pham Chih-Yao Lin Submission
Assessing Level of Service for Highways in a New Metropolitan City
 Assessing Level of Service for Highways in a New Metropolitan City Ganesh Pawar Civil Engineering Department G. H. Raisoni College of Engineering Nagpur, India,4416 Dr. Bhalachandra Khode Civil Engineering
TRAFFIC STUDY GUIDELINES Clarksville Street Department
 TRAFFIC STUDY GUIDELINES Clarksville Street Department 9/1/2009 Introduction Traffic studies are used to help the city determine potential impacts to the operation of the surrounding roadway network. Two
International Journal of Advance Research in Engineering, Science & Technology
 Impact Factor (SJIF): 4.542 International Journal of Advance Research in Engineering, Science & Technology e-issn: 2393-9877, p-issn: 2394-2444 Volume 4, Issue 4, April-2017 Planning & Design Of New By-pass
FINAL DESIGN TRAFFIC TECHNICAL MEMORANDUM
 FINAL DESIGN TRAFFIC TECHNICAL MEMORANDUM July 2014 FINAL (SR 43) Project Development and Environment Study From State Road 60 (Adamo Drive) to I-4 (SR 400) Hillsborough County, Florida Work Program Item
IBPI: Bicycle and Pedestrian Education Program
 Portland State University PDXScholar Urban Studies and Planning Faculty Publications and Presentations Nohad A. Toulan School of Urban Studies and Planning 12-1-2010 IBPI: Bicycle and Pedestrian Education
ADOT Statewide Bicycle and Pedestrian Program Summary of Phase IV Activities APPENDIX B PEDESTRIAN DEMAND INDEX
 ADOT Statewide Bicycle and Pedestrian Program Summary of Activities APPENDIX B PEDESTRIAN DEMAND INDEX May 24, 2009 Pedestrian Demand Index for State Highway Facilities Revised: May 29, 2007 Introduction
MRI-2: Integrated Simulation and Safety
 MRI-2: Integrated Simulation and Safety Year 3 2 nd Quarterly Report Submitted by: Dr. Essam Radwan, P.E. (PI), Ahmed.Radwan@ucf.edu Dr. Hatem Abou-Senna, P.E., habousenna@ucf.edu Dr. Mohamed Abdel-Aty,
Appendix B: Forecasting and Traffic Operations Analysis Framework Document
 Existing Conditions Report - Appendix Appendix B: Forecasting and Traffic Operations Analysis Framework Document This document defines the methodology and assumptions that will be used in the traffic forecasting
Complete Street Analysis of a Road Diet: Orange Grove Boulevard, Pasadena, CA
 Complete Street Analysis of a Road Diet: Orange Grove Boulevard, Pasadena, CA Aaron Elias, Bill Cisco Abstract As part of evaluating the feasibility of a road diet on Orange Grove Boulevard in Pasadena,
Analysis on Capacity of Unsignalized T-Intersections using Conflict Technique
 Analysis on of Unsignalized T-Intersections using Technique B.V. Suresh Kumar Assistant Professor Department of Civil Engineering Coastal Institute of Technology & Management Vizianagaram, INDIA Abstract
1. Introduction. 2. Survey Method. Volume 6 Issue 5, May Licensed Under Creative Commons Attribution CC BY
 A Study on Performance of an Urban Arterial Corridor Guggilla Raju 1, Rontala Ashwini 2 1 Assistant Professor, Department of Civil Engineering, GCET 2 Assistant Professor, Department of Civil Engineering,
Keywords: multiple linear regression; pedestrian crossing delay; right-turn car flow; the number of pedestrians;
 Available online at www.sciencedirect.com ScienceDirect Procedia - Social and Behavioral Scien ce s 96 ( 2013 ) 1997 2003 13th COTA International Conference of Transportation Professionals (CICTP 2013)
Highway Capacity and LOS. Reading Assignment: pgs
 Highway Capacity and LOS Reading Assignment: pgs. 170-200 We know from the previous section that traffic flows fairly well when Demand < Capacity. However, when demand approaches capacity, we begin to
Legendre et al Appendices and Supplements, p. 1
 Legendre et al. 2010 Appendices and Supplements, p. 1 Appendices and Supplement to: Legendre, P., M. De Cáceres, and D. Borcard. 2010. Community surveys through space and time: testing the space-time interaction
Roadway Design Manual
 Roadway Design Manual Manual Notice Archive by Texas Department of Transportation (512) 302-2453 all rights reserved Manual Notice 2009-1 From: Manual: Mark A. Marek, P.E Roadway Design Manual Effective
MICROSIMULATION USING FOR CAPACITY ANALYSIS OF ROUNDABOUTS IN REAL CONDITIONS
 Session 5. Transport and Logistics System Modelling Proceedings of the 11 th International Conference Reliability and Statistics in Transportation and Communication (RelStat 11), 19 22 October 2011, Riga,
Project: OpenDRIVE Document No. Issue: Title: Style Guide For OpenDRIVE Databases VI C. Date: 05 th March 2014 no.
 Project: OpenDRIVE Document No. Issue: Title: Style Guide For OpenDRIVE Databases VI2011.040 C Date: 05 th March 2014 no. of pages: 12 Issuing Party: Author: Distribution List: VIRES Simulationstechnologie
Traffic Impact Analysis Chatham County Grocery Chatham County, NC
 Chatham County Grocery Chatham County, NC TABLE OF CONTENTS 1. INTRODUCTION... 1 1.1. Location and Study Area... 1 1.2. Proposed Land Use and Access... 2 1.3. Adjacent Land Uses... 2 1.4. Existing ways...
Chapter Capacity and LOS Analysis of a Signalized I/S Overview Methodology Scope Limitation
 Chapter 37 Capacity and LOS Analysis of a Signalized I/S 37.1 Overview The Highway Capacity Manual defines the capacity as the maximum howdy rate at which persons or vehicle can be reasonably expected
Verification and Validation Pathfinder
 403 Poyntz Avenue, Suite B Manhattan, KS 66502 USA +1.785.770.8511 www.thunderheadeng.com Verification and Validation Pathfinder 2018.3 Disclaimer Thunderhead Engineering makes no warranty, expressed or
At-Grade Intersections versus Grade-Separated Interchanges (An Economic Analysis of Several Bypasses)
") Transportation Kentucky Transportation Center Research Report University of Kentucky Year 1975 At-Grade Intersections versus Grade-Separated Interchanges (An Economic Analysis of Several Bypasses) Kenneth
Transportation Kentucky Transportation Center Research Report University of Kentucky Year 1975 At-Grade Intersections versus Grade-Separated Interchanges (An Economic Analysis of Several Bypasses) Kenneth
Roundabout Design Aid PREPARED BY TRAFFIC AND SAFETY
 Roundabout Design Aid PREPARED BY TRAFFIC AND SAFETY May 2018 Engineering Manual Preamble This manual provides guidance to administrative, engineering, and technical staff. Engineering practice requires
Study on fatal accidents in Toyota city aimed at zero traffic fatality
 Study on fatal accidents in Toyota city aimed at zero traffic fatality Toru Kiuchi, Yoshihisa Kanno, Makoto Shiota Toyota Motor Corporation, 1 Toyota-cho, Toyota-shi, Aichi 471-8571, Japan Abstract - Since
MUTCD Part 6G: Type of Temporary Traffic Control Zone Activities
 MUTCD Part 6G: Type of Temporary Traffic Control Zone Activities 6G.01 Typical Applications Each temporary traffic control (TTC) zone is different. Many variables, such as location of work, highway type,
Tight Diamond Interchange versus Single Point Urban Interchange: Pedestrians Prospective
 Tight Diamond Interchange versus Single Point Urban Interchange: Pedestrians Prospective Ahmed Amer, M.S. Ph.D. Candidate Graduate Research/Teaching Assistant Department of Civil & Environmental Engineering
Evaluation of Work Zone Strategies at Signalized Intersections
 Evaluation of Work Zone Strategies at Signalized Intersections Khaled Shaaban Qatar University/Department of Civil and Architectural Engineering, Doha, Qatar Email: kshaaban@qu.edu.qa Dina Elnashar Qatar
HENDERSON DEVELOPMENT 213, 217, 221, 221 ½, 223 HENDERSON AVENUE and 65 TEMPLETON STREET OTTAWA, ONTARIO TRANSPORTATION OVERVIEW.
 HENDERSON DEVELOPMENT 213, 217, 221, 221 ½, 223 HENDERSON AVENUE and 65 TEMPLETON STREET OTTAWA, ONTARIO TRANSPORTATION OVERVIEW Prepared for: 2294170 Ontario Inc. February 2, 2017 117-652 Report_1.doc
1.3.4 CHARACTERISTICS OF CLASSIFICATIONS
 Geometric Design Guide for Canadian Roads 1.3.4 CHARACTERISTICS OF CLASSIFICATIONS The principal characteristics of each of the six groups of road classifications are described by the following figure
Effects of Traffic Signal Retiming on Safety. Peter J. Yauch, P.E., PTOE Program Manager, TSM&O Albeck Gerken, Inc.
 Effects of Traffic Signal Retiming on Safety Peter J. Yauch, P.E., PTOE Program Manager, TSM&O Albeck Gerken, Inc. Introduction It has long been recognized that traffic signal timing can have an impact
Transportation Impact Study for Abington Terrace
 Transportation Impact Study for Abington Terrace Abington Township, Montgomery County, PA Sandy A. Koza, P.E., PTOE PA PE License Number PE059911 Prepared by McMahon Associates, Inc. 425 Commerce Drive,
Chapter 9 Chapter 9 PEDESTRIAN AND BICYCLE VOLUME STUDIESVOLUME COUNT STUDY PURPOSE
 Chapter 9 Chapter 9 Formatted: Heading 1 PEDESTRIAN AND BICYCLE VOLUME STUDIESVOLUME COUNT STUDY Formatted: All caps 5.89.19.1 PURPOSE (1) The Pedestrian and bicycle volume studies arevolume Count Study
Crash Patterns in Western Australia. Kidd B., Main Roads Western Australia Willett P., Traffic Research Services
 Crash Patterns in Western Australia Kidd B., Main Roads Western Australia Willett P., Traffic Research Services Abstract Examination of crash patterns is one way of identifying key factors on which focus
INTRODUCTION THOROUGHFARE SYSTEM CLASSIFICATIONS
 INTRODUCTION The thoroughfare plan will assist public officials in the development of a specialized system for efficient and safe movement of vehicular traffic while minimizing potential conflicts with
A REAL-TIME SIGNAL CONTROL STRATEGY FOR MITIGATING THE IMPACT OF BUS STOPS ON URBAN ARTERIALS
 A REAL-TIME SIGNAL CONTROL STRATEGY FOR MITIGATING THE IMPACT OF BUS STOPS ON URBAN ARTERIALS Celeste Chavis 1, and Eleni Christofa 2 1 Department of Transportation and Urban Infrastructure Studies, Morgan
Geometric Categories as Intersection Safety Evaluation Tools
 Geometric Categories as Intersection Safety Evaluation Tools John R. Campbell Ayres Associates N19 W24075 Riverwood Drive, Suite 300 Waukesha, WI 53188 campbellj@ayresassociates.com Keith K. Knapp Engineering