Gait Analysis Using a Shoe-Integrated Wireless Sensor System
|
|
|
- Lillian Howard
- 6 years ago
- Views:
Transcription
1 > PAPER IDENTIFICATION NUMBER: TITB < 1 Gait Analysis Using a Shoe-Integrated Wireless Sensor System Stacy J. Morris Bamberg, Member, IEEE, Ari Y. Benbasat, Student Member, IEEE, Donna Moxley Scarborough, David E. Krebs, and Joseph A. Paradiso, Member, IEEE Abstract We describe a wireless wearable system capable of measuring many parameters relevant to gait analysis. The system was developed to provide quantitative gait analysis outside the confines of the traditional motion laboratory. The extensive sensor suite includes three orthogonal accelerometers, three orthogonal gyroscopes, four force sensors, two bi-directional bend sensors, two dynamic pressure sensors, as well as electric field height sensors. The GaitShoe was built to be worn on any shoe, without interfering with gait, and was designed to collect data unobtrusively, in any environment, and over long periods. The calibrated sensor outputs were analyzed and validated with results obtained simultaneously from The Massachusetts General Hospital Biomotion Lab. The GaitShoe proved highly capable of detecting heel-strike and toe-off, as well as estimating foot orientation and position, inter alia. Index Terms Biomedical measurements, legged locomotion, multisensor systems, telemetry. C I. INTRODUCTION LINICAL gait analysis is the investigation of the pattern of walking. At present, gait analysis is primarily carried out in one of two ways: in a motion laboratory, with full analysis of the motion of body segments using highly accurate computer-based force and optical tracking sensors, or in an office with the clinician making visual observations. The first method is expensive, requires the maintenance of a dedicated Manuscript received May 31, This work was supported in part by CIMIT under Grant X, by the Whitaker Foundation, and by the Things That Think Consortium at the MIT Media Lab. Manuscript received May 31, This work was supported in part by CIMIT under Grant X, by the Whitaker Foundation, and by the Things That Think Consortium at the MIT Media Lab. S.J.M. Bamberg was a graduate student with Harvard / Massachusetts Institute of Technology Division of Health Sciences & Technology, Cambridge, MA USA. She is now an assistant professor with the Department of Mechanical Engineering, University of Utah, Salt Lake City, USA (phone: ; fax: ; sjm@alum.mit.edu). A.Y. Benbasat is a graduate student with the MIT Media Lab, Cambridge, MA 02139, USA ( ayb@media.mit.edu). D.M. Scarborough is Assistant/Clinical Director of the Massachusetts General Hospital Biomotion Laboratory, Boston, MA 02114, USA ( dscarborough@partners.org). D.E. Krebs is professor, MGH Institute of Health Professionals and director of the Massachusetts General Hospital Biomotion Laboratory, Boston, MA 02114, USA ( krebs@helix.mgh.harvard.edu). J.A. Paradiso, is an associate professor with the MIT Media Lab, Cambridge, MA 02139, USA ( joep@media. mit.edu). motion lab, and uses cumbersome equipment attached to the patient, but produces well-quantified and accurate results for short distance ambulation. The second method is inexpensive and does not require special equipment, but requires additional time from the clinician, and the results are qualitative, unreliable, and difficult to compare across multiple visits. There is a need for an alternative analysis method that is capable of providing quantitative and repeatable results over extended time periods. The ability to perform long term gait monitoring will facilitate diagnosis of chronic walking problems. In addition, a system which can quantitatively analyze gait for patients who do not have access to motion analysis labs, either due to living in economically disadvantaged, rural, or underdeveloped settings, offers clinicians and patients new opportunities for diagnosis and treatment. As such, there has been considerable previous work in both research and commercial spheres focused on the development of more mobile methods of analyzing gait. The obvious advantage of directly measuring the pressure distribution beneath the foot has driven many of the early shoe-based systems. The shrinking size of data storage has further encouraged the development of untethered systems. In 1990, Wertsch et al [1] developed a system for measuring the pressure distribution beneath the foot, using seven force sensitive resistors (FSRs), located under seven high pressure points corresponding to the five metatarsal heads, the big toe, and the heel center. This tethered system gave detailed information about the pressure distribution beneath the foot, and provided those results in real-time. Data collected with their device were used to quantify the differences between shuffling and walking [2], and between sensate and insensate (no or little sensation in the foot) subjects [3]. In the latter study, the results led to a caution against drawing conclusions from a short segment of gait analysis in patients with sensory impairment, as a large stepto-step variation was found, emphasizing the need for a device capable of collecting data over a long time period. In 1994, Hausdorff et al [4] developed a system capable of detecting several of the temporal gait parameters. Their system consisted of an insole with two FSRs positioned under the heel and in the general area under the toes and metatarsals, ultimately connected to a circuit board and battery pack worn on the ankle [5], [6]. Validation of the data by comparison to
2 > PAPER IDENTIFICATION NUMBER: TITB < 2 data collected simultaneously from commercial force plates indicated their device measured stance duration to within 3% and swing and stride duration within 5% as compared to the results from the force plate. Their insole has been used to find patterns in gait [7], which they have been able to use to predict the maturation of gait in children [5], and the likelihood of falling in the elderly [6], demonstrating that only two FSRs are necessary to distinguish some types of abnormalities in gait from healthy gait. More recent work resulting in shoe-based sensor systems with increasingly sophisticated measurement capabilities have been driven by subspecialty interests in gait analysis. For diabetics, Morley et al [8] developed an insole-based system to quantify the conditions inside the shoe, with the goal of being able to predict progression of skin breakdown and ulceration in diabetic patients with peripheral neuropathy. Their laminated insole had pressure, temperature and humidity sensors designed to investigate the conditions at the foot interface, and was connected to an electronics module and batteries located in a plastic enclosure strapped to the calf of the subject. In initial work with their device, they detected quantitatively distinct variations in pressure patterns that corresponded to different activities, and were able to correlate their results with previous studies [9]. Another area of research driving the development of devices capable of capturing information about gait is neuroprosthetics for assisted walking. Neuroprosthetics require inputs to trigger, e.g., functional electrical stimulation (FES) used to stimulate muscles that assist walking. Pappas et al first developed a device consisting of three FSRs located on an insole (one under the heel, and two at the first and fourth metatarsal heads), and a gyroscope attached to the back of the shoe, placed such that the sensing axis was perpendicular to the sagittal plane [10]. With this system, they implemented a pattern recognition algorithm that used data from the FSRs and the gyroscope to define the transitions between two distinct phases (stance, swing) and two distinct events (heeloff, heel-strike). Their algorithm was validated by comparison to results from a commercial motion analysis system using optical motion analysis (a Vicon 370 from Oxford Metrics Ltd.). As compared with the commercial system, their algorithm achieved a 99% detection rate for normal subjects and a 96% detection rate for subjects with impaired gait, with a latency under 90 ms; these results demonstrated that on-shoe systems with gyroscopes and FSRs are able to achieve comparable results to commercial optical systems. More recent work by Pappas et al has resulted in an insole-only system where the gyroscope and a microcontroller have been embedded in the insole [11]. Using the results from their previous work, the system was tested on two subjects with incomplete spinal injury resulting in drop-foot. The system was used to trigger functional electrical stimulation (FES), and demonstrated a functional benefit of using it for both subjects, while walking horizontally, uphill, downhill, and while sitting and standing. Other research platforms include instrumented walkways [12], piezo-dyanomometric platforms [13], or instrumented floors [14], [15]. Such systems can determine parameters relating to the pressure distribution, as well as about stance and swing duration, but cannot provide information about the motion of the foot above the platform. In addition, research platforms have been developed to recognize gait without instrumenting the subject (generally motivated for use as a biometric identifier), primarily by videotape analysis [16]-[19], but also through the use of radar [20]. Commercial systems are numerous, and cover a wide range of applications, from tap-dance [21] to golf-swing analysis [22]. A very popular application is the use of inertial sensors to provide athletes with information, particularly for runners, such as the products available from Acceleron [23], Reebok (the Traxtar) [24], FitSense [25], Vectrasense [26], and Adidas [27], [28]. NCSA s Cyberboots use a pressure sensor array in an overshoe to provide walking interaction in a virtual reality environment [29]. For medical applications, Tekscan and Clevemed, among others, have developed insoles which measure pressure distribution [30], [31]. In addition, MiniSun markets The IDEEA LifeGait System, which uses the outputs of accelerometers placed on various parts of the body with artificial intelligence algorithms to determine a number of parameters relating to gait and motion [32]. Finally, the research presented in this paper grew out the Expressive Footware project developed by Dr. Paradiso and students in the Responsive Environments Group at the MIT Media Lab [33]. The Expressive Footware project resulted in a pair of running shoes that were each equipped with a wireless sensor board and an instrumented insole. Each insole measured dynamic pressure at the heel, bidirectional bend of the insole, the height of each foot above a conducting mat on the floor, and had three FSRs (two placed roughly at the medial and lateral metatarsal heads, and one outside the shoe, mounted at the toe). Each sensor board was permanently attached to the lateral side of the shoe, and contained a gyroscope for the angular rate of the foot about the vertical axis, a three-axis compass to determine the orientation of the foot relative to the Earth's local magnetic field, two axes of acceleration (the two axes in the plane of the sensor card), and three axes of shock acceleration. An integrated sonar receiver on each sensor board, in conjunction with four sonar transmitters on the floor, provided the position of each foot in the plane of the floor. This system was built for control, not for measurement; the sensor outputs were used to directly control real-time musical outputs, generated by a computer that interpreted the base-station data stream with an elaborate rule base. Dancers wore this highly instrumented shoe and the outputs of the sensors generated interactive music. It reached high acclaim in the dance community, and was recognized with the Discover Award for Technical Innovation in 2000 [34]. The research described in this paper sought to create a system to provide instrumented wireless gait analysis outside of traditional, expensive motion labs. Such a system has the potential to be highly informative by allowing data collection throughout the day in a variety of environments, thus providing a vast quantity of long-term data not obtainable with
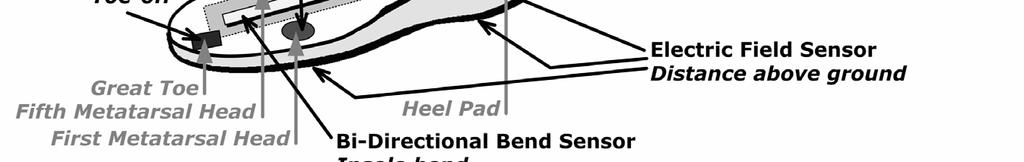
3 > PAPER IDENTIFICATION NUMBER: TITB < 3 current gait analysis systems. The GaitShoe system has been designed with components configured to minimally affect gait, and is readily fixed on typical athletic shoes. The GaitShoe was replete with sensors, with the goal of measuring more parameters than would otherwise be necessary for any one application, essentially providing a wearable podiatric laboratory. The power source was contained on-shoe, and wireless protocols were used to communicate between shoes and to transmit the data to a base-station; no cables of any sort were attached to either shoe. This research evaluated the system both in persons with normal gait, and in elders with Parkinson s disease (PD). The results were validated by comparison with data collected simultaneously by the system in use at the Massachusetts General Hospital Biomotion Laboratory. II. HARDWARE / SENSORS A. Sensor Selection The sensors used in the GaitShoe were selected with the goal of creating a highly instrumented system capable of sensing many parameters which characterize gait. The sensors are summarized in Table I; reference [35] contains details of the implementations. A block diagram of the GaitShoe components is shown in Figure I, and a schematic is shown in Figure II, with labels indicating relevant anatomical markers. For analysis of the dynamic motion of the foot, two dualaxis accelerometers and three gyroscopes were placed at the back of the shoe, oriented such that the individual sensing axes were aligned along three perpendicular axes, allowing measurement of linear acceleration and angular velocity in three dimensions; a device capable of all six measurements is called an inertial measurement unit (IMU). The dual axis accelerometer used was the ADXL202E, from Analog Devices [36]. The ADXL202E is a small, low-power, microelectro-mechanical system (MEMS) accelerometer, with fullscale range of ±2g. This type of accelerometer measures both dynamic and static acceleration, thus, the orientation of the accelerometer must be determined so that the static gravity contribution can be subtracted from the total output. The relative orientations between the accelerometers and between the accelerometers and the shoe were determined using the gravitational vector. This application used two types of gyroscopes: the Analog Devices MEMS-based ADXRS150 gyroscope [37] (an early demo version of the ADXRS150 was used; it has the same specifications as the version now available), and the Murata vibrating-reed-based ENC-03J gyroscope [38]. The relative orientations between the gyroscopes were not determined. To assess the timing parameters and pressure distribution, force sensitive resistors (FSRs) and polyvinylidene fluoride (PVDF) strips were placed under the foot. An FSR is a sensor whose electrical resistance decreases as the applied load increases. Two sizes of FSRs manufactured by Interlink Electronics were used [39]: two sensors with a diameter of 5 mm were placed underneath the heel pad, one medially and the other laterally, and two sensors with a diameter of 12.7 mm were placed under the first and fifth metatarsal heads (each subject s foot was palpated and inked, and the ink was transferred to paper; these markings were used to orient the location of the FSRs, and the PVDF strips, in the insole). The PVDF strips are piezoelectric sensors, and were configured to provide an output corresponding to dynamic pressure. Two PVDF strips, part LDT0 made by Measurement Specialties [40], were used to measure the dynamic force applied across the sensor, and were placed under the heel and the great toe. A bi-directional bend sensor was used to analyze flexion during gait. Two FLX-01 sensors, a uni-directional bend sensor manufactured by The Images Company [41], were placed back to back, and a differential amplifier was implemented to combine the individual outputs into a bidirectional bend output. One of the bend sensors was located at the back of the heel, and held next to the shin by an anklet to provide information about plantar flexion and dorsiflexion. The second bend sensor was located in the insole to measure the flexion at the metatarsal-phalangeal joint. An electric field sensor was developed during the latter part of the project, using an electric field imaging device (MC33794DH) manufactured by Motorola for occupant detection in automotive seat applications [42]. This sensor was added to investigate the utility of using a more direct method of measuring the height of the foot above the floor, via capacitive loading used in testing to measure the height of the heel above floor. B. Physical Implementation The hardware was designed to accommodate the sensors located beneath the foot, all of the electronics, including the sensors located at the back of the shoe, an antenna for the wireless transmission, and the power supply. These requirements resulted in the design of the GaitShoe system, as shown in Figure II. The GaitShoe system was comprised of two shoe modules and a base-station. Each shoe module consisted of an instrumented insole placed beneath the foot, and an attachment that mounted to the back of the shoe. The instrumented insoles contained the force sensitive resistors, the polyvinylidene fluoride strips, one bend sensor, and part of the electric field sensor; the other bend sensor was connected to the insole, but placed behind the shin and held in place with an ankle strap, and an additional part of the electric field sensor was placed underneath the shoe. A sample insole is shown in Figure III. The shoe attachments contained the IMU sensors, microcontroller (Silicon Labs C8051F206 [43]), wireless transceiver (RF Monolithics DR [44]), and antenna, power supply, and all of the required conditioning electronics; these were implemented on a stack of printed circuit boards attached at a right angle to the Power board, which contained voltage regulators and connections to a 9V battery [45]. The shoe attachments were designed such that the bulk of the volume was located behind the heel, so as to have a minimum effect on foot motion. The attachment was made from inch sheets of polyethylene terephthalate glycol (PTG), a thermoformable, machinable, and shatter-resistant material. A
4 > PAPER IDENTIFICATION NUMBER: TITB < 4 photo of the attachments and insoles on a pair of shoes are shown in Figure IV. The base-station consisted of a metal box, with an antenna mounted externally, containing the circuit board with the microcontroller and the power board, plus an additional board with a MAX233 serial line level converter chip. A BNC connector provided a method of input from the Massachusetts General Hospital (MGH) Biomotion Laboratory's (BML) equipment via an opto-isolated trigger connected to an input pin on the microcontroller to align the time-scales of the two individual systems. The microcontroller in the base-station looped through a simple time-division multiplexing routine: 1. Transit mode: Send hex byte 6C. 2. Receive mode: Listen for 1.7 ms. 3. Transit mode: Send hex byte E8. 4. Receive mode: Listen for 1.7 ms. The left shoe microcontroller looped through the following routine: 1. Sample data from all sensors. 2. Receive mode: Listen until hex byte 6C received. 3. Transit mode: Send data. The right shoe microcontroller followed the same overall routine as the left, but listened until hex byte E8 was received in step 2. Thus, each shoe collected analog data from the sensors while the other was sending, then waited for its personal code to transmit the data to the base-station. The outputs of the sensors were all normalized to a scale of 0 to 1 by the maximum 12-bit analog-to-digital converter (ADC) value (i.e. the uncalibrated outputs were divided by 4095). The receive line on the base-station was connected directly to the serial converter, resulting in immediate transmission of the data to the computer. Each shoe sent a full update every 13.4 ms, corresponding to a data transmission rate of approximately 75 Hz. III. SUBJECT TESTING OVERVIEW A. Testing Systems Volunteers were recruited for subject testing to collect data for the validation of the GaitShoe sensor data. The subject testing involved placing the GaitShoe instrumentation on the subjects' own walking shoes, with the insole inside the shoe and the shoe attachment mounted to the posterior aspect of each shoe. Every subject underwent simultaneous gait evaluation using the MGH BML Selspot II (Selective Electronics, Partille, Sweden) data acquisition system. The Selspot II serially sampled up to 64 infrared LEDs, arranged in arrays, at a rate of 152 Hz. The LED arrays were placed on eleven body segments (bilaterally: feet, shanks, thighs, arms; and, the pelvis, trunk, and head). The TRACK kinematic data analysis software package was used to generate photostereogrammetric reconstruction of the 3-D positions of the LEDs and to define the six degree of freedom kinematics of the arrays [46]. Within the 2 m x 2 m x 2 m viewing volume, this system is capable of accurately defining the 3D positions of each body segment to within 1 mm, and the three orientations to within 1 degree. In addition, two Kistler piezoelectric force plates (Kistler Instruments Type 9281A, Winterthur, Switzerland) were used to acquire ground reaction forces; this system has an accuracy of ±1% of full scale; as set in the MGH BML, this corresponds to ±10 N of vertical force, and ±5 N of shear force, for forces and frequencies encountered during gait (the unloaded force plate was recalibrated to a load of 0 N after each gait trial) [47], [48]. B. Subject Recruitment and Consent Each subject was asked to perform a series of locomotor tasks, while both gait evaluation systems simultaneously collected data. The gait parameters collected from the two systems were analyzed and compared to validate the analysis of gait parameters from the data acquired by the GaitShoe. The subjects with healthy gait were recruited by word of mouth comprised of a mixture of colleagues and students from the MIT and MGH communities. Subjects with Parkinson s disease were recruited by collaborating physicians of the MGH Department of Neurology, who performed initial screening of PD patients within their practice and described the research project to prospective subjects. Subjects who expressed interest and agreed to be contacted by the study coordinator were reached by phone at a later date. Subjects with PD were included for the purpose of acquiring data in a population with known fluctuating pathological gait dysfunction. As indicated in recent research, persons often perform gait at their best when being tested in a formal laboratory setting yet they and their family members report poor gait ability throughout their day when at home. This is particularly common among persons with PD. Persons with PD exhibited changes in muscle tone which influence (gait ability) throughout the day, not only as a result of the underlying disease but also from the medications that control the symptoms of Parkinsonian movement disorders. Therefore, this patient population should benefit from home gait evaluation, which can provide information about gait abnormalities present in everyday life that have not traditionally been captured in analyses carried out in motion laboratories [49]. For example, the GaitShoe could provide clinicians insight about changes in gait performance after titrating medication doses based on each individual patient s need. All subjects were adults who could understand and follow basic directions. Persons were excluded if they reported acute pain that prevented performance of their comfortable, typical movement. All persons with a unstable medical condition such as uncontrolled hypertension or diabetes mellitus were excluded from participation. Both the MGH Institutional Review Board (IRB) and the MIT Committee On the Use of Humans as Experimental Subjects (COUHES) approved the protocols for this study. The subjects all provided written consent in accordance with the MGH IRB and the MIT COUHES. Subject testing took place from the March 25, 2003 through June 6, 2003; the final eleven subjects (tested after April 15, 2003) additionally
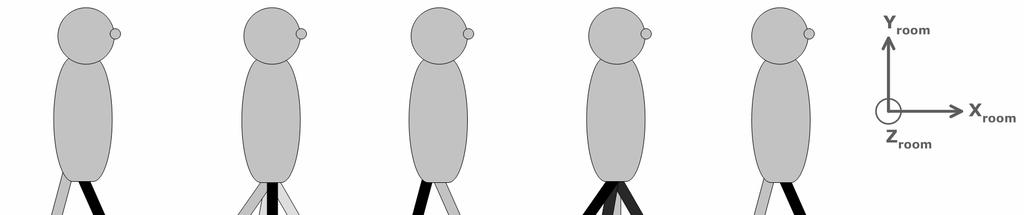
5 > PAPER IDENTIFICATION NUMBER: TITB < 5 signed the Health Insurance Portability and Accountability Act of 1996 (HIPAA) paperwork. C. Testing Protocol The subjects performed a series of locomotor tasks. Each subject first walked at his or her own self-selected natural pace for 2-4 trials, termed free gait. Next, a number of calibration routines were carried out, including a chair rise trial, wherein the subject stood from a seated position. Following the calibrations, another 2-4 trials of free gait were collected followed by 8 other trials of various walking activities not included in the presented analyses. A series of paced gait trials were then performed using a metronome set at 120 beats per minute. Collection from the BML system also included a static standing trial, with the subject standing still with the feet 30 cm apart. D. Participants Overview A total of sixteen subjects were recruited for the validation of the GaitShoe. For each group (subjects with healthy gait, or subjects with Parkinson s disease), gender, age, height, and weight are detailed in Table II. Data for individual gait trials were excluded in the event of wireless transmission problems resulting in a data collection rate from the GaitShoe lower than 50 Hz for each foot, rather than the usual 75 Hz. IV. SENSOR ANALYSIS AND CALIBRATION The full output from the bilaterally mounted GaitShoe sensors is shown in Figure V. The calibration and the analysis of the accelerometers, gyroscopes, and force sensitive resistors (FSRs) are presented in this paper; information on the bend sensors, polyvinylidene fluoride strips, electric field sensors, as well as a recently developed ultrasound sensor for determining the distance and orientation between the feet, are available in [35]. The gait cycle is illustrated in Figure VI. The FSRs were analyzed to determine initial estimates of heelstrike and toe-off timing, the z-gyroscope was analyzed to determine pitch, the x- and y-accelerometers were analyzed to determine stride length, and information from the gyroscopes and accelerometers were used to finalize the heel-strike and toe-off timing results. As compared to the existing systems described above the GaitShoe, with its fifteen continuous outputs per foot, is closest in scope to the Expressive Footware, which had sixteen continuous (uncalibrated) outputs. Indeed, one of the main contributions of the GaitShoe is the congregation of so many calibrated sensors. The system described by Pappas et al [10], [11] also measures multiple parameters, using one gyroscope in conjunction with three FSRs to determine gait phase. At this time, the commercial systems described are not able to measure a broad variety of parameters, but instead fall exclusively into force-sensing or motion-sensing, and have only limited real-time wireless data analysis capability. A. Analysis Model The two coordinate systems used for analysis of the data are shown in Figure VII. The first coordinate system corresponds to the global reference frame of the room, and the second corresponds to the local body frame, where the sensors are located and collect their measurements. Determination of room-based parameters such as orientation or position requires a transformation to the global reference frame. For very simple motions, this transformation is straightforward. For example, a simple rotation about a single gyroscope axis is transformed to an angle of orientation within the fixed reference frame by integrating the corresponding gyroscope signal. Similarly a simple translation consisting only of motion along a single acceleration axis is transformed to a displacement within the fixed reference frame by double integration of the corresponding accelerometer signal. The initial analysis of the GaitShoe sensor output presented here was simplified by assuming that the data collected involved linear motion in the X GS -Y GS plane only (no translation in Z GS ), and rotation about the Z GS axis only (the X GS -Y GS plane remained parallel to the X room -Y room plane). In other words, it was assumed that motion involved only changes in a single plane, as drawn in Figure VI. The subject testing involved collecting data during walking, with the subject walking in a straight line only. Figure VIII shows the outputs of the three gyroscopes and three accelerometers from one of the gait trials during subject testing. Though there is acceleration in Z GS, the magnitude is smaller than the accelerations measured in X GS and Y GS. In this sample, the standard deviation of the acceleration in Z GS is 2.2 m/s 2, compared to greater than 5 m/s 2 in X GS and Y GS, and the spread between the largest positive and largest negative acceleration in Z GS is 20 m/s 2, compared to greater than 45 m/s 2 in X GS and Y GS ; thus, the accelerations in X GS and Y GS are at least double those in Z GS. Similarly, the angular velocity about Z GS, is larger in magnitude than the angular velocities measured about X GS and Y GS. In this sample, the standard deviation of the angular velocity about Z GS is /s, compared to less than 35 /s about X GS and Y GS, and the spread between the largest positive and largest negative angular velocity about Z GS is /s, compared to less than 270 /s in X GS and Y GS ; thus, the angular velocities about X GS and Y GS are less than a third of the angular velocity about Z GS. Thus, these were reasonable assumptions for an initial analysis of the GaitShoe system, without requiring the complex mathematics necessary to represent true 3D motion. The motion analysis consisted of integrating the output of the z-gyroscope to obtain the pitch of the foot about Z room, and transformation of the single and double integration of the output of the x- and y-accelerometers to obtain the velocity and displacement along the X room direction. B. Force Sensitive Resistors The force sensitive resistors (FSRs) were calibrated, the calibrated outputs for all four FSRs in each shoe were added together, and the sum, FSRsum was used in determining heel-strike and toe-off timing. 1) Calibration The output of the FSRs is non-linear, due in part to the choice of conditioning electronics. Also, over time and with
6 > PAPER IDENTIFICATION NUMBER: TITB < 6 use, the adhesive layer in the FSRs may break down and contribute to an increased non-linearity. The FSRs were characterized through the application of a series of forces to several devices. The tests were carried out using a TA-XT Texture Analyser from Stable Micro Systems, with both a 5 kg and a 30 kg load cell, and a curve was fit to the calibration data (a third-order polynomial in an exponential was empirically found to provide a good fit to the data). The relationship between the scaled FSR-402 output, V F402, and the applied force in N, F, is described by: 3 2 { 8.7 V F V F V F F = 9.8 e }, (1) and the relationship between the FSR-400 output, V F400, and the applied force in N, F, is described by: 3 2 { 10.5 V F V F V F F = 9.8 e }. (2) The 95% confidence interval of the curve-fit for the FSR- 402 was N and for the FSR-400 was N. This error is rather large, and is likely due at least in part to the nonlinearity of the FSR response. Different conditioning electronics that would result in a more linear FSR response, such as using the FSR at the input to a current-to-voltage converter, should be implemented before using the FSRs for numerical analysis of the force distribution. In the analysis for this work, the FSRs were calibrated and summed together for use in determining heel-strike and toe-off timing. 2) Analysis The primary use of the calibrated FSR data was to determine initial values of heel-strike and toe-off timing. These initial values were then used to set the integration bounds used to calculate the pitch and stride length. The four FSRs were coarsely distributed underneath the foot, with two underneath the heel, medially and laterally, one underneath the first metatarsal head, and one underneath the fifth metatarsal head. Though this cannot provide a complete picture of the force distribution underneath the foot, the information provided is sufficient to estimate heel strike and toe off times. The individual calibrated FSR outputs (with units of force [N]), the sum of the four calibrated FSR outputs, and the BML force plate output (normalized by the subject s bodyweight) are shown in Figure IX. The FSRs only cover a small percentage of the total weight-bearing area underneath the foot; as such, they only measure a portion of the total force. Thus the shape of the summed FSR output in the middle graph is different than the bottom graph of the force plate measurement, because the summed FSR output is subsumed by the total force output. This does not render the FSR measurements useless: on the contrary, the shape of the FSRsum is similar across the three steps shown, however, there were substantial differences in the weight distribution between the first and fifth metatarsal heads. In the first step shown, more weight is on the fifth metatarsal, while in the second step, more weight is on the first metatarsal, and in the third step, the weight is distributed fairly evenly across the first and fifth metatarsal heads. This information cannot be obtained from a standard force plate, and the use of conditioning electronics that provide a more linear output and improved calibration should provide better quality FSR measurements capable of providing valuable information about the insole force distribution during gait. In the BML, timing of heel-strike and toe-off are determined by examining the force plate output; when it first crosses a certain threshold, that time point is identified as heelstrike, and when it re-crosses that threshold, that time point is identified as toe-off. This general approach was adopted for deriving the heel-strike and toe-off times from the FSRsum, as demonstrated in Figure X. A spline was fit to the FSRsum with time points every 1 msec to improve the time resolution (using spline.m, a standard MATLAB function), and the first difference of the spline-fit to FSRsum, D FSRsum_splinefit, was calculated. The local maximum and minimum extrema of D FSRsum_splinefit, corresponding to rapid loading and unloading occurring at heel-strike and toe-off, respectively, were determined. The time for heel-strike was set at the first D FSRsum_splinefit time point before the local maximum greater than kg was met, and the time for toe-off was set at the first D FSRsum_splinefit time point after the local minimum, respectively less than kg; these conditions were set after inspection of many gait trials. Future work with the GaitShoe will more fully investigate the loading profile of the FSRs. C. Gyroscopes 1) Calibration For the gyroscopes, two types of information were required: the zero offset, which corresponds to 0 /s; and, the sensitivity, to convert the normalized output to units of /s (IMU output units were normalized to between 0 and 1). The zero offset of the gyroscopes was simply the output of the gyro when the hardware was at rest. The sensitivity of the gyroscopes was determined by rotating each gyroscope about its sensitive axis, through a range of constant angular velocities. Data were collected for 20 to 30 seconds each at several discrete angular velocities, and the clipped means (the mean of the data with the top and bottom 10% of data removed) were calculated for each set of data. A line was fit to the clipped mean data points and the zero offset value; the sensitivity of the sensor is the slope of the fit line. The results for the gyroscopes on the two IMU boards used in testing are summarized in Table III, including the coefficient of correlation for the line-fit. 2) Analysis The pitch of the foot, Θ(t), was determined by integrating the z-gyroscope output. The sign of the pitch follows the convention used at the MGH Biomotion Lab (BML), where a positive rotation about the z-axis corresponds to a rotation from the y-axis to the x-axis. The z-gyroscope output was integrated over single strides, with the integration bounds determined from the initial estimates of heel-strike and toe-off. The midpoints between the heel-strike and toe-off times were calculated and used as the bounds of integration; these midpoints occurred during the stance phase when the subject s foot was flat on the floor, so the initial value of the pitch was set to 0. To compensate for drift in the gyroscope output, an iterative method of integrating the z-gyroscope output was developed. The z-gyroscope data were integrated using trapezoidal
7 > PAPER IDENTIFICATION NUMBER: TITB < 7 integration, and the final value after each integration over a single step was compared to an end-limit value, defined as 0.1% of the full-scale across all initial integrations. For a given step, if the final value had a magnitude greater than the end-limit, a small nudge value was added to the calibrated z- gyroscope data between these integration bounds. The magnitude of the nudge value was equal to the difference between the end-limit and the final value after integration, and the sign of the nudge value was opposite from the sign of the final value after integration. This process was repeated until the final value was within the end-limit, and the results are shown in Figure XI, for data collected from a left foot (here, the full-scale is approximately -50 to +60, so the end-limit value would be 0.1% of 110, or approximately 0.11 ). The pitch data collected by the BML for this trial are also plotted in Figure XI. To validate the GaitShoe pitch data, two methods were used: direct comparison of the maximum and minimum values (and the corresponding time-points) for each stride, and the root mean square error (RMS error) between the two curves. For comparison of the extremum values, each minimum and maximum of the calculated pitch were located, and a spline was fit to the pitch data over nine points, with the measured extrema at the center (this corresponds to approximately 0.1 sec of data; again using spline.m in MATLAB). The spline was fit with time points every 3.34 msec, and the new extrema and corresponding time point were determined. The values for the GaitShoe extremum and the BML extremum shown in Figure XI are summarized in Table IV, along with the results from the data collected from the corresponding right foot in the same trial. To calculate the RMS error between the GaitShoe pitch and the BML pitch, a spline was fit to the GaitShoe pitch at time points corresponding to the time points of the BML data (the BML data rate is 152 Hz). The RMS error calculated between the two curves shown in Figure XI was 3.4. D. Accelerometers 1) Calibration Three types of information about the accelerometers were required: the zero offset, which corresponds to 0 m/s 2 ; the sensitivity, to convert the normalized output to units of m/s 2 (IMU output units were normalized to between 0 and 1); and the orientation of the accelerometers relative to the foot, to interpret the sensor output accurately. Determining the sensitivity of the accelerometers was very straightforward, by using gravity. Naturally, the gravitational acceleration vector, g, is stable, accurate, and readily available. By rotating the sensor such that the axis of interest was orthogonal to the earth s surface, and then rotating the sensor 180, measurements of +1g and 1g were easily obtained. The positioning of the accelerometers with respect to the gravity vector was done by hand. The hardware was slowly rotated about each of the three axes; this allowed each accelerometer to sweep through the gravitational acceleration vector, g, twice. The rotations were carried out at seven different times throughout subject testing, and the resulting data were lowpass filtered, with second-order Butterworth coefficients and a low-pass cutoff frequency of 2 Hz (the sampling frequency was 75 Hz). The rotation by hand was performed slowly (to minimize centripetal acceleration), with the goal of keeping the rotation at a constant speed, as the goal was to measure only gravitational acceleration. The filtering was used to remove any small acceleration changes resulting from hand jitter. The outputs corresponding to +1g and 1g for each calibration were determined by finding the maximum and minimum values of each output. The sensitivity was set to the slope of the line between the mean of all +1g outputs and the mean of all 1g outputs, and the zero offset was set as the midpoint between the means of the +1g and the 1g outputs; the results are summarized in Table V, including the standard deviations of the +1g and the 1g outputs. Determining the orientation of each accelerometer in space was critical because the acceleration due to gravity must be correctly subtracted from the total acceleration signal during the analysis of gait data. This type of accelerometer measures both dynamic acceleration (resulting from shock, vibration, linear motion, or other types of motion), and static acceleration (resulting from gravity). Thus, the gravity contribution must be subtracted from the total output. As described above, the pitch orientation of the foot was determined by integrating the angular velocity about the z- axis. The pitch orientation of the accelerometer was determined by the sum of the pitch and the angle of inclination of the accelerometer with respect to the foot. The angle of inclination of the accelerometer with respect to the foot is different for each subject, as the size and shape of shoe influence the orientation of the GaitShoe attachment on the shoe. When a subject stands still, with both feet flat on the floor (corresponding to a pitch of 0 ), each accelerometer measures only the fraction of gravitational acceleration along its sensitive axis. The angle of inclination of the x- accelerometer, α x, can be determined as described by: v A α x x = arcsin, (3) v g where A x is the acceleration measured by the x-accelerometer with the foot flat on the floor. The angle of inclination of the y-accelerometer, α y, can be similarly determined; the difference between these two angles provides the relative orientation between the x- and y-accelerometers in the x-y plane. 2) Analysis Velocity and stride length were determined by single- and double-integration, respectively, of the dynamic acceleration along the X room axis, using the output of the x- and y- accelerometers. The accelerometers were fixed to the back of the shoe via the GaitShoe hardware, and their orientation with respect to the room and the gravity vector changed as the subject walked. The acceleration measured by each accelerometer can be resolved into two components, corresponding to the dynamic acceleration from foot motion, and the static acceleration due to gravity, i.e. AX-GS dynamic, and AX-GS static. To calculate the contribution of AX-GS static component, the orientation of the x-
8 > PAPER IDENTIFICATION NUMBER: TITB < 8 accelerometer with respect to the room, Φ x, must be determined. At time point t i, Φ x (t i ) was calculated from the sum of the pitch of the foot at the same time point, Θ(t i ), and the angle of inclination of the x-accelerometer, α x, as follows: Φ x( ti) = α x + Θ( ti ). (4) The linear acceleration measured by the x-accelerometer at time point t i, AX-GS dynamic (t i ), was calculated by subtracting the contribution of gravity from the total acceleration: v v v AX GS ( ti ) = Ax ( ti ) g sin Φ x ( ti ). (5) dynamic The dynamic acceleration measured by the y-accelerometer is determined using the same method, but substituting the appropriate y-variables. The total acceleration vector experienced by the foot, AFOOT, can be resolved into two components corresponding the reference frame of the room, AX-ROOM dynamic and AY- ROOM dynamic, which contribute the dynamic components measured by the x- and y-accelerometers, as described above, and as shown in Figure XII. To determine the actual dynamic acceleration along X room, the axis of interest for the velocity and the displacement calculations, the outputs of the x- accelerometer and the y-accelerometer were combined as follows: v v v AX GS sin Φ y AY GS sin Φ x. (6) A X ROOM dynamic = dynamic cos Φ sin Φ x y dynamic cos Φ sin Φ AX-ROOM dynamic was integrated twice: a single trapezoidal integration determined the stride velocity, and a subsequent trapezoidal integration determined the stride length. To determine the integration bounds the z-gyroscope integration bounds were used as starting points, with the the characteristics of AX-GS dynamic used to finalize the bounds. The lower integration bound was determined by starting at the first quarter-point between a pair of z-gyroscope integration bounds, and stepping back in time toward the first z-gyroscope integration bound until the magnitude of AX-GS dynamic was less than 0.2 m/s 2. If no value met this condition, the lower bound was set at the time point between the first z-gyroscope integration bound and the first quarter-point where the magnitude of AX-GS dynamic was a local minimum. Similarly, the upper integration bound was determined by stepping forward in time from the midpoint between two subsequent z- gyroscope integration bounds toward the second z-gyroscope integration bound until AX-GS dynamic had either a magnitude less than 0.2 m/s 2 or a value greater than 0 m/s 2. The latter condition was for the instances where a large positive acceleration was detected. This condition, most likely corresponds to a strong heel-strike, so it is appropriate to cease integration, since the stride is completed upon heel-strike. If neither of these conditions were met, the upper bound was set at the time point between the second z-gyroscope integration bound and ten points prior where the magnitude of AX-GS dynamic was a local minimum. The results of the integrations are shown in Figure XIII, with the lower and upper integration bounds indicated on the AX-ROOM dynamic plot. The displacement data collected by the BML for this trial is also plotted. The BML displacement has y x a different 0 m origin than the GaitShoe, so it was shifted to align with the GaitShoe results at a time point during stance (here, at approximately 0.8 sec). To validate the GaitShoe stride length data, two methods were used: direct comparison of the stride lengths for each stride, and the root mean square error (RMS error) between the two curves. In the example shown in Figure XIII, the stride length from the BML displacement data was 1.33 m, and from the GaitShoe was 1.31 m. A spline was fit to the GaitShoe displacement at time points corresponding to the time points of the BML data to calculate the RMS error between the GaitShoe displacement and the BML displacement. The RMS error calculated between the two curves shown in Figure XIII was 10.3 cm. E. Heel-Strike and Toe-Off Timing Timing of heel-strike and toe-off were determined using several of the GaitShoe sensors. Initial values for each were estimated using the sum of the four FSRs, FSRsum, as described above. These initial values were used to determine the integration bounds for the z-gyroscope. The heel-strike times were reevaluated using the accelerometer integration bounds, and the toe-off times were determined from the pitch. As described above, the upper integration bound for the x- accelerometer was set when the magnitude of AX-GS dynamic was either less than 0.2 m/s 2 or greater than 0 m/s 2. This second condition was expected to correspond to an especially strong heel-strike. Each of the upper integration bounds were investigated, and if the bound corresponded to a positive spike in the AX-GS dynamic output, the time point replaced the heelstrike time as initially determined using FSRsum; otherwise, the FSRsum heel-strike time was used. These heel-strike times were validated by comparison to the times of heel-strike obtained from the BML analysis of the force plate data. The final toe-off times were determined by the maximum pitch, which occurs at toe-off: normally, as the foot rolls off the floor, the pitch increases, and once the toe is off the ground, a rapid acceleration at the start of leg-swing occurs, and results in a decrease in the pitch. The local maximums of the pitch, and the corresponding times, were determined as described above. These toe-off times were validated by comparison to the times of toe-off obtained from the BML analysis of the force plate data. Figure XIV shows the AX-GS dynamic and pitch curves (for the same gait trial as shown in Figure X), along with the GaitShoe identified heel-strike and toe-off times and the BML identified heel-strike and toe-off times. V. RESULTS The pitch, displacement, and heel-strike and toe-off timing as analyzed by the GaitShoe system were compared to data collected simultaneously by the Massachusetts General Hospital Biomotion Laboratory (BML). Testing of the fifteen subjects resulted in 270 total trials of gait. The RMS error between the pitch and displacement curves was calculated, and the local maximums and minimums of the pitch, the stride length, the heel-strike time, and the toe-off time for individual
9 > PAPER IDENTIFICATION NUMBER: TITB < 9 strides were compared directly. The GaitShoe pitch, stride length, and vertical displacement results for all of these trials were compared to the data collected simultaneously from the BML (some trials had multiple strides available for comparison). The BML heel-strike and toe-off times were determined by a physical therapist by computer-aided inspection of the BML force plate data; for each subject, approximately three heel-strike times and three toe-off times of each times were determined for each foot, for a total of 86 comparisons. The GaitShoe and BML data were analyzed for outlier data, and the BML data were checked for errors due to array slippage, and these data points were removed; in addition, the GaitShoe wireless protocol occasionally failed to receive a packet because of interference (see [35]). These causes resulted in small gaps in the data from both systems. Comparisons were excluded if there were more than 10 individual gaps in the compared BML or GaitShoe data. All direct comparisons are the value of the GaitShoe parameter minus the value of the BML parameter. Finally, the GaitShoe results used in this validation study were sorted into healthy gait and Parkinsonian gait groups. The means and standard deviations of the pitch extrema, stride length, and heel strike and toe off timing results were calculated for each group. A. RMS Comparison of Curves The mean RMS error between the GaitShoe pitch and the BML pitch was 5.2 ± 2.0º, calculated over 195 samples; a histogram of the results is shown in Figure XV. The mean RMS error between the GaitShoe displacement and the BML displacement, calculated over 303 samples, was 8.5 ± 5.5 cm; a histogram of the results is shown in Figure XVI. B. Direct Comparison of Peak Changes The mean difference between the GaitShoe pitch extrema and the BML pitch extrema was -0.7 ± 6.6º, and the mean percentage change was 15.6 ± 18.4%, calculated over 1132 samples. The corresponding mean difference between the time points of the extrema was ± 24.2 ms. Histograms of the results are shown in Figure XVII. The Pearson s correlation between the pitch extrema was 0.992, and the Pearson s correlation between the time points of the extrema was The mean difference between the GaitShoe stride length and the BML stride length was 7.4 ± 13.6 cm, and the mean percent change was 6.5 ± 11.7%, calculated over 315 samples. Histograms of the results are shown in Figure XVIII. The Pearson s correlation between the stride lengths was The mean difference between the GaitShoe heel-strike and the BML heel-strike times was -6.7 ± 22.9 ms, over 77 samples. The mean difference between the GaitShoe toe-off and the BML toe-off times was -2.9 ± 16.9 ms, over 75 samples. Histograms of the results are shown in Figure XIX. The Pearson s correlation between the heel-strike times was 0.999, and the Pearson s correlation between the toe-off times was C. Comparison of Healthy Gait and Parkinsonian Gait The means and standard deviation across the health gait and Parkinsonian gait groups for each of the validation results are summarized in Table VI. For pitch extrema, the normal range is much larger than that of the Parkinsonian range, with a mean 14.5 beyond for maximum pitch, and a mean 7.5 beyond for minimum pitch. Correspondingly, the normal stride length is a mean 0.26 m longer than the Parkinsonian stride length. Though the stride time of the normal subjects is shorter by 0.15 s, the percentage of the stride spent in stance (see Figure VI) is nearly equivalent, with the normal subjects spending only 2.2% less time in stance. VI. DISCUSSION The development of the GaitShoe has resulted in a wireless wearable system with an unprecedented number of sensors designed to capture information that can characterize gait of both feet. The system costs under $500 per foot in prototype quantities and the hardware for a single shoe weighs under 300 g. The hardware is readily fixed to a variety of typical walking shoes, and data can be collected continuously over a few hours. Linear velocity and stride length were obtained respectively from single- and double-integration, with respect to time, of the acceleration component corresponding to forward motion of the foot, and displacements and velocities in the other two axes can be similarly acquired. The gyroscopes provide information about the rotational velocity of the foot, which can similarly be integrated once with respect to time to provide the angle. While use of only four force sensitive resistors does not provide a full picture of the force distribution beneath the foot, the number is sufficient to provide a general picture of medial vs. lateral force, and heel vs. metatarsal force. The comparison of heel force vs. metatarsal force was used in determining stance time, as well as heel-strike and toe-off timing. The validation results indicate that the GaitShoe can be further developed into a true wearable podiatric laboratory, which could be of great use in evaluating gait over longer periods of time than are available in motion laboratories, as well as allowing the evaluation to be carried out in a natural environment, such as the subject s home. It would also allow the evaluation of subjects who are without access to a motion laboratory. The simplified kinematic analysis of the foot motion, using only the x- and y- accelerometers and the z-gyroscope, resulted in reasonable estimations of the pitch and stride length. The GaitShoe pitch had an RMS error of 5.2º, and the GaitShoe pitch extrema had a standard deviation from the BML of 6.6º, and was well-correlated, with a Pearson s correlation of The GaitShoe stride length had a standard deviation from the BML of 13.6 cm, and a Pearson s correlation of 0.841, with an RMS error of 8.5 cm. The most significant contribution to these errors is likely to be from the z-gyroscope. The pitch, which is determined by
10 > PAPER IDENTIFICATION NUMBER: TITB < 10 integrating the z-gyroscope output, is used to both subtract the gravitational component of the acceleration, as well as to determine the dynamic component of the acceleration along the XROOM coordinate from the x- and y- accelerometers. Thus, small errors in pitch have a compounded effect on the calculations of stride length, and reducing the standard deviation of the GaitShoe pitch measurement is likely result in improved GaitShoe stride length calculations. In addition, the standard deviation between the time points of the GaitShoe extrema and the BML extrema was 24.2 ms, with a Pearson s correlation of Thus, decreasing the time deviation in the pitch will likely also improve the stride length results. An additional contribution to these errors is likely due to the simplified kinematic model, which assumed all the motion of the foot was in a single plane, and that the x- and y- accelerometers were positioned entirely within that single plane. Foot motion during gait is a complex motion, and certainly has accelerations and rotations outside of a single plane. In addition, it is unlikely that the orientation of the x- and y- accelerometers were positioned entirely in a plane orthogonal to X room and Y room. Thus, acceleration along the Z room axis would have been measured by the x- and y- accelerometers, but not accounted for, and, the true orientation of the accelerometers with respect to the horizontal would be slightly different, resulting in a slightly incorrect calculation of the gravitational acceleration. To account for these errors, future work will involve three areas of further research. First, all six IMU measurements will be incorporated to cover the three perpendicular axes of angular velocity and acceleration. This will eliminate errors introduced by the simplified kinematic model used in this initial work. Second, a hardware change will implement the Analog Devices gyroscope to measure rotation about the z- axis (and y-axis), rather than the Murata gyroscope. The Analog Devices gyroscope has two vibrating structures operating in anti-phase to reduce common mode signals unrelated to angular velocity (such as external shocks or vibrations); this alone will likely improve the pitch calculation. Finally, additional FSRs will be added to the insole to improve determination of heel strike and toe off times, and the conditioning electronics for the FSRs will be changed. Though the inherent drift of the accelerometers and gyroscopes induce additional errors, gait analysis has the advantage that the integration is only carried out over a short time scale (under 0.5 s, typically). The accuracy of the integration limits can be improved by better force sensing underneath the foot to better determine when the foot transitions in and out of the phase where it is flat on the floor. The conditioning electronics used had a highly non-linear response; different methods of conditioning the FSR output will be investigated to find a response with improved linearity. Even with only four FSRs, the multi-sensor GaitShoe determination of heel-strike and toe-off was highly successful, as compared to the BML heel-strike and toe-off time. Though the standard deviation of the heel-strike time was 22.9 ms, the Pearson s correlation was 0.999, and, similarly, though the standard deviation of the toe-off time was 16.9 ms, the Pearson s correlation was The determination of the GaitShoe toe-off time used the calculated pitch, so, again, improvement of the pitch will likely propagate through to improve the standard deviation of the toe-off time. The heelstrike time used either the presence of a spike in the x- accelerometer, or, if no spike was present, used a threshold of the first difference of a spline fit to the FSRsum. Better calibration of the FSRsum, resulting in an objectively determined threshold, would likely improve this component of determining heel-strike; if so, placing FSRs underneath the great toe may be able to contribute to the determination of the toe-off time. Finally, increasing the data transfer rate of the GaitShoe from 75 Hz would eliminate the need to fit a spline to the FSRsum data, and may also improve the accelerometer and gyroscope data as well. Placement of additional IMU boards on the shins of the subject could provide useful information about the relative orientation between the foot and the shin, as well as providing information about the orientation of the shin. The validation results were also investigated for differences between the group of subjects with normal gait and the group of subjects with Parkinson s disease. The mean pitch extrema Additional work with the GaitShoe sensor outputs has involved application of standard pattern recognition techniques to discriminate between healthy gait and Parkinsonian gait, as well as to discriminate between individuals [35], [50] and real-time analysis of the data to provide therapeutic musical feedback to investigate interactive applications in physical therapy [35], [51]. VII. CONCLUSIONS AND FUTURE WORK These initial results demonstrate that the GaitShoe may be an important research tool, capable of enabling the analysis of gait in untraditional ways, such as over long periods of time and in the home environment or through use of pattern recognition, and can provide real-time feedback for use in applications such as sports medicine, electro-stimulation, or physical therapy. Future work to improve the GaitShoe will focus on extending the IMU analysis to utilize the full 6 DOF, and on improving the wireless transmission. For the IMU analysis, calibration routines to determine the actual orientation of each of the axes of the accelerometers and gyroscopes will be implemented, and a routine such as Kalman filtering will be used to analyze the data. In addition, a redesign using three ADXRS150 gyroscopes may be considered, to improve the accuracy of the angular velocity measurements. New strategies for wireless transmission will be investigated, both new devices (such as Bluetooth chips) that have become recently available, as well as alternate locations for the antennae, to reduce interference from the human body. For experiments that do not require real-time data analysis, onboard data storage will be considered. The research involving therapeutic musical feedback is ongoing, particularly for patients with Parkinsonian gait. Other future applications include placing IMUs on additional body locations, such as the shin and thigh, as well as the upper
11 > PAPER IDENTIFICATION NUMBER: TITB < 11 body, to generate more information about the motion of the subject. In addition, the equipment developed for the GaitShoe has a potential benefit for areas of research, such as ergonomics, that would benefit from real-time analysis of motion but do not have ready access to traditional motion analysis equipment. ACKNOWLEDGMENTS The authors thank their colleagues the MGH Biomotion Laboratory and the MIT Media Lab, and thank John Memishian at Analog Devices for generously providing samples of the demo version of the ADXRS150 gyroscope. We are grateful to the volunteers for the subject testing, and thank them for their generous contribution. REFERENCES [1] Zhu HS, Maalej N, Webster JG, Tompkins WJ, Bach-Y-Rita P, Wertsch JJ, An umbilical data-acquisition system for measuring pressures between the foot and shoe, IEEE Trans Biomed Eng, 37(9): , Sept [2] Zhu HS, Wertsch JJ, Harris GF, Loftsgaarden JD, Price MB, Foot pressure distribution during walking and shuffling, Arch Phys Med Rehabil, 72(6): 390-7, May [3] Zhu HS, Wertsch JJ, Harris GF, Alba HM, Price MB, Sensate and insensate in-shoe plantar pressures, Arch Phys Med Rehabil, 74(12): , Dec [4] Hausdorff JM, Ladin Z, Wei JY, Footswitch system for measurement of the temporal parameters of gait, J Biomech, 28(3): , Mar [5] Hausdorff JM, Zemany L, Peng C.-K., Goldberger AL, Maturation of gait dynamics: stride-to-stride variability and its temporal organization in children, J Appl Physiol, 86(3): , Mar [6] Hausdorff JM, Rios DA, Edelberg HK, Gait variability and fall risk in community-living older adults: a 1-year prospective study, Arch Phys Med Rehabil, 82(8): , Aug [7] Hausdorff, JM, Purdon PL, Peng C.-K, Ladin Z, Wei J-Y, Goldberger AL, Fractal dynamics of human gait: stability of long-range correlations in stride interval fluctuations, J. Appl. Physiol, 80: , [8] Morley RE Jr, Richter EJ, Klaesner JW, Maluf KS, Mueller MJ, Inshoe multisensory data acquisition system, IEEE Trans Biomed Eng, 48(7): , Jul [9] Maluf KS, Morley RE Jr, Richter EJ, Klaesner JW, Mueller MJ, Monitoring in-shoe plantar pressures, temperature, and humidity: reliability and validity of measures from a portable device, Arch Phys Med Rehabil, 82(8): , Aug [10] Pappas IP, Popovic MR, Keller T, Dietz, Morari M, A reliable gait phase detection system, IEEE Trans Neural Syst Rehabil Eng, 9(2): , Jun [11] Pappas IP, Keller T, Mangold S, A Reliable, Gyroscope based Gait Phase Detection Sensor Embedded in a Shoe Insole, presented at the 2002 IEEE International Conference on Sensors, Orlando, FL. [12] Cutlip RG, Mancinelli C, Huber F, DiPasquale J, Evaluation of an instrumented walkway for measurement of the kinematic parameters of gait, Gait Posture, 12(2): 134-8, Oct [13] Giacomozzi C, Macellari V, Piezo-dynamometric platform for a more complete analysis of foot-to-floor interaction, IEEE Trans Rehabil Eng, 5(4): , Dec [14] Kidd CD, Orr R, Abowd GD, Atkeson CG, Essa IA, MacIntyre B, Mynatt E, Starner TE, Newstetter W, The Aware Home: A living laboratory for ubiquitous computing research, in Proceedings of CoBuild '99: Second International Conference on Cooperative Buildings: [15] Suutala J, Pirttikangas S, Riekki J, Röning J, Reject-optional LVQbased two-level classifier to improve reliability in footstep identification, 2004 Conference on Pervasive Computing. [16] See [17] Yam CY, Nixon MS, Carter JN, Automated person recognition by walking and running via model-based approaches, Pattern recognition, 37(Part 5): , [18] MIT AI Human ID Results [Online]. Available: [19] Johnson AY, Sun J, Bobick AF, Predicting large population data cumulative match characteristic performance from small population data, in the 4th International Conference on Audio- and Video-Based Biometric Person Authentication, Guildford, UK, June 9-11, [20] Walk the Walk: Gait Recognition Technology Could Identify Humans at a Distance, Georgia Tech Research News [Online]. Available: [21] The Miburi performance system, Yamaha Corporation, 1996 [Online]. Available: [22] See [23] The Leader in Smart Technologies for Health, Fitness and Beyond: Technology FAQ s, Acceleron Technologies [Online]. Available: [24] See [25] See [26] See [27] Marriott M, The Bionic Running Shoe. The New York Times, May 6, [28] See [29] Choi I, Ricci C, Foot-mounted gesture detection and its application in virtual environments, IEEE International Conference on Systems, Man, and Cybernetics, Computational Cybernetics and Simulation, 5(12-15): , Oct [30] F-Scan System Features, Tekscan, Inc., 2004 [Online]. Available: [31] See [32] See [33] Paradiso JA, Hsiao K, Benbasat AY, Teegarden Z, Design and implementation of expressive footware, IBM systems journal, 39 (3): , [34] D Agnese J, The 11th annual Discover awards, Discover, 21(7):89-112, [35] Morris SJ, A Shoe-Integrated Sensor System for Wireless Gait Analysis and Real-Time Therapeutic Feedback, Sc.D. dissertation, Harvard/MIT Division of Health Sciences and Technology, Cambridge, MA, June [36] ADXL202E Data Sheet, Rev A, Analog Devices, Inc., 2000 [Online]. Available: 2_10_b.pdf [37] ADXRS150 Data Sheet, Rev A, Analog Devices, Inc., 2003 [Online]. Available: 150_B.pdf [38] ENC-03J Specifications, Murata [Online]. Available: mtmp=enc-03j&slang=2&snhnm=enc-03j&shntyp=old [39] FSR integration guide and evaluation parts catalog, with suggested electrical interfaces, Interlink Electronics [Online]. Available: [40] Piezo Film Sensors Technical Manual, Measurement Specialties [Online]. Available: [41] FLX-01 Specifications, Images Co. [Online]. Available: [42] MC33794 ata sheet, Rev 6.0, Motorola, Inc., Feb 2003 [Online]. Available: [43] C8051F* Data Sheet, Silicon Laboratories [Online]. Available: [44] DR Data Sheet, RF Monolithics, Inc., [Online]. Available [45] Benbasat AY, Morris SJ, Paradiso JA, A wireless modular sensor architecture and its application in on-shoe gait analysis, proc. of the IEEE International Conference on Sensors, p , Oct [46] Antonnson EK, A three-dimensional kinematic acquisition and intersegmental dynamic analysis system for human motion, Ph.D. dissertion, Department of Mechanical Engineering, MIT, 1982.
12 > PAPER IDENTIFICATION NUMBER: TITB < 12 [47] Riley PO, Mann RW, Hodge WA, Modelling of the biomechanics of posture and balance, J. Biomech, 23(5): 503-6, [48] Riley PO, Schenkman ML, Mann RW, Hodge WA, Mechanics of a constrained chair-rise, J Biomech, 24(1): 77-85, [49] Morris ME, Huxham F, McGinley J, Dodd K, Iansek R, The biomechanics and motor control of gait in Parkinson disease, Clin Biomech, 16(6): , Jul [50] Bamberg, SJM, Picard R, Paradiso JA, Pattern recognition of normal and healthy gait using an on-shoe measurement system. To be submitted to Gait & Posture. [51] Paradiso JA, Morris SJ, Benbasat AY, Asmussen E. Interactive Therapy with Instru-mented Footwear. Proceedings of CHI 2004, April 24-29, 2004, Vienna, Austria. Stacy J. Morris Bamberg (S 02) received her S.B. in mechanical engineering from the Massachusetts Institute of Technology (Cambridge, USA) in 1996, her S.M. in mechanical engineering from MIT in 1999, and her Sc.D. from the Harvard/MIT Division of Health Sciences and Technology (Cambridge, USA) in She did her doctoral research in the Responsive Environments Group at the MIT Media Lab. She is currently an Assistant Professor in the Mechanical Engineering Department at the University of Utah in Salt Lake City, UT. In addition to the development of gait analysis instrumentation, her research interests include sensors and instrumentation for biomedical applications. Prof. Bamberg was awarded the Ida Green fellowship from MIT in 1996 and a four-year graduate fellowship from the Whitaker Foundation in She was also a recipient of Whitaker Stipend to attend the IEEE-EMBS Summer School on Medical Devices and Biosensors in the summer of 2002, and is a member of Sigma Xi, Tau Beta Pi, and Pi Tau Sigma. scientific journals, and has been on numerous scientific review panels for NIH, the VA and other granting agencies. Joseph A. Paradiso received a BS in Electrical Engineering and Physics summa cum laude from Tufts University (Medford, MA) in He then became a K.T. Compton fellow at the Lab of Nuclear Science at MIT, and receiving his PhD in physics from MIT (Cambridge, MA) in 1981 for research on muon pair production at the Intersecting Storage Rings at CERN in Geneva. After two years of developing precision drift chambers at the Lab for High Energy Physics at ETH in Zurich, he joined the Draper Laboratory in Cambridge, MA in 1984, where his research encompassed spacecraft control systems, image processing algorithms, underwater sonar, and precision alignment sensors for large high-energy physics detectors. He joined the Media Lab in 1994, where he is now the Sony Career Development Associate Professor of Media Arts and Sciences at the MIT Media Laboratory. In addition, \he directs the Responsive Environments group, and co-directs the Things That Think Consortium, a group of industry sponsors and Media Lab researchers who explore the extreme fringe of embedded computation, communication, and sensing. His current research interests include sensor systems for human-computer interfaces and ubiquitous computing. Prof. Paradiso s honors include the 2000 Discover Magazine Award for Technological Innovation, and he has authored over 100 articles and technical reports on topics ranging from computer music to energy harvesting. He is a member of the IEEE, ACM, AIAA, APS, OSA, Sigma Xi, Tau Beta Pi, and Eta Kappa Nu. Ari Y. Benbasat (S'00) was born in Vancouver, BC, Canada in He received a B.A.Sc. in engineering physics from the University of British Columbia (Vancouver, Canada) in 1998 and a S.M. in media arts and sciences from the Massachusetts Institute of Technology (Cambridge, USA) in In 1993, he was a candidate for the mayoralty of Vancouver and received over 0.1% of the popular vote. He is currently a Ph.D. candidate in the Responsive Environments Group at the MIT Media Lab in Cambridge, USA. His research concentrates on design methodologies for the creation of real-time power optimal wearable sensors, with the goal of making such devices efficient enough that they can be embedded into everyday life. Mr. Benbasat was awarded a post-graduate scholarship by the Natural Sciences and Engineering Research Council of Canada in Donna Moxley Scarborough received her bachelor s of science degree in physical therapy from Northeastern University (Boston, MA) in 1988 and earned her Masters of Science degree from the MGH Institute of Health professions (Boston, MA) in She worked previously at New England Medical Center hospital as a physical therapist treating persons with Neurologic and Orthopedic conditions. Ms. Scarborough is currently the Assistant Clinical Director of the MGH Biomotion Laboratory in Boston, MA. Her general research interests include gait, movement and balance disorders. Her more focused research is in elders balance and motor control. She also holds an adjunct Assistant Professor faculty position at MGH Institute of Health professions. She has received 2 research grant awards from CIMIT, The Center for the Integration of Medicine and Innovative Technology, for research collaborations of the GaitShoe. David E. Krebs received his BS in physical therapy in 1977 and MA in applied physiology in 1979 from Columbia University (New York City, NY), his PhD in pathokinesiology and physical therapy in 1986 from New York University (New York City, NY),, and his DPT in 2002 from the MGH Institute of Health Professions (Boston, MA),. He has been the director of the MGH Biomotion Laboratory since Dr. Krebs has been a professor at the MGH Institute of Health Professions since 1987, now in the Programs in Physical Therapy and in Clinical Investigation. He maintains a clinical appointment at the Massachusetts General Hospital in physical therapy and orthopaedics. He also holds academic appointments in Orthopaedics at Harvard Medical School and in Mechanical Engineering at the Massachusetts Institute of Technology. His general research interests include the biomechanical and neural control of human locomotion. Dr. Krebs has received numerous federal and private research grants and has over 200 publications. He is a member of several professional and scientific societies, from which he has received many awards. He is an editor for several
13 > PAPER IDENTIFICATION NUMBER: TITB < 13 List of Figures Figure I. High level block diagram of the GaitShoe system Figure II. Schematic of the GaitShoe system Figure III. A sample GaitShoe insole Figure IV. GaitShoe hardware mounted on shoes Figure V. Normalized outputs of all GaitShoe sensors Figure VI. The gait cycle Figure VII. Reference frames Figure VIII. Comparison of IMU outputs during walking gait Figure IX. Comparison of the calibrated FSR outputs to the force plate output Figure X. Initial determination of heel-strike and toe-off times Figure XI. Sample results of z-gyroscope integration Figure XII. Dynamic acceleration with XROOM and YROOM components Figure XIII. Sample results of the accelerometer integration Figure XIV. Final determination of heel-strike and toe-off times Figure XV. Histogram of the RMS error between the GaitShoe and BML pitch Figure XVI. Histogram of the RMS error between the GaitShoe and BML displacement Figure XVII. Histogram of the differences between the GaitShoe and BML pitch extrema and corresponding times Figure XVIII. Histogram of the differences between the GaitShoe and BML stride lengths Figure XIX. Histogram of the differences between the GaitShoe and BML heel-strike times and toe-off times List of Tables Table I. Sensors selected for the GaitShoe Table II. Summary of subject characteristics Table III. Gyroscope sensitivities and zero offsets Table IV. Sample pitch extrema of data in Figure X Table V. Accelerometer sensitivities and zero offsets


14


15
16
Stacy J. Morris JUNE ( 2004 Massachusetts Institute of Technology All rights reserved.
 A Shoe-Integrated Sensor System for Wireless Gait Analysis and Real-Time Therapeutic Feedback by Stacy J. Morris M.S., Mechanical Engineering, Massachusetts Institute of Technology, 1999 B.S., Mechanical
An investigation of kinematic and kinetic variables for the description of prosthetic gait using the ENOCH system
 An investigation of kinematic and kinetic variables for the description of prosthetic gait using the ENOCH system K. OBERG and H. LANSHAMMAR* Amputee Training and Research Unit, University Hospital, Fack,
Gait Analyser. Description of Walking Performance
 Gait Analyser Description of Walking Performance This brochure will help you to understand clearly the parameters described in the report of the Gait Analyser, provide you with tips to implement the walking
Mobility Lab provides sensitive, valid and reliable outcome measures.
 Mobility Lab provides sensitive, valid and reliable outcome measures. ith hundreds of universities and hospitals using this system worldwide, Mobility Lab is the most trusted wearable gait and balance
Stride October 20, 2017
 Preliminary Design Review Stride October 20, 2017 Advisor: ProfessorTessier Hollot 1 Advisor : Professor Group Members Richie Hartnett CSE Jarred Penney EE Advisor Prof. Tessier Joe Menzie CSE Jack Higgins
Datalogging Shirt for Baseball Pitchers
 Datalogging Shirt for Baseball Pitchers Design Team Marcus Moché, Alexandra Morgan, David Schmidt Design Advisor Prof. M. Taslim Abstract Baseball pitcher elbow injuries have been increasing in frequency
Figure 1 betois (bending torsion insole system) system with five measuring points and A/D- converter.
 system with five measuring points and A/D- converter.") Bending and Torsional Moments - A new measuring system for gait analysis Nora Dawin & Annette Kerkhoff & Klaus Peikenkamp, University of Applied Sciences Münster, Germany Abstract The Laboratory of Biomechanics
Bending and Torsional Moments - A new measuring system for gait analysis Nora Dawin & Annette Kerkhoff & Klaus Peikenkamp, University of Applied Sciences Münster, Germany Abstract The Laboratory of Biomechanics
siot-shoe: A Smart IoT-shoe for Gait Assistance (Miami University)
") siot-shoe: A Smart IoT-shoe for Gait Assistance (Miami University) Abstract Mark Sullivan, Casey Knox, Juan Ding Gait analysis through the Internet of Things (IoT) is able to provide an overall assessment
siot-shoe: A Smart IoT-shoe for Gait Assistance (Miami University) Abstract Mark Sullivan, Casey Knox, Juan Ding Gait analysis through the Internet of Things (IoT) is able to provide an overall assessment
Development of Wearable Sensor Combinations for Human Lower Extremity Motion Analysis
 Proceedings of the 2006 IEEE International Conference on Robotics and Automation Orlando, Florida - May 2006 Development of Wearable Sensor Combinations for Human Lower Extremity Motion Analysis Tao Liu,
Inertial compensation for belt acceleration in an instrumented treadmill
 Inertial compensation for belt acceleration in an instrumented treadmill Sandra K. Hnat, Antonie J. van den Bogert Department of Mechanical Engineering, Cleveland State University Cleveland, OH 44115,
EXSC 408L Fall '03 Problem Set #2 Linear Motion. Linear Motion
 Problems: 1. Once you have recorded the calibration frame for a data collection, why is it important to make sure the camera does not shut off? hat happens if the camera automatically shuts off after being
AN31E Application Note
 Balancing Theory Aim of balancing How an unbalance evolves An unbalance exists when the principle mass axis of a rotating body, the so-called axis of inertia, does not coincide with the rotational axis.
AMS 6916 Board mount pressure sensor with ratiometric analog output
 FEATURES Piezoresistive pressure sensor with amplified analog output Calibrated and temperature compensated Ratiometric voltage output, 0.5 4.5 V Digital signal conditioning, 12 bit output resolution Differential,
IDeA Competition Report. Electronic Swimming Coach (ESC) for. Athletes who are Visually Impaired
 for. Athletes who are Visually Impaired") IDeA Competition Report Electronic Swimming Coach (ESC) for Athletes who are Visually Impaired Project Carried Out Under: The Department of Systems and Computer Engineering Carleton University Supervisor
IDeA Competition Report Electronic Swimming Coach (ESC) for Athletes who are Visually Impaired Project Carried Out Under: The Department of Systems and Computer Engineering Carleton University Supervisor
AMS 6915 Board mount pressure sensor with digital output (I²C)
") Board mount pressure sensor with digital output (I²C) FEATURES Calibrated and temperature compensated pressure sensor with digital output (I²C) Differential, relative (gage), bidirectional differential,
Board mount pressure sensor with digital output (I²C) FEATURES Calibrated and temperature compensated pressure sensor with digital output (I²C) Differential, relative (gage), bidirectional differential,
ROSE-HULMAN INSTITUTE OF TECHNOLOGY Department of Mechanical Engineering. Mini-project 3 Tennis ball launcher
 Mini-project 3 Tennis ball launcher Mini-Project 3 requires you to use MATLAB to model the trajectory of a tennis ball being shot from a tennis ball launcher to a player. The tennis ball trajectory model
Biomechanics and Models of Locomotion
 Physics-Based Models for People Tracking: Biomechanics and Models of Locomotion Marcus Brubaker 1 Leonid Sigal 1,2 David J Fleet 1 1 University of Toronto 2 Disney Research, Pittsburgh Biomechanics Biomechanics
Implementation of Height Measurement System Based on Pressure Sensor BMP085
 017 nd International Conference on Test, Measurement and Computational Method (TMCM 017) ISBN: 978-1-60595-465-3 Implementation of Height Measurement System Based on Pressure Sensor BMP085 Gao-ping LIU
Wind Flow Validation Summary
 IBHS Research Center Validation of Wind Capabilities The Insurance Institute for Business & Home Safety (IBHS) Research Center full-scale test facility provides opportunities to simulate natural wind conditions
REPORT. A comparative study of the mechanical and biomechanical behaviour of natural turf and hybrid turf for the practise of sports
 REPORT A comparative study of the mechanical and biomechanical behaviour of natural turf and hybrid turf for the practise of sports Addressed to: PSF - PALAU TURF Date: May 2015 Table of Contents SHEET
Cover Page for Lab Report Group Portion. Pump Performance
 Cover Page for Lab Report Group Portion Pump Performance Prepared by Professor J. M. Cimbala, Penn State University Latest revision: 02 March 2012 Name 1: Name 2: Name 3: [Name 4: ] Date: Section number:
The Influence of Load Carrying Modes on Gait variables of Healthy Indian Women
 The Influence of Load Carrying Modes on Gait variables of Healthy Indian Women *Guha Thakurta A, Iqbal R and De A National Institute of Industrial Engineering, Powai, Vihar Lake, Mumbai-400087, India,
User Applied Force to Assistive Jogger s Interface During Gait
 User Applied Force to Assistive Jogger s Interface During Gait Senior Capstone: Assistive Jogger MEE 443 Mechanical Engineering Laboratories University of Maine April 13, 2010 By: Joey Passarelli Alexander
SCHEINWORKS Measuring and Analysis Systems by
 Pressure Measurement Systems for standing and walking analysis Germany since 1879 Pressure Measurement Systems for standing and walking analysis Documentation of Gait image Stance Symmetry of all parameters
NIH Public Access Author Manuscript Gait Posture. Author manuscript; available in PMC 2009 May 1.
 NIH Public Access Author Manuscript Published in final edited form as: Gait Posture. 2008 May ; 27(4): 710 714. Two simple methods for determining gait events during treadmill and overground walking using
Application Note AN-107
 SPEC Sensor TM Characterization & Calibration Considerations Scope This document is provided to describe the considerations needed to characterize, calibrate, verify and validate the measurement performance
Analysis of Foot Pressure Variation with Change in Stride Length
 IOSR Journal of Dental and Medical Sciences (IOSR-JDMS) e-issn: 2279-853, p-issn: 2279-861.Volume 13, Issue 1 Ver. IV (Oct. 214), PP 46-51 Dr. Charudatta V. Shinde, M.S. MCh ( Orthopaedics ), Dr. Weijie
GOLFER. The Golf Putting Robot
 GOLFER The Golf Putting Robot Written By Wing Pan Yuen For EEL 5666 Intelligent Machines Design Laboratory December 05, 1999 Table of Contents Abstract Introduction Executive Summary Integrated System
APPLICATION OF THREE DIMENSIONAL ACCELEROMETRY TO HUMAN MOTION ANALYSIS
 APPLICATION OF THREE DIMENSIONAL ACCELEROMETRY TO HUMAN MOTION ANALYSIS INTRODUCTION Ken'ichi Egawa, T. Tsuboi, T. Satoh, and M. Miyazaki Graduate School of Human Sciences, Waseda University Three dimensional
A NEURAL PROSTHESIS TO IMPROVE GAIT IN PEOPLE WITH MUSCLE WEAKNESS
 A NEURAL PROSTHESIS TO IMPROVE GAIT IN PEOPLE WITH MUSCLE WEAKNESS A thesis presented to the faculty of the Graduate School of Western Carolina University in partial fulfillment of the requirements for
AC : MEASUREMENT OF HYDROGEN IN HELIUM FLOW
 AC 2010-2145: MEASUREMENT OF HYDROGEN IN HELIUM FLOW Randy Buchanan, University of Southern Mississippi Christopher Winstead, University of Southern Mississippi Anton Netchaev, University of Southern Mississippi
In memory of Dr. Kevin P. Granata, my graduate advisor, who was killed protecting others on the morning of April 16, 2007.
 Acknowledgement In memory of Dr. Kevin P. Granata, my graduate advisor, who was killed protecting others on the morning of April 16, 2007. There are many others without whom I could not have completed
Analysis of stroke technique using acceleration sensor IC in freestyle swimming
 Analysis of stroke technique using acceleration sensor IC in freestyle swimming Y. Ohgi, M. Yasumura Faculty of Environmental Information, Keio Univ., Japan H. Ichikawa Doctoral Prog. of Health and Sport
intended velocity ( u k arm movements
 Fig. A Complete Brain-Machine Interface B Human Subjects Closed-Loop Simulator ensemble action potentials (n k ) ensemble action potentials (n k ) primary motor cortex simulated primary motor cortex neuroprosthetic
GasSense NDIR User Manual
 INDEX INDEX... 1 1. OVERVIEW... 2 2. TECHNICAL DATA... 3 3. SPECIFICATIONS... 4 4. PRODUCT DESCRIPTION... 5 4.1 Mechanical details... 5 4.2 Piping... 7 4.3 Connections... 7 5. INSTALLATION... 10 6. CALIBRATION
The Pennsylvania State University. The Graduate School. Department of Mechanical and Nuclear Engineering GAIT RETRAINING USING A SMART SHOE DEVICE
 The Pennsylvania State University The Graduate School Department of Mechanical and Nuclear Engineering GAIT RETRAINING USING A SMART SHOE DEVICE A Thesis in Mechanical Engineering by Tara Sulewski 2010
COMPARISON OF DIFFERENTIAL PRESSURE SENSING TECHNOLOGIES IN HOSPITAL ISOLATION ROOMS AND OTHER CRITICAL ENVIRONMENT APPLICATIONS
 COMPARISON OF DIFFERENTIAL PRESSURE SENSING TECHNOLOGIES IN HOSPITAL ISOLATION ROOMS AND OTHER CRITICAL ENVIRONMENT APPLICATIONS APPLICATION NOTE LC-136 Introduction Specialized spaces often times must
Fall Prevention Midterm Report. Akram Alsamarae Lindsay Petku 03/09/2014 Dr. Mansoor Nasir
 Fall Prevention Midterm Report Akram Alsamarae Lindsay Petku 03/09/2014 Dr. Mansoor Nasir Updates to timeline Last semester we created a timeline that included important milestones. We have narrowed down
Equine Results Interpretation Guide For Cannon Angles May 2013
 Equine Results Interpretation Guide For Cannon Angles May 2013 Page 1 of 20 Table of Contents 1. Introduction... 3 2. Options for all plots... 7 3. Tables of data... 8 4. Gaits... 10 5. Walk... 10 6. Trot...
Gait Analysis System. User Manual and Outcome parameters Patent WO2012/ A1
 Gait Analysis System User Manual and Outcome parameters Patent WO212/7855 A1 Thank you for purchasing our Gait Analysis Package. Gait Up s goal is to provide you with a user-friendly setup to measure accurately
AMS 2710 PCB pressure sensor module with V output
 FEATURES Universal pressure sensor module with 0.. 10 V voltage output Fully calibrated and temperature compensated sensor module Variants for (bidirectional) differential, gage, absolute and barometric
 Kochi University of Technology Aca Study on Dynamic Analysis and Wea Title stem for Golf Swing Author(s) LI, Zhiwei Citation 高知工科大学, 博士論文. Date of 2015-03 issue URL http://hdl.handle.net/10173/1281 Rights
Functional Outcomes of a Custom, Energy Harvesting "Bullfrog" AFO
 Functional Outcomes of a Custom, Energy Harvesting "Bullfrog" AFO Principal Investigator Géza F. Kogler, Ph.D., C.O. Co-Principal Investigator Young-Hui Chang, Ph.D. Co-Investigators Hosna Sharafi, BME
WMO LABORATORY INTERCOMPARISON OF RAIN INTENSITY GAUGES
 WMO LABORATORY INTERCOMPARISON OF RAIN INTENSITY GAUGES Christophe ALEXANDROPOULOS and Muriel LACOMBE Météo-France, Direction des Systèmes d Observation, BP 202-78195 Trappes France christophe.alexandropoulos@meteo.fr
Failure Detection in an Autonomous Underwater Vehicle
 Failure Detection in an Autonomous Underwater Vehicle Alec Orrick, Make McDermott, Department of Mechanical Engineering David M. Barnett, Eric L. Nelson, Glen N. Williams, Department of Computer Science
Motion Control of a Bipedal Walking Robot
 Motion Control of a Bipedal Walking Robot Lai Wei Ying, Tang Howe Hing, Mohamed bin Hussein Faculty of Mechanical Engineering Universiti Teknologi Malaysia, 81310 UTM Skudai, Johor, Malaysia. Wylai2@live.my
Mutual and asynchronous anticipation and action in sports as globally competitive
 1 Supplementary Materials Mutual and asynchronous anticipation and action in sports as globally competitive and locally coordinative dynamics Keisuke Fujii, Tadao Isaka, Motoki Kouzaki and Yuji Yamamoto.
The World Leader in High Performance Signal Processing Solutions MEMS Webcast
 The World Leader in High Performance Signal Processing Solutions MEMS Webcast October, 2013 High Performance Inertial Sensors Sensor Trends Mark Martin VP, MEMS / Sensors Growth Opportunities Products
Current issues regarding induced acceleration analysis of walking using the integration method to decompose the GRF
 Current issues regarding induced acceleration analysis of walking using the integration method to decompose the GRF George Chen May 17, 2002 Stanford Neuromuscular Biomechanics Lab Group Muscle contribution
Queue analysis for the toll station of the Öresund fixed link. Pontus Matstoms *
 Queue analysis for the toll station of the Öresund fixed link Pontus Matstoms * Abstract A new simulation model for queue and capacity analysis of a toll station is presented. The model and its software
Novel Technique for Gait Analysis Using Two Waist Mounted Gyroscopes
 Old Dominion University ODU Digital Commons Computer Science Theses & Dissertations Computer Science Summer 2018 Novel Technique for Gait Analysis Using Two Waist Mounted Gyroscopes Ahmed Nasr Old Dominion
INSTRUMENT INSTRUMENTAL ERROR (of full scale) INSTRUMENTAL RESOLUTION. Tutorial simulation. Tutorial simulation
 INSTRUMENTAL RESOLUTION. Tutorial simulation. Tutorial simulation") Lab 1 Standing Waves on a String Learning Goals: To distinguish between traveling and standing waves To recognize how the wavelength of a standing wave is measured To recognize the necessary conditions
Lab 1 Standing Waves on a String Learning Goals: To distinguish between traveling and standing waves To recognize how the wavelength of a standing wave is measured To recognize the necessary conditions
Equine Cannon Angle System
 Equine Cannon System How to interpret the results December 2010 Page 1 of 14 Table of Contents Introduction... 3 The Sagittal Plane... 4 The Coronal Plane... 5 Results Format... 6 How to Interpret the
Walking Simulator Mechanism
 The Downtown Review Volume 2 Issue 2 Article 4 2015 Walking Simulator Mechanism Titus Lungu Cleveland State University Igor Tachynskyy Cleveland State University Omri Tayyara Cleveland State University
The three steps for biomechanical assessment are the following: > Periodically verify the results and the efficacy of treatment
 ENG After having carried out and saved a test, two reports are immediately available: > Gait/Run report: specific report for gait or running tests, with average values, standard deviation and variability
Body weight measurement, calibration and Gait analysis using feet pressure for physiotherapy
 Original Article Body weight measurement, calibration and Gait analysis using feet pressure for physiotherapy Miss. Ashwini Khot * 1 and Prof. S.S.Patil 2 1,2 Department of Electronics and Telecommunication,
Instrumentation & Data Acquisition Systems
 Instrumentation & Data Acquisition Systems Section 3 -Level Robert W. Harrison, PE Bob@TheHarrisonHouse.com Made in USA 1 Level Section Question Which level measuring technology is the best solution when
CHAPTER IV FINITE ELEMENT ANALYSIS OF THE KNEE JOINT WITHOUT A MEDICAL IMPLANT
 39 CHAPTER IV FINITE ELEMENT ANALYSIS OF THE KNEE JOINT WITHOUT A MEDICAL IMPLANT 4.1 Modeling in Biomechanics The human body, apart of all its other functions is a mechanical mechanism and a structure,
CHEMICAL ENGINEERING LABORATORY CHEG 239W. Control of a Steam-Heated Mixing Tank with a Pneumatic Process Controller
 CHEMICAL ENGINEERING LABORATORY CHEG 239W Control of a Steam-Heated Mixing Tank with a Pneumatic Process Controller Objective The experiment involves tuning a commercial process controller for temperature
ASSESMENT Introduction REPORTS Running Reports Walking Reports Written Report
 ASSESMENT REPORTS Introduction Left panel Avatar Playback Right Panel Patient Gait Parameters Report Tab Click on parameter to view avatar at that point in time 2 Introduction Software will compare gait
Regents Exam Practice: Measurement, Kinematics, Free Fall, PJM, and UCM
 Regents Exam Practice: Measurement, Kinematics, Free Fall, PJM, and UCM 1. Which quantity and unit are correctly paired? 2. Which is a derived unit? meter second kilogram Newton 3. The fundamental unit
Crystal Breath. High Level Design. Nicholas Castro, Suong Do, Joe Duffy, Joe Lervi, John Mullaney
 Crystal Breath Nicholas Castro, Suong Do, Joe Duffy, Joe Lervi, John Mullaney Table of Contents 1 Introduction...3 2 Problem Statement and Proposed Solution...3 2.1 The Problem:... 3 2.2 Proposed Solution:...
Wade Reynolds 1 Frank Young 1,2 Peter Gibbings 1,2. University of Southern Queensland Toowoomba 4350 AUSTRALIA
 A Comparison of Methods for Mapping Golf Greens Wade Reynolds 1 Frank Young 1,2 Peter Gibbings 1,2 1 Faculty of Engineering and Surveying 2 Australian Centre for Sustainable Catchments University of Southern
Autodesk Moldflow Communicator Process settings
 Autodesk Moldflow Communicator 212 Process settings Revision 1, 3 March 211. Contents Chapter 1 Process settings....................................... 1 Profiles.................................................
Transformation of nonfunctional spinal circuits into functional states after the loss of brain input
 Transformation of nonfunctional spinal circuits into functional states after the loss of brain input G. Courtine, Y. P. Gerasimenko, R. van den Brand, A. Yew, P. Musienko, H. Zhong, B. Song, Y. Ao, R.
RELIABILITY ASSESSMENT, STATIC AND DYNAMIC RESPONSE OF TRANSMISSION LINE TOWER: A COMPARATIVE STUDY
 RELIABILITY ASSESSMENT, STATIC AND DYNAMIC RESPONSE OF TRANSMISSION LINE TOWER: A COMPARATIVE STUDY Yusuf Mansur Hashim M. Tech (Structural Engineering) Student, Sharda University, Greater Noida, (India)
SPD Pressure Sensor Families
 DATASHEET SPD Pressure Sensor Families 1/7 Introduction to the principals of Smart Pressure Devices 1 Basic principles Pressure sensors are based on the principle of bending a membrane caused by the pressure
A CO 2 Waveform Simulator For Evaluation and Testing of Respiratory Gas Analyzers
 2011 ROCKY MOUNTAIN NASA SPACE GRANT CONSORTIUM 1 A CO 2 Waveform Simulator For Evaluation and Testing of Respiratory Gas Analyzers Christina Long, and Joseph Orr, Ph.D. Department of Bioengineering, University
ITTC Recommended Procedures and Guidelines
 Page 1 of 6 Table of Contents 1. PURPOSE...2 2. PARAMETERS...2 2.1 General Considerations...2 3 DESCRIPTION OF PROCEDURE...2 3.1 Model Design and Construction...2 3.2 Measurements...3 3.5 Execution of
C-Brace Orthotronic Mobility System
 C-Brace Orthotronic Mobility System You ll always remember your first step Information for practitioners C-Brace Orthotics reinvented Until now, you and your patients with conditions like incomplete spinal
Specific Accreditation Criteria Calibration ISO IEC Annex. Mass and related quantities
 Specific Accreditation Criteria Calibration ISO IEC 17025 Annex Mass and related quantities January 2018 Copyright National Association of Testing Authorities, Australia 2014 This publication is protected
Technical Data Sheet MF010-O-LC
 Technical Data Sheet MF010-O-LC - 1 - 1. Properties The oxygen measuring system MF010-O-LC determines the oxygen content in gas mixtures up to a temperature of 250 C. It is particularly suitable for the
Biomechanics Sample Problems
 Biomechanics Sample Problems Forces 1) A 90 kg ice hockey player collides head on with an 80 kg ice hockey player. If the first person exerts a force of 450 N on the second player, how much force does
Along-string pressure, temperature measurements hold revolutionary promise for downhole management
 Along-string pressure, temperature measurements hold revolutionary promise for downhole management IT S WIDELY KNOWN that the majority of stuck pipe incidents occur while pulling out of hole. If we can
Normal and Abnormal Gait
 Normal and Abnormal Gait Adrielle Fry, MD EvergreenHealth, Division of Sport and Spine University of Washington Board Review Course March 6, 2017 What are we going to cover? Definitions and key concepts
Project 1 Those amazing Red Sox!
 MASSACHVSETTS INSTITVTE OF TECHNOLOGY Department of Electrical Engineering and Computer Science 6.001 Structure and Interpretation of Computer Programs Spring Semester, 2005 Project 1 Those amazing Red
Walking with coffee: when and why coffee spills
 Walking with coffee: when and why coffee spills Hans C. Mayer and Rouslan Krechetnikov Department of Mechanical Engineering University of California at Santa Barbara February 20-24, 2012 Page 1/25 Motivation
Analysis of Gait Characteristics Changes in Normal Walking and Fast Walking Of the Elderly People
 IOSR Journal of Engineering (IOSRJEN) ISSN (e): 2250-3021, ISSN (p): 2278-8719 Vol. 08, Issue 7 (July. 2018), V (V) 34-41 www.iosrjen.org Analysis of Gait Characteristics Changes in and Of the Elderly
Measuring range Δp (span = 100%) Pa
 Pa") 4.4/ RLE 5: Volume-flow controller, continuous How energy efficiency is improved Enables demand-led volume flow control for the optimisation of energy consumption in ventilation systems. Areas of application
4.4/ RLE 5: Volume-flow controller, continuous How energy efficiency is improved Enables demand-led volume flow control for the optimisation of energy consumption in ventilation systems. Areas of application
Level MEASUREMENT 1/2016
 Level MEASUREMENT 1/2016 AGENDA 2 A. Introduction B. Float method C. Displacer method D. Hydrostatic pressure method E. Capacitance method G. Ultrasonic method H. Radar method I. Laser method J. Level
1B1 Meridium. Reclaim your way. Information for practitioners. Meridium Ottobock 1
 1B1 Meridium Reclaim your way. Information for practitioners Meridium Ottobock 1 Reclaim your way. With the development of the individualized Meridium prosthetic foot, Ottobock has incorporated the latest
Precision level sensing with low-pressure module MS
 The task on hand Level sensing as it is understood in modern process automation is much more than simply "tank half full" or "tank a quarter full". Using suitable sensors, levels, inlets and outlets can
General Accreditation Guidance. User checks and maintenance of laboratory balances
 General Accreditation Guidance User checks and maintenance of laboratory balances January 2018 Copyright National Association of Testing Authorities, Australia 2010 All intellectual property rights in
MIE Medical Research Ltd Digital Analyser Pinch/Grip Instruction Manual
 Doc 116-03 Copyright 1998-2004 MIE Medical Research Ltd Getting Started MIE Medical Research Ltd Unpack your Digital Analyser and check that the following components are present: 1 x Digital Analyser
SpeedMax White Paper. Dynastream Innovations Inc. 228 River Avenue Cochrane, AB T4C 2C1. p f
 SpeedMax White Paper 228 River Avenue Cochrane, AB T4C 2C1 www.dynastream.com p 403.932.9292 f 403.932.6521 1 OVERVIEW Established in 1998, has world-leading expertise in the research and development of
Software Design of the Stiquito Micro Robot
 Software Design of the Stiquito Micro Robot Andrew McClain and James M. Conrad University of North Carolina at Charlotte jmconrad@uncc.edu Abstract The Stiquito robot is a small, six legged robot that
Impact Points and Their Effect on Trajectory in Soccer
 Proceedings Impact Points and Their Effect on Trajectory in Soccer Kaoru Kimachi 1, *, Sungchan Hong 2, Shuji Shimonagata 3 and Takeshi Asai 2 1 Doctoral Program of Coaching Science, University of Tsukuba,
GEA FOR ADVANCED STRUCTURAL DYNAMIC ANALYSIS
 SMART SOLUTIONS FOR VIBRATION MONITORING GEA FOR ADVANCED STRUCTURAL DYNAMIC ANALYSIS ANALYSIS OF CIVIL STRUCTURES - EXPO MERLATA PEDESTRIAN BRIDGE ABSTRACT Civil structures and in particular bridges and
A STUDY OF THE LOSSES AND INTERACTIONS BETWEEN ONE OR MORE BOW THRUSTERS AND A CATAMARAN HULL
 A STUDY OF THE LOSSES AND INTERACTIONS BETWEEN ONE OR MORE BOW THRUSTERS AND A CATAMARAN HULL L Boddy and T Clarke, Austal Ships, Australia SUMMARY CFD analysis has been conducted on a 100m catamaran hull
Characteristics of ball impact on curve shot in soccer
 Available online at www.sciencedirect.com Procedia Engineering 60 (2013 ) 249 254 6 th Asia-Pacific Congress on Sports Technology (APCST) Characteristics of ball impact on curve shot in soccer Sungchan
INTERACTION OF STEP LENGTH AND STEP RATE DURING SPRINT RUNNING
 INTERACTION OF STEP LENGTH AND STEP RATE DURING SPRINT RUNNING Joseph P. Hunter 1, Robert N. Marshall 1,, and Peter J. McNair 3 1 Department of Sport and Exercise Science, The University of Auckland, Auckland,
Meridium. Reclaim your way. Information for clinicians
 Meridium Reclaim your way. Information for clinicians Reclaim your way. With the development of the individualised Meridium prosthetic foot, Ottobock has incorporated the latest technology to achieve a
Dynamic analysis and motion measurement of ski turns using inertial and force sensors
 Available online at www.sciencedirect.com Procedia Engineering 6 ( 213 ) 355 36 6th Asia-Pacific Conference on Sports Technology Dynamic analysis and motion measurement of ski turns using inertial and
BUYER S GUIDE AQUAlogger 530WTD
 OCEAN & ENVIRONMENTAL BUYER S GUIDE AQUAlogger 530WTD Wireless Temperature and Depth Logger AQUAlogger 530WTD The AQUAlogger 530WTD has an innovative design that includes the ability to transfer stored
BAPI Pressure Line of Products - FAQs
 Table of Contents 1. Several manufacturers produce pressure transmitters, why should I purchase from BAPI?... p. 2 2. BAPI makes several styles of pressure transmitters. What are the features of each?...
Ball impact dynamics of knuckling shot in soccer
 Available online at www.sciencedirect.com Procedia Engineering 34 (2012 ) 200 205 9 th Conference of the International Sports Engineering Association (ISEA) Ball impact dynamics of knuckling shot in soccer
Procedia Engineering Procedia Engineering 2 (2010)
") Available online at www.sciencedirect.com Procedia Engineering Procedia Engineering 2 (2010) 002681 2686 (2009) 000 000 Procedia Engineering www.elsevier.com/locate/procedia 8 th Conference of the International
Available online at www.sciencedirect.com Procedia Engineering Procedia Engineering 2 (2010) 002681 2686 (2009) 000 000 Procedia Engineering www.elsevier.com/locate/procedia 8 th Conference of the International
Rotation Centers of the Equine Digit and their Use in Quantifying Conformation
 Presented at the Roth Kinematics Symposium, Stanford University, June 21, 2003. Rotation Centers of the Equine Digit and their Use in Quantifying Conformation John J. Craig, Phd ; Monique F. Craig, BSCE;
Sample Solution for Problem 1.a
 Sample Solution for Problem 1.a 1 Inverted Pendulum Model (IPM) 1.1 Equations of Motion and Ground Reaction Forces Figure 1: Scheme of the Inverted Pendulum Model (IPM). The equations of motion of this
2 Field Practices & Measurements
 2 Field Practices & Measurements Objectives: 1. Become familiar with surveying equipment 2. Care of equipment 3. Student responsibilities 4. Field notes 5. Significant figures 6. Tolerances 1. Become familiar