Approved for public release; distribution unlimited
|
|
|
- Alexia Douglas
- 6 years ago
- Views:
Transcription
1 Award Number: W81XWH TITLE: The Effects of Fatigue, Load Carriage, and Physical Activity History on Musculoskeletal Injury Mechanisms PRINCIPAL INVESTIGATOR: HE WANG Ph.D. CONTRACTING ORGANIZATION: Ball State University Muncie, IN REPORT DATE: September 2013 TYPE OF REPORT: Final PREPARED FOR: U.S. Army Medical Research and Materiel Command Fort Detrick, Maryland DISTRIBUTION STATEMENT: Approved for public release; distribution unlimited The views, opinions and/or findings contained in this report are those of the author(s) and should not be construed as an official Department of the Army position, policy or decision unless so designated by other documentation.
2 REPORT DOCUMENTATION PAGE Form Approved OMB No Public reporting burden for this collection of information is estimated to average 1 hour per response, including the time for reviewing instructions, searching existing data sources, gathering and maintaining the data needed, and completing and reviewing this collection of information. Send comments regarding this burden estimate or any other aspect of this collection of information, including suggestions for reducing this burden to Department of Defense, Washington Headquarters Services, Directorate for Information Operations and Reports ( ), 1215 Jefferson Davis Highway, Suite 1204, Arlington, VA Respondents should be aware that notwithstanding any other provision of law, no person shall be subject to any penalty for failing to comply with a collection of information if it does not display a currently valid OMB control number. PLEASE DO NOT RETURN YOUR FORM TO THE ABOVE ADDRESS. 1. REPORT DATE (DD-MM-YYYY) September REPORT TYPE Final 3. DATES COVERED (From - To) 1 Sep Aug TITLE AND SUBTITLE 5a. CONTRACT NUMBER The Effects of Fatigue, Load Carriage, and Physical Activity History on Musculo-Skeletal Injury Mechanisms 5b. GRANT NUMBER W81XWH c. PROGRAM ELEMENT NUMBER 6. AUTHOR(S) HE WANG Ph.D. hwang2@bsu.edu 7. PERFORMING ORGANIZATION NAME(S) AND ADDRESS(ES) Ball State University Muncie, IN d. PROJECT NUMBER 5e. TASK NUMBER 5f. WORK UNIT NUMBER 8. PERFORMING ORGANIZATION REPORT NUMBER 9. SPONSORING / MONITORING AGENCY NAME(S) AND ADDRESS(ES) 10. SPONSOR/MONITOR S ACRONYM(S) U.S. Army Medical Research and Materiel Command Fort Detrick, Maryland DISTRIBUTION / AVAILABILITY STATEMENT Approved for Public Release; Distribution Unlimited 13. SUPPLEMENTARY NOTES 11. SPONSOR/MONITOR S REPORT NUMBER(S) 14. ABSTRACT The overall purpose of this research is to determine the effects of fatigue, load carriage, and history of physical activity on the mechanical loading of the tibia and risk of tibial stress fracture. There are two specific aims in this study. The first aim is to determine the influences of fatigue and load carriage on gait mechanics and tibial loading. Twenty participants were recruited to perform walking in both fatigued and loaded conditions. CT scans of lower legs were obtained. Kinematic and kinetic gait analysis, musculoskeletal modeling, and finite element analysis of the tibia loading were conducted. The second research aim is to determine the effects of history of physical activity on tibial mechanical loading during impact related activities. Forty participants were recruited to perform running, landing, cutting maneuvers, and walking with loads. CT scans of lower legs were obtained. Kinematic and kinetic movement analysis, musculoskeletal modeling, and finite element analysis of the tibia loading are conducted. Within this final report, information concerning adherence to work objectives, results, and reportable outcomes are presented. Overall, we have achieved work objectives of the research and tested all the hypotheses. The data analysis demonstrates encouraging results. 15. SUBJECT TERMS Tibial stress fracture, fatigue, load carriage, modeling, FEA 16. SECURITY CLASSIFICATION OF: 17. LIMITATION OF ABSTRACT a. REPORT U b. ABSTRACT U c. THIS PAGE U UU 18. NUMBER OF PAGES 85 19a. NAME OF RESPONSIBLE PERSON 19b. TELEPHONE NUMBER (include area code) Standard Form 298 (Rev. 8-98) Prescribed by ANSI Std. Z39.18
3 Table of Contents Page Introduction Body Key Research Accomplishments Reportable Outcomes for Phase One 16 Summary and Discussion for Phase One Reportable Outcomes for Phase Two.. 22 Summary and Discussion for Phase Two 36 References 39 Appendices. 41
4 INTRODUCTION Due to the enormity of the tibial stress fracture (TSF) problem in the military it is vitally important to develop a better understanding of how the conditions experienced by military personnel affect their risk for TSF. The overall purpose of this study was to determine how the factors of fatigue, load carriage, and history of physical activity affect the mechanical loading of the tibia and subsequent risk of tibial stress fracture. The research project had been conducted in two phases. The first phase of this research focused on the effects of load carriage and fatigue on mechanical variables associated with increased risk of tibial stress fractures. Motion capture, ground reaction force, electromyographic, and computed tomography data were used to create participant specific musculoskeletal and finite element models. These models were used to determine the tibial strains and strain rates during both loaded and fatigued walking conditions. The immediate significance of this research is the determination of how different tasks and conditions affect the tibial strains produced during militarily relevant conditions. It is this mechanical loading and the strains it causes in the bone that ultimately leads to TSF. The results of this study can be used to evaluate the relative increases in bone strain and potential risk of TSF due to carrying additional loads, fatigue, and the combination of fatigue and load carriage. By understanding how load and fatigue influence tibial strains, the appropriate measures can be taken in the future to minimize the risks to recruits. This could be in form of altering load carriage, training programs, or a combination of the two. The second phase of this research focused on the effects of previous physical activity history on the mechanical variables associated with increased risk of tibial stress fractures. Two groups of participants were recruited. Group 1 consisted of participants who had participated regularly in a minimum of 2 years of recreational basketball. Group 2 consisted of participants who had participated regularly in a minimum of 2 years of recreational running. Motion capture, ground reaction force, electromyographic, and computed tomography data were used to create participant specific musculoskeletal and finite element models. These models were used to determine the tibial strains and strain rates during 1) running, landing, and cutting maneuvers and 2) progressively loaded walking trials. The significance of this research was that it would provide information regarding how physical activity history affects tibial strains in conditions similar to those encountered in basic training. The results from this phase of the research can be used to determine if there are any benefits to engaging in multi-directional, irregular impact activities (such as those encountered in basketball) compared to running. This is relevant because one of the major issues yet to be resolved in stress fracture prevention is the determination of the type and frequency of exercise that is vigorous enough to stimulate bone growth and adaptation yet not severe enough as to lead to overuse injuries. This research will lead to advances in our understanding of how participation in different types of physical activity relates to the incidence of TSF. These data may then be used to develop more effective training programs and to better identify individuals who are at higher risk of sustaining stress fractures due to their history of physical activity. The comprehensive scope of the proposed research will contribute significantly to the scarcity of published literature on in-vivo tibial strains and strain rates during activities consistent with what are required for military personnel. These data are needed in order to develop a better understanding of the dose-response relationship between loading conditions and bone health. 4
5 BODY PHASE 1 PROJECT There is evidence that load carriage and fatigue affect basic kinematic and kinetic gait parameters in a way that is consistent with increased mechanical demands on the tibia. However, the specific effects of load carriage and fatigue on tibial loading, specifically strain and strain rates, are not known. In order to determine these effects, a combination of load carriage and fatiguing protocols are examined using traditional gait analysis techniques in conjunction with new musculoskeletal modeling and finite element analysis (FEA) protocols. The purpose of the first phase of this research is to determine the effects of load carriage and fatigue on mechanical variables associated with increased risk of tibial stress fractures. Currently, there is no clear consensus on how conditions such as carrying additional loads or fatigue influence the strains in the tibia. Summary of Methods In order to determine the effects of load carriage and fatigue on mechanical variables associated with increased risk of tibial stress fracture, traditional kinematic and kinetic analyses derived from motion capture and force plate data have been combined with a participant-specific finite element model of the tibia utilizing customized musculoskeletal modeling software and FEA (Figure 1). Figure 1. Diagram of project workflow In order to test the Phase 1 hypotheses that 1) an increase in load carried will result in changes in gait mechanics and increased strains and strain rates in the tibia, and 2) fatigue will result in changes in gait mechanics and increased strains and strain rates in the tibia, the following protocols and procedures have been implemented. Participants In order to control for the confounding factors of hormonal status, body size, and strength, the study was conducted using a convenience sample of 20 male participants. Participants were recruited from the Ball 5
6 State University student population. Upon signing the written informed consent approved by the university s institutional review board for human subject participation in research and the HRPO of the U.S. Army Medical Research and Materiel Command, participants were scheduled and tested. The participants completed three data collection sessions; 1) assessment of aerobic and muscular strength, 2) gait analysis during loaded/fatigued walking conditions, and 3) computed tomography (CT) imaging of their tibias. Fitness Assessments The participants completed an aerobic and muscular fitness assessment session which lasted approximately two hours. First, an assessment of maximal oxygen consumption, or VO 2 peak, was made. Expired gases were collected with a ParvoMedics metabolic cart (ParvoMedics, Sandy, UT), which was calibrated prior to each testing session with standard gasses and a 3L syringe. A modified ramped version of the Bruce treadmill protocol was used [1]. The participants began the testing by walking at 1.7 mph on a 10% incline. Speed and grade were gradually increased until the subject voluntarily terminated the test due to fatigue. Resting heart rate and blood pressure were measured and monitored at regular intervals throughout the testing session. Next, the participants were given a 30 minute rest. Following the rest period, the participants lower body muscular strength was measured using a 1RM effort leg press similar to that described by Hoffman et al [2]. The participants self-selected an initial starting weight with which they could perform approximately 10 repetitions. After this initial set of 10 repetitions, the researcher in charge of the data collection increased the weight by 2.5 to 20kg, as described in the ACSM s Guidelines for Exercise Testing and Prescription [3]. Two minutes of rest was given between trials. The assessment was continued until the participants could no longer successfully complete a repetition. The weight of the last successful attempt was recorded as the participants 1RM. Load Carriage and Fatigue Protocol The participants completed a set of walking trials under different loading and fatigue conditions during which standard motion capture data were collected. Fifteen VICON M-series cameras (120 Hz) and VICON NEXUS 1.4 software (VICON Inc. Denver, CO) were used to collect three dimensional coordinates of reflective markers, ground reaction forces, and EMG of leg muscles. A modified standard plug-in gait marker set with cluster plates was used. A tandem forceplate instrumented treadmill (AMTI Inc., Watertown, MA) was used to set the walking speed at 1.67 m/s and allowed ground reaction forces to be collected at 2400 Hz. A 16-channel Delsys EMG system (Delsys Inc., Boston, MA) (2400 Hz) with bipolar single differential surface electrodes (41 mm x 20 mm electrode area, inter-electrode distance 1 cm) was used to monitor muscular activity of selected leg muscles. Prior to data collection, basic participant anthropometric measurements were performed. These measurements included: height, weight, leg length, ankle width, knee width, and ASIS width. Following the basic measurements and application of markers and electrodes, the participants warmed up in preparation for assessment of their maximal vertical jump height. The participants warmed up by walking at a self-selected pace on the treadmill for 5 minutes, followed by five practice jumps. The 6
7 participants maximal vertical jump height was assessed using a Vertec, they performed three maximal vertical jumps and the highest of the three was recorded. Following the baseline vertical jump test, the participants began the walking protocol as outlined below: 1. Walk for 5 minutes with no backpack 2. Walk for 5 minutes carrying a 32kg backpack* 3. Completion of Fatigue Protocol 4. Walk for 5 minutes fatigued carrying a 32kg backpack* 5. Walk for 5 minutes fatigued with no backpack *This 32kg load is similar to the Army s suggested approach or marching load [4]. During each of these stages, the participants walked on a treadmill (0 incline) at a pace of 1.67m/s. The participants wore standard military boots (Altama TM Mil-Spec Desert 3 Layer boot), shorts, and t-shirt during the experiment. During the testing session, motion capture, ground reaction force, and EMG data were recorded for the last minute of each stage of the protocol. The fatiguing protocol took place between the second and fourth stages of the walking protocols. Due to the potentially different effects of whole body fatigue vs. local muscle fatigue on factors relevant to tibial stress fracture [5, 6], a combination of activities were used. The participants completed a circuit which included loaded stepping and heel raises. The stepping protocol was based on a Queens College Step Test procedure [7]. The participants performed the test while wearing a 16kg backpack. The step height remained at the standard 16 inches and the participants stepped up and down at a rate of 24 cycles per minute. One cycle was defined as step up with first leg, step up with contra-lateral leg, step down first leg, and step down with contra-lateral leg. A metronome was set at 4 times the cycle rate to correspond to leg movements, in this case 96 beats per minute. Participants performed this stepping sequence until they could no longer match the cadence of the metronome. At this time the participants completed 20 heel raises standing at the edge of a box. Following the heel raises the participants removed the backpack and completed a maximal effort vertical jump measured using the Vertec. This sequence was repeated until the participants maximal vertical jump fell to or below 80% of its original value. Members of the research team provided verbal encouragement throughout the testing in order to elicit a maximal effort from the participants. CT Imaging Protocol The participants visited Ball Memorial Hospital (Muncie, IN) accompanied by a member of the research team. During this visit bilateral tibial CTs were recorded. This process took approximately one hour. Axial plane scans were obtained using the following parameters: slice thickness 0.625mm, 15cm x 15cm field of view (FOV), kvp and mas determined by machine algorithm (auto) based upon participant anthropometrics, each leg scanned separately from the distal femur through the calcaneous. Images were reconstructed in a 512x512 matrix using bone parameters derived from the literature. In addition to using the tibial CTs for modeling purposes, the images were used to calculate the tibial size and cross sectional area at the narrowest portion of the tibia, for consideration in subsequent analyses. 7
8 Modeling Methods Bone geometries were obtained using computed tomography (CT). CT images were segmented and 3D geometry files generated in Materialise MIMICS 13.0 (Materialise, Leuven, Belgium). The 3D surface geometries were used in MD MARC 2008 (MSC Software, Santa Anna, CA) to build hexmesh finite element (FE) models with generic linear isotropic material properties of elastic modulus 17GPa, density 1.9g/cm 3, and Poisson s ratio of 0.3. Tibia models were then imported into a scaled LifeMOD model. Once positioned, spatial coordinates of muscle model markers representing origins, insertions, and joint positions relative to the tibia were incorporated into the FE tibia. Boundary conditions were assigned as rotational and translational degrees of freedom of nodes representing ankle and knee joint centers and flexible bodies (modal neutral files) were generated for LifeMOD. For a full description of LifeMOD modeling methods and use of flexible bodies, see Al Nazer [8]. Key differences between this study and that of Al Nazer et al included more muscle actuators on the leg with the flexible tibia, participant specific segment scaling based on joint center calculations, ground reaction forces, and participant specific tibial geometries generated from CT scans. A lower body model was built using participant sex, mass, and height as scaling inputs in the GeBOD database [9]. Segments, joint locations, and orientations were scaled using joint center data from Visual 3D. Experimental kinematic data were used to perform an inverse kinematic analysis. Results of this analysis were used to train the muscle (right leg) and joint (left leg) PID controllers used to actuate the model in a forward dynamics (FD) analysis. These controllers were trained by using the kinematics of the inverse kinematics run as the targets for the forces produced by the actuators. If these targets were not met, force production was modulated to better produce the kinematics. Flexible tibias were then imported into LifeMOD. A FD analysis was performed with the addition of ground reaction forces applied to the feet and motion capture kinematics disabled. Maximum principal, minimum principal, and maximum shear strain values were then calculated using the Durability plug-in for MD ADAMS/View for the nodes of the geometric middle third of the tibial shaft (MSC Software, Santa Ana, CA). Statistical Analyses The statistical analysis was divided into two parts, one focusing on traditional gait mechanics and the other on the tibial strain profiles. While these analyses both address the general research question regarding the impact of load and fatigue on risk factors associated with tibial stress fracture, the differences in the research designs used to gather the data require the use of somewhat different statistical modeling. Traditional Gait and Loading Mechanics In order to test whether load, fatigue or the combination of these factors results in changes in gait mechanics; the following dependent (outcome) variables were calculated and analyzed: Peak vertical ground reaction forces Vertical ground reaction force loading rate Stride frequency 8
9 Double support time The target independent variables were loading condition and fatigue, which were completely crossed. In addition to these primary independent variables, a number of other variables (referred to collectively as covariates) were included in the analysis in order to control statistically for factors that had previously been shown to be associated with the risk of tibial stress fracture. These covariates included body mass, leg length, tibial size (cross sectional area (CSA) at the narrowest portion of the tibia) and fitness level as measured by 1RM leg press and VO 2 peak. In order to assess the impact of fatigue and loading condition on the outcome variables, a repeatedmeasures Analysis of Covariance (ANCOVA) was used. ANCOVA was appropriate for this statistical analysis because it accounted for the continuous independent variables that were collected from each individual and used to control for variables known to be related to tibial stress fractures. Because the participants were measured under two different load conditions, and two levels of fatigue, the repeated measures aspect of the analysis allowed for a direct comparison of dependent variable means across load conditions and fatigue levels, and allowed for an assessment of the interaction of these two variables. Tibial Strain Profile In order to determine whether load, fatigue or the combination of these factors results in changes of the tibial strain profile, the following dependent (outcome) variables were calculated and analyzed: Peak strain in the middle third of the tibia Peak strain rate in the middle third of the tibia The independent variables and covariates of interest for this analysis were the same as for traditional gait mechanics, with the primary focus being on fatigue and loading condition and their interaction. The actual modeling of the dependent variables was done using a repeated-measures ANCOVA, as described above. As with the traditional gait mechanics, this analysis provided significance tests for the primary independent variables while controlling for the covariates and the repeated measurements on the same individuals. Combining the results from these two analyses enabled the researchers to determine whether or not the data collected in this phase of the study support in full or in part the hypotheses that 1) an increase in load carried will result in changes in gait mechanics and increased strains and strain rates in the tibia and 2) fatigue will result in changes in gait mechanics and increased strains and strain rates in the tibia. PHASE 2 PROJECT There is evidence that an individual s past physical activity influences his or her risk of sustaining a tibial stress fracture. This evidence is based primarily on epidemiologic research on the rates of injury in different sub-populations. The mechanisms that may explain these results have not been adequately examined. In order to assess the effect of previous physical activity, two groups of individuals, basketball players, and runners completed a loaded walking protocol along with a series of other high impact activities such as running, drop-jumping, and cutting. These tasks were analyzed using traditional gait analysis techniques in conjunction with subject-specific musculoskeletal modeling and FEA protocols in order to determine if differences in tibial strains and strain rates exist between the two groups. 9
10 The purpose of the second phase of this research was to determine the effects of physical activity history on mechanical variables associated with increased risk of tibial stress fractures. Summary of Methods In order to determine the effects of physical activity history on mechanical variables associated with increased risk of tibial stress fracture, traditional mechanical analyses derived from motion capture and force plate data had been combined with a subject-specific finite element model of the tibia utilizing customized musculoskeletal modeling software and FEA (Figure 1). In order to test the following hypotheses: 1) regular participation in sports that involve irregular, high impact cutting and landing maneuvers for minimum of 2 years results in bone adaptations that lead to lower strains in the tibia during loaded walking tasks. 2) high impact, irregular sporting maneuvers such as cutting and landing that are performed during playing basketball, produce different tibial strains and strain rate patterns than those produced during running. The following protocols and procedures have been implemented. Participants In order to control for the confounding factors of hormonal status, body size, and strength, the study was conducted using a convenience sample of two groups of 20 male participants each, for a total of 40 participants. Participants were recruited from the Ball State University student population. Group 1 consisted of participants who had participated regularly in a minimum of 2 years of recreational basketball. Group 2 consisted of participants who had participated regularly in a minimum of 2 years of recreational running. Upon signing the written informed consent approved by the university s institutional review board for human subject participation in research and the HRPO of the U.S. Army Medical Research and Materiel Command, the participants were scheduled and tested. The participants completed three data collection sessions; 1) assessment of aerobic and muscular strength, 2) motion capture, force plate, and electromyographic (EMG) data collection while performing drop-jumping, cutting, running, and loaded walking tasks, and 3) computed tomography imaging of their tibias. Fitness Assessments The participants completed an aerobic and muscular fitness assessment session which lasted about two hours. The fitness assessment protocol was the same as Phase 1 research and was described in phase 1 research protocol. Motion Capture Protocol Fourteen VICON M-series and F-series cameras (240 Hz) and VICON Workstation 5.0 software (VICON Inc. Denver, CO) were used to collect three dimensional coordinates of reflective markers, ground reaction forces, and EMG of leg muscles. A modified standard plug-in gait marker set with cluster plates was used. A tandem forceplate instrumented treadmill (AMTI Inc., Watertown, MA) was used to set the walking speed at 6 km/h and running speed at 12 km/h and allowed ground reaction 10
11 forces to be collected at 2400 Hz. A 16-channel Delsys EMG system (Delsys Inc., Boston, MA) (2400 Hz) with bipolar single differential surface electrodes (41 mm x 20 mm electrode area, inter-electrode distance 1 cm) was used to monitor muscular activity of selected leg muscles. Prior to data collection, basic participant anthropometric measurements were performed. These measurements included: height, weight, leg length, ankle width, knee width, and ASIS width. Following the basic measurements and application of markers and electrodes, the participants warmed up in preparation for assessment of their maximal vertical jump height. The participants warmed up by walking at a self-selected pace on the treadmill for 5 minutes, followed by five practice jumps. The participants maximal vertical jump height was assessed using a Vertec, they performed three maximal vertical jumps and the highest of the three was recorded. Following the baseline vertical jump test, the participants performed the following movement tasks while motion capture, force plate, and EMG data were collected: Drop-jump: participants performed a short series of drop-jumps to mimic jump and landing task consistent with those performed in basketball. The jump height was based on 80% of the participant s max vertical jump height. Participants performed 10 drop-jumps onto two force plates (one foot landing on each plate). Thirty seconds rest was given between jumps. Cutting Maneuver: participants performed a cutting maneuver described by Sigward et al. [10]. Participants were instructed to run for 5m and then performed 45-degree cutting maneuvers to the left for five trials and to the right for five trials. A one-minute rest was given between cuttings. Unloaded Running: participants performed unloaded running at 12 km/h on a force instrumented treadmill (AMTI, Watertown, MA). The participants started out walking at 6 km/h for 2 minutes, and then increased speed 1 km/h each minute until the target speed of 12 km/h was reached. The participants maintained the speed for 5 minutes. Three 10 second trials were collected for analysis. Loaded Walking: participants walked at 6km/h on an instrumented treadmill (AMTI, Watertown, MA) with the following loads carried: 0kg, 15kg, 25kg, and 35kg. Participants walked for 5 minutes during each loaded walking condition. Three 10 second trials were collected during each walking task. A fiveminute rest was given between walking conditions. CT Imaging Protocol The participants visited Ball Memorial Hospital (Muncie, IN) accompanied by a member of the research team. During this visit bilateral tibial CTs were recorded. This process took approximately one hour. The CT imaging protocol was the same as Phase 1 research and was described in phase 1 research protocol. Modeling Methods Tibia geometries were obtained using computed tomography (CT). A custom build calibration phantom was used to establish a relationship between the CT Hounsfield units and tibial bone density. A relationship between bone density and Young s modulus was established based on the literature [11]. CT images were segmented and 3D geometry files were generated in MIMICS 14.0 (Materialise, Leuven, Belgium). 11
12 The 3D surface geometries of tibias were used in MARC 2012 (MSC Software, Santa Anna, CA) to build hexmesh finite element (FE) models. Material properties including bone density, Young s modulus, and Poisson s ratio were assigned to each of the individual elements of the tibial FE model. The FE tibia models were then imported into the subject-specific musculo-skeletal models in LifeMOD. Once positioned, spatial coordinates of muscle model markers representing origins, insertions, and joint positions relative to the tibia were incorporated into the FE tibia. Boundary conditions were assigned as rotational and translational degrees of freedom of nodes representing ankle and knee joint centers and flexible bodies (modal neutral files) were generated in MARC 2012 for LifeMOD simulation. A lower body model was built using participant sex, mass, and height as scaling inputs in the GeBOD database [9]. Segments, joint locations, and orientations were scaled using joint center data from Visual3D. Experimental kinematic data were used to perform an inverse kinematic analysis. Results of this analysis were used to train the muscles of both legs, which were used to actuate the model in a forward dynamics (FD) analysis. These muscles were trained by using the kinematics of the inverse kinematics run as the targets for the forces produced by the actuators. If these targets were not met, force production would be modulated to better produce the kinematics. Flexible tibias were then imported into LifeMOD. A FD analysis was performed with the addition of ground reaction forces applied to the feet and motion capture kinematics disabled. Maximum principal, minimum principal, and maximum shear strain values were calculated using the Durability plug-in for ADAMS/View 2012 for the surface nodes of the tibial shaft (MSC Software, Santa Ana, CA). Statistical Analyses The statistical analyses for phase 2 project were carried out using two separate models. The first of these analyses focused on the impact of increasing load carried and type of athletic training on the strain profiles across the tibia, while the second part focused on the magnitude and location of peak strain and strain rates across the tibia as a function of type of athletic activity. Following is a description of each statistical analysis used in phase 2 project. Tibial Strain and Strain Rate by Loading Condition and Previous Physical Activity In order to test the hypothesis that regular participation in basketball for a minimum of 2 years results in bone adaptation that lead to lower strains in the tibia during loaded walking tasks, the following approach was used. The dependent variables of interest were peak strain and strain rate in each third of the tibial shaft. The independent variables were loading condition (walking with 0, 15, 25, 35 kg loads), and physical activity history (basketball or running). In addition, location on the tibia (proximal third, middle third, or distal third) was included in the analysis. In order to ascertain the impact of load and physical activity history on peak strain and strain rate, repeated-measures ANOVAs were performed. There were two within-subject factors, load condition and location on the tibia, and one between-subject factor, type of previous physical activity. This analysis included tests of the three main effects, thus allowing for an assessment of whether there were significant differences in peak strains and strain rates across loadings, type of physical activity history and location on the tibia. 12
13 Peak Tibial Strain and Strain Rate by Type of Athletic Activity In order to test the hypothesis that high impact, irregular sporting maneuvers such as cutting and landing, which were consistent with those performed in basketball, produce different tibial strain and strain rate patterns than those produced during running, repeated-measures ANOVA tests were performed. The dependent variables were peak strains and strain rates. The independent variables were type of athletic activity, physical activity history, and location on the tibia. The repeated-measures ANOVAs had two within-subject factors (type of athletic activity and location on the tibia) and one betweensubject factor (previous physical activity). This ANOVA test provided hypothesis tests for the equality of mean values across type of athletic activity, type of physical activity history and location on the tibia for each dependent variable. 13
14 KEY RESEARCH ACCOMPLISHMENTS The abstract titled An integrated modeling method for tibia strain analysis was presented at the Northwest American Society of Biomechanics Symposium in May 2010 (Appendix A) The abstract titled Muscular fatigue increases ground reaction loading rate during walking was presented at the 57 th Annual Meeting of American College of Sports Medicine in June The abstract was published in Medicine & Science in Sports & Exercise. V. 42, No. 5 Supplement, S192 (Appendix B) The abstract titled Load carriage increases mechanical loading rates during walking was presented at the 34 th Annual Meeting of American Society of Biomechanics in August 2010 (Appendix C) The abstract titled An integrated modeling method for bone strain analysis was presented at the 34 th Annual Meeting of American Society of Biomechanics in August 2010 (Appendix D) The abstract titled Effects of load carriage and muscular fatigue on ground reaction loading rate during walking was presented at the 58 th Annual Meeting of American College of Sports Medicine in June The abstract was published in Medicine & Science in Sports & Exercise. V. 43, No. 5 Supplement, S21-22 (Appendix E) The abstract titled The effect of height on tibial strain while performing drop landings was submitted and accepted for presentation at the 58 th Annual Meeting of American College of Sports Medicine in June The abstract was published in Medicine & Science in Sports & Exercise. V. 43, No. 5 Supplement, S639 (Appendix F) The abstract titled Influences of load carriage and fatigue on lower-extremity kinetics during walking was presented at the 35 th Annual Meeting of American Society of Biomechanics in August 2011 (Appendix G) The abstract titled A time-efficient method for analyzing bone strain with large subject pools was presented at the 35 th Annual Meeting of American Society of Biomechanics in August 2011 (Appendix H) The manuscript titled Influence of fatigue and load carriage on mechanical loading during walking was published in the Journal of Military Medicine in January 2012 (Appendix I) The abstract titled Influence of physical activity history on ground reaction force during walking was presented at the 59 th Annual Meeting of American College of Sports Medicine in May The abstract was published in Medicine & Science in Sports & Exercise. V. 44, No. 5 Supplement, S (Appendix J) The abstract titled The effects of load carriage and fatigue on frontal plane knee mechanics during walking was presented at the 36 th Annual Meeting of American Society of Biomechanics in August 2012 (Appendix K) 14
15 The abstract titled the influence of physical activity history on ground reaction force during running was presented at the 60 th Annual Meeting of American College of Sports Medicine in May The abstract was published in Medicine & Science in Sports & Exercise. V. 45, No. 5 Supplement, S502 (Appendix L) The manuscript titled The effects of load carriage and muscle fatigue on lower extremity joint mechanics was published in the Research Quarterly of Exercise and Sport in September 2013 (Appendix M) The abstract titled the effects of the type of activity on tibial strain characteristics was presented at the 37 th Annual Meeting of American Society of Biomechanics in September (Appendix N) 15
16 REPORTABLE OUTCOMES for THE PHASE ONE PROJECT The following sections outline the results from the first phase of this project. These data along with subsequent analyses will form the basis for forthcoming presentations and manuscripts documenting this research. Participant Characteristics: Twenty college-age male participants were recruited to participate in the first phase of this study. Technical difficulties were encountered with data from two of the participants, whose data were excluded from the analyses. Therefore the final data analysis was performed on 18 participants; their characteristics are presented in Table 1. Table 1. Subject demographic information Mean (SD) Age (yrs) 20.8 (1.8) Height (cm) (4.5) Mass (kg) 77.6 (9.6) Minimum Tibia CSA (mm 2 ) 364 (49) Leg Press 1RM (lbs) 529 (169) VO 2 Peak (ml/kg/min) 51 (5) Gait Kinematics and Kinetics: Gait kinematics and kinetics of the four walking tasks performed are presented in table 2 and table 3. Table 2 shows the means and standard deviations (SDs) of stride frequency, stride length, and double support time. Table 3 shows the means and SDs of the peak vertical and braking ground reaction forces and loading rates during weight acceptance of walking. Two-way repeated-measures ANOVAs were used to determine the effects of load carriage and muscle fatigue on the selected gait kinematics and kinetics variables. Table 2. Means (SDs) of spatio-temporal parameters during walking Variables\Conditions UU UF LU LF Stride Frequency (strides/min) 58.6 (2.7) 59.7 (4.0) 60.5 (2.4) 63.4 (5.1) Stride Length (m) 1.71 (0.07) 1.68 (0.11) 1.66 (0.06) 1.59 (0.12) Double Support (% gait cycle) 22.1 (1.4) 23.0 (1.5) 27.9 (2.1) 29.5 (2.9) Conditions: UU = unloaded unfatigued, UF = unloaded fatigued, LU = loaded unfatigued, LF = loaded fatigued. 16
17 Table 3. Means (SDs) of the peak GRF and loading rates during walking Variables\Conditions UU UF LU LF Peak VGRF (BW) 1.27 (0.06) 1.35 (0.11) 1.92 (0.18) 1.99 (0.19) Peak BGRF (BW) 0.23 (0.03) 0.24 (0.03) 0.35 (0.06) 0.34 (0.06) Peak VGRLR (BW/s) Peak BGRLR (BW/s) (3.40) (7.92) (12.07) (11.92) 7.98 (1.61) 9.78 (2.06) (5.89) (4.36) Conditions: UU = unloaded unfatigued, UF = unloaded fatigued, LU = loaded unfatigued, LF = loaded fatigued. VGRF = vertical ground reaction force, BGRF = braking ground reaction force, VGRLR = vertical ground reaction loading rate, BGRLR = braking ground reaction loading rate. There was no interaction between the load carriage and fatigued conditions for all the gait kinematics and kinetics (p > 0.05). Load carriage had a significant effect on gait spatial-temporal parameters (p < 0.01) and kinetics (p < 0.001). Muscle fatigue also had a significant effect on gait spatial-temporal parameters (p < 0.001) and kinetics (p < 0.001). Specifically, load carriage led to significant increases of stride frequency (p = 0.007) and double support time (p = 0.004) and a significant decrease of stride length (p = 0.006). Muscle fatigue resulted in significant increases of stride frequency (p = 0.001) and double support time (p < 0.001) and a significant decrease of stride length (p = 0.001). Both load carriage and muscle fatigue resulted in alterations of ground reaction force variables. The load carriage led to significant increases of peak vertical and braking ground reaction forces (p < 0.001). Muscle fatigue led to a significant increase of peak vertical ground reaction force (p < 0.001). Furthermore, the load carriage led to significant increases of the peak vertical and braking ground reaction loading rates (p < 0.001). With a significant effect on peak vertical ground reaction loading rate (p = 0.003) and a near significant effect on peak braking ground reaction loading rate (p = 0.084), the muscle fatigue resulted in pronounced increases of ground reaction loading rates. Lower-extremity joint kinematics and kinetics Lower-extremity joint kinematics and kinetics at weight acceptance of the four walking tasks are presented in Table 4 and Table 5. Table 4 shows the means and SDs of the pelvis, hip, knee, and ankle angles at heel contact and stance of walking. Table 5 shows the means and SDs of the hip, knee, and ankle joint moment and power during weight acceptance of walking. Two-way repeated-measures ANOVAs were used to determine the effects of load carriage and muscle fatigue on the selected joint kinematic and kinetics during walking. 17
18 Table 4. Means (SDs) of the lower-extremity kinematics during walking Variables\Conditions UU UF LU LF Pelvis tilt at heel contact (deg) Hip flexion at heel contact (deg) Knee flexion at heel contact (deg) Maximum knee flexion at stance (deg) Ankle dorsi-flexion at heel contact (deg) 8.8 (5.9) 11.0 (8.6) 20.1(5.0) 22.9 (8.6) 32.1 (4.3) 28.2 (10.4) 45.4 (5.2) 40.6 (10.9) -2.5 (3.1) -1.1 (4.5) 3.9 (3.2) 4.7 (4.9) 19.0 (2.8) 20.7 (4.4) 24.6 (4.5) 25.0 (5.3) 7.7 (1.9) 5.3 (4.9) 7.3 (2.7) 5.6 (3.6) Conditions UU = unloaded unfatigued, UF = unloaded fatigued, LU = loaded unfatigued, LF = loaded fatigued. Table 5. Means (SDs) of the lower-extremity joint moments during walking Variables\Conditions UU UF LU LF Hip extensor moment (Nm/kg) Knee extensor moment (Nm/kg) Ankle dorsi-flexion moment (Nm/kg) Hip joint power production (W/kg) Knee joint power absorption (W/kg) Ankle joint power absorption (W/kg) 1.54 (0.41) 1.85 (0.48) 2.26 (0.42) 2.38 (0.42) 0.88 (0.20) 0.90 (0.25) 1.61 (0.37) 1.63 (0.42) (0.12) (0.10) (0.11) (0.11) 1.03 (0.36) 1.47 (0.49) 1.69 (0.61) 1.97 (0.64) (0.37) (0.54) (1.40) (1.06) (0.27) (0.32) (0.30) (0.35) Conditions UU = unloaded unfatigued, UF = unloaded fatigued, LU = loaded unfatigued, LF = loaded fatigued. There was no interaction between the effects of load carriage and muscle fatigue for lower-extremity joint kinematics and kinetics (p > 0.05). Load carriage had a significant effect on lower-extremity joint kinematics and kinetics (p < 0.001). Muscle fatigue had a significant effect on lower-extremity joint kinematics and kinetics (p < 0.05). Both load carriage and muscle fatigue led to pronounced alteration of lower-extremity joint kinematics. Load carriage resulted in significant increases of pelvis anterior tilt (p < 0.001), hip flexion (p < 0.001) and knee flexion (p < 0.001) at heel contact, and maximum knee flexion (p < 0.001) during stance. Muscle fatigue led to significant decrease of ankle-dorsi flexion at heel contact (p = 0.028). 18
19 Both load carriage and muscle fatigue led to pronounced alterations of lower-extremity joint kinetics. Load carriage led to significant increases of hip and knee extensor moments (p < 0.001) and a near significant increase of ankle dorsi-flexor moment (p = 0.08) during weight acceptance. Also, greater hip joint power production (p < 0.001), and knee and ankle joint power absorption (p < 0.001) were observed at weight acceptance of loaded walking. Muscle fatigue led to a significant increase of hip extensor moment (p = 0.001) and a significant decrease of ankle dorsi-flexor moment at weight acceptance. In addition, greater hip joint power production (p = 0.001) and lesser ankle joint power absorption (p = 0.007) at weight acceptance were observed during fatigued walking. Strain and Strain Rate: The peak strain and strain rates from the bone shaft of the tibia during unloaded unfatigued walking in the present study are presented along with in-vivo and simulated strains that have been reported by other researchers (table 6). The strains and strain rates are in reasonable agreement with the previously reported values. Differences in values between the current study and the previous studies may be due to the locations on tibia where the strain data were collected. Strain data reported in previous studies were from the antero-medial aspect of the tibia shaft [8, 12-15], while the current study uses average strains of the tibia shaft. Table 6. Tibial strains and strain rates reported in previous studies and current study Strain Magnitude (Microstrain) Strain Rate (Microstrain/s) Max Principal Min Principal Max Shear Max Principal Min Principal Max Shear Lanyon et al. [12] Not reported Not reported Burr et al. [13] Milgrom et al. [14] Milgrom el al. [15] Not reported Not reported Al Nazer et al.[8] Present Simulation (Bone Shaft) A mixed model ANCOVA was used to determine if there were any differences in strains and strain rates between conditions. Significance was set at α = Height, body mass, age, minimum tibia cross sectional area (CSA), leg press 1RM, VO 2 peak were used as covariates. 19
20 Strain Table 7. Means (SEs) of tibial strains during walking Variables\Conditions UU UF LU LF Max Principal Strain (μs) (90.81) (90.81) (90.81) (90.81) Min Principal Strain (μs) (222.54) (222.54) (222.54) (222.54) Max Shear Strain (μs) (312.91) (312.91) (312.91) (312.91) Conditions UU = unloaded unfatigued, UF = unloaded fatigued, LU = loaded unfatigued, LF = loaded fatigued. Table 7 shows the means and standard errors (SEs) of the maximum and minimum principal strains and shear strains of the tibia for the four walking conditions. Load carriage had a significant effect on maximum principal strain (p < ), minimum principal strain (p < ), and maximum shear strain (p < ). Specifically, load carriage led to significant increases of maximum principal strain, minimum principal strain, and maximum shear strain during walking (p < ). Muscle fatigue had a significant effect on maximum principal strain (p < ), minimum principal strain (p < ), and maximum shear strain (p < ). Specifically, muscle fatigue led to significant decreases of maximum principal strain, minimum principal strain, and maximum shear strain during walking (p < ). None of the participant characteristics used as covariates (height, mass, age, leg press max, VO2peak, or minimum tibial CSA) were significantly related to strain variables (p > 0.05). Strain Rate Table 8. Means (SEs) of tibial strain rates during walking Variables\Conditions UU UF LU LF Max Principal Strain Rate (μs/s) (382.14) (382.14) (382.14) (382.14) Min Principal Strain Rate (μs/s) (719.70) (719.70) (719.70) (719.70) Max Shear Strain Rate (μs/s) ( ) ( ) ( ) ( ) Conditions UU = unloaded unfatigued, UF = unloaded fatigued, LU = loaded unfatigued, LF = loaded fatigued. Table 8 shows the means (SEs) of the maximum and minimum principal strain rates and shear strain rates of the tibia for the four walking conditions. Load carriage had a significant effect on maximum principal strain rate (p < ), minimum principal strain rate (p < ), and maximum shear strain rate (p < ). Specifically, load carriage led to significant increases of maximum principal strain rate, minimum principal strain rate, and maximum shear strain rate during walking (p < ). 20
21 Muscle fatigue had a significant effect on maximum principal strain rate (p < ), minimum principal strain rate (p < ), and maximum shear strain rate (p < ). Specifically, muscle fatigue led to significant decreases of maximum principal strain rate, minimum principal strain rate, and maximum shear strain rate during walking (p < ). None of the participant characteristics used as covariates (height, mass, age, leg press max, VO2 peak, or minimum tibial CSA) were significantly related to strain rates (p > 0.05). SUMMARY and DISCUSSION: We had hypothesized that load carriage and muscle fatigue would alter basic gait spatial-temporal parameters and kinetics. Results from this research support this hypothesis. Specifically, load carriage and muscle fatigue result in significant increases of stride frequency and double support time and a significant decrease of stride length. Furthermore, both load carriage and muscle fatigue lead to significant increases of the vertical ground reaction force and loading rate. It was also hypothesized that load carriage and muscle fatigue would alter lower-extremity joint mechanics. This hypothesis was supported. Specifically, load carriage leads to significant increases of pelvis tilt, hip and knee flexion at heel contact and maximum knee flexion during stance. Muscle fatigue leads to a significant decrease of ankle dorsi-flexion at heel contact. Furthermore, load carriage leads to significant increases of hip and knee joint moment and hip, knee, and ankle joint powers. Muscle fatigue also leads to significant increases of hip joint moment and power and significant decreases of ankle joint moment and power. Thus, when walking with load carried, lower-extremities experience significant increases of external impact forces (ground reaction forces) and loading rates at every foot strike. Moreover, the pronounced increases of lower-extremity joint moments and powers at weight acceptance reflect large increases of leg muscle forces. Therefore, lower-extremity skeletal structures (e.g. tibias) are loaded with both increased ground impact forces and increased leg muscles forces at stance of walking. In addition, the increased stride frequency and double support time associated with load carriage lead to increases of number of loading cycle and loading duration during walking. Similarly, when walking in a fatigued state, lower-extremities experience significant increases of external impact force (vertical ground reaction force) and loading rate at each foot strike. The large increases of hip joint moment and power reflect increased effort of hip extensors to stabilize the pelvis. The significant decreases of ankle joint moment and power indicate reduced ability of the ankle dorsiflexor to control the ankle joint at weight acceptance. Thus, lower legs experience increased ground impact force and loading rate and altered leg muscle loads at stance in a fatigued state. In addition, the increased stride frequency and double support time associated with muscle fatigue expose the lowerextremities to increased number of loading cycle and loading duration. The combined effect of muscle fatigue and load carriage further exposes the lower-extremity skeletal structures to significant increases of external impact loading and loading rate and pronounced alterations of leg muscle loads. This pronounced alteration in mechanical loading pattern is coupled with increased number of loading cycle and loading duration during walking. 21
22 Furthermore, it was hypothesized that the changes in gait mechanics due to load carriage would result in increases in strains and strain rates in the tibia. Results from this study support this hypothesis. We found that the load carriage results in larger tibial strains and strain rates than walking with no loads. Repetitive high bone strains and strain rates were considered to be the etiology of stress fracture [13, 16]. Thus, results from this study provide evidence that load carriage could increase the risk of developing tibial stress fracture. We also hypothesized that the muscle fatigue would result in increases in strains and strain rates in the tibia. This hypothesis was not supported. We found the muscle fatigue led to pronounced reductions in tibial strains and strain rates during walking. Results from this study were different from a previous in vivo study performed by Milgrom et al [15], which reported that fatigue resulted in pronounced increases of tensile strain, tensile and compressive strain rates during walking. However, the compressive strain was found to be significantly reduced during fatigued walk [15]. The discrepancies between the current study and Milgrom s study may be due to the following factors. Firstly, in Milgrom s study, the vertical ground reaction force (GRF) was found to be lower during fatigued walk than during normal walk. However, the current study found that the muscle fatigue leads to a significant increase in the vertical GRF. Secondly, in Milgrom s study, the walking speed was not controlled and not reported for the pre and post fatigue tests. In the current study, the walking speed was controlled at 1.67m/s for all the walking conditions. Thirdly, Milgorm s study did not present gait kinematic data. It is not known whether subjects participated in Milgrom s study walked differently from subjects recruited in this study. Thus, the possible differences in gait kinematics and ground reaction forces observed in the current study and Milgrom s study may contribute to the different findings in strains and strain rates. In conclusion, load carriage and muscle fatigue result in alterations in gait mechanics signified by increases in stride frequency, double support time, vertical ground reaction force and loading rate. Load carriage leads to pronounced increases in tibial strains and strain rates. Muscle fatigue leads to pronounced decreases in tibial strains and strain rates. 22
23 REPORTABLE OUTCOMES for THE PHASE TWO PROJECT The following sections outline the results from the second phase of this project. These data along with subsequent analyses will form the basis for forthcoming presentations and manuscripts documenting this research. Participant Characteristics: Forty college-age male participants were recruited in this study. Participants were divided into two experimental groups (runners and basketball players). The runner group consisted of twenty recreational runners with a minimum of two years of regular running experience. The basketball group consisted of twenty recreational basketball players with a minimum of two years of regular basketball playing experience. Participants characteristics are presented in Table 9. Table 9. Subject demographic information Runners Basketball Players Age (yrs) 20.7(2.4) 20.6(1.7) Height (cm) 180.1(6.3) 180.8(8.3) Mass (kg) 75.7(9.6) 80.1(11.5) Minimum Tibia CSA (mm 2 ) 352(49) 369(49) Leg Press 1RM (lbs) 492(62) 550(127) VO 2 Peak (ml/kg/min) 58(7) 50(5) Mean (+/- standard deviation) for basic participant demographics and results from fitness assessments. Kinematics and Kinetics of Loaded Walking Tasks: Selected gait spatio-temporal parameters and kinetics of the four loaded walking tasks are presented in table 10, which shows the means and SDs of stride frequency, stride length, peak vertical ground reaction force and loading rate. Two-way repeated-measures ANOVAs were used to determine the effects of physical activity history and levels of loaded walking on the selected gait kinematics and kinetics variables. 23
24 Table 10. Means (SDs) of spatio-temporal parameters during loaded walking Variables\Conditions WK00 WK15 WK25 WK35 Runners Stride length (m) 1.70 (0.06) 1.69 (0.06) 1.67 (0.07) 1.63 (0.08) Stride frequency (strides/min) 59 (2) 59 (2) 60 (2) 62 (3) Peak VGRF (BW) 1.29 (0.07) 1.58 (0.10) 1.78 (0.15) 2.01 (0.19) Peak VGRLR (BW/s) (3.73) (4.64) (7.73) (8.24) Basketball Players Stride length (m) 1.69 (0.08) 1.68 (0.08) 1.66 (0.09) 1.62 (0.08) Stride frequency (strides/min) 59 (3) 60 (3) 61 (3) 62 (3) Peak VGRF (BW) 1.30 (0.05) 1.57 (0.12) 1.76 (0.28) 1.97 (0.20) Peak VGRLR (BW/s) (3.80) (5.44) (9.07) (7.18) Conditions: WK00 = unloaded walking, WK15 = 15kg loaded walking, WK25 = 25kg loaded walking, WK35 = 35kg loaded walking. VGRF = vertical ground reaction force. VGRLR = vertical ground reaction loading rate. No interaction was found between the effects of the subject group and incremented load carriage for the selected gait spatio-temporal parameters and kinetics (p > 0.05). In addition, there were no significant differences in gait spatio-temporal parameters and kinetics between the runners and basketball players tested (p > 0.05). However, the incremented load carriage had a significant effect on gait spatialtemporal parameters and kinetics (p < 0.001). The incremented load carriage led to a significant increase of stride frequency (p < 0.001) and a significant decrease of stride length (p < 0.001). Specifically, carrying 35kg load resulted in shorter stride length and faster stride rate than carrying 15kg load and no load conditions (p < 0.001). Furthermore, the increasing load carried resulted in significant increases of peak vertical ground reaction force (p < 0.001) and peak vertical ground reaction loading rate (p < 0.001). As the amount of load carried was increased from 0kg to 35kg, there were linear increases of the peak vertical ground reaction force and peak vertical ground reaction loading rate. Kinematics and Kinetics of Running Task: Selected spatio-temporal parameters and ground reaction force variables during running are presented in Table 11. One-way ANOVAs were performed to determine the differences in these variables between the two groups. 24
25 Table 11. Means (SDs) spatio-temporal parameters and ground reaction forces during running Variables\Conditions Runners Ball Players Stride length (m) 2.45 (0.10) 2.46 (0.10) Stride frequency (strides/min) 82 (3) 82 (3) Impact peak VGRF (BW) 1.65 (0.05)* 1.81 (0.05)* Active peak VGRF (BW) 2.43 (0.20)* 2.57 (0.16)* Peak VGRLR (BW/s) 81.62(22.11)* 95.91(16.12)* Note: * indicates a significant difference (P < 0.05). VGRF = vertical ground reaction force. VGRLR = vertical ground reaction loading rate. Both groups exhibited similar stride length (p = 0.859) and stride frequency (p = 0.744) during running. However, the runner group showed lower ground reaction force variables than those of the basketball group. Specifically, the runner group demonstrated less impact peak VGRF (p = 0.045), active peak VGRF (p = 0.025), and VGRF loading rate (p = 0.025) than those of the basketball group. Peak Strain and Strain Rate during Loaded Walking Tasks Strain during walking with load carriages The following dependent variables were examined: peak tensile strain (peak maximal principle strain), peak compressive strain (peak minimal principle strain), and peak shear strain (peak maximal shear strain) during the stance of walking. For each of the dependent variables, a 2x3x4 repeated-measures ANOVA test was run with the subject group (two levels: runners and ball players), tibial section (three levels: proximal third, middle third, and distal third), and incremented load carriage (four levels: 0kg, 15kg, 25kg, and 35kg) serving as independent factors. For all the dependent variables examined, significant interactions were found between the subject group and incremented load carriage (p = ) and between the tibial section and incremented load carriage (p = ). Therefore, separate ANOVA tests were run to determine the simple effects from the physical activity history, tibial section, and incremented load carriage on tibial strain variables. 25
26 Table 12: Means (SEs) of tibial bone strain during loaded walking tasks Variables\Conditions WK00 WK15 WK25 WK35 Runners Compressive strain (µs) (1.61) (1.96)* (2.23)* (2.71)* Tensile strain (µs) (1.45) (1.81)* (2.05)* (2.52)* Shear strain (µs) (2.02) (2.40)* (2.72)* (3.48)* Basketball Players Compressive strain (µs) (1.56) (1.90)* (2.16)* (2.63)* Tensile strain (µs) (1.41) (1.75)* (1.99)* (2.47)* Shear strain (µs) (1.96) (2.32)* (2.64)* (3.37)* Note: data were extracted from the middle third of the tibia shaft. WK00, WK15, WK25 and WK35 represent walking tasks with a load carriage of 0kg, 15kg, 25kg, and 35kg, respectively. * indicates a significant difference (p = ) from the previous level of the loaded walking condition. One way repeated-measures ANOVAs with the incremented load carriage being the independent factor were run for the runner group and the ball player group, respectively. For both of the groups, significant differences in compressive strain (p=0.0001), tensile strain (p=0.0001), and shear strain (p=0.0001) were found among loaded walking tasks for each of the three tibial sections. Specifically, a dose-response relationship between the incremented load carriage and tibial strain exists. As the load carriage increased in consistent increments, tibial compressive, tensile, and shear strains increase. Table 12 presents the means (SEs) of the compressive, tensile, and shear strains from the middle third of the tibia during walking with incremented load carriages. Comressive Strain (microstrain) *P= *P= *P= Runners Ball Players 0 15kg 25kg 35kg Loaded Walking Conditions Figure 2: Compressive strain of the middle third of the tibia during loaded walking tasks. The runner group (blue) and the ball player group (red) were compared. 26
27 Tensile Strain (microstrain) *P= *P= *P= Runners Ball Players 0 15kg 25kg 35kg Loaded Walking Conditions Figure 3: Tensile strains of the middle third of the tibia during loaded walking tasks. The runner group (blue) and the ball player group (red) were compared. Shear Strain (microstrain) *P= *P= *P= kg 25kg 35kg Loaded Walking Conditions Figure 4: Shear strain of the middle third of the tibia during loaded walking tasks. The runner group (blue) and the ball player group (red) were compared. One way ANOVA tests with the subject group being the independent factor were run for each of the loaded walking tasks and for each of the tibial sections. Significant differences in compressive strain (p=0.0001), tensile strain (p=0.0001), and shear strain (p=0.0001) were found between the runner group and the ball player group. For all the loaded walking tasks from the 15kg load carriage to 35kg load carriage, the runner group consistently exhibited greater compressive, tensile, and shear strains than the ball player group (p=0.0001). The figures 2, 3, and 4 illustrate the group differences in compressive strain, tensile strain, and shear strain during loaded walking tasks, respectively. 27 Runners Ball Players
28 Compressive Strain (microstrain) Distal_third Middle_third Proximal_third 0kg 15kg 25kg 35kg Loaded Walking Figure 5: Compressive strain of the proximal, middle, and distal thirds of the tibia during walking with incremented loads. 800 Tensile Strain (microstrain) Distal_third Middle_third Proximal_third 0kg 15kg 25kg 35kg Loaded Walking Figure 6: Tensile strain of the proximal, middle, and distal thirds of the tibia during walking with incremented loads. 28
29 Shear Strain (microstrain) Distal_third Middle_third Proximal_third 0kg 15kg 25kg 35kg Loaded Walking Figure 7: Shear strain of the proximal, middle, and distal thirds of the tibia during walking with incremented loads. One way ANOVA tests with the tibial section being the independent factor were run for each of the groups and for each of the loaded walking tasks. Significant differences in tibial compressive strain (p=0.0001), tensile strain (p=0.0001), and shear strain (p=0.0001) were found among the three tibia sections. Specifically, for both groups, the distal third of the tibia exhibited greater compressive strain than both of the middle and proximal thirds of the tibia (p=0.0001); the middle third of the tibia exhibited greater tensile strain than both of the distal and proximal thirds of the tibia (p=0.0001). Furthermore, the ball player group consistently experienced greater shear strain in the distal third of the tibia than in the proximal third of the tibia (during all the loaded walking tasks, p=0.0001) and in the middle third of the tibia (during all the loaded walking tasks (p=0.0001) except the 35kg condition (p=0.616)). The runner group demonstrated greater shear strain in the distal third of the tibia than the other two tibial sections during 0kg and 15kg load carriages (p=0.0001). During 25kg load carriage, the runner group experienced similar shear strain in the middle and distal thirds of the tibia (p=0.602). During 35kg load carriage, the runner group experienced greater shear strain in the middle third of the tibia than the other two tibial sections (p=0.0001). Finally, for both groups, the proximal third of the tibia always experienced the least amount of shear strain within the three tibial sections during loaded walking (p=0.0001). Figures 5, 6, 7 illustrate the profiles of the compressive strain, tensile strain, and shear strain of the three tibial sections during various loaded walking tasks, respectively. Strain during high-impact activities The following dependent variables were examined: peak tensile strain, peak compressive strain, and peak shear strain during the stance of high-impact activities. For each of the dependent variables, a 2x3x3 repeated-measure ANOVA test was run with the subject group (two levels: runners and ball players), tibial section (three levels: distal, middle, and proximal thirds of the tibial shaft), and type of activity (three levels: drop-jumping, running, and cutting maneuver) serving as independent factors. For all the dependent variables examined, significant interactions were found between the subject group and type of activity (p = ) and between the tibial section and type of activity (p=0.0001). Therefore, separate ANOVA tests were run to determine the simple effects from the physical activity history, tibial section, and high-impact activity on tibial strain variables. 29
30 Table 13: Means and SEs of the tibial bone strain during high-impact activities Variables\Conditions Running Jumping Cutting Runners Compressive strain (µs) (3.56)* $ (5.27)* # (4.37)$ # Tensile strain (µs) (2.49)* $ (3.74)* # (3.34)$ # Shear strain (µs) (3.93)* $ (5.64)* # (5.48)$ # Basketball Players Compressive strain (µs) (3.83)* $ (5.95)* # (4.85)$ # Tensile strain (µs) (2.34)* $ (4.06)* # (3.33)$ # Shear strain (µs) (4.34)* $ (6.54)* # (6.04)$ # Note: data were extracted from the middle third of the tibia shaft. * indicates a significant difference (p = ) between running and jumping activities; $ indicates a significant difference (p =0.0001) between running and cutting activities; # indicates a significant difference (p = ) between jumping and cutting activities. One way repeated-measures ANOVA tests with the high-impact activity being the independent factor were run for each of the group and for each of the tibial sections. Significant differences in compressive strain (p=0.0001), tensile strain (p=0.0001), and shear strain (p=0.0001) were found between the three activities. For both of the subject groups, the cutting maneuver elicited the largest compressive strain (p=0.0001), tensile strain (p=0.0001), and shear strain (p=0.0001) among the three activities across the three tibial sections. The jumping activity produced greater tensile strain (p=0.0001) than the running activity for all the tibial sections. Also, the jumping activity produced greater compressive strain (p=0.0001) and shear strain (p=0.0001) at the middle and proximal thirds of the tibia than the running activity. The running activity only exhibited greater compressive train (p=0.0001) and shear strain (p=0.0001) than the jumping activity at the distal third of the tibia shaft. Table 13 presents the tibial strains at the middle third of the tibial shaft during the three high-impact activities. Strain Rate during walking with load carriages: The following dependent variables were examined: peak tensile strain rate (peak maximal principle strain rate), peak compressive strain rate (peak minimal principle strain rate), and peak shear strain rate (peak maximal shear strain rate) during the stance of walking. For each of the dependent variables, a 2x3x4 repeated-measure ANOVA test was run with the subject group (two levels: runners and ball players), tibial section (three levels: proximal third, middle third, and distal third), and incremented load carriage (four levels: 0kg, 15kg, 25kg, and 35kg) serving as independent factors. For all the dependent variables examined, significant interactions were found between the subject group and incremented load carriage (p = ) and between the tibial section and incremented load carriage (p = ). Therefore, separate ANOVA tests were run to determine the simple effects from the physical activity history, tibial section, and incremented load carriage on tibial strain rate variables. 30
31 Table 14: Means (SEs) of tibial bone strain rate during loaded walking tasks Variables\Conditions WK00 WK15 WK25 WK35 Runners Compressive strain rate (µs/s) (24.08) (27.04)* (33.26)* (37.50) Tensile strain rate (µs/s) (20.07) (23.27)* (28.28)* (33.14)$ Shear strain rate (µs/s) (13.30) (15.27)* (20.05)* (24.26)$ Basketball Players Compressive strain rate (µs/s) (23.34) (26.22)* (32.23)* (36.36)* Tensile strain rate (µs/s) (19.46) (22.57)* (27.42)* (32.13)* Shear strain rate (µs/s) (12.90) (14.80)* (19.44)* (23.53)* Note: data were extracted from the middle third of the tibia shaft. WK00, WK15, WK25 and WK35 represent walking tasks with a load carriage of 0kg, 15kg, 25kg, and 35kg, respectively. Significant differences between the current load carriage condition and previous load carriage condition were indicated (* indicates p= ; $ indicates p<0.05). One way repeated-measures ANOVAs with the incremented load carriage being the independent factor were run for the runner group and the ball player group, respectively. For both of the groups, significant differences in compressive strain rate (p=0.0001), tensile strain rate (p=0.0001), and shear strain rate (p=0.0001) were found among loaded walking tasks for each of the three tibial sections. Table 14 presents the means (SEs) of the compressive, tensile, and shear strains rate from the middle third of the tibia during walking with incremented load carriages. Compressive strain rate was evaluated for both of the subject groups and for each of the tibial sections. For the runner group, the distal third of the tibia exhibited pronounced increases of the compressive strain rate as the load carriage increased from 0kg to 15kg (p=0.0001), from 15kg to 25kg (p=0.0001), and from 25kg to 35kg (p=0.06); the middle third of the tibia exhibited significant increases of the compressive strain rate as the load carriage increased from 0kg to 15kg (p=0.0001) and from 15kg to 25kg (p=0.0001); meanwhile, the proximal third of the tibia exhibited significant increases in the compressive strain rate as the load carriage increased from 0kg to 15kg (p=0.0001), from 15kg to 25kg (p=0.0001) and from 25kg to 35kg (p=0.0001). For the ball player group, all the three tibial sections exhibited significant increases of compressive strain rate as the load carriage increased from 0kg to 15kg (p=0.0001), from 15kg to 25kg (p=0.0001), and from 25kg to 35kg (p=0.0001). Tensile strain rate was evaluated for both of the subject groups and for each of the tibial sections. For the runner group, the distal third of the tibia exhibited significant increases of the tensile strain rate as the load carriage increased from 0kg to 15kg (p=0.0001) and from 15kg to 25kg (p=0.0001); the middle third of the tibia exhibited significant increases of the tensile strain rate as the load carriage increased from 0kg to 15kg (p=0.0001), from 15kg to 25kg (p=0.0001), and from 25kg to 35kg (p=0.033); the proximal third of the tibia also exhibited significant increases of the tensile strain rate when the load carriage increased from 0kg to 15kg (p=0.0001), from 15kg to 25kg (p=0.0001), and from 25kg to 35kg (p=0.0001). For the ball player group, all the three tibial sections exhibited significant increases of the tensile strain rate as the load carriage increased from 0kg to 15kg (p=0.0001), from 15kg to 25kg (p=0.0001), and from 25kg to 35kg (p=0.0001). 31
32 Shear strain rate was evaluated for both of the subject groups and for each of the tibial sections. For the runner group, the distal third of the tibia exhibited significant increases of the shear strain rate as the load carriage increased from 0kg to 15kg (p=0.0001) and from 15kg to 25kg (p=0.0001); the middle third of the tibia demonstrated significant increases of the shear strain rate as the load carriage increased from 0kg to 15kg (p=0.0001), from 15kg to 25kg (p=0.0001), and from 25kg to 35kg (p=0.01); meanwhile, the proximal third of the tibia demonstrated significant increases of the shear strain rate as the load carriage increased from 0kg to 15kg (p=0.0001), from 15kg to 25kg (p=0.0001), and from 25kg to 35kg (p=0.0001). For the ball player group, all the three tibial sections exhibited significant increases of the shear strain rate as the load carriage increased from 0kg to 15kg (p=0.0001), from 15kg to 25kg (p=0.0001), and from 25kg to 35kg (p=0.0001). Comressive Strain Rate (microstrain/s) *P= *P= P=0.134 Runners Ball Players 0 15kg 25kg 35kg Loaded Walking Conditions Figure 8: Compressive strain rate of the middle third of the tibia during loaded walking tasks. The runner group (blue) and the ball player group (red) were compared. Tensile Strain Rate (microstrain/s) *P= *P= *P= Runners Ball Players 0 15kg 25kg 35kg Loaded Walking Conditions Figure 9: Tensile strain rate of the middle third of the tibia during loaded walking tasks. The runner group (blue) and the ball player group (red) were compared. 32
33 Shear Strain Rate (microstrain/s) *P= *P= *P= Runners Ball Players 0 15kg 25kg 35kg Loaded Walking Conditions Figure 10: Shear strain rate of the middle third of the tibia during loaded walking tasks. The runner group (blue) and the ball player group (red) were compared. One way ANOVA tests with the subject group being the independent factor were run for each of the loaded walking tasks and for each of the tibial sections. Significant differences in compressive strain rate (p=0.0001), tensile strain rate (p=0.0001), and shear strain rate (p=0.0001) were found between the runner group and the ball player group. Figures 8, 9, and 10 illustrate the group differences in compressive strain rate, tensile strain rate, and shear strain rate during loaded walking tasks, respectively. The compressive strain rate was evaluated for each of the loaded walking tasks and for each of the tibial sections. During the 15kg and 25kg load carriages, the runner group demonstrated greater strain rate than the ball player group (p=0.0001) across all tibial sections. During the 35kg load carriage, compared to the ball player group, the runner group exhibited less strain rate (p=0.005) at the distal third of the tibia, more strain rate (p=0.0001) at the proximal third of the tibia, and no difference (p=0.134) in strain rate at the middle third of the tibia. The tensile strain rate was evaluated for each of the loaded walking tasks and for each of the tibial sections. During the 15kg and 25kg load carriages, the runner group demonstrated greater strain rate than the ball player group (p=0.0001) across all tibial sections. During the 35kg load carriage, compared to the ball player group, the runner group exhibited less tensile strain rate (p=0.0001) at the distal third and middle third of the tibia and more strain rate (p=0.0001) at the proximal third of the tibia. The shear strain rate was evaluated for each of the loaded walking tasks and for each of the tibial sections. During the 15kg and 25kg load carriages, the runner group demonstrated greater strain rate than the ball player group (p=0.0001) across all tibial sections. During the 35kg load carriage, compared to the ball player group, the runner group exhibited less shear strain rate (p=0.0001) at the distal third and middle third of the tibia and more strain rate (p=0.0001) at the proximal third of the tibia. 33
34 Compressive Strain Rate (microstrain/s) Distal_third Middle_third Proximal_third 0kg 15kg 25kg 35kg Loaded Walking Figure 11: Compressive strain rate of the proximal, middle, and distal thirds of the tibia during walking with incremented loads Tensile Strain Rate (microstrain/s) Distal_third Middle_third Proximal_third 0kg 15kg 25kg 35kg Loaded Walking Figure 12: Tensile strain rate of the proximal, middle, and distal thirds of the tibia during walking with incremented loads. 34
35 Compressive Strain Rate (microstrain/s) Distal_third Middle_third Proximal_third 0kg 15kg 25kg 35kg Loaded Walking Figure 13: Compressive strain rate of the proximal, middle, and distal thirds of the tibia during walking with incremented loads. One way ANOVA tests with the tibial section being the independent factor were run for each of the groups and for each of the loaded walking tasks. Significant differences in tibial compressive strain rate (p=0.0001), tensile strain rate (p=0.0001), and shear strain rate (p=0.0001) were found among the three tibia sections. Specifically, for both groups, the middle third of the tibia exhibited the greatest compressive strain rate (p=0.0001), tensile strain rate (p=0.0001), and shear strain rate (p=0.0001) among the three tibial sections across all load carriages. In addition, the proximal third of the tibia exhibited the least amount of strain rates in compression (p=0.0001), tension (p=0.0001), and shear (p=0.0001) among the three tibial sections across all load carriages. Figures 11, 12, 13 illustrate the profiles of the compressive strain rate, tensile strain rate, and shear strain rate of the three tibial sections during various loaded walking tasks, respectively. Strain rate during high-impact activities The following dependent variables were examined: peak tensile strain rate, peak compressive strain rate, and peak shear strain rate during the stance of high-impact activities. For each of the dependent variables, a 2x3x3 repeated-measure ANOVA test was run with the subject group (two levels: runners and ball players), tibial section (three levels: distal, middle, and proximal thirds of the tibial shaft), and type of activity (three levels: drop-jumping, running, and cutting maneuver) serving as independent factors. For all the dependent variables examined, significant interactions were found between the subject group and type of activity (p = ) and between the tibial section and activity (p=0.0001). Therefore, separate ANOVA tests were run to determine the simple effects from the physical activity history, tibial section, and high-impact activity on tibial strain rate variables. 35
36 Table 15: Means and SEs of the tibial bone strain rate during high-impact activities Variables\Conditions Running Jumping Cutting Runners Compressive strain rate (µs/s) (69.08)* $ (92.58)* # (87.93)$ # Tensile strain rate (µs/s) (59.08)* $ (73.54)* # (68.85)$ # Shear strain rate (µs/s) (42.10)* $ (56.36)* # (49.17)$ # Basketball Players Compressive strain rate (µs/s) (69.08)* $ (102.68)* # (90.16)$ # Tensile strain rate (µs/s) (58.65)* $ (80.97)* # (65.28)$ # Shear strain rate (µs/s) (44.30)* $ (64.55)* # (52.53)$ # Note: data were extracted from the middle third of the tibia shaft. * indicates a significant difference (p = ) between running and jumping activities; $ indicates a significant difference (p =0.0001) between running and cutting activities; # indicates a significant difference (p = ) between jumping and cutting activities. One way repeated-measures ANOVA tests with the high-impact activity being the independent factor were run for each of the group and for each of the tibial sections. Significant differences in compressive strain rate (p=0.0001), tensile strain rate (p=0.0001), and shear strain rate (p=0.0001) were found between the three activities. For both of the subject groups, the cutting maneuver elicited the largest compressive strain rate (p=0.0001), tensile strain rate (p=0.0001), and shear strain rate (p=0.0001) among the three activities across the three tibial sections; the jumping activity produced greater compressive strain rate (p=0.0001), tensile strain rate (p=0.0001), and shear strain rate (p=0.0001) than the running activity at the middle and proximal thirds of the tibia; the running activity only led to greater compressive strain rate (p=0.0001) and shear strain rate (p=0.0001) at the distal third of the tibia than the jumping activity. Finally, running activity performed by the runner group exhibited greater tensile strain rate (p=0.0001) at the distal third of the tibia than the jumping activity, while the running activity performed by the ball player group exhibited less tensile strain rate (p=0.0001) at the distal third of the tibia than the jumping activity. Table 15 presents the tibial strain rates at the middle third of the tibial shaft during the three high-impact activities. SUMMARY and DISCUSSION: Load carriage leads to significant alterations of gait spatio-temporal parameters and kinetics. The increases of the vertical ground reaction force and loading rate are proportional to the increments of load carried. Although runners and basketball players recruited in this study had distinct physical activity histories, they exhibited no differences in ground reaction forces and loading rates during loaded walking tasks. The results imply that when participating in unaccustomed activities (e.g. loaded walking), both the runner and basketball groups could experience similar mechanical loadings. When performing running movement, habitual runners recruited in this study demonstrated an ability to lower the ground reaction forces. Running with reduced ground impact forces could result in decreased risks of impact related overuse injuries. As the runners have adapted to the running environment by lowering impact forces, runners tibia bones may also have adapted to the same loading environment. 36
37 On one hand, adaptation to a loading environment with reduced impact forces could mean the tibia bone may have remodeled itself for the reduced imposed mechanical loadings via decreasing bone density at some parts of the bone for metabolic efficiency purposes. On the other hand, when the loading environment is changed to an unaccustomed situation (e.g. loaded walking), the tibia bone may need to accelerate the remodeling process to become capable of resisting the novel loadings. We had hypothesized that the incremented load carriages would lead to increases of tibia bone strain. This hypothesis was supported. It was found that the tibial compressive, tensile, and shear strains increased significantly as the load carriage increased from 0kg to 15kg, from 15kg to 25kg and from 25kg to 35kg. The current finding of this significant dose-response relationship between the load carriage and tibial strain indicates that the tibia bone deformation during loaded walking is positively related to the amount of load carried. Thus, it is possible that increasing the load carriage during military training could lead to increased risk of tibia bone damage due to the increase of bone deformation. We had hypothesized that the past physical-training history could influence the tibial bone strain during loaded walking. This hypothesis was supported. We found the runner group demonstrated larger tibial compressive, tensile, and shear strain than the ball player group during walking with incremented load carriages. Participating in running for minimum of two years, the runner group may have remodeled their tibial bones to accommodate the uni-axial cyclic loading encountered during running. On the contrary, minimum of two years of experiencing the irregular multi-axial loading during basketball may shape the tibias of the ball player group to better resist unaccustomed loadings. In this study, the tibias of the ball player group demonstrated less bone deformation during loaded walking than those of the runner group. Thus, it is evident that the tibias of the ball player group are more resilient to the unaccustomed loading from load carriages than those of the runner group. The strains of the proximal, middle, and distal thirds of the tibia were examined during load carriages. It was found that the middle third of the tibia always experienced the largest tensile strain and the distal third of the tibia always experienced the largest compressive strain among the three tibial thirds. The proximal third of the tibia was found to experience the least amount of the strains among the three tibial thirds during load carriages. Previous studies examined in vivo tibial bone strain at the anterior-medial aspect of the middle bone shaft and considered this site was a common location of tibial stress fracture [13, 14, 17]. Findings from this study provide evidence to the assumption taken by those studies [13, 14, 17]. As bone is generally weak to tensile stress, sustaining pronounced tensile strain at the middle third of the tibia during loaded walking could result in increased risk of stress fractures. We had hypothesized that high impact, irregular sporting maneuvers such as cutting and drop-jumping, which were consistent with those performed in basketball, produce different tibial strain patterns than those produced during running. This hypothesis was supported. The cutting maneuver elicited largest amount of compressive, tensile, and shear strains among the three high-impact activities tested. The drop-jumping activity produced greater strains at the middle third of the tibia than the running activity. The running activity only resulted in larger compressive strain than drop-jumping at the distal third of the tibia. Thus, it is evident that participating in high-impact irregular maneuvers consisting cutting and drop-jumping could lead to strengthening tibial bone in general; in particular, the bone quality of the middle third of the tibia can be improved to become more resilient to tensile loads. As the middle third of the tibia is a vulnerable site sustaining stress fracture during military training [13, 14, 17], a preconditioning program consisting high-impact irregular activities such as cutting and drop-jumping may be beneficial to military recruits who are entering basic training and facing high risk of tibial stress fractures. 37
38 We had hypothesized that incremented load carriages would result in increases of tibial bone strain rates. This hypothesis was supported in general. We found the ball player group exhibited pronounced increases of compressive, tensile, and shear strain rates at all the three tibial sections as the load carriage increased from 0kg to 15kg, from 15kg to 25kg, and from 25kg to 35kg, respectively. The runner group also experienced similar strain rate patterns when the load carriage increased from 0kg to 15kg and from 15kg to 25kg. In addition, the runner group experienced the following strain rate patterns: increased compressive strain rate at the distal third of the tibia with the load carriage increasing from 25kg to 35kg; increased tensile strain rate and shear strain rate at the middle third of the tibia with the load carriage increasing from 25kg to 35kg. Interestingly, the compressive strain rate at the middle third of the tibia, the tensile strain rate and shear strain rate at the distal third of the tibia stay unchanged with the load carriage increasing from 25kg to 35kg. As load carriage is accompanied with alterations of gait patterns [4, 18], it is possible that the adjustments of gait signified by reducing stride length and increasing lower-extremity flexion angles could have an effect on strain rate. Reducing the strain rate at the 25kg level of load carriage may be a response from the runner group to prevent bone damage due to cyclic loading during load carriage. On the contrary, the ball player group did not exhibit a threshold effect on bone strain rate before the 35kg load. This reflects that the tibias of the ball player group may be strong enough to sustain higher level loads than the 35kg load. We had hypothesized that the past physical-training history could influence the tibial bone strain rate during loaded walking. This hypothesis was supported. The runner group consistently demonstrated larger tibial strain rates than those of the ball player group when carrying 15kg and 25kg loads. Interestingly, when the load carriage increased to a 35kg load, the runner group started showing lower strain rates than the ball player group. It is possible that a strain rate threshold exists during loaded walking. This strain rate threshold may be dependent on the tibial bone quality. If the tibial bone is not accustomed to a loading environment such as incremented load carriages in this study, protective strategies signified by alternating gait kinematics may result in a reduction of bone strain rates. Therefore, as the runner group experienced unchanged strain rates after the 25kg load carriage and lower strain rates at 35kg load carriage than the ball player group, it is likely that the tibias of the runner group may be less resilient to load carriages than the tibias of the ball player group. When examining the strain rates at the proximal, middle, and distal thirds of the tibia during load carriages, we found the middle third of the tibia sustained the highest strain rate within the three tibial sections. The middle third of the tibia has long been considered a vulnerable site sustaining stress fracture during military training [13, 14, 17]. Findings from this study provide evidence to support this consensus. During military basic training, it is possible that load carriage could lead to a pronounced increase of strain rates at the middle third of the tibia. Bone remodeling may be accelerated, which could temporarily weaken the bone structure. If the load carriage training continues, the risk of developing stress fracture at the middle third of the tibia could be increased. We had hypothesized that high impact, irregular sporting maneuvers such as cutting and drop-jumping, which were consistent with those performed in basketball, produce different tibial strain rate patterns than those produced during running. This hypothesis was supported. We found that the cutting maneuver generated the highest strain rates than the drop-jumping and running activities and the drop-jumping resulted in greater strain rates at the middle third of the tibia than running. Thus, it is evident that participating in sports comprising high impact multi-directional loadings such as cutting and dropjumping could be beneficial to strengthen tibial bones, which could become resilient to load carriages. 38
39 CONCLUSION Load carriages result in increases in tibial strains and strain rates. A dose-response relationship exists between incremented load carriages and bone strains. A threshold in strain rate may exist during walking with incremented load carriages. This threshold may serve as a protective mechanism to limit the increase of strain rates. Past training history has an influence on tibial strains and strain rates. For any given load carriage, basketball players experienced smaller increases of bone strains than runners. During load carriages, the middle third of the tibia experienced the highest strain rates and tensile strain among the three tibial sections. Cutting and drop-jumping maneuvers demonstrated greater strain and strain rates at the middle third of the tibia than running. For military recruits entering the basic training, a pre-conditioning program comprised with high impact, irregular sporting maneuvers such as basketball may be beneficial for strengthening tibial bones to resist unaccustomed loadings from load carriage training. REFERENCES 1. Kaminskly LA, W.M., Evaluation of a new standardized ramp protocol: the BSU/Bruce Ramp protocol. J cardiopulm Rehabil, (6): p Hoffman, J.R., et al., The effect of leg strength on the incidence of lower extremity overuse injuries during military training. Mil Med, (2): p Thompson, W., ACSM's Guidelines for Exercise Testing and Prescription. 2009, Philadelphia: Lippincott Williams & Wilkins. 4. Harman, E., et al., Physiological, biomechanical, and maximal performance comparisons of female soldiers carrying loads using prototype U.S. Marine Corps Modular Lightweight Load- Carrying Equipment (MOLLE) with Interceptor body armor and U.S. Army All-Purpose Lightweight Individual Carrying Equipment (ALICE) with PASGT body armor, in USARIEM Technical Report T Christina, K.A., S.C. White, and L.A. Gilchrist, Effect of localized muscle fatigue on vertical ground reaction forces and ankle joint motion during running. Hum Mov Sci, (3): p Gerlach, K.E., et al., Kinetic changes with fatigue and relationship to injury in female runners. Med Sci Sports Exerc, (4): p Dwyer, G.B. and S.E. DAvis, eds. ACSM's Health-Related Physical Fitness Assessment Manual 2005, Lippincott Williams &Wilkins: Baltimore. 8. Al Nazer, R., et al., Analysis of dynamic strains in tibia during human locomotion based on flexible multibody approach integrated with magnetic resonance imaging technique. Multibody System Dynamics, : p Huaining, C., L. Obergefell, and A. Rizer. The development of the GEBOD program. in Biomedical Engineering Conference, 1996., Proceedings of the 1996 Fifteenth Southern Sigward, S.M. and C.M. Powers, The influence of gender on knee kinematics, kinetics and muscle activation patterns during side-step cutting. Clin Biomech, (1): p Rho JY, Hobatho, M.C., and Ashman, R.B. Relations of mechanical properties to density and CT numbers in human bone. Med Eng Phys (5): p Lanyon, L.E., et al., Bone deformation recorded in vivo from strain gauges attached to the human tibial shaft. Acta Orthop Scand, (2): p
40 13. Burr, D.B., et al., In vivo measurement of human tibial strains during vigorous activity. Bone, (5): p Milgrom, C., et al., In-vivo strain measurements to evaluate the strengthening potential of exercises on the tibial bone. J Bone Joint Surg Br, (4): p Milgrom, C., et al., The effect of muscle fatigue on in vivo tibial strains. J Biomech, (4): p Milgrom, C. The role of strain and strain rate in stress fractures. In: Burr, D.B., Milgrom, C. (Eds.), Musculoskeletal Fatigue and Stress Fractures. CRC Press, Boca Raton. Fl p Burr, D.B. Bone, Exercise, and Stress Fractures. Exerc Sport Sci Rev : p Kinoshita, H. Effects of different loads and carrying systems on selected biomechanical parameters describing walking gait. Ergon, (9): p
41 Appendix A Abstract presented at the North West Biomechanics Symposium (NWBS) in Seattle, WA. May21 May 22, Title: An Integrated Modeling Method for Tibia Strain Analysis 41
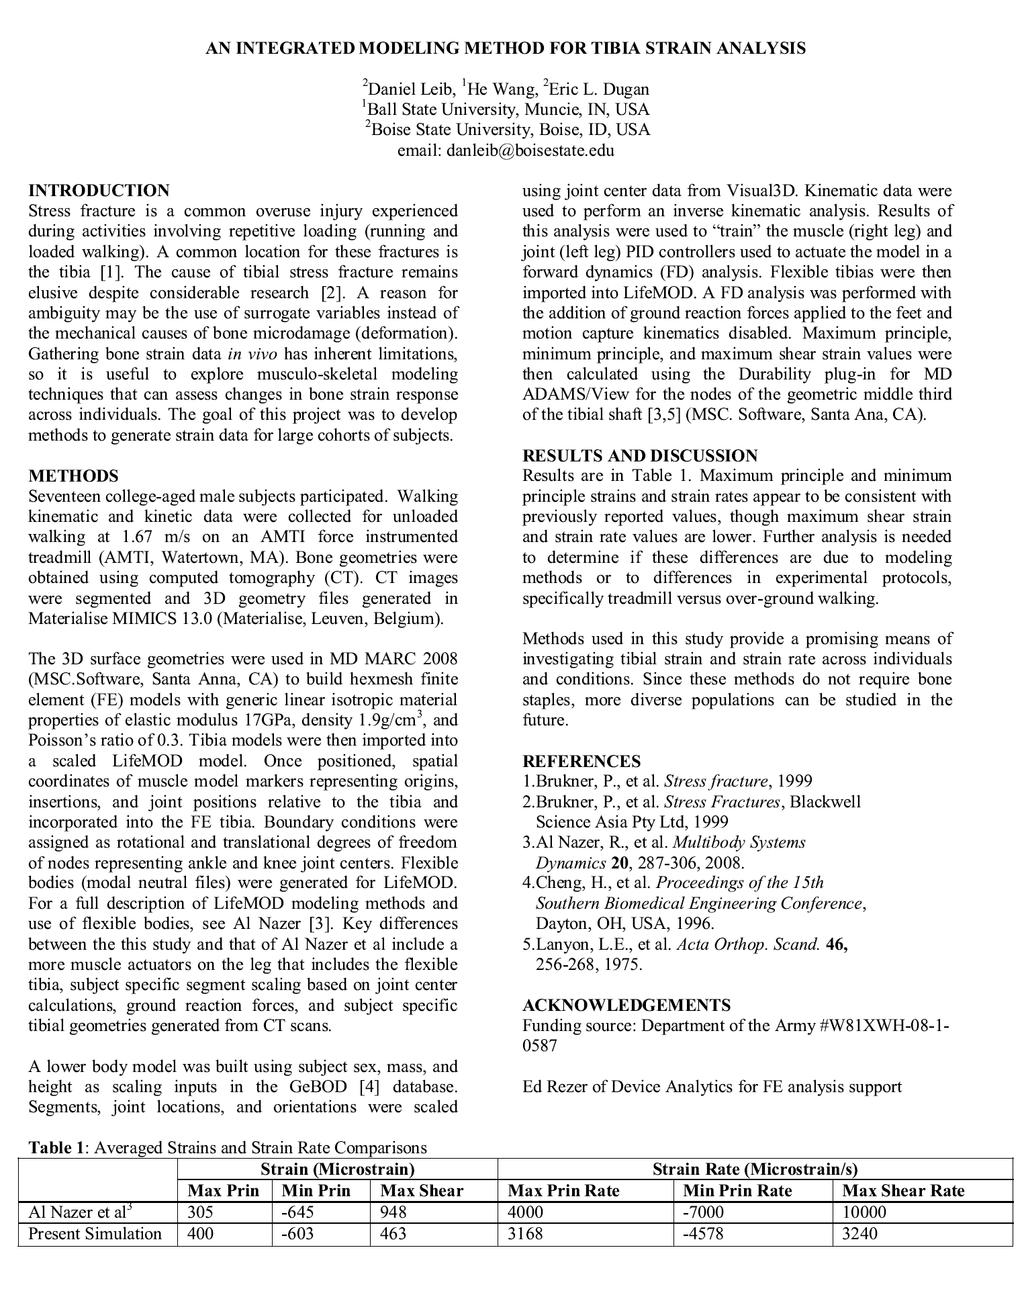
42 42
43 Appendix B Abstract presented at the 56 th annual meeting of American College of Sports Medicine (ACSM) in Baltimore, MD. June 2- June 5, The abstract was published in Medicine & Science in Sports & Exercise. V. 42, No. 5 Supplement, S192 Title: Muscular Fatigue Increases Ground Reaction Loading Rate during Walking 43
44 Medicine & Science in Sports & Exercise: May Volume 42 - Issue 5 - pp doi: /01.MSS A-24 Free Communication/Poster - Gait Analysis: JUNE 2, :30 AM - 12:30 PM: ROOM: Hall C Muscular Fatigue Increases Ground Reaction Loading Rate During Walking: 1433: Board #89 June 2 11:00 AM - 12:30 PM WANG, HE 1 ; FRAME, JEFF 1 ; OZIMEK, ELICIA 1 ; REEDSTROM, CARA 1 ; LEIB, DANIEL 2 ; DUGAN, ERIC 2 1 Ball State University, Muncie, IN. 2 Boise State University, Boise, ID. wanghenr@gmail.com (No disclosure reported) Military personnel are commonly afflicted by overuse injuries such as tibia stress fracture during basic physical training. Muscular fatigue is thought to reduce the leg muscles' ability to attenuate dynamic load on human musculoskeletal system during locomotion (Voloshin, et al. 1998). However, it is not clear if or how muscular fatigue influences mechanical loading of the lower extremities and increases the risk of developing tibia stress fracture. PURPOSE: Compare peak ground impact forces and loading rates during a fatigued and unfatigued walking task. METHODS: Fourteen healthy male subjects (age: 21±2 yr.; body mass: 81.5±11.3 kg; body height: 182±4 cm) participated in the study. Subjects participated in a fatiguing protocol which involved a series of metered step-ups and heel raises while wearing a 16 kg rucksack. The presence of fatigue was determined by a decline in performance of a vertical jump test (< 80% of vertical jump max) Prior to and immediately after the fatiguing protocol, subjects performed level walking at 1.67 m/s on a force instrumented treadmill (AMTI). The following variables were analyzed: Peak vertical and antero-posterior ground reaction forces and peak instantaneous vertical and braking loading rates during first half of the stance. A one way repeated measures MANOVA was used to determine differences in these variables between unfatigued and fatigued conditions. a = RESULTS: Compared to unfatigued condition, during the fatigued condition the subjects exhibited greater vertical ground reaction forces (1.36 ± 0.11 vs ± 0.07 BW, respectively) (p = 0.000), greater instantaneous vertical loading rates (24.46 ± 9.92 vs ± 4.51 BW/s, respectively.) (p = 0.000), and greater instantaneous braking loading rates ( ± 3.02 vs ± 1.99 BW/s, respectively.) (p =0.001). CONCLUSION: Increased vertical loading rate has been linked to higher risk of tibia stress fracture for distance runners (Milner et al. 2006). In this study, muscular fatigue seems to lead to increases of vertical ground impact and instantaneous loading rates during walking at the given speed. It is possible that military personnel under the influence of muscular fatigue may face increased risk of tibia stress fracture when participating in intensive physical training programs. DoD#W81XWH The American College of Sports Medicine 44
45 Appendix C Abstract presented at the 34 th Annual Meeting of American Society of Biomechanics (ASB) in Provincial, RI, August 18- August 20, 2010 Title: Load Carriage Increases Mechanical Loading Rates during Walking 45
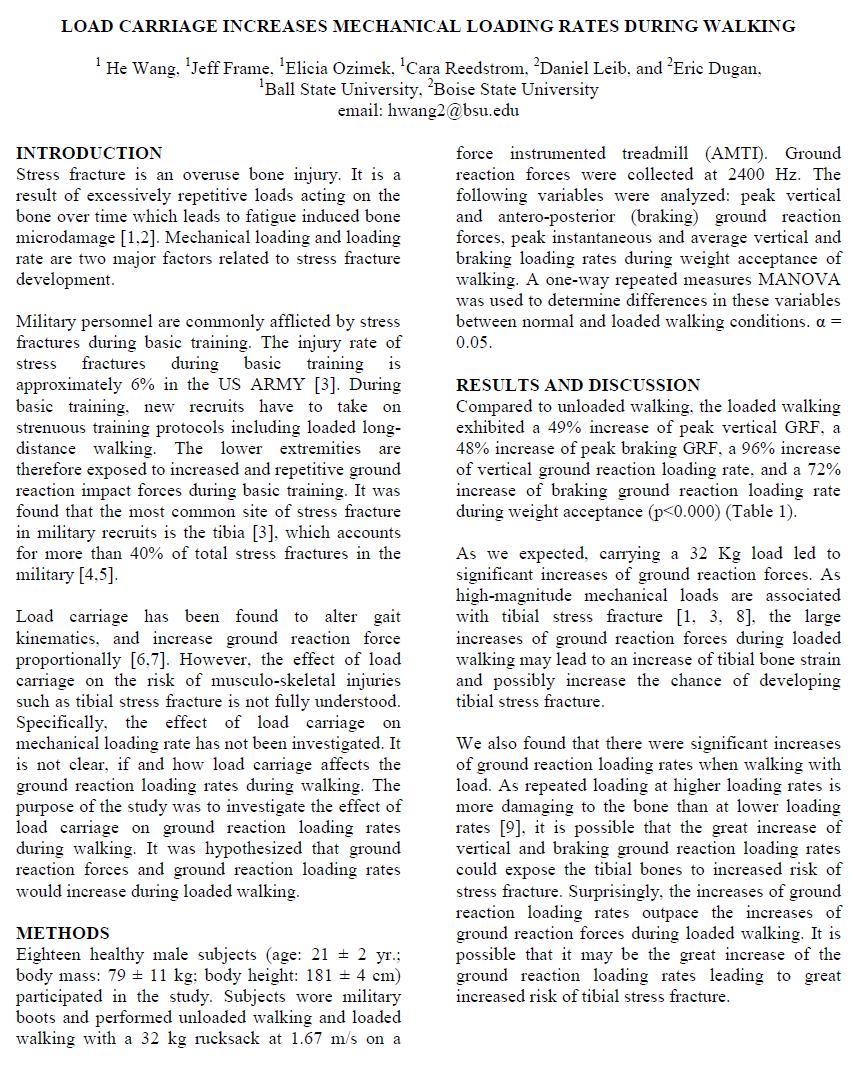
46 46
47 47
48 Appendix D Abstract presented at the 34 th Annual Meeting of American Society of Biomechanics (ASB) in Provincial, RI, August 18- August 20, 2010 Title: An Integrated Modeling Method for Bone Strain Analysis 48
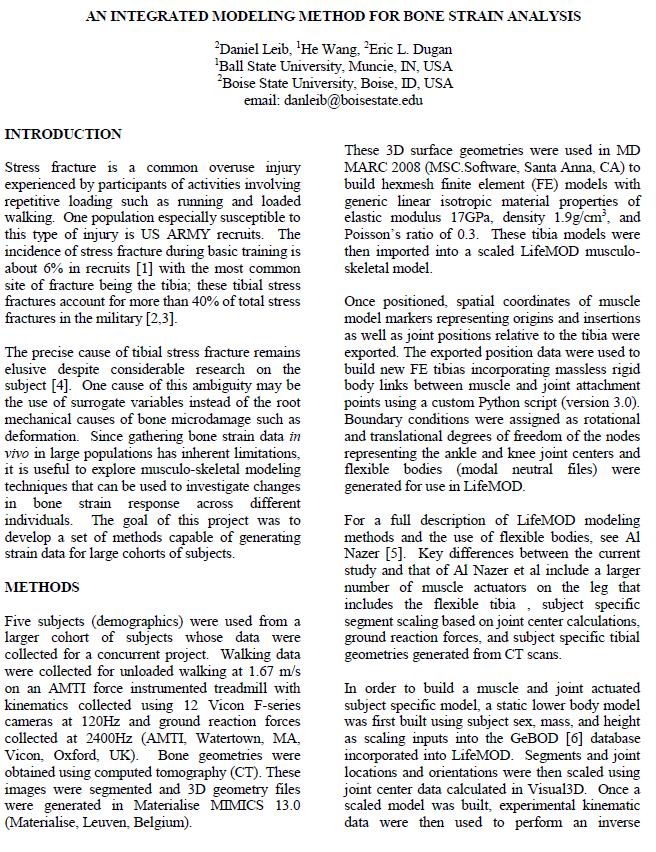
49 49
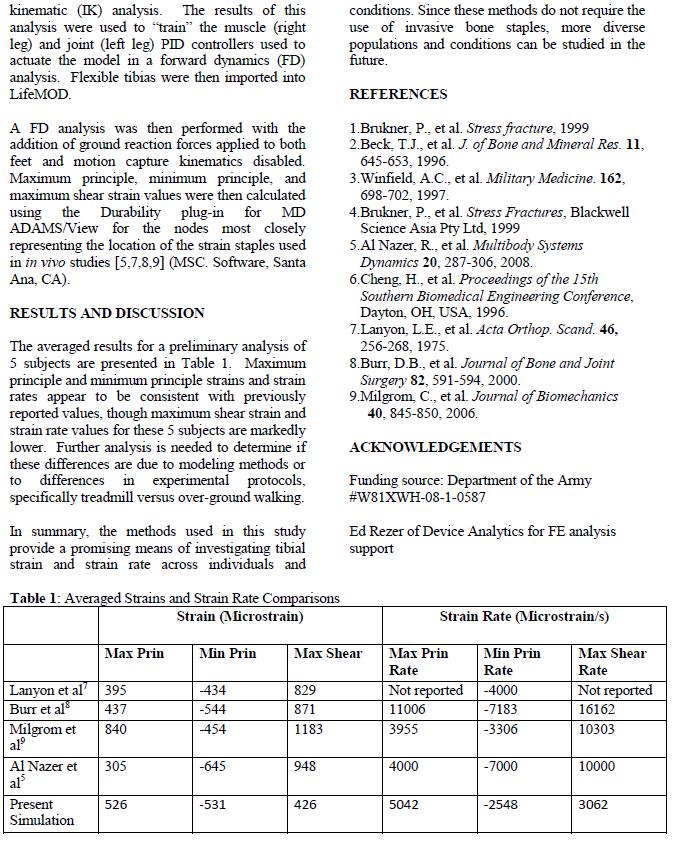
50 50
51 Appendix E Abstract presented at the 58 th annual meeting of American College of Sports Medicine (ACSM) in Denver, CO. June 1- June 4, The abstract was published in Medicine & Science in Sports & Exercise. V. 43, No. 5 Supplement, S21-22 Title: Effects of Load Carriage and Muscular Fatigue on Ground Reaction Loading Rate during Walking 51
52 Medicine & Science in Sports & Exercise: May Volume 43 - Issue 5 - p 30 doi: /01.MSS C-15 Thematic Poster - Obesity and Gait: JUNE 2, :00 AM - 10:00 AM: ROOM: 101 Effects Of Load Carriage And Muscular Fatigue On Ground Reaction Loading Rate During Walking: 629: Board #4 8:00 AM - 10:00 AM Wang, Henry 1 ; Frame, Jeff 1 ; Ozimek, Elicia 1 ; Reedstrom, Cara 2 ; Leib, Daniel 2 ; Dugan, Eric 2 1 Ball State University, Muncie, IN. 2 Boise State University, Boise, ID. hwang2@bsu.edu (No relationships reported) Military personnel are often afflicted by tibia stress fracture (TSF) during basic training. Load carriage and muscle fatigue may be factors related to the high incidence of TSF. Load carriage increases ground reaction force during walking. Muscle fatigue reduces muscles' ability to attenuate dynamic load on musculoskeletal system during locomotion. However, it is yet to be determined what effects load and fatigue may elicit in mechanical loading rate during walking. PURPOSE: To determine the effects of load carriage and fatigue on peak vertical ground reaction force and loading rate during walking. METHODS: Eighteen healthy males (age: 21 ± 2 yrs, body mass: 77.6 ± 9.6 kg, body height: 181 ± 4 cm) performed tasks in the following order: unloaded and unfatigued walking (UU), loaded and unfatigued walking with a 32 kg rucksack (LU), a fatiguing protocol consisting of stepping and heel-raising with a 16 kg rucksack, loaded and fatigued walking with a 32 kg rucksack (LF), and unloaded fatigued walking (UF). Each walking task was performed for 5 min on a force instrumented treadmill (AMTI) at 1.67 m/s. Peak vertical ground reaction force and loading rate at weight acceptance were normalized to body weight. One way repeated measures ANOVAs and pair-wise comparisons with Bonferroni correction were performed. α = RESULTS: The peak vertical ground reaction forces of the UF (1.35 ± 0.11 BW), LU (1.92 ± 0.18 BW), and LF (1.99 ± 0.19 BW) were all greater than that of the UU (1.27 ± 0.06 BW) (p < 0.05). The peak vertical ground reaction loading rates of the UF (21.75 ± 7.92 BW/s), LU (35.29 ± BW/s), and LF (37.58 ± BW/s) were all greater than that of the UU (16.81 ± 3.40 BW/s) (p < 0.05). CONCLUSION: Fatigue, load carriage, and the combination of load carriage and fatigue all lead to significant increases of mechanical loading and loading rate on the lower extremities during walking. As great magnitudes of mechanical loading and loading rate are identified risk factors of TSF, the effects of load carriage and muscle fatigue could expose military personnel to increased risk of TSF during basic training. Interestingly, the increases of mechanical loading rate are more pronounce than that of the mechanical loading. Mechanical loading rate may have greater effect on the development of TSF than the loading magnitude. DOD#W81XWH The American College of Sports Medicine 52
53 Appendix F Abstract presented at the 58 th annual meeting of American College of Sports Medicine (ACSM) in Denver, CO. June 1- June 4, The abstract was published in Medicine & Science in Sports & Exercise. V. 43, No. 5 Supplement, S639 Title: The Effect of Height on Tibial Strain during Drop Landings 53
54 Medicine & Science in Sports & Exercise: May Volume 43 - Issue 5 - pp doi: /01.MSS G-39 Free Communication/Poster - Modeling: JUNE 4, :30 AM - 11:00 AM: ROOM: Hall B The Effect of Height on Tibial Strain During Drop Landings: 3174: Board #137 June 4 9:30 AM - 11:00 AM Dueball, Scott S.; Wang, Henry Ball State University, Muncie, IN. scott.s.dueball@gmail.com (No relationships reported) During landing, the human body is required to absorb impact forces throughout its tissues. Muscle and connective tissue dissipate much of this force. A portion of the impact is delivered to the bones. Repetitive forces acting on the tibia during landing can cause microfractures which may lead to stress fracture. It is difficult to quantify bone strain through invasive measure such as bone staple. PURPOSE: To calculate changes in bone strain during landing using a noninvasive approach by integrating a finite element tibia in a musculoskeletal model. METHODS: A musculoskeletal model representing a healthy male subject (22 years, 78.6 kg, 1.85 m) was created. A flexible tibia, created from a CT scan of the subject's right tibia, was included in the model. Motion capture data were collected while the subject performed drop landings from three separate heights (26, 39, and 52 cm) and served as inputs to perform dynamic simulations. Surface electromyography and joint angle data were compared to their simulation using a cross correlation. Maximum magnitudes of principal and maximum shear strain were computed. RESULTS: Strong cross-correlation coefficients (CCC > 0.87) were found between recorded and simulated lower extremity joint angles. Recorded activity in the vastus lateralis, vastus medialis, and the tibialis anterior agreed strongly with the model (CCC > 0.75). Weaker relationships existed in the gastrocnemius, hamstring, and soleus, which may be due to co-contraction. Maximum principal strain increased with height in 26cm (595 ± 136 μstrain), 39cm (879 ± 134 μstrain), and 52cm (1077 ± 108 μstrain). Minimum principal strain negatively increased with height in 26cm (-593 ± 86 μstrain), 39cm (-645 ± 35 μstrain), and 52cm (-769 ± 33 μstrain) landings. Maximum shear strain followed the same increasing trend in 26cm (592 ± 111 μstrain), 39cm (760 ± 83 μstrain), and 52cm (899 ± 98 μstrain) landings. CONCLUSION: The simulated results showed reasonable agreement with the recorded lower extremity joint angles and muscle activities. The calculated tibial strains were in reasonable agreement with the literature. This study demonstrates a valid non-invasive method of simulating landing movement and computing tibial strain produced during landing movements. Supported by DoD #W81XWH and BSU 2009 ASPiRE. 2011The American College of Sports Medicine 54
55 Appendix G Abstract presented at the 35 th Annual Meeting of American Society of Biomechanics (ASB) in Long Beach, CA, August 10- August 14, 2011 Title: Influences of Load Carriage and Fatigue on Lower-extremity Kinetics during Walking 55
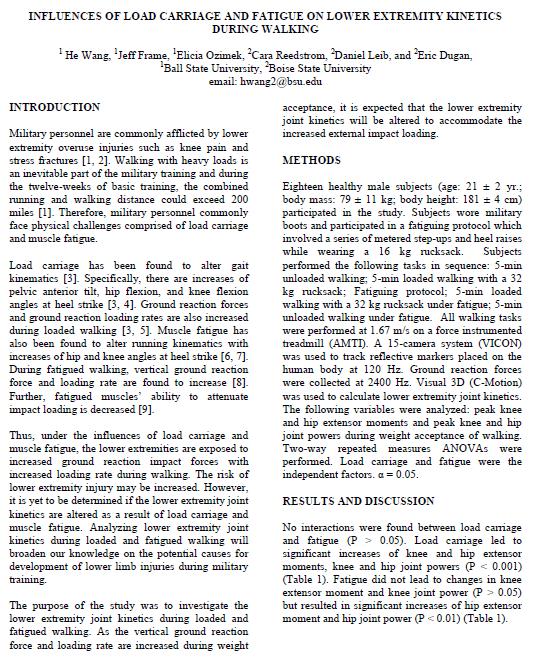
56 56
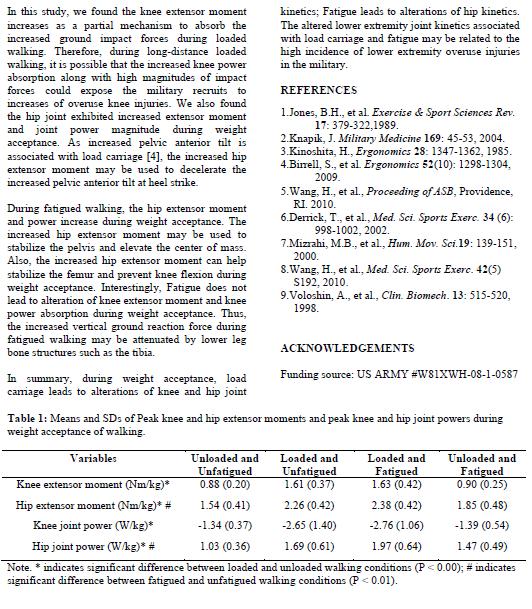
57 57
58 Appendix H Abstract presented at the 35 th Annual Meeting of American Society of Biomechanics (ASB) in Long Beach, CA, August 10- August 14, 2011 Title: A Time-efficient Method for Analyzing Bone Strain with Large Subject Pools 58
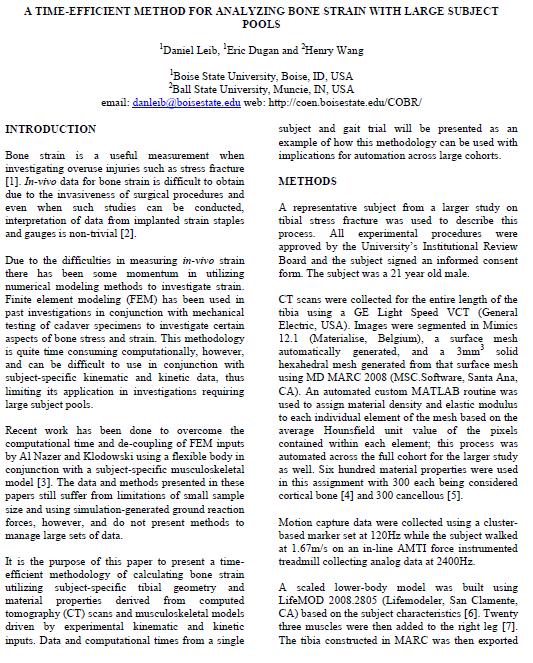
59 59
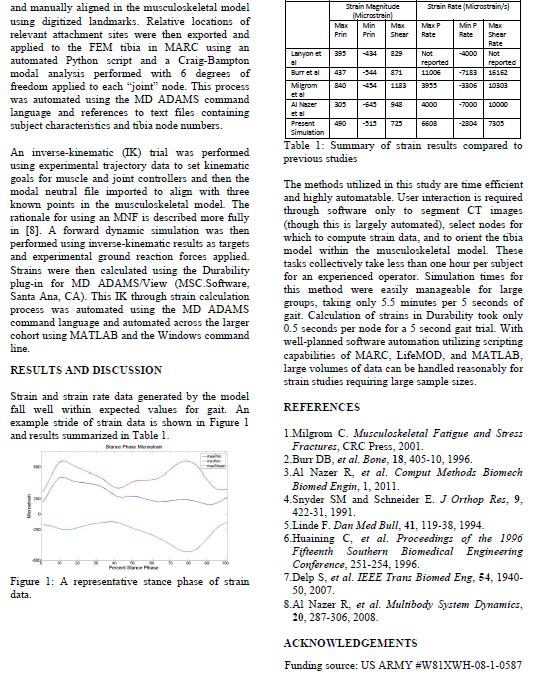
60 60
61 Appendix I The following manuscript was published in Journal of Military Medicine, 177(2), 2012 Title: Influence of Fatigue and Load Carriage on Mechanical Loading during Walking 61
62 62
63 63
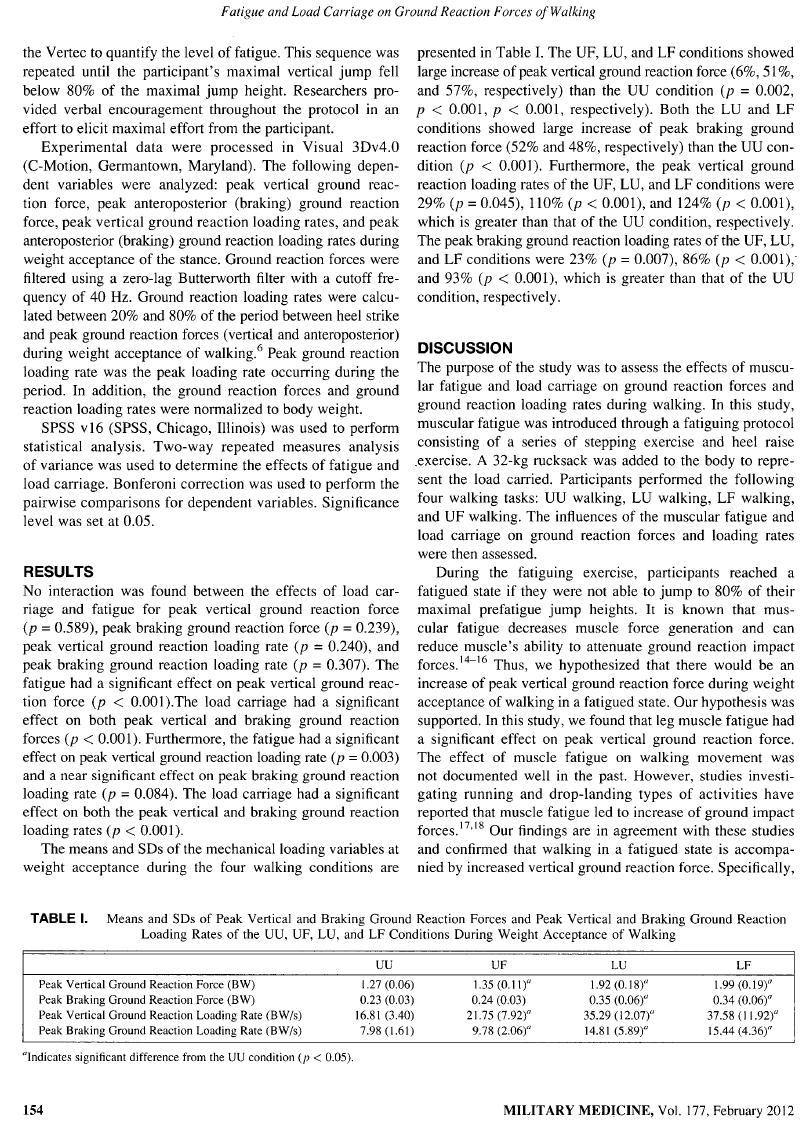
64 64
65 65
66 66
67 Appendix J Abstract presented at the 59 th annual meeting of American College of Sports Medicine (ACSM) in San Francisco, CA. June 1- June 4, The abstract was published in Medicine & Science in Sports & Exercise. V. 44, No. 5 Supplement, S Title: Influence of Physical Activity History on Ground Reaction Force during Walking 67
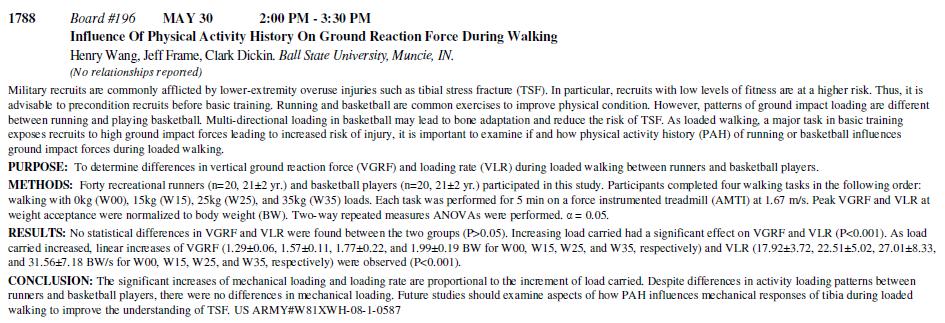
68 68
69 Appendix K Abstract presented at the 36 th Annual Meeting of American Society of Biomechanics (ASB) in Gainesville, FL, August 14- August 18, 2012 Title: The Effects of Load Carriage and Fatigue on Frontal-plane Knee Mechanics during Walking 69
70 THE EFFECTS OF LOAD CARRIAGE AND FATIGUE ON FRONTAL-PLANE KNEE MECHANICS DURING WALKING 1 He Wang, 1 Jeff Frame, 1 Elicia Ozimek, 2 Daniel Leib, and 2 Eric Dugan, 1 Ball State University, 2 Boise State University hwang2@bsu.edu INTRODUCTION Military personnel are commonly afflicted by lower extremity overuse injuries [1, 2]. Overuse knee conditions are among the most common injuries during basic training [3]. Walking with heavy loads is an inevitable part of the military training, and during the twelve-weeks of basic training, the loaded running and walking distance could exceed 200 miles [1]. Therefore, military personnel have to face physical challenges comprised of load carriage and muscle fatigue. During walking, the knee joint experiences an external adduction moment [4]. Large varus knee loading leads to cartilage degeneration and medial knee osteoarthritis (OA) [5,6,7]. Thus, the longterm effect of repetitive high varus knee loading could lead to medial knee OA; in the short term, walking with large varus knee loading could result in knee pain. Load carriage increases vertical ground reaction force (GRF) during walking [8,9]. Walking in a fatigue state also results in increased vertical GRF [10]. It is possible that under the influences of load carriage and muscle fatigue, the knee joint may experience increased internal mechanical loading. However, it is unclear whether load carriage and fatigue result in an increase of varus knee loading during walking. Analyzing frontal-plane knee mechanics during loaded and fatigued walking will broaden our knowledge on the potential causes of developing lower-extremity overuse injuries such as overuse knee conditions during military training. The purpose of the study was to investigate the frontal-plane knee mechanics during loaded and fatigued walking. As the vertical GRF is increased during both the loaded and fatigued walking [8,9,10], it was hypothesized that there would be increased internal knee abductor moments during loaded and fatigued walking. METHODS Eighteen healthy male subjects (age: 21 ± 2 yr.; body mass: 77.6 ± 9.6 kg; body height: 181 ± 4 cm) participated in the study. Subjects wore military boots and participated in a fatiguing protocol which involved a series of metered step-ups and heel raises while wearing a 16 kg rucksack. Subjects performed the following tasks in sequence: 5-min unloaded walking; 5-min loaded walking with a 32 kg rucksack; Fatiguing protocol; 5-min loaded walking with a 32 kg rucksack under fatigue; 5-min unloaded walking under fatigue. All walking tasks were performed at 1.67 m/s on a force instrumented treadmill (AMTI). A 15-camera system (VICON) was used to track reflective markers placed on the human body at 120 Hz. Ground reaction forces were collected at 2400 Hz. Visual 3D (C-Motion) was used to calculate lower extremity joint mechanics. The following variables were analyzed: peak hip and knee adduction angles, peak hip and knee abductor moments during weight acceptance of walking. Two-way repeated measures ANOVAs were performed. Load carriage and fatigue were the independent factors. α = RESULTS AND DISCUSSION No interactions were found between load carriage and fatigue for all the dependent variables (P > 0.05). Load carriage led to significant increases of hip adduction (P < 0.05), hip and knee abductor moments (P < 0.001) (Table 1). Fatigue did not lead to changes in hip and knee adduction angles and abductor moments (P > 0.05) (Table 1). Frontal-plane knee mechanics is altered during loaded walking. There is a large internal abductor 70
71 moment introduced at weight acceptance. The increased internal abductor moment may be related to the increased GRF passing through medial side of the knee. As the internal abductor moment increases, medial compartment of the knee is under large compression. Increased stress in medial knee results in cartilage degeneration and onset of medial knee OA [5,6,7]. During a 12-week military training, the accumulated loaded walking/running distance exceeds 200 miles [1], the repetitive large medial knee loading may inflict cartilage damage in medial knee and result in knee pain. In this study, we also found that the load carriage results in alterations of frontal-plane hip mechanics. There is an increase of hip adduction during weight acceptance of loaded walking. Increasing hip adduction stretches gluteus medius and enhances the muscle s ability to stabilize the pelvis. Indeed, large hip abductor moment is associated with loaded walking. However, increasing hip adduction also stretches tensor fasciae latae on the lateral side of the hip. As load carriage results in increased knee flexion at weight acceptance of walking [8], the friction between the lateral femoral condyle and the illio-tibial band (ITB) could be elevated. Thus, during loaded distance walking, it is possible that increased hip adduction combined with cyclic knee flexion may lead to ITB syndrome. Interestingly, the effect of fatigue on frontal-plane knee mechanics is insignificant. Although it was reported that there is an increased GRF associated with fatigued walking [10], the increased GRF may be positioned close to the center of the knee. Thus, there is no alteration of the external adduction moment. In summary, at weight acceptance, load carriage leads to alterations of frontal-plane hip and knee mechanics. The increases of hip adduction and knee abductor moment could be the causes of overuse knee conditions, which are common during military training. REFERENCES 1.Jones, B.H., et al. Exercise & Sport Sciences Rev. 17: , Knapik, J. Military Medicine 169: 45-53, Jones, B.H., et al. Med. Sci. Sports Exercs. 25(2): , Rose, J. et al., Human walking, 3 rd edition Morrison, J., J Biomech 3(1): 51-61, Schipplein, O., et al., J Orthop Res. 9(1): , Miyazaki, T., et al., Ann Rheum Dis 61(7): , Kinoshita, H., Ergonomics 28: , Wang, H., et al., Proceeding of ASB, Providence, RI Wang, H., et al., Med. Sci. Sports Exerc. 42(5) S192, ACKNOWLEDGEMENTS Funding source: US ARMY #W81XWH Table 1: Means and SDs of Peak hip and knee adduction angles and abductor moments during weight acceptance of walking. Variables Unloaded and Loaded and Loaded and Unloaded and Unfatigued Unfatigued Fatigued Fatigued Hip adduction angle (deg)* 9.3 (3.2) 10.3 (3.6) 10.2 (3.1) 9.5 (3.2) Knee adduction angle (deg) -1.4 (2.9) -1.1 (2.9) -1.4 (2.6) -1.9 (2.9) Hip abductor moment (Nm/kg)* 1.60 (0.18) 2.18 (0.38) 2.22 (0.35) 1.66 (0.24) Knee abductor moment (Nm/kg)* 0.84 (0.18) 1.15 (0.32) 1.10 (0.36) 0.83 (0.22) Note. * indicates significant difference between loaded and unloaded walking conditions (P < 0.05). 71
72 Appendix L Abstract presented at the 60 th annual meeting of American College of Sports Medicine (ACSM) in Indianapolis, IN. May 28 - June 4, The abstract was published in Medicine & Science in Sports & Exercise. V. 45, No. 5 Supplement, S502 Title: The Influence of Physical Activity History on Ground Reaction Force during Running 72
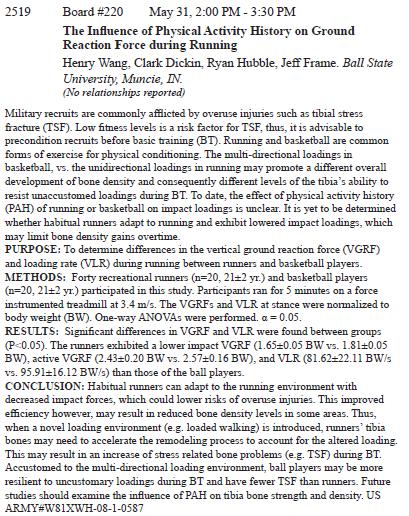
73 73
74 Appendix M The following manuscript was published in Research Quarterly for Exercise and Sport, 84(3), 2013 Title: The Effects of Load Carriage and Muscle Fatigue on Lower-extremity Joint Mechanics 74
75 75
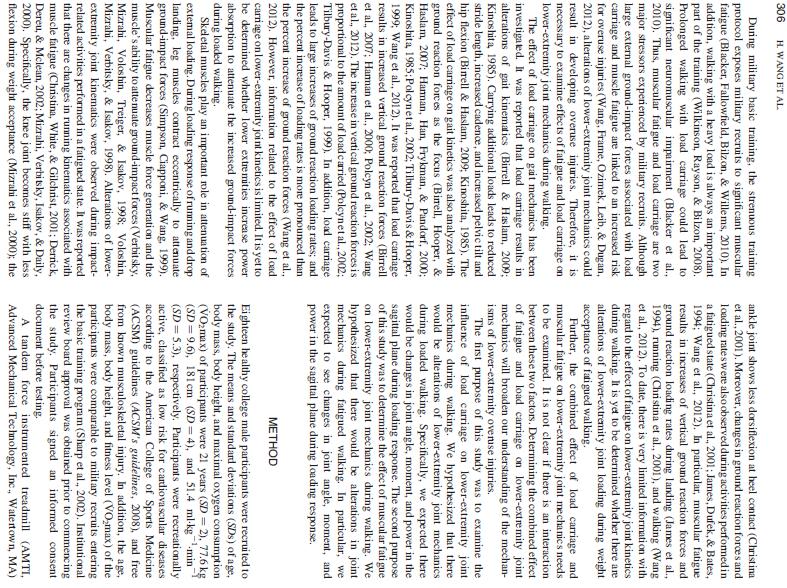
76 76
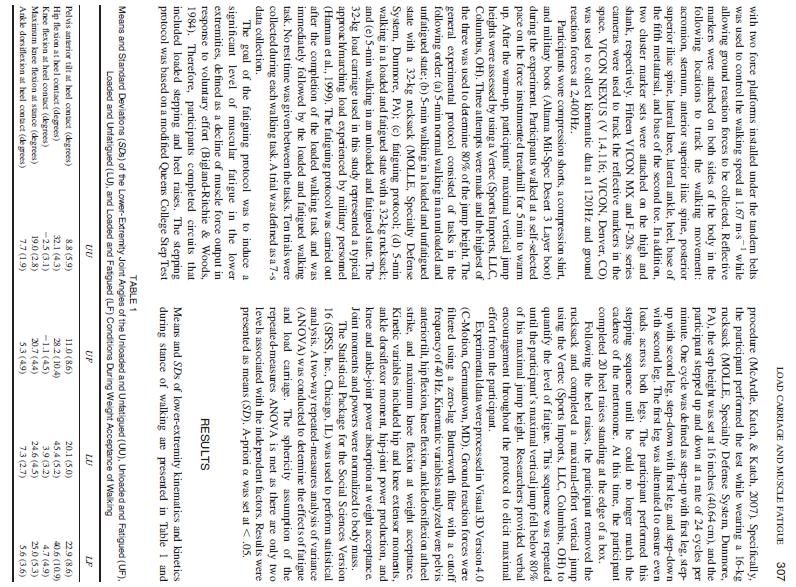
77 77
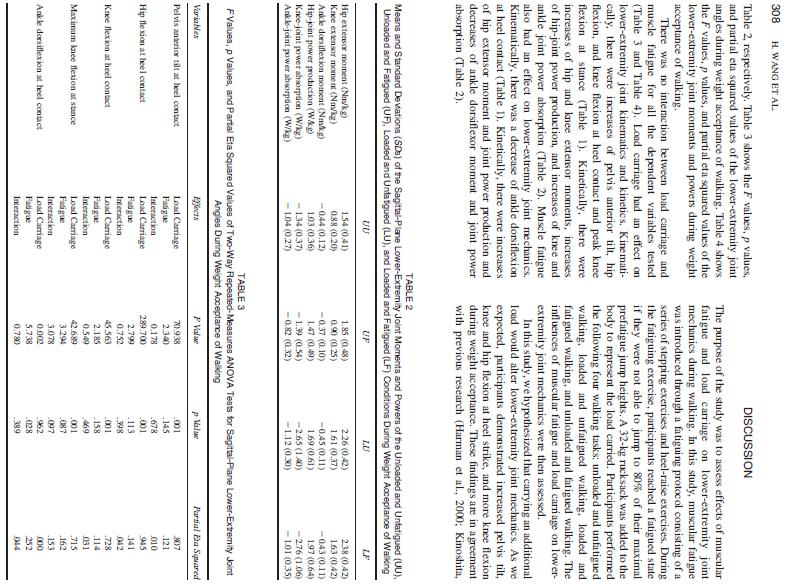
78 78
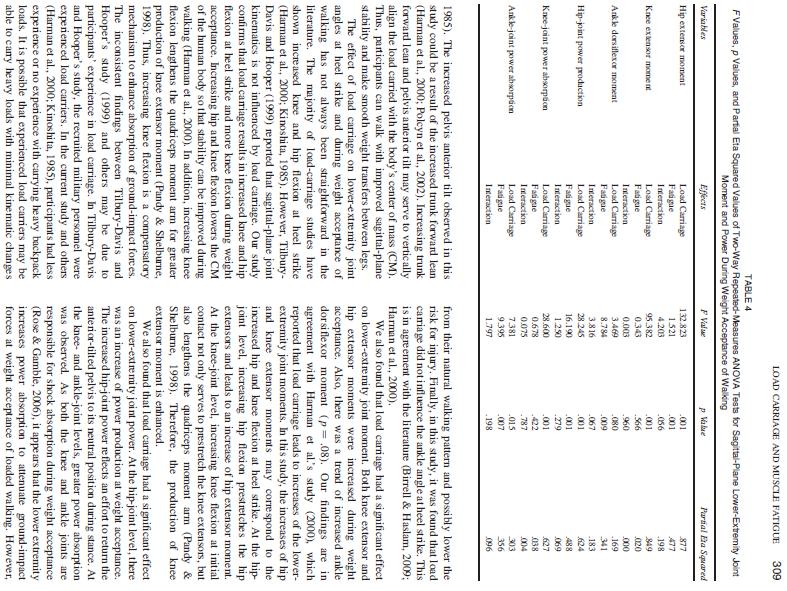
79 79
80 80
81 81
82 82
83 Appendix N Abstract presented at the 36 th Annual Meeting of American Society of Biomechanics (ASB) in Omaha, NE, September 3 September 5, 2013 Title: The Effects of the Type of Activity on Tibial Strain Characteristics 83
84 CHARACTERISTICS OF TIBIAL STRAINS DURING DIFFERENT TYPE OF PHYSICAL ACTIVITIES Mohammad Kia, D. Clark Dickin, and Henry Wang Biomechanics Laboratory, Ball State University INTRODUCTION There is evidence that an individual s past physical activity influences their risk of sustaining a tibial stress fracture. This evidence is based primarily on epidemiologic research on the rates of injury in different sub-populations [1]. The mechanisms that may explain these results have not been adequately examined. The goal of this study was to develop muscle driven forward dynamics simulations to investigate the influence of lower extremity exercises on tibial strains. The study hypothesized that high impact activities such as drop jump and cutting maneuvers produce different tibial strain profiles than those produced during walking. Experimentally measured kinematic data and ground reaction forces were used as inputs to the simulations while the tibial strain values were extracted. METHODS One healthy male subject (Age = 19 yr., height =1.80 m, and weight = 80 kg) performed the following four different type of exercises: drop-jump (JUM), cutting maneuver (CUT), running (RUN) and walking (WAK). A VICON motion capture system was used to record kinematics (240 Hz) and AMTI force plates were used to record ground reaction forces (2400 Hz). Computed tomography (CT) images of the subject were obtained in order to develop the right tibial bone geometry for a subjectspecific lower extremity model. The 3D tibia was segmented in MIMICS 14.0 (Materialise, Leuven, Belgium). MARC 2012 (MSC.Software, Santa Anna, CA) was used to develop a finite element (FE) model of the right tibia bone. Mechanical properties were assigned based on bone density. FE model was converted into a flexible tibia in MARC to incorporate the tibia geometry in LifeMod (LifeModeler Inc., San Clemente, CA). The subject s weight, height, gender, and age as well as the relative positions of the ankle, knee, and hip joints, determined from the motion capture, were used to scale the generic lower extremity models based on the GeBOD anthropometric database. The generic right tibia bone geometry was replaced with the developed flexible body of the subject specific tibia bone geometry. Tri-axis hinges combined with passive torsional spring-dampers were employed to model the hip joints. A hinge joint with a single degree of freedom was used for knee and ankle joints in the sagittal plane. A total of ninety muscles were added to the right/left legs. The measured kinematics, collected during lower extremity exercises, was used to drive the model with an inverse dynamics algorithm [2] while the muscle shortening/lengthening patterns were recorded. Next, kinematic constrains were removed, and muscles served as actuators to replicate the motions during forward dynamics (Fig.1). A proportional integral-derivative (PID) feedback controller was implemented to calculate each muscle force magnitude using the error signal between the current muscle length in the forward dynamics and the recorded muscle length during the inverse dynamics simulation. The force generated by individual muscle was limited by its force generating potential given by the following equation: F max = PCSA σ max (1) Where F max is the muscle s maximum force, PCSA is the physiological cross sectional area and σ max is the maximum tissue stress. The maximum and minimum principle strain values (tension/compression) for all surface nodes of the tibial bone were computed in ADAMS (MSC. Software, Santa Ana, CA) during simulations. In order to compare the tibial strains during different activities in a consistent way, only maximum (Max) and average (Mean) strain values were reported for the nodes within mid-medial tibial shaft region [3]. 84
 and compression (Fig.2b) strains in color coded bars respectively during the stance phase of the cutting maneuver exercise.")

85 RESULTS AND DISCUSSION Although developing more computational models are in the process, the presented results are based on only one single subject specific model. Figure 2 illustrates tension (Fig.2a) and compression (Fig.2b) strains in color coded bars respectively during the stance phase of the cutting maneuver exercise. The average model predictions over the three trials of cutting maneuver are shown in figure 3 with a solid line and a shaded area corresponding to ±1 standard deviation. Table 1 summarizes the maximum and average values for the tibial strain on the mid-medial tibial shaft region over all four exercises during the stance phase. Table 1: Tension (TEN) and Compression (COM) strain values during four different types of activities. COM strain values are rectified. micro STRAIN JUM CUT RUN WAK TEN Max Mean COM Max Mean This study produced a subject specific musculoskeletal model capable of concurrent simulation of muscle driven forward dynamics and calculated the tibial strain values. The current study shows that different types of physical activities exhibit different tibial strain profiles. High impact activities such as dropjumping, cutting, and running elicit large tibial strain. Thus, participating in high impact activities may introduce mechanical stimulations to bone and lead to positive bone adaptations to resist unaccustomed loading environments. In summary, this modeling technique can provide useful insights of bone reactions to mechanical loadings during dynamic activities. Figure 1: Lower extremity multi-body model of the subject with the flexible right tibial bone during the cutting maneuver. a) b) Figure 2: Computed strain at 20 %, 50% and 80% stance phase of the cutting maneuver. REFERENCES [1] Milgorm, et al. Am J Sports Med, 2000 [2] Lifemodeler, I., 2010 [3] Milgorm, et al. J Biomech., ACKNOWLEDGEMENTS US ARMY, # W81XWH Figure 3: Model predicted strain on the midmedial tibial shaft region. 85
REPORT DOCUMENTATION PAGE
 REPORT DOCUMENTATION PAGE Form Approved OMB NO. 0704-0188 The public reporting burden for this collection of information is estimated to average 1 hour per response, including the time for reviewing instructions,
The Influence of Load Carrying Modes on Gait variables of Healthy Indian Women
 The Influence of Load Carrying Modes on Gait variables of Healthy Indian Women *Guha Thakurta A, Iqbal R and De A National Institute of Industrial Engineering, Powai, Vihar Lake, Mumbai-400087, India,
z Interim Report for May 2004 to October 2005 Aircrew Performance and Protection Branch Wright-Patterson AFB, OH AFRL-HE-WP-TP
 AFRL-HE-WP-TP-26-89 Neck Muscle Fatigue with Helmet-Mounted Systems Edward S. Eveland Joseph A. Pellettiere Air Force Research Laboratory LL September 26 z Interim Report for May 24 to October 25 (n 261124
CHAPTER IV FINITE ELEMENT ANALYSIS OF THE KNEE JOINT WITHOUT A MEDICAL IMPLANT
 39 CHAPTER IV FINITE ELEMENT ANALYSIS OF THE KNEE JOINT WITHOUT A MEDICAL IMPLANT 4.1 Modeling in Biomechanics The human body, apart of all its other functions is a mechanical mechanism and a structure,
REPORT. A comparative study of the mechanical and biomechanical behaviour of natural turf and hybrid turf for the practise of sports
 REPORT A comparative study of the mechanical and biomechanical behaviour of natural turf and hybrid turf for the practise of sports Addressed to: PSF - PALAU TURF Date: May 2015 Table of Contents SHEET
Simulation-based design to reduce metabolic cost
 Simulation-based design to reduce metabolic cost Overview: Lecture + Hands On Exercise 1. Generating and evaluating a muscledriven simulation of walking 2. Metabolics 101 3. Designing and evaluating devices
GROUND REACTION FORCE DOMINANT VERSUS NON-DOMINANT SINGLE LEG STEP OFF
 GROUND REACTION FORCE DOMINANT VERSUS NON-DOMINANT SINGLE LEG STEP OFF Sara Gharabaghli, Rebecca Krogstad, Sara Lynch, Sofia Saavedra, and Tamara Wright California State University, San Marcos, San Marcos,
AN EXPERIMENTAL INVESTIGATION OF SPILLING BREAKERS
 AN EXPERIMENTAL INVESTIGATION OF SPILLING BREAKERS Prof. James H. Duncan Department of Mechanical Engineering University of Maryland College Park, Maryland 20742-3035 phone: (301) 405-5260, fax: (301)
Steffen Willwacher, Katina Fischer, Gert Peter Brüggemann Institute of Biomechanics and Orthopaedics, German Sport University, Cologne, Germany
 P01-3 ID126 SURFACE STIFFNESS AFFECTS JOINT LOADING IN RUNNING Steffen Willwacher, Katina Fischer, Gert Peter Brüggemann Institute of Biomechanics and Orthopaedics, German Sport University, Cologne, Germany
Running Injuries in Adolescents Jeffrey Shilt, M.D. Part 1 Page 1
 Running Injuries in Adolescents Jeffrey Shilt, M.D. Chief Surgical Officer, The Woodlands, Texas Children's Hospital Associate Professor, Orthopedic and Scoliosis Surgery, Baylor College of Medicine Part
Examples of Carter Corrected DBDB-V Applied to Acoustic Propagation Modeling
 Naval Research Laboratory Stennis Space Center, MS 39529-5004 NRL/MR/7182--08-9100 Examples of Carter Corrected DBDB-V Applied to Acoustic Propagation Modeling J. Paquin Fabre Acoustic Simulation, Measurements,
TITLE: Biomechanical Factors in the Etiology of Tibial Stress Fractures. CONTRACTING ORGANIZATION: University of Delaware Delaware, DE
 AD Award Number: DAMD17-00-1-0515 TITLE: Biomechanical Factors in the Etiology of Tibial Stress Fractures PRINCIPAL INVESTIGATOR: Irene S Davis Ph.D. CONTRACTING ORGANIZATION: University of Delaware Delaware,
Air-Sea Interaction Spar Buoy Systems
 DISTRIBUTION STATEMENT A: Distribution approved for public release; distribution is unlimited Air-Sea Interaction Spar Buoy Systems Hans C. Graber CSTARS - University of Miami 11811 SW 168 th Street, Miami,
The importance of physical activity throughout an individual's life is indisputable. As healthcare
 What to Expect When They re Expecting: A Look at Biomechanical Changes in Walking/Running During Pregnancy Jennifer Bruer-Vandeweert, Megan Hotchkiss, Jamie Kronenberg, Kristin Olson Dr. Rumit Singh Kakar,
ASSESMENT Introduction REPORTS Running Reports Walking Reports Written Report
 ASSESMENT REPORTS Introduction Left panel Avatar Playback Right Panel Patient Gait Parameters Report Tab Click on parameter to view avatar at that point in time 2 Introduction Software will compare gait
The Effect of Military Load Carriage on Ground Reaction Forces. Technical Note. Stewart A Birrell 1 Robin H Hooper 1 Roger A Haslam 1
 The Effect of Military Load Carriage on Ground Reaction Forces Technical Note Stewart A Birrell 1 Robin H Hooper 1 Roger A Haslam 1 1 Department of Human Sciences, Loughborough University, Leicestershire,
Serve the only stroke in which the player has full control over its outcome. Bahamonde (2000) The higher the velocity, the smaller the margin of
 The higher the velocity, the smaller the margin of") Lower Extremity Performance of Tennis Serve Reporter: Chin-Fu Hsu Adviser: Lin-Hwa Wang OUTLINE Introduction Kinetic Chain Serve Types Lower Extremity Movement Summary Future Work INTRODUCTION Serve the
Lower Extremity Performance of Tennis Serve Reporter: Chin-Fu Hsu Adviser: Lin-Hwa Wang OUTLINE Introduction Kinetic Chain Serve Types Lower Extremity Movement Summary Future Work INTRODUCTION Serve the
Transformation of nonfunctional spinal circuits into functional states after the loss of brain input
 Transformation of nonfunctional spinal circuits into functional states after the loss of brain input G. Courtine, Y. P. Gerasimenko, R. van den Brand, A. Yew, P. Musienko, H. Zhong, B. Song, Y. Ao, R.
An investigation of kinematic and kinetic variables for the description of prosthetic gait using the ENOCH system
 An investigation of kinematic and kinetic variables for the description of prosthetic gait using the ENOCH system K. OBERG and H. LANSHAMMAR* Amputee Training and Research Unit, University Hospital, Fack,
Waves, Turbulence and Boundary Layers
 Waves, Turbulence and Boundary Layers George L. Mellor Program in Atmospheric and Oceanic Sciences Princeton University Princeton NJ 8544-71 phone: (69) 258-657 fax: (69) 258-285 email: glm@splash.princeton.edu
Does isolated hip abductor fatigue lead to biomechanical changes of trunk, pelvis and lower leg during single-leg landing?
 Does isolated hip abductor fatigue lead to biomechanical changes of trunk, pelvis and lower leg during single-leg landing? Yu Iwama 1, Kengo Harato 1, Satoshi Imai 2, Aiko Sakurai 1, Yutaro Morishige 1,
Behavioral Response of Dolphins to Signals Simulating Mid-Frequency Sonar
 DISTRIBUTION STATEMENT A. Approved for public release; distribution is unlimited. Behavioral Response of Dolphins to Signals Simulating Mid-Frequency Sonar Dorian S. Houser Biomimetica, 7951 Shantung Drive,
The Effect of a Seven Week Exercise Program on Golf Swing Performance and Musculoskeletal Screening Scores
 The Effect of a Seven Week Exercise Program on Golf Swing Performance and Musculoskeletal Screening Scores 2017 Mico Hannes Olivier Bachelor of Sport Science Faculty of Health Sciences and Medicine Bond
DEVELOPMENT OF PRIMARY FRAGMENTATION SEPARATION DISTANCES FOR CASED CYLINDRICAL MUNITIONS
 DEVELOPMENT OF PRIMARY FRAGMENTATION SEPARATION DISTANCES FOR CASED CYLINDRICAL MUNITIONS by William H. Zehrt, Jr., P. E. and Michelle M. Crull, PhD, P. E. U. S. Army Engineering and Support Center, Huntsville
Gait Analyser. Description of Walking Performance
 Gait Analyser Description of Walking Performance This brochure will help you to understand clearly the parameters described in the report of the Gait Analyser, provide you with tips to implement the walking
Does Changing Step Width Alter Lower Extremity Biomechanics During Running?
 University of Tennessee, Knoxville Trace: Tennessee Research and Creative Exchange Masters Theses Graduate School 5-2012 Does Changing Step Width Alter Lower Extremity Biomechanics During Running? Richard
Supplementary Figure S1
 Supplementary Figure S1: Anterior and posterior views of the marker set used in the running gait trials. Forty-six markers were attached to the subject (15 markers on each leg, 4 markers on each arm, and
The effects of a suspended-load backpack on gait
 Industrial and Manufacturing Systems Engineering Publications Industrial and Manufacturing Systems Engineering 2009 The effects of a suspended-load backpack on gait Xu Xu North Carolina State University
Rogue Wave Statistics and Dynamics Using Large-Scale Direct Simulations
 Rogue Wave Statistics and Dynamics Using Large-Scale Direct Simulations Dick K.P. Yue Center for Ocean Engineering Department of Mechanical Engineering Massachusetts Institute of Technology Cambridge,
Does Ski Width Influence Muscle Action in an Elite Skier? A Case Study. Montana State University Movement Science Laboratory Bozeman, MT 59717
 Does Ski Width Influence Muscle Action in an Elite Skier? A Case Study John G. Seifert 1, Heidi Nunnikhoven 1, Cory Snyder 1, Ronald Kipp 2 1 Montana State University Movement Science Laboratory Bozeman,
Proposed Paralympic Classification System for Va a Information for National federations and National Paralympic Committees
 Proposed Paralympic Classification System for Va a Information for National federations and National Paralympic Committees Prepared by the research team Johanna Rosén, MSc, PhD student, member Paracanoe
Gait Analysis at Your Fingertips:
 Gait Analysis at Your Fingertips: Enhancing Observational Gait Analysis Using Mobile Device Technology and the Edinburgh Visual Gait Scale Jon R. Davids, MD; Shriners Hospitals for Children Northern California;
Mutual and asynchronous anticipation and action in sports as globally competitive
 1 Supplementary Materials Mutual and asynchronous anticipation and action in sports as globally competitive and locally coordinative dynamics Keisuke Fujii, Tadao Isaka, Motoki Kouzaki and Yuji Yamamoto.
Normal Gait and Dynamic Function purpose of the foot in ambulation. Normal Gait and Dynamic Function purpose of the foot in ambulation
 Normal Gait and Dynamic Function purpose of the foot in ambulation Edward P. Mulligan, PT, DPT, OCS, SCS, ATC Assistant Professor; Residency Chair UT Southwestern School of Health Professions Department
A New Approach to Modeling Vertical Stiffness in Heel-Toe Distance Runners
 Brigham Young University BYU ScholarsArchive All Faculty Publications 2003-12-01 A New Approach to Modeling Vertical Stiffness in Heel-Toe Distance Runners Iain Hunter iain_hunter@byu.edu Follow this and
The Starting Point. Prosthetic Alignment in the Transtibial Amputee. Outline. COM Motion in the Coronal Plane
 Prosthetic Alignment in the Transtibial Amputee The Starting Point David C. Morgenroth, MD, Department of Rehabilitation Medicine University of Washington VAPSHCS Outline COM Motion in the Coronal Plane
Analysis of Gait Characteristics Changes in Normal Walking and Fast Walking Of the Elderly People
 IOSR Journal of Engineering (IOSRJEN) ISSN (e): 2250-3021, ISSN (p): 2278-8719 Vol. 08, Issue 7 (July. 2018), V (V) 34-41 www.iosrjen.org Analysis of Gait Characteristics Changes in and Of the Elderly
Purpose. Outline. Angle definition. Objectives:
 Disclosure Information AACPDM 69 th Annual Meeting October 21-24, 2015 Speaker Names: Sylvia Õunpuu, MSc and Kristan Pierz, MD Gait Analysis Data Interpretation: Understanding Kinematic Relationships Within
Normal and Abnormal Gait
 Normal and Abnormal Gait Adrielle Fry, MD EvergreenHealth, Division of Sport and Spine University of Washington Board Review Course March 6, 2017 What are we going to cover? Definitions and key concepts
M2.50-cal. Multishot Capabilities at the US Army Research Laboratory
 ARL-TN-0694 SEP 2015 US Army Research Laboratory M2.50-cal. Multishot Capabilities at the US Army Research Laboratory by Todd Brinkman Approved for public release; distribution is unlimited. NOTICES Disclaimers
Temporary Flying Restrictions Due to Exogenous Factors
 Army Regulation 40 8 Medical Services Temporary Flying Restrictions Due to Exogenous Factors Headquarters Department of the Army Washington, DC 17 August 1976 UNCLASSIFIED REPORT DOCUMENTATION PAGE Form
Imaging the Lung Under Pressure
 DISTRIBUTION STATEMENT A: Approved for public release; distribution is unlimited. Imaging the Lung Under Pressure Peter L. Tyack, Andreas Fahlman, Michael Moore, and Darlene Ketten Woods Hole Oceanographic
Influence of Fatigue and Load Carriage on Mechanical Loading During Walking
 MILITARY MEDICINE, 177, 2:152, 2012 Influence of Fatigue and Load Carriage on Mechanical Loading During Walking He Wang, PhD*; Jeff Frame, MS*; Elicia Ozimek, MS*; Daniel Leib, MS ; Eric L. Dugan, PhD
INTERACTION OF STEP LENGTH AND STEP RATE DURING SPRINT RUNNING
 INTERACTION OF STEP LENGTH AND STEP RATE DURING SPRINT RUNNING Joseph P. Hunter 1, Robert N. Marshall 1,, and Peter J. McNair 3 1 Department of Sport and Exercise Science, The University of Auckland, Auckland,
HPW Biomechanics
 HPW Biomechanics hpw@mail.com www.hpwbiomechanics.com ~ via e-mail ~ January 31, 213 To: Attn: From: Subject: I-Roc Debbie Chapman Janet S. Dufek, Ph.D. Research Scientist Additional Footwear Evaluation
High-Frequency Scattering from the Sea Surface and Multiple Scattering from Bubbles
 High-Frequency Scattering from the Sea Surface and Multiple Scattering from Bubbles Peter H. Dahl Applied Physics Laboratory College of Ocean and Fisheries Sciences University of Washington Seattle, Washington
Waves, Bubbles, Noise, and Underwater Communications
 Waves, Bubbles, Noise, and Underwater Communications Grant B. Deane Marine Physical Laboratory, Scripps Institution of Oceanography UCSD, La Jolla, CA 92093-0238 phone: (858) 534-0536 fax: (858) 534-7641
Palacký Univerzity in Olomouc Faculty of Physical Culture
 Project: Sophisticated biomechanic diagnostics of human movement Registration number: CZ.1.07/2.3.00/09.0209 Palacký Univerzity in Olomouc Faculty of Physical Culture Tento projekt je spolufinancován Evropským
DIFFERENCE BETWEEN TAEKWONDO ROUNDHOUSE KICK EXECUTED BY THE FRONT AND BACK LEG - A BIOMECHANICAL STUDY
 268 Isas 2000! Hong Kong DIFFERENCE BETWEEN TAEKWONDO ROUNDHOUSE KICK EXECUTED BY THE FRONT AND BACK LEG - A BIOMECHANICAL STUDY Pui-Wah Kong, Tze-Chung Luk and Youlian Hong The Chinese University of Hong
Ankle biomechanics demonstrates excessive and prolonged time to peak rearfoot eversion (see Foot Complex graph). We would not necessarily expect
. We would not necessarily expect") Case Study #1 The first case study is a runner presenting with bilateral shin splints with pain and tenderness along the medial aspect of the tibia. The symptoms have increased significantly over the last
Case Study #1 The first case study is a runner presenting with bilateral shin splints with pain and tenderness along the medial aspect of the tibia. The symptoms have increased significantly over the last
KICKBIKE Your key to optimum sports performance
 KICKBIKE Your key to optimum sports performance Efficient Running is essential to optimum performance of most sports we play. Whether we want to maximize our speed, maximize our endurance, or both, an
Posture influences ground reaction force: implications for crouch gait
 University of Tennessee, Knoxville From the SelectedWorks of Jeffrey A. Reinbolt July 14, 2010 Posture influences ground reaction force: implications for crouch gait H. X. Hoang Jeffrey A. Reinbolt, University
Stride Frequency, Body Fat Percentage, and the Amount of Knee Flexion Affect the Race Time of Male Cross Country Runners
 Stride Frequency, Body Fat Percentage, and the Amount of Knee Flexion Affect the Race Time of Male Cross Country Runners Vineel Mallavarapu 1 and Kevin Finn 2 1 Cedar Falls High School, Cedar Falls, IA
AFRL-RH-WP-TR
 AFRL-RH-WP-TR-2016-0040 C-130J BREATHING RESISTANCE STUDY George W. Miller Air Force Research Laboratory Wright-Patterson Air Force Base, OH 45433 May 2016 Final Report STINFO COPY AIR FORCE RESEARCH LABORATORY
Neurorehabil Neural Repair Oct 23. [Epub ahead of print]
![Neurorehabil Neural Repair Oct 23. [Epub ahead of print]](/thumbs/86/94477916.jpg "Neurorehabil Neural Repair Oct 23. [Epub ahead of print]") APPENDICE Neurorehabil Neural Repair. 2009 Oct 23. [Epub ahead of print] Segmental Muscle Vibration Improves Walking in Chronic Stroke Patients With Foot Drop: A Randomized Controlled Trial. Paoloni M,
APPENDICE Neurorehabil Neural Repair. 2009 Oct 23. [Epub ahead of print] Segmental Muscle Vibration Improves Walking in Chronic Stroke Patients With Foot Drop: A Randomized Controlled Trial. Paoloni M,
AFRL-RX-WP-TP
 AFRL-RX-WP-TP-2012-0215 REVERSE PRESSURE CAPABLE FINGER SEAL (PREPRINT) Nathan Gibson and Joe Yanof Honeywell International, Inc. JANUARY 2012. See additional restrictions described on inside pages STINFO
Comparison of Kinematics and Kinetics During Drop and Drop Jump Performance
 schouweiler, hess UW-L Journal of Undergraduate Research XIII (21) Comparison of Kinematics and Kinetics During Drop and Drop Jump Performance Ryan Schouweiler, Karina Hess Faculty Sponsor: Thomas Kernozek,
Running Gait Mechanics. Walking vs Running. Ankle Joint Complex Sagittal Plane. As speed increases, when has walking ended and running begun?
 Running Gait Mechanics Walking vs Running As speed increases, when has walking ended and running begun? Ankle Joint Complex Sagittal Plane 1 Ankle Joint Complex Sagittal Plane Pos. @FS 5 o DF Absorption
Figure 1 betois (bending torsion insole system) system with five measuring points and A/D- converter.
 system with five measuring points and A/D- converter.") Bending and Torsional Moments - A new measuring system for gait analysis Nora Dawin & Annette Kerkhoff & Klaus Peikenkamp, University of Applied Sciences Münster, Germany Abstract The Laboratory of Biomechanics
Bending and Torsional Moments - A new measuring system for gait analysis Nora Dawin & Annette Kerkhoff & Klaus Peikenkamp, University of Applied Sciences Münster, Germany Abstract The Laboratory of Biomechanics
Impact of heel position on leg muscles during walking
 Original article Niigata Journal of Health and Welfare Vol. 14, No. 1 Impact of heel position on leg muscles during walking Koichi Akaishi Graduate School of Health and Welfare, Niigata University of Health
Using SolidWorks & CFD to Create The Next Generation Airlocks
 Using SolidWorks & CFD to Create The Next Generation Airlocks Matthew Gaffney Mechanical Engineer Geo-Centers, INC US Army Natick Soldier Center Natick, MA 01760 508-233-5557 Matthew.gaffney@natick.army.mil
A bit of background. Session Schedule 3:00-3:10: Introduction & session overview. Overarching research theme: CPTA
 A Cognitive-Biomechanical Perspective for the Management of Common Chronic Musculoskeletal Conditions Skulpan Asavasopon, PT, PhD Loma Linda University Christopher M. Powers, PT, PhD, FAPTA University
Ground Reaction Force Alterations Due to Experimentally-induced Anterior Knee Pain During Walking
 Ground Reaction Force Alterations Due to Experimentally-induced Anterior Knee Pain During Walking Matthew K. Seeley, A. Wayne Johnson, Jihong Park, Daniel King, and J. Ty Hopkins Human Performance Research
Development of Low Volume Shape Memory Alloy Variable Ballast System for AUV Use
 Development of Low Volume Shape Memory Alloy Variable Ballast System for AUV Use Dr. Graeme J Rae Ocean Engineering Program Division of Marine and Environmental Systems Florida Institute of Technology
Running injuries - what are the most important factors
 Created as a free resource by Clinical Edge Based on Physio Edge podcast 59 with Greg Lehman, Tom Goom and Dr Christian Barton Get your free trial of online Physio education at Why do runners get injured?
TITLE: Assessing the Hydrodynamic Performance of Fouling-Release Surfaces (ONR Research Contract # N WR )
") TITLE: Assessing the Hydrodynamic Performance of Fouling-Release Surfaces (ONR Research Contract # N00014-07-WR-2-0213) INVESTIGATOR: Associate Professor Michael P. Schultz, Naval Architecture & Ocean
TITLE: Assessing the Hydrodynamic Performance of Fouling-Release Surfaces (ONR Research Contract # N00014-07-WR-2-0213) INVESTIGATOR: Associate Professor Michael P. Schultz, Naval Architecture & Ocean
DoD Coral Reef Protection and Management Program
 DoD Coral Reef Protection and Management Program PROJECT TEAM U.S. NAVY TOM EGELAND (ASN(I&E)) LORRI SCHWARTZ (NAVFAC) ALEX VIANA (NFESC) STEVE SMITH (NFESC) BOSTON UNIV. MARINE PRG. PHILLIP LOBEL MINDY
Artifacts Due to Filtering Mismatch in Drop Landing Moment Data
 Camenga et al. UW-L Journal of Undergraduate Research XVI (213) Artifacts Due to Filtering Mismatch in Drop Landing Moment Data Elizabeth T. Camenga, Casey J. Rutten, Brendan D. Gould, Jillian T. Asmus,
Running from injury 2
 Created as a free resource by Clinical Edge Based on Physio Edge podcast 049 with Dr Rich Willy Get your free trial of online Physio education by clicking here Running injuries & assessment Running assessment
EXSC 408L Fall '03 Problem Set #2 Linear Motion. Linear Motion
 Problems: 1. Once you have recorded the calibration frame for a data collection, why is it important to make sure the camera does not shut off? hat happens if the camera automatically shuts off after being
2) Jensen, R. Comparison of ground-reaction forces while kicking a stationary and non-stationary soccer ball
 Jensen, R. Comparison of ground-reaction forces while kicking a stationary and non-stationary soccer ball") Northern Michigan University The Commons Conference Papers in Published Proceedings 2001 2) Jensen, R. Comparison of ground-reaction forces while kicking a stationary and non-stationary soccer ball Randall
Northern Michigan University The Commons Conference Papers in Published Proceedings 2001 2) Jensen, R. Comparison of ground-reaction forces while kicking a stationary and non-stationary soccer ball Randall
RUNNING SHOE STIFFNESS: THE EFFECT ON WALKING GAIT
 RUNNING SHOE STIFFNESS: THE EFFECT ON WALKING GAIT Stephen N Stanley, Peter J M c Nair, Angela G Walker, & Robert N Marshall Auckland Institute of Technology, Auckland, New Zealand University of Auckland,
THE ANKLE-HIP TRANSVERSE PLANE COUPLING DURING THE STANCE PHASE OF NORMAL WALKING
 THE ANKLE-HIP TRANSVERSE PLANE COUPLING DURING THE STANCE PHASE OF NORMAL WALKING Thales R. Souza, Rafael Z. Pinto, Renato G. Trede, Nadja C. Pereira, Renata N. Kirkwood and Sérgio T. Fonseca. Movement
Characterizing The Surf Zone With Ambient Noise Measurements
 Characterizing The Surf Zone With Ambient Noise Measurements LONG-TERM GOAL Grant Deane Marine Physical Laboratory Scripps Institution of Oceanography La Jolla, CA 93093-0213 phone: (619) 534-0536 fax:
Chapter 1 - Injury overview Chapter 2 - Fit for Running Assessment Chapter 3 - Soft Tissue Mobilization... 21
 Table of Contents Introduction Chapter 1 - Injury overview... 6 Chapter 2 - Fit for Running Assessment... 13 Chapter 3 - Soft Tissue Mobilization... 21 Chapter 4 - Dynamic Warm-up... 28 Chapter 5 - Strengthening...
video Purpose Pathological Gait Objectives: Primary, Secondary and Compensatory Gait Deviations in CP AACPDM IC #3 1
 s in CP Disclosure Information AACPDM 71st Annual Meeting September 13-16, 2017 Speaker Names: Sylvia Ounpuu, MSc and Kristan Pierz, MD Differentiating Between, Secondary and Compensatory Mechanisms in
INTRODUCTION TO GAIT ANALYSIS DATA
 INTRODUCTION TO GAIT ANALYSIS DATA 1. Phases of gait a. Stance (% gc) i. Loading response (10%) ii. Mid- and terminal stance (%) iii. Pre-swing (10%) b. Swing (% gc) i. Initial swing ii. Mid-swing iii.
Long-Term Autonomous Measurement of Ocean Dissipation with EPS-MAPPER
 Long-Term Autonomous Measurement of Ocean Dissipation with EPS-MAPPER Neil S. Oakey Bedford Institute of Oceanography Dartmouth, Nova Scotia Canada B2Y 4A2 phone: (902) 426-3147 fax: (902) 426-7827 e-mail:
THREE DIMENSIONAL KINEMATICS OF THE DIRECT FREE KICK IN SOCCER WHEN OPPOSED BY A DEFENSIVE WALL
 THREE DMENSONAL KNEMATCS OF THE DRECT FREE KCK N SOCCER WHEN OPPOSED BY A DEFENSVE WALL E. W. Brown l, D. J. Wilson l, B. R. Mason l, J. Baker lyouth Sports nstitute Michigan State University East Lansing,
Relationship between Ground Reaction Force and Stability Level of the Lower Extremity in Runners Background: Objective: Design and Setting:
 Relationship between Ground Reaction Force and Stability Level of the Lower Extremity in Runners Kimitake Sato, Monique Butcher-Mokha Barry University Miami Shores, FL Background: Neuromuscular control
A Biomechanical Approach to Javelin. Blake Vajgrt. Concordia University. December 5 th, 2012
 A Biomechanical Approach to Javelin Blake Vajgrt Concordia University December 5 th, 2012 The Biomechanical Approach to Javelin 2 The Biomechanical Approach to Javelin Javelin is one of the four throwing
Center of Mass Acceleration as a Surrogate for Force Production After Spinal Cord Injury Effects of Inclined Treadmill Walking
 Center of Mass Acceleration as a Surrogate for Force Production After Spinal Cord Injury Effects of Inclined Treadmill Walking Mark G. Bowden, PhD, PT Research Health Scientist, Ralph H. Johnson VA Medical
SCHEINWORKS Measuring and Analysis Systems by
 Pressure Measurement Systems for standing and walking analysis Germany since 1879 Pressure Measurement Systems for standing and walking analysis Documentation of Gait image Stance Symmetry of all parameters
Spasticity in gait. Wessex ACPIN Spasticity Presentation Alison Clarke
 Spasticity in gait Clinicians recognise spasticity but the elements of spasticity contributing to gait patterns are often difficult to identify: Variability of muscle tone Observation/recording General
Available online at Prediction of energy efficient pedal forces in cycling using musculoskeletal simulation models
 Available online at www.sciencedirect.com Engineering 2 00 (2010) (2009) 3211 3215 000 000 Engineering www.elsevier.com/locate/procedia 8 th Conference of the International Sports Engineering Association
In memory of Dr. Kevin P. Granata, my graduate advisor, who was killed protecting others on the morning of April 16, 2007.
 Acknowledgement In memory of Dr. Kevin P. Granata, my graduate advisor, who was killed protecting others on the morning of April 16, 2007. There are many others without whom I could not have completed
A Novel Gear-shifting Strategy Used on Smart Bicycles
 2012 International Conference on Industrial and Intelligent Information (ICIII 2012) IPCSIT vol.31 (2012) (2012) IACSIT Press, Singapore A Novel Gear-shifting Strategy Used on Smart Bicycles Tsung-Yin
Biomechanical analysis of the medalists in the 10,000 metres at the 2007 World Championships in Athletics
 STUDY Biomechanical analysis of the medalists in the 10,000 metres at the 2007 World Championships in Athletics by IAAF 23:3; 61-66, 2008 By Yasushi Enomoto, Hirosuke Kadono, Yuta Suzuki, Tetsu Chiba,
Biomechanics and Models of Locomotion
 Physics-Based Models for People Tracking: Biomechanics and Models of Locomotion Marcus Brubaker 1 Leonid Sigal 1,2 David J Fleet 1 1 University of Toronto 2 Disney Research, Pittsburgh Biomechanics Biomechanics
A COMPARISON OF SELECTED BIOMECHANICAL PARAMETERS OF FRONT ROW SPIKE BETWEEN SHORT SET AND HIGH SET BALL
 A COMPARISON OF SELECTED BIOMECHANICAL PARAMETERS OF FRONT ROW SPIKE BETWEEN SHORT SET AND HIGH SET BALL PAPAN MONDAL a AND SUDARSAN BHOWMICK b,* a Assistant Professor, Department of Physical Education,
Positive running posture sums up the right technique for top speed
 Positive running, a model for high speed running Frans Bosch positive running posture sums up the right technique for top speed building blocks in running: Pelvic rotation for- and backward and hamstring
Equine Trust Summer Scholarship
 Development of 3D gait model Student: Nicola Wichtel Supervisor: Dr Robert Colborne Equine Trust Summer Scholarship In 2015, The Equine Trust funded the purchase of a 6-camera infrared kinematic system
Knee contact force estimation using force-reaction elements
 The webcast will start in a few minutes. Knee contact force estimation using force-reaction elements T H E WINNER I N THE 2015 SIXTH GRAND CHALLENGE COMPETITION TO PRED I C T I N VIVO K N EE LOA DS May
Kelly Legault, Ph.D., P.E. USACE SAJ
 Kelly Legault, Ph.D., P.E. USACE SAJ Report Documentation Page Form Approved OMB No. 0704-0188 Public reporting burden for the collection of information is estimated to average 1 hour per response, including
A Pilot Study on Electromyographic Analysis of Single and Double Revolution Jumps in Figure Skating
 Journal of Exercise Science and Physiotherapy, Vol. 5, No. 1: 14-19, 2009 A Pilot Study on Electromyographic Analysis of Single and Double Revolution Jumps in Figure Skating Taylor¹, C. L. and Psycharakis²,
APPLICATION OF FILMING AND MOTION ANALYSIS IN MOVEMENT STUDIES. Xie Wei Sports Medicine and Research Center, Singapore Sports Council, Singapore
 APPLICATION OF FILMING AND MOTION ANALYSIS IN MOVEMENT STUDIES Xie Wei Sports Medicine and Research Center, Singapore Sports Council, Singapore The sports biomechanics branch of Singapore Sports Council
Internal Waves and Mixing in the Aegean Sea
 Internal Waves and Mixing in the Aegean Sea Michael C. Gregg Applied Physics Laboratory, University of Washington 1013 NE 40 th St. Seattle, WA 98105-6698 phone: (206) 543-1353 fax: (206) 543-6785 email:
Available online at ScienceDirect. Procedia Engineering 112 (2015 )
") Available online at www.sciencedirect.com ScienceDirect Procedia Engineering 112 (2015 ) 540 545 7th Asia-Pacific Congress on Sports Technology, APCST 2015 Movement variability of professional pool billiards
Available online at www.sciencedirect.com ScienceDirect Procedia Engineering 112 (2015 ) 540 545 7th Asia-Pacific Congress on Sports Technology, APCST 2015 Movement variability of professional pool billiards
Joint Torque Evaluation of Lower Limbs in Bicycle Pedaling
 11th conference of the International Sports Engineering Association, ISEA 216 Delft University of Technology; July 12 th Joint Torque Evaluation of Lower Limbs in Bicycle Pedaling Hiroki Yamazaki Akihiro
A Biomechanical Assessment of Gait Patterns and Risk of Associated Overuse Conditions among Mature Female Runners.
 A Biomechanical Assessment of Gait Patterns and Risk of Associated Overuse Conditions among Mature Female Runners. Submitted by Kim Louise Lilley to the University of Exeter as a thesis for the degree