ADOT Bicyclist and Pedestrian Count Strategy Plan
|
|
|
- Kenneth Harrison
- 5 years ago
- Views:
Transcription

1
2
3 Task Assignment: MPD ADOT Bicyclist and Pedestrian Count Strategy Plan Final Report June 2018 ADOT Planning Bid/Proposal Number: ADOT Contract Number: ADOT Prepared by: Kimley-Horn 333 E. Wetmore Road, Suite 280 Tucson, AZ In association with: Lee Engineering Texas A&M Transportation Institute Traffic Research & Analysis, Inc.
4 NOTICE Notwithstanding any other provision of law, reports, surveys, schedules, lists, or data compiled or collected for the purpose of identifying, evaluating, or planning the safety enhancement of potential accident sites, hazardous roadway conditions, or railway-highway crossings, pursuant to sections 130, 144, and 148 [152] of this title or for the purpose of developing any highway safety construction improvement project which may be implemented utilizing Federal-aid highway funds shall not be subject to discovery or admitted into evidence in a Federal or State court proceeding or considered for other purposes in any action for damages arising from any occurrence at a location mentioned or addressed in such reports, surveys, schedules, lists, or data. ADOT Bicyclist and Pedestrian Count Strategy Plan i
5 TABLE OF CONTENTS 1. INTRODUCTION... 6 Background...6 Objectives...7 Technical Advisory Committee TECHNOLOGY REVIEW Overview...10 Summary of Count Technologies...10 Selecting the Most Appropriate Count Technology...20 Current ADOT Count Capabilities...30 Summary of Findings DATA COLLECTION METHODOLOGY AND PLAN Purpose and Use of Bicycle and Pedestrian Count Data...32 Data Collection Site Identification and Prioritization...33 Data Collection Methodology and Plan Short-Term Count Locations ANALYSIS OF BICYCLIST AND PEDESTRIAN COUNT DATA Overview...60 Data Collection Process and Trends NEXT STEPS AND IMPLEMENTATION PLAN Count Data Storage, Analytics, and Reporting System...70 Permanent Continuous Count Sites...71 Short-Duration Counts Collected Using Portable Equipment...74 Costs for Bicycle and Pedestrian Data Collection Plan...75 Additional Guidance...79 APPENDIX A EXAMPLES OF CRITERIA FOR SELECTING BICYCLE AND PEDESTRIAN COUNT SITES APPENDIX B MAPS OF BICYCLE AND PEDESTRIAN COUNT SITES 83 APPENDIX C SITES THAT WERE CONSIDERED BUT NOT ADVANCED ADOT Bicyclist and Pedestrian Count Strategy Plan ii
6 APPENDIX D COMPARISON OF POPULATION DISTRIBUTION AND COUNT LOCATIONS APPENDIX E USE OF TRAFFIC SIGNAL TECHNOLOGY TO COUNT BICYCLES AND PEDESTRIANS APPENDIX F DATA ANALYSIS BY SITE Chandler Cottonwood Flagstaff Fountain Hills Glendale Mesa Phoenix Peoria Prescott Sedona, Village of Oak Creek, and Verde Valley Sierra Vista Tempe Tucson and Pima County ADOT Bicyclist and Pedestrian Count Strategy Plan iii
7 LIST OF FIGURES Figure 1 Arizona State Highway System... 8 Figure 2 Inductance Loops for Counting Bicyclists Figure 3 Active Infrared Sensor for Counting Pedestrians and Bicyclists Figure 4 Passive Infrared Sensor for Counting Pedestrians and Bicyclists Figure 5 Overhead Laser Scanner in Lab Experiment Figure 6 Magnetometer That Could Be Used for Counting Bicyclists Figure 7 Smartphone-Based Manual Count App Figure 8 Piezoelectric Strips for Counting Bicyclists Figure 9 Pneumatic Tubes for Counting Bicyclists Figure 10 Pressure Sensor for Counting Pedestrians Figure 11 Radar Unit for Counting Bicyclists Figure 12 Radio Beam Sensors Figure 13 Stereoscopic Sensor for Counting Pedestrians and Bicyclists Figure 14 Thermal Imaging Sensor for Counting Figure 15 Automated Video Reduction for Counting Pedestrians and Bicyclists Figure 16 Manual Video Reduction for Counting Figure 17 Simplified Flowchart for Selecting Non-Motorized Count Equipment Figure 18 U.S. Bicycle Route Figure 19 ACA Southern Tier Route Section 1 (San Diego, California to Tempe, Arizona) Figure 20 ACA Southern Tier Route, Section 2 (Tempe, Arizona to El Paso, Texas) Figure 21 El Tour De Tucson Route Map (2017) Figure 22 El Tour De Mesa Route Map (2017) Figure 23 Cochise County Cycling Classic Route Map Figure 24 Short-Term Count Locations - Priority 1A Figure 25 Short Term Count Locations - Priority 1B Figure 26 Average Daily Bicycle Volumes, Weekend Versus Weekday Figure 27 Sum of Average Daily Bicycle Volumes by Time of Day for Tube Count Locations Figure 28 Sum of Average Daily Bicycle and Pedestrian Volume by Time of Day for Sites 73, 132, 133, 22, and Figure 29 Typical Weekday Variation for Three Common Seasonal Factor Groups Figure 30 Typical Time-of-Day Variation for Three Common Seasonal Factor Groups ADOT Bicyclist and Pedestrian Count Strategy Plan iv
8 LIST OF TABLES Table 1 Examples of Commercially Available Equipment for Various Types of Technology Table 2 Comparison of Technologies for Counting Pedestrians and Bicyclists Table 3 Comparison of Count Technologies: User and Site Characteristics Table 4 Comparison of Count Technologies: Volume, Width, and Duration Capabilities Table 5 Comparison of Count Technologies: Resources Table 6 Accuracy of Counting Technology for Pedestrians and Bicyclists Table 7 Maricopa Association of Governments (MAG) Count Technology Summary Table 8 Sites Considered for Bicycle and Pedestrian Counts Table 9 Comparison of Population and Count Locations` Table 10 Short-Term Count Locations - Priority 1A Table 11 Short-Term Count Locations - Priority 1B Table 12 Daily Bicyclist Volumes Collected from 7-Day Tube Counts Table 13 Intersection Video Data Collection Summary Table 14 Video Counts at Road Segment Locations Table 15 Long-Term Tube Count Locations Table Cost Estimates for MS2 Non-Motorized Module Table 17 Estimated Costs for Bicycle and Pedestrian Data Collection Table 18 Detailed Guidance Documents for Pedestrian and Bicyclist Monitoring ADOT Bicyclist and Pedestrian Count Strategy Plan v
9 1. INTRODUCTION Background In 2010, the Federal Highway Administration (FHWA) issued a policy statement encouraging state Departments of Transportation (DOTs) to collect data on walking and bicycling to track trends, prioritize investments, and inform setting of mode targets. In recent years, FHWA has taken additional steps to develop and promote technical guidance for pedestrian and bicyclist count data collection. The 2013 FHWA Traffic Monitoring Guide (TMG) included, for the first time, a chapter specifically devoted to non-motorized traffic monitoring. The FHWA also funded a follow-up effort on pedestrian counting. Furthermore, the FHWA has been modifying its Travel Monitoring Analysis System (TMAS), to which most state DOTs submit motor vehicle count data monthly, to accept pedestrian and bicyclist count data. Several state DOTs are in the early stages of establishing a formal bicycle and pedestrian count data and monitoring program. Each state is developing a count program for primarily the same reason as input to performance-based transportation planning to: Justify funding and help to direct investments in multimodal transportation facilities to where they will provide the most benefit, Evaluate facility usage, including before and after new infrastructure is built to evaluate effectiveness of infrastructure investments, and as a measure of exposure for non-motorized transportation crashes, Monitor trends over time. The Arizona Department of Transportation (ADOT) Bicycle and Pedestrian Plan (2013) recommended development and implementation of a pedestrian and bicyclist count strategy (Strategy #5). The ADOT Bicycle and Pedestrian Count Strategy Plan is the first step for ADOT to implement a bicycle and pedestrian count program. The program will be designed to achieve the above purposes, and to support safety assessments, performance measurement, and reporting such as the ADOT Bicycling and Walking Benchmarking document. Key items that ADOT must consider when developing a program are: Understand anticipated data use cases to inform system development and design. A statewide monitoring program should clearly define how that data will be used. This understanding will help immensely as decisions are made and parameters are defined within the program. For example, a focus on providing exposure data in safety analysis will lead the program in a certain direction. Other potential uses include reporting trends over time and providing statewide benchmarking of bicyclist and pedestrian activity. Will the data inform project selection and prioritization? Beforeafter study analysis? It is a difficult task to develop a program that satisfies everyone s needs. The initial ADOT program may focus on a few targeted uses; the program can then be expanded over time. What will be ADOT s role and relationship with local agencies? Most bicycling and walking occurs on lower functional class roads that are not on the state highway system. The ADOT program will likely focus on State Highways with high activity levels, or on locations of concern (e.g., safety hot-spot locations). To support bicycling statewide, ADOT could become a ADOT Bicyclist and Pedestrian Count Strategy Plan 6
10 clearinghouse for off-system and on-system data, which means compiling data from local agencies. Who will own a monitoring program within ADOT? Will the ADOT MPD Traffic Analysis Section integrate bicycle and pedestrian count data into the motor vehicle monitoring program? Will the ADOT Bicycle and Pedestrian Program operate a standalone database outside of motor vehicle monitoring, at least for the first few years until it is better established? How will the program become institutionalized within ADOT, such that it lives on beyond this Task Assignment? Objectives This project developed a framework for establishing a pedestrian and bicycle volume database with the goal of establishing a baseline of bicyclist and pedestrian use on the Arizona State Highway System (SHS), as shown in Figure 1. The framework includes recommended approaches for collecting, storing, and distributing this data to various stakeholders. Project objectives included the following: Review and summarize existing literature on methods and technologies for pedestrian and bicycle volume data collection. Review other state DOT programs for collecting, storing, and distributing pedestrian and bicycle volume data. Review past and on-going programs in Arizona for the collection of pedestrian and bicycle volume data. Build stakeholder knowledge, understanding, and consensus on the scope and structure of the SHS pedestrian and bicycle volume database. Collect pedestrian and bicycle volume data collection at select SHS sites. Develop a prototype pedestrian and bicycle volume database as a proof of concept. Establish goals, roles, responsibilities, and resource needs for continued implementation of the framework. ADOT Bicyclist and Pedestrian Count Strategy Plan 7


11 Figure 1 Arizona State Highway System ADOT Bicyclist and Pedestrian Count Strategy Plan 8
12 Technical Advisory Committee A project Technical Advisory Committee (TAC) was established for this project. Representatives from the following agencies were invited to serve on the TAC: ADOT Transportation Systems Management and Operations ADOT Infrastructure Delivery and Operations Division ADOT Communications ADOT Multimodal Planning Division Arizona Strategic Highway Safety Program Non-Motorized Users Emphasis Area Team FHWA Arizona Division Office Central Arizona Governments Central Yavapai Metropolitan Planning Organization Flagstaff Metropolitan Planning Organization Lake Havasu City Metropolitan Planning Organization Maricopa Association of Governments Northern Arizona Council of Governments Pima Association of Governments Sierra Vista Metropolitan Planning Organization Southeast Arizona Council of Governments Sun Corridor Metropolitan Planning Organization Western Arizona Council of Governments Yuma Metropolitan Planning Organization The TAC convened at key project milestones. The TAC was asked to review and comment on study deliverables, participate and attend TAC meetings, and inform others within their organization of study progress. ADOT Bicyclist and Pedestrian Count Strategy Plan 9
13 2. TECHNOLOGY REVIEW Overview Chapter 2 focuses on technologies that collect pedestrian and bicyclist count data. The reviewed technologies are applicable to the Arizona state highway environment and include both permanent and temporary equipment installations. Several technologies are primarily intended to gather data other than counts, such as route choice, trip waypoints, trip origin and destination, or presence of at least one pedestrian or bicyclist. Examples of these technologies include: GPS-enabled smartphones with certain apps (e.g., Strava) Bluetooth or Wi-Fi readers Intersection control presence detectors Pedestrian crosswalk push buttons It is possible that these technologies could be used to estimate the total pedestrian or bicyclist count, but it is important to remember that the count estimation process for these technologies has not been firmly established, and the resulting count estimation error may be unacceptable when compared to other proven count technologies. Therefore, this review focuses on proven count technologies, while also acknowledging other emerging technologies that are primarily intended for other data collection applications. Summary of Count Technologies Several comprehensive national reports provide detailed information on technologies used to count pedestrians and bicyclists: FHWA Traffic Monitoring Guide (TMG), Chapter 4: Traffic Monitoring for Non-Motorized Traffic, October 2016, National Cooperative Highway Research Program (NCHRP) Report 797, Guidebook on Pedestrian and Bicycle Volume Data Collection, 2014, NCHRP Web-Only Document 229, Methods and Technologies for Pedestrian and Bicycle Data Collection: Phase 2, 2016, Report FHWA-HPL , Exploring Pedestrian Counting Procedures: A Review and Compilation of Existing Procedures, Good Practices, and Recommendations, May 2016, Alta Planning + Design, Innovation in Bicycle and Pedestrian Counts: A Review of Emerging Technology, 2016, The material in this section has been mostly compiled and adapted from these sources, particularly the FHWA TMG and NCHRP Report 797. The sources are cited where applicable. The following 15 count technologies are summarized (listed alphabetically): Inductance loops Infrared: Active Infrared: Passive ADOT Bicyclist and Pedestrian Count Strategy Plan 10

 pass over the loops (description used or adapted from NCHRP Report 797).")
14 Laser scanners Magnetometers Manual observers Piezoelectric strips Pneumatic tubes Pressure and seismic/acoustic sensors Radar Radio beams Stereoscopic sensors Thermal imaging Video: Automated reduction Video: Manual reduction Other emerging technologies Each technology is described in the following pages, and pictures are included to show a typical application. Inductance Loops Wires are installed under (embedded) or on top (temporary) of the pavement surface. Small electrical currents running through the wires that form the loops generate a magnetic field. The processing unit detects changes in this magnetic field that occur when metal parts of a bicycle (e.g., frame, spokes, and pedals) pass over the loops (description used or adapted from NCHRP Report 797). Figure 2 shows an elongated diamond shape that is used specifically for counting bicyclists. Other inductance loop shapes used for bicyclists include quadrupole, diamond quadrupole, and double chevron (see FHWA TMG). Figure 2 Inductance Loops for Counting Bicyclists ADOT Bicyclist and Pedestrian Count Strategy Plan 11
.")

.")
15 Infrared: Active An infrared beam is projected from an emitter to a receiver located on opposite sides of a traveled way (e.g., path or sidewalk). When the infrared beam is broken for a set period of time by an object crossing it, a detection is recorded (description used or adapted from NCHRP Report 797). Figure 3 shows two different views of an active infrared sensor deployed for counting sidewalk users. Figure 3 Active Infrared Sensor for Counting Pedestrians and Bicyclists Infrared: Passive An infrared sensor compares the temperature of the background to the infrared radiation (heat) patterns emitted by persons passing in front of the sensor. A passive infrared sensor is placed on one side of the facility being counted (description used or adapted from NCHRP Report 797). Figure 4 shows a passive infrared sensor being used to count pedestrians on a sidewalk. Figure 4 Passive Infrared Sensor for Counting Pedestrians and Bicyclists ADOT Bicyclist and Pedestrian Count Strategy Plan 12
.")

16 Laser Scanners Laser scanners emit laser pulses in a range of directions and analyze the reflections of the pulses to determine characteristics of the device s surroundings, including the presence of pedestrians or bicyclists. Two varieties of laser scanners exist: horizontal and vertical (description used or adapted from NCHRP Report 797). Laser scanners for counting pedestrians and bicyclists are still considered experimental and are not widely or commercially available. Figure 5 shows an overhead laser scanner being used in a controlled experiment. Figure 5 Overhead Laser Scanner in Lab Experiment (Source: Akamatsu et al., Development of a Person Counting System Using a 3D Laser Scanner, IEEE 2014) Magnetometers Magnetometers operate by detecting a change in the normal magnetic field of the earth caused by a ferrous metal object (e.g., bicycle frame or components). It may be possible to use existing motorized traffic magnetometers for counting bicyclists; however, the installation and configuration may not be optimal for accurate bicyclist counting (description used or adapted from FHWA TMG). Figure 6 shows a magnetometer being installed for a motor vehicle application. Figure 6 Magnetometer That Could Be Used for Counting Bicyclists (Source: FHWA-HRT , ADOT Bicyclist and Pedestrian Count Strategy Plan 13


17 Manual Observers Human data collectors record pedestrian and bicyclist counts using paper sheets, traffic count boards/devices, or smartphone apps. Counts are usually recorded for one to four hours in discrete time intervals, generally 15 minutes, although counts can be collected in shorter intervals if desired. Some count devices can timestamp all data points (description used or adapted from NCHRP Report 797). Figure 7 shows the data collection screen on the Go Counter smartphone-based app that is provided free of charge by the Railsto-Trails Conservancy. Figure 7 Smartphone-Based Manual Count App Piezoelectric Strips Thin strips of metal are installed under (embedded) or on top of the pavement surface, and the piezoelectric materials emit an electric signal when they are physically deformed by wheeled traffic (e.g., bicycles). The electric signal is detected by a roadside processing unit (description used or adapted from NCHRP Report 797). Figure 8 shows an installation of piezoelectric strips being used to count bicyclists. Figure 8 Piezoelectric Strips for Counting Bicyclists (Source: NCHRP Report 797) ADOT Bicyclist and Pedestrian Count Strategy Plan 14


 operate by detecting the passage of energy waves through the ground caused by feet, bicycle tires, or other non-motorized wheels")
18 Pneumatic Tubes One or more rubber tubes are stretched across the expected bicyclist travel path of a roadway or pathway. When a bicycle or other wheeled vehicle passes over a rubber tube, a pulse of air passes through the tube to a roadside processing unit, which then registers an axle count. Multiple tubes can be used to determine speed and directionality (description used or adapted from NCHRP Report 797). Figure 9 shows a two-tube system used to collect directional bicyclist counts. Figure 9 Pneumatic Tubes for Counting Bicyclists Pressure and Seismic/Acoustic Sensors Pressure sensors operate by detecting changes in force (i.e., weight), much like an electronic bathroom scale. Seismic sensors (also sometimes called acoustic sensors) operate by detecting the passage of energy waves through the ground caused by feet, bicycle tires, or other non-motorized wheels (description used or adapted from FHWA TMG). Figure 10 shows a pressure pad that has been installed on a paved pathway. Figure 10 Pressure Sensor for Counting Pedestrians (Source: Eco-Counter) ADOT Bicyclist and Pedestrian Count Strategy Plan 15

 Radio Beams A radio transmitter and receiver are positioned on opposite sides of the facility to be counted.")
19 Radar Ultra-low power, high-frequency pulses are transmitted and reflected off a target object (e.g., bicyclist), and return pulses are analyzed to determine object type, distance, and motion. The radar sensors are typically installed in the pavement. Figure 11 shows a radar sensor that is embedded just below the pavement surface, similar to the magnetometer sensor shown in Figure 6. Figure 11 Radar Unit for Counting Bicyclists (Source: Radio Beams A radio transmitter and receiver are positioned on opposite sides of the facility to be counted. A radio beam is sent from the transmitter to the receiver, and when the beam is broken, a user is detected. Devices that use multiple radio frequencies can differentiate between pedestrians and bicyclists (description used or adapted from NCHRP Report 797). Figure 12 shows an application of radio beam sensors for counting pedestrians. Figure 12 Radio Beam Sensors (Source: NCHRP Report 797) ADOT Bicyclist and Pedestrian Count Strategy Plan 16

 Thermal Imaging Thermal imaging sensors generate infrared images of body heat and work similarly to passive infrared counters but are typically mounted above the detection area.")
.")
20 Stereoscopic Sensors Stereoscopic sensors are similar to video imaging with automated reduction but use a pair of stereoscopic video inputs instead of a single video input. Computer algorithms are still used to automatically identify and count pedestrians and bicyclists. Figure 13 shows close-up and area-wide views of a stereoscopic sensor at a crosswalk. Figure 13 Stereoscopic Sensor for Counting Pedestrians and Bicyclists (Source: Thermal Imaging Thermal imaging sensors generate infrared images of body heat and work similarly to passive infrared counters but are typically mounted above the detection area. The overhead positioning allows thermal sensors to monitor the movement of persons and not just count the number of persons that pass the device. Thermal sensors are not affected by changes in ambient light (description used or adapted from NCHRP Report 797). Figure 14 shows a thermal imaging sensor that is intended for elevated mounting (not necessarily directly overhead). Figure 14 Thermal Imaging Sensor for Counting Pedestrians and Bicyclists (Source: Video: Automated Reduction Computer algorithms are used to automatically identify and count pedestrians and bicyclists in a defined zone from video. Some computer algorithms can operate in real-time in the field, whereas other algorithms process video recordings at a later time. Some algorithms can process video in both of these ADOT Bicyclist and Pedestrian Count Strategy Plan 17


21 ways. Figure 15 shows an example of a computer algorithm identifying and tracking pedestrians as they cross the street in a marked crosswalk. Figure 15 Automated Video Reduction for Counting Pedestrians and Bicyclists Video: Manual Reduction Video recordings are created from permanent or temporary camera field installations. Counts and other information (e.g., gender, helmet use, behavior, etc.) are transcribed manually from the video recordings by human observers, typically in an office environment. Figure 16 shows a technician installing video cameras on a utility pole. The video is retrieved and reduced later in the office. (Source: FHWA TMG) Figure 16 Manual Video Reduction for Counting Pedestrians and Bicyclists (Source: NCHRP Report 797) ADOT Bicyclist and Pedestrian Count Strategy Plan 18
22 Other Emerging Technologies As mentioned earlier, several technologies are primarily intended to gather data other than total counts, such as route choice, trip waypoints, trip origin and destination, or presence of at least one pedestrian or bicyclist. Examples of these technologies include: GPS-enabled smartphones with certain apps (e.g., Strava) Bluetooth or Wi-Fi readers Intersection control presence detectors Pedestrian crosswalk pushbuttons With these emerging technologies, only a sample of pedestrians and bicyclists are captured. In some cases, it is a very small and biased sample that is captured. Current research is investigating methods that can be used to accurately estimate total counts of pedestrians and bicyclists from these samples, but these approaches are still experimental and have not been adopted by most practitioners. Examples of Commercially Available Equipment The previous sections have described count technologies in a generic way, without mentioning actual available equipment. Table 1 lists examples of commercially available equipment for the technologies summarized in this report. This list includes the most commonly known equipment manufacturers in North America but may not include all possible manufacturers. Inclusion of a manufacturer herein does not indicate or imply endorsement of their product(s). Table 1 Examples of Commercially Available Equipment for Various Types of Technology Technology (Alphabetical) Inductance Loops Infrared: Active Infrared: Passive Laser Scanners Magnetometers Manual Observers Piezoelectric Strips Examples of Commercially Available Equipment (Alphabetical) Eco-Counter ZELT Roadsys HI-TRAC CMU Diamond Traffic Trail Counter TTC-4420 TrailMaster TM1550 Eco-Counter PYRO Roadsys HI-TRAC CMU TRAFx Trail Counter No commercially available models identified Econolite AccuSense Mag N/A MetroCount RidePod BP Roadsys HI-TRAC CMU Pneumatic Tubes Diamond Traffic Traffic Tally 6 Eco-Counter TUBE Jamar TRAX Cycles Plus MetroCount RidePod BT Pressure and Seismic/Acoustic Sensors Radar TimeMark Delta NT, TimeMark Gamma NT Eco-Counter SLAB TRAFx Mountain Bike Counter Econolite AccuSense MicroRadar Roadsys SDR Sensys Networks MicroRadar ADOT Bicyclist and Pedestrian Count Strategy Plan 19
23 Technology (Alphabetical) Radio Beams Stereoscopic Sensors Thermal Imaging Video: Automated Reduction Video: Manual Reduction Examples of Commercially Available Equipment (Alphabetical) Chambers Electronics Bike and People Counters Migma PedCount, Migma Bicycle Eco-Counter CITIX-IR FLIR TrafiSense Miovision Scout Numina Placemeter CountingCars.com CountCloud Miovision Scout Various consumer video cameras with manual reduction Selecting the Most Appropriate Count Technology The previous section summarized 15 different types of technology that could be used for counting pedestrians and bicyclists. In some cases, it may seem like a daunting task to select a specific technology that is best for a particular application, but there are several criteria that can be used to narrow the choices to the most appropriate technology. The FHWA TMG contains a selection matrix (Figure 17) that contains these criteria: 1. What are you counting? a. Bicyclists only. b. Pedestrians only. c. Pedestrians and bicyclists combined. d. Pedestrians and bicyclists separately. 2. How long are you counting? a. Permanent. b. Temporary or short term. 3. What is the life cycle (equipment plus operating/maintenance) cost per amount of data? 4. What technologies are used in common practice? a. Is there commercially available equipment for a given technology? Table 2 contains additional information about counting technologies and is sourced from the TMG. Table 3, Table 4, and Table 5 contain additional information about counting technologies and are sourced from NCHRP Report 797. Another important criterion is the accuracy of a technology. However, the TMG indicates that the accuracy of commercially available products can vary significantly based on configuration, installation, and level of use, even within a specific technology. There are two important points in this statement: Even if a technology has proven to be accurate in controlled tests, if that technology is not installed and configured correctly, it may not be as accurate in actual field conditions. Accuracy in actual field conditions may vary among equipment manufacturers due to sensor design, algorithm sophistication, etc. Therefore, a certain technology may not have a fixed and known accuracy, but instead a range of accuracy among several manufacturers products. ADOT Bicyclist and Pedestrian Count Strategy Plan 20
24 NCHRP Web-Only Document 229 describes extensive field accuracy tests of pedestrian and bicyclist counter equipment, but no names of equipment manufacturers are included. Table 6 summarizes the results from these extensive NCHRP evaluation tests. A bicyclist count technology review (Working Paper #2) conducted for the Maricopa Association of Governments (MAG) by Chen Ryan Associates summarized the most common count technologies (shown in Table 7). This study (focused just on counting bicyclists) recommended three different options that included different mixes of manual counts, video with manual reduction, and pneumatic tubes. ADOT Bicyclist and Pedestrian Count Strategy Plan 21


 ADOT Bicyclist")
25 Figure 17 Simplified Flowchart for Selecting Non-Motorized Count Equipment (Source: FHWA TMG, Figure 4-1) ADOT Bicyclist and Pedestrian Count Strategy Plan 22
26 Table 2 Comparison of Technologies for Counting Pedestrians and Bicyclists Technology Typical Applications Strengths Weaknesses Inductance Loop Permanent counts Bicyclists only Accurate when properly installed and configured Uses traditional motor vehicle counting technology Capable of counting bicyclists only Requires saw cuts in existing pavement or pre-formed loops in new pavement construction May have higher error with groups Magnetometer Permanent counts Bicyclists only May be possible to use existing motor vehicle sensors Commercially-available, off-the-shelf products for counting bicyclists are limited May have higher error with groups Pressure sensor/ pressure mats Permanent counts Typically, unpaved trails or paths Some equipment may be able to distinguish bicyclists and pedestrians Expensive/disruptive for installation under asphalt or concrete pavement Seismic sensor Short-term counts on unpaved trails Equipment is hidden from view Commercially-available, off-the-shelf products for counting are limited Radar sensor Short-term or permanent counts Bicyclists and pedestrians combined Capable of counting bicyclists in dedicated bike lanes or bikeways Commercially-available, off-the-shelf products for counting are limited Video Imaging Automated Short-term or permanent counts Bicyclists and pedestrians separately Potential accuracy in dense, high-traffic areas Typically, more expensive for exclusive installations Algorithm development still maturing Infrared Active Short-term or permanent counts Bicyclists and pedestrians combined Relatively portable Low profile, unobtrusive appearance Cannot distinguish between bicyclists and pedestrians unless combined with another bicycle detection technology Very difficult to use for bike lanes and shared lanes May have higher error with groups ADOT Bicyclist and Pedestrian Count Strategy Plan 23
27 Table 2, Continued Comparison of Technologies for Counting Pedestrians and Bicyclists Technology Typical Applications Strengths Weaknesses Infrared Passive Short-term or permanent counts Bicyclists and pedestrians combined Very portable with easy setup Low profile, unobtrusive appearance Cannot distinguish between bicyclists and pedestrians unless combined with another bicycle detector Difficult to use for bike lanes and shared lanes, requires careful site selection and configuration May have higher error when ambient air temperature approaches body temperature range May have higher error with groups Direct sunlight on sensor may create false counts Pneumatic Tube Short-term counts Bicyclists only Relatively portable, low-cost May be possible to use existing motor vehicle counting technology and equipment Capable of counting bicyclists only Tubes may pose hazard to trail users Greater risk of vandalism Video Imaging Manual Reduction Short-term counts Bicyclists and pedestrians separately Can be lower cost when existing video cameras are already installed Limited to short-term use Manual video reduction is labor-intensive Manual Observer Short-term counts Bicyclists and pedestrians separately Very portable Can be used for automated equipment validation Expensive and possibly inaccurate for longer duration counts (Source: FHWA TMG, Table 4-1) ADOT Bicyclist and Pedestrian Count Strategy Plan 24

 User characteristics include estimated age, gender, helmet use, use of wheelchair or other assistive device, pedestrian and bicyclist behaviors, and other characteristics.")
28 Table 3 Comparison of Count Technologies: User and Site Characteristics Notes: (1) Existing automated video systems may not use a completely automated counting process; they may also incorporate manual data checks of automated video processing. (2) Includes manual counts from video images (3) Technologies noted as Yes have at least one vendor that uses the technology to capture directionality. (4) User characteristics include estimated age, gender, helmet use, use of wheelchair or other assistive device, pedestrian and bicyclist behaviors, and other characteristics. (5) Roadway crossings at medians potentially have issues with over-counting due to people waiting in the median. Median locations were not tested during this project. (Source: NCHRP Report 797, Table 3-1) ADOT Bicyclist and Pedestrian Count Strategy Plan 25
29 Table 4 Comparison of Count Technologies: Volume, Width, and Duration Capabilities Notes: (1) Existing automated video systems may not use a completely automated counting process; they may also incorporate manual data checks of automated video processing. (2) Includes manual counts from video images (3) +: provides consistent counts (although some accuracy adjustment may be necessary) up to approximately 200 users per hour, ++: up to 600 users per hour, +++: beyond 600 users per hour. These are approximate ranges under typical conditions. The range also depends on specific characteristics (e.g., average user group size, mix of pedestrians and bicyclists, detection zone width). The maximum user volume range for manual counts assumes a single data collector is counting one type of user and no additional characteristics. Multiple manual data collectors can count more than 600 users per hour. Counts can be adjusted at user volumes above these levels. (4) +: typical detection zone width narrower than 4 meters (13 feet), ++: narrower than 6 meters (20 feet), +++: 6 meters (20 feet or wider). In the case of automated video and manual counts, the detection width may be 25 meters (82 feet) or wider. (5) +: typically used for 48 hours or less, ++: typically used for non-permanent short-or longer-term counts, +++: often used for permanent count sites. Most inductive loops are installed in the pavement, but there are also varieties that can be installed on the top of the pavement for up to 6 months. (Source: NCHRP Report 797, Table 3-2) ADOT Bicyclist and Pedestrian Count Strategy Plan 26

30 Table 5 Comparison of Count Technologies: Resources Notes: N/A: not applicable This table presents generalized information specific to particular counting technologies. Other aspects of counting products, such as battery life and communication interfaces, are also important to consider but are highly vendor-specific. (1) Existing automated video systems may not use a completely automated counting process; they may also incorporate manual data checks of automated video processing. (2) Includes manual counts from video images (3) $: equipment (not including permitting and installation) typically costs less than $1,000 as of 2013, $$: typically costs between $1,000 and $3,000, $$$: typically costs more than $3,000. The cost of most counting technologies is subject to economies of scale, so the site cost can be reduced by purchasing more counters. (4) Fewer dollar signs ($) indicate that it takes less time (and therefore fewer financial resources) to find an appropriate site and to obtain any required permits to install the counting product. Preparation can range from less than one day for manual counts to several months for technologies with more restrictive installation requirements. (5) More clocks are given to methods that require more installation time (e.g., cut pavement, secure the data logger, test and adjust the equipment). Installation can range from no time for manual counts and less than 30 minutes for passive infrared to more than a half day for inductive loops. (6) More dollar signs ($) indicate that the method is costlier for an average hour of counts, given the typical count duration for a particular method. These costs can range from a few cents per hour for automated technologies (the full equipment, preparation, and installation cost is spread across months of counts) to more than $50 per hour or manual counts (including training preparation time, management, and on-site labor costs). (7) More clocks indicate that more time is needed to prepare field data collectors to implement the counting method. A single data collector can be trained how to install or download data from a particular automated technology in less than 30 minutes, but it often takes more than one hour to thoroughly train data collectors to collect accurate manual counts. (8) More plusses (+++) indicate that a counting technology is easier to move after it has been installed. A minus sign (-) indicates that the technology is generally not intended to be used in more than one location based on the installation being permanent. (Source: NCHRP Report 797, Table 3-3) ADOT Bicyclist and Pedestrian Count Strategy Plan 27
31 Table 6 Accuracy of Counting Technology for Pedestrians and Bicyclists Notes: Mode: B = bicycle, C = combined bicycle and pedestrian, P = pedestrian APD = average percentage deviation, AAPD = average of the absolute percent difference, WAPD = weighted average percentage deviation, r = Pearson s Correlation Coefficient, N = number of hours evaluated, Average volume = hourly average pedestrian and bicycle counts based on video observation. Facility count statistics reflect both errors inherent to the counting device or technology, and bypass errors (i.e., missed detections due to bicyclists traveling outside the devices detection area). 1 A negative APD indicates undercounting of device. 2 AAPD weights over-counting and undercounting as absolute percentages. 3 WAPD accounts for the low-volume bias of the AAPD measure by weighting the AAPD based on the ground truth volume. 4 Values of Pearson s r closer to +1 indicate a stronger positive correlation. (Source: NCHRP Web-Only Document 229: Methods and Technologies for Pedestrian and Bicycle Volume Data Collection: Phase 2, ADOT Bicyclist and Pedestrian Count Strategy Plan 28
 ADOT Bicyclist and Pedestrian Count Strategy")
32 Table 7 Maricopa Association of Governments (MAG) Count Technology Summary (Source: Chen Ryan Associates, Bicycle Counting Technology Review: Working Paper #2, MAG Bicycle Count Project, June 5, 2013) ADOT Bicyclist and Pedestrian Count Strategy Plan 29
33 Current ADOT Count Capabilities Input on the current mechanisms and technologies used to collect pedestrian and bicycle data was solicited from ADOT. Discussions with ADOT staff provided the following input on bicycle and pedestrian data collection: The Central District collects bicycle and pedestrian data only rarely. It is estimated that approximately 10 data collection efforts were undertaken during the most recent 12-month period. It is estimated that about 20 percent of bicycle and pedestrian count efforts conducted by the Central District involved full-day data collection, whereas the majority collected data for only two hours at a time. Either pedestrian or bicycle volume, or both, are collected depending on the issue under study. When bicycle or pedestrian data are needed, the Central Region collects the data manually using staff. Contractors are not used because of the added expense. The most common reasons for collecting pedestrian and bicycle data include: o Evaluating existing signalized intersections to restrict right turns on red. o Evaluating unsignalized intersections to determine if a signal is warranted based on pedestrian or bicycle volume. o Evaluating a safety concern raised by a resident. Developers have not been required to submit pedestrian and bicycle volume data in conjunction with their development submittals. Once collected, pedestrian and bicycle data are not stored in a centralized electronic database but are available in association with other information related to the project or issue at hand. As the Central District comprises the Phoenix metropolitan area and is the most heavily populated and urbanized region in the state, its needs for bicycle and pedestrian data likely exceed those of most ADOT Districts. Discussions with an ADOT Traffic Signal Engineer indicated that pedestrian and bicycle demand data are not usually collected, except during traffic studies related to specific projects, such as traffic signal or pedestrian hybrid beacon warrant studies. The Traffic Design Manager in ADOT s Traffic Engineering Group concurred that pedestrian counts are taken only in conjunction with projects, but added that ADOT s Traffic Design Section has never collected bicycle volume data to his knowledge. According to ADOT s Bicycle and Pedestrian Program Coordinator, there is an Eco-Counter bicycle inductive loop system on SR 179 at milepost 307. The device collected data for approximately five years before it stopped working because of corrosion on the loop detector. ADOT did not indicate an ability (or awareness of an ability) to collect pedestrian data using signal infrastructure such as pedestrian pushbuttons. ADOT Bicyclist and Pedestrian Count Strategy Plan 30
34 Summary of Findings This chapter provided an overview of this research project and its key objectives, along with a technology review. The technology review was focused on proven technologies for counting pedestrians and bicyclists. Other emerging technologies (e.g., smartphone apps, Bluetooth or Wi-Fi readers, etc.) can gather data on a sample of people, but these methods to estimate total counts have not yet been firmly established. This chapter also summarized 15 different technologies that may be used to count pedestrians and bicyclists. In some cases, a specific technology may be suitable for only one non-motorized mode (e.g., inductance loops for bicyclists). In other cases, a technology may be able to count all non-motorized users, but may not be able to accurately distinguish between pedestrians and bicyclists (e.g., passive and active infrared). Some technologies are better suited for temporary or short-duration applications rather than permanent continuous operation (e.g., video with manual reduction or manual observers). Some technologies are still being developed for pedestrian and bicyclist applications and may not have a wide choice of manufacturer models that are commercially available. Lastly, this chapter provided the best available guidance for selecting the most appropriate counting technology. Several selection criteria from the FHWA TMG were listed, and other relevant technologybased criteria from NCHRP Report 797 were included. Accuracy was indicated as an important criterion, but accuracy can vary significantly within a technology type. The most recent accuracy results for different count technologies, from NCHRP Web-Only Document 229, are discussed, but no manufacturer or model names are provided for these accuracy results. Ultimately, the selection of most appropriate technologies for ADOT also may depend on data uses as well as available resources. The selection criteria will be influenced by whether the ADOT data uses are better served by collecting data at more locations for a shorter duration (i.e., temporary placement of count equipment) versus fewer locations but permanent installations. The FHWA TMG recommends the use of permanent counters to annualize short-duration counts. However, there are no definitive guidelines for the balance between permanent versus short-duration counts. The FHWA TMG indicates a rule of thumb of three to five continuous count locations should be installed for each distinct factor group (based on trip purpose and seasonality). ADOT Bicyclist and Pedestrian Count Strategy Plan 31
35 3. DATA COLLECTION METHODOLOGY AND PLAN Purpose and Use of Bicycle and Pedestrian Count Data The purpose of bicycle and pedestrian data collection is multifold, including providing information to support safety analyses, justify bicycle and pedestrian improvement projects, and establishing performance measurement. These justifications are discussed as follows. Supporting Safety Analyses The number of bicyclists and pedestrians using a facility provides information on the exposure, which is defined as pedestrian/bicyclist proximity to potentially harmful situations involving motor vehicles (i.e., crossing an intersection). Exposure is related to the opportunity for a crash. Pedestrian/bicyclist risk is defined as the probability that a pedestrian/bicyclist-motor vehicle crash will occur based on the exposure. Information on bicycle and pedestrian volumes at locations with identified safety concerns can help in evaluating and documenting safety concerns. Justifying or Prioritizing Pedestrian and Bicycle Improvements Information on bicycle and pedestrian volumes at specific locations can provide justification for traffic improvements. The following ADOT design guidance references bicycle and pedestrian usage: ADOT State Engineer MGT 02-1 Bicycle Policy (February 2007), Section 1e: Decisions will be made on a project basis weighing such factors as location, vehicular traffic, grades, anticipated bicycle usage, and right of way availability. (emphasis added) ADOT Roadway Design Guidelines (April 2014): These guidelines mention when bicycle traffic is prevalent, where bicycles are expected to be prevalent, pedestrian usage, pedestrian crossing volumes, where significant pedestrian activity occurs, and intersections with heavy bicycle or pedestrian volumes. ADOT Traffic Engineering Guidelines and Processes, Section 480 (December 2015): Has this highway segment been identified by the State Bicycle Coordinator or District as being used by bicyclists? Establishing Performance and Effectiveness Measurement Information on the number of bicyclists and pedestrians can assist in setting mode-share targets for walking and bicycling and tracking them over time. A byproduct of improved data collection is that communities can establish targets for increasing the percentage of trips made by walking and bicycling. Jurisdictions and agencies that routinely collect walking and bicycling data can track trends and prioritize investments to ensure the success of new facilities. These data are also valuable in linking walking and bicycling with transit. ADOT Bicyclist and Pedestrian Count Strategy Plan 32
36 Data Collection Site Identification and Prioritization This section describes the sources of information used to identify potential bicycle and pedestrian count locations and prioritize locations for bicycle and pedestrian counts. Data Sources Reviewed to Identify Bicycle and Pedestrian Count Locations Potential locations for bicycle and pedestrian counts were identified using the following sources: High-crash and high-risk areas identified in statewide bicycle and pedestrian safety plans. Regional/national bicycle routes, such as U.S. Bicycle Route (USBR) 90, which is part of a nationwide system of bicycle routes. Special event bicycle routes. Other sources such as the permanent count station for bicyclists on SR 179 (currently not in operation) and ADOT traffic signal locations. A description of the data sources is provided below. Bicycle and Pedestrian Safety Plans ADOT Pedestrian Safety Action Plan (July 2017) The 2017 ADOT Pedestrian Safety Action Plan (PSAP) identified improvements to effectively focus resources to reduce the greatest number of severe injuries and fatalities. A total of 17 segments and 13 intersections were identified as high pedestrian crash locations. Seventeen locations were identified as high-risk locations. Nine roadway segments with pedestrian safety issues were identified by tribal communities. The 2017 PSAP developed new recommendations, and in some cases, follow-up recommendations to 2009 PSAP recommendations. ADOT Pedestrian Safety Action Plan (June 2009) The 2009 ADOT PSAP recommended actions to reduce the number and rate of pedestrian crashes, fatalities, and injuries on the Arizona SHS. The 2009 PSAP recommends achievable strategies to improve pedestrian safety on the SHS. Improvements were recommended for 22 high crash segments, 11 interchanges, and 15 tribal community locations. The analysis was based on crash data from 2002 to 2006 and tribal input. ADOT Bicycle Safety Action Plan (September 2012) The ADOT Bicycle Safety Action Plan (BSAP) identified improvements, programs, and strategies to reduce the frequency of bicyclist fatalities and injury crashes that occur on state highways in Arizona. The study identified 15 priority intersection/interchange high-crash locations on state highways and 19 road segment locations, and identified a menu of potential countermeasures. These priority intersections and road segments were considered as potential count locations for this study. At the time of this study, the 2018 BSAP was not completed. Regional/National Bicycle Routes USBR 90 In 2015, the American Association of State Highway and Transportation Officials (AASHTO) approved ADOT s application to establish USBR 90, a continuous route through Arizona that connects to New Mexico and California (Figure 18). The route begins along I-10 at the California state line, runs through the Phoenix and Tucson metropolitan areas, and ends along SR 80 at the New Mexico state line. The Phoenix and Tucson areas each have extensive bikeway systems. Potential count locations focused on segments in urban areas in Arizona. ADOT Bicyclist and Pedestrian Count Strategy Plan 33
 Southern Tier Route The ACA")

37 Figure 18 U.S. Bicycle Route 90 Adventure Cycling Association (ACA) Southern Tier Route The ACA Southern Tier Route is a 3,055-mile route from San Diego, California to St. Augustine, Florida. The route is defined in seven sections. The route in Arizona is shown in Figure 19 and Figure 20. ADOT Bicyclist and Pedestrian Count Strategy Plan 34
 (Source: Adventure Cycling Association, Adventure")
")
 (Source: Adventure Cycling Association, Adventure ADOT")
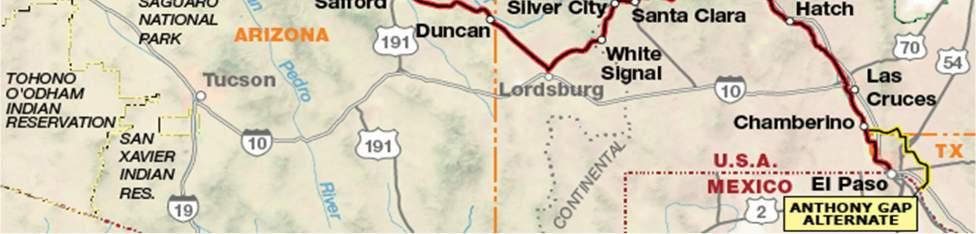
38 Figure 19 ACA Southern Tier Route Section 1 (San Diego, California to Tempe, Arizona) (Source: Adventure Cycling Association, Adventure Cycling Route Southern Tier, Figure 20 ACA Southern Tier Route, Section 2 (Tempe, Arizona to El Paso, Texas) (Source: Adventure Cycling Association, Adventure Cycling Route Southern Tier, ADOT Bicyclist and Pedestrian Count Strategy Plan 35
 is America s largest perimeter bicycling event and includes routes of 106, 76, 54, 37, or 28 miles as well as rides of 10, four, one, or ¼ miles.")
 is an annual event that includes 100k- and 50k- routes.")
39 Special Event Routes Potential bicycle count locations were selected from special event routes. Some examples are summarized below. El Tour De Tucson El Tour De Tucson (Figure 21) is America s largest perimeter bicycling event and includes routes of 106, 76, 54, 37, or 28 miles as well as rides of 10, four, one, or ¼ miles. It is held annually on the Saturday before Thanksgiving. Several bicycle count locations are on this route. Figure 21 El Tour De Tucson Route Map (2017) Source: ETT-Route-MapColor-4-25.pdf El Tour De Mesa El Tour De Mesa ( Figure 22) is an annual event that includes 100k- and 50k- routes. In 2017, the event was held on April 1. Potential count locations on this route are located on SR 87, north of Shea Boulevard. Figure 22 El Tour De Mesa Route Map (2017) Source: ADOT Bicyclist and Pedestrian Count Strategy Plan 36

40 Cochise County Cycling Classic Cochise County Cycling Classic (Figure 23) is America s longest perimeter cycling event and includes routes of 165, 95, 47, and 27 miles. The event starts and finishes in Douglas, Arizona and is held in early October. A bicycle count location is at the SR 191/SR 80 intersection. Figure 23 Cochise County Cycling Classic Route Map Source: Verde Valley Cyclists Coalition Ride Routes The Verde Valley Cyclists Coalition has scheduled road rides in Sedona, the Village of Oak Creek, Cottonwood, Clarkdale, and Jerome. Locations on SR 89A and SR 179 were identified as potential count locations. Other Sources ADOT Permanent Count Station on SR 179 ADOT has one permanent count location for bicycles on located on SR 179 at milepost 307. This location has inductive loops, which are currently not operational since the loops need to be replaced. It is recommended that these loops be replaced to continue to provide bicycle count data. ADOT Traffic Signals The project team reviewed the feasibility of collecting bicycle and pedestrian count data at ADOT traffic signal locations equipped with video/thermal detection and pedestrian pushbutton call data. As described later, existing video detectors in the field and on the market are not yet able to fulfill this dual role. However, numerous ADOT traffic signal locations are recommended as count locations. More information on traffic signal technology to count bicycles and pedestrians is provided in Appendix E. Bicycle and Pedestrian Count Locations and Prioritization In total, 130 bicycle and pedestrian count locations were identified. Data collection sites identified are summarized in Table 8. All sites are mapped in Appendix B. It should be noted that the site numbering is not always consecutive because some locations were considered but not advanced for further analysis (see Appendix C for those sites). ADOT Bicyclist and Pedestrian Count Strategy Plan 37
41 Criteria were developed based on guidance and information from sources such as the FHWA TMG, NCHRP Guidebook on Pedestrian and Bicycle Volume Data Collection (2014), and other references summarized in Appendix A. The following criteria were developed: Pedestrian and bicyclist activity areas or corridors Activity areas indicate that there may be higher levels of bicyclist or pedestrian activity. Locations such as routes for bicycle events, shared-use paths and trails, and U.S. Bicycle Route 90, part of a national network of bicycle routes, are examples of activity areas. Other considerations were sites locates near downtown areas, schools, or parks. Fatal and/or injury crash history Crash history is an important consideration in addressing sites with potential safety concerns; sites were selected from the ADOT Pedestrian Safety Action Plan and Bicycle Safety Action Plan. Area type (urban-suburban or rural) Urban and suburban sites were preferred because they have more bicyclist and pedestrian activity, and greater exposure to motor vehicles. Permanent count stations Proximity of permanent count stations for motor vehicles was a consideration because it is desirable for the bicyclist/pedestrian count program to be incorporated into the ADOT Traffic Data Management System (TDMS) in the future; proximity will streamline maintenance of the counters. Programmed improvements Programmed improvements were considered to support before and after studies to determine the improvement s effectiveness in attracting new users to the facility. Prioritization Sites were prioritized into the following categories: o Priority 1A Locations in the Phoenix and Tucson regions 34 sites o Priority 1B Other high-priority locations in urbanized areas of Sierra Vista, Flagstaff, Sedona, and Prescott 13 sites o o Priority 2 Sites outside of urbanized areas, or where there were multiple sites in the same area 13 sites Future Sites in rural or more remote areas, or where specific locations were not well defined 70 sites Location Locations that minimized travel between data collection locations were considered in prioritizing sites. Priority 1A and 1B sites were recommended for short term counts under this study based on the available budget and equipment available to conduct the traffic counts. ADOT Bicyclist and Pedestrian Count Strategy Plan 38
42 Table 8 Sites Considered for Bicycle and Pedestrian Counts Location ID Area Source Location High Crash Intersections from Pedestrian and Bicycle Safety Plans Area Type Specific Location for Count Pedestrian and Bicycle Activity Areas or Corridors (downtowns, near schools, parks, etc.) Fatal and/or Injury Crash History? Permanent Count Station? Programmed Improvements? Type of Count (pedestrian, bicycle, or both) Other Considerations (e.g., need for night counts) Type of Count Recommended Length of Count Priority 1A Location Priority 1B Location Priority 2 Location Future Comments - Justification 1 Phoenix 2017 PSAP and 2012 BSAP 2 Tucson 2017 PSAP SR 77/River Road 3 Tucson 2017 PSAP SR 77/Ina Road 4 Phoenix 2017 PSAP and 2012 BSAP Northern Avenue/I-17 5 Phoenix 2017 PSAP 67 th Avenue/I Phoenix 2017 PSAP Dysart Road/I Fort Mohave 2017 PSAP SR 95/Joy Lane 8 Flagstaff 2017 PSAP I-40B/(SR 89A) Milton Road 9 Flagstaff 2017 PSAP US 180/Birch Avenue 11 Phoenix 2017 PSAP Glendale Avenue/I-17 Bethany Home Road/I- 17 Urban- Suburban Urban- Suburban Urban- Suburban Urban- Suburban Urban- Suburban Urban- Suburban Ramp crossings SR 77/River Road SR 77/Ina Road Ramp crossings Ramp crossings Ramp crossings Various commercial Various commercial, multi-use path in vicinity Various commercial Various commercial, school near 27 th Avenue Various commercial and industrial including large truck stops south of I-10 Various commercial Rural SR 95/Joy Lane Various commercial, Mohave High School nearby Urban- Suburban Urban- Suburban Urban- Suburban I-40B/(SR 89A, MP 403) Milton Road US 180/Birch Avenue Ramp crossings Various commercial and university Various commercial, park, school, and library Various commercial, high school near 23 rd Avenue and Homestead Park Yes No No Both N/A Video 48 hours ü Identified in both the BSAP and 2017 PSAP Yes No SR 77, Jct. I-10 to Genematas, pavement rehabilitation, FY 2018 Yes On SR 77, north of Ina Road (#100800) SR 77, Genematas Drive to Calle Concordia, pavement rehabilitation Yes No I-17, Northern Avenue TI, predesign for TI, FY 2021 Both N/A Video 48 hours ü PSAP high crash intersection Both N/A Video 48 hours ü Near permanent count location Both N/A Video 48 hours ü Identified in both the BSAP and 2017 PSAP Yes No No Pedestrian N/A Video 48 hours ü PSAP high crash intersection Yes No I-10, Dysart Road to I-17 Pavement Rehabilitation, FY 2018 Pedestrian N/A Video 48 hours ü PSAP high crash intersection Yes No North of site, at Pedestrian N/A Video 48 hours ü PSAP high crash location SR 95, Teller Road to Aztec Road, ROW and construct raised median and roundabout, FY Yes No No Both N/A Video 48 hours ü High crash pedestrian intersection Yes No South of site, US 180, SR 40 B to Aspen Avenue, construct turn lane, FY 2019 Yes No I-17/Glendale Avenue TI, Predesign for TI, FY 2021 Both N/A Video 48 hours ü High crash pedestrian intersection Pedestrian N/A Video 48 hours ü PSAP high crash intersection ADOT Bicyclist and Pedestrian Count Strategy Plan 39
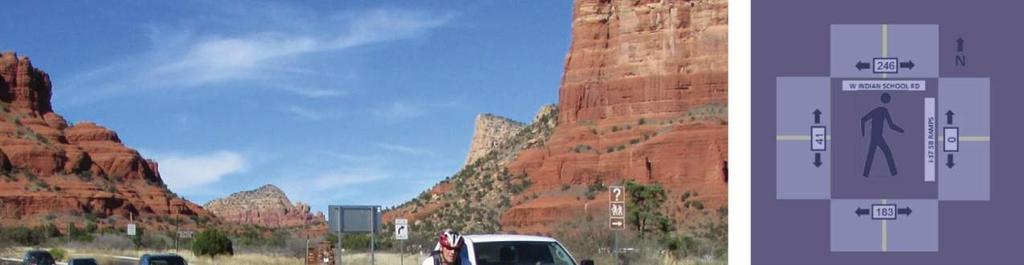
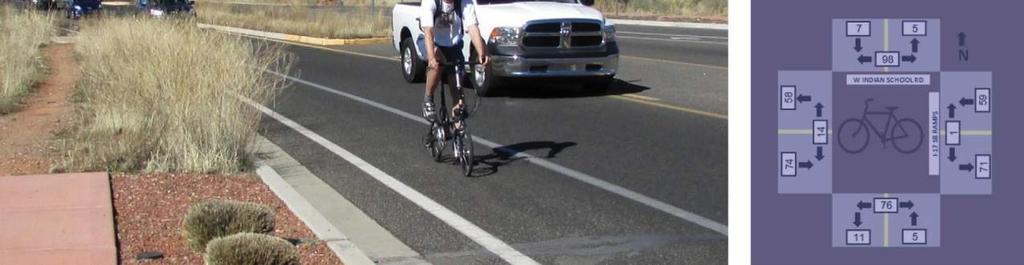
43 Location ID Area Source Location 12 Phoenix 2017 PSAP and 2012 BSAP Indian School Road/I Phoenix 2017 PSAP Thomas Road/I Tempe 2012 BSAP Scottsdale Road/SR Phoenix 2012 BSAP Indian School Road/SR Tempe 2012 BSAP Priest Drive/SR Tempe 2012 BSAP Baseline Road/I Chandler 2012 BSAP SR 101 frontage roads and Sun Circle Trail Crossing Area Type Urban- Suburban Urban- Suburban Urban- Suburban Urban- Suburban Urban- Suburban Urban- Suburban Urban- Suburban 20 Chandler 2012 BSAP SR 87/SR 202 Urban- Suburban 21 Mesa 2012 BSAP SR 87/McKellips Road Urban- Suburban 22 Phoenix 2012 BSAP 7 th Street/ I-10 Urban- Suburban 23 Phoenix 2012 BSAP 24 th Street/SR Phoenix 2012 BSAP 27 th Avenue/SR Tempe 2012 BSAP US 60/Priest Drive 26 Phoenix 2009 PSAP Greenway Road/I Phoenix 2009 PSAP 7 th Avenue/ I Phoenix 2009 PSAP Cactus Road/I- 17 Urban- Suburban Urban- Suburban Urban- Suburban Urban- Suburban Urban- Suburban Urban- Suburban Specific Location for Count Ramp crossings Ramp crossings Ramp crossings Ramp crossings Ramp crossings Pedestrian and Bicycle Activity Areas or Corridors (downtowns, near schools, parks, etc.) Various commercial Various commercial, high school near 20 th Avenue Mainly commercial Commercial and residential Industrial, commercial, business Fatal and/or Injury Crash History? Permanent Count Station? Programmed Improvements? Yes No I-17/Indian School Rd, Predesign, Design, and ROW, utilities, FY 2020 and FY 2022 Type of Count (pedestrian, bicycle, or both) Both Other Considerations (e.g., need for night counts) Pedestrian crossing compliance an issue here Yes No No Pedestrian Pedestrian crossing compliance an issue here Type of Count Recommended Length of Count Priority 1A Location Priority 1B Location Priority 2 Location Future Comments - Justification Video 48 hours ü Identified in both the BSAP and 2017 PSAP Video 48 hours ü PSAP high crash intersection Yes No No Bicycle N/A Tube 1 week ü Future count location Yes No No Bicycle N/A Video 48 hours ü PSAP high crash intersection Yes No No Bicycle N/A Tube 1 week ü Future count location Ramp crossings Commercial Yes No No Both N/A Video 48 hours ü Activity area - near Arizona Mills Mall SR 101 frontage Commercial, Yes No No Bicycle N/A Tube 1 week ü roads and Sun residential, Circle Trail business Crossing (Western Canal Path), approximately MP Ramp crossings Commercial Yes No No Bicycle N/A Tube 1 week ü Future count location SR 87/McKellips Road Commercial Yes No No Bicycle N/A Tube 1 week ü Activity area Ramp crossings Business, commercial, residential Yes No No Bicycle N/A Video 48 hours ü Activity area Ramp crossings Residential, Yes No No Bicycle N/A Video 48 hours ü PSAP high crash intersection business Ramp crossings Commercial Yes No SR 101, 75 th Bicycle N/A Tube 1 week ü Future count location Avenue to I-17, Predesign for widening, FY 2021 Ramp crossings Commercial, Yes No Bicycle N/A Tube 1 week ü Future count location residential Ramp crossings Ramp crossings Hotels and residential School, business, residences Yes No I-17, Peoria Rd to Greenway Road, drainage improvements, FY 2021 Pedestrian N/A Video 48 hours ü Future count location Yes No No Pedestrian N/A Video 48 hours ü Future count location Ramp crossings Commercial Yes No I-17, Peoria Road to Greenway Road, drainage Pedestrian N/A Video 48 hours ü Future count location ADOT Bicyclist and Pedestrian Count Strategy Plan 40
44 Location ID Area Source Location 30 Phoenix 2009 PSAP 32 nd Street/SR Phoenix 2009 PSAP Camelback Road/I Phoenix 2009 PSAP Dunlap Road/I Tempe 2009 PSAP University Drive/SR PSAP High Crash Segments Area Type Urban- Suburban Urban- Suburban Urban- Suburban Urban- Suburban Specific Location for Count Pedestrian and Bicycle Activity Areas or Corridors (downtowns, near schools, parks, etc.) Fatal and/or Injury Crash History? Permanent Count Station? Programmed Improvements? Type of Count (pedestrian, bicycle, or both) Other Considerations (e.g., need for night counts) Type of Count Recommended Length of Count Priority 1A Location Priority 1B Location Priority 2 Location Future Comments - Justification improvements, FY 2021 Ramp crossings Commercial Yes No No Pedestrian N/A Video 48 hours ü Future count location Ramp crossings Commercial Yes No I-17, Design and reconstruct TI, FY Pedestrian N/A Video 48 hours ü Future count location Ramp crossings Commercial Yes No No Pedestrian N/A Video 48 hours ü Future count location Ramp crossings Commercial Yes No No Pedestrian Night counts Video 48 hours ü Future count location 34 Tuba City 2017 PSAP US 160 (MP MP 324.5) 35 Chinle 2017 PSAP US 191 (MP MP 449) 36 Golden Valley 2017 PSAP SR 68 (MP MP 24.3) 37 Golden Valley 2017 PSAP SR 68 (MP MP 24.3) 38 Bullhead City 2017 PSAP SR 68 (MP MP 3.5) 39 Fort Mohave 2017 PSAP SR 95 (MP MP 239.2) Rodeo Drive to Gardner Road 40 Whiteriver 2017 PSAP SR 73 (MP MP 341) 41 Whiteriver 2017 PSAP SR 73 (MP MP 341) 42 Sierra Vista 2017 PSAP SR 92 (MP ), Fry to Yaqui Street Rural Rural SR 160/Main Street (west of segment) US 191, at intersection of Navajo Route 8092, or Navajo Route 7 Some commercial, the study area segment has very little development Small clusters of housing north of Chinle Yes No Project to construct bus pullouts MP in 2019, which may include lighting Pedestrian Night counts Video 48 hours ü Future count location Yes No No Pedestrian Night counts Video 48 hours ü Future count location Rural SR 68/Hope Road, Commercial Yes No No Pedestrian Night counts Video 48 hours ü Future count location Rural Rural Urban- Suburban Urban- Suburban Urban- Suburban Urban- Suburban SR 68 at Houck Road SR 68, at intersection of Landon Drive SR 95/Camino Colorado Road SR 73/Elm Street SR 73/Maple Street (south of MP 340) SR 92 at Avenida Cochise Commercial Yes No No Pedestrian Night counts Video 48 hours ü Future count location Residential area south of segment Various commercial, medical, schools Commercial, schools Yes On SR 68, 2.5 miles SE of the SR 68/Landon Drive intersection (#100723) No Pedestrian Night counts Video 48 hours ü Future count location Yes No Construct Raised Pedestrian Night counts Video 48 hours ü Future count location Median and Signal Improvement in 2019 Yes No Three pedestrian crossings programmed in 2018 Pedestrian Night counts Video 48 hours ü Three pedestrian crossings programmed in 2018 Residential Yes No No Pedestrian Night counts Video ü Future count location Various commercial, churches, residential Yes No No Pedestrian Night counts Video 48 hours ü Future count location ADOT Bicyclist and Pedestrian Count Strategy Plan 41
45 Location ID Area Source Location 43 Sierra Vista 2017 PSAP SR 92 (MP ), Fry to Yaqui Street 44 Sierra Vista 2017 PSAP SR 92 (MP ), Fry to Yaqui Street 45 Three Points 2017 PSAP SR 86 (MP MP 153.0) 46 Tucson 2017 PSAP SR 86 (MP MP ) 47 Pima County 2017 PSAP SR 77 (Roller Coaster Road to Suffolk Drive) (MP ) 48 Pima County 2017 PSAP SR 77 (Roller Coaster Road to Suffolk Drive) (MP ) 49 Flagstaff 2017 PSAP SR 89A (Milton Rd), Forest Meadows SR 40B 53 Surprise 2017 PSAP US 60 (MP MP 145) 54 Phoenix 2017 PSAP US 60 (MP MP 159.5) Area Type Urban- Suburban Urban- Suburban Specific Location for Count SR 92/Golden Acres Drive SR 92/Yaqui Street Pedestrian and Bicycle Activity Areas or Corridors (downtowns, near schools, parks, etc.) Various commercial, churches, residential Various commercial, churches, residential Rural SR 86/Antique Way Some commercial Urban- Suburban Urban- Suburban Urban- Suburban Urban- Suburban Urban- Suburban Urban- Suburban SR 86/Mission Road SR 77/Orange Grove Road SR 77/Rudasill Road SR 89A at University Drive US 60 at Greenway Road US 60 at Indian School Road Various commercial, school, library Various commercial Various commercial University and various commercial Various commercial, school and park; railroad tracks run along north side Various commercial, schools and industrial land use; railroad tracks Fatal and/or Injury Crash History? Permanent Count Station? Programmed Improvements? Type of Count (pedestrian, bicycle, or both) Other Considerations (e.g., need for night counts) Type of Count Recommended Length of Count Priority 1A Location Priority 1B Location Priority 2 Location Future Comments - Justification Yes No No Pedestrian Night counts Video 48 hours ü Fatal pedestrian crash site Yes No No Pedestrian Night counts Video 48 hours ü Future count location Yes No Pavement preservation, MP in 2017 Yes No Ajo Way/I-19 interchange construction in progress Yes No A signalized twostage pedestrian crosswalk north of Rudasill Rd, New sidewalk (Genematas Road Calle Concordia) in FY 2020, Oracle Rd/Orange Grove Rd Intersection Improvement, FY 2018/2020 Yes No A signalized twostage pedestrian crosswalk north of Rudasill Road New sidewalk (Genematas Road Calle Concordia) in 2020 Pedestrian Night counts Video 48 hours ü Future count location Pedestrian Night counts Video 48 hours ü Activity center in this segment Pedestrian N/A Video 48 hours ü Future intersection improvement planned Pedestrian N/A Video 48 hours ü Future count location - in the vicinity of site 47 Yes No No Both Night counts Video 48 hours ü Fatal crash location Yes No US 60, Greenway Road to Thompson Ranch (Thunderbird) Road, Construct frontage road, FY 2018 Pedestrian Night counts Video 48 hours ü Future count location Yes No, No Pedestrian Night counts Video 48 Hours ü however PC station on US 60 north of Camelback Rd (#101869) Future count location ADOT Bicyclist and Pedestrian Count Strategy Plan 42
46 Location ID Area Source Location 55 San Carlos 2017 PSAP US 70 (MP MP 259.0) 56 Mesa 2017 PSAP US 60X, Apache Trail (Meridian Road - 83 rd 2017 PSAP High Risk Segments (HRS) Place) Area Type Rural Urban- Suburban Specific Location for Count US 70 at Casino Driveway (approximately MP 258.4) US 60X (Apache Trail)/Hawes Street Pedestrian and Bicycle Activity Areas or Corridors (downtowns, near schools, parks, etc.) Apache Gold Casino and San Carlos Apache Airport is located on the south side of US 70. Various commercial, residential, and schools Fatal and/or Injury Crash History? Permanent Count Station? Programmed Improvements? Yes No US 70, Extend EB passing lane, MP , FY 2018 Type of Count (pedestrian, bicycle, or both) Other Considerations (e.g., need for night counts) Type of Count Recommended Length of Count Priority 1A Location Priority 1B Location Priority 2 Location Future Comments - Justification Pedestrian Night counts Video 48 hours ü activity area Yes No No Pedestrian Night counts Video 48 hours ü Future count location 57 Bullhead City 2017 PSAP - HRS 58 Bullhead City 2017 PSAP - HRS 59 Bullhead City 2017 PSAP - HRS 60 Fort Mohave 2017 PSAP - HRS 61 Maricopa 2017 PSAP - HRS 62 Phoenix/Glendale 2017 PSAP - HRS 63 Glendale 2017 PSAP - HRS 64 Glendale 2017 PSAP - HRS 65 Peoria 2017 PSAP - HRS SR 95, MP MP 246 (north of Manna Blvd to Arcadia Blvd) SR 95, MP MP 246 (north of Manna Boulevard to Arcadia Boulevard) SR 95, MP MP 244 SR 95, MP MP SR 347, MP MP US 60, MP MP US 60, MP MP US 60, MP MP US 60, MP MP Urban- Suburban Urban- Suburban Urban- Suburban Urban- Suburban Urban- Suburban Urban- Suburban Urban- Suburban Urban- Suburban Urban- Suburban SR 95/Plata Drive SR 95/Hancock Road SR 95/Riverview Drive SR 95/Willow Drive SR 347/Alterra Parkway/ M.L.K. Jr. Boulevard US 60/Bethany Home US 60/55 th Avenue Commercial, high school, and nearby residential School, commercial Big Box store, commercial, church, residential Various commercial, casino Park, residential Commercial, school Post office, commercial, school Yes No No Pedestrian N/A Video 48 hours ü Future count location Yes No Video No Pedestrian N/A Video 48 hours ü Future count location Yes No No Pedestrian Night counts Video 48 hours ü Future count location Yes No No Pedestrian N/A Video 48 hours ü Future count location Yes On SR 347, 0.5 miles south of Alterra Parkway, # No Pedestrian N/A Video 48 hours ü Future count location Yes On US 60, No Pedestrian N/A Video 48 hours ü Pedestrian fatality location south of Bethany Home Road, # Yes No No Pedestrian N/A Video 48 hours ü Fatality location, recommended evaluating intersection operations US 60/59 th Avenue Commercial Yes No No Pedestrian N/A Video 48 hours ü Future count location - recommended for evaluation of intersection operations US 60/83 rd Avenue Commercial Yes On US 60 at Olive Avenue (#101866) and at 87 th No Pedestrian N/A Video 48 hours ü Incapacitating pedestrian crash location ADOT Bicyclist and Pedestrian Count Strategy Plan 43
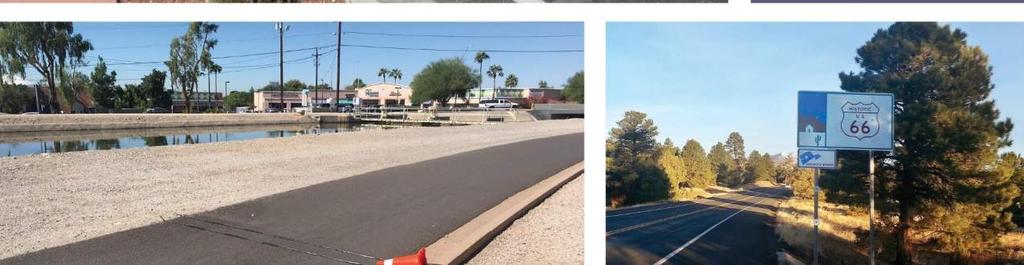
47 Location ID Area Source Location 67 Sun City 2017 PSAP - HRS 68 Surprise 2017 PSAP - HRS 69 Prescott Valley 2017 PSAP - HRS 70 Douglas 2017 PSAP - HRS 71 Sierra Vista 2017 PSAP - HRS 72 Tucson 2017 PSAP - HRS 73 Tucson Pima Association of Governments 74 Tucson 2017 PSAP - HRS 75 Tucson 2017 PSAP - HRS 76 Tucson 2017 PSAP - HRS BSAP Focus Area Segments US 60, MP MP US 60, MP MP SR 69, MP MP US 191, MP MP SR 90, MP MP SR 86, MP MP (La Cholla Boulevard to Los Santos Street SR 77, MP MP 72.0 (Fairview to River Road) SR 77, MP MP 72.0 (Fairview to River Road) SR 77, MP MP 72.0 (Fairview to River Road) SR 77, MP MP 75.4 (Roller Coaster to Suffolk) Area Type Urban- Suburban Urban- Suburban Urban- Suburban Urban- Suburban Urban- Suburban Urban- Suburban Urban- Suburban Urban- Suburban Urban- Suburban Urban- Suburban Specific Location for Count Pedestrian and Bicycle Activity Areas or Corridors (downtowns, near schools, parks, etc.) Fatal and/or Injury Crash History? Permanent Count Station? Programmed Improvements? Type of Count (pedestrian, bicycle, or both) Other Considerations (e.g., need for night counts) Type of Count Recommended Length of Count Priority 1A Location Priority 1B Location Priority 2 Location Future Comments - Justification Avenue (#101864) US 60 /99 th Ave Residential Yes No No Pedestrian N/A Video 48 hours ü Future count location US 60/111 th Avenue SR 69/Lake Valley Road US 191/SR 80 intersection SR 90/Columbo Avenue SR 86/17 th Avenue SR 210 Multiuse path at Park Avenue SR 77/Prince Road SR 77/Auto Mall Drive SR 77/Las Lomitas Road Commercial, grocery store, schools Yes No No Pedestrian Night counts Video 48 hours ü Activity area Commercial Yes No No Pedestrian N/A Video 48 hours ü Future count location Commercial Yes No No Pedestrian N/A Video 48 hours ü Future count location; also a fatality site in the 2009 PSAP Commercial Yes No No Both Night counts Video 48 hours ü Future count location Library, commercial, park to north continuous multiuse path Various commercial Various commercial Yes No No Pedestrian Night counts Video 48 hours ü Future count location Unknown No No Both N/A Video 48 hours ü Activity area Yes No SR 77, I-10 to Genematas Drive, Pavement Rehabilitation, FY 2018 Yes No SR 77, I-10 to Genematas Drive, Pavement Rehabilitation, FY 2018 Commercial Yes N/A SR 77, Las Lomitas to Ina Road, Design and Construct Street Lighting, FY 2018 and 2020 Both N/A Video 48 hours ü Future count location Both N/A Video 48 hours ü Site 2 (SR 77/River Road) will capture this traffic Pedestrian N/A Video 48 hours ü Near Site 2 Future count location 80 Mesa 2012 BSAP Apache Boulevard at SR Tucson Pima Association of Governments I-10/ St. Mary s Road Urban- Suburban Urban- Suburban Apache Boulevard at SR 101 I-10/ St. Mary s Road Commercial, residential near downtown Tucson Yes On 101 at Rio Salado Parkway (#101251) No Bicycle N/A Tube 1 week ü Within a BSAP focus area Unknown No No Both N/A Video 48 hours ü Developments on all four approaches, including Tucson Mall ADOT Bicyclist and Pedestrian Count Strategy Plan 44
48 Location ID Area Source Location 86 Payson 2012 BSAP SR 87, Forest Drive to Ridge Lane 87 Casa Grande 2012 BSAP SR 287/SR 387, Cottonwood Lane to Arizona Road 88 Kingman 2012 BSAP SR 66, I-40 to Armour Avenue 91 Tucson 2012 BSAP SR 77 (Miracle Mile), Fairview Avenue to Romero Road 92 Sedona 2012 BSAP SR 89A, Dry Creek Road to Soldier Pass Road 93 Flagstaff 2012 BSAP US 180, SR 40B to Meade Lane 94 Mesa 2012 BSAP US 60X, Sossaman Road to Meridian Dr 95 Sierra Vista 2012 BSAP SR 92/SR 90, MLK Parkway/Tree Top Ave to Calle Mercancia 96 Gilbert 2012 BSAP SR 87, Guadalupe Road to Baseline Road 2009 PSAP High Crash Segments Not Included in the 2017 PSAP Area Type Urban- Suburban Urban- Suburban Urban- Suburban Urban- Suburban Urban- Suburban Urban- Suburban Urban- Suburban Urban- Suburban Urban- Suburban Specific Location for Count SR 87/SR 260 Pedestrian and Bicycle Activity Areas or Corridors (downtowns, near schools, parks, etc.) Various commercial Fatal and/or Injury Crash History? Permanent Count Station? Programmed Improvements? Type of Count (pedestrian, bicycle, or both) Other Considerations (e.g., need for night counts) Type of Count Recommended Length of Count Priority 1A Location Priority 1B Location Priority 2 Location Future Comments - Justification Yes No No Bicycle N/A Tube 1 week ü Future count location SR 287/SR 387 Commercial Yes No No Bicycle N/A Video 48 hours ü Site for both BSAP and 2009 PSAP SR 66, between Armour Avenue and I-40 interchange SR 77/Flowing Wells Road SR 89A/Thunderbird Drive (approx. MP 371.2) US 180, north of Apache Road (approx. MP 216.2) SR 60X (Apache Trail)/ Crismon Road SR 90/SR 92/Fry Boulevard intersection SR 87, north of Desert Lane Industrial, commercial Yes No No Bicycle N/A Tube 1 week ü ACA Bicycle Route 66 location; Future count location Commercial Yes No SR 77, I-10 to Genematas (MP 68-72), Pavement rehabilitation, FY 2018 Both N/A Tube 1 week ü Future count location Commercial, Yes No No Bicycle N/A Tube 1 week ü Future count location church Commercial Yes On US 180 north of Apache Rd (#102189) No Bicycle N/A Tube 1 week ü Future count location Commercial, Yes No No Bicycle N/A Video 48 hours ü Fatal crash site (2009 BSAP) residential Commercial Yes No SR 92, SR 90 to Kachina (MP ), Pavement Preservation, FY 2018 Commercial, residential at southern end of segment Yes On SR 87, south of Guadalupe Road (#100971) Both N/A Video 48 hours ü Activity area No Bicycle N/A Tube 1 week ü Defer to confirm specific location 97 Bullhead City 2009 PSAP SR 95 and SR 68, North Oatman (MP 243.5) to Davis Dam Rd (MP 251.3) 98 Bullhead City 2009 PSAP SR 95, Joy Lane (MP 236.4) to Camp Mohave Road (MP 238.4) Urban- Suburban Urban- Suburban SR 95/ 5 th Street SR 95, Camp Mohave Drive (MP 238.4) Site of Pedestrian Hybrid Beacon (PHB) Yes No No Pedestrian Night counts Video 48 hours ü Site of PHB Commercial Yes No South of site, SR 95, Aztec Road to Valencia and Camp Mohave Roundabout design, construct roundabout and Pedestrian Night counts Video 48 hours ü In this segment, higher priority is counted at SR 95/Joy Lane (2016 PSAP high crash location) ADOT Bicyclist and Pedestrian Count Strategy Plan 45
49 Location ID Area Source Location 101 Flagstaff 2009 PSAP US 89, Snowflake Drive/ Trailsend Drive (MP 420.1) to Townsend Winona Road (MP 420.7) 102 Holbrook 2009 PSAP 5 th Avenue (MP 286.3) to I-40 Exit 286 G-Ramp (MP 287.4) 105 Sedona 2009 PSAP SR 89A, Dry Creek Road (MP 371) to Soldier Pass Road (MP 372.9) 106 Sedona 2009 PSAP SR 89A, Dry Creek Road (MP 371) to Soldier Pass Road (MP 372.9) 107 Casa Grande 2009 PSAP SR -387/Pinal Ave, SR 287 (MP 0) to Cottonwood Lane (MP 1) 108 Coolidge 2009 PSAP SR 87, Martin Road (MP 131.5) to Vah Ki Inn Rd (MP 133.5) 109 Gila River Indian 2009 PSAP SR 587, MP Community 220 area 110 Gila River Indian 2009 PSAP SR 87, MP 135 Community to MP Navajo Nation (Cameron, Coconino County) 112 Navajo Nation (Kayenta, Navajo County) 113 Navajo Nation (Kayenta, Navajo County) 114 Navajo Nation (Ganado, Apache County) 2009 PSAP US 89, MP MP PSAP US 160, MP MP PSAP US 163, MP MP PSAP SR 264, MP MP Area Type Urban- Suburban Urban- Suburban Urban- Suburban Urban- Suburban Urban- Suburban Urban- Suburban Specific Location for Count US 89/Trailsend Drive SR 40B (Navajo Boulevard)/Florida Street SR 89A/Dry Creek Road SR 89A/Rodeo Road (approx. MP 372) SR 387/Cottonwood Lane SR 87/Northern Avenue Pedestrian and Bicycle Activity Areas or Corridors (downtowns, near schools, parks, etc.) Wupatki Park headquarters, church Fatal and/or Injury Crash History? Permanent Count Station? Programmed Improvements? Type of Count (pedestrian, bicycle, or both) Other Considerations (e.g., need for night counts) Type of Count Recommended Length of Count Priority 1A Location Priority 1B Location Priority 2 Location Future Comments - Justification raised median, FY Yes No No Pedestrian N/A Video 48 hours ü Future count location Commercial Yes No No Pedestrian N/A Video 48 hours ü Future count location Commercial Yes No No Pedestrian N/A Video 48 hours ü Future count location Commercial Yes No No Pedestrian Unknown Video 48 hours ü Near fatal crash site in 2009 PSAP Commercial, residential School, commercial Yes No No Pedestrian N/A Video 48 hours ü Future count location Yes No No Pedestrian N/A Video 48 hours ü Future count location, Northern Avenue was site of incapacitating injury crash in 2009 PSAP Rural SR 587/BIA 68 TBD Yes No No Pedestrian N/A Video 48 hours ü Future count location Rural SR 87/BIA 68 Residential Yes No No Pedestrian N/A Video 48 hours ü Future count location Rural US 89/SR 64 TBD Yes No No Pedestrian N/A Video 48 hours ü Future count location Rural US 160/US 163 Commercial Yes On US 160, 1.8 miles west of intersection (#102178) No Pedestrian N/A Video 48 hours ü Future count location Rural US 163/MP 396 Commercial Yes No No Pedestrian N/A Video 48 hours ü Future count location Rural No specific location identified Commercial Yes No No Pedestrian N/A Video 48 hours ü Future count location ADOT Bicyclist and Pedestrian Count Strategy Plan 46
50 Location ID 115 Navajo Nation (Window Rock, Apache County) 116 Tohono O odham Nation 117 Tohono O odham Nation 118 Tohono O odham Nation Area Source Location 2009 PSAP SR 264, MP MP PSAP SR 86, MP 74 - MP PSAP SR 86, MP 90 - MP PSAP SR 86, MP MP Hopi Tribe 2009 PSAP SR 264, MP MP Hopi Tribe 2009 PSAP SR 264, MP MP 369 USBR 90 Locations Area Type Specific Location for Count Pedestrian and Bicycle Activity Areas or Corridors (downtowns, near schools, parks, etc.) Fatal and/or Injury Crash History? Permanent Count Station? Programmed Improvements? Type of Count (pedestrian, bicycle, or both) Other Considerations (e.g., need for night counts) Type of Count Recommended Length of Count Priority 1A Location Priority 1B Location Priority 2 Location Future Comments - Justification Rural SR 264/BIA 12 Tribal government, commercial Yes No No Pedestrian N/A Video 48 hours ü Future count location Rural No specific School Yes No No Pedestrian N/A Video 48 hours ü Future count location - no specific location identified location identified Rural Rural Rural Rural No specific location identified No specific location identified SR 264 near Second Mesa Elementary School (west of SR 87/SR 264 intersection No specific location identified Rural community of Maish Vaya, scattered residential, store near MP 92.3 Sells, Middle School (MP 115) Yes No No Pedestrian N/A Video 48 hours ü Future count location - no specific location identified Yes No No Pedestrian N/A Video 48 hours ü Future count location - no specific location identified School Yes No No Pedestrian N/A Video 48 hours ü Future count location Scattered residential Yes No No Pedestrian N/A Video 48 hours ü Future count location - no specific location identified 121 Sierra Vista USBR 90 SR 90, at Campus Drive 122 Tucson USBR 90 Julian Wash Greenway Path, at Littletown Road 123 Tucson USBR 90 Santa Cruz River Park Path, north of Speedway Boulevard 124 Mesa USBR 90 Adobe Street, west of 80 th Street 125 Tempe USBR 90 North College Avenue, north of Curry Road 126 Phoenix USBR 90 Campbell Avenue, east of 26 th Street 127 Phoenix USBR 90 Arizona Canal Trail, south of Glendale Avenue 128 Phoenix USBR 90 Arizona Canal Trail, west of 25 th Avenue Urban- Suburban Urban- Suburban Urban- Suburban Urban- Suburban Unknown No TBD Bicycle N/A Tube Long term count 10/1/2017-1/31/18 Urban- Suburban Park Unknown No TBD Bicycle N/A Tube Long term count 10/1/2017-1/31/18 ü USBR 90 location High school, Unknown No TBD Bicycle N/A Tube 1 week ü USBR 90 location residences Urban- Suburban Urban- Suburban Unknown No TBD Bicycle N/A Tube Long term count 10/1/2017-1/31/18 Unknown No TBD Bicycle N/A Tube Long term count 10/1/2017-1/31/18 Urban- Suburban SR 90/Campus Drive Julian Wash Greenway Path, at Littletown Road Santa Cruz River Park Path, north of Speedway Boulevard Adobe Street, west of 80 th Street North College Avenue, north of Curry Road Campbell Avenue, east of 26 th Street Arizona Canal Trail, south of Glendale Avenue Arizona Canal Trail, west of 25 th Avenue College, commercial Unknown No No Bicycle N/A Tube 1 week ü USBR 90 location Parks, schools Unknown No TBD Bicycle N/A Tube 1 week ü USBR 90 location Commercial, nearest location to university Red Mountain Park, schools Unknown No TBD Bicycle N/A Tube 1 week ü USBR 90 location ü USBR 90 location Trailhead Bike and Café, residential Parks, crosses I-17 nearby ü ü USBR 90 location USBR 90 location ADOT Bicyclist and Pedestrian Count Strategy Plan 47
51 Location ID Area Source Location 129 Glendale USBR 90 Arizona Canal Trail, near 59 th Avenue 130 Peoria USBR 90 Deer Valley Road, west of 95 th Avenue 131 Wickenburg USBR 90 US 60 (Wickenburg Way) at MP 108 (west of Lazy Fox Road) Other Sites for Consideration Area Type Urban- Suburban Urban- Suburban Urban- Suburban Specific Location for Count Arizona Canal Trail, near 59 th Avenue Deer Valley Road, west of 95 th Avenue US 60 (Wickenburg Way) at MP 108 (east of Lazy Fox Road) Pedestrian and Bicycle Activity Areas or Corridors (downtowns, near schools, parks, etc.) School, residential, medical center Fatal and/or Injury Crash History? Permanent Count Station? Programmed Improvements? Type of Count (pedestrian, bicycle, or both) Other Considerations (e.g., need for night counts) Type of Count Recommended Length of Count Unknown No TBD Bicycle N/A Tube Long term count 9/21/17-1/31/18 Priority 1A Location ü Priority 1B Location Priority 2 Location Future Comments - Justification USBR 90 location High school Unknown No TBD Bicycle N/A Tube 1 week ü USBR 90 location Residential, business Unknown No No Both N/A Video 48 hours ü USBR 90 location; there is a bike route as well as a parallel path on the north side of the street 132 Sedona Scenic route SR 179, Back O Beyond to SR 179/89A intersection 133 Sedona and Village of Oak Creek 134 Village of Oak Creek 135 Santan-Gila River Indian Community Site of Eco- Counter inductive loop for bike count Scenic route Special event route SR 179, MP 307 (north of Bell Rock Boulevard) SR 179, north of Rojo Drive/ Wild Horse Mesa Drive SR 87, MP MP 158 Urban- Suburban Urban- Suburban Urban- Suburban SR 179 at MP 311 Residential Unknown On SR 179 at MP (#101342) SR 179 at MP 307 Mixed use Unknown Eco-Counter inductive loop for bike count SR 179, approximately MP (between SR 179/Wild Horse Mesa Drive and roundabout at Avenue De Piedras No No Both (to count multiuse path and bike route Both (to count multiuse path and bike route Residential Unknown No No Both (to count multiuse path and bike route (#101341) Rural SR 87 at MP 157 Vacant land Unknown On SR 87 at MP 159 (#100967) N/A Video 48 hours ü Scenic bicycling route N/A Video 48 hours ü Site of Eco-Counter inductive loop that is currently non-operational N/A Video 48 hours ü Scenic bicycling route No No N/A Tube 1 week ü Special event route 136 Tucson El Tour De Tucson route map 137 Safford ACA Southern Tier Route 138 Prescott ACA Grand Canyon Connector Route 139 Flagstaff Area suitable for bicyclists 140 Fountain Hills/Fort McDowell Reservation Special event route SR 77, north of Greenock Drive US 70 at Nelson Drive (MP 342) SR 89 (White Spar Road)/ Cheery Street (MP 310) US 180 (Fort Valley Road, Forest Avenue to Arizona Snow Bowl Road) SR 87 (Beeline Highway), Shea Boulevard to Bush Highway Urban- Suburban Suburban Urban- Suburban Urban- Suburban Rural SR 77, north of Greenock Drive (approximately MP 78.7) US 70 at Nelson Drive (MP 342) SR 89 (White Spar Road)/ Cheery Street/Aspen Way (MP 310) US 180/Forest Avenue (approx. MP 216.4) SR 87, north of Shea Boulevard, MP 189 Special event route and activity area Unknown No Bicycle N/A Tube 1 week ü On El Tour De Tucson route Residential Unknown No No Bicycle N/A Tube 1 week ü Future count location Mainly residential Offices, residential, fairly undeveloped in this area Undeveloped along this part of route, although Shea Unknown No No Both N/A Video 48 hours ü Sidewalks and a bike lane on both sides of the street Unknown No No Both N/A Video 48 hours ü Flagstaff urban trail on the north side of street Unknown No, but there is a WIM station at MP (#100979) No Bicycle N/A Tube 1 week ü Special event route ADOT Bicyclist and Pedestrian Count Strategy Plan 48
52 Location ID Area Source Location 141 Maricopa Area suitable for bicyclists 142 Yuma Area suitable for bicyclists 143 Cottonwood Mingus Mountain Loop 144 Sedona Mingus Mountain Loop 145 Verde Valley Area suitable for bicyclists 146 Clarkdale Verde Valley Cyclists group SR 347, Maricopa Road to West Riggs Road US 195 at East 32 nd Street SR 89A SR 89A SR 179, Verde Valley Area SR 89A, west of Clarkdale Area Type Urban- Suburban Urban- Suburban Urban- Suburban Urban- Suburban Rural Rural Specific Location for Count SR 347, north of SR 238 (Smith Enke Road), MP 175 SR 195 south of East 32 nd Street, approximately MP 27 SR 89A south of Bill Gray Road (approximately MP 358) SR 89A north of Page Springs Road (MP 363) SR 179, north of Beaverhead Flat Road (approximately MP 305) SR 89A at Wildhorse Lane, approx. MP Lake Havasu City TAC SR 95 Urban SR 95/ McCulloch Blvd 148 Miami TAC US 60 at Suburban US 60 at Radanovich Radanovich Blvd Blvd Pedestrian and Bicycle Activity Areas or Corridors (downtowns, near schools, parks, etc.) Boulevard is developed Commercial, residential Fatal and/or Injury Crash History? Permanent Count Station? Programmed Improvements? Type of Count (pedestrian, bicycle, or both) Other Considerations (e.g., need for night counts) Type of Count Recommended Length of Count Priority 1A Location Priority 1B Location Priority 2 Location Future Comments - Justification Unknown No No Bicycle N/A Tube 1 week ü Suggested location Commercial Unknown No No Bicycle N/A Tube 1 week ü Future count location School Unknown No No Bicycle N/A Tube 1 week ü Mingus Mountain Loop route Undeveloped in this area, scenic Undeveloped in this area, scenic Undeveloped in this area, scenic Near London Bridge Shopping plaza on north side that attracts pedestrian traffic Unknown No No Bicycle N/A Tube 1 week ü Mingus Mountain Loop route Unknown No SR 179, I-17 to Red Rock Vista, Pavement Preservation, FY 2018 Bicycle N/A Tube 1 week ü Site is within a loop - SR 179/Beaverhead Flat Road/ Cornville Road/ SR 89A Unknown No No Bicycle N/A Tube 1 week ü No shoulders Unknown No No Bicycle N/A tube 1 week ü Activity area Unknown No MP 246, US 60 at 2 nd St/ EL Camino St, intersection improvements FY 2019 Pedestrian N/A Video 48 hours ü Activity area 149 Sierra Vista TAC SR 92, south of Ramsey Road 150 Sierra Vista TAC USBR 90 Charleston Road Urban Urban SR 92, south of Ramsey Road approx. MP 327.4, Charleston Road near Donnet Ranch Rd Scenic area Unknown No SR 92, SR 90 to Kachina, Pavement Preservation, FY 2018 Scenic bike route, part of US BR90 Unknown No Unknown not a state route Bicycle N/A Tube 1 week ü Tube count by Sierra Vista MPO Bicycle N/A Tube 1 week ü Tube count by Sierra Vista MPO ADOT Bicyclist and Pedestrian Count Strategy Plan 49
53 Population Distribution of Count Locations Although site location was determined through a process that considered findings of safety plans, bicycle routes, and local agency input, it was desirable to compare the percent of total bicycle and pedestrian count locations to the percent of population in each jurisdiction, county, and unincorporated area within the state to determine the distribution of count sites geographically. This comparison by county is provided in Table 9. Appendix D shows a further breakdown of count locations and populations by county, jurisdiction, and unincorporated area. There was a relatively higher distribution of bicycle and pedestrian count locations in Cochise, Coconino, Mohave, Navajo, and Yavapai Counties because relatively more high-crash or high-risk locations were identified in bicycle and pedestrian safety action plans. In some cases, these areas also had bicycle routes that were desirable to survey because of their significance as regional or special event bicycle routes. Maricopa and Yuma Counties had a somewhat lower proportion of pedestrian and bicycle sites, because of a proportionally lower number of high-crash or high-risk locations in these areas. Table 9 Comparison of Population and Count Locations` Number of Count 2016 Population Percent of Total Percent of Total Location Locations Estimate State Population Count Locations Proposed Apache County 72, % 2 1.5% Cochise County 128, % 9 6.9% Coconino County 142, % 9 6.9% Gila County 54, % 2 1.5% Graham County 38, % 2 1.5% Greenlee County 10, % 0 0.0% La Paz County 21, % 0 0.0% Maricopa County 4,137, % % Mohave County 205, % % Navajo County 110, % 8 6.1% Pima County 1,013, % % Pinal County 413, % 8 6.1% Santa Cruz County 50, % 0 0.0% Yavapai County 220, % % Yuma County 217, % 1 0.8% TOTAL 6,835, % % ADOT Bicyclist and Pedestrian Count Strategy Plan 50
54 Data Collection Methodology and Plan Short-Term Count Locations This section discusses the locations and methodology for the short-term counts conducted as part of this study. Pedestrian and Bicycle Count Locations Based on a review of the prioritization criteria and budget considerations, Table 10 and Figure 24 summarize locations that were identified for count locations to be performed in this study. These are the Priority 1A locations identified in the Phoenix and Tucson regions (34 sites) and Priority 1B sites located in Sierra Vista, Prescott, Sedona, and Flagstaff (13 sites). The Priority 1B sites are shown in Table 11 and Figure 25. In general, the sites with video data collection will have data collection for a 48-hour period. Tube count locations were generally identified to have collection periods for 7 days; however, at five locations, longer duration counts (approximately four months long) were identified to be conducted using count equipment available from MAG, under its Bicycle Counter Loan Program. The longer-term counts will allow for analysis of seasonal variations. These longer-term count locations in the Phoenix region are: Site 124, Adobe Street west of 80th Street Site 125, North College Avenue north of Curry Road Site 127, Arizona Canal Trail south of Glendale Avenue Site 128, Arizona Canal Trail west of 25th Avenue Site 129, Arizona Canal Trail near 59th Avenue The counts conducted in this study will set the stage for a long-term count program that can be expanded over time. Other potential future count sites (Priority 2 and Future sites) are shown in the maps in Appendix B and in Table 8. Count Technology and Duration Based on information on count technologies provided in Chapter 2, discussions with ADOT staff, and TAC input, the following count methodologies are recommended for the short-term counts conducted under this study. Additional research was conducted on the feasibility of using traffic signal technologies to count bicycle and pedestrian data; however, the conclusion was that this is not feasible at this time. More information on this research is provided in Appendix E. Bicycle-Only Count Locations Count technology recommended: Pneumatic tubes. One or more rubber tubes are stretched across the expected bicyclist travel path of a roadway or path. When a bicycle or other wheeled vehicle passes over a rubber tube, a pulse of air passes through the tube to a roadside processing unit, which then registers an axle count. Multiple tubes can be used to determine speed and directionality. Figure 9 shows a twotube system used to obtain directional bicyclist counts. ADOT Bicyclist and Pedestrian Count Strategy Plan 51
55 Table 10 Short-Term Count Locations - Priority 1A Id Area Location 19 Chandler SR 101 Frontage Road/Sun Circle Trail Crossing 140 Fountain Hills SR 87, north of Shea Boulevard, MP Glendale US 60/55th Avenue 129 Glendale Arizona Canal Trail, near 59th Avenue 21 Mesa SR 87/McKellips Road 56 Mesa US 60X (Apache Trail)/Hawes Street 80 Mesa Apache Boulevard at SR Mesa SR 60X (Apache Trail)/Crismon Road 124 Mesa Adobe Street, west of 80th Street 130 Peoria Deer Valley Road, west of 95th Avenue 65 Peoria US 60/83rd Avenue 1 Phoenix Bethany Home Road/I-17 Ramp crossings 5 Phoenix 67th Avenue/I-10 Ramp crossings 6 Phoenix Dysart Road/I-10 Ramp crossings 11 Phoenix Glendale Avenue/I-17 Ramp crossings 12 Phoenix Indian School Road/I-17 Ramp crossings 13 Phoenix Thomas Road/I-17 Ramp crossings 16 Phoenix Indian School Road/SR 51 Ramp crossings 22 Phoenix 7th St/I-10 Ramp crossings 23 Phoenix 24th St/SR 202 Ramp crossings 126 Phoenix Campbell Avenue, east of 26th Street 127 Phoenix Arizona Canal Trail, south of Glendale Avenue 128 Phoenix Arizona Canal Trail, west of 25th Avenue 47 Pima County SR 77/Orange Grove Road 18 Tempe Baseline Road/I-10 Ramp crossings 125 Tempe North College Avenue, north of Curry Road 2 Tucson SR 77/River Road 3 Tucson SR 77/Ina Road 46 Tucson SR 86/Mission Road 73 Tucson SR 210 multiuse path/park Avenue 83 Tucson I-10/St. Mary s Road 122 Tucson Julian Wash Greenway Path, at Littletown Rd 123 Tucson Santa Cruz River Park Path, north of Speedway Blvd 136 Tucson SR 77, north of Greenock Drive ADOT Bicyclist and Pedestrian Count Strategy Plan 52
56 Figure 24 Short-Term Count Locations - Priority 1A ADOT Bicyclist and Pedestrian Count Strategy Plan 53
57 Figure 24, Continued Short-Term Count Locations - Priority 1A ADOT Bicyclist and Pedestrian Count Strategy Plan 54
58 Table 11 Short-Term Count Locations - Priority 1B Id Area Location 8 Flagstaff I-40B/ (SR 89A) Milton Road 9 Flagstaff US 180/Birch Avenue 43 Sierra Vista SR 92/Golden Acres Dr 49 Flagstaff SR 89A at University Dr 95 Sierra Vista SR 90/92/Fry Blvd intersection 106 Sedona (Yavapai County) SR 89A/Rodeo Road 132 Sedona (Coconino County) SR 179 at MP Village of Oak Creek (unincorporated Yavapai County) SR 179 at MP Prescott SR 89 (White Spar Rd)/Cherry Street (MP 310) 139 Flagstaff US 180/Forest Avenue (MP 216.4) SR 89 A south of Bill Gray Road (approximately 143 Cottonwood MP 358) 144 Sedona (Yavapai County) SR 89 A north of Page Springs Road (MP 363) 145 Verde Valley (unincorporated Yavapai County) SR 179, north of Beaverhead Flat Rd (approximately MP 305) ADOT Bicyclist and Pedestrian Count Strategy Plan 55
59 Figure 25 Short Term Count Locations - Priority 1B ADOT Bicyclist and Pedestrian Count Strategy Plan 56
60 Figure 25, Continued Short Term Count Locations - Priority 1B ADOT Bicyclist and Pedestrian Count Strategy Plan 57
61 Length of count: typically, one week. As mentioned previously, long-term counts were identified to be conducted at five locations in the Phoenix area over a four-month period to determine seasonal variations. Count considerations: In locations where there is a shoulder area and a shared-use path, it is desirable to count both locations simultaneously. At intersections, tubes were placed on approach and departure legs. Pedestrian-Only Counts and Bicycle/Pedestrian Counts Count technology recommended: Video with manual reduction. Video recordings are created from permanent or temporary camera field installations. Counts are transcribed manually from the video recordings by human observers, typically in an office environment. For this study, video counts were conducted using Miovision video cameras and processing. Manual reduction ensures at least 95% data accuracy. Length of count: 48 hours, which reduces the need to change batteries mid-count. The counts are planned for weekdays. Count considerations: To accurately record data at night, the cameras must be near a light source. At intersections, it is desirable to count bicycles and pedestrians in the crosswalks, as well as bicycles in the roadway. It is desirable to count all bicycles and pedestrians traversing the intersection, regardless of where they are. Differentiating where they are (crosswalk versus travel lane) is useful information for analysis and design purposes. Data reduction at intersections is proposed to show all bicycle and pedestrian movements on all legs of the intersection. At interchanges, cameras need to record data on both sides of the interchange. Count Dates The counts were conducted during the months of September 2017 through February 2018, when weather conditions are favorable for pedestrians and bicyclists. Data collection in the northern part of the state was scheduled in September and October Considerations in scheduling the bicycle and pedestrian count data include the following: The Pima Association of Governments (PAG) conducts annual regional bicycle and pedestrian counts, which are scheduled for two weeks in October. Weekday counts are scheduled during peak periods on either a Tuesday, Wednesday, or Thursday in the morning and late afternoon, from 7:00 to 9:00 a.m. and from 4:00 to 6:00 p.m. Weekend counts occur on either a Saturday or Sunday in the morning from 7:00 to 10:00 a.m. The count is principally a volunteer effort with PAG assisting as a technical resource and event coordinator. In 2017, counts were scheduled between October 15 and 29. The National Bicycle and Pedestrian Documentation Project designated official national count/survey days during the week of September 11, 2017, specifically Tuesday, September 12 through Thursday, September 14 and Saturday, September 16 through Sunday, September 17. This nationwide effort provides a consistent model of data collection and ongoing data for use by planners, governments, and bicycle and pedestrian professionals. MAG conducted a region-wide bicycle count in A consultant worked with MAG member agencies to select a count methodology and determine which sites would be counted. The counts were conducted in October and November of Counts were conducted at 44 sites ADOT Bicyclist and Pedestrian Count Strategy Plan 58
62 using pneumatic tube technology, allowing continuous 24-hour counts over two-week periods. An additional 84 sites were counted manually using consultant staff to perform counts during weekday afternoon peak travel periods (4:00 to 6:00 p.m.) and weekend morning peak travel periods (10:00 a.m. to 12:00 p.m.). Checking Quality Considerations for the data collection effort include: Counting bicycles at locations where there is a curb-attached sidewalk In this case, pneumatic tubes can be placed in a shoulder area and across a sidewalk. An asphalt tape is used to hold the tubes in place and reduce tripping hazards. One challenge is that the pneumatic tubes may be less sensitive in recording data. Accounting for cars drifting over the pneumatic tubes into the shoulder area The dual tube setup will allow for vehicle classification to determine if motor vehicles are part of the count. The dual tube setup will also allow for calculation of speeds, which is another way to differentiate motor vehicles from bicycles. Permissions At ADOT locations, a blanket permit is used for conducting counts. The permit is in effect for one year. At sites where data are collected using MAG tube count equipment, MAG staff generously offered to contact staff in those jurisdictions regarding permissions. At locations adjacent to tribal land, permits/permission typically must be obtained to install traffic count equipment. The specific requirements vary for each tribe. ADOT Bicyclist and Pedestrian Count Strategy Plan 59
63 4. ANALYSIS OF BICYCLIST AND PEDESTRIAN COUNT DATA Overview Chapter 4, in conjunction with Appendix F, presents the results of the data collection effort. Short-term counts at Priority 1A and 1B sites were conducted under this study. Table 10 and Table 11 summarize the count sites, which are also shown on the maps in Figure 24 and Figure 25. Data Collection Process and Trends Data were reviewed in the field to determine that the equipment was collecting data properly. In a few cases, counts were rescheduled or tubes replaced in the field if the data did not appear realistic, or if the tubes were damaged or vandalized. Types of Counts Conducted Bicyclist and pedestrian counts were collected in several ways, depending on the site characteristics and the type of data to be collected. Short-Term Tube Counts Tube counts were conducted using pneumatic tubes to record bicycle traffic only. These locations generally had one-week data collection periods. Tubes were placed to count bi-directional bicycle traffic. Equipment was deployed at locations around the state between September and December 2017 by Traffic Research & Analysis, Inc. Video Counts Most sites were counted using video data collection for a 48-hour period to capture both pedestrian and bicyclist traffic at an intersection, interchange, or other location where a mix of bicyclists and pedestrians were anticipated. Video bicyclist and pedestrian data were collected at locations around the state between September and December 2017 by Traffic Research & Analysis, Inc. Videos were manually reviewed to capture the bicyclist and pedestrian count data. Long-Term (Four-Month) Tube Counts Long-term count locations were identified for deployment from October 12, 2017, to January 31, 2018, at five locations in the Phoenix region: Site 124, Adobe Street west of 80th Street Site 125, North College Avenue north of Curry Road Site 127, Arizona Canal Trail south of Glendale Avenue Site 128, Arizona Canal Trail west of 25th Avenue Site 129, Arizona Canal Trail near 59th Avenue Long-duration counts were conducted using count equipment available from MAG, under its Bicycle Counter Loan Program. This equipment was installed by Kimley-Horn staff and checked on a weekly basis to confirm the tubes were in place and recording data. Site 128 (Arizona Canal Trail west of 25 th Avenue) experienced repeated vandalism and was removed on December 18, ADOT Bicyclist and Pedestrian Count Strategy Plan 60
64 Equipment at Site 127 (Arizona Canal Trail south of Glendale Avenue) and Site 129 (Arizona Canal Trail near 59 th Avenue) was removed a week early, on January 24, 2018, due to requests from the Flood Control District of Maricopa County relating to planned canal maintenance activities. Following is an overview of the data collected using each of these methods. Data Summary Short-Term Tube Count Summary Table 12 summarizes the results of counts that were conducted using pneumatic tubes for seven-day periods. Counts are shown by direction and by weekday and weekend periods. The sites counted included roadways with paved shoulders, shared-use paths, and designated bike lanes. The location with the highest number of bicyclists was in Mesa, at Site 80, on Apache Boulevard west of Price Road. This location had an average weekday total of 81 bicyclists per day and an average weekend total of 43 bicyclists per day over the week-long data collection period. Other busy sites included two sites in Tucson: Site 123 on the Santa Cruz River Park Shared-Use Path, and Site 122 on the Julian Wash Greenway Shared-Use Path. Figure 26 charts the total bicyclist counts for weekday versus weekend periods for 7-day bicyclist counts. Peaks by time-of-day were examined for the thirteen seven-day tube count locations. In general, hourly bicycle volumes were low. To see if trends emerged, an average of hourly volumes at all the tube count locations was computed, and the hourly totals are shown in Figure 27. This figure showed that in general, higher bicycle volumes appeared to occur at 11:00 a.m., 1:00 p.m., and 4:00 p.m. ADOT Bicyclist and Pedestrian Count Strategy Plan 61
65 Site Id Table 12 Daily Bicyclist Volumes Collected from 7-Day Tube Counts Jurisdiction Route Location Facility Type Direction of Travel Average Daily Bicycle Volume (Weekday) Average Daily Bicycle Volume (Weekend) NB/WB SB/EB Total NB/WB SB/EB Total 143 Cottonwood SR 89A S of N Bill Gray Rd Paved shoulder NB/SB Sedona SR 89A 145 Verde Valley 122 Tucson 123 Tucson N of Page Springs MP 363 Paved shoulder NB/SB SR 179 N of Beaver Flat Rd Bike lanes NB/SB Julian Wash Greenway Santa Cruz River Park Path NE of E Littletown Rd Shared-use path EB/WB N of W Speedway Blvd Shared-use path NB/SB Mesa E Apache Blvd W of S Price Rd Paved shoulder EB/WB Chandler N Price Rd S of Sun Circle Trail Striped shoulder NB/SB Mesa SR 87 S of W McKellips Rd Paved shoulder NB/SB Mesa W McKellips Rd W of SR 87 Paved shoulder EB/WB Fountain Hills SR 87 N of E Shea Blvd Paved shoulder NB/SB Peoria W Deer Valley Rd W of N 95 TH Ave Paved shoulder EB/WB Phoenix E Campbell Ave E of N 26 TH St Bike lanes EB/WB Tucson SR 77 N of W Greenock Dr Paved shoulder NB/SB ADOT Bicyclist and Pedestrian Count Strategy Plan 62
66 Average Daily Volume (Cyclists/day) Site ID Average Daily Bicycle Volume (Weekday) Average Daily Bicycle Volume (Weekend) Figure 26 Average Daily Bicycle Volumes, Weekend Versus Weekday ADOT Bicyclist and Pedestrian Count Strategy Plan 63
67 7 Day Tube Count Locations 30 Sum of Average Daily Bicycle Volumes TIme of Day Figure 27 Sum of Average Daily Bicycle Volumes by Time of Day for Tube Count Locations ADOT Bicyclist and Pedestrian Count Strategy Plan 64
68 Video Count Summary Table 13 summarizes data collection for intersection and interchange locations using 48-hour video equipment. The table summarizes the average daily pedestrian and bicyclist traffic for the entire intersection. The site with the highest level of combined pedestrian and bicyclist activity is Site 49 (Milton Road at University Drive) in Flagstaff, where an average of 1,524 pedestrians and 641 bicyclists were recorded. Table 14 shows video data collected at road segment locations with both pedestrian and bicyclist traffic. Site 22, 7 th Street at I-10 ramps, had the highest combined bicyclist and pedestrian count. At these five locations, average daily volumes of bicyclists and pedestrians were graphed (see Figure 28) to show trends by time of day. Peak times at these locations were 7:00 a.m. and 6:00 p.m. Long-Term Tube Count Summary Table 15 summarizes long-term tube counts conducted at five locations from October 13, 2017, to January 31, 2018, using MAG tube counters. The site with the highest level of activity was Site 127 (Arizona Canal Trail south of Glendale Avenue) in Phoenix. An average of 204 bicyclists per day was recorded. Appendix F presents detailed results for each data collection site. ADOT Bicyclist and Pedestrian Count Strategy Plan 65
69 Table 13 Intersection Video Data Collection Summary Site ID Jurisdiction Route Location Total Intersection Cyclists Total Intersection Pedestrians 1 Phoenix I-17 SB Ramps At W Bethany Home Rd Tucson SR 77 At W River Rd Tucson SR 77 At W Ina Rd Phoenix N 67th Ave At I-10 WB Ramps Phoenix N Dysart Rd At I-10 EB/WB Ramps Flagstaff S Milton Rd At I-40B/Historic Rte Flagstaff US-180 At W Birch Ave Phoenix I-17 NB/SB Ramps At W. Glendale Ave Phoenix I-17 NB/SB Ramps At W Indian School Rd Phoenix I-17 NB/SB Ramps At W Thomas Rd Phoenix Tempe SR-51 Ramps (East/West) I-10 WB/EB Ramps At E Indian School Rd At W Baseline Rd Sierra Vista SR 92 At E Golden Acres Dr Tucson S Mission Rd At W Ajo Way Pima County SR 77 At W Orange Grove Rd Flagstaff S Milton Rd At W University Dr Mesa S Hawes Rd At E Main St Glendale N 55th Ave At W Maryland Access Ave Peoria N 83rd Ave At US Tucson I-10 WB/EB Ramps At W St Mary s Rd Mesa N Crismon Rd At E Main St Sierra Vista SR 90 At E Fry Blvd Sedona Rodeo Rd At SR 89A Prescott SR 89 At Aspen Way Flagstaff US-180 At W Forest Ave ADOT Bicyclist and Pedestrian Count Strategy Plan 66
70 Site Id Jurisdiction Route Location Facility Type 73 Tucson Park Ave Table 14 Video Counts at Road Segment Locations At Aviation Bikeway Shared-Use Path 132 Sedona SR 179 At MP Village of Oak Creek SR Phoenix N 7th St 23 Phoenix N 24th St N of Bell Rock Blvd At I-10 Ramps At SR-202 Ramps Shared-Use Path Shared-Use Path Bike lane and Shared- Use Path Direction of Travel Average Daily Bicycle Volume Average Daily Pedestrian Volume NB/WB SB/EB Total NB/WB SB/EB Total EB/WB NB/SB NB/SB No facility NB/SB No facility NB/SB ADOT Bicyclist and Pedestrian Count Strategy Plan 67
71 48 Hour Video Count Summary for Road Segments Average Daily Volume :00 AM 1:00 AM 2:00 AM 3:00 AM 4:00 AM 5:00 AM 6:00 AM 7:00 AM 8:00 AM 9:00 AM 10:00 AM 11:0012:00 AM PM 1:00 PM 2:00 PM Time of Day 3:00 PM 4:00 PM 5:00 PM 6:00 PM 7:00 PM 8:00 PM 9:00 PM 10:0011:00 PM PM Average Daily Pedestrians Average Daily Bikes Figure 28 Sum of Average Daily Bicycle and Pedestrian Volume by Time of Day for Sites 73, 132, 133, 22, and 23 ADOT Bicyclist and Pedestrian Count Strategy Plan 68
72 Count ID Table 15 Long-Term Tube Count Locations Jurisdiction Installation Instructions Dates Recorded Tube # Traffic Direction Weekday Average Weekend Average 124 Mesa Adobe St, west of 80th St 10/12/17-01/31/18 Tube 03 EB Mesa Adobe St, west of 80th St 10/12/17-01/31/18 Tube 11 WB Daily Average 125 Tempe North College Ave, north of Curry Rd 125 Tempe North College Ave, north of Curry Rd 127 Phoenix Arizona Canal Trail, south of Glendale Ave 128 Phoenix Arizona Canal Trail, west of 25th Ave 129 Glendale Arizona Canal Trail, near 59th Ave 10/12/17-01/31/18 Tube 08 NB /12/17-01/31/18 Tube 09 SB /12/17-01/23/18 Tube 01 NW/SE /12/17-12/17/17 Tube 14 E/W /12/17-01/23/18 Tube 04 NW/SE ADOT Bicyclist and Pedestrian Count Strategy Plan 69
73 5. NEXT STEPS AND IMPLEMENTATION PLAN A statewide monitoring program on the Arizona SHS for pedestrians and bicyclists includes numerous activities and elements. For the purposes of simplification, these program activities are grouped into three general areas and discussed in the following sections: Systematic, computerized count data storage, analytics, and reporting system Modest number of permanent, continuous count data collection sites A larger number of short-duration counts from portable counters that provide greater geographic coverage than the continuous count sites The recommended approach for implementing a statewide pedestrian and bicyclist monitoring program will, by necessity, require a cooperative and collaborative approach among several units of ADOT, as well as with cities, counties, and metropolitan planning organizations (MPOs)/Councils of Governments (COGs) The following sections describe various program elements that are most suitable for interdepartment and inter-agency cooperation. Count Data Storage, Analytics, and Reporting System A pedestrian and bicyclist count database provides the foundation for many functions within a monitoring program, including: Permanently storing raw and processed count data, as well as corresponding location metadata Providing an audit trail of the data review process, including flagged, suspect or invalid data Providing seasonal adjustment capability for short-duration counts Providing reports of summary count statistics, including daily, monthly, and annual values Providing flexibility to analyze and visualize count data in non-standard reports Providing ability to schedule short-duration counts and then track progress against a schedule Providing better coordination between ADOT and local agencies/mpos across the state All traffic counters provide digital files of traffic counts, but some counts may be manually collected or reduced (i.e. video counts). However, more is required than simply a collection of traffic counter files, count summaries or spreadsheets. A statewide monitoring program will require the systematic storage of count data in a database that offers simultaneous multi-user access and version control. These functions are typically provided in a relational database environment with a user-friendly front-end interface. In statewide motorized traffic monitoring programs, two basic approaches are used by state DOTs: license a commercially available database system from private providers, or develop and maintain a custom database system with state DOT staff. The approach chosen often depends on database development and maintenance expertise of DOT staff, and how customized the database system requirements are. The database would be available for access and data entry by authorized users throughout the state, creating an overall repository for pedestrian and bicycle counts from jurisdictions statewide. The Arizona DOT has taken the first approach for motorized traffic data and currently uses a Traffic Data Management System (TDMS, available at developed by and licensed from MS2. In addition, all MPOs and COGs use the MS2 TDMS as their motorized traffic database platform: for Phoenix, for Tucson, ADOT Bicyclist and Pedestrian Count Strategy Plan 70
74 for Flagstaff, for Central Yavapai for Lake Havasu for Sierra Vista, for Sun Corridor for Yuma CAG for NACOG for SEAGO for WACOG MS2 also offers a Non-Motorized Data System (NMDS) that performs similar data storage, analytics, and reporting functions as provided on the TMDS. It is recommended that ADOT conduct a pilot test of the MS2 NMDS for the purposes of providing a statewide clearinghouse for pedestrian and bicyclist count data. In fact, MS2 has already established a demonstration of their analytics platform for ADOT ( This approach is recommended because the MS2 system is already being used for motorized traffic counts, and ADOT staff in the Multimodal Planning Division are familiar with the MS2 database system and could assist with implementation and ongoing maintenance and operation. However, ADOT should consider implementation of the MS2 count data analytics platform as a means to an end, and not necessarily the end goal. Implementation of a pedestrian and bicyclist count data system within the MS2 platform will help institutionalize pedestrian and bicyclist data within ADOT, making it easier for other agencies to use the count data in their analyses and applications. This process will also encourage other agencies across the state to follow, enabling other agencies to provide data that can also be used to help assess the SHS. Costs for MS2 Non-Motorized Module Costs for the MS2 non-motorized module vary depending on the number of login users. Based on preliminary information provided by MS2, an estimate of 2018 costs for the non-motorized module is provided in Table 16. Table Cost Estimates for MS2 Non-Motorized Module Cost Estimate for Up to 5 Users Cost Estimate for an Unlimited Number of Users System License $60,000 System License $150,000 Annual Support (First Year) $12,000 Annual Support (First Year) $30,000 System Configuration and Data $12,720 System Configuration and Data $12,720 Migration Migration Total Cost $84,720 Total Cost $192,720 Source: MS2, 2018 Permanent Continuous Count Sites The FHWA TMG recommends a modest number of permanent, continuously-operating count data collection sites for pedestrians and bicyclists. These continuous count sites provide data on seasonal and day-of-week trends, which can then be used to seasonally adjust short-duration counts in the same region. These continuous count sites also provide a more precise measurement of changes in travel ADOT Bicyclist and Pedestrian Count Strategy Plan 71

75 volumes and patterns over longer periods of time, such as throughout an entire year or over several years. The FHWA TMG indicates that the number of continuous count locations will likely be based on what is feasible within existing traffic monitoring budgets. The FHWA TMG suggests that about three to five continuous count sites be installed for each distinct seasonal adjustment factor group, wherein a factor group is composed of locations that have similar seasonal, day-of-week, and time-of-day traffic patterns. Development of seasonal factor groups is an inexact science, but early implementers of pedestrian and bicyclist monitoring programs are using three seasonal adjustment factor groups (Figure 29 and Figure 30): 1. Primarily commuting/utilitarian travel a. Traffic volumes are consistent across all seasons b. Traffic volumes peak at typical morning and evening commuting times on weekdays c. Much lower traffic volumes during weekend days. 2. Primarily recreational travel a. Traffic volumes peak considerably during months with ideal weather b. Traffic volumes peak around noon (before/after work commutes) c. Much higher during weekend days (especially mid-day) 3. Mix of commuting and recreational travel a. Traffic volumes peak slightly during months with ideal weather b. Traffic volumes have commute peak and prolonged afternoon/evening peak c. Traffic volumes fairly consistent across all weekday and weekend days Figure 29 Typical Weekday Variation for Three Common Seasonal Factor Groups (Source: Johnstone, D. K. Nordback, M. Lowry. Collecting Network-Wide Bicycle and Pedestrian Data: A Guidebook for When and Where to Count, September 2017.) ADOT Bicyclist and Pedestrian Count Strategy Plan 72

76 Figure 30 Typical Time-of-Day Variation for Three Common Seasonal Factor Groups (Source: Johnstone, D. K. Nordback, M. Lowry. Collecting Network-Wide Bicycle and Pedestrian Data: A Guidebook for When and Where to Count, September 2017.) Some of the priority locations for pedestrian/bicycle permanent count stations should include portions of USBR 90 and locations identified using existing Strava data showing high non-motorized activity. Pedestrian/bicycle bridges over freeways or canals are also good candidates for consideration of the application of permanent pedestrian and bicycle count stations. Regional and district offices and local agencies should be consulted for potential application of permanent count sites, with a focus on the metropolitan areas where higher numbers of bicycle and pedestrian activity and crashes are occurring. Some of the sites where data were collected as part of the current study may be candidates for permanent count sites, considering that the methodology for selecting this study s count locations would be similar to the methodology for selecting permanent count sites. However, ADOT may want to limit permanent count sites to locations with the following characteristics: Sites on the Arizona SHS. Sites with dedicated on-road space for cyclists (such as a marked bike lane or paved shoulder) to permit automated count equipment to operate more effectively. Sites with at least a modest bicycle volume (considered as 15 cyclists per day for the purpose of this review). The following count locations used in this study were identified as meeting the above criteria and hence are possible candidates for permanent count sites: Site 19, SR 101 Frontage Road/Sun Circle Trail Crossing, Chandler Site 140, SR 87 north of Shea Boulevard, Fountain Hills Site 21, SR 87 at McKellips Road, Mesa Site 6, Dysart Road at I-10, Phoenix area Site 46, SR 86 at Mission Way, Tucson Sites 47, 2, 3, and 136 are all viable locations to collect data on SR 77 in the Tucson area Site 8, I-40B (SR 89A) north of Milton Road, Flagstaff Site 139, US 180 at Forest Avenue, Flagstaff Site 138, SR 89 at Cherry Street, Prescott ADOT Bicyclist and Pedestrian Count Strategy Plan 73
77 Site 106, SR 89A at Rodeo Road, Sedona Site 132, SR 179 at MP 311, Sedona Other potential sites might be a location on US Bicycle Route 90, such as SR 74 or US 60 near Apache Junction. Further review should be undertaken prior to selecting permanent count site locations. A key consideration is who will maintain the count equipment over time. Currently the Traffic Monitoring Manager in the Transportation Analysis Group is responsible for maintaining existing traffic count equipment, and is a starting point for discussions on maintenance. Several cooperation/coordination strategies can expedite the implementation of continuous count sites for pedestrians and bicyclists: ADOT develops standard construction specifications for permanent pedestrian and bicyclist counters. Once developed, the standard specifications can more easily be added to upcoming pavement preservation or construction projects. In these situations, the counter installation is a very small percentage of the overall construction or maintenance cost and more likely to be installed than as a standalone project. ADOT pays the capital costs for installation of permanent pedestrian and bicyclist counters and local agencies pay the operating and maintenance costs for permanent counters within their jurisdictions. An interagency agreement can be used to formalize the terms of this cooperation. ADOT could require funding recipients (such as cities or local agencies) for certain funding categories (such as Transportation Alternatives (TA) to install permanent counters for major projects that provide pedestrian and/or bicycle facilities. This requirement would be less burdensome if standard construction specifications were available to funding recipients. ADOT can install permanent pedestrian and bicycle counters at or near existing permanent motorized vehicle monitoring stations, thereby saving on the capital cost of installing power and communications. ADOT can assess the feasibility of collecting pedestrian and bike counts from existing infrastructure (such as traffic signal detection systems). ADOT can request that MPOs or local agencies share data collected at any permanent counters installed by these MPOs or local agencies. Short-Duration Counts Collected Using Portable Equipment The FHWA TMG recommends a larger number of short-duration counts from portable counter equipment. These short-duration counts: provide the geographic coverage to understand traffic characteristics on individual roads, streets, shared use paths, and pedestrian facilities, as well as on specific segments of those facilities. They provide site-specific data on the time of day variation, can provide data on [day of week] variation in nonmotorized travel, but are mostly intended to provide current general traffic volume information throughout the larger monitored network. However, short duration counts cannot be directly used to provide many of the required data items desired by users. Statistics such as annual average traffic cannot be accurately measured during a short duration count. Instead, data collected during short duration counts are factored or adjusted to create these annual average estimates. (FHWA TMG, page 4-24) Nearly all the pedestrian and bicyclist counts gathered in Arizona by MPOs and local agencies are shortduration counts. However, some agencies, such as the City of Mesa, have implemented permanent count stations on shared-use paths along canals. The FHWA TMG recommends that short-duration counts from ADOT Bicyclist and Pedestrian Count Strategy Plan 74
78 automated counters be a minimum of 7 days, whereas manual counts have a preferred duration of 12 hours on a single day. The TMG discusses numerous other considerations for short-duration counts, but it does not include any specific recommendations for exact number of short-duration count sites. The baseline counts conducted as a part of the current project should serve as a model for future counts in duration and type. Intersection or interchange counts should include pedestrians and bicyclists, by direction and minimally by hour, and should typically be conducted for a duration of 48 hours. Given current technology, this is best done using video equipment. Bicycle-only corridor counts, including those along shared-use paths and streets, can be collected using tubes, and they should ideally be conducted for an entire week (7-days). Count equipment specifically designed to count bicyclists should be used. Several cooperation/coordination strategies can expedite the implementation of short-duration counts for pedestrians and bicyclists both on and off the SHS: ADOT pays the capital costs for purchase of portable pedestrian and bicyclist counters, and loans these portable counters to MPOs and local agencies in Arizona. MAG currently operates a counter loan program for MAG-member local agencies. ADOT requires that data collection contractors include pedestrian and bicyclist counts in existing motorized short-duration counts at selected locations. Short-term pedestrian and bicycle counts can be required as a part of new projects and studies such as RSAs. TA projects can require that agencies conduct before and long-term after counts (one year and three years after completion of the project) to assess the effectiveness of a project to provide pedestrian and/or bicycle facilities or enhancements. ADOT can request that MPOs/COGs or local agencies share short-duration data collected at any portable counters installed by these MPOs/COGs or local agencies. ADOT hosts periodic coordination meetings with key data stakeholders to discuss existing and planned data collection activities and various coordination and collaboration opportunities, including topics like best practices and lessons learned. These meetings can be a part of annual professional conferences, such as Roads and Streets in Tucson or the ITE/IMSA Spring Conference in the Phoenix area. Costs for Bicycle and Pedestrian Data Collection Plan A summary table of costs for an annual bicyclist and pedestrian data collection plan is provided in Table 17. Costs are based on 2017/2018 cost estimates. ADOT Bicyclist and Pedestrian Count Strategy Plan 75
79 Table 17 Estimated Costs for Bicycle and Pedestrian Data Collection Annual Estimated Bicycle and Pedestrian Data Collection Plan Number of Sites Count Locations Schedule MS2 Transportation Management System Estimated costs for initial year hour video counts 15 automated permanent count stations 32 manual 48- hour video counts (Priority 1A and 1B sites, see Table 17A) 15 automated permanent count stations (See Table 17B) October/November Bi-Annual March/April Bi-Annual Assume cost estimate for unlimited number of users. Cost includes Enterprise license, annual support (first year), system configuration and data migration, training webinars (free) Video counts $36,000 Installation of automated $97,500 permanent counters, assume 15 locations and combined bicycle and pedestrian count system (EcoMulti system). Cost / site does not include installation, but does include a $420/year modem fee). Assume cost of system is approximately $6,500 in initial year MS2 Transportation $192,720 Management System (assumes costs for System License - $150,000, Annual Support - $30,000, and system configuration and data migration $12,720 Total $326,220 Note: Costs estimated based on 2017 / 2018 costs ADOT Bicyclist and Pedestrian Count Strategy Plan 76
80 Table 17A 48 Hour Video Count Locations Id Area Location Priority 1 A Sites (excluding those recommended as permanent count sites) 63 Glendale US 60/55th Avenue 129 Glendale Arizona Canal Trail, near 59th Avenue (on US Bicycle Route 90) 56 Mesa US 60X (Apache Trail)/Hawes Street 80 Mesa Apache Boulevard at SR Mesa SR 60X (Apache Trail)/Crismon Road 130 Peoria Deer Valley Road, west of 95th Avenue (on US Bicycle Route 90) 65 Peoria US 60/83rd Avenue 1 Phoenix Bethany Home Road/I-17 Ramp crossings 5 Phoenix 67th Avenue/I-10 Ramp crossings 11 Phoenix Glendale Avenue/I-17 Ramp crossings 12 Phoenix Indian School Road/I-17 Ramp crossings 13 Phoenix Thomas Road/I-17 Ramp crossings 16 Phoenix Indian School Road/SR 51 Ramp crossings 22 Phoenix 7th St/I-10 Ramp crossings 23 Phoenix 24th St/SR 202 Ramp crossings 126 Phoenix Campbell Avenue, east of 26th Street (on US Bicycle Route 90) Arizona Canal Trail, south of Glendale Avenue (on US Bicycle Route 127 Phoenix 90) 128 Phoenix Arizona Canal Trail, west of 25th Avenue (on US Bicycle Route 90) 18 Tempe Baseline Road/I-10 Ramp crossings 73 Tucson SR 210 multiuse path/park Avenue 83 Tucson I-10/St. Mary s Road 122 Tucson Julian Wash Greenway Path, at Littletown Rd (on US Bicycle Route 90) 123 Tucson Santa Cruz River Park Path, north of Speedway Blvd (on US Bicycle Route 90) Priority 1B Sites (excluding those recommended as permanent count sites 9 Flagstaff US 180/Birch Avenue 43 Sierra Vista SR 92/Golden Acres Dr 95 Sierra Vista SR 90/92/Fry Blvd intersection 133 Village of Oak Creek SR 179 at MP Cottonwood SR 89 A south of Bill Gray Road (approximately MP 358) 144 Sedona (Yavapai County) SR 89 A north of Page Springs Road (MP 363) 145 Verde Valley SR 179, north of Beaverhead Flat Rd (approximately MP 305) ADOT Bicyclist and Pedestrian Count Strategy Plan 77
81 Table 17B Permanent Count Sites Id Area Location 19 Chandler SR 101 Frontage Road/Sun Circle Trail Crossing 140 Fountain Hills SR 87 north of Shea Boulevard 21 Mesa SR 87 at McKellips Road 6 Phoenix Dysart Rd at I Tucson SR 86 at Mission Road 49 Flagstaff SR 89A at University Dr 2 Tucson SR 77 at River Road 3 Tucson SR 77 at Ina Road 124 Mesa Adobe Street, west of 80th Street (on US Bicycle Route 90) 8 Flagstaff I-40B (SR 89A), north of Milton Road, Flagstaff 139 Flagstaff US 180 at Forest Avenue 138 Prescott SR 89A at Cherry Street 106 Sedona SR 89A at Rodeo Rd 132 Sedona SR 179 at MP Tempe North College Avenue, north of Curry Road (on US Bicycle Route 90) ADOT Bicyclist and Pedestrian Count Strategy Plan 78
82 Additional Guidance This chapter provided a brief overview of possible implementation strategies. Table 18 lists several other guidance documents that provide extensive detail to support the recommended implementation strategies. Table 18 Detailed Guidance Documents for Pedestrian and Bicyclist Monitoring Guidance Document or Report FHWA 2016 Traffic Monitoring Guide, Chapter 4, Traffic Monitoring for Non-Motorized Traffic Report FHWA-HEP , Coding Nonmotorized Station Location Information in the 2016 TMG Format, 2016 Report FHWA-HEP , FHWA Bicycle-Pedestrian Count Technology Pilot Project - Summary Report, 2016 NCHRP Report 797, Guidebook on Pedestrian and Bicycle Volume Data Collection, 2014 NCHRP Web-Only Document 229, Methods and Technologies for Pedestrian and Bicycle Data Collection: Phase 2, 2016 Report FHWA-HPL , Exploring Pedestrian Counting Procedures: A Review and Compilation of Existing Procedures, Good Practices, and Recommendations, May 2016 Innovation in Bicycle and Pedestrian Counts: A Review of Emerging Technology, Alta Planning + Design, 2016 Useful Resources or Application Automatic counter technology and equipment Systematic monitoring using combination of permanent and short-duration count sites Non-motorized traffic patterns Standardized non-motorized traffic data format Extensive guidance and interpretation on the standardized non-motorized traffic data format and attributes in the TMG Relevant for submitting non-motorized count data to FHWA s Travel Monitoring Analysis System Automatic counter technology and equipment Identifying suitable count locations Practical lessons learned in collecting and using count data Systematic monitoring of counts Automatic counter technology and equipment, calibration and validation, and technology evaluation Extensive and most up-to-date evaluation of automatic counter technology Automatic counter technology and equipment Automatic counter validation and calibration Recommended count practices for various facility types Data management procedures (quality assurance, metadata, data analysis) Automatic counter technology and equipment Innovative and emerging technology for non-motorized counts ADOT Bicyclist and Pedestrian Count Strategy Plan 79
83 APPENDIX A EXAMPLES OF CRITERIA FOR SELECTING BICYCLE AND PEDESTRIAN COUNT SITES ADOT Bicyclist and Pedestrian Count Strategy Plan 80
84 Table A-1: Potential Criteria for Selecting Count Locations from Selected Studies Source FHWA Traffic Monitoring Guide; referenced National Bicycle and Pedestrian Documentation (NBPD) Project criteria for short-duration counts NCHRP Guidebook on Pedestrian and Bicycle Volume Data Collection (2014) MAG Bicycles Count: Final Report and Implementation Plan (June 2014) New Hampshire Bicycle and Pedestrian Transportation Advisory Committee Counting Program Master Plan (April 2015) Criteria Pedestrian and bicycle activity areas or corridors (downtowns, near schools, parks, etc.) Representative locations in urban, suburban, and rural locations Key corridors that can be used to gauge the impacts of future improvements Locations where counts have been conducted historically Locations where ongoing counts are being conducted by other agencies through a variety of means, including videotaping Gaps, pinch points, and locations that are operationally difficult for bicyclists and pedestrians (potential improvement areas) Locations where either bicyclist and/or pedestrian collision numbers are high Select locations that meet as many of the criteria as possible Random locations: Sites are selected randomly. This approach may not capture strategic locations or select sites appropriate for automated counting. Selecting randomly from within categories of desired characteristics (stratified random sampling) is an alternative. Representative locations: This approach balances available resources with spatial coverage. Identified sites, in aggregate, are representative of the community as a whole. Targeted locations: Sites are selected on the basis of being associated with particular projects, facility types, or locations with particular characteristics (e.g., safety concerns). Control locations: This approach compares sites affected by a project with unaltered sites (control locations) to determine how much of the observed change in demand can be attributed to the project. Presence of an existing bicycle facility Achievement of a representative sample of locations in relation to population density, employment density, and median household income A distribution of count sites that generally reflects the distribution of population by local jurisdiction Review and input from local agency staff Infrastructure changes or new development before and after counts Data to assist planning a new facility A geographical representation of the neighborhoods in a community The major corridors in the community, including downtowns and/or main streets For longer duration counts, a need for daily traffic profiles to expand on manual counts is identified Location of bicycle paths or other major bicycle or pedestrian infrastructure A range of facility types A range of urban and rural environments with an emphasis on land uses most conductive to non-motorized transportation ADOT Bicyclist and Pedestrian Count Strategy Plan 81
85 Source San Francisco Bay Metropolitan Transportation Commission Southern California Association of Governments, Conducting Bicycle and Pedestrian Counts: A Manual for Jurisdictions in Los Angeles County and Beyond (2013) Criteria High bicycle collision rates On the local or regional bicycle network (existing or proposed) Proximity to major transit facilities Proximity to schools and colleges/universities Proximity to local or regional attractions/destinations Destinations that attract bicyclists and pedestrians Public facilities for non-motorized travel Specific locations where there is a history of non-motorized counts, collisions involving pedestrians or bicyclists, or planned facilities for non-motorized travel Locations where new bicycle and pedestrian facilities are planned ADOT Bicyclist and Pedestrian Count Strategy Plan 82
86 APPENDIX B MAPS OF BICYCLE AND PEDESTRIAN COUNT SITES ADOT Bicyclist and Pedestrian Count Strategy Plan 83


87 Figure B-1: Sierra Vista, Douglas, and Cochise County Bicycle and Pedestrian Count Locations ADOT Bicyclist and Pedestrian Count Strategy Plan 84


88 Figure B-2: Tucson, Oro Valley and Pima County Bicycle and Pedestrian Count Locations ADOT Bicyclist and Pedestrian Count Strategy Plan 85


89 Figure B-3: Tohono O odham Reservation Bicycle and Pedestrian Count Locations ADOT Bicyclist and Pedestrian Count Strategy Plan 86


90 Figure B-4: Yuma and San Luis Bicycle and Pedestrian Count Locations ADOT Bicyclist and Pedestrian Count Strategy Plan 87


91 Figure B-5: Safford Bicycle and Pedestrian Count Locations ADOT Bicyclist and Pedestrian Count Strategy Plan 88


92 Figure B-6: Casa Grande, Coolidge, Maricopa and Gila River Indian Community Bicycle and Pedestrian Count Locations ADOT Bicyclist and Pedestrian Count Strategy Plan 89


93 Figure B-7: San Carlos Indian Reservation Bicycle and Pedestrian Count Locations ADOT Bicyclist and Pedestrian Count Strategy Plan 90


94 Figure B-8: Phoenix, Glendale, Mesa, Tempe, Chandler, Surprise, and Maricopa County Bicycle and Pedestrian Count Locations ADOT Bicyclist and Pedestrian Count Strategy Plan 91


95 Figure B-9: Whiteriver and White Mountain Apache Indian Reservation Bicycle and Pedestrian Count Locations ADOT Bicyclist and Pedestrian Count Strategy Plan 92


96 Figure B-10: Wickenburg Bicycle and Pedestrian Count Locations ADOT Bicyclist and Pedestrian Count Strategy Plan 93


97 Figure B-11: Payson Bicycle and Pedestrian Count Locations ADOT Bicyclist and Pedestrian Count Strategy Plan 94


98 Figure B-12: Prescott, Prescott Valley, Clarkdale, Cottonwood, Sedona, and Oak Creek Bicycle and Pedestrian Count Locations ADOT Bicyclist and Pedestrian Count Strategy Plan 95


99 Figure B-13: Holbrook Bicycle and Pedestrian Count Locations ADOT Bicyclist and Pedestrian Count Strategy Plan 96


100 Figure B-14: Flagstaff and Coconino County Bicycle and Pedestrian Count Locations ADOT Bicyclist and Pedestrian Count Strategy Plan 97


101 Figure B-15: Lake Havasu City Bicycle and Pedestrian Count Locations ADOT Bicyclist and Pedestrian Count Strategy Plan 98


102 Figure B-16: Bullhead City, Fort Mohave, Kingman, and Mohave County Bicycle and Pedestrian Count Locations ADOT Bicyclist and Pedestrian Count Strategy Plan 99


103 Figure B 17: Navajo and Hopi Reservation Bicycle and Pedestrian Count Locations ADOT Bicyclist and Pedestrian Count Strategy Plan 100
104 APPENDIX C SITES THAT WERE CONSIDERED BUT NOT ADVANCED ADOT Bicyclist and Pedestrian Count Strategy Plan 101
105 Table C-1: Locations Not Advanced for Data Collection Location ID Area Source Location Area Type 10 San Luis 2017 PSAP US 95/B Street Urban- Suburban 15 Mesa BSAP SR 87/SR 202 Urban- Suburban 50 Flagstaff PSAP SR 40B (Milton Road/Route 66), Route 66 to Elden Street 66 Sun City PSAP - HRS 76 Tucson PSAP - HRS 77 Tucson PSAP - HRS US 60, MP MP SR 77, MP MP 75.4 (Roller Coaster to Suffolk) SR 77, MP MP 79.1 (Roller Coaster to Ina Road) Urban- Suburban Urban- Suburban Urban- Suburban Urban- Suburban Specific Location for Count US 95/B Street SR 87/SR 202 SR 40B/Humphrey Street US 60 /113 th Avenue SR 77/ Las Lomitas Road SR 77/ Genematas Pedestrian and Bicycle Activity Areas or Corridors (downtowns, near schools, parks, etc.) Various commercial, San Luis II Arizona- Mexico border crossing Commercial and residential Various commercial, Northern Arizona University Fatal and/or Injury Crash History? Permanent Count Station? Programmed Improvements? Type of Count (pedestrian, bicycle, or both) Reason for Not Advancing Yes No No Pedestrian Site no longer on the State Highway System Yes No No Bicycle Near location #21 Yes No No Both Near location #9 Residential Yes No No Pedestrian Near location #68 Commercial Yes N/A SR 77, Las Lomitas to Ina Road, Design and Construct Street Lighting, FY 2018 and 2020 Commercial Yes On SR 77, north of Ina Road (#100800) SR 77, I-10 to Genematas Drive, Pavement Rehabilitation, FY 2018 Pedestrian Pedestrian Near location #48 Near location #2 ADOT Bicyclist and Pedestrian Count Strategy Plan 102
106 Location ID 78 Apache Junction/Mesa Area Source Location Area Type PSAP - HRS US 60X, MP MP (Sossaman to Meridian) 79 Flagstaff BSAP SR 89A (Milton Road), I-17 to SR 40B 82 Oro Valley BSAP SR 77, Mountain Vista Drive to Ina Road 89 Peoria and Glendale 100 Flagstaff 2009 PSAP BSAP US 60, Northern Avenue to Bethany Home Road US 180, SR 40B (MP 215.4) to Birch Avenue (MP 216.1) Urban- Suburban Urban- Suburban Urban- Suburban Urban- Suburban Urban- Suburban Specific Location for Count At US 60X/Hawes Road or US 60 X/Merrill Road SR 89A (Milton Road) at University Avenue SR 77, north of Ina Road US 60 /59 th Avenue Pedestrian and Bicycle Activity Areas or Corridors (downtowns, near schools, parks, etc.) Various commercial, residential, schools Fatal and/or Injury Crash History? Permanent Count Station? Programmed Improvements? Type of Count (pedestrian, bicycle, or both) Reason for Not Advancing Yes No No Pedestrian Duplicate of location #56 Commercial Yes No No Both Near location #9 Various commercial Various commercial Yes On SR 77, north of Ina Road (# ) No Bicycle Near location # 3 (SR 77/ Ina Road) Yes No No Bicycle Duplicate of location #64 US 180/SR 40 B Commercial Yes No US 180, SR 40 B to Aspen Avenue, Construct turn lane, FY 2019 Pedestrian Near location #9 ADOT Bicyclist and Pedestrian Count Strategy Plan 103
107 APPENDIX D COMPARISON OF POPULATION DISTRIBUTION AND COUNT LOCATIONS ADOT Bicyclist and Pedestrian Count Strategy Plan 104
108 Table D-1: Comparison of Population Distribution and Count Locations Location 2016 Population Estimate Percent of Total State Population Number of Count Locations Proposed Percent of Total Count Locations Location 2016 Population Estimate Percent Number of Count Locations Proposed Percent of Total Count Locations Location 2016 Population Estimate Percent Number of Count Locations Proposed Percent of Total Count Locations APACHE 72, % 2 1.5% MARICOPA 4,137, % % PIMA COUNTY 1,013, % % COUNTY COUNTY Eagar 4, % 0 0.0% Apache % 0 0.0% Marana * 43, % 0 0.0% Junction * Saint Johns 3, % 0 0.0% Avondale 80, % 0 0.0% Oro Valley 43, % 1 0.8% Springerville 1, % 0 0.0% Buckeye 65, % 0 0.0% Sahuarita 28, % 0 0.0% Unincorporated 61, % 2 1.5% Carefree 3, % 0 0.0% South Tucson 5, % 0 0.0% Cave Creek 5, % 0 0.0% Tucson 529, % % COCHISE 128, % 9 6.9% Chandler 250, % 2 1.5% Unincorporated 361, % 5 3.8% COUNTY Benson 4, % 0 0.0% El Mirage 33, % 0 0.0% Bisbee 5, % 0 0.0% Fountain Hills 23, % 1 0.8% PINAL COUNTY 413, % 8 6.1% Douglas 16, % 1 0.8% Gila Bend 1, % 0 0.0% Apache 38, % 0 0.0% Junction * Huachuca City 1, % 0 0.0% Gilbert 239, % 1 0.8% Casa Grande 53, % 2 1.5% Sierra Vista 43, % 8 6.1% Glendale 237, % 4 3.0% Coolidge 12, % 1 0.8% Tombstone 1, % 0 0.0% Goodyear 78, % 0 0.0% Eloy 17, % 0 0.0% Willcox 3, % 0 0.0% Guadalupe 6, % 0 0.0% Florence 25, % 0 0.0% Unincorporated 50, % 0 0.0% Litchfield Park 6, % 0 0.0% Hayden * 0 0.0% 0 0.0% Mesa 467, % 5 3.8% Kearny 2, % 0 0.0% COCONINO 142, % 9 6.9% Paradise Valley 13, % 0 0.0% Mammoth 1, % 0 0.0% COUNTY Flagstaff 71, % 6 4.6% Peoria * 166, % 2 1.5% Marana * 0 0.0% 0 0.0% Fredonia 1, % 0 0.0% Phoenix 1,560, % % Maricopa 47, % 2 1.5% Page 7, % 0 0.0% Queen Creek * 35, % 0 0.0% Queen Creek * % 0 0.0% Sedona * 2, % 1 0.8% Scottsdale 237, % 0 0.0% Superior 2, % 0 0.0% Tusayan % 0 0.0% Surprise 128, % 2 1.5% Winkelman * 0 0.0% 0 0.0% Williams 3, % 0 0.0% Tempe 176, % 6 5.3% Unincorporated 210, % 3 2.3% ADOT Bicyclist and Pedestrian Count Strategy Plan 105
109 Location 2016 Population Estimate Percent of Total State Population Number of Count Locations Proposed Percent of Total Count Locations Location 2016 Population Estimate Percent Number of Count Locations Proposed Percent of Total Count Locations Location 2016 Population Estimate Percent Number of Count Locations Proposed Percent of Total Count Locations Unincorporated 55, % 2 1.5% Tolleson 6, % 0 0.0% SANTA CRUZ 50, % 0 0.0% COUNTY Wickenburg * 6, % 0 0.0% Nogales 21, % 0 0.0% GILA COUNTY 54, % 2 1.5% Youngtown 6, % 0 0.0% Patagonia % 0 0.0% Globe 7, % 0 0.0% Unincorporated 297, % 1 0.8% Unincorporated 27, % 0 0.0% Hayden * % 0 0.0% Miami 1, % 1 0.8% MOHAVE 205, % % YAVAPAI 220, % % COUNTY COUNTY Payson 15, % 1 0.8% Bullhead City 39, % 6 4.5% Camp Verde 10, % 0 0.0% Star Valley 2, % 0 0.0% Colorado City 4, % 0 0.0% Chino Valley 10, % 0 0.0% Winkelman * % 0 0.0% Kingman 29, % 1 0.8% Clarkdale 4, % 1 0.8% Unincorporated 26, % 0 0.0% Lake Havasu 53, % 1 0.8% Cottonwood 11, % 1 0.8% City Unincorporated 78, % 5 3.8% Dewey- 3, % 0 0.0% Humboldt GRAHAM 38, % 2 1.5% Jerome % 0 0.0% COUNTY Pima 2, % 0 0.0% NAVAJO 110, % 8 6.1% Peoria * 7 0.0% 0 0.0% COUNTY Safford 9, % 1 0.8% Holbrook 5, % 1 0.8% Prescott 41, % 1 0.8% Thatcher 5, % 0 0.0% Pinetop- 4, % 0 0.0% Prescott Valley 42, % 1 0.8% Lakeside Unincorporated 21, % 1 0.8% Show Low 11, % 0 0.0% Sedona * 7, % 4 3.0% Snowflake 5, % 0 0.0% Wickenburg * % 1 0.8% GREENLEE 10, % 0 0.0% Taylor 4, % 0 0.0% Unincorporated 86, % 3 2.3% COUNTY Clifton 4, % 0 0.0% Winslow 9, % 0 0.0% Duncan % 0 0.0% Unincorporated 69, % 7 5.3% YUMA COUNTY 217, % 1 0.8% Unincorporated 5, % 0 0.0% San Luis 34, % 0 0.0% Somerton 15, % 0 0.0% LA PAZ 21, % 0 0.0% Wellton 3, % 0 0.0% COUNTY Parker 3, % 0 0.0% Yuma 100, % 1 0.8% ADOT Bicyclist and Pedestrian Count Strategy Plan 106
110 Location 2016 Population Estimate Percent of Total State Population Number of Count Locations Proposed Percent of Total Count Locations Location 2016 Population Estimate Percent Number of Count Locations Proposed Percent of Total Count Locations Location 2016 Population Estimate Percent Number of Count Locations Proposed Percent of Total Count Locations Quartzsite 3, % 0 0.0% Unincorporated 64, % 0 0.0% Unincorporated 14, % 0 0.0% *Location within two counties ARIZONA 6,835, % % Source: Arizona Office of Economic Opportunity, July 1, 2016 Population Estimates for Arizona s Counties, Incorporated Places and Unincorporated Balance of Counties, accessed 7/25/2017. ADOT Bicyclist and Pedestrian Count Strategy Plan 107
111 APPENDIX E USE OF TRAFFIC SIGNAL TECHNOLOGY TO COUNT BICYCLES AND PEDESTRIANS ADOT Bicyclist and Pedestrian Count Strategy Plan 108
112 Some agencies use traffic signal equipment to count cars 1. Usually, vehicles are counted using loop detectors (or other detection technology) already present at traffic signals for the purposes of actuation. This technology is well established for counting motor vehicles, but only in recent years is it being explored to count pedestrians and bicycles at signals. Portland, Oregon is a leader in this area and has been using traffic signal equipment to count bicyclists since at least Portland s extensive network of bicycle accommodations includes many miles of onstreet bike lanes, and when a bike lane approaches a traffic signal, an advance loop detector in the bike lane can count approaching cyclists. The methodology has the following characteristics: 2 The presence of a bicycle lane is important because it ensures that only bicycles travel in that lane and are counted by the loop detectors. The presence of advance loop detectors in bicycle lanes ensures that bicycles can be counted while in motion, which typically generate more accurate counts as compared to stop bar counts. The presence of an individual [loop] wire [to the advance loops] allows exclusive bicycle counts from the loop detectors and the availability of communication to the signal controller is necessary to view and retrieve counts. According to NCHRP Report 797, not all traffic signal controllers can process and store bicycle count data, 3 but Portland uses 170 and 2070 signal controllers, equipment that is fully capable of collecting and storing bicycle count data. Portland s loop detector methodology cannot be directly applied to also count pedestrians. However, Portland uses a different methodology to estimate pedestrian volume, which involves logging actuations from pedestrian pushbuttons at traffic signals. (Portland s methodology can also be used to measure pedestrian delay by recording the time between the pushbutton actuation and the service of the corresponding phase. 4 ) To be sure, pushbutton actuations are different than a pedestrian count. Actuations may miss some pedestrians because pushbutton actuation data can capture a maximum of one actuation per signal cycle, regardless of how many pedestrians cross on that cycle. It also will miss pedestrians who choose not to actuate the pushbutton. These limitations mean that signal activation rates can be a reasonable proxy for determining relative rates of pedestrian demand [but] observing these rates is not an effective method for collecting total pedestrian counts. 5 The Oregon Department of Transportation (ODOT) agrees with this assessment: While pedestrian pushbutton activity does not translate directly to pedestrian volumes, the information can still be useful in determining the level of pedestrian activity at an intersection. 6 ODOT investigated the relationship between pedestrian volume and pushbutton actuations and determined that pedestrian actuations could 1 Incorporating Advanced Signal Control Systems into an Archived Data User Service Program, Virginia Transportation Research Council, October 2002, 2 Kothuri, S.M., et al., Preliminary Development of Methods to Automatically Gather Bicycle Counts and Pedestrian Delay at Signalized Intersections. Transportation Research Board 91 st Annual Meeting, January 2012, p. 3, 3 Guidebook on Pedestrian and Bicycle Volume Data Collection. NCHRP Report 797, Transportation Research Board, 2014, p. 84, 4 Kothuri, S.M., et al., p Guidebook on Pedestrian and Bicycle Volume Data Collection, p Figliozzi, Miguel, et al., Design and Implementation of Pedestrian and Bicycle-Specific Data Collection Methods in Oregon. Oregon Department of Transportation, SPR 754, p. 20. ADOT Bicyclist and Pedestrian Count Strategy Plan 109
113 be multiplied by a factor of 1.24 to estimate pedestrian volume. 7 Certainly, such a factor is highly dependent on local conditions and will likely vary considerably in different parts of a roadway network, particularly one that includes urban, suburban, and rural conditions. Signal pushbutton actuations were also used as a proxy for pedestrian volume in a study at Purdue University. In this case, the study did not make a comparison with actual pedestrian volumes, but rather used the actuation data itself used as a dependent variable to evaluate impacts of several independent variables, such as weather, time of day, and signal phasing type. 8 No known agencies are using video detectors to directly count pedestrians at traffic signals using an automated methodology. While video cameras are certainly used to count pedestrians and bicycles, this methodology uses separate equipment than the existing video detectors at signalized intersections. A leading vendor and service provider in this arena is Miovision, which both sells video data collection devices and offers a service to remotely convert video imagery into count data. FHWA published a comprehensive resource in 2016 with detailed information about pedestrian count technologies but did not include traffic signal video detection as a potential methodology. 9 A 2014 NCHRP study offered the following state of the practice on this potential technology: [S]ensor technologies may be used to detect the presence of bicyclists or pedestrians at a traffic signal, so the traffic signal can adjust its timing to serve those users. They can also be used to detect the presence of a pedestrian or bicyclist in an unauthorized area, such as a tunnel. Because these applications focus on whether or not a pedestrian or bicyclist is present, rather than determining the number of people present, these applications are not a substitute for counting. However, at the time of writing, vendors that specialized in presence-detection applications were working on expanding their functionality to include counting applications. 10 One vendor, Econolite, confirmed that it offers technology capable of both detecting vehicles for signal actuation purposes and counting bicyclists and pedestrians. 11 Econolite s product, known as AccuScan, operates using radar rather than video, but the company claims high levels of accuracy in both detection and counting. (Econolite is willing to offer a product demonstration to ADOT upon request.) Econolite continues to refine its video detection equipment to allow for both counting and detection in a single device. The company confirmed that the technology has not yet been perfected but expects to have an improved video-based product on the market in In summary, it is possible to procure permanent signal-based equipment to both detect vehicles and count non-motorized travelers. However, existing video detectors in the field and on the market are not yet able to fulfill this dual role. 7 Ibid., p Day, Christopher M., et al., Rate of Pedestrian Signal Phase Actuation as a Proxy Measurement of Pedestrian Demand. Transportation Research Board Annual Meeting, January 2015, 9 Exploring Pedestrian Counting Procedures: A Review and Compilation of Existing Procedures, Good Practices, and Recommendations, FHWA, FHWA-HPL , May 2016, 10 Guidebook on Pedestrian and Bicycle Volume Data Collection, p Ibid, p. 4. ADOT Bicyclist and Pedestrian Count Strategy Plan 110
114 APPENDIX F DATA ANALYSIS BY SITE This appendix summarizes individual bicyclist and pedestrian data collection sites and data collected in the following geographic areas: Chandler Cottonwood Flagstaff Fountain Hills Glendale Mesa Phoenix Peoria Prescott Sedona, Village of Oak Creek, and Verde Valley Sierra Vista Tempe Tucson and Pima County ADOT Bicyclist and Pedestrian Count Strategy Plan 111
 crossing where")
 Major Facility Type SR 101 L Frontage Road (N. Price Rd and S.")
115 Chandler Northbound SR 101L Frontage Road near in Chandler Data were collected at Site 19, SR 101L Price Road frontage roads, near the Western Canal Path (part of Sun Circle Trail) in Chandler. This site was selected because it was determined that it would be better to place tubes in the unmarked bike lanes on either side of the Western Canal Path (part of Sun Circle Trail) crossing where there was the potential for more bicycle traffic. Sun Circle Trail is a lengthy Shared-Use Path. Site 19, SR 101L Frontage Road/Sun Circle Trail Crossing Location Summary Type of Count Area Type (Urban-Suburban/Rural) Major Facility Type SR 101 L Frontage Road (N. Price Rd and S. Price Rd) Minor Facility Type Posted Speed Limit Pedestrian Facilities Lighting Bus Stop Locations (within ¼ mile) Crosswalks Bicycle Facilities Seven-day tube count Urban-Suburban two-lane frontage road N/A 45 mph Yes Yes No No Striped shoulder ADOT Bicyclist and Pedestrian Count Strategy Plan 112


116 Site Photo N Sun Circle Trail Crossing Note: Pneumatic tube placement shown in red. Data Summary Data were collected from Thursday, November 9, 2017, to Wednesday, November 15, Separate bar charts are provided below for the northbound frontage road and the southbound frontage road. This site generally had a higher number of bicyclists recorded during the weekday period than the weekend period in both directions. Northbound, during the week, there was an average of approximately 17 bicyclists per day. Saturday and Sunday averaged 12 bicyclists per day. The highest number of bicyclists recorded was 19 bicyclists. Southbound, during the week, there was an average of approximately 16 bicyclists per day. Saturday and Sunday averaged 13 bicyclists per day. The highest number of bicyclists recorded was 17 bicyclists. ADOT Bicyclist and Pedestrian Count Strategy Plan 113
117 Average Daily Volume (Cyclists/day) Site 19 (N PRICE RD SOUTH of SUN CIRCLE TRAIL) - NORTHBOUND Monday Tuesday Wednesday Thursday Friday Saturday Sunday Day of Week Site 19 (S PRICE RD NORTH of SUN CIRCLE TRAIL) - SOUTHBOUND Average Daily Volume (Cyclists/day) Monday Tuesday Wednesday Thursday Friday Saturday Sunday Day of Week ADOT Bicyclist and Pedestrian Count Strategy Plan 114

118 Cottonwood Data were collected at one location in the Cottonwood area: Site 143, SR 89 A (Milepost 358) south of Bill Gray Road. This site was selected because it is part of the Mingus Mountain Loop Route, a 91-mile bicycle route. Mingus Mountain Loop Bicycle Route Source: Site 143, SR 89A (Milepost 358), south of Bill Gray Road Location Summary Type of Count Area Type (Urban-Suburban/Rural) Major Facility Type Minor Facility Type Posted Speed Limit Pedestrian Facilities Lighting Bus Stop Locations (within ¼ mile) Crosswalks Bicycle Facilities Tube Urban-Suburban Four-lane divided roadway N/A 45 mph No No No N/A Paved shoulder ADOT Bicyclist and Pedestrian Count Strategy Plan 115


 Average Daily Volume (Cyclists/day) 7 6 5 4 3 2 1 0 6 5")
119 Site Photo N Note: Pneumatic tube placement shown in red. Data Summary Data were collected from Tuesday, October 3, 2017, to Monday, October 9, Bicycle traffic during this data collection period was generally low. The number of bicyclists recorded on Sunday, October 8, 2017, when six bicyclists were recorded, was the highest number of bicyclists recorded. Site 143 (SR 89A SOUTH of N BILL GRAY ROAD) Average Daily Volume (Cyclists/day) Monday Tuesday Wednesday Thursday Friday Saturday Sunday Day of Week ADOT Bicyclist and Pedestrian Count Strategy Plan 116

120 Flagstaff Counts were conducted at four locations in Flagstaff: Site 8, I-40B / (SR 89A) Milton Road This site was identified as a high-crash pedestrian location in the ADOT Pedestrian Safety Action Plan. Site 9, US 180/Birch Avenue This site was identified as a high-crash pedestrian location in the ADOT Pedestrian Safety Action Plan. Site 49, SR 89A at University Drive This site was a fatal pedestrian crash location. Site 139, US 180/Forest Ave (MP 216.4) This location was suggested for pedestrian and bicyclist data collection by Flagstaff Metropolitan Planning Organization staff. The data collected at each of these sites is summarized on the following pages. Site 8, I-40B / (SR 89A) Milton Road I-40B/Milton Road intersection ADOT Bicyclist and Pedestrian Count Strategy Plan 117
 Crosswalks Bicycle Facilities")
 30 mph Yes Yes Yes Yes, on the west and south legs of the intersection")


121 Location Summary Type of Count Area Type (Urban-Suburban/Rural) Major Facility Type Minor Facility Type Posted Speed Limit Pedestrian Facilities Lighting Bus Stop Locations (within ¼ mile) Crosswalks Bicycle Facilities 48-hour video Urban-Suburban Five-Lane with TWLT Lane Five-Lane with TWLT Lane (I-40B forms a T-intersection with Milton Road, with no east leg) 30 mph Yes Yes Yes Yes, on the west and south legs of the intersection Striped shoulder, northbound on Milton Rd Site Photo N Data Summary Video data collection was conducted on Monday, September 11 and Tuesday, September 12, A daily average of 571 pedestrians and 126 bicyclists crossed the west leg of the intersection. A large number of pedestrians and bicyclists crossed the south leg of the intersection (an average of 442 pedestrians and 80 bicyclists). ADOT Bicyclist and Pedestrian Count Strategy Plan 118


122 Count Date 9/11/2017 Count Date 9/12/2017 ADOT Bicyclist and Pedestrian Count Strategy Plan 119
 / Birch Avenue Location Summary Type of Count Area Type (Urban-Suburban/Rural) Major Facility Type (US")
 Crosswalks Bicycle Facilities 48-hour video Urban-Suburban Three-lane with TWLTL One-way,")


123 Site 9, US 180 (Milepost 215.6) / Birch Avenue Location Summary Type of Count Area Type (Urban-Suburban/Rural) Major Facility Type (US 180) Minor Facility Type (Birch Ave) Posted Speed Limit Pedestrian Facilities Lighting Bus Stop Locations (within ¼ mile) Crosswalks Bicycle Facilities 48-hour video Urban-Suburban Three-lane with TWLTL One-way, two-lane roadway on east 25 mph Yes Yes Yes Yes No Site Photo N Data Summary Video data collection was conducted at the intersection on Monday, September 11, and Tuesday, September 12, Most pedestrians used the south leg of the intersection to cross, an average of 420 persons over the two days. The highest level of bicycle activity was across the north leg of the intersection, where approximately 32 bicyclists crossed the intersection. ADOT Bicyclist and Pedestrian Count Strategy Plan 120
124 Count Date: 9/11/2017 Count Date 9/12/2017 ADOT Bicyclist and Pedestrian Count Strategy Plan 121
 Crosswalks Bicycle Facilities 48-hour video Urban-Suburban Four-lane highway with TWLTL Two-lane divided roadway")
.")
125 Site 49, SR 89A (Milton Road) at University Drive Location Summary Type of Count Area Type (Urban-Suburban/Rural) Major Facility Type (SR 89A/Milton Road) Minor Facility Type (University Drive) Posted Speed Limit Pedestrian Facilities Lighting Bus Stop Locations (within ¼ mile) Crosswalks Bicycle Facilities 48-hour video Urban-Suburban Four-lane highway with TWLTL Two-lane divided roadway Closest NB is 30 mph, closest SB is 35 mph Yes Yes Yes Yes, on north and east legs No Site Photo N W University Dr S Milton Rd Data Summary Video data collection was conducted at Site 49 on Monday, September 11 and Tuesday, September 12, Pedestrian crossing volumes were highest on the east and west legs of the intersection (crossing University Drive). Pedestrian and bicycle volumes were highest crossing the north leg of the intersection. ADOT Bicyclist and Pedestrian Count Strategy Plan 122
126 Count Date: 9/11/2017 Count Date: 9/12/2017 ADOT Bicyclist and Pedestrian Count Strategy Plan 123
 / Forest Avenue Location Summary Type of Count Area Type (Urban-Suburban/Rural) Major Facility Type (US 180) Minor Facility Type (Forest Avenue) Posted Speed")


127 Site 139, US 180 (MP 216.4) / Forest Avenue Location Summary Type of Count Area Type (Urban-Suburban/Rural) Major Facility Type (US 180) Minor Facility Type (Forest Avenue) Posted Speed Limit Pedestrian Facilities Lighting Bus Stop Locations (within ¼ mile) Crosswalks Bicycle Facilities 48-hour video Urban-Suburban Two-lane with TWLTL Two-lane with TWLTL 35 mph Yes Yes No Yes, on south and east legs Shared-use path and paved shoulders Site Photo N Data Summary Video data collection was conducted at Site 139 on Monday, September 11 and Tuesday, September 12, The highest crossing volumes occurred on the south and east legs of the intersection, which are the crosswalk locations. An average of 44 pedestrians per day and 34 bicyclists per day crossed the south leg of the intersection. An average of 35 pedestrians per day and 14 bicyclists used the crosswalk to cross the east leg of the intersection. ADOT Bicyclist and Pedestrian Count Strategy Plan 124
128 Count Date: 9/11/2017 Count Date: 9/11/2017 ADOT Bicyclist and Pedestrian Count Strategy Plan 125

, north of Shea Boulevard Location Summary Type of Count")
 Crosswalks")

129 Fountain Hills Data were collected at one location in the Fountain Hills area, at Site 140, SR 87 at Milepost 189. This site was chosen because it is a special event route for bicyclists. Site 140, SR 87 (Milepost 189), north of Shea Boulevard Location Summary Type of Count Area Type (Urban-Suburban/Rural) Major Facility Type (SR 87) Minor Facility Type Posted Speed Limit Pedestrian Facilities Lighting Bus Stop Locations (within ¼ mile) Crosswalks Bicycle Facilities Seven-day tube count Rural Four-lane divided highway Road segment count- not at intersection 65 mph No At Shea Blvd No No Paved shoulder Site Photo N Note: Pneumatic tube placement shown in red. ADOT Bicyclist and Pedestrian Count Strategy Plan 126
130 Data Summary Bicycle count data were collected over a seven-day period from Thursday, November 9, 2017, to Wednesday, November 15, The bicyclist data collected on Saturday and Sunday showed a significant increase in bicycle riders. During the Monday through Friday period, there was an average of approximately 17 bicyclists per day. On the weekend, there was an average of 50 bicyclists per day. Site 140 (SR-87 NORTH of E SHEA BLVD) Average Daily Volume (Cyclists/day) Monday Tuesday Wednesday Thursday Friday Saturday Sunday Day of Week ADOT Bicyclist and Pedestrian Count Strategy Plan 127

 Major Facility Type (US 60) Minor Facility")
 Crosswalks Yes No Yes Bicycle Facilities None on US 60 or 55 th Avenue, striped shoulder on N.")
131 Glendale Data were collected at two sites in Glendale: Site 63, at the intersection of US 60 and 55 th Avenue/Maryland Access Ave This site was chosen because it was a pedestrian fatality location and was within a high-risk road segment identified in the ADOT 2017 Pedestrian Safety Action Plan. Site 129, located on the Arizona Canal Trail, near 59 th Avenue This site was chosen because it is part of US Bicycle Route 90. Site 63, US 60/West Maryland Access Avenue/55 th Avenue Location Summary Type of Count Area Type (Urban-Suburban/Rural) Major Facility Type (US 60) Minor Facility Type (55 th Avenue) Posted Speed Limit 48-hour video Urban-Suburban Six-lane divided Two-lane undivided 45 mph Pedestrian Facilities Yes, on north side of US 60 Lighting Bus Stop Locations (within ¼ mile) Crosswalks Yes No Yes Bicycle Facilities None on US 60 or 55 th Avenue, striped shoulder on N. 54 th Avenue Site Photo N N 55 th Ave N 54 th Ave ADOT Bicyclist and Pedestrian Count Strategy Plan 128
132 Data Summary Video data collection was conducted on Tuesday, November 7 and Wednesday, November 8, Few pedestrians were observed during the two-day data collection period. Bicycle traffic was modest; bicyclists tended to use the north and east legs of the intersection. Count date: November 7, 2017 Count date: November 8, 2017 ADOT Bicyclist and Pedestrian Count Strategy Plan 129
 Major Facility Type Minor Facility Type Posted")


133 Site 129, Arizona Canal Trail, near 59 th Avenue Location Summary Type of Count Area Type (Urban-Suburban/Rural) Major Facility Type Minor Facility Type Posted Speed Limit Pedestrian Facilities Lighting Bus Stop Locations (within ¼ mile) Crosswalks Bicycle Facilities Longer duration tube count Urban Suburban Shared-Use Path N/A N/A N/A N/A N/A N/A Shared-Use Path Site Photo N N 59 th Avenue Note: Pneumatic tube placement shown in red. ADOT Bicyclist and Pedestrian Count Strategy Plan 130

134 Arizona Canal Trail tube layout, east of 59 th Avenue Data Summary Bicycle count data were collected on this path from October 12, 2017, to January 23, MAG loaned Eco-Counter count equipment and provided the use of data reduction software to analyze the finding of this long-term count. Key findings of this data collection effort included: Total Traffic for the Period Analyzed: 12,120 bicyclists Daily Average: 108 bicyclists o Weekdays: 93 bicyclists / Weekend days: 147 bicyclists Monthly Average: 3,294 bicyclists Busiest Day of the Week: Sunday Busiest Days of the Period Analyzed: o Sunday, November 5, 2017 (235 bicyclists) o Saturday, January 13, 2018 (227 bicyclists) o Sunday, November 26, 2017 (220 bicyclists) This trend data is summarized in the charts on the following page. ADOT Bicyclist and Pedestrian Count Strategy Plan 131
135 Site 129, Arizona Canal Trail, near 59 th Avenue Note: Tubes 04_IN refers to count data in the southeast bound direction, Tubes 04_OUT refers to count data in the northwest bound direction. ADOT Bicyclist and Pedestrian Count Strategy Plan 132
136 Mesa Data were collected at five locations in the Mesa area: Site 21, SR 87/McKellips Road This site was selected because it was a priority location in the ADOT 2012 Bicycle Safety Action Plan. Site 56, US 60X (Main Street)/Hawes Road This site was within a high-crash segment identified in the ADOT 2017 Pedestrian Safety Action Plan. Site 80, Apache Boulevard at SR 101 This site was identified in the ADOT 2012 Bicycle Safety Action Plan. Site 94, SR 60X (Apache Trail)/Crismon Road This site was a fatal bicycle crash location reported in the ADOT 2009 Bicycle Safety Action Plan. Site 124, Adobe Street, west of 80 th Street This location is part of U.S. Bicycle Route 90. Site 21, SR 87/McKellips Road Location Summary Type of Count Area Type (Urban-Suburban/Rural) Major Facility Type (SR 87) Minor Facility Type (McKellips Rd) Posted Speed Limit Pedestrian Facilities Lighting Bus Stop Locations (within ¼ mile) Crosswalks Bicycle Facilities Seven-day tube count Urban-Suburban Six-lane with brick paving treatment to define median Six-lane with TWLTL 45 mph Yes Yes Yes (on McKellips Rd) Yes Paved shoulder ADOT Bicyclist and Pedestrian Count Strategy Plan 133


137 Site Photo N W McKellips Rd SR 87 Note: Pneumatic tube placement shown in red. Summary Tube counts were conducted on Thursday, November 9 through Wednesday, November 15, This site did not have a clear distinction between weekday and weekend bicycle volumes. The highest bicycle volumes occurred on Thursday, Friday, and Saturday, when an average of 43 bicyclists per day were recorded. The two very low days did not appear to be the result of poor weather. Site 21 (SR 87 SOUTH of W MCKELLIPS ROAD) Average Daily Volume (Cyclists/day) Monday Tuesday Wednesday Thursday Friday Saturday Sunday Day of Week ADOT Bicyclist and Pedestrian Count Strategy Plan 134
 Crosswalks Bicycle Facilities 48-hour video Urban-Suburban Six-lane divided roadway Two-lane undivided 45 mph No No No No None Site Photo N Main")

138 Site 56, US 60X (Main Street)/Hawes Road Location Summary Type of Count Area Type (Urban-Suburban/Rural) Major Facility Type (US 60X) Minor Facility Type (Hawes Road) Posted Speed Limit Pedestrian Facilities Lighting Bus Stop Locations (within ¼ mile) Crosswalks Bicycle Facilities 48-hour video Urban-Suburban Six-lane divided roadway Two-lane undivided 45 mph No No No No None Site Photo N Main St S Hawes Rd Data Summary Video data were collected on December 13 and December 14, The majority of pedestrian and bicyclist traffic was recorded on US 60X (Main Street). An average of 12 pedestrians per day and 11 bicyclists per day crossed the north leg of the intersection and 16 pedestrians and 34 bicyclists per day crossed the south leg. Few pedestrians or bicyclists crossed Main Street. It should be noted no crosswalks exist at this location. ADOT Bicyclist and Pedestrian Count Strategy Plan 135
139 Site 56, US 60X (Main Street)/Hawes Road Count date: December 13, 2017 Count date: December 14, 2017 ADOT Bicyclist and Pedestrian Count Strategy Plan 136
 Four-lane divided (light rail lines) Minor Facility Type (SR 101 frontage Road) Two-lane Posted")

140 Site 80, Apache Boulevard at SR 101L Location Summary Type of Count Seven-day tube count Area Type (Urban-Suburban/Rural) Urban-Suburban Major Facility Type (Apache Boulevard) Four-lane divided (light rail lines) Minor Facility Type (SR 101 frontage Road) Two-lane Posted Speed Limit 35 Pedestrian Facilities Yes Lighting Yes Bus Stop Locations (within ¼ mile) Yes Crosswalks N/A Bicycle Facilities Marked bike lane Site Photo N Apache Blvd SR 101L Note: Pneumatic tube placement shown in red. ADOT Bicyclist and Pedestrian Count Strategy Plan 137
141 Data Summary Tube counts were conducted on Thursday, November 9, 2017, through Wednesday, November 15, This site had higher volumes of bicyclists during the weekdays, as compared to the weekend. During the Monday through Friday period, there was an average of 80 bicyclists per day. During the weekend, there was an average of 43 bicyclists per day. Peak days were Tuesday and Thursday. This location had the most bicyclist activity of the sites where seven-day tube counts were conducted. Site 80 (APACHE BLVD EAST of N PRICE ROAD (SR 101 FRONTAGE RD) Average Daily Volume (Cyclists/day) Monday Tuesday Wednesday Thursday Friday Saturday Sunday Day of Week ADOT Bicyclist and Pedestrian Count Strategy Plan 138
 Posted Speed Limit Pedestrian Facilities Lighting Bus Stop Locations (within ¼ mile) Crosswalks Bicycle Facilities 48-hour video count Urban-Suburban Six-lane")

142 Site 94, SR 60X (Main Street)/Crismon Road Location Summary Type of Count Area Type (Urban-Suburban/Rural) Major Facility Type (SR 60X (Main Street) Minor Facility Type (Crismon Road) Posted Speed Limit Pedestrian Facilities Lighting Bus Stop Locations (within ¼ mile) Crosswalks Bicycle Facilities 48-hour video count Urban-Suburban Six-lane divided Two-lane undivided 45 mph Walkway over bridge to east, otherwise no Yes No Yes No Site Photo Crismon Rd N Main St Data Summary Video data were collected on Wednesday, November 15 and Thursday, November 16, Pedestrian and bicycle crossings were low on all four legs of the intersection. ADOT Bicyclist and Pedestrian Count Strategy Plan 139
143 Site 94, SR 60X (Main Street)/Crismon Road Count date: November 15, 2017 Count date: November 16, 2017 ADOT Bicyclist and Pedestrian Count Strategy Plan 140
 Urban-Suburban Major Facility Type (Adobe Street) Two-lane with TWLTL Minor Facility Type N/A Posted")

144 Site 124, Adobe Street, west of 80th Street Location Summary Type of Count Long-duration tube count Area Type (Urban-Suburban/Rural) Urban-Suburban Major Facility Type (Adobe Street) Two-lane with TWLTL Minor Facility Type N/A Posted Speed Limit 35 Pedestrian Facilities Yes Lighting Yes Bus Stop Locations (within ¼ mile) No Crosswalks N/A Bicycle Facilities Marked bike lane Site Photo N Adobe St 80 th St Note: Pneumatic tube placement shown in red. ADOT Bicyclist and Pedestrian Count Strategy Plan 141

 Total Traffic for the Period Analyzed: 1,793 bicyclists Daily Average: 16 bicyclists o Weekdays: 16 bicyclists / Weekend days: 15 bicyclists Monthly Average: 487 bicyclists Busiest")
145 Data Summary Tube counts were conducted from Thursday, October 12, 2017, to Wednesday, January 31, Tube counts were summarized by direction at this location. EB Tube Count Data Total Traffic for the Period Analyzed: 2,155 bicyclists Daily Average: 19 bicyclists o Weekdays: 19 bicyclists / Weekend days: 19 bicyclists Monthly Average: 586 bicyclists Busiest Day of the Week: Monday Busiest Days of the Period Analyzed: WB Tube Count Data o Monday, December 04, 2017 (43 bicyclists) o Monday, January 15, 2018 (40 bicyclists) o Wednesday, January 31, 2018 (38 bicyclists) Total Traffic for the Period Analyzed: 1,793 bicyclists Daily Average: 16 bicyclists o Weekdays: 16 bicyclists / Weekend days: 15 bicyclists Monthly Average: 487 bicyclists Busiest Day of the Week: Tuesday Busiest Days of the Period Analyzed: o Monday, December 04, 2017 (32 bicyclists) o Wednesday, November 15, 2017 (31 bicyclists) o Wednesday, January 31, 2018 (29 bicyclists) EB Adobe St tube installation, west of 80 th St WB Adobe St tube installation, west of 80 th St ADOT Bicyclist and Pedestrian Count Strategy Plan 142
146 Site 124, Adobe Street, west of 80th Street, Eastbound Note: Tubes 03_IN refers to count data in the eastbound direction, Tubes 03_OUT refers to count data in the westbound direction. ADOT Bicyclist and Pedestrian Count Strategy Plan 143
147 Site 124, Adobe Street, west of 80th Street, Westbound Note: Tubes 11_IN refers to count data in the westbound direction, Tubes 1_OUT refers to count data in the eastbound direction. ADOT Bicyclist and Pedestrian Count Strategy Plan 144
148 Phoenix Bicycle and pedestrian count data were collected at 12 locations in the Phoenix area: Site 1, Bethany Home Road/I-17 Ramp Crossings This site was identified as a high-crash location in the 2017 Pedestrian Safety Action Plan and a priority intersection in the ADOT 2012 Bicycle Safety Action Plan. Site 5, 67th Avenue/I-10 Ramp Crossings This site was identified as a high-crash intersection in the ADOT 2017 Pedestrian Safety Action Plan. Site 6, Dysart Road/I-10 Ramp Crossings This site was identified as a high-crash intersection in the ADOT 2017 Pedestrian Safety Action Plan. Site 11, Glendale Avenue/I-17 Ramp Crossings This site was identified as a high-crash intersection in the ADOT 2017 Pedestrian Safety Action Plan. Site 12, Indian School Road/I-17 Ramp Crossing This site was identified as a high-crash location in the ADOT 2017 Pedestrian Safety Action Plan and a priority intersection in the ADOT 2012 Bicycle Safety Action Plan. Site 16, Indian School Road/SR 51 Ramp Crossings This was a focus area location in the ADOT 2012 Bicycle Safety Action Plan. Site 22, 7th Street/I-10 Ramp Crossing This location was identified as a priority location in the ADOT 2012 Bicycle Safety Action Plan. Site 23, 24th Street/SR 202 Ramp Crossings This location was identified as a priority location in the ADOT 2012 Bicycle Safety Action Plan. Site 126, Campbell Avenue, east of 26th Street This location was selected because it is part of U.S. Bicycle Route 90. Site 127, Arizona Canal Trail, south of Glendale Avenue This location was selected because it is part of U.S. Bicycle Route 90. Site 128, Arizona Canal Trail, west of 25th Avenue This location was selected because it is part of U.S. Bicycle Route 90. ADOT Bicyclist and Pedestrian Count Strategy Plan 145
 Crosswalks Bicycle Facilities 48-hour video Urban-Suburban 3 EB lanes, 3 WB lanes, and 2 left turn lanes (in each direction) at")

149 Site 1, Bethany Home Road / I-17 Ramp Crossings Location Summary Type of Count Area Type (Urban-Suburban/Rural) Major Facility Type (Bethany Home Rd) Minor Facility Type (I-17 ramps) Posted Speed Limit Pedestrian Facilities Lighting Bus Stop Locations (within ¼ mile) Crosswalks Bicycle Facilities 48-hour video Urban-Suburban 3 EB lanes, 3 WB lanes, and 2 left turn lanes (in each direction) at the interchange Varies 40 mph Yes Yes Yes Yes No Site Photo N W Bethany Home Rd I-17 Data Summary Video data collection was conducted at the interchange on Thursday, November 30 and Friday, December 1, At the I-17 southbound ramps intersecting with Bethany Home Road, pedestrians most commonly crossed the north leg of the intersection. Daily pedestrian volumes ranged from 31 to 245 persons on the individual crossings. Bicycle volumes ranged from 4 to 97 bicyclists per day, and bicyclists most commonly crossed on the south side of Bethany Home Road. ADOT Bicyclist and Pedestrian Count Strategy Plan 146
150 Site 1, Bethany Home Road/I-17 Ramp Crossings Count date: November 30, 2017 Count date: December 1, 2017 ADOT Bicyclist and Pedestrian Count Strategy Plan 147
 Crosswalks Bicycle Facilities 48-hour video Urban-Suburban Six-Lane Divided Roadway Freeway on/off ramps 40 mph Yes Yes Yes Yes No Site Photo N")

151 Site 5, 67 th Avenue/I-10 WB On/Off Ramp Crossings Location Summary Type of Count Area Type (Urban-Suburban/Rural) Major Facility Type (67 th Ave) Minor Facility Type Posted Speed Limit Pedestrian Facilities Lighting Bus Stop Locations (within ¼ mile) Crosswalks Bicycle Facilities 48-hour video Urban-Suburban Six-Lane Divided Roadway Freeway on/off ramps 40 mph Yes Yes Yes Yes No Site Photo N N 67 th Ave I-10 Data Summary Video data collection was conducted on Wednesday, November 29 and Thursday, November 30, Pedestrian volumes crossing the westbound ramp areas on 67 th Avenue generally ranged from 60 to 74 persons per day on the west leg of the intersection and 54 to 60 persons per day crossing the east leg of the intersection. Bicyclist volumes ranged from 17 to 26 bicyclists per day on the west leg of the intersection and 36 to 44 bicyclists per day crossing the east leg of the intersection. ADOT Bicyclist and Pedestrian Count Strategy Plan 148

152 Site 5, 67 th Avenue/I-10 Ramp Crossings Count Date: November 29, 2017 Count Date: November 30, 2017 ADOT Bicyclist and Pedestrian Count Strategy Plan 149
 Crosswalks Bicycle Facilities 48-hour video Urban-Suburban Six-lane divided roadway On-ramps: two lanes, WB off-ramps: four lanes at")

153 Site 6, Dysart Road/I-10 Ramp Crossings Location Summary Type of Count Area Type (Urban-Suburban/Rural) Major Facility Type (Dysart Road) Minor Facility Type (I-10 ramps) Posted Speed Limit Pedestrian Facilities Lighting Bus Stop Locations (within ¼ mile) Crosswalks Bicycle Facilities 48-hour video Urban-Suburban Six-lane divided roadway On-ramps: two lanes, WB off-ramps: four lanes at intersection, EB off-ramp: three lanes at intersection 40 mph Yes Yes Yes Yes Paved shoulder Site Photo N N Dysart Rd I-10 Data Summary Video data collection was conducted at the interchange on November 7, 2017, and November 8, At the I-10 westbound ramps intersecting with Dysart Road, pedestrians most commonly crossed on the east leg of the intersection. Daily pedestrian volumes ranged from 76 to 147 pedestrians per day for north/south crossings. Bicyclists crossed the ramp areas using both sides of Dysart Road, and daily bicycle volumes ranged from 25 to 44 bicyclists per day for north/south crossings. At the I-10 eastbound ramps crossing Dysart Road, daily pedestrian volumes ranged from 61 to 116 pedestrians per day for ADOT Bicyclist and Pedestrian Count Strategy Plan 150

154 north/south crossings. Bicycle volumes crossing Dysart Road at the eastbound ramps ranged from 13 to 54 bicyclists per day for north/south crossings. North Dysart Road and I-10 WB Ramps Count Date: November 7, 2017 Count Date: November 8, 2017 ADOT Bicyclist and Pedestrian Count Strategy Plan 151
155 North Dysart Road and I-10 EB Ramps Count Date: November 7, 2017 Count Date: November 8, 2017 ADOT Bicyclist and Pedestrian Count Strategy Plan 152
 Crosswalks Bicycle Facilities 48-hour video Urban-Suburban Six-Lane Divided Roadway On-ramps: three lanes; NB offramp: 5 lanes at")

156 Site 11, Glendale Avenue/I-17 Ramp Crossings Location Summary Type of Count Area Type (Urban-Suburban/Rural) Major Facility Type (Glendale Ave) Minor Facility Type (I-17 ramps) Posted Speed Limit Pedestrian Facilities Lighting Bus Stop Locations (within ¼ mile) Crosswalks Bicycle Facilities 48-hour video Urban-Suburban Six-Lane Divided Roadway On-ramps: three lanes; NB offramp: 5 lanes at intersection; SB off-ramp: 5 lanes at intersection 40 mph Yes Yes Yes Yes No Site Photo N I-17 Glendale Ave Data Summary Video data collection was conducted at the single-point urban interchange on Thursday, November 30, 2017, and Friday, December 1, Pedestrian volumes were heaviest along both sides of Glendale Avenue, and volumes varied from 244 to 306 pedestrians per day. Bicycle crossing volumes varied from 60 to 114 bicyclists per day. ADOT Bicyclist and Pedestrian Count Strategy Plan 153
157 Site 11, Glendale Avenue/ I-17 Ramp Crossings Count date: November 30, 2017 Count date: December 1, 2017 ADOT Bicyclist and Pedestrian Count Strategy Plan 154
 Crosswalks Bicycle Facilities 48-hour video Urban-Suburban Eight-Lane Divided Roadway On-ramps: three lanes; NB off-ramp: 5")

158 Site 12, Indian School Road/I-17 Ramp Crossings Location Summary Type of Count Area Type (Urban-Suburban/Rural) Major Facility Type (Indian School Rd) Minor Facility Type (I-17 ramps) Posted Speed Limit Pedestrian Facilities Lighting Bus Stop Locations (within ¼ mile) Crosswalks Bicycle Facilities 48-hour video Urban-Suburban Eight-Lane Divided Roadway On-ramps: three lanes; NB off-ramp: 5 lanes at intersection; SB off-ramp: 5 lanes at intersection 35 mph Yes Yes Yes Yes No Site Photo N I-17 Indian School Road Data Summary Video data collection was conducted at this interchange on Wednesday, December 13 and Thursday, December 14, At the northbound and southbound ramp crossings, the heaviest pedestrian and bicyclist crossing volumes were on the north and south legs of the intersection. On Indian School Road, pedestrian volumes crossing the ramp crosswalks on the north and south legs of the intersection ranged from 183 to 282 persons per day and bicycle volumes ranged from 76 to 112 bicyclists per day. ADOT Bicyclist and Pedestrian Count Strategy Plan 155
159 Indian School Road/I-17 NB Ramps Count date: December 13, 2017 Count Date: December 14, 2017 ADOT Bicyclist and Pedestrian Count Strategy Plan 156
160 Indian School Road/I-17 SB Ramps Count date: December 13, 2017 Count date: December 14, 2017 ADOT Bicyclist and Pedestrian Count Strategy Plan 157
 Crosswalks Bicycle Facilities 48-hour video Urban-Suburban Six-lane divided roadway on-ramps: three lanes; NB off-ramp: four lanes at the")

161 I-17N Site 13, Thomas Road, I-17 Ramp Crossings Location Summary Type of Count Area Type (Urban-Suburban/Rural) Major Facility Type (Thomas Road) Minor Facility Type Posted Speed Limit Pedestrian Facilities Lighting Bus Stop Locations (within ¼ mile) Crosswalks Bicycle Facilities 48-hour video Urban-Suburban Six-lane divided roadway on-ramps: three lanes; NB off-ramp: four lanes at the intersection; SB off-ramp: four lanes at the intersection 35 mph Yes Yes Yes Yes No Site Photo Thomas Rd Data Summary Video data collection was conducted at this interchange location on Wednesday, December 13 and Thursday, December 14, At Thomas Road and the northbound ramps, a significant number of pedestrians crossed Thomas Road on the north, south, and east legs of the intersection. Bicyclists generally used Thomas Road and crossed using the north and south legs of the intersection. At Thomas Road and the I-17 southbound ramps, bicyclists and pedestrians generally crossed using the north and south legs of the intersection. ADOT Bicyclist and Pedestrian Count Strategy Plan 158
162 Thomas Road/I-17 Northbound Ramps Count date: December 13, 2017 Count date: December 14, 2017 ADOT Bicyclist and Pedestrian Count Strategy Plan 159
163 Thomas Road/I-17 Southbound Ramps Count date: December 13, 2017 Count date: December 14, 2017 ADOT Bicyclist and Pedestrian Count Strategy Plan 160
 Posted Speed Limit Pedestrian Facilities Lighting Bus Stop Locations (within ¼ mile) Crosswalks Bicycle Facilities 48-hour video Urban-Suburban Six-lane divided Varies")

164 Site 16, Indian School Road / SR 51 Ramp Crossings Location Summary Type of Count Area Type (Urban-Suburban/Rural) Major Facility Type (Indian School Road Minor Facility Type (SR 51 ramps) Posted Speed Limit Pedestrian Facilities Lighting Bus Stop Locations (within ¼ mile) Crosswalks Bicycle Facilities 48-hour video Urban-Suburban Six-lane divided Varies 35 mph Yes Yes Yes Yes No Site Photo N Indian School Road Data Summary Video data collection occurred on Wednesday, November 15, 2017, and Thursday, November 16, Pedestrians and bicyclists generally crossed the SR 51 ramp crossings using both the north and south legs of the intersection primarily. ADOT Bicyclist and Pedestrian Count Strategy Plan 161
165 Site 16, Indian School Road / SR 51 Ramp Crossings Count date: November 15 th, 2017 ADOT Bicyclist and Pedestrian Count Strategy Plan 162
166 Site 16, Indian School Road / SR 51 Ramp Crossings Count date: November 16 th, 2017 ADOT Bicyclist and Pedestrian Count Strategy Plan 163
 Crosswalks Bicycle Facilities 48-hour video segment Urban-Suburban Four-lane divided Three lanes at intersection 35 mph Yes Yes")

167 Site 22, 7 th Street / I-10 Ramp Crossing Location Summary Type of Count Area Type (Urban-Suburban/Rural) Major Facility Type (7 th Street) Minor Facility Type (I-10 ramp crossings) Posted Speed Limit Pedestrian Facilities Lighting Bus Stop Locations (within ¼ mile) Crosswalks Bicycle Facilities 48-hour video segment Urban-Suburban Four-lane divided Three lanes at intersection 35 mph Yes Yes Yes Yes ramp crossings only No Site Photo N 7 th St N Note: Video camera placement shown in red. Data Summary Video counts were conducted at this location on Wednesday, December 13 th and Thursday, December 14, Because of the single-point urban interchange (SPUI) configuration of the interchange, road segment counts were conducted using video to capture both pedestrians and bicyclists using the crosswalks at the central intersection. Pedestrian volumes using the crosswalk ranged between 283 and ADOT Bicyclist and Pedestrian Count Strategy Plan 164
168 351 persons per day. Bicyclist volumes using the crosswalk and roadway ranged from 40 to 62 bicyclists per day. Site 22, 7 th Street/I-10 Ramp Crossings Count date: 12/13/ Average Daily Volume Crosswalk Roadway Site Code 22 (12/13/2017) Pedestrians Bicycles Count date: 12/14/2017 Average Daily Volume Crosswalk Roadway Site Code 22 (12/14/2017) Pedestrians Bicycles ADOT Bicyclist and Pedestrian Count Strategy Plan 165
 Crosswalks Bicycle Facilities 48-hour video segment count Urban-Suburban Five-lane (3 lanes NB and 2 lanes SB) Varies 1 to 2 lanes at")

169 Site 23, 24th Street/SR 202L Ramp Crossings Location Summary Type of Count Area Type (Urban-Suburban/Rural) Major Facility Type (24 th Street) Minor Facility Type (SR 202 ramps) Posted Speed Limit Pedestrian Facilities Lighting Bus Stop Locations (within ¼ mile) Crosswalks Bicycle Facilities 48-hour video segment count Urban-Suburban Five-lane (3 lanes NB and 2 lanes SB) Varies 1 to 2 lanes at each crossing 35 mph Yes Yes Yes Yes ramp crossings only No Site Photo N SR 202L N 24 th St Note: Video camera placement shown in red. Data Summary Video counts were conducted at this location on Wednesday, November 15, 2017, and Thursday, November 16, Because of the SPUI configuration of the interchange, road segment counts were conducted using video to capture both pedestrians and bicyclists using the crosswalks at the central intersection, as well as the 24 th Street roadway. Daily pedestrian volumes using the crosswalks ranged from 223 to 305 pedestrians. Bicycle volumes using the crosswalks ranged from 160 to 198 per day. ADOT Bicyclist and Pedestrian Count Strategy Plan 166
170 Site 23, 24th Street/SR 202L Ramp Crossings Count date: 11/15/2017 Average Daily Volume Sidewalk Roadway Site Code 23 (11/15/2017) Pedestrians Bicycles Count date: 11/16/2017 Average Daily Volume Sidewalk Roadway Site Code 23 (11/16/2017) Pedestrians Bicycles ADOT Bicyclist and Pedestrian Count Strategy Plan 167
 Minor Facility Type Posted Speed Limit Pedestrian Facilities Lighting Bus Stop Locations")

171 Site 126, Campbell Avenue, east of 26th Street Location Summary Type of Count Area Type (Urban-Suburban/Rural) Major Facility Type (Campbell Avenue) Minor Facility Type Posted Speed Limit Pedestrian Facilities Lighting Bus Stop Locations (within ¼ mile) Crosswalks Bicycle Facilities Seven-day tube count Urban-Suburban Two-lane undivided N/A 30 mph Yes Yes No N/A Bike lanes Site Photo N 26 th St N Note: Pneumatic tube placement shown in red. ADOT Bicyclist and Pedestrian Count Strategy Plan 168
172 Data Summary Tube counts were conducted in the eastbound direction from Thursday, November 9 to Wednesday, November 15. Counts were conducted in the westbound direction from Thursday, November 30, 2017, to Wednesday, December 6, There was an average of 42 bicyclists during the weekend period and 35 bicyclists during the weekday period, in both directions. Saturday had the largest number of bicyclists, when 50 bicyclists were recorded (sum of eastbound and westbound riders, although on different days). Site 126, Campbell Avenue, east of 26th Street Site 126 (E CAMPBELL AVE EAST of N 26TH ST) Average Daily Volume (Cyclists/day) Monday Tuesday Wednesday Thursday Friday Saturday Sunday Day of Week ADOT Bicyclist and Pedestrian Count Strategy Plan 169
 Minor Facility Type Posted Speed Limit Pedestrian Facilities Lighting Bus Stop Locations")

173 Site 127, Arizona Canal Trail, North of Glendale Avenue Location Summary Type of Count Area Type (Urban-Suburban/Rural) Major Facility Type (Arizona Canal Trail) Minor Facility Type Posted Speed Limit Pedestrian Facilities Lighting Bus Stop Locations (within ¼ mile) Crosswalks Bicycle Facilities Long-duration tube count Urban-Suburban Shared-Use Path N/A N/A N/A No N/A N/A Shared-Use Path Site Photo N 16 th St N Glendale Ave Note: Pneumatic tube placement shown in red. ADOT Bicyclist and Pedestrian Count Strategy Plan 170

174 Data Summary Data were collected from Thursday, October 12, 2017, to Wednesday, January 31, Key trends included: Total Traffic for the Period Analyzed: 22,811 bicyclists Daily Average: 204 bicyclists o Weekdays: 172 bicyclists / Weekend days: 283 bicyclists Monthly Average: 6,199 bicyclists Busiest Day of the Week: Sunday Busiest Days of the Period Analyzed: o Saturday, October 21, 2017 (415 bicyclists) o Saturday, November 25, 2017 (408 bicyclists) o Sunday, November 19, 2017 (386 bicyclists) Arizona Canal Trail tube installation, North of Glendale Avenue ADOT Bicyclist and Pedestrian Count Strategy Plan 171
175 Site 127, Arizona Canal Trail, North of Glendale Avenue Note: Tubes 1_IN refers to count data in the northwest bound direction, Tubes 1_OUT refers to count data in the southeast bound direction. ADOT Bicyclist and Pedestrian Count Strategy Plan 172
")

176 Site 128, Arizona Canal Trail, west of 25th Avenue Location Summary Type of Count Area Type (Urban-Suburban/Rural) Major Facility Type Minor Facility Type Posted Speed Limit Pedestrian Facilities Lighting Bus Stop Locations (within ¼ mile) Crosswalks Bicycle Facilities Long-duration tube count Urban-Suburban Shared-Use Path N/A N/A N/A No N/A N/A Shared-Use Path Site Photo N Arizona Canal Trail 25 th Ave Note: Pneumatic tube placement shown in red. ADOT Bicyclist and Pedestrian Count Strategy Plan 173
177 Site 128, Arizona Canal Trail, west of 25th Avenue Note: Tubes 14_IN refers to count data in the westbound direction, Tubes 14_OUT refers to count data in the eastbound direction. ADOT Bicyclist and Pedestrian Count Strategy Plan 174

178 Data Summary Data were collected from Thursday, October 12 to Sunday, December 17, Key trends included: Total Traffic for the Period Analyzed: 11,461 bicyclists Daily Average: 169 bicyclists o Weekdays: 158 bicyclists / Weekend days: 194 bicyclists Monthly Average: 5,130 bicyclists Busiest Day of the Week: Saturday Busiest Days of the Period Analyzed: o Sunday, November 05, 2017 (292 bicyclists) o Saturday, November 04, 2017 (264 bicyclists) o Sunday, November 12, 2017 (257 bicyclists) Arizona Canal Trail tube installation, west of 25 th Avenue ADOT Bicyclist and Pedestrian Count Strategy Plan 175

 Crosswalks Bicycle Facilities Seven-day tube count Urban-Suburban Deer Valley Road N/A 40 mph Yes Yes No N/A Bike lane Site Photo N W Deer Valley Rd Note:")
179 Peoria Data were collected at two locations in Peoria: Site 130, Deer Valley Road, west of 95th Avenue This location was chosen because it is part of US Bicycle Route 90 Site 65, US 60/83rd Avenue This location was chosen because it was a location identified as part of high-risk crash segment in the ADOT 2017 Pedestrian Safety Action Plan. Site 130, Deer Valley Road, west of 95th Avenue Location Summary Type of Count Area Type (Urban-Suburban/Rural) Major Facility Type Minor Facility Type Posted Speed Limit Pedestrian Facilities Lighting Bus Stop Locations (within ¼ mile) Crosswalks Bicycle Facilities Seven-day tube count Urban-Suburban Deer Valley Road N/A 40 mph Yes Yes No N/A Bike lane Site Photo N W Deer Valley Rd Note: Pneumatic tube placement shown in red. ADOT Bicyclist and Pedestrian Count Strategy Plan 176
180 Data Summary Tube counts were conducted at this location from Thursday, November 30, 2017, to Wednesday, December 6, Low bicycle volumes were recorded at this location; however, Sunday did show an increase in volume compared to the other days. The graph below shows combined eastbound and westbound bicycle traffic. Site 130 (W DEER VALLEY RD WEST of N 95TH AVE) Average Daily Volume (Cyclists/day) Monday Tuesday Wednesday Thursday Friday Saturday Sunday Day of Week ADOT Bicyclist and Pedestrian Count Strategy Plan 177
 Minor Facility Type (83 rd Avenue) Posted Speed Limit Pedestrian Facilities Lighting Bus Stop Locations (within ¼")


181 Site 65, US 60 / 83 rd Avenue Location Summary Type of Count Area Type (Urban-Suburban/Rural) Major Facility Type (US 60) Minor Facility Type (83 rd Avenue) Posted Speed Limit Pedestrian Facilities Lighting Bus Stop Locations (within ¼ mile) Crosswalks Bicycle Facilities 48-hour video Urban-Suburban Six-lane divided Two-lane divided 45 mph Yes Yes No Yes No Site Photo N Data Summary Video data collection was conducted on Wednesday, November 29, 2017, and Thursday, November 30, Pedestrians most frequently crossed using the east and west legs of the intersection. The average pedestrian volume was 36 pedestrians crossing the west leg of the intersection and 33 pedestrians crossing the east leg of the intersection. The number of bicyclists was highest crossing the east leg of the intersection, where there was an average of 23 bicyclists per day over the two-day period. ADOT Bicyclist and Pedestrian Count Strategy Plan 178
182 Site 65, US 60/83 rd Avenue Count date: November 29, 2017 Count date: November 30, 2017 ADOT Bicyclist and Pedestrian Count Strategy Plan 179
/Aspen Way/Cheery Street Location Summary Type of Count Area")

183 Prescott Data were collected at one location in the Prescott area, which was Site 138, SR 89 (White Spar Road)/ Cheery Street. This site was chosen because it was part of the American Cycling Association Grand Canyon Connector Route Site 138, SR 89 (Milepost 310)/Aspen Way/Cheery Street Location Summary Type of Count Area Type (Urban-Suburban/Rural) Major Facility Type Minor Facility Type Posted Speed Limit Pedestrian Facilities Lighting Bus Stop Locations (within ¼ mile) Crosswalks Bicycle Facilities 48-hour video Urban-Suburban Two-lane undivided roadway with TWLTL Two-lane undivided roadway 30 mph Yes No No No Striped shoulder Site Photo N Data Summary Video data collection was conducted on October 3, 2017, and October 4, Almost all the pedestrian traffic crossed at the east and west legs of the intersection, where pedestrian volumes ranged from 15 to ADOT Bicyclist and Pedestrian Count Strategy Plan 180
184 23 persons per day. Much of the bicycle traffic was recorded on the west leg of the intersection, rather than on the cross streets of Aspen Way or Cheery Street. Bicyclist volumes crossing the west leg of the intersection ranged from 9 to 17 bicyclists per day. It should be noted there are no crosswalks at this intersection. Count date: October 3, 2017 Count date: October 4, 2017 ADOT Bicyclist and Pedestrian Count Strategy Plan 181
185 Sedona, Village of Oak Creek, and Verde Valley Bicycle and pedestrian count data were collected at five locations in the Sedona, Oak Creek, and Verde Valley area: Site 106, SR 89A/Rodeo Road This site was a near fatal pedestrian crash site reported in the ADOT 2009 Pedestrian Safety Action Plan. Site 132, SR 179 at MP 311 This site is part of a popular scenic bicycling route. Site 133, SR 179 at MP 307 This was the site of an Eco-Counter inductive loop that is currently non-operational. Site 144, SR 89A north of Page Springs Road (MP 363) in Sedona This site is part of the Mingus Mountain loop route. Site 145, SR 179, north of Beaverhead Flat Rd (approximately MP 305), Verde Valley This site is part of a popular cycling route. ADOT Bicyclist and Pedestrian Count Strategy Plan 182
 Crosswalks Bicycle Facilities 48-hour video Urban-Suburban Four-lane with TWLTL Two-lane undivided 35 mph Yes Yes No Yes Bike lane Site Photo N Data")
186 Site 106, SR 89A/Rodeo Road Location Summary Type of Count Area Type (Urban-Suburban/Rural) Major Facility Type (SR 89A) Minor Facility Type (Rodeo Rd) Posted Speed Limit Pedestrian Facilities Lighting Bus Stop Locations (within ¼ mile) Crosswalks Bicycle Facilities 48-hour video Urban-Suburban Four-lane with TWLTL Two-lane undivided 35 mph Yes Yes No Yes Bike lane Site Photo N Data Summary Video data collection took place on Tuesday, October 3, and Wednesday, October 4, The highest pedestrian volumes were observed crossing the north leg of the intersection, which averaged 124 persons over the two-day period. Bicyclists primarily used SR 89A. Bicyclist volumes on SR 89A crossing the north leg of the intersection averaged approximately 14 bicyclists per day. Daily volumes on SR 89A traveling along the south side of the street averaged 27 bicyclists over the two-day period. ADOT Bicyclist and Pedestrian Count Strategy Plan 183
187 Site 106, SR 89A/Rodeo Road Count date: 10/4/2017 Count date: 10/4/2017 ADOT Bicyclist and Pedestrian Count Strategy Plan 184
 Crosswalks Bicycle Facilities 48-hour")


188 Site 132, SR 179 at MP 311 (Sedona) Location Summary Type of Count Area Type (Urban-Suburban/Rural) Major Facility Type (SR 179) Minor Facility Type Posted Speed Limit Pedestrian Facilities Lighting Bus Stop Locations (within ¼ mile) Crosswalks Bicycle Facilities 48-hour video count Urban-Suburban Two-lane divided N/A 35 mph Yes, on west side No No No Bike lanes Site Photo N Note: Approximate location of video cameras shown in red. Data Summary Video counts were conducted on Tuesday, October 3, 2017, and Wednesday, October 4, Video data collection was used to capture pedestrians using the sidewalk as well as bicyclists. Approximately 30 pedestrians per day used the sidewalk area, and between 16 and 33 bicyclists used the road shoulder in both directions. ADOT Bicyclist and Pedestrian Count Strategy Plan 185
189 Site 132, SR 179 at MP 311 (Sedona) Count Date: 10/3/ Average Daily Volume Pedestrian Facilities Bike Lane Site Code 132 (10/03/2017) Pedestrains Bicycles Count date: 10/4/ Average Daily Volume Pedestrian Facilities Bike Lane Site Code 132 (10/04/2017) Pedestrians Bicycles ADOT Bicyclist and Pedestrian Count Strategy Plan 186
 Crosswalks Bicycle Facilities 48-hour video Urban-Suburban Two-lane highway with TWLTL N/A 35 mph Yes (paved path) Yes No N/A Marked bike lane Site Photo N")

190 Site 133, SR 179 at MP 307 (Village of Oak Creek) Location Summary Type of Count Area Type (Urban-Suburban/Rural) Major Facility Type Minor Facility Type Posted Speed Limit Pedestrian Facilities Lighting Bus Stop Locations (within ¼ mile) Crosswalks Bicycle Facilities 48-hour video Urban-Suburban Two-lane highway with TWLTL N/A 35 mph Yes (paved path) Yes No N/A Marked bike lane Site Photo N SR 179 Note: Video camera placement shown in red. Data Summary Video counts were conducted at this location to capture both pedestrian and bicyclist traffic. Pedestrian traffic ranged from 92 to 146 persons per day. Bicyclist traffic on the sidewalk/shared-use path ranged from 46 to 59 bicyclists per day, and on the marked bike lane ranged from 21 to 67 bicyclists per day. ADOT Bicyclist and Pedestrian Count Strategy Plan 187
191 Site 133, SR 179 at MP 307 (Village of Oak Creek) Count date: 10/3/ Average Daily Volume Sidewalk Marked Bike Lane Site Code 133 (10/03/2017) Pedestrians Bicycles Count date: 10/4/ Average Daily Volume Sidewalk Marked Bike Lane Site Code 133 (10/04/2017) Pedestrians Bicycles ADOT Bicyclist and Pedestrian Count Strategy Plan 188
 Major Facility Type Minor")
 Crosswalks Bicycle Facilities Seven-day tube count")

192 Site 144, SR 89A, Milepost 363, north of Page Springs Road (Sedona) Location Summary Type of Count Area Type (Urban-Suburban/Rural) Major Facility Type Minor Facility Type Posted Speed Limit Pedestrian Facilities Lighting Bus Stop Locations (within ¼ mile) Crosswalks Bicycle Facilities Seven-day tube count Rural Four-lane divided N/A 65 mph No No No N/A Paved shoulder Site Photo N Note: Pneumatic tube placement shown in red. ADOT Bicyclist and Pedestrian Count Strategy Plan 189
193 Data Summary Tube counts were conducted at this location from Tuesday, October 3 to Monday, October 9, Bicyclist volumes were low during this time period, ranging from zero bicyclists on Thursday, October 5 to 10 bicyclists on Sunday, October 8, Site 144 (SR 89A N of PAGE SPRINGS ROAD at MP 363) Average Daily Volume (Cyclists/day) Monday Tuesday Wednesday Thursday Friday Saturday Sunday Day of Week ADOT Bicyclist and Pedestrian Count Strategy Plan 190
 Major Facility Type Minor Facility Type")
 Crosswalks Bicycle Facilities Seven-day tube count Rural Two-lane")

194 Site 145, SR 179, Milepost 305 (Verde Valley) Location Summary Type of Count Area Type (Urban-Suburban/Rural) Major Facility Type Minor Facility Type Posted Speed Limit Pedestrian Facilities Lighting Bus Stop Locations (within ¼ mile) Crosswalks Bicycle Facilities Seven-day tube count Rural Two-lane divided highway N/A 55 mph No No No N/A Bike lane Site Photo N Note: Location of pneumatic tubes is shown in red. ADOT Bicyclist and Pedestrian Count Strategy Plan 191
195 Data Summary Tube counts were conducted at this location from Tuesday, October 3 to Monday, October 9, Bicycle volumes were low during this time period, ranging from zero bicyclists recorded on Thursday, Friday, and Monday during this time period to five bicyclists recorded on Saturday, October 7, Site 145 (SR 179 NORTH of BEAVERHEAD FLAT ROAD) Average Daily Volume (Cyclists/day) Monday Tuesday Wednesday Thursday Friday Saturday Sunday Day of Week ADOT Bicyclist and Pedestrian Count Strategy Plan 192

 Crosswalks Bicycle Facilities 48-hour video Urban-Suburban Four-lane divided Two-lane divided 55 mph No Yes No No No Site Photo N SR")
196 Sierra Vista Counts were conducted at two locations in Sierra Vista: Site 43, SR 92/Golden Acres Drive This site was chosen because it was a fatal pedestrian crash site. Site 95, SR 90/92/Fry Blvd intersection This site was chosen because it was part of an ADOT 2012 Bicycle Safety Action Plan focus area segment and because it is an activity area. Site 43, SR 92/Golden Acres Drive Intersection Location Summary Type of Count Area Type (Urban-Suburban/Rural) Major Facility Type (SR 92) Minor Facility Type (Golden Acres Drive) Posted Speed Limit Pedestrian Facilities Lighting Bus Stop Locations (within ¼ mile) Crosswalks Bicycle Facilities 48-hour video Urban-Suburban Four-lane divided Two-lane divided 55 mph No Yes No No No Site Photo N SR 92 E Golden Acres Dr ADOT Bicyclist and Pedestrian Count Strategy Plan 193


197 Data Summary Video data collection was conducted on Monday, November 27, 2017, and Tuesday, November 28, Very little bicyclist or pedestrian activity was recorded during this time period. Site 43, SR 92/Golden Acres Drive Intersection Count date: November 27, 2017 Count date: November 28, 2017 ADOT Bicyclist and Pedestrian Count Strategy Plan 194
 Crosswalks Bicycle Facilities 48-hour video Urban-Suburban Four-lane divided Four-lane with TWLTL 45 mph Yes Yes Yes Yes Shared-Use")

198 Site 95, SR 90/92/Fry Blvd intersection Location Summary Type of Count Area Type (Urban-Suburban/Rural) Major Facility Type (SR 90/SR 92) Minor Facility Type (Fry Blvd/SR 90) Posted Speed Limit Pedestrian Facilities Lighting Bus Stop Locations (within ¼ mile) Crosswalks Bicycle Facilities 48-hour video Urban-Suburban Four-lane divided Four-lane with TWLTL 45 mph Yes Yes Yes Yes Shared-Use Path on east side of SR 92 and north side of SR 90 Site Photo SR 90 N E Fry Blvd SR 90 SR 92 Data Summary Video count data were collected at the intersection on Wednesday, October 11, 2017, and Thursday, October 12, Pedestrians crossed all four legs of the intersection. Bicyclist traffic was heaviest across the east leg of the intersection. ADOT Bicyclist and Pedestrian Count Strategy Plan 195
199 Site 95, SR 90/92/Fry Blvd intersection Count date: October 11, 2017 Count date: October 12, 2017 ADOT Bicyclist and Pedestrian Count Strategy Plan 196
200 Tempe Bicycle and pedestrian counts were conducted at two locations in the Tempe area: Site 18, Baseline Road/I-10 Ramp Crossing This site was chosen because it was identified as a priority location in the ADOT 2012 Bicycle Safety Action Plan. Site 125, North College Avenue, north of Curry Road This site was selected as a longer-term tube count location because it is part of U.S. Bicycle Route 90 and because of its location near the Arizona State University Campus. ADOT Bicyclist and Pedestrian Count Strategy Plan 197
 Crosswalks Bicycle Facilities 48-hour video Urban-Suburban Six-lane divided Off-ramps: four lanes, on-ramps: two lanes 45 mph Yes Yes")

201 Site 18, Baseline Road/I-10 Ramp Crossings Location Summary Type of Count Area Type (Urban-Suburban/Rural) Major Facility Type (Baseline Road) Minor Facility Type (I-10 ramps) Posted Speed Limit Pedestrian Facilities Lighting Bus Stop Locations (within ¼ mile) Crosswalks Bicycle Facilities 48-hour video Urban-Suburban Six-lane divided Off-ramps: four lanes, on-ramps: two lanes 45 mph Yes Yes Yes Yes No Site Photo N I-10 W Baseline Rd Data Summary Video data collection was conducted on Baseline Road at the I-10 westbound ramps on Wednesday, December 13 and Thursday, December 14, Count data for Baseline Road at the I-10 eastbound was collected on Wednesday, November 15, 2017, and Thursday, November 16, Data were collected on different dates because of an equipment malfunction. During all data collection periods, most pedestrians and bicyclists traveled Baseline Road on both the north and south sides of the street. Pedestrian volumes on the north side of the street ranged from 129 to 228 persons per day. On the south side of Baseline Road, pedestrian volumes ranged from 110 to 155 persons per day. Bicyclist volumes were lower, and ranged from 47 to 63 bicyclists crossing the north legs of the intersection, and 28 to 50 bicyclists crossing the south leg of the interchange. ADOT Bicyclist and Pedestrian Count Strategy Plan 198
202 Site 18, Baseline Road/I-10 Ramp Crossing, Westbound Ramps Count date: December 13, 2017 Count date: December 14, 2017 ADOT Bicyclist and Pedestrian Count Strategy Plan 199
203 Site 18, Baseline Road/I-10 Ramp Crossing, Eastbound Ramps Count date: November 15, 2017 Count date: November 16, 2017 ADOT Bicyclist and Pedestrian Count Strategy Plan 200
 Minor Facility Type Posted Speed Limit Pedestrian Facilities Lighting Bus Stop Locations (within ¼ mile) Crosswalks Bicycle")


204 Site 125, North College Avenue, north of Curry Road Location Summary Type of Count Area Type (Urban-Suburban/Rural) Major Facility Type (College Avenue) Minor Facility Type Posted Speed Limit Pedestrian Facilities Lighting Bus Stop Locations (within ¼ mile) Crosswalks Bicycle Facilities Long-duration tube count Urban-Suburban Two-lane divided N/A 35 mph Yes Yes Yes N/A Bike lanes Site Photo N Note: Pneumatic tube placement shown in red. Data Summary Counts were conducted from Thursday, October 12, 2017, to Wednesday, January 31, On Saturday, October 22, 2017, an Ironman event affected the bicycle count in the southbound direction, which recorded a count of 1,936 bicyclists that day. It did not affect the count in the opposite direction. A summary of the data is as follows: ADOT Bicyclist and Pedestrian Count Strategy Plan 201
 o Saturday, October 21, 2017 (75 bicyclists) o Thursday, November 09,")
 o Saturday, October 28, 2017 (141 bicyclists) o Saturday, October")
205 Northbound College Avenue Total Traffic for the Period Analyzed: 4,992 bicyclists Daily Average: 45 bicyclists o Weekdays: 43 bicyclists / Weekend days: 50 bicyclists Monthly Average: 1,357 bicyclists Busiest Day of the Week: Saturday Busiest Days of the Period Analyzed: o Saturday, October 28, 2017 (116 bicyclists) o Saturday, October 21, 2017 (75 bicyclists) o Thursday, November 09, 2017 (69 bicyclists) Southbound College Avenue Total Traffic for the Period Analyzed: 7,932 bicyclists Daily Average: 71 bicyclists o Weekdays: 51 / Weekend days: 121 bicyclists Monthly Average: 2,156 bicyclists Busiest Day of the Week: Sunday Busiest Days of the Period Analyzed: o Sunday, October 22, 2017 (1,936 bicyclists) o Saturday, October 28, 2017 (141 bicyclists) o Saturday, October 21, 2017 (84 bicyclists) SB North College Ave Tube Installation, North of Curry Rd NB North College Ave Tube installation, North of Curry Rd ADOT Bicyclist and Pedestrian Count Strategy Plan 202
206 Site 125, North College Avenue, north of Curry Road, Northbound Note: Tubes 08_IN refers to count data in the northbound direction, Tubes 08_OUT refers to count data in the southbound direction. ADOT Bicyclist and Pedestrian Count Strategy Plan 203
207 Site 125, North College Avenue, north of Curry Road, Southbound Note: Tubes 9_IN refers to count data in the southbound direction, Tubes 9_OUT refers to count data in the northbound direction. ADOT Bicyclist and Pedestrian Count Strategy Plan 204
208 Tucson and Pima County Counts were conducted at nine locations in the Tucson area: Site 2, SR 77/River Road This site was identified as high pedestrian crash location in the ADOT Pedestrian Safety Action Plan (2017). Site 3, SR 77/Ina Road This site was identified as a high pedestrian crash location in the ADOT 2017 Pedestrian Safety Action Plan. Site 46, SR 86/Mission Road This intersection was identified as a high-crash segment in the ADOT Pedestrian Safety Action Plan (2017). Site 47, SR 77/Orange Grove Road This was a focus area intersection in the ADOT 2012 Bicycle Safety Action Plan (2009). Site 73, SR 210 Shared-Use Path/Park Avenue This is a lengthy shared-use path which serves multiple activity areas. Site 83, I-10/St. Mary s Road This site is located within a Bicycle Safety Action Plan focus area. Site 122, Julian Wash Greenway Path, at Littletown Rd This site is located on U.S. Bicycle Route 90. Site 123, Santa Cruz River Park Path, north of Speedway Blvd This site is located on U.S. Bicycle Route 90. Site 136, SR 77, north of Greenock Drive This location is on the El Tour de Tucson bicycle route. The data collected at each of these sites are summarized on the following pages. ADOT Bicyclist and Pedestrian Count Strategy Plan 205
 Crosswalks Bicycle Facilities 48-hour video data collection Urban-Suburban Six-lane divided Four-Lane Divided 45 mph Yes Yes Yes Yes Striped")

209 Site 2, SR 77 (Oracle Road) / River Road Location Summary Type of Count Area Type (Urban-Suburban/Rural) Major Facility Type (SR 77) Minor Facility Type (River Rd) Posted Speed Limit Pedestrian Facilities Lighting Bus Stop Locations (within ¼ mile) Crosswalks Bicycle Facilities 48-hour video data collection Urban-Suburban Six-lane divided Four-Lane Divided 45 mph Yes Yes Yes Yes Striped shoulder on SR 77, bike lane on River Rd Site Photo N Oracle Rd N River Rd Data Summary Video data collection was conducted on Monday, December 18 and Tuesday, December 19, Pedestrian volumes were observed crossing all approaches of the intersection. Pedestrian volumes ranged from a high volume of 81 pedestrians per day crossing the east leg of the intersection to a low volume of 36 pedestrians per day crossing the north leg of the intersection. ADOT Bicyclist and Pedestrian Count Strategy Plan 206
210 Bicyclist volumes were observed to be generally higher on SR 77 (Oracle Road). Bicyclist volumes ranged from a high of 32 bicyclists per day crossing the west leg of the intersection to a low of 9 bicyclists per day crossing the north leg of the intersection. Site 2, SR 77 (Oracle Road) / River Road Count date: December 18, 2017 Count date: December 19, 2017 ADOT Bicyclist and Pedestrian Count Strategy Plan 207
 Posted Speed Limit 45 mph Pedestrian Facilities Yes Lighting Yes Bus Stop Locations (within ¼ mile) Yes Crosswalks Yes Bicycle Facilities Paved shoulders Site Photo N Ina")
.")
211 Site 3, SR 77 (Oracle Road) / Ina Road Location Summary Type of Count 48-hour video Area Type (Urban-Suburban/Rural) Urban-Suburban Major Facility Type Six-Lane Divided (SR 77) Minor Facility Type Four-Lane Divided (Ina Road) Posted Speed Limit 45 mph Pedestrian Facilities Yes Lighting Yes Bus Stop Locations (within ¼ mile) Yes Crosswalks Yes Bicycle Facilities Paved shoulders Site Photo N Ina Rd Data Summary Video data collection was conducted at the intersection on Thursday, November 16 and Friday, November 17, The highest number of pedestrians crossed the west leg of the intersection (132 pedestrians). A large transit stop on the west side of SR 77, just south of the intersection, may attract higher pedestrian volumes. A higher number of bicyclists crossed the west leg of the intersection as compared to the east leg. ADOT Bicyclist and Pedestrian Count Strategy Plan 208
212 Site 3, SR 77 (Oracle Road)/Ina Road Count Date: November 16, 2017 Count Date: November 17, 2017 ADOT Bicyclist and Pedestrian Count Strategy Plan 209
 Crosswalks Bicycle Facilities 48-hour video Urban-Suburban Five-lane roadway with TWLTL Four-lane divided 45 mph Yes Yes Yes Yes")

213 Site 46, SR 86 (Ajo Way)/Mission Road Location Summary Type of Count Area Type (Urban-Suburban/Rural) Major Facility Type (Ajo Way/SR 86) Minor Facility Type (Mission Road) Posted Speed Limit Pedestrian Facilities Lighting Bus Stop Locations (within ¼ mile) Crosswalks Bicycle Facilities 48-hour video Urban-Suburban Five-lane roadway with TWLTL Four-lane divided 45 mph Yes Yes Yes Yes Paved shoulder Site Photo N Mission Rd Ajo Way Data Summary Video data collection was conducted on Thursday, November 16 and Friday, November 17, Pedestrian volumes were highest crossing the south leg of the intersection, ranging from 114 to 140 pedestrians per day. Bicyclist volumes were relatively low on the first day of data collection on Thursday, November 16, but were higher on Friday, November 17. Most of the bicyclists used Mission Road. ADOT Bicyclist and Pedestrian Count Strategy Plan 210
214 Site 46, SR 86 (Ajo Way)/Mission Road Count Date: November 16, 2017 Count Date: November 17, 2017 ADOT Bicyclist and Pedestrian Count Strategy Plan 211
 Crosswalks Bicycle Facilities 48-hour video Urban-Suburban Six-lane divided Four-lane divided 45 mph Yes Yes Yes Yes")

215 Site 47, SR 77 (Oracle Road) / Orange Grove Road Location Summary Type of Count Area Type (Urban-Suburban/Rural) Major Facility Type (SR 77/Oracle Rd) Minor Facility Type (Orange Grove Road) Posted Speed Limit Pedestrian Facilities Lighting Bus Stop Locations (within ¼ mile) Crosswalks Bicycle Facilities 48-hour video Urban-Suburban Six-lane divided Four-lane divided 45 mph Yes Yes Yes Yes Paved shoulder Site Photo N Orange Grove Rd Data Summary Video data collection was conducted at this intersection on Thursday, November 16 and Friday, November 17, Pedestrian volumes were similar on both data collection days, and ranged from 68 to 99 pedestrians per day. Bicyclist crossing volumes ranged from 4 to 18 bicyclists per day. ADOT Bicyclist and Pedestrian Count Strategy Plan 212
216 Site 47, SR 77 (Oracle Road)/Orange Grove Road Count Date: November 16, 2017 Count Date: November 17, 2017 ADOT Bicyclist and Pedestrian Count Strategy Plan 213
 Crosswalks Bicycle Facilities 48-hour video count")


217 Site 73, SR 210 Shared-Use Path/Park Avenue Location Summary Type of Count Area Type (Urban-Suburban/Rural) Major Facility Type Minor Facility Type Posted Speed Limit Pedestrian Facilities Lighting Bus Stop Locations (within ¼ mile) Crosswalks Bicycle Facilities 48-hour video count Urban-Suburban Shared-Use Path N/A N/A N/A No No N/A Shared-Use Path Site Photo N Note: Video placement shown in red. Data Summary A 48-hour video count was conducted on this shared-use path to capture both bicyclist and pedestrian traffic. The counts were conducted on Thursday, November 16, 2017, and Friday, November 17, Daily pedestrian volumes ranged from 47 to 240 over the two-day period. Bicycle counts ranged from 127 to 158 bicycles per day. The Friday count was higher than the Thursday count, particularly for pedestrians. ADOT Bicyclist and Pedestrian Count Strategy Plan 214
218 Site 73, SR 210 Shared-Use Path/Park Avenue Count date: 11/16/ Average Daily Volume Bicycle Path Site Code 73 (11/16/2017) Pedestrians Bicycles Count date: 11/17/ Average Daily Volume Bicycle Path Site Code 73 (11/17/2017) Pedestrians Bicycles ADOT Bicyclist and Pedestrian Count Strategy Plan 215
 Minor Facility Type (I-10 Frontage Road) Posted Speed Limit Pedestrian Facilities Lighting Bus Stop Locations (within ¼ mile) Crosswalks Bicycle Facilities 48-hour video Urban-Suburban")

219 Site 83, I-10 Frontage Road/St. Mary s Road Location Summary Type of Count Area Type (Urban-Suburban/Rural) Major Facility Type (St. Mary s Road) Minor Facility Type (I-10 Frontage Road) Posted Speed Limit Pedestrian Facilities Lighting Bus Stop Locations (within ¼ mile) Crosswalks Bicycle Facilities 48-hour video Urban-Suburban Four-lane divided Varies 35 mph Yes Yes Yes Yes St. Mary s Road Bike lane Site Photo N Data Summary A 48-hour video count was conducted at this location on Thursday, November 9, 2017, and Friday, November 10, Pedestrian volumes were highest crossing the north legs of the interchange, and ranged from 77 to 88 pedestrians per day. Bicyclist volumes were relatively low at this location. The highest bicyclist crossing volume was 28 bicyclists per day crossing the north leg of the eastbound ramp crosswalk. ADOT Bicyclist and Pedestrian Count Strategy Plan 216
220 St. Mary s Road/I-10 Westbound ramps Count date: November 9, 2017 Count date: November 10, 2017 St. Mary s Road/I-10 Eastbound ramps ADOT Bicyclist and Pedestrian Count Strategy Plan 217
221 Count date: November 9, 2017 Count date: November 10, 2017 ADOT Bicyclist and Pedestrian Count Strategy Plan 218
 Crosswalks Bicycle Facilities 7-day tube count")


222 Site 122, Julian Wash Greenway Path, at Littletown Rd Location Summary Type of Count Area Type (Urban-Suburban/Rural) Major Facility Type Minor Facility Type Posted Speed Limit Pedestrian Facilities Lighting Bus Stop Locations (within ¼ mile) Crosswalks Bicycle Facilities 7-day tube count Urban-Suburban N/A N/A N/A No No No N/A Paved Shared-Use Path Site Photo N Littletown Rd Note: Pneumatic tube placement is shown in red. Data Summary Tube counts were conducted over a seven-day period from Wednesday, November 15 to Tuesday, November 21, This path appeared to be well used during both the weekend and weekdays. Use of the path peaked on Wednesday, November 15, 2017, when 89 bicyclists were recorded in both directions of travel. The average number of bicyclists for the week was 59 bicyclists per day in both directions. ADOT Bicyclist and Pedestrian Count Strategy Plan 219
223 Average Daily Volume (Cyclists/day) Site 122 (JULIAN WASH GREENWAY PATH EAST OF LITTLETOWN RD) Monday Tuesday Wednesday Thursday Friday Saturday Sunday Day of Week ADOT Bicyclist and Pedestrian Count Strategy Plan 220
 Crosswalks Bicycle Facilities")


224 Site 123, Santa Cruz River Park Path, north of Speedway Blvd Location Summary Type of Count Area Type (Urban-Suburban/Rural) Major Facility Type Minor Facility Type Posted Speed Limit Pedestrian Facilities Lighting Bus Stop Locations (within ¼ mile) Crosswalks Bicycle Facilities 7-day tube count Urban-Suburban N/A N/A N/A No No No N/A Paved Shared-Use Path Site Photo N Note: Pneumatic tube locations are shown in red. Data Summary Tube counts were conducted over a seven-day period from Wednesday, November 15 to Tuesday, November 21, Use of this shared-use path by bicyclists appeared to peak between Wednesday and Sunday. Bicyclist counts ranged from a high of 76 bicyclists per day on Wednesday, November 15 to a low of 35 bicyclists per day on Tuesday, November 21, ADOT Bicyclist and Pedestrian Count Strategy Plan 221
225 Average Daily Volume (Cyclists/day) Site 123 (SANTA CRUZ RIVER PARK PATH NORTH of W SPEEDWAY BLVD) Monday Tuesday Wednesday Thursday Friday Saturday Sunday Day of Week ADOT Bicyclist and Pedestrian Count Strategy Plan 222
 Crosswalks Bicycle Facilities 7-day tube count Urban-Suburban Six-lane")


226 Site 136, SR 77, north of Greenock Drive Location Summary Type of Count Area Type (Urban-Suburban/Rural) Major Facility Type (SR 77/Oracle Road) Minor Facility Type Posted Speed Limit Pedestrian Facilities Lighting Bus Stop Locations (within ¼ mile) Crosswalks Bicycle Facilities 7-day tube count Urban-Suburban Six-lane divided N/A 50 mph No No N/A No Paved shoulder Site Photo N Note: Pneumatic tube locations are shown in red. Data Summary Tube count data were collected for a seven-day period from Tuesday, December 19 to Monday, December 25, The number of bicyclists ranged from a high volume of 23 bicyclists per day (total of both directions) to a low of 4 bicyclists per day on Thursday, December 22, At this location, there was not a clearly defined weekday versus weekend change in the number of bicyclists. Thursday and Friday had a much lower number of bicyclists as compared to the rest of the week. ADOT Bicyclist and Pedestrian Count Strategy Plan 223
ADOT Statewide Bicycle and Pedestrian Program Summary of Phase IV Activities APPENDIX B PEDESTRIAN DEMAND INDEX
 ADOT Statewide Bicycle and Pedestrian Program Summary of Activities APPENDIX B PEDESTRIAN DEMAND INDEX May 24, 2009 Pedestrian Demand Index for State Highway Facilities Revised: May 29, 2007 Introduction
Ben Timerson, MnDOT Erik Minge, SRF Consulting Group Greg Lindsey, University of Minnesota
 Ben Timerson, MnDOT Erik Minge, SRF Consulting Group Greg Lindsey, University of Minnesota 2050 Vision Minnesota Go Multimodal transportation system maximizes the health of people, the environment and
The Traffic Monitoring Guide: Counting Bicyclists and Pedestrians. APBP 2017 June 28: 11:15am-12:45pm
 The Traffic Monitoring Guide: Counting Bicyclists and Pedestrians APBP 2017 June 28: 11:15am-12:45pm 2 Presentation Organization Why count bicyclists and pedestrians? Why report count data? What resources
NON-MOTORIZED TRANSPORTATION MONITORING PROGRAM
 NON-MOTORIZED TRANSPORTATION MONITORING PROGRAM Ohio Transportation Engineering Conference October 28 th, 2015 Presentation Content: Program Overview Manual Counts Automatic Counts Data storage Information
Bicyclist Safety Action Plan (BSAP) 2018 Update. Presentation by Michael Sanders February 28, 2018
 2018 Update. Presentation by Michael Sanders February 28, 2018") Bicyclist Safety Action Plan (BSAP) 2018 Update Presentation by Michael Sanders February 28, 2018 1 BSAP Update Objectives Evaluate effectiveness of 2012 BSAP to reduce frequency of bicyclist crashes Analyze
Bicyclist Safety Action Plan (BSAP) 2018 Update Presentation by Michael Sanders February 28, 2018 1 BSAP Update Objectives Evaluate effectiveness of 2012 BSAP to reduce frequency of bicyclist crashes Analyze
Summary of NWA Trail Usage Report November 2, 2015
 Summary of NWA Trail Usage Report November 2, 2015 Summary Findings: The study showed that Northwest Arkansas (NWA) had relatively high cyclist user counts per capita aggregated across the top three usage
Comparison of Turning Movement Count Data Collection Methods for a Signal Optimization Study. White Paper
 Comparison of Turning Movement Count Data Collection Methods for a Signal Optimization Study White Paper Grand Rapids Southfield Traverse City www.urscorp.com May 2011 Comparison of Turning Movement Count
MAG Town of Cave Creek Bike Study Task 6 Executive Summary and Regional Significance Report
 Page 1 MAG Town of Cave Creek Bike Study Task 6 Executive Summary and Regional Significance Report August 1, 2012 MAG Project #481 Page 2 Task 6 Executive Summary and Regional Significance Report Introduction
City of Elizabeth City Neighborhood Traffic Calming Policy and Guidelines
 City of Elizabeth City Neighborhood Traffic Calming Policy and Guidelines I. Purpose: The City of Elizabeth City is committed to ensure the overall safety and livability of residential neighborhoods. One
FHWA Resources for Pedestrian and Bicycle Professionals
 FHWA Resources for Pedestrian and Bicycle Professionals Charlie Zegeer, UNC Highway Safety Research Center/PBIC Libby Thomas, UNC Highway Safety Research Center Dan Nabors, Vanasse Hangen Brustlin (VHB)
2017 Northwest Arkansas Trail Usage Monitoring Report
 2017 Northwest Arkansas Trail Usage Monitoring Report Summary Findings: The study showed that average daily weekday bicycle volumes per study site increased by about 32% between 2015 and 2017, from 142
Toward Zero Deaths. Regional SHSP Road Show Meeting. Virginia Strategic Highway Safety Plan. presented by
 Toward Zero Deaths Regional SHSP Road Show Meeting presented by Virginia Strategic Highway Safety Plan December 1, 2016 1 Welcome & Introductions Purpose of the Meeting Objectives & Key Outcomes Agenda»
A Traffic Operations Method for Assessing Automobile and Bicycle Shared Roadways
 A Traffic Operations Method for Assessing Automobile and Bicycle Shared Roadways A Thesis Proposal By James A. Robertson Submitted to the Office of Graduate Studies Texas A&M University in partial fulfillment
TABLE OF CONTENTS. Executive Summary
 Executive Summary Background... ES-1 Pedestrian Network... ES-2 Bikeway Network... ES-2 Collision History... ES-2 Public Input... ES-4 Conclusions and Recommendations... ES-4 1. Introduction and Setting
URL:
 Title and Subtitle PEDESTRIAN AND BICYCLIST COUNTS AND DEMAND ESTIMATION STUDY Author(s) Benz, Robert J., Shawn Turner; and Teresa Qu Performing Organization Name and Address Texas A&M Transportation Institute
5. Pedestrian System. Accomplishments Over the Past Five Years
 5. Pedestrian System Accomplishments Over the Past Five Years The Alamo Area Metropolitan Planning Organization (MPO) and its partner agencies recognize the importance of improving pedestrian mobility.
Broad Street Bicycle Boulevard Design Guidelines
 Broad Street Bicycle Boulevard Design Guidelines Building from the strategies introduced in the 2013 Bicycle Transportation Plan and community input received thus far, City Transportation Staff have identified
CITY OF SAINT JOHN TRAFFIC CALMING POLICY
 CITY OF SAINT JOHN TRAFFIC CALMING POLICY VERSION: 1.0 April 10, 2012 Pedestrians, Cyclists and Motorists Sharing Street Spaces CONTENTS INTRODUCTION... 3 POLICY GOAL... 3 POLICY OBJECTIVES... 3 GUIDING
ADOT STATEWIDE. Pedestrian Plan UPDATE DRAFT FINAL REPORT
 ADOT STATEWIDE Bicycle and Pedestrian Plan UPDATE DRAFT FINAL REPORT JANUARY 2013 ADOT Statewide Bicycle and Pedestrian Plan Update DRAFT Final Report Revision 1 January 2013 Prepared for: ARIZONA DEPARTMENT
Bicycle Master Plan Goals, Strategies, and Policies
 Bicycle Master Plan Goals, Strategies, and Policies Mobilizing 5 This chapter outlines the overarching goals, action statements, and action items Long Beach will take in order to achieve its vision of
Building a bike friendly Chicago
 CASE STUDY Miovision Scout Building a bike friendly Chicago How video data is moving Chicago forward Chicago 2020 Becoming the Most Bike-Friendly City in the United States In 2011, Mayor Rahm Emanuel set
Multimodal Through Corridors and Placemaking Corridors
 68 Multimodal Through Corridors and Placemaking Corridors Corridors have different functions in a region. Some corridors are used to get smoothly and rapidly through a region or to get quickly to major
Traffic Parameter Methods for Surrogate Safety Comparative Study of Three Non-Intrusive Sensor Technologies
 Traffic Parameter Methods for Surrogate Safety Comparative Study of Three Non-Intrusive Sensor Technologies CARSP 2015 Collision Prediction and Prevention Approaches Joshua Stipancic 2/32 Acknowledgements
Chapter 2. Bellingham Bicycle Master Plan Chapter 2: Policies and Actions
 Chapter 2 Bellingham Bicycle Master Plan Chapter 2: Policies and Actions Chapter 2: Policies and Actions The Bicycle Master Plan provides a road map for making bicycling in Bellingham a viable transportation
Chapter 5 DATA COLLECTION FOR TRANSPORTATION SAFETY STUDIES
 Chapter 5 DATA COLLECTION FOR TRANSPORTATION SAFETY STUDIES 5.1 PURPOSE (1) The purpose of the Traffic Safety Studies chapter is to provide guidance on the data collection requirements for conducting a
Pedestrian Project List and Prioritization
 To: Kyle Wagenschutz, City of Memphis CC: From: Anne Conlon and John Cock, Alta Planning + Design Date: December, 2014 Re: Project List Development (Task 3.1-3.2) and Project List Prioritization (Task
APPENDIX A: Complete Streets Checklist DRAFT NOVEMBER 2016
 APPENDIX A: Complete Streets Checklist DRAFT NOVEMBER 2016 Complete Streets Checklist MetroPlan Orlando s Complete Streets Checklist is an internal planning tool for staff to further implementation of
PRELIMINARY DRAFT FIRST AMENDMENT TO VISION 2050: A REGIONAL LAND USE AND TRANSPORTATION PLAN FOR SOUTHEASTERN WISCONSIN
 PRELIMINARY DRAFT FIRST AMENDMENT TO VISION 2050: A REGIONAL LAND USE AND TRANSPORTATION PLAN FOR SOUTHEASTERN WISCONSIN ESTABLISHING TARGETS FOR FEDERAL PERFORMANCE MEASURES: HIGHWAY SAFETY SOUTHEASTERN
City of San Diego Vision Zero Draft Strategic Plan FY 2017
 City of San Diego Vision Zero Draft Strategic Plan FY 2017 Engineering Objective: To develop and implement a strategy that employs best planning, design and engineering practices. Background: Over the
Executive Summary. September 3, 2014
 D Executive Summary September 3, 2014 Study Background and Purpose Citizens for Picture Rocks is a community advocacy group representing the Picture Rocks Fire Department, Pima County Sheriff s Department,
REGIONAL BICYCLE AND PEDESTRIAN DESIGN GUIDELINES
 REGIONAL BICYCLE AND PEDESTRIAN DESIGN GUIDELINES November 16, 2011 Deb Humphreys North Central Texas Council of Governments Bicycle and Pedestrian Advisory Committee Snapshot of the Guide 1. Introduction
Bicycle and Pedestrian Data Collection Manual Draft
 View the updated report: BICYCLE AND PEDESTRIAN DATA COLLECTION MANUAL Authors: Erik Minge, Cortney Falero, Greg Lindsey, Michael Petesch and Tohr Vorvick Report Number: MN/RC 2017-03 Published: January
Neighborhood Traffic Calming Policy & Guidelines
 Policy & Guidelines Town of Lantana 500 Greynolds Circle Lantana, FL 33462-4594 Index Topic Page Introduction 3 Definitions 4 Objectives 5 Policies 5 Process 6 Phases of Traffic Calming Study 7 Rating
ACTIVE TRANSPORTATION
 ACTIVE TRANSPORTATION Mobility 2040 Supported Goals Improve the availability of transportation options for people and goods. Support travel efficiency measures and system enhancements targeted at congestion
The Corporation of the City of Sarnia. School Crossing Guard Warrant Policy
 The Corporation of the City of Sarnia School Crossing Guard Warrant Policy Table of Contents Overview And Description... 2 Role of the School Crossing Guard... 2 Definition of a Designated School Crossing...
ENHANCED PARKWAY STUDY: PHASE 2 CONTINUOUS FLOW INTERSECTIONS. Final Report
 Preparedby: ENHANCED PARKWAY STUDY: PHASE 2 CONTINUOUS FLOW INTERSECTIONS Final Report Prepared for Maricopa County Department of Transportation Prepared by TABLE OF CONTENTS Page EXECUTIVE SUMMARY ES-1
Tulsa Metropolitan Area LONG RANGE TRANSPORTATION PLAN
 Tulsa Metropolitan Area LONG RANGE TRANSPORTATION PLAN Indian Nations Council of Governments August 2005 CONTACTING INCOG In developing the Destination 2030 Long Range Transportation Plan, INCOG s Transportation
IMPROVING PEDESTRIAN SAFETY AT UNCONTROLLED CROSSINGS. Guidelines for Marked Crosswalks
 IMPROVING PEDESTRIAN SAFETY AT UNCONTROLLED CROSSINGS Presented by Nazir Lalani P.E. Traffex Engineers Inc. N_lalani@hotmail.com Guidelines for Marked Crosswalks Source: FHWA, Safety Effects of Marked
Chapter 3 DESIGN SPECIFICATIONS
 Brampton PathWays Planning and Design Guidelines 27 Chapter 3 DESIGN SPECIFICATIONS 3.1 CLASS 1 MULTI-USE PATH Off-road multi-use trails are the backbone of the Brampton PathWays Network. They are typically
Pedestrian Safety and the Highway Safety Improvement Program
 Pedestrian Safety and the Highway Safety Improvement Program Karen Scurry, FHWA Office of Safety Kohinoor Kar, Arizona Department of Transportation David Cohen, FHWA California Division March 13, 2014
Gordon Proctor Director Policy on Accommodating Bicycle and Pedestrian Travel on ODOT Owned or Maintained Facilities
 Approved: Policy: 20-004(P) Responsible Office: Planning Gordon Proctor Director Policy on Accommodating Bicycle and Pedestrian Travel on ODOT Owned or Maintained Facilities I. POLICY STATEMENT: This policy
Closing Plenary Session
 TRAFFIC SAFETY CONFERENCE Closing Plenary Session June 9, 2017 Las Colinas, TX Order of Report Out June 9, 2017 Las Colinas, TX Distracted Driving Prioritized Countermeasures Countermeasure 4a Systemically
The Florida Bicycle and Pedestrian Partnership Council
 The Florida Bicycle and Pedestrian Partnership Council Input to the Update of the Florida Transportation Plan March 2015 This document presents input from the Florida Bicycle and Pedestrian Advisory Council
SAN FRANCISCO MUNICIPAL TRANSPORTATION AGENCY
 THIS PRINT COVERS CALENDAR ITEM NO. : 11 DIVISION: Sustainable Streets BRIEF DESCRIPTION: SAN FRANCISCO MUNICIPAL TRANSPORTATION AGENCY Approving traffic modifications on Twin Peaks Boulevard between Christmas
Pedestrian Crossing Guidelines 2016
 Pedestrian Crossing Guidelines 2016 Engineering Services 1.0 Introduction and Background The City of Kingston s first Pedestrian Crossing Guidelines were approved by Council in 2008 in order to provide
Complete Street Analysis of a Road Diet: Orange Grove Boulevard, Pasadena, CA
 Complete Street Analysis of a Road Diet: Orange Grove Boulevard, Pasadena, CA Aaron Elias, Bill Cisco Abstract As part of evaluating the feasibility of a road diet on Orange Grove Boulevard in Pasadena,
City of Novi Non-Motorized Master Plan 2011 Executive Summary
 City of Novi Non-Motorized Master Plan 2011 Executive Summary Prepared by: February 28, 2011 Why Plan? Encouraging healthy, active lifestyles through pathway and sidewalk connectivity has been a focus
Four Approaches to Starting a Successful Bike / Ped Counting Program
 Four Approaches to Starting a Successful Bike / Ped Counting Program 9/6/2018 Jean-Francois Rheault, Eco-Counter for 2018 Joint Policy Conference: Connecting the DOTs What is the Eco-Counter perspective?
2.0 LANE WIDTHS GUIDELINE
 2.0 LANE WIDTHS GUIDELINE Road Engineering Design Guidelines Version 2.0.1 May 2018 City of Toronto, Transportation Services City of Toronto Page 0 Background In early 2014, Transportation Services initiated
Bicycle Counts Using Pneumatic Tubes
 Bicycle Counts Using Pneumatic Tubes Krista Nordback, Ph.D., P.E. Miguel Figliozzi, Ph.D. Sirisha Kothuri, Ph.D. Taylor Phillips Andrew Schrope Carson Gorecki SPR 772 TREC and Civil & Environmental Eng.
NJDOT Complete Streets Checklist
 Background The New Jersey Department of Transportation s Complete Streets Policy promotes a comprehensive, integrated, connected multi-modal network by providing connections to bicycling and walking trip
Speed Management Action Plan
 Speed Management Action Plan National Selection Criteria Criteria Description Fatalities The number of fatalities resulting from speeding-related crashes. Percentage Compares total fatalities in each State
National Bicycle and Pedestrian Documentation Project Conducting Counts
 National Bicycle and Pedestrian Documentation Project Conducting Counts Alta Planning + Design What is the NBPD? Annual bicycle and pedestrian count and survey effort A cooperative effort between Alta
Appendix 3 Roadway and Bike/Ped Design Standards
 Appendix 3 Roadway and Bike/Ped Design Standards OTO Transportation Plan 2040 4/20/2017 Page A3-1 Adopted Standards The adopted OTO Design Standards and Major Thoroughfare Plan are contained herein.
Bicycle and Pedestrian Counts at Signalized Intersections Using Existing Infrastructure
 Bicycle and Pedestrian Counts at Signalized Intersections Using Existing Infrastructure Opportunities and Challenges Sirisha Kothuri, Krista Nordback, Andrew Schrope, Taylor Phillips, and Miguel Figliozzi
Instructions for Counting Pedestrians at Intersections. September 2014
 Instructions for Counting Pedestrians at Intersections September 2014 Purpose This document introduces the concept of the pedestrian count and provides instructions for performing a manual intersection
Transportation Curriculum. Survey Report
 Transportation Curriculum Survey Report Jennifer Dill, Ph.D. Lynn Weigand, Ph.D. Portland State University Center for Urban Studies Center for Transportation Studies Initiative for Bicycle and Pedestrian
Memorandum. Exhibit 60 SSDP To: Jenny Bailey, Senior Planner. From: Bill Schultheiss, P.E. (WA. P.E. #46108) Date: June 20, 2017
 Date: June 20, 2017") Memorandum To: Jenny Bailey, Senior Planner From: Bill Schultheiss, P.E. (WA. P.E. #46108) Date: June 20, 2017 Re: East Lake Sammamish Trail, Segment 2B Review King County has asked Toole Design Group
Memorandum To: Jenny Bailey, Senior Planner From: Bill Schultheiss, P.E. (WA. P.E. #46108) Date: June 20, 2017 Re: East Lake Sammamish Trail, Segment 2B Review King County has asked Toole Design Group
Appendix B: Forecasting and Traffic Operations Analysis Framework Document
 Existing Conditions Report - Appendix Appendix B: Forecasting and Traffic Operations Analysis Framework Document This document defines the methodology and assumptions that will be used in the traffic forecasting
BICYCLE AND PEDESTRIAN DATA COLLECTION MANUAL
 BICYCLE AND PEDESTRIAN DATA COLLECTION MANUAL Authors: Erik Minge, Cortney Falero, Greg Lindsey, Michael Petesch and Tohr Vorvick Report Number: MN/RC 2017-03 Published: January 2017 Minnesota Department
Exhibit 1 PLANNING COMMISSION AGENDA ITEM
 Exhibit 1 PLANNING COMMISSION AGENDA ITEM Project Name: Grand Junction Circulation Plan Grand Junction Complete Streets Policy Applicant: City of Grand Junction Representative: David Thornton Address:
USDOT Bicycle and Pedestrian Safety Initiative: Safer People and Safer Streets. Barbara McCann, USDOT Office of Policy
 { USDOT Bicycle and Pedestrian Safety Initiative: Safer People and Safer Streets Barbara McCann, USDOT Office of Policy 4 Steps from policy to practice Creating multi-modal streets means: 1. Change Decision-Making
TOWN OF PORTLAND, CONNECTICUT COMPLETE STREETS POLICY
 TOWN OF PORTLAND, CONNECTICUT COMPLETE STREETS POLICY I. VISION, GOALS & PRINCIPLES VISION To improve the streets of Portland making them safer and more accessible for all users including pedestrians,
An Analysis of Reducing Pedestrian-Walking-Speed Impacts on Intersection Traffic MOEs
 An Analysis of Reducing Pedestrian-Walking-Speed Impacts on Intersection Traffic MOEs A Thesis Proposal By XIAOHAN LI Submitted to the Office of Graduate Studies of Texas A&M University In partial fulfillment
4. ENVIRONMENTAL IMPACT ANALYSIS 9. TRANSPORTATION AND TRAFFIC
 4. ENVIRONMENTAL IMPACT ANALYSIS 9. TRANSPORTATION AND TRAFFIC 4.9.1 INTRODUCTION The following section addresses the Proposed Project s impact on transportation and traffic based on the Traffic Study
Chapter PERFORMANCE MEASURES AND ACCOUNTABILITY. Introduction
 PERFORMANCE MEASURES AND ACCOUNTABILITY Introduction Performance measures are helpful in evaluating the progress being made toward achieving the goals and objectives of the Gateway Bicycle Plan. The Plan
SCHOOL CROSSING PROTECTION CRITERIA
 CITY OF MADISON TRAFFIC ENGINEERING SCHOOL CROSSING PROTECTION CRITERIA AUGUST 1990 Adopted as Policy on August 31, 1976, by Common Council by Amended Resolution #29,540 Amended on September 14, 1976,
BIKE PLAN CONTENTS GATEWAY
 CONTENTS Acknowledgments...vii Great Rivers Greenway District Board of Directors... vii Great Rivers Greenway District Staff... vii Project Consultants... vii Committees... viii Citizens Advisory Committee
Pavement Markings (1 of 3)
") Pavement Markings (1 of 3) DESCRIPTION AND DEFINITION Disadvantages Relatively high cost (over typical Crash reduction as yet unknown painted edge line) No tactile effect The STOP AHEAD pavement marking
Pavement Markings (1 of 3) DESCRIPTION AND DEFINITION Disadvantages Relatively high cost (over typical Crash reduction as yet unknown painted edge line) No tactile effect The STOP AHEAD pavement marking
CITY OF BLOOMINGTON COMPLETE STREETS POLICY
 CITY OF BLOOMINGTON COMPLETE STREETS POLICY POLICY OBJECTIVE: The City of Bloomington will enhance safety, mobility, accessibility and convenience for transportation network users of all ages and abilities,
SCHOOL CROSSING PROTECTION CRITERIA
 CITY OF MADISON TRAFFIC ENGINEERING SCHOOL CROSSING PROTECTION CRITERIA January 2016 Adopted as Policy on August 31, 1976, by Common Council by Amended Resolution #29,540 Amended on September 14, 1976,
Bicycle and Pedestrian Planning in a Historically Car-Centric Culture: A Focus on Connectivity, Safety, & Accessibility
 Bicycle and Pedestrian Planning in a Historically Car-Centric Culture: A Focus on Connectivity, Safety, & Accessibility Kate Horton and Zylavian Watley Transportation Planners Memphis MPO Date: October
The Role of MPOs in Advancing Safe Routes to School through the Transportation Alternatives Program
 The Role of MPOs in Advancing Safe Routes to School through the Transportation Alternatives Program In 2012, Congress made changes to Federal funding for Safe Routes to School that gave some metropolitan
CITY MANUALS AND STANDARDS REVIEW
 GEORGETOWN SIDEWALK MASTER PLAN CITY MANUALS AND STANDARDS REVIEW RESOURCES AND STANDARDS As part of the Master Plan process, a review and evaluation of current City documents and policies relevant to
Why Zone In on Speed Reduction?
 Learn it. Do it. Live it! SPEED REDUCTION IN THE ZONE Why Zone In on Speed Reduction? Speeding is a serious issue that plays a major role in the risk of serious injury and pedestrian fatality in a crash.
900 BICYCLE FACILITIES Traffic Engineering Manual
 TABLE OF CONTENTS Part 9 - BICYCLE FACILITIES 900 GENERAL... 9-3 900-1 General Background... 9-3 900-2 Designated Bicycle Routes... 9-3 901 SIGNINGS... 9-4 902 MARKINGS... 9-4 902-1 General... 9-4 902-2
Bicycle - Motor Vehicle Collisions on Controlled Access Highways in Arizona
 Bicycle - Motor Vehicle Collisions on Controlled Access Highways in Arizona Analysis from January 1, 1991 to June 30, 2002 Richard C. Moeur, PE Traffic Design Manager, Northern Region Michelle N. Bina
PEDESTRIAN ACTION PLAN
 ATTACHMENT 2 CITY OF SANTA MONICA PEDESTRIAN ACTION PLAN CITY OF SANTA MONICA PEDESTRIAN ACTION PLAN This page intentionally left blank EXECUTIVE SUMMARY CHAPTER 1 EXECUTIVE SUMMARY Setting the Stage
DEPARTMENT OF ENVIRONMENTAL SERVICES. North Harrison Street (Lee Highway to Little Falls Road) Comparative Analysis. Prepared for:
 Comparative Analysis. Prepared for:") DEPARTMENT OF ENVIRONMENTAL SERVICES North Harrison Street (Lee Highway to Little Falls Road) Comparative Analysis Prepared for: Arlington County Department of Environmental Services 2100 Clarendon Boulevard,
DEPARTMENT OF ENVIRONMENTAL SERVICES North Harrison Street (Lee Highway to Little Falls Road) Comparative Analysis Prepared for: Arlington County Department of Environmental Services 2100 Clarendon Boulevard,
Double the amount of bicycle ridership while at the same time reducing the number of bicycle crashes by one-third.
 CHAPTER 6 Recommended Policies and Action Items To achieve the goals stated in Chapter 1 and guide implementation of the Bicycle Plan, policies and action items have been identified. They are presented
Document 2 - City of Ottawa Pedestrian Crossover (PXO) Program
 Program") 40 Document 2 - City of Ottawa Pedestrian Crossover (PXO) Program OVERVIEW The City of Ottawa Pedestrian Crossover (PXO) Program provides the basis for PXO implementation in Ottawa. The program s processes
40 Document 2 - City of Ottawa Pedestrian Crossover (PXO) Program OVERVIEW The City of Ottawa Pedestrian Crossover (PXO) Program provides the basis for PXO implementation in Ottawa. The program s processes
FEDERAL HIGHWAY ADMINISTRATION APPLICATION
 FEDERAL HIGHWAY ADMINISTRATION APPLICATION REQUEST FOR PERMISSION TO EXPERIMENT WITH A BICYCLE BOX INTERSECTION TREATMENT Submitted by: City of Columbus Department of Public Service Date: June 26, 2009
Chapter 9 Chapter 9 PEDESTRIAN AND BICYCLE VOLUME STUDIESVOLUME COUNT STUDY PURPOSE
 Chapter 9 Chapter 9 Formatted: Heading 1 PEDESTRIAN AND BICYCLE VOLUME STUDIESVOLUME COUNT STUDY Formatted: All caps 5.89.19.1 PURPOSE (1) The Pedestrian and bicycle volume studies arevolume Count Study
o n - m o t o r i z e d transportation is an overlooked element that can greatly enhance the overall quality of life for the community s residents.
 N o n - m o t o r i z e d transportation is an overlooked element that can greatly enhance the overall quality of life for the community s residents. 84 Transportation CHAPTER 11 INTRODUCTION Transportation
TRAFFIC IMPACT STUDY And A TRAFFIC SIGNAL WARRANT ANALYSIS FOR A SENIOR LIVING AND APARTMENT DEVELOPMENT
 TRAFFIC IMPACT STUDY And A TRAFFIC SIGNAL WARRANT ANALYSIS FOR A SENIOR LIVING AND APARTMENT DEVELOPMENT DEERFIELD TOWNSHIP, WARREN COUNTY, OHIO Nantucket Circle and Montgomery Road () Prepared for: ODLE
NM-POLICY 1: Improve service levels, participation, and options for non-motorized transportation modes throughout the County.
 Transportation PRINCE WILLIAM COUNTY 2008 COMPREHENSIVE PLAN NON-MOTORIZED PLAN CONTENTS Goals, Policies, and Action Strategies Table 4 (Bike Facility Classifications and Descriptions) Table 5 (Bike Facility
Active Transportation Facility Glossary
 Active Transportation Facility Glossary This document defines different active transportation facilities and suggests appropriate corridor types. Click on a facility type to jump to its definition. Bike
Omaha s Complete Streets Policy
 Omaha s Complete Streets Policy (Adopted August 2015) VISION To create great places and enhance our quality of life, the City of Omaha will provide safe, accessible streets for all users. Complete Streets
 MEMORANDUM Date: June 28, 2016 Project #: 19458 To: From: Project: Subject: Donna Gardino, FMATS Jackson Fox, City of Fairbanks Andrew Ooms, PE FMATS Pedestrian and Bicycle Count Program TAP Application
CITY OF WEST LAKE HILLS. Forest View Neighborhood Traffic Calming Study
 CITY OF WEST LAKE HILLS 901 South Mopac Expressway Building V, Suite 220 Austin, Texas 78746 Texas P.E. Firm Registration No. F-929 Klotz Associates Final Report Submittal: March 20, 2015 Revised Final
EXECUTIVE SUMMARY... vii 1 STUDY OVERVIEW Study Scope Study Area Study Objectives
 Contents EXECUTIVE SUMMARY... vii 1 STUDY OVERVIEW... 1-1 1.1 Study Scope... 1-1 1.2 Study Area... 1-1 1.3 Study Objectives... 1-3 2 EXISTING CONDITIONS... 2-1 2.1 Existing Freeway Conditions... 2-4 2.1.1
Florida s Intersection Safety Implementation Plan (ISIP)
") Florida Department of TRANSPORTATION Florida s Intersection Safety Implementation Plan (ISIP) Alan El-Urfali, PE State Traffic Engineering and Operations Office March 28, 2017 Intersection Safety Implementation
Florida Department of TRANSPORTATION Florida s Intersection Safety Implementation Plan (ISIP) Alan El-Urfali, PE State Traffic Engineering and Operations Office March 28, 2017 Intersection Safety Implementation
California Manual on Uniform Traffic Control Devices
 California Manual on Uniform Traffic Control Devices FHWA s MUTCD 2009 Edition as amended for use in California 2012 Edition State of California Business, Transportation and Housing Agency Department of
BUILDING CHINARAP. Zhang Tiejun Research Institute of Highway (RIOH) Beijing, China
 Beijing, China") BUILDING CHINARAP Zhang Tiejun Research Institute of Highway (RIOH) Beijing, China E-mail: tj.zhang@rioh.cn Greg Smith International Road Assessment Programme (irap) Beijing, China E-mail: greg.smith@irap.org
BUILDING CHINARAP Zhang Tiejun Research Institute of Highway (RIOH) Beijing, China E-mail: tj.zhang@rioh.cn Greg Smith International Road Assessment Programme (irap) Beijing, China E-mail: greg.smith@irap.org
ADOT BICYCLE AND PEDESTRIAN PLAN UPDATE ADOT MPD Task Assignment 21-11
 ADOT BICYCLE AND PEDESTRIAN PLAN UPDATE ADOT MPD Task Assignment 21-11 Date: Thursday, January 12, 2012 Time: 10:00 am 11:30 am Location: Board Room 206 S. 17 th Ave. Phoenix, Arizona ATTENDANCE Steering
University of Victoria Campus Cycling Plan Terms of Reference. 1.0 Project Description
 University of Victoria Campus Cycling Plan Terms of Reference 1.0 Project Description The Campus Cycling Plan, a first for the University, will provide a comprehensive and coordinated approach to support
UNCONTROLLED PEDESTRIAN CROSSING GUIDELINES
 City and County of Denver UNCONTROLLED PEDESTRIAN CROSSING GUIDELINES Prepared for: Prepared by: Adopted September 2016 This page is intentionally left blank. Contents for Denver Uncontrolled Pedestrian
Pedestrian, Bicycle and Traffic Calming Strategic Implementation Plan. January 18, 2011
 Pedestrian, Bicycle and Traffic Calming Strategic Implementation Plan January 18, 2011 Tonight s Agenda Receive update on project Provide feedback on two policy issues Complete Streets Policy Project Prioritization
Off-road Trails. Guidance
 Off-road Trails Off-road trails are shared use paths located on an independent alignment that provide two-way travel for people walking, bicycling, and other non-motorized users. Trails specifically along
Living Streets Policy
 Living Streets Policy Introduction Living streets balance the needs of motorists, bicyclists, pedestrians and transit riders in ways that promote safety and convenience, enhance community identity, create