outline 1. why cycle? 2. (safety health) 3. safe system 4. what next
|
|
|
- Shanon Russell
- 5 years ago
- Views:
Transcription
1
 3. safe system 4.")
2 outline 1. why cycle? 2. (safety health) 3. safe system 4. what next


3 In a city of many cyclists, why do they ride? Copenhageners reasons for cycling to and from work (multiple answers) 56% it s faster 37% more convenient 29% healthy 26% inexpensive 12% well-being, good start to day 9% new job/ relocation 5% environmental concerns
4
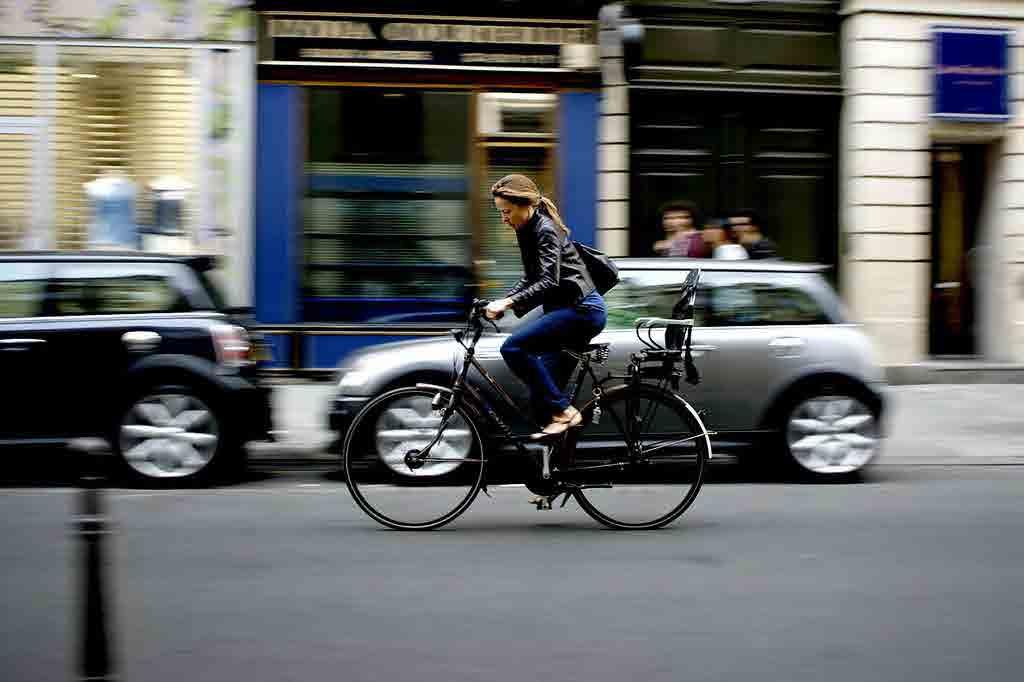
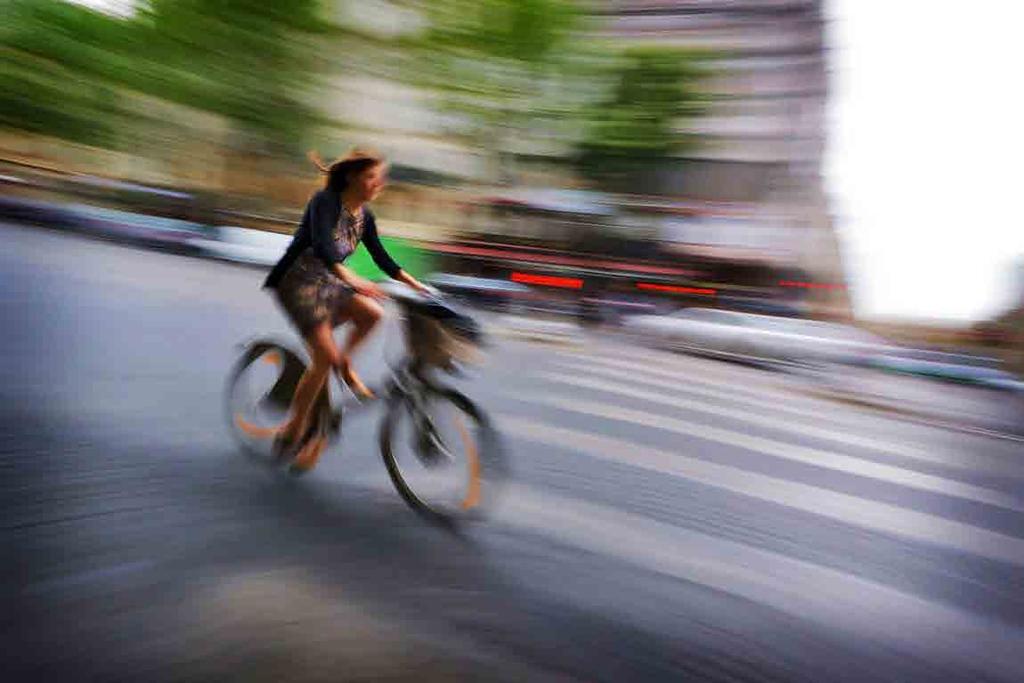
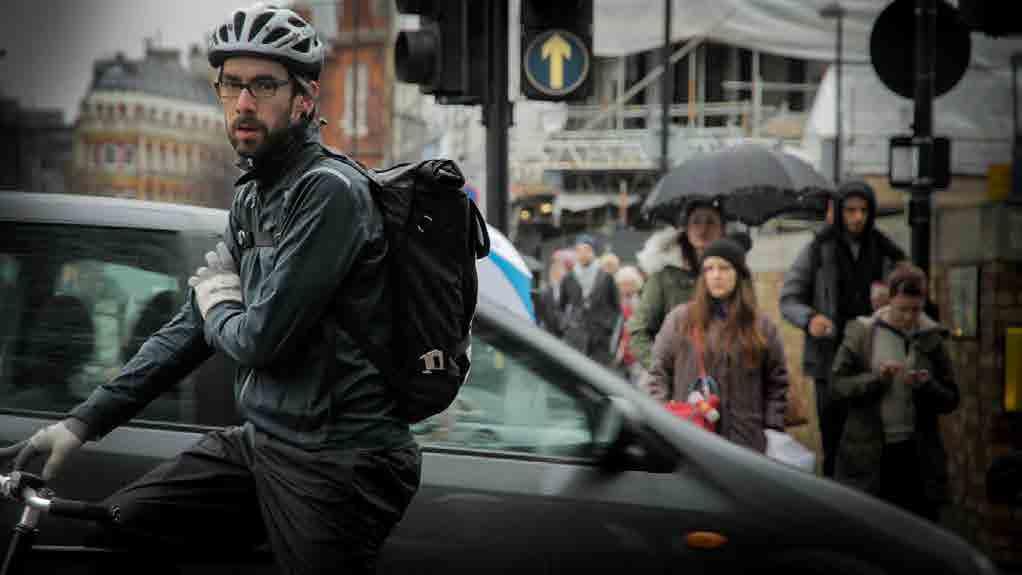
5 for people in a hurry
6
7
8 10-15 km/hr Average speed in European urban centres at peak periods km/hr (Dublin) 15 km/hr (Lyon) 15.5 km/hr (Copenhagen)
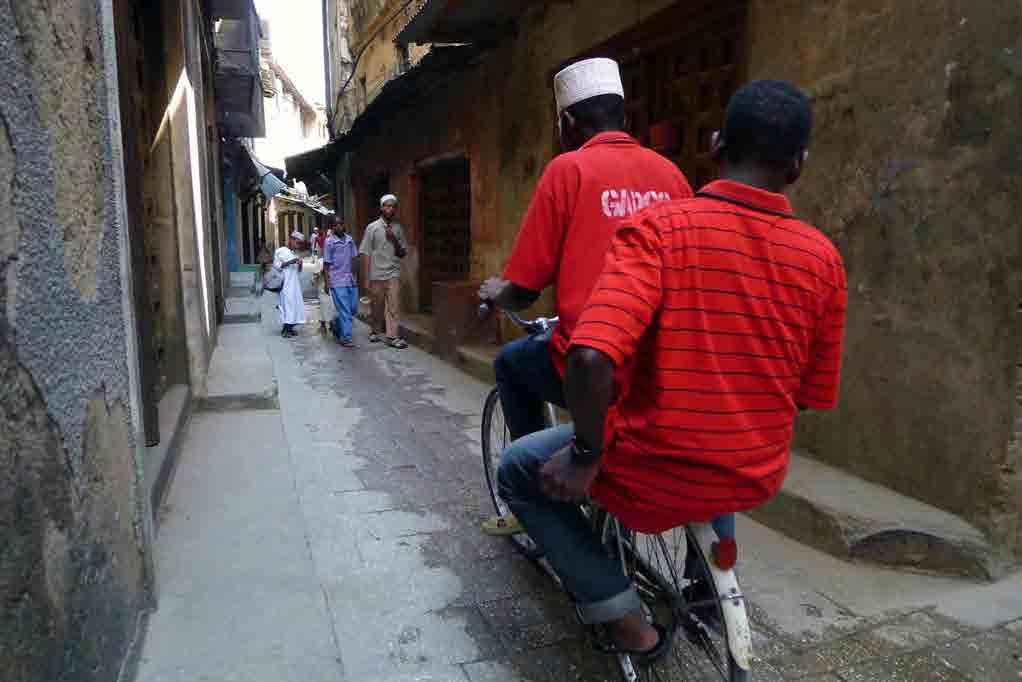
9 for people who can t afford to be late
10
11 for local shops
12 Revenue in Copenhagen shops and supermarkets by mode of transport (DKK billion/yr)
 76 61 66")
13 Expenditure, Portland (shops, restaurants,bars) by mode of transport (USD person/month)

14 Retail revenue per square foot and per hour of occupied parking, Melbourne, AUS. $A 0.69 $A 0.19 Lee, 2008

15 2011 Salt Lake City, USA S 3rd & S 300th ,

16 2015 Salt Lake City, USA S 3rd & S 300th , South Street Reconfiguration +30% -30% +9% $ P
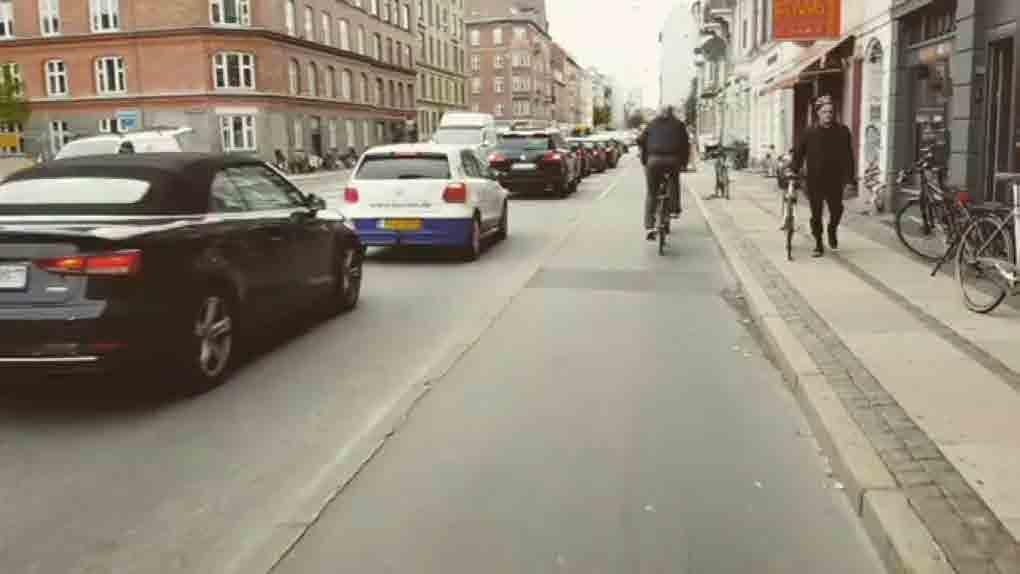
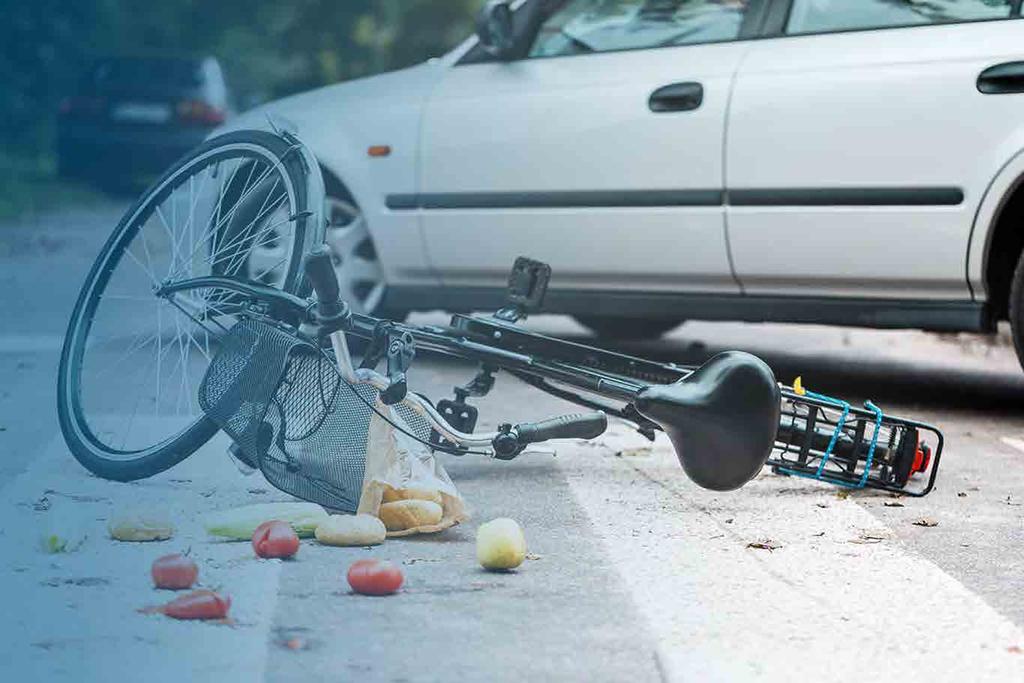
17 for safety?
18 Road fatalities, changes from to % Madrid Warsaw Dublin City Copenhagen Inner London Barcelona Greater London Auckland The Hague Zürich Calgary Melbourne Rome Vancouver Montreal Stockholm Berlin Paris City Brussels Paris area Edmonton New York City -49% -47% -36% -30% -29% -26% -26% -25% -21% -21% -20% -19% -19% -18% -18% -18% -16% -15% -12% -7% -7% 0% City -10% -20% Whole country -30% -40% -50%
19
20 Modal shares of road fatalities, pedestrian bicycle powered-2-wheeler other road users Paris City Inner London Barcelona Madrid Dublin City Bogotá D.C. Stockholm Paris area Copenhagen The Hague Milan Greater London Fortaleza Warsaw Riga New York City Berlin Vancouver Buenos Aires Zürich Mexico City Rome Montreal Guadalajara Lisbon Brussels Edmonton Melbourne Calgary Auckland 0% 10% 20% 30% 40% 50% 60% 70% 80% 90% 100%

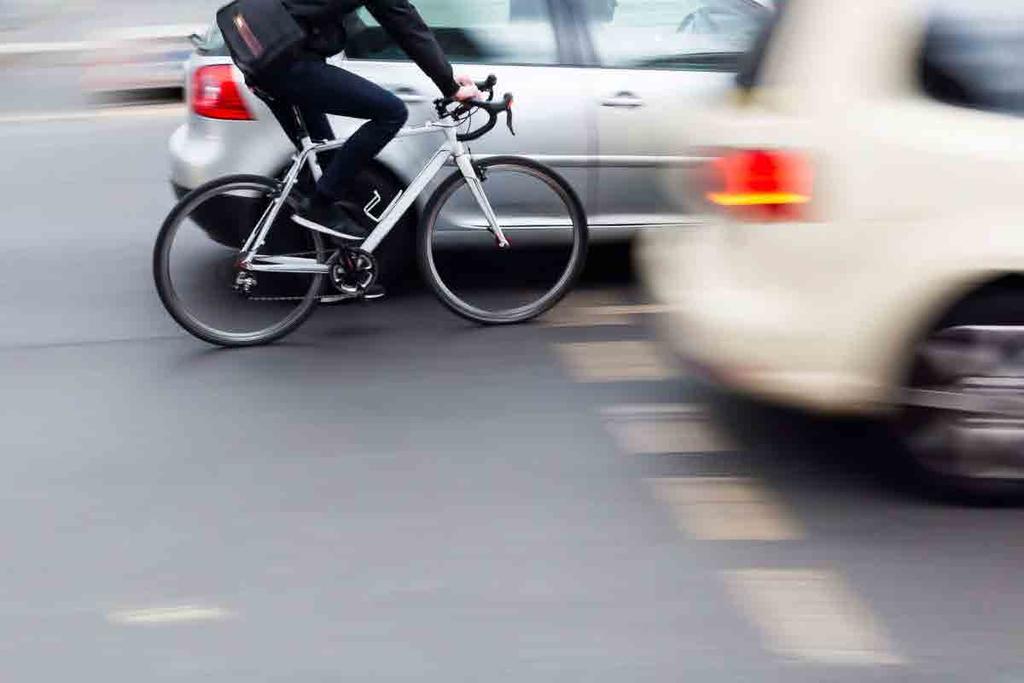
21 Relative risk by mode Relative risk of death/km bicycle vs. car 14 UK 11 Switzerland 6 Norway 6 Netherlands Relative risk of death/hr of travel: UK: 4 Belgium: 1
22 Risk of fatality per unit distance travelled, City Whole Country 161 fatalities per billion kilometre travelled Paris City The Hague Paris area Berlin Copenhagen Barcelona Inner London Greater London Auckland Calgary Vancouver Copenhagen Berlin The Hague Montreal Paris City Barcelona Paris area Greater London Inner London Calgary Auckland Buenos Aires Bogotá D.C. New York City Milan Barcelona Berlin Paris City Paris area Melbourne Inner London Copenhagen Brussels Greater London Auckland
23 Risk of fatality per unit distance travelled, City Whole Country 161 fatalities per billion kilometre travelled Paris City The Hague Paris area Berlin Copenhagen Barcelona Inner London Greater London Auckland Calgary Vancouver Copenhagen Berlin The Hague Montreal Paris City Barcelona Paris area Greater London Inner London Calgary Auckland Buenos Aires Bogotá D.C. New York City Milan Barcelona Berlin Paris City Paris area Melbourne Inner London Copenhagen Brussels Greater London Auckland
24 Risk of fatality per unit distance travelled, City Whole Country 161 fatalities per billion kilometre travelled Paris City The Hague Paris area Berlin Copenhagen Barcelona Inner London Greater London Auckland Calgary Vancouver Copenhagen Berlin The Hague Montreal Paris City Barcelona Paris area Greater London Inner London Calgary Auckland Buenos Aires Bogotá D.C. New York City Milan Barcelona Berlin Paris City Paris area Melbourne Inner London Copenhagen Brussels Greater London Auckland
25

26 Heavy vehicle collisions % fatal bicycle crashes involving truck, bus, coach 33% Ireland: 33% Denmark 25% Belgium 25% UK 20% Netherlands 20% France 12% Germany 11% Spain 4% Italy

27 Single crashes Single bicycle crashes e.g. with no crash opponent are significant and under-reported Single bicycle crash involvement as % of all bicycle crash victims Flanders/Brussels: 87% Belgium: 73% Netherlands: ~75%


28 Elderly cyclists The elderly are especially vulnerable % of all bicycle crash deaths 60yrs and older: Japan: 70% Korea: 65% Italy: 57% Netherlands: 55% Denmark: 49% France: 45% UK: 21%

29 Electric bicycles? After controlling for distance travelled and other potential confounders there is: no difference in crash likelihood and injury severity between EB and CB users crashes on EBs and CBs to be equally severe Schepers, P., Klein Wolt, K., Fishman, E. (2018)
30
31 Junctions and safety 3.2 km B A 13 minutes 11% of time in a junction

32 Junctions and safetye of fatal crashes 3.2 km B A 11% of time in a junction 29% 36% 35% EU Korea USA
33 EU Fatal crashes by hour and month absolute numbers, , n= Jan. Feb. Mar. Apr. May. Jun. Jul. Aug. Sep. Oct. Nov. Dec
34 EU Fatal crashes by hour and day of the week absolute numbers, , n= Mon Tue Wed Thu Fri Sat Sun
35 for safety health

36 Air pollution Accounting for ventilatory effort, cyclists register 2 to 8 times more pollutant intake than car occupants
 Osteoporosis Depression Impact greatest when 1st")
37 Health Cycling, as a moderate physical activity can significantly reduce mortality and morbidity due to: Cardiovascular disease Type-2 diabetes Cancer (Colon, breast) Osteoporosis Depression Impact greatest when 1st becoming active

38 on balance, the monetised benefits from improved health are up to 20x greater than the combined health impacts of crashes and exposure to air pollution
39

40 -15% Today s childrens cardiovascular fitness compared to 30 years ago G. Tomkinson et al, 2013
41 for the economy
42 Environment & climate Economy Social Affairs Energy + Resources Technology + Design Mobility Health Time + Space Diversity of cultures 513,190,000,000/yr Economic impact cycling, European Union Source: European Cyclists Federation

43 Copenhagen at peak hour Every kilometre cycled saves society 0.22 Every kilometre driven in a car costs society 0.76

44 Australia Every 20mn bicycle commute to work and back saves Australia more than AUD21

45 Utrecht The total social benefit of all kilometres cycled in Utrecht is 250 million
46 more, safer, cycling
47 Many authorities cannot adequately assess whether or not policies improve safety safety (crash rate) = crashes (#)? exposure (km, trips)?

48 (mis)reporting Police (official) records and hospital records do not concur. Under-reporting is significant and widespread, especially for less severe injury crashes. Austria bicycle injury crashes 2009: (police) (hospital) (total, adjusted)
49 Police registered vs. real Cyclist serious injuries Netherlands (3 yr. avg.) 7276 Actual number (Police and hospital) % Registered number (Police) %
50 Police registered vs. real Cyclist serious injuries Netherlands (3 yr. avg.) 7276 Actual number (Police and hospital) % Registered number (Police) %

51 Do we make cyclists safe in the current traffic system?

52 or do we make the traffic system safe for people cycling?
53 Do policies that increase the number of cyclists lead to more crashes?
54 Cycling fatalities and distance cycled by country Cycling fatalities per billion km cycled Distance cycled per year per inhabitant (km) Netherlands Denmark Germany Belgium Finland Switzerland Norway Austria Sweden Ireland Italy France United Kingdom USA
55 Cycling fatalities vs. distance cycled by city 64 fatalities per billion kilometre travelled y = x y = x Cycling Walking kilometres per person per year

56 Do policies that increase the number of cyclists lead to more crashes? Safety in numbers? or Numbers because of safety?
57
58
59
60

61 Safe system Functionality: Road design matches desired usage Homogeneity: Speed management, Separation Predictability: Avoid unexpected situations Forgivingness: Minimise crash outcomes

62 Safe system Functionality: Road design matches desired usage

63 Safe system Homogeneity: Speed management

64 Safe system Homogeneity: Speed management

65 Safe system Homogeneity: Separation: essential to manage crash risks at intersections or high traffic situations.

66 Safe system Homogeneity: Separation: essential to manage crash risks at intersections or high traffic situations.
67 Safe system Homogeneity: Separation: essential to manage crash risks at intersections or high traffic situations.

68 Safe system Homogeneity: Separation: essential to manage crash risks at intersections or high traffic situations.
69 Perceived safety Real safety

70 Continuous cycle network of high standard on routes and at intersections, improve cyclist safety, security and accessibility, and is thus an important basis for increasing bicycle use.

71 Safe system Predictability: Avoid unexpected situations

72 Safe system Forgivingness: Minimise crash outcomes
73 what next?
74 mobility in the city
75 walk cycle public transport car trucks/vans mobility in the city
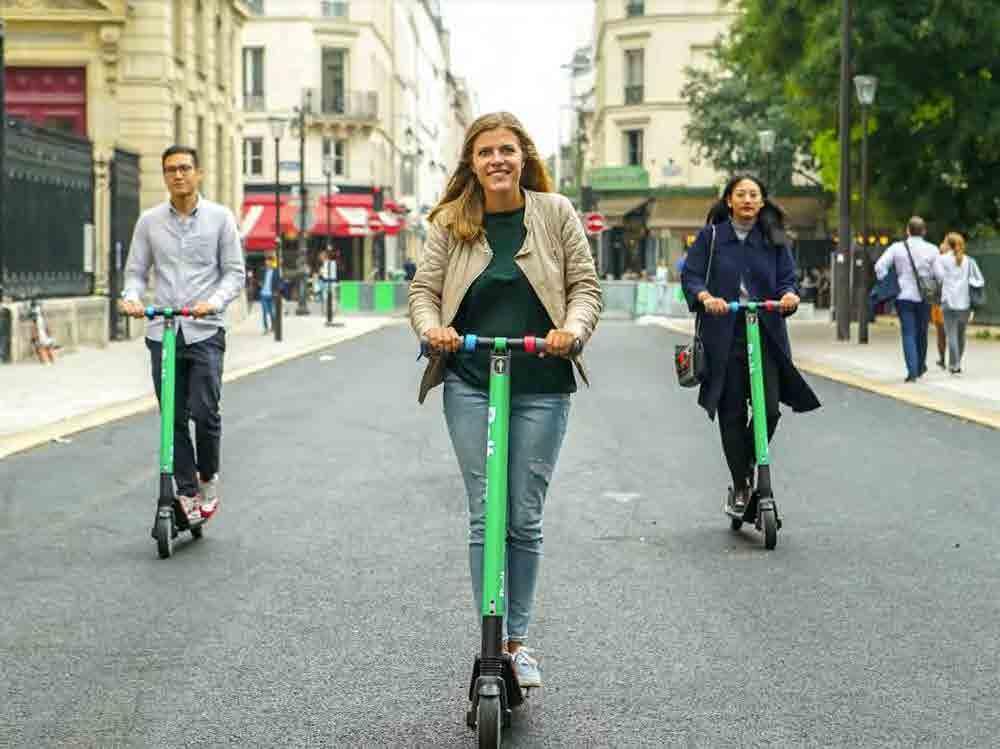
76 drones ride-sourcing scooter share trucks/vans walk bike share cycle public transport car share car mobility in the city on-demand public transport shared micro-mobility deliver-bots
77 drones ride-sourcing scooter share trucks/vans walk bike share cycle public transport car share digitilisation car on-demand public transport shared micro-mobility deliver-bots
78 drones ride-sourcing scooter share trucks/vans walk bike share cycle public transport car share automation car on-demand transit shared micro-mobility deliver-bots
79 drones ride-sourcing scooter share trucks/vans walk bike share cycle public transport car share car on-demand transit artificial intelligence shared micro-mobility deliver-bots


80 convergence

81

82 detected, not connected cyclist
83
84

85
86

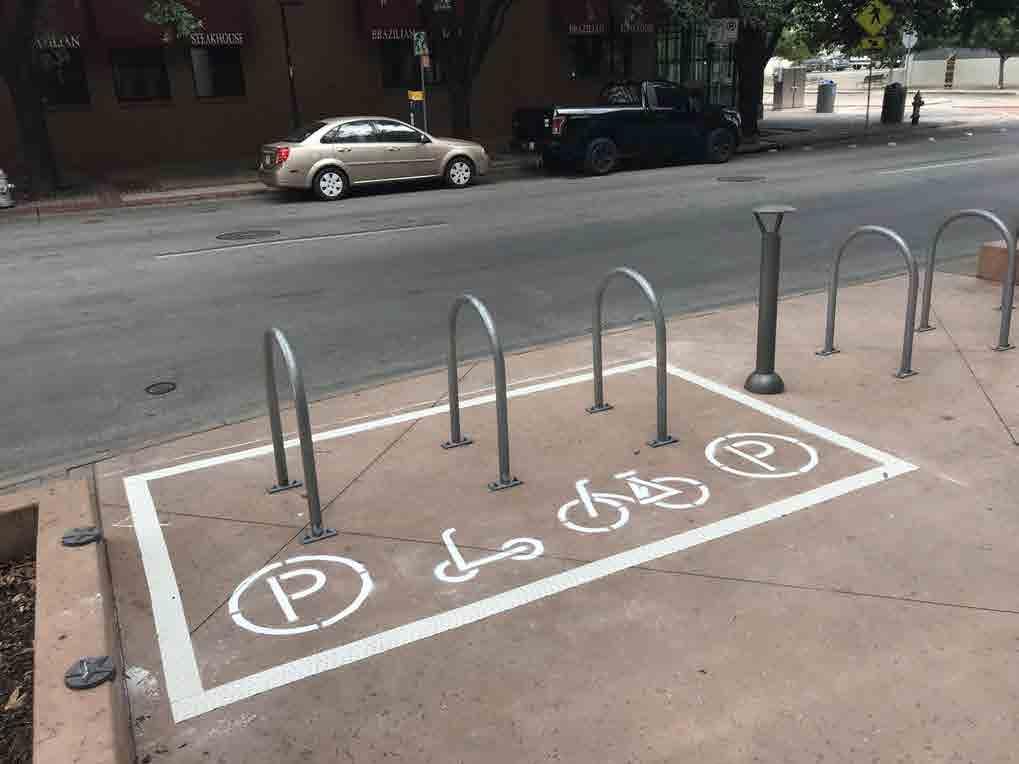
87 the curb: vehicle storage
88 the curb: flexible use zone Goods delivery Taxi/ride service Goods delivery
89 the curb: flexible use zone Bike share Goods delivery Services High-capacity public transport
90 the curb: flexible use zone Food truck Market Bike share Ride services Automated transit Ride services
91 the curb: flexible use zone Dining/leisure use Bike share Ride services Automated/on-demand transit Taxi/ride service

92 Sidewalk 9 000/hr Car storage On-street bikeway 1000/hr Mixed traffic lane frequent buses /hr Mixed traffic lane /hr Mixed traffic lane /hr Mixed traffic lane frequent buses /hr On-street bikeway 1000/hr Car storage Sidewalk 9000/hr

93 Sidewalk 9000/hr Separated bike track 4000/hr Mixed traffic with frequent micro-buses /hr High-capacity on-street bus or rail lane /hr per lane Automated vehicle lane /hr Separated bike track 4000/hr Sidewalk 9000/hr
94

95 When you prioritise active mobility, it makes getting around easier for everyone, including drivers. If you design a city for cars, it fails for everyone, including drivers Brent Toderian. TODERIAN UrbanWorks, former Director of City Planning, Vancouver
96

97

98
Transport statistics as exposure data in road safety analysis. Alexandre Santacreu 5 th ITF TRANSPORT STATISTICS MEETING, April 2018, Paris
 Transport statistics as exposure data in road safety analysis Alexandre Santacreu 5 th ITF TRANSPORT STATISTICS MEETING, 25-26 April 2018, Paris 2 International Traffic Safety Data and Analysis Group IRTAD
Complete Streets 101: The Basics
 Complete Streets 101: The Basics Michigan Municipal League - Capital Conference March 21, 2017 Chip Smith, AICP - Senior Planner - Wade Trim Inc. and City Council member City of Ann Arbor 2017 MML Capital
TomTom European Congestion Index
 TomTom European Congestion Index Disclaimer All copyrights, commercial rights, design rights, trademarks and other elements considered intellectual property that are published in this report are reserved
Road Safety Initiatives at the International Transport Forum :
 Road Safety Initiatives at the International Transport Forum : IRTAD 2016 annual report Zero Road Deaths and Serious Injuries Report Safer City Streets Initiatives TRB Annual Meeting Joint IRTAD / NHTSA
SUSTAINABILITY, TRANSPORT, & HEALTH. Ralph Buehler, Virginia Tech
 SUSTAINABILITY, TRANSPORT, & HEALTH Ralph Buehler, Virginia Tech Prepared for National Academies Roundtable on Science and Technology for Sustainability 6 December 2013 Overview Trends in Motorization
2 nd Road Safety PIN Conference 23 June 2008 Countdown to only two more years to act!
 2 nd Road Safety PIN Conference 23 June 2008 Countdown to 2010 - only two more years to act! EU ambition EU target to cut by 50% yearly road deaths between 2001 and 2010 Countries have similar national
Traffic Safety Basic Facts 2008
 More than 5.000 people died in road traffic accidents involving HGVs in 2006 1 (EU-14 plus the Czech Republic, Estonia, Hungary Malta and Poland) Traffic Safety Basic Facts 2008 and Buses (HGVs) are defined
Safer City Streets Global Benchmarking for Urban Road Safety
 Safer City Streets Global Benchmarking for Urban Road Safety Working Document Safer City Streets Global Benchmarking for Urban Road Safety Working Document The International Transport Forum The International
2015 Victorian Road Trauma. Analysis of Fatalities and Serious Injuries. Updated 5 May Page 1 of 28. Commercial in Confidence
 2015 Victorian Road Trauma Analysis of Fatalities and Serious Injuries Updated 5 May 2016 Page 1 of 28 Commercial in Confidence VICROADS_n3445896_2015_Victorian_Trauma_Report_- _updated_may_2016.docx 2015
Country fact sheet South Korea
 ESRA results Country fact sheet South Korea The ESRA project is a joint initiative of research institutes in 25 countries aiming at collecting comparable national data on road users opinions, attitudes
ThinkBike Workshop. Los Angeles September 22-23, 2011
 September 22-23, 2011 The Experts Cor van der Klaauw Groningen Province Richard ter Avest Goudappel Coffeng Consultancy The Experts Tonny Bosch Goudappel Coffeng Consultancy Hillie Talens CROW Cycling
Encouraging Taxi Drivers to Behave: Grafton Bridge Taxi and Bus Lane Trial. Rob Douglas-Jones Tim Segedin, Edin Ltd.
 Encouraging Taxi Drivers to Behave: Grafton Bridge Taxi and Bus Lane Trial Rob Douglas-Jones Tim Segedin, Edin Ltd. 2.1km 12 mins Hospital 1.5km 9 mins To Newmarket 5 500 bikes per day 500 pedestrians
to both period for which data are available has been How Big is the Problem? 19 in Of these killed car occupants,
 Car Occupants Introduction This fact sheet explores some of the characteristics of car occupant fatalities. Cars comprise a considerable share of the vehicle fleet in the EU. Therefore, better understanding
 Children (Aged
 2012 Annual Conference THE HEAT IS ON! A New World Competition
 2012 Annual Conference THE HEAT IS ON! A New World Competition Going for Gold! Review of Global Hotel Performance with a focus on Olympic performance Elizabeth Winkle, STR Global InterContinental Buckhead
International cooperation to improve the safety of European pedestrian crossings
 International cooperation to improve the safety of European pedestrian crossings Francesco Mazzone Head of International Assessment Programmes ACI Automobile Club d Italia Polis Conference Barcelona, 25
Greenhouse gas emissions from transport have been rising and are expected to continue to rise both in higher & lower income countries.
 1 Greenhouse gas emissions from transport have been rising and are expected to continue to rise both in higher & lower income countries. Transport is seen as a hard area for mitigation 2 However, there
Bicycle Crashes. Number of Bike Crashes. Total Bike Crashes. are down 21% and severe bike crashes down 8% since 2013 (5 years).
.") Bicycle Crashes The City of Fort Collins is well known for its bike culture, and there is a strong focus on encouraging increased riding. Bike safety is an important component of supporting these efforts.
Bicycle Crashes The City of Fort Collins is well known for its bike culture, and there is a strong focus on encouraging increased riding. Bike safety is an important component of supporting these efforts.
Cycling Providing for this Safe & Efficient Mode of Transport
 Trafinz Conference, Sep 2013 Cycling Providing for this Safe & Efficient Mode of Transport Dr Glen Koorey Senior Lecturer in Transportation Dept of Civil & Natural Resources Engineering Presentation Outline
Traffic Safety Basic Facts 2008
 In 2006 1, more than 4.700 seniors died in road traffic accidents in 14 European countries. Fatalities of elderly people in road traffic accidents reduced by over 3 between 1997 and 2006. Traffic Safety
Copenhagen Cycling Map. Red Lines Cycling facilities
 Copenhagen Cycling Map Red Lines Cycling facilities Copenhagen Cycling Facilities Design Approaches Transportation without Pollution Copenhagen s Strategy Where Cycling is one of the top key activities
Traffic Safety Basic Facts 2008
 Urban road fatalities were reduced by more than 29% between 1997 and 2006. In 2006, more than 8.100 persons died in road accidents inside urban areas in the EU-14. This corresponds to 33,2% of all the
NEW COMMERCIAL VEHICLE REGISTRATIONS EUROPEAN UNION 1. July and August 2017
 PRESS EMBARGO: NEW COMMERCIAL VEHICLE REGISTRATIONS EUROPEAN UNION 1 July and August 2017 Next press release: Tuesday 24 October 2017 1 Data for Malta unavailable Page 1 of 12 Commercial vehicle registrations:
Safety in numbers What comes first safety or numbers? Jan Garrard School of Health and Social Development Deakin University
 Safety in numbers What comes first safety or numbers? Jan Garrard School of Health and Social Development Deakin University The safety in numbers theory As the number of cyclists increases, injury rates
Traffic Safety Basic Facts 2011
 Urban areas Fatalities on urban roads were reduced by 32% between 2000 and 2009. In 2009, about 12.300 people died in traffic accidents on urban roads in the EU-19. This corresponds to 38% of all road
Traffic Safety Basic Facts 2010
 Heavy Goods Vehicles and Buses Heavy Goods Vehicles (HGVs) are defined as goods vehicles of over 3,5 tons maximum permissible gross vehicle weight. Road traffic accidents involving HGVs tend to be more
DG AGRI DASHBOARD: CITRUS FRUIT Last update:
 8.000 7.000 6.000 5.000 4.000 3.000 2.000 1.000 0 1996 1997 1998 1999 2000 2001 2002 2003 2004 2005 2006 2007 2008 2009 2010 2011 2012 2013 2014 2015 2016 2017 Small citrus (group mandarines): clementines,
CYCLING & HEALTH. Randy Rzewnicki, PhD, Brussels, September 2013
 ECF gratefully acknowledges financial support from the European Commission. CYCLING & HEALTH Randy Rzewnicki, PhD, Randy@ecf.com Brussels, September 2013 In this presentation: 1. Health benefits of cycling
SWISS Traffic Figures May 2004
 SWISS Traffic Figures May 2004 SWISS continues seat load factor improvement in May SWISS s load factor for May was 4.8 percentage points better than for the same period last year. Seat load factor for
Canada s Capital Region Delegation to the Velo-City Global 2010 Conference
 Canada s Capital Region Delegation to the Velo-City Global 2010 Conference Report of Findings from Visits, Meetings & Presentations In Amsterdam-Den Haag, Utrecht, Berlin & Copenhagen The Itinerary Copenhagen
HotelBenchmark Survey and assessment of European hotel performance trends
 A HotelBenchmark Survey and assessment of European hotel performance trends Launch of the HotelBenchmark Survey for Belgium and The Netherlands Julia Felton Executive Director HotelBenchmark HotelBenchmark
Traffic Safety Basic Facts 2012
 Urban areas Fatalities on urban roads were reduced by 39% between 2001 and 2010. In 2010, about 10.830 people died in traffic accidents on urban roads in the EU-19. This corresponds to 38% of all road
SUSTAINABLE MOBILITY AND WEALTHY CITIES
 SUSTAINABLE MOBILITY AND WEALTHY CITIES CIVITAS Summer Course: Sustainable mobility for a better life 7 10 June 2016 Malaga, Spain Table of contents Theoretical section Introduction: sustainable mobility
Road Safety Pledge. Route to vision zero 2050 in Europe The Hague, June 14th, Malta. Luxembourg Lithuania Latvia Italy
 Malta Luxembourg Lithuania Latvia Italy Ireland The Netherlands Sweden Spain Slovenia Slovakia Romania Portugal Poland 1965 Road Safety Pledge Route to vision zero 2050 in Europe The Hague, June 14th,
Travel Behavior, Transport Policy, and Sustainable Transport in Germany and the USA
 Travel Behavior, Transport Policy, and Sustainable Transport in Germany and the USA Similarities between Germany and the USA Federal system of government, tradition of local self-government Strong economy,
Child- and Youth-friendly Land-use and Transport Planning Guidelines
 Child- and Youth-friendly Land-use and Transport Planning Guidelines Richard Gilbert Centre for Sustainable Transportation (In April 2006, the Centre moved from Toronto, Canada, to the University of Winnipeg)
Heavy Goods Vehicles and Buses
 Traffic Safety Basic Facts 2013 - Main Figures Traffic Safety Basic Facts 2015 Heavy Goods Vehicles and Buses General More than 4.000 people died in road accidents involving HGVs in 2013. Heavy Goods Vehicles
Summer Study: Europe. A look at European hotel performance during summer 2017 (June - August) Key Findings
 Key Findings") Summer Study: Europe A look at European hotel performance during summer 2017 (June - August) Key Findings - This was the strongest summer overall for European hotels dating back to 2000 - with record-breaking
Summer Study: Europe A look at European hotel performance during summer 2017 (June - August) Key Findings - This was the strongest summer overall for European hotels dating back to 2000 - with record-breaking
Canada. UK France. Walk, Bike, Transit Share of Trips
 1950s 1960s Today Relationship between Share of Urban Trips by Transit, Bicycle, and Foot and Per Capita Annual CO 2 Emissions from Road and Rail Transport in Australia, Canada, the USA and EU Countries,
DG AGRI DASHBOARD: CITRUS FRUIT Last update:
 14 000 12 000 10 000 8 000 6 000 4 000 2 000 0 1996 1997 1998 1999 2000 2001 2002 2003 2004 2005 2006 2007 2008 2009 2010 2011 2012 2013 2014 2015 2016 Small citrus (group mandarines): clementines, satsumas
What does active mobility mean for health? Lessons from health impact assessment
 What does active mobility mean for health? Lessons from health impact assessment Linking active Mobility & Health Linking active mobility and health is the key issue of the Physical Activity Through Sustainable
Traffic Safety Basic Facts 2012
 Heavy Goods Vehicles and Buses More than 4800 people died in road traffic accidents involving HGVs in 2010 (EU-24 1 ). In the last two years, the fatalities involving HGVs in Romania have decreased by
Win-Win Transportation Solutions
 Win-Win Transportation Solutions Todd Litman Victoria Transport Policy Institute Presented Lipinski Symposium on Transportation Policy Chicago, Illinois 15 October 2007 What is The Transportation Problem?
RESTRICTED ROADS (20 MPH SPEED LIMIT) (SCOTLAND) BILL. 1. Is reducing the speed limit to 20mph the best way of achieving the aims of the Bill?
 (SCOTLAND) BILL. 1. Is reducing the speed limit to 20mph the best way of achieving the aims of the Bill?") RURAL ECONOMY AND CONNECTIVITY COMMITTEE RESTRICTED ROADS (20 MPH SPEED LIMIT) (SCOTLAND) BILL SUBMISSION FROM CYCLE STIRLING Questions 1. Is reducing the speed limit to 20mph the best way of achieving
RURAL ECONOMY AND CONNECTIVITY COMMITTEE RESTRICTED ROADS (20 MPH SPEED LIMIT) (SCOTLAND) BILL SUBMISSION FROM CYCLE STIRLING Questions 1. Is reducing the speed limit to 20mph the best way of achieving
Traffic Safety Plan Traffic Safety Plan 2015
 Traffic Safety Plan 2015 Purpose Airdrie s last Traffic Safety Plan was created in 2011. The 2015 Traffic Safety Plan is a revised model of the traffic operations for the City of Airdrie. The purpose of
Transportation Planning Division
 Transportation Planning Division Presentation Outline Study Tasks Recap of Previous Meeting Stakeholder Interviews Data Collection Design Principles Tool Box Recommendations Schedule Moving Forward North
Creating Vibrant & Healthy Cities for ALL
 Creating Vibrant & Healthy Cities for ALL Gil (Guillermo) Penalosa Founder & Chair 8 80 Cities World Urban Parks Penalosa_G Association of Flemish Cities & Municipalities Ghent, Belgium October 12 th,
People killed and injured per million hours spent travelling, Motorcyclist Cyclist Driver Car / van passenger
 Cyclists CRASH FACTSHEET 27 CRASH STATISTICS FOR THE YEAR ENDED 31 DEC 26 Prepared by Strategy and Sustainability, Ministry of Transport Cyclists have a number of risk factors that do not affect car drivers.
Country fact sheet Germany
 Country fact sheet Germany ESRA 2015 results The ESRA project is a joint initiative of research institutes in 17 European countries aiming at collecting comparable national data on road users opinions,
Capacity of transport infrastructure networks
 Most infrastructure extension work is concentrated on roads. The total length of the motorway network has increased dramatically during the past two decades (about 3 % per year). Construction of the high-speed
Road Safety Vademecum
 Road Safety Vademecum Road safety trends, statistics and challenges in the EU 2010-2013 March, 2014 European Commission DG for Mobility and Transport Unit C.4 Road Safety Contents Summary of findings...
Auckland Transport Monthly Indicators Report 2018/19
 Attachment 1 Auckland Transport Monthly Indicators Report 218/19 August 218 Table of Contents Page 2. 1. Summary of indicators 1.1 SOI performance measures 1.2 AT Metro patronage breakdown 2. Monthly indicators
Safer Cycling: How the City of Vancouver is Proactively Improving Cycling Safety
 Safer Cycling: How the City of Vancouver is Proactively Improving Cycling Safety Brian Patterson, MCIP, RPP Urban Systems 2015 Canadian Association of Road Safety Professionals (CARSP) Conference Session
COMPARISON OF FIXED & VARIABLE RATES (25 YEARS) CHARTERED BANK ADMINISTERED INTEREST RATES - PRIME BUSINESS*
 CHARTERED BANK ADMINISTERED INTEREST RATES - PRIME BUSINESS*") COMPARISON OF FIXED & VARIABLE RATES (25 YEARS) Fixed Rates Variable Rates FIXED RATES OF THE PAST 25 YEARS AVERAGE RESIDENTIAL MORTGAGE LENDING RATE - 5 YEAR* (Per cent) Year Jan Feb Mar Apr May Jun Jul
COMPARISON OF FIXED & VARIABLE RATES (25 YEARS) Fixed Rates Variable Rates FIXED RATES OF THE PAST 25 YEARS AVERAGE RESIDENTIAL MORTGAGE LENDING RATE - 5 YEAR* (Per cent) Year Jan Feb Mar Apr May Jun Jul
Helsinki. Explaining Active Transportation Success in a City with Winter. Karl Saidla, Ph.D. Candidate, University of Ottawa, Human Kinetics
 Helsinki Explaining Active Transportation Success in a City with Winter Karl Saidla, Ph.D. Candidate, University of Ottawa, Human Kinetics Thanks! University of Ottawa Finland Futures Research Centre-University
PLANNING FOR SUSTAINABLE PEDESTRIAN INFRASTRUCTURE NALIN SINHA INITIATIVE FOR TRANSPORTATION & DEVELOPMENT PROG. (ITD), DELHI
, DELHI") PLANNING FOR SUSTAINABLE PEDESTRIAN INFRASTRUCTURE NALIN SINHA INITIATIVE FOR TRANSPORTATION & DEVELOPMENT PROG. (ITD), DELHI India s Road Network 5 million kms: Total road length 2.6 mn kms: Surfaced
PLANNING FOR SUSTAINABLE PEDESTRIAN INFRASTRUCTURE NALIN SINHA INITIATIVE FOR TRANSPORTATION & DEVELOPMENT PROG. (ITD), DELHI India s Road Network 5 million kms: Total road length 2.6 mn kms: Surfaced
Aaron s European Transportation Vacation Slide Show
 New York Metropolitan Transportation Council Brown Bag Lunch Speakers Series Aaron s European Transportation Vacation Slide Show Presentation by Aaron Naparstek Wednesday, November 16, 2005. Permission
NZ Transport Agency Cycling Rules
 NZ Transport Agency Cycling Rules https://www.nzta.govt.nz/walking-cycling-and-public-transport/cycling/for-peopl e-involved-in-cycling-programmes-and-projects/cycling-resources-and-research/ General regulatory
Roundtable on integrated and sustainable urban transport. Mio Suzuki (University of Tokyo) Hiroki Nakamura (Chuo University)
 Hiroki Nakamura (Chuo University)") Roundtable on integrated and sustainable urban transport Mio Suzuki (University of Tokyo) Hiroki Nakamura (Chuo University) Contents Current situation of cycling in Japan Public bike system in Japan Example
Roundtable on integrated and sustainable urban transport Mio Suzuki (University of Tokyo) Hiroki Nakamura (Chuo University) Contents Current situation of cycling in Japan Public bike system in Japan Example
EAEVE Establishments Status
 EAEVE Establishments Status This table is listing the outcome status of the Veterinary Universities and Faculties, members of EAEVE, after following the European System of Evaluation of Veterinary Training
EVENT LOCATION DATE. Training Course 2 London 19 June. Study Club Clinical Topic High Wycombe 24 June
 United Kingdom. Training Course 2 London 19 June Study Club Clinical Topic High Wycombe 24 June MasterClass (carried from previous year) London 26 June Training Course 2 London 26 June MasterClass (carried
Commemorative Books Coverage List
 Commemorative Books Coverage List England International Football 2018 Date of Paper Pages Event Covered (Daily Mirror ) 3 Apr 1905 Pages 8 and 14 England 1 Scotland 0 (Home Championship) 5 Apr 1909 Page
mobile Bicycle promotion as part of transport and city planning
 mobile2020 11.09.2013 Bicycle promotion as part of transport and city planning Introduction IBC In the last decade a new paradigm on cities and urban transport is developing. New trends on accessibility
TEGMA Fall Transportation Symposium
 TEGMA 2017 Fall Transportation Symposium John Wilson Senior Vice President Dairy industry trends 1997 1998 1999 2000 2001 2002 2003 2004 2005 2006 2007 2008 2009 2010 2011 2012 2013 2014 2015 2016 Million
INTRODUCING SPECTACULAR MONUMENTS AS CITY IMPROVEMENT STRATEGY
 INTRODUCING SPECTACULAR MONUMENTS AS CITY IMPROVEMENT STRATEGY INTRODUCING SPECTACULAR MONUMENTS AS CITY IMPROVEMENT STRATEGY Or-IMPROVING PUBLIC SPACES AS CITY IMPROVEMENT STRATEGY BARCELONA LYON COPENHAGEN
Time series of Staff PPPs
 Luxembourg, 28 August 2013 Unit C3 A64/13/12 Meeting of the Working Group on Article 64 of the Staff Regulations Luxembourg, 27 th September 2013 Bech Building Room "Ampère" 9.30 a.m. Time series of Staff
Michael Cramer MEP. Closing Plenary Velo-City Global. Cycling in Europe. Presentation by Michael Cramer Taipei, March 1 st 2016
 Michael Cramer MEP Closing Plenary Velo-City Global Cycling in Europe Presentation by Michael Cramer Taipei, March 1 st 2016 The fundamental problem in Europe without a change of mobility we will not stop
Japanese Market Potential
 Growth Strategy (announced on 14 June 2013) : Japan is BACK. Overall Target: 2% Real GDP Growth in the next 10 years JPY1.5 million Increase of GNI/capita after 10 years Unleash the Potential of Private
Road Safety in Sweden and the Effect of Speed on Safety
 Road Safety in and the Effect of Speed on Safety Göran Nilsson Dr. Eng. Swedish Road and Transport Research Institute-VTI Abstract has one of the best traffic safety situation in the developed countries.
Modernizing the British Columbia Motor Vehicle Act
 Modernizing the British Columbia Motor Vehicle Act Road Safety Law Reform Group of BC Photo: Ken Ohrn BC Motor Vehicle Act passed in 1957, with motorists in mind First proposal, rename act to include all
Creating walkable, bikeable and transit-supportive communities in Halton
 Creating walkable, bikeable and transit-supportive communities in Halton By presenting current research and best practices, the information in this paper is meant to support and broaden discussion on how
Health and Transportation: Integrated Transport and Health Impact Model in the Nashville Region. Leslie Meehan, AICP June 2015
 THE HONORABLE Mayor KEN WILBER, Karl Dean, CHAIRMAN Chairman Health and Transportation: Integrated Transport and Health Impact Model in the Nashville Region Leslie Meehan, AICP June 2015 Metropolitan Planning
Working for a world free of road crash death and injury
 Working for a world free of road crash death and injury Presentation Outline What makes a road user vulnerable? Who is a Vulnerable Road User? What can be done to protect Vulnerable Road Users? Goal 3:
Speed Limits in the Hoddle Grid
 Speed Limits in the Hoddle Grid Recent History of speed limits March 2013 Docs # 7738485 1 Introduction Muncipalities have power to Erect speed limit signs BUT Municipalities DO NOT have the power to approve
OECD employment rate increases to 68.4% in the third quarter of 2018
 Paris, 17th January 2019 News Release: 3rd Quarter 2018 OECD employment rate increases to 68.4% in the third quarter of 2018 The OECD area employment rate the share of the working-age population with jobs
Traffic Safety Basic Facts 2012
 Car Occupants Introduction This fact sheet explores some of the characteristics of car occupant fatalities. Cars comprise a considerable share of the vehicle fleet in the EU. Therefore, better understanding
Foreign overnight stays 31% Domestic overnight stays 69% 8.3 MILLION FOREIGN VISITORS IN FINLAND IN 2017
 TOURISM IS A GROWING SOURCE OF EXPORT REVENUE AND A SIGNIFICANT EMPLOYMENT PROVIDER IN FINLAND TOURISM HAS A MULTIPLIER EFFECT ON OTHER SECTORS. 1 EURO IN TOURISM ADDS 56 CENTS VALUE TO THE OTHER SECTORS.
THE PEP Partnership on Cycling
 THE PEP Partnership on Cycling Pan-European Master Plan for Cycling THE PEP Bureau Meeting, July 4 th /5 th, 2017 Robert Thaler Head of Division Mobility, Transport, Noise Austrian Federal Ministry of
Laurier Segregated Bike Lane Pilot Project July 2013 update
 Laurier Segregated Bike Lane Pilot Project July 2013 update Presentation Overview Background Pilot Monitoring Results Mitigation Recommendations Next Steps Laurier 2 Background Laurier Avenue Segregated
 Time of Change We Are Growing We Are An Attractive Place To Live We Are Age Diverse + Living Longer 50000 40000 30000 20000 10000 0 2010 Census Job Density Housing Sheds Transit Sheds The Project FUNDING
For Information Only. Pedestrian Collisions (2011 to 2015) Resolution. Presented: Monday, Apr 18, Report Date Tuesday, Apr 05, 2016
 Resolution. Presented: Monday, Apr 18, Report Date Tuesday, Apr 05, 2016") Presented To: Operations Committee For Information Only Pedestrian Collisions (0 to 0) Presented: Monday, Apr 8, 06 Report Date Tuesday, Apr 0, 06 Type: Correspondence for Information Only Resolution For
Presented To: Operations Committee For Information Only Pedestrian Collisions (0 to 0) Presented: Monday, Apr 8, 06 Report Date Tuesday, Apr 0, 06 Type: Correspondence for Information Only Resolution For
An Investment Programme Proposed
 1 Auckland AUCKLAND Cycling: An Investment Programme CYCLING An Investment Programme Proposed 2018-2028 School Supermarket 2 Auckland Cycling: An Investment Programme Auckland Snapshot THE CURRENT INVESTMENT
Facility preferences & safety
 Photo Flickr: Boegh Facility preferences & safety Evidence from two studies Kay Teschke School of Population & Public Health University of British Columbia Canadians don t cycle much % of trips by bike
Total 20 creating a paradigm shift
 Total 20 creating a paradigm shift Agenda Thanks to Transportation Alternatives 20 s Plenty for Us Why we need slower streets Establishment changes guidance Portsmouth UK s first 20mph city Successes around
FAQ sheet Dutch Cycling Embassy
 FAQ sheet Dutch Cycling Embassy Table of Contents Benefits of cycling... 2 The development of cycling in the Netherlands... 3 Accident liability... 4 Bicycle parking in the Netherlands... 4 E-bike & Speed
EAEVE Establishments Status
 EAEVE Establishments Status This table is listing the outcome status of the Veterinary Universities and Faculties, members of EAEVE, after following the European System of Evaluation of Veterinary Training
Extracting Maximum Benefit from Parking Policy - 10 Years Experience in Perth, Australia. By Emmerson Richardson Sinclair Knight Merz
 Extracting Maximum Benefit from Parking Policy - 10 Years Experience in Perth, Australia By Emmerson Richardson Sinclair Knight Merz Snapshot of Perth > Metropolitan Area Population 1.7 million > 3.5 million
Safety and Active Transport. Dr. Maureen Carew, Medical Officer of Health Renfrew County and District Health Unit May 30, 2014
 Safety and Active Transport Dr. Maureen Carew, Medical Officer of Health Renfrew County and District Health Unit May 30, 2014 Active Transport Vision Increase levels of walking and cycling Reduce vehicle
Auckland Transport Monthly Indicators Report 2018/19
 Attachment 1 Auckland Transport Monthly Indicators Report 218/19 October 218 Table of Contents Page 2. 1. Summary of indicators 1.1 SOI performance measures 1.2 AT Metro patronage breakdown 2. Monthly
WELCOME Mission-Geneva Transportation Study
 WELCOME Mission-Geneva Transportation Study Study Process and Schedule 2005 2006 Oct Nov Dec Jan Feb Mar Apr May Jun Jul Aug Sept Oct Task 2 Develop Outreach Plan Task 3 Document Existing Conditions/ Prioritize
2017 North Texas Regional Bicycle Opinion Survey
 2017 North Texas Regional Bicycle Opinion Survey Sustainable Development Program Kevin Kokes, AICP Public Meetings April, 2018 North Central Texas Council of Governments MPO for the Dallas-Fort Worth Region
IGU. Immediate Challenges for Clean and Affordable Gas Mobility in Europe IGU WGCPARIS2015. Eugene Pronin Gazprom export LLC, IGU WOC
 Immediate Challenges for Clean and Affordable Gas Mobility in Europe WGCPARIS2015 WORLD GAS CONFERENCE Eugene Pronin Gazprom export LLC, WOC 1 The Plan Triennium Working Program WOC 5 (Utilization of Gas)
We believe the following comments and suggestions can help the department meet those goals.
 The Honorable Secretary Anthony Foxx The Secretary of Transportation United States Department of Transportation 1200 New Jersey Avenue, SE Washington, DC 20590 August 30, 2013 Dear Secretary Foxx, Thank
Rutgers. October Designing Streets for People LLC
 Rutgers Voorhees Transportation Center October 22 2010 Michael Ronkin Designing Streets for People LLC 1 2 3 4 5 We know how to build right 6 Yet many roads are built like this Recently completed IL 64
The Amsterdam Story. The socio-economic value of cycling and innovative planning practices in context in transition. Kees van Ommeren.
 The Amsterdam Story The socio-economic value of cycling and innovative planning practices in context in transition Kees van Ommeren Paolo Ruffino Questions answered in this presentation What are the economic
Municipality of Sofia Traffic Master Plan. Intelligent Transport Systems Strategy Andrew Walsh
 Municipality of Sofia Traffic Master Plan Intelligent Transport Systems Strategy Andrew Walsh Introduction Presentation to describe an ITS Strategy for Sofia developed as part of the Sofia Traffic Master
TPO Chattanooga-Hamilton County/North Georgia. The Road Less Traveled. Non-traditional Health Impact Analyses in Transportation Planning
 TPO Chattanooga-Hamilton County/North Georgia The Road Less Traveled Non-traditional Health Impact Analyses in Transportation Planning Chattanooga TPO 443,000 people 2,110 lane miles 19 Jurisdictions $7.3M/year
Walking and Cycling for Healthy Cities
 Walking and Cycling for Healthy Cities Prof. John Pucher, Rutgers University http://policy.rutgers.edu/faculty/pucher Walking and Bicycling: the MOST sustainable transport modes MOST environmentally friendly:
Finland s sawmilling industry
 Finland s sawmilling industry Howard Sidney-Wilmot Stora Enso - Sales Director UK, Ireland & Benelux September 2015 Stora Enso Wood Products 13/10/2015 1 Finland s forest products 19bn total value 11bn
Deaths/injuries in motor vehicle crashes per million hours spent travelling, July 2007 June 2011 (All ages) Mode of travel
 Mode of travel") Cyclists CRASH STATISTICS FOR THE YEAR ENDED 31 DECEMBER 211 Prepared by the Ministry of Transport CRASH FACTSHEET 212 Cyclists have a number of risk factors that do not affect car drivers. The main risk
Cyclists CRASH STATISTICS FOR THE YEAR ENDED 31 DECEMBER 211 Prepared by the Ministry of Transport CRASH FACTSHEET 212 Cyclists have a number of risk factors that do not affect car drivers. The main risk