JACKTOWN ACRES FLOOD MITIGATION IMPROVEMENTS ANALYSIS
|
|
|
- Juniper Mitchell
- 5 years ago
- Views:
Transcription

1 JACKTOWN ACRES FLOOD MITIGATION IMPROVEMENTS ANALYSIS SITUATE IN: NORTH HUNTINGDON TOWNSHIP WESTMORELAND COUNTY, PENNSYLVANIA PREPARED FOR: North Huntingdon Township Center Highway North Huntingdon, PA August 2011 Revised: October Waterfront Corporate Park II 2100 Georgetowne Drive Suite 103 Sewickley, PA Phone: Fax:
2 EXECUTIVE SUMMARY FLOOD MITIGATION IMPROVEMENTS ANALYSIS LONG RUN JACKTOWN ACRES NORTH HUNTINGDON TOWNSHIP, WESTMORELAND COUNTY, PA After a significant amount of hydrologic and hydraulic analysis of the Jacktown Acres area, which frequently experiences flooding due to Long Run which flows through the area, a series of mitigation options were developed in an attempt to reduce some of the flooding impacts the residents in the area experience. This report focuses on flood reduction not elimination. Flooding will continue to occur in the watershed regardless of the options chosen to stem the effects of that flooding. The report also includes a financial analysis to determine a benefit/cost ratio for the work that could be done in the watershed to minimize the problems. The estimated amount of damage caused by a 100 year frequency flood is based on the flooding elevations determined in the hydraulic models and the use of U.S. Army Corps of Engineers Depth-Damage curves for typical residential structures. It appears that the best candidates for flood reduction in the study area are as follows and are suggested to be ranked accordingly: 1. Construction of Offstream Detention Basin at Lions Park 2. Replacement of Rebecca Street Culvert and Elimination of Stream Bends 3. Replacement of Wainwright Drive Culvert Taken separately, each option has a positive benefit/cost ratio except for the Wainwright Drive culvert. This culvert is included as a recommendation since 3 homes could have all of their flooding of the structure removed. Each option has other ramifications that the Township should consider that include not only cost, but property acquisition, increased maintenance requirements, and potential road closures just to name a few. We trust that this report will serve as a guide for the Township to make informed decisions on these flood reduction items in the Jacktown Acres area.
3 FLOOD MITIGATION IMPROVEMENTS ANALYSIS LONG RUN JACKTOWN ACRES NORTH HUNTINGDON TOWNSHIP, WESTMORELAND COUNTY, PA INTRODUCTION In October of 2010, North Huntingdon Township requested that the 100 year floodplain of Long Run within the Township be studied to analyze future areas of improvement to potentially reduce the flooding impact to its residents in the area. We provided a base report to the Township that extended the hydraulic modeling previously performed by FEMA to include the entire length of Long Run. Also, the report made some general observations regarding areas that could be modified to try and lessen the flooding impacts that residents along the stream are currently experiencing. It should be noted that many of the homes in the area are within the delineated floodplain established by FEMA. In most cases, regardless of the improvements, or change in flow characteristics, these homes will not be removed from a flood zone. This is the unfortunate side effect of living near a stream. The stream can be an amenity to the property when flowing tranquilly, but turn into a devastating force when severe storms occur in the area. The Township is not legally responsible for the flooding that occurs in streams unless they have blatantly contributed to the volume of flow, or have redirected flow to areas that did not have a channel previously. However, North Huntingdon Township has decided to take a look at some potential flood mitigation options that may help its residents. The purpose of this report is to specifically identify those potential flood mitigation options and determine the effect that they have on the existing flooding in the area. This report will also do a cursory benefit/cost analysis to provide another valuable piece of information to the Township should any of the options go past the conceptual to become actual projects. HYDRAULIC ANALYSIS The HEC-RAS model, as developed by the U.S. Army Corps of Engineers, constructed in the previous report will be used as the base for the modeling used to evaluate the options to be presented in this report. The 100 year storm will be the focus of the analysis, except in the offstream basin location where the Township design storms will be used. Based on this previous study, there is the potential for up to 37 homes to experience flooding during a 100 year storm or during intense rainfall periods that may mimic a 100 year distribution. Some of these homes will experience flooding with lesser rainfall intensities as well. This flooding is to the structure of the home and not the lawns and driveways on the property. This flooding, while troublesome and annoying to the home owner, does not require a significant amount of money to repair and does not factor into a positive benefit/cost ratio. POSSIBLE IMPROVEMENTS The following improvements have been identified on Long Run and will be summarized below: Modifying existing Township maintained culverts at Wainwright Drive, Abrams Drive, Rebecca Street, and South Whitmore Drive Constructing additional flood relief pipes at Roth Drive 1
4 Modifying existing PennDOT culvert at Robbins Station Drive Channel Modifications between Abrams Dr and Robbins Station Drive, as well as between Rebecca Street and just upstream of South Whitmore Road where an existing dike was constructed Elimination of Stream Bend near Rebecca Street by Piping Stream Elimination of constructed berm along stream upstream of South Whitmore Road Construction of Off Stream Flooding Basin at Lions Park Each of these options have a varying degree of flood reduction that will be realized upstream of the culvert or area to be studied. No option will eliminate all of the flooding in Long Run short of enclosing the entire stream which will not be permitted by the PA Department of Environmental Protection. It should also be noted that the proposed modifications are based on options that appear to mesh with existing property lines and developed areas by the residents. The minimum disturbance to private property was a priority in selecting these options. Township Culvert Modification As stated above, we have focused on modifications of culverts at Wainwright Drive, Abrams Drive, Rebecca Street, and South Whitmore Drive. Culvert improvements were tried in several HEC-RAS models at Roth Drive near Roth Drive with no significant improvement in flood elevations. The steepness of the western portion of Roth Drive over the culvert forces the majority of the flood flows into the eastern floodplain. This floodplain flow is significantly higher than that within the channel and is the dominant feature of the flooding. There simply is not enough water in the channel that can be conveyed under Roth Drive without the reconstruction of Roth Drive by raising the road at least 6 feet. This is obviously not an option as the adjacent properties would be lower than the road and their driveways would be impossible to navigate. Wainwright Drive currently has a 7 foot x 12 foot corrugated metal arch culvert for Long Run. Our experimental model replaced that culvert with a 7 foot x 25 foot reinforced concrete box culvert. This results in a reduction in water upstream of the culvert ranging from 1.3 to 1.0 feet. This reduction is effective for 480 feet before being minimized by the Roth Drive culvert outflow. A sketch showing graphically this reduction, as well as the others below appears in the Appendix. The Abrams Drive culvert is a 5 foot by 7 foot concrete box. The theoretical replacement analyzed was a 6 foot by 16 foot Conspan reinforced concrete arch. The effects of this change range from 1.3 to 1.4 feet for 540 feet upstream of the culvert. The Rebecca Street culvert is a 6 foot by 8 foot concrete elliptical pipe. The replacement for this bridge could be a 6 foot by 14 foot Conspan reinforced concrete arch. This replacement results in a reduction in water surface elevation ranging from 0.6 to 0.8 feet for 280 feet. Much of the improvement that could be gained from this culvert is diminished due to the 90 degree bends just upstream of the culvert that most likely causes the bulk of the flooding in this immediate area. South Whitmore Drive has a 5 foot by 7 foot corrugated metal pipe arch for its culvert. The replacement of this culvert could be a 5 foot by 20 foot reinforced concrete box culvert which would result in a reduction in 100 year 2
5 water surface elevation ranging from 0.1 foot to 1.9 feet directly at the culvert. This reduction would be over an 800 foot reach. Additional Flood Pipes at Roth Drive The existing 6 foot corrugated metal pipe culvert at Roth Drive does not have adequate capacity to pass the 100 year storm as the hydraulic cross section in the appendix shows. With the steepness of the road on the western side of the culvert, the options to reduce flooding in this area are quite limited short of a complete replacement of the culvert with a much larger box or arch. The steepness of the road forces the overflow into the eastern floodplain and toward the houses. One option that was proposed was to construct additional pipes adjacent to the existing culvert to provide additional flood carrying capacity. The HEC-RAS model was modified to include 2 additional 4 foot diameter pipes on either side of the existing culvert. The pipes would be at a slightly higher elevation than the existing culvert so that they would be activated only during higher flow periods. Unfortunately, the addition of these 2 pipes results in only a reduction of 0.25 feet upstream of the culvert. Based on the first floor elevations of the homes affected by flooding at this culvert, there would be no appreciable reduction in flooding damage. The 10 year storm was also analyzed in this area and a similar reduction of about 0.25 feet was realized. The cost of installing these 2 pipes through the existing road embankment for a very small reduction in flow that does not benefit the residents significantly should not be considered in this analysis. Robbins Station Road This culvert is owned by PennDOT, so any replacement of this culvert, which is severely undersized, would result in a lot of governmental paperwork and approvals. The existing culvert is a 6 foot corrugated metal pipe. When compared to the other culverts downstream, the lack of capacity, and resulting backup of water is easy to understand. An 8 foot by 12 foot Conspan arch, which is an approved product for PennDOT construction, could be installed at this culvert location. This arch culvert would reduce the floodplain upstream an average of 1.4 feet for approximately 700 feet upstream. However, the water surface reduction occurs in an area where no homes are predicted to be impacted. Replacement of this culvert, while helping the overall hydraulics of the stream would be of little benefit to the residents of the area. In fact, it may increase flooding impacts downstream at Abrams Drive. The undersized culvert now holds back water until it would overtop Robbins Station Drive acting like a de facto stormwater basin. By increasing the size of the culvert, more water would reach the Abrams Drive culvert faster than it does now. This would surely overwhelm the culvert faster and result in longer flooding durations. Channel Modifications There are two areas that could be candidates for channel improvements. The first area, between Abrams Drive and Robbins Station Road would see a uniform 15 foot wide channel constructed with the side slopes of the banks tapering back into existing ground. This would result in the loss of 5 to 8 feet of yard in some instances. The decrease in water surface elevation during the 100 year storm according to this HEC-RAS model in this area reaches a maximum of 1.42 feet, but typically averages 0.1 feet. 3
6 The other area for modification would be upstream of Rebecca Street where a dike was constructed along the stream. It is unknown what the purpose of the dike truly was. It is possible that the dike was built to protect the homes from stream flooding; however, since it is open at its upstream limits, it just serves as a flow splitter and allows water to pool in the rear yards of the homes along McKee Road. The reduction in water surface elevation by removing the dike is only 0.2 feet. The overbank flow in this portion of the stream is strong again due to a smaller channel and any earthwork improvements in the northern floodplain do not have a major effect on the overall water surface elevation. Another possible improvement is to proceed with the regional detention storage idea at Lions Park that has been previously discussed. The water surface elevation, based on preliminary modeling, will not be affected adversely by a berm to temporarily detain water on the Lions Park ballfields. The effect on reducing the peak flow amounts downstream may be a significant improvement for this area. These areas do not appear suitable for a property acquisition by the Township via FEMA or PEMA funding. The frequency of structure flooding does not appear to be significant. Rebecca Street Stream Bend Elimination The two 90 degree bends just upstream of Rebecca Street surely cause significant flooding since a basic property of water is that it prefers to find its own level and direction and does not like to bend. The bends generate large hydraulic losses that result in higher water surface elevations when runoff is above the base flow level. With the development of the existing homes in the area, there appears to be no re-routing solution of the open channel to eliminate the bends without the condemnation of some of the homes. This is not a desirable option since there is not a history of cost of damages in this area on file with FEMA. So the option becomes the enclosure of the stream to bypass this water. The peak 100 year flow in this area would be approximately 202 cfs. A 6 foot diameter pipe is sufficient to pass this flow. A pipe approximately 350 feet in length would result in a reduction in water surface elevation 0.5 to 0.8 feet. This option would be extremely more effective in the smaller storm frequencies that occur more often. The ability to keep the water within the channel would keep some of the areas dryer during these storms. Elimination of Berm Along Steam There appears to have been a man-made berm constructed along the stream at various portions of the Jacktown Acres development. Clear evidence of these berms are especially evident upstream of South Whitmore Road. A HEC-RAS model was developed to determine the effect of the berms on the 100 year water surface elevation. The model showed that the removal of the berms reduced the water surface elevation by less than 0.03 feet. The overall flow in the cross section is too large for these berms to affect the flow. Perhaps during much smaller events the effect may be larger. Again, the cost to remove the berms and re-stabilize the area would far exceed the benefit gained. The one issue that may justify the removal of the berms is that it does appear to split the flood flows from the main channel causing backyard flooding that may not occur in a typical channel/floodplain situation. If the berm was removed, then this split in flow may not occur which would result in less flooding of the rear yard. However, the berm may provide some protection in the quicker, flash flood events and if the berm were to be removed by the Township, the perceived value that the berm provides would be hard to dispute in a court of law. The property owners should make their own decision on the berm and proceed accordingly. 4
7 Offstream Basin Lions Park The concept of using the Lions Park area as an offstream detention facility was first mentioned by Mr. Andrew Blenko, P.E., Township Engineer during an initial field view of the Jacktown Acres area. The concept would be to create a berm or artificial dike around the current park to detain flood flows during significant events and allow them to release downstream after the Long Run has crested and is receding. The water could be temporarily stored on the fields of the park and released using an outlet structure that has a Tideflex valve on its outflow pipe. This valve prevents discharge from the pipe when it is submerged by, in this case, Long Run. After Long Run recedes, the water can be let out from the Park area such that all water will leave the park. The berm needed to store this water would be earthen and constructed around the perimeter of the park. This will result in some loss of the flat green space. However, for the baseball/softball field, there will still be a 300 foot clearance from home plate to the proposed berm. This should be sufficient for most types of baseball and softball except for the upper age and talent groups. There would be no grading on the flat areas of the park so the grade can remain essentially the same. This will allow the park to be used during non flooding periods. This type of multi purpose facility is encouraged by reviewing agencies throughout the state. A Growing Greener grant may be available for this type of work. The upstream portion of the park will have a small berm to direct floodplain flows into the park area. This diversion was modeled in an HEC-HMS model to calculate the hydrographs from the upstream drainage area and to determine the effects of the storage in the park. At maximum storage, the park can provide 514,000 cubic feet, or 3.8 million gallons of storage. The HEC-HMS model is showing that the following flow reductions are achieved for the design storms for the Township: STORM PRECIPITATION (IN) EXISTING FLOW (CFS) REDUCED FLOW (CFS) PERCENT REDUCTION 2 YEAR YEAR YEAR YEAR As can be seen in the table above, there is a significant reduction in flow for the 2, 10, and 25 year storms up to nearly 40 percent. The 100 year storm does not have as large of a reduction simply because the volume available in Lions Park cannot handle the volume of water that is generated in the valley. The FEMA Flood Insurance Study for Long Run does have a 10 year storm analysis, so that storm can be compared to the reduced flow from the Lions Park basin. The water surface elevations are reduced by approximately 0.5 feet just downstream of the park to Robbins Station Road. Downstream of Robbins Station Road to Abrams Road, the reduction in water surface elevation is between 1 and 1.2 feet. Finally, from Abrams to Wainwright Drive, the reduction is from 1.8 to 2 feet. The reduced flow in the lower areas appears to result in some measureable drops in flooding flow. Again, this is only for the 10 year storm and not the 100 year frequency that governmental agencies recognize. However, this storm is theoretically more frequent and so to would be the occurrence of damage causing events. 5
8 BENEFIT/COST ANALYSIS Township Culvert Modification In order to gauge monetarily what impact the proposed modifications have on the Long Run area, an analysis of the costs to implement the improvements must be weighed against the benefits of the measure. The U.S. Army Corps of Engineers have developed a set of curves that reflect Depth-Damage relationships. As the depth of flooding increases, the cost of the damages, both to the structure and the property s contents, also increases, but not in a linear form. The percentage of damage is then related to the value of the property. The curves may be found in the Appendix of this report. The property values for the 37 structures affected by flooding during the 100 year event were researched online and the Westmoreland County Tax website was used to set a base value. As further information may become available, these numbers could be changed. The results of the existing 100 year calculations and the culvert replacements were input into an Excel Spreadsheet along with the rating curves and assumed first floor elevations. The existing conditions HEC-RAS model provided a base for the predicted depth of flooding to occur at each structure. This was then applied to the Depth Damage Curves. It should be noted that this spreadsheet will provide the Township a new tool to further evaluate the area should any of the values change in the future whether they be water surface elevations or property values. The existing analysis showed that there is a potential for $3.2 million dollars worth of structural and contents damage in the Jacktown Acres corridor. Based on the reductions in water surface elevation by the proposed culvert replacements, a separate damage assessment was performed after the culverts would be theoretically installed. The total predicted damage was reduced to $2.4 million dollars, a reduction of approximately $700,000 dollars. Having this knowledge, if the culverts can be replaced for a total of nearly $700,000 a positive Benefit/Cost Ratio could be obtained. Predicting the cost of culvert replacement can be difficult as there are many factors that may affect a culvert installation. Using the latest PennDOT bids for projects that are similar to the proposed culvert replacements, we estimate that the projects would cost as follows: CULVERT MATERIAL FOR REPLACEMENT LENGTH (FT) ESTIMATED COST* BENEFIT IN EACH AREA Wainwright Drive 7 x 25 Box Culvert 52 $340,000 $253,000 Abrams Drive 6 x 16 Conspan Arch 54 $180,000 $88,400 Rebecca Street 6 x 14 Conspan Arch 41/350 $135,000/$100,000 $295,000 / Stream Bend Elimination S. Whitmore Drive 5 x 20 Box Culvert 55 $250,000 $0 *Note Costs may be affected by Public Bidding Requirements which frequently require additional bonding and wage rate standards that are not applicable on private projects. The cost analysis for the culvert replacements may be found in the Appendix of the Report. 6
9 Offstream Basin Lions Park The benefit/cost analysis for the offstream basin was done a bit differently from the culvert replacement analysis as the 100 year storm is not significantly mitigated by the offstream basin. This analysis focuses on the 10 year storm which, while not inflicting as much damage as the 100 year storm, the potential for this damage to occur more often definitely exists. Using the same criteria, the structures which are downstream of Lions Park would realize the benefits of the offstream storage which results in a peak flow reduction. There are 18 structures downstream of Lions Park which will be considered. Without the offstream basin, the 10 year frequency storm could cause up to $1.1 million dollars in flood damage. The implementation of the basin into the watershed reduces the damage to just over $482,000. Also, the impact of the basin, if functioning properly, would remove 10 of the 18 homes from the flood damage list. The most significant cost element of a detention basin of this size is the earthwork needed to create the berm. Typically, detention basins are constructed in developments where cut and fill operations attempt to balance the amount of earth moved onsite. For the Lions Park basin, there would be only the import of material to construct the berm. The berm requires 3,700 cubic yards of earthen material. Typically this material to be hauled onsite can range from to $25 to $50 per cubic yard depending on source of material and distance of haul. This could mean a cost as high as $185,000 The remaining pieces of the basin, the outlet structure and pipe, could be constructed for less than $20,000. Also, the governmental regulations for a project such as this along the stream may be more expensive than a normal project. The PADEP will need to be satisfied with the work being performed as it will be done in a floodway. As a result, engineering costs will be higher than for a normal basin design. A ballpark estimate for the construction of the basin would be approximately $340,000. This could provide a greater than 2:1 benefit/cost ratio. Of course, the inundation of the park and corresponding cleanup that would need to be performed after each activation of the basin needs to be weighed by the Township, as well as the impact on scheduling the usage of the field and remainder of the park. CONCLUSIONS Based on the findings listed in this report, it appears that a positive Benefit/Cost Ratio could be applied to some of the culvert replacements, but not necessarily all of them. The amount of flow in the watershed can only be handled so quickly and the culverts, no matter how large, will become overwhelmed and flooding will occur. A further analysis of what provides the most value for the money, as well as the effect of the culvert replacement on adjacent properties should be performed by the Township to decide if any culverts should be replaced. It appears that the work at Rebecca Drive with a larger culvert and the straightening of the stream by enclosure provides the best benefit when compared to the damages in the immediate area. We would also recommend that the Wainwright Drive culvert be considered for replacement as well. Even though the local benefit is less than the cost to replace the culvert, one factor the overall numbers do not show is that 3 structures would be removed from the flooding impacts. For the cost of this improvement, we believe this is a significant positive improvement. The offstream basin does appear to have the best Benefit/Cost ratio of the options considered. However the impact on the park, from the construction of the berm around the perimeter, to the potential frequent, 7
10 temporary inundation of the park which will likely deposit large amounts of sediment and debris, need to be considered. A ranking of the suggested projects, with respect to the value they could provide, would be as follows: 1. Lions Park Offstream Basin 2. Rebecca Street Culvert/Bend Elimination 3. Wainwright Drive Culvert Replacement 8
11 APPENDIX
12 EXISTING CONDITIONS HEC-RAS REPORT
13 HEC-RAS Version Jan 2010 U.S. Army Corps of Engineers Hydrologic Engineering Center 609 Second Street Davis, California X X XXXXXX XXXX XXXX XX XXXX X X X X X X X X X X X X X X X X X X X XXXXXXX XXXX X XXX XXXX XXXXXX XXXX X X X X X X X X X X X X X X X X X X X X X XXXXXX XXXX X X X X XXXXX PROJECT DATA Project Title: HEC-RAS Project File : 96003HEC-RAS.prj Run Date and Time: 8/20/ :39:11 AM Project in English units PLAN DATA Plan Title: LiDAR-Revised Plan File : y:\projects\north Huntingdon\ Jacktown Acres\HECRAS\96003HEC-RAS.p08 RAS.g06 Geometry Title: LiDAR-Revised Geometry File : y:\projects\north Huntingdon\ Jacktown Acres\HECRAS\96003HEC- RAS.f01 Flow Title Flow File : FEMA Flows : y:\projects\north Huntingdon\ Jacktown Acres\HECRAS\96003HEC- Plan Summary Information: Number of: Cross Sections = 47 Multiple Openings = 0 Culverts = 7 Inline Structures = 0 Bridges = 0 Lateral Structures = 0 Computational Information Water surface calculation tolerance = 0.01 Critical depth calculation tolerance = 0.01 Maximum number of iterations = 20 Maximum difference tolerance = 0.3 Flow tolerance factor = Computation Options Critical depth computed only where necessary Conveyance Calculation Method: At breaks in n values only Friction Slope Method: Average Conveyance Computational Flow Regime: Subcritical Flow FLOW DATA Flow Title: FEMA Flows Flow File : y:\projects\north Huntingdon\ Jacktown Acres\HECRAS\96003HEC-RAS.f01 Flow Data (cfs) River Reach RS PF 1 Long Run-JacktowLong Run-Jacktow Long Run-JacktowLong Run-Jacktow Boundary Conditions River Reach Profile Upstream Downstream Long Run-JacktowLong Run-JacktowPF 1 Known WS =
14 GEOMETRY DATA Geometry Title: LiDAR-Revised Geometry File : y:\projects\north Huntingdon\ Jacktown Acres\HECRAS\96003HEC-RAS.g06 CROSS SECTION RIVER: Long Run-Jacktow REACH: Long Run-Jacktow RS: INPUT Description: Station Elevation Data num= Bank Sta: Left Right Lengths: Left Channel Right Coeff Contr. Expan Blocked Obstructions num= 1 Sta L Sta R Elev CROSS SECTION RIVER: Long Run-Jacktow REACH: Long Run-Jacktow RS: INPUT Description: Station Elevation Data num=
15 Bank Sta: Left Right Lengths: Left Channel Right Coeff Contr. Expan Ineffective Flow num= 1 Sta L Sta R Elev Permanent F Blocked Obstructions num= 2 Sta L Sta R Elev Sta L Sta R Elev CROSS SECTION RIVER: Long Run-Jacktow REACH: Long Run-Jacktow RS: INPUT Description: Station Elevation Data num= Bank Sta: Left Right Lengths: Left Channel Right Coeff Contr. Expan Blocked Obstructions num= 2 Sta L Sta R Elev Sta L Sta R Elev CROSS SECTION RIVER: Long Run-Jacktow REACH: Long Run-Jacktow RS: INPUT Description: Station Elevation Data num= 99
16 Bank Sta: Left Right Lengths: Left Channel Right Coeff Contr. Expan Blocked Obstructions num= 2 Sta L Sta R Elev Sta L Sta R Elev CROSS SECTION RIVER: Long Run-Jacktow REACH: Long Run-Jacktow RS: INPUT Description: Station Elevation Data num= Bank Sta: Left Right Lengths: Left Channel Right Coeff Contr. Expan Blocked Obstructions num= 3 Sta L Sta R Elev Sta L Sta R Elev Sta L Sta R Elev CROSS SECTION
17 RIVER: Long Run-Jacktow REACH: Long Run-Jacktow RS: INPUT Description: Station Elevation Data num= Bank Sta: Left Right Lengths: Left Channel Right Coeff Contr. Expan Blocked Obstructions num= 3 Sta L Sta R Elev Sta L Sta R Elev Sta L Sta R Elev CROSS SECTION RIVER: Long Run-Jacktow REACH: Long Run-Jacktow RS: INPUT Description: Station Elevation Data num= Bank Sta: Left Right Lengths: Left Channel Right Coeff Contr. Expan Ineffective Flow num= 1 Sta L Sta R Elev Permanent F
18 Blocked Obstructions num= 3 Sta L Sta R Elev Sta L Sta R Elev Sta L Sta R Elev CROSS SECTION RIVER: Long Run-Jacktow REACH: Long Run-Jacktow RS: INPUT Description: Station Elevation Data num= Bank Sta: Left Right Lengths: Left Channel Right Coeff Contr. Expan Ineffective Flow num= 1 Sta L Sta R Elev Permanent F Blocked Obstructions num= 3 Sta L Sta R Elev Sta L Sta R Elev Sta L Sta R Elev CROSS SECTION RIVER: Long Run-Jacktow REACH: Long Run-Jacktow RS: INPUT Description: Station Elevation Data num=
19 Bank Sta: Left Right Lengths: Left Channel Right Coeff Contr. Expan Ineffective Flow num= 2 Sta L Sta R Elev Permanent F F Blocked Obstructions num= 4 Sta L Sta R Elev Sta L Sta R Elev Sta L Sta R Elev CULVERT RIVER: Long Run-Jacktow REACH: Long Run-Jacktow RS: 6645 INPUT Description: Distance from Upstream XS = 51 Deck/Roadway Width = 36 Weir Coefficient = 2.6 Upstream Deck/Roadway Coordinates num= 6 Sta Hi Cord Lo Cord Sta Hi Cord Lo Cord Sta Hi Cord Lo Cord Upstream Bridge Cross Section Data Station Elevation Data num= Bank Sta: Left Right Coeff Contr. Expan Ineffective Flow num= 2
20 Sta L Sta R Elev Permanent F F Blocked Obstructions num= 4 Sta L Sta R Elev Sta L Sta R Elev Sta L Sta R Elev Downstream Deck/Roadway Coordinates num= 8 Sta Hi Cord Lo Cord Sta Hi Cord Lo Cord Sta Hi Cord Lo Cord Downstream Bridge Cross Section Data Station Elevation Data num= Bank Sta: Left Right Coeff Contr. Expan Ineffective Flow num= 2 Sta L Sta R Elev Permanent F F Blocked Obstructions num= 5 Sta L Sta R Elev Sta L Sta R Elev Sta L Sta R Elev Upstream Embankment side slope = 0 horiz. to 1.0 vertical Downstream Embankment side slope = 0 horiz. to 1.0 vertical Maximum allowable submergence for weir flow =.98 Elevation at which weir flow begins = Energy head used in spillway design = Spillway height used in design = Weir crest shape = Broad Crested Number of Culverts = 1 Culvert Name Shape Rise Span Culvert #1 Arch 5 7 FHWA Chart # 41- Arch; Corrugated metal FHWA Scale # 3 - Thin wall projecting Solution Criteria = Highest U.S. EG Culvert Upstrm Dist Length Top n Bottom n Depth Blocked Entrance Loss Coef Exit Loss Coef
21 Upstream Elevation = Centerline Station = 400 Downstream Elevation = Centerline Station = 400 CULVERT OUTPUT Profile #PF 1 Culv Group: Culvert #1 Q Culv Group (cfs) Culv Full Len (ft) # Barrels 1 Culv Vel US (ft/s) 9.95 Q Barrel (cfs) Culv Vel DS (ft/s) E.G. US. (ft) Culv Inv El Up (ft) W.S. US. (ft) Culv Inv El Dn (ft) E.G. DS (ft) Culv Frctn Ls (ft) 0.93 W.S. DS (ft) Culv Exit Loss (ft) 0.67 Delta EG (ft) 3.14 Culv Entr Loss (ft) 1.54 Delta WS (ft) 4.50 Q Weir (cfs) E.G. IC (ft) Weir Sta Lft (ft) E.G. OC (ft) Weir Sta Rgt (ft) Culvert Control Outlet Weir Submerg 0.00 Culv WS Inlet (ft) Weir Max Depth (ft) 1.62 Culv WS Outlet (ft) Weir Avg Depth (ft) 0.93 Culv Nml Depth (ft) 5.00 Weir Flow Area (sq ft) Culv Crt Depth (ft) 3.49 Min El Weir Flow (ft) Note: The normal depth exceeds the height of the culvert. The program assumes that the normal depth is equal to the height of the culvert. CROSS SECTION RIVER: Long Run-Jacktow REACH: Long Run-Jacktow RS: INPUT Description: Station Elevation Data num= Bank Sta: Left Right Lengths: Left Channel Right Coeff Contr. Expan Ineffective Flow num= 2 Sta L Sta R Elev Permanent F F
22 Blocked Obstructions num= 5 Sta L Sta R Elev Sta L Sta R Elev Sta L Sta R Elev CROSS SECTION RIVER: Long Run-Jacktow REACH: Long Run-Jacktow RS: INPUT Description: Station Elevation Data num= Bank Sta: Left Right Lengths: Left Channel Right Coeff Contr. Expan Ineffective Flow num= 1 Sta L Sta R Elev Permanent F Blocked Obstructions num= 3 Sta L Sta R Elev Sta L Sta R Elev Sta L Sta R Elev CROSS SECTION RIVER: Long Run-Jacktow REACH: Long Run-Jacktow RS: INPUT Description: Station Elevation Data num=
23 Bank Sta: Left Right Lengths: Left Channel Right Coeff Contr. Expan Ineffective Flow num= 1 Sta L Sta R Elev Permanent F Blocked Obstructions num= 2 Sta L Sta R Elev Sta L Sta R Elev CROSS SECTION RIVER: Long Run-Jacktow REACH: Long Run-Jacktow RS: INPUT Description: Station Elevation Data num= Bank Sta: Left Right Lengths: Left Channel Right Coeff Contr. Expan Ineffective Flow num= 1 Sta L Sta R Elev Permanent F Blocked Obstructions num= 3 Sta L Sta R Elev Sta L Sta R Elev Sta L Sta R Elev CROSS SECTION RIVER: Long Run-Jacktow
24 REACH: Long Run-Jacktow RS: INPUT Description: Station Elevation Data num= Bank Sta: Left Right Lengths: Left Channel Right Coeff Contr. Expan Blocked Obstructions num= 3 Sta L Sta R Elev Sta L Sta R Elev Sta L Sta R Elev CROSS SECTION RIVER: Long Run-Jacktow REACH: Long Run-Jacktow RS: INPUT Description: Station Elevation Data num= Bank Sta: Left Right Lengths: Left Channel Right Coeff Contr. Expan.
25 Blocked Obstructions num= 2 Sta L Sta R Elev Sta L Sta R Elev CULVERT RIVER: Long Run-Jacktow REACH: Long Run-Jacktow RS: 5625 INPUT Description: Distance from Upstream XS = 32 Deck/Roadway Width = 22 Weir Coefficient = 2.6 Upstream Deck/Roadway Coordinates num= 6 Sta Hi Cord Lo Cord Sta Hi Cord Lo Cord Sta Hi Cord Lo Cord Upstream Bridge Cross Section Data Station Elevation Data num= Bank Sta: Left Right Coeff Contr. Expan Blocked Obstructions num= 2 Sta L Sta R Elev Sta L Sta R Elev Downstream Deck/Roadway Coordinates num= 6 Sta Hi Cord Lo Cord Sta Hi Cord Lo Cord Sta Hi Cord Lo Cord Downstream Bridge Cross Section Data Station Elevation Data num=
26 Bank Sta: Left Right Coeff Contr. Expan Blocked Obstructions num= 3 Sta L Sta R Elev Sta L Sta R Elev Sta L Sta R Elev Upstream Embankment side slope = 0 horiz. to 1.0 vertical Downstream Embankment side slope = 0 horiz. to 1.0 vertical Maximum allowable submergence for weir flow =.98 Elevation at which weir flow begins = Energy head used in spillway design = Spillway height used in design = Weir crest shape = Broad Crested Number of Culverts = 1 Culvert Name Shape Rise Span Culvert #1 Ellipse 6 8 FHWA Chart # 29- Horizontal Ellipse; Concrete FHWA Scale # 1 - Square edge with headwall Solution Criteria = Highest U.S. EG Culvert Upstrm Dist Length Top n Bottom n Depth Blocked Entrance Loss Coef Exit Loss Coef Upstream Elevation = Centerline Station = Downstream Elevation = Centerline Station = CULVERT OUTPUT Profile #PF 1 Culv Group: Culvert #1 Q Culv Group (cfs) Culv Full Len (ft) # Barrels 1 Culv Vel US (ft/s) 2.42 Q Barrel (cfs) Culv Vel DS (ft/s) 2.49 E.G. US. (ft) Culv Inv El Up (ft) W.S. US. (ft) Culv Inv El Dn (ft) E.G. DS (ft) Culv Frctn Ls (ft) 3.36 W.S. DS (ft) Culv Exit Loss (ft) 0.00 Delta EG (ft) 3.43 Culv Entr Loss (ft) 0.07 Delta WS (ft) 4.39 Q Weir (cfs) E.G. IC (ft) Weir Sta Lft (ft) E.G. OC (ft) Weir Sta Rgt (ft) Culvert Control Outlet Weir Submerg 0.00 Culv WS Inlet (ft) Weir Max Depth (ft) 2.54 Culv WS Outlet (ft) Weir Avg Depth (ft) 1.74 Culv Nml Depth (ft) 6.00 Weir Flow Area (sq ft) Culv Crt Depth (ft) 2.21 Min El Weir Flow (ft) Warning: During subcritical analysis, with the exit loss set =1.0, the projected WSEL in culvert has a lower energy than the downstream energy. Most likely, the downstream cross section blocks part of the culvert or the ineffective area is set too far in. Instead of projecting the WSEL, the program did an energy balance to get the WSEL inside the culvert at the downstream end. Note: The normal depth exceeds the height of the culvert. The program assumes that the normal depth is equal to the height of the culvert. CROSS SECTION RIVER: Long Run-Jacktow REACH: Long Run-Jacktow RS: INPUT
27 Description: Station Elevation Data num= Bank Sta: Left Right Lengths: Left Channel Right Coeff Contr. Expan Blocked Obstructions num= 3 Sta L Sta R Elev Sta L Sta R Elev Sta L Sta R Elev CROSS SECTION RIVER: Long Run-Jacktow REACH: Long Run-Jacktow RS: INPUT Description: Station Elevation Data num= Bank Sta: Left Right Lengths: Left Channel Right Coeff Contr. Expan.
28 Blocked Obstructions num= 3 Sta L Sta R Elev Sta L Sta R Elev Sta L Sta R Elev CROSS SECTION RIVER: Long Run-Jacktow REACH: Long Run-Jacktow RS: INPUT Description: Station Elevation Data num= Bank Sta: Left Right Lengths: Left Channel Right Coeff Contr. Expan Blocked Obstructions num= 2 Sta L Sta R Elev Sta L Sta R Elev CROSS SECTION RIVER: Long Run-Jacktow REACH: Long Run-Jacktow RS: INPUT Description: Station Elevation Data num=
29 Bank Sta: Left Right Lengths: Left Channel Right Coeff Contr. Expan Ineffective Flow num= 1 Sta L Sta R Elev Permanent F Blocked Obstructions num= 2 Sta L Sta R Elev Sta L Sta R Elev CROSS SECTION RIVER: Long Run-Jacktow REACH: Long Run-Jacktow RS: INPUT Description: Station Elevation Data num= Bank Sta: Left Right Lengths: Left Channel Right Coeff Contr. Expan Ineffective Flow num= 1 Sta L Sta R Elev Permanent F Blocked Obstructions num= 2 Sta L Sta R Elev Sta L Sta R Elev CROSS SECTION RIVER: Long Run-Jacktow
30 REACH: Long Run-Jacktow RS: INPUT Description: Station Elevation Data num= Bank Sta: Left Right Lengths: Left Channel Right Coeff Contr. Expan Ineffective Flow num= 1 Sta L Sta R Elev Permanent F Blocked Obstructions num= 3 Sta L Sta R Elev Sta L Sta R Elev Sta L Sta R Elev CROSS SECTION RIVER: Long Run-Jacktow REACH: Long Run-Jacktow RS: INPUT Description: Station Elevation Data num=
31 Bank Sta: Left Right Lengths: Left Channel Right Coeff Contr. Expan Ineffective Flow num= 1 Sta L Sta R Elev Permanent F Blocked Obstructions num= 1 Sta L Sta R Elev CULVERT RIVER: Long Run-Jacktow REACH: Long Run-Jacktow RS: 4496 INPUT Description: Distance from Upstream XS = 19 Deck/Roadway Width = 12 Weir Coefficient = 2.6 Upstream Deck/Roadway Coordinates num= 3 Sta Hi Cord Lo Cord Sta Hi Cord Lo Cord Sta Hi Cord Lo Cord Upstream Bridge Cross Section Data Station Elevation Data num= Bank Sta: Left Right Coeff Contr. Expan Ineffective Flow num= 1 Sta L Sta R Elev Permanent F Blocked Obstructions num= 1 Sta L Sta R Elev Downstream Deck/Roadway Coordinates num= 3 Sta Hi Cord Lo Cord Sta Hi Cord Lo Cord Sta Hi Cord Lo Cord
32 Downstream Bridge Cross Section Data Station Elevation Data num= Bank Sta: Left Right Coeff Contr. Expan Ineffective Flow num= 2 Sta L Sta R Elev Permanent F F Upstream Embankment side slope = 0 horiz. to 1.0 vertical Downstream Embankment side slope = 0 horiz. to 1.0 vertical Maximum allowable submergence for weir flow =.98 Elevation at which weir flow begins = Energy head used in spillway design = Spillway height used in design = Weir crest shape = Broad Crested Number of Culverts = 1 Culvert Name Shape Rise Span Culvert #1 Circular 3 FHWA Chart # 2 - Corrugated Metal Pipe Culvert FHWA Scale # 3 - Pipe projecting from fill Solution Criteria = Highest U.S. EG Culvert Upstrm Dist Length Top n Bottom n Depth Blocked Entrance Loss Coef Exit Loss Coef Upstream Elevation = Centerline Station = Downstream Elevation = Centerline Station = CULVERT OUTPUT Profile #PF 1 Culv Group: Culvert #1 Q Culv Group (cfs) 9.83 Culv Full Len (ft) # Barrels 1 Culv Vel US (ft/s) 3.10 Q Barrel (cfs) 9.83 Culv Vel DS (ft/s) 2.26 E.G. US. (ft) Culv Inv El Up (ft) W.S. US. (ft) Culv Inv El Dn (ft) E.G. DS (ft) Culv Frctn Ls (ft) 0.02 W.S. DS (ft) Culv Exit Loss (ft) 0.00 Delta EG (ft) 0.14 Culv Entr Loss (ft) 0.12 Delta WS (ft) 0.26 Q Weir (cfs) E.G. IC (ft) Weir Sta Lft (ft) E.G. OC (ft) Weir Sta Rgt (ft)
33 Culvert Control Outlet Weir Submerg 0.65 Culv WS Inlet (ft) Weir Max Depth (ft) 1.31 Culv WS Outlet (ft) Weir Avg Depth (ft) 1.03 Culv Nml Depth (ft) 0.72 Weir Flow Area (sq ft) Culv Crt Depth (ft) 0.99 Min El Weir Flow (ft) Warning: During subcritical analysis, with the exit loss set =1.0, the projected WSEL in culvert has a lower energy than the downstream energy. Most likely, the downstream cross section blocks part of the culvert or the ineffective area is set too far in. Instead of projecting the WSEL, the program did an energy balance to get the WSEL inside the culvert at the downstream end. CROSS SECTION RIVER: Long Run-Jacktow REACH: Long Run-Jacktow RS: INPUT Description: Station Elevation Data num= Bank Sta: Left Right Lengths: Left Channel Right Coeff Contr. Expan Ineffective Flow num= 2 Sta L Sta R Elev Permanent F F CROSS SECTION RIVER: Long Run-Jacktow REACH: Long Run-Jacktow RS: INPUT Description: Station Elevation Data num=
34 Bank Sta: Left Right Lengths: Left Channel Right Coeff Contr. Expan Ineffective Flow num= 1 Sta L Sta R Elev Permanent F Blocked Obstructions num= 1 Sta L Sta R Elev CROSS SECTION RIVER: Long Run-Jacktow REACH: Long Run-Jacktow RS: INPUT Description: Station Elevation Data num= Bank Sta: Left Right Lengths: Left Channel Right Coeff Contr. Expan Ineffective Flow num= 1
35 Sta L Sta R Elev Permanent F Blocked Obstructions num= 1 Sta L Sta R Elev CROSS SECTION RIVER: Long Run-Jacktow REACH: Long Run-Jacktow RS: INPUT Description: Station Elevation Data num= Bank Sta: Left Right Lengths: Left Channel Right Coeff Contr. Expan Ineffective Flow num= 1 Sta L Sta R Elev Permanent F CROSS SECTION RIVER: Long Run-Jacktow REACH: Long Run-Jacktow RS: INPUT Description: Station Elevation Data num=
36 Bank Sta: Left Right Lengths: Left Channel Right Coeff Contr. Expan Blocked Obstructions num= 1 Sta L Sta R Elev CROSS SECTION RIVER: Long Run-Jacktow REACH: Long Run-Jacktow RS: INPUT Description: Station Elevation Data num= Bank Sta: Left Right Lengths: Left Channel Right Coeff Contr. Expan Ineffective Flow num= 1 Sta L Sta R Elev Permanent F Blocked Obstructions num= 1 Sta L Sta R Elev CROSS SECTION RIVER: Long Run-Jacktow REACH: Long Run-Jacktow RS: INPUT Description: Station Elevation Data num=
37 Bank Sta: Left Right Lengths: Left Channel Right Coeff Contr. Expan Blocked Obstructions num= 3 Sta L Sta R Elev Sta L Sta R Elev Sta L Sta R Elev CULVERT RIVER: Long Run-Jacktow REACH: Long Run-Jacktow RS: 3692 INPUT Description: Distance from Upstream XS = 53 Deck/Roadway Width = 30 Weir Coefficient = 2.6 Upstream Deck/Roadway Coordinates num= 5 Sta Hi Cord Lo Cord Sta Hi Cord Lo Cord Sta Hi Cord Lo Cord Upstream Bridge Cross Section Data Station Elevation Data num= Bank Sta: Left Right Coeff Contr. Expan
38 Blocked Obstructions num= 3 Sta L Sta R Elev Sta L Sta R Elev Sta L Sta R Elev Downstream Deck/Roadway Coordinates num= 6 Sta Hi Cord Lo Cord Sta Hi Cord Lo Cord Sta Hi Cord Lo Cord Downstream Bridge Cross Section Data Station Elevation Data num= Bank Sta: Left Right Coeff Contr. Expan Blocked Obstructions num= 3 Sta L Sta R Elev Sta L Sta R Elev Sta L Sta R Elev Upstream Embankment side slope = 0 horiz. to 1.0 vertical Downstream Embankment side slope = 0 horiz. to 1.0 vertical Maximum allowable submergence for weir flow =.98 Elevation at which weir flow begins = Energy head used in spillway design = Spillway height used in design = Weir crest shape = Broad Crested Number of Culverts = 1 Culvert Name Shape Rise Span Culvert #1 Circular 6 FHWA Chart # 2 - Corrugated Metal Pipe Culvert FHWA Scale # 1 - Headwall Solution Criteria = Highest U.S. EG Culvert Upstrm Dist Length Top n Bottom n Depth Blocked Entrance Loss Coef Exit Loss Coef Upstream Elevation = Centerline Station = 391 Downstream Elevation = Centerline Station = CULVERT OUTPUT Profile #PF 1 Culv Group: Culvert #1 Q Culv Group (cfs) Culv Full Len (ft) # Barrels 1 Culv Vel US (ft/s) 2.95
39 Q Barrel (cfs) Culv Vel DS (ft/s) 2.95 E.G. US. (ft) Culv Inv El Up (ft) W.S. US. (ft) Culv Inv El Dn (ft) E.G. DS (ft) Culv Frctn Ls (ft) 5.55 W.S. DS (ft) Culv Exit Loss (ft) 0.00 Delta EG (ft) 5.66 Culv Entr Loss (ft) 0.11 Delta WS (ft) 6.66 Q Weir (cfs) E.G. IC (ft) Weir Sta Lft (ft) E.G. OC (ft) Weir Sta Rgt (ft) Culvert Control Outlet Weir Submerg 0.00 Culv WS Inlet (ft) Weir Max Depth (ft) 1.97 Culv WS Outlet (ft) Weir Avg Depth (ft) 1.41 Culv Nml Depth (ft) Weir Flow Area (sq ft) Culv Crt Depth (ft) 2.45 Min El Weir Flow (ft) Warning: During subcritical analysis, with the exit loss set =1.0, the projected WSEL in culvert has a lower energy than the downstream energy. Most likely, the downstream cross section blocks part of the culvert or the ineffective area is set too far in. Instead of projecting the WSEL, the program did an energy balance to get the WSEL inside the culvert at the downstream end. CROSS SECTION RIVER: Long Run-Jacktow REACH: Long Run-Jacktow RS: INPUT Description: Station Elevation Data num= Bank Sta: Left Right Lengths: Left Channel Right Coeff Contr. Expan Blocked Obstructions num= 3 Sta L Sta R Elev Sta L Sta R Elev Sta L Sta R Elev CROSS SECTION RIVER: Long Run-Jacktow REACH: Long Run-Jacktow RS:
40 INPUT Description: Station Elevation Data num= Bank Sta: Left Right Lengths: Left Channel Right Coeff Contr. Expan Ineffective Flow num= 1 Sta L Sta R Elev Permanent F Blocked Obstructions num= 2 Sta L Sta R Elev Sta L Sta R Elev CROSS SECTION RIVER: Long Run-Jacktow REACH: Long Run-Jacktow RS: INPUT Description: Station Elevation Data num=
41 Bank Sta: Left Right Lengths: Left Channel Right Coeff Contr. Expan Ineffective Flow num= 1 Sta L Sta R Elev Permanent F Blocked Obstructions num= 2 Sta L Sta R Elev Sta L Sta R Elev CROSS SECTION RIVER: Long Run-Jacktow REACH: Long Run-Jacktow RS: INPUT Description: Station Elevation Data num= Bank Sta: Left Right Lengths: Left Channel Right Coeff Contr. Expan Blocked Obstructions num= 3 Sta L Sta R Elev Sta L Sta R Elev Sta L Sta R Elev CROSS SECTION RIVER: Long Run-Jacktow REACH: Long Run-Jacktow RS: INPUT Description: Station Elevation Data num=
42 Bank Sta: Left Right Lengths: Left Channel Right Coeff Contr. Expan Blocked Obstructions num= 2 Sta L Sta R Elev Sta L Sta R Elev CROSS SECTION RIVER: Long Run-Jacktow REACH: Long Run-Jacktow RS: INPUT Description: Station Elevation Data num= Bank Sta: Left Right Lengths: Left Channel Right Coeff Contr. Expan Blocked Obstructions num= 1 Sta L Sta R Elev CROSS SECTION RIVER: Long Run-Jacktow REACH: Long Run-Jacktow RS:
43 INPUT Description: Station Elevation Data num= Bank Sta: Left Right Lengths: Left Channel Right Coeff Contr. Expan Ineffective Flow num= 1 Sta L Sta R Elev Permanent F Blocked Obstructions num= 3 Sta L Sta R Elev Sta L Sta R Elev Sta L Sta R Elev CULVERT RIVER: Long Run-Jacktow REACH: Long Run-Jacktow RS: 2377 INPUT Description: Distance from Upstream XS = 41 Deck/Roadway Width = 21 Weir Coefficient = 2.6 Upstream Deck/Roadway Coordinates num= 8 Sta Hi Cord Lo Cord Sta Hi Cord Lo Cord Sta Hi Cord Lo Cord Upstream Bridge Cross Section Data Station Elevation Data num=
44 Bank Sta: Left Right Coeff Contr. Expan Ineffective Flow num= 1 Sta L Sta R Elev Permanent F Blocked Obstructions num= 3 Sta L Sta R Elev Sta L Sta R Elev Sta L Sta R Elev Downstream Deck/Roadway Coordinates num= 8 Sta Hi Cord Lo Cord Sta Hi Cord Lo Cord Sta Hi Cord Lo Cord Downstream Bridge Cross Section Data Station Elevation Data num= Bank Sta: Left Right Coeff Contr. Expan Blocked Obstructions num= 2 Sta L Sta R Elev Sta L Sta R Elev Upstream Embankment side slope = 0 horiz. to 1.0 vertical Downstream Embankment side slope = 0 horiz. to 1.0 vertical
45 Maximum allowable submergence for weir flow =.98 Elevation at which weir flow begins = Energy head used in spillway design = Spillway height used in design = Weir crest shape = Broad Crested Number of Culverts = 1 Culvert Name Shape Rise Span Culvert #1 Box 7 5 FHWA Chart # 8 - flared wingwalls FHWA Scale # 1 - Wingwall flared 30 to 75 deg. Solution Criteria = Highest U.S. EG Culvert Upstrm Dist Length Top n Bottom n Depth Blocked Entrance Loss Coef Exit Loss Coef Upstream Elevation = Centerline Station = Downstream Elevation = Centerline Station = CULVERT OUTPUT Profile #PF 1 Culv Group: Culvert #1 Q Culv Group (cfs) Culv Full Len (ft) # Barrels 1 Culv Vel US (ft/s) Q Barrel (cfs) Culv Vel DS (ft/s) E.G. US. (ft) Culv Inv El Up (ft) W.S. US. (ft) Culv Inv El Dn (ft) E.G. DS (ft) Culv Frctn Ls (ft) 0.60 W.S. DS (ft) Culv Exit Loss (ft) 4.43 Delta EG (ft) 6.84 Culv Entr Loss (ft) 1.81 Delta WS (ft) 7.23 Q Weir (cfs) E.G. IC (ft) Weir Sta Lft (ft) E.G. OC (ft) Weir Sta Rgt (ft) Culvert Control Outlet Weir Submerg 0.00 Culv WS Inlet (ft) Weir Max Depth (ft) 1.61 Culv WS Outlet (ft) Weir Avg Depth (ft) 1.11 Culv Nml Depth (ft) 3.63 Weir Flow Area (sq ft) Culv Crt Depth (ft) 4.52 Min El Weir Flow (ft) Note: The flow in the culvert is entirely supercritical. CROSS SECTION RIVER: Long Run-Jacktow REACH: Long Run-Jacktow RS: INPUT Description: Station Elevation Data num= Bank Sta: Left Right Lengths: Left Channel Right Coeff Contr. Expan.
46 Blocked Obstructions num= 2 Sta L Sta R Elev Sta L Sta R Elev CROSS SECTION RIVER: Long Run-Jacktow REACH: Long Run-Jacktow RS: INPUT Description: Station Elevation Data num= Bank Sta: Left Right Lengths: Left Channel Right Coeff Contr. Expan Ineffective Flow num= 1 Sta L Sta R Elev Permanent F Blocked Obstructions num= 2 Sta L Sta R Elev Sta L Sta R Elev CULVERT RIVER: Long Run-Jacktow REACH: Long Run-Jacktow RS: 1865 INPUT Description: Distance from Upstream XS = 71 Deck/Roadway Width = 26 Weir Coefficient = 2.6 Upstream Deck/Roadway Coordinates num= 6 Sta Hi Cord Lo Cord Sta Hi Cord Lo Cord Sta Hi Cord Lo Cord Upstream Bridge Cross Section Data Station Elevation Data num=
47 Bank Sta: Left Right Coeff Contr. Expan Ineffective Flow num= 1 Sta L Sta R Elev Permanent F Blocked Obstructions num= 2 Sta L Sta R Elev Sta L Sta R Elev Downstream Deck/Roadway Coordinates num= 6 Sta Hi Cord Lo Cord Sta Hi Cord Lo Cord Sta Hi Cord Lo Cord Downstream Bridge Cross Section Data Station Elevation Data num= Bank Sta: Left Right Coeff Contr. Expan Ineffective Flow num= 1 Sta L Sta R Elev Permanent F
48 Blocked Obstructions num= 2 Sta L Sta R Elev Sta L Sta R Elev Upstream Embankment side slope = 0 horiz. to 1.0 vertical Downstream Embankment side slope = 0 horiz. to 1.0 vertical Maximum allowable submergence for weir flow =.98 Elevation at which weir flow begins = Energy head used in spillway design = Spillway height used in design = Weir crest shape = Broad Crested Number of Culverts = 1 Culvert Name Shape Rise Span Culvert #1 Circular 6 FHWA Chart # 2 - Corrugated Metal Pipe Culvert FHWA Scale # 3 - Pipe projecting from fill Solution Criteria = Highest U.S. EG Culvert Upstrm Dist Length Top n Bottom n Depth Blocked Entrance Loss Coef Exit Loss Coef Upstream Elevation = Centerline Station = Downstream Elevation = Centerline Station = CULVERT OUTPUT Profile #PF 1 Culv Group: Culvert #1 Q Culv Group (cfs) Culv Full Len (ft) # Barrels 1 Culv Vel US (ft/s) Q Barrel (cfs) Culv Vel DS (ft/s) 8.40 E.G. US. (ft) Culv Inv El Up (ft) W.S. US. (ft) Culv Inv El Dn (ft) E.G. DS (ft) Culv Frctn Ls (ft) 1.31 W.S. DS (ft) Culv Exit Loss (ft) 0.93 Delta EG (ft) 3.91 Culv Entr Loss (ft) 1.66 Delta WS (ft) 3.94 Q Weir (cfs) E.G. IC (ft) Weir Sta Lft (ft) E.G. OC (ft) Weir Sta Rgt (ft) Culvert Control Outlet Weir Submerg 0.00 Culv WS Inlet (ft) Weir Max Depth (ft) 2.01 Culv WS Outlet (ft) Weir Avg Depth (ft) 1.35 Culv Nml Depth (ft) 3.85 Weir Flow Area (sq ft) Culv Crt Depth (ft) 3.84 Min El Weir Flow (ft) Note: During subcritical analysis, the backwater through the culvert the solution went to critical depth. The program then assumed critical depth at the inlet. CROSS SECTION RIVER: Long Run-Jacktow REACH: Long Run-Jacktow RS: INPUT Description: Station Elevation Data num=
49 Bank Sta: Left Right Lengths: Left Channel Right Coeff Contr. Expan Ineffective Flow num= 1 Sta L Sta R Elev Permanent F Blocked Obstructions num= 2 Sta L Sta R Elev Sta L Sta R Elev CROSS SECTION RIVER: Long Run-Jacktow REACH: Long Run-Jacktow RS: INPUT Description: Station Elevation Data num= Bank Sta: Left Right Lengths: Left Channel Right Coeff Contr. Expan Ineffective Flow num= 1 Sta L Sta R Elev Permanent F Blocked Obstructions num= 2 Sta L Sta R Elev Sta L Sta R Elev CROSS SECTION
50 RIVER: Long Run-Jacktow REACH: Long Run-Jacktow RS: INPUT Description: Station Elevation Data num= Bank Sta: Left Right Lengths: Left Channel Right Coeff Contr. Expan Ineffective Flow num= 1 Sta L Sta R Elev Permanent F Blocked Obstructions num= 2 Sta L Sta R Elev Sta L Sta R Elev CROSS SECTION RIVER: Long Run-Jacktow REACH: Long Run-Jacktow RS: INPUT Description: Station Elevation Data num=
51 Bank Sta: Left Right Lengths: Left Channel Right Coeff Contr. Expan Ineffective Flow num= 1 Sta L Sta R Elev Permanent F Blocked Obstructions num= 2 Sta L Sta R Elev Sta L Sta R Elev CROSS SECTION RIVER: Long Run-Jacktow REACH: Long Run-Jacktow RS: 1270 INPUT Description: Station Elevation Data num= Bank Sta: Left Right Lengths: Left Channel Right Coeff Contr. Expan Ineffective Flow num= 2 Sta L Sta R Elev Permanent F F CULVERT RIVER: Long Run-Jacktow REACH: Long Run-Jacktow RS: 1235 INPUT Description: Distance from Upstream XS = 24 Deck/Roadway Width = 28 Weir Coefficient = 2.6 Upstream Deck/Roadway Coordinates num= 4 Sta Hi Cord Lo Cord Sta Hi Cord Lo Cord Sta Hi Cord Lo Cord Upstream Bridge Cross Section Data Station Elevation Data num=
52 Bank Sta: Left Right Coeff Contr. Expan Ineffective Flow num= 2 Sta L Sta R Elev Permanent F F Downstream Deck/Roadway Coordinates num= 6 Sta Hi Cord Lo Cord Sta Hi Cord Lo Cord Sta Hi Cord Lo Cord Downstream Bridge Cross Section Data Station Elevation Data num= Bank Sta: Left Right Coeff Contr. Expan Ineffective Flow num= 2 Sta L Sta R Elev Permanent F F Upstream Embankment side slope = 0 horiz. to 1.0 vertical Downstream Embankment side slope = 0 horiz. to 1.0 vertical Maximum allowable submergence for weir flow =.98 Elevation at which weir flow begins = Energy head used in spillway design = Spillway height used in design = Weir crest shape = Broad Crested Number of Culverts = 1 Culvert Name Shape Rise Span Culvert #1 Arch 7 12
53 FHWA Chart # 41- Arch; Corrugated metal FHWA Scale # 1-90 Degree headwall Solution Criteria = Highest U.S. EG Culvert Upstrm Dist Length Top n Bottom n Depth Blocked Entrance Loss Coef Exit Loss Coef Upstream Elevation = Centerline Station = 298 Downstream Elevation = Centerline Station = 298 CULVERT OUTPUT Profile #PF 1 Culv Group: Culvert #1 Q Culv Group (cfs) Culv Full Len (ft) # Barrels 1 Culv Vel US (ft/s) Q Barrel (cfs) Culv Vel DS (ft/s) E.G. US. (ft) Culv Inv El Up (ft) W.S. US. (ft) Culv Inv El Dn (ft) E.G. DS (ft) Culv Frctn Ls (ft) 1.57 W.S. DS (ft) Culv Exit Loss (ft) 0.81 Delta EG (ft) 3.34 Culv Entr Loss (ft) 0.95 Delta WS (ft) 4.68 Q Weir (cfs) E.G. IC (ft) Weir Sta Lft (ft) E.G. OC (ft) Weir Sta Rgt (ft) Culvert Control Outlet Weir Submerg 0.00 Culv WS Inlet (ft) Weir Max Depth (ft) 1.19 Culv WS Outlet (ft) Weir Avg Depth (ft) 0.69 Culv Nml Depth (ft) 2.62 Weir Flow Area (sq ft) Culv Crt Depth (ft) 3.47 Min El Weir Flow (ft) Warning: During subcritical analysis, while trying to calculate culvert and weir flow, the program could not get a balance of energy within the specified tolerance and number of trials. The program used the solution with the minimum error. Warning: During the culvert inlet control computations, the program could not balance the culvert/weir flow. The reported inlet energy grade answer may not be valid. Warning: During the culvert outlet control computations, the program could not balance the culvert/weir flow. The reported outlet energy grade answer may not be valid. Note: The flow in the culvert is entirely supercritical. CROSS SECTION RIVER: Long Run-Jacktow REACH: Long Run-Jacktow RS: INPUT Description: Station Elevation Data num= Bank Sta: Left Right Lengths: Left Channel Right Coeff Contr. Expan
54 Ineffective Flow num= 2 Sta L Sta R Elev Permanent F F CROSS SECTION RIVER: Long Run-Jacktow REACH: Long Run-Jacktow RS: INPUT Description: Station Elevation Data num= Bank Sta: Left Right Lengths: Left Channel Right Coeff Contr. Expan Ineffective Flow num= 1 Sta L Sta R Elev Permanent F CROSS SECTION RIVER: Long Run-Jacktow REACH: Long Run-Jacktow RS: 967 INPUT Description: FEMA L Station Elevation Data num= Bank Sta: Left Right Lengths: Left Channel Right Coeff Contr. Expan CROSS SECTION RIVER: Long Run-Jacktow REACH: Long Run-Jacktow RS: 0 INPUT Description:
55 Station Elevation Data num= Bank Sta: Left Right Coeff Contr. Expan
56 EXISTING CONDITIONS HEC-RAS SUMMARY TABLE
57 HEC-RAS Plan: EX-Revised River: Long Run-Jacktow Reach: Long Run-Jacktow Profile: PF 1 Reach River Sta Profile Q Total Min Ch El W.S. Elev Crit W.S. E.G. Elev E.G. Slope Vel Chnl Flow Area Top Width Froude # Chl (cfs) (ft) (ft) (ft) (ft) (ft/ft) (ft/s) (sq ft) (ft) Long Run-Jacktow PF Long Run-Jacktow PF Long Run-Jacktow PF Long Run-Jacktow PF Long Run-Jacktow PF Long Run-Jacktow PF Long Run-Jacktow PF Long Run-Jacktow PF Long Run-Jacktow PF Long Run-Jacktow 6645 Culvert Long Run-Jacktow PF Long Run-Jacktow PF Long Run-Jacktow PF Long Run-Jacktow PF Long Run-Jacktow PF Long Run-Jacktow PF Long Run-Jacktow 5625 Culvert Long Run-Jacktow PF Long Run-Jacktow PF Long Run-Jacktow PF Long Run-Jacktow PF Long Run-Jacktow PF Long Run-Jacktow PF Long Run-Jacktow PF Long Run-Jacktow 4496 Culvert Long Run-Jacktow PF Long Run-Jacktow PF Long Run-Jacktow PF Long Run-Jacktow PF Long Run-Jacktow PF Long Run-Jacktow PF Long Run-Jacktow PF Long Run-Jacktow 3692 Culvert Long Run-Jacktow PF Long Run-Jacktow PF Long Run-Jacktow PF Long Run-Jacktow PF Long Run-Jacktow PF Long Run-Jacktow PF Long Run-Jacktow PF Long Run-Jacktow 2377 Culvert Long Run-Jacktow PF Long Run-Jacktow PF
58 HEC-RAS Plan: EX-Revised River: Long Run-Jacktow Reach: Long Run-Jacktow Profile: PF 1 (Continued) Reach River Sta Profile Q Total Min Ch El W.S. Elev Crit W.S. E.G. Elev E.G. Slope Vel Chnl Flow Area Top Width Froude # Chl (cfs) (ft) (ft) (ft) (ft) (ft/ft) (ft/s) (sq ft) (ft) Long Run-Jacktow 1865 Culvert Long Run-Jacktow PF Long Run-Jacktow PF Long Run-Jacktow PF Long Run-Jacktow PF Long Run-Jacktow 1270 PF Long Run-Jacktow 1235 Culvert Long Run-Jacktow PF Long Run-Jacktow PF Long Run-Jacktow 967 PF Long Run-Jacktow 0 PF
59 MODIFIED TOWNSHIP CULVERTS HEC-RAS SUMMARY TABLE
60 HEC-RAS River: Long Run-Jacktow Reach: Long Run-Jacktow Profile: PF 1 Reach River Sta Profile Plan Q Total Min Ch El W.S. Elev Crit W.S. E.G. Elev E.G. Slope Vel Chnl Flow Area Top Width Froude # Chl (cfs) (ft) (ft) (ft) (ft) (ft/ft) (ft/s) (sq ft) (ft) Long Run-Jacktow PF 1 ABRAMS Long Run-Jacktow PF 1 EX-Revised Long Run-Jacktow PF 1 ABRAMS Long Run-Jacktow PF 1 EX-Revised Long Run-Jacktow PF 1 ABRAMS Long Run-Jacktow PF 1 EX-Revised Long Run-Jacktow PF 1 ABRAMS Long Run-Jacktow PF 1 EX-Revised Long Run-Jacktow PF 1 ABRAMS Long Run-Jacktow PF 1 EX-Revised Long Run-Jacktow PF 1 ABRAMS Long Run-Jacktow PF 1 EX-Revised Long Run-Jacktow PF 1 ABRAMS Long Run-Jacktow PF 1 EX-Revised Long Run-Jacktow PF 1 ABRAMS Long Run-Jacktow PF 1 EX-Revised Long Run-Jacktow PF 1 ABRAMS Long Run-Jacktow PF 1 EX-Revised Long Run-Jacktow 6645 Culvert Long Run-Jacktow PF 1 ABRAMS Long Run-Jacktow PF 1 EX-Revised Long Run-Jacktow PF 1 ABRAMS Long Run-Jacktow PF 1 EX-Revised Long Run-Jacktow PF 1 ABRAMS Long Run-Jacktow PF 1 EX-Revised Long Run-Jacktow PF 1 ABRAMS Long Run-Jacktow PF 1 EX-Revised Long Run-Jacktow PF 1 ABRAMS Long Run-Jacktow PF 1 EX-Revised Long Run-Jacktow PF 1 ABRAMS Long Run-Jacktow PF 1 EX-Revised
61 HEC-RAS River: Long Run-Jacktow Reach: Long Run-Jacktow Profile: PF 1 (Continued) Reach River Sta Profile Plan Q Total Min Ch El W.S. Elev Crit W.S. E.G. Elev E.G. Slope Vel Chnl Flow Area Top Width Froude # Chl (cfs) (ft) (ft) (ft) (ft) (ft/ft) (ft/s) (sq ft) (ft) Long Run-Jacktow 5625 Culvert Long Run-Jacktow PF 1 ABRAMS Long Run-Jacktow PF 1 EX-Revised Long Run-Jacktow PF 1 ABRAMS Long Run-Jacktow PF 1 EX-Revised Long Run-Jacktow PF 1 ABRAMS Long Run-Jacktow PF 1 EX-Revised Long Run-Jacktow PF 1 ABRAMS Long Run-Jacktow PF 1 EX-Revised Long Run-Jacktow PF 1 ABRAMS Long Run-Jacktow PF 1 EX-Revised Long Run-Jacktow PF 1 ABRAMS Long Run-Jacktow PF 1 EX-Revised Long Run-Jacktow PF 1 ABRAMS Long Run-Jacktow PF 1 EX-Revised Long Run-Jacktow 4496 Culvert Long Run-Jacktow PF 1 ABRAMS Long Run-Jacktow PF 1 EX-Revised Long Run-Jacktow PF 1 ABRAMS Long Run-Jacktow PF 1 EX-Revised Long Run-Jacktow PF 1 ABRAMS Long Run-Jacktow PF 1 EX-Revised Long Run-Jacktow PF 1 ABRAMS Long Run-Jacktow PF 1 EX-Revised Long Run-Jacktow PF 1 ABRAMS Long Run-Jacktow PF 1 EX-Revised Long Run-Jacktow PF 1 ABRAMS Long Run-Jacktow PF 1 EX-Revised Long Run-Jacktow PF 1 ABRAMS Long Run-Jacktow PF 1 EX-Revised Long Run-Jacktow 3692 Culvert
62 HEC-RAS River: Long Run-Jacktow Reach: Long Run-Jacktow Profile: PF 1 (Continued) Reach River Sta Profile Plan Q Total Min Ch El W.S. Elev Crit W.S. E.G. Elev E.G. Slope Vel Chnl Flow Area Top Width Froude # Chl (cfs) (ft) (ft) (ft) (ft) (ft/ft) (ft/s) (sq ft) (ft) Long Run-Jacktow PF 1 ABRAMS Long Run-Jacktow PF 1 EX-Revised Long Run-Jacktow PF 1 ABRAMS Long Run-Jacktow PF 1 EX-Revised Long Run-Jacktow PF 1 ABRAMS Long Run-Jacktow PF 1 EX-Revised Long Run-Jacktow PF 1 ABRAMS Long Run-Jacktow PF 1 EX-Revised Long Run-Jacktow PF 1 ABRAMS Long Run-Jacktow PF 1 EX-Revised Long Run-Jacktow PF 1 ABRAMS Long Run-Jacktow PF 1 EX-Revised Long Run-Jacktow PF 1 ABRAMS Long Run-Jacktow PF 1 EX-Revised Long Run-Jacktow 2377 Culvert Long Run-Jacktow PF 1 ABRAMS Long Run-Jacktow PF 1 EX-Revised Long Run-Jacktow PF 1 ABRAMS Long Run-Jacktow PF 1 EX-Revised Long Run-Jacktow 1865 Culvert Long Run-Jacktow PF 1 ABRAMS Long Run-Jacktow PF 1 EX-Revised Long Run-Jacktow PF 1 ABRAMS Long Run-Jacktow PF 1 EX-Revised Long Run-Jacktow PF 1 ABRAMS Long Run-Jacktow PF 1 EX-Revised Long Run-Jacktow PF 1 ABRAMS Long Run-Jacktow PF 1 EX-Revised Long Run-Jacktow 1270 PF 1 ABRAMS Long Run-Jacktow 1270 PF 1 EX-Revised
63 HEC-RAS River: Long Run-Jacktow Reach: Long Run-Jacktow Profile: PF 1 (Continued) Reach River Sta Profile Plan Q Total Min Ch El W.S. Elev Crit W.S. E.G. Elev E.G. Slope Vel Chnl Flow Area Top Width Froude # Chl (cfs) (ft) (ft) (ft) (ft) (ft/ft) (ft/s) (sq ft) (ft) Long Run-Jacktow 1235 Culvert Long Run-Jacktow PF 1 ABRAMS Long Run-Jacktow PF 1 EX-Revised Long Run-Jacktow PF 1 ABRAMS Long Run-Jacktow PF 1 EX-Revised Long Run-Jacktow 967 PF 1 ABRAMS Long Run-Jacktow 967 PF 1 EX-Revised Long Run-Jacktow 0 PF 1 ABRAMS Long Run-Jacktow 0 PF 1 EX-Revised
64 CULVERT WATER SURFACE ELEVATION REDUCTION SKETCHES
65 WAINWRIGHT DRIVE CULVERT REPLACEMENT EFFECTS
66
67 ABRAMS DRIVE CULVERT REPLACEMENT EFFECTS
68
69 REBECCAS STREET CULVERT REPLACEMENT EFFECTS
70
71 S. WHITMORE ROAD CULVERT REPLACEMENT EFFECTS

72
73 ROTH DRIVE ADDITIONAL FLOOD PIPES
74 96003 HEC-RAS Plan: 1) RothFloodPipes 10/11/2011 2) EX-Revised 10/10/ Legend WS PF 1 - EX-Revised WS PF 1 - RothFloodPipes Ground Ineff 1030 Bank Sta 1020 Elevation (ft) Station (ft)
75 HEC-RAS River: Long Run-Jacktow Reach: Long Run-Jacktow Profile: PF 1 Reach River Sta Profile Plan Q Total Min Ch El W.S. Elev Crit W.S. E.G. Elev E.G. Slope Vel Chnl Flow Area Top Width Froude # Chl (cfs) (ft) (ft) (ft) (ft) (ft/ft) (ft/s) (sq ft) (ft) Long Run-Jacktow PF 1 RothFloodPipes Long Run-Jacktow PF 1 EX-Revised Long Run-Jacktow PF 1 RothFloodPipes Long Run-Jacktow PF 1 EX-Revised Long Run-Jacktow PF 1 RothFloodPipes Long Run-Jacktow PF 1 EX-Revised Long Run-Jacktow PF 1 RothFloodPipes Long Run-Jacktow PF 1 EX-Revised Long Run-Jacktow PF 1 RothFloodPipes Long Run-Jacktow PF 1 EX-Revised Long Run-Jacktow PF 1 RothFloodPipes Long Run-Jacktow PF 1 EX-Revised Long Run-Jacktow PF 1 RothFloodPipes Long Run-Jacktow PF 1 EX-Revised Long Run-Jacktow PF 1 RothFloodPipes Long Run-Jacktow PF 1 EX-Revised Long Run-Jacktow PF 1 RothFloodPipes Long Run-Jacktow PF 1 EX-Revised Long Run-Jacktow 6645 Culvert Long Run-Jacktow PF 1 RothFloodPipes Long Run-Jacktow PF 1 EX-Revised Long Run-Jacktow PF 1 RothFloodPipes Long Run-Jacktow PF 1 EX-Revised Long Run-Jacktow PF 1 RothFloodPipes Long Run-Jacktow PF 1 EX-Revised Long Run-Jacktow PF 1 RothFloodPipes Long Run-Jacktow PF 1 EX-Revised Long Run-Jacktow PF 1 RothFloodPipes Long Run-Jacktow PF 1 EX-Revised Long Run-Jacktow PF 1 RothFloodPipes Long Run-Jacktow PF 1 EX-Revised
76 HEC-RAS River: Long Run-Jacktow Reach: Long Run-Jacktow Profile: PF 1 (Continued) Reach River Sta Profile Plan Q Total Min Ch El W.S. Elev Crit W.S. E.G. Elev E.G. Slope Vel Chnl Flow Area Top Width Froude # Chl (cfs) (ft) (ft) (ft) (ft) (ft/ft) (ft/s) (sq ft) (ft) Long Run-Jacktow 5625 Culvert Long Run-Jacktow PF 1 RothFloodPipes Long Run-Jacktow PF 1 EX-Revised Long Run-Jacktow PF 1 RothFloodPipes Long Run-Jacktow PF 1 EX-Revised Long Run-Jacktow PF 1 RothFloodPipes Long Run-Jacktow PF 1 EX-Revised Long Run-Jacktow PF 1 RothFloodPipes Long Run-Jacktow PF 1 EX-Revised Long Run-Jacktow PF 1 RothFloodPipes Long Run-Jacktow PF 1 EX-Revised Long Run-Jacktow PF 1 RothFloodPipes Long Run-Jacktow PF 1 EX-Revised Long Run-Jacktow PF 1 RothFloodPipes Long Run-Jacktow PF 1 EX-Revised Long Run-Jacktow 4496 Culvert Long Run-Jacktow PF 1 RothFloodPipes Long Run-Jacktow PF 1 EX-Revised Long Run-Jacktow PF 1 RothFloodPipes Long Run-Jacktow PF 1 EX-Revised Long Run-Jacktow PF 1 RothFloodPipes Long Run-Jacktow PF 1 EX-Revised Long Run-Jacktow PF 1 RothFloodPipes Long Run-Jacktow PF 1 EX-Revised Long Run-Jacktow PF 1 RothFloodPipes Long Run-Jacktow PF 1 EX-Revised Long Run-Jacktow PF 1 RothFloodPipes Long Run-Jacktow PF 1 EX-Revised Long Run-Jacktow PF 1 RothFloodPipes Long Run-Jacktow PF 1 EX-Revised
77 HEC-RAS River: Long Run-Jacktow Reach: Long Run-Jacktow Profile: PF 1 (Continued) Reach River Sta Profile Plan Q Total Min Ch El W.S. Elev Crit W.S. E.G. Elev E.G. Slope Vel Chnl Flow Area Top Width Froude # Chl (cfs) (ft) (ft) (ft) (ft) (ft/ft) (ft/s) (sq ft) (ft) Long Run-Jacktow 3692 Culvert Long Run-Jacktow PF 1 RothFloodPipes Long Run-Jacktow PF 1 EX-Revised Long Run-Jacktow PF 1 RothFloodPipes Long Run-Jacktow PF 1 EX-Revised Long Run-Jacktow PF 1 RothFloodPipes Long Run-Jacktow PF 1 EX-Revised Long Run-Jacktow PF 1 RothFloodPipes Long Run-Jacktow PF 1 EX-Revised Long Run-Jacktow PF 1 RothFloodPipes Long Run-Jacktow PF 1 EX-Revised Long Run-Jacktow PF 1 RothFloodPipes Long Run-Jacktow PF 1 EX-Revised Long Run-Jacktow PF 1 RothFloodPipes Long Run-Jacktow PF 1 EX-Revised Long Run-Jacktow 2377 Culvert Long Run-Jacktow PF 1 RothFloodPipes Long Run-Jacktow PF 1 EX-Revised Long Run-Jacktow PF 1 RothFloodPipes Long Run-Jacktow PF 1 EX-Revised Long Run-Jacktow 1865 Culvert Long Run-Jacktow PF 1 RothFloodPipes Long Run-Jacktow PF 1 EX-Revised Long Run-Jacktow PF 1 RothFloodPipes Long Run-Jacktow PF 1 EX-Revised Long Run-Jacktow PF 1 RothFloodPipes Long Run-Jacktow PF 1 EX-Revised Long Run-Jacktow PF 1 RothFloodPipes Long Run-Jacktow PF 1 EX-Revised
78 HEC-RAS River: Long Run-Jacktow Reach: Long Run-Jacktow Profile: PF 1 (Continued) Reach River Sta Profile Plan Q Total Min Ch El W.S. Elev Crit W.S. E.G. Elev E.G. Slope Vel Chnl Flow Area Top Width Froude # Chl (cfs) (ft) (ft) (ft) (ft) (ft/ft) (ft/s) (sq ft) (ft) Long Run-Jacktow 1270 PF 1 RothFloodPipes Long Run-Jacktow 1270 PF 1 EX-Revised Long Run-Jacktow 1235 Culvert Long Run-Jacktow PF 1 RothFloodPipes Long Run-Jacktow PF 1 EX-Revised Long Run-Jacktow PF 1 RothFloodPipes Long Run-Jacktow PF 1 EX-Revised Long Run-Jacktow 967 PF 1 RothFloodPipes Long Run-Jacktow 967 PF 1 EX-Revised Long Run-Jacktow 0 PF 1 RothFloodPipes Long Run-Jacktow 0 PF 1 EX-Revised
79 ROBBINS STATION ROAD MODIFIED CULVERTS HEC-RAS SUMMARY TABLE
80 HEC-RAS River: Long Run-Jacktow Reach: Long Run-Jacktow Profile: PF 1 Reach River Sta Profile Plan Q Total Min Ch El W.S. Elev Crit W.S. E.G. Elev E.G. Slope Vel Chnl Flow Area Top Width Froude # Chl (cfs) (ft) (ft) (ft) (ft) (ft/ft) (ft/s) (sq ft) (ft) Long Run-Jacktow PF 1 RobbinsStation Long Run-Jacktow PF 1 EX-Revised Long Run-Jacktow PF 1 RobbinsStation Long Run-Jacktow PF 1 EX-Revised Long Run-Jacktow PF 1 RobbinsStation Long Run-Jacktow PF 1 EX-Revised Long Run-Jacktow PF 1 RobbinsStation Long Run-Jacktow PF 1 EX-Revised Long Run-Jacktow PF 1 RobbinsStation Long Run-Jacktow PF 1 EX-Revised Long Run-Jacktow PF 1 RobbinsStation Long Run-Jacktow PF 1 EX-Revised Long Run-Jacktow PF 1 RobbinsStation Long Run-Jacktow PF 1 EX-Revised Long Run-Jacktow PF 1 RobbinsStation Long Run-Jacktow PF 1 EX-Revised Long Run-Jacktow PF 1 RobbinsStation Long Run-Jacktow PF 1 EX-Revised Long Run-Jacktow 6645 Culvert Long Run-Jacktow PF 1 RobbinsStation Long Run-Jacktow PF 1 EX-Revised Long Run-Jacktow PF 1 RobbinsStation Long Run-Jacktow PF 1 EX-Revised Long Run-Jacktow PF 1 RobbinsStation Long Run-Jacktow PF 1 EX-Revised Long Run-Jacktow PF 1 RobbinsStation Long Run-Jacktow PF 1 EX-Revised Long Run-Jacktow PF 1 RobbinsStation Long Run-Jacktow PF 1 EX-Revised Long Run-Jacktow PF 1 RobbinsStation Long Run-Jacktow PF 1 EX-Revised Long Run-Jacktow 5625 Culvert
81 HEC-RAS River: Long Run-Jacktow Reach: Long Run-Jacktow Profile: PF 1 (Continued) Reach River Sta Profile Plan Q Total Min Ch El W.S. Elev Crit W.S. E.G. Elev E.G. Slope Vel Chnl Flow Area Top Width Froude # Chl (cfs) (ft) (ft) (ft) (ft) (ft/ft) (ft/s) (sq ft) (ft) Long Run-Jacktow PF 1 RobbinsStation Long Run-Jacktow PF 1 EX-Revised Long Run-Jacktow PF 1 RobbinsStation Long Run-Jacktow PF 1 EX-Revised Long Run-Jacktow PF 1 RobbinsStation Long Run-Jacktow PF 1 EX-Revised Long Run-Jacktow PF 1 RobbinsStation Long Run-Jacktow PF 1 EX-Revised Long Run-Jacktow PF 1 RobbinsStation Long Run-Jacktow PF 1 EX-Revised Long Run-Jacktow PF 1 RobbinsStation Long Run-Jacktow PF 1 EX-Revised Long Run-Jacktow PF 1 RobbinsStation Long Run-Jacktow PF 1 EX-Revised Long Run-Jacktow 4496 Culvert Long Run-Jacktow PF 1 RobbinsStation Long Run-Jacktow PF 1 EX-Revised Long Run-Jacktow PF 1 RobbinsStation Long Run-Jacktow PF 1 EX-Revised Long Run-Jacktow PF 1 RobbinsStation Long Run-Jacktow PF 1 EX-Revised Long Run-Jacktow PF 1 RobbinsStation Long Run-Jacktow PF 1 EX-Revised Long Run-Jacktow PF 1 RobbinsStation Long Run-Jacktow PF 1 EX-Revised Long Run-Jacktow PF 1 RobbinsStation Long Run-Jacktow PF 1 EX-Revised Long Run-Jacktow PF 1 RobbinsStation Long Run-Jacktow PF 1 EX-Revised Long Run-Jacktow 3692 Culvert Long Run-Jacktow PF 1 RobbinsStation
82 HEC-RAS River: Long Run-Jacktow Reach: Long Run-Jacktow Profile: PF 1 (Continued) Reach River Sta Profile Plan Q Total Min Ch El W.S. Elev Crit W.S. E.G. Elev E.G. Slope Vel Chnl Flow Area Top Width Froude # Chl (cfs) (ft) (ft) (ft) (ft) (ft/ft) (ft/s) (sq ft) (ft) Long Run-Jacktow PF 1 EX-Revised Long Run-Jacktow PF 1 RobbinsStation Long Run-Jacktow PF 1 EX-Revised Long Run-Jacktow PF 1 RobbinsStation Long Run-Jacktow PF 1 EX-Revised Long Run-Jacktow PF 1 RobbinsStation Long Run-Jacktow PF 1 EX-Revised Long Run-Jacktow PF 1 RobbinsStation Long Run-Jacktow PF 1 EX-Revised Long Run-Jacktow PF 1 RobbinsStation Long Run-Jacktow PF 1 EX-Revised Long Run-Jacktow PF 1 RobbinsStation Long Run-Jacktow PF 1 EX-Revised Long Run-Jacktow 2377 Culvert Long Run-Jacktow PF 1 RobbinsStation Long Run-Jacktow PF 1 EX-Revised Long Run-Jacktow PF 1 RobbinsStation Long Run-Jacktow PF 1 EX-Revised Long Run-Jacktow 1865 Culvert Long Run-Jacktow PF 1 RobbinsStation Long Run-Jacktow PF 1 EX-Revised Long Run-Jacktow PF 1 RobbinsStation Long Run-Jacktow PF 1 EX-Revised Long Run-Jacktow PF 1 RobbinsStation Long Run-Jacktow PF 1 EX-Revised Long Run-Jacktow PF 1 RobbinsStation Long Run-Jacktow PF 1 EX-Revised Long Run-Jacktow 1270 PF 1 RobbinsStation Long Run-Jacktow 1270 PF 1 EX-Revised Long Run-Jacktow 1235 Culvert Long Run-Jacktow PF 1 RobbinsStation
83 HEC-RAS River: Long Run-Jacktow Reach: Long Run-Jacktow Profile: PF 1 (Continued) Reach River Sta Profile Plan Q Total Min Ch El W.S. Elev Crit W.S. E.G. Elev E.G. Slope Vel Chnl Flow Area Top Width Froude # Chl (cfs) (ft) (ft) (ft) (ft) (ft/ft) (ft/s) (sq ft) (ft) Long Run-Jacktow PF 1 EX-Revised Long Run-Jacktow PF 1 RobbinsStation Long Run-Jacktow PF 1 EX-Revised Long Run-Jacktow 967 PF 1 RobbinsStation Long Run-Jacktow 967 PF 1 EX-Revised Long Run-Jacktow 0 PF 1 RobbinsStation Long Run-Jacktow 0 PF 1 EX-Revised
84 MODIFIED CULVERTS AND BEND REDUCTION HEC-RAS SUMMARY TABLE
85 HEC-RAS River: Long Run-Jacktow Reach: Long Run-Jacktow Profile: PF 1 Reach River Sta Profile Plan Q Total Min Ch El W.S. Elev Crit W.S. E.G. Elev E.G. Slope Vel Chnl Flow Area Top Width Froude # Chl (cfs) (ft) (ft) (ft) (ft) (ft/ft) (ft/s) (sq ft) (ft) Long Run-Jacktow PF 1 Bends Long Run-Jacktow PF 1 EX-Revised Long Run-Jacktow PF 1 Bends Long Run-Jacktow PF 1 EX-Revised Long Run-Jacktow PF 1 Bends Long Run-Jacktow PF 1 EX-Revised Long Run-Jacktow PF 1 Bends Long Run-Jacktow PF 1 EX-Revised Long Run-Jacktow PF 1 Bends Long Run-Jacktow PF 1 EX-Revised Long Run-Jacktow PF 1 Bends Long Run-Jacktow PF 1 EX-Revised Long Run-Jacktow PF 1 Bends Long Run-Jacktow PF 1 EX-Revised Long Run-Jacktow PF 1 Bends Long Run-Jacktow PF 1 EX-Revised Long Run-Jacktow PF 1 Bends Long Run-Jacktow PF 1 EX-Revised Long Run-Jacktow 6645 Culvert Long Run-Jacktow PF 1 Bends Long Run-Jacktow PF 1 EX-Revised Long Run-Jacktow PF 1 Bends Long Run-Jacktow PF 1 EX-Revised Long Run-Jacktow PF 1 Bends Long Run-Jacktow PF 1 EX-Revised Long Run-Jacktow PF 1 EX-Revised Long Run-Jacktow 5892 Culvert Long Run-Jacktow PF 1 Bends Long Run-Jacktow PF 1 EX-Revised Long Run-Jacktow PF 1 Bends Long Run-Jacktow PF 1 EX-Revised
86 HEC-RAS River: Long Run-Jacktow Reach: Long Run-Jacktow Profile: PF 1 (Continued) Reach River Sta Profile Plan Q Total Min Ch El W.S. Elev Crit W.S. E.G. Elev E.G. Slope Vel Chnl Flow Area Top Width Froude # Chl (cfs) (ft) (ft) (ft) (ft) (ft/ft) (ft/s) (sq ft) (ft) Long Run-Jacktow 5625 Culvert Long Run-Jacktow PF 1 Bends Long Run-Jacktow PF 1 EX-Revised Long Run-Jacktow PF 1 Bends Long Run-Jacktow PF 1 EX-Revised Long Run-Jacktow PF 1 Bends Long Run-Jacktow PF 1 EX-Revised Long Run-Jacktow PF 1 Bends Long Run-Jacktow PF 1 EX-Revised Long Run-Jacktow PF 1 Bends Long Run-Jacktow PF 1 EX-Revised Long Run-Jacktow PF 1 Bends Long Run-Jacktow PF 1 EX-Revised Long Run-Jacktow PF 1 Bends Long Run-Jacktow PF 1 EX-Revised Long Run-Jacktow 4496 Culvert Long Run-Jacktow PF 1 Bends Long Run-Jacktow PF 1 EX-Revised Long Run-Jacktow PF 1 Bends Long Run-Jacktow PF 1 EX-Revised Long Run-Jacktow PF 1 Bends Long Run-Jacktow PF 1 EX-Revised Long Run-Jacktow PF 1 Bends Long Run-Jacktow PF 1 EX-Revised Long Run-Jacktow PF 1 Bends Long Run-Jacktow PF 1 EX-Revised Long Run-Jacktow PF 1 Bends Long Run-Jacktow PF 1 EX-Revised Long Run-Jacktow PF 1 Bends Long Run-Jacktow PF 1 EX-Revised
87 HEC-RAS River: Long Run-Jacktow Reach: Long Run-Jacktow Profile: PF 1 (Continued) Reach River Sta Profile Plan Q Total Min Ch El W.S. Elev Crit W.S. E.G. Elev E.G. Slope Vel Chnl Flow Area Top Width Froude # Chl (cfs) (ft) (ft) (ft) (ft) (ft/ft) (ft/s) (sq ft) (ft) Long Run-Jacktow 3692 Culvert Long Run-Jacktow PF 1 Bends Long Run-Jacktow PF 1 EX-Revised Long Run-Jacktow PF 1 Bends Long Run-Jacktow PF 1 EX-Revised Long Run-Jacktow PF 1 Bends Long Run-Jacktow PF 1 EX-Revised Long Run-Jacktow PF 1 Bends Long Run-Jacktow PF 1 EX-Revised Long Run-Jacktow PF 1 Bends Long Run-Jacktow PF 1 EX-Revised Long Run-Jacktow PF 1 Bends Long Run-Jacktow PF 1 EX-Revised Long Run-Jacktow PF 1 Bends Long Run-Jacktow PF 1 EX-Revised Long Run-Jacktow 2377 Culvert Long Run-Jacktow PF 1 Bends Long Run-Jacktow PF 1 EX-Revised Long Run-Jacktow PF 1 Bends Long Run-Jacktow PF 1 EX-Revised Long Run-Jacktow 1865 Culvert Long Run-Jacktow PF 1 Bends Long Run-Jacktow PF 1 EX-Revised Long Run-Jacktow PF 1 Bends Long Run-Jacktow PF 1 EX-Revised Long Run-Jacktow PF 1 Bends Long Run-Jacktow PF 1 EX-Revised Long Run-Jacktow PF 1 Bends Long Run-Jacktow PF 1 EX-Revised Long Run-Jacktow 1270 PF 1 Bends Long Run-Jacktow 1270 PF 1 EX-Revised
88 HEC-RAS River: Long Run-Jacktow Reach: Long Run-Jacktow Profile: PF 1 (Continued) Reach River Sta Profile Plan Q Total Min Ch El W.S. Elev Crit W.S. E.G. Elev E.G. Slope Vel Chnl Flow Area Top Width Froude # Chl (cfs) (ft) (ft) (ft) (ft) (ft/ft) (ft/s) (sq ft) (ft) Long Run-Jacktow 1235 Culvert Long Run-Jacktow PF 1 Bends Long Run-Jacktow PF 1 EX-Revised Long Run-Jacktow PF 1 Bends Long Run-Jacktow PF 1 EX-Revised Long Run-Jacktow 967 PF 1 Bends Long Run-Jacktow 967 PF 1 EX-Revised Long Run-Jacktow 0 PF 1 Bends Long Run-Jacktow 0 PF 1 EX-Revised
89 BEND ELIMINATION PIPE SIZING CALCULATION
 = 1053.00 Rise (in) = 72.0 Shape = Cir Span (in) = 72.0 No. Barrels = 1 n-value = 0.012 Inlet Edge = 0 Coeff. K,M,c,Y,k = 0.0045, 2, 0.0317, 0.69, 0.")
90 Culvert Report Hydraflow Express Extension for AutoCAD Civil 3D 2011 by Autodesk, Inc. Saturday, Aug Cir Culvert Invert Elev Dn (ft) = Pipe Length (ft) = Slope (%) = 1.00 Invert Elev Up (ft) = Rise (in) = 72.0 Shape = Cir Span (in) = 72.0 No. Barrels = 1 n-value = Inlet Edge = 0 Coeff. K,M,c,Y,k = , 2, , 0.69, 0.5 Embankment Top Elevation (ft) = Top Width (ft) = Crest Width (ft) = Calculations Qmin (cfs) = Qmax (cfs) = Tailwater Elev (ft) = (dc+d)/2 Highlighted Qtotal (cfs) = Qpipe (cfs) = Qovertop (cfs) = 0.00 Veloc Dn (ft/s) = 8.10 Veloc Up (ft/s) = HGL Dn (ft) = HGL Up (ft) = Hw Elev (ft) = Hw/D (ft) = 0.97 Flow Regime = Inlet Control
91 CHANNEL MODIFICATIONS HEC-RAS SUMMARY TABLE
92 HEC-RAS River: Long Run-Jacktow Reach: Long Run-Jacktow Profile: PF 1 Reach River Sta Profile Plan Q Total Min Ch El W.S. Elev Crit W.S. E.G. Elev E.G. Slope Vel Chnl Flow Area Top Width Froude # Chl (cfs) (ft) (ft) (ft) (ft) (ft/ft) (ft/s) (sq ft) (ft) Long Run-Jacktow PF 1 ChannelMod Long Run-Jacktow PF 1 EX-Revised Long Run-Jacktow PF 1 ChannelMod Long Run-Jacktow PF 1 EX-Revised Long Run-Jacktow PF 1 ChannelMod Long Run-Jacktow PF 1 EX-Revised Long Run-Jacktow PF 1 ChannelMod Long Run-Jacktow PF 1 EX-Revised Long Run-Jacktow PF 1 ChannelMod Long Run-Jacktow PF 1 EX-Revised Long Run-Jacktow PF 1 ChannelMod Long Run-Jacktow PF 1 EX-Revised Long Run-Jacktow PF 1 ChannelMod Long Run-Jacktow PF 1 EX-Revised Long Run-Jacktow PF 1 ChannelMod Long Run-Jacktow PF 1 EX-Revised Long Run-Jacktow PF 1 ChannelMod Long Run-Jacktow PF 1 EX-Revised Long Run-Jacktow 6645 Culvert Long Run-Jacktow PF 1 ChannelMod Long Run-Jacktow PF 1 EX-Revised Long Run-Jacktow PF 1 ChannelMod Long Run-Jacktow PF 1 EX-Revised Long Run-Jacktow PF 1 ChannelMod Long Run-Jacktow PF 1 EX-Revised Long Run-Jacktow PF 1 ChannelMod Long Run-Jacktow PF 1 EX-Revised Long Run-Jacktow PF 1 ChannelMod Long Run-Jacktow PF 1 EX-Revised Long Run-Jacktow PF 1 ChannelMod
93 HEC-RAS River: Long Run-Jacktow Reach: Long Run-Jacktow Profile: PF 1 (Continued) Reach River Sta Profile Plan Q Total Min Ch El W.S. Elev Crit W.S. E.G. Elev E.G. Slope Vel Chnl Flow Area Top Width Froude # Chl (cfs) (ft) (ft) (ft) (ft) (ft/ft) (ft/s) (sq ft) (ft) Long Run-Jacktow PF 1 EX-Revised Long Run-Jacktow 5625 Culvert Long Run-Jacktow PF 1 ChannelMod Long Run-Jacktow PF 1 EX-Revised Long Run-Jacktow PF 1 ChannelMod Long Run-Jacktow PF 1 EX-Revised Long Run-Jacktow PF 1 ChannelMod Long Run-Jacktow PF 1 EX-Revised Long Run-Jacktow PF 1 ChannelMod Long Run-Jacktow PF 1 EX-Revised Long Run-Jacktow PF 1 ChannelMod Long Run-Jacktow PF 1 EX-Revised Long Run-Jacktow PF 1 ChannelMod Long Run-Jacktow PF 1 EX-Revised Long Run-Jacktow PF 1 ChannelMod Long Run-Jacktow PF 1 EX-Revised Long Run-Jacktow 4496 Culvert Long Run-Jacktow PF 1 ChannelMod Long Run-Jacktow PF 1 EX-Revised Long Run-Jacktow PF 1 ChannelMod Long Run-Jacktow PF 1 EX-Revised Long Run-Jacktow PF 1 ChannelMod Long Run-Jacktow PF 1 EX-Revised Long Run-Jacktow PF 1 ChannelMod Long Run-Jacktow PF 1 EX-Revised Long Run-Jacktow PF 1 ChannelMod Long Run-Jacktow PF 1 EX-Revised Long Run-Jacktow PF 1 ChannelMod Long Run-Jacktow PF 1 EX-Revised
94 HEC-RAS River: Long Run-Jacktow Reach: Long Run-Jacktow Profile: PF 1 (Continued) Reach River Sta Profile Plan Q Total Min Ch El W.S. Elev Crit W.S. E.G. Elev E.G. Slope Vel Chnl Flow Area Top Width Froude # Chl (cfs) (ft) (ft) (ft) (ft) (ft/ft) (ft/s) (sq ft) (ft) Long Run-Jacktow PF 1 ChannelMod Long Run-Jacktow PF 1 EX-Revised Long Run-Jacktow 3692 Culvert Long Run-Jacktow PF 1 ChannelMod Long Run-Jacktow PF 1 EX-Revised Long Run-Jacktow PF 1 ChannelMod Long Run-Jacktow PF 1 EX-Revised Long Run-Jacktow PF 1 ChannelMod Long Run-Jacktow PF 1 EX-Revised Long Run-Jacktow PF 1 ChannelMod Long Run-Jacktow PF 1 EX-Revised Long Run-Jacktow PF 1 ChannelMod Long Run-Jacktow PF 1 EX-Revised Long Run-Jacktow PF 1 ChannelMod Long Run-Jacktow PF 1 EX-Revised Long Run-Jacktow PF 1 ChannelMod Long Run-Jacktow PF 1 EX-Revised Long Run-Jacktow 2377 Culvert Long Run-Jacktow PF 1 ChannelMod Long Run-Jacktow PF 1 EX-Revised Long Run-Jacktow PF 1 ChannelMod Long Run-Jacktow PF 1 EX-Revised Long Run-Jacktow 1865 Culvert Long Run-Jacktow PF 1 ChannelMod Long Run-Jacktow PF 1 EX-Revised Long Run-Jacktow PF 1 ChannelMod Long Run-Jacktow PF 1 EX-Revised Long Run-Jacktow PF 1 ChannelMod Long Run-Jacktow PF 1 EX-Revised
95 HEC-RAS River: Long Run-Jacktow Reach: Long Run-Jacktow Profile: PF 1 (Continued) Reach River Sta Profile Plan Q Total Min Ch El W.S. Elev Crit W.S. E.G. Elev E.G. Slope Vel Chnl Flow Area Top Width Froude # Chl (cfs) (ft) (ft) (ft) (ft) (ft/ft) (ft/s) (sq ft) (ft) Long Run-Jacktow PF 1 ChannelMod Long Run-Jacktow PF 1 EX-Revised Long Run-Jacktow 1270 PF 1 ChannelMod Long Run-Jacktow 1270 PF 1 EX-Revised Long Run-Jacktow 1235 Culvert Long Run-Jacktow PF 1 ChannelMod Long Run-Jacktow PF 1 EX-Revised Long Run-Jacktow PF 1 ChannelMod Long Run-Jacktow PF 1 EX-Revised Long Run-Jacktow 967 PF 1 ChannelMod Long Run-Jacktow 967 PF 1 EX-Revised Long Run-Jacktow 0 PF 1 ChannelMod Long Run-Jacktow 0 PF 1 EX-Revised
96 LIONS PARK OFFSTREAM BASIN CONCEPTUAL SKETCH
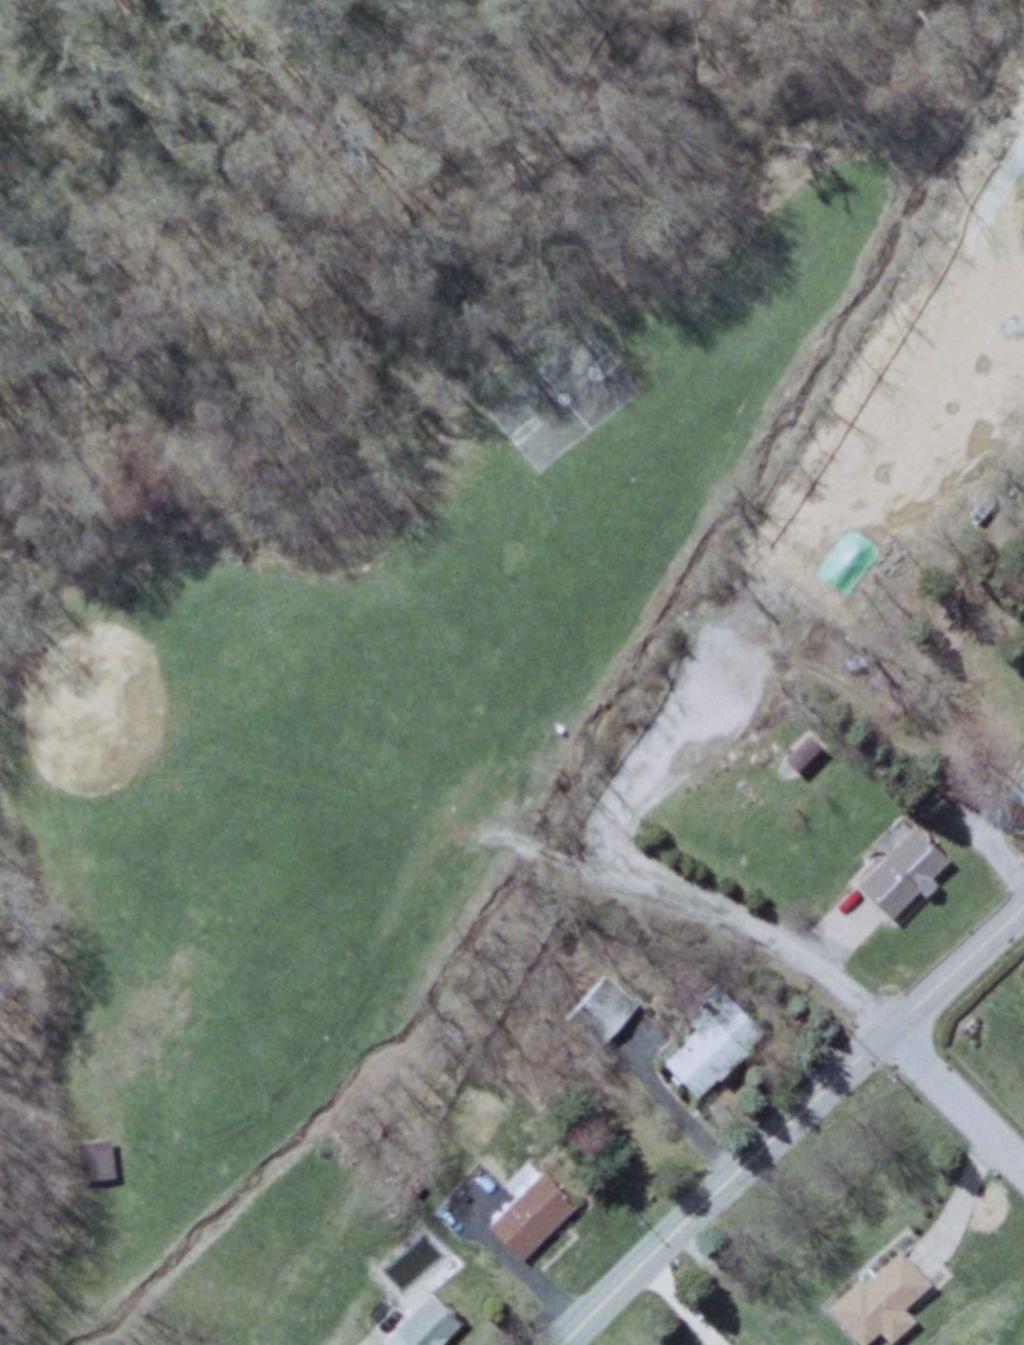
97
PENNDRAIN.rep. HEC-RAS Version May 2005 U.S. Army Corp of Engineers Hydrologic Engineering Center 609 Second Street Davis, California
 HEC-RAS Version 3.1.3 May 2005 U.S. Army Corp of Engineers Hydrologic Engineering Center 609 Second Street Davis, California X X XXXXXX XXXX XXXX XX XXXX X X X X X X X X X X X X X X X X X X X XXXXXXX XXXX
APPENDIX J HYDROLOGY AND WATER QUALITY
 APPENDIX J HYDROLOGY AND WATER QUALITY J-1 Technical Report on Airport Drainage, Northern Sector Airport and Ordinance Creek Watershed / Preliminary Creek Constructed Natural Channel Culvert J-2 Preliminary
General Information for Culvert Design
 Design Manual Chapter 2 - Stormwater 2E - Culvert Design 2E-1 General Information for Culvert Design A. Introduction A culvert is a conduit under an embankment that transports stormwater from one side
Stormwater Level of Service Study - Phase 2 Flooding Adjacent to Rock Creek
 Stormwater Level of Service Study - Phase 2 Flooding Adjacent to Rock Creek City of Fairway, Kansas Fairway Stormwater Level of Service Study - Phase 2 Project No. 108200 Revision 1 12/6/2018 Stormwater
Sediment Basin 7E-12. Design Manual Chapter 7 - Erosion and Sediment Control 7E - Design Information for ESC Measures BENEFITS.
 7E-12 Design Manual Chapter 7 - Erosion and Sediment Control 7E - Design Information for ESC Measures Sediment Basin BENEFITS Flow Control Erosion Control Sediment Control Runoff Reduction Flow Diversion
Chapter 11. Culverts and Bridges Design Checklist for Culvert Design
 Yes No N/A Design Requirements I. GENERAL DESIGN GUIDELINES Chapter 11. Culverts and Bridges A. Culvert design is in accordance with the Culverts chapter of Volume 2 of the UDFCD Manual for additional
USING A LABYRINTH WEIR TO INCREASE HYDRAULIC CAPACITY. Dustin Mortensen, P.E. 1 Jake Eckersley, P.E. 1
 USING A LABYRINTH WEIR TO INCREASE HYDRAULIC CAPACITY Dustin Mortensen, P.E. 1 Jake Eckersley, P.E. 1 Plum Creek Floodwater Retarding Structure No. 6 is located in an area of Kyle, Texas, that is currently
APPENDIX C VEGETATED EMERGENCY SPILLWAY. VERSION 1.0 March 1, 2011
 APPENDIX C VEGETATED EMERGENCY SPILLWAY VERSION 1.0 March 1, 2011 [NOTE: Could use a better photo more clearly showing the emergency spillway in the context of the dam.] SECTION C-1: DESCRIPTION OF PRACTICE
Technical Report Culvert A Hydraulic Analysis
 DATE: November 3, 2011 Technical Report Culvert A Hydraulic Analysis TO: FROM: RE: Jim Reiser, P.E. Project Manager Parsons Brinckerhoff, Inc. Kurt Killian, P.E., CFM Parsons Brinckerhoff, Inc. Design
Plan B Dam Breach Assessment
 Plan B Dam Breach Assessment Introduction In support of the Local Sponsor permit applications to the states of Minnesota and North Dakota, a dam breach analysis for the Plan B alignment of the Fargo-Moorhead
APPENDIX A STRUCTURE DESCRIPTIONS AND RATING CURVES
 3 4 5 6 7 8 9 0 3 APPENDIX A STRUCTURE DESCRIPTIONS AND RATING CURVES Kissimmee River Vol December 005 Version Draft 4 3 4 5 6 7 8 9 0 3 4 5 6 7 8 9 0 3 4 5 6 7 8 9 30 3 3 33 34 35 36 37 38 39 40 4 4 43
CHAPTER 4 SPALDING COUNTY, GEORGIA 4.0 CULVERT DESIGN
 SPALDING COUNTY, GEORGIA CHAPTER 4 4.0 CULVERT DESIGN... 4-1 4.1 INTRODUCTION... 4-1 4.2 SYMBOLS AND DEFINITIONS... 4-1 4.3 ENGINEERING DESIGN CRITERIA... 4-2 4.3.1 FREQUENCY FLOOD... 4-2 4.3.2 VELOCITY
WMS 8.4 Tutorial Hydraulics and Floodplain Modeling HY-8 Modeling Wizard Learn how to model a culvert using HY-8 and WMS
 v. 8.4 WMS 8.4 Tutorial Hydraulics and Floodplain Modeling HY-8 Modeling Wizard Learn how to model a culvert using HY-8 and WMS Objectives Define a conceptual schematic of the roadway, invert, and downstream
Designing Labyrinth Spillways for Less than Ideal Conditions Real World Application of Laboratory Design Methods
 Designing Labyrinth Spillways for Less than Ideal Conditions Real World Application of Laboratory Design Methods Gregory Richards, P.E., CFM, Gannett Fleming, Inc. Blake Tullis, Ph.D., Utah Water Research
The Basics of Culvert and Inlet Design
 PDHonline Course C619 (8 PDH) The Basics of Culvert and Inlet Design Jerry D. Morrow, PE 2013 PDH Online PDH Center 5272 Meadow Estates Drive Fairfax, VA 22030 6658 Phone & Fax: 703 988 0088 www.pdhonline.org
HY-8 Version 7.2 Build Date January 17, Federal Highway Administration.
 HY-8 Version 7.2 Build Date January 17, 2012 Federal Highway Administration http://www.fhwa.dot.gov/engineering/hydraulics/software/hy8/index.cfm SIMPLE Simple to use Use for simple culverts and bridges
Presented by Fred Halterman, URS Jennie Agerton, URS
 Presented by Fred Halterman, URS Jennie Agerton, URS What is Eco Friendly Culvert Design? Culvert design that: Maintains connectivity for aquatic organism migration Maintains connectivity for gene flow
Indiana LTAP Road Scholar Core Course #10 Culvert Drainage. Presented by Thomas T. Burke, Jr., PhD, PE Christopher B. Burke Engineering, Ltd.
 Indiana LTAP Road Scholar Core Course #10 Culvert Drainage Presented by Thomas T. Burke, Jr., PhD, PE Christopher B. Burke Engineering, Ltd. Objectives Review culvert shapes, end sections, and materials
STRUCTURE S-65 PURPOSE SPILLWAY OPERATION
 STRUCTURE S-65 This structure is a reinforced concrete, gated spillway with discharge controlled by three cable operated, vertical lift gates, and a reinforced concrete lock structure with two pairs of
Suitable Applications Check dams may be appropriate in the following situations: To promote sedimentation behind the dam.
 Categories EC Erosion Control SE Sediment Control TC Tracking Control WE Wind Erosion Control Non-Stormwater NS Management Control Waste Management and WM Materials Pollution Control Legend: Primary Category
HEC 26 Aquatic Organism Passage Design Manual Evolution & Application
 HEC 26 Aquatic Organism Passage Design Manual Evolution & Application Sven Leon, P.E., Hydraulics Engineer Federal Highway Administration 2015 Alaska Fish Passage Meeting October 13 14, 2015 VTRC, Juneau,
Outlet Structures T-12
 Description This section provides guidance and details for outlet structures for use primarily with BMPs utilizing sedimentation, (i.e., extended detention basins (EDBs), retention ponds, and constructed
Hydraulic Modeling of Stream Enhancement Methods
 Hydraulic Modeling of Stream Enhancement Methods Matthew J. Curry John J. Levitsky Abstract Development within watersheds increases the amounts of runoff causing stream erosion and degradation of stream
HYDROLOGIC AND HYDRAULIC REPORT PROPOSED CULVERT STRUCTURES SR 194, SECTION 10
 HYDROLOGIC AND HYDRAULIC REPORT PROPOSED CULVERT STRUCTURES SR 194, SECTION 10 RACETRACK ROAD CULVERT OVER THE SPRING RUN & GREEN SPRINGS ROAD CULVERT OVER AN UNNAMED TRIBUTARY TO SPRING RUN BERWICK TOWNSHIP
OFFICE OF STRUCTURES MANUAL FOR HYDROLOGIC AND HYDRAULIC DESIGN CHAPTER 11 APPENDIX B TIDEROUT 2 USERS MANUAL
 OFFICE OF STRUCTURES MANUAL FOR HYDROLOGIC AND HYDRAULIC DESIGN CHAPTER 11 APPENDIX B TIDEROUT 2 USERS MANUAL APRIL 2011 APRIL 2011 Page 1 Preface TIDEROUT 2, Build 1.22 dated June 29, 2006 is the current
Ellis Y. Byeon, PE Bryan VanderGheynst, PE 1
 Ellis Y. Byeon, PE Bryan VanderGheynst, PE 1 Background Information: City of Trenton, Mercer County Assunpink Creek, Pond Run and Delaware River Lower 2.5 miles of the Assunpink Creek Lower 0.6 miles of
Hard Hat Services ph: hardhatinc.com 932 N. Wright St., Suite 160 Naperville, IL 60563
 Interstate Power and Light Company Ottumwa Generation Station CCR Surface Impoundment Annual Inspection Report 154.018.015.003 Report issued: July 03, 2017 Hard Hat Services ph: 877-630-7428 hardhatinc.com
Stormwater Management Pond Design Brief. Greely Village Centre - Commercial Phase - Ultimate Conditions - - City of Ottawa -
 Stormwater Management Pond Design Brief Greely Village Centre - Commercial Phase - Ultimate Conditions - - City of Ottawa - December 2008 Ref: 647-07 J.F. Sabourin and Associates Inc. Water Resources and
VIRGINIA SOIL AND WATER CONSERVATION BOARD GUIDANCE DOCUMENT ON DAM BREAK INUNDATION ZONE AND INCREMENTAL DAMAGE ANALYSIS AND MAPPING PROCEDURES
 (Approved XXXXX, 2010) Working Draft Version January 14, 2010 VIRGINIA SOIL AND WATER CONSERVATION BOARD GUIDANCE DOCUMENT ON DAM BREAK INUNDATION ZONE AND INCREMENTAL DAMAGE ANALYSIS AND MAPPING PROCEDURES
FINAL REPORT. Yonkers Creek Migration Barrier Removal Project Wonderstump Road Del Norte County. Submitted By:
 FINAL REPORT Yonkers Creek Migration Barrier Removal Project Wonderstump Road Del Norte County Submitted By: Del Norte County Community Development Department Yonkers Creek Migration Barrier Removal Project
Modeling of Long Culverts and Stormdrains A Comparison of Different Methods
 Modeling of Long Culverts and Stormdrains A Comparison of Different Methods Shrinivas Kaulgud, P.E., CFM Cheryl Hannan, P.E., CFM, LEED AP October 12, 2017 Presentation Outline Introduction Case Studies
BC Ministry of Forests. March Fish Stream Crossing Guidebook. Forest Practices Code of British Columbia.
 FRST 557 Lecture 7c Bridges and Culverts: Water Velocity and Discharge Lesson Background and Overview: The previous two lessons presented methods for estimating water volume flow at a particular site and
 Dam Modification Report Stingy Run Fly Ash Reservoir Appendix E Spillway System Design Calculations E1: Spillway/Energy Dissipater Design for 100-year Event CHE8273 8 September 4, 2014 Written by: CJW
TOP:001.3 U.S. Fish and Wildlife Service TECHNICAL OPERATING PROCEDURE
 TOP:001.3 March 12, 2015 U.S. Fish and Wildlife Service Marquette Biological Station 3090 Wright Street Marquette, Michigan 49855 U.S.A. and U.S. Fish and Wildlife Service Ludington Biological Station
Culvert Design An Overview of the NYS Highway Design Manual Chapter 8
 Seventeenth Statewide Conference on Local Bridges Culvert Design An Overview of the NYS Highway Design Manual Chapter 8 Tuesday, October 25, 2011 Training Session: Culvert Design, Analysis - talk 2 Presented
PRELIMINARY STORM DRAINAGE REPORT
 PRELIMINARY STORM DRAINAGE REPORT DRURY LANE DEVELOPMENT 704 1ST STREET SULTAN, WA 98294-94240 PARCEL #28083200305500 AUDITOR S FILE NO. 1090255 CITY OF SULTAN SNOHOMISH COUNTY, WASHINGTON PREPARED FOR:
Annex E Bridge Pier Protection Plan
 Annex E Bridge Pier Protection Plan Table E1 Bridge Types and Locations Table E2 Flow Conditions For River Sections Figure E1 Bridge Abutment Protection Figure E2 Bridge Pier Protection Figure E3 Central
Huntington District. For More Information Contact (304)
") Zoar Levee & Diversion Dam are located in the Muskingum River Basin highlighted in green to left. The Muskingum River Basin is the site of Ohio s first multiple purpose water management and land conservation
Zoar Levee & Diversion Dam are located in the Muskingum River Basin highlighted in green to left. The Muskingum River Basin is the site of Ohio s first multiple purpose water management and land conservation
EXAMPLES (OPEN-CHANNEL FLOW) AUTUMN 2018
 AUTUMN 2018") EXAMPLES (OPEN-CHANNEL FLOW) AUTUMN 2018 Normal and Critical Depths Q1. If the discharge in a channel of width 5 m is 20 m 3 s 1 and Manning s n is 0.02 m 1/3 s, find: (a) the normal depth and Froude number
EXAMPLES (OPEN-CHANNEL FLOW) AUTUMN 2018 Normal and Critical Depths Q1. If the discharge in a channel of width 5 m is 20 m 3 s 1 and Manning s n is 0.02 m 1/3 s, find: (a) the normal depth and Froude number
Hard Hat Services ph: hardhatinc.com 932 N. Wright St., Suite 160 Naperville, IL 60563
 Interstate Power and Light Company Ottumwa Generation Station CCR Surface Impoundment Annual Inspection Report 154.018.012.003 Report issued: December 21, 2016 Hard Hat Services ph: 877-630-7428 hardhatinc.com
Rock Ramp Design Guidelines. David Mooney MS Chris Holmquist-Johnson MS Drew Baird Ph.D. P.E. Kent Collins P.E.
 Rock Ramp Design Guidelines David Mooney MS Chris Holmquist-Johnson MS Drew Baird Ph.D. P.E. Kent Collins P.E. Rock Ramp Design Guidelines OUTLINE Local and System Interactions with Rock Ramps Ramp Geometry
APPENDIX C. Fluvial and Tidal Hydraulics Report
 APPENDIX C Fluvial and Tidal Hydraulics Report BUENA VISTA LAGOON ENHANCEMENT PROJECT FLUVIAL AND TIDAL HYDRAULICS ANALYSES Prepared for: SANDAG 401 B Street, Suite 800 San Diego, California 92101 Contact:
APPENDIX B HYDRAULIC DESIGN DATA FOR CULVERTS
 TM 5-820-4/AFM 88-5, Chap 4 APPENDIX B HYDRAULIC DESIGN DATA FOR CULVERTS B-1. General. a. This appendix presents diagrams, charts, coefficients and related information useful in design of culverts. The
CITY OF ROSEVILLE DESIGN STANDARDS
 CITY OF ROSEVILLE DESIGN STANDARDS Section 1 Purpose and Definitions 1-1 Purpose PD 1 1-2 Design Practice PD 1 1-3 Definitions PD 1 Section 2 General Requirements 2-1 Plans by an Appropriate Engineer GR
Lecture 10 : Sewer Appurtenances
 1 P age Module 8 : Sewer Appurtenances Lecture 10 : Sewer Appurtenances 2 P age The structures, which are constructed at suitable intervals along the sewerage system to help its efficient operation and
Culvert Design Basics
 PDHonline Course C287 (4 PDH) Culvert Design Basics Instructor: George E. Thomas, PE 2012 PDH Online PDH Center 5272 Meadow Estates Drive Fairfax, VA 22030-6658 Phone & Fax: 703-988-0088 www.pdhonline.org
CHAPTER 5 CULVERT DESIGN
 CHAPTER 5 CULVERT DESIGN HYDRAULICS OF CULVERTS There are two major types of culvert flow: 1) flow with inlet control, and 2) flow with outlet control. For each type, different factors and formulas are
STRUCTURAL STABILITY ASSESSMENT
 STRUCTURAL STABILITY ASSESSMENT CFR 257.73(d) Fly Ash Reservoir II Cardinal Plant Brilliant, Ohio October, 2016 Prepared for: Cardinal Operating Company Cardinal Plant Brilliant, Ohio Prepared by: Geotechnical
HYDRAULIC JUMP AND WEIR FLOW
 HYDRAULIC JUMP AND WEIR FLOW 1 Condition for formation of hydraulic jump When depth of flow is forced to change from a supercritical depth to a subcritical depth Or Froude number decreases from greater
Appendix G. Alternative Solutions Details. Krosno Creek Flood Reduction Project PROJECT FILE REPORT CITY OF PICKERING
 Krosno Creek Flood Reduction Project PROJECT FILE REPORT CITY OF PICKERING Appendix G Alternative Solutions Details TMIG THE MUNICIPAL INFRASTRUCTURE GROUP LTD Krosno Creek Flood Reduction Project PROJECT
SSO 700 Integrated Watershed Action Plan: Continuous Calibration of a Model
 SSO 700 Integrated Watershed Action Plan: Continuous Calibration of a Model 5 Cities Plus August 16, 2017 Presented by Matt Spidare, P.E MSDGC Victoria Berry, P.E. CH2M Overview of Presentation Project
HISTORY OF CONSTRUCTION
 HISTORY OF CONSTRUCTION CFR 257.73(c)(1) West Boiler Slag Pond Clifty Creek Plant Madison, Indiana October, 2016 Prepared for: Indiana Kentucky Electric Corporation Prepared by: American Electric Power
PROFILE OF SACRAMENTO RIVER, FREEPORT TO VERONA, CALIFORNIA,
 PROFILE OF SACRAMENTO RIVER, FREEPORT TO VERONA, CALIFORNIA, FLOOD OF FEBRUARY 1986 By J.C. Blodgett and J.B. Lucas U.S. GEOLOGICAL SURVEY Open-File Report 88-82 CO CM I m r-h CM Sacramento, California
Colusa Basin Drain Watershed Fish Stranding Tour Concept Paper Mike Hendrick and Brycen Swart NMFS
 Colusa Basin Drain Watershed Fish Stranding Tour Concept Paper Mike Hendrick and Brycen Swart NMFS On May 31, 2013 representatives from CDFW, USFWS, and NMFS went on a field tour to look at locations in
APPENDIX C ESTIMATING SCOUR IN BOTTOMLESS ARCH CULVERTS
 OFFICE OF STRUCTURES MANUAL FOR HYDROLOGIC AND HYDRAULIC DESIGN CHAPTER 11, EVALUATING SCOUR AT BRIDGES APPENDIX C ESTIMATING SCOUR IN BOTTOMLESS ARCH CULVERTS APRIL 2011 APPENDIX C ESTIMATING SCOUR IN
Culvert Design for Low and High Gradient Streams in the Midwest. Dale Higgins, Hydrologist Chequamegon-Nicolet National Forest
 Culvert Design for Low and High Gradient Streams in the Midwest Dale Higgins, Hydrologist Chequamegon-Nicolet National Forest Overview Culvert Design Considerations Hydraulic Terms Culvert Impacts Low
ADA Training Standard Plans
 ADA Training Standard Plans SCREEN READABLE VERSION IS IN THE MAKING AND WILL BE MADE AVAILABLE SOON 2018 MnDOT 2 Standard Plans 2017 Overview Overview PROWAG and Curb Ramp Basics Curb Ramp Types ADA Curb
STRUCTURE 65-B PURPOSE SPILLWAY OPERATION
 STRUCTURE 65-B This structure is a reinforced concrete, gated spillway with discharge controlled by three cable operated vertical lift gates and a reinforced concrete lock structure with two pairs of sector
Information for File # SEW
 Information for File #2014-02744-SEW Applicant: Minnesota Department of Transportation (MnDOT), District 3; c/o Mr. Robert Nibbe Corps Contact: Sarah Wingert, U.S. Army Corps of Engineers, 180 5 th Street
CALIFORNIA SALMONID STREAM HABITAT RESTORATION MANUAL APPENDIX IX-A CULVERT CRITERIA FOR FISH PASSAGE INTRODUCTION
 APPENDIX IX-A STATE OF CALIFORNIA RESOURCES AGENCY DEPARTMENT OF FISH AND GAME CULVERT CRITERIA FOR FISH PASSAGE For habitat protection, ecological connectivity should be a goal of stream-road crossing
Readington Road (C.R. 637) Construction
 Construction") Public Information Meeting Thursday, August 2, 2012 Readington Road (C.R. 637) Construction from Dreahook Road to Harlan School Road Branchburg Township, Somerset County Readington Township, Hunterdon
Public Information Meeting Thursday, August 2, 2012 Readington Road (C.R. 637) Construction from Dreahook Road to Harlan School Road Branchburg Township, Somerset County Readington Township, Hunterdon
Storm Damage Floating Culverts & Other Inlet Issues
 Storm Damage Floating Culverts & Other Inlet Issues Mark Bailey, PE - Hydraulic Manager, INDOT Dale Sedler, PE - Sr. Hydraulic Engineer, INDOT Road School 2016 What causes a culvert to float? 1. Accumulation
ROAD OCCUPANCY PERMIT APPLICATION # Damascus Township, 60 Conklin Hill Road, Damascus, PA Tel Fax
 Instructions: For a driveway access permit, fill in sections 1, 2, 3 and 4, and the appropriate drawings and sign. For a Utility access, fill in sections 1, 2, 3 and 5, and figures 1 and 3. Prepare a detailed
COST EFFECTIVE STORAGE CAPACITY INCREASE FOR ALUMINA TAILINGS DISPOSAL AREA THROUGH SPILLWAY OPTIMISATION
 COST EFFECTIVE STORAGE CAPACITY INCREASE FOR ALUMINA TAILINGS DISPOSAL AREA THROUGH SPILLWAY OPTIMISATION Abstract Lonie I * Tailings and Dams, GHD Brisbane, QLD, Australia Queensland Alumina Limited operates
CLAIBORNE LOCK AND DAM PERTINENT DATA
 CLAIBORNE LOCK AND DAM PERTINENT DATA GENERAL Location Clarke, Monroe, & Wilcox Counties, Alabama; Alabama River, river mile 72.5 Drainage area Millers Ferry to Claiborne sq. mi. 836 Total drainage area
Sussex County, DE Preliminary Study Overview
 Sussex County, DE Preliminary Study Overview Coastal study scope: 102 miles of entire County shoreline Revised 102 panels for coastal study Riverine study scope: 14 streams, 67.1 miles, within the Nanticoke
Information for File #MVP MVM
 Information for File #MVP-2018-00168-MVM Applicant: City of Lino Lakes Corps Contact: Marissa Merriman Address: 180 Fifth Street East, Suite 700, St. Paul, Minnesota 55101-1678 E-Mail: Marissa.V.Merriman@usace.army.mil
Picture Spring Branch Hydrologic and Hydraulic Analysis Report. Prepared for: Anne Arundel County. Final
 Picture Spring Branch Hydrologic and Hydraulic Analysis Report Prepared for: Anne Arundel County Final Date: November 30, 2017 Picture Spring Branch Hydrologic and Hydraulic Analysis Report November 30,
Hydraulic Modeling to Aid TDG Abatement at Boundary and Cabinet Gorge Dams
 Hydraulic Modeling to Aid TDG Abatement at Boundary and Cabinet Gorge Dams Joe Orlins, P.E., Ph.D. NWHA Technical Seminar May 15, 2014 Boundary and Cabinet Gorge Dams The Problem: Too Much Gas Boundary
The Hydraulic Design of an Arced Labyrinth Weir at Isabella Dam
 Utah State University DigitalCommons@USU International Symposium on Hydraulic Structures Jun 28th, 1:30 PM The Hydraulic Design of an Arced Labyrinth Weir at Isabella Dam E. A. Thompson Sacramento District
ADDENDA B Hydrologic and Hydraulic (H&H) Study Guidance 2019
 Study Guidance 2019") 09/25/2018 DRAFT FEMA Region I PA H&H Study ADDENDA B Hydrologic and Hydraulic (H&H) Study Guidance 2019 Region I Federal Emergency Management Agency (FEMA) Public Assistance Hydrologic and Hydraulic (H&H)
09/25/2018 DRAFT FEMA Region I PA H&H Study ADDENDA B Hydrologic and Hydraulic (H&H) Study Guidance 2019 Region I Federal Emergency Management Agency (FEMA) Public Assistance Hydrologic and Hydraulic (H&H)
TM /AFM 88-5, Chap Underground hydraulic design Inlets UFC - Drainage In Areas Other Than Airfields
 sults of laboratory research concerning soil infiltration through pipe joints and the effectiveness of gasketing tapes for waterproofing joints and seams are available. 3 6. Underground hydraulic design.
Figure 1: Graphical definitions of superelevation in terms for a two lane roadway.
 Iowa Department of Transportation Office of Design Superelevation 2A-2 Design Manual Chapter 2 Alignments Originally Issued: 12-31-97 Revised: 12-10-10 Superelevation is the banking of the roadway along
Driveway Design Criteria
 Design Manual Chapter 5 - Roadway Design 5L - Access Management 5L-4 Driveway Design Criteria A. General For efficient and safe operations, access drives and minor public street intersections can be improved
Pier 8 Wave Overtopping Analysis (65 Guise Street East) Our File:
 Our File:") Shoreplan Engineering Limited 55 Eglinton Avenue E., Suite 800 Toronto, ON Canada M4P 1G8 T) 416.487.4756 F) 416.487.5129 E) mail@shoreplan.com March 31, 2016 Mr. Ed English Senior Project Manager Waterfront
Shoreplan Engineering Limited 55 Eglinton Avenue E., Suite 800 Toronto, ON Canada M4P 1G8 T) 416.487.4756 F) 416.487.5129 E) mail@shoreplan.com March 31, 2016 Mr. Ed English Senior Project Manager Waterfront
Chutes Part 2: Synthetic linings
 s Part 2: Synthetic linings DRAINAGE CONTROL TECHNIQUE Low Gradient Velocity Control Short Term Steep Gradient Channel Lining Medium-Long Term Outlet Control [1] Soil Treatment Permanent [2] [1] s can
Greenup Lock Filling and Emptying System Study
 Fourth LACCEI International Latin American and Caribbean Conference for Engineering and Technology (LACCET 2006) Breaking Frontiers and Barriers in Engineering: Education, Research and Practice 21-23 June
Washington State Fish Passage Barrier Removal Projects. Casey Kramer, PE WSDOT State Hydraulics Engineer
 Washington State Fish Passage Barrier Removal Projects Casey Kramer, PE WSDOT State Hydraulics Engineer 2014 National Hydraulic Engineering Conference Iowa City, IA August 20 th, 2014 WSDOT Fish Passage
Fish Passage Assessment of Private Stream Crossings on Lower Stonybrook Creek
 Fish Passage Assessment of Private Stream Crossings on Lower Stonybrook Creek Prepared by: Michael Love & Associates In cooperation with: Center for Ecosystem Management and Restoration Funded by: Coastal
3.0 Basin and Watershed Characteristics
 3.0 Basin and Watershed Characteristics 3.1 Basin Characteristics 3.1.1 Crystal Lake Crystal Lake, located in the cities of Burnsville and Lakeville (Dakota County), covers an area of approximately 292
JAP Additional Information Sheet
 JAP Additional Information Sheet Block 15: Purpose and Need The USACE purpose of the project is to provide a safe and reliable whitewater park for the recreational public in a city park, which will provide
Coal Combustion Residuals Closure Plan
 Virginia Electric and Power Company Chesterfield Power Station Upper (East) Pond Chesterfield County, Virginia GAI Project Number: C150035.00 October 2016 Prepared by: GAI Consultants, Inc. Richmond Office
Interim Guidance Fish Presence Absence
 Interim Guidance Fish Presence Absence Source: Forest Practices Act Guidance for Division 635 of the forest practices act dealing with stream classification when no fish surveys have been done (referenced
City of Guelph. Hanlon Creek Business Park Stormwater Management Report Ponds 1, 2, 3 and 4
 City of Guelph Hanlon Creek Business Park Stormwater Management Report Ponds 1, 2, 3 and 4 City of Guelph Hanlon Creek Business Park Stormwater Management Report Ponds 1, 2, 3 and 4 Prepared by: AECOM
Aquatic Organism Passage at Road-Stream Crossings CHUCK KEEPORTS FOREST HYDROLOGIST ALLEGHENY NATIONAL FOREST WARREN, PENNSYLVANIA
 Aquatic Organism Passage at Road-Stream Crossings CHUCK KEEPORTS FOREST HYDROLOGIST ALLEGHENY NATIONAL FOREST WARREN, PENNSYLVANIA TOPICS COVERED Aquatic Organism Passage (AOP) Benefits of AOP Crossings
(Revised February,2005) CULVERTS, BRIDGES, AND FORDS
 CULVERTS, BRIDGES, AND FORDS") GUIDE TO STREAM CROSSINGS (Revised February,2005) CULVERTS, BRIDGES, AND FORDS Culverts, bridges, and fords are all methods used to cross-streams. Culverts are the most common stream crossing structure.
GUIDE TO STREAM CROSSINGS (Revised February,2005) CULVERTS, BRIDGES, AND FORDS Culverts, bridges, and fords are all methods used to cross-streams. Culverts are the most common stream crossing structure.
Stephens Creek Culvert Replacement. CAC April 28, 2010
 Stephens Creek Culvert Replacement CAC April 28, 2010 1 Top of Bank Willamette Moorage Park Existing Culverts 50 ft Greenway Setback 200 ft Greenway Setback Existing Macadam Bay Access Stephens Creek Existing
Emergent Sandbar Habitat Program Middle Missouri River
 Emergent Sandbar Habitat Program Middle Missouri River Jeremiah Szynskie, P.E. Hydrologic Engineering Branch Introduction Main Stem System Dam Closures Fort Peck 1937 Fort Randall 1952 Garrison - 1953
Hydrologic, Hydraulic and Geomorphic Technical Memorandum
 Appendix A Hydrologic, Hydraulic and Geomorphic Technical Memorandum 01054/8410233/14/Rohner_Alt_Analysis_Report Rohner Creek Flood Control, Habitat and Seismic Improvement Project Alternatives Analysis
ANSWERS TO QUESTIONS IN THE NOTES AUTUMN 2018
 ANSWERS TO QUESTIONS IN THE NOTES AUTUMN 2018 Section 1.2 Example. The discharge in a channel with bottom width 3 m is 12 m 3 s 1. If Manning s n is 0.013 m -1/3 s and the streamwise slope is 1 in 200,
What Happens Downstream Stays Downstream, or Does It? Potential Failure Modes from Spillway Exit Flows
 What Happens Downstream Stays Downstream, or Does It? Potential Failure Modes from Spillway Exit Flows Gregory Richards, P.E., CFM, Gannett Fleming, Inc. Paul Schweiger, P.E., CFM, Gannett Fleming, Inc.
Road Safety Audit Report: Interstate 516
 Road Safety Audit Report: Interstate 516 Interstate 516 from Veterans Pkwy to Montgomery St. (State Route 420 from Veterans Pkwy to City Street 115207) Table of Contents Introduction Road Safety Audit
Washington St. Corridor Study
 FIGURE 7.17 Bridge Alternatives - Cross Sections 86 Discarded Alternative: Short-Term Bridge Repair Short-term repairs and west bridge span replacement were considered during analysis. Short-term repairs
CORPS FACTS. Harbor Dredging U.S. ARMY CORPS OF ENGINEERS BUILDING STRONG
 CORPS FACTS Harbor Dredging U.S. ARMY CORPS OF ENGINEERS BUILDING STRONG Disaster Response Sedimentation in the channel is caused by the normal cycle of silt movement, erosion from high water or heavy
Effect of Fluid Density and Temperature on Discharge Coefficient of Ogee Spillways Using Physical Models
 RESEARCH ARTICLE Effect of Fluid Density and Temperature on Discharge Coefficient of Ogee Spillways Using Physical Models M. SREENIVASULU REDDY 1 DR Y. RAMALINGA REDDY 2 Assistant Professor, School of
Swamp Road Residents Study
 Swamp Road Residents Study SRRG Meeting with PennDot and Elected Officials Newtown and Wrightstown, PA April 25, 2008 Newtown Township Section of Swamp Road Limited Public Funds No reconstruction of a
Water budgets of the two Olentangy River experimental wetlands in 1998
 Water budgets of the two Olentangy River experimental wetlands in 1998 Naiming Wang and William J. Mitsch School of Natural Resources The Ohio State University Water Budgets 17 Introduction An understanding
Whitewater Valley Station Surface Impoundment Coal Combustion Residual Annual Report
 Whitewater Valley Station Wayne County, Indiana GAI Project Number: C151119.07 July 2017 Prepared by: GAI Consultants, Inc. Murrysville Office 4200 Triangle Lane Export, Pennsylvania 15632-1358 Prepared
Red River Basin and FM Diversion Hydrology. North Dakota Water Education Foundation Executive Briefing July 13, 2012
 Red River Basin and FM Diversion Hydrology North Dakota Water Education Foundation Executive Briefing July 13, 2012 Red River Basin Total Drainage Area: 45,000 square miles North Dakota Fargo, ND Moorhead,
Owl Canyon Corridor Project Overview and Summary
 Owl Canyon Corridor Project Overview and Summary December 22, 2008 The Owl Canyon corridor (generally the connection between the I-25 / Larimer County Road 70 interchange and the US 287 / Larimer County