Final Report Hinchinbrook Entrance Wind Wave Extremes
|
|
|
- Clifton Snow
- 5 years ago
- Views:
Transcription

1 Final Report Hinchinbrook Entrance Wind Wave Extremes PRESENTED TO Prince William Sound Regional Citizens Advisory Council NOVEMBER 20, 2018 ISSUED FOR USE FILE: 704-TRN.WTRM03050 The opinions expressed in this PWSRCAC-commissioned report are not necessarily those of PWSRCAC.
2 This page is intentionally left blank. 4-2 Attachment
3 HINCHINBROOK ENTRANCE WIND WAVE EXTREMES FILE: 704-TRN.WTRM03050 NOVEMBER 20, 2018 ISSUED FOR USE TABLE OF CONTENTS EXECUTIVE SUMMARY... IV 1.0 INTRODUCTION RESULTS Local Sensor Data Characterization Closure Conditions Characterization Modelled Data Characterization NOAA/NCEP s WAVEWATCH III Model NWS s NDFD Model Texas A&M University s SWAN Model University of Alaska s WRF Model Tetra Tech s SWAN Model (TT-SWAN) Modelled Results DISCUSSION RECOMMENDATIONS CLOSURE REFERENCES GLOSSARY LIST OF TABLES IN TEXT Table 2-1: Summary of Datasets used in the analysis for this project... 2 Table 2-2: Closure Data at Hinchinbrook Entrance... 4 Table 2-3: Observed Significant Wave Height at Seal Rocks and at Point of Interest 1 and Point of Interest 2 at the Peaks of the 21 Closure Condition Storms in Table 2-4: Output Variables from Tetra Tech s SWAN Numerical Wave Model... 8 Table 2-5: Closure Data at Seal Rocks Location as Reported, Observed, and Modelled at the Seal Rocks Buoy Location for Table 2-6: Modelled Wind Speed Statistics at Buoy Locations Table 2-7: Modelled Wave Height Statistics over 3 m (9.84 feet) at Buoy Locations Table 2-8: TT-SWAN Modelled Significant Wave Height at Seal Rocks and at Point of Interest 1 and Point of Interest 2 at the Peaks of the 18 Closure Condition Storms HinchinbrookFinalReport-BT i
4 HINCHINBROOK ENTRANCE WIND WAVE EXTREMES FILE: 704-TRN.WTRM03050 NOVEMBER 20, 2018 ISSUED FOR USE 4-2 Attachment APPENDIX SECTIONS FIGURES Figures APPENDICES Appendix A Tetra Tech s Limitations on the Use of this Document ii HinchinbrookFinalReport-BT
5 HINCHINBROOK ENTRANCE WIND WAVE EXTREMES FILE: 704-TRN.WTRM03050 NOVEMBER 20, 2018 ISSUED FOR USE LIMITATIONS OF REPORT This report and its contents are intended for the sole use of Prince William Sound Regional Citizens Advisory Council and their agents. Tetra Tech Canada Inc. (Tetra Tech) does not accept any responsibility for the accuracy of any of the data, the analysis, or the recommendations contained or referenced in the report when the report is used or relied upon by any Party other than Prince William Sound Regional Citizens Advisory Council, or for any Project other than the proposed development at the subject site. Any such unauthorized use of this report is at the sole risk of the user. Use of this report is subject to the terms and conditions stated in Tetra Tech Canada Inc. s Services Agreement. Tetra Tech s Limitations on the Use of this Document are provided in Appendix A of this report. HinchinbrookFinalReport-BT iii
6 HINCHINBROOK ENTRANCE WIND WAVE EXTREMES FILE: 704-TRN.WTRM03050 NOVEMBER 20, 2018 ISSUED FOR USE 4-2 Attachment EXECUTIVE SUMMARY The Port of Valdez ships about 500,000 barrels per day of crude oil by means of sea-going tankers. An identified risk to this marine shipping is the possibility of a tanker losing power as it passes through Hinchinbrook Entrance, about 74 nautical miles from Valdez. One of the risk-reducing measures currently in place is the use of tanker escort vessels (powerful tug boats) that could keep a stricken tanker off the coast, and possibly tow it to safety. Tetra Tech Canada Inc. (Tetra Tech) was retained by the Prince William Sound Regional Citizens Advisory Council (PWSRCAC) to conduct a study that better defines weather related conditions at Hinchinbrook Entrance and their effects on the feasibility of efficient and safe rescue operations by these tanker escort vessels, by defining the frequency and duration of conditions under which the escort vessels could not operate. Such conditions are defined as closure conditions, during which a tanker is not allowed to pass through Hinchinbrook Entrance. An analysis of local buoy data was conducted to better characterize closure conditions, which are defined as waves exceeding 15 feet (4.572 m) or winds exceeding 45 knots (23.15 m/s). The wave criterion is based on the Significant Wave Height (i.e., the average of the largest third of the waves under consideration). Interestingly, 95 percent of the time only one or the other of these conditions is met (i.e., very seldom do both winds and waves meet closure conditions). The typical closure condition based on recordings at the Seal Rocks buoy occurred, on an annual basis, 10 to 26 times for wave exceedance, one to three times for wind exceedance, and one to three times for both wind and wave threshold exceedance. The mean direction of the peak wind speed that triggers closure conditions is 96 degrees corresponding to an easterly wind. Mean wind speed during closure is 47 knots (24.2 m/s) and maximum recorded wind is 53.1 knots (27.3 m/s). Closures triggered by winds typically last 1.9 hours. The mean direction of waves that trigger closure conditions is 128 degrees with average closure wave height of 17.4 feet (5.3 m) and a maximum recorded wave height of 26.9 feet (8.2 m). Closures triggered by excessive waves typically last 6.1 hours. Closure condition assessment currently relies on near-real-time observational data from the Seal Rocks buoy, just south of Hinchinbrook Entrance. Tetra Tech conducted two lines of investigation using both observational data and numerical model data to assess the reliability of the current method and to seek ways to improve it. First, it was found that the Seal Rocks buoy typically over-reported wind speeds in comparison to nearby buoys. However, Seal Rocks Buoy under-reported wave conditions in comparison to nearby buoys at least for the large waves characterizing closure conditions. These observations suggest that the Seal Rocks wave data should likely be scaled for use in assessing closure conditions. It was also found, by computing the auto-correlation of the Seal Rocks wind and wave data, that once an assessment of wind and wave conditions is made there is a 30 percent probability that seven hours later, when a tanker leaving Valdez arrives at Hinchinbrook Entrance, say, conditions will have changed from closure to non-closure, or vice versa: persistence is not a good forecast method in this part of the world. Considering the above-noted lack of persistence, Tetra Tech conducted an analysis to understand the suitability of available modelled data for simulating the conditions within Hinchinbrook Entrance and hence the reliability of shortterm forecasts. The WAVEWATCH III model proved to be a suitable candidate for wind and wave conditions in the area of interest. The model is only made available for download in hindcast mode and therefore it is not suitable for forecasting closure events within Hinchinbrook Entrance. Tetra Tech hence implemented a numerical wave model, Simulating Waves Nearshore or SWAN, which has capability of being run operationally in forecast mode and would therefore be useful to decision makers charged with declaring a closure event. This model, using a finer spatial grid, also allowed a more detailed examination of the spatial variability of wave conditions in the vicinity of Hinchinbrook Entrance. Recommendations on further work include recording and archiving a detailed summary and characterization of declared closures and improving the skill of the numerical wave model developed by Tetra Tech. The former would enable a more in-depth analysis of closures at Hinchinbrook Entrance and would improve the ability of the forecast numerical wave model to accurately predict closures. The model would also be useful in assessing the accuracy of local sensors for detecting the exact conditions being experienced in the area of interest during a closure. For instance, wind speed is likely under-reported by buoys during extreme winds, when the buoy is tilted considerably. HinchinbrookFinalReport-BT iv
7 HINCHINBROOK ENTRANCE WIND WAVE EXTREMES FILE: 704-TRN.WTRM03050 NOVEMBER 20, 2018 ISSUED FOR USE 1.0 INTRODUCTION This Final Report provides a summary and conclusion of the work presented in Interim Report 1, and then updated in Interim Report 2. This final report therefore refers back to Interim Report 2 for further details where necessary. The 1989 Exxon Valdez grounding and oil spill in the rich ecosystem of Prince William Sound led stakeholders to make efforts to prevent similar incidents in the future. The Prince William Sound Regional Citizens Advisory Council s (PWSRCAC) mission is to promote environmentally safe operation of the Alyeska terminal and associated tankers. It is a non-profit corporation that was established following the Exxon Valdez oil spill. PWSRCAC advises Alyeska Pipeline Service Company, oil shippers, regulatory agencies, elected officials, and the general public on issues related to the prevention and response to oil spills and the mitigating environmental impacts from terminal and tanker operations. Tetra Tech Canada Inc. (Tetra Tech) was retained by PWSRCAC to conduct a study that better defines weather related characteristics as they affect the feasibility of tanker escort vessels conducting rescue operations at the Hinchinbrook Entrance to Prince William Sound, Alaska. Tankers transiting Prince William Sound and Hinchinbrook Entrance are escorted by escort vessels to ensure swift assistance in the event the tanker becomes disabled. Wind speed and wave height are the main factors affecting the feasibility of tanker escort vessels rescuing a stricken tanker. To prohibit transits in extreme wind and wave conditions, a closure condition has been established as part of the Vessel Escort and Response Plan (VERP) for vessels servicing the Port of Valdez. The Alyeska Pipeline Service Company has defined this closure condition as wind speeds in excess of 45 knots or wave heights in excess of 15 feet, both measured at the Seal Rocks (NOAA 46061) weather buoy. The wave criterion is based on the Significant Wave Height (i.e., the average of the largest third of the waves under consideration). Despite this safety measure, however, a recent study has shown that the possibility of saving an oil tanker in distress is unlikely for conditions at or above the closure condition (Robert Allan, 2016), suggesting the closure condition needs to be revised. This project will better define weather related characteristics of a closure condition with a focus on the met-ocean conditions in Hinchinbrook Entrance that impact the potential rescue of disabled vessels. This project seeks to answer two main questions: Closure Condition Frequency: What is the frequency of extreme-event/closure-conditions at Hinchinbrook Entrance? Closure Condition Applicability: How well does the definition and identification of a closure condition reflect conditions actually experienced by vessels transiting Hinchinbrook Entrance? Are there better methods and data sources to identify closure conditions? To address these two questions, a four-component strategy was proposed: Task 1: Statistical investigation of closure condition likelihood and duration based on Seal Rocks data; Task 2: Analysis of past performance with respect to accurately declaring closure conditions; Task 3: Hindcast conditions within Hinchinbrook Entrance using numerical wind, wave, and current models and generate scaling relationships between modelled conditions in Hinchinbrook Entrance and available real time data; and Task 4: Evaluate accuracy of closure condition hindcasting generated in Task 3 based on the Seal Rocks measurement buoy. The first interim report summarizes the progress on Tasks 1 and 2, covering data acquisition and highlighting any shortcomings of the data collection. The second interim report is an update to the first interim report, and presents the data gathered and the analysis that was conducted. This final report summarizes the findings of the first and second interim reports and provides recommendations to the PWSRCAC. In the following sections, a technical summary of the results and discussion is presented, followed by recommendations. HinchinbrookFinalReport-BT 1
8 HINCHINBROOK ENTRANCE WIND WAVE EXTREMES FILE: 704-TRN.WTRM03050 NOVEMBER 20, 2018 ISSUED FOR USE 4-2 Attachment 2.0 RESULTS All known publicly available observational and modelled data was obtained at the time of reporting for Interim Report 2. Table 2-1 summarizes the data that were thus available to this study. Four buoys, providing winds and waves, were relatively close to Hinchinbrook Entrance. Two land stations were also available. The locations of these observing platforms are shown on Figure Five numerical models, simulating winds, waves, or both, were available. Table 2-1 also summarizes the spatial extent of the available numerical models. Sufficiently detailed data on declared closure conditions and information on best-practice procedures for monitoring and declaring closure conditions was not made available throughout the duration of the project, despite Tetra Tech s continuous attempts in reaching out to the project consortium. An analysis of false positive or false negative declared closure conditions was therefore not possible. Modelled data which is available online were used in Tetra Tech s analysis to determine the current ability to simulate closure conditions at Seal Rocks. The National Digital Forecast Databases (NDFD) and WAVEWATCH III models provide data on both wind and wave conditions, the two SWAN models provide data on wave conditions only, while the weather research and forecasting (WRF) model provides data on wind conditions only. Tetra Tech developed a high-resolution version of the SWAN numerical wave model to improve the estimated wave conditions in Hinchinbrook Entrance as described in Section 6.5 of Interim Report 2. To differentiate the two SWAN models, the SWAN model implemented by Tetra Tech is referred to as TT-SWAN. Table 2-1: Summary of Datasets used in the analysis for this proj ect Data Type Instrument / Model Station Name Source Station ID Interim Report 2 Model Resolution Local Sensor Buoy Seal Rocks NDBC Section 4.0 N/A Cape Cleare NDBC Cape Suckling NDBC West Orca Bay NDBC Station Nuchek NRCS 1074 Station Middleton Island rd Closure Conditions N/A N/A Provided by U.S. Coast Guard via Section 5.0 N/A Model WAVEWATCH III N/A NOAA, NCEP N/A Section km NWS NDFD National Weather Service, NOAA Section x 18.5 km SWAN Texas A&M University Section km WRF AEFF, University of Alaska Section km TT-SWAN Tetra Tech Section m HinchinbrookFinalReport-BT 2
9 HINCHINBROOK ENTRANCE WIND WAVE EXTREMES FILE: 704-TRN.WTRM03050 NOVEMBER 20, 2018 ISSUED FOR USE High wind events in the vicinity of Hinchinbrook Entrance are typically the result of two processes: Gap Winds: Strong gap winds can result from high pressure centered over mainland Alaska combined with a low pressure system in the Gulf of Alaska. These winds are typically northerly and localized within Prince William Sound and at Hinchinbrook Entrance (Macklin et al. 1988, Winstead et al. 2006, Liu et al. 2008); and Intense Low Pressure Systems: These low pressure systems lead to large storms in the Gulf of Alaska and are the source of the most severe winds in the project area. They result in strong easterly and south-easterly winds between Hinchinbrook Entrance and Middleton Island (Overland & Cardone, 1980; Rodionov, 2007; Mesquita, 2009; Pickart, 2009; Olsson, 2015). Gap winds are typically localized and short-lived and have not contributed to a closure condition within the available data record. The intense low pressure systems are the primary weather pattern under investigation for this study as they appear to result in closure conditions. The prevailing winds offshore of Hinchinbrook Entrance are easterly, with most storm winds also from the east. The Pacific and Arctic Coasts Alaska Pilot (NOAA, 2017) contains information on the extreme conditions experienced in Hinchinbrook Entrance. With a strong south gale and ebb tide, very heavy overfalls and tide rips occur in Hinchinbrook Entrance and are dangerous to small craft. Tremendous seas, steep, and breaking, are sometimes encountered just outside the entrance. During heavy weather, tide rips and confused seas are in the vicinity of Wessels Reef. Many halibut schooners have foundered between Cape St. Elias and Montague Island. A more detailed meteorological characterization of Hinchinbrook Entrance is presented in Interim Report 2, Section LOCAL SENSOR DATA CHARACTERIZATION The wind speeds and directions as measured by the National Data Buoy Center (NDBC) buoys are the averaged measurements collected over an eight-minute period. The gust winds reported by the NDBC buoys are not instantaneous peak winds but rather 5 or 8 second gust speed (determined by the on-board computing system capacity) as measured during the eight-minute averaging period. Seal Rocks, Cape Cleare, Cape Suckling, and West Orca Bay buoys record wind speeds at their anemometer elevation of 16.4 feet (5 m). Therefore, wind speeds recorded by these buoys will be about 10 percent lower than winds reported at the standard 32.8 feet (10 m) elevation. Wind data at Nuchek station was downloaded from the U.S. Department of Agriculture s Natural Resources Conservation Service (NRCS) website. Nuchek station is reported to have an elevation of 49.2 feet (15 m). Wave observations recorded by the NDBC buoys are not direct recordings of the accelerometer and inclinometer sensors. Measurements result from computation of the buoy s vertical displacement throughout the wave acquisition time. The on-board computer applies Fast Fourier Transforms to convert the recordings from a time to a frequency domain. The data is post-processed to reduce noise. Spectral wave energies, significant wave height, and wave period are then derived from this data and transmitted. The original acceleration and displacement measurements are not transmitted. The significant wave heights are recorded by the NDBC buoys as the average of the highest one-third of all the wave heights during a 20 minute sampling period, also called the wave acquisition time. The wave direction is the direction from which the waves at the dominant wave period are travelling. Two measurements of wave period are available for the NDBC buoys the average wave period, defined as the mean period of all waves during the 20 minute sampling period, and the dominant wave period, defined as the period with the maximum wave energy. Winds recorded at Seal Rocks over an 11-year period are predominantly easterly and light to moderate (68 percent of recorded speeds are less than knots or 8 m/s). Seal Rocks buoy also records gap winds which are distinct northerly winds that are noticeably lacking at the other buoy stations. The Seal Rocks buoy has recorded these gap winds with speeds reaching up to knots (15 m/s), which corresponds to a wind speed of approximately knots (16.7 m/s) to 34 knots (17.5 m/s) at a height of 32.8 feet (10 m). Maximum recorded non-gap wind speeds at Seal Rocks reach 53 knots (27.3 m/s). HinchinbrookFinalReport-BT 3
10 HINCHINBROOK ENTRANCE WIND WAVE EXTREMES FILE: 704-TRN.WTRM03050 NOVEMBER 20, 2018 ISSUED FOR USE 4-2 Attachment Waves at Seal Rocks originate from the south-southwest to the southeast. The maximum significant wave height observed over the three and a half years of available records at Seal Rocks is 26.9 feet (8.19 m). Rose Interim Report 2, Section 4 provides further information on the characterization of wind and wave conditions at each of the locations. 2.2 CLOSURE CONDITIONS CHARACTERIZATION Closure condition information was provided to Tetra Tech by Carlos Quintero (Quintero, 2017) of the U.S. Coast Guard. The information provided is summarized in Table 2-2 below. For further information, refer to Interim Report 2, Section 5.1. No information was provided on the relative roles of waves and wind in determining closure conditions or dates. Table 2-2: Closure Data at Hinchinbrook Entrance Number of Closures Total Hours of Closures Average Duration Per Closure (Hours) Table 2-3 below shows the date and time of the peak of closure condition storms in 2016, as observed at the Seal Rocks buoy together with the maximum significant wave height as observed by Seal Rocks. The table shows the corresponding maximum observed significant wave heights at Cape Cleare and Cape Suckling buoys. Table 2-3 also shows the percentage difference between the observed peak significant wave height at Seal Rocks and both Cape Cleare and Cape Suckling buoys. A percentage difference of -1 percent means that the observed wave at the buoy is 1 percent lower than Seal Rocks, a percentage difference of 1 percent means that the observed wave at the buoy is 1 percent higher than Seal Rocks. The time difference is the time lag between the peak wave height at Seal Rocks and the peak wave height at the buoys, for the same storm. Thus, a 1 hour time difference means that the peak at the buoy occurred 1 hour after Seal Rocks, a -1 hour time difference means that the peak at the buoy occurred 1 hour before Seal Rocks. Table 2-3 highlights the variability in wave conditions experienced at Seal Rocks and the Cape Cleare and Cape Suckling buoys. At the peak of closure events, observed significant wave heights at Cape Cleare can be up to 72.5 percent larger and at Cape Suckling can be up to 65.1 percent larger. HinchinbrookFinalReport-BT 4
11 HINCHINBROOK ENTRANCE WIND WAVE EXTREMES FILE: 704-TRN.WTRM03050 NOVEMBER 20, 2018 ISSUED FOR USE Table 2-3: Observed Significant Wave Height at Seal Rocks and at Point of Interest 1 and Point of Interest 2 at the Peaks of the 21 Closure Condition Storms in 2016 Closure Condition Seal Rocks Cape Cleare Cape Suckling Date and Time Max Wave Height (feet) Max Wave Height (feet) % Difference Time Difference (hours) Max Wave Height (feet) % Difference Time Difference (hours) 2016/01/02 09: /01/09 17: /01/11 04: /01/17 03: /01/19 00: /01/22 05: /01/27 19: /02/04 00: /02/05 03: /02/21 19: /02/24 11: /02/28 07: /02/28 21: /04/30 23: /05/06 03: /09/21 18: /09/22 12: /11/08 05: /11/10 23: /12/01 06: /12/26 04: HinchinbrookFinalReport-BT 5
12 HINCHINBROOK ENTRANCE WIND WAVE EXTREMES FILE: 704-TRN.WTRM03050 NOVEMBER 20, 2018 ISSUED FOR USE 4-2 Attachment Closure conditions based on Seal Rocks observation data are characterized as follows: Between 2010 and 2017, wind-induced closure events were observed 12 times. In these 12 cases, waves were below the closure condition, by definition of a wind-induced closure event. Wave-induced closure events were observed 120 times, during each of which winds were below the closure condition, by definition of a waveinduced closure condition. Closure condition events triggered simultaneously by both wind and waves occurred a total of 11 times between 2010 and 2017; Closure conditions triggered by both wind and wave exceedance occurred one to three times per year during the available record, with a further 10 to 26 (neglecting 2013 due to equipment failure) exceedances per year associated with waves-only and a further one to three closures per year due to winds-only; The direction of the peak wind speed associated with a closure condition ranges from 82 to 108 degrees with a mean direction of 96 degrees (easterly); The peak wind speeds associated with a closure condition range from 45 knots to 53 knots (23.2 m/s to 27.3 m/s) with an average peak wind speed of 47 knots (24.2 m/s); The mean duration of a wind induced closure condition is 1.9 hours, and is much lower than the duration of wave induced closure durations, 6.1 hours; Over the entire period of record, Seal Rocks buoy experienced wind speeds higher than the other buoys (ranging from 1 to 136 percent higher) when there are either wave- or wind-induced closure conditions recorded at Seal Rocks; The wave direction associated with the peak of a closure condition ranges from 83 to 180 degrees with a mean incident wave direction of 128 degrees (from the southeast); The average significant wave height associated with a closure condition is 17.4 feet (5.3 m), and the overall maximum recorded wave height during a closure condition is 26.9 feet (8.2 m); Wave induced closure conditions typically have a duration ranging from four to seven hours; Although winds at Seal Rocks buoy are generally higher than at other buoys during both wave-induced and wind-induced conditions, the mean significant wave heights recorded at the Seal Rocks buoy are in general lower (ranging from 10 to 16.5 percent lower) than those recorded at the other buoys during closure conditions at the Seal Rocks buoy, suggesting that using Seal Rocks data to select closure conditions may miss some closure conditions or that the Seal Rocks buoy wave data should be scaled. At the peak of a closure, significant wave heights at Seal Rocks can be up to 72.5 percent lower than Cape Cleare and up to 65 percent lower than Cape Suckling; and To estimate how good a nowcast or an observation is in being a predictor of the future, the correlation between the wind speeds now and at different times in the future was calculated, using the Seal Rocks data. After a seven hour period, equivalent to the transit time between Valdez and Hinchinbrook, winds, on average, will be 30 percent higher or 30 percent lower. This means a significant chance of erroneously declaring a closure condition when none transpires or of declaring a non-closure condition when one does in fact develop. The poor correlation emphasizes the benefit of using a forecast as opposed to real-time observations to make go or no-go decisions. 2.3 MODELLED DATA CHARACTERIZATION Modelled data was available to Tetra Tech for download through the Alaska Ocean Observing System (AOOS) portal in hindcast mode. Tetra Tech analyzed the suitability of the available datasets with respect to simulating the conditions within Hinchinbrook Entrance. Tetra Tech also developed a wave simulation which would have the capability of being run in a forecast setting in order to inform decision makers of the future conditions in Hinchinbrook Entrance. This wave simulation also allowed a better understanding of the spatial variability of wave conditions HinchinbrookFinalReport-BT 6
13 HINCHINBROOK ENTRANCE WIND WAVE EXTREMES FILE: 704-TRN.WTRM03050 NOVEMBER 20, 2018 ISSUED FOR USE within the vicinity of Hinchinbrook Entrance. The models under consideration are listed in Section 2.0. The following sections discuss the results on the performance of each of the models NOAA/NCEP s WAVEWATCH III Model The average number of closure events occurring on a particular month based on data available between 04 February September 2017 from local sensor and WAVEWATCH III is displayed on Figure Closure events are most likely to occur between November and February, with February having the greatest number of occurrences per month, according to recorded observations, and January having the greatest number of occurrences according to WAVEWATCH III simulations. The months June to August have the least closure events with July and August having no recorded closure events between the years 2011 and Figure shows wind closure events and wave closure events together with their magnitudes. The axis on the left displays the wind speed and the axis on the right displays the wave height. Wind closure events which have been simulated by WAVEWATCH III are illustrated by gold circles, wind closure events which were observed by the Seal Rocks buoy station are illustrated by red circles. WAVEWATCH III simulated wave closure events are represented by black circles, wave closures recorded by Seal Rocks buoy station are represented by green circles. The lines extending out of the circles depict the minimum and maximum extent of the closure event while the circle represents the average magnitude of that particular closure event. No simulated closure events are shown prior to 04 February 2011 and after 04 September 2017 due to WAVEWATCH III modelled datasets being unavailable. Figure also displays the discrepancy between the larger number of wave-induced closure events versus the lower number of wind-induced closure events. Wave-related closure conditions can be described as follows: Figure shows the mean significant wave height of closure events for WAVEWATCH III in comparison to buoy observations. WAVEWATCH III under-estimates maximum significant wave heights leading to closure events by 12.3 percent on average in comparison to buoy observations at Cape Cleare, Cape Suckling, and West Orca Bay. However, at Seal Rocks the WAVEWATCH III simulated maximum significant wave height that leads to closure conditions is exactly equal to its corresponding observed value from the Seal Rocks buoy. The agreement between WAVEWATCH III and observations supports the hypothesis that Seal Rocks buoy under-reports wave conditions, at least compared to the more exposed buoys at Cape Cleare and Cape Suckling. Or simply, that the Seal Rocks buoy is located in a somewhat quieter, lower wave energy part of the approaches to Hinchinbrook Entrance. Wind-related closure conditions are described below. Figure shows the mean wind speeds in m/s during closure events simulated by WAVEWATCH versus observations at several stations. There is no observed data at points 1 and 2. Nuchek station wind speeds are lower by a factor of 2.25 in comparison to data simulated by WAVEWATCH III. WAVEWATCH III simulates higher wind speeds by 20.3 percent in comparison to buoy observations. Again, at Seal Rocks station the WAVEWATCH III simulated wind speed is almost equal to the Seal Rocks buoy observed wind speed. Buoys reporting lower winds during high wind events might be the contributing factor to the discrepancy between the forecasted and observed values. WAVEWATCH III performs well at simulating wave conditions in Hinchinbrook Entrance. However, its use as a predictor of extreme conditions in Hinchinbrook Entrance is not possible as the datasets are posted on the AOOS portal in hindcast mode NWS s NDFD Model The NDFD is an operational collection of forecast variables including wind speed, wind direction, and wave height at a temporal resolution that varies between three and six hours. Wave direction and wave period are not part of the variables available through the NDFD forecast collection. NDFD is skilful at simulating wind and wave conditions in the area of interest. However, WAVEWATCH III demonstrates favourable statistical skill in reproducing wave and wind conditions in the area of interest. Further detail can be found in Interim Report 2, Section 6.2. HinchinbrookFinalReport-BT 7
14 HINCHINBROOK ENTRANCE WIND WAVE EXTREMES FILE: 704-TRN.WTRM03050 NOVEMBER 20, 2018 ISSUED FOR USE 4-2 Attachment Texas A& M University s SWAN Model The SWAN model produced by Texas A&M University has outputs for wave height, wave direction, and wave period at three hour intervals between 17 December 2011 and 13 September 2013 after which the model was decommissioned. This version of the SWAN model did not demonstrate adequate skill with respect to reproducing wave conditions within the area of interest and was therefore not considered for this analysis. Further details can be found in Interim Report 2, Section University of Alaska s WRF Model WRF performs well at simulating winds in the Gulf of Alaska, however WAVEWATCH III statistically performs better at reproducing wind conditions in this area. WRF wind speed RMSEs (root mean squared errors) are slightly higher than the corresponding WAVEWATCH III values. The biases for WRF wind speeds are similar at Seal Rocks and Cape Cleare, whereas at Cape Suckling and West Orca Bay the WRF wind speeds are greater than WAVEWATCH III winds. The WRF model is no longer operational, has a limited period of record, and therefore can neither be used in forecasting of closure conditions in the area of interest, nor used as initial conditions into the numerical wave model set up by Tetra Tech. Further detail may be found in Interim Report 2, Section Tetra Tech s SWAN Model (TT-SWAN) Although the WAVEWATCH III and NDFD models produce promising results for simulating wave conditions within the Gulf of Alaska, their major shortcoming is the un-availability of data in forecast mode. The modelled datasets are uploaded on the AOOS portal in hindcast mode, meaning their use is limited to analysis and are not suitable for forecasting closure conditions. It is our understanding that WAVEWATCH III and NDFD might have data assimilation techniques applied, if so, this would greatly improve the accuracy of the hindcast modelled datasets. This might therefore have had an effect on the model statistical analysis summarized above. Tetra Tech used the SWAN numerical wave model to develop a simulation of wave conditions within Hinchinbrook Entrance that would have the capability of running in forecast mode. Datasets used as input to the SWAN wave model include: Bathymetry; Wind; and Currents. Input datasets required by the SWAN wave model include bathymetry of the region, winds, and currents. The bathymetry for the study was obtained from NOAA s National Geophysical Data Center (NGDC) and archived at NOAA s National Center for Environmental Information (NCEI). The bathymetric data available within the region of interest has a resolution of eight arc-seconds (roughly 240 m). The winds at the four buoy stations were interpolated onto a grid and passed to SWAN as input. This works for a hindcast non-operational type scenario, however would not allow a forecast to be produced. The Regional Ocean Modeling System (ROMS) forecast of currents was acquired through the AOOS portal. The ROMS modeling framework includes 3-level nested grids of resolutions 1, 3, and 9 km that cover the Gulf of Alaska and Hinchinbrook Entrance. The available model data assimilates observational data to produce an accurate simulation of the ocean conditions. The geographical extent of the 1 km ROMS model unfortunately does not cover the entire SWAN domain as it is focused on Prince William Sound, therefore the 3 km ROMS model currents were used as input into the SWAN model. Currents are provided as input to SWAN at three hour intervals. The TT-SWAN model produces output for a number of variables as indicated in Table 2-4 on an hourly basis for the entire year of Table 2-4: Output Variables from Tetra Tech s SWAN Numerical Wave Model HinchinbrookFinalReport-BT 8
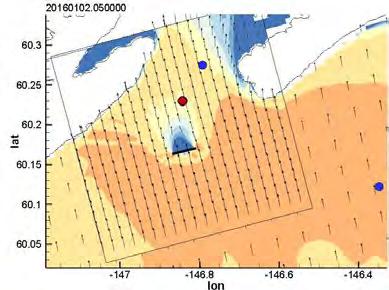
15 HINCHINBROOK ENTRANCE WIND WAVE EXTREMES FILE: 704-TRN.WTRM03050 NOVEMBER 20, 2018 ISSUED FOR USE SWAN Variable Hs Variable Definition Significant Wave Height (m) Dir Mean Wave Direction ( o ) Tps Ubot Steepness Smoothed Peak Period (s) Root Mean Square Value of maxima of the orbital velocity near the bottom (m/s) Average Wave Steepness (dimensionless) Figure shows the TT-SWAN nested grid setup with the 750 m coarser resolution domain, and the 150 m finer resolution domain focused on Hinchinbrook Entrance. The red markers represent the buoys and met stations where data is available within the region of interest. The two points of interest specified in the request for proposal (RFP) are represented by blue markers. Figure displays some of the results obtained through the TT-SWAN numerical model over the first few weeks of the modelled year (2015), in the form of time-series plots of significant wave height, wave direction, wave period, wind direction, and wind speed. This week was selected as there are a few events where the closure condition thresholds were exceeded. The figure provides a visual comparison between the results obtained by the coarse and fine TT-SWAN models, the observational data and the WAVEWATCH III model at the Seal Rocks buoy station location. This figure shows how the spatial variability of the wave field is adequately captured by the coarse resolution version of the SWAN model. It also shows the adequacy of the SWAN numerical wave model to skilfully capture the high wave height events. Figure shows the SWAN coarse and fine grid outputs at the Seal Rocks station, and Points of Interest 1 and 2 for the first 15 days of January The figure shows the significant wave heights forecast at those locations by the two SWAN numerical model. The winds at all three locations are the same. The significant wave heights vary throughout Hinchinbrook Entrance. Wave heights at Point of Interest 2 are higher than those forecast at Seal Rocks and Point of Interest 1. Also, the fine grid wave heights are slightly higher than those forecast by the coarse grid. The spatial variability between the three stations plotted is significant. It raises the question: what area should the closure condition apply to? Answering that question is beyond the scope of this report, but it should be addressed. Figures and show a sequence of maps of the significant wave height for a closure condition event where the peak wave height of 19.3 feet (5.88 m) at Seal Rocks buoy was observed on 02 January 2016 at 08:50H and the SWAN model simulates the wave height to reach a peak value of feet (6.26 m) at 08:00H. Figures and show the steepness for the same event. The typical closure condition statistics as simulated by the SWAN numerical wave model over the simulated 12 months in 2016 are as follows: 18 closure events occurred; The mean duration of closure is 10.9 hours, with a minimum duration of 1 hour, and a maximum duration of 34 hours. The closure condition based on the observed data spanned 31 hours, close to the observed duration; and The average wave height associated with the simulated closures is 17.4 feet (5.3 m), and the maximum wave height is 25 feet (7.6 m). The same closure condition information as observed at Seal Rocks Buoy Station over the full year of 2016 are as follows: HinchinbrookFinalReport-BT 9
16 HINCHINBROOK ENTRANCE WIND WAVE EXTREMES FILE: 704-TRN.WTRM03050 NOVEMBER 20, 2018 ISSUED FOR USE 4-2 Attachment 21 closure events occurred; The mean duration of closure is 8.4 hours, with a minimum duration of 1 hour, and a maximum duration of 31 hours; The average wave height associated with the simulated closures is 17.6 feet (5.36 m), and the maximum wave height is 24.2 feet (7.4 m); and 12 out of the 18 simulated closure conditions agree with the observed closure events. A summary comparison of the closure events triggered by excessive wave heights at Seal Rocks in Hinchinbrook Entrance by the SWAN numerical wave model set up by Tetra Tech is shown in Table 2-5 below. The SWAN statistics when compared to the Seal Rocks buoy observational data was shown in Table 2-7 below. Further information on the SWAN model and its setup can be found in Interim Report 2, Section 6.0. Table 2-5: Closure Data at Seal Rocks Location as Reported, Observed, and Modelled at the Seal Rocks Buoy Location for 2016 Reported (Q uintero, 2017) Observed (Seal Rocks Buoy) Modelled (TT- SWAN) Number of Closures Total Hours of Closures Average Duration Per Closure (Hours) Average Observed Magnitude of Event Wind Speed (m/s) N/A N/A Wind Speed (knots) N/A 33 N/A Wind Direction ( o ) N/A 108 N/A Wave Height (m) N/A Wave Height (feet) N/A Wave Direction ( o ) N/A Dominant Wave Period (s) N/A Steepness N/A N/A Maximum Observed Magnitude of Event Wind Speed (m/s) N/A 23.5 N/A Wind Speed (knots) N/A 45.7 N/A Wind Direction ( o ) N/A 188 N/A Wave Height (m) N/A Wave Height (feet) N/A Wave Direction ( o ) N/A Dominant Wave Period (s) N/A Steepness N/A N/A HinchinbrookFinalReport-BT 10
17 HINCHINBROOK ENTRANCE WIND WAVE EXTREMES FILE: 704-TRN.WTRM03050 NOVEMBER 20, 2018 ISSUED FOR USE Modelled Results The bias, RMSE, and skill statistics were computed as a way to assess the ability of the discussed models to produce an accurate forecast and as a method of quantitatively comparing the models to each another. The RMSE is defined as the average magnitude of the forecast error and is calculated by the following equation where N is the total number of forecast to observation pairs. RMSE is always positive and has the units of the variable under consideration. Zero represents a perfect forecast. The bias is defined by the following equation: NN RRRRRRRR = 1 NN (FFFFFFFFFFFFFFFF ii OOOOFFFFFFOOFFFFOOFFOO ii ) 2 ii=1 NN BBOOFFFF = 1 NN FFFFFFFFFFFFFFFF ii 1 OOOOFFFFFFOOFFFFOOFFOO ii ii=1 Therefore, a bias of 0 means a perfect forecast, a positive bias represents forecast values that are, on average, greater than the corresponding observed values, and a negative bias represents a forecast that is generally lower than observed values. A bias of 0.25 therefore represents a forecast that is 25 percent higher than the associated observations. A bias of represents a forecast that simulates values 25 percent lower than observations. The model skill is defined by the following equation where FFOOFFFFFFOOFFFFOOFFOO is the mean of the observation: ffffffffffffffff FFOOFFFFFFOOFFFFOOFFOO 2 RRSSOOSSSS =1 ffffffffffffffff FFOOFFFFFFOOFFFFooFFOO + FFOOFFFFFFOOFFFFOOFFOO FFOOFFFFFFOOFFFFooFFOO 2 The skill is another quantitative description of the similarity between forecast and observation. A skill of value 1 represents a perfect forecast whilst a forecast which is totally dissimilar to observation will have a skill of value 0. A perfect forecast is represented by a skill of 1. Table 2-6 displays a statistical assessment of the modelled wind speeds at the observing buoys. WAVEWATCH III performs better at simulating wind speeds at Seal Rocks than the NDFD and WRF models. The bias indicates that WAVEWATCH III wind speeds are 24.7 percent higher than those observed by the Seal Rocks buoy. The WAVEWATCH III RMSE (i.e., the average magnitude of the forecast error) is lower than the other models under consideration. WAVEWATCH III skill is the closest to 1.0 of the three models, hence has the highest skill at predicting wind speeds at Seal Rocks. HinchinbrookFinalReport-BT 11
18 HINCHINBROOK ENTRANCE WIND WAVE EXTREMES FILE: 704-TRN.WTRM03050 NOVEMBER 20, 2018 ISSUED FOR USE 4-2 Attachment Table 2-6: Modelled Wind Speed Statistics at Buoy Locations Location Bias RMSE Skill WWIII NDFD WRF WWIII NDFD WRF WWIII NDFD WRF Seal Rocks Cape Cleare Cape Suckling West Orca Bay Table 2-7 displays a statistical assessment of wave heights greater than 9.84 feet (3 m). Over the entire modelled period, WAVEWATCH III has the lowest bias with modelled wave heights at Seal Rocks being greater than observed by 22.1 percent, followed by TT-SWAN with modelled wave heights at Seal Rocks being greater than observed by 22.5 percent, and NDFD with modelled wave heights at Seal Rocks being less than observed by 24.7 percent. TT-SWAN has the smallest average magnitude of forecast error (RMSE), followed by WAVEWATCH III and NDFD respectively. The WAVEWATCH III skill of simulating wave heights is also superior to the skills demonstrated by TT-SWAN and NDFD models respectively. Table 2-7: Modelled Wave Height Statistics over 9.84 feet (3 m) at Buoy Locations Location Bias RMSE Skill WWIII NDFD TT-SWAN WWIII NDFD TT-SWAN WWIII NDFD TT-SWAN Seal Rocks Cape Cleare Cape Suckling West Orca Bay N/A N/A N/A N/A N/A N/A N/A N/A N/A The spatial variability in significant wave height at various locations in the vicinity of Hinchinbrook Entrance is quite large at times. The TT-SWAN model simulated significant wave heights for the full year of During the simulated period, 18 storms, based on Seal Rocks data, breach the closure conditions threshold. Table 2-8 below displays the date and time of the peak of the storm as modelled by TT-SWAN at Seal Rocks, and the maximum significant wave height as modelled at Seal Rocks. The Table also shows the corresponding maximum significant wave height at Point of Interest 1 and Point of Interest 2. Table 2-8 also shows the percentage difference between the modelled peak significant wave height at Seal Rocks and both points of interest. A percentage difference of -1 percent means that the point of interest is 1 percent lower than Seal Rocks, a percentage difference of 1 percent means that the point of interest is 1 percent higher than Seal Rocks. The time difference is the time lag between the peak wave height at Seal Rocks and the peak wave height at the points of interest, for the same storm. Thus, a 1 hour time difference means that the peak at the point of interest occurred 1 hour after Seal Rocks, a -1 hour HinchinbrookFinalReport-BT 12
19 HINCHINBROOK ENTRANCE WIND WAVE EXTREMES FILE: 704-TRN.WTRM03050 NOVEMBER 20, 2018 ISSUED FOR USE time difference means that the peak at the point of interest occurred 1 hour before Seal Rocks. Table 2-8 highlights the spatial variability in wave heights between Seal Rocks and the points of interest. At the peak of closure events, simulated significant wave heights are up to 20 percent higher at point of interest 2 than it is at Seal Rocks. This further supports the hypothesis that conditions at Seal Rocks alone are not good indicators of a closure event. Table 2-8: TT-SWAN Modelled Significant Wave Height at Seal Rocks and at Point of Interest 1 and Point of Interest 2 at the Peaks of the 18 Closure Condition Storms Closure Condition Seal Rocks Point of Interest 1 Point of Interest 2 Date and Time Max Wave Height (feet) Max Wave Height (feet) % difference Time Difference (hours) Max Wave Height (feet) % Difference Time Difference (hours) 2016/01/02 08: /01/05 02: /01/05 14: /01/09 16: /01/11 10: /01/17 03: /01/19 00: /01/26 00: /01/27 21: /01/28 15: /02/04 01: /02/04 22: /02/08 07: /02/08 16: /02/21 23: /02/24 11: /02/28 14: /11/16 11: HinchinbrookFinalReport-BT 13
20 HINCHINBROOK ENTRANCE WIND WAVE EXTREMES FILE: 704-TRN.WTRM03050 NOVEMBER 20, 2018 ISSUED FOR USE 4-2 Attachment 3.0 DISCUSSION Because no detailed closure condition records were made available to Tetra Tech, the following discussion is based on data collected from observation buoys and on modelled data. As the closure condition is currently defined, it is far more likely for a closure condition to be declared on the basis of wave height than wind speed. This is despite the fact that Seal Rocks buoy generally records higher wind speeds and lower wave heights than neighbouring stations. That is, wave observations recorded at Seal Rocks may be missing potential closure events. A component of this mismatch may be that the closure condition wave height is defined as 15-foot seas, which is approximately a moderate gale (Force 6 according to the Douglas Sea Scale according to the Beaufort scale), while closure condition wind speed of 45 knots is a severe gale (Force 9). There are also concerns of wind speeds being under-reported, particularly during high wave events due to sheltering and knockdown of the anemometer on board the buoy. Tetra Tech understands that the closure condition is defined in such a way as to ensure that rescue vessels can get to and control a tanker experiencing difficulties. The tanker doesn t have as much difficulty navigating through these conditions as does the rescue vessel. A tanker in ballast sits higher in water than a laden tanker. It therefore experiences higher wind drag and less hydrodynamic drag. A tanker in ballast drifts faster than a laden tanker making it more difficult to rescue. Robert Allan (2016) reports that there are different rescue vessel types and classes. The report concludes that the defined closure conditions are severe for even the larger rescue vessels (above 130 feet in length). The rescue vessel needs to be able, at a minimum, to prevent the tanker from drifting into a lee shore. However, with the current closure condition definition, even the most powerful of rescue vessels available in the Ship Escort/Response Vessel System (SERVS) fleet would not be able to slow a tanker s drift to zero. The question then would be: can the rescue vessel safely slow the tanker drift sufficiently that conditions improve or a second rescue vessel arrives on scene before the tanker strikes shore. The above suggests some important observations regarding the current closure condition definition: Should the closure condition threshold for wind speed be dropped, or conversely, the wave closure condition threshold increased? It is likely that closure conditions cannot be accurately determined in the absence of adequate wave data as there are more wave closure conditions than wind closure conditions. Does the closure condition need to be redefined to safely allow a rescue vessel to help a stricken tanker in ballast? Should the closure condition be redefined to allow for a typical SERVS fleet rescue vessel to safely respond to a stricken vessel? During closure conditions at Seal Rocks, observed wave heights at the Cape Cleare and Cape Suckling buoys are up to 16.5 percent higher than those recorded at Seal Rocks. At the peak of a closure condition the offshore buoys can be 72.5 percent higher than the Seal Rocks buoys. Tow rescue operations might need to be performed in these offshore environments, perhaps the wave conditions at these locations should also be considered in defining the closure condition? Simulated wave conditions at Point of Interest 2 are up to 20 percent higher than simulated wave conditions at Seal Rocks at the peak of a closure event. Should the spatial variability of wave heights within the area of interest be taken into consideration when defining the closure condition? Should marine weather forecasts be taken into consideration when defining the closure condition to account for the spatial variability of significant wave heights and the potential for waves to either build or decay in the next seven or so hours? HinchinbrookFinalReport-BT 14
21 HINCHINBROOK ENTRANCE WIND WAVE EXTREMES FILE: 704-TRN.WTRM03050 NOVEMBER 20, 2018 ISSUED FOR USE It may be possible to open up shipping windows by increasing the closure condition wave height to bring it in line with the closure condition wind speed. Alternatively, the closure condition wind speed could potentially be lowered without significantly impacting the available shipping windows. However, see the following bullet point. Escort vessel capabilities should be used to define which aspects of the currently defined closure condition is the limiting factor on transits through Hinchinbrook Entrance. Using existing vessels as a baseline, this information could also be used to plan fleet renewals such that the number of closure conditions per year is more realistic and is based on ship capabilities. The U.S. Coast Guard reported some closure events information via correspondence (Quintero, 2017). As reported by the U.S. Coast Guard to Tetra Tech, 2016 had a total of 64 hours of closure that represent 13 events (Quintero, 2017). In 2016, the buoy records 147 hours and 21 events where the observed conditions exceed the closure thresholds. The SWAN numerical wave model developed by Tetra Tech for use in this study reproduced 196 hours of wave height induced closure events which correspond to 18 independent wave height exceedance events throughout Even though the SWAN numerical wave model developed at Tetra Tech does not demonstrate the same level of statistical skill at forecasting wave heights as the WAVEWATCH III model, the SWAN model still shows good ability in forecasting wave heights, as seen in Table 2-6. (Although a model is never going to display perfect agreement, further improvements and scaling factors may be applied to the model output to improve the adequacy of its use.) Further work could be done in order to improve the SWAN model s skill at reproducing the wave heights. It is also uncertain whether the hindcast WAVEWATCH III has had data assimilation techniques applied to it later in order to nudge the model and improve its skill. Methods to improve Tetra Tech s developed SWAN model are further discussed in the recommendations Section RECOMMENDATIONS Several recommendations are made, roughly in the order of significance or ease of implementation: 1. It is recommended that a rigorous procedure be implemented for documenting each closure condition: date, time, waves, and wind at Seal Rocks. This data will be useful in assessing improvements that are suggested below. 2. Additionally, thought should be given to the spatial extent over which escort tugs are required to operate. At the peak of a storm, Point of Interest 2, extreme waves can be up to 20 percent higher than at Seal Rocks. Figure also shows that waves in the region between Point of Interest 2 and Seal Rocks can be larger that at either of these two locations. Table 2-8 summarizes the spatial variability of the wave conditions within the area of interest. The simulated variability in wave conditions within the area of interest highlights the need to take into account the conditions at a number of points in the area of interest, such as Point of Interest 2, when defining the closure condition. This recommendation would also require an in depth understanding of the acceptable operating conditions for rescue vessels. 3. In a similar argument to point 2, observed wave conditions experienced at Cape Cleare and Cape Suckling buoys that are further offshore can be 72.5 percent higher than those recorded at Seal Rocks at the peak of a storm. Rescue tugs might also need to operate in those conditions and further offshore from the Hinchinbrook Entrance. It might be necessary to factor in the conditions being experienced at the offshore buoys into the definition of a closure condition. 4. As an extension to point 2, the Port of Valdez and vessel operators currently use near real time wind and wave data recorded by the measurement buoy at Seal Rocks to determine closure condition go/no-go decisions. This measurement buoy is, however, positioned directly in the lee of Seal Rocks, and therefore simulates lower wave conditions than those experienced by vessels transiting Hinchinbrook Entrance as shown in Table 2-8. Similarly, it is widely reported that buoys similar to Seal Rocks may under-report wind speeds particularly during high wave events due to sheltering, knockdown, and their relatively low anemometer height. Therefore, it is possible that, despite the efforts of terminal and vessel operators, vessels are still transiting Hinchinbrook HinchinbrookFinalReport-BT 15
22 HINCHINBROOK ENTRANCE WIND WAVE EXTREMES FILE: 704-TRN.WTRM03050 NOVEMBER 20, 2018 ISSUED FOR USE 4-2 Attachment Entrance during wind and wave conditions that exceed the stated closure conditions. To provide an immediate upgrade, scaling should be provided for the Seal Rocks observations. With respect to waves, Seal Rocks waves could be increased by 20 percent when assessing closure conditions. This factor should incorporate both the sheltering at Seal Rocks shown on Figure 2.3-9, as well as the results of comparing with other buoys in the region. 5. Wind speeds at Seal Rocks are on average 30 percent higher or lower after a seven hour transit time. Waves will follow a similar behaviour. Thus, an observation at Seal Rocks is not a good predictor of the future conditions that will be experienced during a tanker transit. The poor correlation emphasizes the need of using forecasts in combination with observation data to improve the decision making process for calling a go or no-go situation. 6. As an elaboration to point 5, there are two ways that marine forecasts could be incorporated into the decisionmaking on calling a closure or not. The first and easiest to implement, would be to use a readily available marine weather forecast in order to support the decision-making process. There are three potential sources of marine forecasts. The National Weather Service s marine forecast ( which would provide significant wave height, wind speed and direction, and advisory warnings for small craft. NOAA s WAVEWATCH III ( provides significant wave height, peak wave direction, wind speed, and wind direction every 3 hours. The NWS s NDFD ( provides wave heights, wind speed, and wind direction every 12 hours. These forecasts could help a decision-making process by providing a prediction of whether the present conditions are forecast to get worse or to improve. The second way to implement forecasts into the decision-making process is discussed in point A more elaborate way that numerical models could be used to remove the shortcomings of buoy data to define closure conditions would be to have a dedicated numerical model which is operational with a specialized setup to forecast the conditions within Hinchinbrook Entrance. Models offer a predictive capability, which would considerably improve the management of vessel transits through Hinchinbrook Entrance, provided they are sufficiently accurate. Ultimately, this would be the way forward, but would require further studies and improvements to ensure the accuracy of the model and its effectiveness in the go/no-go decision-making process. The following discussion describes possible improvements to the TT-SWAN model described in this report, that would lead to a reliable forecast tool. Improvements to the SWAN Numerical Wave Model developed by Tetra Tech: 8. By default, the SWAN model interpolates the spectral grid from WAVEWATCH III boundary conditions provided onto its own grid. The SWAN model assumes a Joint North Sea Wave Project (JONSWAP) spectrum. An interesting test to improve the skill of the model would be to pass a spectrum from WAVEWATCH III directly into the SWAN numerical wave model. This should allow SWAN to account for both wind and swell waves. 9. Another improvement that is necessary for the forecasting of these closure conditions is to make the SWAN model run in an operational mode. In order to produce forecasts, the following input and boundary condition parameters need to be provided to the SWAN model in forecast mode rather than in hindcast: Wind forecasts could be provided by WAVEWATCH III, if the data is provided in forecast mode through the AOOS portal. If this is not possible, alternate sources would be explored; Forecasts of currents could be provided through Tetra Tech s in-house three-dimensional hydrodynamic model (H3D); Wave boundary conditions could be provided by WAVEWATCH III, which we understand will be transitioned to forecast mode in the near future; and The fine grid may need to be expanded, based on Point 2 above. 10. The SWAN wave conditions output can be readily extracted at any point in either of the SWAN domains. Typical vessel routes should be agreed upon so SWAN derived wave conditions at representative locations can be extracted. Instead of simply looking at the significant wave height at or near Seal Rocks, or Points 1 and 2 as HinchinbrookFinalReport-BT 16
23 HINCHINBROOK ENTRANCE WIND WAVE EXTREMES FILE: 704-TRN.WTRM03050 NOVEMBER 20, 2018 ISSUED FOR USE an indicator of the conditions within Hinchinbrook Entrance, the maximum of the wave heights of all the points along the route should be used as a better indicator of the most severe conditions that will be encountered along the part of the proposed journey that will require escort tugs. Since a simulated significant wave height does not represent the full extent of the conditions experienced at sea, other wave heights (e.g., the 98 th percentile wave height may be of interest) can be computed from the maximum wave height output as described in Interim Report 2, Section 5.0 (Table 5-1) to better simulate actual wave conditions experienced in the Entrance. 11. Other parameters that should be taken into consideration are the steepness and wave periods. Steepness is also an important wave feature that should determine a closure condition, and hence the definition of a closure condition threshold should be re-addressed to include this feature. Further detail can be found in Interim Report 2, Section 5.0. Wave periods within a specific range could also pose a threat to transiting vessels, particularly if the wave period is such that the wave peaks are simultaneously located at the front and rear of the vessel. A closure condition should be triggered based on any of the aforementioned criteria either exceeding their respective thresholds or reaching a critical value. 12. Due to the nature of modelling, the model will have its own accuracy and skill. Thresholds will need to be established from extensive studying of the model behaviour to account for cases where the model consistently under-predicts conditions in Hinchinbrook Entrance. In these cases, the model would fail to alert a decisionmaker on a potential closure condition situation. Studies of the modelled behaviour would lead to an adequate threshold that could eliminate these missed situations of closure conditions. HinchinbrookFinalReport-BT 17
24 HINCHINBROOK ENTRANCE WIND WAVE EXTREMES FILE: 704-TRN.WTRM03050 NOVEMBER 20, 2018 ISSUED FOR USE 4-2 Attachment 5.0 CLOSURE We trust this report meets your present requirements. If you have any questions or comments, please contact the undersigned. Respectfully submitted, Tetra Tech Canada Inc. Prepared by: Reviewed by: Alana Bonnici, M.Sc. Jim Stronach, Ph.D., P.Eng. Oceanographer Manager, Water and Marine Engineering Direct Line: Direct Line: /tv HinchinbrookFinalReport-BT 18
25 HINCHINBROOK ENTRANCE WIND WAVE EXTREMES FILE: 704-TRN.WTRM03050 NOVEMBER 20, 2018 ISSUED FOR USE REFERENCES Liu, H., Olsson, P.Q., Volz, K., SAR Observation and Modeling of Gap Winds in the Prince William Sound of Alaska. Sensors, 8, , DOI: /s Macklin, S.A., Lackman, G.M., Gray, J., Offshore-Directed Winds in the Vicinity of Prince William Sound, Alaska. Monthly Weather Review, 116, Mesquita, M.S., Characteristics and Variability of Storm Tracks in the North Pacific, Bearing Sea and Alaksa. Ph.D. Dissertation, University of Alaska Fairbanks. Middleton Island Meteorological Data, Retrieved from URL: Date accessed: 12/01/2018. NOAA, United States Coast Pilot 9, Pacific and Arctic Coasts Alaska: Cape Spencer to Beaufort Sea, 35th edn. Washington, DC: U.S. Department of Commerce, National Oceanic and Atmospheric Administration, National Ocean Service. Olsson, P.Q., Personal communication, 15 September, Overland, J.E., Cardone, V.J., Case Studies of Four Severe Gulf of Alaska Storms. NOAA Technical Memorandum, ERL PMEL-19. Pickart, R.S., Moore, G.W.K., MacDonald, A.M., Renfrew, I.A., Walsh, J.E., Kessler, W.S., Seasonal Evolution of Aleutian Low Pressure Systems: Implications for the North Pacific Subpolar Circulation. Journal of Physical Oceanography, 39, , DOI: /2009JPO Quintero, C., Personal communication, 12 December, Robert, A., Sentinel Tug Requirements for Gulf of Alaska: Ship Drift Study. Rodionov, S.N., Bond, N.A., Overland, J.E., The Aleutian Low, Storm Tracks and Winter Climate Variability in the Bering Sea. Deep-Sea Research, Part II, 54, Winstead, N.S., Colle, B., Bond, N., Young, G., Olson, J., Loescher, K., Monaldo, F., Thompson, D., Pichel, W.G., Using SAR Remote Sensing, Field Observations, and Models to Better Understand Coastal Flows in the Gulf of Alaska. Bulletin of the American Meteorological Society, 87, HinchinbrookFinalReport-BT 19
26 HINCHINBROOK ENTRANCE WIND WAVE EXTREMES FILE: 704-TRN.WTRM03050 NOVEMBER 20, 2018 ISSUED FOR USE 4-2 Attachment GLOSSARY AOOS DEM JONSWAP KM M M/S NCEI NCEP NDBC NDFD NGDC NOAA NRCS NWS PWSRCAC RFP RMSE ROMS SERVS SWAN SWH WRF Alaska Ocean Observing System Digital Elevation Model Joint North Sea Wave Project Kilometers Meters Meters Per Second National Center for Environmental Information National Center for Environmental Prediction National Data Buoy Center National Digital Forecast Database National Geophysical Data Center National Oceanic and Atmospheric Administration Natural Resource Conservation Service National Weather Service Prince William Sound Regional Citizens Advisory Council Request for Proposal Root Mean Squared Error Regional Ocean Modeling System Ship Escort/Response Vessel System Simulating Waves Nearshore Significant Wave Height Weather Research and Forecasting HinchinbrookFinalReport-BT 20
27 HINCHINBROOK ENTRANCE WIND WAV E EX TREMES FILE: TRN.WTRM NOV EMBER 20, 2018 ISSUED FOR USE FIGURES Figures HinchinbrookFinalReport

28 Map of Area of Interest SWAN Grid Setup Q:\Vancouver\Engineering\V132\Projects\WTRM03050_Hinchinbrook\reporting\FinalReport\figures\layouts\2.3 1.lay 16 Oct :26:36

29 Q:\Vancouver\Engineering\V132\Projects\WTRM03050_Hinchinbrook\reporting\FinalReport\figures\layouts\3.3 2.lay 16 Oct :54:19

30

31

32

33
34


35 Q:\Vancouver\Engineering\V132\Projects\WTRM03050_Hinchinbrook\working\AB\model\ImagesForReport\folder to regen hourly images\hs1new.lay 09 Nov :52:03


36 Q:\Vancouver\Engineering\V132\Projects\WTRM03050_Hinchinbrook\working\AB\model\ImagesForReport\folder to regen hourly images\hs2new.lay 09 Nov :32:08


37 Q:\Vancouver\Engineering\V132\Projects\WTRM03050_Hinchinbrook\working\AB\model\ImagesForReport\FolderRegenHourlyImages\steep1.lay 16 Oct :47:50


38 Q:\Vancouver\Engineering\V132\Projects\WTRM03050_Hinchinbrook\working\AB\model\ImagesForReport\FolderRegenHourlyImages\steep2.lay 16 Oct :50:06
39 HINCHINBROOK ENTRANCE WIND WAV E EX TREMES FILE: TRN.WTRM NOV EMBER 20, 2018 ISSUED FOR USE 4-2 Attachment APPENDIX A TETRA TECH S LIMITATIONS ON THE USE OF THIS DOCUMENT HinchinbrookFinalReport
40 LIMITATIONS ON USE OF THIS DOCUMENT 4-2 Attachment HYDROTECHNICAL 1.1 USE OF DOCUMENT AND OWNERSHIP This document pertains to a specific site, a specific development, and a specific scope of work. The document may include plans, drawings, profiles and other supporting documents that collectively constitute the document (the Professional Document ). The Professional Document is intended for the sole use of TETRA TECH s Client (the Client ) as specifically identified in the TETRA TECH Services Agreement or other Contractual Agreement entered into with the Client (either of which is termed the Contract herein). TETRA TECH does not accept any responsibility for the accuracy of any of the data, analyses, recommendations or other contents of the Professional Document when it is used or relied upon by any party other than the Client, unless authorized in writing by TETRA TECH. Any unauthorized use of the Professional Document is at the sole risk of the user. TETRA TECH accepts no responsibility whatsoever for any loss or damage where such loss or damage is alleged to be or, is in fact, caused by the unauthorized use of the Professional Document. Where TETRA TECH has expressly authorized the use of the Professional Document by a third party (an Authorized Party ), consideration for such authorization is the Authorized Party s acceptance of these Limitations on Use of this Document as well as any limitations on liability contained in the Contract with the Client (all of which is collectively termed the Limitations on Liability ). The Authorized Party should carefully review both these Limitations on Use of this Document and the Contract prior to making any use of the Professional Document. Any use made of the Professional Document by an Authorized Party constitutes the Authorized Party s express acceptance of, and agreement to, the Limitations on Liability. The Professional Document and any other form or type of data or documents generated by TETRA TECH during the performance of the work are TETRA TECH s professional work product and shall remain the copyright property of TETRA TECH. The Professional Document is subject to copyright and shall not be reproduced either wholly or in part without the prior, written permission of TETRA TECH. Additional copies of the Document, if required, may be obtained upon request. 1.2 ALTERNATIVE DOCUMENT FORMAT Where TETRA TECH submits electronic file and/or hard copy versions of the Professional Document or any drawings or other project-related documents and deliverables (collectively termed TETRA TECH s Instruments of Professional Service ), only the signed and/or sealed versions shall be considered final. The original signed and/or sealed electronic file and/or hard copy version archived by TETRA TECH shall be deemed to be the original. TETRA TECH will archive a protected digital copy of the original signed and/or sealed version for a period of 10 years. Both electronic file and/or hard copy versions of TETRA TECH s Instruments of Professional Service shall not, under any circumstances, be altered by any party except TETRA TECH. TETRA TECH s Instruments of Professional Service will be used only and exactly as submitted by TETRA TECH. Electronic files submitted by TETRA TECH have been prepared and submitted using specific software and hardware systems. TETRA TECH makes no representation about the compatibility of these files with the Client s current or future software and hardware systems. 1.3 STANDARD OF CARE Services performed by TETRA TECH for the Professional Document have been conducted in accordance with the Contract, in a manner consistent with the level of skill ordinarily exercised by members of the profession currently practicing under similar conditions in the jurisdiction in which the services are provided. Professional judgment has been applied in developing the conclusions and/or recommendations provided in this Professional Document. No warranty or guarantee, express or implied, is made concerning the test results, comments, recommendations, or any other portion of the Professional Document. If any error or omission is detected by the Client or an Authorized Party, the error or omission must be immediately brought to the attention of TETRA TECH. 1.4 DISCLOSURE OF INFORMATION BY CLIENT The Client acknowledges that it has fully cooperated with TETRA TECH with respect to the provision of all available information on the past, present, and proposed conditions on the site, including historical information respecting the use of the site. The Client further acknowledges that in order for TETRA TECH to properly provide the services contracted for in the Contract, TETRA TECH has relied upon the Client with respect to both the full disclosure and accuracy of any such information. 1.5 INFORMATION PROVIDED TO TETRA TECH BY OTHERS During the performance of the work and the preparation of this Professional Document, TETRA TECH may have relied on information provided by third parties other than the Client. While TETRA TECH endeavours to verify the accuracy of such information, TETRA TECH accepts no responsibility for the accuracy or the reliability of such information even where inaccurate or unreliable information impacts any recommendations, design or other deliverables and causes the Client or an Authorized Party loss or damage. 1.6 GENERAL LIMITATIONS OF DOCUMENT This Professional Document is based solely on the conditions presented and the data available to TETRA TECH at the time the data were collected in the field or gathered from available databases. The Client, and any Authorized Party, acknowledges that the Professional Document is based on limited data and that the conclusions, opinions, and recommendations contained in the Professional Document are the result of the application of professional judgment to such limited data. The Professional Document is not applicable to any other sites, nor should it be relied upon for types of development other than those to which it refers. Any variation from the site conditions present, or variation in assumed conditions which might form the basis of design or recommendations as outlined in this report, at or on the development proposed as of the date of the Professional Document requires a supplementary exploration, investigation, and assessment. TETRA TECH is neither qualified to, nor is it making, any recommendations with respect to the purchase, sale, investment or development of the property, the decisions on which are the sole responsibility of the Client. 1
41 LIMITATIONS ON USE OF THIS DOCUMENT 4-2 Attachment HYDROTECHNICAL 1.7 ENVIRONMENTAL AND REGULATORY ISSUES Unless expressly agreed to in the Services Agreement, TETRA TECH was not retained to explore, address or consider, and has not explored, addressed or considered any environmental or regulatory issues associated with the project. 1.8 LEVEL OF RISK It is incumbent upon the Client and any Authorized Party, to be knowledgeable of the level of risk that has been incorporated into the project design, in consideration of the level of the hydrotechnical information that was reasonably acquired to facilitate completion of the design. 2
42
43 Interim Report 1.0 Hinchinbrook Entrance Wind Wave Extremes PRESENTED TO Prince William Sound Regional Citizens Advisory Council APRIL 11, 2018 ISSUED FOR USE FILE: 704-TRN.WTRM03050 Tetra Tech Canada Inc. Suite th Floor, 885 Dunsmuir Street Vancouver, BC V6C 1N5 CANADA Tel Fax
44 This page is intentionally left blank. 4-2 Attachment
45 HINCHINBROOK ENTRANCE WIND WAVE EXTREMES FILE: 704-TRN.WTRM03050 APRIL 11, 2018 ISSUED FOR USE TABLE OF CONTENTS 1.0 INTRODUCTION DATA COMPLETENESS METEOROLOGICAL CHARACTERIZATION OF HINCHINBROOK ENTRANCE LOCAL SENSOR DATA Seal Rocks Station (46061) Cape Cleare Station (46076) Cape Suckling Station (46082) Nuchek Station (1074) MEASURED EXTREME WEATHER EVENTS Measured Closure Condition Properties Wind and Wave Extreme Value Analysis DISCUSSION CLOSURE REFERENCES LIST OF TABLES IN TEXT Table 4-1: Observation Station Characteristics Table 5-1: Wave Height Calculations from Significant Wave Height (SWH) Table 5-2: List of Vessel Sizes and Wave Characteristics That Could Potentially Endanger Them Table 5-3: Closure Data at Port Valdez and Hinchinbrook Entrance Table 5-4: Closure Events Data at Seal Rocks Station (46061) on an Annual Basis Table 5-5: Closure Events Data at Seal Rocks Station (46061) on a Monthly Basis Table 5-6: Average Magnitude of Observations at all Stations for Wave-Induced Closure Conditions at Seal Rocks Table 5-7: Average Magnitude of Observations at all Stations for Wind-Induced Closure Conditions at Seal Rocks Table 5-8: Percent Difference Between Seal Rocks and Neighboring Stations During Closure Conditions Table 5-9: Extreme Wind Analysis for All the Stations i
46 HINCHINBROOK ENTRANCE WIND WAVE EXTREMES FILE: 704-TRN.WTRM03050 APRIL 11, 2018 ISSUED FOR USE 4-2 Attachment APPENDIX SECTIONS FIGURES Figure 4-1 Geographical Location of Stations Figure 4-2 Data Unavailability at Seal Rocks Station (46061) Figure 4-3 Seal Rocks Station (46061) Wind Rose Figure 4-4 Seal Rocks Station (46061) Wave Rose Figure 4-5 Cape Cleare Station (46076) Wind Rose Figure 4-6 Cape Cleare Station (46076) Wave Rose Figure 4-7 Cape Suckling Station (46082) Wind Rose Figure 4-8 Cape Suckling Station (46082) Wave Rose Figure 4-9 Nuchek Station (1074) Wind Rose Figure 5-1 Extreme Wind Analysis for Seal Rocks Station (46061) Figure 5-2 Extreme Wind Analysis for Cape Cleare Station (46076) Figure 5-3 Extreme Wind Analysis for Cape Suckling Station (46082) APPENDICES Appendix A Tetra Tech s Limitations on the Use of this Document ii
47 HINCHINBROOK ENTRANCE WIND WAVE EXTREMES FILE: 704-TRN.WTRM03050 APRIL 11, 2018 ISSUED FOR USE LIMITATIONS OF REPORT This report and its contents are intended for the sole use of Prince William Sound Regional Citizens Advisory Council and their agents. Tetra Tech Canada Inc. (Tetra Tech) does not accept any responsibility for the accuracy of any of the data, the analysis, or the recommendations contained or referenced in the report when the report is used or relied upon by any Party other than Prince William Sound Regional Citizens Advisory Council, or for any Project other than the proposed development at the subject site. Any such unauthorized use of this report is at the sole risk of the user. Use of this report is subject to the terms and conditions stated in Tetra Tech Canada Inc. s Services Agreement. Tetra Tech s General Conditions are provided in Appendix A of this report. iii
48 HINCHINBROOK ENTRANCE WIND WAVE EXTREMES 704-TRN.WTRM03050 APRIL 11, 2018 ISSUED FOR USE 1.0 INTRODUCTION The Exxon Valdez grounding and oil spill in the rich ecosystem of Prince William Sound led to stakeholders making efforts to prevent similar incidents in the future. The Prince William Sound Regional Citizens Advisory Council s (PWSRCAC) mission is to promote environmentally safe operation of the Alyeska terminal and associated tankers. It is a non-profit corporation that was established following the Exxon Valdez oil spill. PWSRCAC advises Alyeska Pipeline Service Company, oil shippers, regulatory agencies, elected officials, and the general public on issues related to the prevention and response to oil spills and the mitigating environmental impacts from terminal and tanker operations. Tetra Tech Canada Inc. (Tetra Tech) was retained by PWSRCAC to conduct a study that better defines weather related characteristics as they affect the feasibility of tanker escort vessels conducting rescue operations at the Hinchinbrook Entrance to Prince William Sound, Alaska. Tankers transiting Prince William Sound and Hinchinbrook Entrance are escorted by escort vessels to ensure swift assistance in the event the tanker becomes disabled. Wind speed and wave height are the main factors affecting the feasibility of tanker escort vessels rescuing a stricken tanker. To prohibit transits in extreme wind and wave conditions, a closure condition has been established as part of the Vessel Escort and Response Plan (VERP) for vessels servicing the Port of Valdez. The Alyeska Pipeline Service Company has defined this closure condition as wind speeds in excess of 45 knots or wave heights in excess of 15 feet, both measured at the Seal Rocks weather buoy (NOAA 46061). Despite this safety measure, however, a recent study has shown that the possibility of saving an oil tanker in distress is unlikely for conditions at or above the closure condition (Robert Allan, 2016). This project will better define weather related characteristics of a closure condition with a focus on the met-ocean conditions in Hinchinbrook Entrance that impact the potential rescue of disabled vessels. This project seeks to answer two main questions: Closure Condition Frequency: What is the frequency of extreme event/closure conditions at Hinchinbrook Entrance? Closure Condition Applicability: How well does the definition and identification of a closure condition reflect conditions actually experienced by vessels transiting Hinchinbrook Entrance? Are there better methods and data sources to identify closure conditions? To address these two questions, a four stage strategy was proposed: Task 1: Statistical investigation of closure condition likelihood and duration based on Seal Rocks data. Task 2: Analysis of past performance with respect to accurately declaring closure conditions. Task 3: Hindcast conditions within Hinchinbrook Entrance using numerical wind, wave, and current models and generate scaling relationships between modelled conditions in Hinchinbrook Entrance and available real time data. Task 4: Re-evaluate the occurrence of closure conditions using these scaling relationships to determine how much accuracy can be gained using scaled winds and waves from either Seal Rocks or from an array of stations. This first interim report summarizes the progress on Tasks 1 and 2, covering data acquisition and highlighting any shortcomings of the data collection that will hinder appropriate project progress. This report also presents the data gathered and the analysis carried out thus far. In the following sections, a technical summary and presentation of the data collected is presented. 1
49 HINCHINBROOK ENTRANCE WIND WAVE EXTREMES FILE: 704-TRN.WTRM03050 APRIL 11, 2018 ISSUED FOR USE 4-2 Attachment 2.0 DATA COMPLETENESS At this time, all known publically available local sensor data have been obtained. Data gathering of archived numerical model results is currently ongoing. At the time of reporting sufficient data on declared closure conditions was not available to establish how often closure conditions are declared but do not occur (false positive) or are not declared but occur (false negative). Tetra Tech will continue to reach out to the Port of Valdez, the Alyeska consortium, and the United States Coast Guard to confirm their best-practice procedures for monitoring and declaring closure conditions. 3.0 METEOROLOGICAL CHARACTERIZATION OF HINCHINBROOK ENTRANCE Prince William Sound is located on the south coast of the state of Alaska. The eastern shore of Prince William Sound is formed by the Kenai Peninsula with the western shore formed by the Chugach Mountains and the southern edge comprised of the principal barrier islands Montague Island, Hinchinbrook Island, and Hawkins Island. Prince William Sound is a biological resource with a rich ecosystem (Jin & Wang, 2003). The principal port in Prince William Sound is located at Valdez, Alaska, and is the southern terminus of the Trans Alaska Pipeline System. Winds within the Gulf of Alaska are dominated by general circulation patterns. The stronger winds within the Gulf of Alaska are dominated by the polar highs and Aleutian lows, whilst the weaker winds originate from the East Pacific High. The Aleutian low pressure systems bring winds from the south, southeast, or east, while the polar high pressure systems tend to bring winds from the north, northwest, or northeast. The Aleutian lows and polar highs tend to dominate during the winter months when temperature and pressure differences between the ocean and land are greatest (Lethcoe, 2003). The East Pacific High is a weak clockwise circulation which tends to dominate in summer bringing winds from the southwest within the Gulf of Alaska. Winds within the Gulf of Alaska tend to run parallel to the coast (U.S. Coast Pilot 9). Winds in the Gulf of Alaska influence winds in Prince William Sound. Winds in Prince William Sound are affected by the complex regional orography such as fjords, channels, and inlet areas. The complex orography impacts the variability in direction and magnitude of the winds within the Sound. Port Valdez winds therefore tend to be calmer due to its protected location between the mountains (Jin & Wang, 2003). Winds exhibit seasonal patterns. Circulation patterns for the surface currents within the Sound are highly dependent on seasons. Surface currents are distinguished by an anticyclonic (clockwise) gyre between January to April and a cyclonic gyre (anticlockwise) between September to December with transitionary periods in between (Wang, 1970; Jin & Wang, 2003). The gyres are driven by the fluctuations in salinity and wind forcing. Salinity fluctuations are influenced by the availability of fresh water input into Prince William Sound primarily in summer as runoff (Wang, 1970). Circulation patterns within Prince William Sound are controlled by the throughflow of water between the Hinchinbrook Entrance and Montague Strait (Schoch & McCammon, 2011). Winds at Hinchinbrook Entrance are the result of phenomena occurring within the Gulf of Alaska as well as Prince William Sound. High wind events in the vicinity of Hinchinbrook Entrance are typically the result of two processes: Gap Winds: Strong gap winds can result from high pressure centered over mainland Alaska combined with a low pressure system in the Gulf of Alaska. These winds are typically northerly and localized within Prince William Sound and at Hinchinbrook Entrance (Macklin et al. 1988, Winstead et al. 2006, Liu et al. 2008). Extra-tropical Cyclones: These large storms in the Gulf of Alaska are associated with the Aleutian lows mentioned above. They are the source of the most severe winds in the project area and result in strong easterly and south-easterly winds between Hinchinbrook Entrance and Middleton Island (Overland & Cardone, 1980; Rodionov, 2007; Mesquita, 2009; Pickart, 2009; Olsson, 2015). For the purposes of this study, extra-tropical cyclones will be the primary weather pattern under investigation since gap winds, although severe, are typically localized, generally short lived and have not, within available data records, resulted in a closure condition. The prevailing winds offshore of Hinchinbrook Entrance are easterly with most storm 2
50 HINCHINBROOK ENTRANCE WIND WAVE EXTREMES 704-TRN.WTRM03050 APRIL 11, 2018 ISSUED FOR USE winds also from the east. This is characteristic of the typical winter extra-tropical cyclones in the area and these large storms appear to be the most dominant weather patterns within the area of interest. 4.0 LOCAL SENSOR DATA The primary technical objective of this interim report is to determine the frequency and duration of closure conditions as reported from data sources currently available to terminal and vessel operators. Observational wind and wave data is generally available, depending on equipment failure, from some or all of following five stations: Seal Rocks buoy (station 46061) Cape Cleare buoy (station 46076) Cape Suckling buoy (station 46082) Nuchek, land-based (station 1074) Middleton Island Airport, land-based (station 70343) Specifications of the wind and wave measurements differ according to the measurement platform and the instrumentation and data processing that are used. Seal Rocks, Cape Cleare, and Cape Suckling station data was downloaded from the NOAA s National Data Buoy Center (NDBC) website. The NDBC wind and wave data is represented in meteorological convention, which is the direction the wind or wave is coming from. The unit for direction is degrees clockwise from true north (north represented by 0 degrees and east by 90 degrees). This convention is also adopted throughout this report. The wind speeds and directions as measured by the NDBC buoys are the averaged measurements collected over an eight-minute period. The gust winds reported by the NDBC buoys are not instantaneous peak winds but rather five or eight second gust speed (determined by the onboard computing system capacity) as measured during the eight-minute period. Wave observations recorded by the NDBC buoys are not direct recordings of the accelerometer and inclinometer sensors. Measurements result from computation of the buoy s vertical displacement throughout the wave acquisition time. The onboard computer applies Fast Fourier Transforms to convert the recordings from a time to a frequency domain. The data is post-processed to reduce noise. Spectral wave energies, significant wave height, and wave period are then derived from this data and transmitted. The original acceleration and displacement measurements are not transmitted. The significant wave heights are recorded by the NDBC buoys as the average of the highest one-third of all the wave heights during a 20 minute sampling period, also called the wave acquisition time. The wave direction is the direction from which the waves at the dominant wave period are travelling. Two measurements of wave period are available for the NDBC buoys; the average wave period, defined as the mean period of all waves during the 20 minute sampling period and the dominant wave period, defined as the period with the maximum wave energy. The buoys at Seal Rocks and Cape Suckling have an ARES-type onboard computing system, which is known as a payload. The West Orca Bay and Cape Cleare buoys have an AMPS-type payload. The NDBC provide details on the ability of the ARES payload (but not the AMPS payload) in resolving the measured parameters together with their accuracies. The buoys with an ARES-type payload (Seal Rocks and Cape Suckling) can record wind directions with a resolution of 1 degrees and accuracy of +/- 10 degrees, wind speeds are measured with a resolution of 0.1 meters per second (m/s) and an accuracy defined by the greater of either +/- 1 m/s or 10 percent. Wave directions can be resolved at 0.1 degrees with an accuracy of +/- 10 degrees, the significant wave heights are resolved at 0.1 m with an accuracy of +/- 0.2 m. Wave periods can be resolved at a resolution of 1 s with an accuracy of +/- 1 s. Wind data from Nuchek station was downloaded from the United States Department of Agriculture s Natural Resources Conservation Service (NRCS) website. Although the NRCS records wind speeds in miles per hour, these were converted to units of m/s to be consistent with the NDBC data. Middleton Island Airport 3
51 HINCHINBROOK ENTRANCE WIND WAVE EXTREMES FILE: 704-TRN.WTRM03050 APRIL 11, 2018 ISSUED FOR USE 4-2 Attachment (with WMO station ID 70343) was downloaded from the rp5 website (Date accessed: 12/01/2018; URL: (airport)), however the dataset has a temporal resolution of six hours (i.e., data is only recorded every six hours) with limited metadata and consequently its utility is questioned. The Middleton Island Airport data is therefore used to check for consistency with the other stations but is not used as part of the analysis. The station geographical locations, identification numbers, and sources are summarized in Table 4-1 below and Figure 4-1. It is noted that there is quite a large amount of data unavailable at the Seal Rocks station (46061), particularly in the year 2013 as can be seen in Figure 4-2, which summarizes data availability for all stations. Closure conditions are defined at Hinchinbrook Entrance using the Seal Rocks buoy (46061) and so this is the most representative data source for identifying closure conditions. Seal Rocks buoy (46061) is, however, somewhat sheltered from the full wind and wave climate of the area and so one of the later outcomes of this project will be an understanding of the magnitude by which Seal Rocks buoy (46061) is exposed to weaker wind and wave conditions than the actual conditions experienced during vessel transit. Buoys 46060, 46061, 46076, and record wind speeds at their anemometer elevation of 5 m. The buoys anemometer will sporadically be below a wave and therefore incapable of accurate wind speed measurements. Wind speeds recorded by these buoys will be lower than winds reported at other stations (such as Nuchek) or weather forecasts (standard meteorological wind output is reported at 10 m elevation). Unless otherwise stated, wind speeds recorded at the buoy stations have not been converted to the standard 10 m elevation. Both Nuchek and Middleton Island are land-based stations. Nuchek station is reported to have an elevation of 15 m. Metadata for Middleton Island is not available and therefore the specifications of instrumentation and measurements are not available. Table 4-1: Observation Station Characteristics Station Name Source Station ID Latitude Longitude Seal Rocks NDBC N W Cape Cleare NDBC N W Cape Suckling NDBC N W Nuchek NRCS N W Middleton Island rp N W 4.1 SEAL ROCKS STATION (46061) A wind rose displaying observational data recorded at Seal Rocks station (46061) for hourly winds between 01 January October 2017 is shown in Figure 4-3 together with its associated wind frequency distribution. Over the period considered, the winds recorded by the Seal Rocks buoy are predominantly easterly with over 18 percent coming directly from the east and 12 percent from an east-southeast direction. Wind speeds at Seal Rocks buoy are generally light to moderate with almost 76 percent of wind speeds recorded to be less than 9 m/s (17.6 knots). Seal Rocks buoy also records a distinct northerly wind which is noticeably lacking at the other three stations. The northerly wind recorded at Seal Rocks is a result of the gap winds in Prince William Sound. The gap winds originating in the channels of Valdez Arm and Wells Passage have the highest speeds as they funnel together into Prince William Sound. In the Hinchinbrook Entrance these gap winds can reach speeds of 12 to 20 m/s ( knots) (Liu et al., 2008). The Seal Rocks buoy has recorded these gap winds with intensities reaching up to 15 m/s (29.16 knots) which corresponds to an approximately 16.7 to 17.5 m/s ( knots) at 10 m (32.8 feet) wind speed. It is noted that Seal Rocks buoy might be located in an area of weaker winds than are found in Hinchinbrook Entrance, therefore under-reporting the intensity of these winds due to its sheltered geographical location. 4
52 HINCHINBROOK ENTRANCE WIND WAVE EXTREMES 704-TRN.WTRM03050 APRIL 11, 2018 ISSUED FOR USE Waves at Seal Rocks originate from the south-southwest to the southeast. Wave records are available at Seal Rocks buoy on an hourly basis between 16 April October The maximum significant wave height observed at Seal Rocks is 7.38 m (24.2 feet). A wave rose for Seal Rocks can be found in Figure 4-4, with directions shown in the meteorological convention, the same as for winds. ) Wave Rose 4.2 CAPE CLEARE STATION (46076) Observed wind data at Cape Cleare station (46076) is shown in a wind rose in Figure 4-5 for hourly winds between 01 January October 2017 together with the associated wind frequency distribution. Winds recorded at Cape Cleare are predominantly easterly but have more variability with respect to their direction than those reported at Seal Rocks. The wind speeds are generally light to moderate in magnitude with 76 percent of winds being less than 9 m/s (17.5 knots). The effects of the gap winds can be seen in the Cape Cleare buoy station wind rose. Liu et al. (2008) forecasts northeasterly winds veering around Montague Island as they funnel through Montague Strait and through Hinchinbrook Entrance. The gap winds are expected to dissipate and lose intensity after having funneled out of Montague Strait and Hinchinbrook Entrance. These gap winds have been recorded at Cape Cleare station originating from the northeast and east-northeast. Waves at Cape Cleare show higher variability with respect to the direction of origin in comparison to waves recorded at Seal Rocks. Waves at Cape Cleare predominantly originate from a southerly direction with both westerly and easterly waves being observed. Wave records are available for the Cape Cleare station on an hourly basis between 14 July October The maximum significant wave height observed in the period of record at Cape Cleare station is 8.67m (28.4 feet). The wave rose for Cape Cleare can be found in Figure CAPE SUCKLING STATION (46082) A wind rose displaying hourly winds between 01 January January 2016 at Cape Suckling station (46082) is shown in Figure 4-7 together with the wind frequency distribution at Cape Suckling station. Wind data at Cape Suckling is not found beyond February Winds recorded at Cape Suckling for the six year record exhibit a predominantly east-southeast direction with almost 20 percent of winds originating from this direction and 15 percent originating from the east. Almost 73 percent of the wind speeds recorded at Cape Suckling were light to moderate in magnitude (less than 9 m/s or 17.5 knots). The wind rose at Cape Suckling Station shows a very low frequency of northerly winds which implies that there is no evidence of gap winds seen at the Cape Suckling station. This is to be expected, as Cape Suckling is further away from Prince William Sound and Hinchinbrook Entrance where the effects of the localized gap winds phenomenon should not be felt. Waves at Cape Suckling also have a higher variability in terms of their direction of origin compared to Seal Rocks with the most predominant waves direction observed at Cape Suckling being southwest. The Cape Suckling buoy has wave records on an hourly basis between the dates of 10 July February The maximum significant wave height observed at Cape Suckling station during the period of record is 9.67m or 31.7 feet (higher than both Cape Cleare and Seal Rocks buoys). The wave rose for Cape Suckling can be found in Figure NUCHEK STATION (1074) The Nuchek land-based station (1074) wind rose displaying hourly winds between 01 January November 2017 is shown in Figure 4-9 together with its associated wind frequency distribution. Winds recorded at Nuchek exhibit a predominantly east direction with 60 percent of winds originating from either the east or east-northeast direction. The winds are lighter at Nuchek in comparison to the buoy wind measurements with 88 percent of the wind speeds recorded being less than 9 m/s (17.5 knots). Nuchek station experiences little northerly winds, undoubtedly because of its sheltered location. 5
53 HINCHINBROOK ENTRANCE WIND WAVE EXTREMES FILE: 704-TRN.WTRM03050 APRIL 11, 2018 ISSUED FOR USE 4-2 Attachment 5.0 MEASURED EXTREME WEATHER EVENTS The closure conditions as defined by Alyeska Pipeline Service Company in their VERP prohibit the transit of laden oil tankers out of Prince William Sound when winds exceed 45 knots (23.15 m/s) or wave height exceeds 15 feet (4.57 m) at the Seal Rocks buoy (46061). A closure condition is not the largest extreme weather event that could occur in Prince William Sound. However, the closure condition is the threshold defining the largest event during which an escort vessel could safely rescue a disabled tanker. A closure condition can therefore be triggered by either: 1) a wave height exceedance (greater than 15 feet or 4.57 m); 2) a wind speed exceedance (greater than 45 knots or m/s); or 3) both at the same time. Within the report these types of closure conditions are referred to as wave-only, wind-only, or wind and wave induced closure conditions. Vessels are not permitted to enter or exit Prince William Sound when a closure condition event or greater is experienced. The highest risk transit is therefore experienced by a vessel during conditions at or near those defined by the closure condition. Observed and modelled wave data are averaged and hence might not capture the magnitude of a peak instantaneous event that could endanger a vessel (e.g., a rogue wave). The closure condition might therefore need to be redefined to take these factors into account. Lilly (1983) discusses the computation of a range of wave heights that could be expected in deep waters as a function of the significant wave height and his results are summarized in Table 5-1 below. A rogue wave would, in this context, be defined as one in 300,000 waves (U.S. Coast Pilot 9). This implies that a significant wave height of 15 feet (4.57m) could potentially cause a rogue wave of wave height 37.5 feet (11.4 m) if the water depth supports it. Table 5-1: Wave Height Calculations from Significant Wave Height (SWH) Other Wave Height Calculations as a Function of SWH Most frequent wave heights Average wave heights Significant wave height (average height of highest 33 percent) Height of highest 10 percent of waves One wave in 1,175 waves One wave in 300,000 waves 0.5xSWH 0.6xSWH 1.0xSWH 1.3xSWH 1.9xSWH 2.5xSWH Wave steepness should also play a role in the determination of a closure event. A steep wave presents more danger to a vessel than a high wave with a milder slope (U.S. Coast Pilot 9). Steep waves form at the beginning of a storm when wind speeds pick up. Table 5-2 summarizes a list of vessel lengths with the associated wave heights and periods that could put a vessel of that size in danger (U.S. Coast Pilot 9). The steepness of a wave can be amplified when tidal currents oppose wind direction (U.S. Coast Pilot 9). Table 5-2: List of Vessel Sizes and Wave Characteristics That Could Potentially Endanger Them Size of Vessel Wave Height Period < 100 feet (31 m) > 5 feet (1.5 m) < 6 s feet (31 61 m) > 10 feet (3 m) 6-10 s >200 feet (61 m) 20 feet (6.1 m) - 6
54 HINCHINBROOK ENTRANCE WIND WAVE EXTREMES 704-TRN.WTRM03050 APRIL 11, 2018 ISSUED FOR USE In the following sections, the occurrence and characterization of closure conditions are summarized with the following data products: Typical duration and number of closures per period (e.g., month, season, year); Closure condition probability per period; and Hours of impeded shipping based on an estimated vessel transit time between the Port of Valdez and Hinchinbrook Entrance of seven hours. 5.1 MEASURED CLOSURE CONDITION PROPERTIES At Hinchinbrook Entrance, a closure condition is defined as winds in excess of 45 knots (23.15 m/s) or wave heights in excess of 15 feet (4.57 m) at the Seal Rocks buoy (46061). The closure condition data presently provided to Tetra Tech (Quintero, 2017) is shown in Table 5-3. The number of closure conditions and durations provided to Tetra Tech differ from the number of closure conditions and their durations as determined through observations at Seal Rocks. However, without more detailed information on the exact timing of the closures and the procedure for determining them (e.g., is a closure condition only declared if a vessel is in transit), it is difficult to speculate on the causes of this difference. Table 5-3: Closure Data at Port Valdez and Hinchinbrook Entrance Year Number of Closures Hours of Closure Reported Observed Reported Observed hours 141 hours hours 49 hours F i g u r e 5E -x1 t r e m e W i n d A n a l y s i s f o r S e a l R o c k s S t a t i o n ( ) Table 5-4 lists the number of events exceeding the closure condition threshold of either wind only, wave only, or wind and wave combined together with their average durations according to sensor observations between the years Table 5-5 lists the number of closure events per annum at Seal Rocks station (46061) on a monthly basis. Based on data observed at the Seal Rocks buoy between 2010 and 2017, February is the month that experiences the highest number of closure events per annum with events of peak duration averaging around 8.2 hours. November to February have the largest number of closures events. July and August had no closure event conditions recorded between 2010 and Events that trigger a closure condition tend to be similar, consisting of predominantly easterly and south-easterly winds. Table 5-6 and Table 5-6 display the mean significant wave height and mean wind speed for each station when a closure condition is triggered by wave or wind observations at the Seal Rocks buoy. The typical closure condition is described as follows: Between 2010 and 2017, wind-induced closure events were observed 12 times, whilst wave-induced closure events were observed 120 times. Closure condition events triggered by both wind and wave occurred a total of 11 times between 2010 and 2017 when data was available for both wind speeds and wave heights (total of 83 months or 93 percent of the record length). Closure conditions triggered by both wind and wave exceedance occurred one to three times per year during the available record with a further 10 to 26 (neglecting 2013 due to equipment failure) exceedances per year associated with waves only and a further one to three closures per year due to winds only. The direction of the peak wind speed associated with a closure condition ranges from 82 to 108 degrees with a mean direction of 96 degrees (easterly). 7
55 HINCHINBROOK ENTRANCE WIND WAVE EXTREMES FILE: 704-TRN.WTRM03050 APRIL 11, 2018 ISSUED FOR USE 4-2 Attachment The peak wind speeds associated with a closure condition range from 23.2 m/s (45.1 knots) to 27.3 m/s (53 knots) with an average peak wind speed of 24.2 m/s (47.04 knots). The mean duration of a wind-induced closure condition is 1.9 hours and is much lower than the duration of wave-induced closure durations. Over the entire period of record, Seal Rocks buoy experiences wind speeds higher than the other buoys (ranging from 1 to 136 percent higher) when there are either wave- or wind-induced closure conditions recorded at Seal Rocks (refer to Table 5-6). The wave direction associated with the peak of a closure condition ranges from 83 to 180 degrees with a mean incident wave direction of 128 degrees (from the southeast). A single closure condition with an incident wave angle of 56 degrees (i.e., from Hinchinbrook Island) was recorded, however this direction measurement is suspect and has been left out of this analysis. The average significant wave height associated with a closure condition is 5.3 m (17.4 feet) and the overall maximum recorded wave height during a closure condition is 8.2 m (26.9 feet). The mean duration of a wave induced closure condition is 6.1 hours. The averaging does not include the year 2013 due to a lack of data. Wave induced closure conditions typically have a peak duration ranging from four to seven hours. The mean significant wave heights recorded at the Seal Rocks buoy are in general lower (ranging from 10 to 16.5 percent lower) than those recorded at the other buoys during closure conditions, suggesting that using Seal Rocks data to select closure conditions may miss some closure conditions. The exception is for windinduced events where recorded mean significant wave heights at Seal Rocks slightly (2 percent) higher than at Cape Cleare over the entire period of record (refer to Table 5-6). Table 5-4: Closure Events Data at Seal Rocks Station (46061) on an Annual Basis Year Wind Closures Average Wind Closure Duration (Hours) Wave Closures Average Wave Closure Duration (Hours) Wind and Wave Closures
56 HINCHINBROOK ENTRANCE WIND WAVE EXTREMES 704-TRN.WTRM03050 APRIL 11, 2018 ISSUED FOR USE Table 5-5: Closure Events Data at Seal Rocks Station (46061) on a Monthly Basis Month Average Number of Closures per Month Average Duration (hours) Closure Condition Probability (%) January February March April May June July August September October November December Table 5-6: Average Magnitude of Observations at all Stations for Wave-Induced Closure Conditions at Seal Rocks Parameter Seal Rocks Cape Cleare Cape Suckling Nuchek Wave Height (m) Wave Height (feet) Wind Speed (m/s) Wind Speed (knots) Table 5-7: Average Magnitude of Observations at all Stations for Wind-Induced Closure Conditions at Seal Rocks Parameter Seal Rocks Cape Cleare Cape Suckling Nuchek Wave Height (m) Wave Height (feet) Wind Speed (m/s) Wind Speed (knots)
57 HINCHINBROOK ENTRANCE WIND WAVE EXTREMES FILE: 704-TRN.WTRM03050 APRIL 11, 2018 ISSUED FOR USE 4-2 Attachment Table 5-8: Percent Difference Between Seal Rocks and Neighboring Stations During Closure Conditions Closure Condition Parameter Cape Cleare Cape Suckling Nuchek Wave-Induced Wind-Induced Wave Height -10% -16.5% N/A Wind Speed +32% +1% +65% Wave Height +2% -16% N/A Wind Speed +102% +20% +136% 5.2 WIND AND WAVE EXTREME VALUE ANALYSIS It is standard practice to characterize wind speeds and wave heights by their return period, where the return period is an estimate of the likelihood of a given wind speed or wave height s occurrence. Return periods are most commonly given as an expected frequency such as a 1 in 100 year event. This does not mean that a 100 year event will occur on time in 100 years, but that the probability of this event s occurrence in any given year is 1/100 or 1 percent. Therefore, it is possible for a 100 year event to never occur (36.8 percent probability), occur at least once (63.2 percent probability), or occur at least twice (0.2 percent probability) over the span of 100 years. The severity of a given return period event (e.g., 1 in 100 years) is generally determined from measured data at or near the location of interest. In this way, the severity of measured past events is used to extrapolate the potential severity of future events. Standard practice is to assign the largest recorded event in the period of record a return period equal to the period of record (e.g., the largest event in a five year record is assigned a five year return period). Smaller events in the period of record are assigned smaller return periods (e.g., the second largest event in a five year record is assigned a four year return period) until each of the years in the record has an assigned event (e.g., five events for a five year record). Several extreme event probability distributions are then fit to the recorded events. The distribution with the highest coefficient of determination (r 2 ) value is chosen as most representative of the extreme value distribution at the site and, hence, the best predictor of the magnitude of wind and/or waves associated with a given return period. Table 5-7 shows the projected extreme wind speeds together with their return periods for each of the buoy stations. Higher intensity winds at Seal Rocks and Cape Suckling are generally easterly, while at Cape Cleare extreme winds are predominantly north-easterly and easterly. The 200 year return period winds at Seal Rocks reach speeds of 31.5 m/s (61.23 knots), compared to 24.4 m/s (47.43 knots) at Cape Cleare and 31.3 m/s (60.84 knots) at Cape Suckling. Figure 5-1, Figure 5-2, and Figure 5-3 plot wind speed versus return period at Seal Rocks, Cape Cleare, and Cape Suckling, respectively, for five potential theoretical distributions appropriate for wind and wave extreme value analysis. Extreme wave analysis was not included in this study as both wave height and direction are required and at the time of reporting there is insufficient data for wave direction. An attempt will be made to retrieve more data in order to have a more complete analysis. 10
58 HINCHINBROOK ENTRANCE WIND WAVE EXTREMES 704-TRN.WTRM03050 APRIL 11, 2018 ISSUED FOR USE Table 5-9: Extreme Wind Analysis for All the Stations Return Period Wind Speed (m/s) Wind Speed (knots) Seal Rocks Cape Cleare Cape Suckling Seal Rock Cape Cleare Cape Suckling DISCUSSION Closure conditions typically have a peak duration of four to seven hours. Closure conditions induced by both wind and wave exceedances occur one to three times per year within the period of record with a further 10 to 26 exceedances per year associated with waves only and a further one to three closures per year due to winds only. Winds associated with closure conditions are characterized by easterly winds with an average peak speed of 24.2 m/s (47.04 knots) and an average duration over the closure condition threshold of almost two hours. Observed winds at Seal Rocks buoy are typically 1 to 136 percent higher than those recorded at other stations. Waves associated with closure conditions typically originate from the southeast with an average significant wave height of 5.3 m (17.4 feet) and average duration over the closure condition threshold of six hours. Observed wave heights at Seal Rocks tend to be lower than those recorded at the two other buoys by 10 to 16.5 percent. As the closure condition is currently defined, it is far more likely for a closure condition to be declared on the basis of wave height than wind speed. This is despite the Seal Rock buoy generally recording higher winds speeds and lower wave heights than neighbouring stations. A component of this mismatch may be that the closure condition wave height is defined as 15-foot seas, which is approximately a moderate gale (Force 7), while closure condition wind speed of 45 knots is a severe gale (Force 9). This suggests three important observations regarding the current closure condition definition: It is likely that closure conditions cannot be accurately determined in the absence of wave data as wind data alone is a relatively poor predictor of when a closure condition is occurring. It may be possible to open up shipping windows by increasing the closure condition wave height to bring it in line with the closure condition wind speed. Alternatively, the closure condition wind speed could potentially be lowered without significantly impacting the available shipping windows. Escort vessel capabilities should likely be used to define which aspects of the currently defined closure condition is the limiting factor on transits through Hinchinbrook Entrance. Using existing vessels as a baseline, this information could also be used to plan fleet renewals such that the number of closure conditions per year is minimized. 11
59 HINCHINBROOK ENTRANCE WIND WAVE EXTREMES FILE: 704-TRN.WTRM03050 APRIL 11, 2018 ISSUED FOR USE 4-2 Attachment 7.0 CLOSURE We trust this report meets your present requirements. If you have any questions or comments, please contact the undersigned. Respectfully submitted, Tetra Tech Canada Inc. Prepared by: Reviewed by: Alana Bonnici, M.Sc. Jim Stronach, Ph.D., P.Eng. Oceanographer Manager, Water and Marine Engineering Direct Line: Direct Line: AB/JS/tak 12
60 HINCHINBROOK ENTRANCE WIND WAVE EXTREMES 704-TRN.WTRM03050 APRIL 11, 2018 ISSUED FOR USE REFERENCES Jin, M. and Wang, J., Interannual variability and sensitivity study of the ocean circulation and thermohaline structure in Prince William Sound, Alaska. Continental Shelf Research, 24(3), Lethcoe, J., The Weather and Climate of Prince William Sound. ISBN # Liu, H., Olsson, P.Q., Volz, K., SAR Observation and Modeling of Gap Winds in the Prince William Sound of Alaska. Sensors, 8, , DOI: /s Macklin, S.A., Lackman, G.M., Gray, J., Offshore-Directed Winds in the Vicinity of Prince William Sound, Alaska. Monthly Weather Review, 116, Mesquita, M.S., Characteristics and Variability of Storm Tracks in the North Pacific, Bearing Sea and Alaksa. Ph.D. Dissertation, University of Alaska Fairbanks. Middleton Island Meteorological Data, Retrieved from URL: Date accessed: 12/01/2018. NOAA, U.S. Coast Pilot 9 (35 th Edition). Olsson, P.Q., Personal communication, 15 September, Overland, J.E., Cardone, V.J., Case Studies of Four Severe Gulf of Alaska Storms. NOAA Technical Memorandum, ERL PMEL-19 Pickart, R.S., Moore, G.W.K., MacDonald, A.M., Renfrew, I.A., Walsh, J.E., Kessler, W.S., Seasonal Evolution of Aleutian Low Pressure Systems: Implications for the North Pacific Subpolar Circulation. Journal of Physical Oceanography, 39, , DOI: /2009JPO Quintero, C., Personal communication, 12 December, Robert, A., Sentinel Tug Requirements for Gulf of Alaska: Ship Drift Study. Rodionov, S.N., Bond, N.A., Overland, J.E., The Aleutian Low, Storm Tracks and Winter Climate Variability in the Bering Sea. Deep-Sea Research, Part II, 54, Schoch, G.C., McCammon, M., Demonstrating the Alaska Ocean Observing System in Prince William Sound. Contintental Shelf Research, 63, Wang, J., Patrick, V., Allen, J., Vaughan, S., Mooers, C., Jin, M., Modeling seasonal ocean circulation of Prince William Sound, Alaska using freshwater of a line source. WIT Transactions on The Built Environment, 43. Winstead, N.S., Colle, B., Bond, N., Young, G., Olson, J., Loescher, K., Monaldo, F., Thompson, D., Pichel, W.G., Using SAR Remote Sensing, Field Observations, and Models to Better Understand Coastal Flows in the Gulf of Alaska. Bulletin of the American Meteorological Society, 87,
61 HINCHINBROOK ENTRANCE WIND WAVE EXTREMES 704-TRN.WTRM03050 APRIL 11, 2018 ISSUED FOR USE FIGURES Figure 4-1 Geographical Location of Stations Figure 4-2 Data Unavailability at Seal Rocks Station (46061) Figure 4-3 Seal Rocks Station (46061) Wind Rose Figure 4-4 Seal Rocks Station (46061) Wave Rose Figure 4-5 Cape Cleare Station (46076) Wind Rose Figure 4-6 Cape Cleare Station (46076) Wave Rose Figure 4-7 Cape Suckling Station (46082) Wind Rose Figure 4-8 Cape Suckling Station (46082) Wave Rose Figure 4-9 Nuchek Station (1074) Wind Rose Figure 5-1 Extreme Wind Analysis for Seal Rocks Station (46061) Figure 5-2 Extreme Wind Analysis for Cape Cleare Station (46076) Figure 5-3 Extreme Wind Analysis for Cape Suckling Station (46082)
62 NOTES Notes CLIENT Hinchinbrook Entrance Wind Wave Extremes Geographical Location of Stations Q:\Vancouver\Engineering\V132\Projects\WTRM03050_Hinchinbrook\reporting\InterimReport01\figures\images\4-1NEW.lay STATUS ISSUED FOR USE PROJECT NO. 704-TRN.WTRM03050 OFFICE Tetra Tech - VANC DWN CKD APVD REV AB JM JAS 0 DATE January, 2018 Figure Jan :30:34
63 NOTES Notes CLIENT Hinchinbrook Entrance Wind Wave Extremes Missing Data at Seal Rocks Buoy Q:\Vancouver\Engineering\V132\Projects\WTRM03050_Hinchinbrook\reporting\InterimReport01\figures\images\4-2.lay STATUS ISSUED FOR USE PROJECT NO. 704-TRN.WTRM03050 OFFICE Tetra Tech - VANC DWN CKD APVD REV AB JM JAS 0 DATE January, 2018 Figure Jan :52:29

64 NOTES Seal Rocks Buoy, Dates: 01 Jan Oct 2017 Temporal Resolution: 1 Hour CLIENT Hinchinbrook Entrance Wind Wave Extremes Seal Rocks Station Wind Rose STATUS ISSUED FOR USE PROJECT NO. 704-TRN.WTRM0350 OFFICE Tetra Tech - VANC DWN CKD APVD REV AB JM JAS 0 DATE Januar, 2018 Figure 4-3 Q:\Vancouver\Engineering\V132\Projects\WTRM03050_Hinchinbrook\reporting\InterimReport01\figures\images\4-3_JM.lay 22 Jan :03:35

65 NOTES Wave Rose at Seal Rocks Buoy,46061 Dates: 16 Apr Oct 2017 Temporal Resolution: 1 Hour CLIENT Hinchinbrook Entrance Wind Wave Extremes Seal Rocks Station Wave Rose STATUS ISSUED FOR USE PROJECT NO. 704-TRN.WTRM0350 OFFICE Tetra Tech - VANC DWN CKD APVD REV AB JM JAS 0 DATE Januar, 2018 Figure 4-4 Q:\Vancouver\Engineering\V132\Projects\WTRM03050_Hinchinbrook\reporting\InterimReport01\figures\images\4-3lay.lay 22 Jan :35:28

66 NOTES Wind Rose at Cape Cleare Buoy Dates: 01 Jan Oct 2017 Temporal Resolution: 1 Hour CLIENT Hinchinbrook Entrance Wind Wave Extremes Cape Cleare Station Wind Rose STATUS ISSUED FOR USE PROJECT NO. 704-TRN.WTRM0350 OFFICE Tetra Tech - VANC DWN CKD APVD REV AB JM JAS 0 DATE Januar, 2018 Figure 4-5 Q:\Vancouver\Engineering\V132\Projects\WTRM03050_Hinchinbrook\reporting\InterimReport01\figures\images\4-4new.lay 22 Jan :46:58

67 NOTES Wave Rose at Cape Cleare Buoy Dates: 14 Jul Oct 2017 Temporal Resolution: 1 Hour CLIENT Hinchinbrook Entrance Wind Wave Extremes Cape Cleare Station Wave Rose STATUS ISSUED FOR USE PROJECT NO. 704-TRN.WTRM0350 OFFICE Tetra Tech - VANC DWN CKD APVD REV AB JM JAS 0 DATE Januar, 2018 Figure 4-6 Q:\Vancouver\Engineering\V132\Projects\WTRM03050_Hinchinbrook\reporting\InterimReport01\figures\images\4-6new.lay 22 Jan :48:54

68 NOTES Wind Rose at Cape Suckling Buoy Dates: 01 Jan Jan 2016 Temporal Resolution: 1 Hour CLIENT Hinchinbrook Entrance Wind Wave Extremes Cape Suckling Station Wind Rose STATUS ISSUED FOR USE PROJECT NO. 704-TRN.WTRM0350 OFFICE Tetra Tech - VANC DWN CKD APVD REV AB JM JAS 0 DATE Januar, 2018 Figure 4-7 Q:\Vancouver\Engineering\V132\Projects\WTRM03050_Hinchinbrook\reporting\InterimReport01\figures\images\4-7new.lay 22 Jan :50:07

69 NOTES Wave Rose at Cape Suckling Buoy Dates: 10 Jul Feb 2016 Temporal Resolution: 1 Hour CLIENT Hinchinbrook Entrance Wind Wave Extremes Cape Suckling Station Wave Rose STATUS ISSUED FOR USE PROJECT NO. 704-TRN.WTRM0350 OFFICE Tetra Tech - VANC DWN CKD APVD REV AB JM JAS 0 DATE Januar, 2018 Figure 4-8 Q:\Vancouver\Engineering\V132\Projects\WTRM03050_Hinchinbrook\reporting\InterimReport01\figures\images\4-8new.lay 22 Jan :51:28

70 NOTES Wind Rose at Nuchek Station 1074 Dates: 01 Jan Nov 2017 Temporal Resolution: 1 Hour CLIENT Hinchinbrook Entrance Wind Wave Extremes Nuchek Station 1074 Wind Rose STATUS ISSUED FOR USE PROJECT NO. 704-TRN.WTRM0350 OFFICE Tetra Tech - VANC DWN CKD APVD REV AB JM JAS 0 DATE Januar, 2018 Figure 4-9 Q:\Vancouver\Engineering\V132\Projects\WTRM03050_Hinchinbrook\reporting\InterimReport01\figures\images\4-9new.lay 23 Jan :57:20
71 NOTES Notes CLIENT Hinchinbrook Entrance Wind Wave Extremes Extreme Wind Analysis for Seal Rocks Station (46061) Q:\Vancouver\Engineering\V132\Projects\WTRM03050_Hinchinbrook\reporting\InterimReport01\figures\images\5-1.lay STATUS ISSUED FOR USE PROJECT NO. 704-TRN.WTRM03050 OFFICE Tetra Tech - VANC DWN CKD APVD REV AB JM JAS 0 DATE January, 2018 Figure Jan :29:21
72 NOTES Notes CLIENT Hinchinbrook Entrance Wind Wave Extremes Extreme Wind Analysis for Cape Cleare Station (46076) Q:\Vancouver\Engineering\V132\Projects\WTRM03050_Hinchinbrook\reporting\InterimReport01\figures\images\5-2.lay STATUS ISSUED FOR USE PROJECT NO. 704-TRN.WTRM03050 OFFICE Tetra Tech - VANC DWN CKD APVD REV AB JM JAS 0 DATE January, 2018 Figure Jan :30:11
73 NOTES Notes CLIENT Hinchinbrook Entrance Wind Wave Extremes Extreme Wind Analysis for Cape Suckling Station (46082) Q:\Vancouver\Engineering\V132\Projects\WTRM03050_Hinchinbrook\reporting\InterimReport01\figures\images\5-3.lay STATUS ISSUED FOR USE PROJECT NO. 704-TRN.WTRM03050 OFFICE Tetra Tech - VANC DWN CKD APVD REV AB JM JAS 0 DATE January, 2018 Figure Jan :30:38
74 HINCHINBROOK ENTRANCE WIND WAVE EXTREMES FILE: 704-TRN.WTRM03050 APRIL 11, 2018 ISSUED FOR USE 4-2 Attachment APPENDIX A TETRA TECH S LIMITATIONS ON THE USE OF THIS DOCUMENT
75 LIMITATIONS ON USE OF THIS DOCUMENT 4-2 Attachment HYDROTECHNICAL 1.1 USE OF DOCUMENT AND OWNERSHIP This document pertains to a specific site, a specific development, and a specific scope of work. The document may include plans, drawings, profiles and other supporting documents that collectively constitute the document (the Professional Document ). The Professional Document is intended for the sole use of TETRA TECH s Client (the Client ) as specifically identified in the TETRA TECH Services Agreement or other Contractual Agreement entered into with the Client (either of which is termed the Contract herein). TETRA TECH does not accept any responsibility for the accuracy of any of the data, analyses, recommendations or other contents of the Professional Document when it is used or relied upon by any party other than the Client, unless authorized in writing by TETRA TECH. Any unauthorized use of the Professional Document is at the sole risk of the user. TETRA TECH accepts no responsibility whatsoever for any loss or damage where such loss or damage is alleged to be or, is in fact, caused by the unauthorized use of the Professional Document. Where TETRA TECH has expressly authorized the use of the Professional Document by a third party (an Authorized Party ), consideration for such authorization is the Authorized Party s acceptance of these Limitations on Use of this Document as well as any limitations on liability contained in the Contract with the Client (all of which is collectively termed the Limitations on Liability ). The Authorized Party should carefully review both these Limitations on Use of this Document and the Contract prior to making any use of the Professional Document. Any use made of the Professional Document by an Authorized Party constitutes the Authorized Party s express acceptance of, and agreement to, the Limitations on Liability. The Professional Document and any other form or type of data or documents generated by TETRA TECH during the performance of the work are TETRA TECH s professional work product and shall remain the copyright property of TETRA TECH. The Professional Document is subject to copyright and shall not be reproduced either wholly or in part without the prior, written permission of TETRA TECH. Additional copies of the Document, if required, may be obtained upon request. 1.2 ALTERNATIVE DOCUMENT FORMAT Where TETRA TECH submits electronic file and/or hard copy versions of the Professional Document or any drawings or other project-related documents and deliverables (collectively termed TETRA TECH s Instruments of Professional Service ), only the signed and/or sealed versions shall be considered final. The original signed and/or sealed electronic file and/or hard copy version archived by TETRA TECH shall be deemed to be the original. TETRA TECH will archive a protected digital copy of the original signed and/or sealed version for a period of 10 years. Both electronic file and/or hard copy versions of TETRA TECH s Instruments of Professional Service shall not, under any circumstances, be altered by any party except TETRA TECH. TETRA TECH s Instruments of Professional Service will be used only and exactly as submitted by TETRA TECH. Electronic files submitted by TETRA TECH have been prepared and submitted using specific software and hardware systems. TETRA TECH makes no representation about the compatibility of these files with the Client s current or future software and hardware systems. 1.3 STANDARD OF CARE Services performed by TETRA TECH for the Professional Document have been conducted in accordance with the Contract, in a manner consistent with the level of skill ordinarily exercised by members of the profession currently practicing under similar conditions in the jurisdiction in which the services are provided. Professional judgment has been applied in developing the conclusions and/or recommendations provided in this Professional Document. No warranty or guarantee, express or implied, is made concerning the test results, comments, recommendations, or any other portion of the Professional Document. If any error or omission is detected by the Client or an Authorized Party, the error or omission must be immediately brought to the attention of TETRA TECH. 1.4 DISCLOSURE OF INFORMATION BY CLIENT The Client acknowledges that it has fully cooperated with TETRA TECH with respect to the provision of all available information on the past, present, and proposed conditions on the site, including historical information respecting the use of the site. The Client further acknowledges that in order for TETRA TECH to properly provide the services contracted for in the Contract, TETRA TECH has relied upon the Client with respect to both the full disclosure and accuracy of any such information. 1.5 INFORMATION PROVIDED TO TETRA TECH BY OTHERS During the performance of the work and the preparation of this Professional Document, TETRA TECH may have relied on information provided by third parties other than the Client. While TETRA TECH endeavours to verify the accuracy of such information, TETRA TECH accepts no responsibility for the accuracy or the reliability of such information even where inaccurate or unreliable information impacts any recommendations, design or other deliverables and causes the Client or an Authorized Party loss or damage. 1.6 GENERAL LIMITATIONS OF DOCUMENT This Professional Document is based solely on the conditions presented and the data available to TETRA TECH at the time the data were collected in the field or gathered from available databases. The Client, and any Authorized Party, acknowledges that the Professional Document is based on limited data and that the conclusions, opinions, and recommendations contained in the Professional Document are the result of the application of professional judgment to such limited data. The Professional Document is not applicable to any other sites, nor should it be relied upon for types of development other than those to which it refers. Any variation from the site conditions present, or variation in assumed conditions which might form the basis of design or recommendations as outlined in this report, at or on the development proposed as of the date of the Professional Document requires a supplementary exploration, investigation, and assessment. TETRA TECH is neither qualified to, nor is it making, any recommendations with respect to the purchase, sale, investment or development of the property, the decisions on which are the sole responsibility of the Client. 1
76 LIMITATIONS ON USE OF THIS DOCUMENT 4-2 Attachment HYDROTECHNICAL 1.7 ENVIRONMENTAL AND REGULATORY ISSUES Unless expressly agreed to in the Services Agreement, TETRA TECH was not retained to explore, address or consider, and has not explored, addressed or considered any environmental or regulatory issues associated with the project. 1.8 LEVEL OF RISK It is incumbent upon the Client and any Authorized Party, to be knowledgeable of the level of risk that has been incorporated into the project design, in consideration of the level of the hydrotechnical information that was reasonably acquired to facilitate completion of the design. 2

77 Interim Report 2.0 Hinchinbrook Entrance Wind Wave Extremes PRESENTED TO Prince William Sound Regional Citizens Advisory Council MAY 16, 2018 ISSUED FOR REVIEW FILE: 704-TRN.WTRM03050 This Issued for Review document is provided solely for the purpose of client review and presents our interim findings and recommendations to date. Our usable findings and recommendations are provided only through an Issued for Use document, which will be issued subsequent to this review. Final design should not be undertaken based on the interim recommendations made herein. Once our report is issued for use, the Issued for Review document should be either returned to Tetra Tech Canada Inc. (Tetra Tech) or destroyed.
78 This page is intentionally left blank. 4-2 Attachment
79 HINCHINBROOK ENTRANCE WIND WAVE EXTREMES FILE: 704-TRN.WTRM03050 SEPTEMBER 18, 2018 ISSUED FOR USE TABLE OF CONTENTS 1.0 INTRODUCTION DATA COMPLETENESS METEOROLOGICAL CHARACTERIZATION OF HINCHINBROOK ENTRANCE LOCAL SENSOR DATA Seal Rocks Station (46061) Cape Cleare Station (46076) Cape Suckling Station (46082) West Orca Bay Station (46060) Nuchek Station (1074) MEASURED EXTREME WEATHER EVENTS Measured Closure Condition Properties Wind and Wave Extreme Value Analysis MODELLED DATA Characterization of WaveWatch III Hindcasts WAVEWATCH III Behaviour at Seal Rocks Station (46061) WAVEWATCH III Behaviour at Cape Cleare Station (46076) WAVEWATCH III Behaviour at Cape Suckling Station (46082) WAVEWATCH III Behaviour at West Orca Bay Station (46060) WAVEWATCH III Behaviour at Nuchek Station (1074) WAVEWATCH III Behaviour at Point of Interest WAVEWATCH III Behaviour at Point of Interest Closure Conditions as Simulated by WAVEWATCH III at Seal Rocks Station Characterization of NDFD Hindcasts Characterization of AOOS Portal SWAN Output Hindcasts Characterization of WRF Hindcasts SWAN SIMULATION of Wave Conditions Within Hinchinbrook Entrance Overview of SWAN SWAN Setup SWAN Input Data SWAN Wave Boundary Conditions SWAN Wave Condition Results DISCUSSION CLOSURE REFERENCES GLOSSARY HinchinbrookInterimReport2_final-BT i
80 HINCHINBROOK ENTRANCE WIND WAVE EXTREMES FILE: 704-TRN.WTRM03050 SEPTEMBER 18, 2018 ISSUED FOR USE 4-2 Attachment LIST OF TABLES IN TEXT Table 4-1: Observation Station Characteristics Table 5-1: Wave Height Calculations from Significant Wave Height (SWH) Table 5-2: List of Vessel Sizes and Wave Characteristics That Could Potentially Endanger Them Table 5-3: Closure Data at Hinchinbrook Entrance Table 5-4: Closure Events Data at Seal Rocks Station (46061) on an Annual Basis Table 5-5: Closure Events Data at Seal Rocks Station (46061) on a Monthly Basis Table 5-6: Average Magnitude of Observations at All Stations for Wave-Induced Closure Conditions at Seal Rocks Table 5-7: Average Magnitude of Observations at All Stations for Wind-Induced Closure Conditions at Seal Rocks Table 5-8: Percent Difference Between Seal Rocks and Neighboring Stations During Closure Conditions Table 5-9: Extreme Wind Analysis for All the Stations Table 6-1: Model Characteristics from the AOOS Portal with Data Available in the Geographical Region of Interest Table 6-2: WAVEWATCH III Wave Output Variables Table 6-3: WAVEWATCH III Bias and RMSE for Wind Speed and Wave Height at Different Stations Over the Entire Available Date Record Table 6-4: WAVEWATCH III Bias and RMSE for Wind Speed and Wave Height at Different Stations for Wave Heights Over 3 m (9.84 feet) Throughout the Entire Available Date Record Table 6-5: WAVEWATCH III Simulated Closure Data at Seal Rocks Location on an Annual Basis Table 6-6: Observed and Simulated Closure Events at Seal Rocks Buoy: a Monthly Breakdown Table 6-7: Summary of Reported, Observed, and Simulated Closures Table 6-8: Average Magnitude of WAVEWATCH III Simulated and Observed Closure Conditions Table 6-9: Maximum Magnitude of WAVEWATCH III Simulated and Observed Closure Conditions Table 6-10: List of NDFD Variable Outputs Available Through the AOOS Portal Table 6-11: NDFD Bias and RMSE for Wind Speed and Wave Height at Buoy Locations Over the Entire Available Date Record Table 6-12: NDFD Bias and RMSE for Wind Speed and Wave Height at Buoy Locations Over the Entire Available Date Record for Wave Heights Greater Than 3 m Table 6-13: List of SWAN Variable Outputs Available Through the AOOS Portal Table 6-14: List of WRF Variable Outputs Available Through the AOOS Portal Table 6-15: WRF Bias and RMSE for Wind Speed at Buoy Locations Over the Entire Available Date Record Table 6-16: WRF Bias and RMSE for Wind Speed at Buoy Locations Over the Entire Available Date Record for Wind Speeds Greater Than 15 m/s (29.2 knots) Table 6-17: Output Variables from Tetra Tech s SWAN Numerical Wave Model Table 6-18: SWAN Bias and RMSE for Wave Height, Wave Direction, and Wave Period at Seal Rocks Station Over the Entire Available Date Record Table 6-19: SWAN Bias and RMSE for Wave Height, Wave Direction, and Wave Period at Seal Rocks Station for Wave Heights Greater Than 3 m HinchinbrookInterimReport2_final-BT ii
81 HINCHINBROOK ENTRANCE WIND WAVE EXTREMES FILE: 704-TRN.WTRM03050 SEPTEMBER 18, 2018 ISSUED FOR USE Table 6-20: Closure Data at Seal Rocks Location as Reported, Observed, and Modelled at the Seal Rocks Buoy Location APPENDIX SECTIONS FIGURES Figures APPENDICES Appendix A Tetra Tech s Limitations on the Use of this Document iii HinchinbrookInterimReport2_final-BT
82 HINCHINBROOK ENTRANCE WIND WAVE EXTREMES FILE: 704-TRN.WTRM03050 SEPTEMBER 18, 2018 ISSUED FOR USE 4-2 Attachment LIMITATIONS OF REPORT This report and its contents are intended for the sole use of Prince William Sound Regional Citizens Advisory Council and their agents. Tetra Tech Canada Inc. (Tetra Tech) does not accept any responsibility for the accuracy of any of the data, the analysis, or the recommendations contained or referenced in the report when the report is used or relied upon by any Party other than Prince William Sound Regional Citizens Advisory Council, or for any Project other than the proposed development at the subject site. Any such unauthorized use of this report is at the sole risk of the user. Use of this report is subject to the terms and conditions stated in Tetra Tech Canada Inc. s Services Agreement. Tetra Tech s Limitations on the Use of this Document provided in Appendix A of this report. HinchinbrookInterimReport2_final-BT iv
83 HINCHINBROOK ENTRANCE WIND WAVE EXTREMES 704-TRN.WTRM03050 SEPTEMBER 18, 2018 ISSUED FOR USE 1.0 INTRODUCTION Sections 1 to 5 are reiterated from Interim Report 1 with updates where necessary. The 1989 Exxon Valdez grounding and oil spill in the rich ecosystem of Prince William Sound led to stakeholders making efforts to prevent similar incidents in the future. The Prince William Sound Regional Citizens Advisory Council s (PWSRCAC) mission is to promote environmentally safe operation of the Alyeska terminal and associated tankers. It is a non-profit corporation that was established following the Exxon Valdez oil spill. PWSRCAC advises Alyeska Pipeline Service Company, oil shippers, regulatory agencies, elected officials, and the general public on issues related to the prevention and response to oil spills and the mitigating environmental impacts from terminal and tanker operations. Tetra Tech Canada Inc. (Tetra Tech) was retained by PWSRCAC to conduct a study that better defines weather related characteristics as they affect the feasibility of tanker escort vessels conducting rescue operations at the Hinchinbrook Entrance to Prince William Sound, Alaska. Tankers transiting Prince William Sound and Hinchinbrook Entrance are escorted by escort vessels to ensure swift assistance in the event the tanker becomes disabled. Wind speed and wave height are the main factors affecting the feasibility of tanker escort vessels rescuing a stricken tanker. To prohibit transits in extreme wind and wave conditions, a closure condition has been established as part of the Vessel Escort and Response Plan (VERP) for vessels servicing the Port of Valdez. The Alyeska Pipeline Service Company has defined this closure condition as wind speeds in excess of 45 knots or wave heights in excess of 15 feet, both measured at the Seal Rocks weather buoy (NOAA 46061). Despite this safety measure, however, a recent study has shown that the possibility of saving an oil tanker in distress is unlikely for conditions at the closure condition (Robert Allan, 2016). This project will better define the weather related characteristics of a closure condition with a focus on the metocean conditions in Hinchinbrook Entrance that impact the potential rescue of disabled vessels. This project seeks to answer two main questions: Closure Condition Frequency: What is the frequency of extreme event/closure conditions at Hinchinbrook Entrance? Closure Condition Applicability: How well does the definition and identification of a closure condition reflect conditions actually experienced by vessels transiting Hinchinbrook Entrance? Are there better methods and data sources to identify closure conditions? To address these two questions, a four stage strategy was proposed: Task 1: Statistical investigation of closure condition likelihood and duration based on Seal Rocks data. Task 2: Analysis of past performance with respect to accurately declaring closure conditions. Task 3: Hindcast conditions within Hinchinbrook Entrance using numerical wind, wave, and current models and generate scaling relationships between modelled conditions in Hinchinbrook Entrance and available real time data. Task 4: Re-evaluate the occurrence of closure conditions using these scaling relationships to determine how much accuracy can be gained using scaled winds and waves from either Seal Rocks or from an array of stations. The first interim report summarizes the progress on Tasks 1 and 2, covering data acquisition and highlighting any shortcomings of the data collection that will hinder appropriate project progress. The first interim report presents the data gathered and the analysis carried out thus far. In the following sections, a technical summary and presentation of the data collected is presented. 1
84 HINCHINBROOK ENTRANCE WIND WAVE EXTREMES FILE: 704-TRN.WTRM03050 SEPTEMBER 18, 2018 ISSUED FOR USE 4-2 Attachment 2.0 DATA COMPLETENESS At this time, all known publicly available local sensor data has been obtained. Numerical model results that are available through online archives have also been obtained. At the time of this report, sufficient data on declared closure conditions was not available to establish how often closure conditions are declared but do not occur (false positive) or are not declared but occur (false negative). Tetra Tech continually reached out to the Port of Valdez, the Alyeska consortium, and the United States Coast Guard to confirm their best-practice procedures for monitoring and declaring closure conditions, but ultimately sufficient data on declared closure conditions was not available to allow comparison with publicly available data from wind and wave sensors in the area. 3.0 METEOROLOGICAL CHARACTERIZATION OF HINCHINBROOK ENTRANCE Prince William Sound is located on the south coast of the state of Alaska. The eastern shore of Prince William Sound is formed by the Kenai Peninsula, with the western shore formed by the Chugach Mountains and the southern edge comprised of the principal barrier islands Montague Island, Hinchinbrook Island, and Hawkins Island. Prince William Sound is a biological resource with a rich ecosystem (Jin & Wang, 2003). The principal port for oil loading and transport in Prince William Sound is located at Valdez, Alaska, and is the southern terminus of the Trans Alaska Pipeline System. Winds within the Gulf of Alaska are dominated by general circulation patterns. The stronger winds within the Gulf of Alaska are dominated by the polar highs and Aleutian lows, whilst the weaker winds originate from the East Pacific High. The Aleutian low pressure systems bring winds from the south, southeast, or east, while the polar high pressure systems tend to bring winds from the north, northwest, or northeast. The Aleutian lows and polar highs tend to dominate during the winter months when temperature and pressure differences between the ocean and land are greatest (Lethcoe, 2003). The East Pacific High is a weak clockwise circulation which tends to dominate in summer bringing winds from the southwest within the Gulf of Alaska. Winds in the Gulf of Alaska influence winds in Prince William Sound. Winds in Prince William Sound are affected by the complex regional orography such as fjords, channels, and inlet areas. The complex orography impacts the variability in direction and magnitude of the winds within the Sound. Port Valdez winds therefore tend to be calmer due to its protected location between the mountains (Jin & Wang, 2003). Circulation patterns for surface currents within the Sound are highly dependent on season. Surface currents are distinguished by an anticyclonic (clockwise) gyre between January to April and a cyclonic gyre (anticlockwise) between September to December with transitionary periods in between (Wang, 1970; Jin & Wang, 2003). The gyres are driven by fluctuations in salinity and wind forcing. Salinity fluctuations are influenced by the availability of fresh water input into Prince William Sound primarily in summer as runoff (Wang, 1970). Circulation patterns within Prince William Sound are controlled by the throughflow of water between the Hinchinbrook Entrance and Montague Strait (Schoch & McCammon, 2011). Winds at Hinchinbrook Entrance are the result of phenomena occurring within the Gulf of Alaska as well as Prince William Sound. High wind events in the vicinity of Hinchinbrook Entrance are typically the result of two processes: Gap Winds: Strong gap winds can result from high pressure centered over mainland Alaska combined with a low pressure system in the Gulf of Alaska. These winds are typically northerly and localized within Prince William Sound and at Hinchinbrook Entrance (Macklin et al. 1988, Winstead et al. 2006, Liu et al. 2008). Intense Low Pressure Systems: these low pressure systems lead to large storms in the Gulf of Alaska and are the source of the most severe winds in the project area. They result in strong easterly and south-easterly winds between Hinchinbrook Entrance and Middleton Island (Overland & Cardone, 1980; Rodionov, 2007; Mesquita, 2009; Pickart, 2009; Olsson, 2015). For the purposes of this study, intense low pressure systems will be the primary weather pattern under investigation since gap winds, although severe, are typically localized, generally short lived and have not, within available data HinchinbrookInterimReport2_final-BT 2
85 HINCHINBROOK ENTRANCE WIND WAVE EXTREMES 704-TRN.WTRM03050 SEPTEMBER 18, 2018 ISSUED FOR USE records, resulted in a closure condition. The prevailing winds offshore of Hinchinbrook Entrance are easterly with most storm winds also from the east. 4.0 LOCAL SENSOR DATA The primary technical objective of this interim report is to determine the frequency and duration of closure conditions as reported from data sources currently available to terminal and vessel operators. Observational wind and wave data is generally available, depending on equipment failure, from some or all of following six stations: Seal Rocks buoy (station 46061) Cape Cleare buoy (station 46076) Cape Suckling buoy (station 46082) West Orca Bay buoy (station 46060) Nuchek, land-based (station 1074) Middleton Island Airport, land-based (station 70343) Specifications of the wind and wave measurements differ according to the measurement platform and the instrumentation and data processing that are used. Seal Rocks, Cape Cleare, and Cape Suckling station data was downloaded from the National Oceanic and Atmospheric Administration s (NOAA) National Data Buoy Center (NDBC) website. The NDBC wind and wave data is represented in meteorological convention, which is the direction is which the wind or wave is coming from. The unit for direction is degrees clockwise from true north (north represented by 0 degrees and east by 90 degrees). This convention is also adopted throughout this report. The wind speeds and directions as measured by the NDBC buoys are the averaged measurements collected over an eight-minute period. The gust winds reported by the NDBC buoys are not instantaneous peak winds but rather five or eight second gust speed (determined by the onboard computing system capacity) as measured during the eight-minute period. Wave observations recorded by the NDBC buoys are not direct recordings of the accelerometer and inclinometer sensors. Measurements result from computation of the buoy s vertical displacement throughout the wave acquisition time. The onboard computer applies Fast Fourier Transforms to convert the recordings from a time to a frequency domain. The data is post-processed to reduce noise. Spectral wave energies, significant wave height, and wave period are then derived from this data and transmitted. The original acceleration and displacement measurements are not transmitted. The significant wave heights are recorded by the NDBC buoys as the average of the highest one-third of all the wave heights during a 20 minute sampling period, also called the wave acquisition time. The wave direction is the direction from which the waves at the dominant wave period are travelling. Two measurements of wave period are available for the NDBC buoys; the average wave period, defined as the mean period of all waves during the 20 minute sampling period, and the dominant wave period, defined as the period with the maximum wave energy. The buoys at Seal Rocks and Cape Suckling have an ARES-type onboard computing system, sometimes referred to as a payload. The West Orca Bay and Cape Cleare buoys have an AMPS-type payloads. The NDBC provide details on the ability of the ARES payload (but not the AMPS payload) to resolve the measured parameters together with their accuracies. The buoys with an ARES-type payload (Seal Rocks and Cape Suckling) can record wind directions with a resolution of 1 degree and accuracy of +/- 10 degrees, wind speeds are measured with a resolution of 0.1 meters per second (m/s) and an accuracy defined by the greater of either +/- 1 m/s or 10 percent. Wave directions can be resolved at 0.1 degrees with an accuracy of +/- 10 degrees, the significant wave heights are resolved at 0.1 m with an accuracy of +/- 0.2 m. Wave periods can be resolved at a resolution of 1 s with an accuracy of +/- 1 s. 3
86 HINCHINBROOK ENTRANCE WIND WAVE EXTREMES FILE: 704-TRN.WTRM03050 SEPTEMBER 18, 2018 ISSUED FOR USE 4-2 Attachment Wind data from Nuchek station was downloaded from the United States Department of Agriculture s Natural Resources Conservation Service (NRCS) website. Although the NRCS records wind speeds in miles per hour, these were converted to units of m/s to be consistent with the NDBC data. Middleton Island Airport (with WMO station ID 70343) was downloaded from the rp5 website (Date accessed: 12/01/2018; URL: (airport)). The temporal resolution of a dataset is defined as the periodicity at which an instrument records observations. The dataset available for Middleton Island has a low temporal resolution of six hours with limited information about the dataset itself and consequently its utility is questioned. The Middleton Island Airport data is therefore used to check for consistency with the other stations but is not used as part of the analysis. The station geographical locations, identification numbers, and sources are summarized in Table 4-1 below and Figure 4-1. It is noted that there is quite a large amount of data unavailable at the Seal Rocks station (46061), particularly in the year 2013 as can be seen in Figure 4-2 which summarizes data availability for all stations. Closure conditions are defined at Hinchinbrook Entrance using the Seal Rocks buoy (46061) and so this is the most representative data source for identifying closure conditions. Seal Rocks buoy (46061) is, however, somewhat sheltered from the full wind and wave climate of the area and so one of the later outcomes of this project will be an understanding of the magnitude by which Seal Rocks buoy (46061) is exposed to weaker wind and wave conditions than the actual conditions experienced during vessel transit. Seal Rocks, Cape Cleare, Cape Suckling, and West Orca Bay buoys record wind speeds at their anemometer elevation of 5 m. Therefore, wind speeds recorded by these buoys will be 10.4 percent lower than winds reported at other stations (such as Nuchek) or weather forecasts (standard meteorological wind output is reported at 10 m elevation). Unless otherwise stated, wind speeds recorded at the buoy stations have not been converted to the standard 10 m elevation. Nuchek station is reported to have an elevation of 15 m. Table 4-1: Observation Station Characteristics Station Name Source Station ID Latitude Longitude Seal Rocks NDBC N W Cape Cleare NDBC N W Cape Suckling NDBC N W West Orca Bay NDBC N W Nuchek NRCS N W Middleton Island rp N W 4.1 SEAL ROCKS STATION (46061) A wind rose displaying observational data recorded at Seal Rocks station (46061) for hourly winds between 01 January December 2017 is shown in Figure 4-3 together with its associated wind frequency distribution. Over the period considered, the winds recorded by the Seal Rocks buoy are predominantly easterly with almost 20 percent coming directly from the east and 12 percent from an east-southeast direction. 68 percent of wind speeds recorded at Seal Rocks buoy are light to moderate (less than 8 m/s). Seal Rocks buoy also records a distinct northerly wind which is noticeably lacking at the other three stations. The northerly wind recorded at Seal Rocks is a result of the gap winds in Prince William Sound. The gap winds originating in the channels of Valdez Arm and Wells Passage have the highest speeds as they funnel together into Prince William Sound. In the Hinchinbrook Entrance these gap winds can reach speeds of 12 to 20 m/s (Liu et al., 2008). The Seal Rocks buoy has recorded these gap winds with intensities reaching up to 15 m/s, which corresponds to an approximately 16.7 to 17.5 m/s at 10 m wind speed. Maximum recorded wind speeds at Seal Rocks reach 27.3 m/s. It is noted that Seal Rocks buoy might be located in an area of weaker winds than are found in Hinchinbrook Entrance, therefore under-reporting the intensity of these winds due to its sheltered geographical location. HinchinbrookInterimReport2_final-BT 4
87 HINCHINBROOK ENTRANCE WIND WAVE EXTREMES 704-TRN.WTRM03050 SEPTEMBER 18, 2018 ISSUED FOR USE Waves at Seal Rocks originate from the south-southwest to the southeast. Wave records are available at Seal Rocks buoy on an hourly basis between 16 April December The maximum significant wave height observed at Seal Rocks is 8.19 m. A wave rose for Seal Rocks can be found in Figure 4-4, with directions shown in the meteorological convention (waves propagating from), the same as for winds. ) Wave Rose 4.2 CAPE CLEARE STATION (46076) Observed wind data at Cape Cleare station (46076) is shown in a wind rose in Figure 4-5 for hourly winds between 01 August December 2017 together with the associated wind frequency distribution. Winds recorded at Cape Cleare are predominantly easterly and east-northeasterly but have more variability in their direction than those reported at Seal Rocks. The wind speeds are generally light to moderate in magnitude with 70 percent of winds being less than 8 m/s. Wind speeds at Cape Cleare buoy reach 23.8 m/s. The effects of the gap winds can be seen in the Cape Cleare buoy station wind rose. Liu et al. (2008) forecasts northeasterly winds veering around Montague Island as they funnel through Montague Strait and through Hinchinbrook Entrance. The gap winds are expected to dissipate and lose intensity after having funneled out of Montague Strait and Hinchinbrook Entrance. These gap winds have been recorded at Cape Cleare station originating from the northeast and east-northeast. Waves at Cape Cleare show higher variability with respect to the direction of origin in comparison to waves recorded at Seal Rocks. Waves at Cape Cleare originate predominantly from a southerly direction with both westerly and easterly waves being observed. Wave records are available for the Cape Cleare station on an hourly basis between 14 July December The maximum significant wave height observed in the period of record at Cape Cleare station is m. The wave rose for Cape Cleare can be found in Figure CAPE SUCKLING STATION (46082) A wind rose displaying hourly winds between 01 January December 2017 at Cape Suckling station (46082) is shown in Figure 4-7 together with the wind frequency distribution at Cape Suckling station. Winds recorded at Cape Suckling exhibit a predominantly east-southeast direction with 19 percent of winds originating from this direction and 17 percent originating from the east. 66 percent of the wind speeds recorded at Cape Suckling were light to moderate in magnitude (less than 8 m/s). Wind speeds at Cape Suckling buoy reach a maximum of 25 m/s over the period of record. The wind rose at Cape Suckling Station shows a very low frequency of northerly winds which implies that there is no evidence of gap winds seen at the Cape Suckling station. This is to be expected, as Cape Suckling is further away from Prince William Sound and Hinchinbrook Entrance where the effects of the localized gap winds phenomenon should not be felt. Waves at Cape Suckling also have a higher variability in terms of their direction of origin compared to Seal Rocks, with the most predominant waves direction observed at Cape Suckling being southwest. The Cape Suckling buoy has wave records on an hourly basis between the dates of 10 July December The maximum significant wave height observed at Cape Suckling station during the period of record is m (higher than both Cape Cleare and Seal Rocks buoys). The wave rose for Cape Suckling can be found in Figure WEST ORCA BAY STATION (46060) West Orca Bay is situated within Prince William Sound, and does not experience the extremity of wave heights that the other buoys record. Although West Orca Bay buoy is sheltered from the extreme events in the open Gulf of Alaska, data from this buoy adds value to this study since it provides an analysis of the performance of the models within Prince William Sound and would therefore make the study more complete. Figure 4-9 displays the wind rose of hourly winds recorded between 01 January December 2017 at West Orca Bay buoy together with its frequency distribution table. The winds recorded at this buoy are predominantly east-southeasterly in origin with over 31 percent originating from east-southeast and east. Almost 78 percent of 5
88 HINCHINBROOK ENTRANCE WIND WAVE EXTREMES FILE: 704-TRN.WTRM03050 SEPTEMBER 18, 2018 ISSUED FOR USE 4-2 Attachment winds are light to moderate in magnitude (less than 8 m/s) at this location. The winds recorded at West Orca Bay buoy are only slightly lower in speed in comparison to the winds recorded at Seal Rocks buoy. Figure 4-10 displays the wave rose of hourly waves when both wave direction and significant wave height were available between 07 August December The waves recorded at this buoy are predominantly from the south with over 35 percent of waves originating from this direction. Wave heights recorded at West Orca Bay buoy are lower in height than those observed at Seal Rocks with over 97 percent of waves in the Prince William Sound not exceeding 2 m. 4.5 NUCHEK STATION (1074) The Nuchek land-based station (1074) wind rose displaying hourly winds between 01 January November 2017 is shown in Figure 4-11 together with its associated wind frequency distribution. Winds recorded at Nuchek exhibit a predominantly east direction with 65 percent of winds originating from either the east or east-northeast direction. The winds are lighter at Nuchek with 84 percent of the wind speeds recorded being less than 8 m/s. Nuchek station experiences little northerly winds, undoubtedly because of its sheltered location. 5.0 MEASURED EXTREME WEATHER EVENTS The closure conditions as defined by Alyeska Pipeline Service Company in their VERP prohibit the transit of laden oil tankers out of Prince William Sound when winds exceed 45 knots (23.15 m/s) or wave height exceeds 15 feet (4.57 m) at the Seal Rocks buoy (46061). This closure condition is the threshold defining the largest event during which an escort vessel could safely rescue a disabled tanker. A closure condition can be triggered by either: 1) a wave height exceedance (greater than 4.57 m or 15 feet); 2) a wind speed exceedance (greater than m/s or 45 knots); or 3) both at the same time. Within this report these types of closure conditions are referred to as waveonly, wind-only, or wind and wave induced closure conditions. Vessels are not permitted to enter or exit Prince William Sound when a closure condition event is present. The highest risk transit is therefore experienced by a vessel during conditions at or near those defined by the closure condition. The next sections discuss the weather conditions that should be treated as extreme weather events since they pose a danger to transiting vessels. Observed and modelled wave data are typically averaged over time periods of one hour and hence might not capture the magnitude of a peak instantaneous event that could endanger a vessel (e.g., a rogue wave). The closure condition might therefore need to be redefined to take these factors into account. Lilly (1983) discusses the computation of a range of wave heights that could be expected in deep waters as a function of the significant wave height and his results are summarized in Table 5-1 below. A rogue wave would, in this context, be defined as one in 300,000 waves (U.S. Coast Pilot 9). This implies that a significant wave height of 15 feet (4.57m) could potentially cause a rogue wave of wave height 37.5 feet (11.4 m) if the water depth supports it. Table 5-1: Wave Height Calculations from Significant Wave Height (SWH) Other Wave Height Calculations as a function of SWH Most frequent wave heights Average wave heights Significant wave height (average height of highest 33 percent) Height of highest 10 percent of waves One wave in 1,175 waves 0.5xSWH 0.6xSWH 1.0xSWH 1.3xSWH 1.9xSWH One wave in 300,000 waves 2.5xSWH Wave steepness should also play a role in the determination of a closure event. A steep wave presents more danger to a vessel than a high wave with a milder slope (U.S. Coast Pilot 9). Steep waves form at the beginning of a storm HinchinbrookInterimReport2_final-BT 6
89 HINCHINBROOK ENTRANCE WIND WAVE EXTREMES 704-TRN.WTRM03050 SEPTEMBER 18, 2018 ISSUED FOR USE when wind speeds pick up. Table 5-2 summarizes a list of vessel lengths with the associated wave heights and periods that could put a vessel of that size in danger (U.S. Coast Pilot 9). The steepness of a wave can be amplified when tidal currents oppose wind direction (U.S. Coast Pilot 9). Table 5-2: List of Vessel Sizes and Wave Characteristics That Could Potentially Endanger Them Size of Vessel Wave Height Period < 100 feet (31 m) > 5 feet (1.5 m) < 6 s feet (31 61 m) > 10 feet (3 m) 6-10 s >200 feet (61 m) 20 feet (6.1 m) - Numerous types of weather conditions may cause hazards to a transiting vessel including capsizing or rolling motions. A vessel s individual properties such as its stability, geometry, and size determine its susceptibility to a particular adverse weather condition. Certain combinations of wave length and wave height are considered to lead to conditions that endanger a vessel s safety (IMO, 2007). In the following sections, the occurrence and characterization of closure conditions are summarized with the following data products: Typical duration and number of closures per period (e.g., month, season, year); Closure condition probability per period; and Hours of impeded shipping based on an estimated vessel transit time between the Port of Valdez and Hinchinbrook Entrance of seven hours. 5.1 MEASURED CLOSURE CONDITION PROPERTIES At Hinchinbrook Entrance, a closure condition is defined as winds in excess of 45 knots (23.15 m/s) or wave heights in excess of 15 feet (4.57 m) at the Seal Rocks buoy (46061). The closure condition data provided to Tetra Tech via correspondence (Quintero, 2017) is shown in Table 5-3. The number of closure conditions and durations provided to Tetra Tech differ from the number of closure conditions and their durations as determined through observations at Seal Rocks. However, without more detailed information on the exact timing of the closures and the procedure for determining them (e.g., is a closure condition only declared if a vessel is in transit) it is difficult to speculate on the causes of this difference. 7
90 HINCHINBROOK ENTRANCE WIND WAVE EXTREMES FILE: 704-TRN.WTRM03050 SEPTEMBER 18, 2018 ISSUED FOR USE 4-2 Attachment Table 5-3: Closure Data at Hinchinbrook Entrance Number of Closures Total Hours of Closures Average Duration Per Closure (Hours) Reported (Quintero) Observed (Seal Rocks Buoy) Reported (Quintero) Observed (Seal Rocks Buoy) Reported (Quintero) Observed (Seal Rocks Buoy) Wind Speed m/s m/s Wind Direction o Average Observed Magnitude of Event Wave Height 5.36 m 5.31 m Wave Direction o 133 o Dominant Wave Period 12.3 s 11.7 s Wind Speed 23.5 m/s 23 m/s Wind Direction 188 o 333 o Maximum Observed Magnitude of Event Wave Height 7.38 m 6.57 m Wave Direction 244 o 192 o Dominant Wave Period 16 s 16 s Table 5-4 lists the number of events exceeding the closure condition threshold of either wind-only, wave-only, and wind and wave combined together with their average durations according to sensor observations between the years Table 5-5 lists the number of closure events per annum at Seal Rocks station (46061) on a monthly basis. Based on data observed at the Seal Rocks buoy between 2010 and 2017, February is the month that experiences the highest number of closure events per year with events of peak duration averaging around 8.2 hours. November to February have the largest number of closures events. July and August had no closure event conditions recorded between 2010 and Events that trigger a closure condition tend to be similar, consisting of predominantly easterly and south-easterly winds. Table 5-6 and Table 5-7 display the mean significant wave height and mean wind speed for each station when a closure condition is triggered by wave or wind observations at the Seal Rocks buoy. HinchinbrookInterimReport2_final-BT 8
91 HINCHINBROOK ENTRANCE WIND WAVE EXTREMES 704-TRN.WTRM03050 SEPTEMBER 18, 2018 ISSUED FOR USE The typical closure condition is described as follows: Between 2010 and 2017, wind-induced closure events were observed 12 times, whilst wave-induced closure events were observed 120 times. Closure condition events triggered by both wind and waves occurred a total of 11 times between 2010 and 2017 when data was available for both wind speeds and wave heights (total of 83 months or 93 percent of the record length). Closure conditions triggered by both wind and wave exceedance occurred one to three times per year during the available record with a further 10 to 26 (neglecting 2013 due to equipment failure) exceedances per year associated with waves-only and a further one to three closures per year due to winds-only. The direction of the peak wind speed associated with a closure condition ranges from 82 to 108 degrees with a mean direction of 96 degrees (easterly). The peak wind speeds associated with a closure condition range from 45.1 knots (23.2 m/s) to 53.1 knots (27.3 m/s) with an average peak wind speed of 47.0 knots (24.2 m/s). The mean duration of a wind-induced closure condition is 1.9 hours and is much lower than the duration of wave induced closure durations. Over the entire period of record, Seal Rocks buoy experiences wind speeds higher than the other buoys (ranging from 1 to 136 percent higher) when there are either wave- or wind-induced closure conditions recorded at Seal Rocks (refer to Table 5-8). The wave direction associated with the peak of a closure condition ranges from 83 to 180 degrees with a mean incident wave direction of 128 degrees (from the southeast). A single closure condition with an incident wave angle of 56 degrees (i.e., from Hinchinbrook Island) was recorded, however this direction measurement is suspect and has been left out of this analysis. The average significant wave height associated with a closure condition is 17.4 feet (5.3 m), and the overall maximum recorded wave height during a closure condition is 26.9 feet (8.2 m). The mean duration of a wave induced closure condition is 6.1 hours. The averaging does not include the year 2013 due to a lack of recorded wave data. Wave induced closure conditions typically have a peak duration ranging from four to seven hours. Although winds at Seal Rocks buoy are generally higher than at other buoys during both wave-induced and wind-induced conditions, the mean significant wave heights recorded at the Seal Rocks buoy are in general lower (ranging from 10 to 16.5 percent lower) than those recorded at the other buoys during closure conditions, suggesting that using Seal Rocks data to select closure conditions may miss some closure conditions, or that the Seal Rocks buoy wave data should be scaled. The exception is for wind-induced events where recorded mean significant wave heights at Seal Rocks are slightly (2 percent) higher than at Cape Cleare over the entire period of record (refer to Table 5-8). 9
92 HINCHINBROOK ENTRANCE WIND WAVE EXTREMES FILE: 704-TRN.WTRM03050 SEPTEMBER 18, 2018 ISSUED FOR USE 4-2 Attachment Table 5-4: Closure Events Data at Seal Rocks Station (46061) on an Annual Basis Year Wind Closures Average Wind Closure Duration (Hours) Wave Closures Average Wave Closure Duration (Hours) Wind and Wave Closures Table 5-5: Closure Events Data at Seal Rocks Station (46061) on a Monthly Basis Month Average Number of Closures per Month Average Duration (hours) Closure Condition Probability (%) January February March April May June July August September October November December Table 5-6: Average Magnitude of Observations at All Stations for Wave-Induced Closure Conditions at Seal Rocks Parameter Seal Rocks Cape Cleare Cape Suckling Nuchek Wave Height (m) Wave Height (feet) Wind Speed (m/s) Wind Speed (knots) HinchinbrookInterimReport2_final-BT 10
93 HINCHINBROOK ENTRANCE WIND WAVE EXTREMES 704-TRN.WTRM03050 SEPTEMBER 18, 2018 ISSUED FOR USE Table 5-7: Average Magnitude of Observations at All Stations for Wind-Induced Closure Conditions at Seal Rocks Parameter Seal Rocks Cape Cleare Cape Suckling Nuchek Wave Height (m) Wave Height (feet) Wind Speed (m/s) Wind Speed (knots) Table 5-8: Percent Difference Between Seal Rocks and Neighboring Stations During Closure Conditions Closure Type Parameter Cape Cleare Cape Suckling Nuchek Wave-Induced Wind-Induced Wave Height -10% -16.5% N/A Wind Speed +32% +1% +65% Wave Height +2% -16% N/A Wind Speed +102% +20% +136% 5.2 WIND AND WAVE EXTREME VALUE ANALYSIS It is standard practice to characterize wind speeds and wave heights by their return period, where the return period is an estimate of the likelihood of a given wind speed or wave height occurrence. Return periods are most commonly given as an expected frequency such as a 1 in 100 year event. This does not mean that a 100 year event will occur on time in 100 years, but that the probability of this event s occurrence in any given year is 1/100 or 1 percent. Therefore, it is possible for a 100 year event to never occur (36.8 percent probability), occur at least once (63.2 percent probability), or occur at least twice (0.2 percent probability) over the span of 100 years. The severity of a given return period event (e.g., 1 in 100 years) is generally determined from measured data at or near the location of interest. In this way, the severity of measured past events is used to extrapolate the potential severity of future events. Standard practice is to assign the largest recorded event in the period of record a return period equal to the period of record (e.g., the largest event in a five year record is assigned a five year return period). Smaller events in the period of record are assigned smaller return periods (e.g., the second largest event in a five year record is assigned a four year return period) until each of the years in the record has an assigned event (e.g. five events for a five year record). Several extreme event probability distributions are then fit to the recorded events. The distribution with the highest coefficient of determination (r 2 ) value is chosen as most representative of the extreme value distribution at the site and, hence, the best predictor of the magnitude of wind and/or waves associated with a given return period. Table 5-9 shows the projected extreme wind speeds together with their return periods for each of the buoy stations. Higher intensity winds at Seal Rocks and Cape Suckling are generally easterly, while at Cape Cleare extreme winds are predominantly north-easterly and easterly. The 200 year return period winds at Seal Rocks reach speeds of 61.2 knots (31.5 m/s), compared to 47.4 knots (24.4 m/s) at Cape Cleare, and 60.8 knots (31.3 m/s) at Cape Suckling. Figure 5-1, Figure 5-2, and Figure 5-3 plot wind speed versus return period at Seal Rocks, Cape Cleare, and Cape Suckling, respectively, for five potential theoretical distributions appropriate for wind and wave extreme value analysis. Extreme wave analysis was not included in this study as both wave height and direction are required and at the time of reporting there is insufficient data for wave direction. An attempt will be made to retrieve more data in order to provide a more complete analysis. 11
94 HINCHINBROOK ENTRANCE WIND WAVE EXTREMES FILE: 704-TRN.WTRM03050 SEPTEMBER 18, 2018 ISSUED FOR USE 4-2 Attachment Table 5-9: Extreme Wind Analysis for All the Stations Return Period Wind Speed (m/s) Wind Speed (knots) Seal Rocks Cape Cleare Cape Suckling Seal Rock Cape Cleare Cape Suckling MODELLED DATA It is understood that the Port of Valdez and vessel operators currently use near real time wind and wave data recorded by the measurement buoy at Seal Rocks to determine if a closure condition exists. This measurement buoy is, however, positioned directly in the lee of Seal Rocks and therefore likely under-predicts wave conditions experienced by vessels transiting Hinchinbrook Entrance. Further discussion on this matter can be found later on in this report. Similarly, it is widely reported that buoys similar to Seal Rocks may under report wind speeds particularly during high wave events due to sheltering, knockdown, and their relatively low anemometer height. Therefore, it is possible that, despite the efforts of terminal and vessel operators, vessels are still transiting Hinchinbrook Entrance during wind and wave conditions that exceed the stated closure conditions. As well, near real time data cannot be used to reliably predict conditions several hours into the future, such as is required to estimate conditions at Hinchinbrook Entrance for a vessel now departing Valdez. Numerical models offer the opportunity to remove the above shortcomings of buoy data to define closure conditions, provided the model(s) are sufficiently accurate. As well, models offer a predictive capability, which may be useful in managing vessel transits of Hinchinbrook Entrance. Section 6 explores the capabilities of various models with respect to simulating winds and waves in the study area. Additionally, Tetra Tech has implemented a wave model (Simulating Waves Nearshore or SWAN) for the study area and its capabilities are examined as a possible predictive tool. Available Model Data Sets There are a number of modelled datasets available on the Alaska Ocean Observing System s (AOOS) Gulf of Alaska Data Integration Portal (AOOS.org). These datasets are used in this report for two purposes: 1) to understand the current ability to simulate closure conditions at Seal Rocks and 2) to calibrate and validate Tetra Tech s numerical wave model. There are three models that have output available online that are suitable for determining closure events. The models together with their characteristics and available output variables are summarized in Table 6-1. The variables that are used for this analysis are emphasized using a bold font. Although the Regional Ocean Modeling System (ROMS) model simulated data is also available to download, it does not include the wave height or wind speed variables and therefore could not been used as part of this analysis. The three available models within the region of interest are listed below: NWS National Digital Forecast Database (NDFD) WAVEWATCH III SWAN The grids of the models can be seen in Figures 6.0-1, 6.0-2, and The lower resolution WAVEWATCH III grid is represented in Figure 6.0-1, the higher resolution NDFD grid is represented in Figure 6.0-2, whilst the SWAN model (available on the AOOS data portal) with even higher resolution is represented in Figure The maps HinchinbrookInterimReport2_final-BT 12
95 HINCHINBROOK ENTRANCE WIND WAVE EXTREMES 704-TRN.WTRM03050 SEPTEMBER 18, 2018 ISSUED FOR USE also display the geographical locations of the four buoys and the two meteorological stations used as part of this analysis, together with the locations of the two points of interest specified in the RFP labelled Point 1 and Point 2. Table 6-1: Model Characteristics from the AOOS Portal with Data Available in the Geographical Region of Interest Characteristics Model Details Variables Available Model Institutional Affiliation Period of Record Resolution Model Institutional Affiliation Period of Record Resolution Model Institutional Affiliation Period of Record Resolution NWS NDFD National Weather Service, NOAA 25 Jan Aug km WAVEWATCH III NOAA, NCEP 03 Feb Sept km x 18.5 km SWAN Texas A&M University 16 Dec Sept km Apparent Temperature at Surface Dew Point Temperature at Surface Maximum Temperature Minimum Temperature Relative Humidity at Surface Significant Height of Wind Waves at Surface Temperature at Surface Total Cloud Cover at Surface Total Precipitation Accumulation at Surface Total Snowfall Accumulation at Surface Wind at Surface Wind Speed Gust at Surface Direction of Swell Waves Primary Wave Direction Primary Wave Period Significant Swell Wave Height Significant Wave Height Combined Wind and Swell Waves Significant Wind Wave Height Swell Wave Period Wind (Speed and Direction) Wind Wave Direction Wind Wave Period Peak Wave Periods Significant Wave Heights Stokes Drift Directions As part of the analysis, statistics are computed to verify the accuracy of the forecasts compared to observed data. The statistics used in this report to quantify the forecast accuracy are the root mean square error (RMSE), the bias, and the skill. The RMSE is defined as the average magnitude of the forecast error and is calculated by the following equation where N is the total number of forecast to observation pairs. RMSE is always positive and has the units of the variable under consideration. Zero represents a perfect forecast. 13
96 HINCHINBROOK ENTRANCE WIND WAVE EXTREMES FILE: 704-TRN.WTRM03050 SEPTEMBER 18, 2018 ISSUED FOR USE 4-2 Attachment The bias is defined by the following equation: NN RRRRRRRR = 1 NN (FFFFFFFFFFFFFFFF ii OOOOFFFFFFOOFFFFOOFFOO ii ) 2 ii=1 NN BBOOFFFF = 1 NN FFFFFFFFFFFFFFFF ii 1 OOOOFFFFFFOOFFFFOOFFOO ii ii=1 Therefore, a bias of zero means a perfect forecast, a positive bias represents a forecast that is greater than observation, and a negative bias represents a forecast that is lower than observation. A bias of 0.25 therefore represents a forecast that is 25 percent higher than the associated observations. A bias of represents a forecast that is under-simulated by 25 percent. The model skill is defined by the following equation where FFOOFFFFFFOOFFFFOOFFOO is the mean of the observation: ffffffffffffffff FFOOFFFFFFOOFFFFOOFFOO 2 RRSSOOSSSS =1 ffffffffffffffff FFOOFFFFFFOOFFFFooFFOO + FFOOFFFFFFOOFFFFOOFFOO FFOOFFFFFFOOFFFFooFFOO 2 The skill is another quantitative description of the similarity between forecast and observation. A skill of value one represents a perfect forecast whilst a forecast which is totally dissimilar to observation will have a skill of value zero. 6.1 CHARACTERIZATION OF WAVEWATCH III HINDCASTS WAVEWATCH III is a third generation numerical wave model (Tolman, 1997; Tolman, 1999a; Tolman 2009). It was developed by NOAA/National Center for Environmental Prediction (NCEP) as an improved version of Delft University of Technology s WAVEWATCH model (Tolman, 1989; Tolman, 1991a) and NASA s WAVEWATCH II (Tolman, 1992). The improvements in WAVEWATCH III include changes in the governing equations, numerical methods, and parameterization schemes. WAVEWATCH III uses the implicit assumption that the medium and wave field vary on time and space scales much larger than the variation scales of one wave, to solve the random phase spectral action density balance equation for the wavenumber-direction spectra (Tolman, 2009). WAVEWATCH III equations account for refraction and straining of the wave field caused by time and space variations in water depths and currents (Tolman, 2009). The physical parameterizations account for wave growth and decay, nonlinear resonant interactions, dissipation, bottom friction, surf-breaking, and scattering caused by wave-bottom interactions (Tolman, 2009). The WAVEWATCH III output variables available through the AOOS portal that are essential to this analysis are the wind speed, wind direction, wave period, wave direction, and significant wave height. WAVEWATCH III reports three types of wave period, wave direction, and significant wave height. Their full variable names and definitions are presented in Table 6-2 below. The different WAVEWATCH III variables for each of the three wave parameters together with the buoy variables are displayed in Figure In Figure 6.1-1, the solid lines are WAVEWATCH III output whilst the dashed lines are buoy observation variables. HinchinbrookInterimReport2_final-BT 14
97 HINCHINBROOK ENTRANCE WIND WAVE EXTREMES 704-TRN.WTRM03050 SEPTEMBER 18, 2018 ISSUED FOR USE Table 6-2: WAVEWATCH III Wave Output Variables Parameter WAVEWATCH III Variable WAVEWATCH III Variable Definition Significant Wave Height Wave Direction Wave Period Significant Height of Combined Wind and Swell Waves Significant Height of Swell Waves Significant Height of Wind Waves Direction of Primary Waves Direction of Swell Waves Direction of Wind Waves Mean Period of Primary Waves Mean Period of Swell Waves Mean Period of Wind Waves Average trough to crest height of the 1/3 highest waves both wind generated and swell waves Average trough to crest height of the 1/3 highest swell waves Average trough to crest height of the 1/3 highest wind-generated waves Mean direction of waves from the dominant wave system Mean direction of swell waves Mean direction of all wind generated waves Period between the waves from the dominant wave system Period between the swell-generated waves Period between the wind-generated waves Figure plots the various wave parameters for the period from 01 January 2016 to 31 March 2016, and enables selection of the appropriate WAVEWATCH III variables to be considered for data analysis. The WAVEWATCH III outputs for significant height of combined wind and swell waves and the significant height of wind waves alone are very close in value with the combined height being slightly higher some of the time. The significant height of combined wind and swell waves agrees very well with Seal Rocks observations and will therefore be considered as the WAVEWATCH III significant wave height output throughout the rest of the report. WAVEWATCH III primary wave period is in good agreement with the dominant wave period recorded at the Seal Rocks buoy and therefore will be taken into consideration throughout the rest of the report. WAVEWATCH III output is available from 04 February 2011 until 04 September A timeseries comparison between each of the parameters and the buoy observations for the month of January 2016 is presented in Figures 6.1-2, 6.1-3, 6.1-4, and The timeseries plots represent a one-month sample for Seal Rocks, Cape Cleare, Cape Suckling, and West Orca Bay respectively. The WAVEWATCH III data is available every three hours, whereas the buoy data is available hourly. The WAVEWATCH III output variables are represented in black, whereas the buoy parameters are represented in dark blue. The grey lines in the wind speed and wave height panels represent that parameter s respective closure condition. WAVEWATCH III demonstrates reasonably good accuracy in simulating wind and wave conditions in comparison to buoy recordings. WAVEWATCH III is therefore a potentially good source for boundary conditions within the numerical wave model set up by Tetra Tech. The remainder of this section quantifies the WAVEWATCH III accuracy. Table 6-3 summarizes the computed statistics for the WAVEWATCH III hindcast in comparison to observation. WAVEWATCH III forecasted wave heights are higher than observations at Seal Rocks approximately 18.6 percent of the time. 15
98 HINCHINBROOK ENTRANCE WIND WAVE EXTREMES FILE: 704-TRN.WTRM03050 SEPTEMBER 18, 2018 ISSUED FOR USE 4-2 Attachment Table 6-3: WAVEWATCH III Bias and RMSE for Wind Speed and Wave Height at Different Stations Over the Entire Available Date Record Location Wind Speed Wave Height Wave Period Bias RMSE (m/s) Skill Bias RMSE (m) Skill Bias RMSE (s) Skill Seal Rocks Cape Cleare Cape Suckling West Orca Bay Statistics are also computed for the wind speed, wave height, and wave period parameters for all instances where wave height exceeded 3 m (9.84 feet). The RMSE and bias values for these scenarios occurring throughout the period of data availability are displayed in Table 6-4 below. For waves larger than 3 m (9.84 feet) forecasts are 22 percent higher than observations at Seal Rocks. Table 6-4: WAVEWATCH III Bias and RMSE for Wind Speed and Wave Height at Different Stations for Wave Heights Over 3 m (9.84 feet) Throughout the Entire Available Date Record Location Wind Speed Wave Height Wave Period Bias RMSE (m/s) Skill Bias RMSE (m) Skill Bias RMSE (s) Skill Seal Rocks Cape Cleare Cape Suckling West Orca Bay WAVEWATCH III Behaviour at Seal Rocks Station (46061) Figure displays a timeseries comparing the wind speed and direction, together with the wave height, direction, and period of WAVEWATCH III and Seal Rocks Buoy observations. WAVEWATCH III manages to accurately simulate the observations recorded at Seal Rocks, although detailed statistical analysis would be required in order to determine its reliability for forecasting closures Winds at Seal Rocks A wind rose displaying data simulated by the WAVEWATCH III model at Seal Rocks station (46061) for the entire available record between 04 February September 2017 with a temporal resolution of three hours is shown in Figure and can be compared to the observed wind rose at Seal Rocks shown in Figure 4-3. HinchinbrookInterimReport2_final-BT 16
99 HINCHINBROOK ENTRANCE WIND WAVE EXTREMES 704-TRN.WTRM03050 SEPTEMBER 18, 2018 ISSUED FOR USE The performance of the WAVEWATCH III model in simulating winds at Seal Rocks can be summarized as follows: WAVEWATCH III winds originate predominantly from the east and east-southeast directions. WAVEWATCH III captures the northerly gap wind, however it is less pronounced (in terms of frequency) than the observed winds. At the Seal Rocks location, the WAVEWATCH III overall mean wind speed is 11.9 knots (6.14 m/s), the maximum wind speed is 51.0 knots (26.26 m/s), and the mean of wind speeds above the closure condition is 46.9 knots (24.12 m/s). Over the available record, WAVEWATCH III wind speeds at the Seal Rocks location are generally higher than those observed and are summarized in Table 6-3 and Table Waves at Seal Rocks Waves simulated by the WAVEWATCH III model predominantly propagate from the southeast. WAVEWATCH III simulated waves are displayed in a wave rose in Figure and can be compared to the observed wave rose at Seal Rocks shown in Figure 4-4. The model dataset is available between 04 February September 2017 at three hour intervals. The maximum significant wave height simulated by WAVEWATCH III at Seal Rocks is 26.7 feet (8.13 m). The performance of the WAVEWATCH III model with respect to simulating waves over the available period of record at the Seal Rocks station is outlined below: WAVEWATCH III captures the magnitude and directionality of waves. WAVEWATCH III simulates wave heights 18.6 percent higher than those observed at Seal Rocks Buoy station (46061). WAVEWATCH III demonstrates ability to simulate wave heights at Seal Rocks. 28 percent of WAVEWATCH III waves propagate from the south with 88 percent of simulated waves not exceeding 3 m in wave height. WAVEWATCH III simulated maximum wave height is 26.7 feet (8.13 m), mean significant closure conditioninducing wave height is 17.3 feet (5.27 m) and overall mean wave height is 5.6 feet (1.7 m) WAVEWATCH III Behaviour at Cape Cleare Station (46076) Figure displays a timeseries comparing the wind speed and direction, together with the wave height, direction, and period of WAVEWATCH III and Cape Cleare Buoy observations. WAVEWATCH III manages to accurately simulate the observations recorded at Cape Cleare Winds at Cape Cleare A wind rose displaying data simulated by the WAVEWATCH III model at Cape Cleare station (46076) for the entire available record between 04 February September 2017 with a temporal resolution of three hours is shown in Figure and can be compared to the observed wind rose at Cape Cleare shown in Figure 4-5. The performance of the WAVEWATCH III model in simulating winds at Cape Cleare can be summarized as follows: WAVEWATCH III winds at Cape Cleare originate predominantly from an easterly direction. WAVEWATCH III winds have higher directional variability at Cape Cleare than at Seal Rocks. 17
100 HINCHINBROOK ENTRANCE WIND WAVE EXTREMES FILE: 704-TRN.WTRM03050 SEPTEMBER 18, 2018 ISSUED FOR USE 4-2 Attachment WAVEWATCH III maximum simulated wind speed is 52.3 knots (26.9 m/s) and mean wind speed is 13.0 knots (6.7 m/s). The predominant wind directions simulated by WAVEWATCH III at Cape Cleare are 11 percent from the east and 10 percent each from the east-northeast and northeast with 68 percent of wind speeds forecasted to be lower than 15.6 knots (8 m/s). WAVEWATCH III wind speeds at Cape Cleare are generally higher than recorded observations, as can be seen summarized in Table 6-3 and Table Waves at Cape Cleare The WAVEWATCH III model simulates waves at Cape Cleare predominantly propagating from a southerly direction. WAVEWATCH III simulated waves are displayed in a wave rose in Figure and can be compared to the observed wave rose at Cape Cleare shown in Figure 4-6. The model dataset is available between 04 February September 2017 at three hour intervals. The performance of the WAVEWATCH III model in simulating waves over the available period of record at Cape Cleare station is outlined below: WAVEWATCH III simulates wave heights higher than those observed at Cape Cleare Station as summarized in Table 6-3 and Table 6-4. WAVEWATCH III simulated maximum significant wave height is 28.0 feet (8.53 m) and mean significant wave height is 6.3 feet (1.93 m) at Cape Cleare station. 26 percent of WAVEWATCH III waves propagate from the south-southwest with 84 percent of waves not exceeding 9.8 feet (3 m) in wave height WAVEWATCH III Behaviour at Cape Suckling Station (46082) Figure displays a timeseries comparing the wind speed and direction, together with the wave height and direction of WAVEWATCH III and Cape Suckling Buoy observations. WAVEWATCH III accurately simulates these parameters at Cape Suckling Winds at Cape Suckling A wind rose displaying data simulated by the WAVEWATCH III model at Cape Suckling station (46082) for the entire available record between 04 February September 2017 with a temporal resolution of three hours is shown in Figure and can be compared to the observed wind rose at Cape Suckling Rocks shown in Figure 4-7. The performance of the WAVEWATCH III model in simulating winds at Cape Suckling can be summarized as follows: WAVEWATCH III winds originate predominantly from the east-southeast, with 69 percent of wind speeds forecasted to be lower than 8 m/s. WAVEWATCH III maximum simulated wind speed is 26.6 m/s and mean simulated wind speed is 6.6 m/s. WAVEWATCH III simulates that are generally higher than observations recorded at Cape Suckling station (46082) as can be seen summarized in Table 6-3 and Table Waves at Cape Suckling The WAVEWATCH III model simulates waves at Cape Suckling originating predominantly from the southwest. WAVEWATCH III simulated waves are displayed in a wave rose in Figure and can be compared to the HinchinbrookInterimReport2_final-BT 18
101 HINCHINBROOK ENTRANCE WIND WAVE EXTREMES 704-TRN.WTRM03050 SEPTEMBER 18, 2018 ISSUED FOR USE observed wave rose at Cape Suckling shown in Figure 4-8. The model dataset is available between 04 February September 2017 at three hour intervals. The performance of the WAVEWATCH III model in simulating waves over the available period of record at Cape Suckling station is outlined below: WAVEWATCH III captures the magnitude and directionality of waves at Cape Suckling. WAVEWATCH III simulates wave heights lower than observations recorded at Cape Suckling Station as can be seen summarized in Table 6-3 and Table 6-4. WAVEWATCH III simulated maximum significant wave height is 26.9 feet (8.21 m) and mean significant wave height is 6.9 feet (2.09 m) at Cape Suckling station. 26 percent of WAVEWATCH III waves propagate from the southwest with 81 percent of waves not exceeding a wave height of 9.8 feet (3 m) WAVEWATCH III Behaviour at West Orca Bay Station (46060) Figure displays a timeseries comparing the wind speed and direction, together with the wave height and direction of WAVEWATCH III and West Orca Bay Buoy observations. WAVEWATCH III somewhat manages to reproduce the observations recorded at West Orca Bay Winds at West Orca Bay A wind rose displaying data simulated by the WAVEWATCH III model at West Orca Bay station (46082) for the entire available record between 04 February September 2017 with a temporal resolution of three hours is shown in Figure and can be compared to the observed wind rose at West Orca Bay shown in Figure 4-9. The performance of the WAVEWATCH III model in simulating winds at West Orca Bay Buoy can be summarized as follows: WAVEWATCH III simulations capture the northerly gap winds at this location. WAVEWATCH III maximum simulated wind speed is 37.5 knots (19.3 m/s) and mean simulated wind speed is 8.6 knots (4.4 m/s) at this location. 14 percent of WAVEWATCH III winds originate from the east with 88 percent of wind speeds forecasted to be lower than 15.6 knots (8 m/s). Over the entire available record WAVEWATCH III simulates wind speeds higher than those recorded at West Orca Bay buoy as can be seen summarized in Table 6-3 and Table Waves at West Orca Bay WAVEWATCH III waves at West Orca Bay propagate predominantly from the south. WAVEWATCH III simulated waves are displayed in a wave rose in Figure and can be compared to the observed wave rose at West Orca Bay shown in Figure The model dataset is available between 04 February September 2017 at three hour intervals. The performance of the WAVEWATCH III model in simulating waves over the available period of record at West Orca Bay buoy station is outlined below: WAVEWATCH III waves are not fully replicating the variability in directionality as the waves recorded at West Orca Bay buoy (Figure 4-10). 19
102 HINCHINBROOK ENTRANCE WIND WAVE EXTREMES FILE: 704-TRN.WTRM03050 SEPTEMBER 18, 2018 ISSUED FOR USE 4-2 Attachment WAVEWATCH III simulates wave heights lower than observations recorded at Cape Suckling station summarized in Table 6-3 and Table 6-4. WAVEWATCH III simulated maximum significant wave height is 8.5 feet (2.6 m) and mean significant wave height is 1.6 feet (0.5 m) at West Orca Bay buoy. 84 percent of WAVEWATCH III waves propagate from the south with 100 percent of the waves not exceeding 9.8 feet (3 m) in wave height WAVEWATCH III Behaviour at Nuchek Station (1074) Figure displays a timeseries comparing the wind speed and direction of WAVEWATCH III and Nuchek station recorded observations. WAVEWATCH III accurately simulates these parameters at Nuchek. A wind rose displaying data simulated by the WAVEWATCH III model at Nuchek station (1074) for the entire available record between 04 February September 2017 with a temporal resolution of three hours is shown in Figure and can be compared to the observed wind rose at Nuchek shown in Figure The performance of the WAVEWATCH III model in simulating winds at Nuchek can be summarized as follows: WAVEWATCH III manages to capture the winds experienced at Nuchek station. WAVEWATCH III simulates the northerly gap winds at this location. WAVEWATCH III maximum simulated wind speed is 45.5 knots (23.4 m/s) and mean simulated wind speed is 10.7 knots (5.5 m/s) at this location. 15 percent of WAVEWATCH III winds originate from the east southeast. The predominant wind direction simulated by WAVEWATCH III at Nuchek station is 14.6 percent from the east-southeast and 13 percent from the east with 78 percent of wind speeds forecasted to be lower than 15.6 knots (8 m/s). WAVEWATCH III simulates wind speeds higher than those recordings at Nuchek station as summarized in Table 6-3 and Table WAVEWATCH III Behaviour at Point of Interest 1 A wind rose displaying data simulated by the WAVEWATCH III model at Point of Interest 1 for the entire available record between 04 February September 2017 with a temporal resolution of three hours is shown in Figure together with its associated wind frequency distribution Winds at Point of Interest 1 The characterization of the WAVEWATCH III model winds simulated at Point of Interest 1 are summarized as follows: WAVEWATCH III simulates a predominantly east-southeasterly to easterly winds with gap winds originating from the north. WAVEWATCH III maximum simulated wind speed is 45.5 knots (23.4 m/s) and mean simulated wind speed is 10.7 knots (5.5 m/s) at this location. 15 percent of WAVEWATCH III winds originate from the east-southeast with 78 percent of winds not exceeding speeds of 15.6 knots (8 m/s). A wave rose displaying data simulated by the WAVEWATCH III model at Point of Interest 1 for the entire available record between 04 February September 2017 with a temporal resolution of three hours is shown in Figure together with its associated wave frequency distribution. HinchinbrookInterimReport2_final-BT 20
103 HINCHINBROOK ENTRANCE WIND WAVE EXTREMES 704-TRN.WTRM03050 SEPTEMBER 18, 2018 ISSUED FOR USE Waves at Point of Interest 1 The characterization of the WAVEWATCH III model waves simulated at Point of Interest 1 are summarized as follows: WAVEWATCH III simulates a predominantly southeasterly wave. WAVEWATCH III maximum simulated significant wave height is 16.6 feet (5.1 m) and mean simulated wave height is height is 3.7 feet (1.12 m) at this location. 43 percent of WAVEWATCH III waves propagate from the south with 97 percent of waves no exceeding a wave height of 9.8 feet (3m) WAVEWATCH III Behaviour at Point of Interest 2 A wind rose displaying data simulated by the WAVEWATCH III model at Point of Interest 2 for the entire available record between 04 February September 2017 with a temporal resolution of three hours is shown in Figure together with its associated wind frequency distribution Winds at Point of Interest 2 The characterization of the WAVEWATCH III model winds simulated at Point of Interest 2 are summarized as follows: WAVEWATCH III simulates a predominantly easterly to east-southeasterly winds. WAVEWATCH III maximum simulated wind speed is 50 knots (25.7 m/s) and mean simulated wind speed is 12.2 knots (6.3 m/s) at this location. 32 percent of WAVEWATCH III winds originate from the east and east-southeast with 72 percent of winds not exceeding 15.6 knots (8 m/s) Waves at Point of Interest 2 A wave rose displaying data simulated by the WAVEWATCH III model at Point of Interest 2 for the entire available record between 04 February September 2017 with a temporal resolution of three hours is shown in Figure together with its associated wave frequency distribution. The characterization of the WAVEWATCH III model waves simulated at Point of Interest 2 are summarized as follows: WAVEWATCH III simulates a predominantly south-southwesterly wave. WAVEWATCH III maximum simulated significant wave height is 26.0 feet (7.94 m) and mean simulated wave height is 59 feet (1.8 m) at this location. 29 percent of waves originate from the south-southwest with 87 percent of waves not exceeding 9.8 feet (3 m) in wave height Closure Conditions as Simulated by WAVEWATCH III at Seal Rocks Station The closure condition is defined as winds in excess of 45 knots (23.15 m/s) or wave heights in excess of 15 feet (4.57 m) at the Seal Rocks station (46061). This section describes the occurrence of closure when the parameters simulated by the WAVEWATCH III model exceed the thresholds. Closure situations can be triggered when either the wind speeds exceed their threshold (wind closures), wave heights exceed their threshold (wave closures), or both wind and wave exceed their respective closure condition at the same time. 21
104 HINCHINBROOK ENTRANCE WIND WAVE EXTREMES FILE: 704-TRN.WTRM03050 SEPTEMBER 18, 2018 ISSUED FOR USE 4-2 Attachment Table 6-5 lists the number of events that exceed the closure condition thresholds for wind, wave, and both as simulated by the WAVEWATCH III model at the Seal Rocks buoy location together with their average durations. WAVEWATCH III data is available for a period of 80 months (just over 6.5 years) from 04 February September 2017 with a three hour timestep. Table 6-5: WAVEWATCH III Simulated Closure Data at Seal Rocks Location on an Annual Basis Year Wind Closures Average Wind Closure Duration (Hours) Wave Closures Average Wave Closure Duration (Hours) Wind and Wave Closures Figure and Table 6-6 are the graphical and tabular representations respectively of the number of closure events occurring on a monthly basis. The blue bars in Figure represents the number of closure events as reported to Tetra Tech by Quintero (2017), refer to Table 5-3. The orange bars in Figure represent the closure events based on observed data. Table 6-6 displays a monthly breakdown of closure events that are simulated by WAVEWATCH III at the Seal Rocks buoy location. The months with highest numbers of closure events are November to February as simulated by WAVEWATCH III. Simulated average durations are always higher than average durations based on observed data. Table 6-6: Observed and Simulated Closure Events at Seal Rocks Buoy: a Monthly Breakdown WAVEWATCH III Seal Rocks Buoy Observations Month Average Number of Closures per Month Average Duration (hours) Monthly Closure Conditions as a Fraction of Annual Closures (%) Average Number of Closures per Month Average Duration (hours) Monthly Closure Conditions as a Fraction of Annual Closures (%) January February March April May June July August September October November December HinchinbrookInterimReport2_final-BT 22
105 HINCHINBROOK ENTRANCE WIND WAVE EXTREMES 704-TRN.WTRM03050 SEPTEMBER 18, 2018 ISSUED FOR USE Figure shows the WAVEWATCH III simulated and observed percentage of total annual closure conditions that occur in each month at Seal Rocks. Table 6-7 shows a summary of the reported, observed, and simulated number of closure events and total hours of closure for each available year. The reported values were provided via personal communication to Tetra Tech (Quintero, 2017). Figure shows a summary of the total hours of closure as reported to Tetra Tech (Quintero), observed by the Seal Rocks buoy, and simulated by WAVEWATCH III. Table 6-7: Summary of Reported, Observed, and Simulated Closures Year Number of Closures Total Hours of Closure Reported Observed Simulated Reported Observed Simulated Table 6-8 shows the average magnitude of significant wave heights and wind speeds as simulated by WAVEWATCH III compared to the observations made at the different stations. Table 6-8: Average Magnitude of WAVEWATCH III Simulated and Observed Closure Conditions WAVEWATCH III Observation Station Wave-Induced Wind-Induced Wave-Induced Wind-Induced Wave Height (m) Wind Speed (m/s) Wave Height (m) Wind Speed (m/s) Seal Rocks Cape Cleare Cape Suckling West Orca Bay Nuchek Point Point Table 6-9 summarizes the maximum magnitudes of significant wave heights and wind speeds as simulated by WAVEWATCH III in comparison to the observations made at the different stations. 23
106 HINCHINBROOK ENTRANCE WIND WAVE EXTREMES FILE: 704-TRN.WTRM03050 SEPTEMBER 18, 2018 ISSUED FOR USE 4-2 Attachment Table 6-9: Maximum Magnitude of WAVEWATCH III Simulated and Observed Closure Conditions Station WAVEWATCH III Observation Wave Height (m) Wind Speed (m/s) Wave Height (m) Wind Speed (m/s) Seal Rocks Cape Cleare Cape Suckling West Orca Bay Nuchek Point Point Figures through to graphically display the comparisons between simulation and observation of maximum significant wave height, maximum wind speed, mean closure significant wave height, and mean closure wind speed respectively. Wave-related closure conditions can be described as follows: At locations other than Seal Rocks, WAVEWATCH III under-estimates maximum significant wave heights leading to closure events by 12.3 percent on average (refer to Figure ). However, at Seal Rocks, the WAVEWATCH III simulated maximum significant wave height that leads to closure conditions is exactly equal to its corresponding observed value. The agreement between WAVEWATCH III and observations supports the hypothesis that Seal Rocks buoy under-reports wave conditions, at least compared to the more exposed buoys at Cape Cleare and Cape Suckling. Wind-related closure conditions can be described as follows: Figure shows the mean wind speeds in m/s during closure events simulated by WAVEWATCH versus observations at several stations. There is no observed data at points 1 and 2. Nuchek station wind speeds are under-recorded by a factor of 2.25 in comparison to WAVEWATCH III simulated data. WAVEWATCH III oversimulates wind speeds by 46.5 percent at all station locations other than Seal Rocks or 20.3 percent when comparing solely to data collected by the buoys and eliminating Nuchek station from the analysis. Again, at Seal Rocks buoy the WAVEWATCH III is almost equal to the observed wind speed. Buoys under-reporting winds during high wind events might be the contributing factor to the discrepancy between the forecasted and observed values. Figure shows the probability of a closure event occurring on a particular month based on data available between 04 February September Closure events are most likely to occur between November and February, with February being the highest according to recorded observations, and January being the highest according to WAVEWATCH III simulations. The months June to August have the least closure events with July and August having no recorded closure events between the years 2011 and Figure shows wind closure events and wave closure events together with their magnitudes. The axis on the left displays the wind speed in m/s and the axis on the right displays the wave height in m. Wind closure events which have been simulated by WAVEWATCH III are illustrated by blue circles, whilst wind closure events which were observed by the Seal Rocks buoy station are illustrated by red circles. WAVEWATCH III simulated wave closure events are represented by black circles, whilst wave closures recorded by Seal Rocks buoy station are represented by grey circles. The lines extending out of the circles depict the minimum and maximum extent of the closure event while the circle represents the average magnitude of that particular closure event. There are no simulated closure events prior to 04 February 2011 and after 04 September 2017 due to WAVEWATCH III modelled HinchinbrookInterimReport2_final-BT 24
107 HINCHINBROOK ENTRANCE WIND WAVE EXTREMES 704-TRN.WTRM03050 SEPTEMBER 18, 2018 ISSUED FOR USE datasets being unavailable. Figure also displays the discrepancy between the larger number of waveinduced closure events versus the lower number of wind-induced closure events. 6.2 CHARACTERIZATION OF NDFD HINDCASTS The NDFD is a collection of gridded forecasts for a number of weather variables. They are provided through a collaboration between the NWS of NOAA and the NCEP. The NDFD aims to create a seamless mosaic of several digital forecasts. The NDFD is made up of an experimental version which was taken over by the operational version in A list of NDFD variable outputs available on the AOOS portal can be found in Table 6-10 below. There are currently three variables which are useful in relation to this study: significant height of wind waves at surface, wind at surface, and wind speed gust at surface. The NDFD forecast temporal resolution varies between three and six hours. Table 6-10: List of NDFD Variable Outputs Available Through the AOOS Portal NDFD Variable Variable Definition Apparent Temperature at Surface Dew Point Temperature at Surface Perceived temperature ( o C) derived from ambient temperature, or temperature with wind chill or heat index Expected temperature to which air must be cooled to reach saturation ( o C) Maximum Temperature Maximum daytime temperature ( o C) Minimum Temperature Minimum overnight temperature ( o C) Relative Humidity at Surface Significant Height of Wind Waves at Surface Ratio of atmospheric moisture present relative to what is needed to saturate the air at forecast temperature Average height from trough to crest of the one third highest waves in 12 hour period (m) Temperature at Surface Temperature ( o C) Total Cloud Cover at Surface Ratio of opaque cloud cover Total Precipitation Accumulation at Surface Accumulation over one hour intervals (kg/m 2 ) Total Snowfall Accumulation at Surface Wind at Surface Wind Speed Gust at Surface Accumulation over six hour intervals (inches) Wind direction from which blowing (Meteorological Convention) and wind speed in m/s at surface level Maximum 3-second wind speed gust (m/s) within a 2-minute interval Figures to show timeseries of the NDFD forecasts for wind speed, direction, and wave height in comparison to the four NDBC buoys. The NDFD forecast is depicted in black whilst the buoy observational data is displayed in blue. The grey lines represent the current threshold definition of a closure condition. Figure shows a timeseries of the NDFD forecast for the two points of interest within Hinchinbrook Entrance. Wind roses for NDFD forecasts close to the four buoy stations are displayed in Figures to The wind roses show that NDFD is demonstrating capacity in forecasting wind magnitude together with its direction. The wind roses display the full extent of data availability. Wave roses could not be produced since wave direction is not an output of the NDFD dataset. RMSE statistics for the different parameters at the different stations for the entire period of record can be found in Table For larger waves (wave heights greater than 3 m or 9.8 feet) the computed statistics for the different 25
108 HINCHINBROOK ENTRANCE WIND WAVE EXTREMES FILE: 704-TRN.WTRM03050 SEPTEMBER 18, 2018 ISSUED FOR USE 4-2 Attachment parameters at the different stations are summarized in Table An explanation on the definitions of RMSE, bias, and skill is found in Section 6.0. Table 6-11: NDFD Bias and RMSE for Wind Speed and Wave Height at Buoy Locations Over the Entire Available Date Record Location Wind Speed Wave Height Bias RMSE (m/s) Skill Bias RMSE (m) Skill Seal Rocks Cape Cleare Cape Suckling West Orca Bay Table 6-12: NDFD Bias and RMSE for Wind Speed and Wave Height at Buoy Locations Over the Entire Available Date Record for Wave Heights Greater Than 3 m Location Wind Speed Wave Height Bias RMSE (m/s) Skill Bias RMSE (m) Skill Seal Rocks Cape Cleare Cape Suckling West Orca Bay The RMSE and bias values for WAVEWATCH III (as summarized in Tables 6-3 and 6-4) are better than the values calculated for NDFD. 6.3 CHARACTERIZATION OF AOOS PORTAL SWAN OUTPUT HINDCASTS The Texas A&M University was funded by AOOS to produce SWAN wave model forecasts. The SWAN numerical model was used to generate 36-hour forecasts with a three hour timestep. Wave forecasts were computed using wind fields generated by the Weather Research & Forecasting (WRF) model. SWAN output was validated against both satellite and buoy observations. The model was funded by AOOS between 17 December 2011 and 13 September 2013 after which the model was decommissioned. However, the output forecasts are still available through the AOOS portal for assessment purposes. There are three SWAN output parameters available through the AOOS portal, these are listed in Table The wave directions are defined on the AOOS portal as the mean direction travelled by a drifting object on the surface (i.e., the Stokes Drift direction). The significant wave height is defined on the portal as the mean height from trough to crest of the one third tallest waves that are simulated by HinchinbrookInterimReport2_final-BT 26
109 HINCHINBROOK ENTRANCE WIND WAVE EXTREMES 704-TRN.WTRM03050 SEPTEMBER 18, 2018 ISSUED FOR USE the SWAN model. The peak wave period is defined as the Peak Sea Surface Wave Period at Variance Spectral Density Maximum. Table 6-13: List of SWAN Variable Outputs Available Through the AOOS Portal SWAN Variable Variable Definition Wave Direction Wave Height Wave Period Stokes Drift Directions Sea Surface Wave Significant Height Peak Sea Surface Wave Period at Variance Spectral Density Maximum Figure to Figure show a sample of SWAN output available through the AOOS portal for Seal Rocks, Cape Cleare, Cape Suckling, and West Orca Bay stations respectively. The available SWAN data do not show the level of accuracy required and hence will not be considered for this analysis. 6.4 CHARACTERIZATION OF WRF HINDCASTS The WRF model is a next-generation numerical weather prediction (NWP) model designed for numerous applications and computational efficiency for both research and operational settings (Skamarock et al., 2008). WRF features multiple dynamical cores, fully compressible nonhydrostatic equations, application on local and global scales, two-way nesting capability, and a full up-to-date range of physics settings and parameterization schemes (Skamarock et al., 2008). The WRF model is the result of a collective endeavor between a collection of U.S. entities. The AOOS portal provides WRF model version 3.1 output datasets that have been produced by the Alaska Experimental Forecast Facility (AEFF) at the University of Alaska Anchorage. The dataset uses physics that simulates features such as flow over complex terrain and orography, atmosphere-ocean interactions, and surfaceinduced katabatic circulations. The WRF model was initialized using a 12 hourly North American Model (NAM) dataset. The AOOS portal states that the WRF model was run at a resolution of 3 kilometers (km) for the Prince William Sound area with a 12 hour timestep and a forecast length of 48 hours. The downloaded datasets however have a resolution of 4 km for the higher resolution domain 2, and 12 km for the lower resolution domain 1, and wind output at an hourly output. The model outputs are available between 16 November 2010 to 02 March 2013 and was not maintained due to lack of access to funds. However, the data is archived online through the AOOS portal. The WRF model variables that are available online are listed in Table 6-14 below. The variable which is relevant for this analysis is the wind which is defined as the vector components at 10 m altitude in m/s. Timeseries comparisons for WRF output from domain 1 (12 km resolution) and domain 2 (4 km resolution) in comparison to buoy station observations can be seen in Figure for Seal Rocks station, Figure for Cape Cleare, Figure for Cape Suckling, and Figure for West Orca Bay. Bias and RMSE statistics for wind speeds at the different buoy locations are displayed in Table 6-15 for the entire record. WRF simulated wind speeds for all winds range from 20.9 percent higher at Seal Rocks station to 87.5 percent higher at West Orca bay station. However, for winds greater than 15 m/s (29.2 knots), these biases change to 1.4 percent and 62.5 percent respectively. 27
110 HINCHINBROOK ENTRANCE WIND WAVE EXTREMES FILE: 704-TRN.WTRM03050 SEPTEMBER 18, 2018 ISSUED FOR USE 4-2 Attachment Table 6-14: List of WRF Variable Outputs Available Through the AOOS Portal WRF Variable Variable Definition Air Temperature at 2 m Air temperature at two meters above surface ( o C) Hourly Accumulated Precipitation Hourly Accumulated Snow and Ice Physical Snow Depth Hourly accumulated precipitation (inches) Hourly accumulated snow and ice (inches) Snow water equivalent divided by the density of snow (inches) Sea Surface Temperature Sea Surface Temperature ( o F) Snow Water Equivalent Theoretical depth of water if snowpack melted instantaneously (inches) Surface Skin Temperature Temperature of the surface ( o F) Wind Wind at 10 m (m/s) Table 6-15: WRF Bias and RMSE for Wind Speed at Buoy Locations Over the Entire Available Date Record Location Domain 1 Domain 2 Wind Speed Wind Speed Bias RMSE (m/s) Skill Bias RMSE (m/s) Skill Seal Rocks Cape Cleare Cape Suckling West Orca Bay HinchinbrookInterimReport2_final-BT 28
111 HINCHINBROOK ENTRANCE WIND WAVE EXTREMES 704-TRN.WTRM03050 SEPTEMBER 18, 2018 ISSUED FOR USE Table 6-16: WRF Bias and RMSE for Wind Speed at Buoy Locations Over the Entire Available Date Record for Wind Speeds Greater Than 15 m/s (29.2 knots) Location Domain 1 Domain 2 Wind Speed Wind Speed Bias RMSE (m/s) Skill Bias RMSE (m/s) Skill Seal Rocks Cape Cleare Cape Suckling West Orca Bay WRF performs well at simulating winds in the Gulf of Alaska, however the WRF winds output cannot be used as initial conditions into the numerical wave model set up by Tetra Tech since it is no longer operational and therefore has a limited period of record. WRF wind speed RMSEs are slightly higher than the corresponding WAVEWATCH III values (summarized in Tables 6-3 and 6-4). The biases for WRF wind speeds are similar at Seal Rocks and Cape Cleare, whereas at Cape Suckling and West Orca Bay the WRF wind speeds are greater than WAVEWATCH III winds. 6.5 SWAN SIMULATION OF WAVE CONDITIONS WITHIN HINCHINBROOK ENTRANCE Tetra Tech estimated wave conditions within the study domain using the SWAN numerical wave model. SWAN is used widely within the industry and research communities. This section describes the wave modelling approach Overview of SWAN Developed at Delft University of Technology, SWAN is a third-generation wave model that simulates random, shortcrested, wind-generated wave conditions in coastal regions. The SWAN model is established on the wave action balance equation which describes wave spatial propagation, refraction, shoaling, generation, dissipation, and nonlinear wave-wave interactions. SWAN accounts for a range of physical processes such as: Wave propagation in time and space, shoaling, refraction due to current and depth Wave generation by wind Whitecapping, bottom friction, and depth-induced wave breaking Three- and four-wave interactions Diffraction The latest version of SWAN was used at the time of reporting. The inputs necessary for SWAN include input data for bathymetry, wind, and currents. For this application SWAN was run in a steady state mode. The steady 29
112 HINCHINBROOK ENTRANCE WIND WAVE EXTREMES FILE: 704-TRN.WTRM03050 SEPTEMBER 18, 2018 ISSUED FOR USE 4-2 Attachment state mode makes the assumption that the wind speed is constant for long enough that fully-developed wave conditions will be present. The assumption of a steady state works when the wave can propagate throughout the domain within a single archival timestep. This is roughly the case for a wave traversing the domain defined within SWAN using a timestep of one hour. The following sections describe the SWAN setup, wind and current inputs, and wave boundary conditions SWAN Setup Wave conditions were simulated within Hinchinbrook Entrance using the 2D wave model SWAN. The wave model is set up in a nested configuration, with a 750 m lower resolution grid of the Gulf of Alaska area just outside Hinchinbrook Entrance and a 150 m higher resolution grid focused on Hinchinbrook Entrance. The SWAN nesting feature works by solving for wave conditions in the coarse grid. Computed coarse grid parameters are then passed on to the fine grid as boundary conditions. Figure displays the SWAN grid setup. The red markers on the figure represent the buoys and other meteorological stations. The two points of interest defined in the RFP are shown by blue markers. The WAVEWATCH III grid is represented by the lower resolution black lines. The SWAN 750 m lower resolution grid is illustrated by grey lines, while the higher resolution 150 m domain is illustrated in lighter blue. The yellow markers represent the points where boundary conditions were passed through to the SWAN coarse grid for each WAVEWATCH III grid cell along the boundary. The white markers represent the points where the coarse grid passes boundary conditions to the fine grid SWAN Input Data Datasets used as input to the SWAN wave model include: Bathymetry Wind Currents Input datasets required by the SWAN wave model include bathymetry of the region, winds, and currents. The bathymetry for the study was obtained from NOAA s National Geophysical Data Center (NGDC) and archived at NOAA s National Center for Environmental Information (NCEI). The bathymetric data available within the region of interest has a resolution of eight arc-seconds (roughly 240 m) and is derived from an integrated bathymetrictopographic Digital Elevation Model (DEM). The bathymetry as it is passed into the model is represented in Figure together with the locations of the meteorological stations. Wind data has been obtained from three sources. WAVEWATCH III, WRF, and buoy stations are all sources of wind data. The WRF model run by the University of Alaska available through the AOOS portal is not a good candidate for winds, even though it accurately forecasts winds. However, the model doesn t make a good candidate because the model has stopped producing output as of 02 March 2013 due to lack of funding (for further detail on this model and its validation see section 6.4). A wind forecast would be an essential part of an operationally running SWAN wave model and therefore WRF forecasts would be a good source for winds due to its ability to reproduce wind fields within this region. Tetra Tech has the ability to create accurate WRF forecasts to drive an operational environment of running the SWAN wave model, however this is currently out of scope of the present project. WAVEWATCH III is also a potential source of winds. WAVEWATCH III has the ability to reproduce winds in the Gulf of Alaska, however forecasts aren t available through the AOOS portal. The WAVEWATCH III model only has hindcasts available until 09 March 2017 (for further detail on WAVEWATCH III and its validation see Section 6.1). The source of wind data that was selected to run the SWAN wave model with is assembled from buoy observations at a number of different stations within the region of interest. Buoy data is available for download from NOAA s NDBC. The winds at the four buoy stations (for further details see Section 4.0) were interpolated onto a grid and passed to SWAN as input. This works for a hindcast non-operational type scenario, however would not allow a forecast to be produced. HinchinbrookInterimReport2_final-BT 30
113 HINCHINBROOK ENTRANCE WIND WAVE EXTREMES 704-TRN.WTRM03050 SEPTEMBER 18, 2018 ISSUED FOR USE The ROMS forecast of currents was acquired through the AOOS portal. The ROMS modeling framework includes three level nested grids of resolutions 1, 3, and 9 km that cover the Gulf of Alaska and Hinchinbrook Entrance. The available model data assimilates observational data to produce an accurate simulation of the ocean conditions. The ROMS model uses Global Forecast System (GFS) and regional WRF models as forcing. The geographical extent of the 1 km ROMS model unfortunately does not cover the entire SWAN domain as it is focused on Prince William Sound, therefore the 3 km ROMS model currents were used as input into the SWAN model. Currents are provided as input to SWAN at three hour intervals. The ROMS model datasets available through the AOOS portal uses GFS global forecast and regional WRF atmospheric model forcings, and assimilates both in-situ and remotely sensed observational data (Farrara et al., 2009) SWAN Wave Boundary Conditions The wave boundary conditions are the wave conditions entering at the edge of the model domain. Information on waves propagating into the coarse grid are given by WAVEWATCH III model hindcast output at the points marked with yellow markers in Figure The points at which boundary conditions are exchanged between the two models were chosen such that the WAVEWATCH III wave conditions computed in each grid cell are accounted for and that they are approximately equidistant from each other. The WAVEWATCH III wave conditions are discussed in further detail in section 6.1. The wave conditions computed by SWAN s coarse grid as they propagate into the fine grid are passed over to the fine grid at the positions marked in white circles SWAN Wave Condition Results The wave conditions for all of 2016 were predicted using the SWAN setup described in Section using wind, bathymetry, and currents input data described in Section 6.5.3, and wave boundary conditions described in Section A list of variables that are output from Tetra Tech s SWAN numerical wave model can be found in Table Table 6-17: Output Variables from Tetra Tech s SWAN Numerical Wave Model SWAN Variable Xp Variable Definition x-coordinate in the problem coordinate system Yp y-coordinate in the problem coordinate system Hsign Significant Wave Height (m) Dir Mean Wave Direction ( o ) Tps Ubot Wind Smoothed Peak Period (s) Root Mean Square Value of maxima of the orbital velocity near the bottom (m/s) Wind Velocity (m/s) Vel Current Velocity (m/s) Steepness Average Wave Steepness (dimensionless) 31
114 HINCHINBROOK ENTRANCE WIND WAVE EXTREMES FILE: 704-TRN.WTRM03050 SEPTEMBER 18, 2018 ISSUED FOR USE 4-2 Attachment Output from the SWAN model can be extracted at any point in both the fine and coarse grid domains. A timeseries of the outputs from the SWAN coarse and fine grids, WAVEWATCH III, and buoy data is graphically represented in Figure WAVEWATCH III is represented in black, buoy data is represented in blue, the SWAN coarse grid is represented in red, and SWAN fine grid is represented in green. Figure and show a map view of the significant wave height as simulated by the SWAN wave model, for the coarse grid and the fine grid respectively. Buoy positions are represented by red markers, the two points of interest are represented by blue markers, whilst the locations where wave conditions are passed from the coarse to the fine grid are represented by white markers. The arrows on the figures describe the wave propagation. Figure displays a map of the wave steepness near Hinchinbrook Entrance. Statistics are summarized for the SWAN wave height, wave direction, and wave period outputs for the entire period in Table Table 6-18: SWAN Bias and RMSE for Wave Height, Wave Direction, and Wave Period at Seal Rocks Station Over the Entire Available Date Record Parameter Fine Grid Coarse Grid Bias RMSE Skill Bias RMSE Skill Wave Height (m) Wave Direction ( o ) Wave Period (s) A summary of the statistics computed for SWAN output parameters when wave heights are greater than 3 m are summarized in Table Table 6-19: SWAN Bias and RMSE for Wave Height, Wave Direction, and Wave Period at Seal Rocks Station for Wave Heights Greater Than 3 m Location Fine Grid Coarse Grid Bias RMSE Skill Bias RMSE Skill Wave Height (m) Wave Direction ( o ) Wave Period (s) A summary of the number of closure events triggered by wave height exceedance at the Seal Rocks buoy location by the SWAN numerical wave model set up by Tetra Tech in comparison to observed wave conditions and reported closures at the Port of Valdez is provided in Table The reported closure condition data was provided to Tetra Tech by Quintero (2017). The observed number of closure events and their total duration is as recorded by observations at the Seal Rocks buoy. HinchinbrookInterimReport2_final-BT 32
115 HINCHINBROOK ENTRANCE WIND WAVE EXTREMES 704-TRN.WTRM03050 SEPTEMBER 18, 2018 ISSUED FOR USE The typical closure condition as simulated by the SWAN numerical wave model is as follows: 18 closure events simulated. The mean duration of closure is 10.9 hours, with a minimum duration of one hour and a maximum duration of 34 hours. The average wave height associated with the simulated closures is 5.3 m, whilst the maximum wave height is 7.6 m. Table 6-20: Closure Data at Seal Rocks Location as Reported, Observed, and Modelled at the Seal Rocks Buoy Location Reported Closures Closures Based on Observed Data Closures Based on Modelled Data Number of Closures Total Hours of Closures Average Duration Per Closure (Hours) Average Observed Magnitude of Event Wind Speed (m/s) N/A N/A Wind Direction ( o ) N/A 108. N/A Wave Height (m) N/A Wave Direction ( o ) N/A Dominant Wave Period (s) N/A Steepness N/A N/A Maximum Observed Magnitude of Event Wind Speed (m/s) N/A 23.5 N/A Wind Direction ( o ) N/A 188 N/A Wave Height (m) N/A Wave Direction ( o ) N/A Dominant Wave Period (s) N/A Steepness N/A N/A
116 HINCHINBROOK ENTRANCE WIND WAVE EXTREMES FILE: 704-TRN.WTRM03050 SEPTEMBER 18, 2018 ISSUED FOR USE 4-2 Attachment 7.0 DISCUSSION Closure conditions typically have a peak duration of four to seven hours. Closure conditions induced by both wind and wave exceedances occur one to three times per year within the period of record with a further 10 to 26 exceedances per year associated with waves only and a further one to three closures per year due to winds only. Winds associated with closure conditions are characterized by easterly directions with an average peak speed of 47 knots (24.2 m/s) and an average duration over the closure condition threshold of almost two hours. Observed winds at Seal Rocks buoy are typically 1 to 136 percent higher than those recorded at other stations (refer to Table 5-8). Waves associated with closure conditions originate typically from the southeast with an average significant wave height of 17.4 feet (5.3 m) and average duration over the closure condition threshold of six hours. Observed wave heights at Seal Rocks tend to be lower than those recorded at the two other buoys by 10 to 16.5 percent. As the closure condition is currently defined, it is far more likely for a closure condition to be declared on the basis of wave height than wind speed. This is despite the Seal Rock buoy generally recording higher winds speeds and lower wave heights than neighbouring stations. A component of this mismatch may be that the closure condition wave height is defined as 15-foot seas, which is approximately a moderate gale (Force 6 according to the Douglas Sea Scale), while closure condition wind speed of 45 knots is a severe gale (Force 9). This suggests three important observations regarding the current closure condition definition: It is likely that closure conditions cannot be accurately determined in the absence of wave data as wind data alone is a relatively poor predictor of when a wave-induced closure condition is occurring. It may be possible to open up shipping windows by increasing the closure condition wave height to bring it in line with the closure condition wind speed. Alternatively, the closure condition wind speed could potentially be lowered without significantly impacting the available shipping windows. However, see the following bullet point. Escort vessel capabilities should be used to define which aspects of the currently defined closure condition is the limiting factor on transits through Hinchinbrook Entrance. Using existing vessels as a baseline, this information could also be used to plan fleet renewals such that the number of closure conditions per year is more realistic and is based on ship capabilities. The SWAN numerical wave model used in this study reproduced 196 hours of wave-induced closure events throughout 2016, in comparison to the total of 64 hours that were reported to Tetra Tech (Quintero, 2017) and the 147 hours that are deduced from buoy observations. In terms of number of closure events, the SWAN numerical wave model reproduced 18 independent wave height exceedance events, in comparison to the 13 reported events throughout 2016 and 21 buoy observation induced closure events. The next sections describe the proposed way forward in order to optimally use the wave model results to improve the safety of vessel transit through Hinchinbrook Entrance. By default the SWAN model interpolates the spectral grid from WAVEWATCH III boundary conditions provided onto its own grid. The SWAN model assumes a Joint North Sea Wave Project (JONSWAP) spectrum. An interesting test to improve the skill of the model would be to pass a spectrum from WAVEWATCH III directly into the SWAN numerical wave model. This should allow SWAN to account for both wind and swell waves. Another improvement that is necessary for the forecasting of these closure conditions is to make the SWAN model run in an operational mode. In order to produce forecasts the following input and boundary condition parameters need to be provided to the SWAN model in forecast mode rather than in hindcast: Wind forecasts could be provided by Tetra Tech by running a WRF model tailored for the Gulf of Alaska. Forecasts of currents could be provided through Tetra Tech s in-house three-dimensional hydrodynamic model (H3D). HinchinbrookInterimReport2_final-BT 34
117 HINCHINBROOK ENTRANCE WIND WAVE EXTREMES 704-TRN.WTRM03050 SEPTEMBER 18, 2018 ISSUED FOR USE Wave boundary conditions could be provided by WAVEWATCH III, which we understand will be transitioned to a forecast model in the near future. The SWAN wave conditions output can be readily extracted at any point in either of the SWAN domains. Typical vessel routes should be agreed upon so SWAN derived wave conditions at representative locations can be extracted. Instead of simply looking at the significant wave height at or near Seal Rocks as an indicator of the conditions within Hinchinbrook Entrance, the maximum of the wave heights of all the points along the route should be used as a better indicator of the most severe conditions that will be encountered along the part of the proposed journey that will require escort tugs. Since a simulated significant wave height does not represent the full extent of the conditions experienced at sea (e.g., the 98 th percentile wave height may be of interest) other wave heights can be computed from the maximum wave height output as described in Table 5-1 in Section 5 to better simulate actual wave conditions experienced in the Entrance. Steepness is another parameter computed as an output from SWAN. As discussed in Section 5.0, steepness is also an important wave feature that should determine a closure condition and hence the definition of a closure condition threshold should be re-addressed to include this feature. Wave periods within a specific range could also pose a threat to a transiting vessels. If the wave period is such that the wave peaks are at the front and rear ends of the vessel, Section 5.0 A closure condition should be forecasted and triggered based on any of the criteria above exceeding their respective thresholds. 8.0 CLOSURE We trust this report meets your present requirements. If you have any questions or comments, please contact the undersigned. Respectfully submitted, Tetra Tech Canada Inc. Prepared by: Reviewed by: Alana Bonnici, M.Sc. Jim Stronach, Ph.D., P.Eng. Oceanographer Manager, Water and Marine Engineering Direct Line: Direct Line: Alana.Bonnici@tetratech.com Jim.Stronach@tetratech.com AB/JS/tak 35
118 HINCHINBROOK ENTRANCE WIND WAVE EXTREMES FILE: 704-TRN.WTRM03050 SEPTEMBER 18, 2018 ISSUED FOR USE 4-2 Attachment REFERENCES Farrara, J. D., Y. Chao, Z. Li, X. Wang, X. Jin, H. Zhang, P. Li, Q. Vu, P. Q. Olsson, G. C. Schoch, M. Halverson, M. A. Moline, J. C. McWilliams, F. A. Colas, 2013: A data-assimilative ocean forecasting system for the Prince William Sound and an evaluation of its performance during Sound Predictions Cont. Shelf Res., 63, S193-S208, doi: /j.csr: IMO, Revised guidance to the master for avoiding dangerous situations in adverse weather and sea conditions, MSC.1/Circ.1228 Jin, M. and Wang, J., Interannual variability and sensitivity study of the ocean circulation and thermohaline structure in Prince William Sound, Alaska. Continental Shelf Research, 24(3), Liu, H., Olsson, P.Q., Volz, K., SAR Observation and Modeling of Gap Winds in the Prince William Sound of Alaska. Sensors, 8, , DOI: /s Macklin, S.A., Lackman, G.M., Gray, J., Offshore-Directed Winds in the Vicinity of Prince William Sound, Alaska. Monthly Weather Review, 116, Mesquita, M.S., Characteristics and Variability of Storm Tracks in the North Pacific, Bearing Sea and Alaksa. Ph.D. Dissertation, University of Alaska Fairbanks. Middleton Island Meteorological Data, Retrieved from URL: Date accessed: 12/01/2018. Olsson, P.Q., Personal communication, 15 September, Overland, J.E., Cardone, V.J., Case Studies of Four Severe Gulf of Alaska Storms. NOAA Technical Memorandum, ERL PMEL-19 Pickart, R.S., Moore, G.W.K., MacDonald, A.M., Renfrew, I.A., Walsh, J.E., Kessler, W.S., Seasonal Evolution of Aleutian Low Pressure Systems: Implications for the North Pacific Subpolar Circulation. Journal of Physical Oceanography, 39, , DOI: /2009JPO Quintero, C., Personal communication, 12 December, Robert, A., Sentinel Tug Requirements for Gulf of Alaska: Ship Drift Study. Rodionov, S.N., Bond, N.A., Overland, J.E., The Aleutian Low, Storm Tracks and Winter Climate Variability in the Bering Sea. Deep-Sea Research, Part II, 54, Schoch, G.C., McCammon, M., Demonstrating the Alaska Ocean Observing System in Prince William Sound. Contintental Shelf Research, 63, Skamarock, W. C., Klemp, J. B., Dudhia, J., Gill, D. O., Barker, D. M., Dudha, M. G.,... & Powers, Y. (2008). A description of the advanced research WRF Ver. 30. National Center for Atmospheric Research US. Tolman, H. L., 1989: The numerical model WAVEWATCH: a third generation model for the hindcasting of wind waves on tides in shelf seas. Communications on Hydraulic and Geotechnical Engineering, Delft Univ. of Techn., ISSN , Rep. no. 89-2, 72 pp. Tolman, H. L., 1991a: A third-generation model for wind waves on slowly varying, unsteady and inhomogeneous depths and currents. J. Phys. Oceanogr., 21, Tolman, H. L., 1992: Effects of numerics on the physics in a third-generation wind-wave model. J. Phys. Oceanogr., 22, Tolman, H.L., User Manual and System Documentation of WAVEWATCH III version NOAA / NWS / NCEP / OMB Technical Note 151, 97 pp. Tolman, H.L., 1999a. User Manual and System Documentation of WAVEWATCH III version NOAA / NWS / NCEP / OMB Technical Note 166, 110 pp. HinchinbrookInterimReport2_final-BT 36
119 HINCHINBROOK ENTRANCE WIND WAVE EXTREMES 704-TRN.WTRM03050 SEPTEMBER 18, 2018 ISSUED FOR USE Tolman, H.L., User manual and system documentation of WAVEWATCH III version NOAA / NWS / NCEP / MMAB Technical Note 276, 194 pp. Wang, J., Patrick, V., Allen, J., Vaughan, S., Mooers, C., Jin, M., Modeling seasonal ocean circulation of Prince William Sound, Alaska using freshwater of a line source. WIT Transactions on The Built Environment, 43. Winstead, N.S., Colle, B., Bond, N., Young, G., Olson, J., Loescher, K., Monaldo, F., Thompson, D., Pichel, W.G., Using SAR Remote Sensing, Field Observations, and Models to Better Understand Coastal Flows in the Gulf of Alaska. Bulletin of the American Meteorological Society, 87,
120 HINCHINBROOK ENTRANCE WIND WAVE EXTREMES FILE: 704-TRN.WTRM03050 SEPTEMBER 18, 2018 ISSUED FOR USE 4-2 Attachment GLOSSARY AEFF AOOS DEM GFS JONSWAP KM M/S NAM NCEI NCEP NDBC NDFD NGDC NOAA NRCS NWP NWS PWSRCAC RFP RMSE ROMS SWAN SWH VERP WRF Alaska Experimental Forecast Facility Alaska Ocean Observing System Digital Elevation Model Global Forecast System Joint North Sea Wave Project Kilometers Meters per Second North American Model National Center for Environmental Information National Center for Environmental Prediction National Data Buoy Center National Digital Forecast Database National Geophysical Data Center National Oceanic and Atmospheric Administration Natural Resources Conservation Service Numerical Weather Prediction National Weather Service Prince William Sound Regional Citizens Advisory Council Request for Proposal Root Mean Squared Error Regional Ocean Modeling System Simulating Waves Nearshore Significant Wave Height Vessel Escort and Response Plan Weather Research & Forecasting 38 HinchinbrookInterimReport2_final-BT
121 HINCHINBROOK ENTRANCE WIND WAVE EXTREMES 704-TRN.WTRM03050 SEPTEMBER 18, 2018 ISSUED FOR USE FIGURES Figures
122 Q:\Vancouver\Engineering\V132\Projects\WTRM03050_Hinchinbrook\reporting\InterimReport01\figures\images\4-1NEW.lay 01 May :53:08
123 NOTES Notes CLIENT Hinchinbrook Entrance Wind Wave Extremes Missing Data at Seal Rocks Buoy Q:\Vancouver\Engineering\V132\Projects\WTRM03050_Hinchinbrook\reporting\InterimReport01\figures\images\4-2.lay STATUS ISSUED FOR REVIEW PROJECT NO. 704-TRN.WTRM03050 OFFICE Tetra Tech - VANC DWN CKD APVD REV AB JM JAS 0 DATE January, 2018 Figure Jan :52:29

124 Seal Rocks Buoy Station Dates: 01 Jan Dec 2017 Temporal Resolution: 1 Hour Q:\Vancouver\Engineering\V132\Projects\WTRM03050_Hinchinbrook\reporting\InterimReport02\figures\layouts\4-3.lay 01 May :00:46

125 Wave Rose at Seal Rocks Buoy,46061 Dates: 16 Apr Dec 2017 Temporal Resolution: 1 Hour Q:\Vancouver\Engineering\V132\Projects\WTRM03050_Hinchinbrook\reporting\InterimReport02\figures\layouts\4-4.lay 01 May :02:01

126 Wind Rose at Cape Cleare Buoy Dates: 08 Jan Dec 2017 Temporal Resolution: 1 Hour Q:\Vancouver\Engineering\V132\Projects\WTRM03050_Hinchinbrook\reporting\InterimReport02\figures\layouts\4-5.lay 01 May :02:54

127 Wave Rose at Cape Cleare Buoy Dates: 14 Jul Dec 2017 Temporal Resolution: 1 Hour Q:\Vancouver\Engineering\V132\Projects\WTRM03050_Hinchinbrook\reporting\InterimReport02\figures\layouts\4-6.lay 01 May :59:46

128 Wind Rose at Cape Suckling Buoy Dates: 01 Jan Dec 2017 Temporal Resolution: 1 Hour Q:\Vancouver\Engineering\V132\Projects\WTRM03050_Hinchinbrook\reporting\InterimReport02\figures\layouts\4-7.lay 01 May :08:46

129 Wave Rose at Cape Suckling Buoy Dates: 10 Jul Dec 2017 Temporal Resolution: 1 Hour Q:\Vancouver\Engineering\V132\Projects\WTRM03050_Hinchinbrook\reporting\InterimReport02\figures\layouts\4-8.lay 01 May :16:10

130 Wind Rose at West Orca Bay Buoy Dates: 01 Jan Dec 2017 Temporal Resolution: 1 Hour Q:\Vancouver\Engineering\V132\Projects\WTRM03050_Hinchinbrook\reporting\InterimReport02\figures\layouts\4-9.lay 01 May :26:13

131 Wave Rose at West Orca Bay Buoy Dates: 07 Aug Dec 2017 Temporal Resolution: 1 Hour Q:\Vancouver\Engineering\V132\Projects\WTRM03050_Hinchinbrook\reporting\InterimReport02\figures\layouts\4-10.lay 01 May :40:01

132 Wind Rose at Nuchek Station 1074 Dates: 01 Jan Nov 2017 Temporal Resolution: 1 Hour Q:\Vancouver\Engineering\V132\Projects\WTRM03050_Hinchinbrook\reporting\InterimReport02\figures\layouts\4-11.lay 01 May :45:37
133 NOTES Notes CLIENT Hinchinbrook Entrance Wind Wave Extremes Extreme Wind Analysis for Seal Rocks Station (46061) Q:\Vancouver\Engineering\V132\Projects\WTRM03050_Hinchinbrook\reporting\InterimReport01\figures\images\5-1.lay STATUS ISSUED FOR REVIEW PROJECT NO. 704-TRN.WTRM03050 OFFICE Tetra Tech - VANC DWN CKD APVD REV AB JM JAS 0 DATE January, 2018 Figure Jan :29:21
134 NOTES Notes CLIENT Hinchinbrook Entrance Wind Wave Extremes Extreme Wind Analysis for Cape Cleare Station (46076) Q:\Vancouver\Engineering\V132\Projects\WTRM03050_Hinchinbrook\reporting\InterimReport01\figures\images\5-2.lay STATUS ISSUED FOR REVIEW PROJECT NO. 704-TRN.WTRM03050 OFFICE Tetra Tech - VANC DWN CKD APVD REV AB JM JAS 0 DATE January, 2018 Figure Jan :30:11
135 NOTES Notes CLIENT Hinchinbrook Entrance Wind Wave Extremes Extreme Wind Analysis for Cape Suckling Station (46082) Q:\Vancouver\Engineering\V132\Projects\WTRM03050_Hinchinbrook\reporting\InterimReport01\figures\images\5-3.lay STATUS ISSUED FOR REVIEW PROJECT NO. 704-TRN.WTRM03050 OFFICE Tetra Tech - VANC DWN CKD APVD REV AB JM JAS 0 DATE January, 2018 Figure Jan :30:38

136 Q:\Vancouver\Engineering\V132\Projects\WTRM03050_Hinchinbrook\reporting\InterimReport02\figures\layouts\6.0-1.lay 03 May :56:37

137 Q:\Vancouver\Engineering\V132\Projects\WTRM03050_Hinchinbrook\reporting\InterimReport02\figures\layouts\6.0-2.lay 03 May :58:40

138 Q:\Vancouver\Engineering\V132\Projects\WTRM03050_Hinchinbrook\reporting\InterimReport02\figures\layouts\6.0-3.lay 03 May :01:06
139 Q:\Vancouver\Engineering\V132\Projects\WTRM03050_Hinchinbrook\reporting\InterimReport02\figures\layouts\6.1-1.lay 02 May :28:04

140 Seal Rocks Station WAVEWATCH III and Observation Timeseries Dates: 01 Jan Feb 2016 Q:\Vancouver\Engineering\V132\Projects\WTRM03050_Hinchinbrook\reporting\InterimReport02\figures\layouts\6.1-2.lay 02 May :28:52
141 Cape Cleare Station WAVEWATCH III and Observation Timeseries Dates: 01 Jan Feb 2016 Q:\Vancouver\Engineering\V132\Projects\WTRM03050_Hinchinbrook\reporting\InterimReport02\figures\layouts\6.1-3.lay 02 May :31:01
142 Cape Suckling Station WAVEWATCH III and Observation Timeseries Dates: 01 Jan Feb 2016 Q:\Vancouver\Engineering\V132\Projects\WTRM03050_Hinchinbrook\reporting\InterimReport02\figures\layouts\6.1-4.lay 02 May :31:47

143 West Orca Bay Station WAVEWATCH III and Observation Timeseries Dates: 01 Jan Feb 2016 Q:\Vancouver\Engineering\V132\Projects\WTRM03050_Hinchinbrook\reporting\InterimReport02\figures\layouts\6.1-5.lay 02 May :33:58

144 Wind Rose at Seal Rocks Buoy WAVEWATCH III Output Dates: 04 Feb Sep 2017 Temporal Resolution: 3 Hours Q:\Vancouver\Engineering\V132\Projects\WTRM03050_Hinchinbrook\reporting\InterimReport02\figures\layouts\6.1-6.lay 02 May :34:29

145 Wave Rose at Seal Rocks Buoy WAVEWATCH III Output Dates: 04 Feb Sep 2017 Temporal Resolution: 3 Hours Q:\Vancouver\Engineering\V132\Projects\WTRM03050_Hinchinbrook\reporting\InterimReport02\figures\layouts\6.1-7.lay 02 May :34:55

146 Wind Rose at Cape Cleare Buoy WAVEWATCH III Output Dates: 04 Feb Sep 2017 Temporal Resolution: 3 Hours Q:\Vancouver\Engineering\V132\Projects\WTRM03050_Hinchinbrook\reporting\InterimReport02\figures\layouts\6.1-8.lay 02 May :35:38

147 Wave Rose at Cape Cleare Buoy WAVEWATCH III Output Dates: 04 Feb Sep 2017 Temporal Resolution: 3 Hours Q:\Vancouver\Engineering\V132\Projects\WTRM03050_Hinchinbrook\reporting\InterimReport02\figures\layouts\6.1-9.lay 02 May :36:08

148 Wind Rose at Cape Suckling Buoy WAVEWATCH III Output Dates: 04 Feb Sep 2017 Temporal Resolution: 3 Hours Q:\Vancouver\Engineering\V132\Projects\WTRM03050_Hinchinbrook\reporting\InterimReport02\figures\layouts\ lay 04 May :06:07

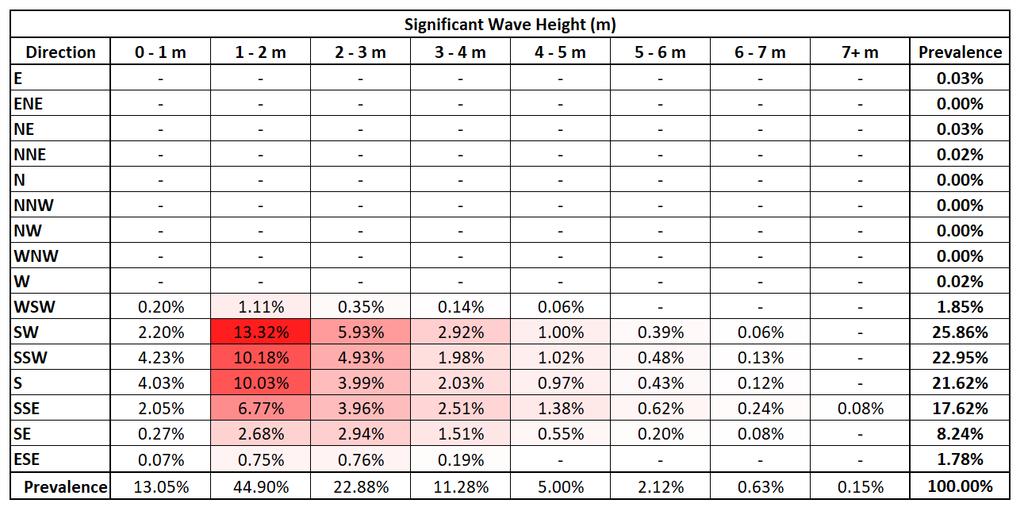
149 Wave Rose at Cape Suckling Buoy WAVEWATCH III Output Dates: 04 Feb Sep 2017 Temporal Resolution: 3 Hours Q:\Vancouver\Engineering\V132\Projects\WTRM03050_Hinchinbrook\reporting\InterimReport02\figures\layouts\ lay 02 May :37:04

150 Wind Rose at West Orca Bay Buoy WAVEWATCH III Output Dates: 04 Feb Sep 2017 Temporal Resolution: 3 Hours Q:\Vancouver\Engineering\V132\Projects\WTRM03050_Hinchinbrook\reporting\InterimReport02\figures\layouts\ lay 02 May :37:46
151 Wave Rose at West Orca Bay Buoy WAVEWATCH III Output Dates: 04 Feb Sep 2017 Temporal Resolution: 3 Hours Q:\Vancouver\Engineering\V132\Projects\WTRM03050_Hinchinbrook\reporting\InterimReport02\figures\layouts\ lay 02 May :38:08
152 Nuchek Station WAVEWATCH III and Observation Timeseries Dates: 01 Jan Feb 2016 Q:\Vancouver\Engineering\V132\Projects\WTRM03050_Hinchinbrook\reporting\InterimReport02\figures\layouts\ lay 02 May :38:36

153 Wind Rose at Nuchek Station 1074 WAVEWATCH III Output Dates: 04 Feb Sep 2017 Temporal Resolution: 3 Hours Q:\Vancouver\Engineering\V132\Projects\WTRM03050_Hinchinbrook\reporting\InterimReport02\figures\layouts\ lay 02 May :39:15

154 Wind Rose at Point of Interest 1 WAVEWATCH III Output Dates: 04 Feb Sep 2017 Temporal Resolution: 3 Hours Q:\Vancouver\Engineering\V132\Projects\WTRM03050_Hinchinbrook\reporting\InterimReport02\figures\layouts\ lay 02 May :39:52

155 Wave Rose at Point of Interest 1 WAVEWATCH III Output Dates: 04 Feb Sep 2017 Temporal Resolution: 3 Hours Q:\Vancouver\Engineering\V132\Projects\WTRM03050_Hinchinbrook\reporting\InterimReport02\figures\layouts\ lay 02 May :40:18

156 Wind Rose at Point of Interest 2 WAVEWATCH III Output Dates: 04 Feb Sep 2017 Temporal Resolution: 3 Hours Q:\Vancouver\Engineering\V132\Projects\WTRM03050_Hinchinbrook\reporting\InterimReport02\figures\layouts\ lay 02 May :41:04

157 Wave Rose at Point of Interest 2 WAVEWATCH III Output Dates: 04 Feb Sep 2017 Temporal Resolution: 3 Hours Q:\Vancouver\Engineering\V132\Projects\WTRM03050_Hinchinbrook\reporting\InterimReport02\figures\layouts\ lay 02 May :45:50

158 Q:\Vancouver\Engineering\V132\Projects\WTRM03050_Hinchinbrook\reporting\InterimReport02\figures\layouts\ lay 02 May :46:45
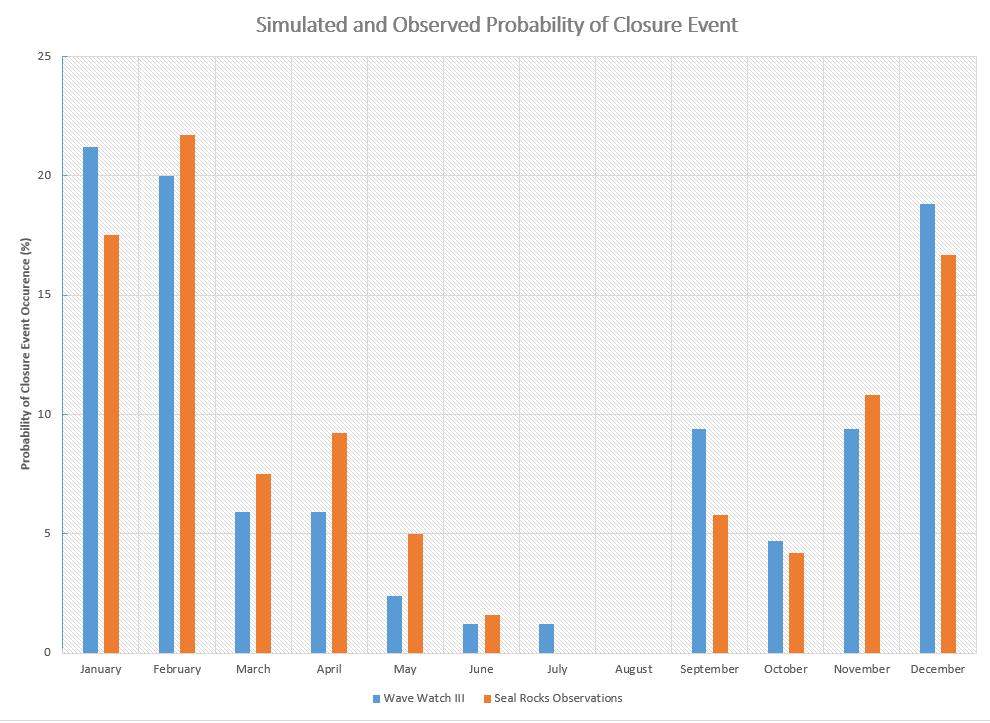
159 Q:\Vancouver\Engineering\V132\Projects\WTRM03050_Hinchinbrook\reporting\InterimReport02\figures\layouts\ lay 02 May :47:48

160 Q:\Vancouver\Engineering\V132\Projects\WTRM03050_Hinchinbrook\reporting\InterimReport02\figures\layouts\ lay 02 May :48:25

161 Q:\Vancouver\Engineering\V132\Projects\WTRM03050_Hinchinbrook\reporting\InterimReport02\figures\layouts\ lay 02 May :49:12

162 Q:\Vancouver\Engineering\V132\Projects\WTRM03050_Hinchinbrook\reporting\InterimReport02\figures\layouts\ lay 02 May :49:41

163 Q:\Vancouver\Engineering\V132\Projects\WTRM03050_Hinchinbrook\reporting\InterimReport02\figures\layouts\ lay 02 May :50:10

164 Q:\Vancouver\Engineering\V132\Projects\WTRM03050_Hinchinbrook\reporting\InterimReport02\figures\layouts\ lay 02 May :50:47
165 Q:\Vancouver\Engineering\V132\Projects\WTRM03050_Hinchinbrook\reporting\InterimReport02\figures\layouts\ lay 16 May :02:46

166 Seal Rocks Buoy Station NDFD and Observation Timeseries Dates: 01 Nov Nov 2015 Q:\Vancouver\Engineering\V132\Projects\WTRM03050_Hinchinbrook\reporting\InterimReport02\figures\layouts\6.2-1.lay 26 Apr :23:22

167 Cape Cleare Buoy Station NDFD and Observation Timeseries Dates: 01 Nov Nov 2015 Q:\Vancouver\Engineering\V132\Projects\WTRM03050_Hinchinbrook\reporting\InterimReport02\figures\layouts\6.2-2.lay 26 Apr :22:00

168 Cape Suckling Buoy Station NDFD and Observation Timeseries Dates: 01 Nov Nov 2015 Q:\Vancouver\Engineering\V132\Projects\WTRM03050_Hinchinbrook\reporting\InterimReport02\figures\layouts\6.2-3.lay 26 Apr :20:35
169 NDFD Output at Points of Interest P1 and P2 NDFD Output Timeseries Dates: 01 Nov Nov 2015 Q:\Vancouver\Engineering\V132\Projects\WTRM03050_Hinchinbrook\reporting\InterimReport02\figures\layouts\6.2-5.lay 26 Apr :18:11
170 NDFD Output at Points of Interest P1 and P2 NDFD Output Timeseries Dates: 01 Nov Nov 2015 Q:\Vancouver\Engineering\V132\Projects\WTRM03050_Hinchinbrook\reporting\InterimReport02\figures\layouts\6.2-5.lay 26 Apr :19:15

171 NDFD Wind Rose at Seal Rocks Station Dates: 26 Jan Dec 2015 Q:\Vancouver\Engineering\V132\Projects\WTRM03050_Hinchinbrook\reporting\InterimReport02\figures\layouts\6.2-6.lay 26 Apr :17:11

172 NDFD Wind Rose at Cape Cleare Station Dates: 26 Jan Dec 2015 Q:\Vancouver\Engineering\V132\Projects\WTRM03050_Hinchinbrook\reporting\InterimReport02\figures\layouts\6.2-7.lay 26 Apr :16:38

173 NDFD Wind Rose at Cape Suckling Station Dates: 26 Jan Dec 2015 Q:\Vancouver\Engineering\V132\Projects\WTRM03050_Hinchinbrook\reporting\InterimReport02\figures\layouts\6.2-8.lay 26 Apr :16:12

174 NDFD Wind Rose at West Orca Bay Station Dates: 26 Jan Dec 2015 Q:\Vancouver\Engineering\V132\Projects\WTRM03050_Hinchinbrook\reporting\InterimReport02\figures\layouts\6.2-9.lay 26 Apr :15:46
175 Seal Rocks Buoy Station SWAN (AOOS) and Observation Timeseries Dates: 01 Feb Mar 2012 Q:\Vancouver\Engineering\V132\Projects\WTRM03050_Hinchinbrook\reporting\InterimReport02\figures\layouts\6.3-1.lay 26 Apr :15:11
176 Cape Cleare Buoy Station SWAN (AOOS) and Observation Timeseries Dates: 01 Feb Mar 2013 Q:\Vancouver\Engineering\V132\Projects\WTRM03050_Hinchinbrook\reporting\InterimReport02\figures\layouts\6.3-2.lay 26 Apr :14:30
177 Cape Suckling Buoy Station SWAN (AOOS) and Observation Timeseries Dates: 01 Feb Mar 2012 Q:\Vancouver\Engineering\V132\Projects\WTRM03050_Hinchinbrook\reporting\InterimReport02\figures\layouts\6.3-3.lay 26 Apr :56:26
178 West Orca Bay Buoy Station SWAN (AOOS) and Observation Timeseries Dates: 01 Feb Mar 2012 Q:\Vancouver\Engineering\V132\Projects\WTRM03050_Hinchinbrook\reporting\InterimReport02\figures\layouts\6.3-4.lay 26 Apr :54:36

179 Seal Rocks Buoy Station WRF and Observation Timeseries Dates: 01 Jan Feb 2011 Q:\Vancouver\Engineering\V132\Projects\WTRM03050_Hinchinbrook\reporting\InterimReport02\figures\layouts\6.4-1.lay 26 Apr :53:55

180 Cape Cleare Buoy Station WRF and Observation Timeseries Dates: 01 Jan Feb 2011 Q:\Vancouver\Engineering\V132\Projects\WTRM03050_Hinchinbrook\reporting\InterimReport02\figures\layouts\6.4-2.lay 26 Apr :53:14

181 Cape Suckling Buoy Station WRF and Observation Timeseries Dates: 01 Jan Feb 2011 Q:\Vancouver\Engineering\V132\Projects\WTRM03050_Hinchinbrook\reporting\InterimReport02\figures\layouts\6.4-3.lay 26 Apr :52:30

182 West Orca Bay Buoy Station WRF and Observation Timeseries Dates: 01 Mar Apr 2011 Q:\Vancouver\Engineering\V132\Projects\WTRM03050_Hinchinbrook\reporting\InterimReport02\figures\layouts\6.4-4.lay 26 Apr :51:37

183 SWAN Grid Setup Q:\Vancouver\Engineering\V132\Projects\WTRM03050_Hinchinbrook\reporting\InterimReport02\figures\layouts\6.5-1.lay 26 Apr :46:45

184 Q:\Vancouver\Engineering\V132\Projects\WTRM03050_Hinchinbrook\reporting\InterimReport02\figures\layouts\6.5-2.lay 26 Apr :45:54

185 SWAN Output at Seal Rocks Station WAVEWATCH III and Observation Timeseries Dates: 01 Jan Jan 2016 Q:\Vancouver\Engineering\V132\Projects\WTRM03050_Hinchinbrook\reporting\InterimReport02\figures\layouts\6.5-3.lay 14 May :50:56

186 Q:\Vancouver\Engineering\V132\Projects\WTRM03050_Hinchinbrook\reporting\InterimReport02\figures\layouts\6.5-4.lay 16 May :18:38

187 Q:\Vancouver\Engineering\V132\Projects\WTRM03050_Hinchinbrook\reporting\InterimReport02\figures\layouts\6.5-5.lay 16 May :25:27

188 Q:\Vancouver\Engineering\V132\Projects\WTRM03050_Hinchinbrook\reporting\InterimReport02\figures\layouts\6.5-6.lay 26 Apr :41:42
Comparison of Wind Measurements at Nuchek Heights, Hinchinbrook Island, and at Seal Rocks NOAA Data Buoy in Hinchinbrook Entrance, Alaska
 653.43.627.HnchinbrkWx.pdf Comparison of Wind Measurements at Nuchek Heights, Hinchinbrook Island, and at Seal Rocks NOAA Data Buoy in Hinchinbrook Entrance, Alaska Richard M. Brown Micro Specialties,
139 South Meals, Suite 202 Drive, P.O. Box 3089 Valdez, Alaska / Fax 907/
 139 South Meals, Suite 202 Drive, P.O. Box 3089 Valdez, Alaska 99686 907/835-5957 Fax 907/835-5926 Date: March 9, 2010 Subject: Analysis of SAFETUG Wave Spectra with Respect to PWS Wave Conditions Project
APPENDIX G WEATHER DATA SELECTED EXTRACTS FROM ENVIRONMENTAL DATA FOR BCFS VESSEL REPLACEMENT PROGRAM DRAFT REPORT
 APPENDIX G WEATHER DATA SELECTED EXTRACTS FROM ENVIRONMENTAL DATA FOR BCFS VESSEL REPLACEMENT PROGRAM DRAFT REPORT Prepared for: B.C. Ferries Services Inc. Prepared by: George Roddan, P.Eng. Roddan Engineering
Coastal Wave Studies FY13 Summary Report
 DISTRIBUTION STATEMENT A. Approved for public release; distribution is unlimited. Coastal Wave Studies FY13 Summary Report Jeffrey L. Hanson US Army Corps of Engineers, Field Research Facility 1261 Duck
Marine Renewables Industry Association. Marine Renewables Industry: Requirements for Oceanographic Measurements, Data Processing and Modelling
 Marine Renewables Industry Association Marine Renewables Industry: Requirements for Oceanographic Measurements, Data Processing and Modelling October 2009 Table of Contents 1. Introduction... 1 2. Measurements
Prediction of Nearshore Waves and Currents: Model Sensitivity, Confidence and Assimilation
 Prediction of Nearshore Waves and Currents: Model Sensitivity, Confidence and Assimilation H. Tuba Özkan-Haller College of Oceanic and Atmospheric Sciences Oregon State University, 104 Ocean Admin Bldg
Beach Wizard: Development of an Operational Nowcast, Short-Term Forecast System for Nearshore Hydrodynamics and Bathymetric Evolution
 Beach Wizard: Development of an Operational Nowcast, Short-Term Forecast System for Nearshore Hydrodynamics and Bathymetric Evolution Ad Reniers Civil Engineering and Geosciences, Delft University of Technology
Wave Energy Atlas in Vietnam
 Wave Energy Atlas in Vietnam Nguyen Manh Hung, Duong Cong Dien 1 1 Institute of Mechanics, 264 Doi Can Str. Hanoi, Vietnam nmhungim@gmail.com; duongdienim@gmail.com Abstract Vietnam has achieved remarkable
Regional Analysis of Extremal Wave Height Variability Oregon Coast, USA. Heidi P. Moritz and Hans R. Moritz
 Regional Analysis of Extremal Wave Height Variability Oregon Coast, USA Heidi P. Moritz and Hans R. Moritz U. S. Army Corps of Engineers, Portland District Portland, Oregon, USA 1. INTRODUCTION This extremal
Wave Transformation, Prediction, and Analysis at Kaumalapau Harbor, Lanai, Hawaii
 Wave Transformation, Prediction, and Analysis at Kaumalapau Harbor, Lanai, Hawaii Jessica H. Podoski, P.E. Coastal Engineer, USACE Honolulu District Christopher Goody, P.E. Sea Engineering, Inc. Thomas
An Investigation of a Safety Level in Terms of. Excessive Acceleration in Rough Seas
 Proceedings of the h International Conference on the Stability of Ships and Ocean Vehicles, 4-9 June 5, Glasgow, UK. An Investigation of a Safety Level in Terms of Excessive Acceleration in Rough Seas
Dynamic Positioning Control Augmentation for Jack-up Vessels
 DYNAMIC POSITIONING CONFERENCE October 9-10, 2012 Design and Control Session Dynamic Positioning Control Augmentation for Jack-up Vessels By Bradley Deghuee L-3 Communications 1 Introduction Specialized
Quantifying Wave Measurement Differences in Historical and Present Wave Buoy Systems
 Quantifying Wave Measurement Differences in Historical and Present Wave Buoy Systems R. E. Jensen 1, V. Swail 2, R.H. Bouchard 3, and B. Bradshaw 2 1 Coastal and Hydraulics Laboratory 2 Environment and
Appendix D: SWAN Wave Modelling
 Appendix D: SWAN Wave Modelling D.1 Preamble The Eurobodalla Shire Council area is subject to extreme waves originating from offshore storms. When swell waves approach the coast, they are modified by the
Preliminary Wake Wash Impact Analysis Redwood City Ferry Terminal, Redwood City, CA
 Technical Memorandum Preliminary Wake Wash Impact Analysis Redwood City Ferry Terminal, Redwood City, CA 1. Introduction The following preliminary wake wash impact analysis was initiated by the Port of
High-Speed Craft Motions: a Case Study
 High-Speed Craft Motions: a Case Study Mr. Kelly Haupt Naval Surface Warfare Center, Carderock Division Norfolk Detachment, Combatant Craft Department 2600 Tarawa Court, Suite 303 Norfolk, Virginia 23521-3239
Sea State Analysis. Topics. Module 7 Sea State Analysis 2/22/2016. CE A676 Coastal Engineering Orson P. Smith, PE, Ph.D.
 Sea State Analysis Module 7 Orson P. Smith, PE, Ph.D. Professor Emeritus Module 7 Sea State Analysis Topics Wave height distribution Wave energy spectra Wind wave generation Directional spectra Hindcasting
Characterizing Ireland s wave energy resource
 Snapshots of Doctoral Research at University College Cork 2011 Characterizing Ireland s wave energy resource Brendan Cahill Hydraulics & Maritime Research Centre, UCC Introduction In theory, the energy
Task 16: Impact on Lummi Cultural Properties
 Gateway Pacific Terminal Vessel Traffic and Risk Assessment Study Task 16: Impact on Lummi Cultural Properties Prepared for Pacific International Terminals, Inc. Prepared by The Glosten Associates, Inc.
Evaluation of June 9, 2014 Federal Emergency Management Agency Flood Insurance Study for Town of Weymouth, Norfolk, Co, MA
 Evaluation of June 9, 2014 Federal Emergency Management Agency Flood Insurance Study for Town of Weymouth, Norfolk, Co, MA Prepared For: Woodard & Curran 95 Cedar Street, Suite 100 Providence, RI 02903
R. H. Bouchard 1, S. Cucullu 1, J. Dellicarpini 2, G. Field 2, P.C. Liu 3, A.V Babanin 4, W.E. Rogers 5, D.W. Wang 5, G. Z. Forristall 6, R.
 A Review of Wind and Wave Measurements from a NOAA Buoy during the Provincetown IV Ferry Incident of August 13, 2014 R. H. Bouchard 1, S. Cucullu 1, J. Dellicarpini 2, G. Field 2, P.C. Liu 3, A.V Babanin
Comparisons of Physical and Numerical Model Wave Predictions with Prototype Data at Morro Bay Harbor Entrance, California
 Comparisons of Physical and Numerical Model Wave Predictions with Prototype Data at Morro Bay Harbor Entrance, California by Robert R. Bottin, Jr. and Edward F. Thompson PURPOSE: This Coastal and Hydraulics
Sand Bank Passage. Fiji nearshore wave hindcast ' ' 19 00'
 Sand Bank Passage Fiji nearshore wave hindcast 1 00' 1 00' 1 30' 1 00' 177 00' 177 30' 17 00' 17 30' 17 30' Figure 1. Location maps of the site. The map on the left shows the region. The map on the right
Mango Bay_Resort. Fiji nearshore wave hindcast ' ' 19 00'
 Mango Bay_Resort Fiji nearshore wave hindcast 1 00' 1 30' 1 00' 177 00' 177 30' 17 00' 17 30' Figure 1. Location maps of the site. The map on the left shows the region. The map on the right shows the island
WAVE IMPACTS DUE TO STEEP FRONTED WAVES
 WAVE IMPACTS DUE TO STEEP FRONTED WAVES Bas Buchner and Arjan Voogt Maritime Research Institute Netherlands (MARIN) b.buchner@marin.nl, a.j.voogt@marin.nl INTRODUCTION It is the question whether Rogue
LATLAS. Documentation
 LATLAS Documentation 27.07.2017 1. Project's presentation The LATLAS project aims at supplying an interactive Internet platform with an atlas of waves for the main Swiss lakes. The characteristics of waves
Validation Study of the Lufft Ventus Wind Sensor
 Weather Forecasts Renewable Energies Air and Climate Environmental Information Technology METEOTEST Cooperative Fabrikstrasse 14, CH-3012 Bern Tel. +41 (0)31 307 26 26 Fax +41 (0)31 307 26 10 office@meteotest.ch,
Wave energy converter effects on wave and sediment circulation
 Wave energy converter effects on wave and sediment circulation Grace Chang and Craig Jones Integral Consulting Inc. cjones@integral-corp.com; gchang@integral-corp.com Jesse Roberts, Kelley Ruehl, and Chris
DUXBURY WAVE MODELING STUDY
 DUXBURY WAVE MODELING STUDY 2008 Status Report Duncan M. FitzGerald Peter S. Rosen Boston University Northeaster University Boston, MA 02215 Boston, MA 02115 Submitted to: DUXBURY BEACH RESERVATION November
TRIAXYS Acoustic Doppler Current Profiler Comparison Study
 TRIAXYS Acoustic Doppler Current Profiler Comparison Study By Randolph Kashino, Axys Technologies Inc. Tony Ethier, Axys Technologies Inc. Reo Phillips, Axys Technologies Inc. February 2 Figure 1. Nortek
Technical Brief - Wave Uprush Analysis Island Harbour Club, Gananoque, Ontario
 Technical Brief - Wave Uprush Analysis RIGGS ENGINEERING LTD. 1240 Commissioners Road West Suite 205 London, Ontario N6K 1C7 October 31, 2014 Table of Contents Section Page Table of Contents... i List
Naval Postgraduate School, Operational Oceanography and Meteorology. Since inputs from UDAS are continuously used in projects at the Naval
 How Accurate are UDAS True Winds? Charles L Williams, LT USN September 5, 2006 Naval Postgraduate School, Operational Oceanography and Meteorology Abstract Since inputs from UDAS are continuously used
TITLE: The Importance of Model Validation: Two Case Studies. AUTHOR:Julie Thomas. Scripps Institution of Oceanography, La Jolla, CA.
 TITLE: The Importance of Model Validation: Two Case Studies AUTHOR:Julie Thomas Scripps Institution of Oceanography, La Jolla, CA jothomas@ucsd.edu CO-AUTHOR: Corey Olfe Scripps Institution of Oceanography,
Development and Implementation of a Relocatable Coastal and Nearshore Modeling System
 Development and Implementation of a Relocatable Coastal and Nearshore Modeling System James M. Kaihatu Zachry Department of Civil Engineering, Texas A&M University 3136 TAMU College Station, TX 77843-3136
Avaavaroa passage. Rarotonga nearshore wave hindcast 21 09' 21 12' 21 15' 21 18' ' ' ' '
 Avaavaroa passage Rarotonga nearshore wave hindcast 21 09' 21 ' Fuel Pipeline Avatiu Passage Black Rock Avarua Passage Pue Tupapa Papua Passage Avaavaroa Passage 21 15' Ngatangiia Passage onga Wave Hotspot
COMPARISON OF CONTEMPORANEOUS WAVE MEASUREMENTS WITH A SAAB WAVERADAR REX AND A DATAWELL DIRECTIONAL WAVERIDER BUOY
 31 Bishop Street, Jolimont Western Australia 6014 T +61 8 9387 7955 F +61 8 9387 6686 E info@rpsmetocean.com W rpsmetocean.com & rpsgroup.com.au COMPARISON OF CONTEMPORANEOUS WAVE MEASUREMENTS WITH A SAAB
Appendix E Cat Island Borrow Area Analysis
 Appendix E Cat Island Borrow Area Analysis ERDC/CHL Letter Report 1 Cat Island Borrow Area Analysis Multiple borrow area configurations were considered for Cat Island restoration. Borrow area CI1 is located
COMPARISON OF CONTEMPORANEOUS WAVE MEASUREMENTS WITH A SAAB WAVERADAR REX AND A DATAWELL DIRECTIONAL WAVERIDER BUOY
 COMPARISON OF CONTEMPORANEOUS WAVE MEASUREMENTS WITH A SAAB WAVERADAR REX AND A DATAWELL DIRECTIONAL WAVERIDER BUOY Scott Noreika, Mark Beardsley, Lulu Lodder, Sarah Brown and David Duncalf rpsmetocean.com
Interim Operating Procedures for SonTek RiverSurveyor M9/S5
 Hydroacoustics Technical Working Group: Task 2.3 Fully operationalize auto-adapting ADCPs Interim Operating Procedures for SonTek RiverSurveyor M9/S5 P Campbell, E. Jamieson, F Rainville, A Du Cap, 2014
: Hydrodynamic input for 2D Vessel Simulations (HY- 0027)
") Technical Note To : Christian Taylor (PoHDA) From : Rohan Hudson Cc : Ben Gray Date : 1/04/2015 (Final Draft) Subject : Hydrodynamic input for 2D Vessel Simulations (HY- 0027) Introduction This Technical
Technical Note To : Christian Taylor (PoHDA) From : Rohan Hudson Cc : Ben Gray Date : 1/04/2015 (Final Draft) Subject : Hydrodynamic input for 2D Vessel Simulations (HY- 0027) Introduction This Technical
Plan B Dam Breach Assessment
 Plan B Dam Breach Assessment Introduction In support of the Local Sponsor permit applications to the states of Minnesota and North Dakota, a dam breach analysis for the Plan B alignment of the Fargo-Moorhead
E. Agu, M. Kasperski Ruhr-University Bochum Department of Civil and Environmental Engineering Sciences
 EACWE 5 Florence, Italy 19 th 23 rd July 29 Flying Sphere image Museo Ideale L. Da Vinci Chasing gust fronts - wind measurements at the airport Munich, Germany E. Agu, M. Kasperski Ruhr-University Bochum
Kavala Bay. Fiji nearshore wave hindcast ' ' 19 00'
 Kavala Bay Fiji nearshore wave hindcast 1 00' 19 00' 1 30' 19 00' 1 00' 1 30' 1 00' 1 30' 1 30' Figure 1. Location maps of the site. The map on the left shows the region. The map on the right shows the
13. TIDES Tidal waters
 Water levels vary in tidal and non-tidal waters: sailors should be aware that the depths shown on the charts do not always represent the actual amount of water under the boat. 13.1 Tidal waters In tidal
WindProspector TM Lockheed Martin Corporation
 WindProspector TM www.lockheedmartin.com/windprospector 2013 Lockheed Martin Corporation WindProspector Unparalleled Wind Resource Assessment Industry Challenge Wind resource assessment meteorologists
An Application of Signal Detection Theory for Understanding Driver Behavior at Highway-Rail Grade Crossings
 An Application of Signal Detection Theory for Understanding Driver Behavior at Highway-Rail Grade Crossings Michelle Yeh and Jordan Multer United States Department of Transportation Volpe National Transportation
IPHC Regulatory Area 2A Directed Commercial Pacific Halibut Fishery Sample Vessel Fishing Period Limit Options for Longer Fishing Periods
 Agenda Item G.1.a IPHC Report 1 September 2017 IPHC Report September 2017 IPHC Regulatory Area 2A Directed Commercial Pacific Halibut Fishery Sample Vessel Fishing Period Limit Options for Longer Fishing
MIKE Release General product news for Marine software products, tools & features. Nov 2018
 MIKE Release 2019 General product news for Marine software products, tools & features Nov 2018 DHI 2012 MIKE 3 Wave FM New advanced phase-resolving 3D wave modelling product A MIKE 3 FM Wave model - why?
Site Summary. Wind Resource Summary. Wind Resource Assessment For King Cove Date Last Modified: 8/6/2013 By: Rich Stromberg & Holly Ganser
 Site Summary Wind Resource Assessment For King Cove Date Last Modified: 8/6/2013 By: Rich Stromberg & Holly Ganser Station ID: 2857 Latitude: 55 7 45.8 N Longitude: 162 16 10.6 W Tower Type: 30 m NRG Tall
APPENDIX A Hydrodynamic Model Qualicum Beach Waterfront Master Plan
 Page 1 of 21 CLIENT: Town of Qualicum Beach PROJECT: SIGNATURE DATE CONTRIBUTORS : M. Marti Lopez REVIEWED BY : P. St-Germain, EIT APPROVED BY: J. Readshaw, P.Eng ISSUE/REVISION INDEX Issue Details Code
SCIENTIFIC COMMITTEE SEVENTH REGULAR SESSION August 2011 Pohnpei, Federated States of Micronesia
 SCIENTIFIC COMMITTEE SEVENTH REGULAR SESSION 9-17 August 2011 Pohnpei, Federated States of Micronesia CPUE of skipjack for the Japanese offshore pole and line using GPS and catch data WCPFC-SC7-2011/SA-WP-09
Wave-Current Interaction in Coastal Inlets and River Mouths
 DISTRIBUTION STATEMENT A. Approved for public release; distribution is unlimited. Wave-Current Interaction in Coastal Inlets and River Mouths Tim T. Janssen Department of Geosciences, San Francisco State
HURRICANE SANDY LIMITED REEVALUATION REPORT UNION BEACH, NEW JERSEY DRAFT ENGINEERING APPENDIX SUB APPENDIX D SBEACH MODELING
 HURRICANE SANDY LIMITED REEVALUATION REPORT UNION BEACH, NEW JERSEY DRAFT ENGINEERING APPENDIX SUB APPENDIX D SBEACH MODELING Rev. 18 Feb 2015 1 SBEACH Modeling 1.0 Introduction Following the methodology
SEASONDE DETECTION OF TSUNAMI WAVES
 SEASONDE DETECTION OF TSUNAMI WAVES Belinda Lipa, John Bourg, Jimmy Isaacson, Don Barrick, and Laura Pederson 1 I. INTRODUCTION We here report on preliminary results of a study to assess the capability
April 7, Prepared for: The Caribbean Disaster Emergency Response Agency Prepared by: CEAC Solutions Co. Ltd.
 April 7, 2006 Prepared for: The Caribbean Disaster Emergency Response Agency Prepared by: Introduction CEAC Solutions Co. Ltd was commissioned in May 2005 to prepare coastal beach erosion hazard maps for
High-Resolution Measurement-Based Phase-Resolved Prediction of Ocean Wavefields
 DISTRIBUTION STATEMENT A. Approved for public release; distribution is unlimited. High-Resolution Measurement-Based Phase-Resolved Prediction of Ocean Wavefields Dick K.P. Yue Center for Ocean Engineering
The Icelandic Information System on Weather and Sea State Related to Fishing Vessels Crews and Stability
 The Icelandic Information System on Weather and Sea State Related to Fishing Vessels Crews and Stability Seminar on Fishing Vessels Crews and Stability World Fishing Exhibition 2009, Vigo Spain September
The role of large-scale modes of climate variability on the Cape Point wave record
 GODAE OceanView 5th COSS-TT meeting, Cape Town 2017 The role of large-scale modes of climate variability on the Cape Point wave record Jennifer Veitch1, Andrew Birkett2, Juliet Hermes1, Christo Rautenbach,
Windcube FCR measurements
 Windcube FCR measurements Principles, performance and recommendations for use of the Flow Complexity Recognition (FCR) algorithm for the Windcube ground-based Lidar Summary: As with any remote sensor,
Coastal and marine recreation in New England is ingrained in the region s economic and
 RECREATION Coastal and marine recreation in New England is ingrained in the region s economic and social fabric. Recreation on the ocean and coast includes many of New Englanders most time-honored and
Reply of Guyana Annex R2
 Summary of Findings: Analysis of Recent Shoreline Revisions to the This report assesses recent shoreline changes made to the 2005 edition of Dutch nautical chart NL 2218. This new edition is credited jointly
Ngatangiia passage. Rarotonga nearshore wave hindcast 21 09' 21 12' 21 15' 21 15' 21 18' ' ' ' '
 Ngatangiia passage Rarotonga nearshore wave hindcast 21 0' 21 ' Fuel Pipeline Avatiu Passage Black Rock Avarua Passage Pue Tupapa Ngatangiia Passage 21 15' Ngatangiia Passage onga Wave Hotspot Rutaki Passage
Examples of Carter Corrected DBDB-V Applied to Acoustic Propagation Modeling
 Naval Research Laboratory Stennis Space Center, MS 39529-5004 NRL/MR/7182--08-9100 Examples of Carter Corrected DBDB-V Applied to Acoustic Propagation Modeling J. Paquin Fabre Acoustic Simulation, Measurements,
Wave research at Department of Oceanography, University of Hawai i
 Wave research at Department of Oceanography, University of Hawai i Hawaii wave climate. Directional waverider buoys around Hawaii. Past and present wave-related research projects. Effect of tides on wave
Field Evaluation of the Wave Module for NDBC s New Self-Contained Ocean Observing Payload (SCOOP) on Modified NDBC Hulls
 on Modified NDBC Hulls") Field Evaluation of the Wave Module for NDBC s New Self-Contained Ocean Observing Payload (SCOOP) on Modified NDBC Hulls Richard H. Bouchard 1, Rodney R. Riley 1, Lex A. LeBlanc 1, Michael Vasquez 1, Michael
Field Evaluation of the Wave Module for NDBC s New Self-Contained Ocean Observing Payload (SCOOP) on Modified NDBC Hulls Richard H. Bouchard 1, Rodney R. Riley 1, Lex A. LeBlanc 1, Michael Vasquez 1, Michael
Analysis of Crude Oil Tanker Ballast Water Data for Valdez & Prince William Sound, Alaska. Final Report
 952.431.140430.TankerBallast Analysis of Crude Oil Tanker Ballast Water Data for Valdez & Prince William Sound, Alaska Final Report Presented To: Prince William Sound Regional Citizens Advisory Council
Evaluation of the Wisconsin DOT Walking Profiler
 Final Report Evaluation of the Wisconsin DOT Walking Profiler March 2007 U.S. Department of Transportation Federal Highway Administration Notice This document is disseminated under the sponsorship of the
ABNORMALLY HIGH STORM WAVES OBSERVED ON THE EAST COAST OF KOREA
 ABNORMALLY HIGH STORM WAVES OBSERVED ON THE EAST COAST OF KOREA WEON MU JEONG 1 ; SANG-HO OH ; DONGYOUNG LEE 3 ; KYUNG-HO RYU 1 Coastal Engineering Research Department, Korea Ocean Research and Development
Minimal influence of wind and tidal height on underwater noise in Haro Strait
 Minimal influence of wind and tidal height on underwater noise in Haro Strait Introduction Scott Veirs, Beam Reach Val Veirs, Colorado College December 2, 2007 Assessing the effect of wind and currents
APPENDIX D-2. Sea Level Rise Technical Memo
 APPENDIX D-2 Sea Level Rise Technical Memo 2185 N. California Blvd., Suite 500 Walnut Creek, CA 94596 (925) 944-5411 Fax: (925) 944-4732 www.moffattnichol.com DRAFT MEMORANDUM To: From: Neil Nichols,
Currents measurements in the coast of Montevideo, Uruguay
 Currents measurements in the coast of Montevideo, Uruguay M. Fossati, D. Bellón, E. Lorenzo & I. Piedra-Cueva Fluid Mechanics and Environmental Engineering Institute (IMFIA), School of Engineering, Research
Predicting wave conditions in a coral embayment from offshore directional spectral model input
 Predicting wave conditions in a coral embayment from offshore directional spectral model input Ron Hoeke 1,2 and Curt Storlazzi 3 1 Coral Reef Ecosystem Division (CRED) NOAA Pacific Islands Fisheries Science
Atmospheric Waves James Cayer, Wesley Rondinelli, Kayla Schuster. Abstract
 Atmospheric Waves James Cayer, Wesley Rondinelli, Kayla Schuster Abstract It is important for meteorologists to have an understanding of the synoptic scale waves that propagate thorough the atmosphere
CVEN Computer Applications in Engineering and Construction. Programming Assignment #4 Analysis of Wave Data Using Root-Finding Methods
 CVEN 30-501 Computer Applications in Engineering and Construction Programming Assignment #4 Analysis of Wave Data Using Root-Finding Methods Date distributed: 9/30/016 Date due: 10/14/016 at 3:00 PM (electronic
Dear Mr. Nicolini: Qualitative Pedestrian Level Wind Assessment Montreal Road, Ottawa GWE File No.: DTPLW
 August 17, 2015 Anthony Nicolini 2068358 Ontario Inc. (Darwin Group) 183 Michael Cowpland Drive Ottawa, Ontario K2M 0M3 Dear Mr. Nicolini: Re: Qualitative Pedestrian Level Wind Assessment 807-825 Montreal
Technical Brief - Wave Uprush Analysis 129 South Street, Gananoque
 Technical Brief - Wave Uprush Analysis 129 South Street, Gananoque RIGGS ENGINEERING LTD. 1240 Commissioners Road West Suite 205 London, Ontario N6K 1C7 June 12, 2013 Table of Contents Section Page Table
DEVELOPMENT AND TESTING OF AIR EXCHANGE RATE METHODS TO IMPROVE COST EFFECTIVENESS WHILE MAINTAINING ACCURACY
 DEVELOPMENT AND TESTING OF AIR EXCHANGE RATE METHODS TO IMPROVE COST EFFECTIVENESS WHILE MAINTAINING ACCURACY Prepared by: Joachim Eberharter (Joachim.Eberharter@tetratech.com) and James Elliot (Tetra
Computational Analysis of Oil Spill in Shallow Water due to Wave and Tidal Motion Madhu Agrawal Durai Dakshinamoorthy
 Computational Analysis of Oil Spill in Shallow Water due to Wave and Tidal Motion Madhu Agrawal Durai Dakshinamoorthy 1 OUTLINE Overview of Oil Spill & its Impact Technical Challenges for Modeling Review
Modeling Results for Glacier Bay
 Chapter 9 Modeling Results for Glacier Bay Finally, attention is now turned to a number of specific results of interest for the Glacier Bay domain. 9.1 Water Surface Elevation In the previous chapter,
NEED FOR SUPPLEMENTAL BATHYMETRIC SURVEY DATA COLLECTION
 305 West Grand Avenue, Suite 300 Montvale, New Jersey 07645 Phone 201.930.9890 Fax 201.930.9805 www.anchorqea.com M EMORANDUM To: Caroline Kwan and Nica Klaber U.S. Environmental Protection Agency Region
HARBOUR SEDIMENTATION - COMPARISON WITH MODEL
 HARBOUR SEDIMENTATION - COMPARISON WITH MODEL ABSTRACT A mobile-bed model study of Pointe Sapin Harbour, in the Gulf of St. Lawrence, resulted in construction of a detached breakwater and sand trap to
AMSA A Roadmap Forward & Relevant Alaska Activities. Captain Bob Pawlowski, NOAA (Ret), MNI Legislative Liaison to the Denali Commission
, MNI Legislative Liaison to the Denali Commission") AMSA A Roadmap Forward & Relevant Alaska Activities Captain Bob Pawlowski, NOAA (Ret), MNI Legislative Liaison to the Denali Commission Selected AMSA Key Findings UNCLOS: Fundamental framework IMO: Competent
AMSA A Roadmap Forward & Relevant Alaska Activities Captain Bob Pawlowski, NOAA (Ret), MNI Legislative Liaison to the Denali Commission Selected AMSA Key Findings UNCLOS: Fundamental framework IMO: Competent
APPENDIX J REQUIRED NAVIGATION PERFORMANCE IMPACTS EVALUATION REPORT
 APPENDIX J REQUIRED NAVIGATION PERFORMANCE IMPACTS EVALUATION REPORT February 01, 2007 Naverus, Inc. Seattle, WA This document contains commercially sensitive information and must be treated as Naverus,
Draft Kivalina Wind Resource Report
 Draft Kivalina Wind Resource Report Kivalina aerial photo by Doug Vaught, July 2011 May 31, 2012 Douglas Vaught, P.E. dvaught@v3energy.com V3 Energy, LLC Eagle River, Alaska Draft Kivalina Wind Resource
1999 On-Board Sacramento Regional Transit District Survey
 SACOG-00-009 1999 On-Board Sacramento Regional Transit District Survey June 2000 Sacramento Area Council of Governments 1999 On-Board Sacramento Regional Transit District Survey June 2000 Table of Contents
ValidatingWindProfileEquationsduringTropicalStormDebbyin2012
 Global Journal of Researches in Engineering: e Civil And Structural Engineering Volume 4 Issue Version. Year 24 Type: Double Blind Peer Reviewed International Research Journal Publisher: Global Journals
WAVE FORECASTING FOR OFFSHORE WIND FARMS
 9 th International Workshop on Wave Hindcasting and Forecasting, Victoria, B.C. Canada, September 24-29, 2006 WAVE FORECASTING FOR OFFSHORE WIND FARMS Morten Rugbjerg, Ole René Sørensen and Vagner Jacobsen
WIND SPEED LENGTH OF TIME WIND BLOWS (Duration) DISTANCE OVER WHICH IT BLOWS (Fetch)
 DISTANCE OVER WHICH IT BLOWS (Fetch)") WAVES Up and down movement of ocean surface Transportation of energy across the water over vast distances If not stopped by anything, waves can travel entire oceans Size and speed depend upon: WIND SPEED
WAVES Up and down movement of ocean surface Transportation of energy across the water over vast distances If not stopped by anything, waves can travel entire oceans Size and speed depend upon: WIND SPEED
Torrild - WindSIM Case study
 Torrild - WindSIM Case study Note: This study differs from the other case studies in format, while here another model; WindSIM is tested as alternative to the WAsP model. Therefore this case should be
Appendix M: Durras Lake Tailwater Conditions
 Appendix M: Durras Lake Tailwater Conditions M.1 Preamble WRL has completed a tailwater condition assessment for the entrance to Durras Lake, to be used as an ocean boundary condition for a future flood
CALCASIEU SALINITY STRUCTURES. HYDRODYNAMIC MODELING (To Support Design of Salinity Barriers)
") CALCASIEU SALINITY STRUCTURES HYDRODYNAMIC MODELING (To Support Design of Salinity Barriers) Presentation Overview 1 2 3 4 5 Project Overview and CEA Circulation Modeling Vessel Hydrodynamics Modeling
CALCASIEU SALINITY STRUCTURES HYDRODYNAMIC MODELING (To Support Design of Salinity Barriers) Presentation Overview 1 2 3 4 5 Project Overview and CEA Circulation Modeling Vessel Hydrodynamics Modeling
Figure 4, Photo mosaic taken on February 14 about an hour before sunset near low tide.
 The Impact on Great South Bay of the Breach at Old Inlet Charles N. Flagg and Roger Flood School of Marine and Atmospheric Sciences, Stony Brook University Since the last report was issued on January 31
BWS ONLINE FORECASTING BERTH OPERATING SAFETY. Matthew R. O Halloran, Daphne Choong
 BWS ONLINE FORECASTING BERTH OPERATING SAFETY Matthew R. O Halloran, Daphne Choong OMC International Pty Ltd, 2/2 Walmer St, Abbotsford, Vic 3067, Australia matthew@omc-international.com.au daphne@omc-international.com.au
BILLY BISHOP TORONTO CITY AIRPORT PRELIMINARY RUNWAY DESIGN COASTAL ENGINEERING STUDY
 Bâtiment Infrastructures municipales Transport Industriel Énergie Environnement BILLY BISHOP TORONTO CITY AIRPORT PRELIMINARY RUNWAY DESIGN COASTAL ENGINEERING STUDY N. Guillemette 1, C. Glodowski 1, P.
DP Ice Model Test of Arctic Drillship
 Author s Name Name of the Paper Session DYNAMIC POSITIONING CONFERENCE October 11-12, 211 ICE TESTING SESSION DP Ice Model Test of Arctic Drillship Torbjørn Hals Kongsberg Maritime, Kongsberg, Norway Fredrik
Nearshore Wind-Wave Forecasting at the Oregon Coast. Gabriel García, H. Tuba Özkan-Haller, Peter Ruggiero November 16, 2011
 Nearshore Wind-Wave Forecasting at the Oregon Coast Gabriel García, H. Tuba Özkan-Haller, Peter Ruggiero November 16, 2011 What is Wave Forecasting? An attempt to predict how the ocean surface is going
On the Challenges of Analysis and Design of Turret-Moored FPSOs in Squalls
 On the Challenges of Analysis and Design of Turret-Moored FPSOs in Squalls Arun Duggal Amir Izadparast Yu Ding 19th SNAME Offshore Symposium 6 February 2014 Overview Squalls, History & Current Practice
Evaluating Extreme Storm Power and Potential Implications to Coastal Infrastructure Damage, Oregon Coast, USA
 Evaluating Extreme Storm Power and Potential Implications to Coastal Infrastructure Damage, Oregon Coast, USA 1.0 INTRODUCTION Heidi P. Moritz, P.E. and Hans R. Moritz, P.E. U. S. Army Corps of Engineers,
Data Analysis of the Seasonal Variation of the Java Upwelling System and Its Representation in CMIP5 Models
 Data Analysis of the Seasonal Variation of the Java Upwelling System and Its Representation in CMIP5 Models Iulia-Mădălina Ștreangă University of Edinburgh University of Tokyo Research Internship Program
Emission Inventory Evaluation Using DISCOVER-AQ Aircraft Data
 Emission Inventory Evaluation Using DISCOVER-AQ Aircraft Data Gary McGaughey, David Allen (PI) and Elena McDonald-Buller (co-pi) Center for Energy and Environmental Resources The University of Texas at