SUPPORTING REPORT OF ENGINEERING STUDY
|
|
|
- Emil Mathews
- 5 years ago
- Views:
Transcription


1
2
3
4 SUPPORTING REPORT OF ENGINEERING STUDY Table of Contents A: Road Traffic Count Survey and Land Acquisition Map B: Natural Conditions Survey C: Environmental Conditions Survey D: Wave Hindcast in Western Java Sea E: Design of Breakwaters F: Tranquility Analysis; Required Length of Breakwater For Bojonegara Port Development G: Tranquility Analysis of Tanjung Priok Port Master Plan H: Marine Geophysical Survey at Bojonegara I: Dredging Works at Bojonegara Development J: Dredging Works at Tanjung Priok Port for Channel And Basin Improvement K: Canal Diversion at Bojonegara Development Site L: Construction Procurement and Cost Estimate
5 Appendix A
6
7

8
9


10

11
12
13
14
15
16

17


18


19
20


21
22
23
24


25

26
27
28
29
30 Appendix B: Natural Conditions Survey APPENDIX B: NATURAL CONDITIONS SURVEY CONTENTS 1. Natural Condition at Tanjung Priok Port 1.1 Natural Condition Survey by Study Team :10,000 Scale Digital Topographic Mapping Sounding Survey Soil Investigation and Soil Laboratory Test 1.2 Topography 1.3 Seabed Depth Condition 1.4 Climate 1.5 Tide 1.6 Wave 1.7 Surface Current and Tidal Stream 1.8 Maintenance Dredging 1.9 Estimation of Seabed Variation 2. Natural Condition at Bojonegara 2.1 Natural Condition Survey by Study Team :10,000 Scale Digital Topographic Mapping Sounding Survey Topographic Survey Soil Investigation and Soil Laboratory Test Seismic Reflection Survey Primary Wave Logging 2.2 Topography 2.3 Seabed Depth Condition 2.4 Climate 2.5 Tide 2.6 Wave 2.7 Tidal Stream 2.8 Maintenance Dredging 2.9 Estimation of Seabed Variation APPENDIX Appendix 1 Appendix 2 Appendix 3 Appendix 4 Appendix 5 1:10,000 Scale Topographic/Sounding Map at Tanjung Priok Port 1:10,000 Scale Topographic/Sounding Map at Bojonegara 1:10,000 Scale Topographic Map at Bojonegara 1:10,000 Scale Topographic/Hydrographic Map at Bojonegara 1:10,000 Scale Topographic/Bedrock Contour Map at Bojonegara FIGURES Figure Figure Figure Figure Figure Figure Figure Figure Figure :10,000 Scale Digital Topographic Mapping Area, Tanjung Priok Port Existing Sounding Map, Tanjung Priok Port Sounding Survey Area, Tanjung Priok Port Bar Check before Sounding Survey, Tanjung Priok Port Location of New and Existing Boring Points and Geological Profile Lines, Tanjung Priok Port Geological Profile (B B Section) at Existing Eastern Breakwater, Tanjung Priok Port Geological Profile (C C ) at Existing Western Breakwater, Tanjung Priok Port Geological Profile (D D Section) at Existing Front Breakwater, Tanjung Priok Port Geological Profile (E E Section) at Entrance of Western Channel, Tanjung Priok Port i
31 Appendix B: Natural Conditions Survey Figure Figure Figure Figure Figure Figure Figure Figure Figure Figure Figure Figure Figure Figure Figure Figure Figure Geological Profile (A A Section) at New West Development Site, Tanjung Priok Port Drilling Log (No. OSB-1), Tanjung Priok Port Drilling Log (No. OSB-2), Tanjung Priok Port Drilling Log (No. OSB-3), Tanjung Priok Port Offshore Boring, Tanjung Priok Port Offshore Boring, Tanjung Priok Port Terusan Lagoa Kali Sunter Baru History of Tanjung Priok Port Relation between Vertical Reference Points for Natural Condition Survey and Tide, Tanjung Priok Port Predominant Surface Current of Sea around West Jawa Annual Maintenance Dredging Volume at Major Channel and Basin, Tanjung Priok Port Tanjung Priok Port Dredging by Grab Dredger, Tanjung Priok Port Estimation of Yearly Seabed Variation, Tanjung Priok Port Longitudinal Profile at Channel Center of Pelabuhan Minyak, Tanjung Priok Port Seabed Variation at Channel Center of Pelabuhan Minyak, Tanjung Priok Port Figure :10,000 Scale Digital Topographic Mapping Area, Bojonegara Figure Existing Sounding Map, Bojonegara Figure Topographic and Sounding Survey Area, Bojonegara Figure Tide Gauge for Sounding Survey, Bojonegara Figure Topographic Survey, Bojonegara Figure Location of Existing Boring Points, Bojonegara Figure Geological Profile (B - B Section) at Proposed Project Site, Bojonegara Figure Geological Profile (C - C Section) at Proposed Project Site, Bojonegara Figure Geological Profile (D - D Section) at Proposed Project Site, Bojonegara Figure Location of Soil Boring, Bojonegara Figure Geological Profile (A - A Section), Bojonegara Figure Drilling Log (No. OSB-1), Bojonegara Figure Drilling Log (No. OSB-2), Bojonegara Figure Drilling Log (No. OSB-3), Bojonegara Figure Drilling Log (No. OSB-4), Bojonegara Figure Seismic Reflection Survey Area, Bojonegara Figure Original Seismic Reflection Survey Data and Interpretated Sub-bottom Profile Figure Bedrock Contour Line Map, Bojonegara Figure Tow Fish for Seismic Reflection Survey, Bojonegara Figure Equipment for Seismic Reflection Survey, Bojonegara Figure Location of Rock Boring, Bojonegara Figure Drilling Log (No. BH-1), Bojonegara Figure Boring Core of Rock Boring at BH-1, Bojonegara Figure Boring Core of Rock Boring at BH-1, Bojonegara Figure Drilling Log (No. BH-2), Bojonegara Figure Boring Core of Rock Boring at BH-2, Bojonegara Figure Drilling Log (No. BH-3), Bojonegara Figure Boring Core of Rock Boring at BH-3, Bojonegara Figure Results of P-Wave Logging Survey, Bojonegara Figure Distribution of Primary Wave Velocity in Rocks in Japan Figure Hammering Casing Pipe to Generate Source Wave, Bojonegara Figure Geophone to be Lowered into Borehole, Bojonegara Figure Rippability Guide Value Figure Workability of Rock (after Muir Wood, 1972) Figure Workability of Rock (after Franklin et al., 1971) Figure Strength Diagram for Jointed Rock Masses (after Bieniawski, 1974) Figure Project Site, Bojonegara Figure Project Site, Bojonegara ii
32 Appendix B: Natural Conditions Survey Figure Figure Figure Figure Figure Figure Project Site, Bojonegara Longitudinal Water Depth Profile (A - A Section), Bojonegara Longitudinal Water Depth Profile (B - B Section), Bojonegara Longitudinal Water Depth Profile, Bojonegara Relation between Vertical Reference Pints for Natural Condition Survey and Tide, Bojonegara Estimation of Yearly Seabed Variation, Bojonegara TABLES Table Horizontal Coordinates of Control Points for Photogrammetric Mapping Table List of Existing Sounding Map, Tanjung Priok Port Table Location of Existing Boring Points, Tanjung Priok Port Table Horizontal Coordinates and Elevation, and Boring Depth, Tanjung Priok Port Table Outline of Soil Condition at Boring No. OSB-1, Tanjung Priok Port Table Outline of Soil Condition at Boring No. OSB-2, Tanjung Priok Port Table Outline of Soil Condition at Boring No. OSB-3, Tanjung Priok Port Table Summary of Soil Laboratory Test at Boring No. OSB-1, Tanjung Priok Port Table Summary of Soil Laboratory Test at Boring No. OSB-2, Tanjung Priok Port Table Summary of Soil Laboratory Test at Boring No. OSB-3, Tanjung Priok Port Table Climate of West Jawa Region (Jakarta) Compiled from Observation Table Tide and Principal Harmonic Components, Tanjung Priok Port Table Four Principal harmonic Components Table Ratio of Principal Harmonic Constants: (K 1 +O 1 )/(M 2 +S 2 ) Table Wave Characteristics off-tanjung Priok by Wave Hindcast ( ) Table Summary of Maintenance Dredging in Channel and Basin, Tanjung Priok Port Table Estimation of Yearly Seabed Variation, Tanjung Priok Port Table Horizontal Coordinates and Elevation of Control Points for Photogrammetric Mapping Table Horizontal Coordinates and Elevation of Control Points for Topographic Mapping Table Elevation of Bedrock by the Existing Boring Data, Bojonegara Table Horizontal Coordinates and Elevation, and Boring Depth, Bojonegara Table Outline of Soil Condition at Boring No. OSB-1, Bojonegara Table Outline of Soil Condition at Boring No. OSB-2, Bojonegara Table Outline of Soil Condition at Boring No. OSB-3, Bojonegara Table Outline of Soil Condition at Boring No. OSB-4, Bojonegara Table Summary of Soil Laboratory Test at Boring No. OSB-1, Bojonegara Table Summary of Soil Laboratory Test at Boring No. OSB-2, Bojonegara Table Summary of Soil Laboratory Test at Boring No. OSB-3, Bojonegara Table Summary of Soil Laboratory Test at Boring No. OSB-4, Bojonegara Table Soil Situation of Planned Site of Port Development at Bojonegara through Analysis of Seismic Reflection Survey Table Horizontal Coordinates, Elevation, and Boring Depth of Rock Boring Points Required for Primary Wave Logging, Bojonegara Table Outline of Rock Boring Results, Bojonegara (No. BH-1) Table Outline of Rock Boring Results, Bojonegara (No. BH-2) Table Outline of Rock Boring Results, Bojonegara (No. BH-3) Table Strength Characteristics of Rock Core Samples, Bojonegara Table Relationship between RQD and Rock Quality Level Table RQDs of Rck Samples, Bojonegara Table Rock Mass Classification by the CRIEPI Table Physical Property and CRIEPI Classification Table Summary of P-Wave Logging Survey, Bojonegara Table Anticipated Materials to be Dredged up to 15 m LLWS Table Soil Types and Compatible Dredging Ship Types Table Tide and the Principal Harmonic Components, Suralaya Table Tide and the Principal Harmonic Components, Bojonegara Table Wave Characteristics of off-bojonegara by Wave Hindcast ( ) iii
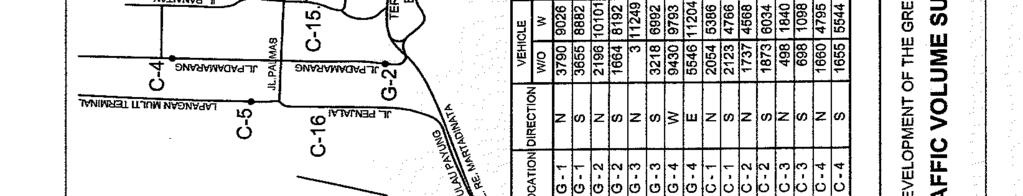
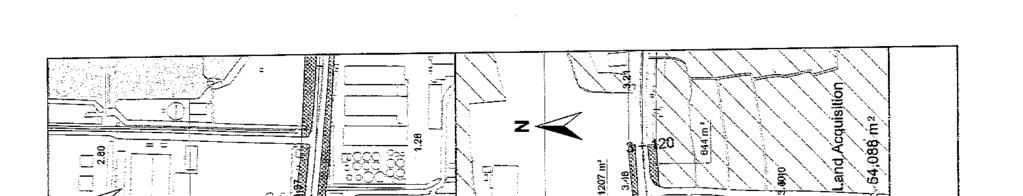
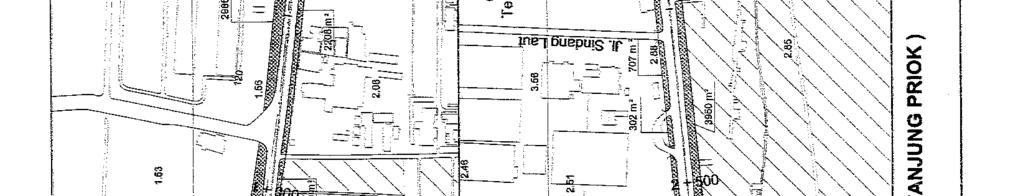
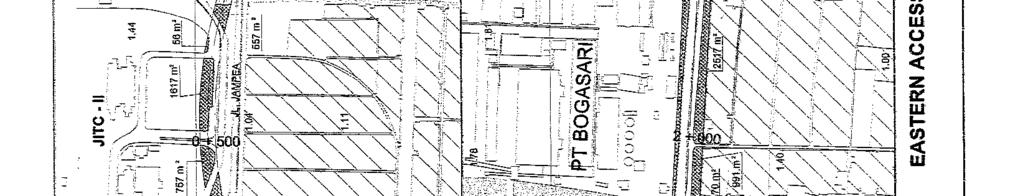
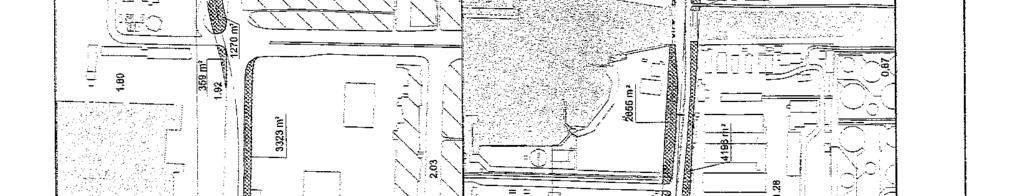
33 Appendix B: Natural Conditions Survey 1. Natural Condition at Tanjung Priok Port 1.1 Natural Condition Survey by Study Team :10,000 Scale Digital Topographic Mapping Urbanization and overpopulation affected the surrounding area of Tanjung Priok Port, resulting in heavy traffic congestion around the port facilities. The problem of traffic congestion around this port among other factors hindered the prosperity and redevelopment of Tanjung Priok Port. On the other hand, the present premises of the port facilities offer little space for expansion, so that any other site than the present facilities site should be considered for redevelopment of the said Port. The 1:10,000 scale digital topographic maps covering the Tanjung Priok Port and its surrounding area were produced by photogrammetric mapping method for the main purposes of planning the construction of access roads to the port facilities and selecting the sites of the planned new port facilities. Figure :10,000 Scale Digital Topographic Mapping Area, Tanjung Priok Port shows the mapping area of 1:10,000 scale digital topographic mapping of Tanjung Priok Port by photogrammetric method. The specifications of the 1:10,000 scale digital topographic maps produced are as follows: 1) Scale of topographic mapping 1:10,000 2) Mapping area Approximately 3,600 ha A-0 size, 1 sheet 3) Spheroid WGS-84 4) Map projection Universal Transverse Mercator (U.T.M.) Zone No. 48 5) Datum level Lowest Low Water Level (LLWL) 6) Reference point of elevation PEM. DKI/P.05 (Existing benchmark established by DKI Jakarta) Elevation = Elevation from MSL m (Z 0 ) = m m = m 7) Aerial photos Existing 1:10,000 scale aerial photo taken in December ) Contour line interval 1 m 9) Format style of digital data AutoCAD format The horizontal coordinates and the elevation of the control points used for photogrammetric mapping are shown in Table Horizontal Coordinates of Control Points for Photogrammetric Mapping. Table Horizontal Coordinates of Control Points for Photogrammetric Mapping BM ID Horizontal Coordinates X (m) Y (m) Elevation (m) , ,324, ,366,630 9,321, , ,321, , ,321, , ,321, , ,323, , ,323, , ,323, , ,323, , ,324, Note: Spheroid: WGS-84, Projection: U.T.M. Zone No. 48 Datum of elevation: LLWS Reference point for elevation: PEM. DKI/P.05, Elevation = Elevation from MSL m = m = m Appendix-1 shows the topographic/sounding map in which the latest results of sounding survey at navigational channels and anchorages are added to the produced 1:10,000 scale digital topographic maps. B-1
34
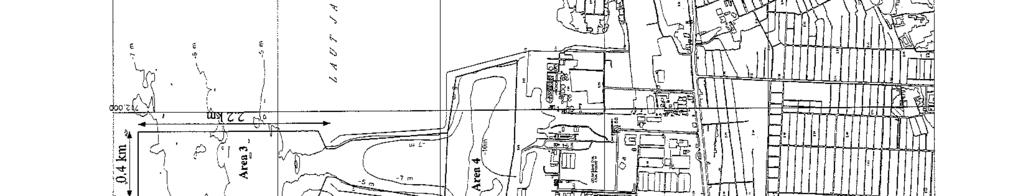
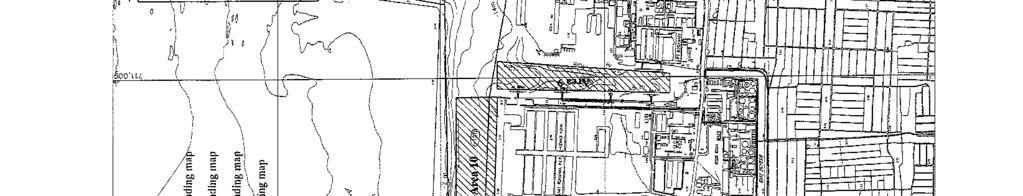
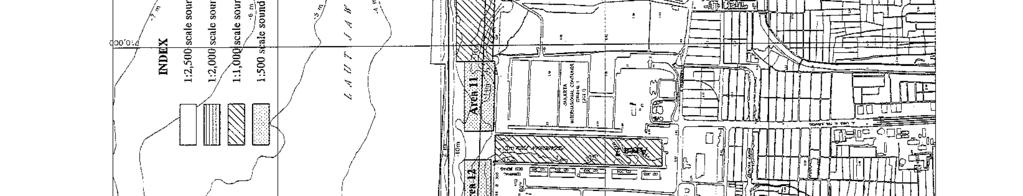
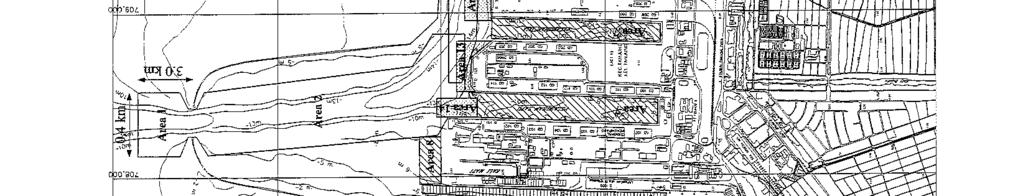
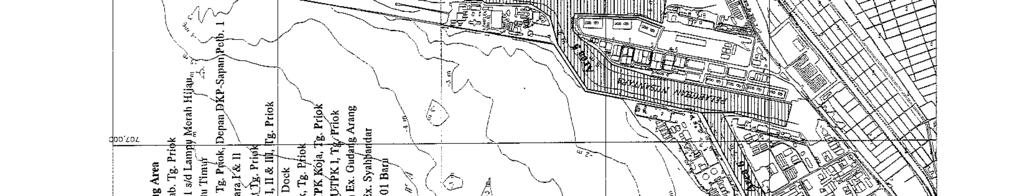
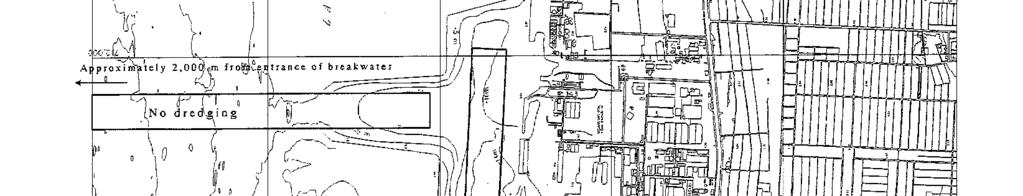
35 Appendix B: Natural Conditions Survey Sounding Survey a) Existing Sounding Data The first facilities at Tanjung Priok Port were constructed at the end of the 19 th Century and the entrance channels, breakwaters, basins and port facilities were expanded for more than one century. In Tanjung Priok Port, sounding surveys are made several times a year and are used for maintenance dredging, and eventually for the construction of port facilities, so that sufficient sounding data including the latest sounding maps are accumulated and kept by IPC-2. Data collected by the JICA Study Team on the existing sounding surveys made, Tanjung Priok Port for the past 3 years are shown in Table List of Existing Sounding Map, Tanjung Priok Port. The ranges of sounding surveys are given in Figure Existing Sounding Map at Tanjung Priok Port. These data were used to estimate the changes in the seabed surface in Tanjung Priok Port and entrance channels. b) Sounding Survey As already mentioned above, the sounding survey at Tanjung Priok Port has been made by IPC-2 periodically. However, the sounding survey at the east entrance channel has not been made in recent years because this channel is not used at present. In addition, the sounding map of the planned west development site has not been provided yet. Thus, the sounding survey at Tanjung Priok Port was made in order to investigate the actual conditions of the water area for the east entrance channel rehabilitation plan and the front water area of the west development area for which the expansion of port facilities for Tanjung Priok Port is planned. The range of sounding survey is shown in Figure Sounding Survey Area, Tanjung Priok Port. The specifications of the sounding survey that has been carried out are shown below. East Entrance Channel 1) Sounding survey area Approximately 0.8 km 4.3 km (344 ha) 2) Sounding line direction Perpendicular to the center line of entrance channel 3) Sounding line interval 50 m 4) Positioning method GPS 5) Sounding method Deeper than 2 m: echo sounder Less than 2 m: staff or lead 6) Scale of sounding map prepared 1:2,500 7) Spheroid WGS-84 8) Map projection Universal Transverse Mercator (U.T.M.) Zone No. 48 9) Datum level Lowest Low Water Level 10) Reference point for elevation Tide pole at Tanjung Priok Port owned by IPC-2 11) Format style of digital data AutoCAD format West New Development Area 1) Sounding survey area Approximately 2 km 3.3 km (500 ha) 2) Sounding line direction East West direction 3) Sounding line interval 100 m 4) Positioning method GPS 5) Sounding method Deeper than 2 m: echo sounder Less than 2 m: staff or lead 6) Scale of sounding map prepared 1:10,000 7) Spheroid WGS-84 8) Map projection Universal Transverse Mercator (U.T.M.) Zone No. 48 9) Datum level Lowest Low Water Level 10) Reference point for elevation Tide pole at Tanjung Priok Port owned by IPC-2 11) Format style of digital data AutoCAD format B-3

36 Appendix B: Natural Conditions Survey Appendix-1 shows the topographic/sounding maps in which the results of sounding survey are added to the 1:10,000 scale digital topographic maps produced at the same time as the sounding survey. Figure Bar Check before Sounding Survey, Tanjung Priok Port B-4
37 Area No No. From Date of Observation To D M Y D M Y Check Sounding Ambang Luar Pelb. Tg. Priok 1:2, Hasil Pengukuran Kedalaman di Alur Amang Luar Pintu Barat Dalam Rangka Check Sounding 1:2, Hasil Pengukuran Kedalaman di Alur Amang Luar Pintu Barat Dalam Rangka Final Sounding 1:2, Hasil Pengukuran Kedalaman di Alur Amang Luar Pintu Barat Dalam Rangka Check Sounding 1:2, Hasil Pengukuran Kedalaman di Alur Amang Luar Pintu Barat Dalam Rangka Check Sounding 1:2, Hasil Pengukuran Kedalaman di Alur Amang Luar Pintu Barat Dalam Rangka Check Sounding 1:2, Hasil Pengukuran Kendalaman Utara Pelb. I s/d Lampu Merah Hijau Dalam Rangka Final Sounding 1:2, Hasil Pengukuran Kedalaman Alur Utara Pelb. Is/d Lampu Merah Hijau Dalam Rangka Check Sounding 1:2, Hasil Pengukuran Kedalaman Alur Utara Pelb. Is/d Lampu Merah Hijau Dalam Rangka Check Sounding 1:2, Hasil Pengukuran Kedalaman Alur Utara Pelb. Is/d Lampu Merah Hijau Dalam Rangka Check Sounding 1:2, Hasil Pengukuran Kedalaman Alur Utara Pelb. Is/d Lampu Merah Hijau Dalam Rangka Check Sounding 1:2, Check sounding Ambang Luar Pintu Timur, Tanjung Priok 1:2, Hasil Pengukuran Kedalaman di Alur Timur Dalam Rangka, Check Sounding 1:2, Hasil Pengukuran Kedalaman di Alur Timur Dalam Rangka, Check Sounding 1:2, Hasil Pengukuran Kedalaman di Alur Timur Dalam Rangka, Check Sounding 1:2, Hasil Pengukuran Kedalaman di Alur Timur Dalam Rangka, Check Sounding 1:2, Check sounding, Alur Dalam Pelab. Tg. Priok, Depan DKP - Depan Pelb.1 1:2, Hasil Pengukuran Kedalaman Alur Dalam Pelab. Tg. Priok Dalam Rangka, Final Sounding 1:2, Hasil Pengukuran Kedalaman Alur Dalam Pelab. Tg. Priok Dalam Rangka, Check Sounding 1:2, Hasil Pengukuran Kedalaman Di Alur Dalam Pelab. Tg. Priok Dalam Rangka, Final Sounding 1:2, Hasil Pengukuran Kedalaman Alur Dalam Pelab. Tg. Priok Dalam Rangka, Check Sounding 1:2, Predredge Sounding Pelabuhan Nusantara I & II, Tanjung Priok 1:2, Hasil Pengukuran Kedalaman Pelabuhan Nusantara I & II, Tg. Priok, Dalam Rangka Check Sounding 1:2, Hasil Pengukuran Kedalaman Pelabuhan Nusantara I & II, Tg. Priok, Dalam Rangka Check Sounding 1:2, Hasil Pengukuran Kedalaman Pelabuhan Nusantara I & II, Tg. Priok, Dalam Rangka Final Sounding 1:2, Hasil Pengukuran Kedalaman Pelabuhan Nusantara I & II, Tg. Priok, Dalam Rangka Check Sounding 1:2, Hasil Pengukuran Kedalaman Alur Lantamal s/d Dermaga Serbangun Dalam Rangka Final Sounding 1:2, Check Sounding Perairan Kali Japat Tg. Priok 1:2, Hasil Pengukuran Kedalaman Perairan Kali Japat T. Priok Dalam Rangka Check Sounding 1:2, Hasil Pengukuran Kedalaman Perairan Kali Japat T. Priok Dalam Rangka Check Sounding 1:2, Hasil Pengukuran Kedalaman Perairan Kali Japat T. Priok Dalam Rangka Check Sounding 1:2, Hasil Pengukuran Kedalaman Perairan Kali Japat T. Priok Dalam Rangka Check Sounding 1:2, Hasil Pengukuran Kedalaman Perairan Kali Japat T. Priok Dalam Rangka Check Sounding 1:2, Hasil Pengukuran Kedalaman Perairan Kali Japat Tg. Priok Dalam Rangka Ffinal Sounding 1:2, Pred Sounding Kolam Pelb. I, II & III Tg. Priok 1:1, Pred Sounding Kolam Pelb. I, II & III Tg. Priok 1:1, Hasil Pengukuran Kedalaman Kolam Pelb. I, II & III Pelb. Tg. Priok Dalam Rangka Check Sounding 1:1, Hasil Pengukuran Kedalaman Kolam Pelabuhan I, II & III Tg. Priok Dalam Rangka Check Sounding 1:1, Hasil Pengukuran Kedalaman Kolam Pelb. I, II & III Pelb. Tg. Priok Dalam Rangka Check Sounding 1:1, Hasil Pengukuran Kedalaman Kolam Pelabuhan I, II & III Tg. Priok Dalam Rangka Check Sounding 1:1, Hasil Pengukuran Kedalaman Perairan Utara Pt. Dock Dalam Rangka Check Sounding 1:1, Hasil Pengukuran Kedalaman Perairan Utara Pt. Dock Dalam Rangka Check Sounding 1:1, Hasil Pengukuran Kedalaman Perairan Utara Pt. Dock Dalam Rangka Check Sounding 1:1, Hasil Pengukuran Kedalaman Perairan Utara Pt. Dock Dalam Rangka Check Sounding 1:1, Hasil Pengukuran Kedalaman di Alur Pelabuhan Minyak Dalam Rangka Final Sounding 1:1, Hasil Pengukuran Kedalaman Pelabuhan Minyak Tg. Priok Dalam Rangka Check Sounding 1:1, Hasil Pengukuran Kedalaman Pelabuhan Minyak Tg. Priok Dalam Rangka Check Sounding 1:1, Hasil Pengukuran Kedalaman di Alur Pelabuhan Minyak Dalam Rangka Final Sounding 1:10, Hasil Pengukuran Kedalaman Pelabuhan Minyak Tg. Priok Dalam Rangka Check Sounding 1:1, Hasil Pengukuran Kedalaman Pelabuhan Minyak Tg. Priok Dalam Rangka Check Sounding 1:1, Hasil Pengukuran Kedalaman Pelabuhan Minyak Tg. Priok Dalam Rangka Check Sounding 1:1, Hasil Pengukuran Kedalaman Pelabuhan Minyak Dalam Rangka Final Sounding 1:1, Check Sounding Depan Dermaga TPK Koja Tg. Priok 1:1, Hasil Pengukuran Kedalaman di Depan Dermaga TPK Koja Tg. Priok Dalam Rangka Check Sounding 1:1, Hasil Pengukuran Kedalaman di Depan Dermaga TPK Koja Tg. Priok Dalam Rangka Check Sounding 1:1, Hasil Pengukuran Kedalaman di Depan Dermaga TPK Koja Dalam Rangka Final Sounding 1:1, Hasil Pengukuran Kedalaman di Depan Dermaga TPK Koja Tg. Priok Dalam Rangka Check Sounding 1:1, Hasil Pengukuran Kedalaman di Utara Dermaga UTPK. I Tg. Priok Dalam Rangka Check Sounding 1: Hasil Pengkuran Kedalaman Perairan Utara Der JICT Tg. Priok Dalam Rangka Check Sounding 1: Hasil Pengukuran Kedalaman di Utara Dermaga JICT Tg. Priok Dalam Rangka Check Sounding 1: Check Sounding di Depan Dermaga Ex. Gudang Arang 1: Hasil Pengukuran Kedalaman di Depan Dermaga Ex. Gd. Arang Dalam Rangka Final Sounding 1: Hasil Pengukuran Kedalaman di Depan Dermaga Ex. Gd. Arang Dalam Rangka Check Sounding 1: Hasil Pengukuran Kedalaman di Depan Dermaga Ex. Gd. Arang Dalam Rangka Check Sounding 1: Hasil Pengukuran Kedalaman di Depan Dermaga Ex. Gd. Arang Dalam Rangka Check Sounding 1: Hasil Pengukuran Kedalaman di Dep. Dermaga Ex. Gudang Arang Dalam Rangka Final Sounding 1: Hasil Pengukuran Kedalaman di Depan Dermaga Ex. Gd. Arang Dalam Rangka Check Sounding 1: Check Sounding Depan Dermaga Ex. Syahbandar 1: Hasil Pengukuran Kedalaman di Dep. Der. Ex. Syahbandar Tg. Priok Dalam Rangka Check Sounding 1: Hasil Pengukuran Kedalaman di Dep. Der. Ex. Syahbandar Tg. Priok Dalam Rangka Check Sounding 1: Hasil Pengukuran Kedalaman di Dep. Der. Ex. Syahbandar Tg. Priok Dalam Rangka Final Sounding 1: Hasil Pengukuran Kedalaman di Dep. Der. Ex. Syahbandar Tg. Priok Dalam Rangka Check Sounding 1: Check Sounding Depan Dermaga 101 Baru Pelabuhan Tg. Priok 1: Check Sounding Depan Dermaga Utara Gd : Hasil Pengukuran Kedalaman Utara Ex. Gudang 101 Dalam Rangka Check Sounding 1: Hasil Pengukuran Kedalaman Utara Ex. Gudang 101 Tanjung Priok Dalam Rangka Check Sounding 1: Hasil Pengukuran Kedalaman Utara Ex. Gudang 101 Dalam Rangka Check Sounding 1: Hasil Pengukuran Kedalaman Utara Ex. Gudang 101 Dalam Rangka Check Sounding 1:500 Source: Existing sounding map provided by IPC-2 Table "List of Existing Sounding Map, Tanjung Priok Port" Name of Sounding Map Sounding Map Scale
38
39
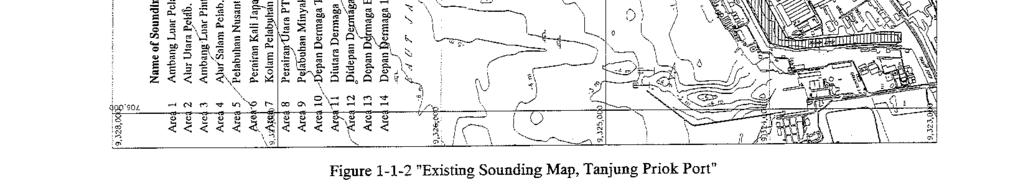
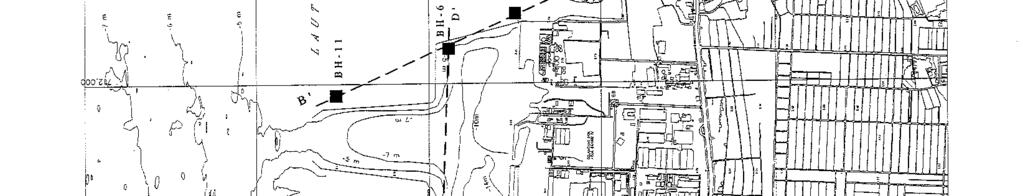
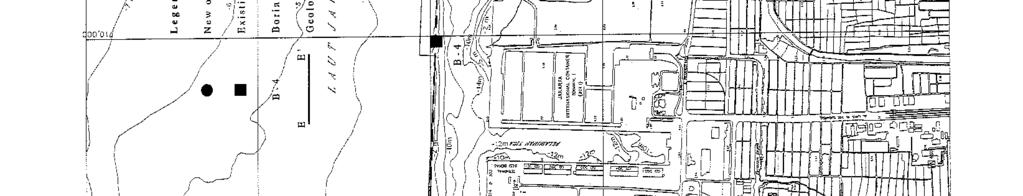
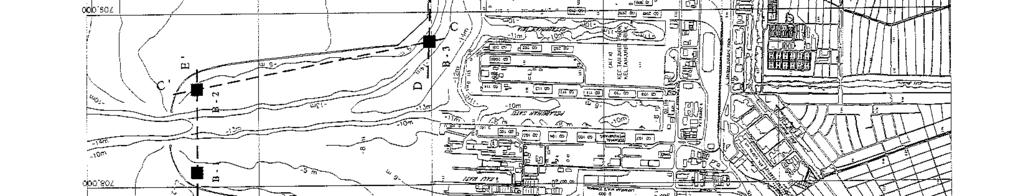
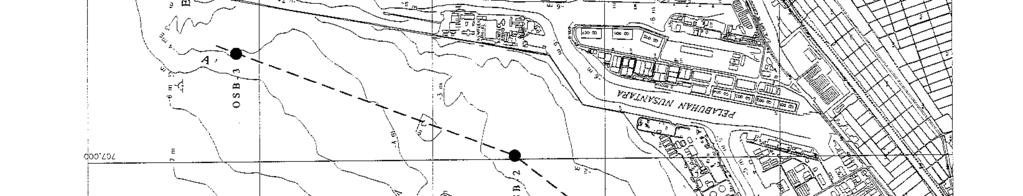
40 Appendix B: Natural Conditions Survey Soil Investigation and Soil Laboratory Test a) Existing Boring Data IPC-2 has already executed many boring works and soil laboratory tests for the study of the construction of new berth and these data are very useful to estimate the subsoil condition at Tanjung Priok Port. The existing boring data acquired by the JICA Study Team are shown in Table Location of Existing Boring Points, Tanjung Priok Port and the locations of boring points are indicated in Figure Location of New and Existing Boring Point and Geological Profile Lines, Tanjung Priok Port. Table Location of Existing Boring Points, Tanjung Priok Port Project Name Boring No, Horizontal Coordinates Boring Depth X (m) Y (m) (m) Feasibility Study for the BH.1 711, ,326, Development of a Bulk BH.2 712, ,326, Terminal BH.3 712, ,325, BH.4 711, ,325, BH.5 712, ,325, BH.6 712, ,325, BH.7 712, ,325, BH.8 712, ,325, Rencana Pengerukan B B B B B Source: Information from IPC-2 The geological profiles based on the existing boring data are shown in Figure Geological Profile (B-B Section) at the Eastern Breakwater, Tanjung Priok Port, Figure Geological Profile (C-C Section) at the Existing Western Breakwater, Tanjung Priok Port, Figure Geological Profile (D-D Section) at the Existing Front Break Water, Tanjung Priok Port and Figure Geological Profile (E-E Section) and Entrance of Western Channel, Tanjung Priok Port. According to the existing report, the soil conditions on the front water area of Tanjung Priok Port could be summarized as follows: 1) The seabed soil (from the seabed to approx. -35m) in the front of Tanjung Priok Port consists of nearly three layers. 2) The first layer is a soft clay layer in the depth range of nearly -13m, and its N-value is approximately 0. 3) The second layer is a deposit consisting of volcanic ash in the depth range of approx. -12m to -20m, with a N-value of approx. 6. 4) The third layer is a deposit consisting of volcanic ash, sand and silt in the depth range of approx. -20 m below, with a N-value of approx. 50 or more than 50. b) Soil Investigation and Soil Laboratory Test As described above, many soil surveys were carried out for the port facilities expansion plans at Tanjung Priok Port. However, no soil survey had been made before at the west development area. Therefore, the soil survey by offshore boring was carried out at the planned west development area. The outline of the soil investigation and soil laboratory test is as follows: West New Development Area 1) Number of boring Offshore boring: 3 locations 2) Boring length 30 m per hole, total 90 m 3) Standard Penetration Test 1.5 m interval, total 60 times 4) Undisturbed sampling 13 samples B-8
41 Appendix B: Natural Conditions Survey 5) Soil Laboratory Test Grain size analysis: 73 samples Specific gravity test: 73 samples Density test 73 samples Moisture content test: 73 samples Plastic/liquid limit test 73 samples Unconfined compression test: 12 samples Consolidation test: 12 samples The locations of boring points are shown in Figure Location of New and Existing Boring Points and Geological Profile Lines, Tanjung Priok Port. The horizontal coordinates, water depth and boring depth of each boring point are shown in Table Horizontal Coordinates and Elevation, and Boring Depth, Tanjung Priok Port. Table Horizontal Coordinates and Elevations, and Boring Depth, Tanjung Priok Port Boring No. Horizontal Coordinates Elevation X (m) Y (m) H (m) Boring Depth SPT OSB-1 706,429 9,324, m 20 times OSB-2 707,015 9,325, m 20 times OSB-3 707,629 9,327, m 20 times Note: Elevation reference is LWS. The Geological profile showing the results of boring is shown in Figure Geological Profile (A-A Section) at New West Development Area, Tanjung Priok Port. The boring log of each bore hole is shown in Figure Boring Log, Tanjung Priok Port (No. OSB-1), Figure Boring Log, Tanjung Priok Port (No. OSB-2) and Figure Boring Log, Tanjung Priok Port (No. SOB-3). The outline of soil conditions at the west development area obtained from the results of boring is shown in Table Outline of Soil Condition at Boring No. OSB-1, Tanjung Priok Port, Table Outline of Soil Condition at Boring No. OSB-2, Tanjung Priok Port and Table Outline of Soil Condition at Boring No. OSB-3, Tanjung Priok Port. Table Outline of Soil Condition at Boring No. OSB-1, Tanjung Priok Port Elevation from LWS Layer Thickness Description of Soil N-Value Characteristic m 9.0 m Clay and shell fragment 1 4 Soft m 5.0 m Silty sand 6 9 Soft m 2.0 m Gravelly sand 60 Hard m 6.0 m Sandy clay Medium to hard m 8.0 m Sand Hard Table Outline of Soil Condition at Boring No. OSB-2, Tanjung Priok Port Elevation from LWS Layer Thickness Description of Soil N-Value Characteristic m 11.0 m Clay and shell fragment 1 4 Soft m 8.5 m Silty clay 60 Hard m 5.0 m Sandy clay Hard m 5.5 m Clay Hard Table Outline of Soil Condition at Boring No. OSB-3, Tanjung Priok Port Elevation from LWS Layer Thickness Description of Soil N-Value Characteristic m 9.0 m Clay and shell fragment 1 2 Soft m 7.5 m Silty clay 4 60 Soft to Hard m 6.0 m Sandy clay Hard m 7.5 m Clay Hard B-9
 The first layer consists of clay layer in the depth range from the seabed to nearly -11 m, eventually with shell fragments.")
 The third layer is a sand layer or a sandy clay layer in the depth range from -19 m to -30 m and it can be used as a foundation layer having the N-value of 40 to more than 60.")
42 Appendix B: Natural Conditions Survey The soil condition at west development area is summarized as follow. 1) The soil conditions can be divided into three layers in boring depth. 2) The first layer consists of clay layer in the depth range from the seabed to nearly -11 m, eventually with shell fragments. This clay layer is very soft and the N-value is found in a range of 1 to 4. 3) The second layer is a silty clay layer in the depth range from -11 m to -19 m and the N-value varies from 4 to 60. 4) The third layer is a sand layer or a sandy clay layer in the depth range from -19 m to -30 m and it can be used as a foundation layer having the N-value of 40 to more than 60. The results of soil laboratory test are simply shown in Table Summary of Soil Laboratory Test at Boring No. OSB-1, Tanjung Priok Port, Table Summary of Soil Laboratory Test at Boring No. OSB-2, Tanjung Priok Port and Table Summary of Soil Laboratory Test at Boring No. OSB-3, Tanjung Priok Port. Figure Offshore Boring, Tanjung Priok Port Figure Offshore Boring, Tanjung Priok Port B-10
43
44
45
46
47
48
49 DRILLING LOG THE STUDY ON DEVELOPMENT OF THE GREATER JAKARTA METROPOLITAN PORTS IN THE REPUBLIC OF INDONESIA Project : JICA Coordinate x : 706,429.0 Drilling Machine : ZT-100 Location : Tanjung Priok Port y : 9,324,778.0 Bor Master : Casna Number of bor hole : OSB -1 Sheet Number : 1 Description by : Mulyadi GWL Elevation : - m Day/date : (15/06-18/06) 2002 Check by : Donny Z Elevation from LWS (m) Depth from ground level (m) Bor Profile Description of Strata Number of Blow N1 N2 N3 Sum of blow S P T- N Graphic Remarks Sea bed 1 0 UDS-1 : (0,50-1,00) m 1 0 / 15 0 / 15 0 / 15 0 / 30 SPT-1 : (1,00-1,45) m 2 0 / 15 0 / 15 0 / 15 0 / 30 SPT-2 : (2,50-2,95) m 3 0 / 15 0 / 15 1 / 15 1 / 30 SPT-3 : (4,00-4,45) m Clay & shell fragment, grey, soft 4 0 / 15 0 / 15 1 / 15 1 / 30 SPT-4 : (5,50-5,95) m 2 UDS-2 : (5,95-6,50) m 5 0 / 15 1 / 15 1 / 15 2 / 30 SPT-5 : (7,00-7,45) m 6 1 / 15 2 / 15 2 / 15 4 / 30 SPT-6 : (8,50-8,95) m 7 2 / 15 3 / 15 3 / 15 6 / 30 SPT-7 : (10,00-10,45) m Silty clay, brown, medium / 15 3 / 15 3 / 15 6 / 30 SPT-8 : (11,50-11,95) m 3 9 UDS-3 : (12,50-13,00) m 9 3 / 15 4 / 15 5 / 15 9 / 30 SPT-9 : (13,00-13,45) m 10 Gravelly fine sand, grey, dense, medium to hard 12 / / / 10 > 60 / 25 SPT-10 : (14,50-14,75) m 11 4 / 15 6 / / / 30 SPT-11 : (15,50-15,95) m / / / / 30 SPT-12 : (17,50-17,95) m Sandy clay, grey, hard / / / 15 > 60 / 30 SPT-13 : (19,00-19,45) m / / / 15 > 60 / 30 SPT-14 : (20,00-20,95) m / 10 > 60 / 10 SPT-15 : (22,00-22,10) m 4 45 UDS-4 : (23,00-23,50) m / / / / 30 SPT-16 : (23,50-23,95) m / / / / 30 SPT-17 : (25,00-25,45) m Coarse sandy, grey, losse, medium / / / / 30 SPT-18 : (26,50-26,95) m / / / / 30 SPT-19 : (28,00-28,45) m / / / / 34 SPT-20 : (29,50-29,45) m SPT Test Clay Sand Shell fragment UDS Sample Silt Gravel Andesit rock Figure "Drilling Log (No. OSB-1), Tanjung Priok Port"
50 DRILLING LOG THE STUDY ON DEVELOPMENT OF THE GREATER JAKARTA METROPOLITAN PORTS IN THE REPUBLIC OF INDONESIA Project : JICA Coordinate x : 707,015.3 Drilling Machine : ZT-100 Location : Tanjung Priok Port y : 9,325,520.7 Bor Master : Casna Number of bor hole : OSB -2 Sheet Number : 1 Description by : Mulyadi GWL Elevation : - m Day/date : (20/06-24/06) 2002 Check by : Donny Z Elevation from LWS (m) Depth Number of Blow S P T- N Graphic from Sum of Bor Profile Description of Strata ground blow level (m) N1 N2 N Remarks Sea bed 1 UDS-1 : (0,50-1,00) m 1 0 / 15 0 / 15 0 / 15 0 / 30 SPT-1 : (1,50-1,95) m 2 0 / 15 0 / 15 0 / 15 0 / 30 SPT-2 : (3,00-3,45) m 3 0 / 15 0 / 15 1 / 15 1 / 30 SPT-3 : (4,50-4,95) m Clay & shell fragment, grey, soft / 15 1 / 15 1 / 15 2 / 30 SPT-4 : (6,00-6,45) m 2 2 UDS-2 : (7,00-7,50) m 5 0 / 15 1 / 15 1 / 15 2 / 30 SPT-5 : (7,50-7,95) m 6 1 / 15 1 / 15 2 / 15 3 / 30 SPT-6 : (9,00-9,45) m 7 1 / 15 2 / 15 2 / 15 4 / 30 SPT-7 : (10,50-11,95) m 8 13 / / / / 30 SPT-8 : (12,00-12,45) m 3 44 UDS-3 : (13,00-13,50) m 9 11 / / / / 30 SPT-9 : (13,50-13,95) m 10 Silty clay, brown, medium to hard 17 / / / 10 > 60 / 25 SPT-10 : (15,00-15,40) m / / / / 30 SPT-11 : (16,50-17,95) m / / / / 30 SPT-12 : (18,00-18,45) m 4 60 UDS-4 : (19,00-19,50) m / 10 > 60 / 10 SPT-13 : (19,50-19,60) m / 15 > 60 / 15 SPT-14 : (21,00-21,15) m Coarse sandy clay, black, losse, medium / 15 > 60 / 15 SPT-15 : (22,50-22,65) m / / / / 30 SPT-16 : (24,00-24,45) m / / / 10 > 60 / 25 SPT-17 : (25,50-25,90) m 18 Clay, grey, dense, medium to hard 27 / / / 10 > 60 / 25 SPT-18 : (27,00-27,40) m / / / / 30 SPT-19 : (28,5-29,95) m 20 5 / / / 15 > 60 / 30 SPT-20 : (30,00-30,45) m SPT Test Clay Sand UDS Sample Silt Gravel Shell fragment Andesit rock Figure "Drilling Log (No. OSB-2), Tanjung Priok Port"
51 DRILLING LOG THE STUDY ON DEVELOPMENT OF THE GREATER JAKARTA METROPOLITAN PORTS IN THE REPUBLIC OF INDONESIA Project : JICA Coordinate x : 707,629.5 Drilling Machine : ZT-100 Location : Tanjung Priok Port y : 9,327,149.7 Bor Master : Casna Number of bor hole : OSB -3 Sheet Number : 1 Description by : Mulyadi GWL Elevation : - m Day/date : (25/06-28/06) 2002 Check by : Donny Z Elevation from LWS (m) Depth from ground level (m) Bor Profile Description of Strata Number of Blow N1 N2 N3 Sum of blow S P T- N Graphic Remarks Sea bed UDS-1 : (1,00-1,50) m 1 0 / 15 0 / 15 0 / 15 0 / 30 SPT-1 : (1,50-1,95) m 2 0 / 15 0 / 15 1 / 15 1 / 30 SPT-2 : (3,00-3,45) m Clay & shell fragment, grey, soft / 15 1 / 15 1 / 15 2 / 30 SPT-3 : (4,50-4,95) m 4 0 / 15 1 / 15 1 / 15 2 / 30 SPT-4 : (6,00-6,45) m 2 2 UDS-2 : (7,00-7,50) m 5 0 / 15 1 / 15 1 / 15 2 / 30 SPT-5 : (7,50-7,95) m 6 1 / 15 2 / 15 2 / 15 4 / 30 SPT-6 : (9,00-9,45) m 7 2 / 15 3 / 15 3 / 15 6 / 30 SPT-7 : (10,50-10,95) m 8 4 / 15 5 / 15 6 / / 30 SPT-8 : (12,00-12,45) m Silty clay, brown, medium 3 44 UDS-3 : (13,00-13,50) m 9 17 / / / / 30 SPT-9 : (13,50-13,95) m 4 60 UDS-4 : (14,50-15,00) m / / / 5 > 60 / 20 SPT-10 : (15,00-15,35) m / 15 > 60 / 15 SPT-11 : (16,50-16,65) m Fine sandy clay, grey, hard / / / / 30 SPT-12 : (18,00-18,45) m 5 53 UDS-5 : (19,00-19,50) m / / / / 30 SPT-13 : (19,50-19,95) m Coarse sandy clay, grey, hard / / / / 30 SPT-14 : (21,00-21,45) m / / / / 30 SPT-15 : (22,50-22,95) m / / / / 30 SPT-16 : (24,00-24,45) m Clay, grey, dense, medium to hard / / / / 30 SPT-17 : (25,50-25,95) m / / / / 30 SPT-18 : (27,00-27,45) m / / / / 30 SPT-19 : (28,50-29,95) m / / / / 30 SPT-20 : (30,00-30,45) m SPT Test Clay Sand Shell fragment UDS Sample Silt Gravel Andesit rock Figure "Drilling Log (No. OSB-3), Tanjung Priok Port"
52 Table "Summary of Soil Laboratory Test at Boring No. OSB-1, Tanjung Priok" Location : Tanjung Priok Boring Number : OSB-1 No. Sample Number Atterberg Limits Density Water Specific Grain Size Analysis (%) Consolidation Unconfined Depth Liquid Limit Plast. Index Dry Wet Content Gravity Clay-Silt Sand Gravel Cc Cv qu Soil Classification (m) (%) (%) (gr/cm 3 ) (gr/cm 3 ) (%) (%) (%) (%) cm 2 /sec (kg/cm 2 ) 1 UDS ~ 1.00 OH - MH E SPT ~ 1.45 ML - OL SPT ~ 2.95 C H SPT ~ 4.45 C H SPT ~ 5.95 C H UDS ~ 7.00 C H E SPT ~ 7.45 C H SPT ~ 8.95 C H SPT ~ C H SPT ~ C H UDS ~ M H E SPT ~ C H UDS ~ OL - ML E SPT ~ S M SPT ~ S M SPT ~ M H SPT ~ C H SPT ~ C H SPT ~ S C SPT ~ S C SPT ~ S C SPT ~ S C SPT ~ S C SPT ~ S C Average CH
53 Table "Summary of Soil Laboratory Test at Boring No. OSB-2, Tanjung Priok Location : Tanjung Priok Boring Number : OSB-2 No. Sample Number Atterberg Limits Density Water Specific Grain Size Analysis (%) Consolidation Unconfined Depth Liquid Limit Plast. Index Dry Wet Content Gravity Clay Silt Sand Cc Cv qu Soil Classification (m) (%) (%) (gr/cm 3 ) (gr/cm 3 ) (%) (%) (%) (%) cm 2 /sec (kg/cm 2 ) 1 UDS ~ 1.50 C H E SPT ~ 1.95 C H SPT ~ 3.45 C H SPT ~ 4.95 C H SPT ~ 6.45 C H UDS ~ 7.50 C H E SPT ~ 7.95 C H SPT ~ 9.45 C H SPT ~ C H SPT ~ M H SPT ~ S M - N P UDS ~ M H E SPT ~ S M - N P SPT ~ O L - M L SPT ~ M H UDS ~ S M - N P SPT ~ S P - N P SPT ~ S M - N P SPT ~ S M - N P SPT ~ M H SPT ~ C H SPT ~ C H SPT ~ C H SPT ~ C H Average
54 Table "Summary of Soil Laboratory Test at Boring No. OSB-3, Tanjung Priok Port Location : Tanjung Priok Boring Number : OSB-3 No. Sample Number Atterberg Limits Density Water Specific Grain Size Analysis (%) Consolidation Unconfined Depth Liquid Limit Plast. Index Dry Wet Content Gravity Clay Silt Sand Cc Cv qu Soil Classification (m) (%) (%) (gr/cm 3 ) (gr/cm 3 ) (%) (%) (%) (%) cm 2 /sec (kg/cm 2 ) 1 UDS ~ 1.50 C H E SPT ~ 1.95 C H SPT ~ 3.45 C H SPT ~ 4.95 C H SPT ~ 6.45 C H UDS ~ 7.50 C H E SPT ~ 7.95 C H SPT ~ 9.45 C H SPT ~ C H SPT ~ C H UDS ~ C H E SPT ~ M H UDS ~ M H E SPT ~ C H SPT ~ C H SPT ~ ML - OL UDS ~ C H E SPT ~ 1.95 M H SPT ~ C H SPT ~ C H SPT ~ M H SPT ~ C H SPT ~ OH - MH SPT ~ C H Average E
, and the coastline runs nearly in the east-west direction and varies in the northeast to southwest")
 Kali Sunter Baru flowing into Pertamina Berth at Tangjung Priok Port 2) Terusan Lagoa flowing into the")
55 Appendix B: Natural Conditions Survey 1.2 Topography Tanjung Priok Port is located along the coastline in the northeastern direction from the center of Jakarta City. The surrounding area of Tanjung Priok Port is flat with the elevation of approximately 2 m (MSL), and the coastline runs nearly in the east-west direction and varies in the northeast to southwest direction at the west end of Tanjung Priok Port. Many rivers and drain channels run in the south-north direction through the flat terrain surrounding the Tanjung Priok Port. The following three rivers or drain channels flow into the waters of Tanjung Priok Port: 1) Kali Sunter Baru flowing into Pertamina Berth at Tangjung Priok Port 2) Terusan Lagoa flowing into the front water area of Koja Terminal at Tanjung Priok Port 3) Kali Ancor flowing into Pelabuhan Nusantara on the west side of Tanjung Priok Port Figure Terusan Lagoa Figure Kali Sunter Baru The first port facilities at Tanjung Priok Port were constructed at the end of the 19th Century and the said Port was constructed in the suburbs of Batavia City, surrounded only by paddy fields and swampy areas as seen from the topographic map produced in the 1930 s. In the 1950 s, villages began appearing in the surrounding area of Tanjung Priok Port, which has been rapidly urbanized in the 1980 s. The situation with many villages and factories built around the Tanjung Priok Port is seen in Figure History of Tanjung Priok Port that was prepared based on the topographic map produced in the same years. B-23
56
57 Appendix B: Natural Conditions Survey 1.3 Seabed Depth Condition Tanjung Priok Port locates almost at the center of coastal line of Jakarta Bay. The coastal line runs nearly in the east-west direction and varies in the northeast to southwest direction at the west end of Tanjung Priok Port. The seabed of Tanjung Priok Port forms a gentle slope that extends gradually deeper to offshore and the depth contour lines run nearly in parallel with the coastline. According to the sounding survey at the east channel, the seabed is inclined at about 1/400 to 1/500 and the water depth increases in parallel with the coastline. At the west end of Tanjung Priok Port, the depth contour lines vary from the east to west direction to the northeast to southwest direction as the coastline varies from the east to west direction to the northeast to southwest direction. B-25
58 Appendix B: Natural Conditions Survey 1.4 Climate The region covering the study area has a tropical monsoon climate. Temperature (23 o C 33 o C) and humidity (23 o C 33 o C) are high with small seasonal variation. Rainfall is high with a yearly total of about 1,800 mm. In the rainy season, from November to March, it has about four to five times as much rain as the dry season, from June to September. Winds are frequently light to moderate through the year although strong winds are blowing more likely during the rainy season between November to March. Gale force winds are rare. Figure Climate of West Jawa Region (Jakarta) compiled from Observation ( ) shows the outline of climate at Jakarta from the existing meteorology data open to public use. B-26
59 Table "Climate of West Jawa Region (Jakarta) Compiled From Observation (Source: Indonesia Pilot, Volume I, Second Edition 1996, The UK Hydrographic Office) :00 13:00 Average Fall (mm) Days with over 0.3 mm N NE E SE S SW W NW Calm N NE E SE S SW W NW Calm 7:00 13:00 S W Number of Days with Gale Direction Temperature Humidity Precipitation Wind Distribution (%) Month Mean Daily Highest Mean Daily Lowest Fog Thunder 7:00 13:00 Mean Wind Speed (knot) January February March April Rare 5 10 May Rare 3 10 June Rare 5 July August September October November December Rare 2 9 Temperature ( C) Total Mean Temperature (Jakarta) Mean Daily Hghest Mean Daily Lowest Average Rainfall (Jakarta) Average Rainfall 100 Frequency (%) S SW W NW N NE E SE Calm Calm E N Month Month Wind Distribution Month Wind
60 Appendix B: Natural Conditions Survey 1.5 Tide Tide forms and the principal harmonic components of the tide at Tanjung Priok Port which is opened to the public by Ddinas Hidro-Oseanografi are as follows. Tide is of diurnal type at Tanjung Priok Port. Table Tide and Principal Harmonic Components, Tanjung Priok Port Components M 2 S 2 N 2 K 2 K 1 O 1 P 1 M 4 MS 4 Z 0 Amplitude (cm) Source: Tide Tables 2002, Dinas Hidro-Oseanografi Ratio of principal harmonic constants (K 1 + O 1 ) / (M 2 + S 2 ) = 3.80 Diurnal type Table Four Principal Harmonic Components Component Name Period (Hours) M 2 Principal Semidiurnal Lunar S 2 Principal Semidiurnal Solar 12 K 1 Principal Diurnal Luni-Solar O 1 Principal Diurnal Lunar Table Ratio of Principal Harmonic Constants: (K 1 +O 1 )/(M 2 +S 2 ) Ratios Type Description 0 to 0.25 Semidiurnal Two highs and two lows of almost equal elevation each day to 1.5 Mixed, dominant semidiurnal Two highs and two lows each day, but of unequal elevation and time of high water. 1.5 to 3.0 Mixed, dominant diurnal Usually one high and one low each day. Time of high water varies. 3.0 and higher Diurnal One high and one low each day. Source: The Ecology of the Indonesia Seas, Part One; Periplus Editions 1997 Also, tidal range is described as follows (source: Didnas Hidro-Oseanografi). HHWL (highest High Water Level): cm MHWS (Mean High Water Spring): cm MSL (Mean Sea Level): cm MLWS (Mean Low Water Spring): cm DL (Datum Level = LLWL: Lowest Low Water Level) 0.0 cm The relation between tidal range, bench mark which was used for 1:10,000 scale digital topographic mapping and tide pole owned by IPC-2 is shown in Figure Relation between Vertical Reference Points for Natural Condition Survey and Tide, Tanjung Priok Port. B-28
61
62 Appendix B: Natural Conditions Survey 1.6 Wave No observed wave data along the north coast of West Java are available to the public. Wave condition is analyzed based on wave hindcast in Jawa Sea by 5-year wind data at the Chengkareng meteorological station (Soekarno-Hatta Airport, ). Wave frequency at offshore Tanjung Priok Port by the wave hindcast is shown in Table Wave Characteristics off-tanjung Priok Port by Wave Hindcast ( ). Wave condition is generally calm in the western portion of Jawa Sea and the cumulative frequency of wave height of less than 0.5 m is about 87 %. Westerly incident waves are most frequent in the table with about 11 % frequency due to the wind of northwest monsoon and transitional seasons. N NNE NE incident waves area also frequent, accounting for about 10 % of the frequency. B-30
63 Table "Wave Characteristics off-tanjung Priok by Wave Hindcast ( ) Combined Frequency of Wave Height and Period (Unit: meter and second) Period Cumulative Total Height Calm H H H H H H H H H H H H H Total Combined Frequency of Wave Height and Direction (Unit: meter) Period Cumulative W WNW NW NNW N NNE NE ENE E Total Height Calm H H H H H H H H H H H H H Total Combined Frequency of Wave Period and Direction (Unit: second) Period Cumulative W WNW NW NNW N NNE NE ENE E Total Height Calm H H H H H H H H H Total
64 Appendix B: Natural Conditions Survey 1.7 Surface Current and Tidal Stream In the open sea, the direction of the predominant surface current generally sets in the same direction to which the monsoon wind is blowing. Figure Predominant Surface Current of Sea Around West Jawa shows the predominant surface current of SE monsoon season (May to September) and NW monsoon season (November to March) at Westa Jawa Area. From November to March the current set ESE in Jawa Sea with an average rate of knots ( m/sec). Between May and September the direction of the current is reversed with a WNW set in Jawa Sea with an average of about 0.75 knots. Maximum rates are usually less than 2 knots (1 m/sec). Tidal streams are generally weak in the open sea, in general, negligible compared with the seasonal currents driven by the monsoon winds. B-32
65

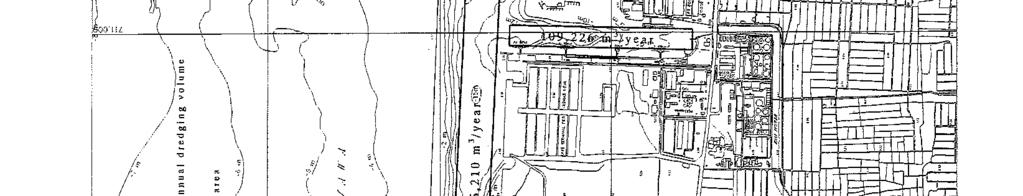
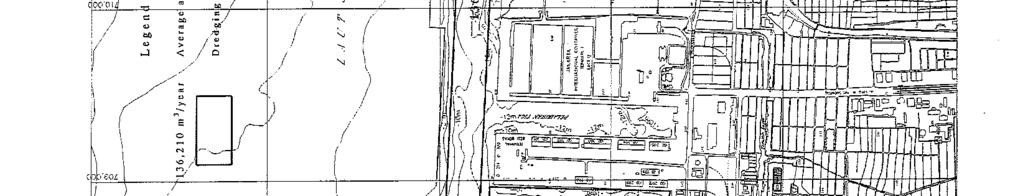
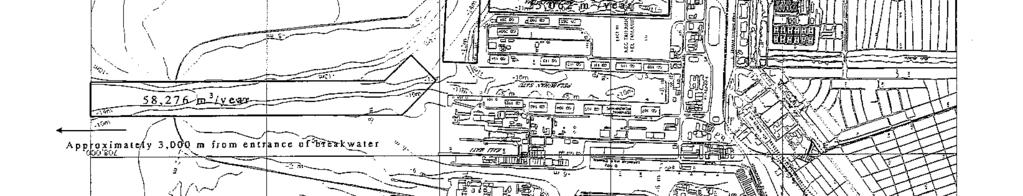
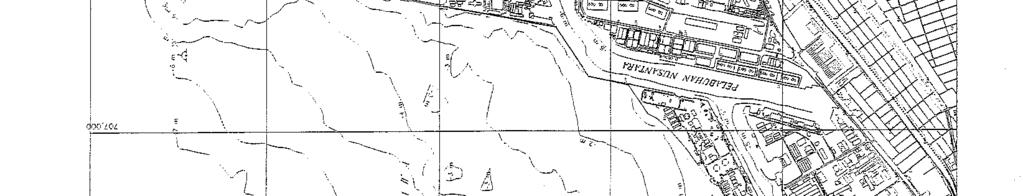
66 Appendix B: Natural Conditions Survey 1.8 Maintenance Dredging Maintenance dredging at channels and basins at Tanjung Priok Port has been executed regularly and maintained at -14 m depth at major channels and basins of Tanjung Priok Port. The summary of maintenance dredging in the channels and basins of Tanjung Priok Port is shown in Table Summary of Maintenance Dredging Volume in Channel and Basin at Tanjung Priok Port The annual volumes of maintenance dredging are about 400,000 m 3 /year in the navigation channels and basins. Figure Annual Maintenance Dredging Volume at Major Channel and Basin, Tanjung Priok Port gives the average dredging volume per year at major navigation channels and basins at Tanjung Priok Port. From the eastern innermost of the port (DKP) to the western entrance (DKP s/d Pintu Masuk Barat; depth: -14 m, length: 5,530 m) shows the largest maintenance dredging volume and the average volume is about 140,000 m 3 /year. The channel section adjacent to the Pertamina oil berth (Pelabuhan Minyak; depth: -12 m, length: 1,145 m) also shows a large maintenance dredging volume with an average of more than 110,000 m 3 /year. As for the access channel outside the western entrance (Pintu Masuk Barat s/d Ambang Luar; depth: -14 m, length: 1,925 m), the average volume of maintenance dredging is about 60,000 m 3 /year. Meanwhile, for the channel inside and outside the eastern entrance, no maintenance dredging has been executed in the last 10 years. This section of the channel is neither maintained nor used by any outgoing or entering major vessels except some small ships. The maintenance dredging volume at basin shows a small volume. The maintenance dredging at some basin such as Kolam Pelabuhan I, Dermaga Syabandar, has not been executed in the last 11 years. Figure Tanjung Priok Port Figure Dredging by Grab Dredger, Tanjung Priok Port B-34
67 Table "Summary of Maintenance Dredging in Channel and Basin, Tanjung Priok Port" Total 166, , , , , , , ,418 95, , ,955 Average 303,712 Total 57, ,249 40,483 9,485 97, , , , , ,347 Average 107,078 Navigation Channel Dimension of Channel (m) Year / Volume of Maintenance Dredging (Unit: m 3 ) Depth Width Length Slope DKP s/d Pintu Masuk Barat ,530 1:4.0 41, , , , , , ,703 26,144 Pintu Masuk Barat s/d Ambang Luar /150 1,925 1: , , ,811 Pelabuhan Minyak (Tahap I) ,145 1: ,257 31,989 95,544 91, ,241 83, , ,418 95, , ,000 Pelabuhan Minyaku (Tahap II) ,145 1: ,000-83,646 - Alur Pintu Timur / Ambang Luar ,200 1: Ex Arsa s/d Lantamal -6.0/ ,600 1: Harbor / Basin Dimension of Channel (m) Year / Volume of Maintenance Dredging (Unit: m 3 ) Depth Width Length Slope Kolam Pelabuhan I , Kolam Pelabuhan II ,035-4,769 40,483 9,485 3,400 73,774 80,011 3,091 67,670 Kolam Pelabuhan III Barat ,050-7,599 Kolam Pelabuhan Nusantara I , ,976 92,580 93,580 96,725 11,294 Kolam Pelabuhan Nusantara II /100 1,300-34,504 37,866 Kolam Pelabuhan Kali Japat ,520 1:2.0 45,718 28,773 Kolam Lantamal s/d Der. S. Guna /60 1,200 1:2.0 Dermaga Ex VTP Selatan Dam Citra Dermaga Syahandar Dermaga Ex Gudang Arang ,430 42,004 27,018 20,381 57,296 Dermaga TPK Koja ,785 62,096 Dermaga JICT (Pelabuhan III Timur) ,050-19,419 Dermaga TPK I Utara Dermaga Utara Source: Cabang Tanjung Priok, PT. Pelabuhan Indonesia II
68
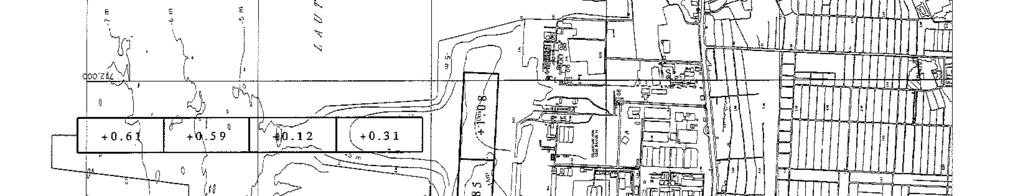
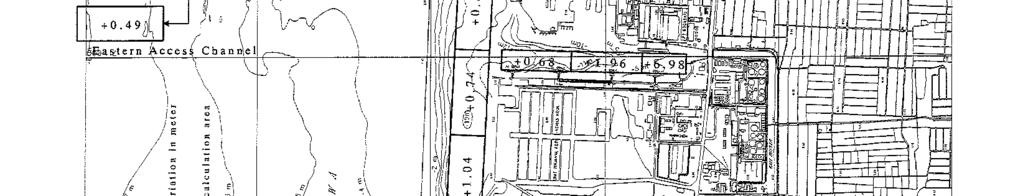
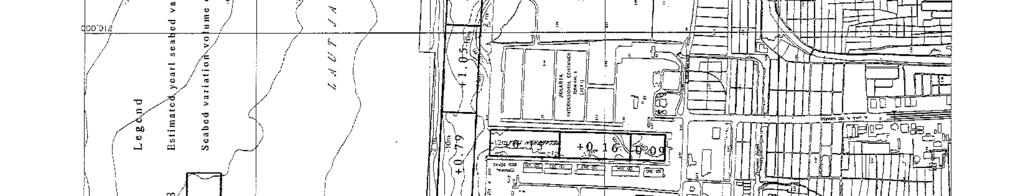
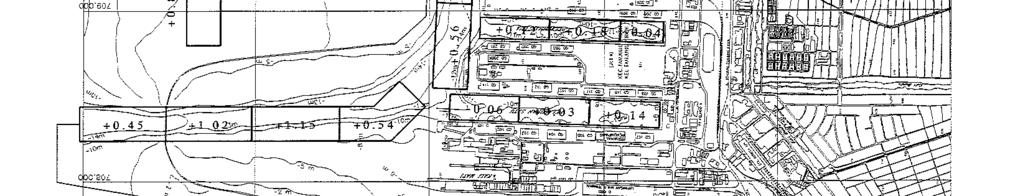
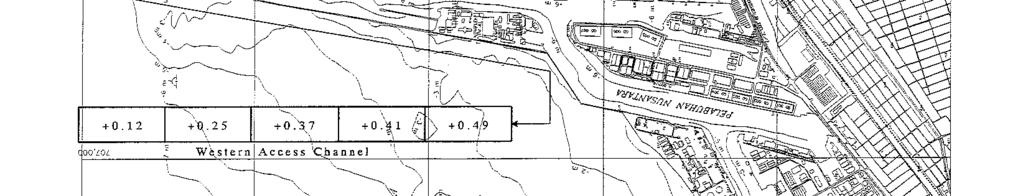
69 Appendix B: Natural Conditions Survey 1.9 Estimation of Seabed Variation The sounding survey using echo sounder for navigation channels and basins has been executed several times per year by IPC-2. These existing sounding data are very useful to study the seabed variation at the access and inner channels and basins of Tanjung Priok Port. The date of sounding survey at each location is mentioned in Table List of Existing Sounding Map, Tanjung Priok Port and the location of sounding area is shown in Figure Existing Sounding Map, Tanjung Priok Port Using these existing sounding data, the cross sections and longitudinal profiles are prepared and the water depth at the same location of longitudinal profiles was compared to estimate the seabed variation. The estimated yearly seabed variations at the access and inner channels and basins of Tanjung Priok Port are shown in Figure Estimation of Yearly Seabed Variation at Tanjung Priok Port. The details of the estimation are also shown in Table Estimation of Yearly Seabed Variation at Tanjung Priok Port. The following features could be thus verified. 1) In the wet access channel to the Tanjung Priok Port (Ambang Luar), the seabed had risen for about +0.5 m per year at the channel center. The value of seabed rise becomes small with respect to the distance from the entrance of breakwater. 2) In east access channel to the Tanjung Priok Port (Lampu Merah Hijau), the seabed risen for about +0.6 m per year at the channel center. The value of seabed rise becomes small with respect to the distance from the entrance of breakwater. 3) The outlet of Kali Sunterbaru at Pelabuhan Minyak shows the highest value of seabed rise. The seabed rise at the outlet of Kali Sunterbaru (drainage channel) is estimated at about +7.0 m per year and about +2.0 m per year at the middle of Pertamina berth. 4) The area in front of the outlet of Terusan Lagoa (drainage channel) (Depan DKP) also shows a high value of seabed rise of m per year. However, the seabed rise in the area within 100 m from the outlet of Terusan Lagoa shows a higher value of m per year. 5) The outlet of Kali Japat shows a relatively small seabed variation of +0.4 m if compared with the outlets of Kali Sunterbaru and Terusan Lagoa. 6) The seabed rise at the Kolam Pelabuhan I, II and III is very small and estimated at less than +10 cm per year. 7) In general, the seabed rise at the area within breakwater is higher than in the outside area of the breakwater. The tidal stream within the breakwater is considered very weak, due to the existing breakwater of Tanjung Priok Port. Therefore, the main reason of the seabed rise within breakwater is due to materials that are flown from the drainage channels such as Kali Sunterbaru, Terusan Lagoa and Kali Japat, into the inside of breakwater of Tanjung Priok Port. Figure shows the longitudinal profile at the channel center of Pelabuhan Minyak and Figure shows the seabed variation at the channel center of Pelabuhan Minyak. This figure shows that the seabed variation curves between December 2000 and March 2001, and between August 2001 and March 2002 are almost identical. Also, the annual maintenance dredging volume at Pelabuhan Minyak (Tahap I) remains constant at about 100, ,000 m 3 /year. Thus, the total volume of sedimentation within the breakwater may not increase to that extent, even if the seabed depth becomes deeper from -14 m to -15 m. B-37
70
REPORT GEO-TECHNICAL INVESTIGATION FOR THE PROPOSED BLOCK-7 SUB-STATION SY NO-225, NEAR RAYACHERLU VILLAGE
 REPORT ON GEO-TECHNICAL INVESTIGATION FOR THE PROPOSED BLOCK-7 SUB-STATION SY NO-225, NEAR RAYACHERLU VILLAGE CLIENT: KARNATAKA SOLAR POWER DEVELOPMENT CORPORATION BANGALORE 0 GEO-TECHNICAL INVESTIGATION
REPORT GEO-TECHNICAL INVESTIGATION FOR THE PROPOSED BLOCK-1 SUB-STATION SY NO-44, NEAR KYATAGANACHERLU VILLAGE
 REPORT ON GEO-TECHNICAL INVESTIGATION FOR THE PROPOSED BLOCK-1 SUB-STATION SY NO-44, NEAR KYATAGANACHERLU VILLAGE CLIENT: KARNATAKA SOLAR POWER DEVELOPMENT CORPORATION BANGALORE 0 GEO-TECHNICAL INVESTIGATION
 FIGURES APPENDIX A SYMBOL SAMPLING DESCRIPTION Location of sample obtained in general accordance with ASTM D 1586 Standard Penetration Test with recovery Location of sample obtained using thin-wall
Hydrographic Surveying Methods, Applications and Uses
 Definition: Hydrographic Surveying Methods, Applications and Uses It is the branch of surveying which deals with any body of still or running water such as a lake, harbor, stream or river. Hydrographic
SOME WATER CHARACTERISTICS OF ESTUARIES IN INDONESIA
 SOME WATER CHARACTERISTICS OF ESTUARIES IN INDONESIA by HENK L. UKTOLSEYA 1 ABSTRACT This paper describes the results obtained during several hydro-oceanographical observations of some estuaries in Indonesia
HARBOUR SEDIMENTATION - COMPARISON WITH MODEL
 HARBOUR SEDIMENTATION - COMPARISON WITH MODEL ABSTRACT A mobile-bed model study of Pointe Sapin Harbour, in the Gulf of St. Lawrence, resulted in construction of a detached breakwater and sand trap to
Coastal Vulnerability Assessment and Coastal Management (Case Study: Lontar s Coastal Area in Serang, Banten Province, Indonesia)
") 1 th International Conference on Hydroscience & Engineering Coastal Vulnerability Assessment and Coastal Management (Case Study: Lontar s Coastal Area in Serang, Banten Province, Indonesia) Olga Catherina
1 th International Conference on Hydroscience & Engineering Coastal Vulnerability Assessment and Coastal Management (Case Study: Lontar s Coastal Area in Serang, Banten Province, Indonesia) Olga Catherina
Chapter 10 Field Survey and Sediment Analysis for the Candidate Site
 Chapter 1 Field Survey and Sediment Analysis for the Candidate Site 1.1 Overview Several kinds of field surveys have been carried out to obtain the necessary information for sediment analysis, planning,
Engineering Surveying - II CE313. Hydrographic Survey Lecture 06 Muhammad Noman
 Engineering Surveying - II CE313 Hydrographic Survey Lecture 06 Muhammad Noman Hydrographic Surveying Hydrographic surveying is the branch of the survey which deal with any body of still or running water
Developing Back Bay. Pre-Handout. Scope and Background
 Developing Back Bay Pre-Handout Scope and Background This is your third project and substantially different from the first two. It is actually a large scale planning project and as such, it is open ended.
Marine Renewables Industry Association. Marine Renewables Industry: Requirements for Oceanographic Measurements, Data Processing and Modelling
 Marine Renewables Industry Association Marine Renewables Industry: Requirements for Oceanographic Measurements, Data Processing and Modelling October 2009 Table of Contents 1. Introduction... 1 2. Measurements
Ennore Coal Port Project: Port Basin and Entrance Channel
 Ennore Coal Port Project: Port Basin and Entrance Channel André Luypaert Ennore Coal Port Project: Port Basin and Entrance Channel Abstract The Chennai Port on the eastern coast of India is the main port
BEACH NOURISHMENT COMBINED WITH SIC VERTICAL DRAIN IN MALAYSIA. Claus Brøgger 1 and Poul Jakobsen 2
 BEACH NOURISHMENT COMBINED WITH SIC VERTICAL DRAIN IN MALAYSIA. Claus Brøgger 1 and Poul Jakobsen 2 The present paper presents measurements and results from a three year full scale Pilot Project with the
SUMMARY OF SUBSURFACE STRATIGRAPHY AND MATERIAL PROPERTIES
 Page 1 of 101 Written by: Ming Zhu Date: 08/20/2008 Reviewed by: R. Kulasingam/J. Beech Date: 08/20/2008 SUMMARY OF SUBSURFACE STRATIGRAPHY AND MATERIAL PROPERTIES 1. INTRODUCTION This Summary of Subsurface
CONE PENETRATION TESTS
 February 25, 2015 John Doe, P.E. Acme Engineering and Testing 1234 Test Avenue, Suite 204 Lake Wales, FL 33853 Re: Sample CPT Soundings Dear Mr. Doe, Direct Push Services, LLC (DPS) was retained by Acme
ENVIRONMENT AGENCY GREAT OUSE AND 100 FT DRAIN QUARTERLY BATHYMETRIC SURVEY DECEMBER 2013 SITE SURVEY REPORT NO. H6787
 ENVIRONMENT AGENCY GREAT OUSE AND 100FT DRAIN QUARTERLY BATHYMETRIC SURVEY DECEMBER 2013 NO. H6787 LONGDIN & BROWNING (SURVEYS) LIMITED CHERRY TREE HOUSE CARMARTHEN ROAD SWANSEA SA1 1HE H6787 1 Measured
Breakwaters and closure dams CT 5308 Exercise 2011: Pointe Noire, Congo
 Breakwaters and closure dams CT 5308 Exercise 2011: Pointe Noire, Congo The town of Pointe Noire is the main port city in the Republic of the Congo and sits on the south-western African coast some 150
FINAL REPORT ON: GEOTECHNICAL INVESTIGATION FOR ENVIRONMENTAL REGULATORY TRAINING INSTITUTE AT NIMLI VILLAGE, TIJARA ALWAR, RAJASTHAN.
 FINAL REPORT ON: GEOTECHNICAL INVESTIGATION FOR ENVIRONMENTAL REGULATORY TRAINING INSTITUTE AT NIMLI VILLAGE, TIJARA ALWAR, RAJASTHAN Submitted to: M/s. Nilayam Housing Pvt. Ltd. 4, Windmill Place Aya
LAB: WHERE S THE BEACH
 Name: LAB: WHERE S THE BEACH Introduction When you build a sandcastle on the beach, you don't expect it to last forever. You spread out your towel to sunbathe, but you know you can't stay in the same spot
Chapter - Oceans and Coasts
 Chapter - Oceans and Coasts Discussion: What do oceans contribute to the environment of Earth? How do Earth s major systems relate to the oceans? Oceans and Coasts Oceans are important - Thermal regulation
CENGRS GEOTECHNICA PVT. LTD. Job No Sheet No. 1
 CENGRS GEOTECHNICA PVT. LTD. Job No. 214030 Sheet No. 1 INTERIM REPORT ON GEOTECHNICAL INVESTIGATION FOR PROPOSED 66 KV GRID PLOT AT G-7, DWARKA, NEW DELHI. 1.0 INTRODUCTION 1.1 Project Description M/s.
Geotechnical Engineering Laboratory CIVIL ENGINEERING VIRTUAL LABORATORY Experiment no 8 Standard Penetration Test
 OBJECTIVE To determine the Bearing Capacity of the soils. SCOPE This method describes the standard penetration test using the split-spon sampler to obtain the resistance of soil to penetration (N-value),
CHAPTER 134 INTRODUCTION
 CHAPTER 134 NEW JETTIES FOR TUNG-KANG FISHING HARBOR, TAIWAN Chi-Fu Su Manager Engineering Department Taiwan Fisheries Consultants, Inc. Taipei, Taiwan INTRODUCTION Tung-Kang Fishing Harbor, which is about
Construction Dewatering
 Construction Dewatering Introduction The control of groundwater is one of the most common and complicated problems encountered on a construction site. Construction dewatering can become a costly issue
SOIL IMPROVEMENT BY VACUUM PRELOADING FOR A POWER PLANT PROJECT IN VIETNAM
 18 th Southeast Asian Geotechnical & Inaugural AGSSEA Conference 29-31 May 213, Singapore Leung, Goh & Shen (eds) SOIL IMPROVEMENT BY VACUUM PRELOADING FOR A POWER PLANT PROJECT IN VIETNAM GOUW TJIE-LIONG
Item 404 Driving Piling
 Item Driving Piling 1. DESCRIPTION Drive piling. 2. EQUIPMENT 2.1. Driving Equipment. Use power hammers for driving piling with specified bearing resistance. Use power hammers that comply with Table 1.
1-44. SITKA HARBOR, ALASKA (Western Channel, Crescent Bay Basin, Channel Rock Breakwaters) (CWIS NOS , 16840, 10322, 55030, 13787)
 (CWIS NOS , 16840, 10322, 55030, 13787)") SITKA 1-44 SITKA HARBOR, ALASKA (Western Channel, Crescent Bay Basin, Channel Rock Breakwaters) (CWIS NOS. 72845, 16840, 10322, 55030, 13787) Condition of Improvement 30 September 2011 AUTHORIZATION:
SITKA 1-44 SITKA HARBOR, ALASKA (Western Channel, Crescent Bay Basin, Channel Rock Breakwaters) (CWIS NOS. 72845, 16840, 10322, 55030, 13787) Condition of Improvement 30 September 2011 AUTHORIZATION:
Implications of proposed Whanganui Port and lower Whanganui River dredging
 PO Box 637 Wanganui 4540 Attention: Rowan McGregor Dear Rowan 1 Summary We understand that it has been proposed to bring large vessels into the Port at Whanganui requiring the excavation of a channel up
A REPORT ON SUB SOIL INVESTIGATION WORK NEW HAJ TOWER COMPLEX HOOGHLY RIVER BRIDGE COMMISSIONERS
 A REPORT ON SUB SOIL INVESTIGATION WORK PROJECT : NEW HAJ TOWER COMPLEX LOCATION : REVISED CHANGED SITE ON PLOT NO. IIA/26, OF RAJARHAT NEW TOWN, KOLKATA Project Implementation Authority : HOOGHLY RIVER
Alaska Deep-Draft Arctic Port System
 Alaska Deep-Draft Arctic Port System Seward Peninsula, AK, Alaska District, Pacific Ocean Division February 2014 PN: ####### Status: DRAFT Alaska Deep-Draft Arctic Ports System i Table of Contents 1.0
SCHEDULE OF RATES FOR GEO-TECHNICAL INVESTIGATION WORKS FOR FAGMIL GRANULATED SINGLE SUPER PHOSPHATE PLANT AT CHITTORGARH, RAJASTHAN
 PC107-PNCV-SOR-202 0 DOC. REV. 1 OF 6 (ANNEXURE-VII) FOR FAGMIL GRANULATED SINGLE SUPER PHOSPHATE PLANT AT CHITTORGARH, RAJASTHAN 0 11.04.16 ISSUED FOR TENDER GC GC BRIJESH REV REV DATE PURPOSE PREPD REVWD
Location of Proposed Dredging Areas, spoil disposal area, beaches identified for nourishment and the Study Area Figure 1
 42 41 4 9 Little Channel Bournemouth Beach Bournemouth Beach (Sand and gravel) Middle RORO Turning Basin Ship Channel Poole Beach Swash Channel 8 Swanage Beach Admiralty Chart 2615 Study Area Proposed
Eilat 's artificial lagoons project on the Red Sea - Israel R. Raviv Ir. R. Raviv, Coastal Engineering Ltd., P.O. Box 7322, z/b 37072,
 Eilat 's artificial lagoons project on the Red Sea - Israel R. Raviv Ir. R. Raviv, Coastal Engineering Ltd., P.O. Box 7322, z/b 37072, Introduction Eilat city is located in the southern part of the state
APPENDIX A1 - Drilling and completion work programme
 APPENDIX A1 - Drilling and completion work programme Information about the well and drilling To the extent possible, the international system of units (SI) should be adhered to, and the drilling programme
Port Sections Guide Section 01
 s Guide 01 Cow Bay Marina Date 10/1/2016 Position (lat / lon) Minimum controlled water depth Chart datum Range of water densities Tidal range alongside Bottom type Dredging regime Distance pilot station
APPENDIX C VEGETATED EMERGENCY SPILLWAY. VERSION 1.0 March 1, 2011
 APPENDIX C VEGETATED EMERGENCY SPILLWAY VERSION 1.0 March 1, 2011 [NOTE: Could use a better photo more clearly showing the emergency spillway in the context of the dam.] SECTION C-1: DESCRIPTION OF PRACTICE
Assessment of Soil Erosion at a DC Park Facility Spring Valley Park NW Washington, DC
 Assessment of Soil Erosion at a DC Park Facility Spring Valley Park NW Washington, DC Annual Progress Report for FY 2004 Prepared by: Principal Investigators: Inder Bhambri, Ph.D., PE Philip Brach, Ph.D.,
UNIT-I SOIL EXPLORATION
 SIDDHARTH GROUP OF INSTITUTIONS :: PUTTUR Siddharth Nagar, Narayanavanam Road 517583 QUESTION BANK (DESCRIPTIVE) Subject with Code : Geotechnical Engineering - II (16CE127) Year & Sem: III-B.Tech & II-Sem
TAO Safety Policy No. HS-5.1 Page 1 of 15 Revision No. 2 Revision Date: July 19, 2005
 TAO Safety Policy No. HS-5.1 Page 1 of 15 Revision No. 2 1.0 OVERVIEW This safety policy provides guidance for conducting trenching and excavation activities at project sites. Emphasis is placed on sloping
UNDERWATER BRIDGE INSPECTION REPORT STRUCTURE NO CSAH 4 OVER THE BEAVER RIVER ST. LOUIS COUNTY
 UNDERWATER BRIDGE INSPECTION REPORT STRUCTURE NO. 7635 CSAH 4 OVER THE BEAVER RIVER ST. LOUIS COUNTY JUNE 18, 2012 PREPARED FOR THE MINNESOTA DEPARTMENT OF TRANSPORTATION BY COLLINS ENGINEERS, INC. JOB
Appendix A Test Pit Logs
 Appendix A Test Pit Logs Pit number : Test Pit 1 Depth Geological Description Scala Penetrometer (mm) 0-200 Light brown silty Topsoil with some gravel 200-400 Fine to medium GRAVEL; grey. Loosely packed;
Figure 4, Photo mosaic taken on February 14 about an hour before sunset near low tide.
 The Impact on Great South Bay of the Breach at Old Inlet Charles N. Flagg and Roger Flood School of Marine and Atmospheric Sciences, Stony Brook University Since the last report was issued on January 31
Geology 10 Activity 8 A Tsunami
 Geology 10 Activity 8 A Materials: Marigram recorded in San Diego, May 23, 1960. Travel Time Graph To San Diego. Answer sheet Source of information: Lander, James F., Patricia A. Lockridge and Michael
YOUR ISTRC SYSTEM REPORT CITY FREDERICKSBURG Mr. Bill Hanna
 YOUR ISTRC SYSTEM REPORT TM CITY OF FREDERICKSBURG January 13, 2017 Park Area Topdressing Sand Lab ID: 16120031 Presented To: Mr. Bill Hanna 11372 Strang Line Road Lenexa, KS 66215 Phone: 800-362-8873
page - Laboratory Exercise #5 Shoreline Processes
 page - Laboratory Exercise #5 Shoreline Processes Section A Shoreline Processes: Overview of Waves The ocean s surface is influenced by three types of motion (waves, tides and surface currents). Shorelines
E4014 Construction Surveying. Hydrographic Surveys
 E4014 Construction Surveying Hydrographic Surveys Charts And Maps Hydrographic Chart an information medium and a tool for maritime traffic for the safety and ease of navigation contains information on
GNSS Technology for the Determination of Real-Time Tidal Information
 GNSS Technology for the Determination of Real-Time Tidal Information Benjamin Kidder C-Nav Positioning Solutions European region Outline of Topics Covered Introduction to Tides Past and Present Methods
Lecture Outlines PowerPoint. Chapter 15 Earth Science, 12e Tarbuck/Lutgens
 Lecture Outlines PowerPoint Chapter 15 Earth Science, 12e Tarbuck/Lutgens 2009 Pearson Prentice Hall This work is protected by United States copyright laws and is provided solely for the use of instructors
Chapter 22, Section 1 - Ocean Currents. Section Objectives
 Chapter 22, Section 1 - Ocean Currents Section Objectives Intro Surface Currents Factors Affecting Ocean Currents Global Wind Belts (you should draw and label a diagram of the global wind belts) The Coriolis
4/20/17. #30 - Coastlines - General Principles Coastlines - Overview
 Writing Assignment Due one week from today by 11:59 pm See main class web pages for detailed instructions Essays will be submitted in Illinois Compass (instructions later) Pick one: Earthquakes, tsunamis,
NEED FOR SUPPLEMENTAL BATHYMETRIC SURVEY DATA COLLECTION
 305 West Grand Avenue, Suite 300 Montvale, New Jersey 07645 Phone 201.930.9890 Fax 201.930.9805 www.anchorqea.com M EMORANDUM To: Caroline Kwan and Nica Klaber U.S. Environmental Protection Agency Region
Inventory of coastal sandy areas protection of infrastructure and planned retreat
 2018-02-28 Inventory of coastal sandy areas protection of infrastructure and planned retreat Johanna Birgander, Thorbjörn Nilsson, Pär Persson Summary To estimate the natural protection around the coast
SAND BOTTOM EROSION AND CHANGES OF AN ACTIVE LAYER THICKNESS IN THE SURF ZONE OF THE NORDERNEY ISLAND
 SAND BOTTOM EROSION AND CHANGES OF AN ACTIVE LAYER THICKNESS IN THE SURF ZONE OF THE NORDERNEY ISLAND Kos'yan R. 1, Kunz H. 2, Podymov l. 3 1 Prof.Dr.,The Southern Branch of the P.P.Shirshov Institute
SURFACE CURRENTS AND TIDES
 NAME SURFACE CURRENTS AND TIDES I. Origin of surface currents Surface currents arise due to the interaction of the prevailing wis a the ocean surface. Hence the surface wi pattern (Figure 1) plays a key
Kennedy Bridge - Summary of Pier 6 Movement Records
 KENNEDY BRIDGE - SUMMARY OF PIER 6 MOVEMENT RECORDS TECHNICAL MEMORANDUM Kennedy Bridge - Summary of Pier 6 Movement Records PREPARED FOR: COPY TO: MnDOT Dale Thomas / CH2M HILL File PREPARED BY: DATE:
Feasibility Study for Restoration of Titlow Lagoon Fish Passage. South Puget Sound Salmon Enhancement Group
 Feasibility Study for Restoration of Titlow Lagoon Fish Passage South Puget Sound Salmon Enhancement Group January 2010 Feasibility Study for Restoration of Titlow Lagoon Fish Passage Prepared for South
SAND ACCUMULATION IN WAVE-SHELTER ZONE OF OHARAI PORT AND CHANGE IN GRAIN SIZE OF SEABED MATERIALS ON NEARBY COAST
 SAND ACCUMULATION IN WAVE-SHELTER ZONE OF OHARAI PORT AND CHANGE IN GRAIN SIZE OF SEABED MATERIALS ON NEARBY COAST Takeo Matsu-ura, Takaaki Uda, Takayuki Kumada and Michio Sumiya Beach changes around facing
STUDY ON TSUNAMI PROPAGATION INTO RIVERS
 ABSTRACT STUDY ON TSUNAMI PROPAGATION INTO RIVERS Min Roh 1, Xuan Tinh Nguyen 2, Hitoshi Tanaka 3 When tsunami wave propagation from the narrow river mouth, water surface is raised and fluctuated by long
Section 6. The Surface Circulation of the Ocean. What Do You See? Think About It. Investigate. Learning Outcomes
 Chapter 5 Winds, Oceans, Weather, and Climate Section 6 The Surface Circulation of the Ocean What Do You See? Learning Outcomes In this section, you will Understand the general paths of surface ocean currents.
LEVELTON CONSULTANTS LTD Clarke Place Richmond, BC V6V 2H9 T: F:
 Appendix B TMEP Enhanced FEED Study eotechnical Foreshore Investigation - Findings Report Westridge Loading Facility, Burnaby, BC, April 7, 1 LEVELTON CONSULTANTS LTD. -1791 Clarke Place Richmond, BC VV
INTERNATIONAL HYDROGRAPHIC SURVEY STANDARDS
 INTERNATIONAL HYDROGRAPHIC SURVEY STANDARDS by Gerald B. MILLS 1 I. Background The International Hydrographic Organization (IHO) traces its origin to the establishment of the International Hydrographic
Application of Expansive Soil Geotechnical Procedures
 Application of Expansive Soil Geotechnical Procedures FPA PRESENTATION John T. Bryant, Ph.D., P.G., P.E with Robert L. Lytton, Ph.D., PE. And Mr. Dean Read HOUSTON, TEXAS WEDNESDAY DECEMBER 10, 2008 2008
TYPES OF FOUNDATION. Superstructure. Substructure. Foundation
 TYPES OF FOUNDATION Introduction: The lowest artificially built part of a structure which transmits the load of the structure to the soil lying underneath is called foundation. The supporting part of a
SHORE PROTECTION AND HABITAT CREATION AT SHAMROCK ISLAND, TEXAS ABSTRACT
 SHORE PROTECTION AND HABITAT CREATION AT SHAMROCK ISLAND, TEXAS M. Cameron Perry, P.E., and Daniel J. Heilman, P.E. Coastal Engineer Shiner Moseley & Associates., Inc. 555 N. Carancahua Corpus Christi,
LAKKOPETRA (GREECE) EUROSION Case Study. Contact: Kyriakos SPYROPOULOS. TRITON Consulting Engineers. 90 Pratinou Str Athens (GREECE)
 EUROSION Case Study. Contact: Kyriakos SPYROPOULOS. TRITON Consulting Engineers. 90 Pratinou Str Athens (GREECE)") LAKKOPETRA (GREECE) Contact: Kyriakos SPYROPOULOS TRITON Consulting Engineers 90 Pratinou Str. 11634 Athens (GREECE) Tel: +32 10 729 57 61 Fax: +32 10 724 33 58 e-mail: kspyropoulos@tritonsa.gr 19 1 1.
LAKKOPETRA (GREECE) Contact: Kyriakos SPYROPOULOS TRITON Consulting Engineers 90 Pratinou Str. 11634 Athens (GREECE) Tel: +32 10 729 57 61 Fax: +32 10 724 33 58 e-mail: kspyropoulos@tritonsa.gr 19 1 1.
Bore-Gard Installation - 1,000 ft. Perry, Oklahoma
 Bore-Gard Installation - 1,000 ft. Perry, Oklahoma Distance of Installation: Maximum Pulling Force on Pipe: Reamer Diameter: Soil Conditions: 1,000 feet Approx. 7,500 pounds 8 inch Beaver Tail Wet Clay
from ocean to cloud PARAMETRIC SUB-BOTTOM PROFILER, A NEW APPROACH FOR AN OLD PROBLEM
 PARAMETRIC SUB-BOTTOM PROFILER, A NEW APPROACH FOR AN OLD PROBLEM Geoff Holland, Alcatel-Lucent Submarine Networks Geoff.holland@alcatel-lucent.com Alcatel-Lucent Submarine Networks Ltd, Christchurch Way,
Chapter 15. The Work of Wind and Deserts
 Chapter 15 The Work of Wind and Deserts Introduction What is desertification? Desertification is the expansion of deserts into formerly productive lands. These expansions destroy croplands and rangelands.
SHORELINE ROTATION CAUSED BY LARGE-SCALE EXCAVATION OF REEF FLAT ON SANUR BEACH IN BALI
 SHORELINE ROTATION CAUSED BY LARGE-SCALE EXCAVATION OF REEF FLAT ON SANUR BEACH IN BALI Masatoshi Endo, Akio Kobayashi, Takaaki Uda, Yasuhito Noshi and Susumu Onaka In the southern part of Sanur Beach
HISTORY OF CONSTRUCTION
 HISTORY OF CONSTRUCTION CFR 257.73(c)(1) West Boiler Slag Pond Clifty Creek Plant Madison, Indiana October, 2016 Prepared for: Indiana Kentucky Electric Corporation Prepared by: American Electric Power
FOR INFORMATION ONLY. Gold Coast Seaway Channel Scour and Rock Wall Stability Investigation. R.B doc December 2011
 A part of BMT in Energy and Environment Gold Coast Seaway Channel Scour and Rock Wall Stability Investigation R.B18625.001.00.doc December 2011 Gold Coast Seaway Channel Scour and Rock Wall Stability Investigation
17. High Resolution Application of the Technology Development Index (TDI) in State Waters. South of Block Island
 in State Waters. South of Block Island") 17. High Resolution Application of the Technology Development Index (TDI) in State Waters South of Block Island for the Rhode Island Ocean Special Area Management Plan 2010 by Annette Grilli 1, Malcolm
17. High Resolution Application of the Technology Development Index (TDI) in State Waters South of Block Island for the Rhode Island Ocean Special Area Management Plan 2010 by Annette Grilli 1, Malcolm
CHAPTER-11 ROAD NETWORK IMPROVEMENT PROJECTS/PROGRAMS
 THE STUDY FOR DEVELOPMENT OF GREATER JAKARTA METROPOLITAN PORTS FINAL REPORT (VOL.III) CHAPTER-11 ROAD NETWORK IMPROVEMENT PROJECTS/PROGRAMS CHAPTER-11. ROAD NETWORK IMPROVEMENT PROJECTS/PROGRAMS 11-A.
ITEM 400 STRUCTURAL EXCAVATION AND BACKFILL
 AFTER MARCH 1, 2012 ITEM 400 STRUCTURAL EXCAVATION AND BACKFILL 400.1 Description. This item shall govern for all excavation required for the construction of all structures, except pipe or box sewers for
Tidal River Management (TRM)-An Innovative Scientific Approach for Sustainable Sediment Management
-An Innovative Scientific Approach for Sustainable Sediment Management") Paper ID: WRE-029 954 International Conference on Recent Innovation in Civil Engineering for Sustainable Development () Department of Civil Engineering DUET - Gazipur, Bangladesh Tidal River Management
Paper ID: WRE-029 954 International Conference on Recent Innovation in Civil Engineering for Sustainable Development () Department of Civil Engineering DUET - Gazipur, Bangladesh Tidal River Management
1) INTRODUCTION 2) THE UNFAIR ADVANTAGE
 INTRODUCTION 2) THE UNFAIR ADVANTAGE") 1 1) INTRODUCTION 2) THE UNFAIR ADVANTAGE and Stingray earth anchors are driven tipping plate soil anchors for reaction of tensile loads. anchors have ultimate capacities up to 20 tons, and Stingray anchors
1 1) INTRODUCTION 2) THE UNFAIR ADVANTAGE and Stingray earth anchors are driven tipping plate soil anchors for reaction of tensile loads. anchors have ultimate capacities up to 20 tons, and Stingray anchors
Sample Project with EPB TBM according to DIN 4085
 1 General The aim of the document is to provide information about the required input parameters and the necessary steps for the calculation of a face support pressure. This calculation is carried out under
DEAD-ENDCHANNELFLUSHINGINHARBORS
 DEAD-ENDCHANNELFLUSHNGNHARBORS PURPOSE: The purpose of this technical note is to present some design con- siderations which benefit dead-end channel flushing. Some of these factors can also be used to
Real Time Surveying GPS and HYDRO Software for Tide and Swell Compensation
 Real Time Surveying GPS and HYDRO Software for Tide and Swell Compensation by Mr Michael Walker, B.Surv. (Otago) HYDRO Division Trimble Navigation New Zealand Ltd. Abstract This paper focuses on the use
The Challenge of Wave Scouring Design for the Confederation Bridge
 13: Coastal and Ocean Engineering ENGI.8751 Undergraduate Student Forum Faculty of Engineering and Applied Science, Memorial University, St. John s, NL, Canada MARCH 2013 Paper Code. (13 - walsh) The Challenge
FIELD EXPERIMENT ON BEACH NOURISHMENT USING GRAVEL AT JINKOJI COAST
 FILD XPRIMNT ON BACH NOURISHMNT USING GRAVL AT JINKOJI COAST Takayuki Kumada, Takaaki Uda, Takeo Matsu-ura and Michio Sumiya Beach nourishment using 87, m of gravel with grain size between.5 and mm was
Utilizing Vessel Based Mobile LiDAR & Bathymetry Survey Techniques for Survey of Four Southern California Breakwaters
 Utilizing Vessel Based Mobile LiDAR & Bathymetry Survey Techniques for Survey of Four Southern California Breakwaters Western Dredging Association: Pacific Chapter September 2012 Insert: Pipe Location
Desaturating sand deposit by air injection for reducing liquefaction potential
 Desaturating sand deposit by air injection for reducing liquefaction potential M. Ishihara, M. Okamura & T. Oshita Public Works Research Institute, Tsukuba City, Japan. ABSTRACT: It has been known that
Chapter 10 Lecture Outline. The Restless Oceans
 Chapter 10 Lecture Outline The Restless Oceans Focus Question 10.1 How does the Coriolis effect influence ocean currents? The Ocean s Surface Circulation Ocean currents Masses of water that flow from one
BEACH NOURISHMENT BY RAINBOWING FOR THE VISAKHAPATNAM PORT TRUST BY DCI. Capt. MVR MURTHY ABSTRACT
 BEACH NOURISHMENT BY RAINBOWING FOR THE VISAKHAPATNAM PORT TRUST BY DCI Capt. MVR MURTHY ABSTRACT The coastal city of Visakhapatnam had a long wide beach. Over past three decades, this beach has progressively
Applied Earth Science Climate Exam Practice Questions Page 1
 Name: 1. Which combination of climate factors generally results in the coldest temperatures? A) low elevation and low latitude B) low elevation and high latitude C) high elevation and low latitude D) high
INSTITUTE OF AERONAUTICAL ENGINEERING (Autonomous) Dundigal, Hyderabad CIVIL ENGINEERING TUTORIAL QUESTION BANK
 Dundigal, Hyderabad CIVIL ENGINEERING TUTORIAL QUESTION BANK") INSTITUTE OF AERONAUTICAL ENGINEERING (Autonomous) Dundigal, Hyderabad - 00 04 CIVIL ENGINEERING TUTORIAL QUESTION BANK Course Name Course Code Regulation Course Structure Course Coordinator Course Faculty
INSTITUTE OF AERONAUTICAL ENGINEERING (Autonomous) Dundigal, Hyderabad - 00 04 CIVIL ENGINEERING TUTORIAL QUESTION BANK Course Name Course Code Regulation Course Structure Course Coordinator Course Faculty
Australian Coastal Councils Conference
 Australian Coastal Councils Conference Kiama March 2019 Where Has My Beach Gone? (and what can I do about it?) Dr Andrew McCowan Water Technology Where Has My Beach Gone? Where Has My Beach Gone? Where
Coasts. 1. Coastal Processes. 1.1 Coastal erosion. 1.2 Sediment transport. Coastal Processes and Landforms. i. Hydraulic action
 Coasts Coastal Processes and Landforms 1. Coastal Processes 1.1 Coastal erosion i. Hydraulic action When waves strike against a rock surface, the waves trap air in the rock joints. This air is compressed
Overview. Beach Features. Coastal Regions. Other Beach Profile Features. CHAPTER 10 The Coast: Beaches and Shoreline Processes.
 Overview CHAPTER 10 The Coast: Beaches and Shoreline Processes Coastal regions constantly change. The beach is a dominant coastal feature. Wave activity continually modifies the beach and coastal areas.
Geospatial Positioning Accuracy Standards Part 5: Standards for Nautical Charting Hydrographic Surveys - Public Review Draft
 Appendix B FGDC Hydrographic Accuracy Standard Geospatial Positioning Accuracy Standards Part 5: Standards for Nautical Charting Hydrographic Surveys - Public Review Draft Subcommittee on Marine and Coastal
White Paper. Draft Variable Depth Root Zones for Golf Putting Greens. James Crum and Trey Rogers. Michigan State University.
 White Paper Draft Variable Depth Root Zones for Golf Putting Greens James Crum and Trey Rogers Michigan State University January 2017 Variable-Depth Root Zones for Golf Putting Greens Introduction The
Concepts & Phenomena
 Concepts & Phenomena in coastal and port sedimentation R. Kamalian Ports and Maritime Organization of Iran and PIANC-Iran 7 9 December 2015 What is the problem? Many harbours have sedimentation problems
CORPS FACTS. Harbor Dredging U.S. ARMY CORPS OF ENGINEERS BUILDING STRONG
 CORPS FACTS Harbor Dredging U.S. ARMY CORPS OF ENGINEERS BUILDING STRONG Disaster Response Sedimentation in the channel is caused by the normal cycle of silt movement, erosion from high water or heavy
Chapter. The Dynamic Ocean
 Chapter The Dynamic Ocean An ocean current is the mass of ocean water that flows from one place to another. 16.1 The Composition of Seawater Surface Circulation Surface Currents Surface currents are movements
CHAPTER 181 MAN-MADE BEACHES MORE THAN 20 YEARS ON FRANCK ROUCH 1 BERNARD BELLESSORT Z
 CHAPTER 181 MAN-MADE BEACHES MORE THAN 20 YEARS ON FRANCK ROUCH 1 BERNARD BELLESSORT Z Abstract This article is an overview of the behaviour of artificial beaches based more particularly on three important
INSTITUTE OF AERONAUTICAL ENGINEERING (Autonomous) Dundigal, Hyderabad
 Dundigal, Hyderabad") INSTITUTE OF AERONAUTICAL ENGINEERING (Autonomous) Dundigal, Hyderabad - 500 043 CIVIL ENGINEERING Tutorial Question Bank Name : FOUNDATION ENGINEERING Code : A60126 Class : III B. Tech II Semester Branch
INSTITUTE OF AERONAUTICAL ENGINEERING (Autonomous) Dundigal, Hyderabad - 500 043 CIVIL ENGINEERING Tutorial Question Bank Name : FOUNDATION ENGINEERING Code : A60126 Class : III B. Tech II Semester Branch
3 Maps and Charts In order to navigate we need to use some form of map. The two choices are nautical charts, or land maps.
 13 3 Maps and Charts In order to navigate we need to use some form of map. The two choices are nautical charts, or land maps. Charts Nautical Charts only show the land detail that is visible from the sea.
SITE S7: EMBANKMENT FAILURE WEST OF MILLARVILLE
 LANDSLIDE RISK ASSESSMENT SOUTHERN REGION SITE S7: EMBANKMENT FAILURE WEST OF MILLARVILLE LEGAL LOCATION: LSD 4-3-21-4 W5M and 1-4-21-4 W5M REFERENCE LOCATION ALONG HIGHWAY The slide area is located between
Lecture 8&9: Construction Dewatering
 Arab Academy for Science, Technology & Maritime Transport Colleague of Engineering & Technology Construction & Building Engineering CB 523 Methods and Equipment for Construction 1 Lecture 8&9: Construction