Final Waterways Assets and Resources Survey Master Plan for Dredging and Beach Nourishment
|
|
|
- Roderick Stewart
- 5 years ago
- Views:
Transcription


1 Final Waterways Assets and Resources Survey Master Plan for Dredging and Beach Nourishment For, Massachusetts Prepared For: Dennis Town Hall P.O. Box Main Street Dennis, MA Prepared By: Woods Hole Group, Inc. 81 Technology Park Drive East Falmouth, MA 02536
2 This page intentionally left blank
3 FINAL WATERWAYS ASSETS AND RESOURCES SURVEY MASTER PLAN FOR DREDGING AND BEACH NOURISHMENT, Massachusetts November 2010 Prepared for: Dennis Town Hall P.O. Box Main Street South Dennis, MA Prepared by: Woods Hole Group, Inc. 81 Technology Park Drive East Falmouth MA (508)
4 This page intentionally left blank
5 TABLE OF CONTENTS 1.0 EXECUTIVE SUMMARY INTRODUCTION MAINTENANCE OF WATERWAYS RESOURCES SESUIT HARBOR SWAN POND RIVER BASS RIVER CHASE GARDEN CREEK PUBLIC BEACH RESOURCES CHAPIN MEMORIAL BEACH Natural Features and Coastal Processes Anthropogenic Features COLD STORAGE BEACH Natural Features and Coastal Processes Anthropogenic Features WEST DENNIS BEACH Natural Features and Coastal Processes Anthropogenic Features SOUTH VILLAGE BEACH Natural Features and Coastal Processes Anthropogenic Features HAIGIS BEACH Natural Features and Coastal Processes Anthropogenic Features GLENDON RD. BEACH Natural Features and Coastal Processes Anthropogenic Features SEA STREET BEACH Natural Features and Coastal Processes Anthropogenic Features SEA VIEW BEACH Final Waterways Assets and Resources i November 2010
6 4.8.1 Natural Features and Coastal Processes Anthropogenic Features DREDGING AND BEACH NOURISHMENT MASTER PLAN FINDINGS RECOMMENDATIONS REFERENCES CITED APPENDIX A GRAIN SIZE ANALYSES... A-1 Final Waterways Assets and Resources ii November 2010
7 Figure 2-1. LIST OF FIGURES Extent of Dennis coastline bordering Cape Cod Bay to the North and Nantucket Sound to the South...5 Figure 3-1. Distribution of waterways resources....7 Figure 3-2. Figure 3-3. Historical aerial photographs of Sesuit Harbor from 1971 to 2009 showing shoaling patterns....9 Sesuit Harbor dredging and placement activities...11 Figure 3-4. Sesuit Harbor shellfish resources Figure 3-5. Historical aerial photographs of Swan Pond River from 1961 to 2009 showing sediment transport patterns around the entrance to the river Figure 3-6. Swan Pond River dredging and placement activities Figure 3-7. Swan Pond River shellfish resources Figure 3-8. Swan Pond River eelgrass resources...19 Figure 3-9. Swan Pond River NHESP estimated and priority habitat sites Figure Historical aerial photographs of Bass River from 1978 to 2009 showing sediment transport patterns around the entrance Figure Bass River dredging and placement activities Figure Bass River dredging and placement activities Figure Bass River dredging and placement activities Figure Bass River shellfish resources Figure Bass River eelgrass resources Figure Bass River NHESP estimated and priority habitat sites Figure Historical aerial photographs of Chase Garden Creek from 1978 to 2009 showing sediment transport patterns around the entrance to the creek..30 Figure Chase Garden Creek shellfish resources Figure Chase Garden Creek NHESP estimated and priority habitat sites Figure 4-1. Distribution of public beach sites throughout the (yellow stars sites included in this study; blue triangles other public beach sites) Figure 4-2. Existing conditions map of Chapin Memorial Beach Figure 4-3. Figure 4-4. View of Chapin Memorial Beach showing the Coastal Beach resources looking to the southwest and northeast (top photos), as well the extensive Coastal Dune resources (bottom photos) Beach profile data for Chapin Memorial Beach (profile locations shown in Figure 4-2) Final Waterways Assets and Resources iii November 2010
8 Figure 4-5. Figure 4-6. Historical shoreline change from 1934 to 2009 for the Chapin Memorial Beach area Areas of coastal armoring near the end of the road (left photo) and at the northeast boundary of Chapin Memorial Beach (right photo) Figure 4-7. Existing conditions map of Cold Storage Beach Figure 4-8. Figure 4-9. Figure View of Cold Storage Beach showing narrow beach with cobble covered cusps; wide, well vegetated coastal dunes; paved parking area; and Sesuit Harbor jetty with mid-section that has collapsed allowing erosion of the dunes (bottom right) Beach profile data for Cold Storage Beach (profile locations shown in Figure 4-7) Historical shoreline change from 1951 to 2009 for the Cold Storage Beach area Figure Existing conditions map of West Dennis Beach Figure Figure View of beach area, parking lot, and low lying coastal dunes at West Dennis Beach (views looking to the west) Beach profile data for West Dennis Beach (profile locations shown in Figure 4-11) Figure 4-13 (cont).beach profile data for West Dennis Beach (profile locations shown in Figure 4-11) Figure Historical shoreline change from 1938 to 2009 for the West Dennis Beach area Figure Existing conditions map of South Village Beach Figure Figure Figure View of South Village beach (left photo) and coastal dunes (right photo), and parking areas flooded by recent storm activity Beach profile data for South Village Beach (profile locations shown in Figure 4-15) Historical shoreline change from 1938 to 2009 for the South Village Beach area Figure Existing conditions map of Haigis Beach Figure View of Haigis Beach showing the beach resource, revetment, upland dune area, playground, and beach access stairs Figure Beach profile data for Haigis Beach (profile locations in Figure 4-19). 64 Figure Historical shoreline change from 1938 to 2009 for Haigis Beach Figure Existing conditions map of Glendon Rd. Beach Figure Photographs of Glendon Rd. Beach showing the beach and dune resources, as well as the restroom facility, and parking area Final Waterways Assets and Resources iv November 2010
9 Figure Beach profile data for Glendon Rd. Beach (profile locations in Figure 4-23) Figure Historical shoreline change from 1978 to 2009 for the Glendon Rd. Beach area Figure Existing conditions map of Sea St. Beach Figure Photographs of Sea St. Beach showing the sloping revetment, parking area, and beach areas Figure Beach profile data for Sea St. Beach (profile locations in Figure 4-27). 75 Figure Historical shoreline change from 1938 to 2009 for the Sea St. Beach area Figure Existing conditions map of Sea View Beach Figure Photographs of Sea View Beach showing the beach and dune resources as well as the natural surface parking area Figure Beach profile data for Sea St. Beach (profile location in Figure 4-31)..79 Figure Historical shoreline change from 1938 to 2009 for the Sea View Beach area Figure 5-1. Sesuit Harbor grain size compatibility with beaches...83 Figure 5-2. Swan Pond River grain size compatibility with beaches Figure 5-3. Bass River grain size compatibility with beaches LIST OF TABLES Table 3-1. History of maintenance dredging at Sesuit Harbor Table 3-2. permits for Sesuit Harbor dredging Table 3-3. History of maintenance dredging at Swan Pond River Table 3-4. permits for Swan Pond River dredging Table 3-5. History of maintenance dredging at the Bass River Table 3-6. Permits for dredging main navigation channel in Bass River Table 4-1. Summary of amenities and services provided at the public beaches Table 4-2. Summary of beach profile locations Table 5-1. Summary of beach conditions Table 5-2. Beaches within pumping distance to county dredge Table 5-3. Summary of recommendations for enhancing beaches.87 Final Waterways Assets and Resources v November 2010
10 This page intentionally left blank Final Waterways Assets and Resources vi November 2010
11 1.0 EXECUTIVE SUMMARY The following report provides a documentation of existing conditions and Town of Dennis management practices at the four (4) waterways and eight (8) primary public beach sites within the town s jurisdiction. The report lays the framework for a master plan for dredging activities in the waterways, as well as associated beach nourishment to restore the public coastal resources. Available information from town records and permit documents was used to evaluate dredging needs and environmental resources in the 4 waterways. The beach sites were evaluated using a combination of information from town records, permit documents, State and Federal agencies, and survey data collected specifically for this study. A summary of key findings presented in the report is as follows: Maintenance dredging is necessary on an annual basis at Sesuit Harbor and Bass River, and at Swan Pond River every five to seven years. Dredging is performed at these locations to provide safe navigation and to maintain adequate tidal flushing and water quality. Average annual shoaling rates for the waterways include: o Sesuit Harbor 13,000 cubic yards per year o Bass River 8,780 cubic yards per year o Swan Pond River 2,500 to 4,500 cubic yards per year Sediments dredged from the entrances of Sesuit Harbor, Bass River, and Swan Pond River are generally compatible with sand on the public beaches, and can be used to restore and enhance the beach sites. beaches provide significant recreational resources to the public. They also provide storm damage protection and flood control for public infrastructure and nearby private properties. Most of the Nantucket Sound beaches show slightly eroding to nearly stable conditions, with long-term rates of erosion generally less than -1.0 ft/yr. Exceptions to this are South Village Beach and the western end of West Dennis Beach which are slightly accretionary. The highest rates of erosion between -3.6 and -9.6 ft/yr occur at Chapin Memorial Beach. This erosion threatens to undermine the entrance road and associated shore protection structure along Dr. Bottero Rd. Cold Storage Beach shows a trend of accretion on the order of 1.9 to 2.5 ft/yr. This accretion is in part due to the annual beach nourishment that is performed in conjunction with dredging at Sesuit Harbor. Final Waterways Assets and Resources 1 November 2010
12 A summary of key recommendations for planning and operations are presented in order of priority is as follows: Planning Recommendations Request extensions of existing Conservation Commission and DEP Water Quality permits for dredging in Sesuit Harbor to avoid a lapse in permitted activities. File a permit application with the local Conservation Commission for maintenance dredging at the entrance to Bass River to permit work at the local level. Prepare permit applications and file for Comprehensive 10-year permits for all maintenance dredging work in the 3 waterways and for beach nourishment and dune restoration at the public beaches. Incorporate into the permit applications, the flexibility to hydraulically nourish the beaches following the information in Table 5-2, and to nourish using material trucked to any of the beaches. Develop plans and permits (as part of the Comprehensive 10-yr permit) for emergency beach nourishment in the vicinity of Dr. Bottero Rd. where erosion currently threatens the stone revetment and associated roadway. Develop plans and permits (as part of the Comprehensive 10-yr permit) for a dredged material dewatering basin and stockpile site in the dunes at Cold Storage Beach landward of the parking lots. The site would be used to maintain sediments dredged from Sesuit Harbor as a source of clean, beach-compatible sand for trucking to Chapin Memorial Beach, or for post-storm nourishment of the south shore beaches. Continue to investigate the feasibility of dredging Sesuit Inner Harbor. Collect sediment cores to quantify the physical characteristics and chemistry of the dredge material. If fine-grained silts and clays are present, investigate potential locations and costs for sediment dewatering and final placement. Meet with local, state, and federal regulatory personnel to discuss viable alternatives. Investigate the feasibility of securing permits to dredge Chase Garden Creek by quantifying benefits to tidal flushing, water quality, and nearby beach resources. Meet with local, state, and federal regulatory personnel to discuss viable alternatives. Initiate discussions with the US Army Corps of Engineers and the Town of Yarmouth regarding existing practices associated with dredged materials placement at Sesuit Harbor and Bass River. Explore options for maximum placement of sand dredged from these waterways on beaches. Develop estimate of construction costs for repair of Sesuit Harbor jetty. Final Waterways Assets and Resources 2 November 2010
13 Operations Recommendations Install sand fencing along the toe of coastal dune resources to help promote sand accumulation and to prevent uncontrolled foot traffic. Plant bare and sparsely vegetated dune areas with beach grass to help trap windblown sand. Continue these activities on an as needed basis. Utilize sand dredged during maintenance of the waterways for beach nourishment and dune restoration according to the recommendations provided in Table 5-3. Raise the elevation of dune access paths at South Village Beach as part of dune restoration, and install elevated or at grade boardwalks for improved access. Final Waterways Assets and Resources 3 November 2010
14 This page intentionally left blank Final Waterways Assets and Resources 4 November 2010
.")
15 2.0 INTRODUCTION The is located in central Cape Cod, and is bound to the north by Cape Cod Bay and to the south by Nantucket Sound. Its unique location on both of these water bodies creates over 63 miles of open coast and estuarine shoreline (Figure 2-1). The coastal waterways and beach systems that comprise the shorelines of Dennis serve as important resources to the town and its residents. The critical values of these resources must be maintained through careful management so that they continue to support their varied uses. Figure 2-1. Extent of Dennis coastline bordering Cape Cod Bay to the North and Nantucket Sound to the South. As with any coastal area, the waterways and beach resources in the are dynamic settings that are constantly changing in response to coastal processes such as waves, winds, storms, currents, and sea level rise. The interaction of these processes with the geologic framework of the coastline acts to shape the present day shoreline of Dennis. These dynamic waterways and beaches serve a number of important natural functions. For example, the waterways allow tidal flushing of inland bays, channels, and marsh areas, thereby enhancing water quality and habitat values for the marine ecosystem. Coastal beaches, dunes, and banks provide storm damage protection and flood control for inland areas by dissipating incoming wave energy and supplying sediment to adjacent resources. Beaches and dunes also provide important wildlife habitat for certain species Final Waterways Assets and Resources 5 November 2010
16 of shorebirds. In addition to these natural functions, the waterways and beach resources also provide tremendous recreational and economic benefits for commercial and recreational boaters, beachgoers, fishermen, and local merchants. The has committed to managing their waterways and beach resources so that they can continue to serve these important functions. This report documents the waterways and beach assets and lays the framework for a master plan for dredging activities within the waterways, as well associated beach nourishment to restore the public coastal resources. Available information has been used to document dredging needs within the major Dennis waterways, and to define the existing coastal conditions and natural resources. Existing conditions and dominant coastal processes acting to shape the public beaches have also been evaluated. Findings from the waterways and beach asset surveys have been combined to develop recommendations for restoring and/or enhancing the beach areas utilizing material obtained from maintenance of the nearby waterways. The recommendations form the basis of a master plan for dredging and beach nourishment that will guide town officials as to the efficient maintenance and operations of these important public resources. Final Waterways Assets and Resources 6 November 2010


17 3.0 MAINTENANCE OF WATERWAYS RESOURCES The has three primary waterways that are maintained through dredging. Sesuit Harbor, which is also a Federally-authorized navigation channel, is located on the north shore of Dennis along the Cape Cod Bay shoreline (Figure 3-1). The Bass River and Swan Pond River are both located on the Nantucket Sound shoreline, with portions of the Bass River being shared by the towns of Dennis and Yarmouth. Chase Garden Creek, or Bass Hole, located in the northwest part of Dennis, is a fourth waterway where the town would like to begin a program of maintenance dredging. Figure 3-1. Distribution of waterways resources. Final Waterways Assets and Resources 7 November 2010
18 To provide a basis for developing recommendations for the long-term management of waterways resources, an inventory of historical and existing conditions was performed. Historical aerial photographs, permitting records, and existing reports were reviewed for information on past dredging activity, sediment characteristics, and geomorphologic changes to the waterways. Environmental resources were also documented using available information on shellfish, finfish, submerged aquatic vegetation, and estimated habitat for state-listed rare species. This combination of information is critical for the development of effective recommendations to guide future management of Dennis waterways resources. 3.1 SESUIT HARBOR Sesuit Harbor is one of the few harbors of refuge located along the north facing shoreline of Cape Cod. The maintains 2 boat ramps, a mooring field, and a large dock facility in the inner harbor. The harbor also supports a full-service marina (Northside Marina), several charter boat operations, the Dennis Yacht Club, and several commercial restaurants. A few private residences have direct frontage on the upper reaches of Sesuit Harbor, where extensive salt marsh resources occur on the flanks of Sesuit Creek. Because of its importance as a harbor of refuge for southern Cape Cod Bay, Sesuit Harbor was authorized as a federal navigation project by the US Army Corps of Engineers in the early 1980s. The Corps periodically performs maintenance dredging in the entrance channel in order to provide safe passage for boaters. In recent years the has also taken on some of the maintenance dredging responsibilities. The entrance to Sesuit Harbor is protected by two stone jetties built sometime between 1945 and 1950 (Figure 3-2). The eastern jetty was built first, and subsequently extended seaward for a current length of 1,750 ft. The western jetty was constructed in two segments; the outer portion is approximately 620 ft long and runs parallel with the eastern jetty, while the inner portion is 430 ft long and is oriented NE to SW. The design of the western jetty has created a broad open area inside the harbor near where the adjacent shorelines meet the jetties. As shown in Figure 3-2 this part of the harbor has accumulated sediment to form a broad shoal, while the adjacent shoreline inside the harbor has eroded. Over the years sediment has also accumulated inside the harbor along the eastern shoreline between the Dennis Yacht Club and the Northside Marina. A stone revetment built to protect this section of shoreline is shown exposed in the 1971 photograph. Over the 38 year period between 1971 and 2009 the shoreline gradually accreted to a point where dredging is required to maintain adequate widths in the main channel. Shoaling has also taken place along the inside of the eastern jetty, primarily in the area where the shoreline meets the jetty. To maintain safe passage into Sesuit Harbor a program of maintenance dredging has been ongoing since the mid 1940s when the eastern jetty was constructed (Table 3-1). Massachusetts Division of Waterways initially dredged a narrow 30 ft wide channel and placed the dredged sand in the dunes east of the jetty (Figure 3-3). Several years later approximately 5,000 cubic yards of material were removed to form a turning basin near the existing boat ramp on the east side of the harbor. In 1958, a 100 ft wide channel was dredged to a depth of -8 ft MLW. In addition, the shoal area near the base of the western Final Waterways Assets and Resources 8 November 2010


19 Figure 3-2. Historical aerial photographs of Sesuit Harbor from 1971 to 2009 showing shoaling patterns. Final Waterways Assets and Resources 9 November 2010
20 Table 3-1. History of maintenance dredging at Sesuit Harbor. Date Activity Volume (cy) Channel 30 wide to 0 MLW; construct eastern jetty N/A Turning basin near Cold Storage Rd. boat ramp to 6 MLW 5,000 Channel 100 wide to -8 MLW; shoal area at base of west jetty to - 8 MLW; inner harbor to various widths at -6 MLW N/A Placement Area Cold Storage near base of eastern jetty Cold Storage near base of eastern jetty Cold Storage; marsh & upland areas east of inner harbor Sponsor MA Div. Waterways MA Div. Waterways MA Div Waterways MA Div Channel 60 wide to -5.0 MLW N/A Dunes at Cold Storage Waterways 1982 Fed. chan wide; -6 MLW 28,000 Offshore Cold Storage USACE 1988 Fed. chan wide; -6 MLW 26,492 Offshore Cold Storage USACE 1992 Fed. chan wide; -6 MLW 37,360 Offshore Cold Storage USACE 1994 Fed. chan wide; -6 MLW 41,050 Offshore Cold Storage USAE 1995 Fed. chan wide; -6 MLW 2,940 Offshore Cold Storage USACE 1996 Fed. chan wide; -6 MLW 20,000 Offshore Cold Storage USACE 1997 Fed. chan wide; -6 MLW 6,000 East of channel USACE 1998 Fed. chan wide; -6 MLW 20,700 Cold Storage USACE 1998 Fed. chan wide; -6 MLW 3,500 CCB disposal site Town 1999 Fed. chan wide; -6 MLW 18,820 Offshore Cold Storage USACE 2000 Fed. chan wide; -6 MLW 7,090 Cold Storage USACE 2001 Fed. chan wide; -6 MLW 24,400 Offshore Cold Storage USACE 2002 Fed. chan wide; -6 MLW 8,890 Offshore Cold Storage USACE 2003 Fed. chan wide; -6 MLW 13,495 Offshore Cold Storage USACE 2005 Fed. chan wide; -6 MLW 12,060 Offshore Cold Storage USACE 2006 Fed. chan wide; -6 MLW 1 4,651 Cold Storage Town 2007 Fed. chan wide; -6 MLW 1 8,883 Cold Storage Town 2008 Fed. chan wide; -6 MLW 9,550 Offshore Cold Storage USACE 2008 Fed. chan wide; -6 MLW 1 5,426 Cold Storage Town 2009 Fed. chan wide; -6 MLW 23,170 Offshore Cold Storage USACE 2009 Fed. chan wide; -6 MLW 1 6,188 Cold Storage Town 1 Dredging primarily near central portion of channel adjacent to Cold Storage Beach jetty was dredged, as was the tidal marsh area where the current marina facilities are located (Figure 3-3). Available data suggests that the 1958 dredging activities in the inner harbor area exceeded the permitted dredge footprint. Sediments from this large scale dredging effort were placed on Cold Storage Beach and on the marsh east of the inner harbor. The harbor channel was dredged again in 1976 by the Massachusetts Division of Waterways, and then starting in 1982 the existing federal navigation channel, which ranges from 100 to 80 ft wide, was dredged to a depth of -6 ft MLW. Over the next 23 years up until 2005, the US Army Corps of Engineers maintained the authorized channel a total of 13 times (Table 3-1). Dredged volumes Final Waterways Assets and Resources 10 November 2010
21 Figure 3-3. Sesuit Harbor dredging and placement activities. Final Waterways Assets and Resources 11 November 2010
22 ranged from 2,940 to 41,050 cubic yards. Since 2005 the has contracted with the Barnstable County Dredge to maintain the entrance channel on an annual basis. The County Dredge has removed approximately 4,650 to 8,900 cubic yards of sand annually, mostly from the central portion of the Federal channel near Cold Storage Beach. During this same period the Corps also dredged the channel twice, removing significant quantities of material each time. Since 1992 when harbor dredging began on an annual basis, the average yearly shoaling rate has been on the order of 13,000 cubic yards per year. Dredge material placement has been either to the east at Cold Storage Beach, or in a nearshore placement site approximately 0.75 miles offshore. Sediment samples collected from the Sesuit Harbor dredge footprint show medium to coarsegrained sands with a mean grain size from 0.35 to 0.71 mm (Appendix A). Sediments outside the dredge footprint are fine-grained sands, while silty material occurs in the inner harbor around the town docks and mooring area. The has raised concerns over shoaling and reduced navigability in the inner harbor area of Sesuit Harbor, especially in the vicinity of the public marina facilities. A recent study by Louis Berger Group, Inc. (Dec, 2009) evaluated sediment accumulation in this area by comparison of two bathymetric surveys. The first was performed in 2004 before replacement of the Bridge Street culvert, and the second survey was performed in 2009 after replacement of the culvert. The most recent survey data showed water depths very close to the permitted dredge depth of -6 ft MLW from The data also indicated that the restoration project at the Bridge Street crossing of Sesuit Creek did not substantially increase sedimentation patterns within the inner harbor. Nonetheless, current water depths are negatively impacting the existing mooring field and the Town is interested in evaluating the feasibility of dredging this area. Since the area of concern falls within the dredge excess footprint created in 1958 (Figure 3-3), it is likely that the work would be considered improvement dredging by the regulatory agencies, especially if the dredge depth is proposed deeper than -6 ft MLW. Estimates by Louis Berger Group, Inc. show removal of 9,850 cy would be required to achieve a depth of -6 ft MLW. A total of 16,760 cy would need to be dredged to accommodate a one foot overdepth in this area. Environmental resources in the Sesuit Harbor area are shown in Figure 3-4. The Massachusetts Division of Marine Fisheries (DMF) shows potential habitat for blue mussels and American oysters along both of the jetties. Areas of the inner harbor show suitable habitat for quahog, soft-shelled clam, blue mussel, and American oyster. Softshelled clam habitat is also shown in the nearshore zone at Cold Storage Beach where dredged materials have been used for beach nourishment. Eelgrass resources are not found within close proximity to Sesuit Harbor and the area is not mapped as a priority or estimated habitat for state-listed rare species by the Natural Heritage and Endangered Species Program. Final Waterways Assets and Resources 12 November 2010
23 Figure 3-4. Sesuit Harbor shellfish resources. A summary of recent environmental permits issued to the for maintenance dredging in Sesuit Harbor is shown in Table 3-2. The DEP water quality certification, issued directly to the USACE rather than the, is set to expire in December Time of year restrictions for dredging have been required in the recent permits to protect winter flounder. The beach nourishment components of the project have not been subject to time of year restrictions for nesting shorebirds or horseshoe crabs. Final Waterways Assets and Resources 13 November 2010
24 Table 3-2. Agency Dennis Conservation Commission MA DEP Wetlands & Waterways MA DEP Waterways Regulation Program US Army Corps of Engineers permits for Sesuit Harbor dredging. Permit Order of Conditions Water Quality Cert. Chapter 91 Permit General Permit Permit No. SE ; Extension Trans. No (USACE) #10309 NAE Expiration Date 4/1/ /31/2010 6/13/2015 1/21/2015 Activities Permitted Dredge 30,000 cy; placement in nearshore or as beach nourishment Dredge 30,000 cy; placement in nearshore Dredge 30,000 cy; placement in nearshore or as beach nourishment Dredge 5,000 cy; placement as beach nourishment above high tide Time of Year Restrictions NA NA NA No dredging Feb. 1 to May SWAN POND RIVER Swan Pond River is a narrow tidal river that stretches north from Nantucket Sound for over 2 miles to Swan Pond. The river exhibits the typical characteristics of a shallow tidal river system, with a meandering channel and fringing marsh areas on the flanks of the river. Swan Pond River supports a diverse ecosystem that is reflective of a saline estuary at its terminus in Nantucket Sound, and a brackish water pond/wetland system at its headwaters in Swan Pond. Because of the shallow water depths, the river is only utilized for small boat navigation. However, development around the estuary system is relatively dense, especially along the lower reaches of the river, and tidal flushing must be maintained to ensure adequate water quality. Historically, the entrance to Swan Pond River has been an area of active sediment transport (Figure 3-5). The location of the inlet was stabilized as early as 1850, when the western jetty was installed. Modifications to the jetty over the years have included lengthening in both directions, most recently in the early 1990s, when the jetty was extended in a northerly direction to prevent erosion of the western shoreline. Examination of historical aerial photos between and 1961 and 2009 show a net longshore transport direction from west to east in response to the prevailing wave direction out of the west (Figure 3-5). Sand moving in the littoral transport system bypasses the inlet through a mechanism called bar bypassing, where sediment is transported along the offshore shoals, or ebb-tidal delta. Sand also migrates into the channel from the shoreline along the eastern side of the inlet. This sand accumulates at the throat, or narrowest section of the channel, and also in the area of the flood-tidal delta immediately upstream of the throat. The combination of sand accumulating on the ebb- and flood-tidal shoals, and in the inlet throat, acts to restrict tidal flow into and out of the Swan Pond River. Final Waterways Assets and Resources 14 November 2010


25 Figure 3-5. Historical aerial photographs of Swan Pond River from 1961 to 2009 showing sediment transport patterns around the entrance to the river. To maintain adequate tidal circulation within the Swan Pond River, the has undertaken a program of maintenance dredging (Table 3-3). The earliest record of dredging was in 1980, when approximately 17,000 cubic yards of sand were removed from the entrance channel. Since this period the entrance to the river has been dredged 6 times, with dredge intervals ranging from 1 to 10 years (Figure 3-6). The average Final Waterways Assets and Resources 15 November 2010
26 volume of material removed per event over this 30-year interval was 15,000 cubic yards. Annual shoaling rates using the most recent dredging records since 1997, after extension of the western jetty, range between 2,500 and 4,500 cubic yards per year. The dredged sediment has been placed in three primary locations; the beach area approximately 1,000 feet to the east as beach nourishment, the upland area behind the jetty extension as fill, and West Dennis Beach approximately 0.75 miles to the west as beach nourishment (Figure 3-6). Table 3-3. History of maintenance dredging at Swan Pond River. Date Activity Dredged Volume (cy) Placement Area Sponsor 1980 Dredging entrance channel 17,000 unknown Town 1984 Dredging of ebb tidal delta 15,000 unknown Town 1988 Dredging entrance channel 3,000 unknown Town 1997 Channel 60 wide to -4 MLW 23, Channel 60 wide to -4 MLW 14, Channel 60 wide to -4 MLW 9, Channel 60 wide to -4 MLW 20,900 Beach nourishment - West Dennis Beach Beach nourishment - West Dennis Beach Beach nourishment - West Dennis Beach Beach nourishment - West Dennis Beach Town Town Town Town Sediment samples collected from the Swan Pond River dredge footprint in 1993 and 2009 show that the material is well-sorted coarse to medium-grained sand (Appendix A). Environmental resources in the Swan Pond River area are shown in Figures 3-7 through 3-9. Areas offshore of the site are shown by the Massachusetts Division of Marine Fisheries (DMF) to be potential habitat for bay scallops and surf clams, and the area along the entire shoreline is potential habitat for blue mussels. Quahog and soft-shelled clam habitat is mapped in the river starting at the inlet throat and extending upstream (Figure 3-7). Massachusetts DEP shows eelgrass resources immediately offshore of the permitted dredge footprint (Figure 3-8), and the Natural Heritage and Endangered Species Program shows the adjacent beaches and river as priority and estimated habitat for state-listed rare species (Figure 3-9). Final Waterways Assets and Resources 16 November 2010
27 Figure 3-6. Swan Pond River dredging and placement activities. Final Waterways Assets and Resources 17 November 2010
28 Figure 3-7. Swan Pond River shellfish resources. Final Waterways Assets and Resources 18 November 2010
29 Figure 3-8. Swan Pond River eelgrass resources. Final Waterways Assets and Resources 19 November 2010
30 Figure 3-9. Swan Pond River NHESP estimated and priority habitat sites. Final Waterways Assets and Resources 20 November 2010
31 A summary of current environmental permits issued to the for maintenance dredging at the entrance to Swan Pond River is shown in Table 3-4. Since dredging was conducted during the winter of 2009/2010, and permits were updated prior to the dredging, all permits are currently still valid. Time of year restrictions prevent dredging between January 15 and June 15 to protect winter flounder. Additional time of year restrictions prevent beach nourishment activities between April 1 and August 31 to protect nesting shorebirds. Table 3-4. Agency Dennis Conservation Commission MA DEP Wetlands & Waterways MA DEP Waterways Regulation Program US Army Corps of Engineers permits for Swan Pond River dredging. Permit Expiration Activities Time of Year Permit No. Date Permitted Restrictions Dredge No dredging Jan. SE16-20,000 cy 15 to Jun /21/2012 Order of Conditions Beach No nourishment SE16-5/12/2012 nourishment at W. from Apr. 1 to 1866 Dennis Aug. 31 Water Quality Cert. Chapter 91 Permit Prog. General Permit Trans. No /20/2014 # /19/2020 NAE /20/2015 Dredge 20,000 cy; placement as beach nourishment at W. Dennis Dredge 20,000 cy; placement as beach nourishment at W. Dennis Dredge 20,000 cy; placement as beach nourishment at W. Dennis; place 10,000 cy at W. Dennis from other source No dredging Jan. 15 to Jun. 15 in inner channel (Sta to 60+00); no nourishment from Apr. 1 to Aug. 31 No dredging Jan. 15 to Jun. 15 in inner channel (Sta to 60+00); no nourishment from Apr. 1 to Aug. 31 No beach nourishment in Plover habitat from Apr. 1 to Sep BASS RIVER The Bass River waterway is a relatively large estuarine system that is located along the boundary between the Towns of Dennis and Yarmouth. The river provides navigation for recreational and commercial vessels, and is also an important natural resource with a varied ecosystem. The river is connected to Nantucket Sound through a large tidal inlet that is protected by jetties on the west and east sides. The river extends 6.3 miles from the Sound to the north into Kelleys Bay, Follins Pond, and Mill Pond. Stage Island is located just inside the entrance to the river, forming the junction between the main channel which extends to the north, and an easterly trending channel known as the Spur Final Waterways Assets and Resources 21 November 2010

32 Channel that passes by the Fingers area of West Dennis. As the Bass River continues to the north it crosses under bridges at Route 28 and Route 6. Sediment transport along the Nantucket Sound shoreline is generally from the southwest to the northeast. Sediment is routinely transported into the Bass River entrance channel, requiring the Towns of Dennis and Yarmouth to dredge in order to maintain navigable depths. Historically, changes in the geomorphology of the Bass River system have been relatively minor. Comparison of aerial photographs from 1978 to 2009 shows few changes in shoreline orientation within the estuary over the 31 year time period (Figure 3-10). One exception occurs at the western tip of West Dennis Beach, where a sandy spit has grown over the jetty, encroaching on the navigation channel. Other notable changes include a loss of salt marsh resource from Stage Island and areas to the north of West Dennis Beach (Figure 3-10). Figure Historical aerial photographs of Bass River from 1978 to 2009 showing sediment transport patterns around the entrance. The earliest available records for dredging in the Bass River system are from the early 1950s (Table 3-5). This work was conducted by the Massachusetts Division of Waterways and the material was placed on the beach and dune area at West Dennis Beach. Although periodic dredging was certainly undertaken during the next 48 years, the dredging records are incomplete and most are not readily available. Starting in 1998, when the Barnstable County Dredge was utilized to maintain the channel, the dredging records are more complete (Table 3-5). These data show that the channel has been dredged annually since 1998, removing between 4,900 and 16,100 cubic yards per event. Although the permitted dredge channel extends north beyond the Route 28 bridge crossing, most of the maintenance dredging is required in the entrance channel between Stage Island and the seaward end of the channel (Figure 3-11). Average shoaling rates Final Waterways Assets and Resources 22 November 2010
33 for the Bass River since 1998 have been approximately 8,780 cubic yards per year. Since the river is shared by the Towns of Dennis and Yarmouth, the responsibility and funds required to maintain the channel are split evenly. Dredged materials removed from the inner portions of the river have been placed on West Dennis Beach; while material removed from the outer portion of the channel have been used to nourish 5 beaches in Yarmouth to the west of the Bass River entrance channel (Figure 3-11). Other problem shoal areas in the Bass River, outside the permitted dredge footprint, include the town landing at Uncle Freemans Rd. and the entrance to Horsefoot Cove just north of the Rt. 28 bridge. In the past, when dredging has been required in these areas, work has been performed under separate permits other than the main navigation channel. These permits have lapsed, and new filings will be required for any dredging in these areas. Further north along the river, shoaling also occurs at the following locations: entrance channel to Grand Cove, main channel south of High Bank Rd. and adjacent to the Indian Lands Conservation area, and on the north and south sides of the bridges for Rt. 6 and the railroad crossing (Figures 3-12 to 3-13). Although these areas present shoaling problems, dredging has not been performed in the past. Surveys, channel designs, and environmental permits will need to be completed for work in these areas. Table 3-5. Date 1950s History of maintenance dredging at the Bass River. Activity Dredged Volume (cy) Placement Area Sponsor Channel seaward of jetties N/A West Dennis Beach Channel 100 wide to -6 MLW 14,482 Channel 100 wide to -6 MLW 14,847 Channel 100 wide to -6 MLW 12,838 Channel 100 wide to -6 MLW 16,092 Channel 100 wide to -6 MLW 5,744 Channel 100 wide to -6 MLW 4,915 Channel 100 wide to -6 MLW 7,406 Channel 100 wide to -6 MLW 2,700 West Dennis Beach; Various Yarmouth beaches West Dennis Beach; Various Yarmouth beaches West Dennis Beach; Various Yarmouth beaches West Dennis Beach; Various Yarmouth beaches West Dennis Beach; Various Yarmouth beaches West Dennis Beach; Various Yarmouth beaches West Dennis Beach; Various Yarmouth beaches West Dennis Beach; Various Yarmouth beaches MA Div of Waterways Towns Towns Towns Towns Towns Towns Towns Towns Final Waterways Assets and Resources 23 November 2010
34 Figure Bass River dredging and placement activities. Final Waterways Assets and Resources 24 November 2010

. Massachusetts DEP shows eelgrass resources in the areas offshore of the Bass River.")
35 Figure Bass River dredging and placement activities. Figure Bass River dredging and placement activities. Environmental resources in the Bass River area are shown in Figures 3-14 through Areas offshore of West Dennis Beach are shown by the Massachusetts DMF to be potential habitat for bay scallops and surf clams. The inner portions of the river are habitat for a variety of shellfish resources; however, areas with the permitted dredge footprint are shown to be habitat for bay scallop, soft-shelled clam, quahog, and razor clams (Figure 3-14). Massachusetts DEP shows eelgrass resources in the areas offshore of the Bass River. They also indicate areas of former eelgrass inside the river on the shoals seaward of Stage Island (Figure 3-15). The Natural Heritage and Endangered Species Program also shows the entire Bass River and West Dennis Beach area as Final Waterways Assets and Resources 25 November 2010
36 priority and estimated habitat for state-listed rare species (Figure 3-16). The river is also an anadromous fish run for alewife and White Perch. Sediment samples collected from the Bass River dredge footprint in 1986 and 1994 show that the material is well-sorted coarse to medium-grained sand (Appendix A). Environmental permits for maintenance dredging in the main navigation channel at Bass River have been issued to the Town of Yarmouth as part of their 10-Yr Comprehensive Dredging and Beach Nourishment Plan. Although not issued directly to the Town of Dennis, these permits allow dredging within parts of the main navigation channel that lie within Dennis town lines. A summary of permits issued to the Town of Yarmouth for work in the Bass River is provided in Table 3-6. These permits authorize all work necessary to dredge the main navigation channel, with the exception of areas under the jurisdiction of the Dennis Conservation Commission, from which a valid permit does not exist. Time of year restrictions prevent dredging in the upper river between January 15 and June 30, and in the entrance channel from April 1 to June 30. Nourishment at West Dennis Beach is prohibited from May 1 to July 31. Table 3-6. Permits for dredging main navigation channel in Bass River. Agency Permit Permit No. Dennis Conservation Commission Yarmouth Conservation Commission MA DEP Wetlands & Waterways MA DEP Waterways Regulation Program USACE Order of Conditions Order of Conditions Water Quality Certification Chapter 91 Permit General Permit Expiration Date Activities Permitted Time of Year Restrictions N/A N/A N/A N/A SE /3/2020 Trans. No Dredge up to 167,000 cy; placement as nourishment at W. Dennis and various Yarmouth beaches 6/22/2015 See above. Pending Pending See above. See above. See below. N of jetties: no dredging Jan. 15 to Jun. 30. Seaward of jetties: no dredging Apr. 1 to Jun. 30. No nourishment at W. Dennis May 1 to Jul. 31 Final Waterways Assets and Resources 26 November 2010
37 Figure Bass River shellfish resources. Final Waterways Assets and Resources 27 November 2010
38 Figure Bass River eelgrass resources. Final Waterways Assets and Resources 28 November 2010
39 Figure Bass River NHESP estimated and priority habitat sites. Final Waterways Assets and Resources 29 November 2010
.")
40 3.4 CHASE GARDEN CREEK Chase Garden Creek is a shallow estuary system in North Dennis that defines the boundary between the towns of Dennis and Yarmouth. The entrance, known as Bass Hole is bound to the north by Chapin Memorial Beach, and to the south by the salt marsh system that forms the eastern flanks of Barnstable Harbor (Figure 3-17). The Town of Yarmouth maintains a small public boat ramp with 15 slips just inside the entrance to Chase Garden Creek. They also maintain Gray s Beach for use by Yarmouth residents. Aquaculture Research Corp. (ARC), which is the state s only commercial shellfish hatchery producing clam spat for virtually all Massachusetts producers, is located on the Dennis side of the creek. Figure Historical aerial photographs of Chase Garden Creek from 1978 to 2009 showing sediment transport patterns around the entrance to the creek. Navigation into and out of Chase Garden Creek is restricted by the extensive tidal flats located seaward of the creek s entrance. Vessel access is restricted to two hours before and two hours after high tide, as the sand flats are completely exposed at low tide. The entrance to Chase Garden Creek has not been dredged previously; however, the Town of Dennis is interested in investigating the feasibility of obtaining dredge permits for the shoals at the entrance to the creek. Potential dredge volumes for a 2,300 ft long channel dredged to -5 MLW have been computed from a Barnstable County Dredge survey performed in August These data show a significant volume of sand on the order of 300,000 cubic yards. A dredge project in this area could help to improve tidal flushing, and enhance water quality and habitat within the estuary. It would also provide a source of clean beach Final Waterways Assets and Resources 30 November 2010
41 compatible sediment for nearby Chapin Memorial Beach, which is eroding rapidly. Further data collection and analyses on water quality parameters, tidal flushing, and sediment transport will be needed to investigate the benefits and feasibility of establishing a dredged channel in this location. In addition, an analysis of engineering feasibility will be required to evaluate potential channel designs across the tidal flats (width, depth, length, and orientation) that can be maintained with reasonable design life times. Environmental resources at Chase Garden Creek include shellfish and habitat for rare state-listed species of shorebird (Figures 3-18 and 3-19). The shellfish resource data from MA DMF indicate suitable habitat for surf clam, quahog, and blue mussel. Most of the channel, surrounding marsh areas, and barrier beach at Chapin Memorial Beach are also mapped as priority and estimated habitat for rate state-listed wildlife. Final Waterways Assets and Resources 31 November 2010
42 Figure Chase Garden Creek shellfish resources. Final Waterways Assets and Resources 32 November 2010
43 Figure Chase Garden Creek NHESP estimated and priority habitat sites. Final Waterways Assets and Resources 33 November 2010
44 This page intentionally left blank Final Waterways Assets and Resources 34 November 2010
45 4.0 PUBLIC BEACH RESOURCES Salt water public beaches operated by the are split between the Cape Cod Bay and Nantucket Sound shorelines. Of the nineteen (19) publically-owned beach resources, eight (8) were selected by the Town for detailed analysis in this study (Figure 4-1). On the Cape Cod Bay side of Dennis the beaches studied were Chapin Memorial and Cold Storage. Moving from west to east along the Nantucket Sound shoreline, the public beaches studied were West Dennis, South Village, Haigis, Glendon, Sea Street, and Sea View-Inman Road. The remaining coastal and freshwater beaches are also shown in Figure 4-1. Table 4-1 shows the various services and amenities offered at each of the beach sites. To provide a basis for the long-term management of the Dennis public beaches, an inventory of historical and existing conditions was performed. Historical aerial photographs, town records, and existing reports were reviewed for geomorphologic and anthropogenic changes to the beaches. Modern day conditions were also documented through site visits, beach profiling, sediment sampling and digital photography. In addition, a general understanding of the process response relationships at each beach was developed from the inventory data. This combination of information is critical for the development of effective recommendations to guide future management of Dennis natural public beach resources. Results from the inventory are provided separately for each of the public beach sites. A description of the physical components of the sites such as size, type and extent of resource areas, protected species, sediment characteristics, vegetation, elevation and beach slope are discussed. In addition, historical shoreline change and sediment transport patterns are discussed. Anthropogenic features of the sites such as coastal engineering structures, fencing, parking areas, and buildings are also identified and described. Existing conditions plans for each of the public beaches were generated using Geographic Information System (GIS) data layers available from MassGIS and the, as well as new data layers created for wetland resources, sediment sample and beach profile locations. With the exception of the sediment sample and beach profile data, all other mapping was performed using a combination of visual inspection and digital orthophotography (2009 available from the ). The delineation of wetland resource areas followed the definitions provided in the Massachusetts Wetlands Regulations (310 CMR 10.0) and the Wetlands Protection Bylaw of the. Mapping information for Estimated and Priority Habitat was obtained directly from the Massachusetts Division of Fisheries and Wildlife Natural Heritage & Endangered Species Program (NHESP; Mass. Div. of Fisheries and Wildlife, 2008). GIS data layers for eelgrass (DEP, 2004)) and shellfish resources (CZM, DMF, & NOAA, 2004) were downloaded directly from Mass GIS. Additional information on storm surge elevations and flood zone designations for each beach was obtained from the Federal Emergency Management Agency (FEMA) Flood Insurance Study (FIS; FEMA, 1986) for the, and the Flood Insurance Rate Maps (FIRMs). These documents provide estimates of flood conditions during Final Waterways Assets and Resources 35 November 2010
.")


46 storms of varying recurrence intervals (10-, 50-, and 100-yr events). Data describing the geomorphic evolution of the beaches and long-term shoreline change was obtained from the Massachusetts Shoreline Change Project (Theiler, O Connell, Schupp, 2001) updated using 2009 orthophotographs. Figure 4-1. Distribution of public beach sites throughout the (yellow stars sites included in this study; blue triangles other public beach sites). Final Waterways Assets and Resources 36 November 2010
47 Table 4-1. Beach Summary of amenities and services provided at the public beaches. Resident Only Parking Restrooms Concession Handicap Access Boardwalk Showers Playground Lifeguard Chapin Memorial Mayflower Bayview Corporation Howes St. Harbor View Cold Storage Sea St. Scargo Princess West Dennis (East End) South Village Haigis Glendon Rd. Sea St. Raycroft Depot St. Sea View Metcalfe Memorial Final Waterways Assets and Resources 37 November 2010
48 Beach profile data were collected on Dec. 8, 2009 at each of the public beach sites using a Trimble RTK Global Positioning System (GPS). A total of 15 profiles were surveyed as indicated in Table 4-2. The data were collected along shore normal transects starting near the roadway or parking lot areas landward of the beach, and extending to wading depth near mean low water. Elevation (z) and position data (x,y) were collected with respect to NAVD88 and the Massachusetts State Plane Coordinate System NAD Copies of the data files are provided in a separate electronic deliverable. Locations of the profiles and cross-section plots are provided below for each beach respectively. Table 4-2. Summary of beach profile locations. Beach Location Beach Profile Chapin Memorial Chapin 1 & 2 Cold Storage Cold Str. 1 & 2 West Dennis W. Dennis 1, 2, & 3 South Village S. Village 1 Haigis Haigis 1 & 2 Glendon Rd. Glendon 1 & 2 Sea St. Sea St. 1 & 2 Sea View Sea View 1 Samples were also collected for grain size analysis from each of the public beach sites. The samples were collected from the foreshore, or intertidal portion of the beach between mean high water and mean low water. Grain size analyses on the sand-sized fractions were performed by GeoTesting Express and percentages of gravel, sand, and silt were computed along with mean grain-size statistics (Appendix A). 4.1 CHAPIN MEMORIAL BEACH Chapin Memorial Beach is located on Cape Cod Bay in North Dennis at the end of Chapin Beach Road (Figure 4-1). The beach is comprised of an elongated spit that stretches from northeast to southwest forming the entrance to Chase Garden Creek (Bass Hole). A private residence abuts the public beach to the northeast, and the salt marsh and tidal creek system of Chase Garden Creek form the southeast boundary Natural Features and Coastal Processes The public beach parcel at Chapin Memorial Beach is approximately 58 acres in size (Figure 4-2). The resource areas include Coastal Beach, Coastal Dune, Barrier Beach, and Salt Marsh. The Coastal Beach spans the entire length of the property, while the Coastal Dune encompasses the remaining areas of the parcel between the beach and the road. All areas of the beach are also considered Barrier Beach. The only Salt Marsh resource occurs at the terminus of the spit, adjacent to Chase Garden Creek. Most dune areas are well vegetated with beach grass, scrub pine, and other woody vegetation, although some bare dune spots do exist (Figure 4-3). Sediments on the beach are composed of medium-grained sand with a median particle size of 0.39 mm (Appendix A). During certain times of the year the tidal flats are also covered with a veneer of cobbles. The entire beach parcel is also mapped as Estimated and Priority Habitat by the Final Waterways Assets and Resources 38 November 2010
49 Figure 4-2. Existing conditions map of Chapin Memorial Beach. Final Waterways Assets and Resources 39 November 2010

.")
. The dune width also decreases from nearly 700 ft around the parking area to 580 ft near profile 2. The parking area lies at an elevation of 7.")
.")
50 NHESP for rare shorebirds (13th Atlas, 2008; Figure 4-2). Each year staff conducts monitoring for rare coastal water birds. Recent data from show that Piping Plovers have nested in overwash areas along the southern portion of the spit. Figure 4-3. View of Chapin Memorial Beach showing the Coastal Beach resources looking to the southwest and northeast (top photos), as well the extensive Coastal Dune resources (bottom photos). The beach profile data collected at Chapin Memorial Beach show maximum dune crest elevations on the order of 28 ft NAVD88 (Chapin 1 profile; Figure 4-4). The dune elevations are highest in the vicinity of the parking area and begin to taper down towards the end of the spit. At the Chapin 2 profile, maximum dune crest elevations are approximately 15.5 ft NAVD88 (Chapin 2 profile; Figure 4-4). The dune width also decreases from nearly 700 ft around the parking area to 580 ft near profile 2. The parking area lies at an elevation of 7.5 ft NAVD88 and is set lower than the surrounding dunes. The beach area between the toe of the dune and the mid-tide range varies from 75 to 85 ft wide, with a gradual 9% slope. The tidal flats offshore of Chapin Memorial Beach are extensive, spanning a distance of nearly 2,400 to 3,000 ft (Figure 4-4). FEMA storm surge predictions for this area of Dennis indicate flood elevations of 9.0, 10.0, and 10.3 ft NAVD88 for the 10-, 50-, and 100-yr storm events, respectively. Given these predictions, the dunes covering the northern half of the site should provide protection from stillwater flooding associated with storms up to and including the 100-yr event. Further to the southwest, in the vicinity of Chapin 2 profile, the lower dune elevations will likely result in complete overtopping of the primary frontal dune during a 50-yr Final Waterways Assets and Resources 40 November 2010
51 Figure 4-4. Beach profile data for Chapin Memorial Beach (profile locations shown in Figure 4-2). Final Waterways Assets and Resources 41 November 2010
52 storm and greater (Figure 4-4). For the 100-yr storm event, the proposed FEMA Flood Insurance Rate Maps (FIRMs) show the entire dune system at Chapin Memorial Beach to fall within a mapped velocity-zone (VE-zone) with a Base Flood Elevation (BFE) of 14 ft NAVD88. The maps also show an AE-zone with a BFE of 10 ft NAVD88 on the back side of the barrier beach south of the roadway (Figure 4-2). These data suggest that the entire beach parcel will experience storm surge flooding and wave action during a 100-yr storm event. The geomorphic evolution of Chapin Memorial Beach has followed a typical pattern for coastal spit features along sandy coastlines (Figure 4-5). There is some evidence that the spit has experienced periods of growth and elongation to the southwest, as seen with the 1978 shoreline which extended beyond the main entrance to Chase Garden Creek. This type of spit growth causes the inlet channel to become elongated and hydraulically inefficient, until a storm event usually breaches through the spit, forming a new and more direct channel between the marsh and open water. Historical shoreline positions from 1934 to 2009 show significant erosion along the entire length of the barrier beach (Figure 4-5). Long-term rates of change at the northeast end of the beach are between -2.5 ft/yr and -3.6 ft/yr. Significantly higher rates of erosion, between -6.2 ft/yr and -9.6 ft/yr, have occurred along the central and southern portions of the beach. These high erosion rates are indicative of a reduced sediment supply, likely caused by coastal armoring of the shorelines to the northeast. Although Chapin Memorial Beach is part of a larger coastal system that forms the entrance to Barnstable Harbor to the west, it is still strongly influenced by littoral drift from the northeast. The extensive sand shoals and tidal flats offshore of the beach that are part of the broad and shallow entrance to Barnstable Harbor act to dissipate incoming wave energy and protect Chapin from high energy waves. Despite the presence of these shoals and the tremendous quantities of sand stored in them, the beach continues to experience significant erosion. The presence of coastal revetments and groins updrift of the beach have limited and trapped available sand, contributing to the erosion problem at Chapin Memorial Beach. Final Waterways Assets and Resources 42 November 2010
53 Figure 4-5. Historical shoreline change from 1934 to 2009 for the Chapin Memorial Beach area. Final Waterways Assets and Resources 43 November 2010

. A second more extensive revetment is located at the northeast end of the beach, where Chapin Memorial Rd. (Dr. Bottero Rd.) is immediately adjacent to the beach.")
54 4.1.2 Anthropogenic Features Since most of Chapin Beach has been maintained by the as a natural undeveloped resource, few anthropogenic features exist. The public beach parking area and roadway are the two primary features, both of which are paved with asphalt. A small rip rap revetment has been installed at the end of the road where it meets the beach, to provide protection from erosion and to support a sand access ramp to the beach for ORV use (Figure 4-6). A second more extensive revetment is located at the northeast end of the beach, where Chapin Memorial Rd. (Dr. Bottero Rd.) is immediately adjacent to the beach. The revetment provides a critical measure of protection for the roadway which is in danger of being undermined by erosion. Historically, sand fill has been placed on the public beach parcel near the end of this revetment to provide emergency protection for the roadway. Figure 4-6. Areas of coastal armoring near the end of the road (left photo) and at the northeast boundary of Chapin Memorial Beach (right photo). 4.2 COLD STORAGE BEACH Cold Storage Beach is located in East Dennis at the northern terminus of Cold Storage Road (Figure 4-1). The beach is bound to the west by Sesuit Harbor and to the east by private residences and Sea St. Beach, another of the public resources in the Town of Dennis. The open waters of Cape Cod Bay abut the beach to the north and private properties along Salt Works Road bound the property to the south Natural Features and Coastal Processes The public beach parcel is approximately 15 acres in size, including both the beach and landward areas to the south where the parking lots are located (Figure 4-7). Coastal Beach and Coastal Dune resources comprise the majority of the parcel. The dune vegetation consists primarily of beach grass, with woody species of beach plum, bayberry, and scrub pine across the landward half of the dune (Figure 4-8). Sediments on the beach are composed of medium-grained sand with a median particle size of 0.46 mm (Appendix A). In general, these medium-grained sands are uniformly distributed across the beach; however, gravel covered beach cusps commonly form in the intertidal zone during the winter season. State/Federal listed rare species are not present on Cold Storage Beach. Final Waterways Assets and Resources 44 November 2010
55 Figure 4-7. Existing conditions map of Cold Storage Beach. Final Waterways Assets and Resources 45 November 2010
56 Figure 4-8. View of Cold Storage Beach showing narrow beach with cobble covered cusps; wide, well vegetated coastal dunes; paved parking area; and Sesuit Harbor jetty with mid-section that has collapsed allowing erosion of the dunes (bottom right). The dunes at Cold Storage Beach have a primary frontal ridge ranging in elevation from 25 to 37 ft NAVD88 (Figure 4-9). Landward of the dune crest, the elevation tapers down gradually to the back side of the beach parcel. The north and south parking areas are nestled in the dunes at elevations of 18.5 and 14.5 ft NAVD88, respectively. The high tide beach is relatively narrow at 60 to 70 ft, and slopes from the dune to MWH at a grade of 8-9%. The tidal flats extend more than 300 ft offshore with more gradual slopes of around 10%. Final Waterways Assets and Resources 46 November 2010
57 Figure 4-9. Beach profile data for Cold Storage Beach (profile locations shown in Figure 4-7). Final Waterways Assets and Resources 47 November 2010
58 FEMA s predicted elevation of 10.3 ft NAVD88 for stillwater flooding during a 100-yr storm event indicates that the primary frontal dune is critical to providing storm damage protection for the area. Since the existing dunes are considerably higher than the 100-yr stillwater elevation, they will serve as the first line of defense during storms (Figure 4-9). The proposed FEMA FIRMs show a VE-zone with a BFE of 14 ft NAVD88 at the crest of the primary frontal dune. The remaining portion of the beach parcel behind the dune is not mapped by FEMA, and as such is not expected to experience flooding during a 100- yr storm event. Historical shoreline positions for Cold Storage Beach from 1868 to 2009 are shown in Figure These data indicate a long-term trend of accretion over this 141 year period. Rates of shoreline change computed using the more recent data since jetty construction (1951 and 2009) show an average rate of accretion on the order of 2.0 to 2.5 ft/yr. This trend of accretion is in part due to the frequent beach nourishment that occurs in conjunction with dredging at Sesuit Harbor. Without this annual nourishment the beach would likely show neither accretion nor erosion, as the shoreline position is influenced by the local geomorphology. Cold Storage Beach is at the western end of a much larger sediment transport system that includes an extensive tidal flat and shoal area to the east. Quantities of longshore transport appear to be fairly equal in both directions, as seen by the lack of any significant build-up or shoreline offset around the Sesuit Harbor jetties. The nearly 1,700 ft long jetties at the entrance to Sesuit Harbor provide protection for the beach from incoming waves generated by the prevailing northwest winds. Similarly, the land mass of the outer Cape limits the fetch over which waves can be generated from the northeast. As such, the location of Cold Storage Beach is relatively sheltered and the beach position is typically stable Anthropogenic Features The provides two parking areas for access to Cold Storage Beach. The parking area closest to the beach is paved, while the second area is maintained as a gravel surface. The only other man-made structure at the beach is the nearly 1,700 ft long rip rap jetty that bounds the western edge of the beach and protects the entrance to Sesuit Harbor (Figure 4-8). The jetty helps to stabilize the beach and with one exception is in good condition for most of its length. One section approximately 230 ft long located adjacent to the narrowest portion of the navigation channel has begun to collapse, allowing water to flow in behind the jetty. This has caused erosion and undercutting of the landward side of the primary dune at the beach (Figure 4-8; bottom right). If this condition is allowed to proceed without repairs to the jetty, the dune will continue to erode and compromise the ability of the resource to provide storm damage protection and flood control. Sediments eroded from the dune will also continue to exacerbate the shoaling problems in the navigation channel. Final Waterways Assets and Resources 48 November 2010
59 Figure Historical shoreline change from 1951 to 2009 for the Cold Storage Beach area. Final Waterways Assets and Resources 49 November 2010
60 4.3 WEST DENNIS BEACH West Dennis Beach is located at the end of Lighthouse Inn Rd. in West Dennis near the Bass River and the Dennis-Yarmouth town line (Figure 4-1). It is bound to the west and north by the Bass River estuary, to the south by open waters of Nantucket Sound, and to the east by the private property operated as the Lighthouse Inn. West Dennis Beach is one of the most heavily used public beaches in the mid-cape area and is an important asset to the Natural Features and Coastal Processes West Dennis Beach extends in an east-west direction for more than 1 mile and the property is approximately 165 acres in size. Wetland resources include Coastal Beach, Coastal Dune, and extensive areas of Salt Marsh (Figure 4-11). The area is also considered to be a Barrier Beach resource. The Coastal Dunes are located on both sides of the access road and are vegetated primarily with beach grass, Rosa Rugosa and Beach Plum (Figure 4-12). A number of footpaths have been established across the dunes by beachgoers traveling from the parking area to the beach. Sediments on the beach are composed of medium- to fine-grained sands with a median particle size of 0.33 mm (Appendix A). The Massachusetts NHESP has mapped the West Dennis Beach area as Estimated and Priority habitat for rare or state-listed rare wildlife (13th Atlas, 2008; Figure 4-11). Consequently, the performs annual monitoring to document nest locations, and to protect the shorebirds. Data from show that Piping Plovers and Least Terns have nested in the beach and dune areas at the western end of the beach. Profile data collected at West Dennis Beach show that the site is relatively low lying (Figure 4-13). Maximum elevations of 11 ft NAVD88 occur in the dunes at the end of the beach closest to Bass River. The western dune resource spans an area approximately 2,500 ft long and 420 ft wide, forming the largest contiguous dune at West Dennis Beach. Lower lying dunes are also located on the marsh side of the access road; maximum elevations in these areas range from 7 to 8 ft NAVD88. The roadway and parking areas increase in elevation from 3.5 ft NAVD88 near the entrance to the beach to 5.6 ft NAVD88 near the western end. Beach widths vary from east to west across the site. The narrowest beach characterized by W. Dennis profile 3, is only 50 ft wide as it is constrained by the location of the east parking lot (Figure 4-13). The W. Dennis profile 2 shows the greatest beach width of 90 ft. This portion of the beach is also constrained on its landward side by the roadway and associated structures. Further to the west in front of the dune field, the average beach width decreases again to approximately 65 ft. Beach slopes across the entire site are fairly gradual and consistent at 10 to 11%. Final Waterways Assets and Resources 50 November 2010
61 Figure Existing conditions map of West Dennis Beach. Final Waterways Assets and Resources 51 November 2010

62 Figure View of beach area, parking lot, and low lying coastal dunes at West Dennis Beach (views looking to the west). FEMA storm surge predictions for this area of Dennis indicate flood elevations of 4.9, 7.5, and 9.1 ft NAVD88 for the 10-, 50-, and 100-yr storm events, respectively. Given these predictions, it is likely that most of the West Dennis Beach property will be inundated with flood waters during a 50-yr storm and greater. For the 100-yr storm, the proposed FEMA FIRMs show VE-zones with BFEs of 14 and 12 ft NAVD88 along the entire beach and part of the dune. An AE-zone with a BFE of 11 ft NAVD88 is also shown starting behind the primary dune crest and across the marsh areas. The VE-zone designation indicates a combination of storm surge and significant wave activity during the 100-yr event. Historical shoreline data for West Dennis Beach indicate that the Bass River jetties have had a major influence on evolution of the coastline (Figure 4-14). With the dominant direction of littoral transport from west to east in this area, sediment moving along the shoreline is trapped on the updrift, or western side of the Bass River jetties. Immediately following jetty construction in 1902, this likely caused erosion of West Dennis Beach, and the resulting shoreline offset that is seen today. However, the location and orientation of the eastern jetty at Bass River also acts to anchor West Dennis Beach and trap sediment moving from east to west. Since 1938 the data show that this process, in conjunction with dredge material placement, has caused the shoreline to accrete over a 2,800 ft long section of beach east of the jetty (Figure 4-14). Over the past 31 years, rates of accretion at the western end of the beach have been as high as 5.1 ft/yr. To the east where the road runs parallel with the shoreline, the beach shows a trend of long-term erosion between 1978 and Rates of erosion range from -0.6 ft/yr, to a high of -0.9 ft/yr, just west of the bath house and concession building. Higher erosion rates, on the order of -.12 ft/yr, have occurred on the resident only portion of the beach east of the bath house (Figure 4-14). Final Waterways Assets and Resources 52 November 2010
63 Figure Beach profile data for West Dennis Beach (profile locations shown in Figure 4-11). Final Waterways Assets and Resources 53 November 2010
64 Figure 4-13 (cont). Beach profile data for West Dennis Beach (profile locations shown in Figure 4-11) Anthropogenic Features Man-made features at West Dennis Beach include the paved roadway with parking that extends the entire length of the beach, as well as two larger parking areas near the entrance and one at the western end of the beach. In addition, the maintains a concession building and permanent bathing/restroom facilities at the eastern end of the site. A low-lying wooden bulkhead is present along the seaward side of the roadway and parking lots. This feature extends along the entire length of West Dennis Beach, acting as a coastal engineering structure that defines the landward boundary of the beach. Higher erosion rates east of the concession building have historically exposed portions of the wooden bulkhead. Without a beach in front of the bulkhead to protect it, the structure is subject to direct wave activity during storms. As such, periodic placement of beach nourishment at this end of West Dennis Beach has been beneficial to the overall lifespan of the bulkhead. Aside from the jetty at Bass River, the only other coastal engineering structure is a single groin at the end of the beach east of the concession building. Final Waterways Assets and Resources 54 November 2010
65 Figure Historical shoreline change from 1938 to 2009 for the West Dennis Beach area. Final Waterways Assets and Resources 55 November 2010
66 4.4 SOUTH VILLAGE BEACH South Village Beach is a small public beach located in West Dennis at the end of South Village Rd. just to the west of Swan Pond River (Figure 4-1). The beach faces south to the open waters of Nantucket Sound, and is surrounded on all other sides by private residential properties. This beach is used primarily by Dennis residents as the parking area has a resident only restriction Natural Features and Coastal Processes South Village Beach is located on a 2 acre parcel that has approximately 135 ft of beach frontage. Wetland resources consist of Coastal Beach, Coastal Dune and Salt Marsh (Figure 4-15). The dunes are vegetated almost exclusively with beach grass (Figure 4-16). The beach sediments are well-sorted medium to fine-grained sand with a median size of 0.29 mm (Appendix A). According to the Massachusetts NHESP, all areas of the beach and dune are mapped as Priority and Estimated habitat sites for rare or state-listed rare wildlife (13th Atlas, 2008). Although the monitors have not identified nesting shorebirds directly on South Village Beach, nesting sites for Piping Plovers have been found on nearby beaches to the east, and a Piping Plover nest was identified in 2010 at the nearby Town Landing. Consequently, the public beach parcel is considered potential habitat and has been mapped as such. Beach profile data collected at South Village Beach show a relatively low-lying dune with maximum elevations ranging from 10.5 to 11.7 ft NAVD88 (Figure 4-17). The dune width at the public beach is only about 120 ft wide, which is considerably less than dunes on the adjacent properties. Foot traffic and beachgoers have likely compromised the dune in this area. The high tide beach extends for nearly 120 ft at an elevation of 5 ft NAVD88, and then drops rather steeply to the nearshore at a slope of 7.5%. Access paths to the beach have been worn down to the same elevation as the high tide beach, and therefore provide little protection from flooding to more landward areas during storms. FEMA s predicted elevation of 4.9 ft NAVD88 for stillwater flooding during a 10-yr storm indicates that much of the parcel will be inundated during a 10-yr storm and greater. According to the proposed FEMA FIRMs, the beach and dune areas of the lot fall within a mapped VE-zone with a BFE of 14 ft NAVD88. The FIRMs show an AE-zone with a BFE of 10 ft NAVD88 in the parking areas landward of the dunes (Figure 4-15). Final Waterways Assets and Resources 56 November 2010
67 Figure Existing conditions map of South Village Beach. Final Waterways Assets and Resources 57 November 2010
.")
68 Figure View of South Village beach (left photo) and coastal dunes (right photo), and parking areas flooded by recent storm activity. Figure Beach profile data for South Village Beach (profile locations shown in Figure 4-15). Final Waterways Assets and Resources 58 November 2010
69 Historical shoreline change positions between 1978 and 2009 for the South Village Beach area are presented in Figure The data show a trend of accretion along the eastern end of the beach, with rates ranging from 0.4 ft/yr to 1.8 ft/yr. The only area that shows erosion is the western end, with long-term rates of -0.4 ft/yr. The stability of the beach is controlled in large part by the western jetty at the entrance to Swan Pond River. This structure acts to trap and hold sediment moving from west to east with the dominant transport direction. Although the shoreline areas to the west have been stabilized with a series of shore perpendicular groins, the supply of sediment to South Village Beach has not been significantly impacted Anthropogenic Features The primary man-made features at South Village Beach are the 2 natural surface parking areas. The elevations of the parking lots are extremely low at 1.5 ft NAVD88, and as such they are susceptible to flooding. Flood waters reach the parking areas either through the beach access paths or through a small marsh channel that connects with Swan Pond River. The marsh channel runs between the two parking areas and connects a small marsh pond with the river. The only man-made structure on the beach parcel is a concrete retaining wall installed between the marsh channel and the edge of the northern parking lot. Final Waterways Assets and Resources 59 November 2010
70 Figure Historical shoreline change from 1938 to 2009 for the South Village Beach area. Final Waterways Assets and Resources 60 November 2010
71 4.5 HAIGIS BEACH Haigis Beach is located in the village of Dennisport on Old Wharf Rd (Figure 4-1). The site faces south to the open waters of Nantucket Sound, and is bound to the west by the private recreational vehicle park known as Campers Haven. Private residences also abut the property across the road to the north and to the east Natural Features and Coastal Processes The Hagis Beach property is made up of 2 separate parcels that together total 3 acres. A stone revetment separates the site into 2 distinct areas; the beach area seaward of the revetment and an upland area behind, or landward of the revetment. The only resource present under the Massachusetts Wetlands Regulations (310 CMR 10.0) and the Town of Dennis Wetlands Protection Bylaw is Coastal Beach (Figure 4-19). A portion of the site has been maintained as a naturally vegetated dune with access paths to the beach; however, because of it location landward of the revetment, this feature does not meet the regulatory definition of Coastal Dune. Upland parts of the site also contain the parking lot and a large open sandy area used as a volleyball court and playground (Figure 4-20). The beach sediments are medium to coarse-grained sand with a median size of 0.62 mm (Appendix A). According to the Massachusetts Natural Heritage and Endangered Species Program (NHESP; 13th Atlas Edition, 2008), Haigis Beach is not mapped as Estimated or Priority habitat for rare or state-listed rare wildlife. Beach profile data collected at Haigis Beach are shown in Figure Two profile locations were surveyed; one through the parking area, revetment, and beach (Haigis profile 1), and a second profile through the upland dune area, revetment, and beach (Haigis profile 2). Elevations at Haigis profile 1 increase gradually from 8.5 ft at the road edge to approximately 14.0 ft NAVD88 at the top of the revetment. Elevations across the upland dune at Haigis profile 2 vary from 11.0 ft to 16.0 ft NAVD88 across the 220 ft wide feature. The top of the revetment shows an elevation of 13.5 ft NAVD88 and slopes steeply at a 45 degree angle to the beach. The high tide portion of the beach is approximately 60 to 70 ft wide with a gradual slope of around 10%. Seaward of MHW the intertidal portion of the beach continues the consistent 10% slope. Final Waterways Assets and Resources 61 November 2010
72 Figure Existing conditions map of Haigis Beach. Final Waterways Assets and Resources 62 November 2010


73 Figure View of Haigis Beach showing the beach resource, revetment, upland dune area, playground, and beach access stairs. The beach profile data show that FEMA s 100-yr stillwater elevation of 9.1 ft NAVD88 reaches approximately mid-way up the revetment. Assuming that the structure can withstand the 100-yr storm event, it should provide protection from stillwater flooding for storms up to and including the 100-yr event. The proposed FEMA FIRMs show a VE-zone with a BFE of 14 ft NAVD88 extending from the water to the top of the revetment. The maps also show a narrow AE-zone with a BFE of 16 ft NAVD88 immediately behind the revetment. The process of wave overtopping during severe storms likely causes the designation of this AE-zone. Final Waterways Assets and Resources 63 November 2010
74 Figure Beach profile data for Haigis Beach (profile locations in Figure 4-19). Final Waterways Assets and Resources 64 November 2010
75 Historical shoreline change positions between 1978 and 2009 for the Haigis Beach area are presented in Figure The data show a trend of long-term erosion on the order of -0.5 ft/yr to -1.0 ft/yr. The shore perpendicular groins, which were built sometime after 1938, have provided some stability to the beach; however, extensive shoreline armoring and groin installation along this stretch of shoreline have limited the supply of sand to Haigis Beach Anthropogenic Features The primary anthropogenic features at Haigis Beach include the stone revetment, 2 stone groins, and the paved parking area (Figure 4-20). Void spaces in the revetment have been grouted with concrete and the cap layer of the structure is also composed of concrete, rather than the traditional stone. The groins are in good condition with no signs of displaced stones or collapse. The western groin is connected at the landward end to a revetment on the adjacent property and is higher in elevation than the adjoining beach. As such, this structure serves as a complete barrier to sediment moving alongshore. The eastern groin is lower in elevation and allows some alongshore sediment transport along the high tide beach during storms. The maintains a wooden stairway across the revetment for access to the beach, as well as an at-grade boardwalk from the parking area to the stairway. Final Waterways Assets and Resources 65 November 2010
76 Figure Historical shoreline change from 1938 to 2009 for Haigis Beach. Final Waterways Assets and Resources 66 November 2010
77 4.6 GLENDON RD. BEACH Glendon Rd. Beach is located in the village of Dennisport on Old Wharf Rd., approximately 0.25 miles east of Haigis Beach (Figure 4-1). The beach faces the open waters of Nantucket Sound to the south, and is bound by private residences to the east and west. Commercial properties are located to the north across Old Wharf Rd Natural Features and Coastal Processes The Glendon Rd. Beach property is made up of 3 separate parcels that together total just under 2 acres (Figure 4-23). Wetland resources on the site include a Coastal Beach and a man-made Coastal Dune. The dune, which is vegetated with beach grass, surrounds the small building constructed to house the public restroom facilities (Figure 4-24). The beach sediments are medium to fine-grained sand with a median size of 0.28 mm (Appendix A). According to the Massachusetts Natural Heritage and Endangered Species Program (NHESP; 13th Atlas Edition, 2008), Glendon Rd. Beach is not mapped as Estimated or Priority habitat for rare or state-listed rare wildlife. The Glendon Rd. Beach profile data indicate that the site is relatively low-lying with maximum elevations of 10.0 ft NAVD88 in the area of the man-made dune (Figure 4-25). The parking area is about 60 ft wide and ranges in elevation from 6.3 ft to 8.0 ft NAVD88. The parking lot is set higher than the adjacent roadway and is separated by a sidewalk and retaining wall. The high tide beach averages about 50 ft wide and slopes gradually to the water at grades of 9 to 10%. The dune surrounding the restroom facility measures approximately 60 ft long by 35 ft wide. FEMA s predicted elevation of 7.5 ft NAVD88 for stillwater flooding during a 50-yr storm indicates that much of the parcel will be inundated during a 10-yr storm and greater. According to the proposed FEMA FIRMs, the beach and dune areas of the lot fall within a mapped VE-zone with a BFE of 14 ft NAVD88. The FIRMs show an AEzone with a BFE of 10 ft NAVD88 in the parking areas landward of the dunes. This information indicates that the entire parcel would experience flooding and wave activity during a 100-yr storm event. Historical shoreline change positions between 1978 and 2009 for the Glendon Rd. Beach area are presented in Figure The data show accretion following the 1938 time period, likely due to the phase of groin building along the south Dennis shoreline. Since 1978 however, the beach has been eroding gradually at an average rate of 1.0 ft/yr. Final Waterways Assets and Resources 67 November 2010
78 Figure Existing conditions map of Glendon Rd. Beach. Final Waterways Assets and Resources 68 November 2010


79 Figure Photographs of Glendon Rd. Beach showing the beach and dune resources, as well as the restroom facility, and parking area Anthropogenic Features Man-made features at Glendon Rd. Beach include the asphalt parking area, restroom facility, and a retaining wall between the parking lot and sidewalk to contain a septic system for the restrooms. Coastal engineering structures include 3 stone groins and a low-lying timber bulkhead separating the beach from the parking lot. The groins are in good condition, and do not show signs of collapse. The groins do not extend landward far enough to reach the timber bulkhead, and as such allow sediment to move along the beach during storms. The bulkhead top ranges from 0.5 to 3 feet above the elevation of the beach. Final Waterways Assets and Resources 69 November 2010
80 Figure Beach profile data for Glendon Rd. Beach (profile locations in Figure 4-23). Final Waterways Assets and Resources 70 November 2010
81 Figure Historical shoreline change from 1978 to 2009 for the Glendon Rd. Beach area. Final Waterways Assets and Resources 71 November 2010
82 4.7 SEA STREET BEACH Sea Street Beach is located in the village of Dennisport at the end of Sea St. (Figure 4-1). The property faces south to the open waters of Nantucket Sound. To the west and north the beach parcel is bound by private residences and to the east by the commercial property known as the Pelham House Resort Natural Features and Coastal Processes The Sea St. Beach parcel is approximately 2.6 acres in size including the beach and parking area (Figure 4-27). Wetland resources include Coastal Beach and Coastal Bank, with the bank being armored with a stone revetment (Figure 4-28). Several small patches of beach grass are located on the beach and some Rosa Rugosa is present near the top of the revetment. The beach sediments are medium-grained sand with a median size of 0.54 mm (Appendix A). According to the Massachusetts Natural Heritage and Endangered Species Program (NHESP; 13th Atlas Edition, 2008), Sea St. Beach is not mapped as Estimated or Priority habitat for rare or state-listed rare wildlife. Beach profile data for Sea St. Beach show that the parking area slopes very gradually towards the Sound, with elevations ranging from 22.5 to 21.2 ft NAVD88 (Figure 4-29). On average the parking area is 75 ft wide. Elevations at the top and bottom of the revetment are 22.0 and 5.5 ft NAVD88, respectively. The structure slopes very steeply to the beach at a grade of 61% (1V:1.6H). Seaward of the revetment the beach is only about 45 to 50 ft wide and slopes to the water at a moderately steep grade of 9%. FEMA s predicted elevation of 9.1 ft NAVD88 for stillwater flooding during a 100-yr storm indicates that the revetment provides protection from flooding during and up to the 100-yr storm event. The proposed FEMA FIRMs show a mapped VE-zone with a BFE of 19 ft NAVD88 across the face of the revetment. The parking area is outside the FEMA 100-yr floodplain. Historical shoreline change positions between 1938 and 2009 for the Sea St. Beach area are presented in Figure The data show accretion following the 1938 time period when many of the groins were built along the south Dennis shoreline. Between 1978 and 1994 the shoreline experienced a net erosion, and over the past 15 years the shoreline has remained relatively stable, showing little net accretion or erosion. Long-term rates of change computed over the period 1938 to 2009 show an average rate of change on the order of +0.5 ft/yr; however, when considering the most recent 15 year time period the average rate of change is near zero. Final Waterways Assets and Resources 72 November 2010
83 Figure Existing conditions map of Sea St. Beach. Final Waterways Assets and Resources 73 November 2010
84 Figure Photographs of Sea St. Beach showing the sloping revetment, parking area, and beach areas Anthropogenic Features Anthropogenic features in the upland areas of Sea St. Beach include the paved parking area and a gravel path along the top of the coastal bank and revetment. The site also contains the rip rap revetment, access stairs to the beach, and 4 stone groins. The groins are low relief structures that meet the base of the revetment near the back of the beach. Because they are lower in elevation sand is able to move along the upper beach face during storms. The groins and revetment are generally in good condition showing no signs of collapse or failure. Final Waterways Assets and Resources 74 November 2010
85 Figure Beach profile data for Sea St. Beach (profile locations in Figure 4-27). Final Waterways Assets and Resources 75 November 2010
86 Figure Historical shoreline change from 1938 to 2009 for the Sea St. Beach area. Final Waterways Assets and Resources 76 November 2010
87 4.8 SEA VIEW BEACH Sea View Beach is located in the village of Dennisport at the junction of Chase Ave. and Inman Rd. (Figure 4-1). The beach is bound to the west, north, and east by a mixture of commercial and private properties. The site also faces south to the open waters of Nantucket Sound Natural Features and Coastal Processes The public beach parcel at Sea View Beach is approximately 0.7 acres in size (Figure 4-31). The site contains a parking area, as well as Coastal Dune and Coastal Beach resources (Figure 4-32). The dunes are well vegetated with beach grass and provide a short path for access to the beach. Development on either side of the public beach parcel has minimized the room for dunes to develop, and as such the resource at the Sea St. Beach site is nearly an isolated feature. Beach sediments are composed of well-sorted medium to fine-grained sands with a median diameter of 0.34 mm (Appendix A). According to the Massachusetts Natural Heritage and Endangered Species Program (NHESP; 13th Atlas Edition, 2008), Sea View Beach is not mapped as Estimated or Priority habitat for rare or state-listed rare wildlife. Beach profile data from Sea View Beach show that the parking area is approximately 190 ft wide (Figure 4-33). It ranges in elevation from 4.5 ft near the road to 6.5 ft NAVD88 at the landward toe of the dune. The Coastal Dune is about 45 ft wide with a maximum crest elevation of 9.4 ft NAVD88. The backshore portion of the beach has a very gradual slope towards the water, while the intertidal section slopes more steeply at a grade of 8%. FEMA s predicted elevation of 9.1 ft NAVD88 for stillwater flooding during a 100-yr storm indicates that much of the parcel will be inundated during a severe 100-yr storm event. According to the proposed FEMA FIRMs, the beach and dune areas of the lot fall within a mapped VE-zone with a BFE of 12 ft NAVD88. The FIRMs also show an AEzone with a BFE of 9 ft NAVD88 in the parking area landward of the dune. This information indicates that the entire parcel would experience flooding and wave activity during a 100-yr storm event. Historical shoreline change data for Sea View Beach are shown in Figure The data indicate that the beach has remained relatively stable over the 71 yr period since Average long-term rates of change between -0.2 ft/yr and -0.6 ft/yr suggest that the beach is slightly erosional to stable Anthropogenic Features The only man-made feature at Sea View Beach is the natural surface parking area. All other parts of the beach are in their natural, unaltered state. Final Waterways Assets and Resources 77 November 2010
88 Figure Existing conditions map of Sea View Beach. Final Waterways Assets and Resources 78 November 2010


.")
89 Figure Photographs of Sea View Beach showing the beach and dune resources as well as the natural surface parking area. Figure Beach profile data for Sea St. Beach (profile location in Figure 4-31). Final Waterways Assets and Resources 79 November 2010
90 Figure Historical shoreline change from 1938 to 2009 for the Sea View Beach area. Final Waterways Assets and Resources 80 November 2010
91 5.0 DREDGING AND BEACH NOURISHMENT MASTER PLAN 5.1 FINDINGS Existing beaches provide significant recreational resources to the public. They also provide storm damage protection and flood control for public infrastructure and nearby private properties. Trends in shoreline change, sediment characteristics, and habitat areas at each of the beaches studied are summarized in Table 5-1. Table 5-1. Summary of beach conditions. Beach Site Chapin Memorial Cold Storage West Dennis South Village Shoreline Trend eroding accreting to stable eroding east end accreting west end accreting Rate of Change -3.6 ft/yr east end -9.6 ft/yr center -6.2 ft/yr west end 1.9 to 2.5 ft/yr (with nourishment) -0.6 to -1.2 ft/yr east end < 1 ft/yr west end 0.4 to 0.8 ft/yr Haigis eroding -0.5 to -1.1 ft/yr Glendon Rd. eroding -0.8 to -1.2 ft/yr Sea St. eroding -0.6 to -0.9 ft/yr Sea View eroding -0.2 to -0.6 ft/yr Mean Grain Size (mm) 0.39 mm medium sand 0.46 mm medium sand 0.33 mm medium sand 0.29 mm medium sand 0.62 mm coarse sand 0.29 mm medium sand 0.54 mm coarse sand 0.34 mm medium sand Habitat Type Rare shorebirds N/A Rare shorebirds; Horseshoe crabs Rare shorebirds Most of the Nantucket Sound beaches show slightly eroding to nearly stable conditions. Long-term rates of erosion are generally less than -1.0 ft/yr. The only Nantucket Sound beaches to show long-term accretion are South Village Beach and the western end of West Dennis Beach. Low rates of accretion at South Village Beach are influenced by the jetty at Swan Pond River, which tends to trap easterly moving littoral drift. Accretion at the western end of West Dennis Beach has been influenced by past nourishment activities, as well as the eastern jetty at Bass River, which traps sediment during periods of reversal in transport direction. N/A N/A N/A N/A Chapin Memorial Beach, on the Cape Cod Bay side, shows the highest rates of shoreline erosion with risks to the roadway near the entrance to the beach Final Waterways Assets and Resources 81 November 2010
92 property. Accretion rates at Cold Storage Beach have been influenced by past beach nourishment activities associated with dredging of Sesuit Harbor. Maintenance dredging is performed at the 3 primary waterways: Sesuit Harbor, Bass River, and Swan Pond River. Dredging is performed to provide safe navigation and to maintain adequate tidal flushing. Maintenance dredging is necessary on an annual basis at Sesuit Harbor and Bass River. At Swan Pond River dredging is required every 5 to 7 years. Average annual shoaling rates for the 3 waterways are as follows: o Sesuit Harbor 13,000 cubic yards per year o Bass River 8,780 cubic yards per year o Swan Pond River 2,500 to 4,500 cubic yards per year Hydraulic dredging and beach nourishment using the Barnstable County Dredge is the most commonly used method of channel maintenance. The US Army Corps of Engineers also utilizes a hopper dredge at Sesuit Harbor. Using Barnstable County equipment, hydraulic dredging with direct placement as beach nourishment generally meets the following criteria: o Maximum pump distance of 2,500 ft (without booster pump); production rate of 1,000 to 1,500 cy/day; $12/cy at 2010 rates. o Maximum pump distance of 2,500 to 4,000 ft (with booster pump); production rate of 2,000 to 3,000 cy/day; $20/cy at 2010 rates. Sand dredged from the waterways can be hydraulically pumped to the various beaches shown in Table 5-2. Existing ORV use of Chapin Memorial Beach is regulated by an Order of Conditions issued by the Dennis Conservation Commission. This permit prohibits ORV access near the toe of the dunes. Provided that this requirement is enforced, the existing practice of allowing ORVs on the beach has little to no impact on erosion of the beach. Beach nourishment compatibility guidelines suggest that source material should always be equal to or coarser than the native beach sand. Following these guidelines, grain size compatibility curves for the three waterways shown in Figures 5-1 to 5-3, indicate that in general, material dredged from the entrances of Sesuit Harbor, Swan Pond River, and Bass River are compatible with the beaches evaluated. The following exceptions occur: o Sediments from the inner harbor areas of Sesuit Harbor contain more than 10% fines, and are thus not suitable for beach nourishment. o Sediment from Sesuit Harbor should not be used to nourish Haigis or Sea St. beaches, as the material is consistently finer than the native beach sand. Final Waterways Assets and Resources 82 November 2010
93 Table 5-2. Waterway Sesuit Harbor Outer Bass River Inner Bass River Swan Pond River Bass Hole Beaches within pumping distance to county dredge. Accessible Beach Without Booster Pump Cold Storage Beach West Dennis Beach (western half) West Dennis Beach (western half) South Village Beach Haigis Beach Chapin Memorial (west end) Accessible Beach With Booster Pump N/A West Dennis Beach (western half to end of dunes) West Dennis Beach (western half to 800 ft past dunes) West Dennis Beach (east end) Glendon Rd. Chapin Memorial (~ to ORV entry ramp) Habitat Type Winter flounder (inner channel) Diadromous fish, Horseshoe crabs Winter flounder, Diadromous fish, Horseshoe crabs Winter flounder (inner channel) Winter flounder (likely present) Figure 5-1. Sesuit Harbor grain size compatibility with beaches. Final Waterways Assets and Resources 83 November 2010
94 Figure 5-2. Swan Pond River grain size compatibility with beaches. Figure 5-3. Bass River grain size compatibility with beaches. Final Waterways Assets and Resources 84 November 2010
95 Past dredging records indicate that the three waterways generate between 15,500 and 26,280 cy of clean beach compatible sand on an annual basis. However, on average only about 10,500 cy of sand are being used annually to replenish the beaches, as Sesuit Harbor sand dredged by the USACE is dumped offshore, and Bass River sand from the entrance channel is routinely placed on Town of Yarmouth Beaches. Most dredging projects in Barnstable County are now being permitted with standardized time of year (TOY) restrictions for specific species of concern. These include the following: o Winter Flounder Jan 15 to May 31; most entrance channels outside jetties are not subject to this TOY o Horseshoe Crab May 1 to August 1 o Anadromous Fish Run April 1 to June 15 o State/Federally Listed Shorebirds April 1 to August RECOMMENDATIONS Planning Recommendations The should consider wherever possible coordination of dredging activities in the local waterways with maintenance of valuable public coastal resources. Request extensions of existing Conservation Commission and DEP Water Quality permits for dredging in Sesuit Harbor to avoid a lapse in permitted activities. File a permit application with the local Conservation Commission for maintenance dredging at the entrance to Bass River to permit work at the local level. Prepare permit applications and file for Comprehensive 10-year permits for all maintenance dredging work in the 3 waterways and for beach nourishment and dune restoration at the public beaches. Incorporate into the permit applications, the flexibility to hydraulically nourish the beaches following the information in Table 5-2, and to nourish using material trucked to any of the beaches. Develop plans and permits (as part of the Comprehensive 10-yr permit) for emergency beach nourishment in the vicinity of Dr. Bottero Rd. where erosion currently threatens the stone revetment and associated roadway. Develop plans and permits (as part of the Comprehensive 10-yr permit) for a dredged material dewatering basin and stockpile site in the dunes at Cold Storage Beach landward of the parking lots. The site would be used to maintain sediments dredged from Sesuit Harbor as a source of clean, beach-compatible sand for trucking to Chapin Memorial Beach, or for post-storm nourishment of the south shore beaches. Final Waterways Assets and Resources 85 November 2010
96 Continue to investigate the feasibility of dredging Sesuit Inner Harbor. Collect sediment cores to quantify the physical characteristics and chemistry of the dredge material. If fine-grained silts and clays are present, investigate potential locations and costs for sediment dewatering and final placement. Meet with local, state, and federal regulatory personnel to discuss viable alternatives. Investigate the feasibility of securing permits to dredge Chase Garden Creek by quantifying benefits to tidal flushing, water quality, and nearby beach resources. Meet with local, state, and federal regulatory personnel to discuss viable alternatives. Initiate discussions with the US Army Corps of Engineers and the Town of Yarmouth regarding existing practices associated with dredged materials placement at Sesuit Harbor and Bass River. Explore options for maximum placement of sand dredged from these waterways on beaches. Develop estimate of construction costs for repair of Sesuit Harbor jetty. Consider beneficial reuse of fine-grained dredged material for salt marsh restoration in Bass River, if effort to dredge fines from the inner basin at Sesuit Harbor proceeds, or if problem shoal areas in the upper Bass River are found to contain fine-grained sediments. Operations Recommendations A summary of recommendations for enhancing the beaches is provided in Table 5-3. These recommendations are intended to improve the ability of the beaches to provide storm damage protection, flood damage control, and to improve their value as recreational resources. Management decisions regarding nourishment and/or dune enhancement at the beaches should be made on an annual basis, by factoring in estimated volumes of sediment available from dredging projects as well as site specific beach conditions. Install sand fencing along the toe of coastal dune resources to help promote sand accumulation and to prevent uncontrolled foot traffic. Plant bare and sparsely vegetated dune areas with beach grass to help trap windblown sand. Continue these activities on an as needed basis. Raise the elevation of dune access paths at South Village Beach as part of dune restoration, and install elevated or at grade boardwalks for improved access. Restore coastal dune resources at South Village, Glendon Rd., and Sea View Beaches where storm-induced flooding places more landward infrastructure at risk. Continue to make use of the Barnstable County Dredge to maintain the Town of Dennis waterways, and to beneficially reuse dredged sediments where possible. Final Waterways Assets and Resources 86 November 2010
97 Table 5-3. Beach Site Chapin Memorial Cold Storage West Dennis South Village Haigis Glendon Rd. Sea St. Sea View Summary of recommendations for enhancing beaches. Recommendation Beach nourishment and dune restoration at east end; ~2,500 ft long from east end; ~15 to 20 cy/foot of beach Reduce frequency of nourishment to every other year; stockpile extra sand in dunes landward of parking lots for use at other beaches as needed Beach nourishment and dune restoration; ~3,800 ft long; ~15 to 20 cy/foot of beach. Negotiate with the Town of Yarmouth to share sand dredged from the entrance channel, rather than pump it all to Yarmouth Dune restoration with path for beach access; ~110 ft long by 80 ft wide to 100-yr stillwater elev. Beach nourishment; ~370 ft long to ends of the groins; ~8 to 10 cy/foot of beach Beach nourishment and dune restoration; ~450 ft long to ends of the groins; ~8 cy/foot of beach Beach nourishment; ~570 ft long to ends of the groins; ~8 to 10 cy/foot of beach Dune restoration with path for beach access; ~110 ft long by 50 ft wide to 100-yr stillwater elev. Source and Method of Sand Placement Bass Hole pumped Sesuit Harbor trucked Sesuit Harbor pumped Bass River pumped Swan Pond River - pumped Swan Pond River - pumped Swan Pond River pumped Sesuit Harbor trucked Swan Pond River pumped Sesuit Harbor - trucked Swan Pond River trucked Sesuit Harbor - trucked Swan Pond River trucked Sesuit Harbor - trucked Estimated Volume 37,500 to 50,000 cy 6,000 cy 57,000 to 76,000 cy 1,000 cy 3,000 to 3,700 cy 3,600 cy 4,500 to 5,700 cy 750 cy Final Waterways Assets and Resources 87 November 2010
98 This page intentionally left blank Final Waterways Assets and Resources 88 November 2010
99 6.0 REFERENCES CITED Federal Emergency Management Agency Flood Insurance Study, Town of Dennis, Massachusetts, Barnstable County, 17 pp. + Appendices. Massachusetts Coastal Zone Management, Division of Marine Fisheries, National Oceanic and Atmospheric Administration Coastal Services Center Coastal Areas Suitable for Shellfish in Massachusetts. GIS Shapefiles from Mass GIS. Massachusetts Department of Environmental Protection Wetlands Conservancy Program Eelgrass Maps. GIS Shapefiles from Mass GIS. Massachusetts Division of Fisheries and Wildlife Priority and Estimated Habitat Maps, Natural Heritage and Endangered Species Program, Thieler, E.R., J.F. O Connell, and C.A. Schupp The Massachusetts Shoreline Change Project: 1800s to 1994, Technical Report prepared in collaboration with USGS, WHOI Sea Grant, Cape Cod Cooperative Extension, and Massachusetts Office of Coastal Zone Management, 39 pp. + Appendices. Final Waterways Assets and Resources 89 November 2010
100 This page intentionally left blank Final Waterways Assets and Resources 90 November 2010
101 APPENDIX A GRAIN SIZE ANALYSES Final Waterways Assets and Resources A-1 November 2010
102 This page intentionally left blank Final Waterways Assets and Resources A-2 November 2010
 468-5075 Fax: (713) 468-1115 Delaware Office 100 Carlson Way, Suite 9 Capital City Business Park Dover, DE")
103 , Inc. 81 Technology Park Drive East Falmouth, MA Tel: (508) Fax: (508) Web: Houston Office Shadow Wood Drive, Ste 100 Houston, TX Tel: (713) Fax: (713) Delaware Office 100 Carlson Way, Suite 9 Capital City Business Park Dover, DE Tel: (302) Fax: (302) Woods Hole Group Middle East Ibn Zahar P.O. Box Riyadh Kingdom of Saudi Arabia Tel: Fax:
104 Dennis Public Beaches 2009 Sample Results
105 Chapin Memorial Beach
106 Cold Storage Beach
107 Glendon Beach
108 Haigis Beach
109 Sea Street Beach
110 Sea View Beach
111 South Village Beach
112 West Dennis Beach
113
114
115
116
117
118
119
120
121
122
123
124
125
126
127 B-1 B-2 B-3 B-4
128 B-5 B-6 B-7
129 B-8 B-9 B-10
130
131
132
133
134
135
136
137
138
139
140
141
142
143
144
145
146
147
148
149
150
151
152
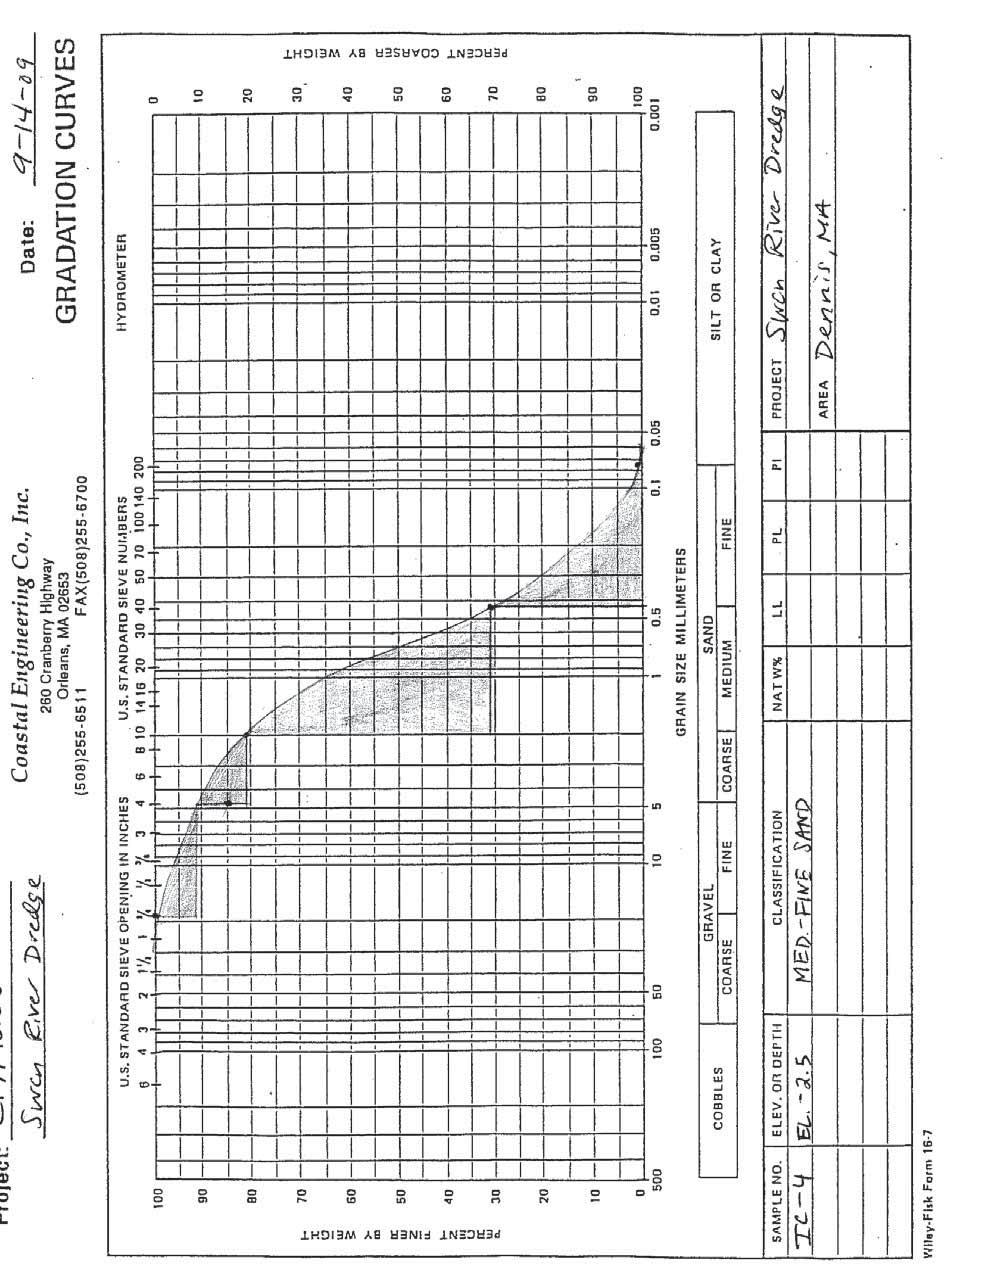
153
154
155
156
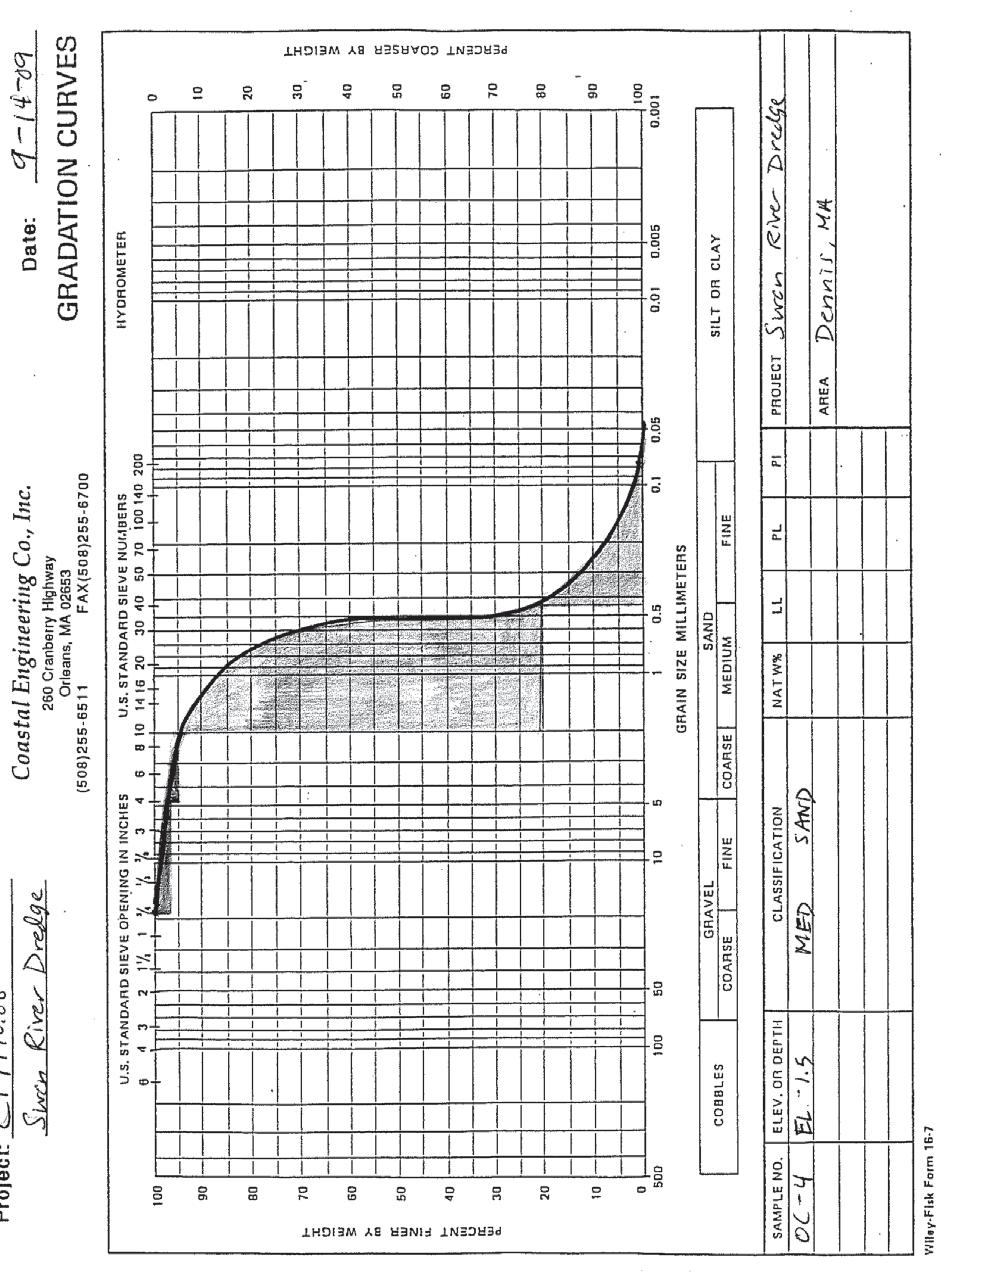
157
TOWN OF DENNIS 10 YR COMPREHENSIVE DREDGE PERMIT SEPTEMBER 10, 2013
 TOWN OF DENNIS 10 YR COMPREHENSIVE DREDGE PERMIT SEPTEMBER 10, 2013 WHAT IS IT? ALL NECESSARY PERMITS FOR DREDGING FOR PORTIONS OF BASS RIVER, SWAN POND RIVER, SESUIT HARBOR AND CHASE GARDEN CREEK ONE
Building Coastal Resiliency at Plymouth Long Beach
 Building Coastal Resiliency at Plymouth Long Beach Department of Marine and Environmental Affairs March 30, 2017 Introducing Green Infrastructure for Coastal Resiliency Plymouth Long Beach & Warren s Cove
New Jersey Coastal Zone Overview. The New Jersey Beach Profile Network (NJBPN) 3 Dimensional Assessments. Quantifying Shoreline Migration
 3 Dimensional Assessments. Quantifying Shoreline Migration") New Jersey Coastal Zone Overview The New Jersey Beach Profile Network (NJBPN) Objectives Profile Locations Data Collection Analyzing NJBPN Data Examples 3 Dimensional Assessments Methodology Examples Quantifying
New Jersey Coastal Zone Overview The New Jersey Beach Profile Network (NJBPN) Objectives Profile Locations Data Collection Analyzing NJBPN Data Examples 3 Dimensional Assessments Methodology Examples Quantifying
UPPER BEACH REPLENISHMENT PROJECT RELATED
 ASSESSMENT OF SAND VOLUME LOSS at the TOWNSHIP of UPPER BEACH REPLENISHMENT PROJECT RELATED to the LANDFALL OF HURRICANE SANDY - PURSUANT TO NJ-DR 4086 This assessment is in response to Hurricane Sandy
Nome Harbor Page 2 of 12
 Nome Harbor Nome Harbor Page 2 of 12 Condition of Improvements 30 December 2015 Nome Harbor, Alaska (CWIS No. 010422, 012270, 072742, 087755) Authorization (1) Rivers and Harbors Act, 8 August 1917 (House
Delaware Chapter Surfrider Foundation - Indian River Inlet Monitoring
 Delaware Chapter Surfrider Foundation - Indian River Inlet Monitoring In 2012, the Delaware Surfrider Foundation Chapter formed the Surf Quality and Access Committee to focus on issues such as surf spot
ST. JOSEPH PENINSULA, GULF COUNTY, FLORIDA Beach Re-Nourishment and Environmental Enhancement Project RECOMMENDATIONS
 ST. JOSEPH PENINSULA, GULF COUNTY, FLORIDA Beach Re-Nourishment and Environmental Enhancement Project RECOMMENDATIONS January 23, 2018 543 Harbor Boulevard, Suite 204 Destin, Florida 32541 850.654.1555
RE: Hurricane Matthew Beach Damage Assessment and Recommendations [CSE 2416]
![RE: Hurricane Matthew Beach Damage Assessment and Recommendations [CSE 2416]](/thumbs/83/87675702.jpg "RE: Hurricane Matthew Beach Damage Assessment and Recommendations [CSE 2416]") October 25, 2016 Iris Hill Town Administrator Town of Edisto Beach 2414 Murray St Edisto Beach SC 29438 RE: Hurricane Matthew Beach Damage Assessment and Recommendations [CSE 2416] Dear Iris, Hurricane
October 25, 2016 Iris Hill Town Administrator Town of Edisto Beach 2414 Murray St Edisto Beach SC 29438 RE: Hurricane Matthew Beach Damage Assessment and Recommendations [CSE 2416] Dear Iris, Hurricane
1-32 NOME HARBOR, ALASKA (CWIS NOS , 87755, 12270, & 10422) Condition of Improvement 30 September 2012
 Condition of Improvement 30 September 2012") NOME HARBOR 1-32 NOME HARBOR, ALASKA (CWIS NOS. 72742, 87755, 12270, & 10422) Condition of Improvement 30 September 2012 AUTHORIZATION: (1) Rivers and Harbors Act, 8 August 1917 (House Doc. 1932, 64th
NOME HARBOR 1-32 NOME HARBOR, ALASKA (CWIS NOS. 72742, 87755, 12270, & 10422) Condition of Improvement 30 September 2012 AUTHORIZATION: (1) Rivers and Harbors Act, 8 August 1917 (House Doc. 1932, 64th
SPECIAL SPRING 2018 STORM REPORT ON THE CONDITION OF THE MUNICIPAL BEACHES FOR THE BOROUGH OF STONE HARBOR, CAPE MAY COUNTY, NEW JERSEY
 SPECIAL SPRING 2018 STORM REPORT ON THE CONDITION OF THE MUNICIPAL BEACHES FOR THE BOROUGH OF STONE HARBOR, CAPE MAY COUNTY, NEW JERSEY Aerial photograph taken April 21, 2018 showing the view up the beach
Ninilchik Harbor Page 2 of 11
 Ninilchik Harbor Ninilchik Harbor Page 2 of 11 Condition of Improvements 31 December 2017 Ninilchik Harbor, Alaska (CWIS No. 012640, 087345) Authorization Rivers and Harbors Act, 3 July 1958 (P.L. 85-500
Beach Nourishment Impact on Beach Safety and Surfing in the North Reach of Brevard County, Florida
 Beach Nourishment Impact on Beach Safety and Surfing in the North Reach of Brevard County, Florida Prepared by John Hearin, Ph.D. Coastal Engineering Vice Chairman Cocoa Beach Chapter Port Canaveral Patrick
Figure79. Location map for the 10 NJBPN profile sites in Atlantic County, NJ 155
 154 Figure79. Location map for the 10 NJBPN profile sites in Atlantic County, NJ 155 ATLANTIC COUNTY SPRING 2009 to FALL 2010 The Atlantic County coastline consists of three barrier islands. Between Little
Atlantic Coast of Long Island, Jones Inlet to East Rockaway Inlet, Long Beach Island, NY Construction Update
 Atlantic Coast of Long Island, Jones Inlet to East Rockaway Inlet, Long Beach Island, NY Construction Update June 2016 US Army Corps of Engineers Project Purpose Three specific damage mechanisms of coastal
Inlet Management Study for Pass-A-Grille and Bunces Pass, Pinellas County, Florida
 Inlet Management Study for Pass-A-Grille and Bunces Pass, Pinellas County, Florida Final Report Submitted By Ping Wang, Ph.D., Jun Cheng Ph.D., Zachary Westfall, and Mathieu Vallee Coastal Research Laboratory
Long Beach Island Holgate Spit Little Egg Inlet Historical Evolution Introduction Longshore Transport Map, Survey and Photo Historic Sequence
 Appendix B Long Beach Island Holgate Spit Little Egg Inlet Historical Evolution Introduction The undeveloped southern end of Long Beach Island (LBI) is referred to as the Holgate spit as it adjoins the
30 DAY PUBLIC NOTICE MAINTENANCE DREDGING OF THE 8-FOOT CHANNEL OF THE FEDERAL NAVIGATION PROJECT IN KENNEBUNK RIVER KENNEBUNK & KENNEBUNKPORT, ME
 fr.iiif.i ~ US Anny Corps of Engineers New England District 696 Virginia Road Concord, MA 01742-2751 Public Notice In Reply Refer to: Mr. Jack Karalius nae-pn-nav@usace.army.mil Programs/Project Management
EVALUATION OF BEACH EROSION UP-DRIFT OF TIDAL INLETS IN SOUTHWEST AND CENTRAL FLORIDA, USA. Mohamed A. Dabees 1 and Brett D.
 EVALUATION OF BEACH EROSION UP-DRIFT OF TIDAL INLETS IN SOUTHWEST AND CENTRAL FLORIDA, USA Mohamed A. Dabees 1 and Brett D. Moore 1 The paper discusses the analysis of up-drift beach erosion near selected
DUNE STABILIZATION AND BEACH EROSION
 DUNE STABILIZATION AND BEACH EROSION CAPE HATTERAS NATIONAL SEASHORE NORTH CAROLINA ROBERT DOLAN PAUL GODFREY U. S. DEPARTMENT OF INTERIOR NATIONAL PARK SERVICE OFFICE OF NATURAL SCIENCE WASHINGTON, D.
1-32 NOME HARBOR, ALASKA (CWIS NOS , 87755, & 10422) Condition of Improvement 30 September 2009
 Condition of Improvement 30 September 2009") NOME HARBOR 1-32 NOME HARBOR, ALASKA (CWIS NOS. 72742, 87755, & 10422) Condition of Improvement 30 September 2009 AUTHORIZATION: (1) Rivers and Harbors Act, 8 August 1917 (House Doc. 1932, 64th Congress,
NOME HARBOR 1-32 NOME HARBOR, ALASKA (CWIS NOS. 72742, 87755, & 10422) Condition of Improvement 30 September 2009 AUTHORIZATION: (1) Rivers and Harbors Act, 8 August 1917 (House Doc. 1932, 64th Congress,
Feasibility Study for Restoration of Titlow Lagoon Fish Passage. South Puget Sound Salmon Enhancement Group
 Feasibility Study for Restoration of Titlow Lagoon Fish Passage South Puget Sound Salmon Enhancement Group January 2010 Feasibility Study for Restoration of Titlow Lagoon Fish Passage Prepared for South
MOREHEAD CITY HARBOR, NC. Dredged Material Management Plan (DMMP)
") MOREHEAD CITY HARBOR, NC Dredged Material Management Plan (DMMP) Public Meeting/Info Session 15 January 2014 US Army Corps of Engineers Morehead City Harbor DMMP Presentation Topics Morehead City Harbor
MOREHEAD CITY HARBOR, NC Dredged Material Management Plan (DMMP) Public Meeting/Info Session 15 January 2014 US Army Corps of Engineers Morehead City Harbor DMMP Presentation Topics Morehead City Harbor
Assateague Island National Seashore North End Restoration Project Timeline
 Assateague Island National Seashore North End Restoration Project Timeline Date Event Some information provided in the Project Introduction document. Detailed events are available in a timeline compiled
Estuarine Shoreline Stabilization
 Estuarine Shoreline Stabilization Property Owner s Guide to Determining the Most Appropriate Stabilization Method Estuarine shorelines are dynamic features that experience continued erosion. Land is lost
For more information or permission to reprint slides, please contact Donna Milligan at 1
 For more information or permission to reprint slides, please contact Donna Milligan at milligan@vims.edu 1 For more information or permission to reprint slides, please contact Donna Milligan at milligan@vims.edu
Beach profile surveys and morphological change, Otago Harbour entrance to Karitane May 2014 to June 2015
 Beach profile surveys and morphological change, Otago Harbour entrance to Karitane May 2014 to June 2015 Prepared for Port Otago Ltd Martin Single September 2015 Shore Processes and Management Ltd Contact
DUXBURY WAVE MODELING STUDY
 DUXBURY WAVE MODELING STUDY 2008 Status Report Duncan M. FitzGerald Peter S. Rosen Boston University Northeaster University Boston, MA 02215 Boston, MA 02115 Submitted to: DUXBURY BEACH RESERVATION November
FINAL ENVIRONMENTAL IMPACT STATEMENT ON BROWARD COUNTY SHORE PROTECTION PROJECT SEGMENTS II AND III BROWARD COUNTY, FLORIDA
 FINAL ENVIRONMENTAL IMPACT STATEMENT ON BROWARD COUNTY SHORE PROTECTION PROJECT SEGMENTS II AND III BROWARD COUNTY, FLORIDA 1. PROJECT PURPOSE AND NEED 1.1. PROJECT AUTHORITY. 1.1.1. INITIAL AUTHORIZATION.
Volume and Shoreline Changes along Pinellas County Beaches during Tropical Storm Debby
 Volume and Shoreline Changes along Pinellas County Beaches during Tropical Storm Debby Ping Wang and Tiffany M. Roberts Coastal Research Laboratory University of South Florida July 24, 2012 Introduction
Figure 4, Photo mosaic taken on February 14 about an hour before sunset near low tide.
 The Impact on Great South Bay of the Breach at Old Inlet Charles N. Flagg and Roger Flood School of Marine and Atmospheric Sciences, Stony Brook University Since the last report was issued on January 31
Public Notice U.S. Army Corps In Reply to Application Number CENAB-OP-RMS (NATIONAL HARBOR (FORMERLY PORT Baltimore District AMERICA])
![Public Notice U.S. Army Corps In Reply to Application Number CENAB-OP-RMS (NATIONAL HARBOR (FORMERLY PORT Baltimore District AMERICA])](/thumbs/89/100795623.jpg "Public Notice U.S. Army Corps In Reply to Application Number CENAB-OP-RMS (NATIONAL HARBOR (FORMERLY PORT Baltimore District AMERICA])") Public Notice U.S. Army Corps In Reply to Application Number of Engineers CENAB-OP-RMS (NATIONAL HARBOR (FORMERLY PORT Baltimore District AMERICA]) 88-01361 PN 14-05 Comment Period: January 16, 2014 to
Public Notice U.S. Army Corps In Reply to Application Number of Engineers CENAB-OP-RMS (NATIONAL HARBOR (FORMERLY PORT Baltimore District AMERICA]) 88-01361 PN 14-05 Comment Period: January 16, 2014 to
STATUS REPORT FOR THE SUBMERGED REEF BALL TM ARTIFICIAL REEF SUBMERGED BREAKWATER BEACH STABILIZATION PROJECT FOR THE GRAND CAYMAN MARRIOTT HOTEL
 August 23 STATUS REPORT FOR THE SUBMERGED REEF BALL TM ARTIFICIAL REEF SUBMERGED BREAKWATER BEACH STABILIZATION PROJECT FOR THE GRAND CAYMAN MARRIOTT HOTEL performed by Lee E. Harris, Ph.D., P.E. Consulting
Blakely Island, N Thatcher Bay. Restoration Recommendation: Rank Score (total score)
") Soft Shore Protection/Structure Removal Blueprint for San Juan County Forage Fish Beaches Appendix 2: Recommendations for sites scoring below the top ten, sorted by island (east to west) Blakely Island,
Soft Shore Protection/Structure Removal Blueprint for San Juan County Forage Fish Beaches Appendix 2: Recommendations for sites scoring below the top ten, sorted by island (east to west) Blakely Island,
Shoreline Studies Program, Department of Physical Sciences, VIMS
 Living Shoreline Training Class 2017 1 Demonstration sites discussed in this talk. 2 A shoreline management plan for the entire creek made conceptual shoreline management recommendations along every stretch
VIMS CCRM Coastal Management Decision Tools. Decision Tree for Undefended Shorelines and Those with Failed Structures
 VIMS CCRM Coastal Management Decision Tools Decision Tree for Undefended Shorelines and Those with Failed Structures Center for Coastal Resources Management Virginia Institute of Marine Science Gloucester
A REVIEW OF THE CONDITION OF THE MUNICIPAL BEACHES AS A RESULT OF HURRICANE SANDY IN THE BOROUGH OF STONE HARBOR, CAPE MAY COUNTY, NEW JERSEY
 A REVIEW OF THE CONDITION OF THE MUNICIPAL BEACHES AS A RESULT OF HURRICANE SANDY IN THE BOROUGH OF STONE HARBOR, CAPE MAY COUNTY, NEW JERSEY View along the dune scarp from 103 rd Street on October 31,
CLAM PASS RESTORATION AND MANAGEMENT PLAN BATHYMETRIC MONITORING REPORT NO. 7 Including Interior Bay Dredge Cuts and Tidal Data
 CLAM PASS RESTORATION AND MANAGEMENT PLAN BATHYMETRIC MONITORING REPORT NO. 7 Including Interior Bay Dredge Cuts and Tidal Data Submitted to: Florida Department of Environmental Protection DEP File No.
GONE! Coastal Erosion Happens During Storms! Why Worry About Coastal Setbacks? Goals for Today
 RI Regulatory Setbacks & Buffers: Coastal Zone Management Issues New England Onsite Wastewater Training Program @ URI OWT 155 November 21, 2013 Goals for Today Understand the impacts of storms, coastal
Overview. Beach Features. Coastal Regions. Other Beach Profile Features. CHAPTER 10 The Coast: Beaches and Shoreline Processes.
 Overview CHAPTER 10 The Coast: Beaches and Shoreline Processes Coastal regions constantly change. The beach is a dominant coastal feature. Wave activity continually modifies the beach and coastal areas.
Figure 1. Schematic illustration of the major environments on Mustang Island.
 STOP #1: PACKERY CHANNEL BEACH TO BAY We will start this field guide near the north jetty of Packery Channel and hike across the island to Corpus Christi Bay (fig. 1). The island emerges from the Gulf
SACO RIVER AND CAMP ELLIS BEACH SACO, MAINE SECTION 111 SHORE DAMAGE MITIGATION PROJECT APPENDIX F ECONOMIC ASSESSMENT
 SACO RIVER AND CAMP ELLIS BEACH SACO, MAINE SECTION 111 SHORE DAMAGE MITIGATION PROJECT APPENDIX F ECONOMIC ASSESSMENT Department of the Army New England District, Corps of Engineers 696 Virginia Road
Sediment Management Plan Rehoboth Bay
 Sediment Management Plan Rehoboth Bay STAC Meeting November 16, 2007 Goals of the Study Improve planning for future dredging needs Reduce the dependency on dredging Study Tasks Environmental data Historical
HURRICANE SANDY LIMITED REEVALUATION REPORT UNION BEACH, NEW JERSEY DRAFT ENGINEERING APPENDIX SUB APPENDIX D SBEACH MODELING
 HURRICANE SANDY LIMITED REEVALUATION REPORT UNION BEACH, NEW JERSEY DRAFT ENGINEERING APPENDIX SUB APPENDIX D SBEACH MODELING Rev. 18 Feb 2015 1 SBEACH Modeling 1.0 Introduction Following the methodology
ALTERNATIVES FOR COASTAL STORM DAMAGE MITIGATION
 ALTERNATIVES FOR COASTAL STORM DAMAGE MITIGATION Dave Basco Old Dominion University, Norfolk, Virginia, USA National Park Service Photo STRUCTURAL (changes to natural, physical system) hardening (seawalls,
CLAM PASS ANNUAL RESTORATION & MANAGEMENT PLAN TIDAL ANALYSIS ELEMENT REPORT NO. 13
 CLAM PASS ANNUAL RESTORATION & MANAGEMENT PLAN TIDAL ANALYSIS ELEMENT REPORT NO. 13 Submitted to: Pelican Bay Services Division Prepared by: Humiston & Moore Engineers H&M File No. 13-078 November 2012
RI Regulatory Setbacks & Buffers: Coastal Management Issues
 RI Regulatory Setbacks & Buffers: Coastal Management Issues New England Onsite Wastewater Training Program @ URI OWT 155 - November 29, 2012 James Boyd - Coastal Policy Analyst Photo: October 30, 2012
Impacts of breakwaters and training walls
 Across the eastern seaboard of Australia, breakwaters and training walls have instigated fundamental perturbations to coastal and estuary processes. This has induced long-term changes to foreshore alignments,
Warm-up # 7 A day 5/17 - B day 5/18 UPDATE YOUR TABLE OF CONTENTS
 Warm-up # 7 A day 5/17 - B day 5/18 UPDATE YOUR TABLE OF CONTENTS Question: List all examples of surface water on Earth. Answer: Rivers and streams, lakes and reservoirs, (ponds) wetlands, estuaries and
North Shore of Long Island, Feasibility Study
 North Shore of Long Island, Asharoken New York Asharoken, Feasibility Study Asharoken, NY Public Meeting June 30, 2015 US Army Corps of Engineers US Army Corps of Engineers New York BUILDING STRONG BUILDING
Trends in Shoreline Change and Hazard Impacts: Hot Spots and Management Challenges. Greg Berman CAPE COASTAL CONFERENCE.
 CAPE COASTAL CONFERENCE Linking Science with Local Solu1ons and Decision- Making Trends in Shoreline Change and Hazard Impacts: Hot Spots and Management Challenges Presented By Greg Berman (WHOI Sea Grant
APPENDIX M DREDGED MATERIAL MANAGEMENT PLAN (DMMP) FINAL INTEGRATED FEASIBILITY REPORT AND ENVIRONMENTAL ASSESSMENT
 FINAL INTEGRATED FEASIBILITY REPORT AND ENVIRONMENTAL ASSESSMENT") APPENDIX M DREDGED MATERIAL MANAGEMENT PLAN (DMMP) Brazos Island Harbor, Texas Channel Improvement Study FINAL INTEGRATED FEASIBILITY REPORT AND ENVIRONMENTAL ASSESSMENT This page is intentionally left
APPENDIX M DREDGED MATERIAL MANAGEMENT PLAN (DMMP) Brazos Island Harbor, Texas Channel Improvement Study FINAL INTEGRATED FEASIBILITY REPORT AND ENVIRONMENTAL ASSESSMENT This page is intentionally left
Follets Island Nearshore Beach Nourishment Project
 Coast & Harbor Engineering A division of Hatch Mott MacDonald Follets Island Nearshore Beach Nourishment Project Arpit Agarwal, P.E. April 1, 2016 Project Site!"#$% &'(% &)*+% )#,'-+% Shoreline Erosion
ALTERNATIVES FOR COASTAL STORM DAMAGE MITIGATION AND FUNCTIONAL DESIGN OF COASTAL STRUCTURES
 The University of the West Indies Organization of American States PROFESSIONAL DEVELOPMENT PROGRAMME: COASTAL INFRASTRUCTURE DESIGN, CONSTRUCTION AND MAINTENANCE A COURSE IN COASTAL DEFENSE SYSTEMS I CHAPTER
Grays Harbor O&M and Deepening Dredging
 Grays Harbor O&M and Deepening Dredging Elizabeth Chien Project Manager Seattle District 28 January 2016 US Army Corps of Engineers Grays Harbor Navigation Channel Inner Harbor O&M Dredging Summer 2015:
Water Resources Report RKLD Annual Meeting July 30, 2016
 Water Resources Report RKLD Annual Meeting 2016 July 30, 2016 Topics Hydrology Report Indianford Dam trash rack cleanout performance Experimental Project update Review of PAS project Twin floods- 1 to
Grays Harbor Federal Project
 Grays Harbor Federal Project Elizabeth Chien Coastal Navigation Program Manager Seattle District 27 October 2016 US Army Corps of Engineers Grays Harbor Navigation Channel Inner Harbor Dredging Summer
FINAL REPORT FOR 2013 ON THE CONDITION OF THE MUNICIPAL OCEANFRONT BEACHES THE BOROUGH OF AVALON, CAPE MAY COUNTY, NEW JERSEY
 FINAL REPORT FOR 2013 ON THE CONDITION OF THE MUNICIPAL OCEANFRONT BEACHES THE BOROUGH OF AVALON, CAPE MAY COUNTY, NEW JERSEY View from 12 th Street to the south taken February 28, 2013, following completion
Habitat Fact Sheets. Rocky habitats are dominated by seaweeds and often mussels, which rely on the rocks for attachment.
 Habitat Fact Sheets Habitats in the Gulf of Maine serve many important roles for the environment and for humans as well. These include: cycling nutrients, filtering pollution, trapping sediments, storing
CROSS-SHORE SEDIMENT PROCESSES
 The University of the West Indies Organization of American States PROFESSIONAL DEVELOPMENT PROGRAMME: COASTAL INFRASTRUCTURE DESIGN, CONSTRUCTION AND MAINTENANCE A COURSE IN COASTAL DEFENSE SYSTEMS I CHAPTER
Juneau Douglas Harbor
 Juneau Douglas Harbor Douglas Harbor Page 2 of 8 Condition of Improvements 31 December 2015 Douglas Harbor, Alaska (CWIS No. 072789, 180942) Authorization Rivers and Harbors Act, 3 July 1958 (House Doc.
23- Year Sand Volume Changes at Site 132, 15th Street, Brigantine
 149 Figure75. Location map for the 9 NJBPN profile sites in Atlantic County, NJ ATLANTIC COUNTY SPRING 2008 to FALL 2009 150 The Atlantic County oceanfront shoreline consists of three barrier islands.
CORPS FACTS. Harbor Dredging U.S. ARMY CORPS OF ENGINEERS BUILDING STRONG
 CORPS FACTS Harbor Dredging U.S. ARMY CORPS OF ENGINEERS BUILDING STRONG Disaster Response Sedimentation in the channel is caused by the normal cycle of silt movement, erosion from high water or heavy
Town of Duck, North Carolina
 Tracking No. 00.00.2010 Erosion Mitigation And Shoreline Management Feasibility Study Town of Duck, North Carolina Coastal Planning & Engineering of North Carolina August 15, 2012 Tom Jarrett Robert Neal
County of Santa Barbara Permit Option Analysis Goleta Beach JULY 13, 2017
 County of Santa Barbara Permit Option Analysis Goleta Beach JULY 13, 2017 Introduction 2 Goleta Beach Park welcomes 1.5 million visitors annually Amenities include: Picnic Areas and Group Areas w/bbqs
Lecture Outlines PowerPoint. Chapter 15 Earth Science, 12e Tarbuck/Lutgens
 Lecture Outlines PowerPoint Chapter 15 Earth Science, 12e Tarbuck/Lutgens 2009 Pearson Prentice Hall This work is protected by United States copyright laws and is provided solely for the use of instructors
2014 ANNUAL REPORT - TO THE CITY OF NORTH WILDWOOD ON THE CONDITION OF THE CITY BEACHES
 2014 ANNUAL REPORT - TO THE CITY OF NORTH WILDWOOD ON THE CONDITION OF THE CITY BEACHES View on September 25, 2014 looking northwest into Hereford Inlet. Considerable southerly expansion of the tip of
ATLANTIC COUNTY 2006 to 2008
 ATLANTIC COUNTY 2006 to 2008 The Atlantic County oceanfront shoreline consists of three barrier islands where the northern one, Little Beach Island and a third of the second, Brigantine Island, are undeveloped
Dauphin Island East End Beach and Barrier Island Restoration Project. Beau Buhring South Coast Engineers
 Dauphin Island East End Beach and Barrier Island Restoration Project Beau Buhring South Coast Engineers Funding Funded with qualified outer continental shelf oil and gas revenues by the Coastal Impact
New Jersey Beach Profile Network Atlantic County Profile Site Locations
 215 RICHARD STOCKTON COLLEGE OF NEW JERSEY New Jersey Beach Profile Network Atlantic County Profile Site Locations COASTAL RESEARCH CENTER Figure 128 There are nine NJBPN survey sites on the Atlantic County
HARBOUR SEDIMENTATION - COMPARISON WITH MODEL
 HARBOUR SEDIMENTATION - COMPARISON WITH MODEL ABSTRACT A mobile-bed model study of Pointe Sapin Harbour, in the Gulf of St. Lawrence, resulted in construction of a detached breakwater and sand trap to
Shorelines Earth - Chapter 20 Stan Hatfield Southwestern Illinois College
 Shorelines Earth - Chapter 20 Stan Hatfield Southwestern Illinois College The Shoreline A Dynamic Interface The shoreline is a dynamic interface (common boundary) among air, land, and the ocean. The shoreline
X.B WETLANDS ROGUE RIVER ESTUARY
 X.B WETLANDS ROGUE RIVER ESTUARY The Rogue River has a drainage area of 5,100 square miles, yet the estuary of the Rogue River is one of the smallest in Oregon, measuring approximately 1,880 acres during
Reading Material. Inshore oceanography, Anikouchine and Sternberg The World Ocean, Prentice-Hall
 Reading Material Inshore oceanography, Anikouchine and Sternberg The World Ocean, Prentice-Hall BEACH PROCESSES AND COASTAL ENVIRONMENTS COASTAL FEATURES Cross section Map view Terminology for Coastal
ATLANTIC COAST OF LONG ISLAND, JONES INLET TO EAST ROCKAWAY INLET, LONG BEACH ISLAND, NY. Contract #2 Construction Scope. April 18th-19th 2018
 ATLANTIC COAST OF LONG ISLAND, JONES INLET TO EAST ROCKAWAY INLET, LONG BEACH ISLAND, NY Contract #2 Construction Scope April 18th-19th 2018 New York District PLAN COMPONENTS Length of Beachfill 35,000
Chapter 10 Lecture Outline. The Restless Oceans
 Chapter 10 Lecture Outline The Restless Oceans Focus Question 10.1 How does the Coriolis effect influence ocean currents? The Ocean s Surface Circulation Ocean currents Masses of water that flow from one
APPENDIX C. Fluvial and Tidal Hydraulics Report
 APPENDIX C Fluvial and Tidal Hydraulics Report BUENA VISTA LAGOON ENHANCEMENT PROJECT FLUVIAL AND TIDAL HYDRAULICS ANALYSES Prepared for: SANDAG 401 B Street, Suite 800 San Diego, California 92101 Contact:
The Sand Beaches of New Hampshire and Maine
 The Sand Beaches of New Hampshire and Maine Beach Preservation and Erosion Control Photographs provided by Joe Kelly and Steve Adams Cover photo: Reid State Park, ME Introduction The sand beaches of New
2018 Beach Preservation Project Information
 QUICK FACTS Beach Renourishment to begin late April 2018 o U.S. Army Corps of Engineers project o Project Area: 8 th St. E. to end of E. Ashley Ave. o Project Length: 2 miles o Cost: $10,900,000 o Funding:
Beach Management Plan for Town of Sandwich Beaches
 Beach Management Plan for Town of Sandwich Beaches Prepared For: Town of Sandwich 16 Jan Sebastian Drive Sandwich, MA 02563 Prepared By: Woods Hole Group, Inc. 81 Technology Park Drive East Falmouth, MA
Puget Sound Nearshore Ecosystem Restoration Project Restore America s Estuaries Conference 2012 Tampa, FL
 Restore America s Estuaries Conference 2012 Tampa, FL presented by: Theresa Mitchell, WA Dept. of Fish & Wildlife Nearshore General Investigation Change Analysis: Comparison of historical and current
Cat Island Chain Restoration
 Cat Island Chain Restoration 1820s Fox River Military Road Map to Fort Howard 1845 Chart of Green Bay & Fox River Cat Island Chain - 1938 Cat Island Brown County Aerial Photography, 1938 Historic Western
TITLE: North Carolina s Changing Shorelines. KEYWORDS: erosion - shorelines - mapping - sustainability
 UNC Coastal Studies Institute Teacher Resources 1 TITLE: North Carolina s Changing Shorelines KEYWORDS: erosion - shorelines - mapping - sustainability Changing shorelines impact coastal infrastructure.
BALD HEAD ISLAND, NC SAND SHARING SYSTEM OVERVIEW AND ASSESSMENT. Erik J. Olsen, P.E. olsen associates, inc.
 BALD HEAD ISLAND, NC SAND SHARING SYSTEM OVERVIEW AND ASSESSMENT Erik J. Olsen, P.E. Olsen Associates, Inc. BACKGROUND Both the Village of Bald Head Island (VBHI) and the Bald Head Island Limited, LLC.
Sediment Transport Analysis Village of Asharoken, New York
 Sediment Transport Analysis Village of Asharoken, New York NORTH SHORE OF LONG ISLAND, NEW YORK COMBINED EROSION CONTROL AND STORM DAMAGE PROTECTION FEASIBILITY STUDY FINAL REPORT August 2004 Cell 0 Asharoken
Nicholas Brown. 31 Bennett Rd Wolfeboro NH Application submitted
 Nicholas Brown 31 Bennett Rd Wolfeboro NH 03894 603-856-5454 Nick4634@gmail.com Application submitted 8-12-2017 Description of proposed project A. General Methodology The site located approximately 600
Absecon Island Shore Protection The planning behind the project
 Absecon Island Shore Protection The planning behind the project Most residents of Atlantic City, Ventnor, Margate and Longport are now aware of upcoming plans to protect their common coastline with a beachfill
Evaluation of June 9, 2014 Federal Emergency Management Agency Flood Insurance Study for Town of Weymouth, Norfolk, Co, MA
 Evaluation of June 9, 2014 Federal Emergency Management Agency Flood Insurance Study for Town of Weymouth, Norfolk, Co, MA Prepared For: Woodard & Curran 95 Cedar Street, Suite 100 Providence, RI 02903
Condition of Improvements 30 December 2014 Wrangell Harbors, Alaska (CWIS No , )
") Wrangell Harbors Condition of Improvements 30 December 2014 Wrangell Harbors, Alaska (CWIS No. 010435, 021500) Authorization (1) Rivers and Harbors Act, 22 September 1922 (House Doc. 161, 67th Congress,
Wrangell Harbors Condition of Improvements 30 December 2014 Wrangell Harbors, Alaska (CWIS No. 010435, 021500) Authorization (1) Rivers and Harbors Act, 22 September 1922 (House Doc. 161, 67th Congress,
Figure 106. Locations of the 28 NJBPN profile stations in Ocean County, NJ.
 130 Figure 106. Locations of the 28 NJBPN profile stations in Ocean County, NJ. 131 2016-2017 Beach Fills in Ocean County: The federal/state/local storm damage reduction project (beachfill) between Manasquan
Beach Scraping at Popham Beach State Park. Phippsburg, Maine
 Maine Geologic Facts and Localities February, 2012 Phippsburg, Maine 43 o 44 2.36 N, 69 o 47 39.29 W Text by Stephen M. Dickson, Department of Agriculture, Conservation & Forestry 1 Photo by J. Picher,
Impact of Hurricane Matthew on the Atlantic Coast of Florida
 Impact of Hurricane Matthew on the Atlantic Coast of Florida A coastal engineer was driving across country and his jeep broke down in front of a monastery. It was late in the day and the monks invited
Figure 262. Location map for the 10 NJBPN profile sites in Atlantic County, NJ 279
 278 Figure 262. Location map for the 10 NJBPN profile sites in Atlantic County, NJ 279 ATLANTIC COUNTY SUMMARY The Atlantic County coastline consists of three barrier islands. The island of Little Beach
Dune Monitoring Data Update Summary: 2013
 Dune Monitoring Data Update Summary: 13 Shoreline Studies Program Virginia Institute of Marine Science College of William & Mary Gloucester Point, Virginia September 13 Dune Monitoring Data Update Summary:
COASTAL ENVIRONMENTS. 454 lecture 12
 COASTAL ENVIRONMENTS Repeated movement of sediment & water constructs a beach profile reflecting the balance between average daily or seasonal wave forces and resistance of landmass to wave action Coasts
Texas passes, longshore transport, hurricanes, beach erosion and sea level
 Texas passes, longshore transport, hurricanes, beach erosion and sea level Richard L. Watson, Ph.D. (361) 749-4152 Field work can be strange! 120,000 years of sea level Years each zone exposed above S/L
Nearshore Dredged Material Placement Pilot Study at Noyo Harbor, CA
 1 Nearshore Dredged Material Placement Pilot Study at Noyo Harbor, CA Noyo Cove N 2011 National Conference on Beach Preservation Technology 9-11, February 2011 Lihwa Lin, Honghai Li, Mitchell Brown US
Figure 38. Locations of the 28 NJBPN profile stations in Ocean County, NJ.
 55 Figure 38. Locations of the 28 NJBPN profile stations in Ocean County, NJ. 56 Individual Site Descriptions: Northern Ocean County recovered its beaches approaching pre-hurricane Sandy elevation or width,
Herring River Restoration Project Chronology of Key Events
 August 2005 Cape Cod National Seashore (CCNS) and Town of Wellfleet Board of Selectmen entered into an MOU (MOU I) to review and summarize the scientific and technical information on the Herring River
FINAL REPORT FOR 2013 ON THE CONDITION OF THE MUNICIPAL BEACHES IN THE TOWNSHIP OF UPPER, CAPE MAY COUNTY, NEW JERSEY
 FINAL REPORT FOR 2013 ON THE CONDITION OF THE MUNICIPAL BEACHES IN THE TOWNSHIP OF UPPER, CAPE MAY COUNTY, NEW JERSEY Aerial photograph at Corson s Inlet showing conditions on December 1, 2013 of the north
HARBOR INFRASTRUCTURE INVENTORIES Marquette Harbor, Michigan
 HARBOR INFRASTRUCTURE INVENTORIES Marquette Harbor, Michigan Harbor Location: Marquette Harbor is located in Marquette Bay on the south shore of Lake Superior, 160 miles west of Sault Ste. Marie, MI and