University of Michigan & Urban Land Institute Real Estate Forum. Mary Beth Graebert Michigan State University
|
|
|
- Myra Carroll
- 5 years ago
- Views:
Transcription

1 University of Michigan & Urban Land Institute Real Estate Forum Mary Beth Graebert Michigan State University November 20, 2013
2 Michigan State University Land Policy Institute Strong focus on research and outreach on analysis of land policy options in many contemporary issue areas. The ways in which we use our land and build upon it impact our quality of life, today and tomorrow. Focus Areas: Placemaking & Regional Prosperity, Land & Planning, Land-Based Resources, and Energy. Affiliated with the MSU School of Planning, Design and Construction. Please see our website for more information:
3 Presentation Outline Changing Demand for the Built Environment National Placemaking Survey Midwest U.S. Home and Neighborhood Survey Midwest U.S. Property Price Assessment Conclusions
4 Summary U.S. population demographics are changing with respect to race, age, income, etc. Growing segments of the population (e.g., young talent) are looking for dense, walkable, mixed-use neighborhoods with access to jobs, green space, arts and culture, entertainment, housing and transportation options, and affordable living. Many Boomers are looking for these features as well. Michigan cities currently are not meeting changing demand for housing and neighborhood types. Placemaking efforts are needed to meet market demand and to make cities and downtowns more attractive places with a high quality of life for all residents.
5 Changing Demand for the Built Environment
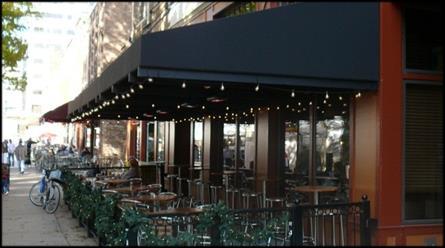
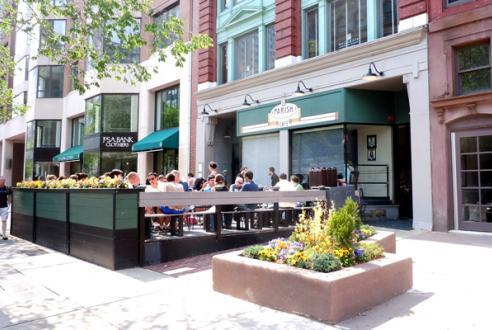
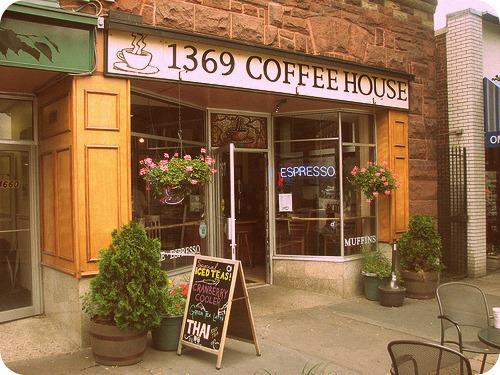
6 Walkable Urban Places Leinberger (2012) states that market demand for the built environment is moving away from the drivable sub-urban approach to walkable urban development. There is pent-up demand for walkable urban development, which is demonstrated by rental and sales price premiums per-square-foot in these places. In Washington D.C., a model for any U.S. city that wants to compete in the global economy, rental apartment developers have started to aggressively pursue walkable urban locations.
7 Community Preference Survey A National Association of Realtors survey (2013) found that nearly 60% of survey respondents prefer to live in a neighborhood with a mix of uses in easy walking distance. Respondents identified their ideal community as a suburban neighborhood with a mix of houses, shops and businesses, not just houses. A majority of respondents would give up a bigger lot for a shorter commute and living within walking distance of schools, stores and restaurants.
8 Soul of the Community The Soul of the Community Survey, conducted by the Knight Foundation and Gallup (2010), found three main drivers of community attachment: social offerings, openness/welcomeness and aesthetics. These factors ranked higher than basic services (community infrastructure), local economy, safety, leadership and education systems. Forming an emotional connection with the community requires the right form and sociability.

9 National Placemaking Survey
10 Study Purpose The purpose of this LPI study is to determine: How do citizens view placemaking, both in terms of what value it has for their communities and what types of place amenities they like to have within their neighborhoods?
11 Placemaking Defined The targeted improvement of a place, within a neighborhood or community, that uniquely creates a functional space with a variety of uses, that is appealing to a wide range of people and that has an identifiable character, or sense of place.
12 Views on Placemaking Question Increase economic activity. Improve opportunities for jobs. Improve the quality of life. Positively affect home prices. Enhance the sense of community belonging. Attract new people to our community. Strongly Agree Somewhat Agree Neither Agree Nor Disagree Somewhat Disagree Strongly Disagree 32% 39% 18% 5% 3% 4% 33% 36% 19% 6% 3% 3% 41% 35% 16% 4% 2% 3% 33% 36% 21% 4% 2% 3% 37% 37% 18% 4% 2% 3% 35% 37% 19% 4% 2% 3% Unsure Between 69%-76% of respondents agree that placemaking has positive economic impacts; around 20% responded neutrally on this point, while only a small percentage (around 3%) appeared to be unsure.

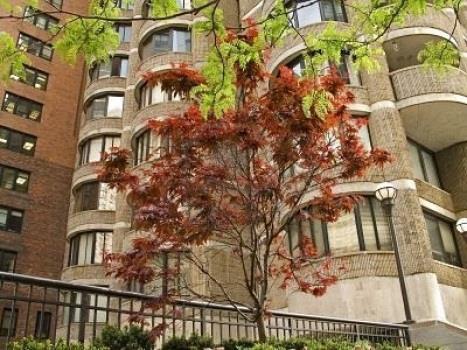
13 Respondents by Transect: Where Do You Currently Live? Transect Number Percent T2: Rural % T3: Suburban 1, % T4: General Urban 1, % T5: Urban Center/Small Town % T6: Urban Core 176 5% } 55% Sub/Rural }45% Urban
14 What are some of the places that people want in their neighborhoods (within walking distance)?


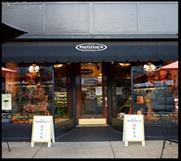
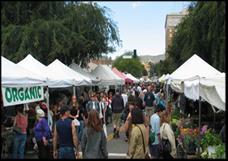
15 Grocery Shopping Big Box Store Neighborhood Grocery Convenience Store Specialty Market Farmers Market


16 What Type of Grocery Shopping? 80% 70% 60% 50% 40% Yes No 30% 20% 10% 0% Big Box Store Neighborhood Grocery Store Convenience Store Specialty Market Farmers Market


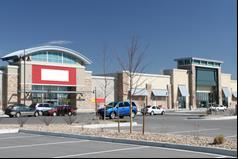
17 Retail Shopping Interior Mall Strip Mall Outlet Mall Lifestyle Center Local Merchants

18 What Type of Retail Shopping? 70% 60% 50% 40% 30% Yes No 20% 10% 0% Interior Mall Strip Mall/Plaza Outlet Mall Lifestyle Center Independent Local Merchants
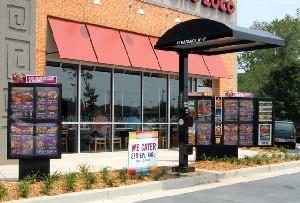
19 Restaurants Fast Food Drive Thru Suburban Sit-Down Mall Restaurant Coffee Shop Sandwich Shop Downtown Sit-Down

20 What Type of Restaurants? 70% 60% 50% 40% 30% Yes No 20% 10% 0% Fast Food Restaurant with Drive Thru Suburban Sitdown Restaurant Sit-down Restaurant in a Strip Mall/Plaza/ Mall Coffee Shop Neighborhood Sandwich Shop Downtown Sitdown Restaurant
21 Beverage Establishment Isolated Bar Mall Bar Casual Neighborhood Bar Downtown Upscale Bar Downtown Nightclub

22 What Type of Beverage Establishment? 60% 50% 40% 30% Yes No 20% 10% 0% Bar in Isolated Building Bar in Strip Mall/Plaza/Mall Downtown or Neighborhood Casual Bar Downtown Upscale Bar Downtown Nightclub with Live Music

23 Park Suburban Specific-Use Suburban Multi-Use Urban Specific-Use Urban Multi-Use Urban Pocket Park 23


24 What Type of Park? 80% 70% 60% 50% 40% Yes No 30% 20% 10% 0% Suburban Park with Specific Use Suburban Park with Multiple Uses Urban Park with Specific Use Urban Park with Multiple Uses Urban Pocket Park
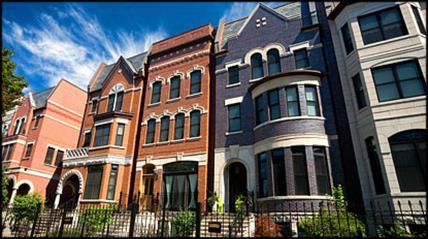
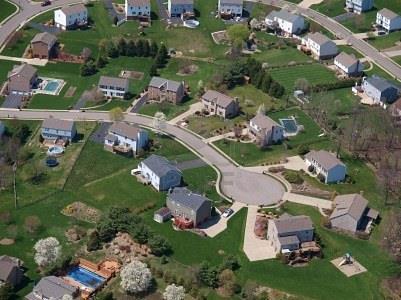
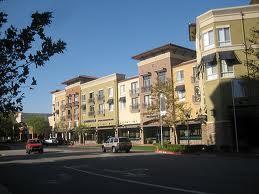
25 Neighborhood Type Rural Suburban Large Lot Small-Medium Lot Mixed-Use Building Downtown Townhomes High Rise 25

26 What Type of Neighborhood? 70% 60% 50% 40% 30% Yes No 20% 10% 0% Rural Area with Open Space Suburban Large Lots Small- to Medium-Sized Lots Downtown Townhomes Mixed Use Building High Rise Building


27 Arts and Culture Library Movie Theatre Performing Arts Museum Art Gallery Art Fair

28 Do You Want Arts and Culture? 80% 70% 60% 50% 40% 30% 20% Yes No 10% 0%
29 Urban Transect Differences People in urban transects (T4, T5 and T6) are slightly less likely to indicate that they want rural areas with open space or large lot suburban neighborhoods, and slightly more likely to want smaller lots, townhomes, mixed use and high rise buildings. The closer to the core (T6), the more likely they are to select denser options. Urban transect respondents are also slightly more likely to want bars, urban parks, and arts and culture amenities.
30 Demographic Differences Survey confirmed that non-whites, young people and low-income families are more likely to live in urban areas. Younger age groups were more likely to say yes to bars and arts and culture venues than their older counterparts. Low-income respondents were more likely to want arts and culture venues in their neighborhood than wealthier respondents. They were also more likely to choose libraries and movie cinemas over museums and art galleries.
31 Neighborhood and Placemaking Correlations Of the people who said they felt that their neighborhood is a better place to live now than five years ago, a large majority of them agreed that: Their neighborhood is visually appealing and ethnically diverse; Their neighborhood has a mix of residential, retail and commercial uses, including many places to go (for working, eating, shopping, drinking, entertainment, recreation, etc.); and Property values in their neighborhood had remained stable, despite the economic recession.
32 Community and Placemaking Correlations Of the people who said they felt that their community is a better place to live now than five years ago, a large majority agreed that: They can do most of their grocery shopping at stores in their local community; that there are bike lanes or paths/trails in their local community; There are many opportunities for arts and cultural experiences within their local community; and Public transportation/transit in their community is reliable and convenient.
33 Changing Demand? A strong majority of respondents agreed that there is a positive relationship between economic well-being and placemaking. However, answers to questions about incorporating placemaking (particularly walkable amenities and mixed use) into their neighborhoods received more ambivalent responses. About 67% of respondents selected transects T2 and T3 (housing only), while only 33% selected zones T4-T6 (mix of uses). This could be a result of survey bias, and/or it could illustrate the struggle that people continue to have about embracing density.
34 Midwest Home and Neighborhood Survey

35 Study Cities

36 What Factors Influence Home Purchase Decisions? #4 Walkability #1 Safety #3 Affordability #2 Commute Time
37 Home and Neighborhood Attributes With respect to housing structures, many respondents indicated that their house has a garage (88%), one or more driveway parking spaces (92%) and 24-hour on-street parking (65%), suggesting that these neighborhoods cater to cars. Seventy-six percent (76%) of households indicated that they have made energy efficiency upgrades, including installing Energy Star appliances, insulation and new windows. Federal and state tax credits, as well as rising energy prices, appear to have been effective incentives for retrofitting. In terms of neighborhood amenities, a majority of homeowners and renters rated the quality of the closest grocery store, park, restaurant and gas station/convenience store at a high or very high level.


38 Walk Time to Nearby Amenities Within 10 Minute Walk 90% 80% 70% 60% 50% 40% 30% 20% 10% 0%

39 How Far Are People Willing to Walk?
40 Walking Preferences In terms of walking preferences, 59% of respondents indicated that they walk often or all of the time. Among those surveyed, the middle to older age brackets (age 40 to 64) appear slightly more likely to walk often. Older respondents (age 50 and older) were also slightly more willing to walk farther distances than their younger counterparts. Younger people (age 18 to 34, in particular) prefer to walk to destinations that are less than 20 minutes away.
41 Aesthetically-Pleasing and Safe Neighborhood? How would you rate the overall look and feel of a walk in your neighborhood? 1: : Not Practical/ Very Low Very High Don't Walk 2% 4% 16% 38% 40% 0% How safe do you feel in this neighborhood? Extremely Very Safe Moderately Safe Slightly Safe Not at All Safe Safe 23% 52% 21% 3% 1%
42 Walkability and Safety Ninety-three percent of people who rated the look and feel of a walk in their neighborhood as very high quality also felt that the neighborhood was very to extremely safe. Eighty-four percent of the people who rated the quality of their nearest park as 5, or very high, said that they feel very to extremely safe in their neighborhood. Sixty-eight percent of people who responded that they feel extremely safe in their neighborhood said that they walk very often or all of the time. It also appears that a perception of safety results in a willingness to walk farther.
43 Walkability, Health and Happiness Seventy-four percent of people who said that they are extremely healthy indicated that they walk very often or all of the time. Extremely healthy people indicated that ability to walk/bike to many nearby places and access to fresh and healthy foods had a strong influence on their home purchase decision. Seventy percent of extremely happy people said that they walk often or all of the time. A majority of extremely happy people said that sense of community had a strong influence on their home buying decision as well.
44 Conclusions
45 Conclusions Certain population segments, like non-whites, lowincome families and young creative class individuals, are more likely to live in urban environments, where there is, ideally, greater connectivity, mixed use and accessibility. To attract and retain these segments of the population, we need to improve their quality of life in urban environments, especially. Placemaking can enhance walkability, transit access, connectivity, arts and culture, recreation, entertainment, services, etc.
46 Conclusions (continued) Places in the Midwest U.S., particularly Michigan cities, are still more auto-oriented than people-oriented, but older Midwesterners will walk more an further than younger ones, while younger ones require more density and activity closer together than older ones. Many people, particularly those who currently live in rural and suburban areas, are not yet ready to give up their cars and live in denser, busier, more vibrant neighborhoods. Despite an understanding that placemaking improves economic well-being, concerns about how it might encourage crime, noise and higher expenses still exist and should be addressed. People would like to be able to walk to nearby destinations, but the quality and safety of that walk is important. Walking has health and happiness benefits.
47 Contact Information Mary Beth Graebert
The Impact of Placemaking Attributes on Home Prices in the Midwest United States
 The Impact of Placemaking Attributes on Home Prices in the Midwest United States 2 0 1 3 C O N S T R U C T E D E N V I R O N M E N T C O N F E R E N C E M A R Y B E T H G R A E B E R T M I C H I G A N
Location Matters: Where America Is Moving
 Location Matters: Where America Is Moving Nearly half of all American households plan to move at some point in the future. While some will move for a larger or nicer home, or perhaps to purchase a home
Community Improvement Plans: Creating walkable and liveable communities that support local business
 Community Improvement Plans: Creating walkable and liveable communities that support local business Kate Hall Program Manager ~ WALK Friendly Ontario Canada Walks, Green Communities Canada khall@greencommunitiescanada.org
National Community and Transportation Preferences Survey. September 2017
 National Community and Transportation Preferences Survey September Executive Summary - Overview The Community and Transportation Preferences Survey echoes many of the major findings from the previous surveys.
Built Environment and Older Adults: Supporting Smooth Transitions Across the Life- Span. Dr. Lawrence Frank, Professor and Bombardier UBC
 Built Environment and Older Adults: Supporting Smooth Transitions Across the Life- Span Dr. Lawrence Frank, Professor and Bombardier Chair @ UBC The Hidden Health Costs of Transportation - Frank et al
Urban planners have invested a lot of energy in the idea of transit-oriented
 DOES TRANSIT-ORIENTED DEVELOPMENT NEED THE TRANSIT? D A N I E L G. C H AT M A N Urban planners have invested a lot of energy in the idea of transit-oriented developments (TODs). Developing dense housing
DATE: June 22, General Release SUBMITTED BY: LAND DEVELOPMENT SERVICES. RE: City Centre Survey Results
 DATE: June 22, 2018 TO: General Release SUBMITTED BY: LAND DEVELOPMENT SERVICES RE: City Centre Survey Results The following is a summary of preliminary findings for the Community Identity and Vision survey.
Summary Report: Built Environment, Health and Obesity
 Research and education Built Environment Edmonton Project Summary Report: Built Environment, Health and Obesity Introduction In 2007 the Canadian Institutes of Health Research and the Heart and Stroke
good walking is good business making massachusetts more walkable
 good walking is good business making massachusetts more walkable Nothing draws a crowd like a crowd. P.T. Barnum 15 minutes with WalkBoston who we are / what we do why walkability makes economic sense
Tourists simply won t go to a city or town that has lost its soul. Arthur Frommer
 Among cities and towns with no particular recreational appeal, those that preserve the past continue to enjoy tourism. Those that haven t receive almost no tourism at all. Tourists simply won t go to a
Golfers in Colorado: The Role of Golf in Recreational and Tourism Lifestyles and Expenditures
 Golfers in Colorado: The Role of Golf in Recreational and Tourism Lifestyles and Expenditures by Josh Wilson, Phil Watson, Dawn Thilmany and Steve Davies Graduate Research Assistants, Associate Professor
KEYS TO GREAT PLACES
 KEYS TO GREAT PLACES A Changing America Demographics are destiny: changing, shrinking households 1960: 44% of US Households were Married Couples with Children A Changing America Demographics are destiny:
Charrette #1 Keypad Polling Results. June 27, 2012
 Charrette #1 Results June 2, 2012 1. My affiliation with Opelika Road is (Choose all that apply) 1 2 Business owner Property owner 12 4 Business owner Property owner 2 1 2 2 Nearby resident Business patron
Planning for Economic and Fiscal Health
 Planning for Economic and Fiscal Health Christopher Zimmerman Vice President for Economic Development Cheyenne, Wyoming April 21, 2015 2 Planning for Economic and Fiscal Health The pattern of development
Community & Transportation Preferences Survey
 Community & Transportation Preferences Survey Webinar: August 5, 2015 Hugh Morris, AICP, LEED Realtor.org Jennifer Dill, Ph.D. trec.pdx.edu 1 Introduction National Association of Realtors Over 1,000,000
WALK Friendly Communities: Creating Vibrant, Inclusive Places for People
 WALK Friendly Communities: Creating Vibrant, Inclusive Places for People Walkers are the indicator species for vibrant communities ~ Dr. Rodney Tolley, Director, Walk21 Imagine yourself walking safely
U.S. Bicycling Participation Study
 U.S. Bicycling Participation Study Report of findings from the 2016 survey Conducted by Corona Insights Commissioned by PeopleForBikes Released July 2017 Table of Contents Background and Objectives 3 Research
Pocatello Regional Transit Master Transit Plan Draft Recommendations
 Pocatello Regional Transit Master Transit Plan Draft Recommendations Presentation Outline 1. 2. 3. 4. What is the Master Transit Plan? An overview of the study Where Are We Today? Key take-aways from existing
Walkable Retail: When Old Becomes New Again Part 1
 Walkable Retail: When Old Becomes New Again Part 1 By Erin Talkington, Vice President, and Jacob Ross, Associate You have probably read the following headline thousands of times, perhaps this year alone:
Cherry Creek Transportation and Land Use Forum September 25, 2013 Meeting Summary
 Cherry Creek Transportation and Land Use Forum September 25, 2013 Meeting Summary I. LEAD-IN TO SMALL GROUP DISCUSSION, POLLING AND STEERING COMMITTEE/TECHNICAL TASK FORCE DISCUSSION The meeting began
Future of Housing Trends and the Housing Market Demographic Waves in the Region and Future of Housing. Illinois Finance Forum January 25, 2019
 Future of Housing Trends and the Housing Market Demographic Waves in the Region and Future of Housing Illinois Finance Forum January 25, 2019 Millions OUR STATE S POPULATION 2000-2017 13.0 12.4 M 12.9
THESE DAYS IT S HARD TO MISS the story that Americans spend
 WHICH COMES FIRST: THE NEIGHBORHOOD OR THE WALKING? BY SUSAN HANDY AND PATRICIA MOKHTARIAN THESE DAYS IT S HARD TO MISS the story that Americans spend more time stuck in traffic than ever, that they re
Property Owner Survey Results
 Property Owner Survey Results 1. What are the most positive aspects of the Golden Mile? (check all that apply) Response Response Existing mix of businesses 50.0% 20 Good access to major roads 85.0% 34
Cottage Grove Road Activity Centers Plan
 Cottage Grove Road Activity Centers Plan Cottage Grove Road January 31, 2107 Kick Off Meeting Input Cottage Grove Road Corridor Visioning Exercise What would you like to see in 20 years? 10 Years? A vision
WILMAPCO Public Opinion Survey Summary of Results
 Wilmington Area Planning Council WILMAPCO Public Opinion Survey Summary of Results Prepared by: 2955 Valmont Road, Suite 300 Boulder, Colorado 80301 t: 303-444-7863 f: 303-444-1145 www.n-r-c.com Table
Creating walkable, bikeable and transit-supportive communities in Halton
 Creating walkable, bikeable and transit-supportive communities in Halton By presenting current research and best practices, the information in this paper is meant to support and broaden discussion on how
PUBLIC OPINION STRATEGIES
 PUBLIC OPINION STRATEGIES National Association of REALTORS The key findings from a national survey of 1,000 adults conducted October 5, 7, 9-10, 2007. 07574 Methodology Public Opinion Strategies is pleased
Perryville Transit Oriented Development & Greenway Plan
 A Partnership of the Town of Perryville and WILMAPCO Perryville Transit Oriented Development & Greenway Plan Why plan for TOD and Greenways? Identify strategies to enhance community character in Perryville
MOUNT CLEMENS, MICHIGAN
 Prepared For: Mount Clemens Downtown Development Authority Downtown District Plan MOUNT CLEMENS, MICHIGAN Prepared By: Michigan State University Practicum Josh Croff Emily Gehle Justin Habalewsky Daniel
Overview: Phase 3 Draft Development and Circulation Plans, White Bear Station
 Overview: Phase 3 Draft Development and Circulation Plans, White Bear Station This overview explains how to get more involved and provides information on the Phase 3 draft circulation and development plans
National Association of REALTORS National Smart Growth Frequencies
 September 520, 2017 3,000 Weighted Online Respondents National Association of REALTORS National Smart Growth Frequencies Q.2 The first question is about the quality of life in your community. How satisfied
Walkability. The Pathway to Atlanta s Future Growth April 19, 2017
 Walkability The Pathway to Atlanta s Future Growth April 19, 2017 1 Walkability The Pathway to Atlanta s Future Growth This report was prepared by the ULI Atlanta s Livable Communities Council Working
City of Davenport CitiBus Public Transportation Study. April 2015
 City of Davenport CitiBus Public Transportation Study April 2015 Overview Project Background Key Findings CitiBus Service Allocation Policy Discussion 2 Project Background 3 About CitiBus Operates 17 routes
TRANSPORTATION FACILITIES AND THEIR IMPACT ON HEALTH
 TRANSPORTATION FACILITIES AND THEIR IMPACT ON HEALTH Health and Transportation Air quality Climate change Safety Physical activity Access to food, medical care, employment Policy Link & Prevention Institute
Characteristics from these programs were used to compare to and evaluate existing conditions in Howard County.
 EXECUTIVE SUMMARY Bike share is a mobility option that allows users to access a fleet of public bicycles throughout a community. Bike share systems have successfully been implemented in communities throughout
Fixed Guideway Transit Outcomes on Rents, Jobs, and People and Housing
 Fixed Guideway Transit Outcomes on Rents, Jobs, and People and Housing Arthur C. Nelson, Ph.D., ASCE, FAICP Professor of Planning and Real Estate Development University of Arizona 1 Changing Transportation
THE 2010 MSP REGION TRAVEL BEHAVIOR INVENTORY (TBI) REPORT HOME INTERVIEW SURVEY. A Summary of Resident Travel in the Twin Cities Region
 REPORT HOME INTERVIEW SURVEY. A Summary of Resident Travel in the Twin Cities Region") THE 2010 MSP REGION TRAVEL BEHAVIOR INVENTORY (TBI) REPORT HOME INTERVIEW SURVEY A Summary of Resident Travel in the Twin Cities Region October 2013 WHAT IS THE TBI? The Travel Behavior Inventory (TBI)
THE 2010 MSP REGION TRAVEL BEHAVIOR INVENTORY (TBI) REPORT HOME INTERVIEW SURVEY A Summary of Resident Travel in the Twin Cities Region October 2013 WHAT IS THE TBI? The Travel Behavior Inventory (TBI)
Vision: Traditional hamlet with an attractive business/pedestrian friendly main street connected to adjacent walkable neighborhoods
 N D. Focus Area II Vision: Traditional hamlet with an attractive business/pedestrian friendly main street connected to adjacent walkable neighborhoods Transit Road Focus Area II is located in the Hamlet
Investment in Active Transport Survey
 Investment in Active Transport Survey KEY FINDINGS 3 METHODOLOGY 7 CYCLING INFRASTRUCTURE 8 Riding a bike 9 Reasons for riding a bike 9 Mainly ride on 10 Comfortable riding on 10 Rating of cycling infrastructure
The National Citizen Survey. Bowling Green, KY. Technical Appendices
 The National Citizen Survey Bowling Green, KY Technical Appendices 2014 National Research Center, Inc. Boulder, CO International City/County Management Association Washington, DC Contents Appendix A: Complete
EXECUTIVE SUMMARY: TRANSIT-ORIENTED DEVELOPMENT IN SMITHS FALLS, ONTARIO; A COMPARISON BETWEEN TWO SITES
 EECUTIVE SUMMARY: TRANSIT-ORIENTED DEVELOPMENT IN SMITHS FALLS, ONTARIO; A COMPARISON BETWEEN TWO SITES Topic and Purpose In 2007, the Mayor of Ottawa s Task Force on Transportation suggested adding a
Webinar: The Association Between Light Rail Transit, Streetcars and Bus Rapid Transit on Jobs, People and Rents
 Portland State University PDXScholar TREC Webinar Series Transportation Research and Education Center (TREC) 11-15-2016 Webinar: The Association Between Light Rail Transit, Streetcars and Bus Rapid Transit
Rock Spring Kick-Off Meeting 09/01/15 Walter Johnson High School Break Out Table Summaries. Rock Spring Break Out Table Comments. Table 1: Strengths:
 Rock Spring Break Out Table Comments Table 1: Strengths: Trees, open areas 1 Medical Care, Offices Parking at Medical important Mall access Good access to emergency services/police/ambulance/fire Weaknesses:
Public Workshop #2. September 14, 2016
 Public Workshop #2 September 14, 2016 Agenda Welcome Project Overview Where We Have Been Alternatives for State Street Land Use Street Design Next Steps 2 Project Overview Create a Vibrant State Street
EVAN GLASS. Montgomery County Council District 5
 EVAN GLASS 1. Do you support funding and advancing the Purple Line to groundbreaking as described in the Locally Yes. As a member of the recently convened Purple Line Implementation Advisory Group, I will
City of Novi Non-Motorized Master Plan 2011 Executive Summary
 City of Novi Non-Motorized Master Plan 2011 Executive Summary Prepared by: February 28, 2011 Why Plan? Encouraging healthy, active lifestyles through pathway and sidewalk connectivity has been a focus
Detroit Metromode. From Suburban To Urban RELATED IMAGES KIM NORTH SHINE THURSDAY, DECEMBER 01, 2011 CHRISTOPHER B. LEINBERGER
 Detroit Metromode From Suburban To Urban KIM NORTH SHINE THURSDAY, DECEMBER 01, 2011 RELATED IMAGES CHRISTOPHER B. LEINBERGER ENLARGE ENLARGE ENLARGE ENLARGE RELATED TAGS DEVELOPMENT, DOWNTOWN DEVELOPMENT,GOVERNMENT,
Pedestrian Survey Report
 Pedestrian Survey Report The City of Albany conducted a Pedestrian Survey in 2007 with the purpose of identifying resident s concerns about barriers to walking and accessibility in the City. The survey
The best indicator of an individual s and expanding access to parks and open space.
 Health & Wellness Create a Safe and Healthy Built Environment Artist s rendering, 2014 Health is important to Loveland residents, and stakeholders see the many strong connections between quality of life,
Implementing Living Streets. Dena Belzer January 29, 2009
 Implementing Living Streets Dena Belzer January 29, 2009 February 22, 2004 Starting with Some Definitions 1.Living Streets/Complete Streets 2.Corridor Revitalization 3.Shopping Mall Reuse Living/Complete
DRAFT for a State Policy for Healthy Spaces and Places
 DRAFT for a State Policy for Healthy Spaces and Places 1 DRAFT State Policy for Healthy spaces and Places 1. Purpose To encourage the use and development of land that builds healthy communities through
Bicycle-Pedestrian Master Plan Update
 Bicycle-Pedestrian Master Plan Update Planning & Zoning Commission November 29, 2017 Overview Project Purpose & Scope Project History Plan Vision & Goals Chapter 5: Making Connections-Beyond the Path Next
Baseline Survey of New Zealanders' Attitudes and Behaviours towards Cycling in Urban Settings
 Baseline Survey of New Zealanders' Attitudes and Behaviours towards Cycling in Urban Settings Highlights 67% of urban New Zealanders, 18 years of age or more own or have access to a bicycle that is in
Speed Limits Study and Proposal. Public Input Session: 8/14/13
 Speed Limits Study and Proposal Public Input Session: 8/14/13 Why is Decatur a unique place for this project? First Community Transportation Plan in the nation with a Health Impact Assessment. Strong sense
GRAHAM PEDESTRIAN TRANSPORTATION PLAN
 GRAHAM PEDESTRIAN TRANSPORTATION PLAN Chapter 1 I 1.1 Scope and Purpose n March of 2005, the City of Graham contracted with Greenways Incorporated (GWI) to create a Pedestrian Transportation Plan. The
Ranking Walkable Urbanism in America s Largest Metros
 Ranking Walkable Urbanism in America s Largest Metros The Largest 30 Metros in the United States SHARE OF U.S. POPULATION SHARE OF U.S. GDP 54% 46% 42% 58% LARGEST 30 METROS REST OF U.S. The Old Dichotomy
Frequently asked questions about how the Transport Walkability Index was calculated are answered below.
 Transport Walkability Index The Transport Walkability Index is a relative indicator of how well the built environment in different areas supports walking for transport. The index is frequently used in
How walk, bike, and transit friendly is your neighbourhood?
 How walk, bike, and transit friendly is your neighbourhood? What is an 8-80 City? 8-80 Cities are communities built for everyone regardless of age or ability. These communities reflect social equality
162 RESIDENTS ATTENDED 2 DAYS OF WORKSHOPS 15 TABLE DISCUSSIONS WHAT WE HEARD. Oakridge Municipal Town Centre Workshops PLANNING PROGRAM
 OAKRIDGE MTC WORKSHOP 2017 CAMBIE CORRIDOR Phase 3 STEP 3: 3: October June 2017 CAMBIE CORRIDOR PLANNING PROGRAM 2 DAYS OF WORKSHOPS 15 TABLE DISCUSSIONS 162 RESIDENTS ATTENDED WHAT WE HEARD Oakridge Municipal
ECONOMIC DEVELOPMENT INTRODUCTION WHAT YOU WILL FIND IN THIS CHAPTER
 ECONOMIC DEVELOPMENT INTRODUCTION WHAT YOU WILL FIND IN THIS CHAPTER Information about the local economy including statistics on population, employment, businesses, and employment sectors. Policies and
Capital Bikeshare 2011 Member Survey Executive Summary
 Capital Bikeshare 2011 Member Survey Executive Summary Prepared by: LDA Consulting Washington, DC 20015 (202) 548-0205 June 14, 2012 EXECUTIVE SUMMARY Overview This report presents the results of the 2012
San Francisco Asian, Inc.
 San Francisco Asian, Inc. Plan Bay Area Community-Based Outreach Outreach area: South of Market/Tenderloin in San Francisco, California Outreach description: Outreach in April and May 2011 through door
Table #6 VISION CHARACTERISTICS
 Table #6 VISION White Flint is a place to live, work, play, shop, and walk with sufficient density to encourage quality redevelopment. Vibrant streets and consistent streetscapes are important. CHARACTERISTICS
Florida Coalition CTST COMMUNITY TRAFFIC SAFETY TEAMS COLLEGE OF MEDICINE
 CTST Florida Coalition COMMUNITY TRAFFIC SAFETY TEAMS COLLEGE OF MEDICINE How to Choose Your Lifelong Community A Transportation Checklist What Is a Lifelong Community? You might be more familiar with
Community & Transportation Preferences Survey U.S. Metro Areas, 2015 July 23, 2015
 Community & Transportation Preferences Survey U.S. Metro Areas, 2015 July 23, 2015 Realtor.org trec.pdx.edu 1 Highlights: Generation gaps in everyday travel Only 71% of Millennials like driving (the lowest
AAMPO Regional Transportation Attitude Survey
 AAMPO Regional Transportation Attitude Survey Traditionally Underserved Populations helping organizations make better decisions since 1982 2018 Submitted to the AAMPO By: ETC Institute 725 W. Frontier
BUILDING THE CASE FOR TRAVEL OPTIONS IN WASHING TON COUNTY. Image: Steve Morgan. Image: Steve Morgan
 BUILDING THE CASE FOR TRAVEL OPTIONS IN WASHING TON COUNTY Image: Steve Morgan Image: Steve Morgan Image: TriMet Image: TriMet WHAT ARE TRAVEL OPTIONS PROGRAMS? Travel options programs encourage residents,
Strategic Plan for Active Mobility Phase I: Bicycle Mobility
 Strategic Plan for Active Mobility Phase I: Bicycle Mobility City of Corpus Christi February 9, 2016 Jeff Pollack, AICP Transportation Planning Director Vision Active Mobility Plan Vision The metropolitan
What s Health Got to Do With It? Health and Land Use Planning
 What s Health Got to Do With It? Health and Land Use Planning CANDACE RUTT, PH.D. EXECUTIVE DIRECTOR APRIL 13 TH, 2016 Planning and Public Health Planning + Public Health Healthy Communities Healthier
TRANSIT-ORIENTED DEVELOPMENT POLICY. City Planning and Development Department Kansas City, Missouri
 TRANSIT-ORIENTED DEVELOPMENT POLICY City Planning and Development Department Kansas City, Missouri TOD Framework Connectivity: Expand transit access, increase mobility options Integrated system of pedestrian,
2007 Quad Cities Community Vitality Scan
 2007 Quad Cities Community Vitality Scan SPONSORED BY Amy Helpenstell Foundation Community Foundation of the Great River Bend Moline Foundation Quad City Health Initiative United Way of the Quad Cities
Connections to the Wild Salmon Resource in cook inlet
 Connections to the Wild Salmon Resource in cook inlet Highlights of Opinion Research Sponsored by The Salmon Project As part of a feasibility study in early 2013, the Salmon Project sponsored extensive
Complete Streets 101: The Basics
 Complete Streets 101: The Basics Michigan Municipal League - Capital Conference March 21, 2017 Chip Smith, AICP - Senior Planner - Wade Trim Inc. and City Council member City of Ann Arbor 2017 MML Capital
TRENDS SEPTEMBER
 2 Chapter 2 TRENDS In order to keep pace with the demands of a growing population, the City of Chanhassen needs to consider how the dynamic nature of technologies, trends, cultures, and activities will
Bowling Green, KY Technical Appendices
 Bowling Green, KY Technical Appendices 2018 2955 Valmont Road Suite 300 777 North Capitol Street NE Suite 500 Boulder, Colorado 80301 Washington, DC 20002 n-r-c.com 303-444-7863 icma.org 800-745-8780 Contents
TOD COVER. Header. Lessons Learned. Results of FTA s Listening Sessions With Developers, Bankers, and Transit Agencies on Transit Oriented Development
 Header COVER TOD T R A N S I T O R I E N T E D D E V E L O P M E N T Lessons Learned Results of FTA s Listening Sessions With Developers, Bankers, and Transit Agencies on Transit Oriented Development U.S.
Introduction Overview This document summarizes the Gateway Gold Line Bus Rapid Transit (Gold Line BRT) health impact assessment (HIA) process and reco
 health impact assessment (HIA) process and reco") Gateway Gold Line Bus Rapid Transit: A Closer Look at Health and Land Use Project Summary May 2016 Introduction Overview This document summarizes the Gateway Gold Line Bus Rapid Transit (Gold Line BRT)
Gateway Gold Line Bus Rapid Transit: A Closer Look at Health and Land Use Project Summary May 2016 Introduction Overview This document summarizes the Gateway Gold Line Bus Rapid Transit (Gold Line BRT)
Illustrated Principles of Good Planning
 Illustrated Principles of Good Planning The Miami 21 Zoning Code incorporates time-tested planning principles into the zoning regulations of our City. These are principles that make for better neighborhoods,
Smart Growth: Residents Social and Psychological Benefits, Costs and Design Barbara Brown
 Smart Growth: Residents Social and Psychological Benefits, Costs and Design Barbara Brown By Scott Siedor 11 At the invitation of the Goodwin-Niering Center for the Environment, Barbara Brown came to Connecticut
How to Develop a Pedestrian Safety Action Plan
 How to Develop a Pedestrian Safety Action Plan Course Introduction Presented by: Peter Eun FHWA RC Safety Engineer Ryan Snyder President, Ryan Snyder Associates, LLC Paul Zykofsky Director, Land Use and
City of Birmingham Draft Multi-modal Transportation Plan
 City of Birmingham Draft Multi-modal Transportation Plan City Commission Public Hearing Monday, November 25, 2013 7:30 pm Norman Cox, PLA, ASLA The Greenway Collaborative, Inc. Ann Arbor, Michigan The
EXCELLENCE. Executive Summary. Destination: 2014 Downtown Detroit Perceptions Survey
 Executive Summary Destination: EXCELLENCE 2014 Downtown Detroit Perceptions Survey Capturing the Voice of Detroit so we can continue to take giant leaps forward. 1 Executive Summary Overall Impressions
CONNECTING PEOPLE TO PLACES
 CONNECTING PEOPLE TO PLACES 82 EAST BENCH MASTER PLAN 07 Introduction The East Bench transportation system is a collection of slow moving, treelined residential streets and major arteries that are the
summary of issues and opportunities
 1 summary of issues and opportunities EXECUTIVE SUMMARY CHAPTER 2: HISTORY - 3: LAND USE This first chapter is an overview of lessons learned from analysis of the existing conditions on El Camino as well
Market Factors and Demand Analysis. World Bank
 Market Factors and Demand Analysis Bank Workshop and Training on Urban Transport Planning and Reform. Baku, April 14-16, 2009 Market Factors The market for Public Transport is affected by a variety of
2020 K Street NW, Suite 410 Washington, DC (202)
") 2020 K Street NW, Suite 410 Washington, DC 20006 (202) 463-7300 Interview dates: October 24 25, 2013 Interviews: 1,008 adults CONDUCTED BY IPSOS PUBLIC AFFAIRS These are findings of an Ipsos online poll
2020 K Street NW, Suite 410 Washington, DC 20006 (202) 463-7300 Interview dates: October 24 25, 2013 Interviews: 1,008 adults CONDUCTED BY IPSOS PUBLIC AFFAIRS These are findings of an Ipsos online poll
Childhood Obesity: A Policy Perspective
 Leadership for Healthy Communities Advancing Policies to Support Healthy Eating and Active Living Childhood Obesity: A Policy Perspective Elizabeth Hinman elizabeth@leadershipforhealthycommunities.org
Briefing Paper #1. An Overview of Regional Demand and Mode Share
 2011 Metro Vancouver Regional Trip Diary Survey Briefing Paper #1 An Overview of Regional Demand and Mode Share Introduction The 2011 Metro Vancouver Regional Trip Diary Survey is the latest survey conducted
Creating Complete Streets to Accommodate All Users
 Creating Complete Streets to Accommodate All Users Peter Lagerwey, Toole Design Group plagerwey@tooledesign.com Brian Dougherty, Seattle DOT brian.dougherty@seattle.gov International Conference on Urban
Presentation Comments and Questions
 Presentation Comments and Questions The community had a number of questions regarding the master plan process and operational issues in and around the MARC rail station areas. The bullet points below are
COMMUNITY CHOICES EVENTS High Schools. February 13-22, 2014
 COMMUNITY CHOICES EVENTS High Schools February 13-22, 2014 In February 2014, the City held a series of events to gain public input on the Arvada Comprehensive Plan Update. Outreach included engaging approximately
Is St. Louis Ready for a Bike Share System? May 14, 2014 Public Open House
 Is St. Louis Ready for a Bike Share System? May 14, 2014 Public Open House PRESENTATION AGENDA 2 BIKE SHARE How does it work? What are the benefits? Who would use it? Will it be safe? Would it work in
ALPHARETTA, GA FOR LEASE
 PROPERTY HIGHLIGHTS Approximately 18,283 SF two-story office building Up to 9,427 SF available for lease 6,377 RSF total contiguous space available (suite 200/210) Offered for lease at $15.50/SF full service
Ann Arbor Downtown Street Plan
 1 Ann Arbor Downtown Street Plan Public Workshop #1 We know that. 2 Public right-of-way (streets, sidewalks, and alleys) make up 30% of the total District area of downtown. Streets need to provide mobility
Healthy Corridors. Ed McMahon Urban Land Institute Nashville, TN
 Healthy Corridors Ed McMahon Urban Land Institute Nashville, TN What s Wrong with this Corridor? Ugly Unsafe Unhealthy Unwalkable Under performing Un-Connected Why Are Corridors Unhealthy? Safety Lots
CITY OF ALPHARETTA DOWNTOWN MASTER PLAN TRAFFIC EVALUATION
 CITY OF ALPHARETTA DOWNTOWN MASTER PLAN TRAFFIC EVALUATION June 2015 CITY OF ALPHARETTA DOWNTOWN MASTER PLAN TRAFFIC EVALUATION Introduction The Alpharetta Downtown Master Plan was developed in the fall
Jut (ar-icbcr/eagleton POLL
 Jut ar-icbcr/eagleton POLL FOR RELEASE: SUNDAY, JUNE 28, 1987 CONTACT: CLIFF ZUKIN OR RELEASE; SL/EP15-3 EP65-3) BOB CARTER RELEASE INFORMATION A story based on the survey findings presented in this release
PEDESTRIAN ACTION PLAN
 ATTACHMENT 2 CITY OF SANTA MONICA PEDESTRIAN ACTION PLAN CITY OF SANTA MONICA PEDESTRIAN ACTION PLAN This page intentionally left blank EXECUTIVE SUMMARY CHAPTER 1 EXECUTIVE SUMMARY Setting the Stage
Purpose and Need. Chapter Introduction. 2.2 Project Purpose and Need Project Purpose Project Need
 Chapter 2 Purpose and Need 2.1 Introduction The El Camino Real Bus Rapid Transit (BRT) Project (Project) would make transit and other transportation improvements along a 17.6-mile segment of the El Camino
Village of Osceola Comprehensive Planning Public Opinion Survey Report. Shelly Hadley David Trechter Denise Parks James Janke Ramona Gunter
 Village of Osceola Comprehensive Planning Public Opinion Survey Report Shelly Hadley David Trechter Denise Parks James Janke Ramona Gunter Survey Research Center Report 2008/4 February, 2008 Students working