Transportation Report on Annual Mobility
|
|
|
- Marian Fisher
- 5 years ago
- Views:
Transcription


1 Transportation Report on Annual Mobility Published annually in support of: Comprehensive Plan Transportation Element Multimodal Transportation Concurrency Program Transportation Benefit District No. 1 Pedestrian Master Plan Bicycle Master Plan WTA Strategic Plan March 2015 Prepared by: Chris Comeau, AICP-CTP Transportation Planner
2 Sections 2015 TRAM TABLE OF CONTENTS Page Executive Summary... 3 Chapter 1: Observations and Implications of the 2015 TRAM... 5 Chapter 2: Multimodal Transportation Concurrency Program in Chapter 3: Bellingham Transportation Benefit District No Chapter 4: Primary Pedestrian Network Completeness Chapter 5: Primary Bicycle Network Completeness Chapter 6: Off-Street Greenways Multiuse Recreation Trails Chapter 7: Whatcom Transportation Authority Primary Transit Network Chapter 8: Automobile and Freight Truck Arterial Networks Chapter 9: Waterfront District Biennial Monitoring Program Transportation Report on Annual Mobility Page 2
 with goals, policies, and project recommendations to accommodate pedestrians,")
 in the development of the 2004 WTA Strategic Plan and adopted the WTA \"Primary Transit")

3 Executive Summary Prior to the popular rise of the national "Complete Streets" movement, Bellingham created a local "Complete Streets" approach to transportation planning by expanding the focus of City transportation planning to include multiple modes of transportation (multimodal) with goals, policies, and project recommendations to accommodate pedestrians, bicyclists, and transit riders, as well as vehicle drivers on public streets. Bellingham transportation planners worked directly with Whatcom Transportation Authority (WTA) in the development of the 2004 WTA Strategic Plan and adopted the WTA "Primary Transit Network" into the 2006 Bellingham Transportation Element. Since then, Bellingham has created a Primary Pedestrian Network and a Primary Bicycle Network through Pedestrian and Bicycle Master Plans and Bellingham's prototypical "Complete Streets" approach has evolved into a "Complete Networks" approach to citywide multimodal transportation planning. Figure 1 - Bellingham's "Complete Networks" Approach to Transportation Planning 2015 Transportation Report on Annual Mobility Page 3
4 Since 2006, the Transportation Report on Annual Concurrency (TRAC) has provided an annual assessment of Bellingham's multimodal transportation system in terms of its ability to accommodate the amount of growth and development planned for in the Land Use Element of the Bellingham Comprehensive Plan. This is done by measuring the multimodal transportation needs of new growth and development against the adopted "Level of Service (LOS) Standard" in the Transportation Element of the Bellingham Comprehensive Plan, as required by the Washington State Growth Management Act (GMA). The TRAC has provided an opportunity to identify concurrency issues proactively and offer recommendations for changes to the program, when and where necessary. In addition to tracking transportation impacts from new development, the TRAC provided an assessment of the existing multimodal transportation system to help Public Works and City Council plan future transportation infrastructure investments for the City s annual 6-Year Transportation Improvement Program (TIP). RCW requires that the City adopt the 6-Year TIP by July 1 each year and the TIP must be consistent with the Transportation Element of the Bellingham Comprehensive Plan. In 2009, Bellingham adopted an innovative multimodal transportation concurrency program and since then, the TRAC has documented the annual improvements to, and completeness of, Bellingham's pedestrian, bicycle, transit, and vehicle networks as well as recognizing that the multiuse Greenways trails provide a secondary transportation function in some parts of Bellingham. The TRAC has been evolving and serving as an annual report card for the multimodal transportation system and with the completion of the 2014 Bicycle Master Plan, the title is being changed to the Transportation Report on Annual Mobility (TRAM) to reflect the comprehensive examination it provides for each major transportation mode (Pedestrian, Bicycle, Transit, Automobile, and Freight Truck). In essence, the TRAM provides a progress report on how Bellingham provides mobility for people, goods, and services. The 2015 TRAM reflects Bellingham's "Complete Networks" approach to transportation planning (Figure 1) and includes new chapters on Bellingham's transit, automobile, and freight truck networks, as well as a new chapter on Bellingham Transportation Benefit District No. 1 (TBD), which will serve as the annual TBD Report to the TBD Board of Directors. The TBD Report includes information on the financial status of the TBD and highlights various transportation improvements that have been and will be funded by TBD revenue. The last chapter in the 2015 TRAM is a placeholder for the Waterfront District Biennial Monitoring Program. The Port of Bellingham is required to produce a full report every two years to monitor transportation impacts as Waterfront District redevelopment occurs, which will lead to various transportation infrastructure mitigation measures agreed to by the Port and the City. Further explanation of Bellingham's adopted LOS standards, multimodal transportation concurrency, long-range transportation planning, annual six-year transportation improvement program, transportation impact fees (TIF), the Urban Village TIF Reduction Program, and other multimodal transportation issues are available on the City of Bellingham Transportation Planning web page at All questions regarding the contents of the TRAM, multimodal transportation concurrency, 6-Year TIP, and citywide multimodal transportation planning in Bellingham should be directed to: Chris Comeau, AICP-CTP, Transportation Planner Bellingham Public Works Engineering (360) telephone; ccomeau@cob.org 2015 Transportation Report on Annual Mobility Page 4
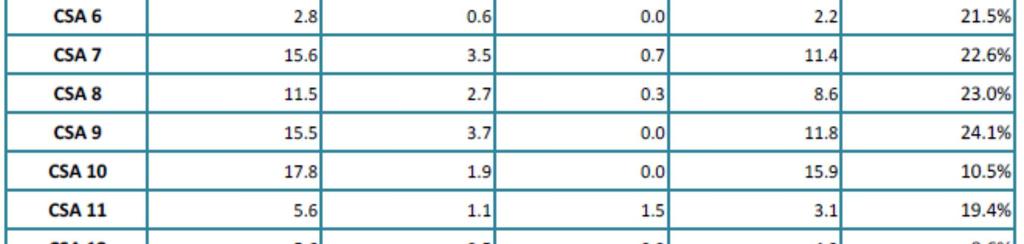
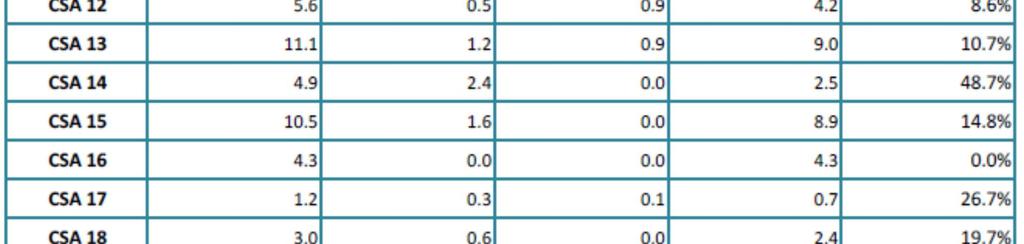
5 Chapter 1: Observations and Implications of the 2015 TRAM Major Change in Bicycle Network Completeness: The most noticeable difference in the number of Person Trips Available by Concurrency Service Area (CSA) between the 2014 TRAC and the 2015 TRAM is that the bicycle completeness percentages have dropped precipitously. This is simply the result of incorporating a much more extensive Primary Bicycle Network (160 miles) with the approval of the 2014 Bicycle Master Plan than the bicycle facilities (107 miles) adopted in the Transportation Element of the Bellingham Comprehensive Plan, which is what all previous TRACs had been based on. The net effect is that the bicycle network in most CSA's is less than 50% complete and therefore no longer have credits for the availability of bicycle facilities. This will change over the next several years as transportation planners continue to maximize investments in bicycle and pedestrian infrastructure. Urban Villages (Green): As Table 2.1 shows, there are more Person Trips Available (PTA) [8,282] in the central urban core CSA #7, which includes the Downtown, Old Town, Samish, and Fountain Urban Villages, than in any other part of the City. This is due to the high degree of completeness of the primary pedestrian network (89.9%), availability of some of the bicycle facilities planned in the Bicycle Master Plan (22%), the presence of multiuse recreational trail connections relative to the planned bicycle facilities (12%), and the prevalence of high-frequency transit routes (1,088 PTA) running through the core to the downtown WTA transit hub. Transition Areas (Yellow): The Bellingham Waterfront District CSA #6 currently has the lowest number of PTA for any of the Type 2 transition areas in Bellingham. This is expected to change in the next few years as the City constructs new multimodal transportation infrastructure in the Waterfront District with the extension of the Granary-Bloedel arterial from Roeder Avenue to Cornwall Avenue in This Type 2 CSA cannot evolve to a Type 1 CSA until WTA high-frequency transit service is available within the CSA. This service is not likely to be provided until a justifiable transit ridership base develops, which is not expected for many years. Suburban Areas (Red): A tremendous amount of major new commercial development has entered the development review pipeline in the northwest portion of Bellingham on the West Bakerview corridor, CSA #18. This CSA now has only 737 PTA, the fewest for any Type 3 suburban CSA. Additional development proposals have already been made in the first quarter of 2015, which will draw the PTA in CSA #18 down even further to 341. Other Type 3 suburban CSA's with low PTA are CSA #19 (UGA: Airport Industrial PTA) and CSA #15 (King Mountain - 1,179 PTA). There is an active annexation proposal to bring 174-acres in CSA #19 into the City, but there are many unanswered questions regarding the transportation infrastructure needs in this area and how they should be funded and constructed. The City is currently working with WSDOT on several transportation studies for Interstate 5 and the interchange at West Bakerview/I-5. As build-out of these CSA's continues over time, private development will be required to construct sidewalks on all public streets and bicycle lanes along all arterial streets. The City will also construct capital street improvements, adding sidewalks, bicycle lanes, streets, and transit connections. While all of these future improvements will add PTA to CSA #18 when completed, if there are not enough PTA to serve new development at the time of concurrency evaluation, then PTA may have to be earned through concurrency mitigation in order for the City to issue a Certificate of Concurrency. Concurrency mitigation can include off-site construction of sidewalk or bicycle facilities identified in the Primary Pedestrian and Bicycle Networks in the Pedestrian and Bicycle Master Plans. General Conclusion: With the highest number of PTA in the urban core (CSA #7) and lower numbers of PTA in the outer suburban areas CSAs, the 2015 TRAM demonstrates that Bellingham's Multimodal Transportation Concurrency methodology is effectively integrating multimodal transportation system capacity and availability with various land use contexts within City limits. This helps to promote the Bellingham Comprehensive Plan and GMA goal to direct new development toward compact, mixed use urban areas where adequate transportation services and facilities are most available Transportation Report on Annual Mobility Page 5
6 Chapter 2: Multimodal Transportation Concurrency Program in 2015 Evolution From Auto-based to Multimodal Transportation Metrics In 2005, transportation planning staff advised that reliance on traditional auto-oriented LOS methodology would not help to achieve Bellingham's infill land use goals, but in June 2006, the City Council adopted BMC 13.70, the City s first GMA-compliant Transportation Concurrency Management Ordinance, in conjunction with the June 2006 Bellingham Comprehensive Plan and GMA requirements for: A transportation element that implements, and is consistent with, the land use element (RCW 36.70A.70 (6)). BMC established an interim program, based on traditional automobile-oriented level of service (LOS) standards, similar to other jurisdictions, to monitor and maintain adequate transportation facilities in support of the City s infill land use strategy and GMA requirements: After adoption of the comprehensive plan by jurisdictions required to plan or who choose to plan under RCW 36.70A.040, local jurisdictions must adopt and enforce ordinances which prohibit development approval if the development causes the level of service on a locally owned transportation facility to decline below the standards adopted in the transportation element of the comprehensive plan, unless transportation improvements or strategies to accommodate the impacts of development are made concurrent with the development. These strategies may include increased public transportation service, ride sharing programs, demand management, and other transportation systems management strategies. For the purposes of this subsection (6) concurrent with the development shall mean that improvements or strategies are in place at the time of development, or that a financial commitment is in place to complete the improvements or strategies within six* years (RCW 36.70A.70 (6) (b)). [*Bellingham requires financial commitment within three years consistent with project funding on 6-Year TIP] As predicted, in early 2007, a LOS violation occurred and a 9-month-long moratorium on new development was imposed along Northwest Avenue. Public Works hired TranspoGroup, Inc. to help Bellingham transportation planners develop an innovative new method to include all major transportation modes (pedestrian, bicycle, transit, and automobile) to replace the traditional auto-only methodology. On January 1, 2009, Bellingham implemented an innovative new Multimodal Transportation Concurrency Program, which received the 2009 American Planning Association/Planning Association of Washington Award for Transportation Planning in Washington State. In 2009, transportation planners further amended the multimodal transportation concurrency ordinance to make several changes to Urban Village Concurrency Service Areas and also incorporated a select inventory of bike-friendly multiuse recreational trails. A full account of Bellingham's past experience and struggles with auto-oriented LOS measurements and the innovative new multimodal approach to transportation concurrency titled "Moving Beyond the Automobile" is available on the City web site at Bellingham's Multimodal Transportation Concurrency Program annually measures sidewalks, bicycle facilities, multiuse trails, WTA transit service, and arterial streets in the context of various land use environments found within 23 Concurrency Service Areas (CSA) (Figure 2.1) Transportation Report on Annual Mobility Page 6


7 Figure 2.1 Bellingham s 23 Concurrency Service Areas (CSA) in Transportation Report on Annual Mobility Page 7
8 Data Inventories The 2015 TRAM identifies Person Trips Available (PTA) by Concurrency Service Area using arterial street traffic count data, WTA transit bus frequency, seated capacity and ridership statistics, and inventories of sidewalk and bicycle facilities, as well as select multiuse trails used for transportation purposes. The 2015 TRAM also accounts for all pipeline trips reserved for development in the Concurrency Evaluation Tracking Tool (CETT) for current conditions through December 31, The measurements of the various travel modes are compiled and converted into Person Trips Available (PTA) by each CSA, which is officially Bellingham's GMA-required adopted level-of-service standard in the Transportation Element of the Bellingham Comprehensive Plan. Concurrency Evaluation Tracking Tool (CETT) The Concurrency Evaluation Tracking Tool (CETT) is a spreadsheet-based tool that contains current arterial traffic volumes and capacities, seated transit capacities and ridership volumes, and completeness of bicycle and pedestrian networks. The CETT is used for Transportation Concurrency evaluations to determine whether enough Person Trips are Available, or can be provided concurrent with, development proposed within Concurrency Service Areas. The CETT provides a snapshot-in-time of the status of the citywide multimodal transportation network and its ability to accommodate new development. Pipeline Development Projects Person trips generated from the 197 total development proposals evaluated for transportation concurrency between June 15, 2006 and December 31, 2014 have been assigned to and withdrawn from affected CSAs Figure Concurrency Certificates Issued from June 15, 2006* - December 31, 2014 *NOTE: BMC effective date = June 15, 2006, consistent with 2006 Bellingham Comprehensive Plan Transportation Report on Annual Mobility Page 8
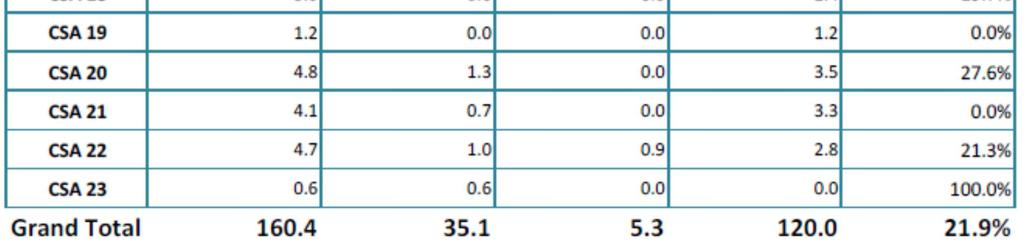
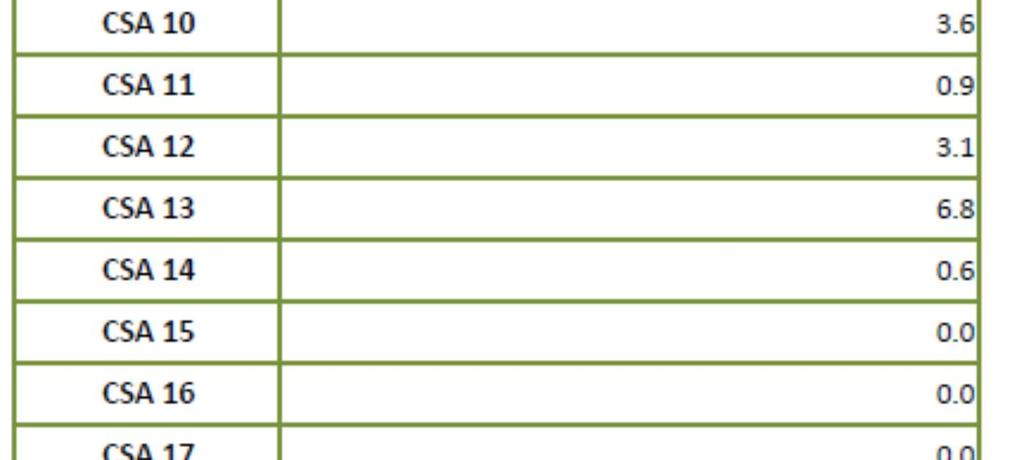
9 Table 2.1. Person Trips Available (PTA) by Concurrency Service Area (CSA) in 2015 Sidewalks 1 Multiuse Trails Bicycle Facilities 2 WTA 3 Auto % Credit % Credit % Credit Transit Arterial Net CSA Comp PTA Comp PTA Comp PTA PTA PTA PTA 4 1. Edgemoor-South 31% 0 39% % , Samish Hill 22.2% 0 31% % ,367 2, Fairhaven Urban Village 81.3% % % ,276 2, South Hill-Happy Valley 57.1% % % ,611 1, WWU 82.5% % % , Waterfront District % 0 86% % , Urban Core (4 Villages) 89.9% % % 0 1,088 6,952 8, Puget-Whatcom Falls 63.9% % % ,599 3, Birchwood-Columbia 59.6% % % ,071 2, Cornwall-Sunnyland-York 80.2% % % ,257 4, Barkley Urban Village 70.8% % % ,565 2, Roosevelt-Chandler 67.6% % % ,098 2, Alabama-Silver Beach 55.8% 96 61% % ,551 3, Cordata South 67.7% % % ,294 7, King Mountain 38.8% 0 0% % ,412 1, Irongate Industrial 4.6% 0 0% 0 0% 0 0 3,529 3, WCC 86.1% 576 0% % ,300 3, West Bakerview 34.6% 0 0% % , UGA: Airport Industrial 1.7% 0 0% 0 0% UGA: Marine-Bennett 0.8% 0 25% 250 0% 0 0 1,683 1, UGA: Pacific Hwy Industrial 0% 0 0% 0 0% 0 0 1,334 1, Cordata North 55.6% 96 15% % ,410 4, UGA: East Bakerview 0.0% 0 0% % ,721 2,521 Citywide 65, Transportation Report on Annual Mobility Page 9
10 Notes: 1.) Percent complete sidewalks reflects degree of completeness by CSA of "Primary Pedestrian Network" in 2012 Pedestrian Master Plan from the list of over 300 sidewalk infill projects. 2.) Percent complete bicycle lanes reflects status of facilities adopted in the Comprehensive Plan, where construction is realistically feasible, rather than absolute total of all facilities identified by the former BPAC. 3.) PTA for WTA transit and Auto arterials are derived from select transit and auto data collection measurement points throughout the City. Transit data is collected by WTA and auto data is collected by Public Works. 4.) 2013 net PTA is derived from the compilation of all five variables (Sidewalk, Bike Lane, Multiuse Trails, WTA Transit, and arterial traffic counts); minus PTA used by development proposals; minus a 500 PTA reserve in each CSA to avoid violating Bellingham's adopted multimodal LOS standards. 5.) Waterfront District eligible to become Type 1 Urban Village in future with Master Plan and fixed route transit. Compliance with Washington State Planning Law The Transportation Report on Annual Mobility (TRAM) is an annual monitoring and reporting system that Public Works has published since March 2006 (previously titled Transportation Report on Annual Concurrency (TRAC). The TRAM informs the City Council, Planning Commission, Transportation Commission, the general public, and the development community which portions of the City are best suited for infill development based on adequate transportation infrastructure and services - reported as Person Trips Available (PTA) by each Concurrency Service Area (CSA) (See Table 1). As such, the TRAM is Bellingham s annual documentation that the City is in full compliance with the Washington State Growth Management Act (GMA) requirements. The 2015 TRAM demonstrates that Bellingham's Multimodal Transportation Concurrency methodology is integrating multimodal transportation system capacity within various land use contexts in Bellingham and is further promoting both the Comprehensive Plan and GMA goal of directing new development toward compact, mixed-use urban areas where adequate transportation services and facilities are most available Transportation Report on Annual Mobility Page 10
11 Transportation Concurrency Program Recommendations Moving Forward Each year, transportation planners report on what was accomplished over the past year and what type of transportation planning is recommended for staff to focus on in the year ahead. A TRAC Recommendations Public Works staff explored each of the recommendations for enhancement to the Multimodal Transportation Concurrency Program in the 2014 TRAC and took the actions listed below. 1) Maintain and Update the Concurrency Evaluation Tracking Tool with new data The Concurrency Evaluation Tracking Tool (CETT) maintains an inventory of arterial traffic counts and capacities, high-frequency transit capacity and ridership data obtained directly from WTA, and the degree of completeness for sidewalk and bicycle facilities approved in Pedestrian and Bicycle Master Plans. The CETT is also used to track and monitor the number of person trips withdrawn for new development for each CSA. Since January 1, 2014, the CETT has been updated to incorporate: Transportation Concurrency Certificates issued in 2014 Six new Concurrency Service Areas in northern Bellingham A 2015 inventory of bicycle facilities comprising the "Primary Bicycle Network" in the Bicycle Master Plan On-street bicycle facilities constructed in 2014 A 2015 inventory of sidewalk facilities comprising the "Primary Pedestrian Network" in the Pedestrian Master Plan Sidewalks on the Primary Pedestrian Network constructed in 2014 Multiuse trail (bicycle-friendly) data inventoried in 2014 and incorporated into each CSA where these trails serve a clear transportation function 2) Fully Integrate the Primary Bicycle Network in the 2014 Bicycle Master Plan into the Multimodal Transportation Concurrency Program and 2015 TRAM Bicycle Master Plan approved October 2014 and fully incorporated into 2015 TRAM 3) Continued Refinement of Multimodal Transportation Concurrency Methodology Public Works staff should continue work to develop connectivity analysis and metrics for both project-specific transportation impact analysis and overall multimodal transportation system planning and measurement of system effectiveness. There is no funding currently provided for this, but it remains a priority for transportation planning staff. In 2010, Public Works and TranspoGroup completed a demonstration of how connectivity metrics might work. In 2013, TranspoGroup and Toole Design employed ViaCity software for bicycle system connectivity analysis in the Bicycle Master Plan work. Transportation planners are still considering methods to develop a connectivity metric for transportation concurrency and transportation impact analysis (TIA) purposes Transportation Report on Annual Mobility Page 11
12 B TRAM Recommendations Bellingham transportation planning staff recommends the following actions in 2015 to further enhance the Multimodal Transportation Concurrency Program and TRAC: 1) Explore Further Refinements/Additions of Concurrency Service Areas As portions of the Bellingham UGA are annexed to the City and as Institutional Master Plans and Urban Village Plans are created within Bellingham, the creation of new CSAs or adjustments to existing CSA categories will be necessary, as listed below. The 2006 Saint Joseph s Hospital IMP (Area 7 Cornwall Park Neighborhood) allows approximately 500,000 SF of additional development and the hospital-medical complex along the Squalicum-Birchwood corridor is characteristically different than the surrounding residential neighborhood. The 2006 SJH IMP requires additional sidewalks and bicycle routes internal to the hospital campus, WTA transit service is available, and PeaceHealth has implemented a robust Commute Trip Reduction (CTR) program employing multiple transportation demand management strategies for employees on the St. Joseph Hospital campus. A new CSA should be created if St. Joseph's amends their IMP with a new transportation circulation system. As work on the Comprehensive Plan update continues, identify additional potential candidates for Urban Villages as future Type 1 "Urban Village" CSAs. 2) Fully Integrate the Biennial Monitoring Program Required for the Bellingham Waterfront District into the 2016 TRAM. In December 2013, the Bellingham City Council and the Port of Bellingham approved the longterm master plan for the Bellingham Waterfront District. One of the key elements of this plan is a Biennial Monitoring Program, which requires the Port of Bellingham to collect and report data on transportation mode choices being made into the Waterfront District every other year. The 2015 TRAM is the natural and best fit for this information to be reported to the community at large. 3) Explore the Possibility of Integrating Connectivity Metrics into Multimodal Transportation Concurrency Evaluation and Transportation Impact Analysis (TIA) for Development Review Public Works staff should continue work to develop connectivity analysis and metrics for both project-specific transportation impact analysis and overall multimodal transportation system planning and measurement of system effectiveness. Bellingham's innovative Multimodal Transportation Concurrency methodology is also fully integrated with the Urban Village Transportation Impact Fee Reduction Program but is not yet integrated with Transportation Impact Analysis (TIA) requirements, which are predominantly auto-oriented. Bellingham's TIA guidelines are in need of revision in 2015 and this offers an opportunity to try to incorporate multimodal concurrency considerations into TIA review for private development. There is no specific time or funding budgeted for this and even though this effort may require significant staff time it is a priority for transportation planners because it could result in more unified and integrated transportation planning and analysis Transportation Report on Annual Mobility Page 12
13 4) Maintain and Update the Concurrency Evaluation Tracking Tool with new data The Concurrency Evaluation Tracking Tool (CETT) maintains an inventory of arterial traffic counts and capacities, high-frequency transit capacity and ridership data obtained directly from WTA, and the degree of completeness for sidewalk and bicycle facilities adopted in the Transportation Element of the Comprehensive Plan. The CETT is also used to track and monitor the number of person trips withdrawn for new development for each CSA. To maintain the effectiveness of this tool, staff must maintain upkeep of arterial traffic counts, WTA transit ridership, completeness of sidewalks and bike lanes, and, where applicable, trails that serve a transportation function. Update arterial traffic counts citywide either in-house or through on-call contracts with traffic data firms. Traffic count data for is needed to inform the 2016 TRAM. Traffic counts are also used for grant applications, federal functional classification requests, transportation modeling, and the comprehensive plan update. Work hand-in-hand with WTA to update their strategic plan in 2015 in conjunction with the update to the Bellingham Comprehensive Plan. This will yield better transit data for the Multimodal Transportation Concurrency Program. 5) Monitor Multimodal Transportation Concurrency Methodology for Effectiveness Continue to publish TRAM and annually report observations of system effectiveness to the Planning Commission, Transportation Commission, and City Council. The methodology is relatively new and innovative in the transportation industry and continued monitoring and reporting is needed to assess long-term effectiveness in promoting infill development in Bellingham. Over time, staff anticipates that there will be a need for further refinements and adjustments to be made to support infill and multimodal policies. This is an on-going and annual procedure. All TRAC/TRAM documents are available at Transportation Report on Annual Mobility Page 13
, contiguous with the City of Bellingham corporate limits.")

:")
14 Chapter 3: Bellingham Transportation Benefit District No. 1 In July 2010, the Bellingham City Council created Transportation Benefit District Number 1 (TBD), contiguous with the City of Bellingham corporate limits. In November 2010, Bellingham voters approved a ballot measure in the general election that authorized the TBD to collect a two tenths of one percent sales tax within TBD boundaries (city limits) for a 10-year period to fund transportation infrastructure and transit service. The TBD revenue will expire in 2021, unless re-approved by voters in The TBD is governed by a Board of Directors, which is comprised of the current elected members of the Bellingham City Council The TBD began receiving sales tax receipts in July 2011 and the TBD Board directed that the TBD revenues be dedicated to the following activities in generally equal amounts (about 1/3 for each): Purchase of additional WTA transit bus service hours via contract between the City and WTA Enhance and improve pedestrian and bicycle transportation infrastructure Resurfacing streets to maintain the City of Bellingham's investment for all transportation users Figure 3.1 Allocation of Total TBD Revenues Transportation Report on Annual Mobility Page 14
15 Table 3.1 Transportation Benefit District #1 Finances Actual Actual Actual Budget Actual Budget Budget Revenues Total Sales Tax Receipts (.2%) $2,454,454 $4,350,591 $4,655,993 $4,600,000 $4,700,864 $4,600,000 $4,728,800 $25,490,702 Interest $1,947 $24,650 $28,068 $50,000 $27,747 $12,244 $12,244 $106,900 Intergovernmental Revenue-Grant $27,400 $436,471 $17,985 $481,856 Total Specific Revenue $2,456,401 $4,402,641 $5,120,532 $4,650,000 $4,746,596 $4,612,244 $4,741,044 $26,079,458 Expenditures Interfund Charges-Admin/Other $36,750 $33,765 $39,649 $43,878 $47,948 $59,653 $57,246 $275,011 5% reserve allocation $122,820 $87,180 $210,000 Total reduction in available cash flow $159,570 $120,945 $39,649 $43,878 $47,948 $59,653 $57,246 $485,011 Revenue/Reserves available for project expenditu $2,296,831 $4,281,696 $5,080,883 $4,606,122 $4,698,648 $4,552,591 $4,683,798 $25,594,447 Transit Contractual services-wta $485,703 $1,068,531 $1,353,497 $1,450,000 $1,346,099 $1,463,000 $1,463,000 $7,179,830 Transit capital projects- $47,500 $450,000 $250,000 $297,500 Total transit $485,703 $1,116,031 $1,353,497 $1,900,000 $1,596,099 $1,463,000 $1,463,000 $7,477,330 Re-paving projects Capital Projects $600,297 $1,070,279 $1,537,468 $1,540,000 $1,497,118 $1,580,000 $1,630,000 $7,915,162 Engineering $90,155 $320,958 $411,113 Projects total $600,297 $1,160,434 $1,858,426 $1,540,000 $1,497,118 $1,580,000 $1,630,000 $8,326,275 Non-motorized capital Capital Projects $390,296 $814,312 $1,010,186 $1,540,000 $1,703,637 $1,580,000 $1,630,000 $7,128,431 Projects total $390,296 $882,905 $1,221,070 $1,540,000 $1,703,637 $1,580,000 $1,630,000 $7,407,908 Total expenditures $1,476,296 $3,159,370 $4,432,993 $4,980,000 $4,796,854 $4,623,000 $4,723,000 $23,211, Transportation Report on Annual Mobility Page 15


16 TBD-Funded Transit Services In 2011, the Bellingham TBD Board of Directors signed an Interlocal Agreement with the Whatcom Transportation Authority for a 5-year period to purchase supplemental transit service in Bellingham. Initially, the TBD-funded transit service restored the Sunday transit bus service that had been cut by WTA in It has also extended evening transit service on some routes and funded an experimental transit route to see if a ridership base existed for commercial and industrial employers on the Waterfront. The TBD - WTA Interlocal Agreement expires in 2015 and the TBD Board will need to make some decisions regarding the TBD funding allocated to enhanced transit service in Bellingham. During 2014, WTA reported 257,664 fixed route boarding/trips and 9,517 paratransit trips on service the City of Bellingham purchased. Further information about WTA transit service throughout Bellingham is available in Chapter 7. TBD-Funded Street Resurfacing Over the past century, Bellingham has made a significant investment in providing a public street system throughout the City. Public streets have a functional lifespan that varies according to the amount of use that the street receives and, at some point, all public streets require maintenance, repair, and resurfacing. Traditional sources of funding for street construction and resurfacing, such as Street and Real Estate Excise Tax (REET) funds, have been significantly diminished through budgeting decisions. Since 2011, TBD revenue allocated to street resurfacing has helped to replace some of the Street and REET funding lost for street resurfacing projects. Approximately $1.4 million in TBD funds have been spent each year to help maintain the City's investment in arterial streets, providing mobility for all transportation users. When streets are resurfaced, pedestrian and bicycle facilities approved in the Pedestrian and Bicycle Master Plans are also installed, whenever possible, as reflected in Tables 3.3, 3.4, 3.5, and 3.6. In 2014 and 2015 Public Works prioritized resurfacing the following arterial streets: Table 3.2 Street Resurfacing Funded by TBD 2014 and 2015 Year Resurfaced Street From To 2014 Hawthorn Road 12th Street Fieldston Road 2014 Electric Avenue Ohio Street Portal Drive th Street Garden Street Douglas Avenue 2015 Alabama Street Cornwall Avenue St. Clair Street 2015 Kellogg Road Cordata Parkway Eliza Avenue 2015 Eliza Avenue Kellogg Road Westerly Road 2015 Transportation Report on Annual Mobility Page 16
 and recommended for construction by Public Works and the Transportation Commission.")

17 TBD-Funded Non-motorized Bicycle and Pedestrian Improvements The TBD Board of Directors annually approves TBD funding for a number of non-motorized transportation projects that have been approved in Bellingham's Pedestrian and Bicycle Master Plans (PMP and BMP) and recommended for construction by Public Works and the Transportation Commission. As shown in the tables below, since TBD revenue became available for the construction of non-motorized transportation improvements in 2011, Bellingham TBD funding has helped transportation planners and engineers to make significant progress in implementing the 343 improvement projects in the PMP and the 185 improvement projects in the BMP. In 2014, Bellingham transportation planners received TBD Board approval to set aside 10% of annual TBD revenue to use as local matching funds to leverage additional state and federal grant funding for pedestrian and bicycle projects, which will allow TBD funds to be maximized. Successful examples of using TBD funds to leverage additional state and federal grant funds for pedestrian and bicycle facilities include: 2012 Flashing Crosswalks at N. Samish/Abbott and N. Samish/Consolidation 2012 Resurfacing Indian Street to add uphill climbing bike lane and downhill shared lane 2012 Pedestrian improvements at Indian/Maple, Indian/Laurel, and Indian/Ivy 2013 Curb extensions and crosswalks at State/Laurel and new sidewalk on south side of Laurel from State to South Bay Trail 2013 Curb extensions and crosswalks at Lincoln/Potter and new sidewalk on north side of Gladstone from Puget to St. Paul 2015 Sidewalk reconstruction on the east side of Yew Street from Alabama to Texas 2015 New sidewalk on the WWU Lincoln Street Park-N-Ride from Maple to Byron 2016 (pending award by State legislature) New sidewalk on the east side of West Maplewood from Northwest to Alderwood 2015 Transportation Report on Annual Mobility Page 17
18 The TBD Board also approved a 2.5% annual TBD reserve for transportation planners to use in the design and preliminary engineering phases of pedestrian and bicycle projects which require further study before a specific capital improvement recommendation can be made to the Transportation Commission and the TBD Board. There are several pedestrian crossing improvements listed in the Pedestrian Master Plan and several important network links in the Bicycle Master Plan that will require further study by transportation planners before engineering and construction recommendations can be made. In November 2014, the TBD Board approved the Public Works and Transportation Commission recommendations for the following studies: 2015 Feasibility study for a yet-to-be-determined bicycle facility improvement on Holly Street from Ellis to Bay 2015 Parking survey on Pacific Street to determine feasibility of removing parking on one side of street to install bike lanes 2015 Parking survey on Orleans Street to determine feasibility of removing parking on one side of street to install bike lanes 2016 Feasibility study for a yet-to-be-determined bicycle facility improvement on Lakeway Drive from Ellis to Queen 2016 Feasibility study for a yet-to-be-determined pedestrian crossing improvement at the intersection of Barkley/Sussex As demonstrated in the tables below, Public Works has already accomplished a great deal in the three years that TBD funding has been available for bicycle, pedestrian, and street resurfacing projects, but there is much more work to be done. The TBD will continue to play a critical role in funding and completing Bellingham s PMP and BMP in the most expeditious manner possible. The $1.5 million revenue currently allocated for non-motorized transportation projects will not be enough to complete the 343 improvement projects in the PMP and the 185 improvement projects in the BMP. The planning level costs to complete the PMP are estimated to be $225 million over 20 years and the BMP cost estimates are over $25 million. Public Works transportation planners intend to accomplish a great deal more through the strategic efforts to capitalize on opportunities to link land use, development, and other infrastructure projects, use TBD funds for local match requirements to leverage larger state and federal grant funds, and by including pedestrian and bicycle improvements wherever possible in street resurfacing projects (see tables below) Transportation Report on Annual Mobility Page 18
19 Table 3.3. Bicycle Improvements Constructed With TBD Non-Motorized and Arterial Resurfacing Funds through 2014 Year Improvement Direction Location BMP Priority Parking Removed? Side Neighborhood 2011 Marked bike lanes East-West Lakeway Drive: Woburn to City limit n/a* Yes: Birch to City limit West Whatcom Falls 2011 Marked bike lanes East-West Birchwood Avenue: Meridian to Squalicum Pkwy n/a* No Cornwall Park 2012 Marked bike lanes North-South Northwest Avenue: Lottie to I-5 Tier 1* Yes: Lottie to McLeod West Dwtn/Ltr/Col/Birchwood 2013 Climbing/Shared Lane North-South Highland Drive: High Street to W. College Way n/a* No 2013 New Shoulders East-West Electric Avenue: Alabama to Ohio Tier 3 No Silver Beach 2014 Shared Lanes North-South Hawthorne: 12th Street to Fieldston Tier 3 No Edgemoor 2014 Shared Lanes North-South 14th Street: Edwards to Douglas Tier 3 No South Hill 2014 New Shoulders East-West Electric Avenue: Lakeway to Ohio Tier 3 No Whatcom Falls 2014 Marked bike lanes North-South 25th Street: Bill MacDonald to Douglas Tier 1* No Happy Valley/WWU *Project was planned or funded prior to 2014 BMP approval Table 3.4. Pedestrian Improvements Constructed With TBD Non-Motorized and Arterial Resurfacing Funds through 2014 Year Improvement Side(s) Location Sidewalk Crossing Neighborhood 2011 Sidewalk, Curb Extensions, Crosswalk Both Prospect Avenue: Lottie to Bay n/a n/a Downtown 2011 Sidewalk, Curb Extensions, Crosswalk South Birchwood/Meridian n/a n/a Birchwood 2011 Curb Extensions, Crosswalk Both Meridian/Connecticut n/a n/a Columbia/Cornwall Park 2011 Sidewalk, Curb Extensions, Crosswalk Both Electric/Birch/Portal Tier 1* Tier 1* Whatcom Falls 2011 Curb Extensions, Flashing Crosswalk Electric/Bloedel-Donovan Park Tier 1* Tier 1* Silver Beach 2012 Sidewalk, Curb Extensions, Crosswalk West Yew Street: Alabama to Texas/Yew Tier 1* Tier 1* Roosevelt 2012 Curb Extensions, Crosswalk Woburn/Texas Tier 1 Roosevelt 2012 Curb ramps, Flashing Crosswalk Alabama/St. Paul Tier 1* Roosevelt 2012 Curb Extensions, Crosswalk Alabama/Yew Tier 1* Roosevelt 2012 Curb ramps, Traffic Signal Woburn/Rimland (TBD + Private$) Tier 1* Barkley 2012 Curb ramps, Flashing Crosswalk Pine/Boulevard Tier 1* Sehome 2012 Curb ramps, extensions, and crosswalks Dupont/Elm/Northwest Tier 1* Dwtn/Ltr/Col/Birchwood 2013 Sidewalk Infill North Bill McDonald Pkwy: 35th to Birnham Wood Tier 1 n/a Sehome 2013 Sidewalk, Curb Extensions, Crosswalk South E. Maple/Cornwall Tier 1 Tier 2 Downtown 2013 Sidewalk, Curb Extensions, Crosswalk South State/E. Maple Tier 1* Downtown 2013 Curb Extensions, Crosswalk E. Illinois/James Tier 1* Sunnyland 2013 Crosswalk, Ped Refuge W. College Way/High Street (WWU) n/a WWU 2014 Sidewalks, Curb Extensions, Crosswalk Both 25th Street: Bill McDonald to Douglas/24th Tier 1 n/a Happy Valley 2014 Ped/Bike Bridge Reconstruction (Parks) Whatcom Creek Trail: Ellis to York n/a Downtown 2014 Sidewalk, Curb Extensions, Crosswalk South Hawthorn: 12th to Fieldston; Hawthorne/Bayside Tier 3 Tier 3 Edgemoor *Project planned/funded prior to 2012 PMP 2015 Transportation Report on Annual Mobility Page 19
20 Table 3.5. Bicycle Improvements to Be Constructed With TBD Non-Motorized and Arterial Resurfacing Funds through 2016 Year Improvement Direction Location BMP Priority Parking Removed? Side Neighborhood 2015 Climbing/Shared Lane East-West Chestnut Street: Bay to Roeder Tier 2 No Downtown 2015 Marked bike lanes North-South Eliza Avenue: Kellogg to Westerly Tier 1 No Cordata 2015 Marked bike lanes East-West Ohio Street: Grant to Cornwall Tier 1 Yes: Dean to Grant South Sunnyland/Downtown 2015 Bicycle Boulevard North-South Grant Street: Illinois to N. State Tier 2 No Sunnyland/Downtown 2015 Bicycle Boulevard North-South Ellis: Squalicum Pkwy to Ohio Tier 2 No Sunnyland/Downtown 2015 Bicycle Boulevard North-South Moore-Texas-Nevada Tier 2 No Roosevelt 2015 Bicycle Boulevard East-West Kentucky: Moore to Cornwall Tier 1 No Sunnyland/Downtown 2015 Bicycle Boulevard East-West E. Illinois Street: Valencia to Sunset Tier 1 No Roosevelt/Sunnyland 2015 Bicycle Boulevard North-South Michigan Street: E. Illinois to Texas Tier 2 No Roosevelt 2015 Climbing/Shared Lane North-South Lincoln: Lakeway to Meador Tier 1 No Puget 2015 Corridor Study East-West Holly Street: Ellis to Bay Tier 1 Unknown? Downtown 2016 Bicycle Boulevard East-West Alderwood Avenue: Northwest to W. Maplewood Tier 3 No Birchwood 2016 Marked bike lanes North-South W. Maplewood: Northwest to Alderwood Tier 1 No Birchwood 2016 Bicycle Boulevard East-West Texas Street: Michigan to Nevada Tier 1 No Roosevelt 2016 Bicycle Boulevard North-South Undine Street: Railroad Trail to Texas Tier 2 No Roosevelt 2016 Bicycle Boulevard North-South St. Paul Street: Railroad Trail to Texas Tier 2 No Roosevelt 2016 Bicycle Boulevard North-South Pacific Street: Alabama to E. Illinois Tier 3 No Roosevelt 2016 Marked bike lanes North-South Pacific Street: Alabama to Iowa Tier 3 Yes: Texas to Kentucky? Roosevelt 2016 Bicycle Boulevard North-South Orleans Street: Alabama to Texas Tier 2 No Roosevelt 2016 Marked bike lanes North-South Orleans Street: Alabama to Barkley Tier 2 Yes: Alabama to Barkley? Roosevelt 2016 Bicycle Boulevard North-South 24th Street: Old Fairhaven Pkwy to Douglas Tier 1 No Happy Valley 2016 Bicycle Boulevard East-West Mill Avenue: 12th Street to 24th Street Tier 1 No Fairhaven/Happy Valley 2016 Unknown Bike Facility East-West Holly Street: Ellis to Bay Tier 1 Unknown? Downtown 2016 Corridor Study East-West Lakeway Drive: Ellis to Queen Tier 1 No Puget/York/Downtown 2015 Transportation Report on Annual Mobility Page 20
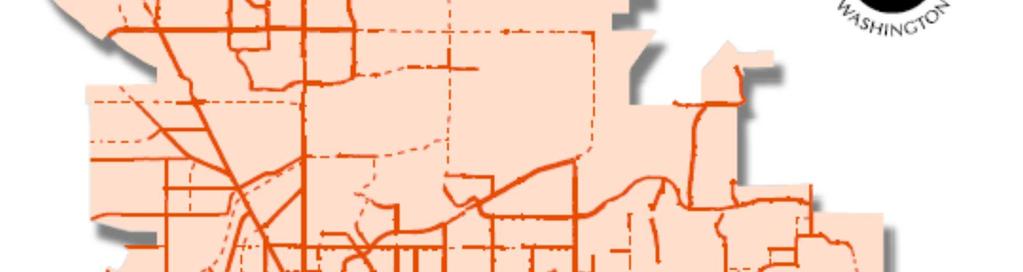
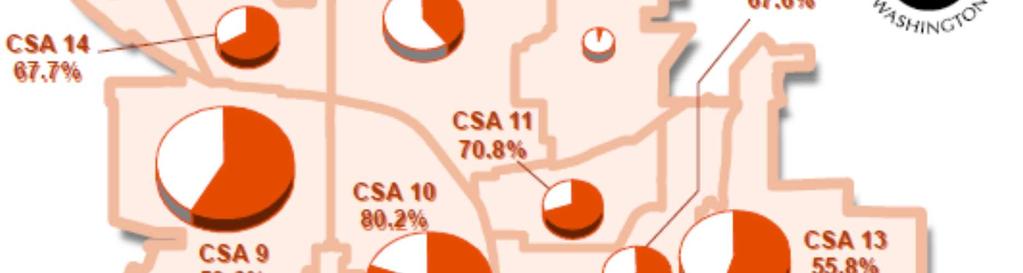
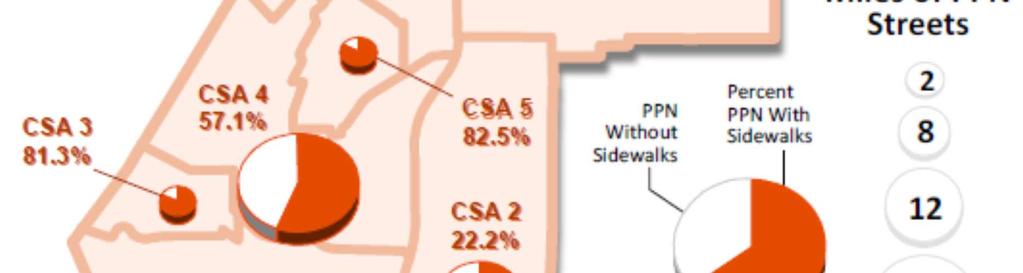
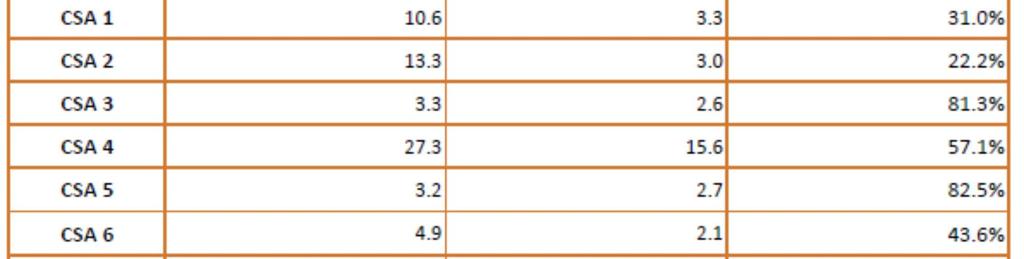
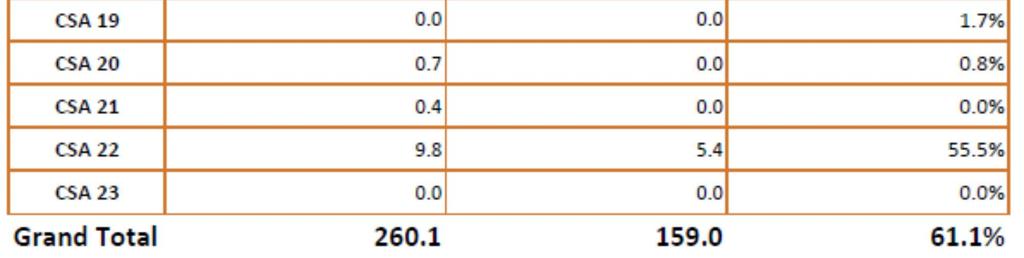
21 Chapter 4: Primary Pedestrian Network Completeness Since 2006, pedestrian improvements have been listed in the Transportation Element of the Bellingham Comprehensive Plan. Bellingham's Pedestrian Master Plan (PMP) was approved by City Council in August 2012 and the 2013 Transportation Report on Annual Concurrency (TRAC) first reported the completeness of the Primary Pedestrian Network by Concurrency Service Area (CSA). As shown in Table 4.3, below, in 2015 the citywide Primary Pedestrian Network is 61% complete. The degree of completeness varies in different parts of the City, as shown in Figures 4.1, 4.2, and Table 4.3 The 2012 PMP is available at and includes 343 sidewalk and crossing improvement projects that are estimated to cost about $225 million over 20 years. Since 2011, most sidewalk and crosswalk projects have been constructed with Transportation Benefit District (TBD) funding, but Bellingham street standards require private developers to construct ADAcompliant sidewalks for any new development on public streets and state and federal grant funding agencies require sidewalks to be included on all arterial street improvement projects. Public Works staff tries to leverage local funding to receive outside funding whenever possible. Some pedestrian projects are funded by the Washington State Transportation Improvement Board (TIB) Sidewalk Program, some are funded by state and federal Safe Route to School Programs, and some are funded with federal funding administered by Washington State, such as the Surface Transportation Program (STP), Transportation Alternatives Program (TAP), or the Highway Safety Improvement Program (HSIP). Occasionally, pedestrian projects can be added to other grant-funded work (storm water, Parks, etc.) that is being conducted. In addition, some pedestrian improvements are funded with a combination of the above as well as funding from other public agencies and/or private development interests. In addition to the TBD-funded pedestrian improvements listed in Chapter 3, Public Works has constructed several pedestrian improvements to the Primary Pedestrian Network since 2011 with funding from non-tbd sources, as listed in Table 4.1, below. In 2015 and 2016, the pedestrian improvements listed in Table 4.2 below are expected to be constructed by Public Works and private development interests. There could be many more pedestrian improvements constructed by private developers throughout Bellingham in 2015 and 2016 and, if so, then those will be accounted for in the 2015 or 2016 Transportation Reports on Annual Mobility. In 2015, Bellingham Public Works will also resurface the following arterial streets and install ADAcompliant curb ramps, crosswalks, and sidewalks, where needed: Alabama Street from Cornwall Avenue to St. Claire Street Kellogg Road from Cordata Parkway to Eliza Avenue Eliza Avenue from Kellogg Road to Westerly Road 2015 Transportation Report on Annual Mobility Page 21
22 Table 4.1. Pedestrian Improvements Constructed With Street Fund, State & Federal Grants, Partnerships, or Private Development through 2014 Year Improvement Side(s) Location Sidewalk Crossing Neighborhood 2011 Sidewalk, Curb Extensions, Crosswalk South Ellis-Kansas-Meador n/a Sunnyland/York/Dwtn 2012 Multimodal Roundabout Northwest/McLeod/I-5 Tier 1* Birchwood 2012 Sidewalk Infill North McLeod Road: Northwest to E. Rusley n/a n/a Birchwood 2012 Curb ramps, Ped refuge, Flashing Crosswalk N. Samish/Abbott Tier 1* Sehome 2013 Curb ramps, Ped refuge, Flashing Crosswalk N. Samish/Consolidation Tier 1* Sehome 2012 Curb Extensions, Crosswalks Indian/Maple; Indian/Laurel; Indian/Ivy Tier 1* Sehome 2013 Sidewalk, Crosswalk West Eliza Ave: Matanuska to Bellis Fair Pkwy n/a Meridian 2013 Multimodal Roundabout State/Forest/Wharf/Blvd Tier 3 Downtown 2013 Sidewalk, Crosswalks, Ped Refuges North West Bakerview: Arctic to Bennett n/a n/a Meridian 2013 Curb ramps, Ped refuge, Crosswalk West College Way/High Street (WWU) n/a WWU 2014 Sidewalk, Crosswalk East James Street: Orchard to Sunset Pond Park Tier 3 King Mountain *Project planned/funded prior to 2012 PMP Table 4.2. Pedestrian Improvements Constructed With Street Fund, State & Federal Grants, Partnerships, or Private Development and 2016 Year Improvement Side(s) Location Sidewalk Crossing Neighborhood 2015 Sidewalk East Yew Street: Alabama to Texas Tier 2 Roosevelt 2015 Sidewalk, Curb Extensions, Crosswalk South State/Laurel to Laurel/South Bay Trail Tier 3 Tier 3 Downtown 2015 Curb Extensions, Crosswalks Lincoln/Potter n/a Puget 2015 Sidewalk, Crosswalk North Gladstone Street: Puget to St. Paul Tier 2 Puget 2015 Sidewalk, Crosswalk East Lincoln Street: Byron to Maple Tier 2 Puget 2015 Sidewalk, Crosswalk (Private Development) West Lincoln Street: Maple to Fred Meyer Tier 1 Puget 2015 Crosswalks Chestnut/Bay (Bridge Rehabilitation) n/a Downtown 2015 Flashing Crosswalk (Yellow) Alabama/Ellis Tier 1 Sunnyland 2015 Ped Hybrid Beacon (Red) Alabama/Moore PMP Roosevelt 2015 Ped Hybrid Beacon (Red) Alabama/St. Paul PMP Roosevelt 2015 Ped Hybrid Beacon (Red) Alabama/Undine PMP Roosevelt 2015 Ped Hybrid Beacon (Red) Alabama/Michigan PMP Roosevelt 2016 Sidewalk (IF State grant is awarded) East W. Maplewood Avenue: Northwest to Alderwood Tier 1 Birchwood 2016 Sidewalks, Crosswalks (Private Development) Arctic Avenue: W. Bakerview to Mahogany Tier 3 Meridian 2016 Sidewalks, Traffic Signals, Crosswalks Mahogany Avenue: Northwest to Pacific Highway Tier 3 Meridian 2016 Sidewalk, Crosswalks (Private Development) Pacific Highway: W. Bakerview to Mahogany Tier 3 Meridian 2016 Sidewalk, Traffic Signals, Crosswalks Granary-Bloedel: Roeder to Cornwall Tier 3 Waterfront 2015 Transportation Report on Annual Mobility Page 22

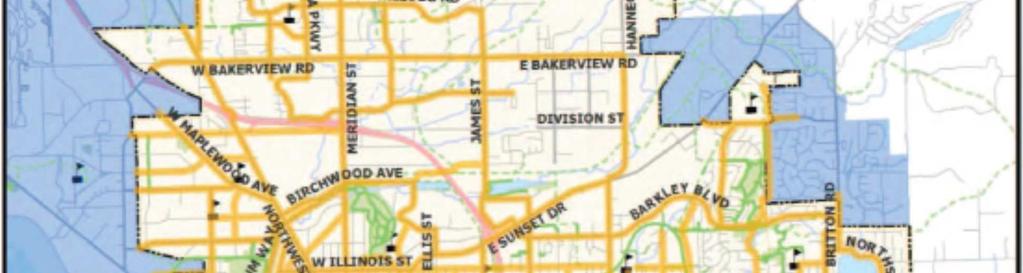
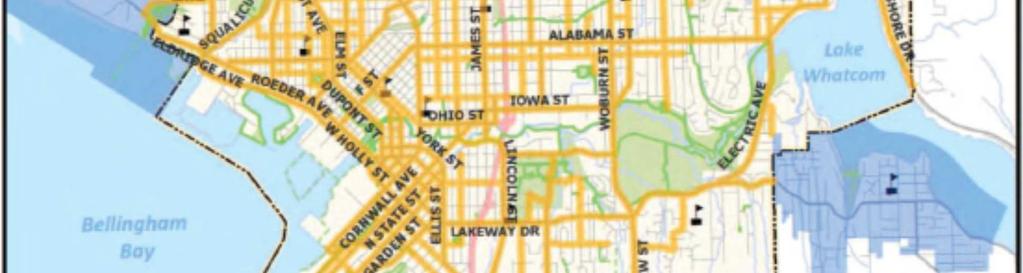
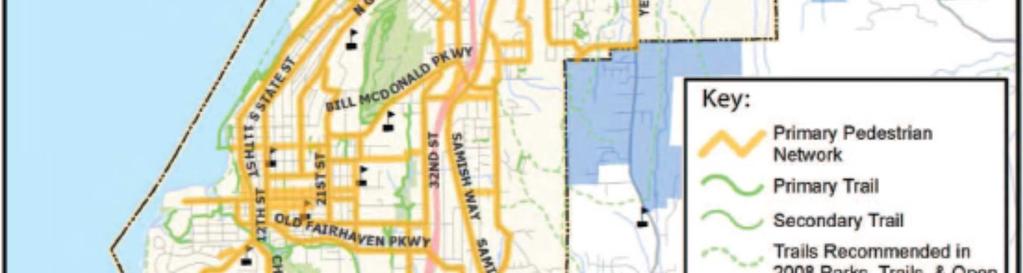
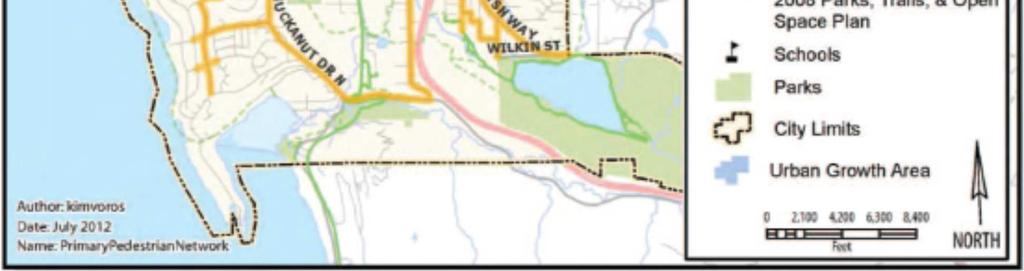
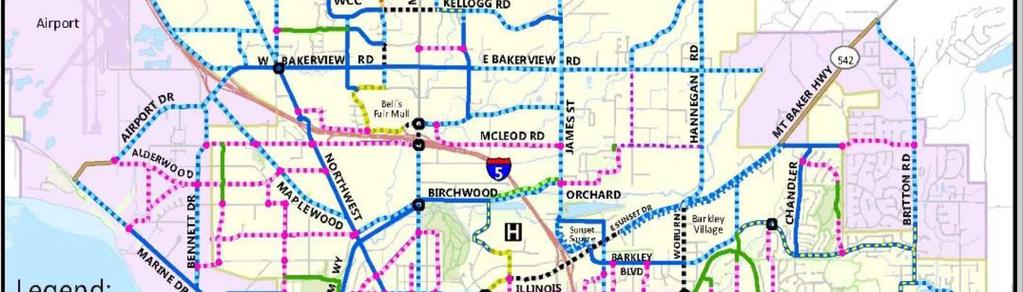
23 Figure 4.1 Bellingham's Citywide Primary Pedestrian Network 2015 Transportation Report on Annual Mobility Page 23


24 Figure Transportation Report on Annual Mobility Page 24


25 Figure Transportation Report on Annual Mobility Page 25

26 Table Transportation Report on Annual Mobility Page 26
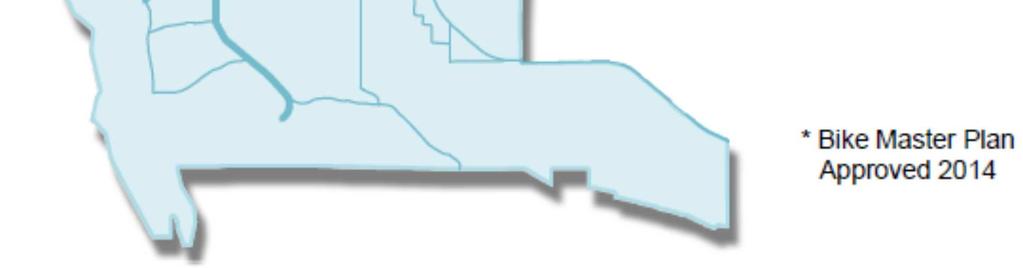
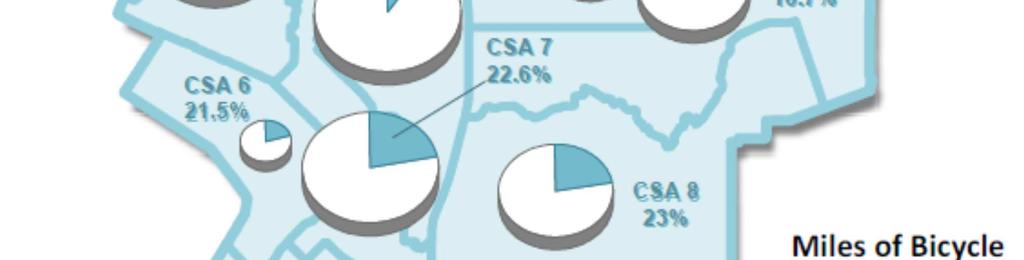
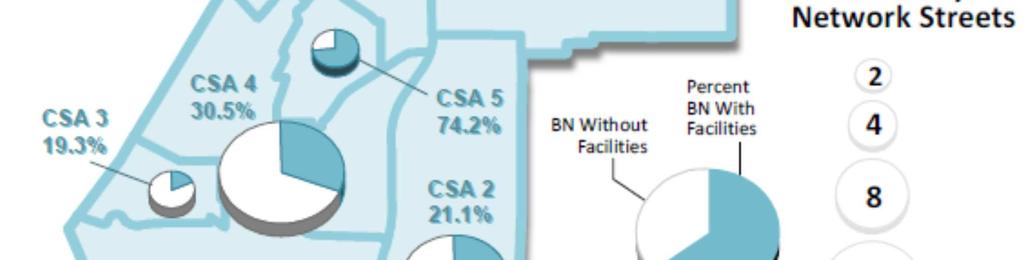
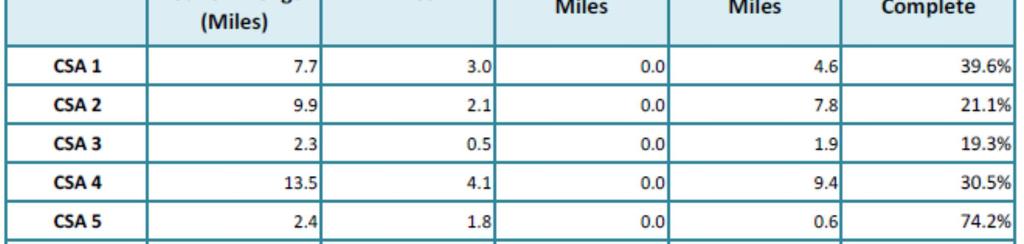
27 Chapter 5: Primary Bicycle Network Completeness Since 2006, bicycle facility improvements have been listed in the Transportation Element of the Bellingham Comprehensive Plan. Bellingham's Bicycle Master Plan (BMP) was approved by City Council in October 2014 and the 2015 TRAM provides the first report on the completeness of the Primary Bicycle Network by Concurrency Service Area (CSA). As shown in Table 5.3., below, in 2015 the citywide Primary Bicycle Network is only 22% complete because the planned network was expanded from 107 mile to 160 miles with the approval of the BMP. The degree of network completeness varies in different parts of the City, as shown in Figures 5.1, 5.2, and Table 5.3. The BMP is available at and includes 185 bicycle facility improvement projects that are estimated to cost about $25 million over 20 years. Since 2011, most bicycle improvement projects listed in the Transportation Element of the Comprehensive Plan have been constructed with TBD funding. Bellingham street standards require private developers to construct bike lanes on arterial streets and state and federal grant funding agencies require bike lanes to be included on all arterial street improvement projects. Public Works staff tries to leverage local funding for additional outside funding whenever possible. Some bicycle improvement projects are funded by the Washington State Transportation Improvement Board (TIB) Urban Arterial Program as larger street projects, some are funded by state and federal Safe Route to School Programs, and some are funded with federal funding administered by Washington State, such as the Surface Transportation Program (STP), Transportation Alternatives Program (TAP), or the Highway Safety Improvement Program (HSIP). In addition, some bicycle improvements are funded with a combination of the above as well as funding from other public agencies and/or private development interests. In addition to the TBD-funded bicycle improvements listed in Chapter 3, Public Works has constructed several bicycle improvements to the Primary Bicycle Network since Prior to the 2014 approval of the Bicycle Master Plan, these bicycle improvements were listed in the Transportation Element of the Bellingham Comprehensive Plan with funding from non-tbd sources, as listed below. In 2015 and 2016, the bicycle facility improvements listed below are expected to be constructed by Public Works and private development interests. There could be many more bicycle improvements constructed by private developers throughout Bellingham in 2015 and If so, then those will be accounted for in the 2015 or 2016 Transportation Report on Annual Mobility Transportation Report on Annual Mobility Page 27
28 Table 5.1. Bicycle Improvements Constructed With State & Federal Grants, Partnerships, or Private Development through 2014 Year Improvement Direction Location BMP Priority Parking Removed? Side Neighborhood 2011 Marked bike lanes East-West Meador Avenue: N. State to James n/a* No Sunnyland/Downtown 2012 Climbing/Shared Lane North-South Indian Street: Chestnut to Oak (WWU) n/a* No Dwtn/Sehome/WWU 2012 Multimodal Roundabout Northwest/McLeod n/a* No Birchwood 2013 Multimodal Roundabout State/Forest/Wharf/Boulevard n/a* No Downtown 2014 Marked bike lanes North-South James Street: Orchard to Sunset Pond Park Tier 1* No King Mountain *Project was planned or funded prior to 2014 BMP approval Table 5.2. Bicycle Improvements to be Constructed With State & Federal Grants, Partnerships, or Private Development and 2016 Year Improvement Direction Location BMP Priority Parking Removed? Side Neighborhood 2015 Marked bike lanes East-West Alabama Street: Cornwall to Iron Tier 2 No Sunnyland 2015 Bicycle Boulevard East-West LaurelStreet: State to Railroad Tier 2 No Downtown 2016 Marked bike lanes North-South Arctic Avenue: W. Bakerview to Mahogany Tier 3 No Meridian 2016 Marked bike lanes East-West Mahogany Avenue: Northwest to Pacific Highway Tier 3 No Meridian 2016 Marked bike lanes North-South Pacific Highway: W. Bakerview to Mahogany Tier 3 No Meridian 2016 Marked bike lanes East-West Granary-Bloedel: Roeder to Cornwall Tier 3 No Waterfront 2015 Transportation Report on Annual Mobility Page 28

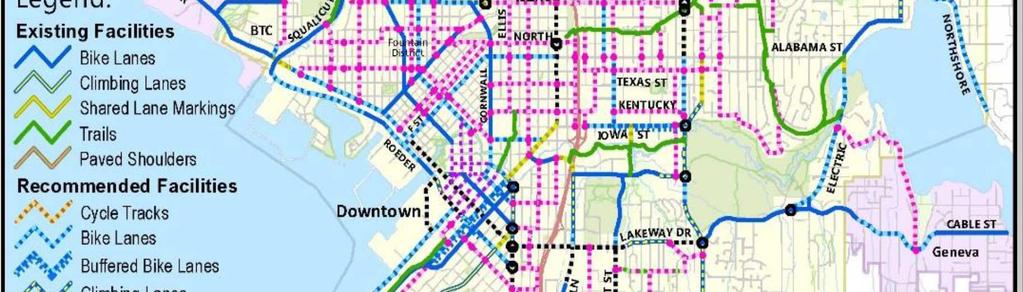
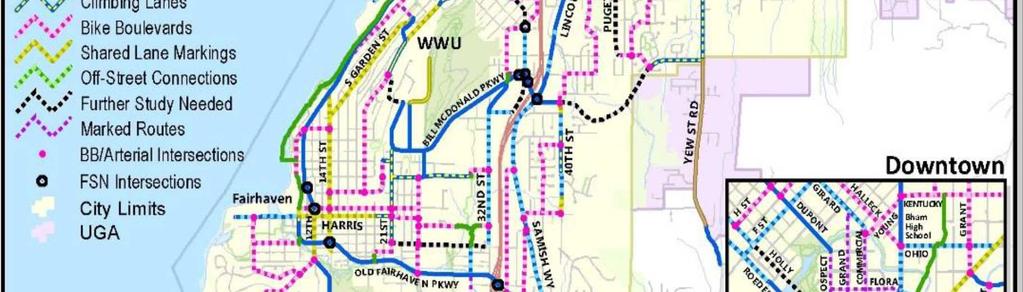
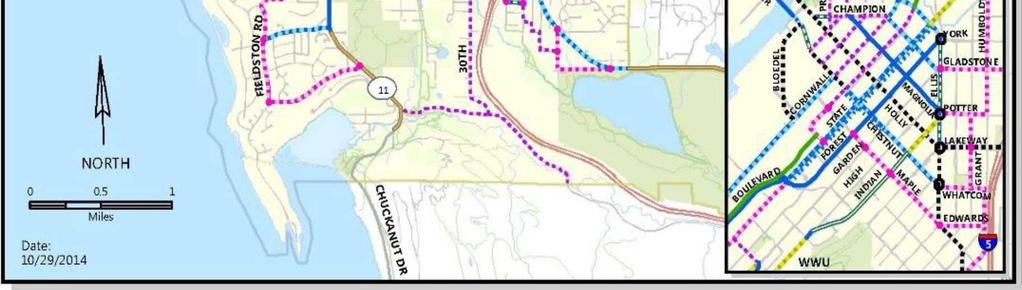
29 Figure 5.1 Bellingham's Citywide Primary Bicycle Network 2015 Transportation Report on Annual Mobility Page 29


30 Figure Transportation Report on Annual Mobility Page 30


31 Figure Transportation Report on Annual Mobility Page 31

32 Table Transportation Report on Annual Mobility Page 32
33 Chapter 6: Off-Street Greenways Multiuse Recreation Trails (Provide less direct and mostly unpaved alternate routes than on-street transportation network) In 2009, Bellingham transportation planners amended the multimodal transportation concurrency ordinance to make several changes to Urban Village Concurrency Service Areas and also incorporated a select inventory of bike-friendly multiuse recreational trails. The inclusion of the bike-friendly multiuse recreational trails was not to declare them as an integral part of the citywide transportation network, but rather to acknowledge that some bicyclists do use these recreational trails as indirect and/or alternative routes to the on-street Primary Bicycle Network identified in the 2014 Bicycle Master Plan (BMP). Most of these recreational trails are not suitable for road/racing bicycles because they are primarily crushed limestone gravel surfaces, vary in width and steepness, and often do not connect to major destinations. These bicycle-friendly trail routes were identified and field verified for ride-ability over many years by individual members of City and County Bicycle and Pedestrian Advisory Committees, the Mt. Baker Bicycle Club, as well as City staff and Parks and Recreation Advisory Board and Greenways Committee members involved in an effort called Green Streets. Technical data came from the City s GIS layers for trails and bicycle routes, digital air photos, and digital terrain models. The criteria that staff used to add select bike-friendly multiuse recreational trails to the list of BMC Definitions Specific to Concurrency Management included: 1.) Off-street multiuse trails that can serve a clear transportation function, in addition to the recreational benefits that they provide, and a safe alternative to unmarked bicycle routes on arterial streets 2.) Prepared gravel/crushed rock surface trails, or smooth dirt with adequate drainage, and smooth even surface facilitating safe travel by cyclists. Trails with stairs, large roots, rocky sections, offcamber cross-sections, or areas with persistent standing water/puddles are generally not included 3.) Trails that average at least 5-feet, but preferably 8-feet, in width to facilitate safe bi-directional passage of cyclists and pedestrians 4.) Trails with slopes/grades of generally less than 6% average with maximum grades of generally less than 12%. The bike-friendly multiuse recreational trails identified in the multimodal transportation concurrency inventory generally adhere to the specified criteria above. Some exceptions exist where lack of an alternative on-street route and the need for a critical connection dictates use of trail network sections that may have sub-standard surfaces, narrow widths, or steep grades. Bike-friendly multiuse recreational trails are credited person trips to each Concurrency Service Area based on each comparative 1% of the total planned Primary Bicycle Network identified in the 2014 BMP. Ten (10) rather than 20 person trip credits are awarded for each 1% of the total planned on-street Primary Bicycle Network in recognition that not all bicyclists will be able to use off-street gravel trails as alternatives to on-street bike routes. It should be noted, however, that several regional multiuse trails, such as the Whatcom Creek Trail, Railroad Trail, and Bay to Baker Trail are included in the citywide bicycle network, see Figure Transportation Report on Annual Mobility Page 33


34 Figure Transportation Report on Annual Mobility Page 34

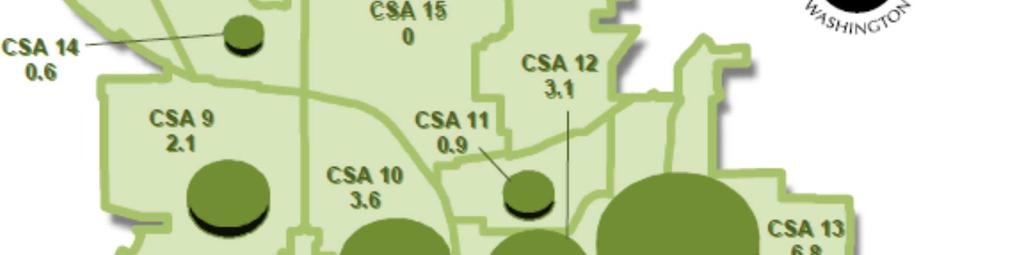
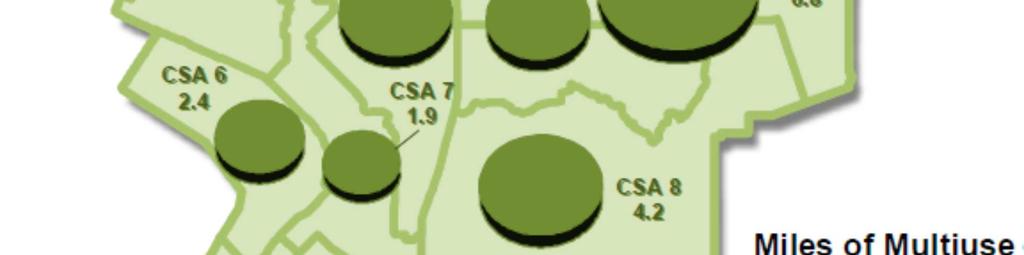
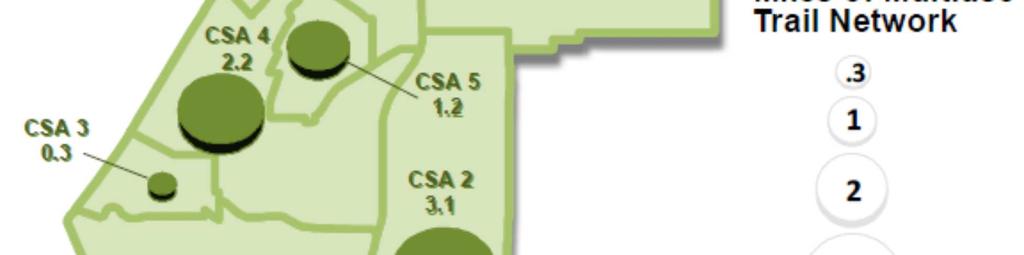
35 Figure Transportation Report on Annual Mobility Page 35

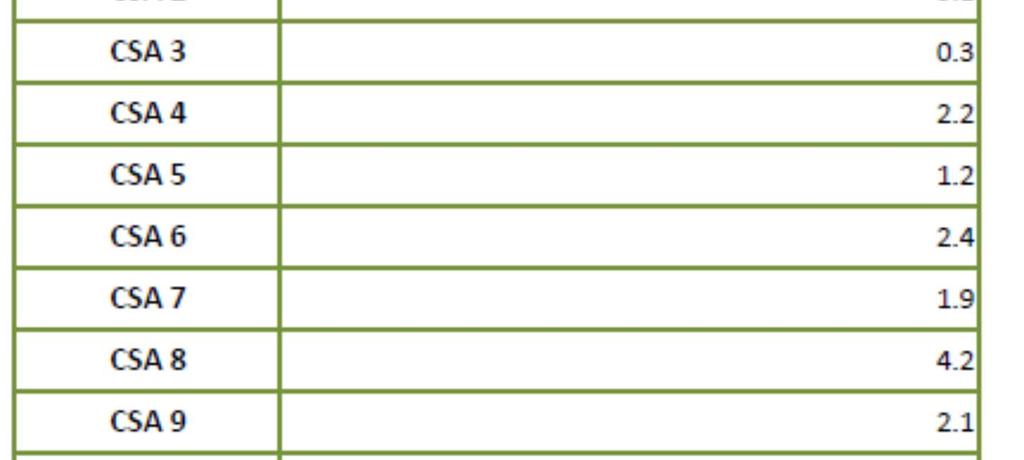
36 Table Transportation Report on Annual Mobility Page 36
37 Chapter 7: Whatcom Transportation Authority Primary Transit Network Whatcom Transportation Authority (WTA) provides public fixed route transit bus service, Paratransit bus service, and a vanpool program available to the public and employers. WTA is funded by sales tax revenue generated in a Public Transit Benefit Area (PTBA) that is contiguous with the boundaries of Whatcom County. WTA serves the City of Bellingham as well as the smaller towns and communities of Ferndale, Lynden, Blaine and Birch Bay, Lummi Nation, Sudden Valley, Kendall, Everson, Nooksack and Sumas. WTA also cooperates with Skagit Transit in neighboring Skagit County, to provide service between Bellingham and Mount Vernon. More information is available on the WTA web site at Fixed Route Transit Bus Service WTA s fixed route transit bus service features 30 routes, including a network of four high-frequency corridors within Bellingham. Service is offered seven days a week, with more limited service on Saturdays, Sundays and evenings. Between 2002 and 2014, WTA ridership increased by 86% In 2008, we were recognized by the Federal Transit Administration for achieving the highest annual ridership increase in the nation In 2014, WTA provided 4.97 million fixed route transit bus boardings, or approximately 17,000 fixed route transit bus boardings per weekday WTA plays a major role transporting students and employees to and from Western Washington University (WWU), Whatcom Community College, Bellingham Technical College, and Northwest Indian College, as well as Bellingham middle schools and high schools WWU students voted to self-fund transit passes for every student through their tuition costs and in 2014, WWU students comprised 38% of WTA's overall fixed route ridership Paratransit Services WTA's Paratransit service area and span of service mirrors the WTA fixed route transit bus service and area. WTA provides an average of 600 Paratransit trips per weekday. Fleet and Facilities WTA s fleet includes 60 full-size buses (including eight hybrid electric buses), 37 Paratransit minibuses, and 39 vanpool vans. WTA operates four transit centers: Bellingham Station, Cordata Station (in North Bellingham), Ferndale Station and Lynden Station. Integrated Transit and Transportation Planning The City of Bellingham works directly with WTA on both land use and transportation issues and all of Bellingham's Urban Villages are served with high-frequency 15-minute transit service. City transportation planners worked directly with WTA in the development of the 2004 WTA Strategic Plan and WTA staff worked directly with City transportation planners in the development of the 2006 Transportation and Land Use Elements of the Bellingham Comprehensive Plan so that City and WTA plans are fully integrated with one another. The City and WTA are working directly with each other once again as both agencies update the WTA Strategic Plan and the Transportation Element in Transportation Report on Annual Mobility Page 37


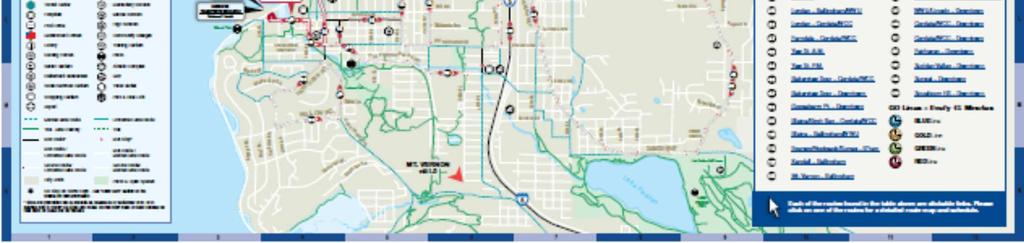
38 Figure 7.1 WTA Transit Routes in Bellingham Transportation Report on Annual Mobility Page 38


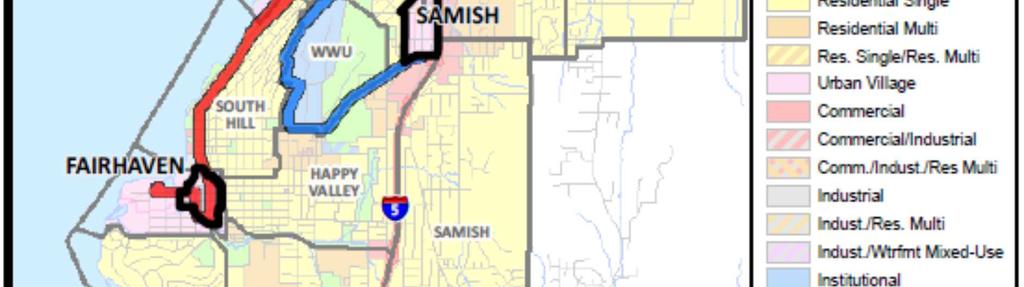
39 Figure 7.2 Urban Villages Served by WTA High-Frequency Transit 2015 Transportation Report on Annual Mobility Page 39
40 Chapter 8: Automobile and Freight Truck Arterial Networks Arterial Streets and Traffic Signals Arterial streets and traffic signals are available and provide benefit to all users (pedestrian, bicycle, transit, automobile, and freight truck), but previous chapters have discussed pedestrian, bicycle, and transit networks and this chapter focuses on arterial streets and infrastructure as it relates to automobile and freight trucks use. The Transportation Element of the Bellingham Comprehensive Plan is available at and describes the existing and planned arterial street network needed to support motorized transportation, such as transit busses, private automobiles, and freight trucks. Arterial streets and traffic signal devices are depicted on Figure 8.1. Bellingham's arterial street network is locally classified into Principle, Secondary, and Collector arterials, with 2015 lane mile totals as follows: Principal Arterial: Major regional transportation corridors and State and federal highways that provide connections into Bellingham from other cities, Whatcom and Skagit Counties, and Canada = 105 lane miles. Secondary Arterial: Major local transportation corridors that provide connections within and between different parts of Bellingham = lane miles. Collector Arterial: Local transportation corridors that provide connections from neighborhood residential streets to secondary and principal arterial streets = 57.2 lane miles. In 2015, Bellingham's arterial street network has 173 traffic signal devices, as follows: 118 Intersection Traffic Signals 27 Pedestrian-Activated Flashing Crosswalks 26 Automated School Zone Flashers 2 Variable Message Radar Speed Signs Designated Freight Truck Routes Bellingham has classified some arterial streets and all State and federal highways as Designated Truck Routes, as depicted on Figure 8.2. The City encourages freight shipping companies to direct their drivers to primarily use the designated freight truck routes, but freight trucks cannot be prevented from using public streets for deliveries unless there are weight restrictions on bridges or other public safety access restrictions Transportation Report on Annual Mobility Page 40

41 Figure 8.1 Bellingham's Arterial Street Network 2015 Transportation Report on Annual Mobility Page 41

42 Figure 8.2 Bellingham Designated Truck Route Network.. > z 4 Z! 12 ~ " Truck Routes 9AKEIMEW RD.. " EXIT 25< t6wast -... Arrows show traffic flow. Legend: Truck Roule$ (BMC t1.$3. tj0) /'..,/ Tno<l Rou... /VTnaR..- UfttodUM /'../... $ IGTE: AH t*.., hon...,,.... lrudl ~ routtttu+ptslt tl ~Of... 12tll S!tMorilJ9.. 0 UlO!M W UllG AB '"' l«jrth AUth~ <JI> ~te: a.n1012 Namr: Truc:kRaut eas:) Transportation Report on Annual Mobility Page 42
43 Chapter 9: Waterfront District Biennial Monitoring Program In 2010, transportation planners created CSA #6 for the Waterfront District in preparation for the adoption of a Waterfront District Master Plan. In 2015, CSA #6 has one of the 1,740 PTA with no credits given for pedestrian facilities, bicycle lanes, or transit services, but 860 credits provided for multiuse trails. Cornwall Avenue has continuous sidewalks on both sides between Wharf Street and West Laurel Street and from Maple to Chestnut, but lack of sidewalk on either side of the Cornwall Avenue Bridge creates a major barrier to pedestrian travel between downtown and the Waterfront. Wharf Street is a steep and narrow street without sidewalks or bicycle lanes and construction of either will require major excavation of the hillside, construction of retaining walls, and significant environmental impact mitigation. WTA transit service does not exist for the Waterfront. WTA does not currently have plans to serve the Waterfront, and it will be a very long time before fixed route transit service becomes a viable option to serve the Waterfront District. Additional person trip credits will not be awarded until new arterials, sidewalks, and bicycle lanes are constructed to increase the PTA to serve new Waterfront development. Additional person trip credits will also be awarded if and when fixed route WTA transit service becomes available to the public in the Waterfront. In December 2013, the City of Bellingham and the Port of Bellingham adopted the Bellingham Waterfront District Master Plan to guide the redevelopment of over 200 acres of industrial waterfront land into a vibrant, new neighborhood filled with a mix of industrial, commercial, institutional, residential, and public uses. The Bellingham Waterfront District Master Plan and Interlocal Agreement between the City and Port of Bellingham is available at Section 20 of the Interlocal Agreement for Facilities within the Waterfront District requires the Port of Bellingham to provide the City with a Biennial Monitoring Program report by December 31, 2015, which will document transportation mobility into and out of the Waterfront District on arterial streets for pedestrians, bicyclists, transit busses, automobiles, and freight trucks. The 2016 TRAM will include the Port's Biennial Monitoring Program report. This section reserved for 2015 Waterfront District Biennial Monitoring Program Required by the Port of Bellingham 2015 Transportation Report on Annual Mobility Page 43

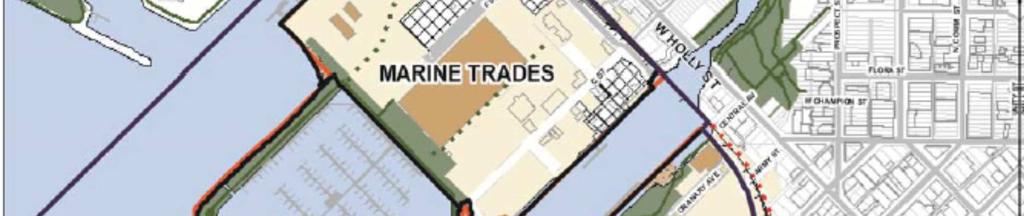

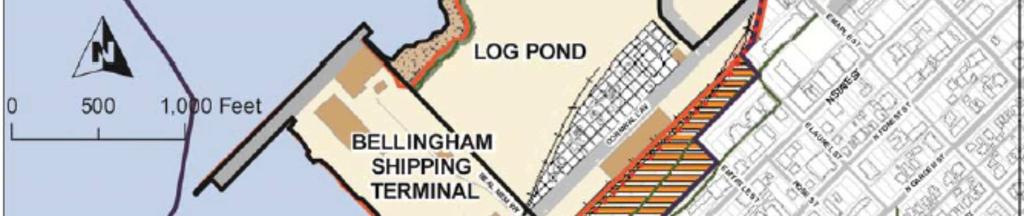
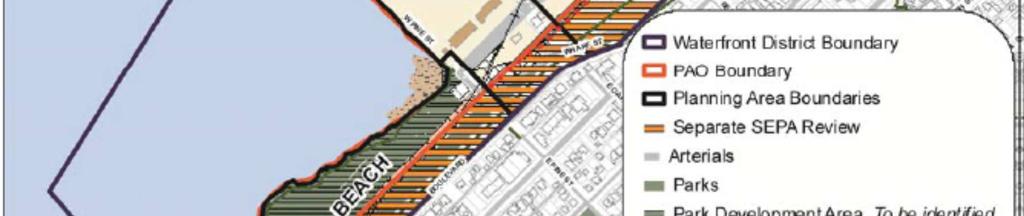
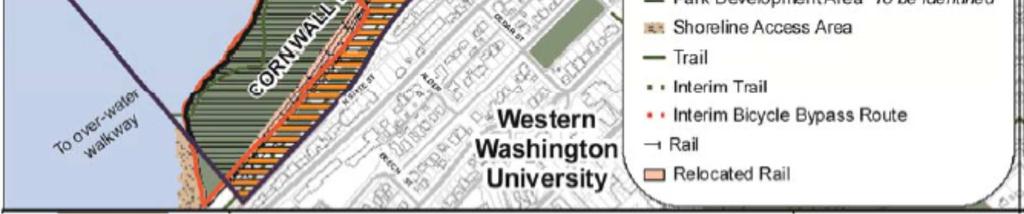
44 Figure 9.1 Bellingham Waterfront District Boundaries 2015 Transportation Report on Annual Mobility Page 44
Transportation Report on Annual Mobility
 Transportation Report on Annual Mobility Published annually in support of: Comprehensive Plan Transportation Element Multimodal Transportation Concurrency Program Transportation Benefit District No. 1
Transportation Report on Annual Mobility
 Transportation Report on Annual Mobility Published annually in support of Bellingham s: Comprehensive Plan Transportation Element; Multimodal Transportation Concurrency Program; Complete Networks Policies;
Supplemental Information for DRAFT TIP
 City of Bellingham Public Works Department Supplemental Information for DRAFT 2016-2021 TIP The following pages are intended to provide supplemental information and explanation of the rationale for projects
Changing the Climate of Mobility: Bellingham s Multimodal Transportation Networks
 1 Changing the Climate of Mobility: Bellingham s Multimodal Transportation Networks Presented by: Chris Comeau, Transportation Planner, Public Works Climate Action Task Force March 6, 2019 2 Bellingham
Samish-Maple-Ellis Corridor Pedestrian & Bicycle Safety Improvements. Bellingham City Council March 26, 2018
 1 Samish-Maple-Ellis Corridor Pedestrian & Bicycle Safety Improvements Bellingham City Council March 26, 2018 2009 Samish Way Urban Village Street Plans Multiple Plans Adopted by City Council 2009 Samish
Multi-Modal Transportation Improvement Projects Identified by Neighborhood for the 20-year Planning Period
 2011 CITY CENTER MASTER PLAN UPDATE ADOPTED TRANSPORTATION ELEMENT PROJECT LIST FOR THE CBD, WATERFRONT, AND YORK, SEHOME, AND LETTERED STREETS NEIGHBORHOODS IMMEDIATELY ADJACENT TO CITY CENTER TRANSPORTATION
2018 Pedestrian and Bicycle and Safe Routes to School Application for Funding Page 1 of 31
 2018 Pedestrian and Bicycle and Safe Routes to School Application for Funding Page 1 of 31 2018 Pedestrian and Bicycle and Safe Routes to School Application for Funding Part 1: General Information Funding
Appendix B: Prioritized Projects List
 Appendix B: Prioritized Projects List The Bicycle Master Plan process utilized a data-driven prioritization methodology to evaluate projects according to key variables that are known to influence bicycling
Six-Year ( ) Transportation Improvement Program (TIP)
 Transportation Improvement Program (TIP)") Six-Year (2017-2022) Transportation Improvement Program (TIP) Kelli Linville, Mayor Ted Carlson, Public Works Director City Council Members Pinky Vargas - 4th Ward, Council President Roxanne Murphy - At
Six-Year (2017-2022) Transportation Improvement Program (TIP) Kelli Linville, Mayor Ted Carlson, Public Works Director City Council Members Pinky Vargas - 4th Ward, Council President Roxanne Murphy - At
Alabama Street Corridor. Road Diet Feasibility Study & Safety Improvements
 Alabama Street Corridor Road Diet Feasibility Study & Safety Improvements Chris Comeau, AICP, Transportation Planner Bellingham Public Works (360) 778-7946 10/28/2011 Bellingham adhered to the following
Chapter 3: Bicycle Network Recommendations
 Chapter 3: Bicycle Network Recommendations Chapter 3 presents the recommended network of on-street bicycle facilities that will help Bellingham meet the goals of this Plan. It describes the methodology
Six-Year ( ) Transportation Improvement Program (TIP)
 Transportation Improvement Program (TIP)") Six-Year (2018-2023) Transportation Improvement Program (TIP) Kelli Linville, Mayor Ted Carlson, Public Works Director City Council Members Michael Lilliquist 6th Ward, Council President Roxanne Murphy
Six-Year (2018-2023) Transportation Improvement Program (TIP) Kelli Linville, Mayor Ted Carlson, Public Works Director City Council Members Michael Lilliquist 6th Ward, Council President Roxanne Murphy
CITY OF COCOA BEACH 2025 COMPREHENSIVE PLAN. Section VIII Mobility Element Goals, Objectives, and Policies
 CITY OF COCOA BEACH 2025 COMPREHENSIVE PLAN Section VIII Mobility Element Goals, Objectives, and Policies Adopted August 6, 2015 by Ordinance No. 1591 VIII MOBILITY ELEMENT Table of Contents Page Number
Chapter 2. Bellingham Bicycle Master Plan Chapter 2: Policies and Actions
 Chapter 2 Bellingham Bicycle Master Plan Chapter 2: Policies and Actions Chapter 2: Policies and Actions The Bicycle Master Plan provides a road map for making bicycling in Bellingham a viable transportation
Proposed. City of Grand Junction Complete Streets Policy. Exhibit 10
 Proposed City of Grand Junction Complete Streets Policy Exhibit 10 1 City of Grand Junction Complete Streets Policy Vision: The Complete Streets Vision is to develop a safe, efficient, and reliable travel
In November 2015, the City of Bellingham, WA, USA completed $4.3 million in safety
 CASE STUDY C-Curb Your Enthusiasm: By Chris Comeau, AICP-CTP and Chris Breiland In November 2015, the City of Bellingham, WA, USA completed $4.3 million in safety improvements on Alabama Street using the
Bellingham Comprehensive Plan Multimodal Transportation Chapter
 Bellingham Comprehensive Plan 2016 I. Introduction Transportation planning is intricately tied to land use, the pattern of development, and the local economy that evolves as an urban area grows. Bellingham's
ACTIVE TRANSPORTATION/NONMOTORIZED TRANSPORTATION
 ACTIVE TRANSPORTATION/NONMOTORIZED TRANSPORTATION BACKGROUND Active transportation, also known as nonmotorized transportation, is increasingly recognized as an important consideration when planning and
May 12, 2016 Metro Potential Ballot Measure Issue Brief: Local Return
 Summary: Local return is an important revenue source for cities to maintain their local transportation infrastructure. Most cities use their local return to operate small bus systems and repave streets,
Bicycle Master Plan Goals, Strategies, and Policies
 Bicycle Master Plan Goals, Strategies, and Policies Mobilizing 5 This chapter outlines the overarching goals, action statements, and action items Long Beach will take in order to achieve its vision of
PEDESTRIAN ACTION PLAN
 ATTACHMENT 2 CITY OF SANTA MONICA PEDESTRIAN ACTION PLAN CITY OF SANTA MONICA PEDESTRIAN ACTION PLAN This page intentionally left blank EXECUTIVE SUMMARY CHAPTER 1 EXECUTIVE SUMMARY Setting the Stage
Non-Motorized Transportation 7-1
 Non-Motorized Transportation 7-1 Transportation facilities no longer mean just accommodating a vehicle powered by a combustion engine. Pedestrian and non-motorized facilities are important modes of travel
Corpus Christi Metropolitan Transportation Plan Fiscal Year Introduction:
 Introduction: The Safe, Accountable, Flexible, Efficient Transportation Equity Act: A Legacy for Users (SAFETEA-LU) has continued the efforts started through the Intermodal Surface Transportation Efficiency
Basalt Creek Transportation Refinement Plan Recommendations
 Basalt Creek Transportation Refinement Plan Recommendations Introduction The Basalt Creek transportation planning effort analyzed future transportation conditions and evaluated alternative strategies for
Bicycle and Pedestrian Plans and Improvements
 Bicycle and Pedestrian Plans and Improvements Presented to the City Council By Randle Harwood, Planning and Development, and Richard Zavala, Parks and Community Services September 24, 2013 Purpose Review
Exhibit 1 PLANNING COMMISSION AGENDA ITEM
 Exhibit 1 PLANNING COMMISSION AGENDA ITEM Project Name: Grand Junction Circulation Plan Grand Junction Complete Streets Policy Applicant: City of Grand Junction Representative: David Thornton Address:
City of Gainesville Transportation/Roadway Needs PROJECT SUMMARY
 A1 Roadway Resurfacing $23,846,000 TYPE: Preservation of existing system Roadway resurfacing A2 Signal Replacement $6,000,000 TYPE: Preservation of existing system Replace traffic signals. B1 W 6th St
Solana Beach Comprehensive Active Transportation Strategy (CATS)
") Solana Beach Comprehensive Active Transportation Strategy (CATS) 3.0 Goals & Policies The Solana Beach CATS goals and objectives outlined below were largely drawn from the Solana Beach Circulation Element
Solana Beach Comprehensive Active Transportation Strategy (CATS) 3.0 Goals & Policies The Solana Beach CATS goals and objectives outlined below were largely drawn from the Solana Beach Circulation Element
Clackamas County Comprehensive Plan
 ROADWAYS The County s road system permits the movement of goods and people between communities and regions, using any of a variety of modes of travel. Roads provide access to virtually all property. They
Bellingham Bicycle Master Plan Chapter 1: Introduction
 Chapter 1 Bellingham Bicycle Master Plan Chapter 1: Introduction Chapter 1: Introduction Bellingham is a city of distinct neighborhoods, revered institutions, innovative businesses, and passionate community
C C C
 C-012-001 Thank you for your support for the creation of new public space and nonmotorized access between downtown and the waterfront through the Overlook Walk, the East-West Connections, and the Promenade.
Chapter 1: Introduction
 Chapter 1: Introduction Bellingham is a city of distinct neighborhoods, revered institutions, innovative businesses, and passionate community members. It prides itself on supporting a diverse mix of transportation
Chapter 3: Bicycle Network Recommendations
 Chapter 3 Bellingham Bicycle Master Plan Chapter 3: Bicycle Network Recommendations Chapter 3: Bicycle Network Recommendations Chapter 3 presents the recommended network of on-street bicycle facilities
UNIVERSITY RIDGE STUDENT HOUSING
 Transportation Impact Analysis UNIVERSITY RIDGE STUDENT HOUSING Prepared for: Ronald T. Jepson & Associates, PS April 213 Prepared by: 1173 118 th Avenue NE, Suite 6 Kirkland, WA 9834-712 Phone: 425-821-3665
Chapter 7. Transportation. Transportation Road Network Plan Transit Cyclists Pedestrians Multi-Use and Equestrian Trails
 Chapter 7 Transportation Transportation Road Network Plan Transit Cyclists Pedestrians Multi-Use and Equestrian Trails 7.1 TRANSPORTATION BACKGROUND The District of Maple Ridge faces a number of unique
IMPLEMENTATION STRATEGIES
 GEORGETOWN SIDEWALK MASTER PLAN 34% of funding is dedicated to Downtown Overlay District sidewalks 28% of funding is recommended within 1/4 mile of Southwestern University 26% of funding is recommended
ADA Transition Plan. City of Gainesville FY19-FY28. Date: November 5, Prepared by: City Of Gainesville Department of Mobility
 ADA Transition Plan FY19-FY28 Date: November 5, 2018 Prepared by: City Of Gainesville Department of Mobility 1.0 INTRODUCTION 1.1 BACKGROUND The federal statute known as the Americans with Disabilities
Chapter 5 Future Transportation
 Chapter 5 Future Transportation The Future Land Use Plan identifies the desired land use designations. The land uses desired for Crozet depend, in large part, on the success of the transportation system,
SANTA CLARA COUNTYWIDE BICYCLE PLAN August 2008
 SANTA CLARA COUNTYWIDE BICYCLE PLAN August 2008 To assist VTA and Member Agencies in the planning, development and programming of bicycle improvements in Santa Clara County. Vision Statement To establish,
Environment and Public Works Committee Presentation
 Mixed Use Centers Complete Streets Guidelines Project Environment and Public Works Committee Presentation December 10, 2008 Project Objectives: Conduct an inter-departmental and agency process to study
CITY OF BURIEN, WASHINGTON MEMORANDUM
 DATE: November 2, 2011 CITY OF BURIEN, WASHINGTON MEMORANDUM TO: FROM: SUBJECT: Burien Planning Commission Charles W. Chip Davis, AICP, Senior Planner Recommendation on Revised Comprehensive Plan Transportation
2014 Bellingham Bicycle Master Plan
 2014 Bellingham Bicycle Master Plan Acknowledgements The City of Bellingham is honored by the commitment of the numerous community members and bicycling enthusiasts who participated in the development
APPENDIX D: 2012 EXISTING PEDESTRIAN RELATED POLICY
 APPENDIX D: 2012 EXISTING PEDESTRIAN RELATED POLICY BELLINGHAM PEDESTRIAN MASTER PLAN City of Bellingham WASHINGTON Table 1 Existing Multi Modal Policies AGENCY US Department of U.S. Department of in
TRANSPORTATION TRAINING TOPICS. April 6, 2010
 TRANSPORTATION TRAINING TOPICS April 6, 2010 Roles of Transportation Providers Context and Policy Makers Division of Transportation and Traffic Other City Operations Other Transportation Operators CMA
RESOLUTION NO ?? A RESOLUTION OF THE CITY OF NEPTUNE BEACH ADOPTING A COMPLETE STREETS POLICY
 RESOLUTION NO. 2018-?? A RESOLUTION OF THE CITY OF NEPTUNE BEACH ADOPTING A COMPLETE STREETS POLICY WHEREAS, safe, convenient, and accessible transportation for all users is a priority of the City of Neptune
Madison Urban Area and Dane County. Bicycle Transportation Plan Summary. September Introduction. Bicycle Plan Scope and Planning Process
 Bicycle Transportation Plan Summary Madison Urban Area and Dane County Introduction September 2000 Bicycling is an important mode of transportation in the Madison urban area and countywide that is available
GOAL 2A: ESTABLISH AND MAINTAIN A SAFE, CONVENIENT, AND EFFICIENT MULTI-MODAL TRANSPORTATION SYSTEM TO MOVE PEOPLE AND GOODS THROUGHOUT THE CITY.
 2. TRANSPORTATION ELEMENT The purpose of this element is to assist in establishing an adequate transportation system within the City and to plan for future motorized and non-motorized traffic circulation
This page intentionally left blank.
 This page intentionally left blank. COMMUNITY Glenpool Community Overview Glenpool Glenpool is a city of nearly 12,000 residents located in Tulsa County southwest of Tulsa and Jenks. The city is growing
Promoting Active Communities Award Application
 Promoting Active Communities Award Application Michigan s Promoting Active Communities (PAC) assessment and award application is available for online completion and submission at www.mihealthtools.org/communities.
City of Atlanta-MARTA Sales Tax Referendum Draft Project List. Atlanta City Council Work Session May 19, 2016
 1 City of Atlanta-MARTA Sales Tax Referendum Draft Project List Atlanta City Council Work Session May 19, 2016 2 SB 369 - MARTA Sales tax for up to 0.50% is allowed in the City of Atlanta for MARTA Purpose
TRANSPORTATION & MOBILITY
 TRANSPORTATION & MOBILITY ROADWAY SYSTEM There are approximately 40 miles of roadways in Manitou Springs. For planning purposes, roadways are typically assigned a functional classification which defines
Michael Parmer, Management Aide, City Manager's Office
 P139 STAFF REPORT f CITY NL- NAGER' S OFFICE RANCHO Date: C;UCAMONGA To: From: Subject: Mayor and Members of the City Council John R. Gillison, City Manager Michael Parmer, Management Aide, City Manager's
Thank you for this opportunity to discuss with you how we can work together to make our streets more complete.
 Thank you for this opportunity to discuss with you how we can work together to make our streets more complete. 1 2 3 Thank you for this opportunity to discuss with you how we can work together to make
City Council Agenda Item #6-A CITY OF ALAMEDA Memorandum. To: Honorable Mayor and Members of the City Council. John A. Russo City Manager
 CITY OF ALAMEDA Memorandum To: From: Honorable Mayor and Members of the City Council John A. Russo City Manager Date: January 14, 2013 Re: Adopt a Resolution Approving a Complete Streets Policy, in Accordance
TRANSIT & NON-MOTORIZED PLAN DRAFT FINAL REPORT Butte County Association of Governments
 1 INTRODUCTION Maintaining a high quality of life is the essence of this plan for transit and non-motorized transportation in Butte County. Curbing greenhouse gas emissions (GHG) by reducing congestion,
COMPLETE STREETS A STEP FORWARD ITE District 10/FSITE Annual Meeting November 3, 2015
 COMPLETE STREETS A STEP FORWARD 2015 ITE District 10/FSITE Annual Meeting November 3, 2015 About Lakeland Incorporated: 1885 Population: 100,728 Area: Approx. 75 sq. mi Major Employers: Publix, Lakeland
MOUNTAIN HOUSE SPECIFIC PLAN I 9.1 INTRODUCTION ASSUMPTIONS TRANSPORTATION FACILITIES TRANSPORTATION IMPROVEMENTS PHASING 9.
 CHAPTER NINE: TRANSPORTATION AND CIRCULATION 9.1 INTRODUCTION 9.1 9.2 ASSUMPTIONS 9.1 9.3 TRANSPORTATION FACILITIES 9.1 9.4 TRANSPORTATION IMPROVEMENTS PHASING 9.3 LIST OF FIGURES LIST OF TABLES Figure
 MEMORANDUM - CITY OF PASADENA Department Of Transportation DATE: OCTOBER 21, 2008 TO: ENVIRONMENTAL ADVISORY COMMISSION FROM: ~ FRED C. DOCK, DIRECTOR OF TRANSPORTATION SUBJECT: UPDATE ON DEPT. OF TRANSPORTATION
CHAPTER 1 INTRODUCTION
 CHAPTER 1 INTRODUCTION Chapter Table of Contents THE 2017 HOUSTON BIKE PLAN 1-1 HOUSTON BIKEWAYS PROGRAM 1-2 HISTORY OF BICYCLE PLANNING IN HOUSTON 1-3 BICYCLE LEVEL OF COMFORT 1-3 EXISTING PLANS, PROGRAMS
Bicycle and Pedestrian Chapter TPP Update Overview. TAB September 20, 2017
 Bicycle and Pedestrian Chapter TPP Update Overview TAB September 20, 2017 Bicycling & Walking in the Twin Cities Where are we now? The Bike-Pedestrian system Current trends New developments Where are we
Route 7 Corridor Study
 Route 7 Corridor Study Executive Summary Study Area The following report analyzes a segment of the Virginia State Route 7 corridor. The corridor study area, spanning over 5 miles in length, is a multi
CITY OF VAUGHAN EXTRACT FROM COUNCIL MEETING MINUTES OF OCTOBER 30, 2012
 CITY OF VAUGHAN EXTRACT FROM COUNCIL MEETING MINUTES OF OCTOBER 30, 2012 Item 31, Report No. 39, of the Committee of the Whole, which was adopted without amendment by the Council of the City of Vaughan
Agenda. Overview PRINCE GEORGE S PLAZA METRO AREA PEDESTRIAN PLAN
 PRINCE GEORGE S PLAZA METRO AREA PEDESTRIAN PLAN May 28, 2008 Agenda Welcome and introductions Project overview and issue identification Planning context and strengths Design challenges and initial recommendations
Living Streets Policy
 Living Streets Policy Introduction Living streets balance the needs of motorists, bicyclists, pedestrians and transit riders in ways that promote safety and convenience, enhance community identity, create
12 RECOMMENDATIONS Road Improvements. Short Term (generally the next five years)
") 12 RECOMMENDATIONS Recommendations are based on the technical analysis of existing and future road and active transportation conditions, the results of the review of existing City policies and public feedback.
12 RECOMMENDATIONS Recommendations are based on the technical analysis of existing and future road and active transportation conditions, the results of the review of existing City policies and public feedback.
Circulation in Elk Grove includes: Motor vehicles, including cars and trucks
 Circulation, as it is used in this General Plan, refers to the many ways people and goods move from place to place in Elk Grove and the region. Circulation in Elk Grove includes: Motor vehicles, including
SUMMARY OF TRANSPORTATION INVESTMENTS
 Santa Cruz County 2016 Measure D: Transportation Improvement Expenditure Plan - Approved by over 2/3 of Santa Cruz County voters on November 8, 2016 - Overview Measure D, the 2016 Transportation Improvement
BIKE PLAN CONTENTS GATEWAY
 CONTENTS Acknowledgments...vii Great Rivers Greenway District Board of Directors... vii Great Rivers Greenway District Staff... vii Project Consultants... vii Committees... viii Citizens Advisory Committee
In station areas, new pedestrian links can increase network connectivity and provide direct access to stations.
 The Last Mile Planning for Pedestrians Planning around stations will put pedestrians first. Making walking to stations safe and easy is important; walking will be a part of every rapid transit Accessible
2045 Long Range Transportation Plan. Summary of Draft
 2045 Long Range Transportation Plan Summary of Draft Fredericksburg Area Metropolitan Planning Organization The George Washington Region includes the City of Fredericksburg and the counties of Caroline,
Orange County s Transportation Planning and Multimodal Corridor Plan
 Orange County Transportation Planning Division Orange County s Transportation Planning and Multimodal Corridor Plan Presentation to UCF LIFE November 11, 2014 Alissa Barber Torres, Ph.D., AICP, PLS Presentation
APPROVE A RESOLUTION ADOPTING A COMPLETE STREETS POLICY
 STAFF REPORT MEETING DATE: September 13, 2016 TO: FROM: City Council Bob Brown, Community Development Director Russ Thompson, Public Works Director Patrick Filipelli, Management Analyst 922 Machin Avenue
Tulsa Metropolitan Area LONG RANGE TRANSPORTATION PLAN
 Tulsa Metropolitan Area LONG RANGE TRANSPORTATION PLAN Indian Nations Council of Governments August 2005 CONTACTING INCOG In developing the Destination 2030 Long Range Transportation Plan, INCOG s Transportation
Multimodal Evaluation at the City of Redmond
 How Did Redmond Get There? 2005 Transportation Master Plan (TMP) A plan that supports and enables land use vision Implemented Annual Mobility Report Card TMP Update identifies key strategies, outcomes
2025 Comprehensive Plan for the City of Temple Terrace Florida. Mobility Element. Adopted by City Council June 30, 2009
 2025 Comprehensive Plan for the City of Temple Terrace Florida Mobility Element Adopted by City Council June 30, 2009 Effective Date September 22, 2009 GOAL 2: To protect and promote the quality of life
Engineering - Bicycle and Pedestrian
 Capital Improvement Plan Project Summary # Bikeways Program 781,000 860,000 900,000 933,000 933,000 933,000 # Cannonball Path 1,200,000-780,000 - - - # Capital City Trail - 70,000 - - 910,000 - # Goodman
Moving Beyond the Automobile
 Page 1 of 16 Case Study Moving Beyond the Automobile Multi-modal Transportation Planning in Bellingham, Washington By Chris Comeau, AICP This case study examines Bellingham, Washington's evolution from
CITY OF BLOOMINGTON COMPLETE STREETS POLICY
 CITY OF BLOOMINGTON COMPLETE STREETS POLICY POLICY OBJECTIVE: The City of Bloomington will enhance safety, mobility, accessibility and convenience for transportation network users of all ages and abilities,
West Dimond Blvd Upgrade Jodhpur Street to Sand Lake Road
 West Dimond Blvd Jodhpur St to Sand Lake CSS Transportation Project Summary Municipality of Anchorage Project # 05 005 Project Manager: John Smith, P.E. (MOA PM&E) Project Administrator: Julie Makela,
4. ENVIRONMENTAL IMPACT ANALYSIS 9. TRANSPORTATION AND TRAFFIC
 4. ENVIRONMENTAL IMPACT ANALYSIS 9. TRANSPORTATION AND TRAFFIC 4.9.1 INTRODUCTION The following section addresses the Proposed Project s impact on transportation and traffic based on the Traffic Study
ACTIVE TRANSPORTATION
 ACTIVE TRANSPORTATION Mobility 2040 Supported Goals Improve the availability of transportation options for people and goods. Support travel efficiency measures and system enhancements targeted at congestion
Pedestrian, Bicycle and Traffic Calming Strategic Implementation Plan. January 18, 2011
 Pedestrian, Bicycle and Traffic Calming Strategic Implementation Plan January 18, 2011 Tonight s Agenda Receive update on project Provide feedback on two policy issues Complete Streets Policy Project Prioritization
This page intentionally left blank.
 This page intentionally left blank. COMMUNITY Coweta Community Overview Coweta Coweta, a residential community located in Wagoner County, is a suburb of Tulsa situated southeast of the metropolitan area
CHAPTER 7.0 IMPLEMENTATION
 CHAPTER 7.0 IMPLEMENTATION Achieving the vision of the Better Streets Plan will rely on the ability to effectively fund, build and maintain improvements, and to sustain improvements over time. CHAPTER
POLICY: TRAFFIC CALMING
 2006 MAY REFERENCE: COUNCIL APPROVED BY COUNCIL MAY 23, 2006 CITY OPERATIONS - NO. 608 POLICY: TRAFFIC CALMING A. All requests for traffic calming within the City shall be considered in accordance with
FROM: CITY MANAGER DEPARTMENT: PLANNING AND COMMUNITY ENVIRONMENT DATE: OCTOBER 4, 2004 CMR:432:04
 TO: HONORABLE CITY COUNCIL FROM: CITY MANAGER DEPARTMENT: PLANNING AND COMMUNITY ENVIRONMENT DATE: OCTOBER 4, 2004 CMR:432:04 SUBJECT: FINANCE COMMITTEE RECOMMENDATION TO ADOPT TRANSPORTATION STRATEGIC
5. Automobile Circulation, Wayfinding and Signage
 5. Automobile Circulation, Wayfinding and Signage Policy: The City Center should have a balanced, safe, and interconnected circulation system that provides expanded travel opportunities for transit, pedestrian,
TRANSPORTATION BENEFIT DISTRICT NO. 1 MINUTES OF THE BOARD OF DIRECTORS MEETING
 TRANSPORTATION BENEFIT DISTRICT NO. 1 MINUTES OF THE BOARD OF DIRECTORS MEETING MONDAY, MARCH 28, 2011, 1:00 PM CITY COUNCIL CHAMBERS 210 LOTTIE STREET BELLINGHAM TRANSPORTATION BENEFIT DISTRICT No. 1
The Bike Buzz in Richland. November 2017 Carl Berkowitz
 The Bike Buzz in Richland November 2017 Carl Berkowitz Richland has been growing by leaps and bounds with lots of new homes and roads throughout the community. Recognizing all the growth in the Queensgate
Mobility Plan Status Report 2012 Average Annual Daily Traffic
 Mobility Plan Status Report 2012 Average Annual Daily Traffic Gainesville Metropolitan Area Congestion Management Process January 22, 2014 Metropolitan Transportation Planning Organization for the Gainesville
MEASURE B AND MEASURE BB Annual Program Compliance Report Reporting Fiscal Year AGENCY CONTACT INFORMATION
 MEASURE B AND MEASURE BB Annual Program Compliance Report Reporting Fiscal Year 2016-2017 AGENCY CONTACT INFORMATION Agency Name: City of Livermore Date: 12/4/2017 Primary Point of Contact Name: Debbie
City of Novi Non-Motorized Master Plan 2011 Executive Summary
 City of Novi Non-Motorized Master Plan 2011 Executive Summary Prepared by: February 28, 2011 Why Plan? Encouraging healthy, active lifestyles through pathway and sidewalk connectivity has been a focus
2. TRANSPORTATION ELEMENT.
 2. TRANSPORTATION ELEMENT. The purpose of this element is to assist in establishing an adequate transportation system within the City and to plan for future motorized and non-motorized traffic circulation
City of Redmond Transportation Improvement Program Adopted: September 16, 2014 Table of Contents
 City of Redmond 2015-2012 Transportation Improvement Program Adopted: September 16, 2014 Table of Contents 1. What is the Six-Year Transportation Improvement Program (TIP)?... 1 2. What is included in
MOBILITY WORKSHOP. Joint City Council and Transportation Commission May 5, 2014
 MOBILITY WORKSHOP Joint City Council and Transportation Commission May 5, 2014 Review of General Plan M-1 Develop world-class transit system M-3 Maintain/enhance pedestrian-oriented City M-4 Create comprehensive
Chapter 9: Pedestrians and Bicyclists
 Chapter 9: Pedestrians and Bicyclists Walking and bicycling are essential modes of transportation. These modes allow people to travel without contributing to congestion and air pollution, to access other
DALLAS MIDTOWN REDEVELOPMENT PLAN FOCUS NORTH TEXAS Peer Chacko, AICP, Assistant Director, City of Dallas
 DALLAS MIDTOWN REDEVELOPMENT PLAN FOCUS NORTH TEXAS 2014 Peer Chacko, AICP, Assistant Director, City of Dallas Dallas Midtown: Strategic growth area Future transit node 2 Peterson Road Study Area Galleria
Goal 3: Foster an environment of partnerships and collaboration to connect our communities and regions to one another.
 Non-Motorized Transportation Plan (NMTP) Draft Vision, Goal and,, Tri-County Regional Planning Commission (TCRPC) Purpose The purpose of the Tri-County Regional Planning Commission (TCRPC) Non-Motorized
Complete Streets Successes, Opportunities, and Challenges
 Complete Streets Successes, Opportunities, and Challenges Juliet Walker, Transportation Planner, City of Portsmouth Rob Houseman, Director of Planning and Development, Town of Wolfeboro Chris Parker, Director
City of Hamilton s Transportation Master Plan (TMP) Public Consultation 3 December 2015
 Public Consultation 3 December 2015") City of Hamilton s Transportation Master Plan (TMP) Public Consultation 3 December 2015 McPhail Transportation Planning Services Ltd. AGENDA 6:00 7:00 pm Viewing Boards / Q & A with the Team 7:00 7:50
City of Hamilton s Transportation Master Plan (TMP) Public Consultation 3 December 2015 McPhail Transportation Planning Services Ltd. AGENDA 6:00 7:00 pm Viewing Boards / Q & A with the Team 7:00 7:50