2008 HUMBOLDT COUNTY REGIONAL TRANSPORTATION PLAN
|
|
|
- Jason Harrington
- 5 years ago
- Views:
Transcription


1 2008 HUMBOLDT COUNTY REGIONAL TRANSPORTATION PLAN Amended January 17, 2013 Humboldt County Association of Governments
 444-8208 hcaog@pacbell.")
2 2008 Humboldt County Regional Transportation Plan Amended January 17, 2013 Prepared for: Humboldt County Association of Governments 427 F Street, Suite 220 Eureka, CA (707) hcaog@pacbell.net Prepared by: th Street, Suite 200 Arcata, CA 95521
3 This document printed on 100% post-consumer recycled paper
4 2008 Humboldt County Regional Transportation Plan Table of Contents Executive Summary Overview of Regional Transportation Plan Organization... ES-1 Highway and Roadway Transportation System... EC-2 Public Transit and Paratransit Services... EC-3 Bicycle and Pedestrian Service System... ES-4 Aviation System... ES-5 Goods Movement... ES-5 Tribal Transportation... ES-6 Community Input... ES-7 Introduction Regional Transportation Planning Agency... I-1 Regional Setting... I-3 Demographic and Economic Projections... I-5 Land Use and Transportation... I-15 Blueprint Planning... I-16 California Transportation Plan... I-17 California Wildlife Action Plan... I-17 Environmental Compliance... I-17 Plan Purpose and Assumptions... I-18 RTP Goal and Guiding Policies... I-21 References... I-23 HR Highway and Roadway Transportation System Element System Description... HR-1 Needs Assessment... HR-4 Guiding Goals, Policies and Objectives... HR-8 Action Plan: Proposed Projects... HR-10 Financing... HR-20 Performance Measures... HR-32 Accomplishments since the 2006 RTP... HR-34 References... HR-35 PT Public Transit and Paratransit Service Element System Description... PT-1 Fixed Route and Commuter Service... PT-6 Paratransit Service... PT-10 Social Service Transportation... PT-13 Cross County/Interregional Service... PT RTP i Table of Contents
5 Coordinated Transportation Plan... PT-14 Needs Assessment... PT-14 Guiding Goals, Policies and Objectives... PT-20 Action Plan: Proposed Projects... PT-22 Financing... PT-24 Performance Measures... PT-29 Accomplishments since the 2006 RTP... PT-30 References... PT-32 BP Bicycle and Pedestrian System Element System Description... BP-1 Needs Assessment... BP-4 Guiding Goals, Policies, and Objectives... BP-19 Action Plan: Proposed Projects... BP-21 Financing... BP-30 Performance Measures... BP-36 Accomplishments since 2006 RTP... BP-37 AS Aviation System Element System Description... AS-1 Humboldt County Airport Land Use Commission... AS-6 California Aviation Systems Plan... AS-7 Needs Assessment... AS-7 Guiding Goals, Policies, and Objectives... AS-13 Action Plan: Proposed Projects... AS-14 Financing... AS-17 Accomplishments since the 2006 RTP... AS-20 References... AS-22 GM Goods Movement System Description... GM-1 Needs Assessment... GM-9 Guiding Goals, Policies, and Objectives... GM-18 Action Plan: Proposed Projects... GM-20 Financing... GM-25 Performance Measures... GM-26 References... GM-29 TT Tribal Transportation Element Native American Coordination and Consultation... TT-1 Humboldt County Tribal Transportation Commission... TT-2 HCAOG s Role in Tribal Transportation... TT-2 Hoopa Valley Tribe... TT-4 Karuk Tribe of California... TT RTP ii Table of Contents
6 Trinidad Rancheria... TT-7 Yurok Tribe... TT-9 Wiyot Tribe... TT-11 Blue Lake Rancheria... TT-11 Financing... TT-12 References... TT-15 CI Community Input Element Community Participation Program... CI-1 Workshop Exercise Number One... CI-2 Workshop Exercise Number Two... CI-7 Additional Comments... CI-15 Comments Received via Mail and ... CI-19 Process Comments... CI-26 Summary of Public Participation Program... CI-29 Public Comment on Draft RTP... CI-30 EC Environmental Clearance RTP EIR Addendum... EC-1 Air Quality Greenhouse Gas Emissions... EC-1 Coordination with North Coast Unified Air Quality Management District for Emissions Reductions... EC-4 California Wildlife Action Plan... EC-6 List of Tables I and 2007 Population Statistics, Humboldt County... I-6 I2 Humboldt County Employment Statistics... I-13 I3 Examples of Transportation Planning Land Use Impacts... I-15 HR1 Significant Roadways... HR-2 HR2 Congested Roadways... HR-6 HR3 Roadway Maintenance Backlog... HR-7 HR4 Summary of short- and Long-term Highway and Roadway Project Costs... HR-10 HR5 Short-term Projects not Funded by STIP or SHOPP... HR-11 HR6 Short-term (1-10 years) STIP Projects... HR-14 HR7 Short-term Highway Operations and Rehabilitation Projects (SHOPP; 2008)... HR-16 HR8 Long-term (11-20 years) Roadway Projects... HR-19 HR9 Illustrative (Unconstrained) Roadway Projects... HR-20 HR10 Summary of Projected Revenues and Costs for Roadways... HR-32 HR11 Highway and Roadway Performance Standards... HR-33 PT1 RTS Fleet Information... PT-7 PT2 ETS Fleet Information... PT RTP iii Table of Contents
7 PT3 A&MRTS Fleet Information... PT-9 PT4 Transit Threshold Levels of Service... PT-18 PT5 RTS Planned Projects... PT-23 PT6 ETS Planned Projects... PT-23 PT7 A&MRTS Planned Projects... PT-23 PT8 Humboldt County TDA Revenues FY2001/ /09... PT-27 PT9 Transit Provider TDA Revenues FY 2006/07... PT-27 PT10 Transit System Fare Revenues for FY 2006/07... PT-28 PT11 Operating Costs FY 2006/07... PT-28 PT12 Projected 20 Year Transit Revenues and Costs... PT-29 BP1 Bikeway Definitions from Caltrans Highway Design Manual... BP-6 BP2 Bicycle Flow Characteristics on Bike Paths and Bike Lanes... BP-7 BP3 Humboldt County Non-Motorized Planned Projects... BP-22 BP4 Humboldt County Non-Motorized Illustrative Projects... BP-24 BP5 Humboldt County Non-Motorized Long-Term Projects... BP-26 BP6 Selected Bicycle Safety Improvement Projects from FHWA Checklist... BP-31 BP7 BTA annual funding... BP-33 BP8 Non-Motorized Performance Measures... BP-36 AS1 Humboldt County Aviation System Public Use Airports... AS-1 AS2 Aviation Activity Forecast Based Aircraft... AS-8 AS3 Aviation Activity Forecast Annual Operations... AS-9 AS4 Proposed Projects... AS-15 TT1 Hoopa Valley Tribe Short- and Long-Term Planned Projects... TT-5 TT2 Hoopa Valley Tribe Illustrative Projects... TT-6 CI1 Modes of Transportation... CI-2 CI2 Modes of Transportation Eureka... CI-3 CI3 Modes of Transportation Fortuna... CI-4 CI4 Modes of Transportation McKinleyville... CI-5 CI5 Exercise Mode Options... CI-7 CI6 Options within Modes... CI-8 CI7 Options within Modes Eureka... CI-9 CI8 Options within Modes Fortuna... CI-11 CI9 Options within Modes McKinleyville... CI-13 List of Figures Population Distribution in Humboldt County (2000)... I-4 Humboldt County Population Growth... I Population Growth Rates (%), Humboldt County... I-6 Projected Population Change (%) by Age Group, I-7 Low-Income Households by Census Block Group... I-8 Carless Households by Census Block Group... I RTP iv Table of Contents
8 Minority Populations by Census Block Group... I-10 Senior Populations by Census Block Group... I-11 Transportation Choices for Work Travel in Humboldt County... I-13 Projected Growth in Vehicle Miles Traveled and in Fuel Consumption for Humboldt County... I-14 Highways and Connecting Roads... HR-3 Humboldt County Bus Routes... PT-2 City of Arcata Bus Routes... PT-3 City of Eureka Bus Routes... PT-4 McKinleyville Bus Routes... PT-5 City of Rio Dell Bike Routes... BP-9 City of Fortuna Bike Routes... BP-10 City of Eureka Bike Routes... BP-11 City of Arcata Bike Routes... BP-12 McKinnleyville Bike Routes... BP-13 Humboldt County Bike Routes... BP-14 Proposed Humboldt Bay Bike Routes... BP-29 Humboldt County Airports... AS-2 Humboldt Bay Channels, Industrial Dock Facilities, and Marine Terminals... GM-3 Railroads in Humboldt County... GM-8 Indian Reservations and Rancherias of Humboldt County... TT RTP v Table of Contents
9 EXECUTIVE SUMMARY ORGANIZATION OF THE REGIONAL TRANSPORTATION PLAN The overall goal of the 2008 RTP is: To develop, operate, and maintain a well-coordinated, balanced, countywide multimodal transportation system that is safe, efficient, and provides good access to all cities, communities, and recreational facilities in Humboldt County, and into adjoining regions. A balanced multimodal transportation includes, but is not limited to highways and local roads, public transit and paratransit, aviation facilities, marine transport, railroads, bicycle facilities and pedestrian facilities. This 2008 RTP has been updated in compliance with guidelines established by the California Transportation Commission. Intended as a resource, and as a guide, for integrated and comprehensive regional transportation planning, the plan is focused on achieving a coordinated and balanced multi-modal transportation system, in both the short and long terms, while maintaining the existing transportation system in a condition that promotes safety and facilitates recreational and tourist travel. The RTP is organized by transportation mode, which include: (1) Highway and Roadway Transportation System; (2) Public Transit Service System; (3) Bicycle and Pedestrian System; (4) Aviation System; (5) Goods Movement System; and (6) Tribal Transportation. Each element includes some or all of the following sections: (1) System Description; (2) Needs Assessment; (3) Goals, Policies and Objectives; (4) Action Plan; (5) Financial Summary; (6) Performance Measures; and (7) Accomplishments since the 2006 RTP was adopted. The system descriptions provide detailed information regarding the current conditions for each mode of transportation. The needs assessments identify needs, and outlines improvements that may be required to accommodate current needs and future transportation conditions. The goals, policies and objectives sections include regional policies and objectives that promote an efficient and equitable transportation infrastructure. The action plans include planned, programmed, and illustrative projects over the next 20 years. The financial summaries assess available financial resources, project funding and (where information is available) outline funding strategies for future transportation improvements. Performance measures are linked to policies and objectives; to set standards against which to evaluate project effectiveness. During 2008 RTP Update preparation, recently completed plans, policy documents and studies addressing transportation and environmental issues in Humboldt County were reviewed and incorporated. They include 5-year Capital Improvement Programs for various cities and the airports managed by the Humboldt County Public Works Aviation Division; Transportation Development Act Unmet Transit Needs Report and Findings FY ; Humboldt 2008 RTP Page ES-1 Executive Summary
10 Coordinated Transportation Alliance project report; bicycle and pedestrian needs studies; a parking needs study; 2004 HCAOG Regional Bicycle Transportation Plan; Phase I and Phase II Manila Community Transportation Plan; HUMPal Transportation Disadvantaged Populations Report and Defining Healthy Design in Humboldt County: A Policy Charrette; and the Hoopa Traffic Calming and Safety Enhancement in the Hoopa Valley Indian Reservation: A Conceptual Plan for Hoopa. In addition, updated data was collected from recent transit performance audits; financial audits; the Humboldt Transit Authority, Eureka Transit System and Arcata and Mad River Transit System Transportation Development Plans; California Department of Transportation Transit Emergency Planning Guidance; marine and rail studies, including general planning documents, Port of Humboldt Bay Harbor Revitalization Plan, North Coast Railroad Authority 2006 Strategic Plan and Progress Report, The Long Term Financial and Economic Feasibility of the Northwestern Pacific Railroad, and the NCRA Capital Assessment Report.; the six Airport Master Plans for Humboldt County Airports; and the Land Use Compatibility Plan for Humboldt County Airports. In compliance with the CTC RTP guidelines, the following plans were reviewed and incorporated (where applicable) into the 2008 RTP, California Transportation Plan; California Rail Plan; Interregional Transportation Strategic Plan; Transportation Concept Reports; California Aviation System Plan; Statewide Wildlife Action Plan; Goods Movement Action Plan; Strategic Highway Safety Plan; and California Highway Safety Plan. Since many of the major roads within Humboldt County are under the jurisdiction of state and federal agencies and municipalities, coordination with those agencies is an important part of the RTP Update. Jurisdictions and agencies with transportation systems located within the Humboldt County, or affected by the RTP, were invited to participate in the RTP update process. Internal and public review was encouraged during RTP development. The HCAOG Technical Advisory Committee (TAC) provided oversight of the plan s development. The RTP planning process was developed to provide various opportunities for public involvement, including consultations with local Native American tribes, associated transportation entities, citizen groups, and other stakeholders. HIGHWAY AND ROADWAY TRANSPORTATION SYSTEM Humboldt County s roadway system has approximately 1,400 miles of county roads and city streets, 378 miles of state highways, including U.S. Highway 101, and roadways on federal lands. Critical needs for the highways and roadways are safety, capacity/functionality, and maintenance/rehabilitation, and environmental compliance. Repetitive highway closures from natural disasters due to the unique geography of Humboldt County pose economic, social and environmental threats. Landslides occur with regularity along US 101 and SR 299 along certain roadway segments. These slides entail significant costs for roadway repair and maintenance and economic costs in the form of closures. Another area of concern for safety is the US 101 Eureka/Arcata corridor, which has a history of a higher-than-average number of accidents; Caltrans, HCAOG and the Federal Highway Administration are currently cooperating on a 2008 RTP Page ES-2 Executive Summary
11 project to improve safety and reduce delay at intersections, reduce traffic conflicts, and rehabilitate existing facilities along this corridor. Roadways that are congested or that are in poor condition present safety concerns for drivers, bikers and pedestrians. While roadway congestion in Humboldt County is not a major transportation issue, increased development pressures have added and are likely to add vehicle volume to the County s roadways that will exacerbate existing conditions over the next 20 years. Many roadways are already operating at or above capacity during peak hours and others are expected to have segments that reach or exceed capacity as traffic volumes increase over the next 20 years, with corresponding declines in levels of service. Private industry representatives have indicated that making US 101 a four-lane facility south towards San Francisco and north to Crescent City would benefit the industry. Such improvements would provide cost savings to the industry by reducing congestion and travel times. In addition, the industry could use longer truck trailers to help cut transportation costs. These savings will have to be quantified to determine whether they are significant enough, when coupled with other factors such as safety and operational concerns, to warrant highway expansion. Overall, the County s roads are in poor condition. County staff estimated that the total backlog in roadway maintenance and rehabilitation is close to $150 million, and City staffs noted an additional backlog of $72-80 million in maintenance and rehabilitation of city streets. And the total cost of currently planned roadway projects is over $260 million (including STIP, SHOPP, other). Funding for these projects is often an order of magnitude or more lower than what is needed to fund planned projects. In fact, a summary of anticipated RTP revenues and costs indicates that estimated 20-year revenues are currently about four-fifths of the revenue needed to meet existing planned project needs. In light of constrained funding for transportation and economic hardships for both state and federal governments, competition for limited resources will continue to be pressing for the County. This creates an environment in which HCAOG must act in its regional capacity to prioritize candidate projects that promote an efficient regional transportation system. Several million dollars of programmed STIP projects nominated by HCAOG are still awaiting funds from the California Transportation Commission. These projects can serve as the basis for prioritization. PUBLIC TRANSIT AND PARATRANSIT SERVICES Humboldt County s public transportation system consists of fixed route transit, commuter services, paratransit services, social service transportation, and cross-county, or interregional, services. Humboldt County is currently served by two commuter transit services (i.e., Redwood Transit System and the Willow Creek RTS Extension Service) and four fixed route public transit services (i.e., Eureka Transit Service, Arcata & Mad River Transit, Klamath/Trinity Non Emergency Transportation and Blue Lake Rancheria Transit). Paratransit services in Humboldt County are provided by City Ambulance, K-T Net, HTA, Blue Lake Rancheria Dial-A-Ride, the 2008 RTP Page ES-3 Executive Summary
12 City of Fortuna, Humboldt Community Access and Resource Center, Bridgeville Community Center, and the Ferndale Senior Resource Agency. With respect to the delivery of public transit programs, especially within a large, rural county, Humboldt s system has been fairly successful. However, the need for public transit, and enhanced transit services, is increasing, countywide. The average age of Humboldt residents is rising, with more elderly people becoming unable to drive and/or voluntarily giving up their driving privileges. Furthermore, state clean air legislation mandates the reduction of greenhouse gas emissions from mobile sources, such as cars and light duty trucks. One public transit bus, filled to capacity, takes 44 cars off the road. Fixed route and paratransit needs are assessed on a yearly basis. Additional evening and Sunday fixed route and paratransit service, and services to outlying communities (Orick, Garberville, Hydesville-Bridgeville) are transit needs expressed by Humboldt County residents on an annual basis. The transit providers would like to see the development of park and ride facilities that accommodate intermodal travel, and the expansion of transit services in areas that are currently underserved and/or not served by public and paratransit services. Public transit 20 year protected short and long term capital costs, without adjusting for inflation, are $22 million dollars; projected operating costs, are anticipated to be $103,241,686 taking into account a 4% annual inflation. Projected 20 year transit revenues are $77 million dollars. Based on the 20 year projection, costs are expected to outpace revenues by a total of $48 million. Expanding and improving Humboldt s public transit and paratransit system will require additional revenue streams, perceptual, as well as practical, measures; convenience, comfort, frequency, accessibility, and the reliability of transit services are all determining factors for encouraging, and increasing, transit use. BICYCLE AND PEDESTRIAN SERVICE SYSTEM Walking and cycling are year-round transportation choices for many Humboldt County residents. Many locals are dedicated walkers, and cyclists, who remain active in any weather. General interest in these activities, for fitness, efficiency, and energy savings, is increasing. In Humboldt County, as in most areas, the local cycling population is made up of bicycle commuters, those who use multiple modes (such as combining bicycling and transit) and recreational, single-mode cyclists. While cycling is a choice for some, many of these users do not have access to other modes of transportation. Children, low-income members of the community, and college students frequently utilize bicycle transportation out of necessity. For the purposes of the RTP, commuting is defined as non-recreational trips to specific destinations everything from travel for work, school or shopping, to visiting friends or attending events. Recreational walking and cycling would include any type of either activity performed essentially for fun or fitness from mountain biking and road cycling, to urban or trail hiking and pleasure walking RTP Page ES-4 Executive Summary
13 Data from the 2000 Census shows that less than two percent of Humboldt County residents, aged 16 years or older, used a bicycle for work-related trips. However, census data did not include information on individuals who use bicycles as their primary mode of transportation aside from work-related commuting, or for transportation to and from school. Data from the 2000 Census indicates that 6.5 percent of Humboldt County residents, aged 16 years or older walk to work. Although pedestrians typically include all population segments, the elderly, children, college students, low-income, and disabled individuals are most likely to walk. People with disabilities comprise a substantial part of the pedestrian population -- especially elderly citizens who have a variety of mobility and sensory limitations. Facilities most utilized by pedestrians are: sidewalks, crosswalks, and where those facilities are not available, road or highway shoulders (albeit road shoulders are not considered a pedestrian facility). AVIATION SYSTEM There are nine public use airports in Humboldt County. Humboldt County Department of Public Works Aviation Division is responsible for the management of the Arcata-Eureka Airport, Dinsmore Airport, Garberville Airport, Kneeland Airport, Murray Field Airport, and Rohnerville Airport. The City of Eureka is responsible for the management of the Eureka Municipal Airport. Shelter Cove Airport is managed by the Resort Improvement District 1 and Hoopa Airport is managed by the Hoopa Valley Tribal Council. The Arcata-Eureka is the only commercial service airport in Humboldt County. The airport is served daily by Horizon Airlines, United Express, and Delta Airlines. Murray Field and the Arcata-Eureka Airports are also served on a daily basis by several dedicated cargo companies (Federal Express, United Parcel Service, AmeriFlight, and Union Flight). A CAL FIRE air attack base and training facility is located at the Rohnerville Airport. All six of the airports owned and operated by Humboldt County Department of Public Works Aviation have undergone repairs and/or upgrades in the past two years. Airport Master Plans and five year plans have also been developed for all six Humboldt County Airports. Short and long term projects have been identified as a result of Humboldt County s planning efforts. However, the Humboldt County short and long term planned projects, in addition to the illustrative projects identified by the City of Eureka, Resort Improvement District 1, and Hoopa Valley Tribal Council will be dependent on the availability of funds. GOODS MOVEMENT The Goods Movement Element focuses on truck and marine transportation modes for moving goods in and out of Humboldt County. The Element follows California s "Statewide Goods Movement Strategy" focusing on ways to improve existing system efficiency, through technology and other means, to maximize capacity and reliability and minimize long-term costs RTP Page ES-5 Executive Summary
14 Goods movement provides three distinct functions in Humboldt County: 1) local pickup and delivery service; 2) domestic trade; and 3) international trade. Local service trucking represents the largest share of truck goods movement, supporting local business and consumer markets. Domestic long-haul trucking provides access to national markets and connections to major goods suppliers. Long-haul trucks also provide connectivity with marine, air and rail systems. Marine and aviation provide access to national and international markets. Currently there is no active rail service in and from Humboldt County. Truck transport is and will continue to be the primary method of goods movement into, within and out of Humboldt County. With the highways and local roads currently bearing the burden of all goods movement through Humboldt County, improvement of the State highway system is the primary need. Currently, conditions on certain sections of U.S. 101 and S.R. 299, including Richardson Grove and Buckhorn Summit, limit the length of trucks that are able to enter and leave Humboldt County. Improvements to these roadway sections will improve the efficiency with which trucks are able to travel into, within and out of the County. The Port of Humboldt Bay s transportation competitiveness is limited by a number of economic and geographic conditions that do not constrain other potentially competing ports, including the area s relative remoteness and rugged topography. Intermodal facility development is an important future need. Improving intermodal transitions (e.g., ship to truck) for goods movement requires both coordinated scheduling and appropriate facilities. In terms of rail transport, the Northwestern Pacific Railroad line, which formerly served Humboldt Bay, has been closed since Reopening the line depends on the availability funds, a number of agency and environmental approvals, and a potentially costly stabilization of the line through highly unstable geological materials along the northern route (the Eel River Canyon). TRIBAL TRANSPORTATION Humboldt County Native American Tribes were consulted as part of the 2008 RTP update process. The Tribes were contacted via the Humboldt County Tribal Transportation Commission (HCTTC) meetings, HCAOG TAC meetings and direct correspondence via and phone. Five Humboldt County tribes are represented on the HCAOG TAC: Blue Lake Rancheria, Hoopa Tribe, Karuk Tribe of California, Trinidad Rancheria, and the Yurok Tribe. Blue Lake Rancheria. Blue Lake Rancheria began a fixed-route intercity bus service in the fall of The vehicle fleet consists of one 20-passenger bus that is lift equipped. Blue Lake Rancheria s fixed-route transit runs Monday through Friday and serves the Rancheria, Blue Lake, Glendale, HSU and the Arcata Transit Center. Blue Lake Rancheria s Dial-A-Ride service serves Blue Lake, McKinleyville and Fieldbrook. The vehicle fleet consists of one van that is lift-equipped. Hoopa Tribe. The Hoopa Valley Reservation total backlog cost for roadway maintenance and rehabilitation needs is approximately $900,000. Planned program costs total $15 million, and illustrative projects total over $100 million. In 2003 Hoopa was awarded a grant under the 2008 RTP Page ES-6 Executive Summary
15 Environmental Justice: Context Sensitive Planning for Communities Grant Program to involve the community in crafting design solutions to traffic safety problems, specifically the critical injury cluster sites along SR 96, while supporting existing community development efforts. A blueprint for implementing ideas related to pedestrian safety along Highway 96 through downtown Hoopa was developed in Karuk Tribe. The Karuk Tribe works directly with the BIA and the Federal Highways Administration to accomplish road construction and maintenance activities. The tribe carries out its own road maintenance activities, and is planning the construction of new roads. The Karuk tribal roads need repair and rehabilitation. The Karuk Tribe of California would like to improve pedestrian and bicycle facilities on Red Cap Road, SR 96, and Ishi Pishi Road. Trinidad Rancheria. The Trinidad Rancheria is beginning to plan and build infrastructure, to look at transportation connectivity, and to develop long-range planning for cultural preservation, housing, land, environment and economic development. Pedestrian and bicycle travel, safe routes to school, and alternative access to the Rancheria are transportation are important issues. Currently, the Rancheria is engaged in three major projects: the Trinidad Pier Reconstruction Project, the stabilization and rehabilitation of Scenic Drive, and the planning for a new US 101 Interchange directly to the Trinidad Rancheria. Yurok Tribe. Most roadways on the Yurok reservation are incomplete, underdeveloped or falling seriously behind acceptable standards for public roads. The estimated cost for roadway rehabilitation projects is over $630 million. The reconstruction of 20.1 miles of SR 169 is estimated to cost over $200 million. And the realignment and pavement of Bald Hills Road is estimated to cost over $60 million. The roadway maintenance backlog could be in the hundreds of millions of dollars. In fact, most roadways have fallen into such deplorable condition that road maintenance can no longer address the problem, and most routes now require major roadway rehabilitation. COMMUNITY INPUT Community workshops were held to solicit community input for the 2008 RTP update. The Community Workshops were held at the Wharfinger Building in Eureka, the Monday Club in Fortuna and Azalea Hall in McKinleyville. The purpose of the workshops was to construct a process that generates useful comments, adds value to the process, builds community engagement, obtain input on all of the transportation modes, and get workshop participants to dialogue with one another on transportation issues. The information presented in the Community Input Element represents the views of the Humboldt County residents that submitted written comments and attended the community workshops it does not necessarily represent the views of all Humboldt County residents. Even so, it provides valuable insights and is worthy of consideration with respect to transportation project programming and funding priorities. Workshop Exercise Number One. For the first workshop exercise, participants were asked to rank the four transportation modes based on personal interest, need or sense of importance. The 2008 RTP Page ES-7 Executive Summary
16 majority of all community workshop participants ranked the four transportation modes in the following order: bicycle and pedestrian facilities, public transit and paratransit services, highway and roads, and goods movement. Workshop Exercise Number Two. For the second workshop exercise, participants were provided with four options for each of the four the modes of transportation. The majority of workshop participants selected the following options as their first choices for each mode: Goods Movement: Eliminate STAA pinch points on US 101 and Highway 299 to facilitate the movement of goods via STAA trucks. Transit: Increase the frequency of public transit service in areas already served by adding express transit service and direct routes. Bicycle and Pedestrian: Develop pedestrian and bicycle trail connections among communities (for example, pedestrian and trail connections among McKinleyville, Blue Lake, Arcata and Eureka). Highways and Roadways: Increase major road capacity to accommodate other modes of travel (for example bicycle lanes, sidewalks and transit stops). Community Input Process Commentary. At the end of each community workshop, participants were asked to provide their comments on the process used to solicit input. There were many comments received, and the following list provides a representative sampling: Did not like categories within highway/roads and goods movement problems with individual options. Skewed toward public transit. Not enough information. Information presented was good. What is HCAOG? Like to see HCAOG hold these meetings in underserved communities (they need it the most). Broader dialogue desired. Certain interest groups are underrepresented. Great discussion hearing others priorities; discussions helped people become more creative. How much money is at stake? A more detailed discussion of workshop participants responses is provided in the Community Input Element RTP Page ES-8 Executive Summary
17 INTRODUCTION REGIONAL TRANSPORTATION PLANNING AGENCY The 2008 Regional Transportation Plan (RTP) for Humboldt County is a long-range planning document, prepared by the Humboldt County Association of Governments (HCAOG), in coordination with the California Department of Transportation (Caltrans) District 1, local transit authorities and transportation agencies, Native American tribes, residents, business interests and other stakeholders. HCAOG is a joint powers authority (JPA) comprising Humboldt County and the cities of Arcata, Blue Lake, Eureka, Ferndale, Fortuna, Rio Dell, and Trinidad. It also serves as the Regional Transportation Planning Agency (RTPA) for Humboldt County. This RTP was prepared to provide regional transportation goals, policies, objectives, and strategies for Humboldt County. Regional transportation planning is a dynamic process, requiring continuous monitoring and periodic updating. As an RTPA, HCAOG is required to adopt and submit an updated RTP to the California Transportation Commission (CTC), and Caltrans, every four years. This 2008 Humboldt County RTP is an update, intended to comply with the CTC s most current, adopted RTP Guidelines, which state that the outlook for an RTP should be 20 years. The horizon year for this RTP is HCAOG developed the 2008 RTP for Humboldt County pursuant to Government Code et seq. of Chapter 2.5, federal legislation; U.S. Code, Title 23, 134 and 135 et seq., and the 2007 CTC RTP guidelines. An RTPA that does not oversee an urbanized area is allowed to adopt and submit an RTP once every four years. If the RTPA determines that an update is not warranted, it may readopt its current RTP. As policy, HCAOG updates its RTP biannually, to better address the most current activities that could impact the development of the regional transportation system. The transportation planning and programming processes are accomplished by a multi-layered committee structure. The Technical Advisory Committee, the Citizens Advisory Committee, the Policy Advisory Committee, and the Social Service Transportation Advisory Council all participate in the transportation planning process. The Technical Advisory Committee (TAC) consists of representatives of the seven incorporated cities, the county, fixed route transit providers, and five representatives of the Native American Tribes of the county. The Committee is responsible for developing transportation planning issues and providing direction to the Association. The Citizens' Advisory Committee (CAC) plays a crucial role in providing citizen participation in the comprehensive regional transportation planning process. The Committee consists of eight members solicited county-wide to generate both a geographic and a modal interest perspective on transportation problems and issues RTP Page I-1 Introduction
18 The role of the Social Service Transportation Advisory Council (SSTAC) is to participate in the RTPA's annual unmet transit needs process and review the Association's findings each year, recommending action as appropriate. They advise the Association on other issues, to include coordination, and consolidation of specialized programs. The Council consists of social service transportation providers, users, and administrative agencies representing the elderly, disabled, and economically disadvantaged citizens of Humboldt County. The Policy Advisory Committee (PAC) is comprised of the same members as the HCAOG Board with the addition of the Director of Caltrans District 01 and the Chairman of the Humboldt Transit Authority (HTA) Board of Directors or their designate. The Committee is responsible for developing transportation planning issues and providing direction to the Association. The HCAOG Board is the final authority for all of the decisions generated in the region's transportation planning and programming arena. The Board is comprised of the Mayors of the seven incorporated cities and the Chairman of the Board of Supervisors or their designate. Each fiscal year, HCAOG approves the Overall Work Program (OWP). The OWP document outlines the transportation planning work to be accomplished, responsible agencies, and funding. It also helps ensure that an adequate and up-to-date RTP is maintained. An OWP must be approved by Caltrans before State and Regional Planning Assistance Funds (SRPAF) can be used for transportation planning studies or administration. State funds are used to reimburse local funds, and no local matching funds are required. An OWP also outlines a regional agency s use of Planning, Programming and Monitoring (PPM) resources. One significant purpose of an OWP is to serve as the implementation tool for issues emanating from the RTP and its processes. The purpose of an RTP is to encourage and promote the safe and efficient management, operation and development of a regional, intermodal transportation system that will serve the mobility needs of goods and people. An RTP provides a vision for future demand and transportation investment within the region. To advance Humboldt County s long-term goals, HCAOG s transportation planning requires strategies for operating, managing, maintaining, and financing the area s transportation system. RTPs are developed to be consistent with Federal and State transportation planning requirements (e.g., Caltrans RTP Guidelines). To qualify for funding in the State Transportation Improvement Program (STIP), projects included in a RTIP or the ITIP must be consistent with adopted RTPs. Given the requirements of Government Code 65080(c), the CTC will only consider STIP funding for projects consistent with an RTP adopted within three years (four years in non-urban regions) of a STIP application. Federal Transportation Conformity rules require a new conformity determination at not more than 3-year intervals. However, shorter deadlines may apply, based on various EPA actions including non-attainment designation or classification changes, SIP approvals, emission budget approvals, and changes in modeling assumptions. These requirements are separate from the RTP adoption schedule, but can affect it. When the RTP is updated or amended, a new conformity determination, where applicable, shall be made RTP Page I-2 Introduction
19 This RTP describes Humboldt County's regional transportation system, which serves a population of over 131,000 people dispersed over a 3,573 square mile geographic area. It also discusses planned system improvements, anticipating a county population growth of approximately 12 percent, to 147,000 people, over the RTP s 20-year period. Transportation is critically important to Humboldt County s economic health and quality of life. Through accessibility to land, the area s transportation system provides for the mobility of people and goods, and influences patterns of growth and economic activity. And, as transportation is essential to social and economic vitality in Humboldt County, it can only be examined in connection with other issues, including: population growth and demographics, changing travel behaviors, increasing travel demand, safety, employment, housing, land use, the environment, community values and social equity, individual opportunity, and resources. Overall, HCAOG s 2008 RTP demonstrates the importance of creating a balance between maintaining and preserving Humboldt County's existing transportation systems, and creating capacity in areas where population growth and travel increases are projected to occur. The RTP also highlights the importance of bicycle and pedestrian modes as integral to the multimodal goals of the regional transportation system. In short, although the county population is projected to grow moderately especially when compared to other areas in California regional travel is still predicted to increase at rates that will require expansion, modernization and diversification of the current transportation infrastructure. REGIONAL SETTING Humboldt County is a geographically diverse region located in northwestern California. The County encompasses 3,500 square miles of forested mountains, river valleys, coastal terraces, agricultural lands and coastline. The Pacific Ocean forms the western border of Humboldt County and Del Norte County borders the north. The eastern border meets mountainous Trinity and Siskiyou Counties, and Mendocino County s coastal mountains and valleys of border the south. In addition to several unincorporated communities, Humboldt County is home to seven incorporated cities: Eureka, Arcata, Fortuna, Blue Lake, Rio Dell, Ferndale, and Trinidad. Their populations range in size from Trinidad s 400 residents to Eureka s 26,000 residents. It is noteworthy that no community within the County meets the urbanized metropolitan criteria as defined by the U.S. Census Bureau. The nearest designated metropolitan area is located more than 150 miles away. The figure on the following page illustrates the distribution of Humboldt County s population. In 2007, the county population was over 131,000. As the figure shows, the majority of these residents (52%) were concentrated in the area surrounding Humboldt Bay, which is also the center of government and commercial services. Most of the county remains sparsely populated, and many residents live in places that are remote or difficult to access. The most prominent geographic areas of the county include: Greater Humboldt Bay Area: The alluvial coastal terraces surrounding Humboldt Bay and the Eel River estuary are the most populous areas in the county and include the cities of Eureka, Arcata, Blue Lake, Fortuna, Ferndale, and the unincorporated community of McKinleyville RTP Page I-3 Introduction
 and Van Duzen River communities; Humboldt Redwoods, Richardson Grove and Grizzly Creek State Parks; and the King Range National Conservation Area.")
20 South County: Geographically the largest part of the county, the South County includes Rio Dell and Scotia; the Avenue of the Giants communities; Garberville and Redway; the Eel, Mattole Population Distribution in Humboldt County (2000) and Van Duzen River communities; Humboldt Redwoods, Richardson Grove and Grizzly Creek State Parks; and the King Range National Conservation Area. North County: This part of the County includes the coastal bluffs and mountains extending from the city of Trinidad northward; Orick; Yurok Reservation at Lower Klamath River; Redwood National Park; Prairie Creek and Humboldt Lagoons State Parks; and several state beaches. East County: The mountainous, upper Klamath River-lower Trinity River region includes Willow Creek, Hoopa Valley Indian Reservation, Orleans, and Six Rivers National Forest RTP Page I-4 Introduction
21 DEMOGRAPHIC AND ECONOMIC PROJECTIONS As an integral part of the social and economic fabric of Humboldt County, transportation cannot be examined without considering population growth and demographics, changing travel behavior, increasing demand, safety, employment, housing, land use, the environment, community values, individual opportunity, and resources. An efficient and effective freight transportation system is essential to economic growth and productivity. As always, adequate and flexible funding is one of the greatest challenges in providing a transportation system that offers a high degree of accessibility to all Humboldt County citizens and supports and enhances the efficient movement of goods. Population growth creates social, economic, environmental and transportation challenges for policy makers. Vehicle fuel combustion and associated health and greenhouse gas emissions impact Humboldt County s air quality. Transportation sources also impact water and visual quality, vegetation, wildlife, open space, other land uses and quality of life issues. The way communities are planned and designed has a profound impact on travel behavior. Uncoordinated decision-making, single-use zoning ordinances, and low-density growth planning often result in increased traffic congestion, air pollution, greater reliance on fossil fuels, loss of wildlife habitat and open spaces, inequitable distribution of economic resources, and loss of a sense of community. While California is the most rapidly growing State in the nation, Humboldt County s population is expected to grow only moderately over the next 20 years. Several resources were consulted in order to project a profile of Humboldt County s future economic and demographic characteristics over two decades. Population Growth From 1990 to 2007, the population of Humboldt County grew from 119,000 to over 131,000 residents -- an average annual growth rate over the period of about.6%. As the figure below shows, the County population is projected to grow to approximately 147,000 (a similar.6% annual growth rate) by Humboldt County Population Growth 2008 RTP Page I-5 Introduction
22 As Table I1 and the figure below show, there was a considerable range in the level of population changes that were experienced by Humboldt County s cities during the period. The most rapid annual growth rate of.9 percent was experienced by the City of Fortuna, while there was a negative growth rate in Trinidad. Housing price differentials may have played a part in this demographic shift. Table I and 2007 Population Statistics, Humboldt County CITY 2000 Population 2007 Population Average Annual Growth Rate Arcata 16,651 17, % Blue Lake 1,137 1, % Eureka 26,128 27, % Ferndale 1,382 1, % Fortuna 10,498 11, % Rio Dell 3,174 3, % Trinidad % Balance Of County 67,236 70, % Incorporated 59,282 61, % County Total 126, , % Population Growth Rates (%), Humboldt County 2008 RTP Page I-6 Introduction

23 Humboldt County s Changing Demographics The figures below illustrate the age distribution of Humboldt County s population which shows a general trend toward more people in the over-50 categories in the coming decades. The California Department of Finance predicts that, from , the number of people ages in Humboldt County will increase by 12.7 percent, and the population of those over-80 will increase by percent. Projected Population Change (%) by Age Group, Transportation Equity and Community Values The Humboldt County Transportation-Disadvantaged Populations Report, developed by the Eureka-based Redwood Community Action Agency s (RCAA) Planning for Active Transportation and Health (PATH) program, provides tools for decision makers to plan for more functional and equitable access to goods, services and employment, particularly for the approximately 30 percent of the population who does not drive. Current transportation and land use patterns tend to be automobile-oriented. The location of common destinations (worksites, public services and facilities), transportation funding, and traditional planning and design practices, favor automobile transportation often to the disadvantage of non-automobile travel. Further, there tends to be very limited transit service in rural areas, where it is more costly and challenging to provide. The PATH report includes GIS maps of disadvantaged populations, bicycle- and pedestrianvehicle collisions and access to public transit services. The figures on the following four pages are from the Humboldt County Transportation-Disadvantaged Populations Report, and depict the geographic distribution in Humboldt County of those populations that are transportationdisadvantaged: (1) low-income households; (2) carless households; (3) minority populations; and (4) senior citizens RTP Page I-7 Introduction
24 2008 RTP Page I-8 Introduction


25 2008 RTP Page I-9 Introduction
26 2008 RTP Page I-10 Introduction

27 2008 RTP Page I-11 Introduction
28 As the PATH report notes, Humboldt County residents who experience challenges achieving basic access to services, goods, employment and/or education are most often: Do not have cars and/or have limited access to automobiles; Low-Income (less than $35,000 household income); Mobility-impaired (physical, mental or self-care disability); Youth aged 15 and under (non-drivers); Seniors aged 62 and over (those identified by the state to have senior status); Ethnic minority and/or low-english proficient; and/or geographically isolated. Potentially high concentrations of transportation-disadvantaged populations exist in: 1) Yurok and western Hoopa Reservations; 2) Orleans and surrounding Karuk lands; 3) the Willow Creek area; 4) Orick and surrounding area; 4) North and south Arcata; 5) Many parts of Eureka; 6) Lower Humboldt Hill and Elk River Valley; 7) Table Bluff; 8) Loleta; 9) North and south Fortuna; and, 10) Downtown and eastern Rio Dell. The promotion of transportation equity is required by law and also serves the whole community. When local governments make the decision to invest in a transportation system that accommodates those without the use of private automobiles, transportation choices for the entire community are enhanced as well. These community-wide benefits include: public health and safety, economic development and greater resource efficiency. As RCAA s PATH report notes, safe, affordable, convenient transportation choices give transportation-disadvantaged populations the ability to meet their basic life needs, such as access to food, affordable housing, and medical care. In addition, they have greater access to educational, employment, social and cultural opportunities. Lack of transportation choices can seriously impair people s abilities to 1) realize their highest potential as individuals and 2) fully participate in civic and community life. Consideration of transportation equity can align transportation investments with fundamental democratic values. Employment Total employment in Humboldt County employment in 2008 is 56,200, with 4,200 unemployed (a rate of 6.9%). Table I2 below shows Humboldt County s employment statistics as of February 2008 broken out by major municipalities RTP Page I-12 Introduction

29 Table I2 Humboldt County Employment Statistics Area Labor Force Employed Unemployed Unemployment Rate (%) Humboldt County 60,400 56,200 4, % Arcata 9,200 8, % Eureka 11,800 10, % Fortuna 4,700 4, % McKinleyville 6,400 5, % Rio Dell 1,300 1, % Employment is predicted to increase by 20 percent, to around 70,000 jobs, during the period. Much of this increase is projected to be in the government sector, followed by increases in wholesale and retail trade and health and education. Local employment opportunities in the traditional areas of farming and construction are projected to remain at close to current levels. Manufacturing is projected to decline over the period. Changing Travel Behaviors The figure below summarizes the work-travel statistics obtained from the 2000 census data for Humboldt County. Transportation Choices for Work Travel in Humboldt County (%; over 16 population) 2008 RTP Page I-13 Introduction
30 In sum: 38,710 individuals 16 years and over travel alone to work by automobile. 7,056 individuals 16 years and over carpool to work. 565 individuals 16 years and over utilize public transportation to get to work. 895 individuals 16 years and over ride a bike to work. 3,492 individuals 16 years and over walk to work. 3,001 individuals 16 years and older work at home. Projected growth in California vehicle-miles-traveled is affected by population, real total personal income per person (IPP), vehicles per person (VPP) and the fuel cost per mile (FCPM) of travel. As the figures below show, both vehicle miles traveled and fuel consumption are projected to increase over the next 20 years. Projected Growth in Vehicle Miles Traveled and in Fuel Consumption for Humboldt County Largely as a result of fairly recent, but significant, increases in the cost of oil, the Federal Energy Information Administration has predicted a general decline in U.S. fuel consumption during 2008, followed by a rebound in While Caltrans has projected a 16 percent increase in the number of registered vehicles in Humboldt County, from approximately 148,000 in 2007 to approximately 172,000 in 2028, sustained increases in fuel prices would likely moderate this projection somewhat as drivers seek out lower-cost alternatives to get to work and for day-to-day activities. Similarly, sustained increases in fuel prices would likely create a downward shift in the projected increases in vehicle miles traveled and in fuel use RTP Page I-14 Introduction
31 LAND USE AND TRANSPORTATION The guiding principle in preparing this RTP update is the need for a more balanced transportation system that addresses all travel modes and land uses. This approach is expected to result in lower cost for improvements and increased operational efficiency of the existing transportation system a goal that can be accomplished by ensuring that the identified functions, capacities and levels of service of transportation facilities are consistent with applicable regional land use and transportation policies, as well as the adjacent land use patterns. This means paying attention to the modal emphasis of certain segments of roadway, and making sure there is a functional connection with the surrounding land use. Land Use refers to the location, type and design of community development. Some land-use patterns are more accessible and have lower development costs, some are more accessible for non-drivers and benefit disadvantaged people, and some preserve greenspace and help preserve the environment. Transportation planning decisions influence land use directly (by affecting the amount of land used for transport facilities) and indirectly (by affecting land use accessibility and development location and design). Table I3 provides some examples of how transportation planning can impact land use. Table I3 Examples of Transportation Planning Land Use Impacts Planning Decision Direct Impacts Indirect Impacts Increased parking supply. Expanded urban roads. Transit improvements. Road pricing. Increases pavement area. Increases pavement area. Degrades urban landscapes. May require new facilities (rail lines, busways, stations, etc.). Reduces need to expand roads and parking facilities. Reduces density and encourages urban fringe development. Encourages urban fringe development Makes urban areas more accessible and attractive. Mixed, depending on overall effects on accessibility and livability. Given budgetary constraints, Humboldt County needs to invest, strategically, in areas and travel corridors that experience the most use and where future growth is planned. Activity centers and urban development areas should also accommodate the growing population by enhancing bike, pedestrian and transit travel (in addition to automobiles). About 16,000 more people will be living in Humboldt County in 2028 than in 2008, requiring about 6,700 additional housing units countywide (assuming the existing average household size of 2.38 persons remains constant). The County s unincorporated share of this total housing need is expected to be 54%, or about 3,630 units. Accommodating this growth with mixed-use developments, developments that are high density, and by concentrating development along existing transit corridors can increase transportation efficiency RTP Page I-15 Introduction
32 Future travel pattern needs should be linked with land use zoning to promote a balanced multimodal transportation system. The following strategies/concepts can help promote a viable connection and functionality between the transportation system and future planned land uses: Provide travel mode choices so that people can opt to travel independently, via the mode that fits their needs. These choices go beyond automobiles, including alternative modes such as transit, walking, biking, and telecommuting. Support regional multi-modal travel on major routes that connect major activity destinations. The transportation system should provide access from local areas to regional activities in centers such as Eureka, Arcata, Fortuna and McKinleyville. A multi-modal system would also serve to balance alternative modes, such as transit and freight needs for designated land uses, both commercial and residential. Promote pedestrian and bicycle accessibility to transit sites and other destinations. A seamless network of pedestrian and bicycle routes should be the goal in denser areas. Promote citizen involvement at all levels of planning so that local communities and neighborhoods can help determine their particular transportation needs. Promote traffic calming features through land use planning to minimize noise, speeding and use of residential neighborhoods as thoroughfares. BLUEPRINT PLANNING HCAOG has been selected as the eligible applicant for the State of California s Regional Blueprint Planning program. The California Regional Blueprint Planning Program is a State initiative to promote the linking of transportation, land use, housing, environment, economic development, and equity issues when developing transportation plans and projects. Regional leaders, local governments, and stakeholders find consensus on a preferred growth scenario (or "Blueprint ) for a 20-year planning horizon, while at the same time providing a regional framework for collaboration. Federal and State agencies provide funding and guidance, localities make land use decisions, and communities supply public input on needs and desires. The regional framework, which identifies corridor and landscape vantage points, and convenes stakeholders, facilitates this planning process. A challenge would be to coordinate legacy documents (general plans, transit development plans, bicycle and pedestrian plans) to develop unique and effective planning strategies appropriate for both the urban and the rural components of Humboldt County. Regional Blueprint Planning typically consists of scenario planning; extensive public involvement (including those who are traditionally underserved); the innovative use of visioning tools; the incorporation of environmental and socio-economic data as part of the visioning process; and performance measures. Through Regional Blueprint Planning, regional transportation plans can be coordinated with other planning efforts, such as habitat conservation plans, integrated regional water management plans, housing plans, and local general plans. The integration and coordination of these plans is intended to result in planning processes that are parallel and consistent. A Humboldt County Regional Blueprint Plan would be expected to result in more efficient land use patterns and transportation systems that: support improved 2008 RTP Page I-16 Introduction
33 mobility and reduced dependency on single-occupant vehicle trips; accommodate an adequate supply of housing for all incomes; reduce impacts on valuable habitat, productive farmland, and air quality; increase resource use efficiency; promote a prosperous economy; and provide safe, vibrant neighborhoods. A transportation project arising from such planning would have a head start in meeting the requirements of SAFETEA-LU. CALIFORNIA TRANSPORTATION PLAN 2030 The California Department of Transportation adopted a California Transportation Plan (CTP) 2025 addendum in June of The addendum addressed the new requirements for statewide planning established by SAFETEA-LU. The goal of the CTP addendum was to enhance and preserve the State s valuable natural resources, while avoiding costly project overruns and delays in planning and developing transportation infrastructure. SAFETEA-LU directs states to consult and compare transportation related plans, maps, and data with federal, state, tribal and local agencies responsible for land use management, natural resources, environmental protection, conservation, and historic resources. CALIFORNIA WILDLIFE ACTION PLAN In 2000, Congress enacted the State Wildlife Grants Program to support state programs that broadly benefit wildlife and habitats but particularly species of greatest conservation need. As a requirement for receiving funding under this program, state wildlife agencies were to have submitted a Wildlife Action Plan (comprehensive wildlife conservation strategy) to the U.S. Fish and Wildlife Service in The California Department of Fish and Game (Fish and Game), working in partnership with the Wildlife Health Center, University of California, Davis, directed the development of this report, California Wildlife: Conservation Challenges, the state s Wildlife Action Plan, and associated Web publications. Species identified in the Plan, for the north coast, are limited to marbled murrelet and coho salmon. Potential impacts to these listed species are considered in environmental documents prepared for transportation projects. ENVIRONMENTAL COMPLIANCE Humboldt County is included in the North Coast Air Basin along with Del Norte, Trinity and Mendocino Counties. These counties operate as a unified special district, also called the North Coast Unified Air Quality Management District (NCUAQMD), which manages air resources in this mountainous, predominantly rural region. Most major air pollutants in Humboldt County -- especially from mobile sources -- are well below what levels that the state considers harmful. Sources of ozone precursor emissions are low enough that ozone smog does not rise to significant levels, even during periods of minimal air movement. The entirety of the North Coast Air Basin has been designated as "attainment" or "unclassified" for all criteria pollutants (carbon monoxide, ozone, sulfur oxides, and nitrogen dioxide) and is subject to "Prevention of Significant Deterioration" (PSD) permit procedures. Except for Redwood National Park, which is designated Class I (pristine), all of Humboldt 2008 RTP Page I-17 Introduction
34 County is designated as a Class II area (in attainment of the National Ambient Air Quality Standards). Long-term impacts on regional air quality are projected to increase at a slower rate than in the past, due to conversion to more efficient and lower emission vehicles, as well as RTP plan policies and actions encouraging public transit use, conversion of transit vehicles to alternative fuels, and programs and improvements designed to increase bicycle and pedestrian system use. PM 10 is defined by the EPA as airborne particulate matter composed of multiple substances suspended in air in the form of particles that are less than 10 micrometers in diameter. They include both fine and coarse dust particles and are a health concern because they can pass through the nose and throat and get into the lungs. Potential effects of PM 10 include increased asthma rates, increased rates of heart attacks and cardiovascular damage in adults, and decreased lung capacity, especially for children. Humboldt County is currently listed as non-attainment for PM 10 by the California Air Resource Board (CARB). This status will continue to be impacted by the projected growth in region-wide vehicle miles of travel (VMT) and population. Daily regional VMT is expected to increase from 2008 to 2028, but the resulting emissions are predicted to decrease, due to cleaner vehicle emissions on the road by the year Transportation improvements from projects contained in the Action Element of the RTP should further reduce emissions, while also alleviating congestion. PLAN PURPOSE AND ASSUMPTIONS Plan Purpose The Regional Transportation Planning Agency (RTPA) for Humboldt County has prepared this 2008 RTP update to fulfill the following purposes: Provide an assessment of the current modes of transportation and the potential of new travel options within the region; Predict the future needs for travel and goods movement; Identify and document specific actions necessary to address the region's mobility and accessibility needs; Identify and document public policy decisions by local, regional, state and federal officials regarding transportation expenditures and financing; Identify needed transportation improvements, in sufficient detail, to serve as a foundation for the following: o Development of the Federal Transportation Improvement Program (FTIP), the Regional Transportation Improvement Program (RTIP) and the Interregional Transportation Improvement Program (ITIP); o Facilitation of the National Environmental Protection Act (NEPA)/404 integration process decisions; and 2008 RTP Page I-18 Introduction
35 o Identification of project purpose and needs. Development of an estimate of emissions impacts for demonstrating conformity with the air quality standards identified in the State Implementation Plan (SIP). Promotion of consistency between the California Transportation Plan, the regional transportation plan and other transportation plans developed by cities, counties, districts, private organizations, tribal governments, and state and federal agencies in responding to statewide and interregional transportation issues and needs; Provide a forum for: (1) participation and cooperation, and, (2) to facilitate partnerships that reconcile transportation issues which transcend regional boundaries and; Involve the public, federal, State and local agencies, as well as local elected officials, early in the transportation planning process by including them in discussions and decisions on the social, economic, air quality and environmental issues related to transportation. Plan Assumptions The Regional Transportation Plan contains assumptions on which the plan is based. Following is an updated list of assumptions used in developing this 2008 RTP update: General Assumptions: The RTP update is based on a 20-year planning horizon. The growth in population in Humboldt County will continue at a less than 1% rate of growth. The average age of the population will continue to increase. This assumption is consistent with the Humboldt County General Plan Update assumptions. Employment opportunities and housing availability will keep pace with population growth. This RTP will emphasize multimodal opportunities as a way to decrease or minimize any increase of vehicle miles traveled within the region. The needs of disadvantaged populations for alternative forms of transportation will increase over the planning period. Traditional and non-traditional funding will become more available for non-motorized transportation facilities and public transit improvements. The state s economic woes will continue to impact transportation funding, delaying projects that may need to be reprogrammed, subject to availability of resources. Fossil fuels will continue to be available, but will experience price fluctuations and/or general increases and will be more expensive in Humboldt County relative to other areas of California. Rising fuel costs and an aging population will increase the number of public and paratransit riders RTP Page I-19 Introduction
36 Roadways As the population increases, the automobile will continue to be the primary mode of travel in the County for both work and non-work trips, though automobile usage may be moderated by sustained increases in gasoline prices; Community planning and general planning practices will encourage the use of alternative transportation modes to lessen the burden on the County s roadway system and reduce harmful emissions. Transit There is a direct relationship between ridership on the Arcata & Mad River Transit Service (A&MRTS) and Redwood Transit System (RTS) and student enrollment at Humboldt State University (HSU), and College of the Redwoods (CR). This relationship will continue throughout the plan period. Bikeways and Pedestrian Facilities Non-motorized facilities will continue to improve and become better connected with other modal systems. These improvements will result in an increase in use of nonmotorized (pedestrian and bicycle) transportation modes. Aviation Only Arcata-Eureka, Murray Field, Rohnerville and Garberville Airports will experience growth in home-based aircraft. The Arcata-Eureka Airport will continue to offer scheduled passenger service to Los Angeles, Portland, Salt Lake City, San Francisco, Sacramento, and to destinations in Oregon or Washington. It is expected that the airport will be served by the new generation of regional jets. The increased number of seats is expected to increase enplanements (i.e. passenger numbers). Goods Movement There will be increased opportunity for goods movement in and out of the region by marine transport, due to Humboldt Bay channel harbor improvements. Truck volumes will continue to be a major element of the transportation system representing approximately ten percent (10%) of travel on all state facilities in Humboldt County. The NCRA will continue to strive to restore rail service. Land Use and Transportation The land use and transportation elements contained in local plans will emphasize stronger land use and transportation coordination RTP Page I-20 Introduction
37 Air Quality The air quality in Humboldt County will continue to improve, due to technological improvements, regulatory guidelines for vehicles and fuels, changes in goods movement, and travel mode choices. RTP GOAL AND GUIDING POLICIES The overall goal of the 2008 RTP is: To develop, operate, and maintain a well-coordinated, balanced, countywide multimodal transportation system that is safe, efficient, and provides good access to all cities, communities, and recreational facilities, and into adjoining regions. A balanced multimodal transportation includes, but is not limited to highways and local roads, public transit and paratransit, aviation facilities, marine transport, railroads, bicycle facilities and pedestrian facilities. As a fundamental element for achieving its goal, the RTP supports an overall balance between transportation modes, and between the preservation of existing systems while developing new uses and/or new systems. These principles are reflected in the adopted transportation policies guiding the RTP. These policies are intended to guide the development of an efficient, coordinated regional transportation system, and to improve the mobility of Humboldt County residents, visitors, and goods. The overarching RTP policies are: Policy I-1: Support efforts to preserve the existing state, county, city, and reservation road system from further deterioration. Objective: Support efforts to promote and fund a local road maintenance program similar to Caltrans' SHOPP program which would receive adequate funding. Policy I-2: Encourage interconnectivity of the transportation network. Objective: Update transportation plans to include an interconnected, well-planned, and efficient regional transportation network that includes bicycle and pedestrian facilities. Policy I-3: Link inter-county transportation systems to those in other areas of the state, and coordinate and integrate interregional travel patterns. Objective: Coordinate public transit services so that rural services are effectively integrated with urban services; integrate automobile and bicycle transport with public transit. Policy I-4: Promote a balanced multimodal transportation system that provides equitable levels of access for all travel modes RTP Page I-21 Introduction
38 Objectives: Encourage the use of alternative transportation modes through public education and incentives programs; support land use policies that encourage intermodal transportation connections. Policy I-5: Promote Transportation System Management (TSM) measures. Objective: Encourage the use of public transit, ride sharing, carpools, vanpools, bicycle commuting, walking, and telecommuting RTP Page I-22 Introduction
39 REFERENCES HCAOG Regional Transportation Plan. Humboldt County General Plan 2020, Building Communities, Dyett and Bhatia. Litman, Todd Evaluating Transportation Land Use Impacts, Victoria Transport Policy Institute. Redwood Community Acton Agency, May Humboldt County Transportation- Disadvantaged Populations Report. Eureka, California. State of California, California Motor Vehicle Stock, Travel and Fuel Forecast, Division of Transportation System Information, Office of Travel Forecasting and Analysis, Statewide Modeling Branch. State of California, Department of Finance Population Projections for California and Its Counties , by Age, Gender and Race/Ethnicity. State of California, Department of Finance E-4 Population Estimates for Cities, Counties and the State, , with 2000 Benchmark. State of California, Department of Finance E-4 Historical Population Estimates for City, County and the State, , with 1990 and 2000 Census Counts. State of California, Department of Transportation (Caltrans) Long Term Socio- Economic Forecasts by County. State of California, Employment Development Department Labor Market Information Division U.S. Census Bureau U.S. Census Data, RTP Page I-23 Introduction
40 HIGHWAY AND ROADWAY TRANSPORTATION SYSTEM ELEMENT SYSTEM DESCRIPTION Humboldt County s roadway transportation system accommodates motor vehicle traffic, goods movement, transit, and bicycle and pedestrian travel. Motor vehicles that use the system include passenger automobiles, delivery vans, light- and heavy-duty trucks, and public and private sector operated passenger buses. Non-motorized vehicles, most often bicycles, and pedestrians use the roadway system as well. In Humboldt County the roadway system includes U.S. Highway 101, state highways, arterial streets, local paved access roads, unpaved rural roads, and public resources lands roads. Most routes are controlled by traffic signals, stop signs, advisory signs, directional signing, street signs, and roadside markers. All travel modes use the roadway system to some extent. Humboldt County s roadway system has approximately 1,400 miles of county roads and city streets, 378 miles of state highways, including U.S. Highway 101, and roadways on federal lands. These roadways provide for the inter-regional and intra-regional movement of goods and people on California s north coast. Humboldt County roadways traverse varying degrees of flat, rolling, and mountainous terrain and provide for limited passing opportunities in many areas. The County-maintained roadways are integrated with an overall countywide circulation system. The agencies responsible for roadway maintenance, include, but are not limited to: the California Department of Transportation (Caltrans); the U.S. Forest Service, National and State Park Service, Bureau of Land Management and the Bureau of Indian Affairs; cities; and private property owners. This roadway network contributes to the economic vitality of Humboldt County, providing safe access and travel routes for Humboldt County citizens and visitors, from low-density rural areas to higher-density urban areas. While this Element focuses primarily on roadways, it is important to note that County s circulation and goods movement systems also includes truck, marine, bicycle, pedestrian, transit, and (currently unutilized) rail facilities. These transportation modes are discussed in this RTP under the Bicycle and Pedestrian, Goods Movement, and Public Transit Service system elements. Regionally Significant Streets and Roadways Table HR1 lists significant streets and roadways identified by City and County staffs. HCAOG Page HR-1 Highway and Roadway Systems Element
41 Table HR1 Significant Roadways Location Significant Roadways Arcata 11th Street, Bayside Road/Old Arcata Road, Foster Avenue/Sunset Avenue, Giuntoli Lane, Janes Road/Spear Avenue, K Street/Alliance Road, L K Wood Boulevard, West End Road Blue Lake Greenwood Avenue, Hatchery Road, Railroad Avenue Eureka Ferndale 14th Street, Buhne Street, H Street, Harris Street, Harrison Avenue, Henderson Street (I to Broadway), I Street (Harris to Waterfront Drive), Myrtle Avenue, Waterfront Drive; US 101, State Route 255 Arlington Avenue, Bluff Street, Centerville Road, Fifth Avenue, Main Street, Ocean Avenue, Van Ness Avenue Fortuna Main Street, Rohnerville Road; US 101 Rio Dell Belleview Avenue, Blue Slide Road, Monument Road, Wildwood Avenue; US 101 Trinidad Edwards Street, Main Street, Patrick s Point Drive, Scenic Drive, Stagecoach Road, Trinity Street, Westhaven Drive; US 101 Humboldt County Alderpoint Road, Bald Hills Road, Bair Road, Blue Lake Boulevard/Glendale Drive, Blue Slide/Grizzly Bluff Road, Briceland-Thorne Road, Campton Road, Central Avenue (McKinleyville), Elk River Road, Fieldbrook Road, Freshwater/Kneeland Road, Humboldt Hill Road, Maple Creek Road, Mattole Road, Old Arcata Road/Myrtle Avenue, Redwood Drive (Garberville), Rohnerville Road, Shelter Cove Road, Sprowel Creek Road, Wilder Ridge Road, New Navy Base Road, Walnut Drive, Herrick Road, Murray Road The figure on the following page shows the Highways and significant roadways in Humboldt County. HCAOG Page HR-2 Highway and Roadway Systems Element

42 HCAOG Page HR-3 Highway and Roadway Systems Element
43 NEEDS ASSESSMENT Critical highways and roadway needs are safety, capacity/functionality, maintenance/ rehabilitation, and environmental compliance. Environmental considerations are increasingly becoming an issue, with concerns about greenhouse gas emissions and the energy-consumption of many transportation modes and transportation system management. In Humboldt County, measures have been taken to reduce greenhouse gas emissions in the maintenance and rehabilitation of roadways through the recycling of asphalt (which reduces rock extraction, hauling, and sedimentation), the use of LEDs in traffic lights, and through the development of a more functional and efficient circulation system. Increasing the use of transit and nonvehicular transportation modes also serves to reduce greenhouse gas emissions. Repetitive highway closures from natural disasters due to the unique geography of Humboldt County poses economic, social and environmental threats. Landslides occur with regularity along US 101 and SR 299 along certain roadway segments. These slides entail significant costs for roadway repair and maintenance and economic costs in the form of closures. On US 101, the currently-underway $70-million Confusion Hill bypass project will provide new bridges that circumvent the chronically slide-prone area. This will improve safety, minimize highway closures (thereby preserving an economic lifeline for Humboldt County), and significantly reduce the costs of slide clean-up and associated roadway maintenance. Another area of concern for safety is the US 101 Eureka/Arcata corridor, which has a history of a higher-than-average number of accidents. Caltrans, HCAOG and the Federal Highway Administration are currently cooperating on the Eureka/Arcata Route 101 Corridor Improvement Project to improve safety and reduce delay at intersections, reduce traffic conflicts, and rehabilitate existing facilities. The development of a safety corridor in 2002 has improved safety along the stretch of roadway, though some of the early safety gains from lowered speed limits have been lost as many drivers have resumed driving above posted speed limits. Roadways that are congested or that are in poor condition present safety concerns for drivers, bikers and pedestrians. While roadway congestion in Humboldt County is not a major transportation issue, increased development pressures have added and are likely to add vehicle volume to the County s roadways that will exacerbate existing congestion and lead to more congestion down the road. Roadway maintenance is a challenge for rural areas such as Humboldt County because of lower population densities and long travel distances, which means that fewer funds are available on a per-mile basis. Estimates of roadway capacities and condition help to identify roadways where upgrades, expansions and/or maintenance may be needed. As the County s population grows over the next 20 years, the projected vehicle-volume growth will have impacts on the safety and functionality of County roadways. Many roadways are already operating at or above capacity during peak hours and others are expected to have segments that reach or exceed capacity as traffic volumes increase over the next 20 years, with corresponding declines in levels of service. In other cases, roadways currently able to accommodate existing traffic volumes are likely to develop areas of congestion as traffic volumes increase. HCAOG Page HR-4 Highway and Roadway Systems Element
44 While capacity concerns can be addressed by accommodating or managing increased volumes through roadway upgrades and expansions, capacity expansion can also be achieved through the expansion of transit, bicycle and pedestrian facilities and increased use of those modes, as they can offset vehicle volume growth and congestion from planned development. In general, truck operations do not cause traffic congestion within Humboldt County. The major exception is on US 101 along Eureka's retail and commercial area. This portion of the highway is used for through travel as well as access to local stores and businesses. Due to this roadway s mixed use, heavy timber industry trucks can cause incompatible noise and vibration, as well as hazardous conditions for pedestrians and local crossing traffic. The county and cities expend significant transportation funds to repair and maintain roadways used by timber trucks. For example, the estimated cost to maintain and repair the roads used during a sustained logging operation is $9,000 per mile. The primary arterials used by the timber industry are US 101 and SR 299. These major state highways provide adequate facilities and levels of service, except during summer months when congestion is highest due recreational travel. Other State Routes experiencing truck volumes include SRs 36, 169, 200, 211, 254, 255, 271 and 283. Private industry representatives have indicated that making US 101 a four-lane facility south towards San Francisco and north to Crescent City would benefit the Humboldt County economy. Such improvements would provide cost savings to industries by reducing congestion and travel times. The trucking industry could use longer trailers to help cut transportation costs. These savings will have to be quantified to determine whether they are significant enough, when coupled with other factors such as safety and operational concerns, to warrant highway expansion. A significant economic issue concerns the trucking industry s use of longer trailers (53 to 56 feet) to help cut costs and improve efficiency. Truck-length restrictions and backhaul opportunities in Humboldt County are preventing businesses from being profitable and competitive with similar business along the West Coast. California currently allows trucks with 53-foot trailers to operate on the National Network and terminal access routes throughout most of the state. Trucking companies operating trucks with two 28-foot trailers are carrying about the same capacity as a 53-foot trailer but their operating costs are much higher. Longer vehicle lengths require significant roadway improvements including lane widths and curve radii. The industry has expressed concern about the limitations imposed by narrow lanes and sharp curves on portions of US 101 (Richardson Grove) and SR 299 (Buckhorn Summit). The industry is concerned that these roadway segments do not safely accommodate the longer vehicles. The Humboldt County planning division, with Caltrans, has been exploring alternatives for safely providing larger truck and multimodal access on US 101 through Richardson Grove State Park. Potential improvements include operational fixes (curve correction procedures) and added road-width capacity. HCAOG and other planning agencies have also participated in planning efforts for SR 299 improvements to the east side of the Buckhorn grade from near the Trinity/Shasta County line to Yankee Gulch (approximately 7 miles). The counties of Humboldt, Shasta, and Trinity, along with Caltrans Districts 1 and 2 have participated in funding HCAOG Page HR-5 Highway and Roadway Systems Element
45 the environmental component of the SR 299 Buckhorn Grade Improvement Project. The project is a priority for Humboldt and Trinity Counties but has been deemphasized by Shasta County in favor of I-5 corridor improvements; a preferred alternative has not been selected but Humboldt County continues to program safety and long-term improvements. Level of Service Traffic operations can be assessed using the Level of Service (LOS) concept, a qualitative measure of traffic operating conditions. A letter grade, A through F, representing progressively worsening traffic conditions, is assigned to a roadway segment or an intersection. In areas such as Humboldt County, LOS C or better has generally been considered an acceptable traffic operating condition. LOS C provides for stable flows of traffic during peak conditions, and allows drivers at signalized intersections to (typically) proceed in one signal cycle. LOS D can be acceptable in some instances, such as during peak travel times, when rights of way must accommodate multiple travel modes, or when existing developments or budgetary restrictions reduce the ability of service providers to remediate congestion problems through costly capacityexpansion projects. County and city staff identified roadways with the most severe congestion problems (LOS E or F), shown in Table HR2 below: Table HR2 Congested Roadways (LOS E or F) Location Congested Roadway Alliance Road and Foster Avenue Arcata 15th Street & Alliance Road (Arcata High School) 11th & "K" Streets SR 101 (Broadway) Hilfiker Lane to Del Norte Street SR 101 (Broadway) 15th Street to 14th Street SR 101 (4th St) 4th Street from "X" to "V" Streets SR 101 (5th St) 5th Street at Umpqua Bank Plaza ramps Eureka Fairway Drive Entire length F Street Manzanita to Harris F Street City Limits to Laurel F Street Laurel to Oak Myrtle Avenue Harrison Ave to West Highway 101, Kenmar Exit (southbound) Fortuna Rohnerville Rd. westbound left turn at North Fortuna Blvd./Main St. intersection Central Avenue at northbound 101 exit (McKinleyville) Elk River at Herrick (South Eureka) Humboldt Hubbard at Myrtle (Myrtletown) County Park Street (McKinleyville) School Road (McKinleyville) Walnut from Hemlock to Cypress HCAOG Page HR-6 Highway and Roadway Systems Element
46 Roadway Maintenance Roadway maintenance programs must be properly funded and managed to have a lasting beneficial effect on roadway condition and public safety. Maintenance benefits can only be achieved if substantial improvements are made to assure the long-term performance of the County s roadways. Whether a roadway maintenance program effectively and economically preserves the investment is not easy to determine, as many factors confound the long-term performance of roadways. Perhaps the most significant factor is the availability and allocation of funds for roadway maintenance and construction. And the amount of funding needed is determined by roadway design, construction, maintenance and rehabilitation, which all affect the rate of roadway deterioration. The 2003 Humboldt County Road and Bridge Capital Improvement Plan (CIP) report notes that, overall, the County s roads are in poor condition, with the County s Overall Condition Index (OCI) rated at 40 on a scale of The report notes that, in 2000, there was approximately $100 million in deferred maintenance on the County s roadways (not including maintenance costs for local streets). In 2008 County Public Works staff estimated that the total backlog in roadway maintenance and rehabilitation had grown closer to $150 million. City staffs noted an additional backlog of $72-80 million in maintenance and rehabilitation of city streets. As Table HR3 shows, the total roadway maintenance backlog in Humboldt County is estimated at $ million. Table HR3 Roadway Maintenance Backlog Location Roadway Maintenance Backlog ($ million) Roadway Rehabilitation Backlog ($ million) Total ($ million) Arcata 17 Blue Lake Eureka Ferndale Fortuna Rio Dell Trinidad Humboldt County 150 TOTAL HCAOG Page HR-7 Highway and Roadway Systems Element
47 GUIDING GOALS, POLICIES AND OBJECTIVES The Highway and Roadway goals, policies, and objectives presented here address the economic implications of policy decisions that affect highways and roadways, and point to appropriate investment strategies and policies for improving circulation and condition issues. These goals, policies and objectives as address the issues identified in the Needs Assessment, and reflect the short- and long-range projects identified in the Action and Financial sections below. ROADWAYS (State Highways, County Roads and City Streets) Goal: Build, maintain a safe and efficient highways, roadways, and streets system that will accommodate, balance and provide appropriate incentives for consumers to use multiple modes of transportation. Policy HR-1: Support efforts to preserve the existing state, county, city, and reservation road system from further deterioration. Objective: Support efforts to promote and fund a local road maintenance program-similar to Caltrans' SHOPP program-which would receive adequate funding. Policy HR-2: To facilitate road and highway improvements where feasible to provide additional secure access for communities whose access is threatened by road failure or other conditions. Objective: Identify communities in the region with a history of access problems of isolation due to roadway failures and facilitate local government efforts to eliminate those conditions. Policy HR-3: Project Study Reports shall be developed for RTIP candidate project nominations which include a (1) statement of need, purpose, and description of project; (2) estimated costs; and (3) delivery schedule. Objective: Completed project study reports from project applicants prior to programming. Policy HR-4: Support safety improvements on highways, roadways, and streets in the HCAOG region. Objective: Secure funds for efforts to promote non-motorized access with bridge and shoulder widening, and improve overall safety for motorists, bicyclists, pedestrians, and transit users on all county, city, and state highways and streets. Policy HR-5: Support barrier stripe mitigation efforts, in mountainous and rural areas, that alleviate travel delays. Objective: Identify locations where there is a lack of passing opportunities in mountainous and rural areas of the region. HCAOG Page HR-8 Highway and Roadway Systems Element
48 Policy HR-6: Support non-freeway alternatives for US 101 through Eureka. Objective: Program improvements needed to correct identified congestion and safety problems on US 101 through Eureka. Allocate program revenues generated from the sale of bypass rights of way, for non-freeway alternative congestion reduction measures including Transportation System Management techniques, and non-construction solutions. Policy HR-7: Promote at-grade intersection improvements. Objective: Identify all existing at-grade intersections where improvements are needed, including those on State Routes where Caltrans would be the lead agency for improving circulation and safety for the region's motorists. Policy HR-8: Support corridor protection measures for future highways and major streets. Objective: Protect future routes, rights-of-ways, and alignments identified in state and local route planning through state, county, city and tribal government partnerships; secure state funding commitments, approved route plans, environmental analyses, and implementation of city and county land use plans. Policy HR-9: Route Public Roadway Access to Resource Lands to avoid environmental constraints that would cause significant impacts. Objective: Prior to approval of major maintenance or reconstruction, analyze the potential environmental impacts of access roads to resource lands, and demonstrate that adverse impacts can be mitigated to "less than significant" levels. Policy HR-10: Support efforts to reduce energy consumption and associated air quality and environmental impacts of the highway and roadway system. Objective: Analyze the potential for reducing energy consumption and associated air quality and environmental impacts of the highway and roadway system from roadway improvement and maintenance projects, and through projects that reduce congestion and shorten vehicle trip length. Policy HR-11: Use Level of Service (LOS) standards to measure the performance of all regionally significant roadways that contribute to the regional transportation network. Objective: Develop and maintain a list of regionally significant roadways with minimum acceptable LOS for each, and periodically conduct traffic volume counts to determine whether minimum LOS levels are being maintained. Objective: Coordinate traffic volume LOS with other bicycle and pedestrian LOS to achieve balanced multi-modal use of roadways. HCAOG Page HR-9 Highway and Roadway Systems Element
49 Policy HR-12: Pursue legislation that will insure adequate funding to maintain existing roadways in Humboldt County region. Objective: Educate and lobby legislators to pursue such legislation, including providing them with costs and sample legislative language to generate revenue sources for local street and road maintenance and rehabilitation. Objective: Support CTC guidelines that allow continued use of STIP funds to preserve and maintain the existing road system, and explore local options for developing a regional maintenance and preservation program. Policy HR-13: Promote equity, cost effectiveness, and modal balance in programming processes. Objective: Program all funds based on multi-modal transportation needs and priorities as established in the RTP. Prioritize and balance projects based on cost effectiveness as well as need. Policy HR-14: Promote a balanced fund distribution among regionally significant projects. Objective: Develop and adopt flexible funding and allocation guidelines to ensure a balanced and equitable distribution of funds between regionally significant projects. These guidelines are to include a process, using all funds available to HCAOG, to plan for and program projects based on anticipated receipt of funds. ACTION PLAN: PROPOSED PROJECTS Projects listed below identify the key short-term and long-term roadway improvements for Humboldt County's regional road system through the RTP's horizon year of Table HR4 summarizes the dollar amounts for the short- (0-10 years) and long-term (11-20 years) projects for Humboldt County based on information provided by City and County staffs. Total project costs are $275.2 million. Detailed tables follow below. Table HR4 Summary of Short- and Long-term Highway and Roadway Project Costs Project Type Funding Source Amount ($ million) Short-Term Various (not STIP or SHOPP) $33.9 STIP $73.4 SHOPP $159.3 Illustrative (no funding source) $7.7 Short-term Total $274.3 Long-Term Various $20.8 TOTAL $295.1 HCAOG Page HR-10 Highway and Roadway Systems Element
50 Short-Term Projects Not Funded by STIP or SHOPP Table HR5 lists short-term planned projects identified by City and County staff as not funded by STIP or SHOPP, but which do have a funding source ( constrained projects). Table HR5 Short-term Projects not Funded by STIP or SHOPP Project Humboldt County Alderpoint Road Benbow Drive Blue Slide Road Briceland-Thorne Road Butler Valley Road Cathey Road Elk Creek Road Kneeland Road Lower Cappell Road Mattole Road Sprowel Creek Road Thomas Road Tompkins Hill Road Trinidad Scenic Dr. Zenia Bluff Road Honeydew Martin Ferry Description (Program) Storm Damage Repair Storm Damage Repair Cost ($000) 6, Storm Damage Repair 41 Storm Damage Repair 67 Storm Damage Repair 220 Storm Damage Repair 160 Storm Damage Repair 392 Storm Damage Repair 334 Storm Damage Repair 95 Storm Damage Repair 1,194 Storm Damage Repair 139 Storm Damage Repair 855 Storm Damage Repair 103 Storm Damage Repair 385 Storm Damage Repair 50 TOTAL 10,509 Bridge Replacement 6,000 Bridge Repair 5,950 Funding Source Year Federal Highways Admin. (FHWA) with Caltrans 2008/09 Federal Emergency Management Agency (FEMA) and Office of Emergency Services (OES) 2008/09 FHWA (o/s Caltrans) 2008/09 FHWA (o/s Caltrans) 2008/09 FHWA (o/s Caltrans) 2008/09 FEMA/OES 2008/09 FHWA (o/s Caltrans) 2008/09 FHWA (o/s Caltrans) 2008/09 FEMA/OES) 2008/09 FHWA (o/s Caltrans) 2008/09 FHWA (o/s Caltrans) 2008/09 FEMA/OES 2008/09 FHWA (o/s Caltrans) 2008/09 FEMA/OES 2008/09 FHWA (o/s Caltrans) 2008/09 Highway Bridge Program 2008/09 Highway Bridge Program 2008/09 HCAOG Page HR-11 Highway and Roadway Systems Element
51 Description Cost Project Funding Source Year (Program) ($000) Waddington Road Box Culvert 978 Highway Bridge Program 2008/09 Trinidad Scenic Drive Williams Creek Briceland -Thorne Road Grassy Creek Repair & Realignment 900 Bridge Replacement 1,028 TOTAL 14,856 Curve Correction 900 Culvert Replacement 335 BIA 2008/09 Highway Bridge Program 2008/09 High Risk Rural Roads (HRRR) 2008/09 Fish Passage 2008/09 Mill Creek 120 Fish Passage 2008/09 Indian Creek 800 Fish Passage 2008/09 Total 2,155 Humboldt County TOTAL 27,520 Arcata "H" Street; Sunset Avenue; and Alliance Road, 29th Street to Overlays 500 Spear Avenue Prop. 1B 2008 Residential City 2008 Maintenance 100 Program 207 Funds (Gas Tax) Annual Giuntoli Lane - Boyd Road to West End Rehabilitation 105 Road Gas Tax & General Fund 2008 Janes Road - Spear Avenue to Upper Bay Rehabilitation 80 Road Gas Tax & General Fund 2009 Spear Avenue - Ribeiro Lane to Overlay 75 Alliance Road Gas Tax & General Fund 2009 Samoa Blvd. - Union Street to Bayside Rehabilitation 700 Road Gas Tax & General Fund th Street - "G" Rehabilitation 30 Street to "F" Street Gas Tax & General Fund 2010 St. Louis Overcrossing - Janes Creek Meadows to L Overlay 60 K Wood Blvd. Gas Tax & General Fund 2010 Alliance Road - 27th Overlay 164 Street to 29th Street Gas Tax & General Fund 2010 Spear Avenue - Janes 380 Road to Ribeiro Lane Overlay Gas Tax & General Fund 2014 HCAOG Page HR-12 Highway and Roadway Systems Element
52 Ericson Way - Belle Falor Ct. to Giuntoli Lane L K Wood Blvd. - 14th Street to Granite Avenue Valley East Blvd. - Giuntoli Lane to end Valley West Blvd. - Giuntoli Lane to end Blue Lake Fourth Avenue Ferndale Fifth St. Arlington Ave. Rehabilitation 95 Rehabilitation 380 Rehabilitation 150 Rehabilitation 160 Arcata TOTAL 2,979 Reconstruction (Sidewalks, Drainage, Asphalt) 1,000 Pavement Rehabilitation 138 from Shaw Ave. to Arlington Ave. Pavement Rehabilitation 98 from Fifth St. to Main St. Ferndale TOTAL 236 Gas Tax & General Fund 2013 Gas Tax & General Fund 2013 Gas Tax & General Fund 2009 Gas Tax & General Fund 2009 Community Development Block Grant Proposition 1B funds Proposition 1B funds and gas tax Fortuna Ross Hill Road Reconstruction 421 Proposition 1B (anticipated) Rio Dell Third and Fourth Rehabilitation CDBG 877 Avenue 2008 Trinidad Road, sidewalk, ramp, and pedestrian improvements 416 Main and Trinity (School to Hwy 101) Federal 2008 Construction of 260 Park and Museum access road State and Federal 2008 Road, sidewalk, ramp, pedestrian improvements, 180 TEA Gateway Project and beautification. State 2008 Trinidad TOTAL 856 OVERALL TOTAL 33,889 HCAOG Page HR-13 Highway and Roadway Systems Element
53 Short term (0-10 years) STIP-Funded Projects Table HR6 lists the STIP projects and costs. The total cost of these projects is $69.3 million. Table HR6 Short term (0-10 years) STIP Projects Roadway Description Cost ($000) Program Fiscal Year Caltrans US 101/SR 36 Interchange and Frontage Road 21, /09 US 101/SR 36 Interchange, Construction 3, US 101 Eureka-Arcata corridor improvement 5, /08 Caltrans TOTAL 29,325 Humboldt County Old Arcata Road/Myrtle Avenue Three Corners to Stephens Lane - shoulder widening and roadway rehabilitation 5, /09 Fieldbrook Road PM0.0 to 2.8 overlay /09 Central Avenue Shoulder widening Fieldbrook Road Herrick Avenue Widen shoulders from Turner Draw to Bella Vista PM 3.5 to PM shoulder widening for pedestrian & bicycle Construct sidewalks to infill existing system / / /09 Humboldt Hill Road Hwy 101 to PM overlay /09 Indianola Cutoff Murray Road Myrtle, Harris and Lucas Railroad Crossings City of Eureka to Myrtle Ave - Reconstruct & overlay Murray R. PM 5.1 to Fieldbrook Rd PM 2.8 overlay Construct sidewalks to infill existing system Reconstruct railroad crossings at various locations / / / /10 Redwood Drive Redway to Hwy overlay /09 Union Street and Sea Street City of Eureka to Higgins Street - shoulder widening and roadway rehabilitation 2, /10 Humboldt County TOTAL 13,504 HCAOG Page HR-14 Highway and Roadway Systems Element
54 Roadway Description Cost ($000) Program Fiscal Year Arcata Old Arcata Road/Samoa Boulevard Foster Avenue to Sunset Boulevard Extension Various Locations Highway 255 and Highway 101 Intersections Blue Lake Eureka Various Waterfront Drive Old Arcata Road between Samoa Blvd./US 101 interchange and Jacoby Creek Rd. Rehabilitate roadway, construct bike lanes, sidewalks and traffic calming improvements at major intersections and school pedestrian crossings, drainage improvements. Construct new roadway and bike and pedestrian pathway connecting Foster Ave to Sunset Ave. between Eastern Ave and Jay St. Rehabilitate existing roadway with bike lanes and sidewalk where needed. Install traffic calming/pedestrian improvements at Sunset Railroad crossings, 16 locations, rehabilitation 1, /12 2, /09, 09/10, 01/ /08 Roundabouts (with Caltrans) 1, /14 Arcata TOTAL 4,683 General roadway rehabilitation and repair in downtown, ped and bike improvements Waterfront Drive Connection Phase II G to J Streets /08 4, /12 Eureka Waterfront Trail Phase A: Construct Class I multi-use tral from Del Norte to Truesdale 1, /15 Hawthorn, Felt, and 14 th Highland and Koster Streets Hawthorn Street between Broadway and Felt Street, Felt Street between Hawthorn and Del Norte Street, and 14 th Street between M Street and West Avenue. Roadway rehabilitation, including bicycle improvements and ADA compliant sidewalks Highland Avenue between Broadway and Utah Street and Koster Street between Del Norte and Washington Street. Roadway rehabilitation including ADA compliant sidewalks / /14 HCAOG Page HR-15 Highway and Roadway Systems Element
55 Roadway Description Cost ($000) Program Fiscal Year Fortuna Rio Dell Rohnerville Road Widening between Newberg and Strong s Creek Eureka TOTAL 6, /09 Rohnerville Road Widening between Redwood and School /09 Fortuna TOTAL 1,267 Wildwood Avenue and View Street Trinidad Azalea Avenue, Pacific Avenue Trinidad Park & Museum Access HCAOG Paving from Side Street to Eagle Prairie Bridge Reconstruction - Azalea from Edwards to Pacific, and Pacific (approx. 500 ft.) / Trinidad TOTAL /08, 08/ /08, 08/09 HCAOG Planning, programming and monitoring /11 OVERALL TOTAL 59,170 Short-term (0-10 years) SHOPP-Funded Roadway Projects Short-term improvement projects for the State Highway System will be funded through the Caltrans SHOPP and "Minor" programs. Although Caltrans is responsible for these programs, the County may have limited input into those projects that are programmed for SHOPP funding. Table HR7 lists the short-range SHOPP projects programmed by Caltrans in the 2008 SHOPP through 2012; total cost is $159.3 million. Table HR7 Short-Term Highway Operations and Rehabilitation Projects (SHOPP; 2008) Route Location/Description Total ($000) FY Category 101 Near Phillipsville, from 1.4 miles south of Richardson Grove to south of Prairie Creek Park at various locations. Reconstruct guard railing. 11, /11 Collision Reduction HCAOG Page HR-16 Highway and Roadway Systems Element
56 Route Location/Description Near Arcata, from south of 14th Street to north of Sunset Ave; also 3.5 miles south of Del Norte County line (PM 133.6). Repair slipout, realign roadway, install drainage. Near McKinleyville, at the Vista Point. Required wetland mitigation. In and near Rio Dell, from Eel River Bridge and overhead to 0.5 mile south of Van Duzen River Bridge. Rehabilitate roadway. Near Eureka, from Eureka Slough Bridge to Arcata overhead. Rehabilitate roadway. Near Weitchpec, from 8.9 miles east of Johnsons to 3.7 miles west of Route 96. Replace bridges. Near Johnsons, from Wautec to Weitchpec at various locations. Install guardrail. Near Hoopa, from 0.6 mile east of Cappell Creek Bridge to Rube Creek Bridge. Construct retaining wall, realign roadway, install drainage. In Humboldt County, at various locations 1.9 miles west of Cappell Creek Bridge to 0.9 mile west of Route 96. Repair slipouts, drainage and roadways. Near Weitchpec, from 3.4 miles west to 2.6 miles west of Cappell Creek Bridge. Repair slipouts, drainage and roadways. In Humboldt County, at various locations from Ohman Creek Bridge #4-7 to Bear Creek Bridge #4-12. Replace bridge rails and widen shoulder. Near Miranda, 0.6 mile south of Post Office; also 0.2 mile north of Bridge Creek. Repair slipouts. Near Miranda, 1.3 miles south of Post Office; also 0.8 mile south of Post Office. Repair slipouts. Near Redcrest, at various locations 1.6 miles north of Mattole Road to 0.8 mile south of Bear Creek Bridge. Repair slipouts. Near Miranda, at 0.3 mile south of Miranda Bridge Road; also 0.4 mile north of Bridge Creek #4-9. Repair slipouts. West of Willow Creek, 0.8 mile west of Redwood Creek Bridge. Construct wall. Total ($000) FY Category 1, /09 Emergency Response 1, /09 Emergency Response 20, /09 40, /12 Roadway Preservation Roadway Preservation 12, /09 Bridge Replacement 5, /11 Collision Reduction 1, /10 Emergency Response 1, /09 Emergency Response 2, /10 Emergency Response 10, /12 Bridge Replacement 6, /10 Emergency Response 4, /09 Emergency Response /10 Emergency Response /09 Emergency Response 1, /09 Emergency Response HCAOG Page HR-17 Highway and Roadway Systems Element
57 Route Location/Description Near Blue Lake, at 1.8 miles east of Buckley Road; also at 0.1 mile east of County Road 375 Right. Repair slipouts. Near Bridgeville, from 0.6 to 0.8 mile east of Van Duzen River Bridge. Repair slipout. Near Bridgeville, from 0.6 mile west of Bridgeville Post Office to 0.3 mile east of Little Larabe Creek Bridge. Repair slipouts. Near Bridgeville, from 3.8 to 4.3 miles east of Little Larabe Creek Bridge. Repair slipout. Near Bridgeville, 0.1 mile west of Van Duzen River Bridge. Repair slipout. Near Bridgeville, 1.0 mile west of Van Duzen River Bridge. Repair slipout. Near Carlotta, from 0.7 mile to 2.5 miles east of Carlotta Post Office. Widen shoulders. Near Hoopa, from 0.8 mile south of Rock Chute Bridge to 1.9 miles north of Sidehill. Install guardrail. Near Willow Creek, from 0.2 mile west of Pipeline overcrossing to 2.6 miles west of Klamath River. Reconstruct roadway, repair slope and drainage. Near Weitchpec, from 0.1 mile west of Route 169 west to 0.4 mile east of Weitchpec Road. Repair roadway and construct drainage gallery wall. Near Orleans, from 0.3 mile west of Beach Access Road to 0.8 mile west of Siskiyou County line. Repair roadway and drainage. Near Weitchpec, 1.2 miles west of Klamath River Bridge. Repair slipout. Total ($000) FY Category 3, /09 Emergency Response 3, /10 Emergency Response 1, /10 Emergency Response 1, /09 Emergency Response 2, /09 Emergency Response 2, /10 Emergency Response 9, /11 Mobility 4, /10 Collision Reduction /10 Emergency Response 1, /09 Emergency Response 1, /09 Emergency Response 2, /09 Emergency Response 96 Near Hoopa, at 0.3 mile east of Tish Tang Sidehill Viaduct. Repair slipout. SHOPP TOTAL 159,338 3, /09 Emergency Response Long-term (11-20 years) Roadway Projects Table HR8 lists the proposed candidate long-term improvement projects and their costs for Humboldt County. The projects identified in the table are necessary to maintain service levels HCAOG Page HR-18 Highway and Roadway Systems Element
58 and accommodate projected traffic growth over the next twenty years. Total Cost is $68.05 million. HCAOG Page HR-19 Highway and Roadway Systems Element
59 Table HR8 Long-term (11-20 years) Roadway Projects Route Description Cost ($000) Fiscal Year Humboldt County Walnut & Hemlock Intersection Fern Street Extension McKay Tract Connector Roundabout or signals with dedicated turn pockets 1, Complete connection from Walnut to Campton 1, Northerly connection to Harris at Hubbard 2, Campton Road Widening Fairway Drive Connector Reardon Ranch Road Intersection at Harris & Harrison Walnut Drive Eliminate parking and improve pedestrian facilities Construct new connector to Fairway Drive in vicinity of Lunbar Hills Construct new connector to Elk River Road from area behind Westgate Widen intersection to better deal with left and right turning movement Intersection improvements at Cypress and Campton 1, , , , School Road - McKinleyville Avenue Extend McKinleyville Ave directly to School Rd. 1, School Road Widening Widen from Fischer to Washington to provide sidewalks, bike lanes, and turn lanes 1, McKinleyville Avenue Reconstruct & overlay Murray to Halfway St. Conne London Drive Connector Extend London Drive to South Broadway Humboldt Hill to Tompkins Hill Connect Humboldt Hill Road to Tompkins Hill Rd. 1, Herrick and Elk River Freshwater and Myrtle Intersection Signalize intersection with left turn pockets Construct a roundabout OVERALL TOTAL 20,788 HCAOG Page HR-20 Highway and Roadway Systems Element
60 Illustrative (Unconstrained) Roadway Projects The following table lists roadway projects identified by City staffs that are currently without funding but which have been identified as necessary to maintain roadway condition, reduce congestion, and improve safety. Total cost for these projects is estimated at $9.4 million. Table HR9 Illustrative (Unconstrained) Roadway Projects City Project Description Cost ($000) Greenwood Avenue Pavement Rehab or Reconstruction 1,000 Railroad Avenue Pavement Rehab or Reconstruction 2,000 Blue Lake Hatchery Road Pavement Rehab or Reconstruction 2,000 I Street Sidewalks, Pavement Rehab or Reconstruction 1,000 Eureka Eliminate northbound Fairfield entering intersection and install new traffic signal Wabash Street at Hawthorne Street 500 Bluff St. from Craig St. E to City Limits Pavement Rehab or Reconstruction 133 Eugene St. from Berding Ferndale Street to Harrison Ave. Pavement Rehab or Reconstruction 18 Lincoln St. from Grant Ave. to City Limits Pavement Rehab or Reconstruction 49 Herbert Street from Berding Street to Rose Ave. Pavement Rehab or Reconstruction 49 Rio Dell Wildwood Avenue Downtown Roadway Improvement Project 800 Douglas Street Overlay Paving Project 50 Trinidad Stagecoach Road Paving (cemetery to city limits) 80 Frontage Road Crack Sealing 20 TOTAL 7,699 FINANCING Federal, State, and local funding sources and programs which are driven by State and Federal fuel taxes, and some sales taxes, available to the Humboldt County region are described in the following section. Federal Sources/Programs for Roadways and Related Facilities Safe, Accountable, Flexible, and Efficient Transportation Equity Act: A Legacy for Users (SAFETEA-LU): The act authorizes $244 billion nationwide for transportation between 2005 and This represents a 42 percent increase in average annual funding over the previous program, the Transportation Equity Act for the 21 st Century (TEA-21). The general structure of HCAOG Page HR-21 Highway and Roadway Systems Element
61 SAFETEA-LU is relatively similar to TEA-21. The act also guarantees donor states such as California a minimum rate of return on state fuel tax contributions annually, with the rate increasing from 90.5 percent in 2006 to 92 percent in Additionally, the act includes a number of provisions that influence the way that transportation facilities are planned, built, and administered. Specifically, SAFETEA-LU encourages private investments and partnerships in constructing transportation facilities, in addition to providing opportunities for environmental streamlining, design-build contracting, and private toll projects. A summary of key federal programs is provided below. National Highway System (NHS): The NHS funding level is $30.5 billion nationwide over the life of SAFETEA-LU. California would receive 9.6 percent of NHS funds or $2.8 billion over the life of SAFETEA-LU. The formula for distribution of funds is based on lane-miles of principal arterials (excluding Interstate), vehicle-miles traveled on those arterials, diesel fuel used on the State s highways, and per capita principal arterial lane miles. The Act expands eligibility of NHS funding to include environmental restoration and pollution abatement to minimize the impact of transportation projects, control of noxious weeds and aquatic noxious weeds, and establishment of native species. Surface Transportation Program (STP): The STP provides flexible funding that may be used by States and localities for projects on any Federal-aid highway, including the NHS, bridge projects on any public road, transit capital projects, and public bus terminals and facilities. The Act expands STP eligibilities to include advanced truck stop electrification systems, high accident/high congestion intersections, and environmental restoration and pollution abatement, control of noxious weeds and aquatic noxious weeds, and establishment of native species. A total of $32.5 billion in STP funds is authorized through California is expected to receive $3.2 billion in STP funds. Funds will continue to be distributed among the States based on lane miles of Federal-aid highways, total vehicle-miles traveled on those Federal-aid highways, and estimated contributions to the Highway Account of the HTF. Each State must set aside a portion of their STP funds (10 percent or the amount set aside in 2005, whichever is greater) for transportation enhancements activities. Transportation Enhancement Activities (TEA): TEA funds represent 10 percent of the statewide STP funds. TEA offers broad opportunities and federal dollars to take unique and creative actions to integrate transportation into local communities and the natural environment. The Program is designed to promote livable communities and strengthen partnerships. Areas eligible for TEA funding include the following 12 categories: 1. Provision of facilities for pedestrians and bicycles. 2. Provision of safety and educational activities for pedestrians and bicyclists. 3. Acquisition of scenic easements and scenic/historic sites. 4. Scenic or historic highway programs (including the provisions of tourist and welcome center facilities). 5. Landscaping and other scenic beautification. 6. Historic preservation. HCAOG Page HR-22 Highway and Roadway Systems Element
62 7. Rehabilitation and operation of historic transportation facilities (including historic railroad facilities and canals). 8. Preservation of abandoned railway corridors (including the conversion and use thereof for pedestrian or bicycle trails). 9. Control and removal of outdoor advertising. 10. Archaeological planning and research. 11. Environmental mitigation to address water pollution due to highway runoff and reduce vehicle-caused wildlife mortality while maintaining habitat connectivity. 12. Establishment of transportation museums. HCAOG is responsible for ranking and programming TEA projects countywide, in the same manner as for RTIP projects, but the California Transportation Commission bears final authorization. Bridge Program: A total of $21.6 billion is authorized nationwide for this program through 2009 to enable States to improve the condition of their eligible highway bridges over waterways, other topographical barriers, other highways and railroads. California will receive $1.9 billion. Each State must spend at least 15% of its bridge apportionment for bridges on public roads that are not Federal-aid highways (off- system bridges). The discretionary bridge program was funded only through 2005; beginning in 2006, $100 million was to be set aside annually to fund designated projects. Railroad/Highway At-Grade Crossing Program: The purpose of this program is to reduce the number and severity of highway accidents by eliminating hazards to vehicles and pedestrians at existing railroad crossings. Railroad/highway at-grade crossing improvement projects include, but are not limited to, installation and upgrade of railroad protection systems to a state-of-the-art condition at grade crossings and grade crossing eliminations. Eligibility is rather strict, as there are several requirements to qualify, including the following: Project must be on a public road. Project must be sponsored by a city or a county or a railroad company. The railroad/highway crossing must be included on the California Public Utilities Commission s (CPUC) Recommended List of Public Crossings in California for Improved Crossing Protection with Federal Funding. Projects (or lump sums to cover all projects) must be included in the appropriate Federal Transportation Improvement Program (FTIP) developed by a Metropolitan Planning Organization (MPO) and the Federal Statewide Transportation Improvement Program (FSTIP) approved by the Federal Highway Administration (FHWA). Since the beginning of the program in 1974, $3.8 billion has been obligated for grade crossing improvements. Annually, $155 million is allocated to the states. Federal Lands Highways Program (FLHP): The Federal Lands Highways program authorizations thru 2009 a total of $4.5 billion for Indian Reservation Roads (IRR), Park Roads and Parkways, Public Lands Highways (discretionary and Forest Highways), and Refuge Roads programs. FLHP funds can be used for transportation planning, research, engineering, and HCAOG Page HR-23 Highway and Roadway Systems Element
63 construction of highways, roads, parkways and transit facilities within public lands, national parks, and Indian reservations. In addition, FLHP funds can be used as the State/local match for most types of Federal-aid highway funded projects. New eligible uses of Public Lands Highways funds include up to $20 million per year for maintenance of Forest Highways, $1 million per year for signage identifying public hunting and 12 fishing access, and $10 million by the Secretary of Agriculture to facilitate the passage of aquatic species beneath roads in the National Forest System. SAFETEA-LU provides significant changes in the IRR program. IRR funding may be provided via a funding agreement in accordance with the Indian Self-Determination and Education Assistance Act to a requesting Indian tribal government(s) that has satisfactorily demonstrated financial stability and financial management to the Secretary. IRR funds shall only be expended on projects identified in a transportation improvement program approved by the Secretary. The Secretary, in cooperation with the Secretary of the Interior, is required to complete a comprehensive national inventory of transportation facilities that are eligible for assistance under the IRR program within 2 years of enactment of SAFETEA-LU. Up to 25% of a tribe s IRR program funds may now be used for the purpose of IRR system maintenance as defined in 25CFR170, although the Bureau of Indian Affairs (BIA) will retain primary responsibility for IRR maintenance programs through DOI appropriations. Funding for the BIA s program management and oversight expenses is provided, although this amount now includes BIA project-related administrative expenses. An Indian tribe may enter into a road maintenance agreement with a State to assume the responsibilities of the State for roads in and providing access to Indian reservations. A new position in DOT is established for a Deputy Assistant Secretary of Tribal Government Affairs. A total of $70 million is authorized separately (no longer a set-aside) through 2009 for projects to replace structurally deficient or functionally obsolete IRR bridges. U.S. Forest Service: The U.S. Forest Service (USFS) places a fee on all timber receipts from federal lands. Humboldt County and the school districts receive half of these receipts, and the USDF receives the remaining half. These monies become part of the County Road Fund and are used for operational improvements. Safe Route to Schools: Authorized by Section 1404 of SAFETEA-LU the federal Safe Routes to School (SRTS) Program came into effect in August of 2005 and is set to expire September This federal funding program emphasizes community collaboration in the development of projects that target grades K-8, and projects that incorporate elements of the 5 E s education, encouragement, engineering, enforcement, and evaluation. The program seeks to increase the number of children who walk or bicycle to school. Eligible agencies include state, local, and regional agencies; cities and counties; non-profit organizations; school districts; and Native American Tribes. Eligible projects include stand alone infrastructure within 2 miles of a grade school or middle school or non-infrastructure projects. Emergency Relief Program (ER): Congress authorized in Title 23, United States Code, Section 125, a special program from the Highway Trust Fund for the repair or reconstruction of Federal-aid highways and roads on Federal lands which have suffered serious damage as a result HCAOG Page HR-24 Highway and Roadway Systems Element
64 of natural disasters or catastrophic failures from an external cause. The funds received through the ER program are intended to supplement the commitment of resources by States, their political subdivisions, or other Federal agencies to help pay for unusually heavy expenses resulting from extraordinary conditions. Damage to highways must be server, occur over a wide area, and result in unusually high expenses to the highway agency in order to be eligible for ER funds. In addition, catastrophic failure due to an external cause is based on the criteria that the failure was not the result of an inherent flaw in the facility, but was sudden, caused a disastrous impact on transportation services, and resulted in unusually high expenses to the highway agency. The Federal Highway Administration can provide up to $100 million in ER funding to a State for each natural disaster or catastrophic failure that is eligible for ER funding. For a disaster that exceeds the $100 million per State cap, Congress may pass special legislation lifting the cap for that disaster. State Sources/Programs for Roadways and Related Facilities As described earlier, past state budget problems have directly impacted the core state programs supporting transportation, including the State Highway Account and Proposition 42. State support for transportation in general has been waning, especially from loans taken from transportation to offset the state deficit, without guaranteed payback. The overall state program consists of five main broad categories: 1. State Highway Operations and Protection Program (SHOPP) which is funded off the top from the State Highway Account; 2. Regional Transportation Improvement Program (RTIP) funded from 75% of the STIP; 3. Interregional Transportation Improvement Program (ITIP) funded from 25% of the STIP; 4. Traffic Congestion Relief Program (TCRP) and Proposition 42 funded from the retail sales tax on gasoline and diesel. 5. Prop 1B--The Highway Safety, Traffic Reduction, Air Quality, And Port Security Bond Act Of 2006 Brief summaries of these programs are provided below along with other potential state funding sources. State Highway Operations & Protection Program (SHOPP): The purpose of the SHOPP program is to maintain the integrity of the State Highway System. Funding for this program is provided through gas tax revenues deposited into the State Highway Account. Projects are nominated within each Caltrans District office and are sent to Caltrans Headquarters for programming. Final project determinations are subject to CTC approval. Several categories of projects are contained in the SHOPP, including collision reduction, bridge preservation, roadway preservation, roadside preservation, mobility enhancement, and preservation of other transportation facilities related to the state highway system. SHOPP projects are based on statewide priorities within each program category for state highways (i.e., safety, rehabilitation, operations, etc) within each Caltrans District and are not subject to county minimums. SHOPP funds cannot be used for capacity-enhancing projects. HCAOG Page HR-25 Highway and Roadway Systems Element
65 Minor Program: The Minor A Program is a district-discretionary SHOPP program based on annual statewide/district allocations. This program provides some level of discretion to Caltrans District Offices in funding projects up to $1,000,000. Minor B funds are used for projects up to $147,000. The advantage of this program is the streamlined nature of the funding process and the local nature of the decisionmaking. Funding is competitive within the funds allocated to a given District. State Transportation Improvement Program (STIP): The STIP is a five-year capital improvement program to assist the state and local entities to plan and implement transportation improvements and to utilize resources in a cost effective manner. All STIP projects must be capital projects (including project development costs) needed to improve transportation, including improvements to mobility, accessibility, reliability, sustainability and safety. A Fund Estimate is prepared every two years by Caltrans and approved by the California CTC. Regional agencies and Caltrans must submit their project lists by the end of the year. The California CTC then adopts the STIP by the following April. In August 2008, CTC adopted Resolution G (TE Program Reform) integrating the Transportation Enhancements (TE) program into the STIP. The 2008 STIP Guidelines further clarify and direct programming of TE funded projects, or project enhancement elements, into the STIP. From passage of SB 45, the STIP is split 75 percent to Regional Transportation Improvement Program (RTIP), decided by regional agencies such as HCAOG, and 25 percent to Interregional Transportation Improvement Program (ITIP), projects nominated by Caltrans. Below is a description of each program. Regional Transportation Improvement Program (RTIP): The RTIP receives 75 percent of STIP funding. The 75 percent is further subdivided by formula of population (25 percent) and road mileage (75 percent) into county shares. A primary source of funding is the motor vehicle fuel excise tax and the retail sales tax on motor vehicle fuel. Interregional Transportation Improvement Program (ITIP): The ITIP receives the remaining 25 percent of STIP funding. This program is controlled by Caltrans, but regional agencies can provide input and seek co-funding on the specific ITIP projects for their region. Caltrans nominates projects totaling the first 10 percent of the ITIP, including State highways, intercity passenger rail, mass transit guideway, or grade separation projects. Non-capital costs for transportation system management or transportation demand management may be included where Caltrans finds the project to be a costeffective substitute for capital expenditures. The remaining 15 percent is limited by statute to intercity rail projects (including interregional commuter rail and grade separation projects) and to improvements outside urbanized areas on interregional road system routes (which are specified in statute), selected by Caltrans. HCAOG Page HR-26 Highway and Roadway Systems Element
66 Prop 1B: The Highway Safety, Traffic Reduction, Air Quality, and Port Security Bond Act of 2006, approved by the voters as Proposition 1B on November 7, 2006, authorized nearly $20 billion in general obligation bond proceeds to be available for the following programs: Corridor Mobility Improvement Account (CMIA) A total of $4.5 billion is to be allocated to this program. The funds in the CMIA are to be available to the CTC for allocation for performance improvements on the state highway system or major access routes to the state highway system. The CMIA presents a unique opportunity for the state s transportation community to provide demonstrable congestion relief, enhanced mobility, improved safety, and stronger connectivity to benefit traveling Californians. STIP Augmentation Two billion dollars will be allocated to the STIP program to augment funds otherwise available for the STIP from other sources. Funding constraints in the 2006 STIP cycle prevented or delayed the funding of many important transportation improvement projects. The primary intent of STIP augmentation is to advance programming of funds for STIP projects that can be delivered prior to the adoption of the 2008 STIP. Port Air Quality One billion dollars will be available to CARB for emission reductions from activities related to the movement of freight along trade corridors. State-Local Partnership Program Account Over the period of five years, the California Transportation Commission (CTC) will use $1 billion in funds to match dollar-for-dollar local funds for eligible projects. Local Bridge Seismic Retrofit This program will provide the11.5 percent match for federal Highway Bridge Replacement and Repair funds available for seismic retrofit of local bridges. Highway-Railroad Crossing Safety Account This account will provide $250 million for completion of high-priority grade separation and railroad crossings safety improvements. State Highway Operations and Protection Program (SHOPP) An additional $500 million will be available for SHOPP projects. Traffic Light Synchronization This account will provide $250 million to fund traffic light synchronization or other technology-based solutions. Port, Harbor and Ferry Terminal Security The Office of Emergency Services will allocate $100 million to award grants for port, harbor and ferry terminal security improvements. Transit - $3.6 billion will be allocated to transit projects. Local Streets and Roads - $2 billion will be allocated by the State Controller for local streets and roads projects. The formula distribution of funds is based on the number of vehicles registered in the county relative to all counties in the State (75 percent of funds) and the number of county maintained road miles relative to all county maintained road miles in the State (25 percent of funds). Timing and exact amounts of these allocations are being debated by the California legislature. Environmental Enhancement and Mitigation (EEM) Program: Similar to TEA, the EEM offers funding to remedy environmental impacts of new or improved transportation facilities. Applicants may apply for these funds to undertake environmental enhancement and mitigation projects which are directly or indirectly related to the environmental impact of modifying HCAOG Page HR-27 Highway and Roadway Systems Element
67 existing transportation facilities, or for the design, construction or expansion of new transportation facilities. The related transportation facility must be modified or constructed in 1990 or later and the EEM project must be over and above the required mitigation for the related transportation project. All participating cost incurred on a project are funded in arrears on a reimbursement basis of the states proportionate share of actual costs. No matching funds or cost shares from the applicant or other funding sources are required to apply for an EEM grant, however, projects that include the greatest proportion of other monetary sources of funding will be rated highest. Grants are generally limited to $350,000. Highway-Railroad Grade Separation Program: The purpose of the Program is to improve safety and to expedite the movement of vehicles by eliminating highway-rail crossings at grade. Agencies with jurisdiction over public roadways that cross railroad tracks are eligible to receive funds under this program. Three types of projects are considered: 1. The alteration or reconstruction of existing grade separations; and 2. The construction of new grade separations to eliminate existing or proposed grade crossings; and 3. The removal or relocation of roads or tracks to eliminate existing grade crossings. On grade separations, the project includes all approaches, ramps, connections, drainage, and other construction required to make the grade separation operable and to effect the separation of grades. Annual budget can be $15 million for grade separation projects under this program. In general, State participation per project is limited to $5 million or 80 percent of the project cost, whichever is less. There is also a matching requirement of 10 percent local and 10 percent railroad. The Public Utilities Commission (PUC), prior to July 1 of each year, establishes a list of projects, in priority order, which it has determined to be the most urgently in need of separation or alteration. The criteria for project prioritization are established by the PUC. Allocations for projects are made by the California Transportation Commission (CTC), although this authority is currently delegated to Caltrans. A project must meet certain readiness criteria in order to receive an allocation the most important being that an agreement with the railroad must be in place. Petroleum Violation Escrow Account (PVEA): Funds from the PVEA are intended to result in energy savings or displacement of nonrenewable energy. PVEA funds are available as a result of Federal Court decisions and settlement agreements against a number of oil companies and producers which ordered refunds to the States for petroleum product price overcharges. PVEA projects must result in energy savings or displace nonrenewable energy and provide restitution to the motoring public who were injured by the oil price overcharges. PVEA funding cannot be used to: Supplant funds which are already available for the proposed project; or Fund projects with restitution too far into the future; or Fund projects whose primary concern is environmental, safety, or has very little energy saving; or Fund studies because they might not result in project implementation, or fund administrative expenses that exceed 5 percent. HCAOG Page HR-28 Highway and Roadway Systems Element
68 Annual funding varies. PVEA funds must be allocated to transportation projects through special legislation carried in behalf of Caltrans for inclusion in the Budget Act or for allocation to local agencies. Upon legislative approval, the Department of Finance determines which specific court case has funds available to fund the project. Each project must be submitted as a proposal to the California Energy Commission and approved by the U.S. Department of Energy (DOE). Funds can only be encumbered following DOE approval. Any project costs incurred prior to DOE approval will not be paid. Traffic Congestion Relief Program/Proposition 42: The general electorate in March 2002 overwhelmingly voted in favor of dedicating retail sales tax revenues from the sale of gasoline to transportation, indefinitely, thereby expanding the Traffic Congestion Relief Program (TCRP) created in Proposition 42 revenues go toward several programs, including specific projects selected by the Governor, State highways, local streets and roads, and transit. The percentage of revenues allocated to each program is as follows: Governor s Traffic Congestion Relief Program ($678 million per year through 2008) State Highways (40% of remaining revenues) Local Streets (20% of remaining revenues) County Roads (20% of remaining revenues) Transit (20% of remaining revenues - 10% goes to intercity rail, 10% for local transit) Gas Tax Subventions: The 18 cent per gallon tax on gasoline and diesel fuel is divided among several programs, including the State Highway Account which funds the SHOPP and STIP, and local city and county street and road maintenance, often referred to as subventions. State law designates the amount of revenues that are allocated to each program. In turn, formulas based on mileage of maintained roads, vehicle registration, and population determine the share of subventions to each county and city. Safe Routes to School: Established in 1999, the State-legislated Safe Routes to School (SR2S) program came into effect with the passage of AB In 2001, SB 10 was enacted which extended the program for three additional years. In 2004, SB 1087 was enacted to extend the program three more years. And in 2007, AB 57 was enacted to extend the program indefinitely. Eligible applicants include cities, counties, and school districts. Eligible projects include infrastructure projects located in the vicinity of a school; projects must be completed within four state fiscal years after project funds are allocated. Targeted beneficiaries include children in grades K through 12. Regional and Local Sources and/or Programs for Roadways As the Regional Transportation Planning Agency (RTPA) for Humboldt County, HCAOG administers several state and federal government fund sources. Transportation Development Act (TDA) funds: Since 1972, TDA funds are generated from a ¼ cent of the state retail sales tax. Revenues from the sales tax are deposited into the Local Transportation Fund (LTF) which is one of two programs under TDA. These funds are apportioned to the Association's member entities on a population percentage basis. The primary use of TDA funds is for public transportation; however, streets and roads are eligible for the LTF HCAOG Page HR-29 Highway and Roadway Systems Element
69 revenue after HCAOG undertakes the annual transit unmet needs process. In recent years, little LTF remains available for streets and roads at the end of the allocation process. TDA revenue in Humboldt County has grown an average 4 percent annually since 1996, which is slightly above the rate of inflation. The state also provides funds from the Public Transportation Account (PTA). This is divided between regions for State Transit Assistance, which is the second program under TDA, and Caltrans for state rail commute/passenger programs. Humboldt County Transportation Systems: Revenues available to support the county road system, including gas tax subventions, are projected to increase slightly in the short-term; however, the actual purchasing power of the available dollars will likely further decline as a result of increased inflation and better auto fuel economy. The funds available for new facilities have become virtually non-existent at all levels of government, forcing a focus on maintenance of current levels of service. The Humboldt County Public Works Department displays similar conditions as shown by their limited programming of transportation construction dollars. City of Eureka Transportation Systems: The City of Eureka will continue to face long-term financial challenges in providing for new facilities projects. Available local revenues will be focused on street maintenance, e.g. overlays, slurry seals and crack filling. Arcata City Streets: General fund and other city revenues range from 40 percent to 50 percent of the total revenues. Influencing factors include limited federal funding for city streets and static state revenues. Transportation Development Act funds available are used for public transit. The city is currently discussing a Local Transportation Sales Tax. Estimated local backlog needs are 17 million dollars. Small Cities Programs: All of the smaller cities in Humboldt County, (Fortuna, Rio Dell, Blue Lake, Ferndale, and Trinidad) have major problems in financing street maintenance and construction. In general, state gas tax revenues are only sufficient to cover maintenance costs, leaving street construction or reconstruction projects under-funded. There are projects which these cities would like to implement, which as a practical matter, cannot be constructed because the cost far exceeds projected revenues. Projected revenues for the smaller cities are expected to grow at an annual rate of 2.5 percent to 3.5 percent, unless otherwise provided by the entity. For the most part, revenues fall short of expenditures, which reflects the inadequacy of revenue levels. Of the five cities, only Fortuna receives RSTP revenues in a significant amount. HCAOG has developed a small cities program to supplement the funding hardship facing the region's smaller municipalities. Potential Funding Sources for Roadways The following local funding sources may potentially be considered in Humboldt County. Although grants and loans can provide for infrastructure funding, other options can be implemented to support needed public systems and facilities. Impact fees and development mitigation measures and agreements are other funding options, discussed in more detail below. HCAOG Page HR-30 Highway and Roadway Systems Element
70 New Development/Traffic Mitigation Fees: Traffic mitigation fees are one-time charges on new development to pay for required public facilities, and to mitigate impacts created by the development or reasonably related to it. There are a number of approaches to charging developers for the provision of public facilities. In all cases, however, the fees must be clearly related to the costs incurred as a result of the development. AB 1600, which was passed to govern the imposition of development fees, requires that a nexus, or rational connection, be made between a fee and the type of development on which the fee is based. Furthermore, fees cannot be used to correct existing problems or pay for improvements needed for existing development. A county may only levy such fees in the unincorporated area over which it has jurisdiction. Development Mitigation Measures/Agreements: Development mitigation measures are imposed whenever developments require approval by a local entity. Generally, mitigation measures are imposed as conditions on tentative maps. These conditions reflect on- and off-site project mitigation that must be completed in order to be able to develop. Development agreements are also used to gain cooperation of developers in constructing off-site infrastructure improvements or dedicating rights-of-way needed as a result of the proposed development. Road Operations and Maintenance: Besides the major capital projects recommended in this transportation study, Humboldt County has significant, ongoing operations and maintenance (O&M) needs. To some extent, the funding for O&M and capital projects overlap. Therefore, it is important to understand the annual O&M funding sources. Each source is briefly described below. State Gas Taxes: The State of California returns a portion of the statewide gas tax revenues to each jurisdiction for the purpose of maintaining roadways. These funds are restricted for use to the City's Road Fund and are accrued on an annual basis. The formula for determining the amount of allocation to each City is complex, but primarily determined based on population. Motor Vehicle In-Lieu Fees: The Motor Vehicle In-Lieu Fees are motor vehicle registration funds returned to the County from the State based on a jurisdiction's population. These funds are General Fund revenues and are not restricted for roadway use. Therefore, the dedication of these funds to provide roadway O&M is essentially a use of General Fund revenues. Local Transportation Fund (LTF): As stated above, any funds not allocated to transit, bicycle and pedestrian facility improvements can be used for road operations and maintenance. Benefit Assessment Act of 1982: The Benefit Assessment Act of 1982 allowed for the development of County-wide assessments for drainage, flood control, and street lighting. A 1989 amendment to the Act added street maintenance assessments. To date very few cities or counties have instituted this assessment for street maintenance. HCAOG Page HR-31 Highway and Roadway Systems Element
71 Costs and Revenues Estimated for Roadways Assumptions During the plan s development, it is required that reasonable estimates of expected revenues be forecasted during the life of the RTP. The following funding assumptions are made for regional improvements contained in the Action Element. Humboldt County has $8.5 million available in 2008 STIP funds. Adding this amount to its prior reserves of $3 million brings the total to $11.5 million. There are over $81.8 million in programmed STIP projects awaiting funding, half of which are for Caltrans projects. A 20-year projection using $8.5 million would provide for $170 in revenues from STIP over the next 20 years. The County is currently allocated $159.3 million in SHOPP funds over a four year period through 2011/12. Funding for the SHOPP is different from funding the STIP in several ways. One, revenues for the SHOPP is taken off the top before money is allocated to STIP projects, meaning SHOPP receives priority by Caltrans. Second, there is no formula for allocating SHOPP revenues, so that Humboldt County could receive a large share of revenues in one cycle, then much less in future cycles, thus presenting a degree of uncertainty. Selection and programming of SHOPP projects is based on Caltrans estimates of the delivery of the project. Humboldt County receives close to $4.5 million per year in TDA funds. About $1.6 million is used for transit purposes, leaving $3 million for street and road purposes, or $60 million over 20 years. Humboldt County and the cities receive a total of $4.5 million per year in gas tax subventions. Because these funds are for any roadway use, it is reasonable to assume that a portion of the revenues are used for roadway related expenses (e.g. engineering, other maintenance) that are not contained in the Action Element of the RTP. Using State Controller s data, it can be assumed that 40% of subventions are used for non-major rehabilitation/construction projects. Therefore, the 20-year forecast is reduced to $54 million. Table HR10 shows the summary of anticipated RTP revenues and costs for various roadway projects (excluding SHOPP). The revenue estimates are simple projections of current revenues over 20 years. The cost estimates are developed by adding planned project costs with reported maintenance backlogs. The value in this exercise is likely less as a definitive calculation but as an indicator of a significant problem: estimated 20-year revenues are currently about 80% of the revenue needed to meet existing needs. HCAOG Page HR-32 Highway and Roadway Systems Element
72 Table HR10 Summary of Projected Revenues and Costs for Roadways Revenue/Cost 20 year Projected Revenues ($ million) STIP 170 TDA 60 Gas Tax 54 Existing Costs/Backlog ($ million) Percentage Difference (20-year revenues/current costs) Planned Projects 128 Maintenance Backlog Totals percent In light of constrained funding for transportation and economic hardships for both state and federal governments, competition for limited resources will continue to be pressing for the County. This creates an environment in which HCAOG must build on its leadership role in its regional capacity to prioritize candidate projects that promote an efficient regional transportation system. There remains several million dollars of programmed STIP projects that HCAOG has nominated that are still awaiting funds from the California Transportation Commission. These projects can serve as the basis for prioritization. This RTP is being updated during an uncertain period in which transportation revenues are in great flux, ranging from loans being made from state transportation coffers to the renewal of federal transportation legislation. PERFORMANCE MEASURES Transportation performance measures consist of a set of objectives, measurable criteria used to evaluate the performance and effectiveness of the transportation system. Performance measures use statistical evidence to determine progress toward specific and defined objectives. Performance measures help set goals and outcomes, detect and correct problems, and document accomplishments (CTC RTP Guidelines, 2007). Table HR11 sets out Highway and Roadway Performance Standards for the 2008 RTP. HCAOG Page HR-33 Highway and Roadway Systems Element
73 Table HR11 Highway and Roadway Performance Standards Performance Measure Indicator(s) Data Source(s) Safety Reduce collision rates on roadways, focusing on corridor segments that exceed statewide averages Mobility/Accessibility Change in vehicle occupant, freight and goods travel time or delay by improved flow on roadway segments associated with congestion/delay and high peakhour traffic volumes. Reduction in travel time by: 1) physical improvements to the system, or 2) by reducing traffic demand through support and provision of nonvehicle modes Change in frequency and reliability of transit service System Preservation Improved county-wide weighted average overall condition index for arterials and collectors Improved cost-effectiveness of pavement management activities Environmental Quality Environmental impacts associated with highway operation or improvements should be assessed and mitigated where necessary in compliance with applicable laws Reduction in collisions (per million vehicle (or passenger) miles traveled) Reduced severity of collisions Implementation of safety improvement projects Decrease in collisions and fatalities per thousand dollars invested LOS, with the goal of maintaining LOS C in rural areas and LOS D as a minimum in urban areas Delays due to landslides, weather or highway construction activities; congestion/capacity data Transit ridership statistics Pavement distress ratings for arterials and collectors Maintenance and budget data Air quality, land use data Accident statistics collected by Caltrans, CHP, Humboldt County Humboldt County Public Works Department GEATM and other sources HTA Humboldt County Arcata and Eureka Other city data sources Humboldt County Public Works EARs, EIRs, other sources HCAOG Page HR-34 Highway and Roadway Systems Element
74 Where information is available, the cost-effectiveness of specific projects will be measured using the following types of information: Decrease in vehicle occupancy travel, freight and goods time per thousand dollars invested; Decrease in vehicle and system operating cost per thousand dollar invested; Improved access to jobs, markets and commerce per thousand dollars invested; Increased frequency reliability of transit service per thousand dollars invested; Decrease in air pollution emissions per thousand dollars invested; and, Increase in annual passenger, freight and goods miles carried per thousand dollars invested. ACCOMPLISHMENTS SINCE 2006 RTP Humboldt County McKinleyville Avenue overlay Washington Avenue to Murray Road Walnut Drive overlay Cypress Street to Fern Street Hiller Road overlay Ocean to McKinleyville Pickett Road overlay Central to Grace Tompkins Hill Road overlay Highway 101 to PM 1.8 Sutter Road reconstruct and overlay Central Road to Camillia Road Central Avenue overlay Pickett to Babler and Airport to Grange City of Arcata K Street rehabilitation Samoa Boulevard to Foster Avenue Neighborhood maintenance: east side of Westwood Avenue; Arcata High School Area; Greenview area Citywide sharrow project Bicycle Transportation Accounty Cycle five Safe Routes to Schools Project Sunset School area Eureka Waterfront Drive connection I to K Streets Seventh Street bike lanes J Street to Myrtle Avenue City of Ferndale Ocean Avenue reconstruction City of Fortuna Riverwalk Drive rehabilitation, Rohnerville Road Jordan to Drake Hill City of Rio Dell Wildwood Avenue paving project HCAOG Page HR-35 Highway and Roadway Systems Element
75 REFERENCES Caltrans California Transportation Plan Caltrans Interregional Transportation Strategic Plan. Caltrans Performance Measures for Rural Transportation Systems Guidebook. City of Arcata Engineering Data/Road Projects; Pavement Management System City of Blue Lake Engineering Data/Road Projects. City of Eureka Engineering Data/Road Projects, Pavement Management System. City of Ferndale Engineering Data/Road Projects. City of Fortuna Engineering Data/Road Projects. City of Rio Dell Engineering Data/Road Projects. City of Trinidad Engineering Data/Road Projects. Federal Highway Administration. Eureka/Arcata Corridor Improvement Project Flyer. HCAOG Regional Transportation Plan. Humboldt County Capital Improvement Plan. Humboldt County General Plan Update, Community Services and Infrastructure Element (Draft) Report. Humboldt County General Plan Update Circulation Element (Draft) Report. Personal Communication with Chris Whitworth, Deputy Director of Humboldt County Public Works Personal Communication with Doby Class, City of Arcata Director of Public Works. Personal Communication with Tatiana Ahlstrand, Caltrans. Personal Communication with Tom Mattson, Director of Humboldt County Public Works HCAOG Page HR-36 Highway and Roadway Systems Element
76 PUBLIC TRANSIT AND PARATRANSIT SERVICE ELEMENT SYSTEM DESCRIPTION Humboldt County s public transportation system consists of fixed route transit, commuter services, paratransit services, social service transportation, and cross-county, or interregional, services. With respect to the delivery of public transit programs -- especially within a large, rural county -- Humboldt s system has been fairly successful. However, the need for public transit, and enhanced transit services, is increasing, countywide. The American Disabilities Act requires the expansion of paratransit services to specific areas, complementary to fixed route transit. The average age of Humboldt residents is rising, with more elderly people becoming unable to drive. Furthermore, state clean air legislation mandates the reduction of greenhouse gas emissions from mobile sources, such as cars and light duty trucks -- and one public transit bus, filled to capacity, takes 44 cars off the road. Expanding and improving Humboldt s public transit and paratransit system will require perceptual, as well as practical, measures; convenience, comfort, frequency, accessibility, and the reliability of transit services are all determining factors for encouraging, and increasing, transit use. Humboldt County s public transit and paratransit service areas are mapped on pages PT-2 through PT-5. Humboldt Transit Authority The Humboldt Transit Authority (HTA), established in 1975, provides transit services along the US 101 corridor in Humboldt County. A joint powers agreement was signed by Humboldt County and the cities of Arcata, Eureka, Fortuna, Rio Dell and Trinidad to finance, acquire, construct, manage, operate and maintain public transit systems and related property and facilities. Funding for support of the operations and maintenance of HTA is obtained primarily through fares, and Transportation Development Act (TDA) funds that accrue to each entity of HTA. The proportion of TDA funds that are paid by the cities and the county for the support of HTA are based on the census population of each city, compared to the population of all the cities. Humboldt County provides 50 percent of the TDA funds, and the participating cities provide the other 50 percent (City of Eureka 25.6 percent, City of Arcata 13.1 percent, City of Fortuna 8.1 percent, City of Rio Dell 2.8 percent and City of Trinidad.4 percent) of TDA funds for the support of HTA. The member entity assessments have not been adjusted since RTP Page PT-1 Public Transit & Paratransit System Element


77 2008 RTP Page PT-2 Public Transit & Paratransit System Element


78 2008 RTP Page PT-3 Public Transit & Paratransit System Element


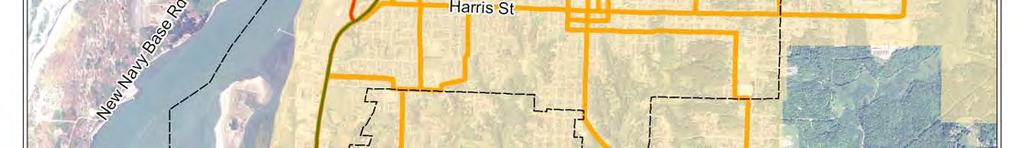


79 2008 RTP Page PT-4 Public Transit & Paratransit System Element


80 2008 RTP Page PT-5 Public Transit & Paratransit System Element
81 HTA operates and maintains the Redwood Transit System, the Willow Creek RTS Extension Service, the Eureka Transit System and the Southern Humboldt Rural Transit System (QUAIL). HTA is also under contract to provide fleet maintenance for Arcata & Mad River Transit System and serves as the lead agency for public transit projects that benefit the region. In addition, HTA manages the Dial-A-Ride and Dial-A-Lift service contracts. HTA served as the lead agency on three regional transit projects, implemented in the 2007/2008 Fiscal Year. The first project was the installation of electronic fareboxes and air filters on the entire fixed-route public transit fleet. The air filters were installed to reduce harmful diesel emissions. In addition, with assistance from Arcata & Mad River Transit System staff, HTA implemented the Jack Pass program in August of Prior to this program, Humboldt State University students were allowed unlimited rides only on the A&MRTS system. Now, Humboldt State University (HSU) students are allowed unlimited rides on RTS, the RTS Willow Creek extension service, and the ETS system as well. Students simply need to show their valid, current student ID to the driver of the bus when they board. As part of the HSU fees, students contribute $15 per semester to fund the Jack Pass program. Faculty and staff can buy into the program for $60 a semester. HTA has been working on a coordinated emergency response plan with the Humboldt County Office of Emergency Services. In the event of a natural disaster, or any emergency situation, the HTA office on V Street in Eureka is equipped to serve as an Emergency Response Command Center. Additionally, HTA can mobilize the public transit fleet to assist with the evacuation of residents. FIXED ROUTE AND COMMUTER SERVICE Humboldt County is currently served by two commuter transit services (i.e., Redwood Transit System and the Willow Creek RTS Extension Service) and four fixed route public transit services (i.e., Eureka Transit Service, Arcata & Mad River Transit, Klamath/Trinity Non Emergency Transportation and Blue Lake Rancheria Transit). A detailed description of the Blue Lake Rancheria Transit is included in the Tribal Transportation Element. Redwood Transit System Redwood Transit System (RTS) provides commuter service along the US 101 corridor between Scotia, Fortuna, Loleta, Fields Landing, Eureka, Arcata, McKinleyville, Westhaven, and Trinidad, Monday through Friday, between the hours of 5:44 a.m. and 10:50 p.m. and Saturday between the hours of 8:30 a.m. and 8:00 p.m. RTS makes 23 northbround and 22 southbound trips, Monday through Friday. On Saturday, RTS provides 12 northbound trips and 11 southbound trips; service frequency varies by location. The RTS commuter service is funded by Humboldt County and the cities of Arcata, Eureka, Fortuna, Rio Dell and Trinidad. The RTS fleet consists of 13 vehicles. In 2007, RTS purchased three diesel-electric hybrid buses, to reduce harmful bus emissions. All of the RTS buses are equipped with wheelchair lifts and bicycle racks. Table PT1 provides a summary of the RTS vehicle fleet by fuel type RTP Page PT-6 Public Transit & Paratransit System Element
82 Table PT1 RTS Fleet Information Vehicle Make Fuel Type Vehicle Year Gillig Phantom Diesel 1996 Gillig Phantom Diesel 1998 Gillig Phantom Diesel 1998 Gillig Phantom Diesel 2000 Gillig Phantom Diesel 2000 Gillig Phantom Diesel 2001 Gillig Phantom Diesel 2002 Gillig Phantom Diesel 2003 Gillig Phantom Diesel 2004 Gillig Phantom Diesel 2004 Gillig Phantom Diesel-electric hybrid 2007 Gillig Low Floor Diesel-electric hybrid 2007 Gillig Low Floor Diesel-electric hybrid 2007 Two buses were pulled from the RTS fleet as a result of California Air Resource Board requirements (CARB), even though they were equipped with air filters to reduce emissions. Because the buses were not scheduled to be replaced, there is strain on the RTS vehicle fleet -- both in terms of availability and backup when a bus is in need of repair. RTS ridership and service frequency has increased as a result of the HSU Jack Pass Program. RTS added a new morning route and extended service hours on four routes, morning and afternoon. HSU students account for an additional 50,000 passengers per year. RTS initiated service to Garberville, Orick, Old Arcata Road, the Sun Valley Bulb Farm and Blue Lake due to comments received from community members. However, due to low ridership, service to those areas was discontinued. RTS also served the Aldergrove Industrial Park, but ceased providing service when Redwoods United workshop shut down. The RTS route to the Aldergrove Industrial Park was established specifically for Redwoods United workshop clients. Willow Creek RTS Extension Service RTS provides an extension service that runs between the City of Arcata and Willow Creek, Monday through Friday. The Willow Creek route completes four runs per day, two in the morning between 6:30 a.m. and 11:00 a.m. and two in the afternoon/evening between 3:30 p.m. and 7:30 p.m. Humboldt County provides the funds to operate the Willow Creek RTS extension service RTP Page PT-7 Public Transit & Paratransit System Element
83 Eureka Transit Service Eureka Transit Service (ETS) provides four fixed routes, Monday through Friday, between 6:15 a.m. and 7:00 p.m. within the City of Eureka and adjacent areas. On Saturdays, ETS operates on a reduced schedule, with two routes running between the hours of 10:00 a.m. and 5:00 p.m. The City of Eureka and Humboldt County provide funding for ETS. The City of Eureka provides 73 percent of the ETS funding costs and Humboldt County covers the remaining 27 percent. The costs are split, based on the amount of service area that falls within the city or county jurisdiction. The ETS fleet consists of six vehicles that are equipped with wheelchair lifts and bicycle racks. In 2007, ETS purchased two diesel-electric hybrid buses to reduce emissions. Table PT2 provides a summary of the ETS vehicle fleet by fuel type. Table PT2 ETS Fleet Information Vehicle Make Fuel Type Vehicle Year Gillig Phantom Diesel 1992 Gillig Phantom Diesel 1999 Gillig Phantom Diesel 2002 Gillig Phantom Diesel 2003 Gillig Low Floor Diesel-electric hybrid 2007 Gillig Low Floor Diesel-electric hybrid 2007 Two buses were pulled from the ETS fleet as a result of CARB mandates, even though they were equipped with air filters to reduce emissions. Because the buses were not scheduled to be replaced, there is a strain on the ETS vehicle fleet -- both in terms of availability and backup when a bus is in need of repair. Arcata & Mad River Transit System The Arcata and & Mad River Transit System (A&MRTS) provides fixed route transit service within the Arcata city limits. A&MRTS was initiated by the Arcata City Council in 1975, to provide an alternative form of transportation, with the objectives of saving energy and serving groups such as college students, senior citizens, young people, and others without automobile transportation. A&MRTS is operated by the City of Arcata Public Works Department. The Public Works department employs a Transportation Superintendent, who functions as Transit Manger and oversees all transit operations, planning and support services, which includes the Arcata Transit center. A&MRTS vehicle maintenance is contracted out to the HTA. The cost of the system is offset by fares (25 percent) and revenues obtained from a portion of the state sales tax on gasoline (75 percent). Humboldt State University rates are subsidized by university parking fines RTP Page PT-8 Public Transit & Paratransit System Element
84 The A&MRTS fleet consists of eight vehicles that are equipped with wheelchair lifts and bicycle racks. Table PT3 provides a summary of the A&MRTS vehicle fleet by fuel type. Table PT3 A&MRTS Fleet Information Vehicle Make Fuel Type Vehicle Year Gillig Diesel 2002 Gillig Diesel 2002 Gillig Diesel 1995 Gillig Diesel 1995 Ford Diesel 2001 Ford Diesel 2001 A&MRTS hours of operation vary by the Humboldt State University s (HSU) academic calendar. A&MRTS operates two fixed routes (Red and Gold) year round which covers the City of Arcata s five square miles and adds an additional route (Express Route), eight months out of the year, when HSU is in session. When HSU is in session, the Red and Gold routes operate on 60 minute frequencies weekdays from 7:05 a.m. to 9:57 p.m. When HSU is not in session, the Red and Gold route operate on a 60 minute frequencies weekdays from 7:00 a.m. to 7:00 p.m. Saturday service consists of the Gold and Red routes, between the hours of 9:00 a.m. and 5:00 p.m., with the Gold route operating on the even hours and the Red route operating on the odd hours. The Express Route only operates on weekdays, when HSU is in session. The Express Service runs on 60 minute frequencies from 7:30 a.m. to 5:30 p.m. Over the past 33 years, A&MRTS has modified service to maximize current resources. A&MRTS plans to replace its older buses as needed to comply with California Air Resource Board mandates. Klamath Trinity Non Emergency Transportation Klamath Trinity Non Emergency Transportation (K-T Net) is a non-profit community based organization in the Klamath Trinity that began transit operations in January of K-T Net provides fixed route service between Hoopa and Willow Creek, Monday through Friday. The bus departs Willow Creek for Hoopa at 8:25 a.m., 9:35 a.m., 12:35 p.m. and, if demand warrants, at 6:35 p.m. K-T Net coordinates their schedule with the RTS Willow Creek Extension schedule, connecting riders from Hoopa and Willow Creek with the RTS Willow Creek extension service, twice a day. The service is funded with TDA revenues from Humboldt County (1/4 of operating costs), stipends from the Hoopa Valley Tribe, and grants acquired from various agencies. In 2007, the farebox recovery ratio was 16 percent, with an average of 15 riders per day RTP Page PT-9 Public Transit & Paratransit System Element
85 In August 2008 K-T Net will be expanding fixed route service to the community of Weitchpec, with financial assistance from the Yurok Tribe. Grant monies received by the Yurok will also be used to buy a new bus. The new bus will be used for fixed route transit, and the old bus will serve as a backup bus. In early 2009, K-T Net will expand their service area to include the communities of Pecwan and Orleans. The expansion will be funded in part by the Karuk Tribe. The K-T Net service demonstrates the ability of tribal communities, local stakeholders and concerned citizens to work together, to develop needed transit service for the outlying areas of the county. PARATRANSIT SERVICES Paratransit is a form of transportation service that is more flexible and personalized than fixed route or commuter transit service. Paratransit is tailored to the needs of disabled and elderly individuals. Paratransit services include Dial-A-Ride, Dial-A-Lift and non-emergency medical transportation services. Dial-A-Ride (DAR) and Dial-A-Lift (DAL) are discount transportation services available to seniors and/or the disabled with a doctor s verification of disability. These services are also available to individuals over the age of 72, regardless of their medical condition. A reservation must be made to utilize either DAR or DAL. DAR and DAL services have traditionally covered the City of Eureka, City of Arcata and McKinleyville areas. As a result of input received through the HCAOG unmet needs hearings, the DAR and DAL services were expanded (with State Transit Assistance Funds (STAF) in February of 2005) to include the Fields Landing, King Salmon, Humboldt Hill, Elk River Road, Ridgewood Heights, Samoa, Manila, Indianola and Old Arcata Road areas. Paratransit services in Humboldt County are provided by City Ambulance, K-T Net, HTA, Blue Lake Rancheria Dial-A-Ride, the City of Fortuna, Humboldt Community Access and Resource Center, Bridgeville Community Center, and the Ferndale Senior Resource Agency. A detailed description of the Blue Lake Rancheria Dial-A-Ride services is included in the Tribal Transportation Element. City Ambulance of Eureka City Ambulance has been providing ambulance service to Humboldt County for over 25 years. In addition, City Ambulance provides emergency and non-emergency medical transportation, taxi cab, courier, DAR/DAL services. City Ambulance provides the DAR/DAL services to the City of Arcata and McKinleyville under a contract between the City of Arcata, Humboldt County and the HTA. City of Arcata DAR/DAL services operate within the city limits. The McKinleyville DAR/DAL southern service area boundary begins at the Mad River and extends, west to east, from the Pacific Ocean 2008 RTP Page PT-10 Public Transit & Paratransit System Element
86 to North Bank Road and State Highway 299. The northern service area boundary is U.S. 101 at the Little River. City Ambulance is under contract with the City of Eureka, Humboldt County and HTA to provide DAR/DAL services within the City of Eureka and adjacent areas. The City of Eureka DAR/DAL service boundary coincides with the area serviced by ETS. DAR/DAL services are provided Monday through Friday, from 6:00 a.m. until 7:00 p.m., and Saturdays from 7:30 a.m. until 5:30 p.m. City Ambulance provides 300 DAR/DAL rides per day on average. The DAR/DAL system is a demand/response system that responds immediately to calls for service. At certain times of the day the system is heavily impacted, and riders have a two-hour wait for service, whereas other times of the day the wait for service is ten minutes or less. In an effort to level out response times, City Ambulance is in the process of acquiring a scheduling and dispatching system. Software will then set the schedules and routes for the drivers, based on the reservations made. That system will be implemented early in the 2008/2009 Fiscal Year. The new system will require riders to make a 24 hour advance reservation -- but reservations can be made 24 hours a day. This is anticipated to be beneficial for the DAR/DAL users and the City Ambulance. The scheduling and dispatch system will improve efficiency, decrease wait times during heavily impacted times of the day, allow City Ambulance to provide the same level of service with more transports as the population grows and ridership increases, and provide for better use of drivers and vehicles, which should result in reduced capital and operating costs. This new system will be used only for the DAR and DAL service area covered by City Ambulance. Humboldt Community Access and Resource Center The Humboldt Community Access and Resource Center (HCAR) serves as the Consolidated Transportation Service Agency (CTSA) for Humboldt County. In their capacity as the CTSA, HCAR assists with the coordination of paratransit services. In addition to serving as the CTSA, HCAR is under contract to provide DAR/DAL services to the Fields Landing, King Salmon, Humboldt Hill, Elk River Road, Ridgewood Heights, Samoa, Manila, Indianola and Old Arcata Road areas. HCAR formerly provided the Care-A-Van service (a non-emergency medical transportation service) for eligible low-income individuals. The grant funding which supported Care-A-Van was discontinued. Ferndale Senior Resource Agency Bridging the Gap The Ferndale Senior Resource Agency is a non-profit organization formed in March of It is currently grant-funded. The goal of the agency is to provide seniors and disabled residents with transportation options that allow them to live independently, in their homes, without relying upon family and friends for all of their transportation needs. Seniors 62 years of age or older and 2008 RTP Page PT-11 Public Transit & Paratransit System Element
87 disabled individuals, regardless of age, that reside within the zip code area, are eligible for bridging the gap transportation service. This service is available Monday through Friday, from 9:00 a.m. until 5:00 p.m., and operates on a floating ride schedule. Riders must secure a reservation 24 hours in advance, and medical needs prioritize scheduling. Bridging the Gap uses a van that can accommodate motor scooters and power chairs. A rider must be able to either transfer in and out of the van, or have the assistance of a care giver, in order to use this service. Fortuna Senior Transit Fortuna Senior Transit serves senior and disabled individuals residing within the Fortuna city limits. Two buses operate Monday through Friday, 8:30 a.m. to 4:00 p.m., and one bus runs on Saturday, between 9:00 a.m. and 3:30 p.m. Riders are allowed up to three destinations per day. The service is provided on a reservation basis, and reservations can be made up to one month, or at least 24 hours, in advance. Bridgeville Community Center Van The Bridgeville Community Center is a grassroots organization that began with a Healthy Start grant in The center provides a van service on Thursdays that is available to all age groups and serves the Bridgeville and Carlotta areas. Riders must secure reservations in advance. Preference is given to riders traveling to and from doctors appointments; the remaining seats are offered on a first come, first serve, basis. The van typically departs the Bridgeville Community Center at 9:30 a.m. and returns by 5:00 p.m. This transportation service is grant-funded. The center uses one van (which is not lift-equipped) to provide transportation services. Klamath Trinity Paranet Klamath Trinity Paranet (K-T Net Paranet) provides demand-responsive non-emergency specialized door-to-door service for the elderly, mentally and physically disabled, and children in the Hoopa and Willow Creek area, who cannot, independently, use a fixed-route transit service to meet their medical appointment needs. An eligibility application must be filled out by both the rider and a doctor, prior to service. K-T Net Paranet runs along Highway 96 between Orleans and Willow Creek and long Highway 299 between Big Bar and Arcata / Eureka. K-T Net Paranet s future is uncertain. The non-profit is in the process of locating long-term funds to finance operations and maintenance. Medi-Cal provides transportation reimbursement for individuals in wheelchairs only, and doesn t cover the costs incurred by K-T Net going to the rider s home and from the rider s home back to the office. In addition, the Medi-Cal reimbursement rate is far the below the cost to provide transit services. Southern Humboldt Rural Transit The Southern Humboldt Rural Transit (QUAIL) was established, in February 1979, by the Retired Senior Volunteer Program (RSVP), Seniors in Humboldt as Resources in Education (SHARE), and Humboldt County. It is a rural, demand/response shared-ride and door-to-door transit service for individuals 60 years or older and disabled people in the Southern Humboldt County region. QUAIL operates between Weott and Benbow along the US 101/State Route RTP Page PT-12 Public Transit & Paratransit System Element
88 corridor. The QUAIL fleet consists of one vehicle that is lift-equipped. The service runs Monday through Friday and generally operates between the hours of 8:00 a.m. and 5:00 p.m. On the first and third Tuesday of every month service is provided to Eureka, on the second and fourth Tuesday of every month service is provided to Fortuna, and on the first and fourth Friday of every month service is provided around the Redway/Garberville area. In addition, service is provided Mondays, Wednesdays, and Thursdays to the Senior Center in Redway. SOCIAL SERVICE TRANSPORTATION A number of service providers, agencies and care homes provide transportation services to their clients, residents or patients. Following is a list of the social service transportation providers in Humboldt County: Nenita s New Beginning Care Home; Mobile Medical Office; Gracelyn Residential Care; Willow Creek Community Resource Center; Especially You Assisted Living; Arcata Endeavor; Youth Service Bureau; Redwood Coast Regional Center; Humboldt Domestic Violence Services; Redway Family Resource Center; Skilled Healthcare, LLC; Sterling House; Adult Day Health Care of Mad River; Humboldt County Public Health, Arcata House, United Indian Health Services, and Humboldt County Mental Health. CROSS COUNTY / INTERREGIONAL SERVICE Cross County, or Interregional Service, refers to transit services that move people into and out of Humboldt County. Redwood Coast Transit Redwood Coast Transit (RCT) provides public and paratransit services for Del Norte County. RCT also provides service between Smith River and Arcata, Monday through Saturday. The RCT bus runs along the US 101 corridor; Humboldt County stops include the Orick Redwood National Park Post Office, Trinidad Park and Ride, and the Arcata Transit Center. In addition to scheduled stops, RCT will make flag stops on request, at any safe location, as determined by the driver. Riders should call RCT 24 hours in advance to arrange a flag stop. Greyhound Greyhound currently provides one daily trip from Arcata to San Francisco. The service no longer provides direct routes north, or east, out of the county. Transferring in San Francisco is the only option. AMTRAK AMTRAK service consists of two buses daily, connecting communities from Arcata to Healdsburg, with southbound service, via bus, from Healdsburg to Martinez City RTP Page PT-13 Public Transit & Paratransit System Element
89 COORDINATED TRANSPORTATION PLAN Starting in Fiscal Year 2007, projects funded through three programs in SAFETEA-LU, including the Job Access and Reverse Commute Program (JARC, Section 5316), New Freedom (Section 5317) and the Formula Program for Elderly Individuals and Individuals with Disabilities (Section 5310), are required to be derived from a locally developed, coordinated public transit/human services transportation plan. SAFETEA-LU indicates that the plan should be a unified and comprehensive strategy for public transportation service delivery that identifies the transportation needs of individuals with disabilities, older adults, and individuals with limited income, laying out strategies for meeting these needs, and prioritizing services. The State, in its role as the designated recipient for these funds, must certify that projects selected for funding are derived from such a coordinated plan. Fulfilling this federal mandate ensures that projects receiving these funds minimize service duplication, thereby enhancing human-services transportation statewide. As part of a large planning effort overseen by Caltrans, Nelson/Nygaard Consulting Associates constructed a Coordinated Public Transit-Human Services Transportation Plan for Humboldt County. NEEDS ASSESSMENT The following section details the Humboldt County public and paratransit transit needs. The information for this section was obtained from the HTA, ETS and RTS Transit Development Plans, the Transportation Development Act Unmet Transit Needs Report, and Findings for the 2007/2008 Fiscal Year. Humboldt Transit Authority The 2001 Humboldt Transit Authority Transit Development Plan addressed the need for the development of an Intermodal Transit Center (ITC). A concept for an ITC was developed. The original concept included the construction of an ITC, in Old Town Eureka, that would be adjacent to the waterfront and the NCRA rail line. The ITC would provide a central venue where locals and tourists could access the local transportation system and/or transfer from one mode of transportation to another (e.g., ride bicycle to facility and catch a public transit bus to another destination). The ITC was envisioned to provide tourist information and bus ticket sales. The original concept also included the establishment of retail shops, which could be leased by private business interests, lease fees would in turn fund the maintenance and operation costs of the ITC. That ITC project was shelved due to lack of funding. The Arcata Transit Center in Arcata currently functions as an ITC for the entire Humboldt Bay Area. Development of a more broadly envisioned ITC -- where locals and tourists could access local transportation systems and transfer between various transportation modes -- should remain a consideration. An ITC project was once proposed, and had support, from several members of the Humboldt County Board of Supervisors, Eureka City Council, and representatives from Caltrans and HCAOG. The ITC concept still has the support of the local public transit service providers RTP Page PT-14 Public Transit & Paratransit System Element
90 The public transit system in Humboldt County is not supported by established park and ride facilities. Currently, private business parking lots near transit lines are utilized as park-and-ride facilities by public transit users. Although the majority of the business owners do not object to this use of their lots, others are concerned about the loss of parking space for potential business customers. The public transit service providers support the establishment of dedicated park-andride facilities along certain transit routes. HTA should explore the feasibility of designing and constructing these facilities. Park-and-ride facilities should also include services for cyclists, including lockers, bike lockers and/or racks. Redwood Transit System In June of 2006, the Humboldt Transit Authority completed a Transit Development Plan (TDP) update. The TDP is the primary planning document guiding the Humboldt Transit Authority. As part of the update, an onboard rider survey was conducted. Survey respondents were asked to identify which potential service improvement or enhancement they would most like to see implemented; survey respondents reported the following: 21.8 % Sunday service; 21.1% Later evening service; 19.3 % More frequent Saturday Service; 17.2 % More frequent weekday service; 8.8 % Other; 7.0 % More direct routes, and 4.9 % Earlier morning service. In addition, the relationship between desired improvement and patronage levels was assessed, to determine service improvements that would increase RTS patronage. Riders requesting earlier morning service were deemed most likely to generate additional business for RTS, followed by more frequent weekday service, later evening service, more frequent Saturday service, Sunday service and more direct routes. The RTS TDP also identified a need for transit service south of Rio Dell, increased frequency on existing routes, and Sunday service. The size of Humboldt County, in addition to funding availability, present challenges for this expansion of services. Although air filters were recently installed on the entire RTS fleet (at a cost of $22,000 per filter) the RTS vehicle fleet was reduced by two buses, due to CARB mandates. This vehicle fleet reduction has placed a strain on RTS operations. CARB has certified a diesel engine for use in public transit buses, but has yet to certify a hybrid engine. RTS should determine the financial feasibility of replacing the two buses pulled from circulation. RTS should also consider expanding their fleet to keep pace with the added demands placed on the system by the implementation of the Jack Pass and every increasing fuel prices. Eureka Transit Service In June of 2006, the Eureka Transit Service completed a Transit Development Plan (TDP) update. The TDP is the primary planning document guiding the ETS. An onboard rider survey 2008 RTP Page PT-15 Public Transit & Paratransit System Element
91 was conducted as part of the ETS Transit Development Plan. ETS riders were asked to identify which potential service improvement or enhancement they would most like to see implemented, survey respondents reported the following: 22.9 % Later evening service; 22.7 % Sunday service; 18.4 % More frequent weekday service; 15.4 % More frequent Saturday service; 10.8 % More direct routes; 5.1 % Other; and 4.7 % Earlier morning service. In addition, the relationship between desired improvement and patronage levels was assessed, to determine service improvements that would increase ETS patronage. Riders requesting earlier morning service were deemed most likely to generate additional business for ETS, followed by later evening service, more direct routes, Sunday service, and more frequent weekday service. The ETS TDP also identified a need for increased service frequency, the introduction of Sunday service and a unified pass or ticket to ease intra-county travel. Although air filters were recently installed on the entire ETS fleet (at a cost of $22,000 per filter) the ETS vehicle fleet was reduced by two buses, due to CARB mandates. The vehicle fleet reduction has placed a strain on ETS operations. CARB has certified a diesel engine for use in public transit buses, but has yet to certify a hybrid engine. ETS should determine the financial feasibility of replacing the two buses pulled from circulation. Arcata & Mad River Transit Service A&MRTS updated their Transit Development Plan in June of The TDP is the primary planning document guiding the A&MRTS system. As part of the June 2006 A&MRTS TDP update, an onboard survey was conducted as part of the A&MRTS Transit Development Plan. A&MRTS riders were asked to identify which potential service improvement or enhancement they would most like to see implemented, survey respondents reported the following: 28.9 % greater frequency within the existing weekday; 23.7 % greater frequency within the Saturday schedule; 22.6 % Sunday service; 12.4 &% other; and 12.4 % more direct routes. Additionally, the relationship between desired improvement and patronage levels was assessed, to determine service improvements that would increase A&MRTS patronage. Riders requesting more frequent Saturday service were deemed most likely to generate additional business for A&MRTS, followed by direct routes, more frequent service and Sunday service. Interviews with 2008 RTP Page PT-16 Public Transit & Paratransit System Element
92 stakeholders identified the following transit needs: increased service frequencies, the addition of Sunday service, a unified pass or ticket to ease intra-county travel. A&MRTS has the funds to replace one bus in order to comply with CARB mandates. A&MRTS has been approved to receive $425, funds from Caltrans and has an additional $10,000 local match. A&MRTS wanted to use the bus acquisition funds toward the purchase of a hybrid bus, but -- due to CARBs certification of diesel engines and not hybrid engines -- a diesel bus will be purchased instead. HCAR Non-emergency medical transportation services are currently unavailable south of Fields Landing and north of McKinleyville. The HCAR Care-A-Van service is no longer being provided and the We Care transportation service a medical, physical therapy and dialysis transportation service -- has also been discontinued. HCAR is searching for funds in order to reinstate the Care-A-Van transportation service. Until such funds are procured, residents outside of the DAR/DAL service area are without non-emergency medical transportation. Unmet Transit Needs Report and Findings HCAOG, acting in their capacity as the RTPA, bears the responsibility pursuant to Transportation Development Act (TDA) Statues for ensuring that transit needs are examined for each member entity s respective area of jurisdiction, if that entity intends to utilize TDA funds for non-transit purposes, and also for the area of jurisdiction for the Social Service Transportation Advisory Council (SSTAC). Unmet needs hearings are conducted by HCAOG and its member entities. Public hearings provide local, elected officials with an opportunity to hear, and respond to, the expressed needs of their constituents. Within HCAOGs jurisdiction, unmet transit needs are defined as: (1) transit levels identified in the Humboldt County RTP as the threshold level of services which have not been implemented or addressed; (2) transit levels identified in the Humboldt County RTP needs assessment, which have not been implemented or addressed; and (3) transit needs identified through the public hearing process, delivered in writing or in public testimony. Unmet transit needs may be found as reasonable to meet if all of the following conditions prevail: (1) a significant level of support exists for the public subsidy of transit services designed to address the unmet transit need, including but not limited to, support from community groups, community leaders, and community meetings reflecting a public commitment to public transit; (2) sufficient funding is forecast to be available, on a long-term basis, from the respective entity or entities Local Transportation Fund, for the purpose of providing services to address the unmet transit needs; (3) the complete cost of addressing the unmet transit need justifies service implementation, or continuation, in terms of the size of the transit dependent public, passengers served, severity of need, and feasibility; (4) transit services designed or intended to address an unmet transit need shall not duplicate transit services currently provided either publicly or privately; and (5) transit services designed or intended to address an unmet transit need shall, in all cases, make coordinative efforts with transit services currently provided, either publicly or privately. Table PT4 illustrates the transit threshold levels of service RTP Page PT-17 Public Transit & Paratransit System Element
93 Table PT4 Transit Threshold Levels of Service Transit Service Weekday Weekend Other Urban Areas Local Bus (Eureka and Arcata) 1 Hour N/A US 101 Corridor Trinidad to Scotia Service Hours N/A 299 Corridor TBD* TBD Connect with RTS Specialized Service Rural Areas ADA compliant vehicles maintained by RTS, ETS and A&MRTS. Additional may be provided as funds allow. Local Bus TBD TBD Specialized Service Service for elderly and handicapped only Garberville to Eureka once or twice per week; Benbow to Weott daily. Additional paratransit service as funds allow. * To Be Determined Source: 2006 Regional Transportation Plan for Humboldt County Following the examination of comments generated during the hearing process, and determining that consistency exists with respect to the RTP, the HCAOG must adopt one of the following findings in accordance with the Transportation Development Act, Section (d) with respect to each entity claiming non-transit funds: there are no unmet transit needs; there are unmet transit needs, including needs identified as reasonable to meet ; there are identified transit needs, but they are unreasonable to meet with current funding and/or service levels. Many of the hearing comments resurface annually; the following is a list of comments which are received annually: Additional evening and/or Sunday general public transit service; Additional evening and weekend DAR/DAL services in all rural areas of the county; and Service to outlying communities (Orick, Garberville, Hydesville-Bridgeville). A list of comments generated during the 2007/2008 unmet needs hearing follows. During the public hearing, comments generated specific to transit needs in the City of Blue Lake, City of Ferndale, City of Fortuna, and City of Rio Dell were not received. City of Arcata More frequent commuter service between Eureka and Arcata; Sunday service; Provide late night transportation service after bars close; Continue to focus on mobility needs of senior and disabled community; and Continue to pursue reestablishing Redding and Portland service to avoid having to transfer in San Francisco RTP Page PT-18 Public Transit & Paratransit System Element
94 City of Eureka Include routes that link up downtown and with southern parts of Eureka; Increase bus routes; Smaller buses with pre-arranged routes for seniors; Need of weekend and evening services; and Dial-A-Ride needs to be affordable. City of Trinidad More frequent stops in Trinidad; and Coordination with bus schedule from Trinidad to HSU. Humboldt County Support for southern Humboldt transportation needs. For the 2007/2008 it was determined that there are no unmet transit needs that are reasonable to meet. However, the unmet needs hearing did result in a recommendation that discussions be generated to: (1) explore expansion of Fortuna s paratransit program beyond the city limit boundaries; (2) explore possibility of shuttle feeder service in the McKinleyville community, and (3) as a result of the completion of public transit TDPs, explore possibility of RTS route modifications which may reduce headways with increased efficiencies in both Fortuna and McKinleyville. The unmet needs hearing report also recommended that the expressed needs of contiguous, or near contiguous communities, be examined through use of special studies resources programmed in the Overall Work Program. Humboldt Coordinated Transportation Alliance The Humboldt Coordinated Transportation Alliance (HCTA) is a community coalition. Its goal is to work with the Humboldt County community in finding ways to improve the use of transportation resources through coordination. HCTA includes representatives from Humboldt Transit Authority, Humboldt County Workforce Investment Board, Tri-County Independent Living, Humboldt Community Access Resource Center (HCAR), and the Area 1 Agency on Aging. HCTA received grant funding from the Community Transportation Alliance of America to conduct an inventory of formal transit, informal transit, paratransit and transit access resources available to Humboldt County; complete a needs assessment; and conduct a series of eight focus groups. Five key areas or transit needs were identified, via the focus groups: increased service frequency in order to make public transit a viable option; expansion of service areas to include Garberville, Thorn Junction, Mateel, neighborhoods adjacent to Central Avenue in McKinleyville; subsidized fares for low-income residents; increased information dissemination regarding bus schedules and stops; and increased passenger safety. HCTA is interested in using the information gained as a result of the study to maximize the use of available transportation resources RTP Page PT-19 Public Transit & Paratransit System Element
95 GUIDING GOALS, POLICIES, AND OBJECTIVES The goals, policies and objectives address the issues identified in the Needs Assessment element, and reflect the short- and long-range projects identified in the Action Element below. The goals, policies and objectives are also consistent with the Financial Element, specifically identifying project and program areas that should be included in the Regional Transportation Plan in order to leverage funding, as a result of shifting funding priorities at the federal level. Changes have been made to the goals, policies and objectives that reflect an emphasis on safety and a commitment to long term planning. Goal: Provide high quality, safe, reliable and cost-effective public transit services to county residents, especially to accommodate student, workforce, elderly and disabled needs. Policy PT-1: Support public transportation programs, including system improvements, to provide efficient and cost effective transit service to county residents. Objective: Complete periodic safety audits of public transit services to ensure that transit services meet or exceed safety performance measures detailed in the Transit Development Plans. Objective: Complete periodic performance audits of public transit services to ensure that transit services meet or exceed reliable transit performance measures detailed in the Transit Development Plans. Objective: Fund transit programs that increase public transit trip frequency, especially where frequency would result in increased ridership and reduced single occupancy vehicle use. Objective: Continue to support the transition to alternative fuels for transit fleet. Policy PT-2: Improve local and interregional transit service Objective: Develop standards for transit service amenities (e.g., bus stops, bike racks) tailored to local conditions and resources Objective: Increase community outreach efforts to demonstrate the importance of A&MRTS, ETS and RTS to the vitality of the community. Objective: Coordinate transportation services with other transportation providers within the region. Objective: Pursue partnerships with the County of Humboldt, Native American Tribes, and nonprofit transportation organizations that will help fund and facilitate the re-establishment of services to rural communities in the east, south and north portions of the County. Objective: Perform a feasibility study to determine the benefits, constraints and costs to reestablish daily bus service east between Eureka and Redding, via the State Route 299, and north to Portland, Oregon RTP Page PT-20 Public Transit & Paratransit System Element
96 Policy PT-3: Promote long range planning to guide transit decisions. Objective: For each public transit operator and entity, maintain current transit development plans that provide long-range management and capital directions, and continue to apply system evaluation standards to measure the "success" of its system. Objective: Transit providers shall annually review operating procedure in an effort to minimize overhead cost and increase system productivity, while maintaining financial viability. Objective: Improve coordination of capital planning between HTA, transit providers, city departments, and the county. Objective: Develop local funding sources -- such as, parking fees, transportation sales tax, employer contributions, local gas sales tax, impact fees, local vehicle impact fee and cost sharing quotas -- for service provisions outside established service areas. Objective: Perform a feasibility study to determine the benefits, constraints, costs and the steps necessary to establish a consolidated transit agency for delivery of public transit and Dial-A- Ride/Dial-A-Lift services. Objective: Review the Humboldt Transit Authority Joint Powers Agreement with regard to the regional formulary used to fund HTA, to ensure that the formularies have kept pace with population growth and the provision of transit services. Objective: Advocate for and support lobbying initiatives designed to increase the allocation of federal and state transportation funds for public transit services. PolicyPT-4: Promote coordination of transit service route planning with land use policy, community planning and development efforts. Objective: Encourage the cities and the county to support transit-friendly development. Objective: Work with the cities and the county to enhance pedestrian access to bus stops. Objective: Encourage new development to provide unimpeded transit access and amenities for transit riders. Objective: Work with the seven incorporated cities and the county, to identify potential growth areas, and outline the level of service and funds necessary for the provision of transit services in the areas identified. Policy PT-5: Promote intermodal transit opportunities. Objective: Make intermodal transfers as efficient as possible, through coordinated transit planning and scheduling by public and private transportation services entities. Objective: Conduct a feasibility study for the development of park-and-ride lots near population centers to encourage bus ridership and carpooling 2008 RTP Page PT-21 Public Transit & Paratransit System Element
97 Policy PT-6: Support specialized transportation programs for the county's disabled and elderly population. Objective: Provide specialized transportation programs, including publicly provided service, and complementary program-oriented private non-profit transportation services, for persons with disabilities. Objective: Promote integrated social services and public transportation services, using existing programs where possible, and seek available alternatives for independently providing client transportation services. In addition, encourage public and private non-profit specialized transportation providers to notify and apprise each other of all service changes that will impact programs or clientele. Policy PT-7: Provide ongoing support for the Social Services Transportation Advisory Council. Objective: Coordinate the transportation needs of social service agencies, private non-profit agencies, and users through the Social Services Transportation Advisory Council's (SSTAC) ongoing, pro-active forum. Objective: Provide the SSTAC with support, access, and technical support as needed. Policy PT-8: Promote measures to reduce social service transportation operating costs. Objective: Lower overall costs and increase selection of services through group activities such as joint purchasing ventures, group insurance, and consolidated maintenance programs. Objective: Fully utilize FTA Section 5310 vehicle acquisition program funds by having HCOAG work with eligible private non-profit agencies involved in transportation services programs. Objective: Make potential federal and state funding sources known to all private and nonprivate agencies providing social service transportation programs. Policy PT-9: Support the use of private transit service. Objective: Encourage private enterprise to provide the identified transit service needs of Humboldt County residents whenever feasible. Objective: Work with operators of privately funded shuttles to expand service area to supplement fixed route transit service. ACTION PLAN: PROPOSED PROJECTS ETS, RTS and A&MRTS public transit project selection begins with the HCAOG Service Coordination Committee (SCC). Projects are selected based on the amount of funding available in a fiscal year. The Action Element consists of short and long-term activities for three of the fixed route service providers (i.e., RTS, ETS, and A&MRTS). These short and long-term activities address the transit service provider s capital acquisition plans. The Action Plan does 2008 RTP Page PT-22 Public Transit & Paratransit System Element
98 not address the expansion of service, due to the current fiscal environment. The expansion of fixed route public transit service requires a long-term funding stream that can support the expansion of both the fixed route and paratransit service as a result of state mandates; paratransit services must be available in areas where new fixed route transit is provided. The implementation of the projects listed below, both funded and unfunded, will be dependent on the availability of funding. Fixed Route and Commuter Service The following tables detail the planned projects for the RTS, ETS and A&MRTS systems. Table PT5 RTS Planned Projects Project / Improvement Cost Short and Long term (11-20) year Bus Replacement ( ) $4,700,000 Bus Replacement ( ) $5,000,000 Bus Shelters ( ) $10,000 Table PT6 ETS Planned Projects Project / Improvement Cost Short and Long term (11-20) year Bus Replacement $4,700,000 Bus Replacement $5,000,000 Bus Shelters $10,000 Table PT7 A&MRTS Planned Projects Project / Improvement Cost Funding Source Short term (0-10) year Replacement buses (2008) $530, & TDA funds Replacement buses (2009) $530,000 Van Replacement (2010) $80,000 Van Replacement (2011) $80,000 Long term (11-20) year Bus replacement ( ) $1,400,000 Van replacement ( ) $200,000 Illustrative Projects Illustrative projects are candidate projects that would be planned projects if additional funding becomes available. If additional funding became available, A&MRTS would pursue unmet transit need requests such as service to Alder Grove Industrial park and the Arcata Marsh, or the expansion of weekend service to include Sundays. If additional funds were made available, HTA would pursue the expansion of service in McKinleyville and Fortuna, focusing on the development of small transit systems that could 2008 RTP Page PT-23 Public Transit & Paratransit System Element
99 connect residents to the RTS mainline. HTA would also initiate transit service in southern Humboldt and fund the development of park and ride stations with multi-modal facilities. Paratransit Services The majority of the paratransit service providers are focused on maintaining and acquiring funding streams to support existing operations and service areas. Projects have not been identified, with the exception of the projects that are in the process of being implemented (K-T Net expansion of service, implementation of the scheduling system for the City Cab DAR/DAL service). The projects for the paratransit service providers are limited to illustrative projects. HCAR would like to reinstate the non-emergency medical transportation service that was ceased due to lack of funds. HCAR would require approximately $35,000 annually to reinstate service. City Cab would like to respond to frequent requests for longer service hours and the addition of Sunday service. FINANCING The acquisition of funds continues to be a significant constraint for the provision of services in Humboldt County. Extended evening and weekend public transit services are not being planned for the ETS and A&MRTS programs, because the City of Eureka and City of Arcata currently expend all of their resources on current service levels. Expansion of DAR/DAL service is not currently feasible, due to the high public subsidy costs of services, and the inability of the cities to absorb the cost of increased services. The limited evening hours provided by A&MRTS and RTS are subsidized by either HSU or CR. The larger cities of Eureka and Arcata, operate independent municipal transit systems, paratransit systems, and participate on a shared-cost basis with the RTS corridor service on US 101; this scenario, in conjunction with the TDA proportionate requirement of the HTA JPA, limit their ability to fund municipal system cost increases as well as growth of the regional system. Low ridership, statutorily driven performance requirements, lower population density in rural communities, and the HTA JPA limitations present significant challenges to the expansion of existing services. The following is a brief description of the principal sources expected to be available, as well as projected revenues for Humboldt County. Federal Sources Funding for transit capital and operational costs has traditionally been provided by federal, state and local sources. Federal funding is passed through the Federal Transit Administration. Although the federal transportation legislation TEA-21 expanded the use of transit revenues through the addition of new programs, the majority of public transit revenues are generally designated by law for use in larger urbanized areas. Below is the federal transit programs identified for potential use by the transit operators RTP Page PT-24 Public Transit & Paratransit System Element
100 SAFETEA LU Section 5311 Funds Rural Area SAFETEA-LU establishes a new formula tier based on non-urbanized land area to address the needs of low-density States. Twenty percent of Section 5311 funds will be distributed through this tier, with a limitation that no State may receive more than five percent of the tier. The remaining 80 percent of funds are to be allocated using the existing formula, based on the State s non-urbanized population. The Rural Transportation Assistance Program (RTAP) is funded with a two percent set aside of the Rural Formula program rather than from the Research program under SAFETEA. In addition, SAFETEA-LU adds Indian tribes as eligible recipients of Section 5311 funds. A portion of funding is set aside each year for Indian tribes - $8 million in FY 2006 and rising to $15 million by FY Approximately $2 billion was authorized for the six year period covered by SAFETEA-LU, with roughly $438 million available in Fiscal Year 2008 and $465 million available in Fiscal Year fund revenues are shared among the Humboldt County transit operators. The operators collaborate on programming the grant fund, normally five years at a time. Typically, one vehicle per year is funded by the grant, with a matching amount from state or local sources. SAFETEA LU Section 5310 Elderly Individuals & Individuals with Disabilities The Section 5310 program was established in 1975 as a discretionary capital assistance program. In cases where public transit was inadequate or inappropriate, the program awarded grants to private non-profit organizations to serve the transportation needs of elderly persons and persons with disabilities. SAFETEA LU introduced the requirement that projects funded with 5310 funds be derived from a locally developed, coordinate public transit-human services transportation plan; removed the flexibility that funds can be transferred to Section 5311 for Section 5311 program purposes during the fiscal year apportioned, if funds were not needed for Section 5310 program purposes; introduced a seven State pilot program that allows selected States to use up to one-third of the funds apportioned to them for operating assistance; and allowed transfers to Section 5307 or 5311, but only to fund projects selected for Section 5310 program purposes. Approximately $674 million is available nationally for the six year time period. California is estimated to receive $13,479,312 in 2008 and $14,201,973 in SAFETEA LU Section 5316 Job Access and Reverse Commute Under SAFETEA-LU, the Job Access and Reverse Commute (JARC) program is now a formula program rather than a competitive discretionary grant program. The formula is based on ratios that involve the number of eligible low-income and welfare recipients, with 20 percent of funds going to rural areas, 60 percent going to urban areas with more than 200,000 population, and 20 percent for urban areas with a population less than 200,000. Section 5316 still contains language that directs the FTA to continue its practice of providing maximum flexibility to job-access projects designed to meet the needs of individuals who are not effectively served by public transportation. Approximately $851 million is available nationally for the six year time period. California is estimated to receive $22,349,640 in 2008 and $23,567,408 in RTP Page PT-25 Public Transit & Paratransit System Element
101 SAFETEA LU Section 5311(b)(2) Rural Transit Assistance SAFETEA-LU authorizes $10.5 million nationally, through 2009, to promote delivery of safe and effective transit service in rural areas, including: providing technical and training materials produced by the National Rural Transit Assistance Program (RTAP); supplementing their program with California specific technical assistance; management workshops; peer networking and scholarship assistance. This program is administered by California Association for Coordinated Transportation, Inc. (Cal ACT), based in Sacramento, through an agreement with Caltrans. California is estimated to receive $241,449 in 2008 and $261,198 in State Sources State Transit Assistance The Transportation Development Act (TDA) established the State Transit Assistance (STA) account. These funds were established in 1979, under SB 620, and amended in 1982, under SB 215 and AB 251/SB The funds are derived from sources that include gasoline sales tax receipts and diesel fuel sales that help fund the Public Transportation Account (PTA), which is the primary state transit funding pot. The STA portion of the PTA is allocated directly to the transit operators in the State for any transit use, including operations, maintenance and capital projects. Two formulas are applied to distribute the revenues: one is by population; the other is by each operator s share of transit revenues generated relative to those of the other operators in the state. In recent years, the STA program has been relatively stable, with statewide funding of about $100 million annually. Fixed route transit providers use STA funds for small capital projects, such as replacing computer equipment. Regional Transportation Improvement Program RTPAs may program transit capital projects through the regional share of the State Transit Improvement Program (STIP). HCAOG sets aside two percent of the STIP for transit projects. The transit agencies formerly used this source of funding for the acquisition of buses, but now use the funds for transit amenities such as bus shelters, due to the tenuous nature of the STIP funding stream. Local Sources Transportation Development Act The Transportation Development Act (TDA) of 1971 established the Local Transportation Fund (LTF). One-quarter cent of the state sales tax generated in each county is returned to the regional transportation planning agency for deposit in the Local Transportation Fund. LTF funds are apportioned to each entity, based on population. Transit receives its share within a county, based on the ability of the transit system to meet the county's transit needs (that are reasonable to 2008 RTP Page PT-26 Public Transit & Paratransit System Element
102 meet). Arcata and Eureka allocate all of their TDA shares to transit. Table PT8 details the Humboldt County TDA revenues beginning in Fiscal Year 2001/02 and ending in Fiscal Year Table PT8 Humboldt County TDA Revenues FY 2000/ /09 Fiscal Year Amount % Change $ 3,291, % $ 3,310, % $ 3,415, % $ 3,599, % $ 3,459, % $ 3,670, % $ 4,050, % $ 4,477, % $ 4,477,578 0% Table PT9 details the TDA revenues spent on transit service in Humboldt County for the 2006/2007 Fiscal Year. The table does not reflect the TDA funds received by Fortuna Senior Transit or the Blue Lake Rancheria Transit System. Table PT9 Transit Provider TDA Revenues FY 2006/07 Transit Provider TDA revenues received RTS $931,808 A&MRTS $352,000 Willow Creek $144,282 Quail $62,684 K-T Net $27,000 DAR/DAL $68,108 Total $1,585,882 Farebox Revenues Farebox recovery for the Humboldt fixed route transit systems range from 26 percent to 43 percent of total operating costs. DAR/DAL farebox recovery is generally lower, due to the nature of the differences between the two systems. Fares are collected from general passengers, as well as through contracts with other public entities, such as A&MRTS's arrangement with Humboldt State University. Fluctuations in these contracts may cause overall fare revenue to vary from year-to-year. Table PT10 provides transit system fare revenues for the FY 2006/2007. The table does not reflect fare revenues for the K-T Net fixed route and paratransit service, Ferndale Senior Resource Agency, Fortuna Senior Transit, or the QUAIL service RTP Page PT-27 Public Transit & Paratransit System Element
103 Table PT10 Transit System Fare Revenues for FY 2006/07 Transit System Fare Revenues FY RTS $619,670 Willow Creek $40,737 ETS $210,866 A&MRTS $152,581 DAR / DAL $31,472 HCAR DAR/DAL $5,108 Total $1,060,434 Comparison of Costs and Revenues for Public Transit During the plan s development, it is required that reasonable estimates of expected revenues be forecasted during the life of the RTP. The following funding assumptions are made for transit improvements contained in the Action Element. Operations and maintenance costs are assumed to grow with inflation, essentially maintaining a flat growth pattern in constant dollar terms. Table PT11 provides the FY 2006/2007 Operating Cost and the projected 20 year Operating Costs for the RTS, Willow Creek Extension Service, ETS, A&MRTS, and K-T Net transit systems. The 20 year projected costs are calculated by assuming an annual inflation rate of 4%. The K-T Net operating costs do not reflect the entire operating budget, but the portion of the budget covered by funds addressed in the RTP. Table PT11 Operating Costs FY 2006/07 Transit System Annual Cost 20-Year Forecast RTS $1,683,373 $52,132,718 Willow Creek $166,793 $5,165,446 ETS $688,970 $21,336,851 A&MRTS $542,556 $16,802,526 K-T Net $27,000 $836,168 DAR/DAL $111,790 $3,462,047 HCAR DAR/DAL $113,207 $3,505,930 Total $3,333,689 $103,241,686 FTA 5311 funds are assumed at $425,000 per year, based on current and anticipated allocations. The 20-year forecast would be $8.5 million dollars. FTA 5310 revenues are very competitive for non-profit organizations. To be conservative, no revenues are assumed RTP Page PT-28 Public Transit & Paratransit System Element
104 The TDA revenues will continue to be allocated per the formula used to disperse funds. Revenues available for transit would be approximately $32 million dollars. The remaining TDA funds are assumed as used for street and roads. STA revenues are about $1 million annually, with a 20-year projection of $20 million. Interest income and advertising are assumed at $67,000 a year, or $1 million over 20- years. Fares of all transit operators are approximately $850,000 a year. Over 20-years, assuming fares keep pace with operating cost and inflation, fares revenue would be $17 million. Table PT12 summarizes the expected costs and revenues for transit operations and capital improvements. Based on the 20 year projection, costs are expected to outpace revenues by a total of $37 million. Table PT12 Projected 20 Year Transit Revenues and Costs ($millions of Dollars) Revenue/Cost Revenues Cost FTA 5311 $8 TDA $32 STA $20 Interest/Advertising $1 Fares $17 O&M Cost $103 Capital Cost $22 Totals $77 $125 PERFORMANCE MEASURES The performance measures were adapted from the performance measures recently adopted in the HTA and A&MRTS short range Transit Development Plan. It is recommended that the SCC develop agreed-upon performance measures for future project planning and selection of delivery. Performance Measure Indicator Standard Miles between preventable accidents >60,000 DAR/DAL: Maximum wait time < 30 minutes Fixed Route: Percent scheduled departures ontime Provide safe, reliable public and paratransit services 0 5 minutes past the published scheduled time Miles between preventable accidents Passenger injuries per 100,000 miles Less than 2 per 100,000 miles Fixed Route: Service frequency 30 minutes 2008 RTP Page PT-29 Public Transit & Paratransit System Element
105 Performance Measure Indicator Standard Provide cost-effective public and paratransit Farebox recovery ratio Fixed route = >18.8% and paratransit = > 5% services Subsidy per rider Fixed route = $2.00 Accommodate student, workforce, elderly and disabled needs Enhance marketing efforts to promote/publicize service to target markets Encourage input from local stakeholders Number of service refusals on demand response service Percentage of capacity in any hour used by subscription trips Review budgets on an annual basis to determine marketing revenues Send to interested stakeholders regarding unmet transit needs hearings or applicable transit planning meetings < 1 day < 50% ACCOMPLISHMENTS SINCE THE 2006 RTP The following accomplishments have taken place since the 2006 RTP update: HTA/RTS During the 2006/2007 unmet needs process, the Association implemented an increased Caravan program provided by Humboldt Community Access and Resource Center (HCAR). This program was expanded to include service to Old Arcata Road, and Humboldt Hill communities. Later it was expanded further to include Fields Landing, King Salmon, Ridgewood and Cutten areas. The service contract has been executed with a two year extension; Implemented the HSU Jack Pass program; Major website improvements, featuring downloadable schedules for ipods, pdas, and mobile phones; innovative schedule display features, such as customizable by-stop schedule views; Assisted in developing a region-wide Google Transit online schedule system; Completion of bus storage facility adjacent to HTA offices; Installation of electronic fareboxes on all four transit systems; and Purchase of diesel/electric hybrid buses (two buses for ETS and three buses for RTS). A&MRTS Assisted in implementation of the HSU Jack Pass program; 2008 RTP Page PT-30 Public Transit & Paratransit System Element
106 Implemented electronic fare boxes; Reviewed and appropriated conditions for all new land development projects in the City of Arcata to accommodate bus turnouts and shelters; Updated the City of Arcata 5-year transit development plan; Added the HSU Express Shuttle Bus; Assisted in developing a region-wide Google Transit online schedule system. City Ambulance Initiated the acquisition of a scheduling and dispatch system. K T Net Initiated the expansion of service to include Weitchpec 2008 RTP Page PT-31 Public Transit & Paratransit System Element
107 REFERENCES Humboldt Transit Authority Humboldt Transit Authority Transit Development Plan Update. Moore & Associates. City of Eurkea City of Eureka Transit Development Plan Update. Moore & Associates. City of Arcata City of Arcata Transit Development Plan Update. Moore & Associates. (February 5, 2008) (February 4, 2008). (February 4, 2008). Personal correspondence with Larry Pardi, Superintendent of Transit for A&MRTS. Humboldt County Association of Governments. FY Transportation Development Act Unmet Transit Needs Report and Findings. The Humboldt Partnership for Active Living. October Defining Healthy Design in Humboldt County: A Policy Charrette. Personal communication with Mike Guerriero, Community Coordinator for the Bridgeville Community Center on March 24, Personal communication with Mary Ann Bansen from the Ferndale Senior Resource Agency on March 19 th, Personal communication with Susan Harincar-Driscoll, Transportation Coordinator for HCAR on March 19 th and March 25 th, 2008 and May 15 th, Personal communication with Terri Castner, Executive Director of K-T Net on May 9 th, Personal communication with Neleen Fregoso, General Manager Humboldt Transit Authority. U.S. Department of Transportation Federal Transit Administration, 5310 Circular. (May 15, 2008) 2008 RTP Page PT-32 Public Transit & Paratransit System Element
108 BICYCLE AND PEDESTRIAN SYSTEM ELEMENT SYSTEM DESCRIPTION For most people, travel starts and ends with walking. Where facilities exist, many short trips and components of commuter trips can be most efficiently and economically completed by bicycle. The Safe Routes to Schools program relies almost exclusively on bicycle and pedestrian facilities. A smaller population segment relies almost exclusively on bicycles and walking for travel. In addition to our local population, visitors are drawn here for the walking and cycling. All this makes an interconnected, safe and efficient pedestrian and bicycle system an essential component of our regional transportation system. Walking and cycling are year-round transportation choices for many Humboldt County residents for pleasure as well as practicality. While visitors who opt for hiking and bicycle touring are more prevalent in the summer months, a variety of pedestrian and bicycle activities are locally popular throughout spring and fall. Aside from seasonal winter storms (including snow at higher elevations) the county s overall moderate temperatures are quite suitable for pedestrian and bicycle travel of all types. Many locals are adamant walkers, and cyclists, who remain active in any weather -- and the general interest in these activities, for saving energy and for fitness, is increasing. Commuting, Recreating and Touring For the purposes of this section, commuting is defined as non-recreational trips to specific destinations everything from travel for work, school or shopping, to visiting friends or attending events. Recreational walking and cycling would include any type of either activity performed essentially for fun or fitness from mountain biking and road cycling, to urban or trail hiking and pleasure walking. Bicycle touring refers to longer distance and/or travel cycling, whether by local riders or non-residents visiting and riding through the county. For commuters, the choice to walk or cycle often depends more on distances and safety than on weather conditions. Humboldt s cities and communities are spread far and wide, with few connective corridors that can safely accommodate either foot or bicycle traffic. Also, depending on one s level of fitness or experience, the overall area s varied topography can be highly challenging. However, a growing number of cyclists do commute, regularly, often along the county s highways. Commuter walking is more likely to occur within the various communities, albeit distances and safety issues may present obstacles inside city limits as well. Hiking and mountain biking are popular recreational activities, with both locals and visitors, in the National Forest, State and National parks, and community parks and forests. Although more 2008 RTP BP-1 Bicycle and Pedestrian System Element
109 people pursue these activities during warmer, dryer months, these off-roads trails are well-used throughout the year; however, a trail s maintenance and surfacing may dictate the levels of use. Also, since many people walk alone, in isolated areas, the perception of personal safety in these areas is paramount. Bicycle touring has a staunch local following, and touring visitors cycle through Humboldt County at all times of the year. Safety is a primary concern for these groups. Road conditions are use-determining factors, as well as a rider s proximity to vehicles along back roads and highways. Another significant factor is rider/driver awareness, and the continuing need for a better understanding of road etiquette -- on both sides. Safety Pedestrian safety issues are manifold, depending on the when, where, and how any type of walking occurs. In towns, sidewalks may separate walkers from vehicles but obstructions such as mailboxes, power poles often force pedestrians (and wheelchairs) off the pavement, or into the street. In towns, or in the country, wherever sidewalks are not present, people typically walk in the roadways, many of which have barely useable shoulders. Street crossings, even at marked intersections, can be hazardous, depending on walker/driver awareness. Walking at night, or in areas with few people, heightens vulnerability to crime as does the absence of enforcement officers. On trails and beaches -- especially in the larger parks or forests encountering a ranger or enforcement officer is a rarity. Hiker vulnerabilities may include dangers from natural conditions, wildlife, or other persons. In addition, since State, National, and some local, parks do not allow even leashed dogs on trails, one of the few personal safety measures a hiker can take is denied. Humboldt s multi-use trails -- which typically allow hikers, cyclists, walkers and equestrians -- present a unique safety issue. Effective use of these trails demands general public knowledge of, and appreciation for, right-of-way and speed limits. Ongoing education in effective trail etiquette, for all these user groups, is essential to promote awareness, understanding and cooperation. Safety issues for cyclists also hinge on improved rider/driver awareness, and, as stated previously, the continuing need for both groups to develop a better understanding of road etiquette. Road conditions, countywide, also present serious safety concerns: Plethoras of potholes, dangerous debris, lack of designated bike paths or lanes -- or even a useable shoulder all deter safe bicycle usage and set the stage for accidents. Connectivity Although many of Humboldt s cities, and the County, are working on alternative routes and facilities that would provide safe access for bicyclists and pedestrians, these various facilities are not interconnected. Even within towns, designated travel pathways for both pedestrians and bicycles may be available in some sections, and not in others and getting from one part of town to another, as a walker or cyclist, can be daunting and unsafe RTP BP-2 Bicycle and Pedestrian System Element
110 Desirability Historically, the State and County have been minimally involved with pedestrian improvements, because the roadways under their jurisdictions are generally not designed to meet pedestrian demand. Similarly, while bicycles can legally use all State and county roadways, only a limited number of these facilities are constructed to safely carry bicycle traffic and motor vehicle in the same right-of-way. While individual cities and small towns have attempted to improve safe pedestrian and bicycle access, their financial constraints have too often dictated other priorities. Yet, the health, environmental and economic benefits associated with walking and cycling are well documented. It has been said that every trip (except for those with disability) starts and ends with walking. The key is to extend this activity to more of each trip. For Humboldt County, the key to improving local and regional air quality, relieving traffic congestion, and enhancing tourism, may well be the provision of safer more efficient, interconnected pedestrian and bicycle facilities. Health Benefits Sidewalks, roadway shoulders or other pedestrian facilities enable people to walk more safely, for utilitarian, recreation and personal enjoyment purposes. Recent U.S. studies show that people walk on average 70 minutes longer in pedestrian-oriented communities. Additionally, clearly marked bike lanes enable bicycle use and potentially decreasing bicyclist injuries. Biking and walking can help people meet minimum physical activity requirements. Health benefits of physical activity include a reduced risk of coronary heart disease, hypertension, colon cancer, and diabetes mellitus and premature mortality. On the other hand, unsafe mixes of motor vehicles, pedestrians, and cyclist traffic leads to increased risk of injury and death. In addition to individual benefits, biking and walking also reduce noise or air pollution emissions. For most, long term exposure to moderate environmental noise levels can adversely affect sleep, school and work performance, and cardiovascular disease. According to the World Health Organization, noise reductions help improve sleep. Chronic road noise can affect cognitive performance of children, contributing to attention deficits, reduced ability to concentrate, and diminished reading ability. Noise is also associated with higher stress and stress hormone levels. Increased biking and walking trips reduce driving trips, improving air quality and reducing respiratory disease effects. According to the California Air Resources Quality Board, about half the air pollution in California is caused by cars and trucks (Humboldt County General Plan Update Health Impact Assessment - Safe and Sustainable Transportation Indicators). Bicycle and Pedestrian Facilities as part of Complete Streets Concept The term complete streets means a transportation corridor designed and operated to enable safe access for all users. Pedestrians, bicyclists, motorists and transit riders of all ages and abilities must be able to safely move along and across a complete street. A complete streets policy or 2008 RTP BP-3 Bicycle and Pedestrian System Element
111 program would ensure that the entire corridor right of way is designed and operated to enable safe access for all users. It is expected that the next SAFETEA-LU reauthorization, expected in 2009, will include funding for complete street projects. NEEDS ASSESSMENT The quality and quantity of bicycle and pedestrian facilities (aside from those accommodating the mobility-challenged) vary widely throughout Humboldt County. The region s pedestrian and bicycle facilities are predominantly sidewalks, crosswalks, and bicycle lanes associated with the road system. Pedestrians and bicyclists frequently utilize roads in Humboldt County that lack sidewalks and/or bicycle lanes. A number of community and public land trail systems provide transportation and recreation opportunities; however, most of the facilities dedicated exclusively for non-motorized use are provided in urban areas of the county. The Humboldt County Pedestrian Needs Assessment Study concluded that better pedestrian access and improved safety conditions are required to ensure that the County and its communities are walkable, safe, vibrant places to live. Cyclists are granted full access to all State route facilities in Caltrans District 1, which includes all of Humboldt County. Goals and policies for bicycle facility development, existing and planned bicycle facilities, and related implementation plans are described in HCAOG s June 2004 Regional Bicycle Transportation Plan Update. A 2003, Humboldt County resident opinion survey about many aspects of living in Humboldt County was conducted. Sixty nine percent of respondents felt that the County should provide walking and biking paths closer to existing communities. Sixty two percent stated that closer access to outdoor recreation including bicycling was a major reason why they live in Humboldt. People participating in the Humboldt County Health and General Plan Update focus groups saw the health connection between land use planning that prioritized non-motorized transportation. Participants understood that bike/pedestrian network connections increase physical activity and reduce cardiovascular disease, diabetes and stress. They also recognized the value of quantifying the amount of non-motorized transportation routes, multi-use trails, and bicycle-friendly roads to building a path and trail network. Vehicle speed limits; safe and dry bike parking; lighting; pedestrian and bike friendly traffic signals; marked, designated and mapped bike lanes; community connectivity; sidewalks and well marked cross-walks; and bike safety education; were identified as needs in the General Plan Update Health Impact Assessment (Humboldt County General Plan Update Health Impact Assessment - Safe and Sustainable Transportation Indicators). Pedestrian Use Pedestrian facilities are most commonly found in the County s seven cities and larger unincorporated communities. Sidewalks and pathways of varying width are found in 2008 RTP BP-4 Bicycle and Pedestrian System Element
112 commercial areas, residential neighborhoods, and near schools. Existing sidewalks, in many cases, meet only the minimum ADA standards an often are obstructed by utility poles, signposts, and other obstacles. There are also sidewalk gaps, uncontrolled intersections, and street crossings that pose pedestrian travel impediments, especially to the mobility-impaired. Many outlying areas have no dedicated pedestrian facilities at all, and pedestrians must use roadways for travel between communities. In many rural locations, sharing of roadway by pedestrians, vehicle and truck drivers, bicyclists and even equestrians is common. Bicycle Use The cycling population is made up of recreational cyclists, touring cyclists who travel through the area, local bicycle commuters, and those who use multiple modes, such as combining bicycling and transit. While cycling is a choice for some, many of these users do not have access to other modes of transportation. Children, low-income members of the community, and college students frequently utilize bicycle transportation out of necessity. Data from the 2000 Census showed that in Humboldt County, 1.7 percent of persons aged 16 years or older used a bicycle for work-related trips, compared to only 1.0 percent of persons age 16 years or older that use public transit for work-related trips. However, census data did not include information on individuals who use bicycles as their primary mode of transportation aside from work-related commuting, or for transportation to and from school. According to the 2004 Regional Bicycle Facilities Plan both Humboldt State University (HSU) and College of the Redwoods (CR) "have significant potential bicyclist populations," with HSU generating "more cyclists because of its larger enrollment, parking constraints, and location in the City of Arcata." In addition, data from the Humboldt Bay Area Bicycle Use Study [RCAA 1999] indicates that over 900 cyclists passed through one intersection near HSU, during a twelve-hour period, on a weekday. That study also documented a substantial number of cyclists in the Eureka, greater Arcata, and McKinleyville area. (Refer to Bicycle Use Study data highlights, below, for general characterizations of bicycle travel). Based on information contained in both of the above plans, it is assumed that there is a higher percentage of bicycle commuters in Humboldt County that was indicated by the 2000 census. Local Agency and Community Organization Based Efforts The planning and development of bicycle and pedestrian improvements by cities, Caltrans, and the County of Humboldt are supplemented -- and often pioneered by community desires to establish bicycle and pedestrian facilities within, and between, communities. Such grassroots efforts have effectively demonstrated long-term, local commitments to implementation. Examples in this region include: Humboldt Bay Bicycle Commuters Association -- advocates a balanced transportation system inclusive of bicycle transportation and has worked with Humboldt County and cities to secure grant funding for bicycle improvement projects RTP BP-5 Bicycle and Pedestrian System Element
113 The Friends of the Annie and Mary Rail-Trail -- working to develop a trail along the outof-service rail corridor between Arcata and Korbel. Citizen groups in Jacoby Creek, Redway and Garberville, Eureka and Trinidad -- supporting local pedestrian, bicycle, and trail development. Green Wheels - a community based organization advocating for efficient and environmentally friendly transportation alternatives. They maintain a website: and produce a newsletter: Community Wheel. The Trails Trust of Humboldt Bay was formed for the purpose of both advocating and educating the community about potential projects for trail development and to raise necessary funds for the planning and permitting stages. They maintain a website: The Humboldt Partnership for Active Living (HumPAL) provides trainings and workshops to promote active living education, and contributes to neighborhood, regional, transportation design and redevelopment efforts to help ensure inclusion of active living principles into sustainable community design. HumPAL has facilitated several studies encouraging healthy transportation alternatives, which include: Active Living by Design Policy Charrette and Let s Get Moving: A Plan for Action. The Let s Get Moving: A Plan for Action includes a Humboldt County Physical Activity Primer and a HumPAL Strategic Plan. Bicycle Routes, Classification and Level of Service In general, there are three major types of bicycle facilities: bike paths, which are public land trail systems, either dedicated as bikeways or shared with pedestrian and equestrian trails systems; bicycle lanes, which are dedicated and lined along sections of roadways; and bike routes, which are signage-only, along sections of roadways. In Humboldt County, all bike paths are located in urban areas. Bicycle facility types are summarized in Table BP1 below. Table BP1 Bikeway Definitions from Caltrans Highway Design Manual Name Bikeway Classification Description* Bike Path Class I Separated, surfaced right-of-way designated exclusively for nonmotorized use. The minimum width for each direction is 1.5 meters, with a 2.4 meter minimum width for a bi-directional path. Bike Lane Class II White stripe and Bike Lane sign on roadway providing 1.5 meters of road surface for preferential bicycle use (not including gutter). Vehicle parking adjacent to and motorist crossflow is allowed. Bike lanes must be on both sides of a two-way road for one-way travel only. Bike Route Class III Shared roadway with motorists on through routes not served by Class I or II bikeways or to connect discontinuous bikeways. Established by a Bike Route sign. *All roadways are open to bicycle use in Humboldt County; the listed facilities further accommodate bicycles RTP BP-6 Bicycle and Pedestrian System Element
114 Bicycle lanes exist in Eureka, Arcata, McKinleyville, Fortuna (see figures pages BP9-BP13). The City of Arcata provides the most interconnected system of bicycle lanes that facilitates access to, and from, various trip-generating areas. In Eureka, the bike lane system includes both north-south and east-west lanes; however, not all the City s trip-generating areas are connected. Both McKinleyville and Fortuna have limited systems of bike lanes and designated routes. The only example of a Class I bike path in Humboldt County is the Hammond Coastal Trail, in McKinleyville, which provides a non-motorized environment for both transportation and recreation purposes. It extends from Clam Beach to the Mad River. State bike lane width standards were increased from four feet to 1.5 meters (approx. 5 feet) in 1997; consequently, many bike lanes constructed in Humboldt County before 1997 do not meet current State width standards. The Pacific Coast Bike Route, (PCBR) begins on Highway 101 at the California/Oregon State Line, and ends 1,000 miles away, adjacent to Interstate 5 at the Mexican border. In Humboldt County, the trail diverts to Newton B. Drury Scenic Parkway, through Prairie Creek Redwoods State Park. South of the park, it rejoins Highway 101 for approximately 40 miles, up to the City of Eureka. At Eureka, the PCBR immediately diverts from Highway 101, following a series of one-way city streets with lower traffic volumes. South of Eureka, it travels along Highway 101, approximately 80 miles to the Mendocino County line. Bicycle Level of Service The current County Trails Plan does not include service standards. Bicycle level of service (LOS) modeling has been developed in the past five years and is gaining acceptance throughout the country (USDOT 1998). Established service standards clarify the ability of existing facilities to meet current and future needs. They can be expressed on the same A to F scale as used for roadway planning. For bike routes, for example, standards could reflect the relationship between flow rates, density and speed (see Table BP2). Table BP2 Bicycle Flow Characteristics on Bike Paths and Bike Lanes Level of Service (LOS) Characteristics A B C D E F Flow Rateª (bikes/min/ft) < Variable Density (bikes/sq. ft) < >.025 Cycling Speed <6.0 ª Minimum bike path or bike lane width for which these figures apply are: LOS A-8.0 ft; LOS B-7.5 ft; LOS C-3.5 ft; and LOS D-3.2 ft. The greater widths shown for LOS A and B are necessary to allow free overtaking. Source: Institute of Transportation Studies, University of California, Berkeley. Fundamentals of Traffic Engineering, 13 th Edition. As an example, in Davis, California, standards for Class I Bike Paths and Class II Bike Lanes address the function of the facility, access control and right-of-way requirements. In Humboldt County, these standards should reflect differences between the rural and urban environments; 2008 RTP BP-7 Bicycle and Pedestrian System Element
115 there also may be a need for special standards in coastal areas, where bike usage is higher than in rural areas inland. The perception of hazard is prime component of this modeling. A cyclist s perception of hazard is based on many factors -- road and traffic conditions, as well one s personal condition, skill level, and riding experience. Poor roadway conditions can include close proximity to motor vehicles, deteriorated pavement, presence of debris, high volume and/or speed of traffic, and intersections without traffic controls (i.e. stop signs). The perception of hazard is also a major factor in route selection, or whether a bicycle trip is even initiated (City of Birmingham, 1996). This link between perceived hazards and cycling behavior was demonstrated in the Humboldt Bay Area Bicycle Use Study which revealed that, when local cyclists believed conditions to be hazardous, they were more likely to ride on the sidewalk, or against traffic, or select a different route, or not ride at all (RCAA 1999). If recognition of the links between perceived hazards, bicycle use volume and route selection is incorporated into planning and developing bicycle facilities, ridership can be increased. In addition, a variety of facility types and cycling environments will meet the needs of a larger cycling population. Although the above modeling is applied to cyclists, it is a model that contains components applicable to pedestrians as well -- specifically, the perception of hazard. Cyclist and pedestrian perceptions of hazard could be useful tools in determining priority areas for bike and pedestrian improvements. It is also critical for Caltrans, City and County governments to acknowledge that improving access for cars may increase conflicts with both pedestrians and cyclists. All modes of transportation should be considered, in concert, when planning and designing phases of road construction or rehabilitation. Bicycle Facilities The presence of adequate parking facilities is important to many cyclists. Overall, bicycle parking facilities outside of Eureka and Arcata business centers are sporadic, and few are sheltered from weather. Also, many of the older bicycle parking facilities in the region either do not accommodate contemporary bicycle designs or no longer function effectively. However, the communities of Arcata, Eureka, and McKinleyville have installed new, low-maintenance, easyto-use bicycle parking facilities. In addition, steps have been taken by a few local transit providers to aid commuters that rely on the combination of transit and bicycle as their means of transportation. Humboldt Transit Authority installed improved front-loading bicycle racks on all of their Redwood Transit System buses. Blue Lake Rancheria buses are also equipped with user-friendly bike racks. Below are figures illustrating the existing bicycle facilities for the City of Rio Dell, the City of Fortuna, the City of Eureka, the City of Arcata, and McKinleyville RTP BP-8 Bicycle and Pedestrian System Element


116 2008 RTP BP-9 Bicycle and Pedestrian System Element


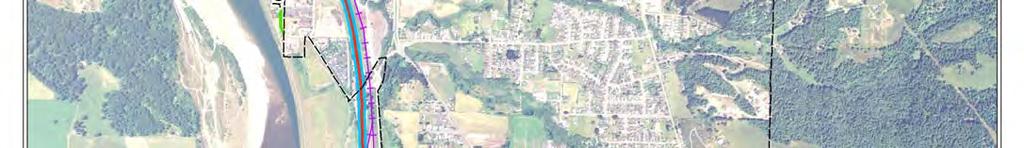


117 2008 RTP BP-10 Bicycle and Pedestrian System Element


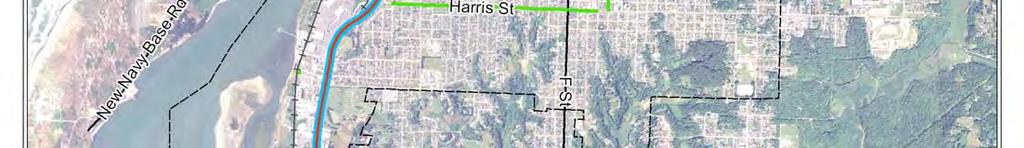

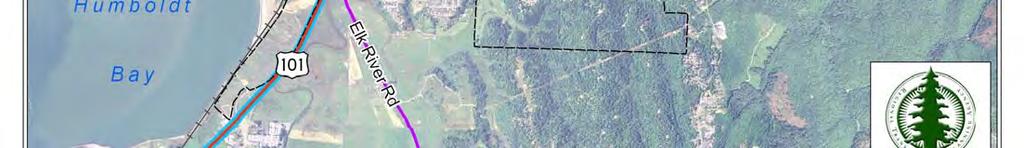
118 2008 RTP BP-11 Bicycle and Pedestrian System Element


119 2008 RTP BP-12 Bicycle and Pedestrian System Element


120 2008 RTP BP-13 Bicycle and Pedestrian System Element


121 2008 RTP BP-14 Bicycle and Pedestrian System Element
122 Pedestrians Data from the 2000 Census indicates that in Humboldt County, 6.5 percent of persons aged 16 years or older walk to work. Although pedestrians typically include all segments of the population, the elderly, children, college students, low-income, and disabled individuals are most likely to rely on pedestrian travel. People with disabilities comprise a substantial part of the pedestrian population -- especially elderly citizens who have a variety of mobility and sensory limitations. Pedestrian Facilities Facilities most utilized by pedestrians are: sidewalks, crosswalks, and -- where those facilities are not available -- road or highway shoulders (albeit road shoulders are not considered a pedestrian facility). Many of the rural roadways in the county do not provide any facility for pedestrians, which forces people to walk in, or too near, the vehicle travel path. In a few areas, multi-use pathways, walking paths, or trails serve as transportation corridors. Pedestrian facilities are most commonly provided in urban areas of the county (individual cities as well as a number of unincorporated communities). Where these facilities do exist, they most often meet only the minimum ADA standards. Existing sidewalks may be obstructed by utility poles, sign posts, street furniture and/or driveways, which can force pedestrians and wheelchair users into road shoulders or bicycle lanes. In recent years, the County and some of the cities have installed more curb cuts and otherwise improved wheelchair access; however, numerous gaps in the overall pedestrian facilities system remain. For one example, existing pedestrian street crossings in some areas are difficult to negotiate, particularly for the mobility-impaired. Again, many smaller communities, or neighborhoods in outlying areas of the county, have no dedicated pedestrian facilities at all. A number of communities are bisected by very busy state routes, or county roads with no (or limited) crossing facilities. Hence, in and between most of these smaller communities, pedestrians walk in the roadways. Bicycle and Pedestrian Facility Planning This plan identifies Humboldt County s pedestrian and cyclist needs and desires. The development of pedestrian and bicycle facilities, as well as linkages between these and other modes of transportation, became part of Humboldt County s planning purview with the preparation and adoption of the Humboldt County Trails Plan in In 2004, HCAOG adopted the Regional Bicycle Transportation Plan Update for Humboldt County. The document was created to facilitate coordinated, area-wide bicycle facilities development, throughout the County, and was written to be incorporated, by reference, into the RTP. Additionally, the Plan established the region s seven cities and the county s eligibility for the State s Bicycle Transportation Account (BTA) funding. More information about this funding source is in the financial section RTP BP-15 Bicycle and Pedestrian System Element
123 Eligibility for this funding is critical, because lack of funds is typically an obstacle to bicycle facility development. The RTP also incorporates, by reference, more in-depth planning efforts by cities and communities in Humboldt County. These local plans often contain more detail about route alignments, facility type, design, phasing and costs The City of Arcata adopted the Arcata Pedestrian and Bicycle Plan in November of It focused on the encouragement of cycling, and walking, as preferred transportation alternatives -- whether for commuting, shopping, or other purposes. The Arcata Pedestrian and Bicycle Plan provides goals, objectives, and policies that serve to guide the planning and implementation of comprehensive network of walking and cycling routes in Arcata, with linkages to other communities. The Avenue of the Giants Community Plan was developed in Residents of the communities along the Avenue of the Giants have expressed interest in establishing a multi-use pathway, parallel to the Avenue. Most of the pathway would be located in beautiful Humboldt Redwoods State Park, with some private property also involved. The community plan provided policies to support the development of this trail, as well as trails to, and along, the Eel River. The Humboldt County Department of Community Development Services helped residents update the Blue Lake Community Action Plan in July of 2003, which included several proposals to improve cycling in Blue Lake. One proposed project would develop a bicycle rental program similar to Arcata s Library Bike program. Another project goal was to adopt a trails plan that would include the Annie and Mary Rail Trail, which has the potential to evolve into a major regional trail in Humboldt County. In addition, the circulation element of the Blue Lake General Plan adopted in 1986 identifies non-motorized transportation modes as vital to the City. Policies to encourage cycling included non-vehicular access to, and along, the Mad River, pathways to schools and recreational areas, and bicycle parking requirements. The Eureka City Council initiated the 1982 Bicycle Plan process, to enable the City to qualify for State grants, and to provide a safe and efficient network of bikeways throughout the City. Policies in that plan addressed not only the provision of bikeways, but also bicycle parking, rider/driver education, and the need for funding to implement the plan s recommendations. The Transportation and Circulation element of Eureka s General Plan, adopted in 1996, identifies the bicycle as a viable mode of transportation. That Plan includes a bikeway system, revised from the 1982 bicycle plan, and policies supporting the installation of bikeways and bicycle parking. The City of Rio Dell updated its Land Use Element in 2003, as part of its efforts to maintain a small town character, focus new growth within the existing downtown neighborhoods, and revitalize the downtown area. The existing Circulation Element contains bikeway classifications and applies designations to certain streets. The Land Use Element contains transportation policies which encourage the development of bicycle routes and alternatives sources of transportation. The City of Fortuna is currently in the process of updating its General Plan. The Transportation and Circulation Element of the General Plan will contain sections devoted to pedestrian and bicycle travel. The Background Report (the initial report in the General Plan Update process) has been released. It assessed Fortuna s bicycle and pedestrian facilities, identifying areas for improvement that will be addressed in the General Plan Update RTP BP-16 Bicycle and Pedestrian System Element
124 The Manila Community Services District (MCSD) was awarded funding from HCAOG and Caltrans in 2003 and to study transportation in that community, particularly along Highway 255. Recommendations in the Manila Transportation Plan Phase I (2003,) to improve bicycle safety and access, included Share the Road signs along Highway 255, and a rail-trail between Pacific Avenue, the Dean Street and Peninsula Drive intersection, and just north of Ward Street. The Manila Community Transportation Plan Phase II was released in December of It recommended the development of pedestrian and bicycle paths already defined in the 2004 Humboldt County Regional Transportation Plan. The Circulation Plan of the McKinleyville Community Plan of 2002, established policies which illustrate that community s commitment to bicycle facilities. It designated new roadway and intersection design standards that incorporate bikeways, and funding priorities that favor safe pedestrian and bicycle access to schools. It also envisioned more off-street pathways. The Willow Creek Community Action Plan was drafted in July of Humboldt County Community Development Staff worked with residents of Willow Creek to develop this plan, to improve the overall quality of life in Willow Creek. Building bicycle trails was recommended, to make the area more attractive to visitors and residents. In 2003 Hoopa was awarded a grant under the Environmental Justice: Context Sensitive Planning for Communities Grant Program. The purpose of this grant-funded project was to involve the community in crafting design solutions to traffic safety problems (specifically the critical injury cluster sites along Highway 96) while supporting existing community development efforts. Implementation of the grant began in November In January of 2006, the Traffic Calming and Safety Enhancement in the Hoopa Valley Indian Reservation: A Conceptual Plan for Downtown Hoopa was released. That Plan provided a blueprint for implementing ideas related to pedestrian safety, and enhancing the pedestrian environment, through downtown Hoopa. State Highway 96 is the main route through Hoopa, yet there are no sidewalks, bikeways, or formal public trails that allow people to walk outside the travel lanes. Pedestrian crosswalks, and a pedestrian zone on Trinity River Bridge, are a few of the safety improvements recommended in the Plan. Related Research Bicycle Use Study: During 1997 and 1998, bicycle use in, and between, Eureka, Arcata and McKinleyville was studied. Data was collected during all seasons, including the number of cyclists, data on the cyclists, and their cycling behavior. The Humboldt Bay Area Bicycle Use Study (1999) documented bicycle use in the three communities, on Highways 101 and 255, on Old Arcata Road/Myrtle Avenue (Figure 6), and on the Hammond Trail. Bicycle use occurred throughout all the sampling periods. Cyclists were more active in spring, summer and fall months, but also were present, in appreciable numbers, during rainy winter months. Regional Pedestrian Needs Assessment Study Update: HCAOG prepared a Regional Pedestrian Needs Assessment Update in June That update identified the existing pedestrian network, and developed recommendations to improve pedestrian access throughout Humboldt County. It assessed intersections, routes to schools, transit, downtowns, civic centers, 2008 RTP BP-17 Bicycle and Pedestrian System Element
125 commercial districts, recreation resources, and neighborhoods. Although the study focused on pedestrian improvements, several multi-use trails which serve either as segments of the regional bikeway network, or local routes, were identified. The assessment is being updated and the 2008 Regional Pedestrian Needs Assessment Study is scheduled to be adopted by the HCAOG Board in June of Humboldt County General Plan Update: The County is currently updating its General Plan. Indications of the information collected to date, and the policy considerations under review, may be demonstrated by two reports: The 2001 Critical Choices Report is a compilation of public input. Non-motorized transportation pedestrian, bicycle, and equestrian travel was a priority for many people around the county, while others approved of non-motorized improvements as long as property rights were protected and maintenance issues were addressed. The 2002 Moving Goods and People Report describes the county s bicycle and pedestrian facility conditions, and presents policy options for inclusion in the Circulation Element of the General Plan. In addition, the Humboldt County Community Infrastructure and Services Technical Report has information about County Roadways that is applicable for bicycle and pedestrian facilities. Humboldt county General Plan bicycle and pedestrian policy topics are summarized in the Goals and Policies Section. Existing Programs There are a number of bicycle programs already in place around the County, which are aimed at improving safety, convenience, and ridership. Library Bikes: Arcata Library Bikes evolved from the 1990 s Green Bikes program. Volunteers repair and rebuild bicycles, from donated parts, to maintain a fleet for loan. These bicycles are available for check out with a $20 deposit for a six-month period. They can be returned before the lending period expires for a refund, or be checked out again. Promise Bikes are bicycles of higher quality, that are loaned to people who vow to give up their car for trips within Arcata, or for students moving to Arcata without an automobile. Both programs have been a tremendous success. Library Bike also provides an after-school program, in which they teach kids basic bicycle repair and maintenance. Bike to Work Month Activities: The Humboldt Bay Bicycle Commuters Association (humboldtbikemonth.org) hosts and annual Bike to Work Day, typically during National Bike to Work Week. They encourage bicycle commuting and give prizes, and other incentives, for distinctive groups and riders RTP BP-18 Bicycle and Pedestrian System Element
126 GUIDING GOALS, POLICIES, AND OBJECTIVES Goal: Create a transportation system that provides inter-community and intra-community nonmotorized pedestrian, bicycle travel throughout the region. BP-1 Policy: Develop a cohesive system of regional bikeways that provides access to, and between, major activity centers, public transportation, recreation, and other destinations, and eliminate barriers to pedestrian and bicycle travel. [Linked to Performance Measures #9- Pedestrian Mobility and #10-Bicycle Mobility.] Objective: Periodically evaluate designated pedestrian facilities and bicycle routes to identify barriers to local and regional pedestrian and bicycle travel. Prioritize pedestrian and bicycle roadway improvements that will eliminate those barriers -- such as bridges, roadway shoulder widening, and gap closures. Objective: Construct and maintain contiguous sidewalks and designated bicycle routes within one mile of all public schools, and between transit stops and nearby public facilities (libraries, parks, and community centers). BP-2 Policy: Encourage an interconnected transportation network. Objective: Update transportation plans to include an interconnected, well-planned, and efficient regional transportation network that includes pedestrian and bicycle facilities. Objective: Develop bicycle and pedestrian trail facilities in the region, through coordination among Humboldt County (Humboldt County General Plan), Caltrans, cities, non-profits, and other entities with planning responsibilities. BP-3 Policy: Encourage and support the creation, or expansion, of comprehensive safety awareness, driver education, cyclist education and diversion training programs for bicyclists and motorists. Objective: Develop programs that improve the safety of pedestrians and bicyclists -- including education for bicyclists, motorists, and pedestrians -- and actively enforce bicycle safety laws. BP-4 Policy: Encourage the pursuit of alternative non-motorized funding sources to the maximum degree plausible. Objective: Secure alternative funding source -- such as grants and public-private partnerships-- to finance pedestrian and bicycle facility improvements. Objective: Develop alternative approaches for providing improvements to pedestrian and bicycle facilities RTP BP-19 Bicycle and Pedestrian System Element
127 BP-5 Policy: Encourage bicycle-friendly designs for all streets and roadways, through new technologies, best practices standards, guidelines, and innovative treatments on new roadways and multiuse paths. Objective: Administer resurfacing programs for local streets to include appropriate provisions for bicycle facilities. All bikeways will be developed in compliance with standards adopted by Caltrans and as required by Sections 2375 and 2376 of the Streets and Highways Code. Objective: Secure funding augmentations for roadway improvement projects to include bicycle and/or pedestrian facility improvements, such as bridges, roadway shoulder widening, and dedicated facilities for bicycle travel. BP-6 Policy: Maintain pedestrian and bicycle facilities. Objective: Program funds, as available, for HCAOG entities to maintain pedestrian and bicycle facilities in safe, efficient condition. BP-7 Policy: Encourage the adoption of ordinances requiring bicycle parking and storage for all new development and redevelopment. Objective: Provide sample ordinances that promote adequate bicycle parking facilities as part of new development projects' off-street parking requirements. Ordinances are to be applicable to commercial, industrial, and multi-family residential uses. Encourage cities and the County to adopt these bicycle parking ordinances. BP-8 Policy: Promote use of the Bicycle Level of Service concept. Objective: Provide member entities with information on the Bicycle Compatibility Index and the Bicycle/Pedestrian Level of Service (B/P LOS) concept. Objective: Use the Bicycle Compatibility Index as a resource for determining BLOS and bicycle facility needs. BP-9 Policy: HCAOG recognizes the high level of public support for provision of a dedicated bicycle and pedestrian facility between Arcata and Eureka. Objective: Promote the study of alternatives for a dedicated facility between Arcata and Eureka. Objective: Continue to support the multi-jurisdictional group of stakeholders, currently working to identify constraints and opportunities to develop a multi-use trail facility in NCRA and Caltrans corridor between Eureka and Arcata, under a National Park Service Technical Assistance grant RTP BP-20 Bicycle and Pedestrian System Element
128 Coordination with County General Plan Policy The following are a representative listing of the policies topics the county is proposing for their general plan: Roadway Capacity Expansion and Non-Vehicle Modes. Right-of-Way Design Standards. Encourage bicycle-friendly design Right-of-Way Multi-Modal Level of Service Standards. Efficiency and Capacity Investment Priority. Capital Improvement Plan. Coordination with School Districts. Walkability Audits. Traffic Calming. Landscape Maintenance Zones. Protection of Designated Trails and access to recreation areas. Encourage Bicycle Storage Facilities and transport on Public Transit. Annie and Mary Trail & NWP Railroad Right of Way for Bicycles and Pedestrians. The policies adopted in the Humboldt County General Plan will be implemented through county zoning and development standards. ACTION PLAN: PROPOSED PROJECTS The 2004 Regional Bicycle Transportation Plan for Humboldt County identifies potential bicycle projects, bicycle routes, facilities, and improvements for the region. The list of projects in that plan is detailed in the Needs Assessment section of this document. HCAOG's Pedestrian Needs Assessment was updated in June 2003 and provides recommendations for future pedestrian projects throughout the region. That complete list of recommendations is also included in the Needs Assessment. At the initial set of RTP workshops, comments were received regarding the need for the establishment of a bicycle and pedestrian trail between Arcata and Eureka. A National Park Service technical Assistance Grant funded a study of the opportunities and constraints regarding multi-use trail facility development in the NCRA corridor between Eureka and Arcata. A group of multi-jurisdictional stakeholders who are affected by the trail development (HCAOG, RCAA, City of Arcata, City of Eureka, County officials, National Park Service, Caltrans, Humboldt Bay, NCRA) has been established, to assist the National Park Service. High priority bicycle and pedestrian projects, identified and updated by respective entities, are illustrated in Table BP3. However, it is important to note that the Pedestrian Needs Assessment and the 2006 Regional Bicycle Transportation Plan identify additional projects throughout the county. Table BP4, found on page BP-24, highlights non-motorized illustrative projects or projects that are needed but have fiscal constraints. Table BP5, found on page BP-25, illustrates long-term, non-motorized projects. A figure of proposed regional trails can be found on page BP RTP BP-21 Bicycle and Pedestrian System Element
129 Table BP3 Humboldt County Non Motorized Planned Projects PLANNED PROJECTS Project Description Cost ($) Trinidad Main Street/ Weshaven Drive East City Limits to Trinity Street. Enhanced Class III. 555 Planned 2008/2009 Patrick's Point Drive Main Street to City Limits. Enhanced Class III. Planned /2009 Rio Dell Center Street and Davis Street Wildwood to Ireland. Construct pedestrian refuge, sidewalks, bulb-outs, speed bumps, school access trail and striping and signing. State 528,000 Funded Safe Routes to School Grant. Construction Planned in Summer 2009 Wildwood Ave Scotia Bridge to Davis Street Corridor. Planned as part of 2008 STIP Project and Pending Application for HSIP Grant Ferndale 5th Street Arlington Avenue to Pixley Avenue Corridor. Partially funded, planned for 295, Arlington Avenue Main Street to 5th Street Corridor. Partially funded, planned for 125, Berding Street Rose Avenue to Lewis Avenue Corridor. Partially funded, planned for 30, Rose Avenue Berding Street to Lincoln Avenue Corridor. Partially funded, planned 165,970 for Herbert Street Rose Avenue to Dewy Avenue Corridor. Partially funded, planned for 261, Fortuna Various locations throughout the City including, but not limited to, numerous corners on 8 th, 9 th, 10 th, 11 th, 12 th, 13 th, 14 th, 15 th, 16 th, Newberg, and Wood Streets, and So. 185,000 Fortuna Blvd. ADA Sidewalk Accessibility Improvement Project Phase 1 Probable CDBG Funding. Construction through Various locations throughout the City including, but not limited to, numerous corners on 7 th, 9 th, 10 th, 11 th, 12 th, 15 th, 16 th, Newell, Wood, Senestraro, Shamrock, and Jenny 335,250 Streets. ADA Sidewalk Accessibility Improvement Project Phase 2 Possible CDBG Funding. Construction through Eureka H Street/ Campton Road Harris Street to City limit Class II Planned for City has applied for grant funding to upgrade bike lane markings to thermoplastic. If money 46,425 exists we will include H Street with this project RTP BP-22 Bicycle and Pedestrian System Element
130 PLANNED PROJECTS Project Description Cost ($) Arcata Arcata Pedestrian and Bicycle Master Plan 2009 Update and CIP * 25,000 11th Street Q Street Janes Road Class II In Progress Complete 04/08 22,727 Alliance Rd. Spear Avenue14th Street Class II In Progress Complete 08/08 89,489 Samoa Blvd. K Street Buttermilk Ln. Class II. K H Streets with Samoa Blvd. Improvements (2009) Union Buttermilk Ln STIP 85,938 10th Street Q Street L Street Class III Fund 2008 for Bike Blvd. 50,000 11th Street Corridor Class II / III Janes Road to Bayview Street 22,500 Sunset Avenue Class II / III Western Avenue to H Street 4,750 F Street Class II / III 7 th Street to 11 th Street 7,650 Citywide Bicycle Parking Bike Racks & Bike Lockers Bike Routes Class II / III city wide 217,500 Bike Boulevards w/ calming Class III city wide 73,250 Hammond Trail (on RR ROW) Class I west Arcata city limit to Annie & Mary Rail Trail 770,000 Annie & Mary Rail Trail Arcata Reach Class I north Arcata city limits to Marsh / 700,000 South G Street Arcata-Eureka 101 Corridor Bike Path Class I / II H Street to South Arcata City Limit 687,000 Blue Lake Hatchery Road Railroad Avenue to Mad River Bridge Class II Planned for construction ,150 I Street Blue Lake Blvd to 5 th Avenue. Planned for construction Humboldt County Herrick Sidewalks Funded - STIP 2009 construction * 206,000 Myrtle Sidewalks Funded -STIP 2009 construction * 206,000 Sutter Sidewalks Completed Central to Park, future Park to Azalea infill * 206,000 Fieldbrook Road Widen shoulders for pedestrian and bicycles - PM Funded -STIP 2008 construction * 551,000 Peninsula Drive Widen shoulders for pedestrian and bicycles. Planned for future. * $ Park to Camellia Drive Pedestrian & bike trail connecting Sutter area to Heartwood. Planned for future. * 300,000 Annie & Mary Trail Glendale to Blue Lake portion of trail. Planned for future. * 800,000 Freshwater Road Three corners to Howard Heights, pave and stripe bike lanes. Funded - Safe Routes to School/Prop 1B, construction * 600,000 Myrtle Ave Harrison Street to Hall Ave Pedestrian Corridor Construction Humboldt Hill Road US 101 to Donna Drive Enhanced Class III STIP 2009 Construction 5,066 Myrtle Avenue/Old Arcata Road Hall Ave. to Bayside Cutoff Enhanced Class III STIP 2008 Construction 8,000,000 Tish Tang/Hwy 96 Intersection - Shift intersection north to be opposite shopping center. STIP planning funds approved, no construction funding yet.* 1,500,000 Central Avenue Bella Vista shoulder widening $ Union Street Bicycle and pedestrian shoulder widening * = Priority Project $ = Fund Estimates not available 2008 RTP BP-23 Bicycle and Pedestrian System Element
131 Table BP4 Humboldt County Non Motorized Illustrative Projects ILLUSTRATIVE PROJECTS Project Description Cost Trinidad Edwards Street Trinity Street to Bay Street. Enhanced Class III 350 Scenic Drive Main Street to City Limits Class III 300 Trinity Street Main Street to Edwards Street Class III 250 Westhaven Drive Main Street to City Limits. Enhanced Class III 300 Main St/Westhaven Drive Scenic Drive to Hidden Creek $ Van Wycke Trail Rehabilitation Project (Edwards St. to Galindo St.) * 200,000 Lighthouse Trail Improvement Project (Lighthouse to Beach) * 50,000 Ferndale 5th Street Arlington Avenue to Ocean Drive Enhanced Class III * 44,145 Arlington Avenue Main Street to 5th Street Enhanced Class III * 22,159 Grizzly Bluff Road Craig Street to East city limit Class III * 36,782 Main Street (SR 211) Market Street to Ocean Drive Enhanced Class III * 37,497 Ocean Avenue Shaw Avenue to Craig Street Class III * 14,800 Shaw Avenue Ocean Avenue to Berding Street Class III * 36,772 5th Street Arlington Avenue to Fairview Drive North. Curb, gutter, and sidewalk along east side. * 53,454 Fortuna 12th Street Main St. Newburg Rd. Class II* 10,800 Fortuna Boulevard Main St. Kenmar Rd. Class II 150,000 Kenmar/ Kenwood Riverwalk Drive Rohnerville Road Class II* 16,200 Main Street 9 th St. Rohnerville Road Class II * 7,200 Rohnerville Rd. Main St. School St. Class II 240,000 Riverwalk Dr. Dinsmore Dr. Kenmar Road Class II 72,000 Ross Hill Road School St. Kenmar Rd. Class II* 18,000 Redwood Way Fortuna Boulevard St. Joseph Dr. Class II* 40,000 Newburg Rd. 12th St. Rohnerville Rd. Class II* 18, th St. Overpass Newberg Rd. Dinsmore Dr. Class II* 3,600 12th Street K Street to Loni Drive $ Newburg Road Virginia to Fortuna Blvd $ Newburg Road at Rohnerville Road Intersection $ Riverwalk Drive/Kenmar Riverwalk RV Park to Fortuna Blvd. $ Ross Hill Road/School St. at Thelma Intersection $ Eureka Buhne St. Fairfield St. to Harrison St. Enhanced Class III* 4,088 B Street Third Street to Harris St. Enhanced Class III* 3,898 Eureka Waterfront Trail Commercial to Pound Road Class I CA Coastal Trail segment* 1,872, th Street Waterfront to West Ave. Class III* 1,809 C Street Waterfront to 7th Street Enhanced Class III Waterfront connectivity with B Street* RTP BP-24 Bicycle and Pedestrian System Element
132 ILLUSTRATIVE PROJECTS Project Description Cost ($) Dolbeer Harris Street to Hemlock Enhanced Class III* 1,178 E Street Harris Street to Waterfront Drive Class III* 2,576 Fairfield St. Harris Street to Wabash Ave. Enhanced Class III* 2,035 Glen Street Harris Street to Allard Ave. Enhanced Class III* 1,243 Harris Street I Street to Hall Avenue Class III* 2,711 Harrison Ave. Harris Street to Harrison St.(city limit) Enhanced Class III School route* 2,790 Hemlock St. W Street to Walnut Ave. Enhanced Class III School route* 383 Henderson St. S Street to I Street Enhanced Class III* 1,445 Hodgson St. F Street to W Street Enhanced Class III School route* 1,509 S St./West Ave./V St. Hodgson Street to First Street Enhanced Class III School route* 2,983 Utah St./Central Avenue Allard Street to Henderson Center Enhanced Class III* 1,500 W Street Hodgson Street to Hemlock Street Class III School route* 575 Wabash Avenue C Street to H Street Enhanced Class III* 965 Washington Street Waterfront to B Street Class III* 938 4th & 5th Streets Commercial Street to V Street. The City is currently working with the State on an enhanced crosswalk project. $ 6th & 7th Street Broadway Street to Myrtle Avenue $ Broadway Street (US 101) Kmart to 5th Street. The City is currently working with the State on a sidewalk infill project in the vicinity of Vigo and Broadway and Hawthorne $ and Broadway. H & I Streets US 101 to Harrison Street $ Harris Street Broadway Street to Hall Avenue The City will begin shortly working on plans for a new traffic signal with full pedestrian protection at the Harris and Central $ location. Henderson Street Broadway Street to I Street * $ Elk River Wildlife Sanctuary to Truesdale Street* $ Truesdale Street to Del Norte* $ Waterfront Drive "G" to "J" Street* $ Waterfront Drive "T" to "V" Street* $ Transit Stop Pullout improvements, 12 locations* $ Downtown Intermodal Transit Facility* $ Arcata Samoa Blvd. West City Limit K Street Enhanced Class III In Long-Term Plan 2,038 Blue Lake Annie & Mary Rail-Trail Chartin to Hatchery Road I * 337,500 Greenwood Road Blue Lake Boulevard to Railroad Avenue Enhanced Class III 625 Railroad Avenue Greenwood Road to City limit Enhanced Class III 2,118 Greenwood Road Blue Lake Blvd to Redwood Avenue $ Railroad Avenue Blue Lake Blvd to H Street $ South Side Railroad Ave Chartin Road to H Street Trail * $ 2008 RTP BP-25 Bicycle and Pedestrian System Element
133 ILLUSTRATIVE PROJECTS Project Description Cost ($) Humboldt County Hammond Trail Bridge Replacement over Mad River * 3,000,000 Sprowel Creek Road Widen Shoulders Garberville Park * 600,000 Westhaven Road Widen shoulders for pedestrian and bicycles * 1,000,000 Glendale Shoulder Widening * $ Greenwood Heights Shoulder Widening* $ West End Road Shoulder Widening* $ Bald Hills Road Shoulder Widening* $ Maple Creek Road Shoulder Widening * $ Briceland-Thorne Road Shoulder Widening * $ Shelter Cove Road Shoulder Widening* $ Railroad Drive McKinleyville Class III shoulder and sidewalk N side* $ Murray Road McKinleyville Sidewalk infill* $ Centerville Road Ferndale City Limit to Beach shoulder widening* $ Cannibal Island Road shoulder widening* $ Hookton Road Shoulder Widening* $ Tompkins Hill Road Shoulder Widening* $ Eel River Drive Shoulder Widening/Striping* $ Red Cap Road Shoulder Widening/Sidewalks* $ Continuous Sidewalks/Shoulders on County Roads within 1 mile radius of schools* $ Blue Lake Boulevard Sidewalks and four foot shoulders $ * = Priority Project $ = Fund Estimates not available Table BP5 Humboldt County Non Motorized Long Term Projects LONG-TERM PROJECTS Project Description Cost ($) Rio Dell Access Trail Gunnerson Lane to Edwards Drive Class I 9,000 Davis Street Wildwood Avenue to Rigby Avenue Class II 35,700 Main Street/ Wildwood US Eeloa Ave to Davis Street Class II 46,875 Painter Street Wildwood Avenue to Rigby Avenue Class II 29,040 Bellevue St. Main St. to West City Limit Class III $ Ireland Street Center St. to Davis St. Enhanced Class III 490 Main Street Eeloa Ave. to US 101 Class III 494 Main Street/ Wildwood Ave. Davis Street to South City Limit Enhanced Class III 1,750 Rigby Avenue Davis Street to Painter St. Enhanced Class III 675 Humboldt County Hammond Trail Mad River Bridge to Arcata City Limits Class I Implementation Strategy Private Property Issues/Alternatives Analysis Needed 797,500 Humboldt Bay Trail-East Bay Arcata Marsh & Wildlife Sanctuary to Eureka Waterfront Trail/Drive Class I Implementation Strategy 3,520,000 Humboldt Bay Trail-West Bay Arcata City Limits Samoa-potential extension to Fairhaven Class I Implementation Strategy 1,980, RTP BP-26 Bicycle and Pedestrian System Element
134 LONG-TERM PROJECTS Project Description Cost ($) Redwood Drive Garberville to Redway to US 101 Class II $ Blue Lake Boulevard Class II $ Humbooldt Hill to Eureka City Limits Class III $ V Street Arcata City Limits to 255 Class III $ Riverwalk Trail Fortuna City Limits to Sandy Prairie Road Class I 550,000 SR 96: Hoopa Mill Creek Road to Shoemaker Road Class I Implementation Strategy 75,000 SR 96: Willow Creek SR 299 to Elementary School Class I Implementation Strategy 332,050 Campton Road Eureka City Limit to Walnut Drive Class II 117,614 Ridgewood Drive Elk River Road to Walnut Drive Class II 97,500 F Street Fairway Drive to Oak Street Class II 28,409 Harris Street Harrison Street to Hall Avenue Class II 56,818 Elk River Road Ridgewood to Headwaters Trailhead Class III 9,617 Hall Avenue Harris Street to Myrtle Avenue Enhanced Class III 308 Park Street Myrtle Ave. to Quaker St. Class II 39,773 Quaker St. Park Street to Trinity Street Enhanced Class III 1,278 Trinity St. Quaker St. to Myrtle Ave. Enhanced Class III 663 Mad River Rd/Upper Bay/Miller Ln/Heindon Rd Mad River Beach to Arcata City Limits Enhanced Class III 6,439 SR 255 US 101 to US 101 Class III 13,307 Glendale Drive SR 299 to Blue Lake Boulevard Enhanced Class III 5,824 Blue Lake Boulevard Glendale Drive to Blue Lake City Limit Class III 241 Blue Lake Boulevard Southeast Blue Lake city limit to Maple Creek Road Class III 256 West End Road Giuntoli Lane to Hatchery Road Class III 5,378 Hatchery Road Mad River Bridge to Fish Hatchery Enhanced Class III 1,539 Grizzly Bluff/Blue Slide Roads Ferndale City Limit to Rio Dell City Limit Class III (R) 18,568 SR 211 Fernbridge Drive to Ferndale City Limit Street Enhanced Class III 9,250 Sandy Prairie Road Fortuna City Limit to US 101 Enhanced Class III 2,936 Maple Creek Road Blue Lake Boulevard to Korbel Road Class III 2,472 Main Street Rio Dell City Limit to US 101 Enhanced Class III 3,646 Patrick s Point Drive Trinidad City Limit to Patrick's Point - US 101 Enhanced Class III 13,750 Westhaven Drive Trinidad City Limit to US 101 Class III 4,800 Scenic Drive Trinidad City Limit to US 101 Class III 3,750 SR 299 US 101 to Trinity County Class III 63,150 SR 36 US to 101 Trinity County Class III 68,550 SR 96 SR 299 to Siskyou County Class III 67, RTP BP-27 Bicycle and Pedestrian System Element
135 LONG-TERM PROJECTS Project Description Cost ($) US 101 Pacific Coast Bike Route (PCBR) Newton B. Drury Scenic Parkway to V Street Class III 74,250 Pacific Coast Bike Route US 101 Henderson Street, Eureka Mendocino County Class III 116,550 Mid Town Trail Railroad Avenue to Washington Street Class I 440,000 Airport Road Letz Avenue to Central Avenue Class II 76,350 Central Avenue US 101 to Railroad Drive Class II 310,125 Central Avenue School Road to SR 200 Class III 7,500 School Road Fischer Ave to Central Avenue Class II 47,175 Washington Avenue McKinleyville Avenue to School Road Class II 37,642 Azalea Avenue SR 200 to Sutter Road Class III 2,330 Dows Prairie Grange Road to Norton Road Enhanced Class III 1,563 Grange Road Central Avenue to Dows Prairie Road Class III 369 Halfway Ave/ Gassoway Rd Airport Road to Murray Road Class III 998 Norton Road Dow's Prairie Road to Central Avenue Class III 377 Garberville-Redway Garberville to Redway Class I Feasibility Study 20,000 South Fork High Trail Miranda to Meyer's Flat Class I 800,000 Avenue of the Giants (SR 254) US 101 to US 101 Enhanced Class III 34,935 Briceland Road Redwood Drive to Eel River Road Enhanced Class III 2,250 Redwood Drive Manzanita to Maple Lane Class III 1,200 Sprowel Creek Road Redwood Drive to Community Park Class III 1,500 SR 96 Downtown to S. Trinity Bridge to Jury $ SR 96 Mill Creek to Shoemaker Rd $ Loleta Drive Main Street to Franklin Ave $ Franklin Ave Park Street to Loleta Drive $ Park Street Loleta Drive to Franklin Ave $ SR 255 Lupin Drive to Pacific Ave $ NWP Trail Sandy Road to Dean Ave Trail $ Hiller Road Central Avenue to Cliff Avenue $ Railroad Avenue Central Avenue to Thiel Avenue $ School Road Bugenig Ave to Fischer Road $ Washington Street McKinleyville Avenue to School Road $ Avenue of the Giants at School Road $ SR 96 Post Office to Clinic $ SR 96 Post Office to Big Rock Road $ SR 96 within Weitchpec $ Newton Road Sewell Road to School Road $ SR 96 SR 299 to Trinity Elementary $ SR 299 Roth Road to Panther Creek $ * = Priority Project $ = Fund Estimates not available 2008 RTP BP-28 Bicycle and Pedestrian System Element


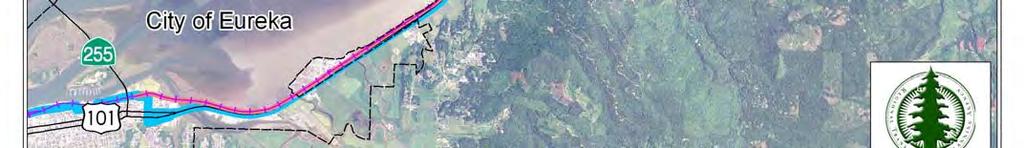
136 2008 RTP BP-29 Bicycle and Pedestrian System Element
137 FINANCING The bicycle and pedestrian plans and programs outlined in the RTP will take years, some even decades to fully accomplish. Project phasing is dependent on a number of factors, including appropriate design, right of way acquisition, sponsorship, and funding. This part of the section focuses on financing of facilities. Federal The Safe, Accountable, Flexible, Efficient Transportation Equity Act: A Legacy for Users (SAFETEA-LU), is being reauthorized for It is hoped that this reauthorization will allow funding for continuing and significantly building upon the projects funded under prior Transportation Equity Act programs. This would include continued funding, including dollars from highway authorization bills, to ensure bicycling and walking, garnered a more prominent role in our nation s transportation system. To be meaningful, future SAFETEA-LU programs must provide broad funding eligibility for pedestrian and bicycle programs in addition to funding of roadways. The Non-Motorized Transportation Pilot Programs established under existing SAFETEA-LU has been an important source of pedestrian and bicycle program funding. The program purpose has been to demonstrate the extent to which bicycling and walking can carry a significant part of the transportation load, and represent a major portion of the transportation solution, within selected communities. One of the pilot programs is being conducted in Marin County, California. A network of non-motorized transportation infrastructure facilities (including sidewalks, bicycle lanes, and pedestrian and bicycle trails) that connect directly with transit stations, schools, residences, businesses, recreation areas, and other community activity centers, will be built in each city. Statistical information will be gathered to provide information on changes in motor vehicle, non-motorized transportation, and public transportation usage in communities participating in the program, and assess how such changes decrease congestion and energy usage, increase the frequency of bicycling and walking, and promote better health and a cleaner environment. Several roadway improvement projects programmed in the STIP include pedestrian and bicycle components. When new pavement is laid, some projects include pavement for bikeways. In addition, the passage of Proposition 42 in March 2003 could provide additional funding for roads, which could translate into additional funding for pedestrian and bicycle improvements. Under SAFETEA-LU, Transportation enhancement activities continue to be funded through a set-aside of 10 percent, or the amount set aside in FY 2008, whichever is greater, from STIP funds. Assuming funding levels remain constant over 20-years, the amount would be $6 million, which could implement a number of high-priority projects identified in the Action Element. As shown in the Needs Assessment, several high-priority bikeway and pedestrian projects are identified, but not yet programmed, or costs have not been assigned. These projects will be implemented as funding becomes available. The County can affect the amount of funding by 2008 RTP BP-30 Bicycle and Pedestrian System Element
138 aggressively pursuing competitive funding sources. Potential funding sources are contained in the recently completed Humboldt County Pedestrian Needs Assessment Study Update. The 1998 Federal Highway Administration (FHWA) report, Implementing Bicycle Improvements at the Local Level also recommends facility improvements designed to increase bicycle safety, (Online version at October 9, 2002). Many of these improvements would improve pedestrian safety conditions as well. There are 13 items in the complete checklist covering urban to rural uses on a range of facility types. Those that are applicable to rural areas such as Humboldt County are displayed in Table BP6. Table BP6 Selected Bicycle Safety Improvement Projects from FHWA Checklist Category Typical Concerns Possible Projects Street crossings Bicyclists have difficulty crossing busy arterial thoroughfares from quiet residential streets. Provide median refuges at key minor street crossings, bike-friendly signals, and other features on collectors. Breaking bicycling barriers Trail networks Transit connections Roadway bridge modifications Railroad crossings Physical features (rivers, creeks, railroads, and freeways) often keep bicyclists from getting where they want to go. Trails are popular facilities among the bicycling public but they may be rare or discontinuous. In addition, some are poorly designed, constructed, or maintained. The success of a multimodal transportation system suffers when bicyclists cannot get to transit stations, when there is not adequate safe bicycle storage, and when bicyclists are not accommodated on the system itself. Some bridges contain narrow outside lanes, hazardous deck surfaces, hazardous expansion joints, high traffic volumes, high traffic speeds, or high speed on- and off-ramps. Diagonal railroad crossings and rough crossings regardless of crossing angle can cause bicycle crashes. Provide independent bicycle/pedestrian structures where necessary or combine bicycle/pedestrian structures with other existing or planned transportation facilities. Provide new trails where possible throughout the community, connect existing trail segments, and encourage developers to include trails in their developments. Make sure designers and operations staff-use current literature. Improve connections between residential areas and transit stops, provide secure bicycle parking at stops, and provide for carrying bicycles on the system. Reallocate bridge deck width by shifting lane lines, modify surface for better bicycle stability, modify ramps to discourage high-speed turning movements, and, as a last resort, develop bicycle connections independent of the bridge in question. Replace dangerous crossings with rubberized installations (especially in the outside through lane), use flangeway fillers on low-speed diagonal crossings, flair paved surface at crossing approaches to allow right-angle crossings, and use warning signs or markings RTP BP-31 Bicycle and Pedestrian System Element
139 Category Typical Concerns Possible Projects Most traffic-actuated signals have difficulty detecting bicycles. In addition, signal timing may not allow sufficient clearance time for bicyclists to get through an intersection, and programmed visibility heads may not be as visible from a typical bicyclist s location as from a typical motorist s location. Traffic signals Drainage grates and utility covers Rural road shoulders Bicycle parking Maintenance Some drainage grate designs can trap a bicycle wheel; in addition, grates and utility covers should be kept level with the grade of the street surface and, wherever practical, such installations should be kept out of the typical path of a bicyclist. Many rural roads serve high-speed traffic and, in some cases, high volumes of motor traffic containing a significant proportion of large trucks. For bicyclists, sharing narrow roads with such traffic can be unpleasant and dangerous. Scarce bike parking at popular destinations, undesirable bike parking devices, no bike parking zoning requirements. Poorly maintained trails and roadway edges. Provide bicycle-sensitive loop detectors in new installations and retrofit where needed; in some cases, use pavement markings to identify most sensitive locations; adjust timing requirements on signals and test heads for visibility at necessary angles. Replace bad drain grate standards with bicyclesafe models; replace or modify existing installations; as a routine practice, consider bicyclists when locating new utilities. Provide smooth paved shoulders on all new construction and reconstruction; add shoulders to popular bicycling routes; adopt standards calling for adequate paved shoulders; restrict the use of rumble strips when bicycle traffic is expected (if deemed appropriate by Caltrans whose policy is to install rumble strips when their use is considered the optimal solution to an identified problem), and on new construction and reconstruction; or provide space for future shoulders if they cannot be installed at the time. Each year, provide new bike parking as a routine practice; use only parking devices that accept high security locks; or add bike parking to local zoning regulations. Alter current practices, create a user-requested bicycle spot improvement program. Source: Implementing Bicycle Improvements at the Local Level, Federal Highway Administration, In a more recent report, Bicycle Lanes Versus Wide Curb Lanes: Operational and Safety Findings and Countermeasure Recommendations (Publication No. FHWA-RD , October 1999, online version at October 9, 2002) the FHWA cites research done in Canada, Denmark, and Sweden that found that marking bicycle lanes with paint and/or raised pavement reduced bicycle-motorist conflicts and crashes at intersections by 10% to 36%. The Bike Plan Implementation Program and/or proposed bike trails include projects applicable to several of the FHWA s categories for bicycle safety improvements, such as: Widen outside through lanes or add bike lanes; Provide new trails where possible throughout the community; Connect existing trail segments; 2008 RTP BP-32 Bicycle and Pedestrian System Element
140 Provide secure bicycle parking at transit stops; Provide for carrying bicycles on the bus system; Improvement bike facilities at railroad crossings; Add shoulders to popular bicycling routes; and Provide new bike parking. Implementation of these improvements, along with bicycle safety education, is expected to decrease conflicts, increase bicycle safety, and reduce the potential for accidents involving bicyclists. As discussed previously (see Bicycle Safety and Education Programs in Section 2B of this document), the Humboldt County Office of Education/ Sherrifs Department conducts bicycle safety programs in conjunction with the California Highway Patrol. By teaching children how to ride bicycles safely, the potential for bicycle accidents is reduced; however, no conclusive data is available at this time. Safe Route to Schools: Authorized by Section 1404 of SAFETEA-LU the federal Safe Routes to School (SRTS) Program came into effect in August of 2005 and is set to expire September This federal funding program emphasizes community collaboration in the development of projects that target grades K-8, and projects that incorporate elements of the 5 E s education, encouragement, engineering, enforcement, and evaluation. The program seeks to increase the number of children who walk or bicycle to school. Eligible agencies include state, local, and regional agencies; cities and counties; non-profit organizations; school districts; and Native American Tribes. Eligible projects include stand alone infrastructure within 2 miles of a grade school or middle school or non-infrastructure projects. State Bicycle Transportation Account (BTA): The BTA is intended to provide funds for bicycle transportation, which is recognized as an important and low cost mode of public transportation. The BTA provides funds to local agencies for projects that improve safety and convenience for bicycle commuters. With regards to State funding, counties that prepare, and adopt, a Bicycle Transportation Plan (BTP) are allowed to compete for BTA funds. These funds are available on an annual basis and are competitive throughout California. BTA annual funding, per Streets and Highways Code Section 2106 is shown in table BP7: Table BP7: BTA annual funding Fiscal Year Funding ($) 2000/01 1,500, /02 7,200, /03 7,200, /04 7,200, /05 7,200, /06 7,190, /07 and beyond 5,000, RTP BP-33 Bicycle and Pedestrian System Element
141 The City of Eureka received $57,420 from this account in FY 2000/01, for upgrading bicycle racks throughout the city, and constructing bicycle lanes on Wabash Avenue. In addition, a $29,520 grant was approved for the City of Arcata for bike lane improvements. The City of Arcata also received $170,000 from this account in FY for: installation of shared-lane arrow pavement markings with Share the Road signage; installation of wrong-way (R5-1b) and ride with traffic (R9-3C) signage and STOP legends painted in bike lanes at 4-way stop intersections; construction of a Class II Bikeway on South G Street from Front Street to the Arcata Marsh and Wildlife Sanctuary; installation of 10 bicycle lockers and a covered bicycle parking area at the City Intermodal Transit Facility; a support library bicycle station program in downtown; a free public bicycle repair shop and bicycle parking adjacent to Post Office and downtown Plaza; support for a bicycle education rodeo with Plaza rally and ceremony for bicycle commuters; promotion and advertising for the bike rodeo; banner purchase; and children s bicycle safety training during City downtown criterium race. Safe Routes to School: Established in 1999, the State-legislated Safe Routes to School (SR2S) program came into effect with the passage of AB In 2001, SB 10 was enacted which extended the program for three additional years. In 2004, SB 1087 was enacted to extend the program three more years. And in 2007, AB 57 was enacted to extend the program indefinitely. Eligible applicants include cities, counties, and school districts. Eligible projects include infrastructure projects located in the vicinity of a school; projects must be completed within four state fiscal years after project funds are allocated. Targeted beneficiaries include children in grades K through 12. California Office of Traffic Safety: The goal of the California Office of Traffic Safety (OTS) is to reduce deaths, injuries and economic losses resulting from traffic related collisions. They do this by funding traffic safety programs that have impact both state-wide and in individual communities. From impaired driving enforcement to encouraging seat belt usage, speed enforcement to bicycle safety, OTS funded programs are intended to save lives on California s roadways. For more information go to: Transportation Development Act (TDA): Also known as SB 325, provides two major sources of funding for public transportation: the Local Transportation Fund (LTF) and the State Transit Assistance fund (STA). These funds are for the development and support of public transportation needs that exist in California and are allocated to areas of each county based on population, taxable sales, and transit performance. Local entities may reserve 2% of the TDA funds allocated annually for pedestrian and bicycle projects RTP BP-34 Bicycle and Pedestrian System Element
142 Local Transportation Fund (LTF): The Transportation Development Act creates in each county a Local Transportation Fund for the transportation purposes specified in the Act. Revenues to the LTF are derived from 1/4 percent of the retail sales tax collected statewide. The 1/4 percent is returned by the State Board of Equalization to each county according to the amount of tax collected in that county. The LTC allocates the funds to claimants to provide public and community transportation services. Local Transportation Funds may be allocated for local streets and roads purposes if there are no unmet transit needs that are reasonable to meet. Department of Transportation Section 887.8(b) of the California Streets and Highways Code permits the Department of Transportation to construct and maintain non-motorized facilities where such improvements will increase the capacity or safety of a State Highway. Section requires an annual statewide budget of at least $360,000 for new non-motorized transportation facilities to be used by Caltrans in conjunction with the State Highway System. Proposition 116: Clean Air & Transportation Improvement Act of 1990: Under Proposition 116, non-urban county transit funds can be made available for transit or non-motorized facilities. These funds are provided on a per capita basis, using the Federal census. Non-Motorized Trails Grant Program: Under The Safe Neighborhood Parks, Clean Water, Clean Air, and Coastal Protection Bond Act of 2000, program funds are appropriated for the development, improvement, rehabilitation, restoration, and enhancement of non-motorized trails, and associated interpretive facilities for the purpose of increasing public access to, and enjoyment of, public areas for increased recreational opportunities. Environmental Enhancement and Mitigation (EEM) Program: Offers funding to remedy environmental impacts of new or improved transportation facilities. State gasoline tax monies fund EEM. Grants are awarded in three categories. Roadside Recreational is applicable for bicycles including projects that provide for the acquisition and/or development of roadside recreational opportunities such as trails. Mello-Roos Community Facilities Act of 1982: Allows any county, city, special district, school district, or joint powers authority to establish a Mello-Roos Community Facilities District (CFD), which allows for financing of public improvements and services when no other source of money is available. This is an enormously flexible tool placed at the disposal of local governmental agencies within the State to help them finance needed community facilities and services through the levy of voter approved special taxes. Community-Based Transportation Planning (CBTP) Grant Program: Provides funding for planning projects statewide that support livable communities, coordinate land use and transportation planning, and involve the community. Caltrans awards approximately $1.5 million in projects that address concepts such as improved mobility and transportation choices for a wider range of users, increased transit- oriented/ mixed use development, and/ or enhanced community/ economic development. Office of Traffic Safety (OTS) Grants: Provides bicycle and pedestrian grants to assist local agencies with safety and educational programs, including bicycle rodeos and bicycle helmet 2008 RTP BP-35 Bicycle and Pedestrian System Element
143 distribution programs. Grants are based on a statewide competitive basis, and not available for construction of bikeway facilities. PERFORMANCE MEASURES The RTP Guidelines identify the requirements for performance-based planning. Performance measure requirements identify the criteria that should be applied to evaluate performance of the transportation system and identify the overall objective of the analysis. The following bike and pedestrian performance measures have been developed to enable HCAOG and member organizations to prioritize bicycle and pedestrian and projects for purposes of the RTP. Table BP8 includes performance measures identified to implement bicycle and pedestrian policies. BP8 Non-Motorized Performance Measures Performance Measure Indicator(s) Data Source(s) Maintain accidents at roadway intersections with bike-lanes/routes or pedestrian crosswalks at statewide average or better based on number of accidents per million vehicle miles. Reduce accident rates and number of incidents at intersections with the roadway system and the non-motorized transportation system Increase bicycle ridership for commuting and recreation Increase pedestrian travel for commuting and education Implement traffic safety improvement projects addressing non-motorized transportation system accidents from prioritized list of safety enhancement projects. Implement bicycle facility improvements/projects that improve connectivity, safety, and desirability. Reduce pedestrian travel impediments, in particular to the mobility-impaired, by implementing pedestrian facility improvements/projects Accident statistics collected by Caltrans District 1 Safety Division; Accident reports from California Highway Patrol; and local agency accident reports. Bicycle system surveys to assess bicycle mobility Sidewalk and user surveys to assess pedestrian mobility 2008 RTP BP-36 Bicycle and Pedestrian System Element
144 ACCOMPLISHMENTS SINCE THE 2006 RTP Arcata Installed sharrows on the following streets: 11 th Street corridor from Janes Road to Shirley Boulevard, 14 th Street from K Street to Union Street, Buttermilk Lane from Samoa Boulevard to eastern City Limits, and K Street from 4 th to 11 th Streets. Blue Lake Completed the Broad Street walkway improvements and the B Street walkway improvements. Eureka Completed Class II bikeway on 7th street from J Street to Myrtle Avenue. Enhanced Class III bikeway on Waterfront/ First Street from L Street to Commercial, the Pacific Coast Bike Route was also signed through this area. The Pacific Coast Bike Route was relocated to northbound Broadway to Wabash, west on Wabash to Railroad Ave, north on Railroad Ave./Waterfront Drive to C Street, continue east on First Street to H Street, south on H Street to Second Street, east on Second Street to L Street, north on L Street to Waterfront Drive, east on Waterfront Drive to T Street, south on T Street to First Street, east on First Street to V Street, south on V Street to Fourth and Fifth Street (Hwy 101). In the fall of 2007, the city completed the installation of pedestrian improvements at the intersections of West Avenue at Tydd Street (near Silvercrest), S Street near Zane Middle School, and W Street at Russell Street (near Sequoia Zoo). Crosswalk warning light systems were installed, as a pilot program, at these three locations to enhance driver awareness and improve pedestrian safety. System components include advance warning signs, overhead beacons, audible messages, and lights installed in the roadway surface along the crosswalk, all of which are activated by pedestrians with the push of a button. Fortuna Installed ADA Compliant Curb Ramps on various street corners on Newberg Road, Wood Street, Toddy Thomas School entrance, and 10 th Street. HCAOG Eureka Arcata Trail Feasibility Study 2008 RTP BP-37 Bicycle and Pedestrian System Element
145 Humboldt County Completed Class II bikeways on Sutter Road from Central Avenue to Azalea Avenue, on McKinleyville Avenue from Washington Street to School Road, and on Walnut Drive from Hemlock Street to Ridgewood Drive. Completed Class III bikeways on Herrick Road from US 101 to Fairway Drive, on Hiller Road from Ocean Avenue to Central Avenue, and on Rohnerville Road from Hydesville to Fortuna City Limit. Hammond Trail extension Murray to Letz dual trail. Hammond Trail Fisher Road / School to Montana. Installed sidewalks on McKinleyville Avenue-Washington Avenue to Murray Road. Installed sidewalks on Walnut Drive-Cypress Street to Fern Street. Installed sidewalks on Sutter Road-Central to Camilla. Rio Dell Constructed ADA Compliant Curb Ramps; updated curb ramps to meet ADA guidelines on Wildwood between Belleview and Side Street. Repaving of Wildwood Avenue and existing Class II bike route between Highway 101 and Davis Street 2008 RTP BP-38 Bicycle and Pedestrian System Element
146 AVIATION SYSTEM ELEMENT SYSTEM DESCRIPTION Commercial and general aviation facilities provide a range of transportation services for the Humboldt County region and its rural communities. These services are also integral to regional, state and national economies. The Aviation System for Humboldt County is composed of nine airports, which are access points for business, tourism, recreation, and emergency transport. Emergency services are particularly significant, given the long distances between this county, and urban areas with major medical centers. The airports serve as bases for public, private, and commercial aircraft, providing an important means of travel and goods movement. The airports are distributed throughout the county in response to the geographical and population characteristics of the region. The airports name, location and owner are provided in Table AS1 below: Table AS1 Humboldt County Aviation System Public Use Airports Airport Location Owner Arcata-Eureka Airport McKinleyville Humboldt County Dinsmore Airport ¼ miles east of Dinsmore Humboldt County Garberville Airport 1 mile southwest of Garberville Humboldt County Kneeland Airport Kneeland Humboldt County Murray Field Airport 3 miles east of Eureka Humboldt County Rohnerville Airport 0.8 miles south of Fortuna Humboldt County Eureka Municipal Airport City of Eureka City of Eureka Shelter Cove Airport Shelter Cove Shelter Cove Resort Hoopa Airport Hoopa Hoopa Valley Tribal Council The figure on the following page depicts the location of all the airports in Humboldt County. Eight of the nine airports in Humboldt County are described below. For information pertaining to the Hoopa Airport, see the Tribal Transportation Element. Arcata Eureka Airport The Arcata-Eureka Airport lies on a 200-foot plateau overlooking the Pacific Ocean. It is located approximately seven miles north of the City of Arcata, and 15 miles north of the City of Eureka. The nearest community is McKinleyville, an unincorporated town with residential development bordering the airport s north, east, and southeast sides. Airport Road and Central Avenue border the south and east sides, respectively. Highway 101 and the Pacific Ocean border it to the west RTP Page AS-1 Aviation Systems Element


147 2008 RTP Page AS-2 Aviation Systems Element
148 Principal automobile access to Arcata-Eureka Airport is via Highway 101 and Airport Road. Bus service is provided by Redwood Transit System and Amtrak. Other ground services are provided by Door-to-Door Airporter shuttle, taxicab companies and numerous local hotels. The Arcata-Eureka Airport is a non-hub, primary commercial airport providing airline and general aviation services. It is the only airport in the county offering scheduled airline services, which are provided daily by Horizon Airlines, United Express, and Delta Airlines. The U.S. Coast Guard Search and Rescue Base is also located at this airport, providing emergency services to the community and outlying rural areas. The Arcata-Eureka Airport encompasses 745 acres. Aviation-related buildings include: a terminal with three airlines, three car rental agencies, a restaurant, a conference room, Humboldt County Airports Division Offices, FAA and TSA offices, a warehouse and equipment storage building; fuel attendant office; and a maintenance shop with an aircraft rescue and fire fighting barn to house fire fighting equipment. Aircraft parking includes: 25 marked tie downs; 55,000 square foot large aircraft apron;and one corporate hanger; rage. Primary Runway is 5,998 feet long and 150 feet wide. Runway is 4,499 feet long and 150 feet wide. A major terminal expansion project is in progress at the Arcata-Eureka Airport. In 1999, construction of a general aviation ramp was completed on the north side of the airport that includes space for private development of 12 box hangars and three tie-downs and room for the county to construct a bank of 17 T-hangars. From1994 to 1997, airport improvements focused on safety improvements (e.g., installation of runway and taxiway signs and safety areas upgrades) and pavement/drainage repairs. Increasing airline passenger numbers and security needs to meet new TSA requirements following the events of 9/11 were the driving force for the terminal expansion project, which is adding 10,000 square feet to the existing terminal. The expansion, combined with reconstruction of the existing terminal, will improve the security passenger waiting area, enlarge the baggage return area, consolidate the checked luggage security area, and return the second floor public area (which was taken over by the TSA) to airport patrons who are meeting or greeting passengers. The expansion will also include measures to comply with Americans with Disabilities Act (ADA) standards and system upgrades. The Arcata-Eureka Airport is also served on a daily basis by several dedicated cargo companies (e.g., Federal Express, United Parcel Service, AmeriFlight, and Union Flight). In 2007, approximately 234 metric tons of cargo was enplaned and 548 metric tons of cargo was deplaned at the Arcata-Eureka Airport. During the first four months of 2008, approximately 54 metric tons of cargo was enplaned and 116 metric tons of cargo was deplaned. The metric ton cargo activity numbers highlight the important role that the Arcata-Eureka Airport plays in Humboldt County s Goods Movement system. Dinsmore Airport Dinsmore Airport provides air access to the unincorporated community of Dinsmore, in an isolated area of eastern Humboldt County. This airport is located about a quarter mile east of Dinsmore, in a winding canyon of the Van Duzen River Valley. Hills immediately adjacent to 2008 RTP Page AS-3 Aviation Systems Element
149 the airport rise 1,000 feet above the runway elevation. Use of the airport requires mountain flying knowledge, and use of common (nonstandard) approach/departure paths. Automobile access to Dinsmore Airport is from State Route 36, which wraps around the airport s northern boundary. This airport operates in daytimes only. It has one runway, Runway 9-27, which is 2,504-feet long, 50feet wide and oriented roughly east-west. Aircraft parking is located at the east and west apron areas north of each runway end. At present, airport property totals approximately 23 acres (owned in fee-simple) and 426 acres (easements). Developed land on the airport is dedicated to apron and runway pavement. The airport does not have any onsite fueling stations. Garberville Airport Garberville Airport is located approximately one mile southwest of Garberville and serves the Garberville-Redway area. It rests on a bluff, at an elevation of 551 feet above mean sea level. The south fork of the Eel River runs to the east and south of the airport. Terrain rises rapidly to the west, and elevations up to 1,000 feet higher than the runway are within one mile of the airport. Automobile access to Garberville Airport is from the east via Sprowel Creek Road. US 101 is located two miles farther east and provides a direct connection to Sprowel Creek Road. Garberville airport has one runway, Runway 18-36, which is 2,783 feet long, 75 feet wide and can accommodate aircraft with wingspans of up to 49 feet and approach speeds of less than 121 knots. A specialized aviation service operator was established at Garberville Airport in May of Services offered by the operator include flight training, aircraft rental and a pilots lounge. The airport also has aircraft parking and fueling facilities. Kneeland Airport Kneeland Airport is sited on a butte about 15 miles southeast of the City of Eureka. ). It is 2,737 feet above mean sea level -- above the common low weather conditions and serves, principally, as an alternate landing site to the four airports in the Humboldt Bay area (Arcata-Eureka, Eureka Municipal, Murray Field and Rohnerville) when these airports are temporarily closed due to fog (which can develop quickly, and often unpredictably). This airport is also a vital venue for flight training and small-package delivery; however, it often becomes inundated by small-package, time sensitive, delivery aircraft when the four Humboldt Bay airports are closed. Kneeland airport encompasses 14 acres. It has one runway, Runway 15-33, which is 2,235 feet long and 50 feet wide. Its pavement is in excellent condition, and the terrain falls sharply, immediately beyond the runway ends. The airfield is not lighted, has standard visual runway markings, and a small aircraft tiedown apron, located midfield, along the westerly property line. The apron consists of six marked tiedown positions. Informally, the apron can accommodate six additional aircraft. A wind cone is located midfield on a hill east of the Airport. The California Department of Forestry s heliport and associated buildings are located immediately west of this Airport. Principal automobile access to Kneeland Airport is via US 101, Kneeland Road, and Mountain View Road RTP Page AS-4 Aviation Systems Element
150 Murray Field Airport Murray Field sits at an elevation of 10.5-feet above mean sea level (MSL). This airport lies immediately east of Humboldt Bay. It is bounded by Fay Slough to the north, and to the southwest and east by Eureka Slough. Murray Field Airport encompasses 131 acres. It has one runway, Runway 11-29, and includes a connecting taxiway system, one Fixed Base Operator (FBO) facility, and aircraft storage and parking areas. The main building area is located in the southwest quadrant of the airport. The runway is 3,011 feet long, 75 feet wide, and is oriented roughly northwest-southeast. Runway offers non-precision instrument approach capabilities and can accommodate aircraft with wingspans of up to 49 feet, and approach speeds of less than 121 knots. The U.S. Coast Guard conducts training maneuvers at this Airport. Automobile access to Murray Field is from Jacobs Avenue, via US 101. Jacobs Avenue follows the airport s southern boundary. US 101 borders the airport to the west, adjacent to Humboldt Bay. Services for pilots and aircraft are provided by a single major FBO, Northern Air. Northern Air has operated at the airport for over 40 years. Fuel (100LL), transient aircraft parking, aircraft rental, flight instruction, and engine maintenance repair are among the services available. Northern Air utilizes two large hangars leased from the county. Federal Express, UPS, and AmeriFlight have been serving Murray Field for over 10 years. Federal Express (FedEx) operates from a ramp east of the aircraft storage area, where Federal Express employees distribute and prepare packages for shipment from FedEx trucks to FedEx aircraft. Fed-Ex aircraft operates four flights per day. AmeriFlight aircraft operate from the main apron, receiving packages from United Parcel Service (UPS) ground delivery trucks. In 2007, approximately 448 metric tons of cargo was enplaned and approximately 462 metric tons of cargo was deplaned at Murray Field. During the first four months of 2008, approximately 157 metric tons of cargo was enplaned and 140 metric tons of cargo was deplaned there. Rohnerville Airport Rohnerville airport is located 0.8 miles south of Fortuna. It serves the City of Fortuna, Rohnerville and surrounding communities of west-central Humboldt County. This airport is situated atop a plateau, overlooking the Eel River, amid rural residential and undeveloped land. Its runways end at rapidly falling terrain, south of the airfield. Vehicular access to Rohnerville Airport is from Airport Road via Drake Hill Road and US 101. The airport has one runway, Runway which is 4,007 feet long and oriented roughly northwest/southeast. Runway offers non-precision instrument approach capabilities. There are two banks of hangars, located at the west end of the airport, consisting of box hangers, T-hangars and portable T-hangars. Fifteen tie-downs are positioned between these hangars. The transient apron is located mid-field and consists of five tie-downs, and one portable T-hangar. A pilots lounge is immediately west of the transient apron. Fuel is dispensed from a self-fuel card operated system. A California Department of Forestry and Fire Protection (CAL FIRE) station has been operating on the east side of Rohnerville Airport since The CAL FIRE station is an air attack base, 2008 RTP Page AS-5 Aviation Systems Element
151 as well as a fire-fighter training facility. CAL FIRE equipment includes water and retardant tanks, one hangar used to store helicopters, an apron that provides parking for up to four aircraft and a fuel dispensary. Eureka Municipal Airport Eureka Municipal Airport is located on a peninsula, west of downtown Eureka and Humboldt Bay. Its sole runway is 2,700 feet long and 60 feet wide. This runway is not lighted, and night operations are prohibited. The airport has 11 hangars for public use and ten runway tidedowns. It also has an onsite Bed and Breakfast located in the building that was used for administrative purposes when the airport served as base during WWII. Approximately 10 aircraft are based at this airport. It is used, primarily, for recreational and personal business purposes. No aviation services are available. Shelter Cove Airport Shelter Cove Airport is located one mile west of the community of Shelter Cove. Its sole runway is 3,400 feet long and 75 feet wide. This runway is not lighted, and night operations are prohibited. The airport has no based aircraft. Aircraft parking is available, and camping, hotel rooms, restaurants and other retail services are located adjacent to the site. HUMBOLDT COUNTY AIRPORT LAND USE COMMISSION The California Public Utilities Code, Sections et seq., sets the statutory authority for establishment of Airport Land Use Commissions (ALUC) and the adoption of the airport land use compatibility plan. Every county in which a public use airport is located is required to establish an ALUC. Its charge is expressly stated as being to, protect public health, safety, and welfare by ensuring the orderly expansion of airports and the adopting of land use measures that minimize the public s exposure to excessive noise and safety hazards within areas around public airports to the extent that these areas are not already devoted to incompatible uses (Airport Land Use Compatibility Plan Humboldt County Airports, March 1993). The Board of Supervisors is the designated ALUC for Humboldt County. It authorizes the Humboldt County Aviation Advisory Committee (AAC) to advise them on aviation matters within the county. There are nine AAC committee members. The Airport Land Use Compatibility Plan Humboldt County Airports sets forth the criteria and policies, which the ALUC uses in assessing the compatibility between the public use airports in Humboldt County and proposed development in areas surrounding them. It emphasizes reviews of local general and specific plans, zoning ordinances, and other land use documents covering broad geographic areas. The plan specifically pertains to the land uses surrounding the following airports: Arcata-Eureka, Dinsmore, Garberville, Hoopa, Kneeland, Murray Field, Rohnerville and Shelter Cove Airports RTP Page AS-6 Aviation Systems Element
152 The plan contains compatibility criteria and airport compatibility maps that are utilized by the ALUC to determine if proposed land uses are compatible with airport operations. The compatibility criteria and maps provide a single, combined set of zones and associated criteria, covering each of the basic types of airport impacts (i.e., noise, safety, airspace, and overflight), to facilitate project review. It contains criteria for building heights, restrictions on the use of land, and standards for building construction. These criteria contain standards to be achieved, rather than a list of specific uses which are permitted in each zone. CALIFORNIA AVIATION SYSTEM PLAN The California Aviation System Plan (CASP) is prepared by the California Department of Transportation (Caltrans), Division of Aeronautics, and updated every five years per California Public Utilities Code Section 21701, et seq. The law requires the CASP to be developed in consultation with Regional Transportation Planning Agencies, such as HCAOG. The primary purpose of the CASP is to develop and preserve a balanced system of airports responsive to the needs of the state. This process considers airport interdependency, airspace, public demand for aviation facilities, and ground access. It also takes into account the interactions of local, regional, state, and national aviation needs. The System Requirements Element is one of ten Elements and Working Papers that comprise the CASP. The Systems Requirements Element identifies and prioritizes needed airport capacity, along with safety related infrastructure enhancements that impact the California Aviation Transportation System safety and effectiveness. It emphasizes enhancement projects at General Aviation and Reliever Airports. The focus on the two types of facilities, rather than commercial service airports, is a result of funding mechanisms. Commercial service airports seldom apply for project funding from the Division s four funding programs. The document focuses on areas wherein the state s limited financial resources may best be applied, to enhance the California Transportation System. Airport project funds are derived solely from General Aviation fuel excise taxes. The CASP identifies airports as Limited Use, Community, Regional, Metropolitan, and Commercial/Primary to distinguish how each airport functions to serve the community, region, state, or nation. NEEDS ASSESSMENT Information for this section was obtained from the Humboldt County Airport Master Plans, the CASP, and discussion with local agency staff. An airport s airfield design is shaped by a small set of external key factors, or demand determinants, which in turn define the airport s fundamental needs. The demands placed on an airport can be defined in terms of three key parameters: the total volume of aircraft operations, the types of aircraft seeking to operate at the airport, and the weather conditions that affect those operations. The demands translate into facility needs, and the needs are assessed with respect to 2008 RTP Page AS-7 Aviation Systems Element
153 four design factors, which include: the runway length needed to serve the critical aircraft; the classification of the runways and taxiways for design purposes; the adequacy of the runway/taxiway system capacity; and the adequacy of the runway system wind coverage. Environmental constraints (e.g., terrain) can also play a role in defining an airport s needs, in relation to the expected demand. Table AS2 details the based-aircraft aviation activity forecasts for six of the nine Humboldt County Airports: Table AS2 Aviation Activity Forecast Based Aircraft Aircraft type Based Aircraft Forecast Arcata-Eureka Single-Engine Twin-Engine Turbo-Prop Jets Helicopter Total Dinsmore Single-Engine Twin-Engine Jet Helicopter Total Garberville Airport Single-Engine Twin-Engine Jet Helicopter Total Kneeland Airport Based Aircraft Total Murray Field Single-Engine Twin-Engine Jet Helicopter Total Rohnerville Single-Engine Twin-Engine Jet Helicopter Total RTP Page AS-8 Aviation Systems Element
154 The Eureka Municipal Airport and Shelter Cove Airport are not anticipated to experience increases in based aircraft within the 20 year timeframe of the RTP. Table AS3 details the annual operations aviation activity forecasts for six of the nine Humboldt County Airports: Table AS3 Aviation Activity Forecast Annual Operations Operation Type Annual Operations Forecast Arcata - Eureka Air Carrier 11,650 11,700 11,675 11,650 Air Taxi 4,650 5,600 6,450 7,300 General Aviation 9,700 9,800 9,950 10,100 Military / Government Dedicated Air Cargo 1,250 1,400 1,625 1,850 Sub Total 27,250 28,500 29,700 30,900 General Aviation 7,700 7,800 7,950 81,00 Military / Government 15,000 15,000 15,000 15,000 Dedicated Air Cargo Sub Total 23,250 23,500 23,750 24,000 Total 50,500 52,000 53,450 54,900 Kneeland Single-Engine Fixed 3,000 3,000 3,300 3,300 Single-Engine Variable 2,000 2,000 2,000 2,000 Sub Total 5,000 5,000 5,300 5,300 Single-Engine Turboprop Helicopters Light Twin-Engine Single-Engine Fixed Single-Engine Variable Sub Total 1,500 1,500 2,200 2,200 Total 6,500 6,500 7,500 7,500 Dinsmore Air Carrier Air Taxi General Aviation 1,045 1,105 1,170 1,236 Military / Government Sub Total 1,045 1,105 1,170 1,236 General Aviation Military / Government Sub Total Total 1,670 1,770 1,870 1,975 Garberville Air Carrier Air Taxi General Aviation 7,475 7,896 8,340 8,809 Military / Government Sub Total 7,475 7,896 8,340 8,809 Itinerant Local Itinerant Local Itinerant Local Itinerant 2008 RTP Page AS-9 Aviation Systems Element
155 Local Itinerant Local Itinerant Local Operation Type Annual Operations Forecast General Aviation 8,542 9,022 9,530 10,066 Military / Government Sub Total 8,542 9,022 9,530 10,066 Total 16,017 16,918 17,870 18,875 Murray Field Air Carrier Air Taxi General Aviation 21,360 22,560 23,830 25,170 Military / Government Sub Total 21,840 23,070 24,370 25,740 General Aviation 48,050 50,750 53,600 56,620 Military / Government Sub Total 48,050 50,750 53,600 56,620 Total 69,890 73,820 77,970 82,360 Rohnerville Air Carrier Air Taxi General Aviation 11,360 12,020 12,710 13,450 Military / Government Sub Total 11,750 12,410 13,100 13,.840 General Aviation 17,620 18,610 19,660 20,760 Military / Government Sub Total 17,620 18,610 19,660 20,760 Total 29,370 31,020 32,760 34,600 The Eureka Municipal Airport and Shelter Cove Airport are not anticipated to experience increases in aircraft operations within the 20 year timeframe of the Regional Transportation Plan. Arcata Eureka Airport The Arcata-Eureka Airport is the only non-hub primary commercial service airport in Humboldt County. This airport handles the region s commercial traffic and serves a critical role in the region s air transport network, providing access to national and international air service. It is also a major link in Humboldt County s goods movement system. The Arcata-Eureka Airport is working towards and will benefit from a balanced 14/32 Runway of 6000 feet to meet its existing and future needs. Improvements will be coordinated to have a minimum impact on runway safety and object free areas. Government Code requires primary air carrier airports with annual enplanements over 10,000 to have an Airport Ground Access Improvement Program. The program addresses the development and extension of mass transit systems, major arterial and highway widening and extension projects and any other ground access improvement projects that a planning or airport management agency deems appropriate. The Arcata-Eureka Airport has annual enplanements over 10,000, but an Airport Ground Access Improvement Program has not been developed RTP Page AS-10 Aviation Systems Element
156 Dinsmore Airport The principal factors affecting future operational levels at Dinsmore Airport are runway length and non-standard approach and departure procedures. The runway length is 766 feet shorter than required for 75 percent of small airplanes with 10 passenger seats or less. However, due to the rapidly rising terrain, the location of Highway 36, and dense forest cover surrounding the east and west sides of the airport, the costs associated with an extension or realignment of the runway would be disproportionately high for a small gain. Given the constraints, it is recommended that Humboldt County request a modification of FAA standards to maintain the current width of the runway, to allow part of Highway 36 to remain inside the runway safety area, to allow nonstandard conditions with regard to the object free area for Runway 9-27, and to maintain tiedowns within the aircraft parking limit. Planned Dinsmore Airport improvements include: Runway repair and overlay with required markings, enhancement of the wind sock and segmented circle, the improvement of existing fencing and installation of new gates. It is also recommended that space be established and preserved for aircraft storage facilities, in case demands increase. Garberville Airport Aircraft parking is the most extensive aviation-related use of land at the Garberville Airport. It is anticipated that eight additional aircraft will be based at the airport within the 20-year time frame of this RTP. Additional parking space may be required, to meet future demand for airport based aircraft. A reconfiguration of the existing space could add ten additional new tiedowns. If demand for services increases at Garberville, the Master Plan outlines development to be completed in two phases Phase II would occur within a 7 to 13 year timeframe and Phase III would occur in a 14 to 20 year timeframe. Phase II development includes extension of the existing apron further to the north, construction of two taxiway exits, a combination of tiedown parking positions and new aircraft storage units, and designated parking in the undeveloped area north of the core building area. Phase III development would occur in the west building area of the airport. Phase II development would include new hangers and apron construction, vehicle access to the west building area, and vehicle parking. Kneeland Airport This airport s ability to provide the facilities necessary to accommodate anticipated demand is based on the overall development potential of its site. The principal factor affecting operational levels at Kneeland Airport is runway length. The published runway length at Kneeland Airport is 2,235 feet, which is 885 feet shorter than required for 75 percent of small airplanes with 10 passenger seats or less. However, the Kneeland Airport site has three primary constraints affecting development, which are as follows: Kneeland Prairie pennycress, the topography and soils, and the California Department of Forestry base. Kneeland Prairie pennycress is a perennial herb found in the coastal uplands of Humboldt County. In February 2000, Kneeland Prairie pennycress was placed on the California 2008 RTP Page AS-11 Aviation Systems Element
157 Endangered Species list. The only known population is scattered within an area on, and immediately adjacent to, the airport. The Kneeland Prairie pennycress population is bisected into two colonies by the airport s runway. It is a designated critical habitat, which precludes modification of the airfield. This environmental constraint is the most significant factor restricting future expansion of airport facilities. In addition, Kneeland Airport is situated on top of an isolated ridge, surrounded by mountainous open space; the terrain drops off immediately beyond the ends of the runway. Based on a geotechnical study conducted in 2001, topographic and geologic conditions surrounding the facility severely limit the expansion potential of the runway and the ability to satisfy the FAA s new runway setback requirements. Finally, the California Department of Forestry base is located immediately west of the airfield. Murray Field Airport Currently, wildlife fencing and hangar development are priority needs. It is recommended that land on the south-southwest side of the airport, consisting of approximately two acres, should be preserved for future aviation development (i.e., based aircraft storage and parking). There is also approximately three acres to the north of the airport that would be appropriate for development of an apron, hangars, tiedowns, vehicle parking, and access road. The building areas at Murray Field Airport are constrained by wetlands and would require prior approval by the Army Corps of Engineers before development. Rohnerville Airport The 2007 Rohnerville Airport Master Plan outlines a phased development plan that would expand airport facilities to accommodate the projected growth. Development plans include reconfiguration of the based and transient tiedown aprons, construction of a new taxiway, expansion of the transient apron, construction of new aprons, construction of T-hangers or tiedowns, perimeter fencing and new runway lighting. The current runway length can accommodate 100 percent of small aircraft with less than 10 passenger seats, excluding larger California Department of Forestry aircraft. Rohnerville Airport is significantly limited in its potential to extend its runway because it is located atop a plateau. However, the Master Plan recommends improvements to the runway safety area. Runway and taxiway lighting systems have been upgraded with an automated weather observation system programmed in the airport federal grant program for fiscal year 2009/2010. Eureka Municipal Airport Although Eureka Municipal Airport is classified as a Community General Aviation Airport, it does not meet all the minimum standards for this classification. The airport does not have 24- hour on-field weather services or an instrument approach procedure. Enhancement needs identified by CASP for Eureka Municipal include: a wider and longer runway, runway pavement improvements, visual approach slope indicator equipment, instrument approach procedures and fuel availability. City of Eureka staff identified a need for 10 new T-hangers RTP Page AS-12 Aviation Systems Element
158 Shelter Cove Airport Although Shelter Cove Airport is classified as a Community General Aviation Airport., it does not meet all the minimum standards for this classification. The airport does not have 24-hour onfield weather services or an instrument approach procedure. Enhancement needs identified by CASP for Shelter Cove include: wider and longer runway, runway pavement improvements, visual approach slope indicator equipment, instrument approach procedures, fuel availability and security fencing around the perimeter of the airport. Shelter Cove staff identified a need to straighten the runway. Airport Land Use Compatibility Plan Humboldt County Airports Airport Land Use Compatibility Plan Humboldt County Airports was written in March of The plan should be updated to ensure that the compatibility criteria and policies adequately reflect public health and safety concerns, reflect infrastructure improvements that have been made at various airports, and record any changes that have occurred. GUIDING GOALS, POLICIES, AND OBJECTIVES The goals, policies and objectives address the issues identified in the Needs Assessment element, and reflect the short- and long-range projects identified in the Action Element below. The goals, policies and objectives are also consistent with the Financial Element, specifically identifying project and program areas that should be included in the RTP, in order to leverage funding. Changes have been made to the goals, policies and objectives that reflect an emphasis on safety and a commitment to long term planning. Goal: Provide continued support to the Humboldt County Aviation Division of the Public Works Department, City of Eureka, the Resort Improvement District Number 1, and the Hoopa Valley Business Council, to maintain and manage the facilities and services at the public-use airports in Humboldt County and to maximize linkages to the national aviation network. Policy AS-1: Maintain and expand scheduled passenger airline service in and out of Humboldt County. Objective: Identify facility improvement projects that would retain, expand and/or attract scheduled passenger airline service for inclusion in the Regional Transportation Plan. Objective: Encourage inter-modal coordination, to compliment scheduled passenger airline service (e.g. secure bicycle storage). Policy AS-3: Promote full utilization of air freight capabilities in Humboldt County. Objective: Maintain a current inventory of available airfreight services in Humboldt County and identify where additional capacity exists; disseminate this information to businesses with existing and potential future demand for those services RTP Page AS-13 Aviation Systems Element
159 Objective: Develop a marketing plan for airfreight services in Humboldt County. Objective: Include projects and programs that would improve, expand or add additional air freight capabilities at Humboldt County Airports in the Regional Transportation Plan. Goal: Provide support and coordination for the continued operation of safe and efficient aviation facilities in Humboldt County. Policy AS-4: Encourage long-term airport planning in the region. Objective: Maintain the utility of Humboldt County airports by encouraging airport operators (e.g., the City of Eureka, the Hoopa Valley Business Council, and the Resort Improvements District Number 1) to review airport needs every five years, regularly update airports plans, and implement capital improvement programs. Policy AS-4: Support the Humboldt County Airport Land Use Commission's efforts to ensure that proposed development in the vicinity of airports is compatible with airport activities. Objective: Support and encourage the Airport Land Use Commission to update the 1993 Airport Land Use Compatibility Plan Humboldt County Airports. Objective: Promote the City of Arcata, City of Eureka, City of Fortuna, Humboldt County, and the Hoopa Valley Business Council, to use their land use authority to ensure that land use and development around the airports are consistent with the Airport Land Use Compatibility Plan Humboldt County Airports. Objective: Request annual reports on airport activities, needs and planned projects from the Airport Land Use Commission to the HCAOG Board. ACTION PLAN: PROPOSED PROJECTS The Humboldt County Aviation Division of Public Works Airport Capital Improvement Plan (ACIP), the Airport Master Plans, and direct input from local agency staff were the primary sources used in determining projects for each airport. The projects address the needs that have been identified for each airport and/or anticipated needs based on long-term demand increases. The projects listed may or not have the funding available for implementation. The Humboldt County Aviation Division of Public Works ACIP and the Airport Master Plans serve as outlines for the next five to twenty years; projects may change based on funding, FAA priorities or national emergencies such as 911. Although the funding is not secure, and funding priorities change, projects need to be listed in an ACIP or Master Plan in order to be eligible for various funding streams. The projects in table AS4 reflect short-term (0-10 years) and long-term (11-20 years) projects RTP Page AS-14 Aviation Systems Element
160 Table AS4 Proposed Projects DESCRIPTION TOTAL COST FISCAL YEAR Arcata-Eureka Airport Design runway safety areas $300, Construct safety area $5,000, Construct runway lighting enhancements $787, Construct fire station $3,700, RnR Twy B&G / drainage (design completed 2006) $508, Design runway extension $300, Construct runway extension $5,000, Construct terminal covered walkway $325, Seal runway 14-32, parallel taxiways and exits $950, Install PAPI for runway 19 $60, Seal public parking lots and access roads $115, Seal east hangar access and taxilanes $35, Seal Coast Guard access road $40, Sub Total $17,121,302 Dinsmore Airport Runway and ramp rehabilitation and reconstruction $135, Design and construct windsock and segmented circle $55, Design westend storm drain improvements $50, Construct westend storm drain improvements $290,000 Design Fencing and Gates $38, Construct Fencing and Gates $166, Design and Construct Phase I Improvements, which include aircraft $645, storage units and tiedowns (if demand materializes) Sub Total $1,380,450 Garberville Airport Design and construct underground storm drainage for runway safety $68, area enhancement Implement an automated weather observation system $100, Construct Ramp Reconstruction, Rehabilitation, and Expansion $562, Design Runway Rehabilitation and Reconstruction $52, Construct Runway Rehabilitation and Reconstruction $297, Design Relocation of Wind Cone and Segmented Circle $20, Relocate Wind Cone and Segmented Circle $20, Design and Construct Phase II Improvements, which includes extension of the existing core area apron to the north, tidedowns, storage units and space for a new fixed base operator (as needed) Design and Construct Phase III Improvements, which includes new apron and hanger sites and new taxiway system connected to the runway (as needed) $1,420, $784, Sub Total $3,324,500 Kneeland Airport Environmental Assessment for Stabilization of Runway 33 $157, Design stabilization $107, Construct stabilization $1,077, Design fencing and gates $45, RTP Page AS-15 Aviation Systems Element
161 DESCRIPTION TOTAL COST FISCAL YEAR Construct fencing and gates $350, Steal coat and re-marking $60, Design tie-down area $60, Sub Total $1,857,650 Murray Field Airport Design wildlife perimeter fencing and gates $63, Construct wildlife perimeter fencing and gates $500, Design upgrade of runway and taxiway lighting system and connecting $63, security lights to emergency generator Construct upgrade of runway and taxiway lighting system $278, Implement an automated weather observation system $100, Design runway and taxiway reconstruction and rehabilitation $63, Construct runway and taxiway reconstruction and rehabilitation $753, Design entrance road rehabilitation $40, Construct entrance road rehabilitation $480, Design and Construct Phase I improvements, which includes reconfiguration of the existing tiedown apron and construction of aircraft storage units (as needed) $455, Design and construct Phase II improvements, which includes design and construction of North Building Area (as needed) $1,360, Design and construct Phase III improvements, which includes design and construction of South Building Area ( as needed) $335, Sub Total $4,490,300 Rohnerville Airport Implement an automated weather observation system $100, Construct ramp reconstruction and rehabilitation $660, Construct runway and taxiway reconstruction and rehabilitation $933, Design and construct Phase II improvements, which includes design $1,081, and construction of Southeast Building Area (as needed) Design and construct Phase III improvements, which includes design and construction of Northeast Building Area (as needed) $1,263, Sub Total $4,037,750 Eureka Municipal Design and construct ten T-hangers $205, Installation of runway lights $230, Construction of parallel taxiway $390, Construction of security fencing $100, Sub Total $925,000 Shelter Cove Design and construct runway rehabilitation and reconstruction $ Sub Total $0 TOTAL $33,136, RTP Page AS-16 Aviation Systems Element
162 FINANCING The previous section presented a list of projects that would assist in meeting the airports identified needs, or projected needs if demand increases. Local counties, particularly rural counties, have few resources available to finance the projects outlined in the Action Plan. This section presents funding sources available for project implementation. There are a variety of resources from which funding and financing for general aviation airport facilities and improvements can be obtained. These resources include federal grants, state grants, bonds, airport self funding and private investment. It is difficult to assess anticipated revenue streams, due to funding priority shifts that occur on a regular basis. The Humboldt County Aviation Division of Public Works has been successful in obtaining federal grants to complete projects outlined in the Past Accomplishments section below. The Humboldt County Aviation Division of Public Works does not receive a share of the general fund and as a result, relies on successful acquisitions of grant funds. The City of Eureka and Shelter Cove Airports are funded via the State of California Annual Grant program. Each airport receives a $10,000 annual grant. It is anticipated that both airports will continue to receive the State of California Annual Grant for the twenty year timeframe covered by the RTP. Federal Aviation Grants A common source of federal aid for airport facilities is the Airport Improvement Program (AIP), which is administered by the Federal Aviation Administration (FAA). The current AIP program, reauthorized in 2000, is the latest evolution of a funding program originally authorized by Congress in 1946 as the Federal Aid to Airports Program (FAAP). The program is based upon a user trust fund concept, allocating aviation-generated tax revenues for specified airport facilities, on a local matching-share basis. The program currently provides 95 percent federal participation and five percent local participation on small primary, reliever and general aviation eligible airport projects in California. The Airport Improvement Program (AIP) provides grants to public agencies and, in some cases, to private owners and entities, for the planning and development of public-use airports that are included in the National Plan of Integrated Airport Systems (NPIAS). The six county owned airports are registered in the NPIAS. Eligible projects include those improvements related to enhancing airport safety, capacity, security, and environmental concerns. In general, AIP funds can be used on most airfield capital improvements, hangars, and non-aviation development. Professional services necessary for projects (e.g., planning, surveying, and design) are eligible, as is runway, taxiway, and apron pavement safety enhancements. Aviation demand at the airport must justify the projects, which must also meet Federal environmental and procurement requirements. Projects related to airport operations and revenue-generating improvements are typically not eligible for funding. Operational costs such as salaries, maintenance services, equipment, and supplies are also not eligible for AIP grants. Because the demand for AIP funds exceeds the availability, the FAA bases distribution of these funds on current national priorities and objectives. AIP funds are typically first apportioned into major entitlement categories such as primary, cargo, and general aviation. Remaining funds are distributed to a discretionary fund. Set-aside projects (airport noise and the Military Airport 2008 RTP Page AS-17 Aviation Systems Element
163 Program) receive first attention from this discretionary distribution. The remaining funds are true discretionary funds that are distributed according to a national prioritization formula. State of California Airport Grant and Loans The Division of Aeronautics within the California Department of Transportation administers four different programs which provide funding for airport improvements. These funding programs are discussed below. Acquisition and Development Grant Program The Division of Aeronautics Acquisition and Development (A&D) Grant Program is similar to the federal AIP grant program in that the state program provides airport development funds on a matching-share basis. The state provides 90 percent and the local jurisdiction provides 10 percent. The state grants are allocated through the California Transportation Commission and are governed by the priorities set forth in the State Transportation Improvement Program (STIP) and the CASP. A&D grants can be used for construction projects, land acquisition and planning projects such as Master Plans and airport layout plans. The minimum grant amount is $10,000 and the maximum is $500,000. The amount available statewide for these grants is the remaining funding available in the Aeronautics Account after funding State operations, Annual Grants and AIP Matching Grants. Annual Grant Program The California Division of Aeronautics administers an Annual Grant Program, through which all qualifying publicly-owned airports in the state receive $10,000 per year to be used for eligible projects. Funds received must be kept in a Special Aviation Account, and with the permission of the Division of Aeronautics, can be accumulated for up to five years toward a larger capital project. The funds can also be used as part of a local match for federal grants. This program is intended to assist general aviation airports. Commercial service and reliever airports are not eligible for this annual grant. Airport Loan Program The California Division of Aeronautics also makes available a State Airport Land program. The program was established to allow public airport owners the opportunity to borrow funds for an 8 to 15 year term, at lower than commercial interest rates. Airport Loan Program funds can be used on specified revenue generating projects and as the local share of FAA grant funded projects. The most common use of these lands is for revenue-producing hanger construction and development of aviation fuel storage and dispensing facilities. AIP Matching Grants These are State grants, to eligible airports, for a portion of the required match for the Federal Airport Improvement Program grants. This program provides a funding amount equal to RTP Page AS-18 Aviation Systems Element
164 percent of the FAA funding amount (4.5 percent of total project cost). The remaining match must be provided by the local agency; however, the Annual Grant funding can be applied toward this match. In order for projects to be eligible for the AIP and the AIP Matching Grants, they must be included in the State Transportation Improvement Program. State matching funds can only be used for airport and aviation purposes. Airport Sponsor Self Funding The Humboldt County Aviation Division is a self-supporting enterprise fund. Humboldt County s general funds are not used to support any of the Division s six airports. At commercial service airports the size and character of Arcata-Eureka, airport sponsor self-funding is principally provided by a combination of airport-generated income and retained earnings. Funding airport improvements that are not grant eligible, and providing the local matching share for grants-in-aid from airport-generated income, is the simplest and often most economical method for use of the funds because direct interest costs are eliminated. Airports such as Kneeland Airport have limited revenue generating capacity and are supported solely by Aviation Division revenue and various federal and state funding programs. Kneeland Airport s limited funding comes from non-aviation sources such as providing a favored backdrop for companies filming car commercials. Passenger Facility Charge Since 1992, airports have been authorized to charge airline passengers a fee, known as a passenger facility charge (PFC), which the airlines collect as an add-on to the airfare. The maximum fee was originally set at $3 per leg of a flight, which a maximum of $12. Beginning in 2000, Congress authorized an increase in the maximum PFC rate to $4.50 per segment, with a cap of $18 for a roundtrip. These fees are dedicated to capital improvements that preserve or enhance the safety, capacity or security of the national air transportation system; reduce noise; or enhance competition between or among air carriers. Each PFC application is tied to specific capital improvement projects that have been approved by the airlines, FAA and the county. New projects may be approved under a separate application. The Arcata-Eureka airport is currently charging $4.50 for flights at the airport. Funds are used to provide the required matching funds for AIP grants and projects that may be critical to the airport, but not a priority to the FAA. Private Investment Private sector investment is an important source of funding for some types of airport improvements. The most common sources of funding for private sector development are commercial lending institutions and insurance companies. Pilots groups, community groups or businesses with links to an airport, will sometimes donate funds for specific airport projects. In the case of private development on public lands, these types of financing may be difficult and expensive to obtain, because the borrower can encumber only the improvements as loan collateral. It is essential that agreements be reached with tenants that provide for adequate airport revenues and facility development, while encouraging private investment and satisfying tenants borrowing requirements RTP Page AS-19 Aviation Systems Element
165 ACCOMPLISHMENTS SINCE THE 2006 RTP The information contained in this section identifies projects known to be completed since the adopting of the 2006 Regional Transportation Plan. Arcata-Eureka Airport Updated Arcata-Eureka Airport Master Plan Constructed a general aviation ramp on the north side of the airport Began passenger terminal expansion and renovation project Environmental analysis for runway and safety area improvements Updated 5-year FAA Airport Capital Improvement Plan Addition of Delta as an air service carrier to Salt Lake City Removal of hazards to airspace Dinsmore Airport Updated Dinsmore Airport Master Plan CEQA environmental analysis for projects outlined in Master Plan Drainage improvement project Runway overlay Removal of hazards to airspace Updated 5-year FAA Airport Capital Improvement Plan Garberville Airport Updated Garberville Airport Master Plan CEQA environmental analysis for projects outlined in Master Plan Upgraded fuel system to a cardlock system that allows 24 hour self-fueling Designed and constructed security fencing and gates Phase I of ramp design and expansion project Updated 5-year FAA Airport Capital Improvement Plan Kneeland Airport Updated Kneeland Airport Master Plan Runway overlay and marking project Updated 5-year FAA Airport Capital Improvement Plan Completed an EA/EIR study for the repair of areas that eroded due to weather 2008 RTP Page AS-20 Aviation Systems Element
166 Murray Field Airport Updated Murray Field Airport Master Plan Updated 5-year FAA Airport Capital Improvement Plan Repainted runway markings Removed hazards to airspace Replaced existing fencing with security fence and gates Installed security equipment Environmental analysis for construction of a wildlife fence, hangar development and lighting upgrades Rohnerville Airport Updated Rohnerville Airport Master Plan Updated 5-year FAA Airport Capital Improvement Plan CEQA environmental analysis of projects outlined in Master Plan Erected security fencing and automated gates Undergrounding of overhead wires Replaced runway and taxiway lighting Changed lighting conduit Surveyed and marked Private hanger development sites Phase I of Master Plan ramp extension project Repainted runway markings Installed security equipment 2008 RTP Page AS-21 Aviation Systems Element
167 REFERENCES Mead & Hunt. September Kneeland Airport Master Plan Update. Humboldt County, CA. Mead & Hunt. January Dinsmore Airport Master Plan Report. Humboldt County, CA. Mead & Hunt. January Garberville Airport Master Plan Report. Humboldt County, CA. Mead & Hunt. January Murray Field Airport Master Plan Report. Humboldt County, CA. Mead & Hunt. January Rohnerville Airport Master Plan Report. Humboldt County, CA. Mead & Hunt. January Arcata-Eureka Airport Master Plan Report. Humboldt County, CA. Rushton, Nathan. Airport Traffic Sets New Record. The Eureka Reporter, 15 February < California Aviation Systems Plan Draft System Requirements Element / December 2003 / California Department of Transportation Personal Communication with Lisa Savage, Project Manager for the City of Eureka Personal Communication with Sue Sack, Administrative Secretary for the Resort Improvement District Number 1 Personal Communication with Jacquelyn Hulsey, Airports Manager with the County of Humboldt Aviation Division of Public Works 2008 RTP Page AS-22 Aviation Systems Element
168 GOODS MOVEMENT ELEMENT The goods movement section focuses on truck, marine and rail transportation in and out of Humboldt County. This section examines: The role of goods movement in the Humboldt County region Existing uses and plans for future expansion of marine transportation, and issues with these plans Plans for restoring rail service short- and long-range strategies for an integrated and balanced multimodal goodsmovement system SYSTEM DESCRIPTION There are three main goods movement functions in Humboldt County: (1) local pickup and delivery service; (2) domestic trade; and (3) international trade. Local service trucking represents the largest share of truck traffic, supporting local business and consumer markets. Domestic long-haul trucking provides access to national markets and connections to major goods suppliers. Long-haul trucks also provide connectivity with marine, air and rail systems. Marine and aviation provide access to national and international markets. Currently there is no active rail service in and out of Humboldt County. Truck transport is and will continue to be the primary method of goods movement into, within and out of Humboldt County. Restrictions on trailers longer than 28 feet at Richardson Grove on US 101 north of Mendocino County and at Buckhorn Summit on SR 299 limit goods movement. These factors increase the need to support the efficient movement of goods for the economic benefit of the County. Statewide Goods Movement Strategy The State has adopted a strategic policy and action blueprint, the "Statewide Goods Movement Strategy," for improving the statewide goods-movement transportation system. This strategy focuses on improving existing system efficiency, through technology and other means, to maximize capacity and reliability and minimize long-term costs. Truck Transport System Description Humboldt County s roadway system has approximately 1,400 miles of county roads and city streets, 378 miles of state highways, including U.S. Highway 101, and roadways on federal lands. These roadways provide for the inter-regional and intra-regional movement of goods by trucks on California s north coast. The County-maintained roadways are integrated with an 2008 RTP Page GM-1 Goods Movement Element
169 overall countywide circulation system maintained by the California Department of Transportation (Caltrans), the U.S. Forest Service Bureau of Land Management, cities, and private property owners. The primary routes into and out of the County used by commercial trucks are U.S. Highway 101 and State Route 299. These highways provide adequate facilities and level of service for their operations. There are narrow, winding sections of these highways that prevent larger trailers from entering the County, increasing shipping costs for both imported and exported goods. Improvements to the road alignment of US 101 through Richardson Grove in the southern end of the County, combined with recent State regulatory reforms, may eliminate constraints on large truck access, which would reduce shipping costs. Future improvements to SR 299 in the Buckhorn Summit area of Trinity County could provide trucks with larger trailers access from the east. Marine System Description The Port of Humboldt Bay is a working port that can handle ocean-going vessels with domestic or international cargoes. The Port is the only deep-water shipping port between San Francisco, 225 nautical miles to the south, and Coos Bay, Oregon, 156 nautical miles to the north. The Humboldt Bay Harbor, Recreation and Conservation District (HBHRCD) was established by the State of California in 1970, and ratified by the Humboldt County electorate in 1973, to implement, supervise and regulate the development of Humboldt Bay. The HBHRCD manages Humboldt Bay to promote commerce, navigation, fisheries, recreation, and the protection of natural resources. The HBHRCD is empowered by California statutes to develop Humboldt Bay to its ultimate potential as a harbor and port while conserving the natural resources of the area. The Port s amenities include: the jetties at the Bay entrance, the bar and entrance channel, shipping channels within the Bay, turning basins, shoreline protection and improvements, docks and other landside improvements, and key waterfront sites used for coastal-dependent industry. Adjacent to the Humboldt Bay channels there are eight operating docks with the potential of serving ocean-going dry cargo vessels and one liquid bulk dock. Two of the eight cargo docks are located on the Eureka waterfront, four are located on the Samoa Peninsula, and two are located at Fields Landing. The HBHRCD s Redwood Marine Terminal on the Samoa Peninsula has two berths and over one mile of shoreline. The Samoa docks are presently used principally by mill operators and paper pulp manufacturers on the Samoa Peninsula. The Eureka waterfront docks are used primarily for commercial shipping (wood chips, lumber and logs), and occasionally by cruise ships, other passenger vessels, and U.S. Naval vessels calling on Humboldt Bay. The Fields Landing dock is used chiefly for log imports. The Commercial fishing industry is a significant contributor to the local economy. Over 200 commercial vessels list Eureka as home port and over 500 vessels from other West Coast ports use the Bay's facilities annually. Commercial fishing facilities are concentrated along the Eureka waterfront from the Eureka Public Marina to the foot of J Street, in Fields Landing, and 2008 RTP Page GM-2 Goods Movement Element


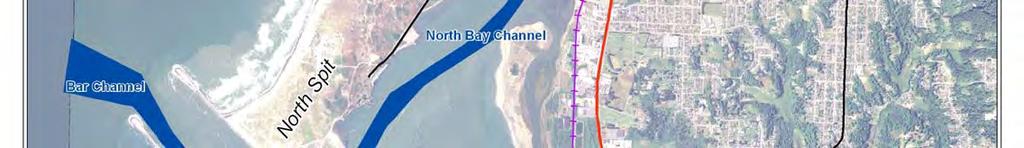


170 2008 RTP Page GM-3 Goods Movement Element
171 Trinidad. Boat repair yards are located at Fields Landing and the Fairhaven terminal. The Eureka Public Marina has been re-constructed and provides a berthing area for approximately 130 commercial fishing vessels, other local boats and a temporary berthing area for visiting boats. Most of the Eureka shoreline along the Inner Reach was previously used as a mooring area by commercial boats. Today, although Dock B is in poor condition, the remaining docks on the Eureka waterfront have either been improved or recently rebuilt and are in good condition. The Pacific Choice Seafoods processing facility is the only seafood processor in Humboldt Bay, and provides an important service to the fishing industry. The City-owned facilities, at the foot of Commercial Street in Eureka, include a fish-processing plant with area for a second plant, a ship's chandlery, and a fueling facility. The Woodley Island Marina facility, operated by the Humboldt Bay Harbor District, provides 237 berths, a work area, and restaurant, office and restroom facilities. The island is also home to the region s new National Weather Service facility. The Harbor District owns the Kramer dock at the south end of the Fields Landing Channel. The Olson Dock, operated by Humboldt Bay Forest Products, Inc., is also used for mooring commercial fishing vessels when it is not being used by commercial deep-draft vessels. There are six maintained channels in Humboldt Bay (all channel depths are given as the depth below Mean Lower Low Water (MLLW: the average of the lower low water height of each tidal day)): 1. The bar channel extends seaward of the entrance channel, and is maintained at a depth of -48 feet MLLW. It is approximately 2,300 feet long, and is 1,600 feet wide at the seaward end and 700 feet wide at the jetties. 2. The entrance channel extends through the two rubble mound/jetties forming the bay entrance to the open ocean, and is maintained at a depth of -48 feet MLLW. It is approximately 9,000 feet long and 500 feet wide. 3. The North Bay and Samoa Channel, the bay's main and longest channel, serve as the Bay s major deep-vessel dock facilities along the Samoa bayfront. The North Bay Channel is maintained at a depth of -38 feet MLLW. It is 400 feet wide and 18,500 feet long, extending from the entrance channel to the confluence of the Eureka and Samoa Channels. 4. The 400-foot wide Eureka Channel serves the Eureka waterfront and Woodley Island. It consists of a southerly segment 3,000 feet long and maintained at a depth of -35 feet MLLW and a northerly segment that is 6,700 feet long and 16 feet deep. 5. The Samoa Channel serves Bay's major deep-draft vessel dock facilities along the Samoa bayfront. The Samoa Channel is 8,000 feet long, 400 feet wide and maintained at a depth of -38 feet MLLW. This channel has a turning basin at the north end, which is also maintained at a depth of -38 feet MLLW. 6. The Fields Landing Channel (Hookton Channel) is the only maintained south bay shipping channel. It connects to the entrance channel, is 12,000 feet long and 300 feet wide, and is maintained at a depth of -26 feet MLLW. This channel services Commercial 2008 RTP Page GM-4 Goods Movement Element
172 and sport fishing facilities in King Salmon and commercial dock facilities in Fields Landing. Humboldt Bay's marine transport industry is linked to growth in the other primary forms of goods movement: truck and rail. Due to the railroad s current inactive condition, goods loaded on and off of commercial vessels calling on Humboldt Bay are transported to and from the Port by truck. Several studies projecting future cargo volumes have been completed over the last 12 years. These studies indicate that the growth in marine transport is dependent on several factors, including: distance to the origin or destination of the shipped commodity; connections to other forms of goods movement (truck and rail); competitiveness with other port facilities; sufficient cargo volumes to spread fixed shipping costs, and adequate dockside resources for handling and utilization of cargoes and commodities. West Coast port traffic has grown over the past decades, with the growth in containerized cargo traffic exceeding other cargo types. Bulk and break-bulk cargoes have grown slightly in recent decades, while lumber and forest products have declined by more than 50 percent. The loss of forest product exports and domestic shipments has affected all ports from Humboldt Bay north to Washington. Outgoing cargo from Humboldt Bay has historically consisted almost exclusively of forest products (wood chips, wood pulp and lumber). More recently, wood products exports have declined, and lumber exports are nearly non-existent. Today, the incoming cargo to Humboldt Bay includes unprocessed logs from Canada and other west coast U.S. ports, wood chips and fuel. Humboldt Bay imports more than 90 percent of the gasoline and diesel that is used in Humboldt County and approximately 70 percent of the fuel used in the neighboring three counties (Del Norte, Trinity and Mendocino). Exports presently consist of forest products (wood chips and paper pulp). Marine transport of goods also has been affected by changes in the shipping industry. Larger, deep-draft vessels are becoming more common for moving cargo via the Pacific Ocean shipping lanes; while these vessels have higher cargo capacities, they also require deeper and wider channels and turning basins. An assessment by the Army Corps of Engineers in 1995 of the feasibility of deepening and widening Humboldt Bay found navigation concerns in two areas: (1) safety and efficiency, including that the North Bay Channel depths did not allow for the efficient movement of deep draft vessel commerce, and (2) deep-draft vessels that called at Humboldt Bay had vessel design drafts that were constrained by the existing channel depths. The deepening of Humboldt Bay channels in 2000 (to accommodate deeper draft vessels) was accomplished through an agreement between the U.S. Army Corps of Engineers and the Humboldt Bay Harbor District. The bar and entrance channels were deepened from -42 to -48 feet MLLW, and the North Bay and Samoa Channels deepened from -35 to -38 feet MLLW RTP Page GM-5 Goods Movement Element
173 As a follow-up to the deepening project, the HBHRCD s Bar Pilots conducted an extensive navigation simulation study in 2007 that concluded that vessels up to 950 in length could be safely brought into Humboldt Bay in most weather and sea conditions Harbor Revitalization Plan The 2003 Harbor Revitalization Plan identified a number of competitive advantages for the Port of Humboldt Bay, including: waterfront industrial sites; natural resource availability; tourism; marine science and environmental base; and livability. The key disadvantages identified by the Revitalization Plan were: small local market size; and difficult inland transportation access (truck and rail). Humboldt County s small population and economic base put it at a disadvantage in attracting traditional marine cargo business. As the area is primarily a producing region, it generates little inbound freight for consumption. The Revitalization Plan identified the most promising opportunities for the Port of Humboldt Bay Harbor, which included: marine-dependent industrial projects; niche dry and liquid bulk cargoes; tourism and marine science; aquaculture and commercial fishing; boat building and vessel repair, and forest products. Marine-dependent industrial opportunities are manufacturing facilities that have a major marine shipping component, either to bring in raw materials or to ship out finished products. The Port of Humboldt s advantages are the availability of large sites on Samoa Peninsula with access to the 38-foot channel, relatively low-cost land, labor, and livability. Dry-bulk cargo opportunities identified in the 2003 study include the shipment of bulk aggregates and rock to the Northern California construction market. For marine-dependent uses in general, the District supports portrelated functions for Humboldt Bay, according to its legislative mandate; in this support, the District must also take into account its obligations with respect to conservation and recreation. Aquaculture (mariculture) is a growth industry with relatively low investment requirements, and the region can build on its competitiveness in this area. Possible tourist and marine science 2008 RTP Page GM-6 Goods Movement Element
174 activities such as a public aquarium, cruise dock, Naval vessel museum, and marine-science center may also be potential opportunities, particularly if approached as a cluster. Existing import and export forest-product terminal handling activities should continue to be supported and monitored for potential new opportunities; the potential for a coastal forest products barge service or rail-on-barge service warrant monitoring and further investigation; and the needs of commercial fishing should continue to be supported. According to the Revitalization Plan, Humboldt s basic weaknesses in the areas of local market size, lack of proximity to a large metropolitan market, and limited inland truck and rail access are major competitive disadvantages for cargo handling activities, including containers, automobiles, break-bulk steel, fruit, and project cargoes. The study found that these markets should be given the lowest priority. Rail System Description The Northwestern Pacific Railroad (NWP) was acquired by the North Coast Railroad Authority (NCRA) through two financial transactions in 1992 and The NWP line and its branch lines North of Willits (Eel River Division) were purchased with State funds in The NWP line South of Willits (Russian River Division) was purchased with federal funds in Until the time operations ceased in 1998, the NWP provided freight service three days a week and occasional excursion passenger service on weekends and holidays. The service operated from Korblex South to Ignacio and east to Schellville and Lombard. The main line extends approximately 280 miles from Samoa to the national rail interchange South of Napa. From Eureka, the Korbel branch extends 11.5 miles north through Arcata to Korblex, where it connects with the Arcata and Mad River branch (A&MR). The A&MR branch extends seven miles to a point near Korbel the rails and ties on this route were salvaged in late The Samoa branch runs from Arcata south along the coast for 10.4 miles to Fairhaven. From Alton, 21.4 miles south of Eureka, a branch extends five miles to Carlotta. Principal freight for the railroad was lumber moving to California and Arizona markets. Additional traffic included dairy products, fish products and aggregates. When the line operated, there was some inbound traffic of coke and calcified lime used in paper production. Rail traffic had declined substantially in the last years of operation, mostly due to lower timber production. As a result of a November 25, 1998, Federal Railroad Administration (FRA) Emergency Order (Order No. 21), the NCRA was ordered to cease all railroad operations until safety repairs could be completed to the satisfaction of the FRA. Since that time, the NCRA has taken part in railroad rehabilitation programs made available by Caltrans and the California Transportation Commission, and committed over $37 million toward infrastructure improvements on the Russian River Division RTP Page GM-7 Goods Movement Element

175 2008 RTP Page GM-8 Goods Movement Element
176 This $37 million is part of the $60 million made available in 2000 under the Transportation Congestion Relief program initiated by the Gray Davis administration for railbed rehabilitation. The Federal Emergency Management Agency (FEMA) provided $7.9 in 2005 for moveable ridge repairs, rail repair equipment, and to update the Capital Assessment Report for the Russian River Division. $690,000 in TCRP funds were used in to repair 300 yards of the rail levee near King Salmon. While these monies have improved the NCRA system, little of the money has actually been invested within the HCAOG Regional Transportation Planning Area. NEEDS ASSESSMENT Overview Because the highways and local roads currently accommodate all goods movement through Humboldt County, State highway system improvement is a primary need for improving goods movement in Humboldt County. Large trucks cause traffic congestion and wear and tear on local streets. Currently, conditions on certain sections of US 101 and SR 299 (viz., Richardson Grove and Buckhorn Summit) limit the length of trucks that are able to enter and leave Humboldt County. Improvements to these roadway sections will improve the efficiency with which trucks are able to travel into, within and out of the County. Humboldt Bay s transportation competitiveness is limited by a number of economic and geographic conditions that do not constrain other potentially competing ports, including the area s relative remoteness and rugged topography. In terms of rail transport, the Northwestern Pacific Railroad line, which formerly served Humboldt Bay, has been out of service since 1998 after the line washed out at several points in the Eel River canyon due to three successive years and El Nino Storms. The line was closed by Federal Railroad Authority in Since that time the North Coast Railroad Authority (NCRA), the current owner of the line, has pursued state and federal funding and support for restoring service on the line. While the NCRA has made progress in restoring service on the south end (Russian River Division) of the 300-mile line, reopening the line north of Willits (Eel River Division) depends on the availability of funds, a number of agency and environmental approvals, and stabilization of the line through highly unstable geological materials throughout the Eel River Canyon. Humboldt Bay s competitive range by truck is also limited. The 2003 Harbor Revitalization Plan identifies a truck-competitive hinterland that includes a relatively small area bounded approximately by Medford and Klamath Falls, Oregon, on the north, Redding on the west, and Willits on the south. Beyond that area, truck shipping rates are generally lower to competing ports. Truck competitiveness to and from Humboldt Bay is further limited by truck length restrictions that do not apply at competing ports. Intermodal facility development is an important future need. Improving the transitions such as ship to rail or truck to ship for goods movement requires both coordinated scheduling and appropriate facilities. There are currently several intermodal facilities operating in the County, including the Schneider Dock and Intermodal Facility on Humboldt Bay. The goods movement 2008 RTP Page GM-9 Goods Movement Element
177 system could be further improved through the provision of an alternative to heavy trucks for moving freight and goods. Potential products that could be diverted to rail are bulk products, such as sand, gravel, cement and other extracted minerals, and timber products, although that industry has declined in recent years. If rail freight service is restored, the opportunities for developing functional intermodal facilities will require more urgent attention. Highway, Maritime and Rail Transport Linkages The Humboldt Bay Harbor, Recreation and Conservation District supports the goal of modernizing Humboldt Bay port facilities and the road and rail connections and services to support the creation of local jobs and to strengthen the local economy. Reductions in truck travel times between Redding and the Humboldt Bay region via SR 299 are crucial to reaching this goal. The District believes the Port of Humboldt Bay could become competitive with the Port of Sacramento for the export of agricultural products and minerals to the northern California Central Valley and Sierra Foothill region if truck travel times could be reduced. However, the District also recognizes that in order to make significant improvements to SR 299, there needs to be a demonstration of sufficient traffic and market potential to justify the major costs of improving the highway. Another project that could benefit is the development of a port-rail marine terminal facility with improved highway access. This would improve intra- and inter-regional goods movement, and improve the competitiveness of the region s intermodal systems. Washington Street in Eureka has been designated as a route of intermodal significance because of its rail, port, highway and pipeline accessibility. These issues are discussed more fully below. Truck Transportation Needs Assessment Truck transportation is a major component of many industries doing business in Humboldt County and the north coast. The timber industry annually trucks millions of board feet of wood products harvested in Del Norte, Humboldt and Mendocino counties. Trucking operations rely on a sizable transportation system of state and county roads. State and county governments allocate significant resources to maintain roadways. The State of California allocates over $2 million annually to maintain and repair the roadbeds in the north coast counties. Humboldt County receives approximately $2,833 per mile each year from state gas tax funds to maintain the county road system. A portion of the necessary financing is obtained from the U.S. Forest Service through the sale of National Forest timber. The balance of the road maintenance and repair financing must come primarily from a county road tax on property in unincorporated areas, traffic fines, and in-lieu taxes. Because truck traffic causes more rapid and severe deterioration of the roads compared to other vehicular traffic, there are concerns regarding equitable cost sharing for road repair and maintenance. It has been recommended that generation of additional funds from both increased weight fees and additional timber taxes is needed to make cost sharing more equitable. Cooperative efforts are needed between the trucking industry, Humboldt County, and Caltrans to assess the impacts that trucks have on the roadway network, and to create regulatory guidelines 2008 RTP Page GM-10 Goods Movement Element
178 for truck travel, such as designated truck routes. Trucks should not be permitted on facilities that are not designed or constructed for heavy vehicles if there are alternatives. In Humboldt County, a major portion of truck traffic is from timber industry operations. Humboldt County s road system provides the collector road and rural access function between the forest (point of harvest), local roads, and the state highways. County roads vary from four-lane, paved expressways to one-lane, untreated, narrow, winding roads. Many county roads used for trucking timber are not designed for heavy truckloads, and the structural condition of these roads is deteriorating. Many of the existing bridges and other structures also require additional structural support to handle the heavy loads. In general, truck operations do not cause traffic congestion within Humboldt County. The major exception is on US 101 along Eureka's retail and commercial area. This portion of the highway is used for through travel as well as access to local stores and businesses. Due to this roadway s mixed use, heavy timber industry trucks can cause incompatible noise and vibration, as well as hazardous conditions for pedestrians and local crossing traffic. The county and cities expend significant transportation funds to repair and maintain roadways used by timber trucks. For example, the estimated cost to maintain and repair the roads used during a sustained logging operation is $9,000 per mile. The primary arterials used by the timber industry are US 101 and SR 299. These major state highways provide adequate facilities and levels of service, except during summer months when congestion is highest due to recreational travel. Other state routes experiencing truck volumes include SRs 36, 169, 200, 211, 254, 255, 271 and 283. Timber industry representatives have indicated that making US 101 a four-lane facility south towards San Francisco and north to Crescent City would benefit the industry. Such improvements would provide cost savings to the industry by reducing congestion and travel times. In addition, the industry could use longer trailers to help cut transportation costs. These savings will have to be quantified to determine whether they are significant enough, when coupled with other factors such as safety and operational concerns, to warrant highway expansion. Truck Length A significant issue concerns the trucking industry s use of longer trailers (53 to 56 feet) to help cut costs and improve efficiency. California currently allows trucks with 53-foot trailers to operate on the National Network and terminal access routes throughout most of the state. Trucking companies operating trucks with two 28-foot trailers are carrying about the same capacity as a 53-foot trailer but their operating costs are much higher. Longer vehicle lengths require significant roadway improvements, including lane widths and curve radii. The industry has expressed concern about the limitations imposed by narrow lanes and sharp curves on portions of US 101 and SR 299. The industry is concerned that these roadway segments do not safely accommodate the longer vehicles RTP Page GM-11 Goods Movement Element
 is served by truck routes meeting federal interstate truck length guidelines.")
179 Humboldt County has truck restrictions on all state highways serving the county. No portion of Humboldt County (or Trinity County) is served by truck routes meeting federal interstate truck length guidelines. In addition, truck routes in all directions to and from Humboldt Bay currently do not meet California legal truck length requirements, which allow a king-pin-to-rear-axle (KPRA) length on semi-trailers of up to 40 feet. Advisory routes at three locations limit KPRA length in and out of Humboldt Bay to 32 feet or less: on CA 299 to the east at Buckhorn Summit, to the south on US 101 at Richardson Grove, and to the north on US 101 nine miles north of Trinidad. Livestock trucks have an exemption that allows for total truck length of 70 feet with a KPRA of 43 feet. Truck length restrictions and backhaul opportunities in Humboldt County are preventing businesses from being profitable and competitive with other similar business along the West Coast. Truck manufacturers are not phasing out the 28-foot trailer, but economics are driving the industry toward the longer trailers. Since most of the beef grown in Northern California is shipped out-of-state, North Coast ranchers need to use out-of-state trailers to move their product. Stakeholders have noted that truck length restrictions effectively result in an increase in the number of trucks they are forced to run in and out of the County. Truck length restrictions prevent the North Coast livestock industry from utilizing 43-foot trailers to haul cattle. The Humboldt County planning division, with Caltrans, has been exploring alternatives for safely providing larger truck and multimodal access US 101 through 2008 RTP Page GM-12 Goods Movement Element
180 Richardson Grove State Park, while improving overall transportation for all modes, and goods movement access to Humboldt County. Potential improvements include operational fixes (curve correction procedures) and added road-width capacity. Possible improvements to Richardson's Grove follow a series of roadway improvements that have sought to accommodate semi-trailer travel through the region. HCAOG and other planning agencies have participated in planning efforts to identify and prioritize appropriate SR 299 State Transportation Improvement Program (STIP)-funded improvements. These efforts concluded that improvements to the east side of the Buckhorn grade provided the greatest travel-time reduction, and greatest benefit to the SR 299 corridor. This project was also determined to be the most expensive and difficult to program. The counties of Humboldt, Shasta, and Trinity, along with Caltrans Districts 1 and 2 have participated in funding the environmental component of the SR 299 Buckhorn Grade improvement project. Maritime Needs Assessment The 2003 Harbor Revitalization Plan focused on establishing a new and sustainable maritime focus for the Harbor. The strategy involved two phases, channel deepening and landside improvement. With the completion of the Channel Deepening Project in 2000, the focus of the Harbor Revitalization Plan became the marine facilities, landside access, diversification opportunities, and the associated economic development and marketing of the Port. Non-rail-dependent opportunities for the Port include: (1) project cargo; (2) local bulk cargo; (3) cruise market; and (4) container-on-barge. Items #1-3 currently offer greater prospects than the container on-barge service, which at present has smaller cargo volumes and must compete with truck service between Oakland and Humboldt Bay. Container-on-barge service may become more viable in the future if the cost of trucking increases due to environmental regulations and highway congestion issues, including new and enforceable future regulations to limit truck emissions, and if companies interested in developing barge service can overcome high stevedoring costs at the Port of Oakland and access to a suitable terminal in the Oakland area. The development of a facility that could more efficiently transfer containers from barges at the Port of Humboldt Bay (using, e.g., roll-on/roll-off, or roro, barges) would facilitate the greater use of container-on-barge for goods movement into and out of Humboldt County relative to other approaches, in part by reducing stevedoring costs here and in other port (e.g., Oakland) by upwards of 50-75%. A number of longer-term industry trends may support the need for investment in new terminal capacity on the U.S. West Coast over the next decade and beyond, which may create opportunities for secondary ports to expand their market presence. The container shipping industry is expected to face West Coast port capacity constraints in the period. As major West Coast container ports seek new container terminal capacity within their property boundaries, they may replace existing automotive terminals with container terminal operations, which typically generate higher cargo density per acre and higher lease revenues for the port authority. Automotive terminal operators are likely to seek new terminal sites at secondary ports along the West Coast RTP Page GM-13 Goods Movement Element
181 Other cargo sectors breakbulk and bulk may also seek new terminal facilities at secondary ports due to the difficulty of securing land at the major ports. Secondary ports will have to offer good rail and highway connections to population centers on the West Coast and further inland. Environmental constraints (pollution, traffic congestion) at the major West Coast ports are expected to support interest in the development of secondary ports and new port locations to accommodate the long-term growth of cargo flows over the West Coast. The private sector (terminal operators, investment funds, etc.) is showing greater interest in the development, management and operation of transportation infrastructure including ports, railroads and warehousing. This participation can take different forms including full private sector control and public-private partnerships. Historically, forest products have been the highest volume commodity passing through Humboldt Bay. The export demand for forest products has fluctuated over the years, having been affected by governmental regulations, market fluctuations, and construction activity levels. Shipped commodities entering Humboldt Bay include petroleum products (gasoline and fuel oil), wood chips, and logs. In 2006, the State of California released a report titled, Goods Movement Action Plan Phase II Progress Report: Draft Framework for Action. The Plan includes a discussion of underutilized Port facilities, and looked at a solution for integrating the Port of Humboldt into the State system, to tap local infrastructure and services. In addition, the Plan provides a statewide action plan for goods movement capacity expansion, goods movement-related public health and environmental impact mitigation and community impact mitigation, and goods movementrelated security and public safety enhancements. The Port of Humboldt Bay Board requested that the report include two Northern Gateway projects to the short list of infrastructure improvements: (1) the reestablishment of freight rail service on the State-owned NCRA rail line from the Port of Humboldt Bay to the national rail system; and (2) the modernization of the Redwood Dock Marine Terminal to facilitate short-sea shipping between the Port of Humboldt and the Port of Oakland, accommodate and respond to goods movement shipping demands at the Harbor District s publicly-owned marine terminal in Humboldt Bay, and support national and international investment in and around the Port of Humboldt Bay. The Port of Humboldt Bay has a variety of port assets and services that are presently underutilized and available to the State. It is currently the major underutilized deepwater harbor in the State of California. The integration of the Port into the State system and utilization of port services and assets could provide substantial goods movement alternatives and additional capacity for the State of California. The marine transport of goods has been affected by changes in the shipping industry. Larger deep-draft vessels are becoming more common for moving cargo along Pacific Ocean shipping lanes. These vessels have higher cargo capacities and also require deeper and wider channels and turning basins. The Army Corps of Engineers assessed the feasibility of deepening and widening of Humboldt Bay in a study completed in The study found navigation concerns in two areas: safety and efficiency, including that the North Bay Channel depths did not allow for the efficient movement of deep draft vessel commerce, and that deep draft vessels that call at Humboldt have vessel design drafts that were constrained by the existing channel depths RTP Page GM-14 Goods Movement Element
182 To address the concerns from the study, the deepening of Humboldt Bay channels, to accommodate deeper draft vessels, was accomplished in 2000 through an agreement between the U.S. Army Corps of Engineers and the Humboldt Bay Harbor District. The bar and entrance channels were deepened from a depth of -42 MLLW to a depth of -48 feet, and the North Bay and Samoa Channels were deepened from a depth of -35 MLLW to a depth of -38 feet. Rail Needs Assessment In Humboldt County, almost 100% of goods, raw resources, and agricultural products move by trucks (of all kinds) on the same roadways that carry passenger automobiles. Trucks can cause physical damage to roadways and impede the flow of traffic. A freight railroad could help relieve these concerns. With suitable economic conditions, a freight railroad could also help timber and other extractive industries remain competitive. The railroad s ability to offer reliable service depends largely on the condition of the track and roadbed, and the availability of stations. Currently, there are six inactive stations at Willits, Ukiah, Scotia, Fort Seward, Calpella and Laughlin. A considerable program of roadbed, track, bridge, tunnel and station upgrading will be necessary if operations and competitiveness are to be restarted and/or improved. The NCRA has started rehabilitation work in order to lift the closure and re-open the line south of Willits to Lombard. The work currently underway on the Russian River Division is expected to cost from $50 to $60 million. The cost for repairs North of Willits through the Eel River Canyon to Samoa cannot be determined until a mapping survey, geotechnical study and EIR for the Eel River Division are completed. The NCRA released the Capital Assessment Report-Russian River Division report in November of The report is a comprehensive condition assessment of the railroad from Lombard to Willits. The updated report provides recommendations for improvements and processes to reopen the railroad, details capital repairs, deferred maintenance, storm water repairs, and related environmental requirements to reopen the railroad. Subsequently, in March 2006, the NCRA released a Strategic Plan and Progress Report; this plan was updated in February The Strategic Plan has been refined to reflect available funds and the requirement to have completely operable segments to attract and support an operator. The Strategic Plan calls for an eventual reopening of the entire line from Lombard to Arcata/Samoa. In order to maximize funding sources and begin construction, the construction is expected to be phased based on a strategy of opening operable segments that produce a positive return on investment to an operator. The first phase of construction is the Russian River Division from Lombard to Windsor. This reopening will be based on the market demand for rail service, the existing condition of the line, the ability of NCRA to team with Sonoma Marin Area Rail Transit (SMART), and the ability to work within NCRA s right-of-way to restore service. Repair of the NWP line North of Willits through the Eel River Canyon and from South Fork to Samoa will require a separate EIR for Eel River Division which is currently underway. Trucking lumber on US 101 to Willits and then transloading onto rail cars showed a significant increase in cost of shipping lumber by truck versus shipping by rail from Eureka. The Union 2008 RTP Page GM-15 Goods Movement Element
183 Pacific Railroad (UP) subsidizes a large percentage of the trucking transload cost to prevent this traffic from staying on trucks to its final destination. With the UP subsidy, the net cost to transport lumber from Eureka to Suisun via the US 101 corridor is an additional $200 per railcar over the existing rail rate. The truck rate between Eureka and Redding via SR 299 is an additional $350 per railcar higher than the Willits rate. However, the Union Pacific (UP) does not have to share revenue with the NCRA or the California Northern Railroad (CNR) for transportation to their rail connection in Suisun. The result is the savings in shortline revenue sharing offsets their subsidy for the transload cost. Therefore it is more economical for UP to maintain a transload in Redding than to subsidize a transload in Willits. The UP can control where the transload site is by adjusting the subsidy rate. To ensure the majority of lumber trucks go to Redding, UP subsidizes the trucking cost so they are approximately $100 per carload less than the Willits transload rate. Several lumber companies are using the Redding reload and will continue to do so as long as the rate remains lower than the Willits rate. Although UP has given assurances they will try to keep the Willits transload competitive, the benefits of a Redding transload for UP will always ensure that Redding transload rate will stay low enough to cause the majority of the lumber traffic to move on SR 299 to Redding. Caltrans conducted a telephone survey of the five largest lumber companies in Humboldt County to determine if the companies would use a transload site in Willits to support the NCRA. Four companies all stated they prefer having a rail connection in Eureka, but would support a Willits transload provided it did not significantly increase their transportation costs. One lumber company said they would not accept an increase in transportation costs. Their response indicated they are trucking all of their lumber to Redding and will continue to do so until rail service returns to Eureka. Fifty percent of the flakeboard produced in Humboldt County goes to markets outside of California. The most economical way to move this lumber is by rail service. For California Redwood, sixty to seventy percent is shipped outside of California. Most of these shipments would potentially go by rail if the NCRA could provide reliable service. Lumber mills must truck their lumber to Redding to remain competitive. The only way to prevent a significant increase in truck traffic on SR 299 would be to continue providing rail service to Humboldt County. Another existing need is solid waste removal. Humboldt County s landfill has already reached capacity, while Mendocino County estimates its landfill will reach capacity soon. The most economically feasible way to export waste is by rail. It is estimated that new waste traffic on the NCRA would increase transloadings by 25 percent and provide approximately $1 million in additional revenue per year. The waste traffic would offer a steady, year-round source of revenue that will only increase as the population of the north coast continues to grow. The rail system will also have the capability to handle backhaul movements for export traffic through the Port of Humboldt Bay. The backhaul operation could generate an additional $1.5 million in revenue to the County. The alternative would be to set up a transload point at Willits. If a transload were set up at Willits, the cost of hauling garbage by truck to Willits from Eureka 2008 RTP Page GM-16 Goods Movement Element
184 would increase transportation costs to the Counties by $18 to $20 per ton or $1.2 to $2 million per year in addition to the 9,000 truck movements per year on US 101. The survey and analysis by Caltrans shows a railroad alternative that has the potential to be selfsustaining if properly managed and if sufficient public funding is provided for the rehabilitation of the railroad. Many lumber shippers stated in their survey they would ship more lumber by rail if the service were reliable. During the wet winter months, many customers pay the additional cost of a truck transload so they can guarantee their lumber shipments will be delivered on time. With the necessary capital improvements in place and the ability to restore service in a minimum amount of time, the NCRA would be able to attract year-round shipping contracts. A study commissioned by the HBHRCD shows that shipments of 10,000-30,000 carloads of aggregate every year may be necessary to sustain a profitable railroad (see figure below). The study also noted problems with shipping containers or automobiles because of the Port s distance from population centers and markets and the cost of trans-shipping goods RTP Page GM-17 Goods Movement Element
185 GUIDING GOALS, POLICIES, AND OBJECTIVES The goods movement goals, policies, and objectives present here address the economic implications of policy decisions that affect goods movement, and point to appropriate investment strategies and policies for improving regional goods movement. Goals: Truck, marine, air and rail transport systems suitable for the continuous, efficient and cost-effective flow of goods in and out of Humboldt County. A stable, reliable, integrated freight/goods movement system that utilizes roadway, marine, aviation and rail facilities and includes strategically placed intermodal transfer facilities. A fully operational and environmentally compatible Marine transportation system connecting the Port of Humboldt Bay to interregional, state, national and international markets with safe and efficient access for freight movement, integration with truck, aviation and (potential) future rail freight service by the strategic use of intermodal transfer facilities. Policy GM-1: Encourage a goods movement strategy that is developed as a joint effort between private business, airport management, NCRA, Humboldt Bay Harbor District, Caltrans District 1, county and city Governments. Objective: Support the development of a Redwood Trade Corridor Coalition made up of representatives of private business, airport management, NCRA, Humboldt Bay Harbor District, Caltrans District 1, county and city Governments along the Redwood Trade Corridor from Humboldt Bay to interstate road and rail connections in the north San Francisco Bay area. Policy GM-2: Promote balanced growth in truck, marine, air and rail transport of goods, and multiple uses of transportation corridors. Objective: Monitor and evaluate goods movement volumes and support efforts by goods movement industries to interconnect modes and maximize use of transportation corridors. Policy GM-3: Continue to support state highway and local road projects that aid goods movement by improving intermodal connectivity and mobility within the region. Objective: Provide planning and programming support for the development and construction of state highway and local road projects that will aid goods movement throughout the region and improve intermodal connectivity (e.g., access to the port). Policy GM-4: Support existing commercial truck weight fees and timber taxes. Objective: Maintain and reconstruct city and county (rural) truck routes with proportional revenues from commercial truck fees RTP Page GM-18 Goods Movement Element
186 Policy GM-5: Promote truck route improvements. Objective: Support roadway improvements for commercial vehicle access, and conduct further studies to determine trucking industry needs and options to eliminate barriers to freight movement, and to improve safety along truck routes. Policy GM-6: With other stakeholders, coordinate economic development activities identified by the Harbor Revitalization Plan and the Redwood Marine Terminal Feasibility Study. Objective: Help coordinate and develop economic development activities that support and develop goods movement opportunities and facilities in the Port of Humboldt Bay. Policy GM-7: Support dredging when it serves water-dependent uses (goods movement) or will enhance navigational safety. Objective: Ensure that Humboldt Bay maintains a sufficient depth to support the transit of deepdraft vessels for goods movement and passenger service. Policy GM-8: Support Harbor District efforts to improve port facilities. Objective: Improve Humboldt Bay port facilities, including public and private docks and petroleum terminals, modernization of the Redwood Marine Terminal and Fields Landing Marine Terminal, as important intermodal facilities that should be maintained. Encourage Harbor District to develop a harbor marketing plan. Objective: Coordinate economic development activities with harbor marketing plan developed by the Harbor District. Policy GM-9: Identify and protect harbor-related land uses in Humboldt Bay. Objective: Assist local, regional, and state agencies in identifying and protecting harbor-related land uses in Humboldt Bay, and in developing increased institutional capability in the planning, regulatory, and development programs related to such uses. Policy GM-10: Assist in removing potential constraints for marine-dependent or coastaldependent land uses. Objective: Remove potential constraints for marine-dependent or coastal-dependent land uses along the Samoa Peninsula, Fields Landing Channel, Eureka shorelines, and other harborrelated areas. Objective: Remove potential constraints for marine-dependent or coastal-dependent land uses along harbor-related parcels in the South Bay RTP Page GM-19 Goods Movement Element
187 Policy GM-11: Support increases in energy efficiency and the reduction of energy consumption across the goods movement system. Objective: develop cost-effective and environment-enhancing programs to reduce overall energy use in the goods movement system through sound energy management practices (energy efficiency and conservation, use of alternative energy sources). Policy GM-12: Work with other stakeholders to improve the public health and air quality impacts of the goods movement system. Objective: With NCUAQMD and other stakeholders, identify sources and reduce pollutant emissions of NOx, PM, SOx, sulfate, VOC, and other identified pollutants. Policy GM-13: Continue to support the restoration and implementation of freight and passenger rail. Objective: Support and encourage the NCRA s efforts to re-establish economically viable, environmentally compatible freight and passenger rail services in and out of Humboldt County. Support NCRA efforts to include their lines in the California State Rail Plan, for federal rehabilitation and new facility construction fund eligibility. ACTION PLAN: PROPOSED PROJECTS Goods Movement The trucking industry will benefit through HCAOG s support of improvements to the State highway and local roadway systems. For marine and rail facilities, HCAOG has the opportunity to provide both guidance and support. Public transit and the roadway system that provides access to rail stations and terminals are within the discretionary authority of the Board. The movement of freight/goods/raw resources using trucks and the roadway/highway is subject to the regulation of the state vehicle code, the Interstate Commerce Commission (ICC) and the market place. Short- and long-range projects supported by HCAOG for all modes are listed below. Richardson Grove Realignment Project At the south Humboldt County line, Highway 101 runs through Richardson Grove State Park. The narrow roadway and small curve radii along a 1.1-mile stretch of roadway that winds through the Grove limit the length of trucks that can pass through. Caltrans has developed a proposal to realign the roadway in order to remove the pinch points and the existing restrictions on STAA trucks. The Richardson Grove realignment project includes the following: minor realignment to accommodate STAA truck access two 12 travel lanes and two paved shoulders a retaining wall at the north end of the project pavement overlay 2008 RTP Page GM-20 Goods Movement Element

188 culvert extension where needed Improvements to the east side of the Buckhorn grade have been identified by various studies as potentially providing the greatest travel time reduction and benefit to truck transport to and from Humboldt Bay on SR 299 corridor; however, this project would be expensive and require major environmental reviews. CalTrans has considered approximately $120 million in Buckhorn Summit improvements that would remove the Advisory Route restrictions and allow California legal truck lengths connecting to I-5 at Redding; additional improvements at about six locations along SR 299 would raise the route to Federal interstate STAA standards. Maritime Redwood Marine Terminal Feasibility Study In February 2008 the Harbor Commission released the results of a feasibility study (conducted by TranSystems and SHN Consulting Engineers) of the best uses of the Harbor s Redwood Marine Terminal asset. Tasks 1 and 2 of the feasibility study assessed the physical condition of the existing Redwood Terminal to determine capability of the site to support expanded operations, and assessed current and potential cargo flows in the breakbulk, bulk, container and cruise sectors. Briefly, Task 1 found that the Redwood Marine Terminal has sufficient land acreage and waterfront property to support development of modern cargo terminal operations, but the terminal infrastructure requires modernization. Task 2 presented two market strategies based on short- to medium-term development, and medium- to long-term development. The Task 3 report is divided into two elements to match the two market strategies identified in Task 2. Recommendations for these strategies were made in Task 4 and presented as Options A and B, with Option A based on the short- to medium-term opportunities identified, and Option B 2008 RTP Page GM-21 Goods Movement Element
189 positioning Humboldt Bay to compete for shipping community investment in secondary ports. Option B is contingent on the availability of a rail corridor between Humboldt Bay and the transcontinental rail system. In February 2008, the Harbor District Commissioners voted to support Option B and the development of the Redwood Marine Terminal facility into an amenity that can handle container ships, bulk and breakbulk ships, cruise ships and barges with the ultimate goal of connecting with a restored rail system. To compete effectively with other secondary ports and potential new port locations for investment, the Harbor District would need to pursue the following market strategy: Commit to a sustained multi-year effort to market the Redwood Marine Terminal given that terminal projects, including competing for investment, can take upwards of 10 years from concept to completion. Raise the industry profile of Humboldt Bay amongst the cargo shipping industry (terminal operators, shipping lines, shippers, etc.). Fully evaluate the rail corridor, including cost of construction to meet standards for intermodal rail service and environmental impacts. Option B foresees the short-term development of a single multipurpose berth that is suitable for multipurpose cargo ships, cruise ships and barges, and designed to be integrated into potential larger, longer-term terminal development. The initial cost of development is $32 to $38 million. To achieve the longer-term goals, Option B recommends the development and implementation of a marketing plan for major terminal development, and for discussions with shipping lines, terminal operators, shippers of cargo, and major national railroads. Other recommendations include: pursuing a coordinated development strategy with the State agency that manages the rail corridor, investigating environmental requirements and permits needed to extend the turning basin and dredge at the berth should there be market and shipping line demand, and conducting further vessel simulation exercises for specific large commercial cargo and cruise vessels to support development of appropriate cost and construction requirements. The availability of rail service is critical for the success of Option B and this strategy for longterm Port development. The Harbor District has been working with NCRA on the Northern Freight Corridor Restoration Project, which aims to position the Port of Humboldt Bay for growth by providing essential port and rail infrastructure. The Project seeks to reduce shoaling in Humboldt Bay (enhancing navigation efficiency and safety), and rehabilitate the Northern Corridor of the NWP railroad from the Port of Humboldt Bay to South Fork. Following rehabilitation of the rail infrastructure envisioned and funded in part by this Project, NWP would operate a separate short-line railroad on the Northern Corridor of the NWP line, extending from South Fork to Samoa. Traffic will be general freight from the Northern Corridor that will be transferred from rail to barge at a transload facility within the Port of Humboldt Bay. This Project would also provide the potential to attract additional traffic to the NWP rail service 2008 RTP Page GM-22 Goods Movement Element
190 in the South Fork-Samoa area, including the movement of additional traffic that would both originate and terminate on this line segment, and the movement of inbound traffic moving through the Port of Humboldt Bay; however, the amount of this traffic has not been quantified at this time. Moreover, the Project would also provide the potential to operate excursion passenger train service within the Northern Corridor. In January 2008 an unsuccessful application for $ million for the Northern Freight Corridor Restoration Project was submitted by the Harbor District and NCRA to the CTC s Trade Corridors Improvement Fund (TCIF). Ongoing Projects The following summary lists the current status of several Humboldt Bay Harbor, Recreation and Conservation District projects. Additional information on these projects can be found in the Harbor District's Five-Year Strategic Plan ( ), Harbor Revitalization Plan (2003) and Redwood Marine Terminal Feasibility Study (2008). 1. Harbor Deepening Project: The Humboldt Bay deepening project for the Bar and Entrance Channels (from -40' to -48' MLLW), and the North Bay and Samoa Channels (from -35' to -38' MLLW) was completed in April Maintenance Dredging: The Harbor District continues to work with the Army Corps of Engineers on maintenance dredging of Humboldt Bay Channels and entrance. 3. Long Term Sediment Management: The Harbor District continues to work with the Army Corps of Engineers and State of California to fund and complete a long term sediment management program that is intended to develop and implement sediment reduction strategies aimed at reducing dangerous winter shoaling at Humboldt Bay s entrance. 4. Fields Landing Channel: The proposed modernization of the Fields Landing Channel, by deepening it from the currently authorized -26' MLLW to -35/ MLLW, was identified as a federal cost share project in the Water Resources Development Act of 1999, by the US Congress. 5. Humboldt Bay Management Plan: The Harbor District continues to work on the implementation of the policies adopted in the Humboldt Bay Management Plan. 6. Redwood Marine Terminal Modernization: A project to establish a multi-purpose, publicly-owned marine terminal with two berths that would be available for cruise ships, cargo ships, visiting Naval vessels and seasonal or overflow commercial fishing activities. The Redwood Marine Terminal Feasibility study was completed in February The District s consultants are presently completing the business plan for the selected terminal development option. The business plan is expected to be completed by summer Rail Rail transportation can be a vital component of the region s balanced multi-modal transportation system. Restoring the line and striving for an acceptable level of service to the region continues to be a long-range goal. Long-term future projects will complete the stabilization required to restore disaster eligibility for the entire line and will require the acquisition of substantial additional funding. The scope, schedule and costs will be determined in the future RTP Page GM-23 Goods Movement Element
191 Short term Projects Northwestern Pacific Railroad Reopening. NCRA has adopted a policy of reopening the entire Northwestern Pacific Railroad Line from Lombard to Arcata/Samoa. The cost for rehabilitation of the line cannot be estimated until aerial mapping, a geotechnical study, and an EIR/EIS are final. The first phase of construction has been identified as the Russian River Division Phase 1 from Lombard to Windsor based on the market demand for rail service, the existing condition of the line, the ability to team with SMART, and the ability to work within NCRA s right-of-way to restore a prior-existing service. Future construction phasing will be based on several factors including market demand for rail, environmental clearance, and availability of funding. However, the current plan, once the Russian River Division Phase 1 is completed, is to move forward with the Russian River Division Phase 2, then the Canyon, and finally the North-End. Depending on funding and environmental clearance it is likely that repairs to the North End between South Fork and Samoa will commence prior to any rehabilitation work in the Eel River Canyon. Russian River Division Phase 1 (Lombard to Windsor). NCRA proposes to use TCRP funds to open Phase 1 of the Russian River Division, Lombard to Windsor, to class 3 (annual operating revenue of less than $10 million (1978 dollars)). This would allow NCRA s operator the ability to serve several shippers that have expressed interest in using rail and provide Sonoma County with an economical out-haul alternative for their waste. The items listed below summarize the major work elements required for the Lombard to Windsor Project. These items are further described in the 2005 Capital Assessment Report and rehabilitation plans. Canyon EIR/EIS. The processing of the EIR/EIS document and associated preliminary engineering is the critical path to reopening NCRA's rail line from Willits north. Due primarily to the nature of the project, the complexities of the processes, and the extent of public disagreements as to the physical effects of the proposed project, NCRA, as lead agency, has proposed to prepare and process a combined document (CEQA/NEPA) that involves facility upgrades, landslide stabilization and reopening of the line from Willits to South Fork. In order to prepare an EIR/EIS, several items must be defined: project scope, design features, and costs including mitigation. Therefore, NCRA proposes to begin this work immediately to allow ample time to address issues, yet be consistent with its obligation to rehabilitate the line in a timely manner for its Operator. Operator Lease Status. The NCRA Board approved the Lease Agreement with its new operator, NWP Company, at its September 13, 2006 Board meeting contingent on obtaining necessary consents from Sonoma Marin Rail Transit (SMART) together with other relevant actions, NCRA and NWP executing an equipment lease for equipment being transferred to NWP, NCRA compliance with CEQA, and obtaining necessary approvals or making appropriate notifications concerning the Private Activity Tax Rules related to property acquired with Proposition 116 Bond funds RTP Page GM-24 Goods Movement Element
192 NWP Co. supports the NCRA s decision to reopen the Phase 1 of the Russian River Division, and believes a modest profit will result with or without the Sonoma County waste haul. Both NWP Co. and NCRA agree that the $25 million plan will provide a fully operational and dependable freight railroad to Windsor, and that this initial reopening will be a stepping stone to successfully and profitably reopening the full Russian River Division and the entire line once the cumulative effects are investigated and the Canyon is environmentally cleared. Long Term Projects Rail transportation continues to be a vital component of the region s balanced multi-modal transportation system. The emphasis of rehabilitating the line and striving for an acceptable level of service to the region continues to be a long-range goal for Humboldt County. The California Northern Freight Corridor Restoration Project is divided into a rail and navigation component, and would: 1. Restore competitive and cost-efficient rail service between South Fork and Samoa, NWP s Northern Corridor. 2. Enhance navigation efficiency and safety at the Port of Humboldt Bay. 3. Create velocity of rail freight movements in the Northern Corridor where no rail service now exists. 4. Relieve congestion on the region s roadways and reduce vehicular air emissions, both in California and in the Northern Corridor in particular. 5. Provide jobs and generate beneficial economic impacts in the Northern Corridor through Port and railroad activities. The goal of the Northern Freight Corridor Restoration Project is to provide an improved Port and freight rail system. The proposed improvements would enhance a freight movement system that is significantly under-utilized and increase freight mobility for an area that currently is not serviced by rail. FINANCING The financial plans and funding sources for the implementation of truck-related freight/goods movement and development of intermodal facilities are covered in large degree by the financial plans for the Highway and Roadway Transportation System Element. Financing options for maritime are discussed below. Financing for the rail system is not presented as the system is currently not operating RTP Page GM-25 Goods Movement Element
193 Maritime Financing The Harbor District's principal sources of income include Humboldt County property taxes, tideland leases from dock operators and mariculture operations, rents and leases from commercial sources, and the Harbor Improvement Surcharge (a general charge levied on cargo and deep draft vessels using Humboldt Bay's improved navigation channels). The District also utilizes grant funding from various sources to assist in accomplishing its mission. Costs to Operate and Maintain the Current Maritime System The HBHRCD budget for FY 2007/08 includes $3.07 million in revenue, $2.28 million in operating expenses, $1.86 million in nonoperating expenses (capital expenditures, debt payment), and a total shortfall of $.64 million after transfers from fund balance designations for capital expenditures. PERFORMANCE MEASURES Performance measures for freight/goods movement are listed below. Performance Measure Indicator(s) Data Source(s) Safety Improve safety in goods movement at Port facilities. Improve safety in truckrelated goods movement. Construction and repair of breakwaters, sea walls, docks, piers and general maritime facilities. See Highway and Roadway Element. HBHRCD; private industry. Facility Use/Service Demand Increase facility use and demand for Harbor services. Recorded and estimated boat launchings, berthed boat departures and arrivals for commercial purposes from ramps and piers within the Port. HBHRCD; Woodley Island Marina; private industry. Velocity Improve velocity, or the speed of goods delivery. Velocity = distance goods travel per unit of time for goods delivery. A project should be measured on its ability to maximize distance or minimize time. The velocity increase offered by any single infrastructure project is subordinate to the velocity across the entire intermodal supply chain. Private industry sources (e.g., small package carriers) would be needed for studies to assess velocity RTP Page GM-26 Goods Movement Element
194 Performance Measure Indicator(s) Data Source(s) Throughput Increase throughput, or the volume of goods handled by the system. Connectivity Increase connectivity across the goods movement system. Reliability Increase the reliability of the goods movement system. Congestion Reduce congestion for both goods movement and non-goods movement traffic. Funding Identify and commit supplemental non-state funds. Innovative Technology Considers innovative technologies. Overall system capacity. (Throughput = the volume of goods passing a given point in a given period. An infrastructure project that expands overall system capacity increases throughput.) Street and highway capacity (trucks). As goods move from one mode to another (intermodal) there will be variations in velocity and throughput. Better connectivity lends itself to increased reliability, velocity, and throughput systemwide. Variance or consistency in trip time and equipment constraints. See Highway and Roadway Element Projects likely to have higher levels of federal, local, or private supplemental funding should be prioritized. Goods movement projects should be long-lasting improvements and should consider the most promising and the most feasible technological advances. Private industry sources would be needed for studies to assess throughput. Caltrans; County and City public works departments; Greater Eureka Area Travel Model. Studies of system reliability, velocity, and throughput. Private industry sources would be needed for studies to assess throughput. Funding sources and grant-making entities. Industry technology standards. Technology assessment reports RTP Page GM-27 Goods Movement Element
195 Performance Measure Indicator(s) Data Source(s) Energy Efficiency Increases energy efficiency and reduces aggregate energy/fuel consumption across the goods movement system. Change in system-wide aggregate fuel/energy consumption. Goods movement systemwide energy usage data. Public Health and Environmental Impacts Improves Public Health and Mitigates Environmental Impact Total tons of emissions reduced (NOx, PM, SOx, sulfate, VOC), and ambient pollution measurements. NCUAQMD; EIRs; state, county and city sources 2008 RTP Page GM-28 Goods Movement Element
196 REFERENCES Humboldt Bay Recreation and Conservation District Harbor Revitalization Plan. PB Marine. Humboldt Bay Recreation and Conservation District Strategic Plan Humboldt Bay Recreation and Conservation District Humboldt Bay Management Plan. Humboldt Bay Recreation and Conservation District FY 2007/08 Budget. Humboldt Bay Recreation and Conservation District Redwood Marine Feasibility Study. conducted by TranSystems and SHN Consulting Engineers. North Coast Railroad Authority Capital Assessment Report-Russian River Division. Pat Higgins, Humboldt Bay Commissioner. Submitted Comments Personal communication with David Hull, CEO, Humboldt Bay Recreation and Conservation District Personal communication with Mike Wilson, Humboldt Bay Commissioner Personal communication with Mitch Stogner, Executive Director, North Coast Railroad Authority Personal communication with Rob McBeth, O&M Industries Personal communication with Vince Thomas, Sun Valley Group State of California Goods Movement Action Plan Phase II Progress Report: Draft Framework for Action. U. S. Army Corps of Engineers Final Feasibility Report and Environmental Impact Statement/Report for Navigation Improvements RTP Page GM-29 Goods Movement Element
197 TRIBAL TRANSPORTATION ELEMENT The United States Constitution recognizes Native American tribes as separate and independent political communities within U.S. territorial boundaries. In California, Native American lands are usually referred to as Reservations or Rancherias. Tribes create and administer their own laws and operate under their own constitutions. Indian Tribal governments have many of the same priorities and needs as cities and the County that determine the focus of Tribal governments and guide Tribal member efforts and a few important differences (e.g., cultural maintenance, prosperous membership, financial security, infrastructure repair) that distinguish Tribes. There are 109 federally recognized Native American tribes in California. There are eight Native American Reservations and Rancherias in Humboldt County, which are as follows: Bear River Band of Rohnerville Rancheria, Big Lagoon Rancheria, Blue Lake Rancheria, Hoopa Valley Tribe, Karuk Tribe of California, Trinidad Rancheria, Wiyot Tribe, and the Yurok Tribe. The figure on the following page TT-3 depicts the location of the Reservations and Rancherias in Humboldt County. NATIVE AMERICAN COORDINATION AND CONSULTATION The CTC RTP Guidelines require consultation with, and consideration of Indian Tribal Governments interests in the development of regional transportation plans and programs. This includes state and local transportation program funding, for transportation projects which access tribal lands. The Humboldt County Native American Tribes were consulted as part of the 2008 RTP update process. The Tribes were contacted via the Humboldt County Tribal Transportation Commission (HCTTC) meetings, HCAOG TAC meetings and direct correspondence via and phone. At their request, the Tribes were presented with the highway and roads, bicycle and pedestrian facilities, and public transit and paratransit information requests sent to the seven incorporated cities and Humboldt County. Humboldt County Tribes not referenced in this element did not provide information for the 2008 RTP update. It should be noted that Humboldt County Reservations and Rancherias have widely varying land bases for which they are responsible. As a result, the development of transportation systems cannot be viewed as simply a resource management issue, a wildlife urban interface issue, or any sort of narrow issue for all of the Humboldt County Reservations and Rancherias. Each tribe is required to perform its own evaluation of the transportation elements found on each reservation and how to improve those elements for the betterment of their community RTP Page TT-1 Tribal Transportation Element
198 HUMBOLDT COUNTY TRIBAL TRANSPORTATION COMMISSION The HCTTC is comprised of representatives from the Bear River Rancheria, Big Lagoon Rancheria, Blue Lake Rancheria, Hoopa Valley Tribe, Karuk Tribe of California, Trinidad Rancheria, the Wiyot Tribe, the Yurok Tribe, and the Smith River Rancheria in Del Norte County. The HCTTC Mission Statement is as follows: To promote safe and efficient modes of transportation, and to improve transportation, identify transportation needs, and advocate for transportation issues of tribal communities; to collaborate on issues between all of the Native American Tribes; and, to solve problems concerning transportation issues among the tribes. The purpose of the HCTTC is as follows: To actively participate and seek federal, state, and local funding, technical assistance and training. To promote safe and efficient modes of transportation; To act as representative for tribes, as delegated; To assist in federal, state and local transportation planning; To seek opportunities to preserve contemporary and traditional modes and routes of transportation; To raise awareness of tribal transportation issues; To seek funding that does not impact or reduce funding to individual tribes; and To represent Humboldt County tribes transportation issues and priority projects at federal, inter-tribal, tribal, state, and county levels. The HCTTC members work together and partner on transportation issues, share information about transportation programs, funding sources and project delivery, and network on the best approaches to dealing with transportation bureaucracies. The HCTTC has successfully brought together diverse groups that have historically not worked together. HCAOG S ROLE IN TRIBAL TRANSPORTATION Five Humboldt County tribes are represented on the HCAOG TAC. The five tribes are as follows: Blue Lake Rancheria, Hoopa Tribe, Karuk Tribe of California, Trinidad Rancheria, and the Yurok Tribe. For the 2008 STIP programming cycle, funds were allocated for the Hoopa Downtown Enhancement project. Unfortunately, due to the current structure of many funding programs, the Tribes cannot be direct recipients. A tribal project can, however, under many programs, be eligible for funds when another agency - such as a city or county, acts as the project sponsor and administers the project on the Tribe s behalf. The HCAOG TAC places emphasis on the provision of resources to tribes that are actively involved in the acquisition of resources for tribal transportation needs. Although active Tribe transportation needs are given an emphasis with 2008 RTP Page TT-2 Tribal Transportation Element
199 2008 RTP Page TT-3 Tribal Transportation Element
200 regard to funds distribution, other tribes will not be ignored in future transportation planning efforts if/when they decide to become active members of TAC. The State of California has passed legislation authorizing the Hoopa Tribe to serve on the HCAOG Board of Directors. Discussions are still taking place regarding the long-term appointment of a Hoopa Tribe representative to the Board. HOOPA VALLEY TRIBE The Hoopa Valley Indian Reservation is the largest reservation in California. The Reservation is nearly square and totals approximately 144 square miles. This area encompasses roughly 50 percent of the Hupa aboriginal territory. The Reservation is located in the northeastern corner of the county, approximately 50 miles inland from the Pacific Ocean. Highway 96 bisects the Hoopa Valley Reservation and the Trinity River flows through the center. Highways and Roads The Hoopa Valley Reservation total backlog cost for roadway maintenance and rehabilitation needs is approximately $900,000. SR 96 bisects the Reservation and is the primary access road for the Hoopa Valley, SR 299 and I-5. SR 96 is in need of traffic calming and safety enhancements at various locations. The following segments of SR 96 experience peak- and nonpeak- hour congestion: the intersections of SR 96 and School Road, SR96 and Pine Creek Road/Loop Road, SR96 and Tish Tang Road, and SR96 and Tsewenaldin Road. In 2003 Hoopa was awarded a grant under the Environmental Justice: Context Sensitive Planning for Communities Grant Program. The purpose of the grant-funded project was to involve the community in crafting design solutions to traffic safety problems, specifically the critical injury cluster sites along SR 96, while supporting existing community development efforts. Implementation of the grant began in November In January of 2006 the Traffic Calming and Safety Enhancement in the Hoopa Valley Indian Reservation: A Conceptual Plan for Downtown Hoopa was released. The Plan provides a blueprint for implementing ideas related to pedestrian safety along Highway 96 through downtown Hoopa. Additionally, the Plan presents ideas related to enhancing the pedestrian environment throughout downtown Hoopa. SR 96 is a major route for people in Hoopa, yet there are no sidewalks, bikeways, or formal public trails that allow people to walk adjacent to the travel lanes. Pedestrian crosswalks and a pedestrian zone on Trinity River Bridge are a few of the safety improvements recommended in the Plan. In October 2007, the Hoopa Valley Tribe completed a project study report (PSR) to move the SR 96 project forward. The 2008 STIP cycle includes a programming allocation for the Hoopa Valley Tribe SR 96 project; however, a funding year has not been determined at this time RTP Page TT-4 Tribal Transportation Element
201 Hoopa Valley Reservation regionally significant roads include: Tish Tang Road, which provides the only access to K ima:w Medical Center; Pine Creek Road, which provides access to significant residential areas and is the sole connection to Bald Hill Road (to US 101) and Dowd Road (route around Martins Ferry Bridge); Bair Road, which provides secondary access to SR 299; and Tsewenaldin Road, which provides access to the grocery store, US Post Office, radio station, and Lucky Bear Casino. Table TT1 contains a list of the Hoopa Valley Tribes short- and long-term planned roadway projects. Table TT1 Hoopa Valley Tribe Short and Long Term Planned Projects Project Year Estimated Cost Funding Source Bald Hill Slide Stabilization Project 2005 $6,000,000 IRR, IRRHPP, BIA, congressional earmark BIA Campus Streets Reconstruction 2005 $1,502,000 IRR Bald Hill Slide Repair 2008 $1,020,000 IRR, National Guard Hoopa Airport Capital Improvements 2010 $150,000 FAA Tsewenaldin Road 2012 $ IRR Hospitality Road 2012 $ IRR Retail Road 2012 $ IRR Bank Lane 2012 $ IRR Big Hill Road Grading, Drainage, & Paving 2014 $1,964,000 IRR KIDE Road 2016 $ IRR Post Office Lane 2016 $ IRR Baldy Flat Road 2018 $ IRR Storage Road 2019 $ IRR River Road 2020 $ IRR Redwood Grove Road Grading, Drainage, & Paving 2020 $2,074,000 IRR Mill Creek Road Grading, Drainage, & Paving 2023 $2,912,000 IRR Scale Shack Road 2025 $ IRR $ = Fund estimates not available Total $15,622,000 Since the 2006 RTP, the Hoopa Valley Tribe has completed the following road projects: Loop Road Reconstruction Moon Lane Construction Project 2008 RTP Page TT-5 Tribal Transportation Element
202 Campus Streets Project Bald Hill Slide Winterization 2006 Bald Hill Slide Winterization 2007 Table TT2 details the Hoopa Valley Illustrative road projects or projects that they would complete if funding was available. Table TT2 Hoopa Valley Tribe Illustrative Projects Project Description Total Cost Tish Tang Reconstruction Reconstruct roadway near bridge to K'ima:w Medical Center; add sidewalks and bicycle lanes $6,000,000 School Sidewalks to Downtown Cantilevered Walkway Bridge at Blue Slide Bridge to K'ima:w Medical Center Tish Tang Foot Bridge Tish Tang Reconstruction Connect sidewalks and bike lanes from Loop Road (south end) to Trinity River Bridge Full size pedestrian, bicycle, equestrian walkway constructed to one side of the Trinity River Bridge On SR 96 at Blue Slide, place a bridge connecting the straight portions of the highway on each bank over the Trinity River On SR 96 at Blue Slide, place a bridge crossing the Trinity River from the north end of Blue Slide across to the area south of the dance grounds below the airport Place a seasonal pedestrian/bicycle bridge connecting the two Tish Tang campgrounds Reconstruct roadway near bridge to K'ima:w Medical Center; add sidewalks, bicycle lanes $3,500,000 $12,000,000 $25,000,000 $45,000,000 $4,000,000 $6,000,000 Total $101,500,000 Hoopa Airport Hoopa Airport is owned by the Hoopa Valley Tribe. The airfield serves the Hoopa Willow Creek area. Its sole runway is 2,325 feet long and 50 feet wide. There is one aircraft based at the airport and aircraft tiedowns are available. The runway is not lit, so night operations are not normally permitted. However, in emergencies, battery-powered runway edge lights are placed along the runway to permit its use. CASP classifies the Hoopa Airport as a Limited Use General Aviation Airport with a runway weight bearing capacity that is 2,500 pounds shy of the desired minimum. The Hoopa Valley Tribe has capital improvements scheduled for RTP Page TT-6 Tribal Transportation Element
203 KARUK TRIBE OF CALIFORNIA The Karuk Tribe of California is the second largest Tribe in California with 3,513 enrolled members. The Karuk Tribe is a self-governance tribe and compacted transportation functions into a multi-year funding agreement with the Bureau of Indian Affairs (BIA) in The tribe now receives funding for a transportation program, and works directly with the BIA and the Federal Highways Administration to accomplish road construction and maintenance activities. The Karuk Tribe previously contracted with the BIA to construct tribal roads, and before that the BIA built them. Now that the tribe receives the funding directly, carries out its own road maintenance activities, and is planning the construction of new roads in Orleans, Happy Camp, and Yreka. The tribe is also planning a snow removal project on Greyback Road, a forest highway that gets snowed in every year and is the only alternate access for the town of Happy camp. The Karuk tribal roads are showing sign of needing repair and rehabilitation. SR 96 is considered a regionally significant road for the Karuk Tribe as it provides the only access between, in and out of Karuk communities. The Karuk Tribe does not have any road project planned in Humboldt County. The Karuk Tribe of California applied for an FTA Tribal Transit 5311 Grant to connect KT-NET up to Somes Bar, and the Yreka STAGE down to Somes Bar, but did not receive the grant. The tribe intends on using their IRR Program Construction Funds to expand the KT-NET service are to include a route to Somes Bar twice a week. The Karuk Tribe of California would like to improve pedestrian and bicycle facilities on the reservation. If funds became available, they would install bicycle and pedestrian facilities on Red Cap Road, SR 96, and Ishi Pishi Road. TRINIDAD RANCHERIA The Trinidad Rancheria is comprised of three separate parcels that total 83 acres. The largest parcel is located on the west side of Highway 101 along the Pacific Coast and is made up of 46.5 acres. The 46.5 acre parcel contains Tribal Member Housing, Tribal Offices, a Tribal Library, and the Cher-Ae Heights Casino. Highway 101 bisects the Rancheria on the north eastern corner which leaves a small nine-acre parcel on the eastern side of Highway 101. A third 27.5-acre parcel is located in the unincorporated community of McKinleyville, east of the Arcata Eureka Airport. Twelve residential properties are located on the 27.5-acre parcel. In addition to Rancheria property, the Trinidad Rancheria also owns the Trinidad Pier and Seascape Restaurant in the City of Trinidad. The Rancheria s property in Trinidad also includes the main entrance and access point to the Trinidad Head, which hosts walking trails, and cultural and historical points of interest. Breathtaking ocean views and recreational opportunities for walkers, joggers, bicyclists surfers, outdoor enthusiasts, fisherman and tourists contribute to the need for transportation alternatives within the lands owned and managed by the Trinidad Rancheria RTP Page TT-7 Tribal Transportation Element
204 The Rancheria is beginning the journey of planning and building infrastructure. The Rancheria recently hired a full time Roads Director and Assistant to undertake the development of a Trinidad Rancheria and Harbor Master Plan. This plan will look at transportation connectivity, long range planning for cultural preservation, housing, land, environment and economic development. Finding solutions to the existing barriers to pedestrian and bicycle travel, safe routes to school, and alternative access to the Rancheria are transportation issues which will be addressed as priorities in the plan. Currently, the Trinidad Rancheria is engaged in three major projects pertinent to the Rancheria s long-range planning and development: The Trinidad Pier Reconstruction Project, the stabilization and rehabilitation of Scenic Drive, and the planning for a new US 101 Interchange directly to the Trinidad Rancheria. Pier Project The Trinidad Rancheria is in the permit process and beginning design and engineering phase for a Pier Reconstruction Project in the Trinidad harbor. The existing pier was built in 1946 and is the northernmost oceanfront pier in California. It serves a fleet of commercial fisherman yearround and offers a unique opportunity for visitors to the north coast to observe a working pier and fishing operation. The Rancheria leases the land below the pier (harbor) from the City of Trinidad. Additionally, the Humboldt State University Marine Lab leases space on Trinidad Pier for placement of a pump and associated plumbing for the Telonicher Marine Laboratory. The purpose of the pier project is to correct the structural deficiencies of the pier and to improve the pier facilities for the public. The pier reconstruction will address the structural and environmental impacts caused by the aged creosote-treated fir piles. The new pier will be 540 feet long and will vary in width from 24 feet to 26 feet, to match the existing footprint. The current pier will be replaced with 13,500 feet of recast concrete decking, 115 concrete piles (including batter and motor piles) four hoists, standard lights, guardrail and dock utility pipes including power, water and phone. Stairs will be replaced with an ADA compliant ramp and a new storm drain system will be incorporated into the new pier design. Additionally, the new design and construction will improve the water quality conditions and provide additional habitat for the biological community in the ASBS (area of special biological significance), as identified by the State Water Resources Control Board. Scenic Drive Rehabilitation and Realignment The Trinidad Rancheria is working on a 2,150-feet (0.4 mile) reconstruction project on Scenic Drive, directly west of the Rancheria. Scenic Drive is a two-lane, three-mile-long road that parallels US 101 from the City of Trinidad (to the north) to the community of Westhaven (to the South). Originally, Scenic Drive was operated as a part of US 101 until 1962 when a bypass was constructed and Scenic Drive was deeded to the County. The Trinidad Rancheria, the City of Trinidad, and the County of Humboldt own sections of Scenic Drive. Scenic Drive provides the only access to the Trinidad Rancheria which is home to Tribal member housing, Tribal operations and office buildings, and the Cher-Ae Heights Casino. Various sections of the public road are failing due to slope instability and bluff erosion; Scenic Drive was constructed on the face of a steep bluff adjacent to the Pacific Ocean and has 2008 RTP Page TT-8 Tribal Transportation Element
205 experienced extensive damage which has compromised the roads overall safety and integrity. The Scenic Drive project will repair and stabilize roadside areas, improve drainage, and realign the southernmost 600 feet of the project area to meet the Federal Highways Administration (FHA) geometric design standards for horizontal and vertical curvature. Further, this project will include repaving, shoulder widening and guardrail installation. This project will indeed improve road safety and stability, but does not include pedestrian or bicycle improvements because of the prohibitive four-foot shoulders needed to accomplish this. Future planning for Scenic Drive Projects will incorporate alternatives that may address this goal. 101 Interchange The Trinidad Rancheria s long-term goal is the construction of a US 101 interchange directly to the Rancheria, and is in the process of writing a plan to address the goal. Current access to the Rancheria is compromised due to the continuous failure of Scenic Drive which offers the only access to the Rancheria, its Tribal offices and operations, and the Cher-Ae Heights Casino. The Rancheria is dedicated to maintaining an inclusive relationship with various stakeholder groups as the planning process unfolds. Major components of the Rancheria s plan include public outreach, publicity, and a community Charrette event to take place in The Charrette will include multiple days of community involvement that incorporate focus groups, community meetings, and design concepts. The Rancheria looks forward to the public s involvement as the planning process unfolds. YUROK TRIBE The territory of the Yurok people runs along the coast seven miles north of the Klamath River to Wilson Creek and 35 miles south of the river mouth to Little River. Inland, their territory follows the Klamath River from its mouth upriver for over 45 miles past the confluence of the Klamath and Trinity Rivers. The watershed of the Lower Klamath River and its tributaries dominated the Yurok Territory. The River is mountainous, heavily forested and meanders 52 miles along the federally designated Wild and Scenic Klamath River. Highway and Roads Historically, the Yurok people used the Klamath River along with a traditional system of trails as their primary transportation routes. Many of the roads today on the Yurok Reservation follow these same traditional trails. The Yurok Reservation was once the center of a bustling logging economy that depended upon improved roads for the removal and sale of logs. As logging on the reservation diminished, State and county roads and bridges on the reservation have fallen into disrepair. While highways and roads off the reservation were widened and brought up to federal standards, highways and roads on the reservation have deteriorated and fallen far short of federal highway standards. Consequently, most road segments on the reservation are incomplete, underdeveloped or falling seriously behind acceptable federal standards for public roads. SR 169 and US 101 serve as the major transportation arteries of the Yurok Reservation, and are key access points for Tribal economic development and transportation-related commerce. A 2008 RTP Page TT-9 Tribal Transportation Element
206 twenty-mile strip of SR 169 on the upper reservation is a one-lane highway without striping, guardrails or other safety measures. Martin s Ferry Bridge connecting the upper reservation to the lower reservation was recently condemned and is currently undergoing a $15,000,000 emergency renovation. Hunter Creek Bridge in Klamath is rated below an acceptable standard and required replacement. The estimated cost (in 2005 dollars) for roadway rehabilitation projects ranked by relative importance to the Yurok Tribe is $633,208,000. The number one transportation construction priority is the reconstruction of 20.1 miles of SR 169 at a cost of $205,720,000. The second highest priority project is the realignment and pavement of Bald Hills Road at a cost of $61,230,200. The BIA stopped conducting routine road maintenance in For the last 20 years, the only road maintenance on tribal or BIA roads has been the result of disaster assistance after major storms. Funding for road maintenance provided by the BIA amounts to less than $50,000 dollars per year. It is estimated that the backlog of roadway maintenance could be in the hundreds of millions of dollars. In fact, most roadways have fallen into such deplorable condition that road maintenance can no longer address the problem, and most routes now require major roadway rehabilitation. The tribe is currently working with Caltrans to widen a small portion of SR 169. The project is a SHOPP project that has been several years in the process of completing the PS&E. The tribe is working with Humboldt County to complete an emergency rehabilitation project on Martin s Ferry Bridge and PS&E for Bald Hills Road. The tribe is working with Del Norte County to resurface Klamath Blvd and Elhers Way and to complete a guardrail and safety project for P.J. Murphy Road. The Yurok Tribe completed the Yurok Tribal Transportation Plan (TTP) in Included in the TTP is a list of projects for the Tribal Transportation Improvement Program (TTIP). The Yurok Tribe also completed a comprehensive update of Indian Reservation Road Program inventory (IRR). Public Transit The Yurok Tribe is currently in negotiations with K-T NET to begin transit services to the upper portion of the Yurok Reservation by late summer of State, tribal FTA and Indian Reservation Road grants will be used to fund the service. The Yurok tribe has ordered a passenger, Ford #450 Super Duty bus with two wheelchair positions to serve the Hoopa to Weitchpec route. A second smaller bus will be added to serve the Wautec to Weitchpec Route. Bicycle and Pedestrian Facilities There are currently no bicycle and pedestrian facilities located on the Yurok Reservation. Bicycle and pedestrian routes along US101 and SR 169 are being considered for future planning efforts. The tribe was recently funded by California Coastal Conservancy to begin planning for a coastal pedestrian trail through the Yurok Reservation RTP Page TT-10 Tribal Transportation Element
207 Yurok High Priority Projects Martin s Ferry Bridge Rehabilitation Project, Currently under construction. Bald Hills Road, currently in progress. Widening SR 169 at Weitchpec; Caltrans is currently completing Plans Specifications &Engineering. WIYOT TRIBE The land base of the Wiyot Tribe is an 88.5 acre parcel of trust land located south of Eureka near the community of Loleta. Table Bluff Reservation is a community of 34 homes, and the Tribe s administrative buildings. In addition, the Tribe owns property on Cock Robin Island and on Indian Island in Humboldt Bay. While the Tribe s land base is small, the Tribe serves the needs of approximately 600 citizens. Current Project The Wiyot Tribe is currently engaged in a long-awaited road construction project. Called the Bayview extension, this roadway will complete the roads on the reservation proper. Unmet Needs While the construction of the road on the Reservation will be completed soon, there are still a number of unmet needs. US 101 connects Tribal citizens to destinations within the county. However, significant flooding at Hookton Road often reroutes drivers to other areas. Additionally, no public transit or paratransit is available to connect riders at the Reservation with jobs, schools medical care or other destinations. The Wiyot Tribe is a member of the HCTTC, working with other Tribes for the improvement of transportation for all. Transportation continues to be a high priority item for the Tribe as it looks to the future for its citizens. BLUE LAKE RANCHERIA Blue Lake Rancheria began a fixed-route intercity bus service in the fall of Blue Lake Rancheria s fixed -route service is currently financed by the Blue Lake Rancheria with TDA funds from the City of Blue Lake. The vehicle fleet consists of one 20-passenger bus that is lift equipped. Blue Lake Rancheria s fixed-route transit runs Monday through Friday and serves the Rancheria, Blue Lake, Glendale, HSU and the Arcata Transit Center. In 2005, 15,981 riders utilized the Blue Lake Rancheria fixed-route service. The Blue Lake Rancheria Dial-A-Ride service began operating in spring Blue Lake Rancheria s DAR/DAL serves Blue Lake, McKinleyville and Fieldbrook. The vehicle fleet consists of one van that is lift-equipped. The service operates Monday through Friday for five 2008 RTP Page TT-11 Tribal Transportation Element
208 hours each day. Riders must make a 24-hour advance reservation. In 2005, 3,313 individuals utilized the Blue Lake Rancheria dial-a-ride service. Between the hours of 8:00 am and 10:00 am, and between 1:30 pm and 4:30 pm on weekdays, the Dial-A-Ride service is utilized for subscription service with the Mad River Adult Day Health Care. FINANCING There are several funding sources from which the Tribes may benefit. Two of the funding sources are controlled directly by HCAOG the State Transportation Improvement Program (STIP) and Transportation Enhancements (TE) program. The remaining programs are awarded and administered by either State or Federal government agencies, such as Caltrans. Unfortunately, due to the current structure of the funding programs, the tribes themselves cannot be direct recipients of some of these funds. A tribal project can, however, be eligible for the funds with another agency, such as a city, county or state agency, acting as the project sponsor and administering the project on behalf of the tribe. State Transportation Improvement Program The State Transportation Improvement Program (STIP) is a five-year capital improvement program to assist the state and local entities to plan and implement transportation improvements and to utilize resources in a cost effective manner. All STIP projects must be capital projects (including project development costs) needed to improve transportation, including improvements to mobility, accessibility, reliability, sustainability and safety. A Fund Estimate is prepared every two years by Caltrans and approved by the California CTC. Regional agencies and Caltrans must submit their project lists by the end of the year. The California CTC then adopts the STIP by the following April. In August 2008, CTC adopted Resolution G (TE Program Reform) integrating the Transportation Enhancements (TE) program into the STIP. The 2008 STIP Guidelines further clarify and direct programming of TE funded projects, or project enhancement elements, into the STIP. From passage of SB 45, the STIP is split 75 percent to Regional Transportation Improvement Program (RTIP), decided by regional agencies such as HCAOG, and 25 percent to Interregional Transportation Improvement Program (ITIP), projects nominated by Caltrans. Below is a description of each program. With HCAOG as a project sponsor, the Tribes could be eligible for some of these resources. Environmental Enhancement and Mitigation Program Similar to TEA, the Environmental Enhancement and Mitigation Program EEM offers funding to remedy environmental impacts of new or improved transportation facilities. Applicants may apply for these funds to undertake environmental enhancement and mitigation projects which are directly or indirectly related to the environmental impact of modifying existing transportation facilities, or for the design, construction or expansion of new transportation facilities. The 2008 RTP Page TT-12 Tribal Transportation Element
209 related transportation facility must be modified or constructed in 1990 or later and the EEM project must be over and above the required mitigation for the related transportation project. All participating costs incurred on a project are funded in arrears on a reimbursement basis of the states proportionate share of actual costs. No matching funds or cost shares from the applicant or other funding sources are required to apply for an EEM grant, however, projects that include the greatest proportion of other monetary sources of funding will be rated highest. Grants are generally limited to $350,000. BIA Indian Reservation Roads (IRR) Program The purpose of the IRR Program is to provide safe and adequate transportation and public road access to and within Indian reservations, Indian lands, communities for Native Americans, visitors, recreational and resource users and others while contributing to economic development, self-determination, and employment of Native Americans. IRR Program funds are authorized as part of the surface transportation authorization acts as part of the Federal Lands Highway Program (FLHP). The BIA Department of Transportation and the Federal Land Highway Office of the FHWA administer the program. Indian Reservation Roads Maintenance Program These funds are intended for maintenance activities on roads serving the tribes. Unfortunately, the funding levels of the program are exceedingly inadequate for the work needed. Nationally, BIA receives about $26 million per year, with only $700,000 of that earmarked for the entire State of California. Hazard Elimination Safety The purpose of the Hazard Elimination Safety (HES) program is to provide funds for safety improvements on any public road, any public surface transportation facility, any publicly owned bicycle or pedestrian pathway or trail, and for any traffic-calming measure. These funds serve to eliminate or reduce the number and severity of traffic collisions at locations selected for improvement. The Tribes could be eligible for these funds if another agency, such as a city, county or state agency, acts as the project sponsor and administers the project on behalf of the Tribe. Exceptions to this requirement will be reviewed on a case-by-case basis. Applicants that do not have representation from a city or county must provide written justification for the exception and attach it to the application. Bridges on Indian Reservation Roads This program is authorized under the HBRR Program and provides funding for rehabilitation or replacement of bridges or culverts on public roads meeting the definition of an IRR. Each BIA Regional Office works with Tribal, State, and local government to develop a priority list of bridge replacement projects and identify sources for the 20% matching funds required by the program RTP Page TT-13 Tribal Transportation Element
210 Caltrans Transportation Planning Grants The Environmental Justice Grant promotes context-sensitive planning in diverse communities and provides means to help low-income, minority and Native American communities, including community based organizations (CBOs) become active stakeholders in transportation planning and project development. The Community Based Transportation Planning grant program is primarily used to seed planning activities that encourage livable communities. CBTP grants assist local agencies to better integrate land use and transportation planning, to develop alternatives for addressing growth and to assess efficient infrastructure investments that meet community needs RTP Page TT-14 Tribal Transportation Element
211 REFERENCES Personal Communication with Warren Tamerius, Transportation Planner, Hoopa Valley Roads Department. Personal Communication with Scott Quinn, Director of Land & Transportation Planning, Karuk Tribe of California. Personal Communication with Amanda Mager, Planner II, Planning and Community Development Department, Yurok Tribe. Personal Communication with Jacque Hostler, Roads Director, Trinidad Rancheria. Personal Communication with Rebecca Kellawan, Administrative Assistant, Roads Department Trinidad Rancheria. Personal Communication with the Humboldt County Tribal Transportation Commission. Humboldt County Tribal Transportation Commission Informational Brochure RTP Page TT-15 Tribal Transportation Element
212 COMMUNITY INPUT ELEMENT COMMUNITY PARTICIPANT PROGRAM Community input is a vital component of the RTP. Community workshops were held to solicit the community s input for the 2008 RTP update. Workshops were held prior to the draft release of the RTP at the Wharfinger Building in Eureka, the Monday Club in Fortuna and at Azalea Hall in McKinleyville. Workshop participants were asked to prioritize regional transportation modes and areas of emphasis within each of the modes. The following goals guided the development of the public participation plan for the 2008 RTP development process: Construct a process that generates useful comments, adds value to the process and builds community engagement in transportation issues; Obtain resident and stakeholder input on all the modes of transportation; Obtain input from every community workshop participant; and Engage workshop participants in dialogue with one another to share similar and different perspectives and/or opinions pertaining to the transportation modes in order to enhance the community workshop learning environment. Public Service Announcements (PSA) were distributed to local print (i.e., Times Standard, North Coast Journal, Arcata Eye, Eureka Reporter, EcoNews, EL Heraldo, Ferndale Enterprise, McKinleyville Press, Redwood Times, Senior News, Humboldt Beacon, The Independent, Lumberjack News, Press Democrat, ), radio (i.e., KHSU, KHUM, KIDE, KMUD, KWPT, KSLG, KAJK/KNCR/KXGO, KFMI/KATA/KRED/KKHB, KGOE), and TV (i.e., Access Humboldt, KAEF-TV 23, KVIQ-TV 6, KBVU-TV 29) media four weeks, three weeks and two weeks (to applicable media per media deadlines) prior to the community workshops. PSAs were also sent via to agency staff, stakeholder groups, interested community members and various listserves (e.g., HUMPal, Southern Humboldt Working Together). The PSAs contained contact information for community members that could not attend the meeting, but wished to provide input for the RTP; written comments were accepted via or the US Postal Service. Following is a summary of information received via the community outreach process. It is important to note that the information in this element represents the views of the Humboldt County residents that submitted written comments and attended the community workshops; the information does not represent the views of all Humboldt County residents. Although the input is not representative of Humboldt County residents, it does provide valuable insights and is worthy of consideration with respect to transportation project programming and funding priorities RTP Page CI-1 Community Input Element
213 WORKSHOP EXERCISE NUMBER ONE The community workshops included a presentation on the RTP update process and givens, and two workshop exercises. For the first workshop exercise, participants were asked to rank four modes of transportation based on personal interest, needs or sense of importance, using the numbers one through four, with one being their first choice. The four modes of transportation included: goods movement (i.e., port infrastructure, rail service, US 101 and Highway 299, and airport infrastructure), public transit and paratransit services, bicycle and pedestrian facilities and highways and roads. Participants were given five minutes to review and rank the four transportation modes, and then asked to break into small groups and move to a table marked with either their first or second mode priority. Participants were given 15 minutes for small-group discussions in order to discuss why they chose their first or second priority, and then to provide a small group discussion summary to the larger group of participants present. Below is a summary of information obtained via the prioritization exercise and small table reports. Summary of all workshop participants A total of fifty Humboldt County residents attended the RTP community workshops. Table CI1 illustrates the combined transportation mode ranking for all fifty participants. Table CI1 Modes of Transportation Modes of Transportation Goods Movement 12% 20% 31% 37% Public Transit and Paratransit 35% 37% 20% 8% Bicycle and Pedestrian Facilities 41% 20% 12% 27% Highway and Roads 12% 22% 37% 29% The majority of all community workshop participants ranked the four transportation modes in the following order: bicycle and pedestrian facilities (41%), public transit and paratransit services (37%), highway and roads (37%), and goods movement (37%). Eureka A total of 21 one Humboldt County residents attended the RTP community workshop in Eureka. Table CI2 reflects how Eureka community workshop participants ranked the four modes of transportation. The majority of Eureka community workshop participants ranked the four transportation modes in the following order: bicycle and pedestrian facilities (62%), public transit and paratransit (48%), and goods movement (48%). An equal percentage of participants (38%) ranked highways and roads as their third and fourth transportation mode of preference RTP Page CI-2 Community Input Element
214 Table CI2 Modes of Transportation Eureka Modes of Transportation Goods Movement 5% 9% 38% 48% Public Transit and Paratransit 29% 48% 14% 9% Bicycle and Pedestrian Facilities 62% 24% 9% 5% Highway and Roads 5% 19% 38% 38% Workshop participants were asked to break into small groups based on their first or second transportation mode priority. The small groups were asked to discuss with one another why they chose their first or second priority and to then provide a summary of the small-table discussions to the larger group in attendance. The information below was received via the small-table summary reporting: Goods movement Imports comprise most of what we consume Necessary for local economy and quality of life Everything is supported by goods movement Humboldt County is geographically remote, goods movement connects us to the rest of the world Public transit and paratransit Incentives to use public transit and paratransit for health reasons Silver tsunami (aging baby boomers) meets peak oil Incentives to get people to use public transit Accessibility (universal) and awareness (language, etc.) Bicycle and pedestrian facilities Heath reasons, reduced obesity Diminished greenhouse gases Fewer crashes To have fun Increasing costs of gas and reducing the number of cars on the road Highways and roads Economic growth for Humboldt County We have a good system; provides good connections for other modes such as bike and transit Provides connections to other communities and links to goods movement 2008 RTP Page CI-3 Community Input Element
215 Fortuna A total of 12 Humboldt County residents provided input at the RTP community workshop in Fortuna. Table CI3 reflects how Fortuna community workshop participants ranked the four modes of transportation. Table CI3 Modes of Transportation Fortuna Modes of Transportation Goods Movement 25% 33% 42% 0% Public Transit and Paratransit 50% 17% 25% 8% Bicycle and Pedestrian Facilities 0% 17% 8% 75% Highway and Roads 25% 33% 25% 17% The majority of Fortuna community workshop participants ranked the four transportation modes in the following order: public transit and paratransit (50%), highways and roads (33%), goods movement (42%), and bicycle and pedestrian facilities (75%). Workshop participants were asked to break into small groups based on their first or second transportation mode priority. The small groups were asked to discuss with one another why they chose their first or second priority and to then provide a summary of the small table discussions to the larger group in attendance. The below information was received via the small table summary reporting: Goods Movement Humboldt County suffers economically from rural location; higher transportation costs affect us more Goods movement is how we deliver services and commodities in and out of the county; it is how we make money Public Transit The State is and has cut money for dialysis transportation No volunteers for transit programs Public transit providers should recruit more riders and be more flexible Current transit times do not fit people s schedules The county should provide leased vehicles for a community to use in order to set up services similar to the Ferndale Bridge the Gap Service Service frequency for working families inconvenient timing of public transportation Regularly schedule transit for seniors Seniors and disabled may not request service if they think they are the only ones requesting the service; if it is already a service seniors are more likely to use it 2008 RTP Page CI-4 Community Input Element
216 Transit schedules don t fit everyone s needs Advertise to let people know it is there (publicize); people will use it more Educate people of car alternatives to help offset high fuel costs Door to door service (connection points at key locations and protected locations) Need to offer shelter at bus stops Intergenerational community center Dual threat: funding regulations from Sacramento can cause issues, currently four busses are underutilized because of state air quality regulations (Humboldt County is different in air quality than Sacramento and should be evaluated separately) Ability to push back regulations if it is not contributing to what we are trying to accomplish Roads and Highways Roads are the #1 basic infrastructure because all other modes are dependent on working roads Transit relies on roads Safe roads = safe transit/safe goods movement Roads are essential Internal dependency In some (rural) places, roads are the only option for transportation Comments were not received for bicycle and pedestrian facilities as a result of how participants ranked the transportation modes. McKinleyville A total of 17 Humboldt County residents attended the RTP community workshop in McKinleyville. Table CI4 reflects how McKinleyville community workshop participants ranked the four modes of transportation. Table CI4 Modes of Transportation McKinleyville Modes of Transportation Goods Movement 12% 25% 13% 50% Public Transit and Paratransit 31% 38% 25% 6% Bicycle and Pedestrian Facilities 43% 19% 19% 19% Highway and Roads 12% 19% 44% 25% The majority of McKinleyville community workshop participants ranked the four transportation modes in the following order: bicycle and pedestrian facilities (43%), public transit and paratransit (38%), highways and roads (44%), and goods movement (50%) RTP Page CI-5 Community Input Element
217 Workshop participants were asked to break into small groups based on their first or second transportation mode priority. The small groups were asked to discuss with one another why they chose their first or second priority and to then provide a summary of the small table discussions to the larger group in attendance. The information below was received via the small table summary reporting: Goods Movement Economics How we can attract new businesses Importance of basic necessities Humboldt County is a resource-based economy, goods movement allows for products to be shipped out of county Public and Paratransit Services Economics, gas prices too expensive Benefits most people with least environmental impacts Some people s only choice Better access to transit equals more productivity for Humboldt County residents Bicycle and Pedestrian Facilities Too much emphasis on automobiles Want multi-modal transportation Exercise, health, safety, and social justice Environment and economics Increased social capital of communities Social engagement Highways and Roads Experience in rural Humboldt County (dangers slides ) No access for seniors or communities for basic services Without roads there are no other modes, key factor Rural roads not up to standard, which creates a hardships to communities 2008 RTP Page CI-6 Community Input Element
218 WORKSHOP EXERCISE NUMBER TWO For the second workshop exercise, participants were provided with four options for the four modes of transportation (see table CI5 below). Participants were given 15 minutes to rank the four options within each mode from a regional perspective on a scale of one to four, with one being participants first regional priority. Table CI5 Exercise Mode Options Goods Movement Option 1: Develop port infrastructure to accommodate deep draft container ships and break bulk cargo. Option 2: Reestablish rail service on the North Coast Railroad Authority railroad. Option 3: Eliminate STAA pinch points on US 101 and Highway 299 to facilitate the movement of goods via STAA trucks. Option 4: Expand airport infrastructure to increase the use of the county s airports for goods movement. Public Transit and Paratransit Option 1: Expand the geographic coverage area of public transit to include communities that are currently not served by public transit services (for example Garberville). Option 2: Increase the frequency of public transit service in areas already served by adding express transit service and direct routes. Option 3: Reestablish public transit service out of the county to the north (for example Portland) and to the east (for example Redding). Option 4: Expand paratransit (service tailored towards seniors and disabled residents) and nonemergency medical transportation services to include communities that are not currently served (for example Trinidad, Loleta, Scotia, Rio Dell). Bicycle and Pedestrian Facilities Option 1: Develop pedestrian and bicycle trail connections among communities (for example, pedestrian and trail connections among McKinleyville, Blue Lake, Arcata and Eureka). Option 2: Develop pedestrian and bicycle trail connections within communities (for example, within the community of McKinleyville). Option 3: Develop and implement share the road safety and education campaigns. (Such campaigns typically involve radio and television adds, educational programs, and road signs to educate motorists and bicyclists about road rights and responsibilities as well as to increase user safety.) Option 4: Develop, maintain and rehabilitate the California Coastal Trail and Pacific Coast Bike Route. Highways and Roads Option 1: Established funding mechanism (e.g., gas tax) will be used to maintain and rehabilitate existing major (e.g., Arterial and Collector) roadway infrastructure. New secure funding mechanism (e.g., Permanent Road Divisions, Mello-Roos Districts) would be used to maintain and rehabilitate new local / access roads. Option 2: Increase major road capacity to accommodate other modes of travel (for example bicycle lanes, sidewalks and transit stops). Option 3: Implement major and local road improvements that increase vehicle, bike and pedestrian safety. Option 4: Implement major and local road improvements that relieve congestion RTP Page CI-7 Community Input Element
219 Fifty percent of workshop attendees at each table were asked to move to another table and discuss the similarities and differences in how they ranked the options. Participants were given fifteen minutes for small group discussions and then asked to share a summary of the small table discussion with the larger group. Below is a summary of information obtained via the options within mode prioritization exercise and small table reports. Summary of all workshop Participants Table CI6 Options within Modes Option Number Goods Movement Option 1 21% 44% 28% 7% Option 2 8% 13% 18% 61% Option 3 70% 9% 21% 0% Option 4 7% 32% 32% 29% Public Transit and Paratransit Option 1 6% 40% 42% 12% Option 2 64% 14% 12% 10% Option 3 8% 16% 22% 54% Option 4 22% 30% 24% 24% Bicycle and Pedestrian Facilities Option 1 58% 27% 11% 4% Option 2 27% 40% 23% 10% Option 3 13% 19% 33% 35% Option 4 2% 15% 33% 50% Highways and Roads Option 1 17% 2% 59% 22% Option 2 44% 34% 18% 4% Option 3 33% 53% 10% 4% Option 4 6% 9% 13% 72% The majority of all community workshop participants ranked option 3 (70%) as their first priority, option 1 (44%) as their second priority, and option 2 (61%) as their third priority within a regional context for goods movement. The majority of all participants were equally split with respect to option 4, with 32 percent of participants ranking it second and 32 percent of participants ranking it third. Public transit and paratransit option 2 (64%) was ranked as the first regional priority by a majority of all workshop participants. Public transit and paratransit option 4 (30%) was ranked 2008 RTP Page CI-8 Community Input Element
220 second, option 1 (42%) was ranked third and option 3 (54%) was ranked fourth by a majority of all community workshop participants. Bicycle and pedestrian facilities option 1 (58%) was ranked as the first regional priority and option 2 (40%) was ranked as the second. The majority of all workshop participants ranked option 3 (35%) fourth and option 4 (50%) fourth; as a result a third regional priority was not established by participants ranking. The majority of all workshop participants ranked highways and roads option 2 (44%) as their first priority, option 3 (53%) as their second priority, option 1 (59%) as their third priority, and option 4 (72%) as their fourth priority within a regional context for highways and roads. Eureka Table CI7 illustrates how Eureka community workshop participants ranked the four options within the four transportation modes. Table CI7 Options within Modes Eureka Option Number Goods Movement Option 1 28% 37% 28% 7% Option 2 21% 21% 29% 29% Option 3 53% 12% 35% 0% Option 4 0% 27% 13% 60% Public Transit and Paratransit Option 1 4% 48% 24% 24% Option 2 80% 10% 10% 0% Option 3 5% 33% 29% 33% Option 4 10% 10% 38% 42% Bicycle and Pedestrian Facilities Option 1 76% 24% 0% 0% Option 2 14% 48% 29% 9% Option 3 10% 19% 38% 33% Option 4 0% 10% 33% 57% Highways and Roads Option 1 0% 0% 72% 28% Option 2 67% 19% 14% 0% Option 3 28% 72% 0% 0% Option 4 5% 5% 16% 74% 2008 RTP Page CI-9 Community Input Element
221 The majority of Eureka community workshop participants ranked goods movement option 3 (53%) as their first priority within a regional context for goods movement, option 1 (37%) as second, and option 4 (60%) as fourth regional priority. Public transit and paratransit option 2 (80%) was ranked as the first priority by a majority of Eureka workshop participants. Public transit and paratransit option 1 (48%) was ranked second, and option 4 (42%) was ranked as the fourth regional priority. The majority of Eureka attendees were equally split with respect to option 3, with 33 percent of participants ranking it second and 33 percent of participants ranking it fourth. Bicycle and pedestrian facilities option 1 (76%) was ranked first and option 2 (48%) was ranked as their second regional priority by a majority of Eureka workshop attendees. The majority of Eureka participants ranked option 3 (38%) third and option 4 (57%) fourth priority within a regional context for bicycle and pedestrian facilities. The majority of Eureka workshop participants ranked highways and roads option 2 (67%) as their first priority, option 3 (72%) as their second priority, option 1 (72%) as their third priority, and option 4 (74%) as their fourth highway and roads priority. Workshop participants were asked to break into small groups and discuss with one another the similarities and differences between how and why they ranked the options within the four modes of transportation and then a summary of the small table discussions to the larger group in attendance. The below information was received via the small table summary reporting: Similarities and Differences Imagine future and what is important Cannot prioritize goods movement (lack of knowledge/information) General sense that transportation planning is automobile dependent, disaster with peak oil Safety/education; public outreach campaign to help people understand safety issues Motor vehicle education and enforcement of laws Safety, people on road and awareness and access to safe modes and services as well as access to community places (shopping) Geography influences your options (e.g., within city centers it is easier to get around than rural communities) Zoning considering connectivity Having situations safe enough to ride (i.e., consider all members: kids, elders, etc.) Include education for those that can t conceive of no cars; more education as to what all modes are. What are incentives? Important process that has quality of life impacts Cutting down use of cars Zoning for public transportation systems that get cars off the road; include public transit Zoning; how uses are grouped; pedestrian accessibility 2008 RTP Page CI-10 Community Input Element
222 Connectivity in neighborhoods Change our thinking about cities, we need to consider all members of society Fortuna Table CI8 illustrates how Fortuna community workshop participants ranked the four options within the four transportation modes. Table CI8 Options within Modes Fortuna Option Number Goods Movement Option 1 0% 36% 46% 18% Option 2 0% 9% 18% 73% Option 3 100% 0% 0% 0 Option 4 0% 55% 36 9% Public Transit and Paratransit Option 1 17% 42% 33% 8% Option 2 33% 9% 33% 25% Option 3 16% 0% 16% 68% Option 4 33% 50% 17% 0% Bicycle and Pedestrian Facilities Option 1 70% 10% 10% 10% Option 2 10% 40% 40% 10% Option 3 10% 30% 20% 40% Option 4 10% 20% 30% 40% Highways and Roads Option 1 55% 0% 36% 9% Option 2 17% 33% 33% 17% Option 3 18% 46% 27% 9% Option 4 18% 18% 0% 64% All of the Fortuna workshop participants selected goods movement option 3 (100%) as their number one goods movement regional priority. The majority of Fortuna community workshop participants ranked goods movement option 4 (55%) as their second, option 1 (46%) third, and option 2 (43%) as their fourth goods movement priority RTP Page CI-11 Community Input Element
223 An equal number (33%) of Fortuna workshop participants selected public transit and paratransit option 2 as their first and third regional priority. The majority of workshop participants selected option 1 (42%) and option 4 (50%) as their second priority. Public transit and paratransit option 3 (68%) was the fourth regional priority for a majority of Fortuna workshop participants. Bicycle and pedestrian facilities option 1 (70%) was ranked first by a majority of Fortuna workshop attendees. Option 2 was selected as participants second (40%) and third (40%) option by an equal majority of workshop participants. An equal number of participants also selected option 3 (40%) and option 4 (40%) as their fourth priority among the bicycle and pedestrian facilities priorities provided. The majority of Fortuna workshop participants ranked highways and roads option 1 (55%) as their first priority, option 3 (46%) as their second priority, and option 4 (64%) as their fourth regional priority. The majority of Fortuna attendees were equally split with respect to option 2, with 33 percent of participants ranking it as their second priority and 33 percent of participants ranking it as their third priority. Workshop participants were asked to break into small groups and discuss with one another the similarities and differences between how and why they ranked the options within the four modes of transportation and then a summary of the small table discussions to the larger group in attendance. The below information was received via the small table summary reporting: Similarities and Differences Busses don t get to destination at a time that works for basic work schedule Port is unique, it is halfway between Mexico and Canada and near I-5 (and power, gas, and pipelines future integral port) Roads depend on definition of congestion (i.e., rural congestion on Briceland Road) Port has capability of handling bulking exports at cheap costs; cargo can come to port in sufficient amounts for economies of scale Expand paratransit From rural perspectives, increase geographic range of transit services Expanding medical transportation; provide partnership for transportation to and from hospital for medical needs (i.e., shared services) Understanding of transportation service on a specific day of the week; increased coordination and word of mouth Goods movement; widening roads to facilitate goods transit Railroads and containers go hand in hand Gravel and rock/aggregate resources (bulky resources) need rail/marine transportation Airports are in good shape; public funding available to improve More air provider choices result in cheaper costs Option #3 road widening is necessary for larger trucks Importance of port for goods movement 2008 RTP Page CI-12 Community Input Element
224 McKinleyville Table CI9 illustrates how McKinleyville community workshop participants ranked the four options within the four transportation modes. Table CI9 Options within Modes McKinleyville Option Number Goods Movement Option 1 29% 57% 14% 0% Option 2 0% 8% 8% 84% Option 3 64% 14% 22% 0% Option 4 20% 20% 47% 13% Public Transit and Paratransit Option 1 0% 30% 70% 0% Option 2 65% 23% 0% 12% Option 3 6% 6% 18% 70% Option 4 29% 41% 12% 18% Bicycle and Pedestrian Facilities Option 1 29% 41% 24% 6% Option 2 53% 29% 6% 12% Option 3 18% 12% 35% 35% Option 4 0% 18% 35% 47% Highways and Roads Option 1 12% 6% 59% 23% Option 2 35% 53% 12% 0% Option 3 47% 35% 12% 6% Option 4 0% 6% 18% 76% The majority of the McKinleyville workshop attendees selected option 3 (64%) as their number one regional goods movement priority among the options provided. Option 2 (57%) was ranked second, option 4 (47%) was ranking third and option 2 (84%) was ranked as the fourth regional priority by the majority of McKinleyville workshop participants. The majority of McKinleyville participants selected option 2 (65%) as their first regional priority, option 4 (41%) as their second priority, option 1 (70%) as their third priority and option 3 (70%) as their fourth priority within a regional context for public transit and paratransit services. Bicycle and pedestrian facilities option 2 (53%) was ranked first by a majority of McKinleyville workshop attendees. Option 1 (41%) was selected as the second regional priority and option RTP Page CI-13 Community Input Element
225 (47%) was selected as the fourth regional priority by a majority of workshop participants. An equal number of McKinleyville workshop participants selected option 3 (35%) as their third and fourth bicycle and pedestrian facilities priority. The majority of McKinleyville workshop participants ranked highways and roads option 3 (47%) as their first priority, option 2 (53%) as their second priority, option 1 (59%) as their third priority and option 4 (76%) as their fourth highways and roads regional priority Workshop participants were asked to break into small groups and discuss with one another the similarities and differences between how and why they ranked the options within the four modes of transportation and then a summary of the small table discussions to the larger group in attendance. The below information was received via the small table summary reporting: Similarities and Differences Goods movement option 3 is the most flexible A need for expanded public transit and paratransit, and increasing frequency in high use areas Increase public transit ridership and express routes Bicycle and pedestrian facilities, development within communities and then expand Share road in rural communities Public Transit option 2 is more efficient; improve ridership Expand services to those with no other options Develop facilities within communities Safety and education (bike and pedestrian safety on roadways) and across modes Hard to rank goods movement options Airport inefficient for goods movement Are we currently underserved? Who benefits from goods movement? Many people could benefit from goods movement for cost efficiency Betting on the industry coming Bicycle and pedestrian option 1 and option 4 are very similar Question education programs; do they work? Goods movement pinch points should be priority Need rail linkage with deep port; how do you develop the port? Bicycle and pedestrian increase frequency and service Small community we don t have transit volumes and ridership What do we want the county to be doing in the next twenty years? Larger communities need to be linked within, smaller communities needs links to larger communities 2008 RTP Page CI-14 Community Input Element
226 ADDITIONAL COMMENTS Community workshop participants were given a worksheet to record their prioritization of the transportation modes and the options within each mode (see Appendix). The worksheet contained a page for workshop attendees to provide additional written comments; the comments received are as follows: Let us give up on intercounty rail No new roads, regional gas tax to fund public transit For goods movement, encourage buy local movement The ultimate in my estimation is: accessibility; safety; more awareness of what is available now; education; needs assessment and how to achieve those needs There are economic benefits to having pedestrian trails Education, drive safely motor vehicle education It is my hope that Caltran s present review of the Manila Community Transportation Plan are incorporated in the 2008 RTP. Nothing in here about zip car renting a car by the hour so people wouldn t have to own a car. Focus on eliminating imports so we wouldn t need to transport so many goods. Zoning that is public transportation friendly rather than car friendly. Lowering the speed limit. We need more bike and pedestrian trails that are physically separate from highways that connect cities. I do not want any more funding of the North Coast Railroad Authority. I would like to see streets that are pedestrian and bicycle friendly and that through design and layout slow down motor vehicle traffic without creating more pollution, i.e., make it more convenient to walk or bike, less convenient to drive. Plan and design to encourage safe driver behavior. Video conferencing or busing of this first workshop to allow rural communities to participate, (i.e., Garberville, Willow Creek, Fortuna) for more viewpoints and interaction. I believe that light rail for within community transportation would be a wonderful way to think progressively about the future. So railroads do not only for movement of goods, but for movement of people. Also, I sense that HCAOG s process is not cutting edge in order to prepare us for peak oil and the exorbitant amounts that we are and will pay in the future. It s time to favor alternative modes to cars hooked on petroleum! And create incentives to helping people make the shift. If we practice now we ll be ready for true change that is already under way. There was a comment that roads and highways facilitate economic growth. I would dispute this. Increased automobile dependency harms our economy by compelling citizens to buy imported vehicles, fuel and parts, draining money out of our economy. I want to see an emphasis on ped/bicycle transportation to connect communities and to connect within communities. I want to see a priority on reducing our dependence on oil and reduce greenhouse gases. I have a particular interest in Hwy 255 and increasing safe 2008 RTP Page CI-15 Community Input Element
227 access. It is time to change the expressway status of 255 to a conventional highway. This will open up opportunities to respond to the current conditions and needs in Manila. We need trails, connections with recreational areas and we need to find a solution that would allow bikes and pedestrians to travel safely over the Samoa Bridge. What we need is a balanced, multimodal transportation system. We need current bike parking at bus stops. We need park and ride locations near bus stops. Why is there a park and ride lot at Herrick Avenue? What is the intended use of this site? Sidewalks are essential for transit riders. How can specialized transit such a casinos, non profit, be better coordinated than public transit? Why start with four modes and then arbitrarily group them? Transportation modes should consider using a triple bottom line economic, social and environmental. Using this analysis it is likely that transportation planning has overemphasized vehicular travel for too long. Other modes need investment similar to what vehicular travel has gotten till now. Non-motorized means should be incorporated into land use planning, convenient bus stops in places that do not lead to long off route travel, i.e., Bayshore Mall. Private connections from sidewalks or arterials to buildings should be improved. Why is there no pedestrian path to the Walgreens on Broadway unlike the one at Harris and Harrison? We need better data for transportation planning. The safety data is unreliable and poorly reported. People need ways to use resources better, such as car sharing, bicycle libraries, etc. My main interests are trails and safe roads that connect communities. The goal is to encourage a society with less reliance on fossil fuels, i.e., less cars. People should be able to get around with out their own, personal vehicle, safety and efficiently. Public transit should be more available. It d be great to be able to go from Blue Lake, Trinidad, Manila, Arcata, McKinleyville and Eureka at any hour of the day safely, and to stores, medical, schools, etc. I found that the modes and options listed on this worksheet were difficult to prioritize. Everything is super interconnected, so it s hard to differentiate. For example, I m currently very opposed to reestablishing rail service because it would make it much more expensive (+ possibly dangerous) to implement a trail commuter system on this right-of-way. So, what I know about reality and beauracracies affects my vision/dreams of a perfect transportation system. Active transportation and public transportation would take priority and automobiles increase safety-include lighting, separation of buses from active transport vehicles. Visioning, Educating what kid of future do we want? Then how can we get there? I want the following: (1) 9:15 p.m. bus from Eureka to Arcata, especially for ArtsAlive; (2) Sunday bus service; (3) Jack Pass equivalent for College of the Redwoods; (4) Allow passengers to travel between Arcata and Trinidad on Redwood Coast Transit (much faster than Redwood Transit System); (5) Trail between Eureka and Arcata on rail right-of-way; (6) Shift of freight traffic from trucks to water (shallow draft barges); (7) Add natural gas buses with long-term transition to hydrogen-natural gas mixtures (hythane) an eventually to pure hydrogen. Hydrogen to be generated from local, renewable sources; (8) Secure bicycle parking (bike lockers) in Arcata (transit center) and Eureka; (9) Bus Rapid Transit; (10) Car Share Service (zip care, flex car, etc; (11) Re-establish library bike program in Arcata and elsewhere; and (12) Automated bicycle rental RTP Page CI-16 Community Input Element
228 The county must use all its transportation development act funds for transit, bicycle and pedestrian services/infrastructure NOT roads! I didn t like the options in goods movement if the railroad where in good condition it would be a good option, but it needs billions of $ to return. We don t have a deep port to receive containers safely. I don t favor more air traffic. Thank you so much for all of the people who are putting time into the plan that affects all of us. I apologize if our community is a bit hostile, but it shows passion. I hope that the personal preferences ranking is not used as a statistical basis for a decision to total community ranking of these modes. There were only 21 people attending the McKinleyville meeting. I m sure the other meetings were not a large enough number to be an accurate sampling of the overall community. I would say this is a good approach but this needs to be sampled by all the Chambers of Commerce, Service Clubs, Presented to B.O.S. and other local governments (this is just a small list). All of which will be necessary to get a true sampling of Humboldt County needs and interests, or a cross sampling at Safeway, etc. I wonder how the RTP could better integrate with the circulation elements and the land use elements of the General Plans of each jurisdiction. I had difficulty ranking the GOODS options as they were written. The only that was close to being acceptable was Option 4. I am against developing port infrastructure so it may accommodate container ships. Also, reestablishing rail service is too expensive and impractical. An option that called for maintaining and improving existing highways would have been preferable. However, widening the highway at Richardson Grove is a bad idea. It s all interconnected. Why choose one mode only. Should be equitably balanced. Not too much over or under on any one mode. Be realistic. Every interest group promotes their special interest passionately and it shouldn t be a fight between the groups. Work together. Sure, a bike lane is good, but I can t ride a bike miles for services, especially on the days my body doesn t function (as I age and deteriorate). Move transportation investment away from car-centric I am also very interested in air travel for individuals such as an east-bound flight My second choice (highway and roads) was based on my interest in improvements on 255. Modes must be equally valued Goods movement, not one of these options is a choice of mine Goods movement option 1 to hard on Eureka Goods movement option 2, for public transit only Goods movement option 2, kill this Goods movement option 2, a black hole for money Goods movement option 2, cost to much 2008 RTP Page CI-17 Community Input Element
229 Goods movement option 2, can we get a billion dollar gift? Goods movement option 2, I support rail in general, but not viable and realistic to happen here with geology and keeping track open. Goods movement option 4: not economic, more air pollution CO2 at higher atmospheric levels Goods movement these all should be a 4 Goods movement option 4, Cost? More for people? Public transit and paratransit option 2, make it a viable alternative for people who have cars. Public transit and paratransit option 2, make more usable and convenient with increase usage. Public transit and paratransit option 3, alternatives to air and cars. Public transit and paratransit option number 1 and 4 pretty close to each other. Bicycle and pedestrian facilities option 1, for commuting and recreation Bicycle and pedestrian facilities option 2, make easier to get to bus stops/hubs Bicycle and pedestrian facilities Option 2, to schools Bicycle and pedestrian facilities Option 3, this should go hand-in-hand with all options Bicycle and pedestrian facilities Option 3, teach the parents to kick the kids out of the car Bicycle and pedestrian facilities Option 3, rural road size and condition make it more critical to be educated Bicycle and pedestrian facilities Option 4, Pacific Coast Bike Route is OK as it is in Humboldt. Coastal Trail would not get uses as much as routes to school, work, stores. Bicycle and pedestrian facilities Option 4, if we do this, we don t need option 1 Highways and roads option 2, modify, do not expand/enlarge Highways and roads option 3, wider in order for pedestrian, bike vehicle safety Highways and roads option 1, could there be CFDs for non road projects, trails? Highways and roads option 4, less cars equal less congestion Highways and roads option 2, I d rather see separate (but equal!) bike paths away from roads Highways and roads option 1, the roads we have are not maintained now, so nobody benefits, but more efficient maintenance, don t need new roads. Highways and roads Option 4, educate to carpool, other ways to reduce car usage and more emphasis on transit RTP Page CI-18 Community Input Element
230 COMMENTS RECEIVED VIA MAIL AND The public participation plan included an avenue for Humboldt County residents to provide written comments via or mail. An avenue for written comments was established for residents who were unable to attend the community workshops. The following written comments were received for the 2008 RTP update: Greetings HCAOG, Regarding the Regional Transit Plan, and as follow-up to the Eureka meeting we attended on April 21, 2008, we respectfully submit the following comments as social service providers for Humboldt & Del Norte County residents who are blind and visually impaired. 1. Please address increased public transportation to remote, rural, unserved and underserved geographic areas, in particular: Southern Humboldt, Orick, Blue Lake, Bridgeville, Loleta, and the Hoopa Valley. We provide itinerant services to people, particularly elders who are losing their vision loss at greater rates than the remainder of the population. Many of them do not drive and/or should not drive for their own safety and for public safety. Yet they drive or remain isolated in their homes not accessing medical care, community programs, or sometimes grocery stores. Their basic needs are not met and the cost of providing services and medical care costs the community a great deal in the long run. Their quality of life is poor and could be mediated by transit access to service hubs in more populated areas-- particularly in Eureka, Arcata, and Fortuna where there are hospitals and medical professionals located closely together. 2. Please address increased door-to-door Para transit services for elders who may not have the mobility or training to walk to the nearest bus stop in their town. As life spans increase, as the Baby Boomer generations ages in greater numbers, and as the north coast continues to attract retirees seeking affordable housing, the number of senior citizens are on the rise. Concurrently, the number of people with disabilities is on the rise, including vision loss, since aging often comes hand-in-hand with sensory loss be it vision loss, hearing loss, or both--dual sensory loss. 3. Please address universal access to transportation, including increased posting of current information electronically, in braille, large print, tapes, on CDs, and in Spanish. The local Spanish-speaking population is on the rise and will continue to rise in California, a border state long-known for its promise of employment and education for all. Public transit information includes: schedules, maps (could be tactile maps by request), fares, bus-stops, tickets, and any other printed text generated by a public transit system. Humboldt County residents who are deaf rely upon print communication, particularly if they are totally deaf and use American Sign Language as their primary mode of communication. Humboldt County residents who are blind or visually impaired rely upon bus drivers to call out all (not just some) of the bus stops to help them orient themselves to their place along the route. While some people have the presence of mind to count bus stops, most people who are blind 2008 RTP Page CI-19 Community Input Element
231 or visually impaired benefit from audible clues as well as alternative formats providing access to printed text. 4. Please address round-about traffic-calming measures. Although they are useful, community-enhancing, fuel-saving, and effective traffic-calming measures, they are notoriously difficult for people who are blind and visually impaired to cross. It is difficult to hear, predict, and negotiate the flow of traffic for pedestrians with vision loss who negotiate round-abouts and similarly configured traffic circles. 5. Please address audible pedestrian signals for people who are blind or visually impaired. As a rural community, rapidly developing, we have the advantage of building audible pedestrian signals into new signal installations at lower cost than it might be, otherwise, should they be an added measure down the line. Audible pedestrian signals, for busy intersections, are not only necessary, they can be life-saving. 6. Please address public awareness of mobility tools people who are blind and visually impaired use to negotiate Humboldt County. Dog guides, white mobility canes, and white support canes are three necessary tools for people to safely negotiate streets, determine depth, find curb-cuts, avoid trees, and other hazards found on roadways. The white mobility cane is also used for identification purposes, for automobile drivers, bicyclists, and pedestrians to allow persons who are blind or visually impaired extra time, extra space, or extra assistance as needed to safely negotiate public transit and public spaces. Both adults and children alike, who are blind and visually impaired, use mobility canes and receive training on how best to use it. 7. Please address traffic-calming measures and medians to separate pedestrians from automobile traffic to increase pedestrian safety. 8. Please address faded or missing crosswalk lines. People with low vision often rely upon the white crosswalk lines heavily for negotiating corners, walking across the street in a straight line, and finding the traffic signal at the other end of the cross walk. In Henderson Center, for example, many of the crosswalks are faded or missing, so pedestrians with some usable vision have difficulty orienting themselves to corners and safely crossing the busy intersections at F and Harris Streets or F and Henderson Streets. 9. Please address the unsafe intersection at V and Myrtle Avenue. Its proximal location to a fire station, two strip-malls, Silvercrest Residence (a low-income, senior housing complex), and its function as a primary route to hospital row, on Harrison Avenue, from Highway 101, makes this prime intersection one of the busiest in Eureka, CA. It is a dangerous intersection, complicated to cross for sighted individuals, let alone people who happen to be blind or have low vision. Four-way, controlled traffic, with a median strip, merge at this intersection. Additionally, automobile drivers make right-hand turns at fast speeds, lefthand turns on yellow lights, and crosswalks run more diagonal than square to corners. We receive numerous complaints, annually, from pedestrians who are afraid or had near-misses to cross this intersection RTP Page CI-20 Community Input Element
232 10. Please address the car-centric hospital row, not conducive to pedestrian traffic, on Harrison Avenue--between Myrtle Avenue and Harris Street. There is only one, semi-safe crossing at Buhne and Harrison, where there is a traffic-light, otherwise, pedestrians must often run across the street between cars who pick-up speed as they journey north or south or Harrison Avenue. Sprinkled with medical facilities and medically-related businesses, such as a pharmacy, Harrison Avenue includes restaurants, a bank, a hospital, a rehabilitation center, and Pacific Care Rehabilitation Center for seniors. Harrison Avenue hosts pedestrian traffic, but not many safety measures are in place for those pedestrians who need to cross from east to west, or conversely west to east safely. We have moved our office away from Harrison Avenue, to Henderson Center, for greater public transit access and for greater pedestrian safety. For the services Humboldt County does have, we are grateful. Transportation systems in rural areas suffer piecemeal funding and gaps in services; however, we believe Humboldt County could be the exception to the rule given its current Dial-A-Ride, Redwood Coast Transit System, Arcata-Mad River Transit System, Eureka City Bus System, and Quail System. We look forward to communication regarding additional feedback or resource ideas should HCOAG seek specialized knowledge about the Orientation and Mobility of people who are blind or visually impaired. Our home office, in San Francisco, now celebrating its 105th year in service regularly works with the city of San Francisco regarding transit and pedestrian planning and solutions. For more information, please call the LightHouse for the Blind and Visually Impaired at and ask for Vision Loss Resource Center Coordinator Jesse Lorenz. For local communication, please call me at the LightHouse or Doug Rose at the Humboldt Council of the Blind. He, as well as I, could direct you to pertinent resources. Thank you for addressing the above issues in regards to the Regional Transit Plan. Respectfully, Ali O. Lee Vision Loss Services Coordinator LightHouse of the North Coast 2008 RTP Page CI-21 Community Input Element
233 May 12, 2008 Dear Ms. Wilson, Thank you for the opportunity to comment on the new 2008 update of the Humboldt County Regional Transportation Plan (RTP) (Planwest Partners, 2006). It is exciting to be able to provide guidance on how our regional transportation system can better meet Humboldt County s changing needs. The increasing cost of fuel and continued escalation will cause a major shift in transportation patterns in Humboldt County that is already underway. We need to emphasize multi-modal transportation that includes bicycle and pedestrian trails that link our communities. Increased use of public transit is likely and the updated RTP needs to foster increased capacity to meet this need. I have thoroughly studied our railroad and shipping transport options and I provide some guidance on viability of both. Although I have been elected as Commissioner of the Humboldt Bay Harbor, Recreation and Conservation District (HBHRCD) for Humboldt County s Fifth Division, I offer the comments below as an individual. Railroad I believe that the updated RTP should include a realistic assessment of the prospects for reconstruction of an operating railroad in the next decade so that impediments to use of the right-of-way in the short term can be resolved. Studies commissioned by the HBHRCD (PB Marine, 2003) show that the North Coast Railroad authority stands to lose between $2-4 million annually, without shipment of on the order of 10,000-30,000 carloads of aggregate every year (Figure 1). PB Marine and Winzler and Kelly (2003) also stated categorically that large sea shipping of Asian containers or automobiles was also not feasible because of the distance from population centers and markets and the cost of trans-shipping goods. The Federal Emergency Management Authority (FEMA, 1998) estimated the cost of re-opening the NCRA through the Eel River Canyon at $640 million. Capital on this scale is not available to the North Coast and there is no viable business scenario under which reconstruction of the railroad is cost-feasible. Although some in the progressive community tout light rail as the future of public transportation, funding such projects is difficult for rural areas and it would lose too much money to maintain, if constructed. Furthermore, pulling riders off buses to ride light rail would reduce the viability of what is really our community s only viable form of public transit: buses RTP Page CI-22 Community Input Element
234 Figure 1. PB Marine found that the NCRA was likely to lose between $2-6 Million per year and would only make money if greater than 20,000 carloads of aggregate are shipped annually. Chart from PB Marine NCRA Economic Feasibility Study. Public Transit I am happy to see that Humboldt County has new hybrid buses and I hope that this trend will continue. We should continue to focus all public transit expenditures on buses and expand the fleet to include more hybrids and maybe some powered by other alternative fuels. Continuing to provide bike racks on buses will allow people to combine bicycle commuting and use of public transit. Bike and Walking Trails Humboldt County has the potential to draw millions of dollars from State agencies and/or the federal government to construct a system of trails that plug gaps in the California Coastal Trail and connect our communities. There is a huge well-spring of support for this type of project, as shown by the very high use of the Hammond Trail in McKinleyville. By offering ways for people to get to the store, school or HSU without using their car. Many economically disadvantaged people will be able to travel safely without using fossil fuels and without cost, which also has substantial cumulative benefits for our economy as less money leaves the County for energy. Short term economic benefits from construction would be followed by longer term increases in tourism and jobs as we re-brand Humboldt County as the place to come for a bicycling vacation. Studies in other areas have also proven that community health is improved as a result of increased walking and bicycle commuting, which helps decrease the cost of medical care and the burden on services in the long-term RTP Page CI-23 Community Input Element
235 The most logical location for these trails is along established railroad right-of-ways because there are 1) intact easements, 2) appropriate grade and 3) there is no indication of short-term revival of the railroad as a viable enterprise over the next decade (see Railroad below). Because the North Coast Railroad Authority does not have plans in the short term future for re-opening service to Eureka, there is the real prospect that right of way will be lost or fragmented. Therefore, ironically to protect future rail options in future decades, maintaining easements through rails-to-trails makes sense. An immediate priority for establishment of a rail to trails conversion is the old Annie and Mary Railroad route between Arcata and Blue Lake. The easement for the NCRA that links Arcata and Eureka also makes sense as a priority. The new Caltrans Highway 101 Mad River bridge project should consider including a short link along the dike downstream to the Mad River beach access road that acts as the northern extension of the Hammond Trail. Bike trails could also be established on or adjacent to rural roads that are targeted for upgrading and trial programs established where rural residents are made aware of new sources of revenue for maintaining their access but with the understanding that they will improve efforts to share the road with bicyclists. Healthy Rural Roads While freeways provide quick and convenient modes of transport, they represent the homogenization of our community whereas rural roads maintain the character of our area. Additionally, many residents of remote parts of the 1 st, 2 nd and 5 th Districts rely more on County roads more than State or federal highways. In the long term, maintaining and improving these roads helps keep the County connected, but if routes were well maintained, they could also be promoted as scenic drives for tourists and possibly accommodate bicycle routes where appropriate. Specifically, instead of adding lanes or more clover leafs to Highway 101 between Eureka and Arcata, Caltrans needs to consider funding upgrades for Old Arcata Road so that it can handle traffic as an alternate to Highway 101. It would also make sense to build a bike trail parallel to Old Arcata Rd. or to expand the shoulder to accommodate a bike lane. Shipping Future shipping options for large scale industrial port operation with container ships or automobiles are inviable (PB Marine and Winzler & Kelly, 2003). Therefore, shipping enterprises should be shaped around meeting local import and export needs, including short sea shipping as fuel costs change costs to favor barges over truck transport. Thanks for this opportunity to comment. Sincerely, 2008 RTP Page CI-24 Community Input Element

236 Patrick Higgins References Federal Emergency Management Authority Estimated cost of reconstruction of the North Coast Railroad through the Eel River Canyon. FEMA, Washington D.C. PB Ports & Marine, Inc. and Winzler and Kelly Port of Humboldt Bay Harbor Revitalization Plan. Prepared for the Humboldt Bay Harbor, Recreation and Conservation District. Eureka, CA. PB Ports & Marine, Inc North Coast Railroad Authority Economic Feasibility Study. Prepared for the Humboldt Bay Harbor, Recreation and Conservation District. Eureka, CA. *** Please contact Green Wheels for a copy of the Bus Rapid Transit Feasibility study submitted to HCAOG RTP Page CI-25 Community Input Element
237 To planners: Bike Trails: My husband and I currently work commute from Arcata to Eureka and back 3-4 days/week on our bikes. We try to carpool and use the bus the other days. We feel very motivated to continue as long as possible. We LOVE to do this--for the exercise, the beauty, the lack of climate impact. We commute the 101 corrider and have gotten over our initial fears but do not feel it is the safest experience, especially on the northbound route, due to off ramps. We are very willing and eager to do our part towards reducing global warming and would greatly appreciate your support through the creation of a separate bike trail as soon as possible. PLEASE!!! Busses: I ride the Arcata-Eureka bus also when I cannot ride my bike. My experience is generally pretty positive but I am concerned about the rainy season. Can we have rain shelters with benches at ALL the bus stops? Encourage bus ridership with shelters to wait in. Thank you. Cathy and Bill Chandler-Klein PROCESS COMMENTS At the end of each community workshop, participants were asked to provide comment on the process used to solicit input. The information below is result of process comments received at the community workshops, in addition to written comments received via . Post notice of results and outcomes, timeline and history Personal conflicts about transportation priorities no facilitator at table Need more information and assistance at table Broader dialogue desired Did not like categories within highway/roads and goods movement problems with individual options *Good facilitator Not enough information (for some) information presented was good Great discussion hearing others priorities Discussions helped people become more creative Skewed toward public transit Difficulty with range of options (goods movement) not economically feasible Wording of highway and roads not clear How can we facilitate table conversations? What is HCAOG? 2008 RTP Page CI-26 Community Input Element
238 How much money is at stake? Better understanding of rules - what are resource limitations? Less abstract (unclear about HCAOG funding and how much money is spent) Public transportation Would appreciate a broader range of interest groups Highways and roads options new categories Difficulty separating theories versus realities are fantasy options realistic? Don t understand our role Certain interest groups are underrepresented Like to see HCAOG hold these meetings in underserved communities (they need it the most) What decisions are facing the group so we can be more helpful? For visioning we need to educate about trucking system inefficiencies From official if it s focused decision makers, see what community wants More information How can you determine when you don t know? Background information on website No real sense of how this fits into bigger picture 101 corridor Introduce previously identified priority projects Specific information on priorities of prior projects Information on website Outcome of previous RTP priority projects Reference HCAOG website in PSA Link to 2006 Plan in More advertising (radio, and T.V.) 2008 RTP Page CI-27 Community Input Element
239 I m not sure what the reasoning was behind the location selection, but I am concerned that the Fortuna and Mky locations are not close enough to distance reaches of the county, while they are both only 20min from Eureka. I would suggest that the workshop for So. Hum be in Garberville, which is 50 min away from Island Mtn, and Shelter Cove. For No Hum, I suggest Hoopa which is an hour away from Orick and Somes bar. These might not get the numbers of people that are in the populated areas, but they would get the diversity of folks from different communities, especially since these areas are under/unserved by the county. Mark Schaffner - HCOE Vocational Caseworker Please run the buses, both city and county, on Sundays. Why are you having the community workshops in Eureka at the Wharfinger Building at a time when the City Bus is not operative? We need workshops in the morning or the afternoon, please. Patricia Cottrell Will there be a workshop in the Redway Garberville /Avenue of the Giants areas? Thanks Christina Huff I am writing to complain that you aren't doing any workshops in So. Hum. which is almost completely unserved by our county regional transportation and I think we need to be included. Is it too late to get a workshop scheduled for the Garberville Redway area? Please let me know because some people have been asking why you aren't planning one. Thanks. Patti Rose I read in the Eureka Reporter of your planned meetings to discuss transportation needs in Humboldt County. I would like to tell you that you have excluded a very large segment of the interested community by having all your meetings in the evenings when public transportation is not available. How can we express our voices to your organization? Those of us who take the bus or dial a ride system have been left out. Henry N. Willey, Far North Regional Director California Network of Mental Health Clients 2008 RTP Page CI-28 Community Input Element
240 Thank you for your interest in discovering the transportation priorities for our region. I m sure it would be helpful to have meetings closer to the Southern Humboldt portion which is underserved in public transportation. Thank you, Stephanie Steffano-Davis SUMMARY OF PUBLIC PARTICIPATION PROGRAM Community Workshop Exercise One It is interesting to note that the majority of Eureka and McKinleyville participants prioritized three modes of transportation similarly; bicycle and pedestrian facilities was ranked as the number one priority, public transit and paratransit services ranked second, and goods movement was ranked fourth. However, a majority of McKinleyville participants selected highways and roads as their third priority, a majority of Eureka participants were equally divided with 38 percent ranking highways and roads third and 38 percent ranking Highways and roads fourth. For workshop exercise one, Fortuna residents prioritized the modes in the following order: public transit and paratransit, highways and roads, goods movement and bicycle and pedestrian facilities. Although the prioritization is not representative of Humboldt County residents, the results obtained from the workshop prioritization indicate that opinions regarding the prioritization of transportation modes may differ depending on their geographic location within Humboldt County. Community Workshop Exercise Two Eureka, McKinleyville, and Fortuna Community Workshop participants selected goods movement option 3 (eliminate STAA pinch points on US 101 and Highway 299 to facilitate the movement of goods via STAA trucks) as their first regional priority for goods movement. Public transit and paratransit option 2 (Increase the frequency of public transit service in areas already served by adding express transit service and direct routes) was selected as the first regional public transit and paratransit regional priority by workshop participants in Eureka, McKinleyville and Fortuna. Eureka and Fortuna workshop participants, selected bicycle and pedestrian facilities option 1 (develop pedestrian and bicycle trail connections among communities) as their first regional priority for bicycle and pedestrian facilities within a regional context. McKinleyville workshop participants selected option 2 (develop pedestrian and bicycle trail connections within communities) as their first bicycle and pedestrian regional priority. For highways and roads, the participants at the three locations selected different options as their first priority. Eureka participants selected option 2 (increase major road capacity to accommodate other modes of travel) as their first priority, Fortuna participants selected option RTP Page CI-29 Community Input Element
241 (established funding mechanisms will be used to maintain and rehabilitate existing major roadway infrastructure. New secure funding mechanisms would be used to maintain and rehabilitate new local/access roads) as their first priority, and McKinleyville participants chose option 3 (implement major and local road improvements that increase vehicle, bike and pedestrian safety) as their number one priority. PUBLIC COMMENT ON DRAFT RTP A second round of community workshops were held to solicit the community s input on the Draft 2008 RTP. The second round of community workshops were held at Azalea Hall in McKinleyville, the Rio Dell Fire Hall, and the Humboldt Bay Aquatic Center in Eureka. The comments received from the second round of community workshops are as follows: Highway and Roadway Transportation System Element Policy HR4 Add transit reference to policy (with bike and pedestrian) How does the RTP relate/consistent to city and county general plans? RTP does reflect planning from city and county plans - programming roadways for their general plans What is the benefit to cities and counties projects put in RTP are eligible for funding, programming benefits Service providers get certified by HCAOG funding eligibility Policy HR 6 Non-freeway alt s loss of freeway bypass Eureka. Funds committed to Eureka Funds used for non-freeway improvements 4 th and 5 th /R Waterfront Drive still needs permits Health impacts decrease vehicle miles positive H. I. Set as goal Congestion at 14 th, 15 th, Del Norte, and Hilfiker (what about between 15 th and Del Norte?) also congestion on the 101 Illustrative projects on Broadway/ Closing Fairfield? Aren t there other Broadway projects? Other signals that create delay (e.g. two-way signal at Henderson) Public Transit and Paratransit Service Element Good graphics Does the needs assessment influence projects; or are projects identified in the needs assessment carried out? 2008 RTP Page CI-30 Community Input Element
242 Transit service in McKinleyville (example: Grange and Central) needs to be more frequent There needs to be an increased frequency of transit between McKinleyville and Eureka. Express bus with less stops It is important to look at what we have look at stops and time corrections There should be no parking near bus stops. Need park and ride facilities Transit providers need to maintain ratios, which causes problems No transit to/out of Samoa. The development will increase population the transit needs. The increase in fuel costs and aging population will increase ridership. This needs to be an assumption Impressed with Jack Pass program financing mechanism for transit. This concept should be expanded to large employers Bus rapid transit should be implemented between communities There needs to be Sunday bus service Evening service should be extended Illustrative projects should be implemented when feasible Good A lot of what has been mentioned in this workshop is in the RTP Quail is an important service in southern Humboldt only a single vehicle provides service Scheduling is incorrect, correct schedule is as follows: 1 st and 3 rd Tuesdays Eureka 2 nd and 4 th Tuesdays Fortuna Monday, Wednesday, Thursday Senior Center in Redway 1 st and 4 th Friday around Redway/Garberville No service 5 th Friday Reservations taken for appointments; local stops In Fortuna stops at library / banks Restrictions for riding have increased. It is hard to comply, which affects ridership Value of the service doesn t always get into evaluation. Look at benefits of the service Service is in jeopardy. The original concept included feeder lines Can t use Quail to get to HCAOG workshops How much money goes to publicizing service? Some flyers sent from HTA Almost seniors aren t able to ride Quail. Minimum age has increased from 55 to 60 years old 2008 RTP Page CI-31 Community Input Element
243 Use of Quail seniors and disable mixing of populations to be considered but could increase ridership Emphasis on Bike/Pedestrian may drain resources for transit Quail is only transit south of Scotia Health care providers and teachers working in Rio Dell/Fortuna areas could benefit from transit to and from southern Humboldt Accessibility of transit vehicles limited. Can be deterrent to use Opportunities for input on services use different media outlets Health districts are important entities for providing input on public transit issues Keep the Quail! Look into broadening transit service to southern Humboldt Get any proposal in the plan for transit How does this fit into Coordinated Transit Plan being prepared There are funds for capital expansion not operating and maintenance or increased frequency For 5310 funds, it used to be that you had to be in top 20% to get funded. Now you need to be in top 50% - getting funding is easier More coordination between three public transit providers Jack pass for HSU not CR! Looking at ways to increase ridership to increase frequency education about transit system Ridership has increased Times that accommodate commuters Replacing buses due to air quality standards CARB has not certified hybrids, but has certified clean diesel Working with Oregon Department of Transportation (ODOT) and Caltrans to run the Redwood Coast Transit (RCT) up 199 to Grants Pass. Need to provide service to Grants Pass either by Amtrak, Greyhound or RCT Need transportation east on 299 also Try to get people out of cars plug the holes Intermodal transit at HSU 75% A&MRTS riders are HSU students/ 50% of HTA riders are HSU students include child care center/cleaners one stop location Education programs around transit/costs/limitations Land use is an issue move out to periphery when you are mobile, then need/want service when you are not mobile 2008 RTP Page CI-32 Community Input Element
244 Make transit convenient Provide transit where it is not currently provided; in areas where cars cannot be conveniently parked Should include a note about continuing to explore other transit options Difficulty for folks when HTA offices are closed from 12:00 to 1:00 pm Dial-A-Ride/Dial-A-Lift tickets cannot be purchased on bus Need to extend service into Cutten It would help to connect transit riders with regional transportation especially for medical appointments out of the area Public Transportation Element: lack of long-term planning Bus rapid transit (BRT) signal pre-emption on Broadway makes sense Funds from Homeland Security, make use for emergency services vehicles as well Analyze stops, perhaps on leading side of intersections Hard to put in queen jumps north of Wabash Express routes are very important; increase express service, especially from McKinleyville to Eureka (# of stops in McKinleyville is a barrier) Curious about how transit is included in Ridgewood Village Project will be needed; with any development projects that don t have infrastructure transit requirement Expansion of transit service to McKinleyville: airport access should be one of the major goals in the future Evening service expansion could better serve social activities (example: Arts Alive, downtown outings) What about just Fri and Sat as a pilot project Why does last bus dead head from McKinleyville to Eureka (with no passengers)? Could they take to 4 th and V? It doesn t seem infeasible to meet this need Bike and Pedestrian systems Element Increased signage/signals for the visually impaired Look at specific intersections Make materials accessible in brail Increase bike racks at public facilities Public access as a requirement for coastal permits (myrtle Ave and Harley Store) 2008 RTP Page CI-33 Community Input Element
245 Bike facility at Audubon Society/along bay access Bring Pedestrian facilities up to ADA requirements Funding for Bike and Pedestrian surveys for performance measures New trail between Wabash and Herrick to continue trail to King Salmon Bike/trail safety needs to be a top priority Connecting trails bike boulevards Big dots stop cars from going into bike lanes Bike education policy for adults and kids Need better pedestrian crossing between Henderson and Wabash; Perhaps an overpass from bluff or stairs? Overpass from library to Waterfront Drive Develop Vigo Street as Waterfront /trail access Need a separate facility on Samoa Bridges because many Somoa and Eureka residents are carless; would also be beneficial for visitors to access the beach including safe crossing of Navy Base Road Need a trail between Arcata and Eureka on Rail corridor Bringing back the Rail doesn t seem realistic/feasible Trans Systems study = $.5 million in hole annually Old Arcata Road/Myrtle need bike lanes and speed humps Speed reduction/traffic calming needed on Glen Street and Fairfield in Eureka; the park attracts many kids, there are many bicyclists, and many carless households in this area Annie and Mary = add Arcata to Glendale segment in long-term projects Need a solid, high quality Class I from Blue Lake/McKinleyville to Willits; it is needed as a backbone Positives aspects of Element: Using information from PATH, policy Charrette, HIA Highlighting complete streets as guiding concept Considering health benefits of biking and walking Bike and pedestrian LOS Linking bike facility systems with transit hubs (see policy Charrette and General Plan Update to expand hub concept) Shared lane pavement markings or sharrows in Arcata are a good case study to watch 2008 RTP Page CI-34 Community Input Element
246 Timing is good for alternatives to single occupancy vehicle use (e.g. park and ride full) there are good opportunities to pursue transit, carpooling, bike/pedestrian Long-Term Projects: It is great the Ave. School Road Projects done can a flashing speed/radar sign be done? And expand to other Ave. Communities? Negative aspects of Element: Language is soft much stronger on roads element. Too much could not shall Need more clarity: what percentage of available funding is actually used for non-motorized transportation (e.g. Transportation Development Act (TDA) funding)? Policy language should utilize max funding? Complete streets concept should be expanded to complete neighborhoods in order to incorporate land use influence on non-motorized transportation. Bike and pedestrian LOS could be stronger do more than provide information and encourage use - a process should be adopted There is a lack of attention to needs/demand for traffic calming on 255 in Manila Travel Demand Management (TDM) has a role - TDM is addressed in transit, but not in the Bike and Pedestrian Element - HCAOG needs to actively promote TDM, not just encourage reducing Vehicle Miles Traveled (VMT) Coordination with General Plan Update doesn t give direction on how, instead just a list. HCAOG s RTP should be adopted as official policy for all local governments, including the General Plan Update for Humboldt County North Bank Road (State Route 200) needs to be safer. There needs to be an intersection with HWY 101 and up Central Avenue in absence of A& M trail, it is the only option Class II (not III) Need improved shoulders for Dow s Prairie Road Manila: social justice issue without access to a store by bike/pedestrians, there needs to be a trail - also the Samoa development will exacerbate the need and traffic safety issues Consistent, annual bike safety education campaign is needed Left turn pockets for bikes??? Need covered bike parking at transit stops so people can leave them Area buses are exceeding capacity for bikes - Bike lending stations (like in Europe) should be encouraged so people can just borrow bikes (plus they could be subsidized by transit) need more bike racks on buses Reducing VMT will reduce gas taxes that pay for non-motorized transportation and transit Bike lane on Rohnerville Road doesn t have a real destination Include adjacent trail in Richardson s Grove Project 2008 RTP Page CI-35 Community Input Element
247 SR2S projects emphasize importance and role in bike/pedestrian system Encourage State and National Parks to develop Class I trails instead of pushing them into Caltrans corridors they have much more attractive facilities and set backs from highways Need creative solutions with schools on Highways (e.g. South Fork High needs a diagonal crosswalk, local district not open to it) Goods Movement Thanks for including Rail graph Take care of highways before rail, though we need rail too STAA access to North: it exists when FHWA approves Big Lagoon Project General Comments Redundancy of planning processes with Nelson/Nygaard and RTP efforts - It is important that the public understands both processes and relationship Can be hard in southern Humboldt to know public processes are happening workshop survey question responses might be influenced by where people live and the options they think they have Concern for continued function of the Quail Can there be a meeting in southern Humboldt? Humboldt County residents could also submit comments on the 2008 Draft RTP via or mail. Following are the written comments received, regarding the 2008 Draft RTP. Dear Mr. Clifton and Ms. Wilson, Thank you for providing a forum for members of the general public to provide input regarding Humboldt County s Regional Transportation Plan (RTP). After a careful review of the Highway and Roadway Transit System Element: Table HR8 Long- Term (11-20 years) Roadway Projects, I note that the majority (11 out of 15) of the projected long-range roadway projects are within one single region (within the jurisdiction of the Eureka Community Plan (ECP), as part of the Humboldt County General Plan Vol. 11.) Zoning for the ECP area has procured the highest transference of rural residential and timber production (TPZ) lands to high-density development in Humboldt County to date RTP Page CI-36 Community Input Element
248 As table HR8 depicts, roads will need to be expanded, improved, built, and subsequently maintained. My concern is the change in traffic density, patterns, and modes of transport. The effects on bicycle and pedestrian safety and existing vehicle motor transport will provide us with a region that is no longer livable or safe. The ability to fund such growth will continue to be challenged throughout the years to come. Funding Once the improvements are made and the new roads built, continued funding for their maintenance will be needed. It is fiscally much wiser for the county to encourage growth in areas that have existing roads rather than expanding into areas with no roads. Additionally there will be, as you aware, a large need for major improvements in order to develop such plans for development. Conversion from rural residential traffic to commercial traffic With existing plans for high density development and large retail locations, the nature of the traffic will change dramatically. Potential for bottle-necking of large commercial trucks within a region of five existing schools and residential homes is a major concern. Unsafe Traffic Levels According to the ECP, traffic levels will be at 200 % capacity on Walnut Drive, resulting in unsafe traffic levels which should be addressed. Reduction of Pedestrian and Bicyclist Safety Cited as the largest concern for District 1, bicycle and pedestrian safety will likely be reduced for the existing neighborhoods, due to large increases and changes in both types and levels of traffic. Thank for your time and consideration. Anna Hetko In addition to the oral comments that I made at the public meeting on Tuesday I have the following written comments. There are three places where I have questions about the data and assumptions presented in the plan. 1) On page I-3 the plan discusses an increased demand for travel. On page I-5 it says that population growth is projected to increase at.6% annual growth rate. On page I-14 there is a chart of projected vehicle miles traveled. But because the units are different and there is no percentage increase given for vehicle miles traveled, the relationship between vehicle miles 2008 RTP Page CI-37 Community Input Element
249 traveled and population growth is unclear. Are they growing at the same rate or is one growing faster than the other? Are there projections for demand for other modes of travel? 2) For Redwood Transit Service and Eureka Transit Service riders requesting early morning service were most likely to generate additional business (Pages PT-15 and PT-16) while for Arcata and Mad River Transit Service Saturday service was most likely to increase patronage (PT-16). What are the differences that led to these differing projections? 3) On page EC-4 it says that "Table EC-1 shows the expected level of increase in vehicle miles traveled and mobile emission levels if no improvements are made to the existing transportation system." Table EC-4 shows all pollutants going down. The table and the text here and on page I- 18 seem to be in conflict. Is pollution from mobile sources going down or up? Also, I have a couple typographical errors and clarifications. Introduction Page I-1 no discussion of Policy Advisory Committee Page I-3 and Page EC-4 There is no explanation of the difference between class I and class II air sheds. Highway and Roads Page HR-1 The report discusses an "Interstate" freeway. There is no Interstate facility in Humboldt County. Page HR-5 It would be helpful to clearly explain where Buckhorn grade is. Page HR-6 Table HR2 discusses Mall 101 ramps. This should read Umpqua Bank Plaza ramps to match the current land use. On page HR-7 in Table HR 3 there are no subtotals for Arcata and Humboldt County. Page HR-23 U.S. Department of Forestry should read United States Forest Service. Goods Movement Page GM -2 It says "there are narrow, windy sections of these highways." This should probably read winding. Page GM-2 Humboldt Bay Recreation and Conservation District should read Humboldt Bay Harbor, Recreation and Conservation District. Page GM-24 There is no explanation of what a class 3 railroad is. Page GM-24 There is no explanation of what SMART is. Aviation Page AS-1 It should read urban "areas" with major medical centers. Public Transit PT-6 It reads "tuition fees." This should read enrollment fees. Under the California Higher Education Master Plan California residents do not pay tuition. PT-13 There are two Amtrak buses daily. See attached schedule. Community input Page CI-16 My comments were poorly transcribed. It should read:" Using this analysis it is likely that transportation planning has overemphasized vehicular travel for too long." "Private connections from sidewalks or arterials to buildings 2008 RTP Page CI-38 Community Input Element
250 should be improved." "Why is there no pedestrian path to the Walgreens on Broadway unlike the one at Harris and Harrison?" "People need ways to use resources better, such as car sharing, bicycle libraries, etc." Sincerely, Jeremy Mills Comments on draft 2008 RTP, Submitted by Rudy Ramp 1. I could not find where parking was addressed anywhere in the draft 2008 RTP. Since vehicle parking consumes considerable and valuable space, and is an integral part of the transportation system, I would like to see it addressed either in the Highways and Roads Element or as a separate Element. 2. It is my understanding that States have the flexibility to shift federal government allocated transportation funds from roads to transit. I would, therefore, like to see the following objective added to Policy I-4: Advocate for and support any lobbying initiative designed to increase the allocation of federal and state transportation funds for public transit services. 2. Considering the impact commercial trucks, particularly logging trucks, are having on our rural roads, I believe Policy GM-4: Support existing commercial truck weight fees and timber taxes. needs to be reconsidered and reworded to ensure that adequate revenues are generated to adequately maintain these rural roads. 3. I would like to suggest that the Objective for Policy GM-13 be amended to read as follows: Support and encourage the NCRA s efforts to thoroughly study the economic viability, and environmental and quality of life impacts before making decisions related to the reestablishment of freight and passenger rail services in and out of Humboldt County. Support NCRA efforts to... To: Humboldt County Association of Governments From: Kaye Strickland Date: June 23, 2008 Subject: 2008 Humboldt County Regional Transportation Plan Most of my concerns have already been expressed at your Workshop Sessions, and I think they have been quite well covered in the Draft RTP Page CI-39 Community Input Element
251 However, I do want to reiterate several specific points that are very significant to my group, Citizens for Port and Rail Development, and would hope that this can be included in the Pub. Hearing Portion of your meeting on Thursday. * It is our mail concern that the rail right-of-way around the Bay, and the tracks stay in place. It is very necessary to bring back this whole rail line, all 300 plus miles. * There are several potential freight uses, that are waiting to be able to utilize the freight capability, * There is the Timber Heritage Association currently preparing the line from Samoa toward Arcata, with the hope of being able to utilize a portion of it later this summer. * The THA is working to create a Rail Heritage Museum at Samoa, below the Cook House, and a Tourist Train which with the combo of CookHouse, Museum, Rail line, Madaket, and the Bridge with improved Bike Lanes can be a win win situation. * I also want to make it positively clear, that we do not object to the Trails that Green-Wheels and the Trail Group are looking to have around the Bay and between Eureka and Arcata. We support them, but they MUST BE SAFE, MULTI-MODAL and PROPERLY LOCATED for bikes, walkers, etc., and it is beginning to look like the a route on the east side of the highway is the best and safest location. * I also like some of the ideas that Green-Wheels are proposing, but hope it could be accomplished without any new infra-structure having to be built. I m sorry I cannot be there in person, but I have to be at the Harbor Dist Meeting, same date/time, re utilization of their Redwood Marine Terminal Business Plan, and the opinion that the railroad has to be a part of the mix. This was the conclusion of the Goldman Sacks offer as well. Sincerely, Kaye Strickland, for CPD/R Dear HCAOG: I appreciate the opportunity to participate in the Regional Transportation Plan, and request that you consider the following: 1. Explore funding available for Humboldt County connectors to California Coastal Trail system and trails to promote alternative forms of transportation within and linking our communities RTP Page CI-40 Community Input Element
252 2. Support transportation systems that reduce fossil fuel use and greenhouse gases, especially increase in bus service with electric, hybrid, and other alternative fuel vehicles. 3. Support bike libraries and facilities for ease of bicycle transportation. 4. Give high priority to transportation of locally-produced goods and low priority to foreign or out-of-state imports, and priority to barges over truck and container modes. 5. Keep 101 safety corridor between Arcata and Eureka as is. Institute 55 mph speed limits everywhere for increased safety and fuel efficiency. 6. Install speed tables on School Road, Ocean Drive, and Hiller Aves in McKinleyville where speed limits are routinely not enforced and neighborhood children and pets are at risk. Thanks you very much for your consideration. Joyce H. King Dear HCAOG, This letter is to address the concern of traffic safety as a result of high-density development in Humboldt County. One of the areas of concern is Cutten and its surrounding communities. In regard to public hearings held by the county, citizens have expressed their concerns with the increase of traffic since the year Respected community members agree that the public schools in the surrounding vicinities have become unsafe due to bottlenecking of traffic and excessive road use. As a result of extensive crowding, pedestrians such as school children are now challenged with their own health and safety. Also, children who use bicycles as a form of transport are highly at risk. In Eureka, Harris Street has been documented as the highest vehicle/pedestrian accident- prone area. This trickle-down effect from Harris Street has already caused unsafe conditions and consequences for surrounding schools and their communities. The county should be responsible in maintaining a safe and rural environment for Eureka s outlying areas. The focus for future development should occur in areas where roads and its underlying infrastructure already exist. Hence, maintaining and improving preexisting roads cerates in the process a safe and healthy environment for all communicates who share out counties roads. Thank you for your time. Donna Alvarado 2008 RTP Page CI-41 Community Input Element
253 Dear Spencer, I attended a couple of HCAOG-sponsored workshops in June at the Adorni Center and at Azalea Hall. These are my comments on the Humboldt County 2008 Draft Regional Transportation Plan Update, Public Transit and Paratransit Service Element. I urge that HCAOG needs to make drastic changes in the availability of public transit for people to get to work and to school, without having to drive a car to get there. This is necessary because of 1) the impact on the environment of excessive CO 2 emissions due to increasing dependence on automobiles to get to work and school; 2) the rising cost of fuel to get to work and school, particularly with the high impact on low income households; 3) the health impact on childrens and adults lives of being dependent on cars to get to work and school. There needs to be an increase in funding for public transportation so that both the current Planned Projects of replacing buses and shelters listed on the top of page 23 of this element can be funded as well as the Illustrative Projects listed at the bottom of page 23 - of expansion of service farther into the evenings and on Sundays, and new routes. I am strongly in support of a bus rapid transit system as proposed by Green Wheels that would allow commuters coming to Eureka from outlying areas to get to work and school quicker. In my case, even if I bike to the nearest bus stop on Central Avenue, and put my bike on the bus, it is another hour to get to Eureka from Northern McKinleyville. If it is not possible to secure the extra funding that is needed, I would support a mix of replacing some of the buses and shelters, but also to move forward on some of the route expansion/frequency initiatives, rather than foregoing the Illustrative Projects completely and only replace buses and shelters. Sincerely, Bill Rodstrom 23 June 2008 Letter concerning a need for roadway repair: I frequently ride my bicycle through the Arcata Bottoms to the Hammond Bridge and points north. As one is riding Mad River Road north to the Hammond Bridge, the last 150 yards of the roadway before the bridge is in horrendous condition. The road surface here is highly eroded and potholed pavement. I ride my bicycle all over Humboldt County, and I find this segment of county road to be one of the most punishing and damaging that one can encounter. This is a significant problem, as this segment of roadway cannot be avoided if one wishes to ride the Hammond Trail from Arcata. Thus I am writing to request that this segment of Mad River Road 2008 RTP Page CI-42 Community Input Element
254 be resurfaced. As we move toward $5 per gallon gasoline, local government needs to encourage and facilitate bicycle riding. Please make this repair a priority. Thank you, Steven Hackett 2008 RTP Page CI-43 Community Input Element

255 2008 RTP Page CI-44 Community Input Element

256 2008 RTP Page CI-45 Community Input Element

257 2008 RTP Page CI-46 Community Input Element

258 2008 RTP Page CI-47 Community Input Element

259 2008 RTP Page CI-48 Community Input Element

260 2008 RTP Page CI-49 Community Input Element

261 2008 RTP Page CI-50 Community Input Element
AGENDA ITEM NO. 5b HCAOG TAC meeting of May 8, 2014
 Humboldt County Association of Governments Eureka, CA, 95501 AGENDA ITEM NO. 5b HCAOG TAC meeting of May 8, 2014 DATE: May 1, 2014 TO: HCAOG Technical Advisory Committee (TAC) FROM:, SUBJECT: Letters of
Circulation in Elk Grove includes: Motor vehicles, including cars and trucks
 Circulation, as it is used in this General Plan, refers to the many ways people and goods move from place to place in Elk Grove and the region. Circulation in Elk Grove includes: Motor vehicles, including
Transportation Master Plan Advisory Task Force
 Transportation Master Plan Advisory Task Force Network Alternatives & Phasing Strategy February 2016 BACKGROUND Table of Contents BACKGROUND Purpose & Introduction 2 Linking the TMP to Key Council Approved
Regional Transportation Needs Within Southeastern Wisconsin
 Regional Transportation Needs Within Southeastern Wisconsin #118274 May 24, 2006 1 Introduction The Southeastern Wisconsin Regional Planning Commission (SEWRPC) is the official areawide planning agency
Solana Beach Comprehensive Active Transportation Strategy (CATS)
") Solana Beach Comprehensive Active Transportation Strategy (CATS) 3.0 Goals & Policies The Solana Beach CATS goals and objectives outlined below were largely drawn from the Solana Beach Circulation Element
Solana Beach Comprehensive Active Transportation Strategy (CATS) 3.0 Goals & Policies The Solana Beach CATS goals and objectives outlined below were largely drawn from the Solana Beach Circulation Element
Exhibit 1 PLANNING COMMISSION AGENDA ITEM
 Exhibit 1 PLANNING COMMISSION AGENDA ITEM Project Name: Grand Junction Circulation Plan Grand Junction Complete Streets Policy Applicant: City of Grand Junction Representative: David Thornton Address:
Bicycle Master Plan Goals, Strategies, and Policies
 Bicycle Master Plan Goals, Strategies, and Policies Mobilizing 5 This chapter outlines the overarching goals, action statements, and action items Long Beach will take in order to achieve its vision of
MCTC 2018 RTP SCS and Madera County RIFP Multi-Modal Project Eval Criteria GV13.xlsx
 MCTC 8 RTP SCS and Madera County RIFP Multi-Modal Project Eval Criteria GV.xlsx Madera County Transportation Commission Regional Transportation Plan / Sustainable Communities Strategy Multi-Modal Project
CITY OF COCOA BEACH 2025 COMPREHENSIVE PLAN. Section VIII Mobility Element Goals, Objectives, and Policies
 CITY OF COCOA BEACH 2025 COMPREHENSIVE PLAN Section VIII Mobility Element Goals, Objectives, and Policies Adopted August 6, 2015 by Ordinance No. 1591 VIII MOBILITY ELEMENT Table of Contents Page Number
Corpus Christi Metropolitan Transportation Plan Fiscal Year Introduction:
 Introduction: The Safe, Accountable, Flexible, Efficient Transportation Equity Act: A Legacy for Users (SAFETEA-LU) has continued the efforts started through the Intermodal Surface Transportation Efficiency
Basalt Creek Transportation Refinement Plan Recommendations
 Basalt Creek Transportation Refinement Plan Recommendations Introduction The Basalt Creek transportation planning effort analyzed future transportation conditions and evaluated alternative strategies for
ACTIVE TRANSPORTATION
 ACTIVE TRANSPORTATION Mobility 2040 Supported Goals Improve the availability of transportation options for people and goods. Support travel efficiency measures and system enhancements targeted at congestion
CITY OF BLOOMINGTON COMPLETE STREETS POLICY
 CITY OF BLOOMINGTON COMPLETE STREETS POLICY POLICY OBJECTIVE: The City of Bloomington will enhance safety, mobility, accessibility and convenience for transportation network users of all ages and abilities,
Tulsa Metropolitan Area LONG RANGE TRANSPORTATION PLAN
 Tulsa Metropolitan Area LONG RANGE TRANSPORTATION PLAN Indian Nations Council of Governments August 2005 CONTACTING INCOG In developing the Destination 2030 Long Range Transportation Plan, INCOG s Transportation
TRANSIT & NON-MOTORIZED PLAN DRAFT FINAL REPORT Butte County Association of Governments
 1 INTRODUCTION Maintaining a high quality of life is the essence of this plan for transit and non-motorized transportation in Butte County. Curbing greenhouse gas emissions (GHG) by reducing congestion,
Proposed. City of Grand Junction Complete Streets Policy. Exhibit 10
 Proposed City of Grand Junction Complete Streets Policy Exhibit 10 1 City of Grand Junction Complete Streets Policy Vision: The Complete Streets Vision is to develop a safe, efficient, and reliable travel
SUMMARY OF TRANSPORTATION INVESTMENTS
 Santa Cruz County 2016 Measure D: Transportation Improvement Expenditure Plan - Approved by over 2/3 of Santa Cruz County voters on November 8, 2016 - Overview Measure D, the 2016 Transportation Improvement
May 12, 2016 Metro Potential Ballot Measure Issue Brief: Local Return
 Summary: Local return is an important revenue source for cities to maintain their local transportation infrastructure. Most cities use their local return to operate small bus systems and repave streets,
Clackamas County Comprehensive Plan
 ROADWAYS The County s road system permits the movement of goods and people between communities and regions, using any of a variety of modes of travel. Roads provide access to virtually all property. They
Purpose and Need. Chapter Introduction. 2.2 Project Purpose and Need Project Purpose Project Need
 Chapter 2 Purpose and Need 2.1 Introduction The El Camino Real Bus Rapid Transit (BRT) Project (Project) would make transit and other transportation improvements along a 17.6-mile segment of the El Camino
South King County High-Capacity Transit Corridor Study
 HIGH-CAPACITY TRANSIT CORRIDOR STUDY South King County Corridor South King County High-Capacity Transit Corridor Study Corridor Report August 2014 South King County High Capacity Transit Corridor Report
Perryville TOD and Greenway Plan
 Perryville TOD and Greenway Plan Greenway Glossary Pathway: A bicycle and pedestrian path separated from motorized vehicular traffic by an open space, barrier or curb. Multi-use paths may be within the
AMATS Complete Streets Policy
 AMATS Complete Streets Policy Table of Contents: Section 1. Definition of Complete Streets Section 2. Principles of Complete Streets Section 3. Complete Streets Policy Section 4. Consistency Section 5.
Vision to Action Community Coalition February 14, 2014 Briefing
 Vision to Action Community Coalition February 14, 2014 Briefing Transportation and Transit Planning & Mass Transit Operations Strategic Growth Area Office Brian S. Solis Transportation & Transit Manager
Climate Change Action Plan: Transportation Sector Discussion Paper: Cycling
 Climate Change Action Plan: Transportation Sector Discussion Paper: Cycling ontario.ca/climatechange Contents 1. Minister of Transportation s message... 3 2. Introduction... 5 3. Sector Overview and Support
ACTIVE TRANSPORTATION/NONMOTORIZED TRANSPORTATION
 ACTIVE TRANSPORTATION/NONMOTORIZED TRANSPORTATION BACKGROUND Active transportation, also known as nonmotorized transportation, is increasingly recognized as an important consideration when planning and
2. Context. Existing framework. The context. The challenge. Transport Strategy
 Transport Strategy Providing quality connections Contents 1. Introduction 2. Context 3. Long-term direction 4. Three-year priorities 5. Strategy tree Wellington City Council July 2006 1. Introduction Wellington
Typical Rush Hour Commute. PennyforTransportation.com
 Typical Rush Hour Commute In the News Overview of the Plan Collaborative plan with projects in every community Prioritizing connectivity and congestion relief Dedicated transportation-specific funding;
TOWN OF PORTLAND, CONNECTICUT COMPLETE STREETS POLICY
 TOWN OF PORTLAND, CONNECTICUT COMPLETE STREETS POLICY I. VISION, GOALS & PRINCIPLES VISION To improve the streets of Portland making them safer and more accessible for all users including pedestrians,
FUNDING SOURCES CHAPTER 6
 CHAPTER 6 6.1 BICYCLE 6.1.1 Local 6.1.2 Regional 6.1.3 State 6.1.4 Federal 6.1.5 Public Facilities 6.1.6 Bicycle Registration and Licensing Fees 6.1.7 Summary Table 6.1 of Bicycle Funding Sources 6 2 6.2
2040 RTP. Chapter 6: Investments in our Transportation Future
 2040 RTP Chapter 6: Investments in our Transportation Future This chapter describes the transportation investments proposed for the San Benito region that support the goals and objectives of the Regional
Welcome. Background. Goals. Vision
 Welcome The formal Public Information Centre (PIC) for the Transportation Master Plan How We GO will be held in early 2017. At that time we will present the recommended transportation system for Niagara
Chapter 2. Bellingham Bicycle Master Plan Chapter 2: Policies and Actions
 Chapter 2 Bellingham Bicycle Master Plan Chapter 2: Policies and Actions Chapter 2: Policies and Actions The Bicycle Master Plan provides a road map for making bicycling in Bellingham a viable transportation
4. ENVIRONMENTAL IMPACT ANALYSIS 9. TRANSPORTATION AND TRAFFIC
 4. ENVIRONMENTAL IMPACT ANALYSIS 9. TRANSPORTATION AND TRAFFIC 4.9.1 INTRODUCTION The following section addresses the Proposed Project s impact on transportation and traffic based on the Traffic Study
Chapter 14 PARLIER RELATIONSHIP TO CITY PLANS AND POLICIES. Recommendations to Improve Pedestrian Safety in the City of Parlier (2014)
") Chapter 14 PARLIER This chapter describes the current status and future plans for biking and walking in the City of Parlier. RELATIONSHIP TO CITY PLANS AND POLICIES The Parlier General Plan is the primary
Chapter 14 PARLIER This chapter describes the current status and future plans for biking and walking in the City of Parlier. RELATIONSHIP TO CITY PLANS AND POLICIES The Parlier General Plan is the primary
APPENDIX B: FUNDING MATRIX
 APPENDIX B: FUNDING MATRIX 101752 B - 1 FEDERAL SAFETEA-LU -- Congestion Mitigation and Air Quality Improvement Program (CMAQ) SAFETEA-LU -- Surface Transportation Program (STP)/Congestion Mitigation and
Chapter 7. Transportation. Transportation Road Network Plan Transit Cyclists Pedestrians Multi-Use and Equestrian Trails
 Chapter 7 Transportation Transportation Road Network Plan Transit Cyclists Pedestrians Multi-Use and Equestrian Trails 7.1 TRANSPORTATION BACKGROUND The District of Maple Ridge faces a number of unique
TABLE OF CONTENTS. Executive Summary
 Executive Summary Background... ES-1 Pedestrian Network... ES-2 Bikeway Network... ES-2 Collision History... ES-2 Public Input... ES-4 Conclusions and Recommendations... ES-4 1. Introduction and Setting
Living Streets Policy
 Living Streets Policy Introduction Living streets balance the needs of motorists, bicyclists, pedestrians and transit riders in ways that promote safety and convenience, enhance community identity, create
Where We Live and Work Today
 San Diego Forward: The 2019-2050 Regional Plan Network Concepts Transportation Committee Item 4 October 19, 2018 Where We Live and Work Today 2018 2 2019 Regional Plan Transportation Committee Item 4 October
RESOLUTION NO ?? A RESOLUTION OF THE CITY OF NEPTUNE BEACH ADOPTING A COMPLETE STREETS POLICY
 RESOLUTION NO. 2018-?? A RESOLUTION OF THE CITY OF NEPTUNE BEACH ADOPTING A COMPLETE STREETS POLICY WHEREAS, safe, convenient, and accessible transportation for all users is a priority of the City of Neptune
NOTICE OF AVAILABILITY/NOTICE OF COMMENT PERIOD OF A DRAFT EIR/EIS/EIS FOR PUBLIC REVIEW AND HEARINGS
 Tahoe Transportation District 128 Market Street, Suite 3F Stateline, NV 89449 Phone: (775) 589-5500 www.tahoetransportation.org Federal Highway Administration 650 Capitol Mall, Suite 4-100 Sacramento,
EXECUTIVE DIRECTIVE NO. 20. Issue Date: July 1, 2011
 ANTONIO R. VILLARAIGOSA MAYOR EXECUTIVE DIRECTIVE NO. 20 Issue Date: July 1, 2011 SUBJECT: Implementation of the 2010 Bicycle Plan It is no secret that the quality of life in Los Angeles is directly influenced
Rochester Area Bike Sharing Program Study
 roc bike share Rochester Area Bike Sharing Program Study Executive Summary ~ January 2015 JANUARY 2015 8484 Georgia Avenue, Suite 800 Silver Spring, MD 20910 3495 Winton Pl., Bldg E, Suite 110 Rochester,
Chapter 5. Complete Streets and Walkable Communities.
 Chapter 5. Complete Streets and Walkable Communities. 5.1 Description of Complete Streets. Cities throughout the world, and specifically the United States, are coming to embrace a new transportation and
Chapter 5 Future Transportation
 Chapter 5 Future Transportation The Future Land Use Plan identifies the desired land use designations. The land uses desired for Crozet depend, in large part, on the success of the transportation system,
City of Novi Non-Motorized Master Plan 2011 Executive Summary
 City of Novi Non-Motorized Master Plan 2011 Executive Summary Prepared by: February 28, 2011 Why Plan? Encouraging healthy, active lifestyles through pathway and sidewalk connectivity has been a focus
APPROVE A RESOLUTION ADOPTING A COMPLETE STREETS POLICY
 STAFF REPORT MEETING DATE: September 13, 2016 TO: FROM: City Council Bob Brown, Community Development Director Russ Thompson, Public Works Director Patrick Filipelli, Management Analyst 922 Machin Avenue
TRASBURG RANSPORTATION
 TRASBURG RANSPORTATION LAN DEVELOPED BY THE TRANSPORTATION PLANNING DIVISION OF THE VIRGINIA DEPARTMENT OF TRANSPORTATION IN COOPERATION WITH THE U.S. DEPARTMENT OF TRANSPORTATION, FEDERAL HIGHWAY ADMINISTRATION
DRAFT BUENA VISTA 2020 TRANSPORTATION PLAN
 DRAFT BUENA VISTA 2020 TRANSPORTATION PLAN DEVELOPED BY THE TRANSPORTATION PLANNING DIVISION OF THE VIRGINIA DEPARTMENT OF TRANSPORTATION IN COOPERATION WITH THE U.S. DEPARTMENT OF TRANSPORTATION, FEDERAL
o n - m o t o r i z e d transportation is an overlooked element that can greatly enhance the overall quality of life for the community s residents.
 N o n - m o t o r i z e d transportation is an overlooked element that can greatly enhance the overall quality of life for the community s residents. 84 Transportation CHAPTER 11 INTRODUCTION Transportation
I-105 Corridor Sustainability Study (CSS)
") I-105 Corridor Sustainability Study (CSS) Metro Streets and Freeways Subcommittee March 21, 2019 Gary Hamrick Cambridge Systematics, Inc. I-105 CSS Project History & Background Funded by Caltrans Sustainable
I-105 Corridor Sustainability Study (CSS) Metro Streets and Freeways Subcommittee March 21, 2019 Gary Hamrick Cambridge Systematics, Inc. I-105 CSS Project History & Background Funded by Caltrans Sustainable
Executive Summary. September 3, 2014
 D Executive Summary September 3, 2014 Study Background and Purpose Citizens for Picture Rocks is a community advocacy group representing the Picture Rocks Fire Department, Pima County Sheriff s Department,
Performance Criteria for 2035 Long Range Transportation Plan
 Minimizing Impacts on Natural, Historic, Cultural or Archeological Resources 2035 LRTP Weighting Factor: 7% Objective 1.1: Use appropriate planning and design criteria to protect and enhance the built
Bicycle Lanes Planning, Design, Funding South Mountain Partnership Trails Workshop Roy Gothie PennDOT Statewide Bicycle Pedestrian Coordinator
 Bicycle Lanes Planning, Design, Funding 2018 South Mountain Partnership Trails Workshop Roy Gothie PennDOT Statewide Bicycle Pedestrian Coordinator Policy Changes: BOP Bicycle Policy Changes The OLD Way
Executive Summary Route 30 Corridor Master Plan
 Route Corridor Master Plan Project Overview The Route Corridor Master Plan is a coordinated multimodal transportation and land use plan for the entire stretch of Route through East Whiteland Township,
SANTA CLARA COUNTYWIDE BICYCLE PLAN August 2008
 SANTA CLARA COUNTYWIDE BICYCLE PLAN August 2008 To assist VTA and Member Agencies in the planning, development and programming of bicycle improvements in Santa Clara County. Vision Statement To establish,
Moving Cambridge. City of Cambridge Transportation Master Plan Public Consultation Centre. March 7, :00 8:00 PM.
 City of Cambridge Transportation Master Plan Public Consultation Centre March 7, 2018 5:00 8:00 PM Region of Waterloo City of Cambridge Transportation Master Plan Public Consultation Centre March 7, 2018
REGIONAL BICYCLE AND PEDESTRIAN DESIGN GUIDELINES
 REGIONAL BICYCLE AND PEDESTRIAN DESIGN GUIDELINES November 16, 2011 Deb Humphreys North Central Texas Council of Governments Bicycle and Pedestrian Advisory Committee Snapshot of the Guide 1. Introduction
NM-POLICY 1: Improve service levels, participation, and options for non-motorized transportation modes throughout the County.
 Transportation PRINCE WILLIAM COUNTY 2008 COMPREHENSIVE PLAN NON-MOTORIZED PLAN CONTENTS Goals, Policies, and Action Strategies Table 4 (Bike Facility Classifications and Descriptions) Table 5 (Bike Facility
BIKE PLAN CONTENTS GATEWAY
 CONTENTS Acknowledgments...vii Great Rivers Greenway District Board of Directors... vii Great Rivers Greenway District Staff... vii Project Consultants... vii Committees... viii Citizens Advisory Committee
2015 Florida Main Street Annual Conference. Complete Streets Equal Stronger Main Streets
 WHAT ARE COMPLETE STREETS? CASE STUDIES COMPLETING YOUR MAIN STREET 2015 Florida Main Street Annual Conference St. Petersburg, Florida August 19, 2015 WHAT ARE COMPLETE STREETS? CASE STUDIES COMPLETING
4 Ridership Growth Study
 Clause 4 in Report No. 15 of Committee of the Whole was adopted, without amendment, by the Council of The Regional Municipality of York at its meeting held on November 16, 2017. 4 Ridership Growth Study
Madison Urban Area and Dane County. Bicycle Transportation Plan Summary. September Introduction. Bicycle Plan Scope and Planning Process
 Bicycle Transportation Plan Summary Madison Urban Area and Dane County Introduction September 2000 Bicycling is an important mode of transportation in the Madison urban area and countywide that is available
APPENDIX A: Complete Streets Checklist DRAFT NOVEMBER 2016
 APPENDIX A: Complete Streets Checklist DRAFT NOVEMBER 2016 Complete Streets Checklist MetroPlan Orlando s Complete Streets Checklist is an internal planning tool for staff to further implementation of
3.5.1 Transportation/Traffic -Environmental and Regulatory Setting
 3.5 Transportation This section provides background information regarding the circulation system within the County including the multimodal use of roads; marine, rail, and air transportation; public transportation;
EXECUTIVE SUMMARY... vii 1 STUDY OVERVIEW Study Scope Study Area Study Objectives
 Contents EXECUTIVE SUMMARY... vii 1 STUDY OVERVIEW... 1-1 1.1 Study Scope... 1-1 1.2 Study Area... 1-1 1.3 Study Objectives... 1-3 2 EXISTING CONDITIONS... 2-1 2.1 Existing Freeway Conditions... 2-4 2.1.1
Active Transportation Infrastructure Investment A Business Case
 Active Transportation Infrastructure Investment A Business Case In 2016, the Real Estate Foundation awarded the Capital Regional District a $50,000 grant for Shifting Gears: Land Use Change through Active
TRANSPORTATION TRAINING TOPICS. April 6, 2010
 TRANSPORTATION TRAINING TOPICS April 6, 2010 Roles of Transportation Providers Context and Policy Makers Division of Transportation and Traffic Other City Operations Other Transportation Operators CMA
PEDESTRIAN ACTION PLAN
 ATTACHMENT 2 CITY OF SANTA MONICA PEDESTRIAN ACTION PLAN CITY OF SANTA MONICA PEDESTRIAN ACTION PLAN This page intentionally left blank EXECUTIVE SUMMARY CHAPTER 1 EXECUTIVE SUMMARY Setting the Stage
Develop a Multi-Modal Transportation Strategy (Theme 6)
") DEVELOP A MULTI-MODAL TRANSPORTATION STRATEGY (THEME 6) WHY IS THIS THEME ADDRESSED? Develop a Multi-Modal Transportation Strategy (Theme 6) Statement of Ideal Reduce resident and visitor reliance on single
DEVELOP A MULTI-MODAL TRANSPORTATION STRATEGY (THEME 6) WHY IS THIS THEME ADDRESSED? Develop a Multi-Modal Transportation Strategy (Theme 6) Statement of Ideal Reduce resident and visitor reliance on single
INNER LOOP EAST. AIA Rochester Annual Meeting November 13, 2013 TRANSFORMATION PROJECT. Bret Garwood, NBD Erik Frisch, DES
 INNER LOOP EAST TRANSFORMATION PROJECT AIA Rochester Annual Meeting November 13, 2013 Bret Garwood, NBD Erik Frisch, DES Why? We are building a city that encourages walking, biking and enjoying the outdoor
Transportation Authority of Marin Renew Existing ½-cent Transportation Sales Tax
 Transportation Authority of Marin Renew Existing ½-cent Transportation Sales Tax Request for Approval of the Final Sales Tax Renewal Expenditure Plan Town of Tiburon June 20, 2018 Request Council to Approve
Section 9. Implementation
 Section 9. Implementation The transportation system is just one of many aspects that must be carefully planned to maintain and enhance the quality of living in Cecil County. The Cecil County Bicycle Plan
Cities Connect. Cities Connect! How Urbanity Supports Social Inclusion
 Cities Connect! How Urbanity Supports Social Inclusion Todd Litman Victoria Transport Policy Institute Metropolis Toronto, Canada - 14 June 2006 Cities Connect People with people. People with jobs. People
2045 Long Range Transportation Plan. Summary of Draft
 2045 Long Range Transportation Plan Summary of Draft Fredericksburg Area Metropolitan Planning Organization The George Washington Region includes the City of Fredericksburg and the counties of Caroline,
How To Encourage More Efficient Transportation in Brazilian Cities
 How To Encourage More Efficient Transportation in Brazilian Cities Todd Litman Victoria Transport Policy Institute Presented Seminar on Discouraging The Use Of Cars São Paulo, Brazil 3 September 2013 Creating
The Route 29 Corridor Study was initiated at the request of Virginia s Commonwealth
 CHAPTER 2: Study Background and approach The Route 29 Corridor Study was initiated at the request of Virginia s Commonwealth Transportation Board in response to requests from members of the General Assembly
Agency Advisory Group Meeting #3 and Walk Audit Anchorage Non-Motorized Plan
 Agency Advisory Group Meeting #3 and Walk Audit Anchorage Non-Motorized Plan Friday, May 18 th Walk Audit 10:00-11:30 AM Meeting 11:30 AM 1:00 PM Municipal Planning Department, 4700 Elmore Road, Training
Fresno Council of Governments Community Workshop. Tuesday, April 25, 2017 Hoover High School Fresno, California
 Fresno Council of Governments Community Workshop Tuesday, April 25, 2017 Hoover High School Fresno, California Who is Fresno COG? Fresno Council of Governments Association of local governments-the 15 cities
 Time of Change We Are Growing We Are An Attractive Place To Live We Are Age Diverse + Living Longer 50000 40000 30000 20000 10000 0 2010 Census Job Density Housing Sheds Transit Sheds The Project FUNDING
Governor s Transportation Vision Panel
 Office of Governor Kate Brown Governor s Transportation Vision Panel JLA Public Involvement Project Overview The is a yearlong effort to develop a series of recommendations for the Governor that address
WALKNBIKE DRAFT PLAN NASHVILLE, TENNESSEE EXECUTIVE SUMMARY NASHVILLE, TENNESSEE
 NASHVILLE, TENNESSEE EXECUTIVE SUMMARY Executive Summary A world-class multi-modal transportation system is essential to a vibrant city and better quality of life. -Mayor Barry The WalknBike plan aims
Corporate. Report COUNCIL DATE: June 26, 2006 NO: C012 COUNCIL-IN-COMMITTEE. TO: Mayor & Council DATE: June 22, 2006
 Corporate NO: C012 Report COUNCIL DATE: June 26, 2006 COUNCIL-IN-COMMITTEE TO: Mayor & Council DATE: June 22, 2006 FROM: General Manager, Engineering FILE: 0410-20(MoT/Gate) SUBJECT: Surrey Response on
Berkeley Strategic Transportation Plan A-76
 Berkeley Strategic Transportation Plan A-76 Appendices 1. A Team Effort 2. Where We ve Been A-11 Berkeley Strategic Transportation Plan Alameda County Transportation Plan Alameda County will be served
New Measure A Expenditure Categories DEFINITIONS OF ELIGIBLE EXPENDITURES Adopted March 8, 2007
 New Measure A Expenditure Categories DEFINITIONS OF ELIGIBLE EXPENDITURES Adopted March 8, 2007 City Street and County Road Maintenance Program The preservation and keeping of public street and road rights-of-way
MEMORANDUM. Santa Clara Valley Transportation Authority
 MEMORANDUM TO: FROM: Board of Directors Kurt Evans, Government Affairs Manager DATE: September 12, 2014 SUBJECT: Legislative Update: Cap-and-Trade Together, the FY 2015 Budget Act and SB 862, a budget
San Jose Transportation Policy
 San Jose Transportation Policy Protected Intersections in LOS Policies to Support Smart Growth Presented by: Manuel Pineda City of San Jose Department of Transportation Bay Area Map San Francisco Oakland
Town of Babylon Sustainable Complete Streets Policy
 Town of Babylon Sustainable Complete Streets Policy Steve Bellone, Supervisor Adopted July 14, 2010 1 Table of Contents Vision... 3 Policy Statement... 3 Definition... 3 Road Users... 4 Network... 4 Roads...
HOOPA DESIGN FAIR 4. IMPLEMENTATION PHASES & FUNDING
 4. IMPLEMENTATION PHASES & FUNDING HOOPA DESIGN FAIR 4-1 4. IMPLEMENTATION PHASES & FUNDING Phase One Development 1. Implementation The Conceptual Plan recommends five concept elements to revitalize downtown
San Mateo County Comprehensive Bicycle and Pedestrian Plan Open House
 San Mateo County Comprehensive Bicycle and Pedestrian Plan Open House October 28, 2010 Presented to San Mateo County residents and interested parties by Lauren Ledbetter, Alta Planning + Design Matt Haynes,
A Matter of Fairness: ROCOG s Environmental Justice Protocol. What is Mobility Limitation?
 No Person Left Behind What is Mobility Limitation? What is the Access Limitation? Environmental Justice population should be provided adequate mobility & access to meet their needs; Identify acceptable
Key Findings & Corridor Highlights
 The PA 358 Corridor Greenville to I-79 The PA 358 Corridor connects the Borough of Greenville in northwest Mercer County with I-79 to the east. For much of the way it follows the Shenango and Little Shenango
APPENDIX 2 LAKESHORE ROAD TRANSPORTATION REVIEW STUDY EXECUTIVE SUMMARY
 APPENDIX 2 LAKESHORE ROAD TRANSPORTATION REVIEW STUDY EXECUTIVE SUMMARY Appendix 2 City of Mississauga Lakeshore Road FINAL REPORT Transportation Review Study December 2010 EXECUTIVE SUMMARY Study Purpose
Context of Transportation Planning in the Central Lane Metropolitan Planning Organization (MPO) Area
 Area") May 2017 May 2017 Context of Transportation Planning in the Central Lane Metropolitan Planning Organization (MPO) Area There are four adopted transportation plans which cover the Central Lane MPO area,
May 2017 May 2017 Context of Transportation Planning in the Central Lane Metropolitan Planning Organization (MPO) Area There are four adopted transportation plans which cover the Central Lane MPO area,
4. TRIBAL TRANSPORTATION ELEMENT
 4. TRIBAL TRANSPORTATION ELEMENT The United States Constitution recognizes Native American tribes as separate and independent political communities within U.S. territorial boundaries. In California, Native
Scope of Services BICYCLE/PEDESTRIAN PLAN FOR THE INDIAN RIVER COUNTY MPO
 I. INTRODUCTION Scope of Services BICYCLE/PEDESTRIAN PLAN FOR THE INDIAN RIVER COUNTY MPO The Indian River County Metropolitan Planning Organization (MPO) Bicycle and Pedestrian Plan was completed in 1997.
ROUTES 55 / 42 / 676 BUS RAPID TRANSIT LOCALLY PREFERRED ALTERNATIVE
 ROUTES 55 / 42 / 676 BUS RAPID TRANSIT LOCALLY PREFERRED ALTERNATIVE April, 2012 1 INTRODUCTION The need for transit service improvements in the Routes 42/55/676 corridor was identified during the Southern
ORDINANCE NO
 1 Sponsored by: Councilmembers Stan Flemming, Connie Ladenburg, and Rick Talbert 2 Requested by: Executive/Public Works and Utilities - Transportation Services 3 4 5 6 7 10 11 ORDINANCE NO. 2014-445 12
City of Hamilton s Transportation Master Plan (TMP) Public Consultation 3 December 2015
 Public Consultation 3 December 2015") City of Hamilton s Transportation Master Plan (TMP) Public Consultation 3 December 2015 McPhail Transportation Planning Services Ltd. AGENDA 6:00 7:00 pm Viewing Boards / Q & A with the Team 7:00 7:50
City of Hamilton s Transportation Master Plan (TMP) Public Consultation 3 December 2015 McPhail Transportation Planning Services Ltd. AGENDA 6:00 7:00 pm Viewing Boards / Q & A with the Team 7:00 7:50