FINAL EL DORADO COUNTY REGIONAL TRANSPORTATION PLAN
|
|
|
- Deirdre Preston
- 5 years ago
- Views:
Transcription


1 EL DORADO COUNTY TRANSPORTATION COMMISSION FINAL EL DORADO COUNTY REGIONAL TRANSPORTATION PLAN SEPTEMBER 3, 2015
2 TABLE OF CONTENTS Chapter 1 Introduction... 1 Figure 1-1: Transportation Project Lifecycle... 3 Table 1-1: Regional Roadway Network, Delivered Projects Table 1-2: Transit Delivered Projects Table 1-3: Aviation Delivered Projects Table 1-4: Freight Movement Delivered Projects Table 1-5: Non-Motorized Delivered Projects Table 1-6: Transportation Systems Management Delivered Projects Table 1-7: ITS Delivered Projects Chapter 2 Organizational Setting... 9 Figure 2-1: Transportation Planning and Funding Map 2-1: US Highway 50 Corridor Chapter 3 Physical Setting Table 3-1: Temperature and Precipitation in El Dorado County Map 3-1: State Location El Dorado County Map 3-2: Cities and Places of El Dorado County Map 3-3: Distribution of Children Under Age Map 3-4: Distribution of Seniors Over Age Table 3-2: Population Projects Table 3-3: Employment Projections by Sector Table 3-4: Dwelling Unit Projects Table 3-5: Growth Trend Factors El Dorado County Figure 3-1: Growth in Aging Population Chapter 4 Regional Transportation Issues Figure 4-1: State Funding Figure 4-2: Federal Funding Table 4-1: Mode Split Chapter 5 Guiding Principles Goals, Objectives, Policies, and Performance Measures Figure 5-1: El Dorado County Regional Transportation Plan Goals, Objectives, Policies, and Performance Measures Chapter 6 Regional Road Network Table 6-1: El Dorado County Travel Demand Forecasting Roadway Functional Categories Map 6-1: State and Federal Highways in El Dorado County Table 6-2: Motor Vehicle Level of Service Grades Table 6-3: County Travel Demand forecasting Roadway Functional Categories Map 6-2: Regional Road Network Table 6-4: Roads in El Dorado County Allowed to Operate at Level of Service F Table 6-5: El Dorado County Regional Road Network Short-Term Action Plan Table 6-5: City of Placerville Road Network Short-Term Action Plan Table 6-6: El Dorado County/City of Placerville Regional Road Network Long-Term Action Plan ( )... 65
3 TABLE OF CONTENTS Chapter 7 Transit Table 7-1: El Dorado Transit Authority Fare Structure Table 7-2 Transit Short-Term Action Plan ( ) Table 7-3: Transit Long-Term Action Plan ( ) Chapter 8 Aviation Map 8-1: Location of Public Use Airports in El Dorado County Table 8-1: Annual Aircraft Operation Forecasts Public Use Airports in El Dorado County Table 8-2: Cameron Park Airpark Short-Term Action Plan ( ) Table 8-3: Georgetown Airport Short-Term Action Plan ( ) Table 8-4: Placerville Airport Short-Term Action Plan ( ) Table 8-5: Aviation Long-Term Action Plan ( ) Chapter 9 Freight Movement Table 9-1: Goods Movement Short- and Long-Term Action Plan ( ) Chapter 10 Non-Motorized Table 10-1: Existing Bikeways in El Dorado County Table 10-2: Existing Bikeways in the City of Placerville Table 10-3: American Community Survey Mode Share % Table 10-4: Non-Motorized Transportation Short-Term Action Plan ( ) Table 10-5: Non-Motorized Transportation Long-Term Action Plan ( ) Table-Tier 2 Proposed Improvements Table-Tier 3 Proposed Improvements City of Placerville Proposed Bikeway Facilities Class II Bike Lanes City of Placerville Proposed Bikeway Facilities Class III Bike Routes City of Placerville Proposed Bikeway Facilities Class I Bike Routes City of Placerville Proposed Bicycles Facilities Bike Racks and Lockers Table 10-6: Cost Estimates for Non-Motorized Transportation Long-Term Action Plan ( ) Map 10-1: El Dorado County Bicycle Facilities Network Chapter 11 Transportation Systems Management Table 11-1: Transportation Systems Management/Transportation Demand Management Action Plan ( ) Chapter 12 Intelligent Transportation Systems Table 12-1: ITS Short-Term Action Plan ( ) Table 12-2: ITS Long-Term Action Plan ( )
4 TABLE OF CONTENTS Chapter 13 Financial Element Table 13-1: RTP Delivery Success Table 13-2: Cost Estimates Regional Transportation Plan Table 13-3: Estimated Funding Revenues Table 13-4: MAP-21 Federal Aid Highway Programs and Mass Transit Funding Levels Table 13-5: Expenditure Estimates and Estimated Revenue Comparison Table 13-6: Unfunded Projects Chapter 14 Air Quality Map 14-1: Air Basins and Air Quality Monitoring Station Locations Table 14-1: National California Ambient Air Quality Standards Table 14-2: 2013 State and National Area Designations for the El Dorado County Portion of the Mountain Counties Air Basin Chapter 15 Environmental Document APPENDICES Appendix A... RTP Checklist Appendix B... RTP Advisory Committee Agendas Appendix C... EDCTC Committees Appendix D... Public Involvement Plan Appendix E... Tribal Government Consultation Appendix F... Regional Roadway Classification Appendix G... Local Jurisdictions Capital Improvement Program Appendix H... Intelligent Transportation systems (ITS) Glossary Appendix I... Acronym List Appendix J... Bibliography Individuals without access to the internet or a computer who wish to access the draft and final RTP and related materials can contact the EDCTC office directly by calling to schedule a review or printing of the requested materials. Individuals with disabilities or specific language requirements will be accommodated per the policies set forth in the El Dorado County Transportation Commission Title VI Program, Public Participation Plan, and Language Assistance Plan Title VI adopted by the EDCTC in March 2015.
5 Introduction Chapter 1 The El Dorado County Regional Transportation Plan (RTP) was developed under the direction of the El Dorado County Transportation Commission (EDCTC). The RTP is designed to be a guide for the systematic development of a balanced, comprehensive, multi-modal transportation system. This system includes but is not limited to: roadways, transit, aviation, freight movement, bikeways, pedestrian facilities, transportation systems management, and intelligent transportation systems. The RTP is action oriented and pragmatic, considering both the short-term (up to 10 years) and long-term (10 to 20 year) periods. The RTP is developed to fulfill the state requirements of AB 402 (Government Code Title 7, Chapter 2.5, Sections ). The California Transportation Commission Regional Transportation Plan Guidelines (adopted April 7, 2010) have been considered in the preparation of the RTP. PURPOSE Regional Transportation Plans are developed to provide a clear vision of the regional transportation goals, objectives, and policies complimented by short-term and long-term strategies for implementation. The vision for the RTP must be both realistic and fiscally constrained. In addition to providing a clear vision, the RTP serves the following specific functions: Provides an assessment of the current modes of transportation and the potential of new travel options within the region Predicts future needs for vehicle, non-motorized, and freight movement Identifies and documents specific actions necessary to address the region s mobility and accessibility needs Identifies needed transportation improvements, in sufficient detail, to serve as a foundation for the: Facilitation of the National Environmental Protection Act integration process `decisions Development of the Federal and State Transportation Improvement Programs, the Regional Transportation Improvement Program, and the Interregional Transportation Improvement Program Identification of project purpose and need Development of an estimate of emission impacts for demonstrating conformity with the air quality standards identified in the State Implementation Plan Promotes consistency between the California Transportation Plan, the Regional Transportation Plan, the SACOG Metropolitan Transportation Plan, and other transportation plans developed by cities, counties, special districts, private organizations, tribal governments, and state and federal agencies in responding to statewide and interregional transportation issues and needs Develops the framework for demonstrating regional air quality conformity pursuant to Assembly Bill 32 with the air quality standards identified in the State Implementation Plan Provides a forum for: Participation and cooperation throughout the planning process Facilitation of partnerships that reconcile transportation issues which transcend regional boundaries Involves the public; federal, state, and local agencies; tribal governments; and local, elected officials early in the transportation planning process so as to include them in discussions and decisions regarding the social, economic, air quality, and environmental issues related to transportation Chapter 1 Introduc on Page 1
6 REGIONAL TRANSPORTATION PLAN REQUIREMENTS REQUIRED ELEMENTS Government Code Section states that Regional Transportation Plans shall include the following components. A Policy Element that identifies mobility goals, objectives, and policies of the region. This element outlines the process for implementation of the Regional Transportation Plan to guide decision-makers. An Action Element that identifies programs and actions to implement the RTP in accordance with the goals, objectives, and policies set forth in the policy element. The institutional and legal actions needed to implement the Regional Transportation Plan and action plans are also discussed in this section, followed by a detailed assessment of all transportation modes. Priorities for regional transportation programs are established within the Action Element. A Financial Element that summarizes the cost of implementing projects in the RTP within a financially constrained environment. All anticipated transportation funding revenues are compared with the anticipated costs of the transportation programs and actions identified in the Action Element. If shortfalls are identified, strategies are developed to potentially fund the otherwise unfunded projects. REQUIRED DOCUMENTATION Environmental Documentation is required under the California Environmental Quality Act. The environmental documentation states whether there will be an environmental impact of implementing the projects listed in the plan and, if so, what those impacts will be. Depending upon the scope of the plan and the local environment, the appropriate environmental documentation may be a negative declaration, a mitigated negative declaration, or a full environmental impact report. REGIONAL TRANSPORTATION PLAN PROCESS The El Dorado County Transportation Commission is the Regional Transportation Planning Agency (RTPA) for El Dorado County, except for that portion of the County within the Tahoe Basin, which is under the jurisdiction of the Tahoe Regional Planning Agency (TRPA). One of the fundamental responsibilities which results from this designation is the preparation of the County s Regional Transportation Plan. Under the terms of a Memorandum of Understanding (MOU) between the EDCTC and the Sacramento Area Council of Governments (SACOG) EDCTC submits the Regional Transportation Plan for inclusion into the SACOG Metropolitan Transportation Plan (MTP) and Sustainable Communities Strategy (SCS). This process is important to both the SACOG MTP and the EDCTC RTP, as it allows for a locally developed RTP to be included in the regional air quality conformity process. The MOU also stipulates that EDCTC shall utilized data and data analysis methodologies which are consistent with that developed by SACOG. This data includes existing and projected travel data, socio-economic data, and travel demand forecasts and assumptions. However, this data is integrated into this locally developed RTP process focused around local consensus of policies, projects, programs, and funding decisions. The El Dorado County RTP, pending review by SACOG, will become the El Dorado County portion of the SACOG MTP. REGIONAL TRANSPORTATION PLAN DELIVERY SUCCESS Delivery of transportation projects is a lengthy process that includes extensive public outreach, detailed planning, environmental studies, engineering design, right of way, and construction. Add to this the development of funding strategies and the overall life of a project from planning to construction can take Chapter 1 Introduc on Page 2
7 a great deal of time, see Figure 1-1: Transportation Project Lifecycle. FIGURE 1-1: Transportation Project Lifecycle This complex process is one of the many reasons the RTP is developed to address transportation needs over a 20-year period. A long-horizon planning process allows for the time necessary to effectively deliver projects. The and RTPs each included a 20 year shelf of multi-modal projects which, in normal circumstances, would take at least 20 years to deliver. However, due to competitive successes through California Proposition 1B and the Federal American Recovery and Reinvestment Act of 2009, a larger number of transportation projects listed in those RTPs were delivered in the 10-year period between The following Delivered Projects Fact sheets, shown in Tables 1-1 through 1-7, highlight the delivery successes of the RTP over the last 10 years ( ). Costs included in the delivered projects tables below are for illustrative purposes only and are planning level estimates developed during the and RTP processes and do not reflect actual expenditures. TABLE 1-1: Regional Roadway Network, Delivered Projects Project Description Cost Responsible/ Support Agencies US 50-Missouri Flat Interchange Phase 1A: Replace US 50 overcrossing structure, widen Missouri Flat Road, install intersection improvements /channelization US 50-Missouri Flat Interchange Phase 1B: Reconfigure interchange and widen Weber Creek Bridges on US 50 High-Occupancy Vehicle Lanes Phase 1: Install HOV lanes on US 50 from El Dorado Hills Blvd. to Bass Lake Grade US 50 Placerville Operational Improvements: Improve aesthetic elements, and eastbound auxiliary lane on US 50 from Placerville Drive to Bedford Avenue SR 49 Improvements: Install a two-way, left turn lane, stop sign, and bicycle and pedestrian facilities from the South Fork American River Bridge #25-21 to Marshall Road in Coloma SR 193 Improvements: Construct a left-turn pocket approximately ten kilometers east of Cool at Sliger Mine Road SR 49 Improvements: Widen and add shoulders from.2 kilometers south of Ore Court to.2 kilometers south of China Hill Road Westbound US 50: Install on/off ramps and signalization at Cambridge Road and Merrychase Drive $41,203,740 Caltrans, El Dorado County, EDCTC $37,707,967 Caltrans, El Dorado County, EDCTC $47,908,000 Caltrans, El Dorado County SACOG, EDCTC $46,337,000 Caltrans, City of Placerville, EDCTC $1,300,000 Caltrans, El Dorado County, EDCTC $556,000 Caltrans, El Dorado County, $7,700,000 Caltrans, El Dorado County, $430,000 El Dorado County, Caltrans, EDCTC Program Local Funds STIP, Bond, ARRA, TE, SHOPP RSTP/CMAQ, Local Funds, Bond STIP, State and Regional TE SHOPP SHOPP SHOPP RSTP Chapter 1 Introduc on Page 3
8 TABLE 1-1: Regional Roadway Network, Delivered Projects Project Description Cost Responsible/ Support Cameron Park Drive-Palmer Drive-Green Valley Road: Improve operations and perform safety analysis Cameron Park Drive-Mira Loma Drive: Construct left-turn lanes at intersection Missouri Flat Road-El Dorado Road: Construct left-turn lanes and signalize intersection Mother Lode Drive: Install two-way left-turn widening from South Shingle Road to French Creek Road Green Valley Road at Tennessee Creek: Bridge Agencies $395,346 El Dorado County, EDCTC $400,000 El Dorado County, EDCTC $460,000 El Dorado County, EDCTC $380,000 El Dorado County, EDCTC $5,858,326 El Dorado County, Replacement EDCTC Rubicon Trail at Ellis Creek: Bridge Replacement $435,528 El Dorado County, Caltrans Wentworth Springs Road at Gerle Creek: Bridge Replacement RSTP RSTP RSTP RSTP HBP, RSTP HBP, Grants, RSTP, Local Funds $1,395,731 El Dorado County HBP, Grants, RSTP, Local Funds US 50 HOV Phase 0: El Dorado Hills Blvd Interchange Improvements $19,200,000 El Dorado County, EDCTC, Caltrans Local Funds, CMIA US 50 Silva Valley Parkway Interchange: Phase 1 Improvements (Under Construction) $64,600,000 El Dorado County, EDCTC, Caltrans Local Funds, SLPP Green Valley Road-Deer Valley Road: Improvements $4,300,000 El Dorado County Local Funds Bass Lake Road: Frontage Improvements at Silver $70,582 El Dorado County Local Funds Springs Green Valley Road: Widening County Line to Francisco Drive $9,200,941 El Dorado County Local Funds, RSTP Latrobe Road: Widening 2-4 Lanes - Suncast Lane to Golden Foothill Parkway South $11,676,000 El Dorado County Local Funds High-Occupancy Vehicle Lanes Phase 2A: US Hwy 50 Bass Lake Grade to Cameron Park Drive $24,874,000 El Dorado County, EDCTC, Caltrans Silva Valley Parkway: Widening $2,644,000 El Dorado County, EDCTC Pleasant Valley Road SR 49 Patterson Drive: $3,898,000 El Dorado County, Signalization EDCTC, Caltrans US 50 Hangtown Creek Beautification: Remove $405,000 Caltrans, City of abandoned eastbound off-ramp at Main Street Placerville Point View Drive: Extend Point View Drive US 50 to $3,180,000 EDCTC, City of Jacquier Road Placerville, Caltrans US 50: Ray Lawyer Drive westbound US 50 onramp $7,200,000 EDCTC, City of Placerville, Caltrans, El Dorado County Capital SouthEast Connector: A segment of Connector within El Dorado County Placerville Drive: Enhancements to Placerville Drive from US 50 to Canal Street Source: El Dorado County Regional Transportation Plans ( , ) $2,446,356 SACOG El Dorado County,, EDCTC, Connector JPA $564,780 City of Placerville, EDCTC Program Local Funds, CMAQ, CMIA Local Funds, SLPP Local Funds, SLPP, SHOPP State TE Local Funds, Bond Local Funds, Bond Local Funds, Bond RSTP Chapter 1 Introduc on Page 4
9 TABLE 1-2: Transit Delivered Projects Project Description Cost Responsible/ Program Support Agencies Provide Transit Service to Planned Light Rail in Folsom: Upon opening of the Sacramento Regional Transit s Iron Point light rail service to Folsom, EDCTA began operation of the Iron Point Connector Commuter service from transit centers in the Placerville area. The schedule is timed to allow connections to other EDCTA routes serving Placerville, El Dorado Hills, Cameron Park, and Pollock Pines. $178,290 EDCTA TDA Expand Transit Service on Pollock Pines, El Dorado/Diamond Springs, Folsom Lake College, and Cameron Park Routes: The El Dorado/ Diamond Springs, Folsom Lake College/El Dorado Center Route was improved to provide hourly service. The Pollock Pines Route was redesigned to provide an hourly express bus to and through Placerville. The Cameron Park route was increased to seven runs per day then was reduced to five runs per day in 2009 due to budget cuts. Expand Commuter Service to Meet Increasing Demand: Nine commuter buses were purchased that increase passenger capacity from 45 passengers per bus to 57 per bus. An additional peak hour commuter route was added from Placerville to the Iron Point Light Rail Station. Convert Placerville/Hangtown Shuttle to Fixed Route and Provide Complementary ADA Service: The Placerville/Hangtown Shuttle was converted to two fixed routes in the east and west directions and complimentary ADA service is now provided. Expand Dial-A-Ride Service: An additional Dial-A-Ride van was added for a three-year period but was reduced in 2009 due to budget cuts. Continuation of Direct Sacramento Commuter Bus Service: The commuter service to Sacramento remains an active and viable EDCTA service. Expansion of local Hangtown Shuttle, Pollock Pines, and Folsom Lake College Routes: EDCTA implemented the Placerville Shuttle(s) East and West which are timed to provide convenient transfers to the Pollock Pines Shuttle, Cosumnes River College, Diamond Springs, and Cameron Park Routes. Increased Bicycle Rack Capacity on Transit Buses: EDCTA installed three bicycle capacity bike racks on all EDCTA buses. Source: El Dorado County Regional Transportation Plans ( , ) $149,860 EDCTA TDA $71,850 EDCTA TDA $51,800 EDCTA TDA $114,810 EDCTA TDA N/A EDCTA TDA $329,470 EDCTA TDA $20,000 EDCTA, EDCTC BTA Chapter 1 Introduc on Page 5
10 TABLE 1-3: Aviation Delivered Projects Project Description Cost Responsible / Support Agencies Program Placerville Airport Engineering Design-East End Apron $301,000 El Dorado County El Dorado County, FAA, Caltrans Construct a Service Access Road to East End Development $6,830,000 El Dorado County El Dorado County, FAA, Caltrans Crack Repair and Slurry Seal Runway 5-23 Taxiways and Ramp $236,900 El Dorado County El Dorado County, FAA, Caltrans Replace MIRL Runway 5-23, Relocate Threshold Runway 23, Remark Runway 5-23, Install PAPI $430,000 El Dorado County El Dorado County, FAA, Caltrans Runway 23 Runway Exit Taxiway East End $35,400 El Dorado County El Dorado County, FAA, Caltrans Georgetown Airport Crack Seal and Slurry Seal Ramp and Hangars $115,000 El Dorado County El Dorado County, FAA, Caltrans Ramp Security Lighting $165,500 El Dorado County El Dorado County, FAA, Caltrans Source: El Dorado County Regional Transportation Plans ( , ) TABLE 1-4: Freight Movement Delivered Projects Project Description Cost Responsible/ Support Agencies US 50 HOV Lane Project El Dorado Hills to Bass Lake Grade: Added an HOV lane in both the east and westbound directions on US 50 in this area (Phase 0, 2A, and 2B too?) Latrobe Road Improvements: Widened to four lanes between Suncast Lane and Golden Foothill Parkway south US 50 Operational Improvements Project: Added an auxiliary lane in the eastbound direction along US 50 within the City of Placerville improving freight movement capacity to and through the City of Placerville Missouri Flat Interchange Phase 1A: New interchange at Missouri Flat Road and US 50 provides for efficient freight movement between US 50 and the commercial areas of Diamond Springs US 50-Missouri Flat Interchange Phase 1B: Reconfigured the interchange and widened Weber Creek Bridges on US 50 $48,000,000 El Dorado County, Caltrans, EDCTC Program $11,600,000 El Dorado County Local $46,000,000 Caltrans, City of Placerville, EDCTC $41,000,000 El Dorado County, EDCTC $37,707,967 Source: El Dorado County Regional Transportation Plans ( , ) Caltrans, El Dorado County, EDCTC CMIA, CMAQ, Local STIP, ITIP, TE, Local Local STIP, Bond, ARRA, TE, SHOPP Chapter 1 Introduc on Page 6
11 TABLE 1-5: Non-Motorized Delivered Projects Project Description Cost Responsible/ Support Agencies Harvard Way Class I Bike Path: Bike Path between Clermont Way and Hawker Placer as a component of El Dorado Hills CSD Master $187,044 El Dorado Hills CSD, EDCTC Facilities Plan New York Creek Trail East: Bike Path between Silva Valley Road and New York Creek in El Dorado Hills $201,164 El Dorado Hills CSD, EDCTC, El Dorado County Northside School Bike Path: Bike Path from the Auburn Lake Trails $3,995,374 EDCTC, El Dorado County Community to Northside School in Cool SPTC/El Dorado Trail Class I Bike Path: Forni Road to Missouri Flat $2,000,000 El Dorado County, EDCTC Road Green Valley Road Class II Bike Lanes: County Line to 400 west of El $50,000 El Dorado County Dorado Hills Boulevard Green Valley Road Class II Bike Lanes: Cameron Park Drive to Pleasant $50,000 El Dorado County Grove Middle School White Rock Road Class II Bike Lanes: Joeger Cut-Off Road to Carson $65,000 El Dorado County Crossing Road Cameron Park Drive Class II Bike Lanes: Winterhaven Drive to $525,000 El Dorado County Alhambra Drive Latrobe Road Class II Bike Lanes: Golden Foothill Parkway to Towne $65,000 El Dorado County Center Drive El Dorado Trail Class I Bike Path: Parkway Drive to Los Trampas Drive $670,000 El Dorado County El Dorado Trail Class I Bike Path: Mosquito Road to Clay Street $270,000 City of Placerville Green Valley Road Safe Routes to School Project: Sidewalk from Bass $435,300 El Dorado County Lake Road to Pleasant Grove Middle School Canal Street Safe Routes to School Project: Sidewalk from $280,000 City of Placerville Middletown Road to Markham School Placerville Drive Class II Bike Lanes: Canal Street to US 50 $133,000 City of Placerville, Caltrans undercrossing State Route 49-Class II Bike Lanes: South Fork of the American $50,000 Caltrans River Bridge in Coloma to Marshall Road US 50-Missouri Flat Interchange Phase 1B Bicycle Pedestrian Component: Bike/Pedestrian overcrossing eastbound lane of the Weber $5,100,000 El Dorado County, Caltrans Creek Bridge Source: El Dorado County Regional Transportation Plans ( , ) TABLE 1-6: Transportation Systems Management Delivered Projects Project Description Cost Responsible/ Program Support Agencies Vanpool Program at DST Output: Six vanpools run daily to and $120,500 EDCTC, 50 TMA Dues from DST Output Corridor TMA El Dorado Transit Commuter Service to Iron Point Road Light $112,900 EDCTA TDA Rail Construction of the Commerce Park-and-Ride Lot $774,000 EDCTA EDCTA Smart Routes to School Website and Program $60,000 EDCTC, 50 TMA Dues Corridor TMA Annual Walk to School Day and Bike Month $30,000 EDCTC, 50 EDCTC RPA Activities Corridor TMA El Dorado County Government Center Commuter Club $5,000 EDCTC, 50 Corridor TMA EDCTC RPA Source: El Dorado County Regional Transportation Plans ( , ) Chapter 1 Introduc on Page 7
12 TABLE 1-7: ITS Delivered Projects Project Description Cost Responsible/ Support Agencies US 50-Operational Improvements Project, including Signal Synchronization $46,000,000 Caltrans, City of Placerville, EDCTC Program STIP, ITIP, TE, Local US 50-Missouri Flat Interchange Ramp, including intersection coordination $41,000,000 Caltrans, El Dorado County, EDCTC Local Funds Green Valley Road-Francisco Drive Intersection, including signal coordination $287,000 El Dorado County Local Funds Rural Safety Innovation Project $380,000 Caltrans, El Dorado County Federal RSIP Source: El Dorado County Regional Transportation Plans ( , ) Chapter 1 Introduc on Page 8


 planning boundaries (See Chapter 3, Map 3-2). TRPA is the RTPA for the Tahoe Basin area.")


.")

13 Organizational Setting Chapter 2 The El Dorado County Transportation Commission (EDCTC), as the designated Regional Transportation Planning Agency, has a number of roles in and responsibilities for the transportation activities of El Dorado County, as discussed below. REGIONAL TRANSPORTATION PLANNING AGENCY DESIGNATION The EDCTC was designated as the Regional Transportation Planning Agency (RTPA) for the western slope of El Dorado County on July 23, 1975, (and as amended April 4, 1979) per Article 11, Chapter 2, Division 3, Title 3 of the Government Code and organized per Chapter 3, Title 21 of the California Administrative Code. This planning and programming authority does not include that portion of the County within the Tahoe Regional Planning Agency (TRPA) planning boundaries (See Chapter 3, Map 3-2). TRPA is the RTPA for the Tahoe Basin area. The EDCTC is operated under a Joint Powers Agreement between El Dorado County and the City of Placerville, which was executed on June 6, As the RTPA for El Dorado County, EDCTC has updated the Regional Transportation Plan for the County. EDCTC is responsible for developing and adopting a plan that conforms to the most recent version of the California Transportation Commission s Regional Transportation Plan Guidelines, adopted April 7, 2010, in order to ensure that EDCTC and member jurisdictions continue to receive state and federal transportation planning and construction funds. It is important to distinguish the roles and responsibilities of EDCTC and partner agencies. EDCTC performs transportation planning and funding efforts in coordination with the City of Placerville, El Dorado County, Caltrans, and the Sacramento Area Council of Governments (SACOG). EDCTC is not responsible for the design, construction, or maintenance of transportation and transit related projects. Furthermore, EDCTC has no land use authority. These duties fall primarily on El Dorado County Development Services Transportation Division, the City of Placerville Public Works Department, El Dorado Transit Authority and Caltrans on the state transportation system. Figure 2-1 highlights the roles and responsibilities of each agency and how their role fits into each step of the process. Chapter 2 Organiza onal Se ng Page 9


14 FIGURE 2-1: Transportation Planning and Funding OTHER AGENCIES MEMBER JURISDICTIONS The City of Placerville and County of El Dorado are member jurisdictions of the EDCTC. As members, each of the jurisdictions has direct input into EDCTC s decision-making process, both on a staff and commission level. The Commission currently consists of four members appointed by the El Dorado County Board of Supervisors and three members appointed by the Placerville City Council. The District 3 Director of Caltrans or their designated representative and a representative from the City of South Lake Tahoe serve as ex-officio members of the Commission. The input provided by the member jurisdictions directly affects the content and direction of the RTP. Member jurisdictions are represented on the EDCTC Policy Advisory Team, Technical Advisory Committee and RTP Advisory Committee. Further, member jurisdictions recommend specific projects to be included in the action plan of the RTP. Any project that requires federal or state funding must be included in the RTP in order to be eligible for funding. Many of the goals, objectives, and policies delineated in the RTP are implemented by the jurisdictions. The participation and agreement of all member jurisdictions, therefore, is critical in implementing the RTP. CALIFORNIA TRANSPORTATION COMMISSION (CTC) The California Transportation Commission is composed of members appointed by the Governor to oversee transportation funding in California. The CTC biennially adopts the State Transportation Improvement Program (STIP). The STIP is a five-year capital improvement program for state transportation funding. EDCTC recommends projects in the local Regional Transportation Improvement Program (RTIP) to be considered by the CTC for inclusion in the STIP. CALIFORNIA DEPARTMENT OF TRANSPORTATION (CALTRANS) Virtually all federal and state planning and construction funds are administered through Caltrans to EDCTC and its member jurisdictions. As a result, Caltrans is responsible for monitoring and reviewing the activities of EDCTC to ensure that transportation planning and programming requirements associated with these funding programs are met. The RTP is the cornerstone of these requirements as the region plans a comprehensive transportation system which identifies what improvements are most needed and how they will be funded. The California Transportation Plan 2040, developed by Caltrans, and other Caltrans planning efforts mentioned and/or referenced throughout the RTP provide the necessary state system information. Chapter 2 Organiza onal Se ng Page 10
15 Most federal and state programs administered by Caltrans require projects to be identified in a current RTP following state and federal guidelines in order for such projects to be funded. Without an adopted RTP, Caltrans could not distribute funds to EDCTC and its jurisdictions to build those projects, nor could Caltrans build its own projects within the region. As the owner operator of the state highway system, Caltrans has a vested interest in ensuring that a complete and conforming RTP is adopted. Caltrans representatives participate in the development and review of the RTP. The agency is represented on the EDCTC Technical Advisory Committee and RTP Advisory Committee. Caltrans perspective on pertinent transportation issues is sought, and Caltrans recommends projects to be included in the action plan. When the draft RTP is completed, it is sent to Caltrans District 3 and Headquarters for comments. Further, Caltrans Headquarters distributes the draft RTP to the appropriate divisions, such as Mass Transportation and Aeronautics, for more specific review. The comments received as a result of the review conducted by the various divisions of Caltrans are then incorporated, as appropriate, in the final RTP. SACRAMENTO AREA COUNCIL OF GOVERNMENTS (SACOG) The Sacramento Area Council of Governments is the Regional Transportation Planning Agency for Sacramento, Sutter, Yolo, and Yuba counties. In addition, SACOG is the federally designated Metropolitan Planning Organization (MPO) for the Sacramento Metropolitan Area. As a result, SACOG acts as the MPO for the western slope of El Dorado County within the Federal Ozone Non-Attainment Area. EDCTC has the responsibility for the development and adoption of the Regional Transportation Plan and the Regional Transportation Improvement Program for El Dorado County. SACOG has the responsibility for the development and adoption of the Metropolitan Transportation Plan and the Metropolitan Transportation Improvement Program. Senate Bill (SB) 375 adds new requirements: the inclusion of a Sustainable Communities Strategy (SCS) along with the RTP that strives to achieve a passenger vehicle greenhouse gas emissions reduction target; and additional consideration of natural resource and farmland impacts. Therefore, rather than thinking of the MTP and SCS as two separate documents, they are one document that has more detailed requirements in some areas than the past plans, while offering some incentives to achieve the regional greenhouse gas reduction target. Additionally, SACOG is responsible for making findings of conformity required under Section 176 of the Federal Clean Air Act with the designated Federal Ozone Non-Attainment Area. Under the terms of a Memorandum of Understanding, EDCTC submits the Regional Transportation Plan for inclusion into the SACOG Metropolitan Transportation Plan. EL DORADO NATIONAL FOREST The El Dorado National Forest, managed by the United States Forest Service (USFS), comprises over 434,000 acres within El Dorado County. The roadway network within these USFS managed lands exceeds 2,000 miles maintained and managed by the USFS. Additionally, nearly 350 miles of trail are maintained and managed by the USFS. This transportation network is a significant resource in El Dorado County as it provides access to logging and resource extraction operations as well as the extensive public outdoor and active recreation opportunities found throughout the forests. ADVISORY COMMITTEES The planning process includes systematic public participation and input from EDCTC advisory committees. The purpose of the advisory committees is to provide technical assistance, advice, and recommendations to EDCTC to aid in fulfilling its responsibilities for a coordinated transportation planning process within El Dorado County. Assistance and input for preparation of the RTP has been provided by the following EDCTC advisory committees. POLICY ADVISORY TEAM (PAT) The Policy Advisory Team provides input to the EDCTC Executive Director and Board on policy level issues related to financing, land use, and intergovernmental cooperation which impact the overall ability to plan, fund, and deliver transportation programs and projects. PAT members are responsible for ongoing Chapter 2 Organiza onal Se ng Page 11
 Community Development Director, City of Placerville Director of Development and Engineering, the EDC Air Quality Management District Air Pollution")
16 communication and action taken within their respective organizations regarding coordination with EDCTC adopted policies and programs. The members include the El Dorado County (EDC) Community Development Director, City of Placerville Director of Development and Engineering, the EDC Air Quality Management District Air Pollution Control Officer, the EDC Transit Authority Executive Director, and the EDCTC Executive Director. TECHNICAL ADVISORY COMMITTEE (TAC) The TAC is composed of members representing the Engineering Department of the City of Placerville; selected representation from the EDC Transportation Division, EDC Long-Range Planning Division, and EDC Air Quality Management District; a representative from El Dorado County Transit Authority; the Caltrans District 3 Liaison; a Caltrans District 3 Project Manager; and a SACOG Liaison. The TAC provides technical guidance in the development of EDCTC s plans, programs, and agenda items that will come before the Commission. Meetings are held on a monthly basis. SOCIAL SERVICES TRANSPORTATION ADVISORY COUNCIL (SSTAC) The Social Services Transportation Advisory Council is a diverse group of persons representing senior, handicapped, and limited means populations, as well as commuters. SSTAC members are recruited and appointed by the EDCTC in accordance with Transportation Development Act statutes. The SSTAC meets several times throughout the year to discuss transit needs in El Dorado County. REGIONAL TRANSPORTATION PLAN ADVISORY COMMITTEE (RTP AC) The RTP Advisory Committee includes invited representatives from jurisdictions, communities, transit operators, tribal governments, bicycle groups, pedestrian advocates, freight movement interests, environmental groups, taxpayer associations, chambers of commerce, and social service agencies. The RTP AC, appointed by the EDCTC to reflect the diverse interest groups within El Dorado County, provides input during all phases of the RTP update process. Refer to Appendix B for RTP Advisory Committee meeting agendas. BICYCLE ADVISORY COMMITTEE (BAC) The Bicycle Advisory Committee assists EDCTC with bicycle issues including the development of bikeway and non-motorized plans. The BAC meets on an as-needed basis to discuss bicycle issues with a focus on improving the bikeway network throughout El Dorado County as well as improving access and safety for bicyclists. The BAC was ratified by the EDCTC for the update of both the El Dorado County Bicycle Transportation Plan and the City of Placerville Non-Motorized Transportation Plan in Additional advisory committees are established by the Commission on an as-needed basis. Refer to Appendix C for a listing of EDCTC Advisory Committees. CONSULTATION WITH TRIBAL GOVERNMENTS The Shingle Springs Rancheria, located in El Dorado County, is home to the Shingle Springs Band of Miwok Indians. EDCTC corresponded with the Tribal Chair early in the RTP planning process in order to insure consistency with Tribal plans and the RTP. Tribal leaders were included in all RTP AC correspondence and outreach (see Appendix E). The Shingle Springs Band of Miwok Indians actively collaborates on project specific issues such as expansion of the US 50 High-Occupancy Vehicle Lane network. GENERAL PUBLIC The quality of life for El Dorado County residents has a direct correlation to the availability and efficiency of the transportation system. Consequently, public participation is crucial for the RTP to accurately address the transportation needs and demands of the local community. Throughout the development of the RTP, which is the primary planning document for transportation in El Dorado County, EDCTC actively solicits the participation of the public and provides opportunities for any interested parties or individuals to participate and have access to information as outlined in Title VI of the Civil Rights Act of 1964 and the American s with Disabilities Act. Chapter 2 Organiza onal Se ng Page 12
17 Public involvement continues after a draft plan is produced through public meetings and a public hearing process. In addition, citizen comments are encouraged and accepted at any point during the plan development. The draft RTP and environmental documentation are made available at county libraries, jurisdiction offices, on the EDCTC web page, and at EDCTC offices. Citizens are invited to review the plan and make comments at a noticed public hearing which takes place prior to plan adoption by the Commission. In accordance with RTP guidelines, public hearings for the RTP must be noticed and posted at least 30 days prior to the hearing date. The environmental documentation is also made available for public review in accordance with the California Environmental Quality Act and noticed prior to the public hearing. OTHER PLANS AND PROGRAMS The Regional Transportation Plan outlines the region s goals and policies for meeting current and future transportation needs and provides a foundation for transportation decision-making. Transportation planning is conducted by several agencies at all levels of government in El Dorado County. The El Dorado County RTP is designed to be consistent with adopted plans and programs. LOCAL GENERAL PLANS Local governments prepare circulation elements governing street and transportation system improvements for incorporation into their local general plans and capital improvement programs. Local government circulation elements and capital improvement programs must be internally consistent with the land use elements of their general plans in order for the local general plan as a whole to be considered legally adequate. The Capital Improvement Program (CIP) contains improvements that are needed for implementation of the goals, policies, and uses designated by the general plan for that jurisdiction. Locally significant transportation improvements are ultimately proposed for inclusion in the RTP if state or federal funds are used or if the improvement is located on a regionally significant route. The RTP acknowledges existing general plans and local jurisdictions capital improvement programs. COORDINATED PUBLIC TRANSIT HUMAN SERVICES TRANSPORTATION PLAN Moving Ahead for Progress in the 21st Century (MAP-21), signed into law on July 6, 2012, is the nation s key surface transportation program. Under MAP-21, in order for transit agencies and providers to be eligible for funding from the Section 5310 program for Enhanced Mobility of Seniors and Individuals with Disabilities, they must adopt a Coordinated Public Transit Human Services Transportation Plan (coordinated plan). According to the FTA, the coordinated plan should be a unified, comprehensive strategy for public transportation service delivery that identifies the transportation needs of three priority groups/transportation disadvantaged groups: 1) individuals with disabilities, 2) seniors, and 3) individuals with limited incomes, laying out strategies for meeting these needs, and prioritizing services. The plan should be developed through a process that includes representatives of public, private, and nonprofit transportation and human services providers and participation by members of the public. In coordination with Caltrans and social service partners, EDCTC completed an update to the previously adopted 2008 coordinated plan in 2014/2015. SHORT- AND LONG-RANGE TRANSIT PLAN In 2014 EDCTC adopted a 2035 Short- and Long-Range Transit Plan to improve and enhance transit services of El Dorado County. This plan includes service recommendations, a capital plan, an institutional and management plan, and a financial plan for the fiscal years 2014/2015 through 2018/2019 for the shortterm, and through 2035 for the long-term. The RTP is consistent with the 2035 Short- and Long-Range Transit Plan. EL DORADO COUNTY TRANSIT AUTHORITY PARK AND RIDE MASTER PLAN The purpose of the Park-and-Ride Master Plan is to identify the policies, actions, and financing needed to ensure a continuous, adequate supply of parking capacity in El Dorado County to support the El Dorado County Transit Authority s (EDCTA s) commuter bus service, as well as carpooling, vanpooling, and other forms of shared rides. Chapter 2 Organiza onal Se ng Page 13
18 EL DORADO COUNTY TRANSIT AUTHORITY TRANSIT DESIGN MANUAL The El Dorado County Transit Design Manual is a handbook that provides EDCTA with transit improvement standards appropriate to the specific conditions of the transit organization and its area. The Design Manual provides specific standards for bus stop improvements and roadways along transit routes. NON-MOTORIZED AND BICYCLE TRANSPORTATION PLANS EDCTC has developed both the Non-Motorized Transportation Plan (NMTP) for the City of Placerville and the El Dorado County Bicycle Transportation Plan. Both plans include detailed lists of existing conditions, proposed projects, and goals, objectives, and policies to guide the development of projects and programs related to bicycle and pedestrian transportation. The RTP is consistent with the City of Placerville Non-Motorized Transportation Plan and the El Dorado County Bicycle Transportation Plan. CITY OF PLACERVILLE PEDESTRIAN CIRCULATION PLAN (PED PLAN) The development of the City of Placerville Pedestrian Circulation Plan, completed in 2007, was the logical next step to the NMTP. The Ped Plan expanded the sidewalk inventory of the NMTP to include all areas of the City of Placerville. The Ped Plan provides prioritized project proposals and options for funding a subsequent Pedestrian Circulation Improvement Program for the ultimate construction and maintenance of an extensive sidewalk network throughout the City. OTHER AGENCIES REGIONAL TRANSPORTATION PLANS Surrounding areas such as the Tahoe Basin, Placer County, Amador County, and the greater Sacramento region prepare RTPs addressing similar issues and state required criteria. These plans are intended to coordinate with each other and address efficient and convenient interregional connections. In addition, the Sacramento Area Council of Governments (SACOG) develops a six-county (Sacramento, Sutter, Yolo, Yuba, Placer, and El Dorado) Metropolitan Transportation Plan, which is consistent with the Placer County RTP and El Dorado County RTP. The SACOG MTP includes an air quality analysis that is required for the El Dorado County RTP. El Dorado County s RTP acknowledges the Regional Transportation Plans of surrounding areas. REGIONAL TRANSPORTATION IMPROVEMENT PROGRAM (RTIP) The RTIP is a five-year program of transportation projects for El Dorado County that includes projects nominated for inclusion in the State Transportation Improvement Program (STIP). The RTIP is adopted by EDCTC and is due to Caltrans and the CTC by December 15 of every odd year. The CTC adopts guidelines, policies, and procedures to guide the STIP process. Projects in the RTIP must be consistent with the adopted RTP in order to be programmed into the STIP. INTERREGIONAL TRANSPORTATION IMPROVEMENT PROGRAM (ITIP) The 2008 State Interregional Transportation Improvement Program (ITIP) was prepared in accordance with Government Code Section 14526, Streets and Highways Code Section164 and the California Transportation Commission (Commission) State Transportation Improvement Program (STIP) Guidelines. The ITIP is a five-year program of projects for improvement of interregional movement of people, vehicles, and freight. The RTP is consistent with the projects contained within the ITIP. STATE TRANSPORTATION IMPROVEMENT PROGRAM (STIP) In every even year, the CTC adopts the RTIPs from the regions of California, together with the Caltrans Interregional Transportation Improvement Program, to form the STIP. The STIP is a biennial five-year programming document listing all major capital outlay projects to be funded from state transportation funds allocated by the CTC. In accordance with State law, the CTC may accept or reject a region s RTIP in its entirety but may not reject specific projects in the RTIP. The RTP is consistent with the adopted STIP. SACRAMENTO REGIONAL CLEAN AIR PLAN The Sacramento Federal Non-attainment Area for ozone includes the western slope of El Dorado County. The Sacramento Regional Clean Air Plan, or State Implementation Plan, was adopted in 1994 in compliance with the Federal Clean Air Act. California leads the nation in an effort to mitigate the impacts of automobile generated greenhouse gas emissions (GHG). One of two recent legislative efforts to achieve this is known as Assembly Bill 32 (AB 32), signed into law as part of the California Global Warming Solutions Act of AB 32 requires that by 2020 the state's greenhouse gas emissions be reduced to Chapter 2 Organiza onal Se ng Page 14
19 1990 levels, roughly a 25% reduction under business as usual estimates. The second piece of legislation, Senate Bill 375 (SB 375), is more focused on reducing GHG emissions through the regional transportation planning efforts of the Metropolitan Planning Organizations. Therefore, EDCTC continues to work closely with SACOG and the El Dorado County Air Quality Management District to assess the impact of all transportation projects and planning efforts on air quality in the region. The RTP must conform to the State Implementation Plan and AB 32. The El Dorado County Air Quality Management District is the local agency responsible for protecting the public and the environment from the effects of air pollution. The District s jurisdiction is all of El Dorado County, including the City of Placerville. The SACOG MTP includes an air quality conformity analysis that is required for the El Dorado County RTP. RURAL URBAN CONNECTIONS STRATEGY The SACOG Rural Urban Connections Strategy (RUCS) began in January of RUCS followed the lead of the SACOG Blueprint, which engaged a new approach to addressing land use, transportation, and environmental quality issues. It is anticipated that the RUCS project will provide an economic and environmental sustainability strategy for rural areas. EDCTC has been involved throughout the RUCS process to ensure the county s interests are represented in this analysis of the Sacramento region s rural growth and sustainability objectives. SACOG METROPOLITAN TRANSPORTATION PLAN/SUSTAINABLE COMMUNITIES STRATEGY Similar to the RTP developed by EDCTC, SACOG develops the Metropolitan Transportation Plan/ Sustainable Communities Strategy (MTP/SCS). This is a long-range (at least 20-year) regional plan for transportation projects, such as bikeway, road, sidewalk, and transit projects. In order to provide people with a variety efficient transportation options, an MTP/SCS considers where jobs, housing and services are located both today and in the future. The plan also includes a financial forecast that shows that the transportation projects in the plan can reasonably be funded over the course of 20 years. The major outcomes of the MTP/SCS include improving air quality, reducing traffic congestion, and reducing greenhouse gas emissions. The RTP is incorporated into the MTP/SCS as El Dorado County s component of the broader regional planning effort. SACOG must maintain and update the MTP/SCS at least every four years. All transportation projects that receive state or federal funding must be included in the plan, and therefore SACOG works closely with its 22 member cities and 6 member counties when updating the MTP/SCS. In addition to working with member jurisdictions, SACOG staff examines projections for growth in population, housing, and jobs. Staff also gathers input from a wide variety of stakeholders and the general public. DISTRICT SYSTEM MANAGEMENT AND DEVELOPMENT PLAN In January 2013, Caltrans completed the District System Management and Development Plan (DSMDP). The District 3 DSMDP is the District s long-range strategic planning document. It identifies key policies, programs and projects that are intended to maintain, manage and enhance overall system mobility with the District, with a primary focus on the State Highway System. For the first time, the DSMDP also includes the comprehensive list of actual proposed improvement projects which was previously included in the separate District 3 Transportation System Development Program. The document will be regularly updated to respond to changing land use, transportation demand, financial, legal, community, and environmental conditions. The DSMDP is a 20-year strategic plan, focused primarily on the State Highway System, defining and describing how the transportation system will be managed with enhancement activities positioned in terms of multi-modal and multi-jurisdictional cooperation. TRANSPORTATION CONCEPT REPORT In addition, Caltrans has prepared Transportation Concept Reports (TCR) for State Route (SR) 49, US 50, SR 89, SR 153, and SR 193. The TCR is a long-term planning document that Caltrans prepares for every State Highway, or portion thereof, in its jurisdiction. The purpose of the TCCR is to determine how the State Highway will be improved and managed over a 20-year period so that it maintains a minimum acceptable Level of Service. CORRIDOR SYSTEM MANAGEMENT PLAN In addition to the DSMDP, Caltrans has initiated the process of developing Corridor System Management Plans (CSMP) for corridors within each district within the state (See Map 2-1). Each CSMP outlines transportation improvements for the State s most congested corridors. CSMPs were created for corridors asso- Chapter 2 Organiza onal Se ng Page 15
20 ciated with the Corridor Mobility Improvement Account (CMIA) and the Highway 99 Bond Programs, supported by the Highway Safety, Traffic Reduction, Air Quality, and Port Security Bond Act of 2006, Proposition 1B. One CSMP within District 3 includes that which was developed for US Highway 50 and parallel routes within El Dorado County. The US 50 CSMP evaluates existing conditions of the US 50 Corridor providing analysis of projected traffic conditions. Furthermore, the CSMP proposes traffic management strategies to enhance the mobility of the US Highway 50 Corridor. The EDCTC has been involved throughout the process, providing local knowledge and support on specific issues within the county. The RTP is consistent with the strategies, actions, and improvements identified in the adopted CSMP that are needed to restore capacity. These include taking into consideration statewide and regional objectives which can include but are not limited to: multi-modal mobility, accessibility, environmental protection, and greenhouse gas reduction. The most current US Highway 50 CSMP was adopted June Chapter 2 Organiza onal Se ng Page 16


21 MAP 2-1: US Highway 50 Corridor Chapter 2 Organiza onal Se ng Page 17
22 Physical Setting Chapter 3 To set the framework in which the current and future transportation systems of El Dorado County function, a complete characterization of the area is needed. Information included in this section describes the location, population, and demographics of the county, as well as projections for the future employment, housing, and population. MAP 3-1: State Location El Dorado County LOCATION El Dorado County is located in the foothills and mountains of the Sierra Nevada, extending eastward from the eastern portion of California s Central Valley. The western portion of El Dorado County is characterized by rolling foothills, increasing in elevation to the east. The county is bordered by Placer County to the north, Amador County to the south, Sacramento County to the west, and the State of Nevada to the east. A portion of Lake Tahoe is located in El Dorado County. In total, El Dorado County contains 1,805 square miles ranging in elevation from 200 feet above sea level to 10,881 feet above sea level at the highest mountain peak. There are two incorporated cities in El Dorado County: Placerville, the County seat; and South Lake Tahoe, which is within the jurisdiction of the Tahoe Regional Planning Agency. Numerous unincorporated communities are located in El Dorado County. These include El Dorado Hills, Cameron Park, Shingle Springs, El Dorado, Diamond Springs, Latrobe, Fairplay, Somerset, Grizzly Flat, Camino, Pollock Pines, Coloma/Lotus, Garden Valley, Georgetown, Rescue, Mt. Aukum, Pleasant Valley, Kyburz, Strawberry, and Cool. Map 3-1 shows the location of El Dorado County in California. Map 3-2 shows the location of designated places within El Dorado County. CLIMATE The weather in El Dorado County varies greatly depending on the elevation, from warm dry summers and mild winters in El Dorado Hills and Placerville to cool summers and snowy winters in South Lake Tahoe. Typically, temperatures in the lower elevations are higher in summer and winter, while mountain temperatures are lower. The rainy season in El Dorado County occurs between November and April, but excessive rainfall and damaging winter storms are rare. The Sierra Nevada snowfields are a major source of water for the region during the dry summer months as the snowmelt is captured in reservoirs along the western slope. TABLE 3-1: Temperature and Precipitation in El Dorado County Area Average Temperature Average Maximum Temperature Average Minimum Temperature Source: Western Regional Climate Center, Average Total Precipitation Placerville Georgetown South Lake Tahoe Chapter 3 Physical Se ng Page 18


23 MAP 3-2: Cities and Places of El Dorado County Chapter 3 Physical Se ng Page 19


24 CHARACTER El Dorado County is truly Gold Country, as it is where the California Gold Rush began. From the rolling El Dorado Hills, to the narrow streets of Placerville, all the way up the Pony Express Trail to Lake Tahoe, El Dorado County is rich in history. The Marshall Gold Discovery State Historic Park in Coloma has a full-scale replica of Sutter s Mill and hosts up to 500,000 visitors annually. El Dorado County is rich in a diverse array of agricultural resources. The orchards of Apple Hill host thousands of visitors each fall for the apple harvest. The wineries of El Dorado have gained acclaim since 1984 when the County was designated by the federal government as an official wine district appellation with the El Dorado name. In 2001, the sub-region of Fairplay was given a similar designation. Of the 1,805 square miles in El Dorado County, over half is in public ownership in the form of national forests, parks, and recreational areas. The acres of public land combined with privately owned timberlands, parks, campgrounds, orchards, wineries, and recreational facilities preserve and promote open space for which the County is well known. The climate, geography, agriculture, recreation, and historical richness of El Dorado County make it a highly acclaimed destination and an outstanding place to live. The western portion of El Dorado County, Cameron Park to the Sacramento County Line, is more suburban and urban in nature. The communities of Cameron Park and El Dorado Hills are more typical of communities which are located near the rural-urban interface. Within the 2010 US Census this area is classified as urban and has a variety of residential, employment, and service sector opportunities. This area also includes the El Dorado Hills Business Park located south of U.S. Highway 50 on the west side of Latrobe Road, the 900 acre park is home to more than 200 companies, including one of the county s largest employers; DST Output. Blue Shield of California, another one of the county s largest employers, is located in Town Center West of El Dorado Hills. El Dorado County has diverse socio-economic, cultural, and lifestyle character which draws a wide array of residents and visitors. Among this diversity are groups of people with unique needs and demands, requiring access to multi-modal transportation such as bikeways, public transit, and emergency services. To effectively assess the concentrations of these uniquely dependent cohorts, Maps 3-3 and 3-4 are provided. Map 3-3 depicts the distribution of children under the age of 15, who may demand more of local pedestrian and bicycle connections to areas of interest throughout the community. Additionally, Map 3-4 depicts the concentrations of the older population, people over age 65, who may be more dependent on public transit and emergency services. Chapter 3 Physical Se ng Page 20


25 MAP 3-3: Distribution of Children Under Age 15 Chapter 3 Physical Se ng Page 21


26 MAP 3-4: Distribution of Seniors Over Age 65 Chapter 3 Physical Se ng Page 22
27 GROWTH ASSUMPTIONS INTRODUCTION As the Regional Information Center for the Sacramento area, the Sacramento Area Council of Governments has prepared and adopted population and employment forecasts for the development of the Regional Transportation Plan. The population and employment forecasts reflect the growth that is anticipated to occur within El Dorado County during the 20-year horizon of this plan. SACOG developed the population and employment forecasts in consultation with local jurisdictions and the 2010 Census. POPULATION PROJECTIONS The population forecasts included in the Regional Transportation Plan were developed by SACOG. Population forecasts are identified at varying intervals as shown in Table 3-2. Included for comparison purposes is the historical 2008 data for each jurisdiction. TABLE 3-2 Population Projects Regional Analysis Districts (RADs)** El Dorado County Total* 151, , ,843 Cameron Park - Shingle Springs 31,593 34,605 45,017 Coloma - Lotus 8,609 8,556 8,956 Diamond Springs 11,958 11,663 14,792 El Dorado High Country 2,641 2,557 2,637 El Dorado Hills 39,276 46,697 55,124 Georgetown 7,219 7,173 7,303 Mt. Aukum - Grizzly Flat 6,364 6,262 6,487 Pilot Hill 5,391 5,394 5,524 Pollock Pines 16,182 16,138 16,547 Placerville 22,020 22,869 25,456 *Excludes Tahoe Basin ** The six-county SACOG region is divided into approximately seventy Regional Analysis Districts (RADs). A RAD is an area defined by SACOG. RADs may have the same name as community planning areas or city names but the boundaries are not the same. The RADs for El Dorado County can be viewed here: estimatemaps/eldo/eldoall.pdf Source: SACOG Modeling Projections; SACOG Info Center info@sacog.org October 2014 EMPLOYMENT PROJECTIONS Employment forecasts included in the Regional Transportation Plan are derived from the expected increase in building square footage or acreage factor consistent with each local general plan. SACOG converted the building square footage or acreage factor into employment using calculated holding capacities consistent with those assumed for the local general plans. Employment forecasts are identified at varying year intervals as shown in Table 3-3. Included for comparison purposes is the historical 2005 data for each jurisdiction. HOUSING PROJECTIONS Housing forecasts are developed by SACOG. Housing forecasts are identified at varying year intervals as shown in Table 3-4. Included for comparison purposes is the historical 2005 data for each jurisdiction. Chapter 3 Physical Se ng Page 23
28 TABLE 3-3: Employment Projections by Sector Regional Analysis Districts (RADs) El Dorado County Total* Cameron Park - Shingle Springs Educa- on Food 2008 Office Other Retail Service Medical Industrial Total 3,480 2,570 2,427 7, ,024 12,46 8 3,963 5,424 44, , ,645 2, ,654 Coloma-Lotus Diamond Springs El Dorado High Country El Dorado Hills , ,113 3, ,605 14,020 Georgetown ,375 Mt. Aukum Grizzly Flat Pilot Hill Placerville 1,096 1,028 1,003 1, ,013 4,147 2,822 2,458 16,148 Pollock Pines ,395 Regional Analysis Districts (RADs) Government Educa- on Food Government Office Other Retail Service Medical Industrial Total El Dorado County 3,562 2,868 3,227 8, ,102 1,4351 4,215 5,758 50,370 Total* Cameron Park , ,250 3, ,090 Shingle Springs Coloma-Lotus Diamond Springs ,465 El Dorado High El Dorado Hills , ,372 3, ,732 16,427 Georgetown ,375 Mt. Aukum Grizzly Flat Pilot Hill Placerville 1,096 1,041 1,140 1, ,113 42,91 2,865 2,491 16,633 Pollock Pines , ,553 *Excludes Tahoe Basin Source: SACOG Modeling Basin Projects May 2012 SACOG Info Center; info@sacog.org 2020 Chapter 3 Physical Se ng Page 24

29 TABLE 3-3: Employment Projections by Sector Regional Analysis Districts (RADs) Education Food Government Office Other Retail Service Medical Industrial Total El Dorado County Total* Cameron Park Shingle Springs 4,100 3,355 3,574 12, ,475 15,487 5,322 7,137 62, , ,620 3, ,049 12,154 Coloma - Lotus Diamond Springs El Dorado High El Dorado Hills 1,125 1,078 1,167 9, ,713 4,208 1,699 2,580 23,779 Georgetown ,375 Mt. Aukum - Grizzly Flat Pilot Hill Placerville 1,124 1,107 1,177 1, ,462 4,837 2,959 2,774 18,382 Pollock Pines ,958 TABLE 3-4: Dwelling Unit Projections Regional Analysis Districts (RADs) El Dorado County Total* 61,821 66,785 74,648 Cameron Park-Shingle Springs 12,121 13,509 16,826 Coloma-Lotus 3,262 3,281 3,345 Diamond Springs 5,112 5,146 6,421 El Dorado High Country 1,469 1,482 1,482 El Dorado Hills 13,341 16,141 18,468 Georgetown 3,341 3,353 3,355 Mt. Aukum-Grizzly Flat 3,777 3,797 3,797 Pilot Hill 2,166 2,170 2,170 Pollock Pines 7,637 7,772 7,782 Placerville 9,594 10,135 11,002 *Excludes Tahoe Basin Source: SACOG Info Center October 2014 SUMMARY El Dorado County s communities, cultural amenities, economic opportunities, and climate continue to attract new residents, workers, and businesses, creating a dynamic environment in which to plan for and implement transportation improvements. To examine how growth has impacted transportation, it is useful to examine historic growth trends. Table 3-5 displays key growth indicators shaping travel behavior in El Dorado County. It is also important to note that the population of El Dorado County has experienced a significant increase in the aging cohorts over the past 20 years. Figure 3-1 highlights the growth in persons 65 years and older in relation to the total population. El Dorado County has experienced a higher rate of growth among this aging cohort as compared to the rest of California. Chapter 3 Physical Se ng Page 25

 21 24 28 29 30 29 Persons 65 years and older")
 SACOG Info Center info@sacog.")
30 TABLE 3-5: Growth Trend Factors El Dorado County Population 85, , , , , ,737 Households 32,505 46,845 58,939 65,310 70,223 66,751 Registered cars and trucks 52, , , ,241 N/A N/A Persons Over 16 in Labor Force 42,404 62,301 78,086 94,609 89,358 88,104 Persons who drove alone to work 25,433 43,213 54,656 64,805 60,721 57,551 Persons carpooling to work 7,349 8,397 9,599 10,581 7,392 6,673 Persons using public transit ,294 1,187 1,422 1,091 Mean commute time (in minutes) Persons 65 years and older 8,478 14,885 19,278 19,615 26,362 31,982 Median Household Income (Real $'s) $17,513 $35,058 $51,484 $68,640 $66,129 $61,365 Source: U.S. Census Bureau (2010 and 2013 are from Census ACS 1 year data) SACOG Info Center info@sacog.org October 2014 Figure 3-1: Growth in Aging Population Chapter 3 Physical Se ng Page 26
31 Regional Transportation Issues Chapter 4 REGIONAL ISSUES El Dorado County is a growing, dynamic community. Population, housing, employment, and other key parameters have all been impacted by the recession following However, slow to moderate growth is beginning to show in most sectors. This growth combined with significant tourism and recreation visitors brings increasing demands on our transportation systems to maintain and enhance safety and efficiency. The purpose of this chapter is to introduce the various transportation modes and their interrelationships and to discuss the key regional transportation issues currently facing El Dorado County and the greater Sacramento metropolitan area. Subsequent chapters build on this information, identifying overall goals and objectives for the transportation system, addressing specific needs, and developing an action plan for each transportation mode. RECREATIONAL TRAVEL Increasingly, the transportation needs of the recreation and tourism industries are impacting the transportation infrastructure in El Dorado County. The demands for recreation-oriented travel need to be accounted for in all transportation planning, and these demands are unique. There are peak travel seasons and times of day that are different from the typical commute patterns. Tourism and recreational travel, as discovered in the Bay to Tahoe Basin Tourism and Recreation Travel Impact Study 2014, can account for 80% or more of daily peak hour traffic along primary routes such as US Hwy 50 and SR 49 in Placerville. El Dorado County offers a vast array of tourism and recreational opportunities ranging from white water rafting, historical tours, to wine tasting and other agritourism related activities. As this economic sector continues to grow more demand will be placed on the rural state and local transportation system requiring more planning and focus for not the resident population but the actual transportation system user population. One of the challenges is providing a public transportation system that is convenient, flexible, and reliable enough to encourage visitors to leave their car behind and/or negate the need to rent a car. Linking different modes conveniently (air, bus, bicycles, shuttles) is also important in providing a seamless transportation system for tourists and visitors. Additionally, funding the transportation system traditionally has been focused on a formula which considers the resident population and lane miles. This formula does not take into account the more than 8 million estimated trips from visitors coming into El Dorado County each year from the Bay Area and Sacramento alone to recreate. Funding policies need to reflect the user population and not just the resident population in order to adequately support an effective transportation system. INTER-JURISDICTIONAL COORDINATION/ INTEGRATED LAND USE One of the prime motivations for the establishment of the EDCTC in 1975 was to provide a forum for inter-jurisdictional coordination on county-wide issues. Therefore, an ongoing fundamental responsibility of EDCTC is to continue to advance communication and coordination between jurisdictions on the variety of transportation-related issues facing the region. Such coordination is first necessary to ensure connectivity of roads, transit, bicycle and pedestrian paths, and other transportation systems to provide continuity and access between communities. Coordination is also critical to addressing transportation-related regional impacts, such as air quality and congestion. In a time of scarce governmental resources, coordination is even more important to ensure that the funds that are available are spent in the most efficient and effective manner possible. Intergovernmental coordination furthers that goal by developing county-wide transportation priorities, implementing studies and projects in cooperation with other counties, facilitating joint transportation projects, and anticipating and mitigating impacts of governmental decisions of one jurisdiction onto another. Coordination both within El Dorado County and with neighboring jurisdictions in the Sacramento region, Tahoe Basin, and State of Nevada is crucial in the effort to address transportation challenges along key corridors such as US 50 and State Route 49. Coordination among regional agencies such as Caltrans, the Sacramento Area Council of Governments (SACOG), Placer County Transportation Planning Agency, Chapter 4 Regional Transporta on Issues Page 27
32 Amador County Transportation Commission, Tahoe Regional Planning Agency, Tahoe Transportation District, El Dorado County Air Quality Management District, Sacramento Metropolitan Air Quality Management District, and others also plays an important role. Integrating transportation and land use planning is critical for responsible development. The planning agencies and jurisdictions work together to support and encourage land use patterns that promote alternatives to driving alone. A continuous dialogue, interdisciplinary approach, and proactive strategy is needed to keep land use decision-making and transportation investment in sync. A relatively new development in multi-jurisdictional land use and transportation planning is the development of the Rural Urban Connections Strategy (RUCS) facilitated by SACOG. The RUCS is an effort to mitigate growth impacts on the rural to urban interface. Nowhere is this more important than in El Dorado County where encroaching urban development places pressures and demands on the rural landscape. EDCTC has been and will continue to work with SACOG on the RUCS project to ensure rural to urban transitional zones within the county are effectively planned and managed. AIR QUALITY The primary source of air pollution in California is vehicle exhaust. As a result, transportation and air quality are closely linked. In fact, the Sacramento region, including El Dorado County, has been designated as a non-attainment area for air quality standards, which are specified by the California Clean Air Act of 1988 and the Federal Clean Air Act Amendments of California leads the nation in an effort to mitigate the impacts of automobile generated greenhouse gas emissions (GHG). One of two recent legislative efforts to achieve this is known as Assembly Bill 32 (AB 32), signed into law as part of the California Global Warming Solutions Act of AB 32 requires that by 2020 the state's greenhouse gas emissions be reduced to 1990 levels, roughly a 25% reduction under business as usual estimates. The second piece of legislation, Senate Bill 375 (SB 375), is more focused on reducing GHG emissions through the regional transportation planning efforts of the Metropolitan Planning Organizations. Therefore, EDCTC continues to work closely with SACOG and the El Dorado County Air Quality Management District to assess the impact of all transportation projects and planning efforts on air quality in the region. CONGESTION As El Dorado County continues to grow, congestion on US 50 and local roads continues to increase. Commute times become longer, and the capacity of many roadways during peak periods is exceeded, bringing traffic to a crawl. Consequently, this diverts auto and truck traffic to parallel roadways not equipped to handle the increase in traffic. Successful implementation of congestion mitigation strategies requires significant additional funding, careful coordination with land use changes, and calculation of positive and negative impacts on air quality. A number of strategies are necessary to address congestion and capacity issues: Improving the availability, reliability, convenience, and frequency of public transportation Increasing the capacity of existing roadways and interchanges Promoting commute alternatives that remove vehicles from the road (e.g., telecommuting, bicycling, walking, and transit) Providing connectivity between all transportation modes GROWTH The El Dorado County region continues to be faced with urban and sub-urban growth development pressures. The total county-wide population, excluding the Tahoe Basin, is expected to grow at an average of approximately 1.75% annually, for an estimated overall growth of over 31% between 2005 and Housing units and employment are also expected to increase. Between 2005 and 2035, the number of housing units and employment are expected to grow over 17%. Along with continuing commercial and industrial growth, these trends indicate that transportation within, into, and out of El Dorado County will be key issues (Source: SACOG 2035 MTP). Chapter 4 Regional Transporta on Issues Page 28
33 TRANSPORTATION FUNDING The western slope of El Dorado County s transportation network consists of streets, highways, railways, airports, bicycle routes, and walkways. This network provides people and businesses with the ability to access destinations, move freight, services, and information. The state, regional, and local governments share the network s construction, operation, and maintenance. Moreover, funding to pay for these activities come from federal, state, and local taxes, fees and assessments, and private investments. Our region s transportation network receives funding from federal, state, local governments, and private investments. TRANSPORTATION FUNDING SOURCES FEDERAL FUNDS Federal Fuel Excise Tax: The Internal Revenue Service collects this tax, 18.4 /gallon gasoline and 24.4 / gallon diesel fuel, and deposits it into the Highway Trust Fund (HTF). About 85% of the HTF account goes into the Highway Account. The Federal Highway Administration (FHWA) appropriates funding to each state for specific purposes. The remaining 15% of the HTF account goes into the Transit Account. The Federal Transit Administration (FTA) allocates this funding to regional agencies and local transit providers in each state for specific transit purposes. FEDERAL DECISION-MAKING Congress authorizes the federal government to spend its transportation revenue on programs that support public policy interests for a given amount of time typically a five to six year period. An authorization sets the maximum amount of funding that can be appropriated to programs each fiscal year. Each year, Congress reviews appropriation bills to allocate funding for all federal agencies, departments, and programs. This action provides the legal authority for federal agencies to spend money during the upcoming fiscal year on administered programs. The federal government can only allocate up to the maximum amount identified in the authorization for the upcoming year no more. The FHWA and the FTA are the main recipients of federal transportation funding. They allocate funding to each state based on various programs. Current Federal Authorization: Moving Ahead for Progress in the 21st Century The President signed H.R. 4348, otherwise known as MAP-21, on July 6, This authorization spanned October 1, 2012 to September 30, 2014 and allocated $105 billion for transportation purposes. Federal-aid highway programs received approximately $40 billion and public transit received approximately $11 billion. MAP-21 extended the federal government s authority to collect motor vehicle fuel excise taxes through September 30, 2016 and truck excise taxes through September 30, STATE FUNDS State Fuel Excise Tax: As of July 1, 2014, California collects 36 /gallon excise tax on gasoline and 11 / gallon on diesel fuel generating approximately $3.0 billion a year. The total amount of State Fuel Excise Tax revenues are divided between the State Highway Account and local entities according to a statutory formula. The excise tax on gasoline is comprised of two taxes: The base state excise tax (Proposition 111, 1990) has remained at 18 /gallon since Cities and counties receive approximately 36% and the state receives 64% of this revenue. The price-base excise tax for Fiscal Year (FY) is 18.0 /gallon. Revenue is first used to backfill weight fees that are diverted to the General Fund. The remaining funds are allocated between local roadways (44%), new construction projects (State Transportation Improvement Program 44%), and highway maintenance and operations (State Highway Operations and Protection Program 12%). The Fuel Tax Swap was first enacted in Due to conflicts created by the passage of Propositions 22 and 26 by voters, the Legislature reenacted the Fuel Tax Swap through AB 105 (2011). The Fuel Tax Swap Chapter 4 Regional Transporta on Issues Page 29
34 eliminated the sales tax on gasoline and replaced it with the price-base excise tax. The California Board of Equalization (BOE) is required to adjust this rate annually. The passage of AB 105 also authorized the redirection of weight fees from the SHA to the General Fund to pay off obligation bond debt service for specified voter-approved transportation bonds. State Sales Tax: As of January 2013, the BOE collects a 6.50% state base sales and use tax (Proposition 30 temporarily added 0.25% until January 1, 2017) and a 1% Bradley-Burns local uniform tax totaling to a statewide tax rate of 7.50%. Portions of this tax are earmarked for the following transportation programs: The 1971 Transportation Development Act (TDA) allows each county to impose a 0.25% sales tax for transportation purposes through the Local Transportation Fund (LTF). The BOE collects and distributes this tax revenue to each county based on a pro rata basis. The Public Transportation Account (PTA) provides funding for local transit, as outlined in the Transportation Development Act. The sole source of revenue for this account is from the state sales tax on diesel fuel. The sales and use tax on diesel fuel is an additional 1.75% on top of the base sales tax (7.50%) for FY and thereafter according to Revenue and Taxation Code , , and This equates to a total sales tax rate of 9.25% for diesel fuel. Proposition 22 (2010) requires revenue generated from the state s 4.75% base portion of the sales tax on diesel fuel to be split equally between the state and local transit agencies. The additional 1.75% on top of base sales tax on diesel fuel is dedicated to State Transit Assistance fund (STA) for operation and capital purposes. Truck Weight Fees: The state collects commercial vehicle fees based on weight, generating approximately $900 million a year. The California Department of Motor Vehicles (DMV) calculates weight fees based on the gross weight of commercial vehicles. Fees are collected and deposited into the SHA and then transferred onto the General Fund to pay for transportation debt as mentioned above. Proposition 1B Bonds: This 2006 Bond Act provided $19.9 billion for the following projects: congestion relief, freight movement facilitation, air quality improvement, and safety and security enhancements to the transportation network. STATE DECISION-MAKING Similar to federal programming, the State Legislature dictates how state revenues are spent on the transportation network. The Legislature appropriates state funding for specific purposes each year. State Transportation Improvement Program (STIP): Funds new construction projects that add capacity to the transportation network. STIP consists of two components: Caltrans Interregional Transportation Improvement Program (ITIP), and regional transportation planning agencies Regional Transportation Improvement Program (RTIP). STIP funding is a mix of state, federal, and local taxes and fees. State Highway Operations and Protection Plan (SHOPP): Provides funds for pavement rehabilitation, operation, and safety improvements on state highways and bridges. Active Transportation Program (ATP): In response to the Federal Transportation Alternative Program, Governor Jerry Brown signed Senate Bill (SB) 99 on September 26, 2013, allocating $129.5 million of federal and the State Highway Account funding to create the State ATP. This program provides funding for safe routes to school, pedestrian, bicycle, and trail projects. Furthermore, disadvantaged communities must receive at least 25% of the program s funding. The CTC is responsible for adopting guidelines and programming projects. Proposition 1B Transportation Bonds: The Highway Safety, Traffic Reduction, Air Quality, and Port Security Bond Act of 2006 (Proposition 1B) authorized the state to sell $19.9 billion in general obligation bonds for transportation projects. These projects focus on improving state highways and local roads, transit network, Chapter 4 Regional Transporta on Issues Page 30
35 freight mobility, and air quality. In partnership with the CTC, Caltrans is responsible for administering a majority of the Proposition 1B funds. A majority of Proposition 1B projects are complete or under construction for purposes such as SHOPP, Trade Corridors Improvement program, State Route 99, intercity rail projects, and seismic retrofitting of local bridges and overpasses. This program funded many projects in El Dorado County, but now has sunset. LOCAL FUNDS Local sales tax measures, the Transportation Development Act, transit fares, and other funding sources provide additional funding for various transportation purposes. Local Sales Tax Measures (Self-Help Counties): Counties are allowed to adopt a sales tax increase for transportation programs subject to 2/3 local voter approval and generally last between 20 to 30 years. El Dorado County is not currently a Self-Help County. 19 California counties have approved sales tax measures for transportation. 4 California Transit Authorities have approved permanent local tax measures. Transportation Development Act (TDA): As mentioned above, this 1971 Act provides local agencies with funding for transportation and transit purposes through the LTF and the STA. Transit Fares: Provide for local transit systems. Local General Funds and Other Local Funds: This includes TIM fees, property taxes, developer fees, street assessments, bonds, fines, and forfeitures. LOCAL DECISION-MAKING Currently, El Dorado County has three separate transportation impact mitigation (TIM) accounts: El Dorado Hills TIM, US 50 TIM, and West Slope TIM. The TIM Fee Program includes eight designated fee zones: Zone 1 East of Pollock Pines; Zone 2 Cameron Park/Shingle Springs; Zone 3 West of Placerville; Zone 4 North County; Zone 5 East of Placerville; Zone 6 Pleasant Valley; Zone 7 South County; and Zone 8 El Dorado Hills. Additionally, the City of Placerville has a separate TIM Fee Program which generates funding for projects within the City Limits. Both the City of Placerville and the El Dorado County TIM Fee Programs generate considerable local funding for new transportation facilities and improvements required by new development. FUTURE FUNDING Development of new sources of transportation funding is always a challenge; needs outpace available revenues. Nearly 15 years ago, the California Transportation Commission (CTC) conducted a survey to assess the "need" for transportation infrastructure in California. That survey estimated a 10-year transportation infrastructure need of approximately $110 billion. In late 2011, 13 years after the report, and 5 years after voters approved a $19.9 billion bond measure for transportation, the CTC conducted another survey of stakeholders to assess the state's transportation needs. That assessment concluded that the unfunded 10-year need is $296 billion. The state excise tax, now the highest in the country (when combined with the federal rate), may not be the best source of funding for our long-term needs. First, excise tax revenues are anticipated to continue to decline as vehicle efficiency improves in California. Second, the flat per-gallon excise tax does not grow with inflation, which over time can significantly reduce the purchasing power of this revenue. The gas tax has not been increased since A new approach to funding is necessary to prevent a steady disinvestment in our transportation system. The emergence of the Cap and Trade expenditure program provides an opportunity to expand investment in carbon-reducing transportation programs, but those funds probably will not be used for traditional state highway and local road construction projects. In summary there are many more transportation projects than there are funds available to implement them. Future funding sources for state and local projects will continue to be dependent on the condition of the local/federal/state budgets and the City Council, County Board of Supervisors, State Legislature and Congress development of transportation funding programs. Innovative approaches to transportation Chapter 4 Regional Transporta on Issues Page 31


36 funding and development of new funding sources will also be needed to provide for the multi-modal transportation needs of the residents and businesses of El Dorado County. Some of these approaches might include: dedicated sales tax, raising existing taxes such as the gasoline /fuel tax. PUBLIC HEALTH AND SAFETY Expanding the availability of, safety for, and access to a variety of transportation options and integrating health-enhancing choices into transportation policy has the potential to save lives by preventing chronic diseases, reducing and preventing motor-vehicle-related injury and deaths, improving environmental health, while stimulating economic development, and ensuring access for all people. Motor vehicle travel has become safer over time, but motor vehicle crashes are still the leading cause of death for people ages Improving the safety and efficiency of motor vehicles and their occupants is critical to improving transportation policy and the public s health. FIGURE 4-1: State Funding FIGURE 4-2: Federal Funding Chapter 4 Regional Transporta on Issues Page 32
37 Transportation-related air pollutants are one of the largest contributors to unhealthy air quality. Exposure to traffic emissions has been linked to many adverse health effects including: premature mortality, cardiac symptoms, exacerbation of asthma symptoms, diminished lung function, increased hospitalization and others. Public transportation systems reduce the necessity for single occupancy vehicle trips, reduce the production of automobile emissions, increase incidental physical activity, and provide necessary transportation access for people with physical, economic, or other limitations that impede their access to and use of a single occupancy motor vehicle. Policies that encourage public transportation infrastructure are needed to improve access for all people. Healthy community design incorporates elements (such as transportation networks, street designs, and zoning/land use policies) that work synergistically to promote health and safety. Active transportation systems should connect the places where people live, learn, work, shop, and play by providing safe and convenient walking and bicycling facilities. State funding exists for safety improvement projects for highways, transit, and safe routes to schools. However, the need for safety improvement projects far outstrips the available funding. Other funding is available for bicycle and bridge projects. State funds are also available for airport upgrades and improvements that impact safety and for updating the comprehensive land use plan for local airports. The RTP includes a wide array of transportation system projects which improve the safety for all users. This is consistent with the goals of the California s Strategic Highway Safety Plan (SHSP) which is a statewide, comprehensive, data-driven effort to reduce fatalities and serious injuries on public roads. Started in 2005, the SHSP is updated regularly to ensure continued progress and meet changing safety needs. REGIONAL ROAD NETWORK ISSUES MAINTENANCE AND REHABILITATION As traffic increases, the issues of roadway rehabilitation and maintenance, including vegetation management and storm water runoff, become increasingly important to ensure safe and effective travel. In particular, investing in the maintenance of the existing infrastructure is a focus of road projects during the planning period. Roadways, bridges, and the associated infrastructure have a limited useful life, and funding must be available to maintain and, if needed, rehabilitate these facilities. In addition, rehabilitation projects may be needed to accommodate changes in travel patterns. Interchanges may need to be upgraded to accommodate more efficient movement of traffic. Additional paving work may be needed in response to the faster breakdown of pavement integrity resulting from increased truck traffic. Lanes may need to be added and shoulders may need to be widened or added. Providing sufficient funding at the time it is needed to keep up with wear and tear and changes in traffic demands/patterns is crucial. Eighty-one percent of California s pavements are owned and maintained by cities and counties. The California State Association of Counties and League of California Cities, working with the California Regional Transportation Planning Agencies and the Rural Counties Task Force, released a Statewide Local Streets and Roads Needs Assessment in 2014, which assumed a ten-year analysis period. On a scale of zero (failed) to 100 (excellent), the statewide average pavement condition index (PCI) has deteriorated from 68 in 2008 to 66 ( at risk category) in 2012, and El Dorado County is 63 in If current funding remains the same, the statewide condition is projected to deteriorate to a PCI of 53 by Even more critical, the unfunded backlog will increase from $40.4 billion to $66 billion. Utilizing the county s pavement management program to determine priorities, maintenance and rehabilitation projects are added to the County s Five Year Capital Improvement Program (CIP). The most recent CIP was adopted by the County Board of Supervisors on June 24, To effectively implement the maintenance and rehabilitation projects for the 910 miles of western slope roadway included in the CIP, the County estimates an average yearly cost of approximately $2.7 million. The City of Placerville Pavement Management Program estimates an average yearly need of $1.7 million to elevate the current Pavement Condition Index from the current rating of 51 to the rating of 70 over the next 20 years for the streets and roads in the City. Chapter 4 Regional Transporta on Issues Page 33
38 As maintenance and rehabilitation projects are undertaken, it is important to involve all modes in design decisions so that pedestrians, bicyclists, auto vehicle drivers, large truck drivers, and transit can all move efficiently and safely. Furthermore, as projects are planned and ultimately delivered maintenance cost plans should be integrated to ensure the long-term sustainability of the transportation system across all modes. MOBILITY AND ACCESS To effectively support existing and future transportation needs EDCTC and local jurisdictions are faced with options to enhance or build upon existing infrastructure or develop increased access via new roadways. In areas where capacity is, or is planned to be, reached, or exceeded, options to explore other modes may promise improvements and ultimately a more efficient transportation system. In areas where mobility challenges are not related to congestion or capacity, access in the form of new transportation infrastructure is the more feasible alternative. This may be delivered in the form of new roadways, non-motorized facilities, or transit services. TRANSPORTATION DEMAND In order to address transportation needs associated with existing and projected growth, EDCTC and local jurisdictions are planning to build upon and fully utilize the capacity of the existing transportation system through strategic maintenance and improvements, implementation of new technologies which enhance performance of the transportation system, and when and where feasible expansion of the existing roadway systems. These efforts involve regional partnerships with SACOG, Caltrans, the private and public sectors, California Highway Patrol (CHP), local jurisdictions, and all users of the complete transportation system. EDCTC continues to promote the development of US 50 parallel capacity roadways, alternative modes and new technologies to reduce congestion and the reliance on US Hwy 50 for local trip purposes. Implementation of the Freeway Service Patrol along US Hwy 50 is one effort that has proven successful in achieving the transportation demand goals of the RTP. The Freeway Service Patrol program (FSP) is a program managed by the CHP and provides emergency roadside assistance on freeways. The Freeway Service Patrol is designed to increase roadway safety, reduce motorist delays, reduce freeway congestion, reduce air pollution, and improve overall efficiency of freeway operations. COMPLETE STREETS Governor Schwarzenegger signed AB 1358, the California Complete Streets Act of 2009, into law in September, AB 1358 requires a city or county s general plan to identify how the circulation of all users of the roadway, including motorists, pedestrians, bicyclists, children, seniors, individuals with disabilities, and users of public transportation will be accommodated. This especially critical in El Dorado County which has experienced a significant growth in the elderly population placing emphasis on the importance to consider their transportation needs. Such accommodations may include sidewalks, bike lanes, crosswalks, wide shoulders, medians, and bus pullouts, among others. In addition to the typical complete streets application, EDCTC also encourages implementation of Intelligent Transportation Systems throughout the region and coordination with utilities to include rural broadband. AB 1358 is also a key strategy to help improve air quality and reduce greenhouse gas emissions. Integrating sidewalks, bike lanes, transit amenities, and safe crossings into the initial design of a project is more cost-effective than constructing retrofits later. Furthermore, consideration should be given to the growing elderly population, some of whom rely on personal motorized scooters and other electric driven vehicles for mobility. These types of vehicles are often overlooked when constructing transportation facilities. Considerations given to an aging population should include adapting, connecting and modifying roads to better accommodate the transportation needs by providing lower speed route options, senior friendly road designs, and signal timing. TRANSIT ISSUES COMMUTER TRANSIT El Dorado County ranges from sparsely populated rural areas to more densely populated urban areas. With Chapter 4 Regional Transporta on Issues Page 34
39 the county s increasing population comes an increasing demand for transit service to more people over larger areas. Over the past 20-year period, the number of persons using public transportation to commute to work has increased significantly. As the emphasis shifts from local bus service to regional services, the creation of multi-jurisdictional agreements for ongoing funding of transit will become even more important. The convenience and reliability of transit services plays a key role in encouraging transit use as opposed to single-occupancy vehicle commuting. In particular, convenience can be provided by designing transit services that are as seamless as possible. Transit can also play a role in mitigating El Dorado County s jobs/housing imbalance by providing tailored commuter services. Light Rail and/or Bus Rapid Transit services along selected corridors may prove helpful in enhancing convenience and providing a viable alternative to driving. Other more specific factors also contribute to the need for increased transit: The Americans with Disabilities Act requires the expansion of paratransit services to specific areas complementary to fixed-route service State and federal clean air legislation and transportation demand management principles call for the increased use of transit to offset and reduce automotive vehicle emissions Commuter bus service to provide quick connections between El Dorado County and downtown Sacramento has been a consistent need cited by El Dorado County citizens The aging of the population also contributes to the demand for transit and paratransit services, as people become unable to drive themselves. This increased demand includes non-emergency medical transportation As the entire Sacramento region grows, interregional connections between areas such as El Dorado County, South Placer County, and Rancho Cordova will become increasingly important COMMUNITY TRANSIT SERVICE Regular and convenient local community transit service is a fundamental key to increasing transit ridership. While local service currently exists in Cameron Park, adjacent El Dorado Hills is recognized as an important activity center not currently well served by El Dorado Transit. An evaluation of potential transit demand in El Dorado Hills indicates significant transit demand in the social service realm, particularly among teens, seniors, and the disabled. In addition, the major employment centers in the southern portion of El Dorado Hills generate a potential for transit ridership. Through this RTP, funding options will need to be explored to improve local community transit service in the Cameron Park and El Dorado Hills areas. The coordination of bicycle and pedestrian facilities with local transit stops is recognized as an important factor in encouraging and maintaining transit ridership on local routes. It is recognized that at one end of their trip or the other, virtually all transit passengers also travel on foot or on bicycle. Furthermore, daily transit needs of rural residents may not be typical of a more urban transit system. Therefore, dial-a-ride services provide for these needs on a more individual basis. REGIONAL TRANSIT CONNECTIONS Regional transit connections are one of the most prominent transportation issues in El Dorado County. As El Dorado County works to manage a jobs-housing balance over the next 20 years, the daily movement of people to and from jobs to the Sacramento Valley west of El Dorado County will remain consistent. The existing El Dorado Transit Commuter Service to downtown Sacramento is a popular and valuable service to the citizens of El Dorado County. In order to maximize the convenience and efficiency of the commuter service, El Dorado County will need to maintain and improve safety and access at transit stops and park-and-ride lots as well as maximize use of the existing US 50 High Occupancy Vehicle (HOV) Lanes. Convenient and timely regional connections to Folsom health care facilities and light rail stations remain as key components of regional transit service. An emerging regional connection is the Capital SouthEast Connector project which will ultimately provide a transportation facility connecting El Dorado County with the City of Elk Grove. As the Capital SouthEast Connector project moves forward, El Dorado County will need to consider potential light rail options as well as options for a county line transit transfer center. Chapter 4 Regional Transporta on Issues Page 35
40 Another challenge facing transit service providers across the region is a connected transit network which supports the significant tourism and recreation travel needs. El Dorado County experiences high volumes of tourism and recreation traffic from the broader region, including the State of Nevada. A high percentage of visitors come from urban areas where transit service is readily available. Developing a cross jurisdictional transit network which supports tourism and recreation travel needs would likely be utilized and appreciated by many visitors to and within the region. Furthermore, a complete cross jurisdictional transit network would mitigate some of the impacts posed by high tourism traffic volumes to the rural state and local transportation network. COORDINATION WITH SCHOOLS/COLLEGES Transit coordination with schools and school transportation would benefit transportation services between the two public entities. Transit service to local colleges, as well as regional connections to colleges west of El Dorado County in Folsom or Sacramento, will need to be identified and coordinated with existing regional transit connections in Folsom and Rancho Cordova. Additionally, school bus service and transit service often follow similar routes and scheduling. Therefore, there may be opportunities for a coordinated effort which would merge the two services in manner which is cost effective and serves all users including children and seniors in the rural reaches of the County. AVIATION ISSUES AIRPORT LAND USE COMMISSION As the Airport Land Use Commission (ALUC) for the western slope of El Dorado County, EDCTC continues to support efforts to identify and utilize available funding at the state and federal level for airport infrastructure improvement, planning, and expansion as warranted. Additionally, EDCTC is responsible for the review of proposed projects, to be consistent with the current Airport Land Use Compatibility Plans, in and around the three airports within their jurisdiction which include the Georgetown, Placerville, and Cameron Park Airports. These airports support five primary functions throughout El Dorado County; public and private regional air transportation and emergency, fire, and rescue. EMERGENCY RESPONSE The rural and remote character of the county requires that operations of each airport be maintained to ensure the safety, security, and prosperity of residents. To guarantee this fundamental function, it is important to continue improving upon emergency response times and capacity. One critical aspect of emergency air services is the continued planning and development of the surface transportation network connecting emergency service providers to airport facilities via an efficient streets and roads network. Consequently, planning for efficient surface to air transportation networks will add to the success of each of the three functions of county airports, but most importantly will enhance emergency vehicle access. Additionally, to effectively provide emergency services, technological advancements must be maintained at each airport to ensure the most up to date and current information systems are utilized. ECONOMIC IMPACTS In addition to providing emergency and transport services to local and regional residents, El Dorado County airports are a major contributor to the economic prosperity and viability of the community. However, they are often overlooked as such and are challenged by limited exposure throughout the region and state as strong economic players. Increased exposure and awareness may draw potential employers and businesses in high-tech and high-wage industries that are generally dependent on efficient and reliable air transport. Additionally, increased awareness would reveal opportunities for regional public and private travel opportunities. Increasing awareness of the county s airports would add value to the marketing efforts of agri-tourism, outdoor recreation, and other local attractions and local economic drivers. INFRASTRUCTURE ENHANCEMENT AND EXPANSION As challenges are overcome El Dorado County airports will be positioned to add services, enhance infrastructure, and expand when necessary. Enhancement efforts such as these are included in the 2014 El Dorado County Airport Capital Improvement Program, which outlines specific projects such as increased tie Chapter 4 Regional Transporta on Issues Page 36
41 down and hangar capacity, runway repaving, and technological advancements. Implementation of these and other improvements will add greatly to each airport and ensure that the three major air transportation functions serving the county are maintained into the future. FREIGHT MOVEMENT ISSUES As population and traffic increase, the ability to move freight efficiently and safely within and through El Dorado County will be an ever-increasing challenge. Efficient freight movement is essential for the local and regional economy. The majority of freight movement in El Dorado County is provided by truck transportation. US 50 is an important truck route for the region of Northern California. Truck traffic, as a percentage of Average Annual Daily Traffic, ranged from 3.1% to 6.5% on US 50 and from 3% to 14.2% on State Route 49 in El Dorado County in 2007 (Caltrans traffic volumes website). It is important to consider the needs of all road users (e.g., residents, truckers, buses, bicyclists) when planning for freight movement. Regional air freight, utilized extensively by manufacturers in El Dorado County, is handled either at Sacramento International Airport or at Mather Airport. Because air freight is market-driven, it is impossible to predict exactly what the demand for it will be in the future, which airport will be used, and to what extent. NON-MOTORIZED TRANSPORTATION ISSUES Bicyclists and pedestrians share the use of transportation facilities with motorized vehicles for both recreation and transportation. Non-motorized transportation can provide a viable alternative to motorized transportation if the design of new and/or rehabilitated facilities considers the need for bicyclists and pedestrians to have access to safe travel, direct routes, well maintained facilities, and off-road options when necessary. In addition to providing an alternative mode of transportation, non-motorized transportation also provides ancillary benefits such as reduced congestion, improved air quality, and improved public health. Providing for safe and efficient non-motorized facilities also encourages more users, such as children to and from school, where currently unsafe conditions may or may be perceived to exist. By including community members in the non-motorized planning process a greater sense of safety and security can be had for users and/or parents of users of the facilities. Land use coordination can have an impact on people s choice of travel mode by connecting non-motorized transportation facilities to activity centers, particularly in the most densely populated areas of the county, and providing safe routes to schools. To facilitate non-motorized transportation this RTP recommends inclusion of non-motorized travel needs in all phases of land use and transportation planning, design, and implementation. Through discussions with the public and EDCTC agency partners, four overarching themes emerged concerning non-motorized transportation issues: safety, access, connectivity, and funding. MODE SPLIT A common term used in analyzing choices people make in transportation is mode split. Mode split refers to the transportation option a person chooses, be it taking a bus, walking, carpooling, driving, or bicycling. Mode split is often used to evaluate transportation mode choices, and the trend in the Sacramento region today is to create a more evenly distributed mode split. The Census records only Means of Transportation to Work and thus, home-to-school, trips to the store, trips to a friend s house, or other transportation related trips remain unaccounted for. Chapter 4 Regional Transporta on Issues Page 37
42 Table 4-1: El Dorado County* Mode Split Means of Transportation to Work for Workers age 16 and over Transportation Mode Number of Persons Percent of Work Trips or Mode Split Drove alone 60,721 79% Carpooled 7,392 10% Public Transportation 1, % Motorcycle % Bicycle % Walked 1, % Other means % Worked at home 4,787 6% TOTAL 76, % *Includes Tahoe Basin Data Source: US Census 2010 Chapter 4 Regional Transporta on Issues Page 38
43 Guiding Principles, Goals, Objectives, Policies, and Performance Measures Chapter 5 As part of the planning process, the Regional Transportation Plan establishes guiding principles, goals, objectives, policies, and performance measures to guide the development and management of the region s transportation systems. These elements of the Regional Transportation Plan were prepared in accordance with the California Transportation Commission 2010 RTP Guidelines. EDCTC s guiding principles, goals, objectives, policies, and performance measures were developed to address the regional transportation needs and to provide guidance and monitoring tools to make informed planning decisions. Within this Chapter these elements are presented by mode or topic area and are not presented in any prioritized manner. Guiding Principles direct how EDCTC, working as part of a larger regional context, will contribute to overall quality of life for the region. Goals are general statements outlining the desired transportation future reflecting the region s needs and priorities. Objectives are specific and quantifiable steps toward the realization of those goals. Policies are statements that provide direction for decisions to help attain these goals and objectives. Performance Measures provide a means to determine existing transportation system conditions and to evaluate the effectiveness of proposed investments by using a qualitative or quantitative measure that corresponds to the success of transportation investments. GUIDING PRINCIPLES Guiding principles direct how EDCTC working as part of a larger regional context comprised of the interests of public citizens, local governments, non-profit organizations, and the business community will contribute to preservation and development of an integrated multi-modal transportation system which enhances the overall quality of life for the region. Guiding Principle A: Coordination EDCTC will enhance coordination with local and regional partner agencies to include El Dorado County, the City of Placerville, Caltrans, Tahoe Regional Planning Agency, Tahoe Transportation District, and maintain strong collaboration with SACOG to provide for regional air quality conformity analysis, travel demand modeling, and consistency with relevant legislation. Guiding Principle B: Livability EDCTC plans and programs will enhance the quality of life in the region by supporting transportation improvements that increase opportunities for a strong jobs-housing balance, environment, economy, education, healthful communities, recreation, and civic involvement. Guiding Principle C: Sustainability EDCTC plans and programs will support growth and prosperity while enhancing the health, environment, natural and socio-cultural resources, reducing greenhouse gas emissions, preserving and enhancing rural and community character, or financial stability of current or future generations. Chapter 5 Guiding Principles Page 39
44 Guiding Principle D: Prosperity EDCTC plans and programs will contribute to the economic well-being of the region by supporting transportation solutions that increase access to education, jobs, and amenities, unique rural resources, reduce the cost of living and doing business, and attract new investment to the region. Guiding Principle E: Diversity EDCTC plans and programs will recognize the multitude of needs and the variety of perspectives and backgrounds of the people that live, work, and visit the region by promoting a range of equitable transportation choices that are designed with sensitivity to the desired context while preserving the unique character of each community or sub region. Guiding Principle F: Safety and Security EDCTC will plan for transportation investments which improve and/or maintain the safety and security of the transportation system and its users. Guiding Principle G: Transparency EDCTC will ensure that local jurisdiction and public involvement in transportation plans and programs will be early, ongoing and meaningful in its methods and outcomes to ensure the community has ownership in the process and results. Guiding Principle H: Accountability EDCTC will incorporate performance measures and monitoring for plans, programs, and infrastructure projects to ensure federal, state, and local investment in the transportation system effectively meets the needs of the transportation users in the region. GOALS, OBJECTIVES, AND POLICIES The goals embody a general set of strategies by which EDCTC working as part of a larger regional context comprised of the interests of public citizens, local governments, non-profit organizations, and the business community to help the region achieve the desired future. These goals reflect the region s transportation needs and priorities while the objectives represent a specific. Policies are the actual elements EDCTC will implement to achieve the goals of the 2035 Regional Transportation Plan. To align with the guiding principles and effectively provide transportation facilities and services in and beyond El Dorado County, the following eight goals are provided and discussed further. OVERALL GOALS Support the maintenance of and improvement to an integrated multi-modal transportation system which is safe, efficient, accessible, and convenient for all users throughout, within, and beyond the region. Promote a convenient, desirable, and reliable regional and interregional public transit system for residents and visitors travelling within, to, and beyond El Dorado County. Promote and preserve aviation facilities and services that complement the regional transportation system, support emergency response, and enhance economic activities. Provide for the safe and efficient movement of freight through and within El Dorado County. Promote a safe, convenient, and efficient non-motorized transportation system which is part of a balanced overall transportation system for all users. Develop and promote plans and programs which support active transportation as a choice to reduce vehicle miles travelled, greenhouse gas emissions, the impacts of single-occupant vehicle travel, and enhance public health. Integrate local and regional land use, air quality, and transportation planning to create a transportation system which supports the needs of the system user, enhances the economy, preserves the environment, and protects the community character. Secure maximum available funding and pursue new sources of funds for maintenance, safety, expansion, and improvement of all modes of transportation facilities and services. Chapter 5 Guiding Principles Page 40
45 GOAL: HIGHWAYS, STREETS, AND REGIONAL/INTER-REGIONAL ROADWAYS Support the maintenance of and improvement to an integrated multi-modal transportation system which is safe, efficient, accessible, and convenient for all users throughout, within, and beyond the region Objective A: Provide for a complete roadway transportation network which supports existing and future transportation needs Policies: 1. Support the implementation of the local jurisdictions adopted General Plans and related Circulation Elements 2. Provide necessary planning and programming support for local jurisdictions to prioritize, fund, deliver, and maintain projects included in their respective Capital Improvement Programs 3. Maintain and update the current RTP to ensure investments reflect changes in growth patterns and land use 4. Encourage local jurisdictions to adapt, connect, and modify transportation to better accommodate the needs of our aging population 5. Develop and promote a complete transportation system that supports active transportation, improves public health, reduces greenhouse gas emissions, and offers equitable modal choices for all users to access daily goods and services Objective B: Uphold the existing transportation system at a standard which furthers its life and viability and continues to support the region s current and future transportation needs Policies: 1. Encourage local jurisdictions to adopt a fix-it-first planning and programming approach directing transportation funding to clearly identified maintenance and improvements to the transportation system 2. Identify transportation infrastructure in need of major upgrading to meet standards for safety, operations, and design through coordination with Caltrans, regional, and local capital improvement programs 3. Support local jurisdictions to maintain and implement current (two-year cycle) pavement management programs which identify and prioritize projects 4. Incorporate maintenance, funding, safety, and action plans when planning or programming new or expanded transportation elements 5. Encourage local jurisdictions and transit operators to maintain transportation infrastructure which allows transit service to meet the demands of transit users effectively Objective C: Support the maintenance of a safe, sustainable, and reliable transportation system optimizing all travel modes for all users with a focus on cost effectiveness, demand, and prioritization Policies: 1. Seek out creative and alternative low cost high impact transportation solutions, across all modes, when planning and programming new transportation investments 2. Encourage local jurisdictions to focus non-maintenance investments on parallel capacity to US Hwy 50 and SR 49 to reduce reliance on these routes for local trip purposes 3. Coordinate the evaluation and prioritizing of investments which are cost effective and consistent with travel demand model analysis, environmental practices, local plans, engineering, and safety 4. Work with local jurisdictions to increase efforts to improve the form and function of transportation corridors in order to contribute to the sense of place and preserve historic character 5. Provide support for local jurisdictions to identify, prioritize, and eliminate conditions on local and regional roadways that currently or may pose a safety risk in coordination with Caltrans and local jurisdictions 6. Support the achievement of state and federal air quality goals and greenhouse gas reduction targets 7. Encourage the development of mobility improvement projects that ensure that community values and regional character are protected or enhanced 8. Coordinate with local jurisdictions to provide effective transportation choices for a diverse population including the aging, youth, and disabled Chapter 5 Guiding Principles Page 41
46 GOAL: PUBLIC TRANSIT Promote a convenient, desirable, and reliable regional and interregional public transit system for residents and visitors travelling within, to, and beyond El Dorado County Objective A: Focus transit service provision to the region s diverse characteristics Policies: 1. Encourage transit operators to prioritize transit services in urban and suburban areas, corridors with high commuter volume, high-tourism traffic areas and where other operational efficiencies exist 2. Encourage the development of new and innovative transit systems which are effective in serving non-typical transit users such as rural residents, recreation, and tourism travelers 3. Work with transit operators, both within El Dorado County and the surrounding Counties, to coordinate with regional transit operators to support transit trips into and out of El Dorado County for employment, education, medical, tourism, and recreation travel purposes 4. Work with partner agencies to encourage development of bicycle and pedestrian facilities to transit stops, park and ride lots, and other multi-modal facilities Objective B: Promote a transit system that is responsive to the needs of transit-dependent persons Policies: 1. Update and implement the Coordinated Public Transit Human Services Transportation Plan in coordination with the El Dorado County Transit Authority (EDCTA), who also serves as the Consolidated Transportation Service Agency, and other social service agencies 2. Assist with the ongoing implementation of the Americans with Disabilities Act 3. Promote the provision of discount fares for the elderly, disabled, and students 4. Work with EDCTA to assist social service agencies in providing multi-modal transportation for Access to Jobs clients 5. Utilizing the Coordinated Public Transit Human Services Transportation Plan, work to improve services through coordination between social service transportation and public transit 6. Work with transit providers and social service transportation providers to improve or increase transit services to rural and remote areas 7. Integrate bicycle and pedestrian connections to transit stops and services Objective C: Develop and encourage the use of public transit as a primary transportation alternative Policies: 1. Support transit operators to provide effective, convenient, coordinated transit service that serves employment and activity centers, daily goods and services, education centers, recreation and tourism, and offers a viable option to single-occupant vehicle travel within and beyond the region 2. Promote coordination with regional transit and paratransit systems 3. Involve employers of the region in meeting the transportation needs of employees 4. Develop and work with transit providers to implement a multi-lingual marketing program to promote public transit 5. Work with local jurisdictions to integrate transit accessibility for projects and investments Objective D: Provide an effective and efficient transit system that best utilizes available resources Policies: 1. Provide necessary support to transit operators to maintain a performance monitoring system which evaluates the effectiveness of transit service as outlined in the Transportation Development Act 2. Encourage transit operators to utilize developments in technology such as mobile device applications, and other Intelligent Transportation Systems, to inform transit users of available service and monitor transit vehicles in order to optimize routes Chapter 5 Guiding Principles Page 42
47 3. Work with transit operators to ensure that transit services continue to meet all state and federal requirements for funding, including those for farebox recovery ratios 4. Promote an effective and efficient transit planning process GOAL: AVIATION Promote and preserve aviation facilities and services that complement the regional transportation system, support emergency response, and enhance economic activities Objective A: Promote the operation, preservation, and maintenance of a regional system of public use general aviation airports Policies: 1. Promote the development of airport facilities and services necessary to satisfy a diversity of user requirements such as plane and small jet sizes and fuel requirements 2. Encourage the development of aviation system facilities that serve as a regional economic stimulus including aircraft maintenance and restoration and flight training 3. Support the role of public use airports in accommodating general aviation, agricultural, business promotion and retention, and emergency response needs 4. Participate in Caltrans Division of Aeronautics regional and statewide aviation planning efforts 5. Promote the safe, orderly, and efficient use of airports and air space and compatible land uses that are consistent with the Airport Compatibility Land Use Plans Objective B: Implement and maintain Airport Land Use Compatibility Plans (ALUCPs) Policies: 1. Coordinate with airport owners/operators to maintain up to date Airport Master Plans 2. Acquire funding through Caltrans Division of Aeronautics to maintain up to date ALUCPs 3. Recognize the need for comprehensive and coordinated aviation planning Objective C: Encourage and promote air passenger, specialty freight movement, and other aviation and air transportation services as part of a multi-modal transportation system Policies: 1. Support projects that integrate air transport facilities with other modes of transportation, including roadway, emergency, public transit, and non-motorized access 2. Support projects that facilitate freight movement utilizing the regional system of airports 3. Promote road system maintenance, consistent with appropriate standards that support freight movement and emergency services, to support access to airports GOAL: FREIGHT MOVEMENT Provide for the safe and efficient movement of freight through and within El Dorado County Objective A: Promote a coordinated system of surface and air transportation for the improvement of freight transport Policies: 1. Support projects that facilitate interregional freight transport throughout the County 2. Encourage local jurisdictions and Caltrans to maintain freight movement coordination at the regional, state, federal, and international level 3. Help local jurisdictions to establish appropriate infrastructure that supports the export of local agriculture and other freight to enhance the competitiveness of the region s export market 4. Support projects that facilitate interregional freight movement to and from the region s commercial and industrial facilities to encourage business attraction and retention 5. Support projects that address the timely movement of freight and services throughout the region Chapter 5 Guiding Principles Page 43
48 6. Encourage local freight operators to coordinate with local jurisdictions and Caltrans to establish formal truck routes to improve efficiency, safety, and maintenance Objective B: Mitigate conditions that are dangerous or unacceptable for freight transport Policies: 1. Encourage local jurisdictions to maintain pavement management systems that identify and prioritize road maintenance projects to better serve primary shipping routes 2. Encourage local jurisdictions to provide proper road geometry and weather maintenance efforts on roadways intended to accommodate truck traffic 3. In coordination with local jurisdictions, partner agencies, businesses, and Caltrans improve access to transportation system condition information to provide for better route/trip planning, reduction of travel time, and ingress-egress options for enhanced freight movement services GOAL: NON-MOTORIZED TRANSPORTATION Promote a safe, convenient, and efficient non-motorized transportation system which is part of a balanced overall transportation system for all users Objective A: Plan and develop a continuous, safe, and easily accessible pedestrian and bicycle system within the region and connecting to surrounding regions Policies: 1. Ensure that local jurisdictions have current Bikeway Master Plans that comply with state standards 2. Ensure that local jurisdictions have current pedestrian circulation plans that comply with state and federal standards 3. Encourage the completion of existing bicycle and pedestrian systems and facilities, with an emphasis on closing gaps and providing connectivity to activity centers 4. Work with local jurisdictions to include Class I, II, and III bikeways with all new construction per currently accepted standards, and include Class II or Class III on existing facilities, and during maintenance efforts as preferred linkages in the bicycle facilities network 5. Develop a visually clear, simple, and recognizable bicycle route map and way finding system 6. Work with local jurisdictions to incorporate investment strategies which provide a diversification of modes 7. Encourage the development of underutilized rights of way, corridors, irrigation ditches, and utility easements for non-motorized transportation facilities 8. Expand non-motorized accessibility within and between new and existing residences, job centers, schools, services, recreation, and other activity centers 9. Pursue alternative funding mechanisms for the development and maintenance of bicycle and pedestrian facilities 10. Encourage local jurisdictions to consider use of non-motorized facilities by mobility-challenged users 11. Collaborate with local jurisdictions to incorporate complete streets and/or context sensitive solutions which fit the character of the region s communities into every transportation investment Objective B: Support local jurisdictions in providing a pedestrian transportation system that emphasizes the health, safety, travel needs, and wellbeing of people as part of a multi-modal transportation system Policies: 1. Encourage local jurisdictions to develop ordinances to define direction of travel for all users on shareduse facilities 2. Ensure that local jurisdictions have current pedestrian circulation plans that comply with state and federal standards 3. Work to prevent the placement of signs or other obstructions to be placed in pedestrian right-of-ways Chapter 5 Guiding Principles Page 44
49 4. Help local jurisdictions to identify and correct intersections that have sub-standard or missing crosswalks and/or curb cuts 5. Encourage local jurisdictions to incorporate pedestrian improvements with maintenance improvements or new developments to the existing roadway network 6. Work with local jurisdictions to prioritize designs that provide for safe use by all modes and all users 7. Work to incorporate adjacent pedestrian facilities maintenance into roadway maintenance including upgrading the pedestrian facility to current design standards 8. Encourage local jurisdictions to include sidewalks, walkways, and/or shoulders on new construction consistent with the adopted General Plans, Transit Plans, and Bicycle and Pedestrian Plans 9. Collaborate with regional and cross-regional jurisdictions to establish a comprehensive regional and cross regional pedestrian transportation system that provides connections with public transit as part of a multimodal transportation system 10. Work with local jurisdictions and Caltrans to incorporate a pedestrian level of service measurement system for non-motorized facilities Objective C: Support Local Jurisdictions in providing a bicycle transportation system that emphasizes the health, safety, travel needs, and wellbeing of people as part of a multi-modal transportation system Policies: 1. Encourage the location of secure facilities for bicycle storage at major activity and employment centers as well as transit facilities such as park-and-ride lots 2. Encourage local jurisdictions to develop ordinances to define direction of travel for all users on shared-use facilities 3. Work to prevent the placement of signs or other obstructions to be placed in bicycle network right of ways 4. Encourage local jurisdictions to incorporate bicycle facilities when implementing maintenance improvements or new developments to the existing roadway network 5. Work with local jurisdictions to prioritize designs that provide for safe use by all modes and all users 6. Work to incorporate adjacent bicycle network maintenance into roadway maintenance including upgrading the non-motorized facility to current design standards 7. Encourage local jurisdictions to include bicycle facilities on construction consistent with the adopted General Plans, Transit Plans, and Bicycle Transportation Plans 8. Collaborate with regional and cross-regional jurisdictions to establish a comprehensive regional and cross regional bicycle transportation system which enhances modal connectivity and encourages active transportation that provides connections with public transit as part of a multimodal transportation system 9. Work with local jurisdictions and Caltrans to incorporate a bicycle level of service measurement system for transportation facilities GOAL: TRANSPORTATION SYSTEMS MANAGEMENT Develop and promote plans and programs which support active transportation as a choice to reduce vehicle miles travelled, greenhouse gas emissions, the impacts of single-occupant vehicle travel, and enhance public health Objective A: Support the creation of a multi-modal and multi-jurisdictional transportation network connecting residential areas, educational and recreational facilities, and employment centers Policies: 1. Market the availability of transit service information to likely users including educational, commercial, recreational, employment, and civic centers 2. Encourage the consideration of education trips, employment trips, tourism, and daily travel routes when locating multi-modal connections 3. Encourage local jurisdictions to consider multi-modal transit facilities when planning development supporting large concentrations of people and services Chapter 5 Guiding Principles Page 45
50 4. Encourage schools to promote the use of bus transportation, non-motorized travel, and ridesharing while discouraging use of single-occupant vehicles 5. Encourage local jurisdictions to promote mixed use development to include multi-modal transportation facilities 6. Encourage local jurisdictions, Caltrans, and transit operators to deploy technology, such as mobile device applications, as a means to inform the travelling public of the transportation system conditions, route choices, and traveler experience 7. Strive for full modal integration to provide options for a complete trip to include bicycle, pedestrian, transit, and auto for employment, education, and all other trips Objective B: Support advancement of Transportation Demand Management (TDM) in a thorough, cost-effective manner which reflects the needs of the region Policies: 1. Support the use of public transportation as a transportation control measure to improve throughput and reduce traffic congestion and vehicle emissions 2. Work with Caltrans and local jurisdictions to locate and develop park-and-ride lots 3. Work with the Regional Rideshare Partnership and appropriate agencies to coordinate ridesharing activities and goals 4. Promote awareness of the positive impacts of alternative transportation 5. Encourage local jurisdictions to implement a TDM ordinance for large businesses in El Dorado County 6. Continue the Freeway Service Patrol program along US 50 in El Dorado County 7. Work with local jurisdictions and Caltrans to develop Intelligent Transportation System elements which enhance traveler information dissemination and help shape more efficient travel patterns and route alternatives GOAL: INTEGRATED LAND USE, AIR QUALITY, AND TRANSPORTATION PLANNING Integrate local and regional land use, air quality, and transportation planning to create a transportation system which supports the needs of the system user, enhances the economy, preserves the environment, reduces greenhouse gases, and protects the community character Objective A: Provide transportation planning support services to local jurisdictions regarding the countywide transportation impacts of local land use decisions Policies: 1. Support the implementation of the local jurisdictions General Plans and encourage implementation to include performance measures to balance growing capacity, cost of infrastructure, and quality of life; seek a balance of housing and employment land uses which encourage the use and integration of transit in daily trips; and continue to provide opportunities to review development proposals to ensure the region s transportation goals, objectives, and policies are achieved 2. Incorporate public outreach efforts as a fundamental component of the transportation planning process and encourage input from all interest groups and individuals 3. Encourage local jurisdictions to seek a balance of housing and employment land uses which encourage the use and integration of transit and/or non-motorized modes in daily trips 4. Work with local jurisdictions to protect transportation corridors and future rights of way through the adoption of specific plans, zoning ordinances, and general plans 5. Work closely with local, regional, state, federal, and tribal partner agencies to provide opportunities and define roles for all types of organizations and/or individuals (public or private) to assist in the implementation of transportation programs and projects Objective B: Support local, tribal, state, and regional jurisdictions to ensure the transportation infrastructure meets existing and future needs Chapter 5 Guiding Principles Page 46
51 Policies: 1. Encourage local jurisdictions to develop transportation projects and programs that complement planned growth patterns, economic development programs, and support adjacent land uses 2. Work with local jurisdictions to review and assess the impact of new development proposals on transportation system demand 3. Encourage local jurisdictions to use Complete Streets practices for new development, redevelopment, and infill areas with a focus on high traffic and high-intensity land uses 4. Coordinate with local jurisdictions to plan for, construct, and maintain multi-modal transportation infrastructure for the senior, youth, and disabled 5. Utilize the current regional travel demand model and land use forecasts for the region in planning and programming decisions Objective C: Support transportation planning and programs which aid in achieving regional air quality standards and greenhouse gas emission reduction targets Policies: 1. Coordinate with local agencies, Caltrans, and other partners to prioritize transportation projects that minimize vehicle emissions while providing cost effective movement of people and freight 2. Work with local transit providers, jurisdictions, and employers to provide for transportation services, facilities, and vehicles that cause the least amount of environmental impact and yield environmental benefits wherever feasible 3. Promote a transportation system and support local jurisdictions land use planning which minimizes dependence on long-distance, single-occupant-vehicle commute trips 4. Consider how transportation policies, programs, and investment strategies affect the overall health of people and the environment including air quality, physical activity, biodiversity, and natural resources 5. Promote project types that have a proven track record of reducing air pollution 6. Provide assistance to local heavy equipment and diesel vehicle operators to identify diesel retrofit grant programs and to seek out those funding opportunities 7. Ensure all transportation planning efforts comply with Assembly Bill 32 and Senate Bill 375 requirements Objective D: Work with local jurisdictions, Tribal Governments, the Sacramento Area Council of Governments, Caltrans, the California Transportation Commission, and other transportation agencies to develop a regional planning and programming process to ensure that El Dorado County jurisdictions have maximum participation in the transportation decision-making process Policies: 1. Develop mechanisms such as Memoranda of Understanding and Joint Powers Agreements between jurisdictions to accomplish planning and implementation of multi-jurisdictional transportation projects and programs 2. Facilitate the coordination and implementation of local and regional transportation programs to improve mobility and air quality 3. Coordinate transportation planning with local, regional, state, tribal, and federal governments. 4. Build coalitions with key private sector and community groups 5. Support the coordination of inter-jurisdictional transportation projects with Caltrans and other agencies GOAL: FUNDING Secure maximum available funding and pursue new sources of funds for maintenance, expansion, and improvement of all modes of transportation facilities and services Objective A: Obtain funding for vital mutli-modal transportation needs through all sources. Policies: 1. Maintain required planning documents to be current and meet planning regulations and guidelines to qualify for federal and state transportation funding sources. Chapter 5 Guiding Principles Page 47
52 2. Strengthen coordination, cooperation, and consistency between local partner agencies to maximize the effective use of transportation resources 3. Practice thoughtful, transparent financial stewardship by ensuring that transportation improvements meet the region s needs 4. Promote the funding of operational improvements that will improve traffic flows, further lifecycle, reduce vehicle miles travelled, and optimize system capacity at relatively low cost 5. Promote the funding of maintenance, operational improvements, and modernization of public transit services and facilities 6. Promote funding of maintenance for existing infrastructure as a top priority 7. Promote the funding of non-motorized projects which increase accessibility to activity centers and residences 8. Prioritize transportation funding according to the overall transportation system benefit 9. Promote funding of transportation projects consistent with provisions included in adopted general plans 10. Work with partners to provide opportunities and define roles for all types of organizations and/or individuals (public or private) to assist in the implementation of programs and projects 11. Establish funding priorities which support the deployment of technology based transportation improvements such as intelligent transportation systems Objective B: Develop innovative funding for vital transportation needs where conventional funding sources are insufficient Policies: 1. Encourage local jurisdictions to effectively utilize Transportation Impact Mitigation Fee programs connecting financing of new or expanded facilities and services to the development that is creating the need for such facilities 2. Support the improvement of the transportation experience to visitors or prospective businesses or residents; complement existing natural and cultural resources; improve the function of the road for all users; and foster civic pride toward public investments in infrastructure 3. Assist local jurisdictions to identify and obtain grant and other non-traditional funding 4. Consider alternative fund sources such as local transportation sales taxes, local option motor vehicle fuel taxes, public/private partnerships, peak hour congestion pricing, road user fees, and bond measures in the event funding shortfalls for needed projects occur 5. Develop new sources of funding for road rehabilitation and maintenance in coordination with the League of California Cities, California State Association of Counties, Regional Council of Rural Counties, legislators, transportation groups, and other interested parties 6. Provide education on transportation funding and how it is utilized 7. Explore the feasibility of implementing a local option sales tax for transportation purposes PROJECT CONSISTENCY The eligibility criteria for many funding programs include a requirement that the project be consistent with the goals, objectives, and policies of the Regional Transportation Plan. The following list of project categories is consistent with this RTP document (in no priority order). Projects that meet the needs of persons whose mobility is limited by inaccessible transportation systems Transportation maintenance and preservation projects Capacity increasing projects only where alternative solutions would not be practical or cost-effective Connections between urbanized areas of the county of roads, non-motorized networks, and reasonable public transit service to meet demand Projects to enhance the movement of agricultural, commercial, and industrial freight Projects that maintain the interregional integrity of the state highway system Projects to enhance surface connections to airports System management, demand management, and other transportation control measures included in trip reduction ordinances and/or air quality attainment plans Multi-occupant vehicle systems, such as public transit, ridesharing projects, and park-and-ride facilities Chapter 5 Guiding Principles Page 48
53 Bicycle and pedestrian projects connecting residential, transit, employment, medical, education and other land uses Transportation projects that facilitate higher density or mixed-use development, to the extent desired by local communities Projects which enhance and support the transportation network for all users including resident and tourist transportation system users Projects which align with the SACOG MTP/SCS and reduce greenhouse gases and improve air quality Projects that are shown to reduce congestion without construction of new facilities for single-occupant vehicles PERFORMANCE MEASURES Performance measures are tools that are used to determine existing transportation system conditions and to evaluate the effectiveness of proposed investments by using a qualitative or quantitative measure to evaluate anticipated and/or actual progress toward achieving a specific benchmark or target that corresponds to one of the regional goals. Performance measures must be appropriate to the region, realistic, relevant, and effective. Performance measures do not apply uniformly across urban and rural jurisdictions or across varied geographies. Therefore, the performance measures included in this plan are specific to the region and will provide the necessary tools to effectively measure the transportation network of El Dorado County while also providing the outcome measures necessary for state and federal funding eligibility. However, traditional performance measures such as Level of Service, safety, speed, delay, travel time, and volume to capacity will continue to be included. The process in which performance measures are applied is as follows: 1. Evaluate the condition of the system over time 2. Develop proposed transportation plans, programs, and projects 3. Project anticipated performance of the proposed projects 4. Implement project improvements 5. Measure the realized performance of the delivered project With the onset of performance based planning requirements and a general federal and state shift toward increased performance based planning this RTP aims to integrate more effective performance measures. The measures are laid out in Figure 5-1 below. Chapter 5 Guiding Principles Page 49
54 Env. Stew PERFORMANCE MEASURES Reduced VMT Per Capita Reduction in Freeway/ Hwy VMT Reduction in Congested Arterial VMT Increase in bike and ped miles traveled (Independently Measured) Decrease % of distressed lane miles hwy Decrease in % of distressed lane miles local roads Improved Frwy/hwy travel time reliability: FHWA buffer index (PeMS) Improved Transit travel time reliability Transit accessibility: housing/jobs within 2 miles of stop Decrease mean travel time to work Consistent with SCS Transit mode share (mode share travel to work,non work mode share) Accessibility and connectivity (modal accessibility, travel time to jobs) Improved multi-modal travel opportunities Improved multi-modal travel reliability Improved multi-modal operations and maintenance Reduction in fatalities/injuries (all modes) per capita/vmt Context Sensitive Design Increased pedestrian mode share Increased bicycle mode share Emissions reduction (co2 reduction per capita) Equitable distribution of impacts Equitable distribution of access and mobility Efficient use of system resources Return on investment HIGHWAYS, STREETS, AND REGIONAL/ INTERREGIONAL ROADWAYS PUBLIC TRANSIT AVIATION FREIGHT MOVEMENT NON-MOTORIZED TRANSPORTATION SYSTEMS MANAGEMENT INTEGRATED LAND USE, AIR QUALITY, AND TRANSPORTATION PLANNING FUNDING El Dorado County Regional Transportation Plan Goals, Objectives, Policies, and Performance Measures Congestion Reduction Infastructure Economic Reliability Vitality Location Efficiency Reliable Mobility Goal Support the maintenance of and improvement to an integrated multi-modal transportation system which is safe, efficient, accessible, and convenient for all users throughout, within, and beyond the region. Objective A Provide for a complete roadway transportation network which supports existing and future transportation needs. Objective B Objective C Goal Uphold the existing transportation system at a standard which furthers its life and viability and continues to support the region s current and future transportation needs. Support the maintenance of a safe, sustainable, and reliable transportation system optimizing all travel modes for all users with a focus on cost effectiveness, demand, and prioritization. Promote a convenient, desirable, and reliable regional and interregional public transit system for residents and visitors travelling within, to, and beyond El Dorado County. Objective A Focus transit service provision to the region s diverse characteristics. Objective B Promote a transit system that is responsive to the needs of transit-dependent persons. Objective C Develop and encourage the use of public transit as a primary transportation alternative. Objective D Provide an effective and efficient transit system that best utilizes available resources. Goal Promote and preserve aviation facilities and services that complement the regional transportation system, support emergency response, and enhance economic activities. Objective A Promote the operation, preservation, and maintenance of a regional system of public use general aviation airports. Objective B Implement and maintain Airport Land Use Compatibility Plans (ALUCPs). Objective C Encourage and promote air passenger, specialty freight movement, and other aviation and air transportation services as part of a multi-modal transportation system. Goal Provide for the safe and efficient movement of freight through and within El Dorado County. Objective A Promote a coordinated system of surface and air transportation for the improvement of freight transport. Objective B Mitigate conditions that are dangerous or unacceptable for freight transport. Goal Promote a safe, convenient, and efficient non-motorized transportation system which is part of a balanced overall transportation system for all users. Objective A Objective B Objective C Plan and develop a continuous, safe, and easily accessible pedestrian and bicycle system within the region and connecting to surrounding regions. Support local jurisdictions in providing a pedestrian transportation system that emphasizes the health, safety, travel needs, and wellbeing of people as part of a multi-modal transportation system. Support Local Jurisdictions in providing a bicycle transportation system that emphasizes the health, safety, and wellbeing of people as part of a multi-modal transportation system. Goal Develop and promote plans and programs which support active transportation as a choice to reduce vehicle miles travelled, greenhouse gas emissions, the impacts of single-occupant vehicle travel, and enhance public health. Objective A Support the creation of a multi-modal and multi-jurisdictional transportation network connecting residential areas, educational and recreational facilities, and employment centers. Objective B Support advancement of Transportation Demand Management (TDM) in a thorough, cost-effective manner which reflects the needs of the region. Goal Integrate local and regional land use, air quality, and transportation planning to create a transportation system which supports the needs of the system user, enhances the economy, preserves the environment, reduces greenhouse gases, and protects the community character. Objective A Provide transportation planning support services to local jurisdictions regarding the countywide transportation impacts of local land use decisions. Objective B Support local, tribal, state, and regional jurisdictions to ensure the transportation infrastructure meets existing and future needs. Objective C Support transportation planning and programs which aid in achieving regional air quality standards and greenhouse gas emission reduction targets. Objective D Work with local jurisdictions, Tribal Governments, the Sacramento Area Council of Governments, Caltrans, the California Transportation Commission, and other transportation agencies to develop a regional planning and programming process to ensure that El Dorado County jurisdictions have maximum participation in the transportation and land use decision-making process. Goal Secure maximum available funding and pursue new sources of funds for maintenance, expansion, and improvement of all modes of transportation facilities and services. Objective A Obtain funding for vital multi-modal transportation needs through all sources. Objective B Develop innovative funding for vital transportation needs where conventional funding sources are insufficient. Health and Safety Social Equity Robust Economy
55 Regional Road Network Chapter 6 El Dorado County s transportation system is primarily focused around the roadway network. Most in-county travel is by automobile because low-density development patterns and topography have limited the viability of facilities or services related to transit, bicycles, and pedestrians. However, well planned and coordinated improvements to entire transportation network including roadways can create more practical active transportation and transit access in both rural and more urban areas of the county. According to American Community Survey five-year Estimates, 87 percent of all trips from home to work by County residents were made by automobile. Although automobile travel is the primary function of the roadway network, it also serves a variety of other users including freight haulers, buses, bicyclists, pedestrians, and in some locations, equestrians. This roadway network must be integrated with all modes for all users, including the significant aging population within El Dorado County, and users who are more dependent on active and transit transportation. Commuting, shopping, recreation, and shipping are responsible for most of the travel demand on the regional transportation system. The Lake Tahoe Basin is a popular recreational attraction, as is the Eldorado National Forest, with destinations such as Desolation Wilderness. Other attractions include the South Fork of the American River, Marshall Gold Discovery State Historic Park, Folsom Lake, Jenkinson Reservoir, historic downtown Placerville, wine country, and Apple Hill. Visitors come primarily from population centers to the west of El Dorado County, such as Sacramento and the San Francisco Bay Area. Employment for a large portion of the residents of the western portion of the County is in the greater Sacramento area, for which US 50 serves as the main commute route. To better understand the impacts of tourism and recreation travel on the rural transportation system of El Dorado County and the surrounding region in 2014 EDCTC completed the Bay to Tahoe Basin Recreation and Tourism Travel Impact Study. The study was a project funded by a Caltrans Partnership Planning Grant to examine the relationship of major Northern California urban areas and the rural areas of El Dorado, Placer, Amador, and Nevada counties and the bi-state Lake Tahoe Basin as defined by tourism travel. This study evaluates the impacts of regional and interregional tourism traffic on the rural state highway system in the Study Area, including US Highway 50 (US 50), Interstate 80 (I-80), and SR 20, SR 49, SR 88, SR 89, SR 193, and SR 267. A transportation network functions properly when it successfully supports vital social and economic connections between and within regions. This is particularly true when a region s economy is dependent on travel and tourism. Simply stated, if travelers and tourists cannot easily reach a tourism destination, they are much less likely to go the first time or be a repeat consumer. It is clear that transportation policies and investments significantly impact the accessibility and the number and type of destinations available to tourists, and the overall health of a region s tourism and associated economy. More succinctly stated, the success of a specific tourism market is largely tied to its supporting transportation infrastructure. REGIONAL ROAD NETWORK EXISTING CONDITIONS HIGHWAYS State highways in El Dorado County include freeways and conventional highways which are operated and maintained by the California Department of Transportation (Caltrans). These highways are an integral part of the County s transportation system, serving inter-county and inter-regional traffic. Interstate and US numbered routes are also part of the state highway system, which is maintained by Caltrans. El Dorado County has one US Highway (US 50) and four other State Routes (SR 49, 89, 153, and 193). Map 6-1 shows the State and Federal Highways throughout El Dorado County. Chapter 6 Regional Road Network Page 51
56 US Highway 50 US 50 is a transcontinental route that begins at I-80 in West Sacramento and traverses portions of Yolo, Sacramento, and El Dorado County before crossing into the State of Nevada and beyond. US 50 is designated as a Scenic Highway from its descent into downtown Placerville to the western city limit of South Lake Tahoe. US 50 provides access to many recreation and tourism locations in the Sierra Nevada range and the Lake Tahoe Basin. Peak recreational and commute travel periods are heavily congested, with demand for travel often exceeding the capacity of existing facilities and services. The western half of the highway, from I-80 through Sacramento and Placerville to the canyon of the South Fork American River at Riverton is, at minimum, a four-lane divided highway, mostly built to freeway standards. The remaining portion, passing through the canyon, over the Sierra, crossing Echo Summit (7,377 feet) then descending into the Lake Tahoe Basin is primarily a two-lane road that has passing lanes in both directions at several locations. Once US 50 enters the City of South Lake Tahoe, it becomes a four-lane highway again along the Lake Tahoe s South Shore with numerous access points for public roads and private property, including many businesses, lodging accommodations, community services, and recreation/visitor attractions. US 50 is subject to adverse weather conditions that often result in chain restrictions, snow removal operations, rock, debris, and snow slides, significant travel time delays, and full closures of the highway. Long-term planning for US 50 is addressed in two documents prepared by Caltrans as the lead agency the US Corridor System Management Plan (CSMP) and a TCR. The CSMP addresses the segments of US50 from West Sacramento to the Cedar Grove exit east of Placerville. The TCR addresses segments from the Cedar Grove exit to the Nevada State line at the eastern end of South Lake Tahoe adjacent to Stateline, Nevada. US 50 is part of the Interregional Transportation Strategic Plan and is classified as a High Priority Emphasis Route, one of Caltrans highest priority designations for interregional routes. High Emphasis Routes typically have high priority status for funding and programming of the improvements required for the route to maintain its interregional connectivity between urban centers. US 50 is also the major commute route to employment locations in the greater Sacramento region and the major shipping route for movement of freight by truck in to and out of El Dorado County. It is the primary transportation corridor extending through El Dorado County from west to east and serves all of the County s major population centers, including El Dorado Hills, Cameron Park, Diamond Springs, Shingle Springs, Placerville, Camino, and South Lake Tahoe. US 50 is a two-lane, conventional highway at the east end (Echo Summit), and a seven-lane freeway (including HOV lanes) at the west end. The 2013 peak month Average Daily Traffic (ADT) ranges from 101,000 at the west end of the County at Latrobe Road to 11,200 near Echo Summit to the east ( The peak month ADT is the average daily traffic for the month of heaviest traffic flow. This data is used for many routes, such as US 50, because it is more representative of traffic conditions than the annual ADT. Caltrans 2012 Annual Truck Traffic Study estimates truck traffic on US 50 between 3% and 6.5% of total vehicle volumes ( State Route 49 SR 49 serves north-south traffic throughout the Sierra Nevada foothills. In and near El Dorado County, SR 49 is a two-lane conventional highway that runs from Plymouth in Amador County through El Dorado, Diamond Springs, Placerville, Coloma, Pilot Hill, and Cool to Auburn in Placer County. The portions of SR 49 between Plymouth and Placerville, Placerville and Coloma, and Cool and Auburn contain sections that are narrow, winding, and steep. These narrow segments of SR 49 are without shoulders and provide few passing opportunities, although there are a limited number of turn-outs. The road has many horizontal curves, some with speed advisories as low as 15 mph. Portions of SR 49 are a primary transportation corridor for El Dorado County. Commuters use the roadway in large part to reach US 50 in or near Placerville or Interstate 80 in Placer County, while substantial amounts of recreational traffic use the roadway to reach wineries, river rafting, historical sites, parks, ski resorts, and other locations peak month Average Daily Traffic ranges from 2,800 to 15,600, with the highest volumes in the City of Placerville. ( Caltrans 2012 Annual Truck Traffic Study estimates truck traffic on SR 49 between 3% and 14% of total vehicle volumes ( counts.dot.ca.gov/truck2012final.pdf). Chapter 6 Regional Road Network Page 52
57 State Route 193 SR 193 runs from SR 49 in Placerville north to Georgetown and connects back with SR 49 in the town of Cool. SR 193 is a two-lane highway interconnecting the communities of Cool, Greenwood, Georgetown, Kelsey, and Chili Bar, as well as various local roads to other communities and recreation/ forestry resources, and SR 49 at Placerville near US 50. This highway traverses mainly mountainous terrain and is generally 28-feet except for a wider section near Georgetown and a wider section north of the City of Placerville. The portion near Chili Bar on the South Fork of the American River to the end of the route in Cool contains steep, winding sections which feature particularly poor horizontal sight distances. Logging and agricultural trucks make use of these sections, but trucks with a kingpin-to-rear-axle length of greater than 30 feet are advised against using the portion near the South Fork of the American River peak month Average Daily Traffic ranges from 2,500 to 7,200 near Cool ( r180197i.htm). Caltrans 2012 Annual Truck Traffic Study estimates truck volumes averaging between 4% and 6% on SR 193 ( State Route 89 and State Route 153 The other two state highways in El Dorado County are SR 89 and SR 153. SR 89, a north-south route in the northern Sierra Nevada, runs entirely within the Lake Tahoe Basin portion of El Dorado County, and consequently is under the jurisdiction of the Tahoe Metropolitan Planning Agency peak month ADT for SR 89 ranges from 3,600 at the El Dorado County line to 26,000 at the junction with US 50 near South Lake Tahoe. SR 153 is a one half-mile long road that provides access from SR 49 to the Marshall Monument in Coloma and does not support regional traffic peak month ADT on SR 153 ranges from 170 to 3,900 ( REGIONAL SIGNIFICANCE CRITERIA The El Dorado County Community Development Agency (CDA) maintains a travel demand forecasting model which includes freeways, highways and arterials, both divided and undivided. For the purposes of the travel demand forecasting model, CDA listed roads by the categories shown in Table 6-1. These category listings differ from the road classifications used by the Federal Highway Administration (FHWA), but are utilized to assess existing and future Levels of Service for regional roadways in El Dorado County. TABLE 6-1: El Dorado County Travel Demand Forecasting Roadway Functional Categories* Code Functional Class Codes (Updated to HCM 2010) 2A Two-Lane Arterial 4AU Four-Lane Arterial, Undivided 4AD Four-Lane Arterial, Divided 6AD Six-Lane Arterial, Divided 4M Four-Lane Multi-Highway 2F Two Freeway Lanes (One Dir.) 2FA Two Freeway Lanes + Auxiliary Lane (One Dir.) 3F Three Freeway Lanes (One Dir.) 3FA Three Freeway Lanes + Auxiliary Lane (One Dir.) 4F Four Freeway Lanes (One Dir.) *For Travel Demand Purposes Only Chapter 6 Regional Road Network Page 53


58 MAP 6-1: State and Federal Highways in El Dorado County The City of Placerville General Plan Circulation Plan Diagram identifies major and minor arterials, and collector and local streets. For purposes of this RTP, the City of Placerville s major and minor arterials are included in the regional network. A regional route of significance is defined by FHWA as a facility which serves regional transportation needs (such as access to and from the area outside the region, major activity centers in the region, major planned developments such as new retail malls, sports complexes, etc., or transportation terminals as well as most terminals themselves) and would normally be included in the modeling of a metropolitan area s transportation network, including at a minimum, all principal arterial highways and all fixed guideway transit facilities that offer an alternative to regional highway travel. The federal functional classification serves as an important measure, as federally-funded road projects must be on roads with a federal functional classification of urban collector, or major rural collector or higher. Appendix F incorporates all roadways included in the County model, but divides those roadways by segment as they are classified by FHWA. Based upon these criteria, the regional network consists of the facilities displayed in Map 6-2. REGIONAL ROAD NETWORK NEEDS ASSESSMENT ROADWAY CAPACITY AND MOTOR VEHICLE LEVEL OF SERVICE (LOS) The motor vehicle LOS was calculated for each roadway segment in the regional roadway system to evaluate the quality of existing traffic conditions. Motor vehicle LOS is a general measure of traffic operating conditions whereby a letter grade, from A (the best) free flow traffic to F (the worst) congested traffic is assigned. These grades represent the perspective of drivers and are an indication of the comfort and convenience associated with driving. The motor vehicle LOS grades are generally defined in Table 6-2: Motor Vehicle Level of Service Grades. Existing motor vehicle LOS for the regional roadway network was calculated using traffic count data from the El Dorado County Community Development Agency Transportation Division and Caltrans, and applying those traffic numbers to the County s operational class and peak hour level of service thresholds shown in Table 6-3. The El Dorado County standard for peak hour motor vehicle level of service thresholds is LOS E in Community Regions, as defined in the General Plan, and LOS D everywhere else. Chapter 6 Regional Road Network Page 54
59 TABLE 6-2: Motor Vehicle Level of Service Grades LOS A LOS B LOS C LOS D LOS E LOS F Free-flow operations. Free-flow speed prevails on the freeway, and vehicles are almost completely unimpeded in their ability to maneuver within the traffic stream. The effects of incidents or point breakdowns are easily absorbed. Represents reasonably free-flow operations, and free-flow speed on the freeway is maintained. The ability to maneuver within the traffic stream is only slightly restricted, and the general level of physical and psychological comfort provided to drivers is still high. The effects of minor incidents and point breakdowns are still easily absorbed. Provides for flow with speeds near the free-flow speed of the freeway. Freedom to maneuver within the traffic stream is noticeably restricted, and lane changes require more care and vigilance on the part of the driver. Minor incidents may still be absorbed, but the local deterioration in service quality will be significant. Queues may be expected to form behind any significant blockages. Is the level at which speeds begin to decline with increasing flows, with density increasing more quickly. Freedom to maneuver within the traffic stream is seriously limited and drivers experience reduced physical and psychological comfort levels. Even minor incidents can be expected to create queuing, because the traffic stream has little space to absorb disruptions. Describes operation at capacity. Operations on the freeway at this level are highly volatile because there are virtually no usable gaps within the traffic stream, leaving little room to maneuver within the traffic stream. Any disruption to the traffic stream, such as vehicles entering from a ramp or a vehicle changing lanes, can establish a disruption wave that propagates throughout the upstream traffic flow. At capacity, the traffic stream has no ability to dissipate even the most minor disruption, and any incident can be expected to produce a serious breakdown and substantial queuing. The physical and psychological comfort afforded to drivers is poor. Describes breakdown, or unstable flow. This condition exists wherever the volume of traffic exceeds the capacity of the roadway. Source: Highway Capacity Manual (HCM), Basic Freeway Segments, Transportation Research Board 2010 TABLE 6-3: County Travel Demand Forecasting HCM 2010 Planning Level Volumes 1 Roadway Functional Categories Code Functional Class Codes (Updated to A B C D E HCM 2010) 2A Two-Lane Arterial ,540 1,650 4AU Four-Lane Arterial, Undivided - - 1,760 3,070 3,130 4AD Four-Lane Arterial, Divided - - 1,850 3,220 3,290 6AD Six-Lane Arterial, Divided - - 2,760 4,680 4,710 4M Four-Lane Multi-Highway - 2,240 3,230 4,250 4,970 2F Two Freeway Lanes (One Dir.) - 2,070 2,880 3,590 4,150 2FA Two Freeway Lanes + Auxiliary Lane - 2,610 3,630 4,520 5,230 (One Dir.) 3F Three Freeway Lanes (One Dir.) - 3,100 4,320 5,380 6,230 3FA Three Freeway Lanes + Auxiliary Lane - 3,640 5,070 6,320 7,310 (One Dir.) 4F Four Freeway Lanes (One Dir.) - 4,140 5,760 7,180 8,310 1 Freeway LOS based on HCM 2010, Exhibit 10 8, Urban Area, Rolling Terrain, K factor of 0.09, and D factor of lane highway (and arterial 2 lane) LOS based on HCM 2010, Exhibit 15 30, Class II Rolling,.09 K factor, and D factor of 0.6 Arterial LOS based on HCM 2010, Exhibit 16 14, K factor of 0.09, posted speed 45 mi/h Volumes are for both direc ons unless noted Chapter 6 Regional Road Network Page 55


60 MAP 6-2: Regional Road Network Chapter 6 Regional Road Network Page 56
61 EL DORADO COUNTY GENERAL PLAN MOTOR VEHICLE LOS POLICIES In 1998, El Dorado County voters adopted an initiative known as Measure Y, the Control Traffic Congestion Initiative. The initiative was implemented as Policy TC-Xa in the 2004 El Dorado County General Plan which provided that it would remain in effect for ten years. In November 2008, voters passed an amendment to Measure Y. The initiative added five policies to the 1996 General Plan intended to prevent traffic congestion from worsening in the County. The Measure Y policies were later incorporated into the adopted 2004 General Plan along with alternative policies that would take effect if the Measure Y policies were not readopted by the voters at its ten-year expiration in The 2004 General Plan also included a number of other policies designed to further the goals of the General Plan and the Measure Y policies. With the July 2004 adoption of the El Dorado County General Plan, Goal TC-X was added to include the policies in Measure Y along with other policies related to traffic congestion, as follows: GOAL TC-X: To coordinate planning and implementation of roadway improvements with new development to maintain adequate Levels of Service on County roads. In November 2008, a new Measure Y was approved by the voters revising the previous Measure Y policy. The new policy has a time horizon extending to 2018 and now reads: Policy TC-Xa: The following policies shall remain in effect until December 31, 2018: 1. Traffic from single-family residential subdivision development projects of five or more parcels of land shall not result in, or worsen, Level of Service F (gridlock, stop-and-go) traffic congestion during weekday, peak-hour periods on any highway, road, interchange or intersection in the unincorporated areas of the county. 2. The County shall not add any additional segments of U.S. Highway 50, or any other roads, to the County s list of roads that are allowed to operate at Level of Service F without first getting the voters approval or by a 4/5ths vote of the Board of Supervisors. 3. Developer-paid traffic impact fees combined with any other available funds shall fully pay for building all necessary road capacity improvements to fully offset and mitigate all direct and cumulative traffic impacts from new development upon any highways, arterial roads and their intersections during weekday, peak-hour periods in unincorporated areas of the county. In addition to amending Policy TC-Xa, the subsequent Measure Y policies (General Plan TC-X policies) were amended. The primary effect of those revisions was to clarify the timing of the Capital Improvement Program and the traffic improvement concurrency requirements. TABLE 6-4: Roads in El Dorado County Allowed to Operate at Level of Service F (Through December 31, 2018) Roadway Segment(s) Max. V/C* Cambridge Road Country Club Drive to Oxford Road 1.07 Cameron Park Drive Robin Lane to Coach Lane 1.11 Missouri Flat Road US Highway 50 to Mother Lode Drive 1.12 Mother Lode Drive to China Garden Road 1.20 Pleasant Valley Road El Dorado Road to SR Canal Street to junction of SR 49 (Spring Street) 1.25 Junction of SR 49 (Spring Street) to Coloma Street 1.59 US Highway 50 Coloma Street to Bedford Avenue 1.61 Bedford Avenue to beginning of Freeway 1.73 Beginning of Freeway to Washington Overhead 1.16 Ice House Road to Echo Lake 1.16 Pacific/Sacramento Street to four-lane section 1.31 SR 49 US Highway 50 to SR SR 193 to County Line 1.51 Source: Table TC-2, 2004 El Dorado County General Plan * Maximum Volume to Capacity (Max. V/C) is the ratio of demand flow rates to capacity for a given transportation facility. Chapter 6 Regional Road Network Page 57

62 REGIONAL ROAD NETWORK ACTION PLAN The Action Element of the RTP consists of short-term and long-term projects and activities that address regional transportation issues and needs. The federal conformity regulations (Title 40 CFR , Content of Transportation Plans) identify the short-term horizon as a period up to 10 years in the future and the long-term horizon as projects or activities 20 years and beyond. The Action Element implements the Policy Element, must be consistent with the financial constraints identified in the Financial Element, and must conform with the air quality State Implementation Plan. The following tables list the short-term and longterm regional road network projects. For those projects which have an estimated completion date, the year of expenditure dollar is provided. The year of expenditure dollar is adjusted based on inflation factors provided by SACOG. The Regional Road Network Action Plan implements the first GOAL: HIGHWAYS, STREETS, AND REGIONAL/INTER-REGIONAL ROADWAYS of the Policy Element of this RTP, which pertains to highways, streets, and regional roadways: Support the maintenance of and improvement to an integrated multi-modal transportation system which is safe, efficient, accessible, and convenient for all users throughout, within, and beyond the region. TABLE 6-5: El Dorado County Regional Road Network Short-Term Action Plan ( ) Project Description Alder Drive at EID Canal Bridge Replacement Bassi Road at Granite Creek Bridge Replacement Blair Road at EID Canal Bridge Replacement Bucks Bar Road at the North Fork Cosumnes River Bridge Replacement Clear Creek Road at Clear Creek (PM 0.25) Bridge Replacement Clear Creek Road at Clear Creek (PM 1.82) Bridge Replacement Cold Springs Road Realignment Cosumnes Mine Road at North Fork Cosumnes River Bridge Maintenance Completion Year Cost Estimate Year of Expenditure Dollars Cost Estimate 2015 Dollars Lead/Support Agencies 2017 $1,134,200 $1,070,000 El Dorado County HBP 2018 $4,407,480 $4,081,000 El Dorado County HBP Funding Programs 2017 $1,550,780 $1,463,000 El Dorado County HBP, RSTP 2019 $7,009,200 $6,372,000 El Dorado County, Caltrans,, EDCTC 2024 $5,639,858 $4,585,250 El Dorado County HBP 2024 $5,639,833 $4,585,230 El Dorado County HBP HBP, RSTP 2016 $176,800 $170,000 El Dorado County, Caltrans HSIP, RSTP 2015 $143,000 $143,000 El Dorado County HBP, Road Fund/ Discretionary Chapter 6 Regional Road Network Page 58

63 TABLE 6-5: El Dorado County Regional Road Network Short-Term Action Plan ( ) Project Description Country Club Drive Extension - Silver Dove Road to Bass Lake Road Diamond Springs Parkway - Phase 1A - State Route-49 Realignment Diamond Springs Parkway - Phase 1B El Dorado County Road Rehabilitation to elevate the Entire County Maintained Road Network to PCI of 70 or Above El Dorado Hills Boulevard Widening - Lassen Lane to Park Drive Francisco Drive Right-Turn Pocket Completion Year Cost Estimate Year of Expenditure Dollars Cost Estimate 2015 Dollars Lead/Support Agencies 2025 $1,423,670 $1,121,000 El Dorado County TIM Funding Programs 2016 $10,223,200 $9,830,000 El Dorado County TIM, Local, MC&FP, Utility Agencies 2024 $39,866,760 $32,412,000 El Dorado County TIM, CMAQ, Local, MC&FP, Utility Agencies $285,000,000 $285,000,000 El Dorado County, EDCTC 2025 $1,391,920 $1,096,000 El Dorado County TIM 2015 $1,013,000 $1,013,000 El Dorado County, Caltrans, EDCTC Gold Hill Overlay 2015 $750,000 $750,000 El Dorado County Local Green Valley Road at Indian Creek Bridge Replacement Green Valley Road at Mound Springs Creek Bridge Replacement Green Valley Road at Tennessee Creek Bridge Replacement Green Valley Road at Weber Creek Bridge Replacement 2024 $5,535,000 $4,500,000 El Dorado County, Caltrans, EDCTC 2024 $5,539,920 $4,504,000 El Dorado County, Caltrans 2019 $45,100 $41,000 El Dorado County, Caltrans, EDCTC, EID 2020 $11,576,320 $10,336,000 El Dorado County, Caltrans, EDCTC RSTP, Local Funds CMAQ, RSTP, TEA HBP, RSTP HBP, RSTP TIM, HBP, HSIP, RSTP, TCSP, EID TIM, HBP, RSTP Green Valley Road Traffic Signal Interconnect Green Valley Road Widening from Salmon Falls Road to Deer Valley Road Green Valley Road/Deer Valley Road West Intersection Improvements Greenstone Road at Slate Creek Bridge Replacement Hanks Exchange at Squaw Hollow Creek Bridge Replacement 2015 $287,000 $287,000 El Dorado County, Caltrans 2025 $15,974,060 $12,578,000 El Dorado County TIM HSIP, RSTP 2015 $1,209,000 $1,209,000 El Dorado County TIM, Developer Funded, Road Fund/ Discretionary 2018 $3,788,640 $3,508,000 El Dorado County HBP 2018 $4,230,630 $3,917,250 El Dorado County HBP Chapter 6 Regional Road Network Page 59
64 TABLE 6-5: El Dorado County Regional Road Network Short-Term Action Plan ( ) Project Description Happy Valley Cutoff Road at Camp Creek Bridge Maintenance Project Hazel Valley Road at EID 2018 $2,495,880 $2,311,000 El Dorado County HBP Canal Bridge Replacement Hollow Oak Road Drainage 2015 $977,000 $977,000 El Dorado County Bass Lake Hills Specific Plan, RSTP Ice House Road at Jones Fork Silver Creek Bridge Maintenance Project 2016 $791,440 $761,000 El Dorado County HBP, SMUD (UARP) Ice House Road Rehabilitation 2016 $5,011,760 $4,819,000 El Dorado County FLAP, SMUD (UARP) Latrobe Road Widening - White Rock Road to Carson Creek (Suncast Lane) 2025 $11,413,490 $8,987,000 El Dorado County TIM Metal Beam Guardrail Installation - Various Locations Mosquito Road Bridge at South Fork American River Replacement Mount Murphy Road at South Fork American River Bridge Replacement Mt. Aukum Road at North Fork Cosumnes River Bridge Maintenance Newtown Road at South Fork of Weber Creek Bridge Replacement Oak Hill Road at Squaw Hollow Creek Bridge Replacement Pleasant Valley Road at Oak Hill Road Improvements Ray Lawyer Drive Extension to new El Dorado County Courthouse Salmon Falls Road South of Glenesk Lane Realignment Saratoga Way Extension Phase 1 Completion Year Cost Estimate Year of Expenditure Dollars Cost Estimate 2015 Dollars Lead/Support Agencies 2015 $200,000 $200,000 El Dorado County HBP, Road Discretionary Fund 2025 $853,440 $672,000 El Dorado County RSTP, FHWA HSIP 2024 $37,618,320 $30,584,000 El Dorado County HBP, Road Fund/ Discretionary 2018 $22,182,120 $20,539,000 El Dorado County HBP, Road Fund Discretionary 2015 $498,000 $498,000 EDCTC, El Dorado County HBP, RSTP 2024 $5,565,750 $4,525,000 El Dorado County, Caltrans 2018 $4,277,070 $3,960,250 El Dorado County HBP 2015 $1,238,000 $1,238,000 El Dorado County, Caltrans, EDCTC HBP, RSTP HSIP, RSTP, TIM 2017 $3,710,000 $3,500,000 El Dorado County Local Funds 2015 $1,472,000 $1,472,000 El Dorado County, Caltrans 2025 $14,657,070 $11,541,000 El Dorado County TIM Funding Programs HSIP, RSTP Chapter 6 Regional Road Network Page 60
65 TABLE 6-5: El Dorado County Regional Road Network Short-Term Action Plan ( ) Project Description Silva Valley Interchange Traffic Mitigation Silver Fork Road at South Fork American River - Bridge Rehabilitation Silver Springs Parkway to Bass Lake Road (South Segment) Sly Park Road at Clear Creek Crossing Bridge Replacement State Route 49 and US 50 Various Locations - Apply high friction surface treatment State Route 49 from Coloma to Cool - Pavement rehabilitation (PM 23.9/35.0) Completion Year Cost Estimate Year of Expenditure Dollars Cost Estimate 2015 Dollars Lead/Support Agencies Funding Programs 2015 $50,000 $50,000 El Dorado County Anticipated Urban RSTP, CMAQ (Currently Road Fund) 2017 $2,487,820 $2,347,000 El Dorado County HBP, Utility Agencies 2018 $9,258,840 $8,573,000 El Dorado County TIM, Developer Funded, Road Fund/ Discretionary 2016 $5,978,960 $5,749,000 El Dorado County TIM, HBP, RSTP 2016 $1,097,200 $1,055,000 Caltrans Toll Credits 2016 $8,249,280 $7,932,000 Caltrans Toll Credits State Route 49 South Fork American River Bridge Retrofit/Enhancement 2019 $21,595,200 $19,632,000 Caltrans, El Dorado County SHOPP, Local Traffic Signal and Intersection Operational Improvements U.S. 50 /Missouri Flat Road Interchange Improvements Phase 1B2: Bike and Pedestrian Improvements $26,307,500 $26,307,500 El Dorado County TIM 2016 $1,505,000 $1,505,000 El Dorado County MC&FP, CMAQ, LOCAL U.S. 50/El Dorado Hills Boulevard Interchange Improvements - Phase 2B U.S. 50/El Dorado Road Interchange Improvements Phase 1 U.S. 50/Missouri Flat Road Interchange Improvements Phase 1C Riparian Restoration US 50 Camino Corridor Safety Improvements 2025 $8,768,080 $6,904,000 El Dorado County, Caltrans 2025 $3,672,840 $2,892,000 El Dorado County, Caltrans, EDCTC 2018 $1,909,440 $1,768,000 El Dorado County, Caltrans 2021 $38,337,060 $33,629,000 El Dorado County, Caltrans, EDCTC TIM TIM, RSTP MC&FP SHOPP, Local Fund Chapter 6 Regional Road Network Page 61
66 TABLE 6-5: El Dorado County Regional Road Network Short-Term Action Plan ( ) Project Description US 50 Drainage Improvements in Placerville at 0.5 mile west of junction with State Route 49 - Install slotted drain and drainage inlets in median Completion Year Cost Estimate Year of Expenditure Dollars Cost Estimate 2015 Dollars Lead/ Support Agencies Funding Programs 2015 $950,000 $950,000 Caltrans SHOPP, Toll Credits US 50/Silva Valley Parkway Interchange Phase 1 Wentworth Springs Road at Gerle Creek Bridge Replacement 2018 $61,536,240 $56,978,000 El Dorado County, Caltrans, EDCTC 2016 $1,527,760 $1,469,000 El Dorado County Silva Valley Interchange Set Aside, Developer Advance, Road Fund/ Discretionary, SLPP, Utility Agencies HBP, OHV Grant, Road Fund/ Discretionary, RSTP, SMUD (UARP) White Rock Road Widening Monte Verde Drive to US 50/Silva Valley Parkway Interchange 2025 $24,216,197 $19,067,872 El Dorado County, Caltrans TIM Total $743,964,128 $687,964,352 *The Pavement Condition Index (PCI) is a numerical index between 0 and 100 which is used to indicate the general condition of a pavement. Source: El Dorado County CIP 2014 Chapter 6 Regional Road Network Page 62
67 TABLE 6-5: City of Placerville Road Network Short-Term Action Plan ( ) Project Description Cost Estimate Responsible Agency Funding Programs Blairs Lane over Hangtown Creek Replace 1 lane bridge with two lane bridge Broadway Crosswalk Improvements Carson Road to Schnell School $3,175,202 City of Placerville, EDCTC $251,000 Caltrans, City of Placerville, EDCTC City of Placerville ADA Transition Plan $50,000 City of Placerville, EDCTC City of Placerville Road Rehabilitation to elevate the Entire City Maintained Road Network to PCI of 70 or Above $33,600,000 City of Placerville, EDCTC RSTP, TIM, HSIP, STIP, Local Funds, HBP, CMAQ, City of Placerville TIM Fee Program RSTP, TIM, HSIP, STIP, Local Funds, HBP, CMAQ Local Funds RSTP, TIM, HSIP, STIP, Local Funds, HBP, CMAQ, City of Placerville TIM Fee Program Lower Main Street Road Closure Gates $31,000 City of Placerville, EDCTC Main Street/Cedar Ravine/Clay Street Intersection Project Mosquito Rd./ Clay St. Park & Bus Phase II - Construct an additional 50-car parking lot with lighting landscaping, install public restrooms, and install the El Dorado Trail facility Placerville ADA Curb Ramps In Placerville, at the intersection of Spring Street and US 50, and at the intersection of Spring Street and Coloma Placerville Drive Widening - Cold Springs Road to US 50 Placerville Drive Widening - Ray Lawyer Drive to Cold Springs Road Placerville Drive Widening - Fair Lane to Ray Lawyer Drive $3,372,877 City of Placerville, EDCTC $1,440,000 City of Placerville, EDCTC $1,938,000 Caltrans Toll Credits $6,515,000 City of Placerville, EDCTC $10,352,000 City of Placerville, EDCTC $3,169,000 City of Placerville, EDCTC RSTP, TIM, HSIP, STIP, Local Funds, HBP, CMAQ, City of Placerville TIM Fee Program RSTP, TIM, HSIP, STIP, Local Funds, HBP, CMAQ, City of Placerville TIM Fee Program RSTP, TIM, HSIP, STIP, Local Funds, HBP, CMAQ, City of Placerville TIM Fee Program RSTP, TIM, HSIP, STIP, Local Funds, HBP, CMAQ, City of Placerville TIM Fee Program RSTP, TIM, HSIP, STIP, Local Funds, HBP, CMAQ, City of Placerville TIM Fee Program TIM Schnell School Road Traffic Signal $550,000 City of Placerville, EDCTC Speed Bump Replacement Estey Way, Canal Street, Clay Street, and County Courthouse Alley US 50 Broadway Eastbound Exit (#47) Signalization and Ramp Extension $13,000 Caltrans, City of Placerville, EDCTC $2,000,000 City of Placerville, EDCTC RSTP, TIM, HSIP, STIP, Local Funds, HBP, CMAQ, City of Placerville TIM Fee Program City of Placerville TIM Fee Program RSTP, TIM, HSIP, STIP, Local Funds, HBP, CMAQ, City of Placerville TIM Fee Program Chapter 6 Regional Road Network Page 63
68 TABLE 6-5: City of Placerville Road Network Short-Term Action Plan ( ) Project Description US 50 Eastbound Off Ramp to Ray Lawyer Drive, Park-and-Ride Lot, and associated bike/pedestrian and roadway improvements for access to Ray Lawyer Drive Extension Western Placerville Interchanges Phase 2: US 50 Eastbound Off Ramp to Ray Lawyer Drive, Park-and-Ride Lot, and associated bike/pedestrian and roadway improvements for access to Ray Lawyer Drive Extension On US 50 near Placerville, from 0.8 mile east of Bridal Veil Falls Road to Strawberry Lodge Drive - Construct traction sand traps Cost Responsible Estimate Agency $8,940,000 City of Placerville, EDCTC $8,940,000 Caltrans, City of Placerville, EDCTC $6,205,000 Caltrans, City of Placerville, EDCTC Funding Programs RSTP, TIM, HSIP, STIP, Local Funds, HBP, CMAQ, City of Placerville TIM Fee Program RSTP, TIM, HSIP, STIP, Local Funds, HBP, CMAQ Toll Credits In El Dorado County, in and near Placerville, on US 50 and SR 193 at various locations In El Dorado County, near Placerville, from the Amador County line to Pleasant Valley Road - Bonded wearing course overlay $3,772,000 Caltrans Toll Credits $3,198,000 Caltrans Toll Credits Total $97,512,079 *The Pavement Condition Index (PCI) is a numerical index between 0 and 100 which is used to indicate the general condition of a pavement. Source: City of Placerville TIM fee program 2008 **Delivery years for City of Placerville projects are not determined and therefore 2015 cost estimates are used. Chapter 6 Regional Road Network Page 64
69 TABLE 6-6: El Dorado County/City of Placerville Regional Road Network Long-Term Action Plan (2026 to 2035) Project Description Cost Lead/Support Funding Programs Estimate** Agencies Bass Lake Road Frontage $1,501,000 El Dorado, Caltrans, TIM, Developer Funded Improvements - Silver Springs EDCTC Bass Lake Road Full $7,445,000 El Dorado County, Bass Lake Hills PFFP, Developer Improvements - Phase 1A Bass Lake Road Widening - U.S. 50 to Silver Springs Parkway, Phase 1B EDCTC Advance-EDH TIM, RSTP $15,385,000 El Dorado County TIM Bush Court/Roddan Court $705,482 City of Placerville, EDCTC Broadway Traffic Signals/ Mosquito Road and Blairs Lane Cameron Park Drive Widening Durock Road to Coach Lane Cameron Park Drive Widening Palmer Drive to Meder Road Cameron Park Drive/Green $6,980,000 El Dorado County, Valley Road Intersection EDCTC Improvements City of Placerville Road Rehabilitation $34,608,000 City of Placerville, to elevate the Entire City EDCTC Maintained Road Network to PCI* of 70 or Above Coleman Street Extension $1,762,000 City of Placerville, Bedford Avenue to Spring Street EDCTC Combellack Road Extension $3,466,000 City of Placerville, EDCTC Country Club Drive Ext. - West Bass Lake Hills SP Boundary to Silver Dove Rd Country Club Drive Realignment - Bass Lake Road to east Bass Lake Hills Specific Plan Boundary Durock Road Widening - Robin Lane to S. Shingle Road El Dorado County Road Rehabilitation to maintain the Entire County Maintained Road Network to PCI* of 70 or Above El Dorado Hills Boulevard / Francisco Drive Intersection Alignment El Dorado Hills Boulevard Widening - Lassen Lane to Park Drive Gateway Drive/Broadway Roundabout Green Valley Road Widening Deer Valley Road East to Lotus Road Green Valley Road Widening Francisco to Salmon Falls Road $1,032,650 Caltrans, City of Placerville, EDCTC $7,338,000 El Dorado County TIM $12,520,000 El Dorado County TIM RSTP, TIM, HSIP, STIP, Local Funds, HBP, CMAQ, City of Placerville TIM Fee Program TIM TIM, RSTP RSTP, Local Funds TIM $5,413,000 El Dorado County TIM $5,043,000 El Dorado County TIM RSTP, TIM, HSIP, STIP, Local Funds, HBP, CMAQ, City of Placerville TIM Fee Program $7,210,000 El Dorado County RSTP, Local Funds $293,550,000 El Dorado County, EDCTC TIM $9,452,000 El Dorado County TIM $1,096,000 El Dorado County TIM $1,286,000 Caltrans, EDCTC TIM $4,784,000 El Dorado County TIM $1,898,000 El Dorado County TIM Chapter 6 Regional Road Network Page 65
70 TABLE 6-6: El Dorado County/City of Placerville Regional Road Network Long-Term Action Plan (2026 to 2035) Project Description Headington Road Extension Missouri Flat Road to El Dorado Road Intelligent Transportation System Improvements Cost Estimate** Lead/Support Agencies Funding Programs $10,417,000 El Dorado County Anticipated Grant, EDCTC, Road Fund/Discretionary $5,833,000 EDCTC, El Dorado County TIM, Road Fund/Discretionary, Miscellaneous Reimbursement Latrobe Connection $19,445,000 El Dorado County TIM, EDH Business Park Assessment District Latrobe Road Widening - Golden $3,308,000 El Dorado County TIM Foothill Parkway South to Investment Blvd Missouri Flat Rd Two-Way Left Turn $1,202,000 El Dorado County Developer Funded Lane El Dorado Rd to Headington Rd Missouri Flat Road Widening, Headington Road to Prospector's Plaza $1,299,000 El Dorado County TIM Mother Lode Drive/Pleasant Valley Road Intersection Improvements Pleasant Valley Road Widening - Pearl Place to Big Cut Road in Diamond Springs Pleasant Valley Road Widening from Big Cut Road to Cedar Ravine Road Pleasant Valley Road Widening from El Dorado Road to State Route 49 Ponderosa Road Widening from North Shingle Road to Meder Road Runnymeade Drive Realignment at El Dorado Road $7,782,420 El Dorado County RSTP, TIM, HSIP, STIP, Local Funds, HBP, CMAQ, City of Placerville TIM Fee Program $2,710,000 El Dorado County TIM $2,291,000 El Dorado County TIM $1,099,000 El Dorado County TIM $2,798,000 El Dorado County TIM $1,902,000 El Dorado County TIM Saratoga Way Extension - Phase 2 $4,638,000 El Dorado County TIM Silva Valley Parkway/Golden Eagle Lane Intersection Signalization State Route 49 Passing Lanes from SR193 (in Cool) to the northern County Line State Route 49 Widening from Pleasant Valley Road to Missouri Flat Road Traffic Signal and Intersection Operational Improvements $768,000 El Dorado County TIM $3,482,000 El Dorado County TIM $7,879,000 El Dorado County TIM $26,307,500 El Dorado County TIM Chapter 6 Regional Road Network Page 66
71 TABLE 6-6: El Dorado County/City of Placerville Regional Road Network Long-Term Action Plan (2026 to 2035) Project Description Cost Estimate** Lead/Support Agencies Funding Programs Transit Service Improvements $10,500,000 El Dorado County TIM U.S. 50 Auxiliary Lane Eastbound - Cambridge to Ponderosa U.S. 50 Auxiliary Lane Westbound - El Dorado Hills Boulevard to Empire Ranch Road $10,350,000 El Dorado County, Caltrans $2,809,337 El Dorado County, Caltrans TIM Local U.S. 50 HOV Lanes (Phase 3) - Ponderosa Road to Greenstone Road $615,000 El Dorado County, Caltrans, EDCTC U.S. 50 Mainline Widening at El Dorado Hills $2,161,000 El Dorado County, Caltrans, EDCTC U.S. 50/Bass Lake Road Interchange $16,532,000 El Dorado County, Improvements - Phase 1 Caltrans U.S. 50/Bass Lake Road Interchange $19,063,000 El Dorado County, Improvements - Phase 2 Caltrans U.S. 50/Camino Area Parallel Capacity/Safety $2,000,000 El Dorado County, Study Caltrans, EDCTC U.S. 50/El Dorado Road Interchange Phase 2 $5,870,000 El Dorado County, Caltrans U.S. 50/Silva Valley Parkway Interchange - $12,070,000 El Dorado County, Phase 2 On Ramps and Auxiliary Lanes on Caltrans, EDCTC U.S. 50 US 50/Ponderosa Road - North Shingle Road $5,020,000 El Dorado County, Realignment Caltrans US 50/Ponderosa Road South Shingle Road Interchange Improvements US 50/Ponderosa Road Interchange - Durock Road Realignment White Rock Road Widening - Latrobe Road to US50/Silva Valley Parkway Interchange White Rock Road Widening Manchester Drive to Sacramento County Line $16,359,000 El Dorado County, Caltrans TIM TIM, Developer Advance TIM TIM, RSTP TIM Silva Valley Interchange Set Aside TIM TIM TIM $7,152,000 El Dorado County, Caltrans TIM $6,058,000 El Dorado County, TIM Caltrans $3,317,000 El Dorado County TIM Wiltse Road Improvements $380,000 City of Placerville, EDCTC Total $649,785,389 RSTP, TIM, HSIP, STIP, Local Funds, HBP, CMAQ, City of Placerville TIM Fee Program *The Pavement Condition Index (PCI) is a numerical index between 0 and 100 which is used to indicate the general condition of a pavement. **Delivery years for long-term projects ( ) are not determined and therefore 2015 cost estimates are used. Source: El Dorado County CIP 2014 Source: City of Placerville TIM fee program 2008 Specific El Dorado County project descriptions are developed through County s Capital Improvement (CIP) process and are available here: These projects are updated in the CIP annually to reflect changes in the scope, schedule and budget. Projects under the jurisdiction of the City of Placerville s Capital Improvement Program are located here: EDCTC monitors projects underway or which have EDCTC programmed funding associated with them. These projects are included in the EDCTC Project Monitoring Report located here: Chapter 6 Regional Road Network Page 67
72 Transit Chapter 7 EL DORADO COUNTY TRANSIT AUTHORITY Transit services in western El Dorado County are provided through a joint powers agreement between the El Dorado County Transit Authority (El Dorado Transit), County of El Dorado, and City of Placerville. The El Dorado Transit is governed by a five-member Board of Directors, with three members appointed by the County Board of Supervisors and two members appointed by the Placerville City Council. Additionally, a Transit Advisory Committee is made up of nine members, representing both private and public interests. The Transit Advisory Committee has the responsibility for reviewing the operation of the transit system, monitoring levels of transit service in relation to funding constraints, and providing advice and recommendations to the Executive Director. Public Transportation in the El Dorado County portion of the Tahoe Basin is coordinated by BlueGO. BlueGO is a service of the South Tahoe Area Transit Authority with administrative support provided by the Tahoe Regional Planning Agency. BlueGO is a non-profit community based corporation in Nevada charged with operating public transit services in the Tahoe Basin of El Dorado and Douglas Counties, and is not under the jurisdiction of the El Dorado County Transportation Commission or El Dorado Transit. El Dorado Transit operates a wide range of services including local fixed routes, demand response, intercity commuter service, and contracted social service transportation. The following describes each of the existing services in detail. TRANSIT EXISTING CONDITIONS LOCAL FIXED ROUTE SERVICES Fixed route service is characterized by transit vehicles, usually larger buses, which travel a specified route and stop at fixed locations (i.e. bus stops) on a fixed schedule. Riders utilize this service by simply traveling to a bus stop at the appointed time. No pre-arrangement or reservation is necessary. El Dorado Transit operates fixed route transit service in Placerville, Pollock Pines, Diamond Springs and Cameron Park. Furthermore, all fixed route buses offer bike racks located on the front of the buses which enhances the utility and reach of the service to more modes. 50 Express The 50 Express provides hourly service between Placerville and the City of Folsom. This limited weekday stop route serves park and ride locations in El Dorado County; Folsom Lake College (El Dorado and Folsom); Cameron Park and the Tribal Health Clinic in El Dorado County Mondays through Fridays from 5:53 AM to 6:52 PM. Placerville Fixed Routes El Dorado Transit operates an East Route and a West Route along the US 50 Corridor in the City of Placerville. These routes provide fixed-route service mainly along the US 50 Corridor between the Missouri Flat Transfer Center and Point View Drive on the eastern side of Placerville. The East and West Routes are essentially directional trips of the same loop, although the routes do serve different stops between Spring Street and Point View Drive. Service is provided Monday through Friday on one hour headways from 7:00 AM to 6:43 PM. Some notable stops along the Placerville routes are: Human Services, El Dorado County Fairgrounds Park-and-Ride, Mother Lode Rehabilitation Enterprises, Inc. workshop, Marshall Hospital, Rite Aid, and Home Depot. Both east and west Placerville Routes have two (2) Transfer options for the 50 Express. Chapter 7 Transit Page 68
73 Pollock Pines Fixed Route The Pollock Pines route operates an East and a West route along the US 50 Corridor between the Missouri Flat Transfer Center in Diamond Springs, the Camino area, and the Safeway Plaza on Pony Express Trail in Pollock Pines. Service is provided Monday through Friday between 6:30 AM and 6:25 PM. Both east and west routes have Transfer Points: Placerville Station Transfer Center and Missouri Flat Road Transit Center. Some notable stops on the Pollock Pines route are: Regal Theaters, the Upper Room, Pollock Pines Post Office, and Safeway Plaza (Pony Express Trail). Diamond Springs Fixed Route The Diamond Springs Route begins at the Missouri Flat Transfer Center and follows a clockwise loop around Diamond Springs on Pleasant Valley Road, back to the Missouri Flat Transfer Center, then across highway 50 serving Folsom College, Safeway, and Prospector Plaza. The Diamond Springs Route takes about one hour to operate. Service for this route is provided hourly from 7:00 AM to 6:46 PM on Monday through Friday. The Diamond Springs Route includes three Transfer Point options at the Missouri Flat Road Transit Center. Cameron Park Fixed Route Cameron Park operates with Cameron Park Monday through Friday from 6:30 AM to 6:30 PM. Service is provided hourly within Cameron Park with four Transfer point options connecting with the 50 Express. Saturday Express Fixed Route This route operates between the Missouri Flat Transfer Center in Diamond Springs and the Safeway Plaza on Pony Express Trail in Pollock Pines. An eastbound bus leaves from the Missouri Flat Transit Center at 9:00 AM, and a westbound bus leaves from Safeway Plaza on Pony Express Trail at 9:00 AM, and both buses operate on hourly headways from 9:00 AM to 5:00 PM. ADA Complementary Paratransit for Local Routes Complementary Paratransit refers to door-to-door, on-demand service ( paratransit ) which complements a fixed route by ensuring that persons with disabilities in the vicinity of the route have access to public transit services under the requirements of the Americans with Disabilities Act. El Dorado Transit s complementary paratransit service is compliant with the transportation requirements of the ADA and is only available to persons who are unable to use the local fixed routes. El Dorado Transit complementary paratransit provides curb-to-curb transit service during the same hours and days as the Local Fixed Routes. Passengers may reserve a ride up to three days in an advance. As is typical for paratransit services, this service has a normal productivity, an average of 2.0 passengers per hour. Grizzly Flat Demand Response Route The Grizzly Flat Route provides two round-trips on Thursdays between Prospector Plaza on Missouri Flat Road and the Grizzly Flat area southeast of Placerville. The bus is only operated when there are a minimum of five passenger requests for service. Eastbound runs depart at 7:50 AM and 3:00 PM, and westbound runs depart at 8:26 AM and 3:36 PM. The afternoon westbound run from Grizzly Flat to Placerville is by request only. Route deviations are provided for ADA passengers up to three-quarters of one mile from the designated route. ADA route deviation requests can be scheduled the previous service day, though same day requests are accommodated when possible. El Dorado Transit service route maps and services are available in an online interactive map located on the EDCTA website located here: A summary the El Dorado Transit Fare Structure is provide in the Table Below: Chapter 7 Transit Page 69


74 TABLE 7-1: El Dorado Transit Authority Fare Structure Chapter 7 Transit Page 70


75 Chapter 7 Transit Page 71
76 TABLE 7-2: Transit Short-Term Action Plan ( ) Goal Description Annual Cost El Dorado Hills Taxi Voucher Subsidy Program Implement Community Express Route Plan with 2 Hour Headway on US 50 Express El Dorado Hills Wednesday Activity Bus Extend Placerville, Pollock Pines and Diamond Springs Service by one hour Start Diamond Springs and Placerville Routes one hour earlier Expand Saturday Express Service in Peak Direction Provide Diamond Springs Service on Saturdays Advanced Public Transit System Technologies Establish a taxi voucher program for residents of El Dorado Hills. The taxi voucher program will utilize private transportation providers by providing subsidies to eligible citizens to purchase discounted taxi services. Reconfigure the Cameron Park Route to an hourly community shuttle. Convert the Iron Point Connector into the US 50 Express Route, using a single bus to provide consistent service every two hours between Placerville and Folsom. Reconfigure the Cameron Park Route to an hourly community shuttle. Implement a one-day-a-week Activity Bus, on a demonstration basis. El Dorado Hills residents could reserve trips no more than 14 and no less than 2 days in advance. If less than five one-way trip requests are received by 5 PM on Monday, the service would not be operated. In addition, trips would be accommodated on an on-call and as-available basis on the day of service. One additional hour of service should be added on weekdays on the Placerville, Pollock Pines and Diamond Springs Routes. Modify the schedules for the Diamond Springs and Placerville Routes to begin service at 6:00 AM, rather than 7:00 AM. $1,204,460 $223,553 $367,420 $1,240,600 $729,250 Expand the Saturday Express service by adding eastbound $191,800 runs from the Missouri Flat Transit Center at 12:00 Noon and 4:00 PM, and adding westbound runs from Pollock Pines at 8:00 AM and 12:00 Noon. This will provide a consistent operating plan throughout the day, and expand the hours of service available to transit passengers throughout the corridor between Missouri Flat and Pollock Pines. Operate Diamond Springs Service on Saturday 9 AM to $360,920 As needed to address capacity constraints, up to six additional vehicle-hours of service should be added per weekday (a 10% increase over existing levels). $55,790 Innovations in fare, data collection, and communications technologies that should be implemented consist of the following: Full implementation of the Connect Card Universal Fare Card for Sacramento Region Improvements to Mobile Data Terminals and installation in the vehicles. Real-time traveler information system that can provide access to vehicle location information and trip planning software via the internet, including smartphones and video displays in transit centers. Automated next-stop announcements and reader boards on transit vehicles. Transit Annual Operations Maintaining transit services including local fixed route, deviated $70,912,580 fixed route, Dial-a-Ride, and commuter service Transit Capital Plan Vehicle Replacement needs $24,461,200 TOTAL (Over 10 Years) $100,124,153 Source: 2014 Western El Dorado County Short- and Long-Range Transit Plan *Includes 2% annual rate of inflation Chapter 7 Transit Page 72
77 TABLE 7-3: Transit Long-Term Action Plan ( ) Goal Description Annual Cost Coordination with schools and transit service Coordination with neighboring transit agencies Other Potential Future Service Improvements Include design review to provide children with transportation alternatives Ensure connections to neighboring transit agencies are as efficient and convenient as possible. Skier service to Sierra-At-Tahoe Ski Area or service to South Lake Tahoe. Implementation of these additional improvements will be dependent upon obtaining additional financial resources. NA NA NA Regional Fueling Station Transit Annual Operations Develop a regional fueling station near the Sacramento/El Dorado County Line. Projected annual operating costs to maintain transit services including local fixed route, deviated fixed route, Dial-a-Ride, and commuter service. $7,477,900* TOTAL (Over Ten Years) $95,089,000 Source: 2014 Western El Dorado County Short- and Long-Range Transit Plan *Includes 2% annual rate of inflation $20,310,000 Chapter 7 Transit Page 73


78 Aviation Chapter 8 Local airports play an important role in the safety, efficiency, and sustainability of communities. Airports improve the quality of life and enhance mobility by connecting communities with business services, emergency response, fire suppression, law enforcement, tourism, and travel. Airports are a critical element of the regional transportation network and must be maintained as development pressures grow and communities expand. Aviation facilities in El Dorado County include both public and private airports and helipads serving commercial, recreational, medical, military, fire, and search and rescue needs. There are three public use airports on the west slope in El Dorado County: the Cameron Park Airpark, Georgetown Airport, and the Placerville Airport. There are also several private use airports and helipads in the County. There are no commercial or military airports on the west slope of El Dorado County. Map 8-1 displays the location of the public use airports in on the west slope of El Dorado County. The California Department of Transportation, Division of Aeronautics classifies the Cameron Park and Georgetown airports as Community General Aviation (GA) Airports. Community GA airports provide access to other regions and states and are located near small communities or in remote locations. They serve, but are not limited to, recreational flying, training, and local emergencies. They accommodate predominately single-engine aircraft under 12,500 pounds and provide basic or limited services for pilots or aircraft. The Placerville Airport is classified as a Regional GA Airport. Regional GA Airports provide the same access as Community GA airports, but may provide international access, and are located in an area with a larger population base than Community GA airports. They have a higher concentration of business and corporate flying, and accommodate most business, multi-engine, and jet aircraft. They also provide services for pilots and aircraft including aviation fuel, have published instrument approach, and may have a control tower. The South Lake Tahoe Airport is located in El Dorado County in the City of South Lake Tahoe. The airport is within the planning boundaries of the Tahoe Regional Planning Agency, and therefore, is included in the Tahoe Regional Transportation Plan. MAP 8-1: Location of Public Use Airports in El Dorado County (Excluding Tahoe Basin) Chapter 8 Avia on Page 74


79 AVIATION EXISTING CONDITIONS CAMERON PARK AIRPARK The Cameron Park Airpark is the smallest of nine unique Airport Districts in California. The District is a special district similar to a Community Services District or Fire District governed by an elected Board of Directors and run by an on-site airport manager. The El Dorado County Board of Supervisors formed the District on December 1, The Cameron Park Airpark encompasses 50 acres within the County and is responsible for paying the costs of maintenance and operation of the airport and the taxi lane/streets within the adjacent subdivision, Air Park Estates. The District is made up of 136 parcels: 125 residential (plane port lots) and 11 commercial. There are 105 existing plane port lots and 20 undeveloped residential parcels in the District. The plane port lots in the District have their own hangars plus 100-foot wide taxi lanes combined with streets for taxiing between the residences and the runway. The Airport Reference Code (ARC) is a coding system developed by the FAA to tie airport design criteria to the operational and physical characteristics of the types of aircraft likely to operate at a particular airport. The Cameron Park Airport ARC is A-1. The Cameron Park Airpark is essentially in the center of the Cameron Park community situated between its own residential parcels and some commercial development along Cameron Park Drive. The properties along both sides of Cameron Park Drive near the airport are zoned and developed commercial-industrial. The airport is 1.5 miles north of US 50 and approximately 1 mile south of Green Valley Road at an elevation of 1,284 feet. The Cameron Park Airpark is surrounded primarily by developed land. The airport runway is 4,051 feet long, 50 feet wide. The airport provides facilities for recreational flying, local emergencies including medical evacuation, law enforcement, and training. There are 97 based aircraft at the airport, and there were 36,036 operations for the 12 month period ending 4/30/15. Airport facilities include four transient spaces, fuel availability, and public restrooms. As of 2010, there were eight District and privately owned (commercial) hangars on the public use/commercial portion of the airpark. The total number of tiedowns on the public use/commercial portion is 21. Each of the 105 existing plane port lots have a hanger and some residences have more than one aircraft. The Cameron Park Airpark officials estimate that 250 aircraft could eventually be based in Air Park Estates. The airport has an approved airport layout plan date April 6, 2000 and an Airport Master Plan is currently being developed. Of particular concern in the development process of the Master Plan is whether the plan will be recognized and funded by FAA due to regulations regarding access issues with the private properties surrounding the airport. The Master Plan will include proposals for expansion and maintenance of the airport through acquisition of land within the airpark boundaries that is currently not owned by the airpark. This will be implemented through a process guided by an Airport Capital Improvement Program (ACIP). The projects from the ACIP are included in Table 8-3 in the Action Plan of this Chapter. GEORGETOWN AIRPORT The Georgetown Airport is located approximately two miles northwest of the community of Georgetown in the Sierra Nevada foothills of El Dorado County. It is situated on a ridge top above the town at an elevation of 2,623 feet. The airport is a public use Community General Aviation airport owned by El Dorado County and operated by El Dorado County. The airport can be accessed by SR 193 from either the City of Placerville or the community of Cool. Chapter 8 Avia on Page 75

80 The airport has a single north-south asphalt runway that is 2,980 feet long and 60 feet wide. Airport facilities include fuel availability, 30 open tie-down spaces, six transient spaces, fourteen t-hangars and nine box hangers, public restrooms, and a telephone. There are 34 based aircraft at the airport, and there were 22,500 operations for the 12 month period ending 4/28/14. The ARC for Georgetown Airport is B-1. The airport is currently operating at maximum capacity and there is a need for an increase in airport land. An Airport Master Plan was developed and adopted in The Airport Layout Plan was adopted January 22, The Master Plan includes recommendations for expansion and maintenance of the airport in a process guided by an Airport Capital Improvement Program. The projects from the ACIP are included in Table 8-4 in the Action Plan of this Chapter. PLACERVILLE AIRPORT The Placerville Airport is located in the foothills of the Sierra Nevada in El Dorado County, three miles east of downtown Placerville. The airport is a public use Regional General Aviation airport owned by El Dorado County and operated by the Community Development Agency Transportation Division. The airport serves the Placerville community as well as a number of surrounding communities. It is also used by the military and other governmental agencies for training, search and rescue missions, medical evacuation, and fire support. According to the California Aviation System Plan, the Placerville Airport is considered one of the Sierra Region s highest priority facilities in terms of capacity and safety enhancement. Enhancements to the airport could improve the California state system capacity and safety, and perhaps make it worthy of reclassification. The airport property is acres at an elevation of 2,585 feet above sea level. The airport terminal area consists of the airport administration building, aircraft parking aprons, aircraft storage hangars, a fuel island, and facilities for aviation related service businesses. The airport also has 113 open tie-down spaces, 22 transient spaces, 94 hangars, and public restrooms. According to the CASP Forecast Element, in 2009 there were 208 based aircraft and 72,348 annual operations. The existing airfield includes a northeastsouthwest runway that is 4,200 feet long and 75 feet wide. The ARC for Placerville Airport is B-1 The Placerville Airport is considered to be strategically important to emergency air operations in support of wild land fires. The airport s location is ideal due to its access to US 50 and proximity to Sacramento. Placerville s central location allows access to a broad area within the foothill region of California. Ground access is crucial to emergency air operations. In some cases, the vehicles required to support emergency air operations are double-trailer tank trucks delivering fuel for helicopter operations. The airport is located on Airport Road, which can be accessed from either upper Broadway Road on the east end of Placerville or via Cedar Ravine Road from central Placerville. The access from upper Broadway is limited due to one hairpin turn and, to a lesser extent, overhead clearance problems presented by trees and brush. The alternate access route from the Bedford Road exit off US 50 to Main Street and then to Cedar Ravine Road is more direct, with less drastic turns, but less desirable due to the required travel on Main Street. The Placerville Airport Master Plan was last updated and adopted in The aviation activity forecasts are complete and it has been determined that the airport is currently operating at maximum capacity. The Airport Master Plan includes proposals for a significant increase in airport land. The Master Plan also includes detailed proposals for expansion and maintenance of the airport in a process guided by an Airport Capital Improvement Program. The projects from the ACIP are included in Table 8-5 in the Action Plan of this Chapter. Chapter 8 Avia on Page 76
81 AIRPORT LAND USE COMMISSION On July 3, 2008 the El Dorado County Transportation Commission (EDCTC) was designated as the Airport Land Use Commission (ALUC) for El Dorado County. As the designated ALUC, EDCTC provides technical and advisory support to the Georgetown and Placerville Airports, and the Cameron Park Airpark. The Comprehensive Land Use Plans (CLUP) for each of the three airports under EDCTC jurisdiction, Georgetown, Placerville, and Cameron Park Airpark Airports, were developed in Therefore it is imperative that they be updated to reflect the changes in land use patterns that have occurred since their adoption. Based on new guidelines these land use plans are now referred to as Airport Land Use Compatibility Plans (ALUCPs). The ALUCPs may be updated during FY 2010/2011 dependent upon grant funding. These plans will define and assess compatible land uses for safety, height, and noise on and near airports. The California Department of Transportation, Division of Aeronautics, updated the California Airport Land Use Planning Handbook in The updated Handbook is to be used by Airport Land Use Commissions to address airport/land use safety issues and determine compatible land uses surrounding airports in California. The EDCTC/ALUC serves four primary functions under the State Aeronautics Act of the California Public Utilities Code Section (Division 9, part 1, Chapter 4, Article 3.5). Develop and adopt land use standards to minimize public exposure to safety hazards and excessive levels of noise Prevent encroachment of incompatible land uses around public-use airports Prepare an Airport Land Use Compatibility Plan (ALUCP) for the area around each public use airport defining compatible land uses for safety, density, height, and noise Perform land use consistency determinations for proposed projects within each ALUCP AIRPORT FORECASTS The most current forecasts for the aviation facilities in El Dorado County are available in the Caltrans California Aviation System Plan (CASP) which examines the state s overall aviation systems. Based on that assessment, a forecast of aviation system conditions for a period of twenty years is developed. The CASP uses three indicators to forecast aviation trends: population, number of households, and personal income. These factors, in conjunction with historical trends of aircraft mix, aircraft operations, and airport funding, are utilized to forecast demand. The CASP Forecast Element is currently being updated. The data listed in Table 8-1 is from the Caltrans CASP Forecast Element. TABLE 8-1: Annual Aircraft Operation Forecasts Public Use Airports in El Dorado County Departures and Landings Airport Forecast Growth Cameron Park 52,612 57,736 62,662 19% Georgetown Airport 33,000 35,750 39,417 20% Placerville Airport 95, , ,739 19% Number of Aircraft Based at Airport Cameron Park % Georgetown Airport % Placerville Airport % Source: CASP 2003 Chapter 8 Avia on Page 77

82 AVIATION ACTION PLAN The Action Element of the RTP consists of short-term and long-term projects and activities that address regional transportation issues and needs. The federal conformity regulations (Title 40 CFR , Content of Transportation Plans) identifies the short-term horizon as a period up to 10 years in the future and the long-term horizon as projects or activities 20 years and beyond. The Action Element implements the Policy Element and must be consistent with the financial constraints identified in the Financial Element and must conform to the air quality State Implementation Plan (SIP). Tables 8-2, 8-3, and 8-4 list the projects contained within the short-term action plans for each airport. Projects contained within the Aviation Action Element are derived from the El Dorado County CIP and Cameron Airpark Airport Layout Plan. Detailed projects descriptions are not available for the Cameron Airpark Airport. However, for the Placerville and Georgetown Airport projects the detailed project descriptions are found here: Government/DOT/CIP.aspx. The Aviation Action Plan implements GOAL: AVIATION of the Policy Element of this RTP, which pertains to aviation: Promote and preserve aviation facilities and services that complement the regional transportation system, support emergency response, and enhance economic activities. Detailed project descriptions are not available for the Cameron Park Airpark. TABLE 8-2: Cameron Park Airpark Short-Term Action Plan ( ) Project Description Total Cost Year of Expenditure Dollar Responsible Agency Completion Year Extend Culvert $360,000 Cameron Park Airpark 2016 Construct North Parallel Taxiway $340,000 Cameron Park Airport District 2016 Cameron Park Airpark Master Plan $75,000 Cameron Park Airpark 2016 Acquire Parcels A and B and Construct Apron $592,800 Cameron Park Airpark 2012 Construct South Parallel TW $313,200 Cameron Park Airpark 2016 Drainage Improvements, East, North, and South $426,600 Cameron Park Airpark 2016 Widen RW to 60 $288,600 Cameron Park Airpark 2015 Construct Stopway $166,500 Cameron Park Airpark 2015 Acquire Parcels C and D $400,000 Cameron Park Airpark 2020 TOTAL $2,962,700 Chapter 8 Avia on Page 78
83 TABLE 8-3: Georgetown Airport Short-Term Action Plan ( ) Project Description Total Cost Year of Expenditure Responsible Agency Completion Year Airport Layout Plan Update $7,500 El Dorado County 2018 Ramp Security Lighting $253,000 El Dorado County 2017 Construction of AWOS $251,000 El Dorado County 2024 Crack Seal and Remark Runway, Taxiways, Aprons and Tee Hanger Taxi lanes $320,000 El Dorado County 2024 Crack Seal, Joint Seal and Mark Runway, Taxiways, Aprons and Tee Hanger Taxi lanes; Change Runway End ID $490,000 El Dorado County 2017 Update Airport 2013 Layout Plan with Program Narrative Report $71,000 El Dorado County 2015 West Side Development Phase 1 $1,853,000 El Dorado County 2024 West Side Development Phase 2 $1,484,000 El Dorado County 2024 Update Pavement Maintenance/Management Program $40,000 El Dorado County 2015 TOTAL $4,769,500 TABLE 8-4: Placerville Airport Short-Term Action Plan ( ) Project Description Total Cost Year of Expenditure Responsible Agency Construction Year Water Line and Fire Hydrant to New Apron Area $174,000 El Dorado County 2015 Airport Layout Plan Update $75,000 El Dorado County Unit Nested Tee Hangar $1,279,000 El Dorado County 2024 Tee Hangar Site Development Phase 2 $2,795,000 El Dorado County 2024 Taxiway Edge Lights $416,000 El Dorado County 2016 Crack Seal and Remark Runway 5-23, Taxiways, Aprons and Tee Hanger Taxi lanes 2015 $344,000 El Dorado County 2016 Crack Seal and Remark Runway 5-23, Taxiways, Aprons and Tee Hanger Taxi lanes 2019 $380,000 El Dorado County 2024 Update Pavement Maintenance/Management Program $40,000 El Dorado County 2015 Runway Exit Taxiway East End $261,960 El Dorado County 2015 Water Line and Fire Hydrant to New Apron Area $174,000 El Dorado County 2015 Airport Layout Plan Update $75,000 El Dorado County Unit Nested Tee Hangar $1,279,000 El Dorado County 2024 Tee Hangar Site Development Phase 2 $2,795,000 El Dorado County 2024 Taxiway Edge Lights $416,000 El Dorado County 2016 Crack Seal and Remark Runway 5-23, Taxiways, Aprons and Tee Hanger Taxi lanes 2015 $344,000 El Dorado County 2016 Crack Seal and Remark Runway 5-23, Taxiways, Aprons and Tee Hanger Taxi lanes 2019 $380,000 El Dorado County 2024 Update Pavement Maintenance/Management Program $40,000 El Dorado County 2015 Runway Exit Taxiway East End $261,960 El Dorado County 2015 TOTAL $5,764,960 Chapter 8 Avia on Page 79
84 TABLE 8-5: Aviation Long-Term Action Plan ( ) Project Description Total Cost* Responsible Continue efforts to avoid conflicts over noise issues at each airport N/A Ongoing Continue to protect airspace and runway approaches at each airport N/A Ongoing Continue to maintain and improve existing airport facilities in accordance with the Airport Master Plans and Airport Layout Plans at each airport Assist operators of public use airports in pursuing funding sources for all airports N/A N/A Ongoing Ongoing Develop a jet fuel storage facility at each airport N/A Ongoing Maintain compact land uses surrounding each airport N/A Ongoing Provide opportunities for commercial aviation related tourism activities such as tours at each airport N/A Ongoing Airport tourism marketing plan for each airport N/A Ongoing Coordinate with medical service providers at each airport N/A Ongoing Acquire Parcel E at the Cameron Park Airpark $400, Nested Hangars Eleven Units at the Georgetown Airport $1,097, West Access Road Georgetown Airport $1,349, West Taxiway Phase 1 Georgetown Airport $131, West Taxiway Phase 2 Georgetown Airport $1,341, Total $4,318,000 *Delivery years are not determined and therefore 2015 cost estimates are used. Chapter 8 Avia on Page 80
85 Freight Movement Chapter 9 California serves as an important hub in the global freight movement network. The State s large population and market size create huge demands on the freight movement-related infrastructure within its own borders. In addition to serving the domestic needs of Californians, the State s freight movement system must also accommodate the needs of the large agricultural, natural resources, and manufacturing sectors. In 2013, California industries exported more than $168 billion worth of freight; 10.6 percent of all U.S. exports. Caltrans is largely responsible for planning for and supporting a transportation system which supports this level of freight movement. The current plan which reflects this commitment is the Caltrans California Freight mobility plan as well as partner efforts within the Air Resources Board Sustainable Freight Transport Initiative and Executive Order B More information for these statewide efforts can be found at and respectively. Freight movement is critical to the continued economic health of the El Dorado County region by allowing local producers to transport their goods to market, as well as bringing needed raw materials and finished products into the area for use by local businesses and individuals. Freight movement covers all transportation methods by which freight and commodities are transported into and out of El Dorado County. In general, the most common methods to transport freight and commodities are rail, truck, air, bus, and pipelines. FREIGHT MOVEMENT EXISTING CONDITIONS RAIL TRANSPORT Currently, El Dorado County has no viable rail transport system. In July 1991, the Sacramento-Placerville Transportation Corridor Joint Powers Authority (SPTC-JPA) was formed to purchase the Sacramento- Placerville railroad corridor from the Southern Pacific Transportation Company. The purchase was completed in September 1996 shortly before the merger of Southern Pacific into Union Pacific. The four agencies of the SPTC-JPA are El Dorado County, Sacramento County, Sacramento Regional Transit, and the City of Folsom. Twenty-eight of the 53 miles of the rail banked Sacramento-Placerville Transportation Corridor (SPTC) purchased by the SPTC-JPA are within El Dorado County. In February 2003, a Master Plan was prepared for the corridor which identifies multiple uses, including excursion trains, trails, and utility easements. It also identifies related environmental protection and enhancement strategies such as fencing, landscaping, signage, maintenance, vegetation control, and other fire prevention/control actions. Rail transportation has played an important historical role in the development of the County, although there are no currently active rail transportation facilities. The former Southern Pacific right-of-way and track within the County, known as the SPTC, was purchased in compliance with the Rails to Trails Act, and has requirements regarding preservation of the corridor for potential future reinstatement of rail transportation. The former Michigan/California Railroad right of way between Placerville and Camino was purchased with state funding that precludes its use for rail unless the state funding is returned. AIR TRANSPORT Air transportation is more expensive than ground transportation and is thus not feasible for low cost bulk products. Air transportation is the preferred method of transport for high value, light weight freight such as computer components. Chapter 9 Freight Movement Page 81
86 Mather Airport is the closest cargo airport to El Dorado County, with a location approximately 15 miles west of El Dorado County along the US 50 Corridor, and comprises 2,875 acres which formerly served as a United States Air Force base. Its available facilities include two parallel runways, one of which is 11,300 feet long and capable of handling the largest fully-loaded aircraft, 40 acres of cargo ramp space, 321,000 square feet of warehouse space, and 198,000 square feet of office space. DHL and the United Parcel Service have their Sacramento operations stationed at Mather Airport. Airport access is critical to the region s air cargo business, and this is especially evident at Mather Airport. Mather airport serves as a primary cargo hub for the region shipping over 100 thousand tons of freight and mail each year. Many of these shipments are time-sensitive and demand just-in-time delivery. These include high tech goods, perishables, and medical shipments that can be life-saving deliveries. For these reasons, although Mather Airport is located in Sacramento County, El Dorado County has a vested interest in maintaining adequate access to/from the airfield. El Dorado County s financial contribution for the High Occupancy Vehicle lanes from Cameron Park to Watt Avenue in Sacramento County supports this interest by maintaining mobility along the US 50 Corridor into El Dorado County. Air transportation plays a key role in the movement of freight and people not only to locations outside of the County but also between locations within the County. There are three public airports in the county: Placerville, Cameron Park, and Georgetown. The County s role in air transportation is limited to land use regulation of the land surrounding the airports through the Zoning Ordinance and the actual operations of the two airports owned by the County: the Placerville Airport and the Georgetown Airport. State and federal agencies have primary jurisdiction over all airport facilities and operations in the County. For more information on airports within El Dorado County, see Chapter 8, Aviation. TRUCK TRANSPORT Truck transport remains the primary method of moving freight in California, and El Dorado County is no exception. Truck transport uses much of the state s 172,000 highway miles; however, trucking is mostly concentrated to a 7,513 mile portion of the National Highway System which includes portions of US 50 and SR 49. Trucks are defined as heavy freight vehicles which meet the Surface Transportation Assistance Act of 1982 (STAA) definitions as found in the California State Vehicle Code. US 50 is part of the STAA system and is a terminal access route up to the Sly Park Road exit in Pollock Pines. From Sly Park Road to SR 89 near South Lake Tahoe, US 50 is considered part of the California Legal Truck Network. SR 49, along the entire width of El Dorado County, is classified as a California Legal Advisory Route. According to Caltrans Traffic Data Branch, 2012 Annual Average Daily Truck Traffic (AADT) volumes are approximately 6% of total vehicle traffic on the US 50 Corridor from east of Shingle Springs to Sly Park Road. On State Route 49 within El Dorado County, AADT is approximately 9% of total vehicle traffic between the Amador County line and US 50, and approximately 6.8% between Placerville and Placer County. FREIGHT MOVEMENT NEEDS ASSESSMENT It is anticipated that cargo service into and out of Mather and Sacramento International airports will triple in the next 20 years. Whether products are shipped by rail, ship, air, or truck, regional highways, and local roads are very likely to be used for some part of the trip. Caltrans data indicate that truck movements in the region more than doubled between 1980 and Freight movement by truck suffers from congestion on the roadway system, which delays deliveries and therefore may cause some economic loss to shippers. Mixing of auto traffic with truck traffic contributes to the congestion, and can pose safety and operational problems on the freeways. These issues led to the construction of the Bass Lake Grade Truck Climbing Lane project on US 50 in The project created an additional lane to allow slower moving trucks to climb the steep grade between the Chapter 9 Freight Movement Page 82
87 Silva Valley Road undercrossing and Bass Lake Road Interchange. Construction of the HOV lane extension between El Dorado Hills Boulevard and Cameron Park Drive between 2010 and 2013 further alleviates congestion and mixing of auto and truck traffic in this area. Future improvements to interchanges and multimodal enhancements along US 50, as well as efforts to improve parallel capacity adjacent to US 50, will be critical to maintain an adequate level of service to support interregional movement of freight and services into, through, and out of El Dorado County. FREIGHT MOVEMENT ACTION PLAN The Action Element of the RTP consists of short-term and long-term projects and activities that address regional transportation issues and needs. The federal conformity regulations (Title 40 CFR , Content of Transportation Plans) identify the short-term horizon as a period up to 10 years in the future and the long-term horizon as projects or activities 20 years and beyond. The Action Element implements the Policy Element, must be consistent with the financial constraints identified in the Financial Element and must conform with the air quality State Implementation Plan. Table 9-1 includes both the short-term and longterm action plans for Freight Movement. The projects listed in Table 9-1 implement GOAL: FREIGHT MOVEMENT of the Policy Element of this RTP, which pertains to Freight Movement: Provide for the safe and efficient movement of freight through and within El Dorado County. TABLE 9-1: Freight Movement Short and Long-Term Action Plan ( ) Project Description Support projects that facilitate inter-regional, multi-modal, freight transport to commercial and industrial areas Support projects that facilitate inter-regional freight movement utilizing the regional system of airports Support projects that address the timely movement of freight and services throughout the region Improve US 50 in order to facilitate freight movement and access to jobs Support projects which provide for appropriate loading and unloading as reflected in the adopted El Dorado County Zoning Ordinance Responsible/Supporting Agencies Local jurisdictions, EDCTC, SACOG, Caltrans, Industry Local jurisdictions, EDCTC, SACOG, Caltrans, Industry Local jurisdictions, EDCTC, SACOG, Caltrans, Industry Caltrans, SACOG, EDCTC, Local jurisdictions Local jurisdictions, EDCTC, SACOG, Caltrans, Industry Chapter 9 Freight Movement Page 83
88 Non-Motorized Transportation Chapter 10 Bicycle and pedestrian travel are the two primary modes of non-motorized travel in El Dorado County. Many of the facilities designed for these two modes are readily usable by other non-motorized transportation forms such as equestrians, wheelchair users, in-line skaters, and skateboarders. Bicycling and walking make up a relatively small portion of commuting activity in the United States, but these non-motorized travel modes play important roles within many of the nation s local transportation systems. Infrastructure that supports bicycling and walking expands transportation options and may complement other forms of transportation by supplementing segments of trips. BICYCLING In El Dorado County, bicyclists enjoy a variety of terrain and climates. Neighborhood suburbs dotted with parks, schools, and shopping centers characterize the less-rural western portion of the County, including the communities of El Dorado Hills and Cameron Park. The relatively compact layout of the City of Placerville provides bicyclists the opportunity to ride short distances to numerous destination points. The rural hills of the South County area are lined with wineries and are a popular destination for recreational road cyclists. In addition to being popular with local road cyclists, the rural areas of Cool, Georgetown, and Coloma are also frequent destinations for recreational road. Coloma is both a historic state park and a recreation center for those seeking to spend time on the South Fork of the American River. The western portion of the County provides cyclists with mild winters and ideal weather conditions during the spring and fall months. Mid-day summer heat in the western portion of the County could discourage even the most avid cyclist from riding during the heat of the day. The Census American Community Survey found that between 2009 and % of adult workers over age 16 rode a bicycle as a primary means of transportation to work in El Dorado County. PEDESTRIANS Virtually all travel trips at one point or another include a pedestrian element. The trip could be a walk from the front door to the car in the driveway or from the parking place to the office or shopping center. For others, it could be a long walk or jog from home to the office. For most, it is errands to a nearby business at lunch or after work, or a recreational walk, a walk to shopping near home, or a walk to and from transit. According to the 1990 National Personal Transportation Study, the average walking trip is 0.6 mile. The 2010 Census found that walking was the primary means of transportation to work for 2% of workers age 16 and over in El Dorado County. In developing plans or programs to meet the needs of pedestrians, EDCTC considers all users including the unique needs of the elderly, young, poor, parents pushing strollers, and people with disabilities. This effort parallels policy called out within the State of California 2015 Vehicle Code Div Chapter 5. Pedestrians Rights and Duties Legislative Declaration: Pedestrians (a) The Legislature hereby finds and declares that it is the policy of the State of California that safe and convenient pedestrian travel and access, whether by foot, wheelchair, walker, or stroller, be provided to the residents of the state. (b) In accordance with the policy declared under subdivision (a), it is the intent of the Legislature that all levels of government in the state, particularly the Department of Transportation, work to provide convenient and safe passage for pedestrians on and across all streets and highways, increase levels of walking and pedestrian travel, and reduce pedestrian fatalities and injuries. Chapter 10 Non Motorized Transporta on Page 84

89 NON-MOTORIZED EXISTING CONDITIONS One of the El Dorado County Transportation Commission s goals is to develop programs and projects that encourage the use of active transportation modes and the integration of active modes with other modes of transportation. This includes the coordination of bike paths and lanes with transit stops and the implementation of bikeway and pedestrian projects in concert with transportation improvement projects and development of business and industry. Daily non-motorized trips to and from transit and to and from automobiles are often overlooked. However, they are often times the most challenging trips for elderly, youth, and mobility challenged travelers. These trips, whether long or short, are often the only significant physical activity people may get in their daily lives, tying non-motorized trips directly to public health and wellbeing. The projected growth for this region necessitates the development of safe and efficient non-motorized transportation facilities to support and encourage current and future increases in the use of non-motorized facilities. The development of safe and efficient non-motorized facilities should specifically consider the needs of the most vulnerable pedestrians and bicyclists: children, seniors, and people with disabilities. Additionally, by providing non-motorized facilities which support effective connectivity to not only goods and services but to transit and automobile trips, increased opportunities are offered to improve one s health, wellbeing, and quality of life, and increase the independence of elderly, youth, and the disabled. It is expected over the life of this RTP that standards and accepted practice with regard to non-motorized transportation may change. Therefore, the most current non-motorized standards approved by FHWA, Caltrans, and AASHTO will be implemented for all non-motorized design and construction. While these standards must be followed, each project should be carefully planned, located and designed to meet the needs of the non-motorized facility users. This is ever more important when considering the aging population of the region and opportunities to improve their health, wellness, and independence. Effectively planned and designed non-motorized facilities will also attract new generations to the region who continue to seek out active, walkable, bikeable, and livable communities. By designing and providing these facilities to meet the needs of all users, including the aging population and younger generations, multiple benefits are realized from economic development and growth to improved health and quality of life. PEDESTRIAN FACILITIES EXISTING CONDITIONS A majority of the new commercial developments in the communities within El Dorado County have existing sidewalks on the roads fronting shopping centers. Many of the newer residential developments also have sidewalks on at least one side of the road. Some adopted specific plans have policies with regard to sidewalks, and equestrian, biking, and pedestrian hiking trails and pathways within the developments. The City of Placerville adopted its Non-Motorized Transportation Plan in October 2010 with an overall goal of providing a safe, efficient, and convenient network of non-motorized facilities that establish active transportation as a viable option in the City of Placerville. The Plan includes an inventory of the sidewalk conditions. The Non-Motorized Transportation Plan includes proposals for new bikeway facilities but does not include specific proposals for additional sidewalks. In 2007 the City of Placerville also adopted the Pedestrian Circulation Plan (PCP). The PCP provides prioritized project proposals and options for funding a subsequent Pedestrian Circulation Improvement Program for the ultimate construction and maintenance of an extensive sidewalk network throughout the City. Similarly, in 2003 El Dorado County adopted the Sacramento Placerville Transportation Corridor (SPTC) Master Plan to address pedestrian transportation and circulation along the 28 mile corridor in El Dorado County. Currently, no pedestrian circulation plan has been developed for the unincorporated areas of the Western Slope of El Dorado County. As such, when new and/or existing transportation facilities are developed and when maintenance of existing facilities is performed, consideration should be given for pedestrian facilities. Until such time that a pedestrian circula- Chapter 10 Non Motorized Transporta on Page 85


90 tion plan identifies and prioritizes specific pedestrian improvements shall be considered on a project by project basis. Furthermore, pedestrian improvements shall be consistent with the most currently accepted engineering standards and consider connections to public transit, activity, employment, education, and residential centers. BICYCLE FACILITIES EXISTING CONDITIONS The Western Slope of El Dorado County is a primarily rural region with varying topography and distances between places in which people live and work, go to school, or access other daily needs and services. Consequently, automobile transportation is the primary means of transportation. However, growing interest in livable-walkable communities and active lifestyle choice opportunities has increased awareness of and demand for bicycle transportation connectivity. As such El Dorado County has started to include bicycle facilities with new roadway construction and as a requirement of new residential and commercial development. Where appropriate, bicycle facilities have been developed throughout El Dorado County as means to more alternatives to the typical automobile trip. While these have been focused in more populated areas of the County and City, additional effort has been made to construct bicycle facilities which connect to the rural communities and recreation and tourism destinations such as from Placerville to Apple Hill and on Green Valley Road from the County line to Francisco Drive. Tables 10-1 and 10-2 show the existing Bicycle transportation facilities in the City of Placerville and El Dorado County respectively. As with any transportation facility the most current design standards must be used. To date these standards are contained in the Caltrans Highway Design Manual (HDM), Chapter 1000 Bikeway Planning and Design, dated July 1, 2015 Chapter 1000 has been adopted and is followed by El Dorado County. Caltrans standards are based largely on standards developed by the American Association of State Highway and Transportation Officials (AASHTO). The California Manual of Uniform Traffic Control Devices (CAMUTCD 2014) edition which includes the Federal Highway Administration (FHWA) MUTCD 2009 edition dated December 19, 2009 contains standards for bikeway signage. The most current bikeway standards approved by FHWA, Caltrans, and AASHTO will be implemented for all bikeway design and construction. The HDM, Chapter 1000 emphasizes that the designation of bikeways as Class I, II and III should not be construed as a hierarchy of bikeways; that one is better than the other. Each class of bikeway has its appropriate application. Brief descriptions of the four most common bikeway facilities, summarized from descriptions provided in the HDM, Chapter 1000, and their typical cross sections are as follows: Shared Roadway (No Bikeway Designation) Most bicycle travel in the State now occurs on streets and highways without bikeway designations and this may continue to be true in the future as well. In some instances, entire street systems may be fully adequate for safe and efficient bicycle travel, where signing and pavement marking for bicycle use may be unnecessary. In other cases, prior to designation as a bikeway, routes may need improvements for bicycle travel. Many rural highways are used by touring bicyclists for intercity and recreational travel. However, the development and maintenance of four-foot paved roadway shoulders with a standard four-inch edge line can significantly improve the safety and convenience for bicyclists and motorists along such routes. Class I Bikeway (Bike Path) Generally, bike paths should be used to serve corridors not served by streets and highways or where wide right of way exists, permitting such facilities to be constructed away from the influence of parallel streets. Bike paths should offer opportunities not provided by the road system. They can either provide a recreational opportunity, or in some instances, can serve as direct high-speed commute routes if cross flow by motor vehicles and pedestrian conflicts can be minimized. Chapter 10 Non Motorized Transporta on Page 86
91 Bike Paths are facilities with exclusive right of way, with cross flows by vehicles minimized. Motor vehicles are prohibited from bike paths, which can be reinforced by signing. Bike paths, unless adjacent to an adequate pedestrian facility, are for the exclusive use of bicycles and pedestrians, therefore any facility serving pedestrians must meet accessibility requirements. However, experience has shown that if regular pedestrian use is anticipated, separate facilities for pedestrians maybe beneficial to minimize conflicts. Sidewalks are not Bike paths because they are primarily intended to serve pedestrians, generally cannot meet the design standards for Bike paths, and do not minimize vehicle cross flows. Sidewalks are not to be designated for bicycle travel. Wide sidewalks that do not meet design standards for bicycle paths or bicycle routes also may not meet the safety and mobility needs of bicyclists. Wide sidewalks can encourage higher speed bicycle use and can increase the potential for conflicts with turning traffic at intersections as well as with pedestrians and fixed objects. Class II Bikeway (Bike Lane) Bike lanes are established along streets in corridors where there is significant bicycle demand, and where there are distinct needs that can be served by them. The purpose is to improve conditions for bicyclists in the corridors. Bike lanes are intended to delineate the right of way assigned to bicyclists and motorists and to provide for more predictable movements by each. A more important reason for constructing bike lanes is to better accommodate bicyclists through corridors where insufficient room exists for side-by-side sharing of existing streets by motorists and bicyclists. This can be accomplished by reducing the number of lanes, reducing lane width, or prohibiting or reconfiguring parking on given streets in order to delineate bike lanes. In addition, other things can be done on bike lane streets to improve the situation for bicyclists that might not be possible on all streets. Class III Bikeway (Bike Route) Bike routes are shared facilities which serve either to: (a) Provide continuity to other bicycle facilities (usually Class II bikeways); or (b) Designate preferred routes through high demand corridors. As with bike lanes, designation of bike routes should indicate to bicyclists that there are particular advantages to using these routes as compared with alternative routes. This means that responsible agencies have taken actions to assure that these routes are suitable as shared routes and will be maintained in a manner consistent with the needs of bicyclists. Normally, bike routes are shared with motor vehicles. The use of sidewalks as Class III bikeways is strongly discouraged. Bike routes are intended to provide continuity to the bikeway system. Bike routes are established along through routes not served by Class I or II bikeways, or to connect discontinuous segments of bikeway (normally bike lanes). Bike route facilities are facilities shared with motor vehicles on the street, which are established by placing bike route signs along roadways. Additional enhancement of bike route facilities can be provided by adding shared roadway markings along the route. TABLE 10-1: Existing Bikeways in the City of Placerville Location Type of Bikeway Facility Main Street Class II Bike Lanes Main Street to Canal Street Ray Lawyer Drive Class II Bike Lanes Placerville Drive to Forni Road Placerville Drive Class II Bike Lanes US 50 to Ray Lawyer Drive Point View Drive Class II Bike Lanes Broadway to Smith Flat Road Combellack Road Class II Bike Lanes State Route 49 to Canal Street El Dorado Trail Class I Bikeway Dimity Road to Jacquier Road El Dorado Trail Class I Bikeway Dimity Road to Mosquito Road El Dorado Trail Class I Bikeway Clay Street to Mosquito Road El Dorado Trail Class I Bikeway Clay Street to Bedford Avenue El Dorado Trail Class I Bikeway Ray Lawyer Drive to Forni Road / Lower Main Street Chapter 10 Non Motorized Transporta on Page 87
92 TABLE 10-2: Existing Bikeways in El Dorado County Location Type of Bikeway Facility El Dorado County near Bicycle Warning Sign near Koki Lane on SR 49 Diamond Springs El Dorado County near Latrobe Bicycle Warning Sign on Latrobe Road El Dorado County near Bicycle Warning Sign on Salmon Falls Road Folsom El Dorado Hills Class I Bike Path Along Bass Lake Road from Bass Lake Fire Station to Serrano Parkway El Dorado Hills Class I Bike Path Within the Sacramento Municipal Utility District power line easement between Silva Valley Parkway and the natural trail near New York Creek El Dorado Hills Boulevard Class I Bike Path- Near Serrano Parkway to Woedee Drive El Dorado County near Cool El Dorado County near Cool El Dorado Trail near Placerville El Dorado County near El Dorado County near Cameron Park El Dorado Hills El Dorado Hills El Dorado County near Cameron Park El Dorado Hills El Dorado County near Diamond Springs El Dorado Hills El Dorado Hills El Dorado Hills El Dorado County near Camino El Dorado Hills El Dorado County near Coloma Class I Bikeway Along State Route 193 between State Route 49 and American River Trail in Auburn Lake Trails Class I Bikeway Along State Route 49 between State Route 193 and Northside School Class I Bikeway Jacquier Road to Los Trampas Drive, includes US 50 overcrossing and Forni Road to Missouri Flat Road and Weber Creek Bridge Bike/Pedestrian facility Class I Bikeway-Harvard Way to Clermont Way to the El Dorado Hills Community Services District Class II Bike Lanes on Cameron Park Drive Winterhaven Drive to Alhambra Drive Class II Bike Lanes on Francisco Drive from El Dorado Hills Boulevard to Cambria Way Class II Bike Lanes on Green Valley Road 400 feet west of El Dorado Hills Boulevard to County Line Class II Bike Lanes on Green Valley Road Cameron Park Drive to Pleasant Grove Middle School Class II Bike Lanes on Latrobe Road Golden Foothill Parkway to Town Center Drive Class II Bike Lanes on Missouri Flat Road from US 50 to Golden Center Drive Class II Bike Lanes on Sophia Parkway Class II Bike Lanes on White Rock Road Latrobe Road to Carson Street Class II Bike Lanes on White Rock Road Joerger Cut-Off Road to Latrobe Road One Bicycle Warning Sign/Share the Road Sign on North Canyon Road and one on Larson Road Three Class III Bike Route Signs; one at Harvard Way, two at Governor s Drive Intersection Two Bicycle Warning Signs/Share the road Signs, Bike Lanes in Coloma from the American River Bridge to Marshall Road NON-MOTORIZED TRANSPORTATION NEEDS ASSESSMENT For the purposes of the needs assessment discussion non-motorized facilities, both bicycle and pedestrian, are discussed together as they are both widely used for recreation, leisure, and transportation. With an increase in active lifestyle choices, increased fossil fuel costs, and a desire to live within livable walkable communities, the demand for these facilities is growing. While still not a primary mode of transportation, many studies document the potential of walking or riding a bicycle as a transportation mode. The American Community Survey (ACS) is one of the only sources of data regarding existing levels of walking and bicycling within El Dorado County. The ACS provides sample data about means of transportation to Chapter 10 Non Motorized Transporta on Page 88
93 work. Table 10-3 shows commuting mode share for El Dorado County and the Census Designated Places within the west slope of El Dorado County according to the ACS. Data within Table 10-3 is for work trips only and does not include trips made for recreational or other utilitarian purposes. The ACS also looked at non-motorized transportation across varying community types, these being City, Suburb, or Outside Metro Areas. This data states, Within regions and metropolitan areas, the likelihood of walking or bicycling to work varies across community types such as cities or suburbs. Downtown areas within cities accommodate high population and worker densities, particularly during typical business hours. Cities respond to the challenge of accommodating a large number of people traveling to, from, and within their boundaries with varied strategies, but walkability is a common concern. Rates of walking to work are highest for workers living in a principal city within a metropolitan area at 4.3 percent, compared with 2.4 percent for workers in suburbs, and 1.9 percent outside of metropolitan areas. TABLE 10-3: American Community Survey Mode Share %, Jurisdiction Automobile Transit Pedestrian Worked at Other* Home El Dorado County City of Placerville *Includes Bicycle Trips Source: American Community Survey, Many factors influence the decision to ride a bicycle or walk, and studies show that the primary factor is lack of safe, appropriate, and effective facilities which serve the needs of the potential users of each respective community. In order for non-motorized transportation to be a viable transportation option, it must be safe, attractive, and easy to use while providing for the efficient connectivity to daily goods and services as well as connection from the home, transit stop, or other mode to employment, education, and other activity centers. Generally this includes use of facility design and planning which promotes safety and improves awareness of and access to non-motorized transportation, and placement in sufficient locations and numbers to connect with important activity centers such as schools, parks, shopping centers, and residential areas. For example, a non-motorized facility within an urbanized area of the region such as Cameron Park or El Dorado Hills may look very different and serve different needs than a facility spanning a greater distance within a more rural community. Ultimately, the full list of non-motorized facility options, whether a bike path, sidewalk, or signage on a roadway, need to be an integral component of land use and transportation planning decisions and implementation. These facilities need to follow the most currently accepted standards while supporting the needs of all users. A recent study in the Cameron Park Community revealed nearly 19 percent of Cameron Park community households have annual incomes less than $35,000. These people may find their budgets constrain their transportation choices, which in turn limit employment, education, and recreation opportunities. About four percent of Cameron Park households do not own a car. Having better access to less expensive modes of transportation such as transit, walking, biking, and ride-sharing could improve the standard of living for all residents and free up a portion of their car-related transportation expenses for other uses. NON-MOTORIZED TRANSPORTATION ACTION PLAN The Action Element of the RTP consists of short-term and long-term projects and activities that address regional transportation issues and needs. The federal conformity regulations (Title 40 CFR , Content of Transportation Plans) identify the short-term horizon as a period up to 10 years in the future and the longterm horizon as projects or activities 20 years and beyond. The Action Element implements the Policy Element and must be consistent with the financial constraints identified in the Financial Element and must conform to the air quality State Implementation Plan. Chapter 10 Non Motorized Transporta on Page 89
94 The Action Plan for non-motorized transportation includes projects derived from the El Dorado County Bicycle Transportation Plan, the City of Placerville Non-Motorized Transportation Plan, and the City of Placerville Pedestrian circulation Plan. Table 10-4 is the RTP short-term action plan which takes into account the historical and projected funding levels in El Dorado County for non-motorized projects. The long-term action plan in in Table 10-5 includes projects from Tiers 2 and 3 from the El Dorado County Bicycle Transportation Plan. Table 10-5 also includes long-term projects from the City of Placerville Non-Motorized Transportation Plan. Estimated year of completion dates are not available for non-motorized projects; therefore, the cost estimates are shown in 2015 dollars. The Non-Motorized Action Plan implements GOAL: NON-MOTORIZED TRANSPORTATION of the Policy Element of this RTP, which pertains to non-motorized transportation: Promote a safe, convenient, and efficient non-motorized transportation system which is part of a balanced overall transportation system for all users. Chapter 10 Non Motorized Transporta on Page 90
95 TABLE 10-4: Non-Motorized Transportation Short-Term Action Plan ( ) PROJECT Bass Lake Road Bike Lanes SEGMENT/ DESCRIPTION Class II Bike Lanes from Green Valley Road to US 50 PLANNING LEVEL COST ESTIMATE* RESPONSIBLE/ SUPPORT AGENCY $1,500,000 El Dorado County TD, El Dorado Hills CSD Bike Path Parallel to US 50 on the north side -EDH to Bass Lake Connection Phase 2: EDH to Bass Lake Connection From Silva Valley Road to El Dorado Hills Village Center Shopping Center $300,000 El Dorado County TD, El Dorado Hills CSD Broadway Bike Lanes Main Street to Blairs Lane $300,000 City of Placerville Broadway Bike Lanes Blairs Lane to Schnell School Road $50,000 City of Placerville Cameron Park Drive Bike Lanes Class II Bike Lanes on entire length with the exception of from Palmer Drive to Hacienda Road $363,000 El Dorado County TD Cambridge Drive Merrychase Drive to Crazy Horse $75,000 El Dorado County Road Carson Road Bike Lanes Jacquier Road to Larsen Drive $787,500 El Dorado County TD (on climbing shoulder) Coach Lane Bike Lanes Entire Length $131,250 El Dorado County TD Commerce Way Bike Route Entire Length $1,000 El Dorado County TD Construct Class II Bike Lane State Route 49 in Placerville to Gold $2,880,000 Caltrans Hill Rd Country Club Drive Bike Lanes Phase 1: Cameron Park Drive to $350,000 El Dorado County TD Cambridge Road Durock Road Bike Lanes Entire Length $350,000 El Dorado County TD El Dorado County ADA Transition Plan El Dorado Hills Boulevard Bike Lanes N/A $202,086 El Dorado County TD Phase 1: Saratoga Way to Governor Drive/St. Andrews El Dorado Hills Boulevard Bike Path Phase 2: Utilizing an existing golf cart undercrossing of Serrano Parkway, extend the bike path from the current terminus at Serrano Parkway to Raley s Center El Dorado Hills Boulevard Bike Path Sign and stripe existing Class I Paths Phase 1 in two locations: 1) from Harvard Way to St. Andrews 2) from Governors Drive to Brittney Way $297,500 El Dorado County TD, El Dorado Hills CSD $200,000 El Dorado County TD, El Dorado Hills CSD $10,000 El Dorado County TD, El Dorado Hills CSD El Dorado Hills New York Creek Trail Phase 2 El Dorado Hills to Bass Lake Connection Phase 1 Class I Bike Path from El Dorado Hills Boulevard to natural trail at New York Creek Class III Bike Route on Tong Road, Class III Bike Route on Old Bass Lake Road, use existing roadway as Class I Bike Path between gates from Tong to Old Bass Lake Road $1,000,000 El Dorado County TD, El Dorado Hills CSD $25,000 El Dorado County TD, El Dorado Hills CSD Chapter 10 Non Motorized Transporta on Page 91
96 TABLE 10-4: Non Motorized Transportation Short-Term Action Plan ( ) PROJECT El Dorado Trail El Dorado Trail Missouri Flat Road Bike/Pedestrian Overcrossing El Dorado Trail in Placerville SEGMENT/ DESCRIPTION Class I Bike Path from Los Trampas Drive to Halcon Road Bicycle and pedestrian overcrossing of Missouri Flat Road at the El Dorado Trail Clay Street to Bedford Avenue, Ray Lawyer Drive to Main Street PLANNING RESPONSIBLE/ LEVEL COST SUPPORT AGENCY ESTIMATE* $1,050,000 El Dorado County TD $2,705,000 El Dorado County TD $205,000 City of Placerville, Caltrans El Dorado Hills New York Creek Trail Phase 2 $1,000,000 El Dorado County Enterprise Drive Bike Route Entire Length $1,000 El Dorado County TD Gold Hill Road Bike Route SR 49 to Lotus Road $4,000 El Dorado County TD Green Valley Road Bike Lanes Class II Bike Lanes from Loch Way to Pleasant Grove Middle School $320,000 El Dorado County TD, El Dorado Hills CSD Harvard Way Bike Path From Clermont Road to El Dorado Hills Boulevard $200,000 El Dorado County TD, El Dorado Hills CSD Jacquier Road Bike Lanes Placerville City limit to Carson Road $175,000 El Dorado County TD Latrobe Road Bike Lanes Investment Boulevard to Deer Creek/ $525,000 El Dorado County TD SPTC Lotus Road Bike Lanes Phase 1: Gold Hill Road to SR 49 $525,000 El Dorado County TD Main Street Shared Roadway Marking and Bike Route Signage Mallard Lane/Green Valley Road Bike Lanes Spring Street to Clay Street $7,500 City of Placerville City Limit to Green Valley Road / Mallard Lane to Placerville Drive $150,000 City of Placerville Marshall Road Bike Lanes Marshall Road Bike Route Class II bike lanes from the top of Prospectors Road to Black Oak Mine Road Class III Bike Route on Marshall Road from Black Oak Mine Road to SR 193 $525,000 El Dorado County TD $20,000 El Dorado County TD Meder Road Bike Lanes Phase 1: Cameron Park Drive to $175,000 El Dorado County TD Paloran Court Middletown Road Bike Lanes Canal Street to Cold Springs Road $300,000 City of Placerville Missouri Flat Road Bike Lanes Missouri Flat Road Bike Lanes Mother Lode Drive Bike Lanes Old Bass Lake Rd EDH to Bass Lake Connection Phase 1: Campus Drive to existing Class II on the south side of US 50 Phase 2: Golden Center Drive near Wal-Mart to Pleasant Valley Road Phase 1: Missouri Flat Road to Lindberg Ave Phase 1: EDH to Bass Lake Connection. Between gates, using existing roadway as Class I path $350,000 El Dorado County TD $175,000 El Dorado County TD $175,000 El Dorado County TD $200,000 El Dorado County TD Chapter 10 Non Motorized Transporta on Page 92
97 TABLE 10-4: Non-Motorized Transportation Short-Term Action Plan ( ) PROJECT SEGMENT/DESCRIPTION PLANNING LEVEL COST ESTIMATE* Palmer Drive Bike Lanes Entire Length $87,500 El Dorado County TD Palmer Drive Bike Path From Wild Chaparral Drive to $200,000 El Dorado County TD Connection Palmer Drive Placerville Drive Bike Lanes Green Valley Road to Forni Road / $150,000 City of Placerville US 50 Pleasant Valley Road Bike Phase 1: Big Cut Road to Missouri $350,000 El Dorado County TD Lanes Flat Road Pleasant Valley Road Bike Phase 2: Missouri Flat Road to $525,000 El Dorado County TD Lanes Mother Lode Drive Pleasant Valley Road Bike Big Cut Road to Sly Park Road $1,575,000 El Dorado County TD Lanes Ponderosa Road Bike Lanes US 50 to Meder Road $131,250 El Dorado County TD Prospectors Road Class III Class III bike route on the entire $12,500 El Dorado County TD Bike Route length of Prospectors Road Saratoga Way Extension Class II Bike Lanes Class II Bike Lanes included in extension of Saratoga Way from $75,000 El Dorado County TD Silva Valley Bike Lanes Silva Valley Parkway Bikeway SPTC / El Dorado Trail SPTC/El Dorado Trail SPTC/El Dorado Trail Tong Road EDH to Bass Lake Connection U.S. 50/Missouri Flat Road Interchange Phase 1B.2 Finders Way to County Line From the new connection with White Rock Road to Harvard Way Class I Bike Path between Harvard Way and Appian Way; Class II Bike Lanes on southbound Silva Valley Parkway between Harvard Way and Appian Way; Class II Bike Lanes between Appian Way and Green Valley Road Class I Bike Path from Latrobe to El Dorado County Line Class I Bike Path from El Dorado Road to Mother Lode Drive Class I Bike Path from Missouri Flat Road to El Dorado Road Phase 1: Silva Valley Parkway to Bass Lake Connection Entire Length Class III Second Phase of the Class 1 Bike Path and Pedestrian Facility between Missouri flat Road and Placerville Drive. $300,000 El Dorado County TD, El Dorado Hills CSD $1,678,000 El Dorado County TD, El Dorado Hills CSD $2,800,000 El Dorado County TD, El Dorado Hills CSD $1,500,000 El Dorado County TD $4,165,000 El Dorado County TD $2,500 El Dorado County TD $1,504,000 El Dorado County TD Upper Broadway Bike Lanes Schnell School Road to Point View $575,000 City of Placerville Drive US 50 / El Dorado Hills Pedestrian Overcrossing Pedestrian Overcrossing from near Raley s Center to El Dorado Hills $6,783,000 El Dorado County TD, El Dorado Hills CSD Town Center White Rock Road Bike Lanes From El Dorado County Line to Carson Crossing Road $50,000 El Dorado County TD, El Dorado Hills CSD TOTAL* $38,822,586 *Delivery year for short-term projects ( ) are not determined and therefore 2015 cost estimates are used. RESPONSIBLE/ SUPPORT AGENCY Chapter 10 Non Motorized Transporta on Page 93
98 TABLE 10-5: Non-Motorized Transportation Long-Term Action Plan ( ) *Delivery year for long-term projects ( ) are not determined and therefore 2015 cost estimates are used. TIER 2 Proposed Improvements Roadway, Route or Project Name El Dorado Hills Blvd Bike Lanes El Dorado Hills SMUD Trail Segment Phase 2: Governors Dr.,/ Street Andrews to Green Valley Road Within the SMUD powerline easement between El Dorado Hills Boulevard and Sophia Parkway Segment Bikeway Facility Distance (miles) 1.5 Class II Bike Lanes 1.2 Class I Bike Path Latrobe Road US 50 to Deer Creek 2.5 Class II Bike Lanes Valley View Bike Paths Along Valley View parkway to schools, parks, and 1.5 Class II Bike Lanes Village Center Valley View Parkway Entire Length 1.5 Class II Bike Lanes Harvard Way Entire Length.5 Class II Bike Lanes Ambiance Drive Sophia Parkway to Brittany Way 1 Class II Bike Lanes Brittany Way Ambiance Drive to El Dorado Hills Boulevard.5 Class II Bike Lanes El Dorado Hills Town Through entire commercial center 1 Class II Bike Lanes Center Serrano Parkway Entire Length 3.5 Class II Bike Lanes Saratoga Drive Entire Length 1 Class II Bike Lanes Country Club Drive Phase 2: Cambridge Road to Bass Lake Road 2 Class II Bike Lanes Green Valley Road Cameron Park Drive to Lotus Road 5 Class II Bike Lanes Meder Road Phase 2: Paloran Court to Ponderosa Road 1 Class II Bike Lanes Cambridge Drive Country Club Drive to Merrychase Drive.5 Class II Bike Lanes Cambridge Drive Green Valley Road to Country Club Drive 3 Class II Bike Lanes Mother Lode Drive US 50 to French Creek.5 Class III Bike Lanes Castana Drive Entire Length.5 Class II Bike Lanes Covello Circle Castana Drive to end on eastern side.25 Class III Bike Lanes Cameron Park Bass Lake Bike Path connection Covello Circle to Magnolia Hills Development at Summer Drive 1 Class III Bike Lanes Latrobe Road Bike Lanes South Shingle to SPTC 1 Class II Bike Lanes South Shingle Road Latrobe Road to School 1 Class II Bike Lanes Forni Road Missouri Flat Road to Enterprise Drive 1 Class II Bike Lanes Mother Lode Drive Bike Phase 2: Lindberg Avenue to Pleasant Valley 2 Class II Bike Lanes Lanes Road Carson Road Jacquier Road to Larsen Drive 4.5 Class II Bike Lanes on climbing shoulder Missouri Flat Road Bike Class I Bike Path on north side of Missouri Flat.25 Class I Bike Path Path Road SR 49 Placerville to Gold Hill Road 3 Class II Bike Lanes Big Cut Road Pleasant Valley Road to the City of Placerville 3 Class III Bike Lanes Fort Jim Road Entire Length 2 Class III Bike Lanes Lindberg Avenue Mother Lode Drive to Forni Road 1 Class III Bike Lanes Snows Road Carson Road to Fuji Court.75 Class II Bike Lanes Pony Express Trail Road Carson Road to Sly Park Road 6 Class II Bike Lanes Carson Road Snows Road to Pony Express Trail Road.5 Class III Bike Lanes Chapter 10 Non Motorized Transporta on Page 94
99 TABLE 10-5: Non-Motorized Transportation Long-Term Action Plan ( ) *Delivery year for long-term projects ( ) are not determined and therefore 2015 cost estimates are used. TIER 2 Proposed Improvements Roadway, Route or Project Name Segment Segment Distance (miles) Bikeway Facility Mt Aukum Road Fairplay Road to Blackhawk Lane 6.5 Class III Bike Lanes Mt Aukum Road/E16 Fairplay Road to Mt Creek/Pioneer Schools 1 Class III Bike Lanes Fairplay Road Mt Aukum Road to Unser Way/Pioneer Park.5 Class III Bike Lanes Mt Aukum Road Blackhawk Lane to Fairplay Road 6.5 Class III Bike Lanes SR 49 Cold Springs Road to Cool 11 Class II Bike Lanes SR 49 (also map 4) Placerville to Gold Hill Road 3 Class II Bike Lanes Lotus Coloma Bike and Beach Court in Coloma to Henningsen Lotus Park.5 Pedestrian Bridge Lotus Road Bike Lanes Green Valley Road to SR Class II Bike Lanes SR 193 Through Georgetown 1 Class II Bike Lanes SR 193 Auburn Lake Trails to Wentworth Springs Road 11 Class II Bike Lanes Garden Valley Road Near schools in Garden Valley 1 Class II Bike Lanes Marshall Road SR 49 to Prospector Road.5 Class II Bike Lanes Marshall Road Near Schools in Garden Valley 1 Class II Bike Lanes Marshall Road Through Georgetown 1 Class II Bike Lanes Lotus Road Bike Lanes Phase 2: Green Valley Road to Gold Hill Road 3 Class II Bike Lanes Newtown Road Bike Parkway Drive to Pleasant Valley Road 5 Class II Bike Lanes Lanes Sly Park Road Bike Route Mormon Emigrant Trail to US Class III Bike Route SPTC El Dorado Trail Mother Lode Drive in El Dorado to Mother Lode Drive in Shingle Springs 4.75 Class I Bike Path Chapter 10 Non Motorized Transporta on Page 95
100 TABLE 10-5: Non-Motorized Transportation Long-Term Action Plan ( ) TIER 3 Proposed Improvements Roadway, Route or Project Segment Name Segment Distance (miles) Bikeway Facility Village Center Drive Entire Length.5 Class II Bike Lanes Windplay Road Entire Length.25 Class II Bike Lanes Golden Foothill Parkway Entire Length 2 Class II Bike Lanes Sheffield Drive Entire Length 1 Class III Bike Lanes Francisco Drive Sheffield Drive to Green Valley Road 1.5 Class III Bike Lanes Lakehills Drive Sheffield Drive to El Dorado Hills Boulevard 1 Class III Bike Lanes South Shingle Road SPTC to US Class II Bike Lanes Wild Chaparral Dr Ponderosa Road to end.75 Class II Bike Lanes North Shingle Road Ponderosa Road to Sports Field Dr.5 Class II Bike Lanes Oxford Road Entire Length.5 Class III Bike Lanes Merrychase Drive Entire Length.75 Class III Bike Lanes Shingle Lime Mine Road Durock Road to SPTC.5 Class III Bike Lanes Latrobe Road Bike Lanes SPTC to El Dorado County/Amador County 3 Class II Bike Lanes Line SPTC El Dorado Trail Mother Lode Drive in Shingle Springs to 2.5 Shingle Lime Mine Road SPTC/El Dorado Trail Shingle Lime Mine Road to Latrobe Road 8 Mother Lode Drive Bike Lanes Phase 3: Pleasant Valley Road to South 4 Class II Bike Lanes Shingle Road SR 49 Pleasant Valley Road to Union Mine Road.5 Class II Bike Lanes Lindberg Avenue Mother Lode Drive to Forni Road 1 Class III Bike Lanes Patterson Drive Pleasant Valley Road to Crusader.75 Class III Bike Lanes Crusader Road/Cash Boy Road/ Crystal Dr/Tullis Mine Road Patterson Drive to Pleasant Valley Road 1 Class III Bike Lanes Zandonnella Road Entire Length 1 Class III Bike Lanes Union Mine Road Entire Length 4 Class III Bike Lanes SPTC El Dorado Trail Halcon Road to Snows Road in Camino 4 Happy Valley Road/Cutoff Mt Aukum to Happy Valley Cutoff to Mt 1.5 Class III Bike Lanes Aukum Road Grizzly Flat Road Glen Drive to Sciaroni Road.5 Class II Bike Lanes Sciaroni Road/Tyler Road Grizzly Flat Road to Grizzly Pines School.5 Class II Bike Lanes Sly Park Road Mormon Emigrant Trail to Pleasant Valley Road 6 Class III Bike Route Fairplay Road Pioneer Park to Omo Ranch Road 4.2 Class III Bike Route Chapter 10 Non Motorized Transporta on Page 96
101 TABLE 10-5: Non-Motorized Transportation Long-Term Action Plan ( ) City of Placerville Proposed Bikeway Facilities Class II Bike Lanes Roadway, Route or Segment Project Name Segment Distance (miles) Green Valley Road Placerville Drive to Mallard Lane.24 Forni Road Ray Lawyer Drive to US 50/Placerville Drive.5 Cold Springs Road City Limit to Placerville Drive.5 Pierroz Road Cold Springs Road to Placerville Drive.25 Placerville Drive Bridge over Hangtown Creek.10 SR 49 City Limit to Green Street 1 Spring Street SR 49 to Pleasant Street.25 Bee Street Entire Length.25 Main Street Spring Street to Canal Street.25 Pacific Street Main Street to Sacramento Street and Cedar Ravine to.20 Clark Street Marshall Way Cedar Ravine to Marshall Hospital.25 Clay Street Coleman Street to Arizona Way.5 Mosquito Road Dimity Lane to Broadway.25 Schnell School Road Broadway to Carson Road.25 Broadway Main Street to Schnell School Road.5 Tunnel Street Spring Street to Robin Court.25 Cedar Ravine Washington Street to Lyon Park 1 TOTAL CLASS II BIKE LANES PROPOSED 6.79 City of Placerville Proposed Bikeway Facilities Class III Bike Routes Roadway, Route or Segment Project Name Segment Distance (miles) Armory Drive Entire length.25 Canal Street Entire length.75 Bedford Avenue Pleasant Street to Gold Bug Park.75 Moulton Dr/Markham Dr Entire length.25 Coloma Court Entire length.25 Coloma Street /SR 49 Green Street to US 50 Overcrossing.5 Benham Street Entire length.25 Big Cut Road To City limit.5 Spring Street US 50 to Pleasant Street.25 Main Street Spring Street to Clay street.25 Cedar Ravine Main Street to Marshall Way.25 Washington Street Main Street to Cedar Ravine.25 Sherman Street / Thompson Street / Washington Street to Sierra School / Main Street.35 Sheridan Street Spanish Ravine Road Connection from Main Street to.25 McDonald s parking lot Clay Street Arizona Way to Mosquito Road.5 Carson Road Broadway to Dimity Lane.25 Dimity Lane Mosquito Road to Carson Road.25 TOTAL CLASS III BIKE ROUTES PROPOSED 6.1 Chapter 10 Non Motorized Transporta on Page 97
102 TABLE 10-5: Non-Motorized Transportation Long-Term Action Plan ( ) City of Placerville Proposed Bikeway Facilities Class I Bike Routes Roadway, Route or Project Name Segment Segment Distance (miles) Government Center to Fairgrounds Connector Fair Lane Court to El Dorado County Fairgrounds.10 Government Center Placerville Drive Connector Fair Lane to Armory Way.5 Quartz Mountain Bike Path Quartz Mountain Road to Robin Court / Tunnel Street.25 TOTAL CLASS I BIKE PATHS PROPOSED 2.35 City of Placerville Proposed Bicycle Facilities Bike Racks and Lockers Roadway, Route or Segment Project Name Bike Racks Lower Broadway, near Taco Bell, Rite Aid Bike Racks Bike Racks Bike Racks Bike Racks Upper Broadway, near Grocery Outlet Placerville Station on Mosquito Road At Raley s Center on Placerville Drive At any new Park and Ride Lot in the City of Placerville TABLE 10-6: Cost Estimates for Non-Motorized Transportation Long-Term Action Plan ( ) Facility Type Miles Proposed Approximate Cost Class I Bike Path 49.2 $12,940,000 Class II Bike Lanes $16,320,000 Class III Bike Route $269,750 Total $29,529,750 Chapter 10 Non Motorized Transporta on Page 98


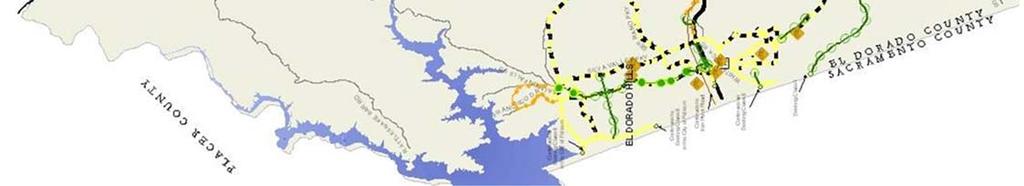
103 MAP 10-1: El Dorado County Bicycle Facilities Network Chapter 10 Non Motorized Transporta on Page 99
 to describe a series of techniques designed to maximize the efficiency of the existing transportation system by reducing dependence on single -occupant vehicles.")
104 Transportation Systems Management Chapter 11 Transportation Systems Management (TSM) is often used interchangeably with Transportation Control Measures (TCMs) and Transportation Demand Management (TDM) to describe a series of techniques designed to maximize the efficiency of the existing transportation system by reducing dependence on single -occupant vehicles. The common goals of TSM, TCMs, and TDM are to reduce traffic congestion, improve air quality, and reduce or eliminate the need for new and expensive transportation infrastructure. Techniques are generally low-cost measures to reduce travel demand or improve the utilization of existing transportation facilities. The differences between the three concepts are subtle. Each contains alternative transportation measures, such as carpooling, transit, bicycling, walking, vanpooling, compressed work weeks, and telecommuting. TSM s emphasize the reduction of traffic congestion by increasing the person-trip capacity of existing transportation systems. As such, TSM techniques also include restriping roadways for channelization, ramp metering, and establishment of freeway auxiliary lanes. TCM s are geared towards reducing air pollution through techniques such as alternative fuel vehicles. Typical TDM strategies include the provision of public information and incentives for carpooling, vanpooling, bicycling, or using public transit, primarily for work trips. Strategies to encourage telecommuting, or working from home, or alternate work schedules that encourage travel during off-peak hours are also considered TDM. TSM s and TDM elements are monitored by EDCTC to determine usage and opportunities for improvements. Collection and analysis of this TSM and TDM usage and demand data, such as HOV lane usage, park-and-ride usage, and ridesharing volumes, is used to prioritize and position projects and programs for available funding. Since 1981, the Federal Highway Administration (FHWA) and the Federal Transit Administration (FTA) have required that Transportation Systems Management be part of the regional transportation planning and programming process. Specifically, the Regional Transportation Plan must have a TSM element which describes how the region intends to deal with the movement of people and freight by improving the efficiency and effectiveness of the total transportation system. TRANSPORTATION SYSTEMS MANAGEMENT STRATEGIES TRAFFIC FLOW IMPROVEMENTS Roadway restriping, channelization, ramp metering, auxiliary lanes, elimination of on-street parking, non-motorized facilities, and computerized signalization are techniques currently used to improve the flow of traffic without new road construction. Roadway restriping seeks to increase the number of lanes by reducing lane width, thus increasing traffic capacity. Channelization, which is often done in conjunction with restriping, adds turn lanes to busy roadways to eliminate traffic backups behind cars trying to make turns. Auxiliary lanes are often added to ease merging of traffic onto and off of freeways, such as US 50. Elimination of on-street parking is done to add lanes, and thus capacity, to heavily traveled roadways. In addition, traffic backups caused by vehicles entering or exiting on-street parking spaces is eliminated. Computerized signalization seeks to coordinate signal timing to smooth traffic flow, control speed, and improve throughput. TRANSIT Public transit service is the most widely used TSM measure in El Dorado County, serving residents who depend on transit for commuting to work and school and for shopping, medical, and leisure trips. Chapter 7 Chapter 11 Transporta on Systems Management Page 100

 manages the Regional Rideshare Program covering El Dorado, Placer, Sacramento, Yolo, Yuba, and Sutter counties.")
105 provides a comprehensive overview of the public transportation services provided by the El Dorado County Transit Authority (EDCTA). EDCTA provides commuter bus services to downtown Sacramento as well as local fixed routes, deviated fixed routes, Dial-a- Ride, demand response, intercity commuter service, and contracted social service transportation. RIDESHARING There are several coordinated ridesharing programs that serve El Dorado County. The Sacramento Area Council of Governments (SACOG) manages the Regional Rideshare Program covering El Dorado, Placer, Sacramento, Yolo, Yuba, and Sutter counties. The Regional Rideshare Program is a Transportation Control Measure, included in the 2009 State Implementation Plan for Air Quality for the Sacramento Region. Under federal law, the Regional Rideshare Program must be provided as long as the Sacramento Region is designated a non-attainment area for the federal eight-hour ozone air quality standard. The purpose of the Regional Rideshare Program is to encourage carpooling and the use of alternative transportation modes for traveling to work, school, personal trips, and recreation. The Regional Rideshare Program includes the toll-free 511 phone number and the sacregion511.com website. The website includes an online database for commuters interested in ridesharing (carpools and vanpools), a transit trip planning tool, real time traffic information, and detailed information about commuting by bike. Members of the Regional Rideshare Program conduct outreach to large employers throughout the region and work with them to offer incentives, such as transit pass subsidies, and disincentives, such as charging for parking, to encourage employees to use an alternative transportation mode. The 50 Corridor Transportation Management Association works with employers in El Dorado County and along the 50 Corridor to implement commute programs that focus on transportation alternatives such as carpooling, vanpooling, cycling, walking, and utilizing transit to improve the commute today and into the future. The 50corridor.com website provides up-to-date traffic information for US 50, links to the Regional Rideshare Program database, and information on ridesharing, bicycling, and transit along the US 50 Corridor. Another regional program focused on encouraging ridesharing is the Spare-the-Air program managed by the Sacramento Metropolitan Air Quality Management District and supported by the air districts of the Sacramento region (including the El Dorado County Air Quality Management District). Spare-the-Air is a regional driving curtailment and health notification program which operates in the Sacramento ozone non-attainment area (which includes El Dorado County with the exception of the Tahoe Basin) during the summer smog season, May to October. Drivers are alerted to reduce driving on days when ozone formation is expected to be high. The public is advised of ozone levels and health effects through a variety of media. CARPOOL/VANPOOL Commuter vanpools can be organized and paid for in a variety of ways. In general, a group of ten or more commuters share the operating and maintenance cost of a leased van that transports them to and from work. Usually one person in the group is the regular driver. Participants typically meet in a central location, such as a park-and-ride lot, and are then dropped off at their workplace(s). Vanpool participants often work for the same company. Vanpools are often self-supporting but can also be subsidized by a public agency and/or employers. Formal carpools and vanpools in El Dorado County are primarily organized by two private commercial vanpool leasing firms, Enterprise Rideshare and Vanpool Service Inc. (VPSI). Currently several employee operated commuter vanpools provide transportation for employees who reside in El Dorado Hills, Diamond Springs, Shingle Springs, Pollock Pines, and Placerville. Through the private providers, as of October 2010 there were 13 commercially leased vans which are utilized for the sole purpose of commuting to and from El Chapter 11 Transporta on Systems Management Page 101
106 Dorado County. The commute patterns for 6 of the 13 commuter vans operating in El Dorado County are as follows: VPSI: Three vans travel daily from the Diamond Springs area to downtown Sacramento Two vans travel daily from Placerville to downtown Sacramento One travels daily from Pollock Pines to downtown Sacramento The seven additional vans are leased by Enterprise Rideshare to support employees at DST Output, as described below: DST OUTPUT One of the largest employers in El Dorado County, DST Output has seven vanpools traveling to El Dorado Hills from South Sacramento (five vanpools) and Elk Grove (two vanpools). The vanpools carry more than 75 passengers to their jobs each day. The vans are leased by Enterprise exclusively for vanpools. 50 CORRIDOR TRANSPORTATION MANAGEMENT ASSOCIATION (TMA) 50 Corridor TMA, a nonprofit agency, promotes commuting options by providing information about ridesharing. Placement assistance is available to employers, individuals and other interested organizations. BICYCLING AND WALKING Promotional events that encourage bicycling and walking as a transportation mode in El Dorado County have continually seen annual increases in participation. EDCTC works closely with the 50 Corridor Transportation Management Association and SACOG to promote Bike Month events held annually in May. The Sacramento Region mayisbikemonth.com website serves as a venue for the promotion of bicycling events held throughout the region in May to encourage bicycle commuting. The website also allows bicyclists to log their miles and develops a summary of commute, errand, work trip and recreational miles ridden in the Sacramento Region during May. EDCTC has worked with local El Dorado County and City of Placerville schools to hold Walk to School Day events annually in October. The events are promoted in conjunction with International Walk to School Day, which is typically held on the first Wednesday in October. Several El Dorado County schools participate and each year approximately 500 students walk to school. The event promotes increased awareness about walking as a transportation mode. PARK-AND-RIDE LOTS The purpose of park-and-ride lots is to provide a central meeting place adjacent to major travel routes where commuters can congregate and form carpools or catch buses for the remainder of the commute trip. Caltrans operates numerous park-and-ride lots in El Dorado County, located along US 50. The El Dorado County Transit Authority also operates several lots, located near US 50. The lots include paved areas for parking cars and some lots include bicycle lockers (See Map 7-1). FREEWAY SERVICE PATROL The Freeway Service Patrol program (FSP) is a program managed by the California Highway Patrol and a regional or local entity which provides emergency roadside assistance on a freeway in an urban area. The FSP was established by the California legislature through the Freeway Service Patrol Act, Streets and Highways Code Section , to provide for the implementation of a freeway service patrol system using a formula-based allocation. The Freeway Service Patrol is designed to increase roadway safety, reduce motorist delays, reduce freeway congestion, reduce air pollution, and improve overall efficiency of freeway operations. FSP is a fleet of roving white tow trucks on the lookout for stalls and accidents during peak commute hours. Over 350 CHP certified and supervised tow truck drivers assist 50,000 motorists monthly on California freeways absolutely free. The El Dorado County FSP operates from the El Dorado/ Sacramento County line approximately ten miles east on US 50. Chapter 11 Transporta on Systems Management Page 102
107 INTELLIGENT TRANSPORTATION SYSTEMS There are several Intelligent Transportation Systems (ITS) efforts underway in the Sacramento region, in the foothill counties (El Dorado, Placer, Nevada, Sierra), and in the Tahoe Basin (refer to Chapter 12). The Tahoe Gateway ITS Strategic Deployment Plan recommends implementation of several technology improvements that can improve the flow and timeliness of information available to the traveler in order to avoid and/or reduce traffic congestion and delays due to traffic. Regional projects focus on traveler information management, emergency management, and communications. In El Dorado County, recommended improvements include signal system technology, traffic management, and Automatic Vehicle Identification, Automatic Vehicle Location, and Computer Aided Dispatch technologies for public transit and emergency vehicles. An example of a regional ITS project is the 511 comprehensive traveler information system. 511 is a joint project between SACOG, the California Department of Transportation, and other partners. The 511 system provides access to information about all modes of travel: traffic conditions for commuters, bus and light rail information for more than 20 transit agencies, Paratransit services for the elderly and disabled, and information about ridesharing and commuting by bike. The telephone service is available in English and Spanish and, in conjunction with the phone service, the 511 website can help users plan their daily commute, access transit providers, find a carpool partner, and learn about bicycling as a commute option. With the traffic information on the 511 site, users can check commute options and know the road conditions before traveling. For more information about the 511 service, visit the Sacramento Region 511 website at TRANSPORTATION DEMAND MANAGEMENT STRATEGIES TELECOMMUTING, COMPRESSED WORK WEEKS, AND FLEXIBLE WORK HOURS Telecommuting, compressed work weeks, and flexible work hours are employment-based techniques to reduce the number of work trips per week, or to transfer trips to off-peak hours to reduce peak hour congestion. Telecommuting, or alternative work location, allows workers to perform job duties at home or another location, communicating with the main work center by modem, fax, or telephone as necessary. From 2003 to 2008, the total number of Telecommuters rose 43 percent to 33.7 million Americans (World at Work 2010). While the surface transportation infrastructure for cars, buses, and trains consists of roads and rails, the infrastructure required for telecommuting is broadband internet. Continued efforts to expand broadband internet infrastructure to rural El Dorado County will further telecommuting opportunities throughout the region; refer to Table 12-1, ITS Action Plan. One such effort was initiated in 2010 through the Central Valley Next Generation Broadband Infrastructure Plan which will begin opening telecommuting opportunities to rural residents who currently do not have access to broadband infrastructure. Providing broadband throughout the rural areas is imperative for telecommuting to be a viable tool toward decreasing daily commuter travel. Compressed work weeks increase the number of hours worked each day to squeeze a regular work week into fewer work days. A typical schedule could be four ten-hour work days each week (4/10 schedule) or eight nine-hour days and one eight-hour day in two weeks (9/80 schedule). Flexible work hours may reduce the number of work trips per week, but seek to reduce traffic congestion by shifting some trips out of the peak period. Employers using flexible hours may allow workers to vary time of arrival and departure daily, better coordinate with transit service, or may require workers to choose a specific schedule to meet the needs of the employer and employee. TELE/VIDEO CONFERENCING Tele/video conferencing is generally defined as meetings held by telephone or via video hookup to replace the need for traveling to meet in person. Many employers in El Dorado County utilize tele/video conferencing as a cost-effective way to conduct meetings and seminars while avoiding travel on roadways. Chapter 11 Transporta on Systems Management Page 103
108 ALTERNATIVE FUELS Alternative fuels are used to power motor vehicles while reducing the impacts to air quality. Common alternative fuels include ethanol, propane, compressed natural gas, and electricity. Current efforts in the Sacramento region are focusing on cost effective ways to reduce precursors to ozone in order to meet federal air quality conformity guidelines. Due in large part to the unavailability of alternative fueling facilities in El Dorado County, EDCTA utilizes clean diesel equipment which meets California Air Resources Board requirements. TRANSPORTATION SYSTEMS MANAGEMENT/ TRANSPORTATION DEMAND MANAGEMENT ACTION PLAN The Action Element of the RTP consists of short-term and long-term projects and activities that address regional transportation issues and needs. The federal conformity regulations (Title 40 CFR , Content of Transportation Plans) identify the short-term horizon as a period up to 10 years in the future and the long-term horizon as projects or activities 20 years and beyond. The Action Element implements the Policy Element, must be consistent with the financial constraints identified in the Financial Element and must conform with the air quality State Implementation Plan. Table 11-1 lists the projects in the short-term and long-term action plans. The TSM Action Plan implements GOAL: TRANSPORTATION SYSTEMS MANAGEMENT, Objective B, of the Policy Element of this RTP, which pertains to TDM and reads as follows: Support advancement of Transportation Demand Management (TDM) in a thorough, costeffective manner which reflects the needs of the region. TABLE 11-1: TSM/TDM Action Plan ( ) Project Description Work cooperatively with neighboring jurisdictions to implement ITS improvements in the region Continue to work cooperatively with Caltrans, SACOG, SMAQMD, and 50 Corridor.com on implementation and enhancement of regional rideshare programs that encourage the use of alternative modes of transportation Implement traffic flow improvements on regionally significant roadways Improve and expand public transportation systems as feasible Develop and expand facilities to support the use of alternative transportation such as pedestrian and bicycle facilities and Park-and-Ride lots Work cooperatively to implement school congestion mitigation programs, such as Safe Routes to School and walking school buses Expand broadband internet access to rural areas of El Dorado County to support telecommuting opportunities Expand the use of alternative fuels to reduce impacts on air quality Maintain a Freeway Service Patrol program along US 50 Responsible/Support Agencies El Dorado County, SACOG, TRPA, NCTC, PCTPA, ACTC, Caltrans Caltrans, SACOG, SMAQMD, EDCTC, 50Corridor.com, local employers, School Districts EDCTC, Local Jurisdictions, Caltrans EDCTC, EDCTA EDCTC, EDCTA, Local jurisdictions, Caltrans El Dorado County, City of Placerville, School Districts, EDCTC EDCTC, SACOG, Local jurisdictions EDCTC, SACOG, EDC AQMD, SMAQMD, EDCTA, Local jurisdictions EDCTC, CHP, Caltrans, SACOG Chapter 11 Transporta on Systems Management Page 104

109 Intelligent Transportation Systems Chapter 12 The transportation network of El Dorado County continues to experience increased commuter traffic, local roadway and intersection congestion, increased commercial freight movement, and an increased need for sophisticated traffic control. The mountainous areas of the foothills are more rural in character and have the inherent limitation of fewer alternate routes, as well as rapidly changing weather and road conditions. In addition to commuter traffic, the foothills are impacted by heavy tourism and local traffic flowing through to recreational destinations in the Tahoe area and beyond. While the substantial growth of the last decade has slowed, it is expected to regain momentum and potentially exceed capacity of the existing transportation facilities throughout El Dorado County. Limited transportation funds, recent decreases in sales taxes and developer fee revenues, environmental constraints, and various other factors have created the reality that capacity-increasing transportation projects alone will not fulfill the needs to improve safety and reduce congestion. Intelligent Transportation Systems (ITS) offer potential new solutions to accomplish these goals by making the most efficient use of the existing transportation network. Many ITS applications have proven to be significant factors in reducing the demand placed on existing transportation networks operating at or beyond capacity. INTELLIGENT TRANSPORTATION SYSTEMS DEFINED The official ITS definition (23 CFR Part 940), is electronics, communications, or information processing used singly or in combination to improve the efficiency or safety of a surface transportation system. An alternative definition for ITS is the application of advanced technology to assist in the solution of transportation problems and the management of transportation systems. The implementation of ITS technology is not new. ITS elements such as computerized signal systems have been used for well over a decade in the Sacramento Region to manage traffic flow on arterial roads. However, ITS technology is increasingly being used for other transportation management purposes such as traffic management, transit operations management, incident management, and travel information management. COMMON ITS APPLICATIONS The following is a description of some of the more common ITS applications currently being deployed. It is important to note that new ITS technologies are constantly being researched and developed. ADVANCED TRAVELER INFORMATION SYSTEMS These systems deliver data directly to travelers, empowering them to make better choices about alternate routes or modes of transportation. These systems include real-time traffic data via the internet or Highway Advisory Radio, Changeable Message Signs, Landslide Sensor Integration, and Weather Stations. An example of this type of technology utilized in El Dorado County is the website which contains construction updates and road closures for regionally significant roadways, real-time traffic via video cameras, commute assistance, and general information and news regarding the US 50 corridor. ADVANCED TRAFFIC MANAGEMENT SYSTEMS These systems employ a variety of relatively inexpensive detectors, cameras, and communication systems to monitor traffic, optimize signal timing on major arterials, and control the flow of traffic. Caltrans manages Chapter 12 Intelligent Transporta on Systems Page 105
110 ten Closed Circuit Television (CCTV) cameras in El Dorado County along US Highway 50 beginning at Spring Street and SR 49 and extending east to Echo Summit. INCIDENT MANAGEMENT SYSTEMS These systems provide traffic operators with the tools to provide quick and efficient response to accidents, hazardous spills, floods, forest fires, avalanches, and other emergencies. Multiple communications systems link data collection points, transportation operations centers, and travel information portals into an integrated network that can be operated efficiently and intelligently. TRANSIT OPERATIONS MANAGEMENT Transit Operations Management utilizes technology of Automatic Vehicle Identification (AVI) and Automatic Vehicle Location (AVL) technology to provide communications between transit agency vehicles and dispatch centers. AVI and AVL technology is currently being utilized in El Dorado County, and remains as one of the ongoing applications included in the ITS short-term action plan Table INTELLIGENT TRANSPORTATION SYSTEMS EXISTING CONDITIONS The El Dorado County Transportation Commission (EDCTC), as the Regional Transportation Planning Agency for El Dorado County, is involved in varied levels of ITS studies and plans to integrate ITS technology into the region. EDCTC has and continues to participate in a number of significant ITS efforts including the Statewide ITS Architecture and System Plan, the Sacramento Regional ITS Partnership, and the Tahoe Gateway Strategic Deployment Plan, all of which must conform with a broader, National ITS Architecture. These programs and plans are described in detail below. NATIONAL ITS ARCHITECTURE The Federal Highway Administration has produced a National ITS Architecture that provides a template, or framework, to assist individual states and regions with the development of their ITS Programs. In addition to the template, the National Architecture provides a consistent vocabulary to facilitate the communication between transportation professionals, and structured guidelines to aid in regional ITS development. In short, The National ITS Architecture provides a common structure for the design of Intelligent Transportation Systems. STATEWIDE ITS ARCHITECTURE AND SYSTEM PLAN In October 2004 Caltrans released the California ITS Architecture and System Plan. This plan was a direct offshoot of the Intelligent Transportation Systems Deployment Initiatives Project completed in The plan provides the link between existing and planned regional efforts within a statewide system resulting in a seamless, coordinated, and integrated transportation "system of systems," thus providing the traveling public access to ITS services across geographic regions and municipal jurisdictions. SACRAMENTO REGIONAL ITS PARTNERSHIP A Regional ITS Architecture is a plan that describes ITS deployment in terms of regional integration and cooperation among stakeholders within that region over a time period of generally ten to twenty years. The Sacramento Region ITS Partnership is an advisory committee made up of local and state transportation personnel. The Partnership meets on a monthly basis and identifies issues and opportunities for deploying ITS in the region. The Sacramento Area Council of Governments (SACOG) has been active in building consensus among the various agencies to support successful ITS projects and anticipates continued collaboration between Partnership members on future projects. Future Smart Corridors, the 511 Comprehensive Traveler Information Systems, initiated September 2004, and the Sacramento Transportation Area Network Regional Services are examples of ITS cooperative efforts that will be facilitated by this collaboration and partnership. CAPITOL VALLEY REGIONAL SERVICE AUTHORITY FOR FREEWAYS AND EXPRESSWAYS The Capitol Valley Regional Service Authority for Freeways and Expressways was established in October The Capitol Valley Regional Service Authority for Freeways and Expressways is a multi-county Chapter 12 Intelligent Transporta on Systems Page 106
111 Service Authority for Freeways and Expressways (SAFE) containing six counties: El Dorado, Sacramento, San Joaquin, Yolo, Yuba, and Sutter. SACOG provides staffing and management for SAFE. One of the projects administered by the SAFE is a multi-county call box system. The current call box system consists of approximately 1,500 call boxes located throughout the six-county service area. The Capitol Valley Regional Service Authority for Freeways and Expressways call box calls are routed to three different California Highway Patrol (CHP) dispatch facilities. Call boxes in Yuba and Sutter counties are answered by the Chico CHP; calls from El Dorado, Sacramento, and Yolo counties are answered at the Sacramento CHP; and calls from San Joaquin are answered by the Stockton CHP. SAFE also supports the Freeway Service Patrol program, discussed in Chapter 11, in cooperation with Caltrans and EDCTC. TAHOE GATEWAY INTELLIGENT TRANSPORTATION SYSTEMS STRATEGIC DEPLOYMENT PLAN The Tahoe Gateway Counties ITS Systems Strategic Deployment Plan, completed in 2002, involved a collaborative effort of the counties of Sierra, Placer, El Dorado, and Nevada. The Plan focuses efforts on an area of approximately 5,500 square miles and nearly 450,000 people. The Strategic Deployment Plan was adopted by the EDCTC on June 6, The Tahoe Gateway Counties regional ITS architecture was created as a consensus view of what ITS systems the stakeholders in the region have currently implemented and what systems they plan to implement in the future to improve mobility to and from the Tahoe region. SACOG is responsible for maintaining and updating the Tahoe Gateway Regional Architecture as required in coordination with the Tahoe Gateway Maintenance Team. The Tahoe Gateway ITS plan can be viewed here: The following ITS elements, which are defined in the glossary (Appendix J), are currently being used to some extent or are already programmed for implementation in the Tahoe Gateway Counties region. RAMP METERS Ramp meters at the El Dorado Hills Boulevard/US Highway 50 westbound on-ramp became operations in the summer of On US 50 there are twenty ramp meters planned for installation in El Dorado County. TRAFFIC MONITORING STATIONS Currently Caltrans operates 23 traffic monitoring stations along US Highway 50. CHANGEABLE OR DYNAMIC MESSAGE SIGNS (CMS/DMS) CMS/DMS are in use along I-80, US 50, SR 49, and SR 89. On US 50, there are four existing CMS/DMS including the Rural Safety Innovation Program safety improvement at US 50 and Still Meadows Road. Additionally, there are six more CMS/DMS planned in El Dorado County. HIGHWAY ADVISORY RADIO These devices are primarily found in the I-80 and US 50 Corridors. On US 50, three stations are in operation and three more are planned. ROAD WEATHER INFORMATION SYSTEMS (RWIS) Two RWIS are planned for US 50 east of Pollock Pines. TRAFFIC MANAGEMENT There is a Caltrans Traffic Management Center (TMC) in Rancho Cordova serving the greater Sacramento area. This center has full capabilities for management of the ITS elements in the I-80 and US 50 corridors throughout the Tahoe Gateway Region. The facility serves as the central control point for all of Northern California. It operates 24 hours a day, seven days a week. Sharing the facility is the CHP dispatch center. The location of these two agencies in a single building makes the facility a key element for transportation management. Chapter 12 Intelligent Transporta on Systems Page 107
112 TRAVELER INFORMATION In the Tahoe Gateway Region, there is one traveler information kiosk located on northbound U.S. 395 at the Sierra-Washoe County line. A variety of traveler information for state highways is also available through the Caltrans web site at and through Smart-Traveler at Telephone based traveler information systems are available in the study area. These include Caltrans Road Conditions GAS-ROAD ( ) and Travel Information in the Bay Area (area codes 415, 650, 408, 510, 925, 707) at In addition, the 511 Traveler Information System in the Sacramento Region will assist motorists with travel plans into and through El Dorado County. INTELLIGENT TRANSPORTATION SYSTEMS ACTION PLAN The Action Element of the RTP identifies short-term and long-term projects and activities that address regional transportation issues and needs. The federal conformity regulations (Title 40 CFR , Content of Transportation Plans) identify the short-term horizon as 2015 to 2025 and the long-term horizon as projects or activities 2025 and beyond. High priority ITS projects planned for El Dorado County fall into the short-term horizon, and projects with a Medium or Low priority are included in the long-term horizon. Estimated years of completion are not available for ITS projects listed in the action plan; therefore, cost estimates are shown in 2015 dollars. There are five overall strategies used to identify appropriate ITS strategies applicable to El Dorado County. Strategy 1: Communications Systems Improvement Strategy 2: Operational Improvements Advanced Traffic Management Systems Improvements Strategy 3: Automated Traveler Information System Improvement Strategy 4: System Integration Improvements Strategy 5: Rural Area Projects, Safety Improvements and Transit Vehicles The ITS Action Plan implements GOAL: TRANSPORTATION SYSTEMS MANAGEMENT, Objective B, of the Policy Element of this RTP, which pertains to ITS and reads as follows: Work with local jurisdictions and Caltrans to develop Intelligent Transportation System elements which enhance traveler information dissemination and help shape more efficient travel patterns and route alternatives. Tables 12-1 and 12-2 list planned projects for El Dorado County that were selected based upon these five strategies. Detailed project descriptions follow tables 12-1 and Chapter 12 Intelligent Transporta on Systems Page 108
113 TABLE 12-1: ITS Short-Term Action Plan ( ) Location Project Description Cost Local Communications Plan $100,000 Local Traffic Control System Procurement $250,000 Local Procure and deploy Portable Dynamic Message Signs (DMS) and Trailblazers $90,000 Local STARNET Integration $40,000 Local Continued Signal Coordination Improvements $50,000 Local Priority Corridor Deployment of ITS Latrobe Road/El Dorado Hills $900,000 Local Traffic Control System (TCS) Upgrade $30,000 Local Install Communication Phase II $200,000 Local El Dorado County Integration Project $400,000 Local Landslide Sensor Integration Project $60,000 Regional Highway Advisory Radio Deployment and Weather Stations integrate with Caltrans $6,500,000 Local Critical Intersection Improvements $5,000,000 Regional Traveler Information Dissemination Devices at Key Locations $300,000 Regional Web Page Development $100,000 Regional Upgrade Caltrans District 3 TMC to manage US 50, I-80 and other ITS Deployments $1,500,000 Local Placerville Signal System Technology Advances $800,000 Local Lower US 50 Freeway Management $500,000 Local US 50 Winter Traffic Management $250,000 Local US 50 Traveler Information $1,500,000 Local US 50 Surveillance $1,100,000 Local Implement/Expand AVI/AVL/CAD Technologies for Public Transit $600,000 TOTAL $20,270,000 TABLE 12-2: ITS Long-Term Action Plan ( ) Regional/ Project Description Local Local Continued Signal Coordination Improvements $50,000 Local Remote Traffic Control Workstation $8,000 Local Installation of CCTV $390,000 Local Long-Term Priority Corridor Deployment of ITS $900,000 Local Install bicycle detection at all major intersections $6,000 Local Install Ice Detection and Warning Systems $200,000 Local Install Downhill Speed Warning System on U.S. 50 Near Camino $100,000 Local Install Animal Vehicle Collision Avoidance Systems-Hwy 49 and US 50 $150,000 Local AVI/AVL For Emergency Vehicles $400,000 Local Install Rock/Mudslide and Avalanche Detection and Warning System $200,000 Regional Install ramp metering at all interchanges along US 50 NA Regional Install dynamic messaging signs along US 50 NA Regional Regional Incident/Emergency Management Plan NA Regional Portable Traffic Management Devices $350,000 Regional Medium-Term Regional ITS Plan Update $200,000 Regional Long-Term Regional ITS Plan Update $200,000 Local El Dorado County Capital Improvement Program: Future ITS Projects $5,833,211 (EDC CIP#31202) TOTAL $8,987,211 Cost Chapter 12 Intelligent Transporta on Systems Page 109


114 Financial Element Chapter 13 The Financial Element establishes the funding plan for transportation improvement projects and programs in El Dorado County which are included in the Action Element, Chapters 6 through 12 of the RTP. Project cost estimates used in this Financial Element are consistent with those included in the short-term and long-term action plans. The Financial Element includes a discussion of the following: explains the history of revenue sources and expenditures summarizes the project cost estimates of the short- and long-term action plans discusses the revenue projections from federal, state, and local sources compares project cost estimates and projected revenues identifies constrained and unconstrained project plans HISTORY OF REVENUES AND EXPENDITURES The El Dorado County Transportation Commission (EDCTC) allocates funds for a variety of transportation purposes, from constructing highway improvements and non-motorized facilities to maintaining local streets and roads to supporting transit services. Funding sources are often accompanied by rules and regulations guiding how funds may be allocated to specific projects. Figure 13-1 illustrates the programmed funding through EDCTC and surrounding jurisdictions over the period from Table 13-1 illustrates the expenditures and project delivery success from the RTP. FIGURE 13-1: EDCTC Funding Expenditure History by Mode ( ) Chapter 13 Financial Element Page 110
115 TABLE 13-1: RTP Delivery Success RTP Short-Term Action Plan ( ) Mode Projects Projects Delivered % of Total Regional Roadway Network % Transit % Aviation % Non-Motorized % Total % RTP Long-Term Action Plan (2021 and Beyond) Mode Projects Projects Delivered % of Total Regional Roadway Network % Transit % Total % SUMMARY OF PROJECT COST ESTIMATES Transportation project cost estimates identified in the Action Element of the Regional Transportation Plan total over $2.5 billion. This amount includes all projects listed in both the short-term and longterm action plans as well as the fiscally unconstrained list. Table 13-2 shows the estimated cost for both the short-term and long-term action plans for each transportation mode. This table is included to illustrate the magnitude of funding needed to enhance and maintain the entire El Dorado County transportation system. TABLE 13-2: Cost Estimates Regional Transportation Plan El Dorado County Regional Transportation Plan Cost Estimates (millions) Transportation Mode Short -Term Action Plan (2015 Dollars) Short-Term Action Plan (Nominal* Dollars) Long -Term Action Plan (2015 Dollars) Long-Term Action Plan (Nominal* Dollars) Regional Road Network $785,476,431 $918,510,749 $649,785,389 $1,163,115,846 Transit $100,124,153 $134,558,489 $95,089,000 $170,209,310 Aviation $13,497,160 $18,139,054 $4,318,000 $7,798,788 Freight Movement Component of the Regional Roadway Network Project Costs Non-Motorized Transportation $38,822,586 $51,183,830 $29,529,750 $53,334,013 Transportation Systems Management Component of the Regional Roadway Network, Non-Motorized, ITS Project Costs Intelligent Transportation Systems $20,270,000 $27,241,185 $11,587,211 $18,831,903 Total $958,190,330 $1,149,633,307 $790,309,350 $1,413,289,860 Source: SACOG Draft MTP *Nominal dollars include real dollars plus inflation Chapter 13 Financial Element Page 111
116 SUMMARY OF PROJECT COST ESTIMATES Transportation project cost estimates identified in the Action Element of the Regional Transportation Plan total over $2.5 billion. This amount includes all projects listed in both the short-term and long-term action plans as well as the fiscally unconstrained list. Table 13-2 shows the estimated cost for both the short-term and long-term action plans for each transportation mode. This table is included to illustrate the magnitude of funding needed to enhance and maintain the entire El Dorado County transportation system. ESTIMATED FUNDING REVENUES Preparing forecasts of anticipated transportation revenues is a challenging task due to the ever-changing transportation funding picture in California. A key task in the preparation of a long-range transportation funding TABLE 13-3: Estimated Funding Revenues (dollars adjusted for Inflation to 2035 (in millions) Anticipated Revenues (Adjusted for Inflation) Funding Applicable Uses Short Term Federal Programs CMAQ - Urban Regional Surface Transportation Program (RSTP) Combined Urban and Rural Roads, Transit, Non- Motorized, TDM, TCM Highways, Roads, Transit, Non-Motorized, TDM, TCM Long Term Total Annual Average $27.50 $41.70 $69.20 $3.46 $22.40 $33.90 $56.30 $2.82 Federal Discretionary Programs (ATP, TIGER, etc ) Highways, Roads, Transit $24.20 $40.50 $64.70 $3.24 FTA 5307 Urbanized Area Transit $6.10 $9.20 $15.30 $0.77 Formula FTA 5309 c Bus Allocations Transit $5.10 $7.70 $12.80 $0.64 FTA 5311 b Rural Transit $9.40 $14.20 $23.60 $1.18 Assistance Program State Programs SHOPP Highways, Bridges $ $ $ $14.66 STIP, RTIP, ITIP Shares Highways, Roads, $51.80 $94.30 $ $7.31 Non-Motorized State Highway Maintenance Highways, Roads $81.60 $ $ $9.09 California Aid to Airports Airports $0.67 $0.56 $1.23 $0.06 Freeway Service Patrol Highways $1.10 $1.10 $2.20 $0.11 STA Transit $13.30 $20.90 $34.20 $1.71 PTMISEA Transit $0.70 $0.00 $0.70 $0.04 Local Programs LTF Transit, Highways, Roads, $48.10 $72.80 $ $6.05 Non-Motorized Gas Tax Subventions Roads $47.60 $42.70 $90.30 $4.52 Gas Tax Swap (Excise Tax Roads $33.40 $65.40 $98.80 $4.94 Subventions) Transit Fares Transit $34.60 $63.20 $97.80 $4.89 Chapter 13 Financial Element Page 112
117 Local Programs (continued) Local Streets and Roads Roads, Transit, $ $ $1, $70.04 Non-Motorized Roads $16.50 $0.00 $16.50 $0.83 City of Placerville Sales Tax Measure (1/2 cent) Caltrans Discretionary Highways, Roads $26.40 $32.70 $59.10 $2.96 Total $1, $1, $2, $ Source: SACOG Draft MTP 2035 Forecast Source: El Dorado County CIP and City of Placerville CIP strategy is an assessment of revenue potentially available from existing federal and state programs and local sources. The revenue forecasts prepared for the Regional Transportation Plan were developed by Sacramento Area Council of Governments for the Draft 2035 Metropolitan Transportation Plan for the 20-year planning period extending through to Additionally, the currently adopted El Dorado County and City of Placerville Capital Improvement Programs and related financial forecasts are included in the local funding assumptions. There are three overarching funding sources for implementing the projects and programs included in the RTP. These include federal, state, and local funds. Table 13-3 illustrates the projected funding forecasts for years 2015 through FINANCIAL ASSUMPTIONS EDCTC works directly with SACOG and local jurisdictions to develop the financial forecasts used in the RTP. SACOG prepared the regional revenue forecasts as part of the Draft 2036 MTP update. Developing the revenue forecasts involves establishing the regional assumptions for the anticipated Federal, State, and Local transportation revenue that is expected to be realized during the planning horizon of This effort includes calculating the share of federal and state revenues that come to the Sacramento Region and ultimately the proportionate share of that revenue that is allocated to El Dorado County. Calculations were based upon the Draft 2036 MTP, historical precedence, and the Federal and State formulaic distribution mandates under the currently approved transportation legislation. All assumptions and growth rates are labeled as real and/or nominal. Real dollars indicate revenue before adding the impact of inflation. Nominal dollars include real dollars plus inflation. FEDERAL TRANSPORTATION REVENUE SOURCES Federal transportation funding is principally allocated through multi-year transportation funding laws. The Moving Ahead for Progress in the 21st Century Act (MAP-21), was signed into law by President Obama on July 6, MAP-21 provided funding for surface transportation programs at over $105 billion for fiscal years 2013 and MAP-21, currently under a legislative extension until July 31, 2015, is the first longterm highway authorization enacted since SAFETEA-LU which was approved in SAFETEA-LU expired in 2009 and was extended ten times until the approval of MAP-21. SAFETEA-LU guaranteed $244 billion for Fiscal Years 2007 to 2012 for highways and transit. MAP-21 set funding levels for highway and transit programs above $50 billion annually for Fiscal Years 2013 and While federal transportation funding is a large and important source of transportation revenues, it only accounts for about 25 percent of all government spending on highway and transit capital, maintenance, and operations. Thus, a larger share comes from state and local governments, for both transit and highways. MAP-21 is a milestone for the U.S. economy and the Nation s surface transportation program. By transforming the policy and programmatic framework for investments to guide the system s growth and development, MAP-21 creates a streamlined and performance-based surface transportation program and builds on many of the highway, transit, active transportation programs and policies established in previous legislation. MAP -21 revised the framework which Federal transportation funding is allocated and applied to transportation projects. Furthermore, MAP-21 differs from previous legislation in that it aims to place more emphasis on Chapter 13 Financial Element Page 113
118 efficient project delivery and performance measurement while removing Federal earmarks and improving the flexibility in the use of funds. MAP-21 s transition to performance and outcome-based requirements will require investments in projects to achieve outcomes which further the national transportation performance goals. The Federal highway program performance goals outlined in MAP-21 are: Safety To achieve a significant reduction in traffic fatalities and serious injuries on all public roads. Infrastructure condition To maintain the highway infrastructure asset system in a state of good repair. Congestion reduction To achieve a significant reduction in congestion on the NHS. System reliability To improve the efficiency of the surface transportation system. Freight movement and economic vitality To improve the national freight network, strengthen the ability of rural communities to access national and international trade markets, and support regional economic development. Environmental sustainability To enhance the performance of the transportation system while protecting and enhancing the natural environment. Reduced project delivery delays To reduce project costs, promote jobs and the economy, and expedite the movement of people and freight by accelerating project completion through eliminating delays in the project development and delivery process, including reducing regulatory burdens and improving agencies work practices. TABLE 13-4: MAP-21 Federal-Aid Highway Programs and Mass Transit Funding Levels (fiscal years ) CORE PROGRAMS DESCRIPTION AVERAGE ANNUAL FUNDING (Billions) National Highway Performance Program Provides funding to improve condition and performance of National Highway System, construct new facilities, and meet state performance targets. $21.8 Surface Transportation Program Highway Safety Improvement Program Congestion Mitigation and Air Quality Improvement Program Metropolitan Transportation Planning Flexible program to fund transit, bridges, tunnels, carpooling, maintenance, intelligent transportation systems, etc. Funding source for strategies, activities, and projects on a public road to correct or improve a hazardous road condition or address highway safety problem. Flexible funding source for transportation projects and programs to help meet the requirements of the Clean Air Act. Funding for MPOs to carry out the metropolitan transportation planning process. $10.0 $2.4 $2.2 $0.0 Transportation Alternatives Funding projects for pedestrians, bicyclists, recreational trails, safe routes to schools, etc. $0.8 Mass Transit 16 public transit specific programs managed by the Federal Transit Administration Source: $10.6 Chapter 13 Financial Element Page 114
119 Until MAP-21, SAFETEA-LU and prior legislation, authorization of transportation funding was constrained within programmatic modal focused silos. MAP-21 reduced these silos by both eliminating and/or defunding 12 highway programs and by consolidating 90 surface transportation programs into 30 programs housed within 6 core Federal-aid Highway programs plus 16 programs for mass transit. These core programs are highlighted in Table CONGESTION MITIGATION AND AIR QUALITY PROGRAM (CMAQ) The CMAQ Program was re-authorized with the passage of MAP-21. Funds are directed to transportation projects and programs which contribute to the attainment and maintenance of National Ambient Air Quality Standards in non-attainment or air quality maintenance areas for ozone, carbon monoxide, or particulate matter under provisions in the Federal Clean Air Act. As part of the Sacramento Valley air basin, which is in non-attainment for ozone, El Dorado County is eligible for CMAQ funds (refer to Chapter 14, Air Quality Conformity). Eligible CMAQ projects include public transit improvements; high occupancy vehicle lanes; Intelligent Transportation System Infrastructure; traffic management and traveler information systems (i.e., electric toll collection systems); employer-based transportation management plans and incentives; traffic flow improvement programs (signal coordination); fringe parking facilities serving multiple occupancy vehicles; shared ride services; bicycle and pedestrian facilities; flexible work-hour programs; outreach activities establishing Transportation Management Associations; fare/fee subsidy programs; and under certain conditions, Particulate Matter improvement projects. Key Assumptions: EDCTC will continue to receive CMAQ funds in a manner consistent with historical apportionments El Dorado County Program Level: $69.2 Million SURFACE TRANSPORTATION PROGRAM (STP) MAP-21 continues the STP to provide flexible funding that may be used by States and localities for projects to preserve or improve conditions and performance on any Federal-aid highway, bridge projects on any public road, facilities for active transportation, transit capital projects and public bus terminals and facilities. Fifty percent of a State s STP funds are to be distributed to areas based on population, known as Regional Surface Transportation Program (RSTP) funds which is what EDCTC and local jurisdictions receive. Also, a portion of its STP funds is to be set aside for bridges not on Federal-aid highways. Furthermore, a special rule is provided to allow a portion of funds reserved for rural areas to be spent on rural minor collectors. RSTP was established by the 1991 Federal Intermodal Surface Transportation Efficiency Act (ISTEA) and continued with the passage of MAP-21 in Of all the funding programs in MAP-21, RSTP is the most flexible. A broad variety of transportation projects and modes, including streets and roads, are eligible. Examples of projects eligible for RSTP include highway projects; bridges (including construction, reconstruction, seismic retrofit, and painting); transit capital improvements; carpool, parking, bicycle, and pedestrian facilities; safety improvements and hazard elimination; research; traffic management systems; surface transportation planning; transportation enhancement activities and control measures; and wetland and other environmental mitigation. Eighty percent of the apportionment is distributed among the urbanized and non-urbanized areas of the State through Metropolitan Planning Organizations and Regional Transportation Planning Agencies. The remainder goes directly to counties in a formula equal to 110% of the Federal Aid Urban/Federal Aid Secondary funding in place prior to Key Assumptions: EDCTC will continue to receive RSTP funds in a manner consistent with historical apportionments El Dorado County Program Level: $56.3 Million Chapter 13 Financial Element Page 115
120 TRANSPORTATION ALTERNATIVES PROGRAM (TAP) MAP-21 established a new program to provide for a variety of alternative transportation projects that were previously eligible activities under separately funded programs. This program is funded at a level equal to two percent of the total of all MAP-21 authorized Federal-aid highway and highway research funds, with the amount for each State set aside from the State s formula apportionments. Unless a State opts out, it must use a specified portion of its TAP funds for recreational trails projects. TAP consolidated the following programs: Recreational Trails Program Safe Routes to Schools Transportation Enhancements On September 26, 2013, Governor Brown signed legislation creating the Active Transportation Program (ATP). The ATP consolidates existing federal and state transportation programs, including the Transportation Alternatives Program (TAP), Bicycle Transportation Account (BTA), and State Safe Routes to School (SR2S), into a single program with a focus to make California a national leader in active transportation. The purpose of the ATP is to encourage increased use of active modes of transportation by achieving the following goals: Increase the proportion of trips accomplished by biking and walking Increase safety and mobility for non-motorized users Advance the active transportation efforts to achieve greenhouse gas reduction goals Enhance public health Ensure that disadvantaged communities fully share in the benefits of the program Provide a broad spectrum of projects to benefit many types of active transportation users Key Assumptions: EDCTC will receive TAP/ATP funds through a competitive process El Dorado County Program Level: Competitive NATIONAL HIGHWAY PERFORMANCE PROGRAM (NHPP) MAP-21 dramatically expands the funding for the NHPP program (previously called the National Highway System program) and consolidates the other programs intended for bridge repair and Interstate construction and maintenance. Only projects located on the expanded National Highway System are eligible. States are permitted to transfer up to 50 percent of the NHPP dollars to other programs, including the Surface Transportation Program (STP), Highway Safety Improvement Program (HSIP), and the Congestion Mitigation and Air Quality Improvement program (CMAQ). Key Assumptions: EDCTC will receive NHPP funding in a manner consistent with historical federal discretionary program El Dorado County Program Level: Included within Federal Discretionary Programs in Table 3-3. FEDERAL DISCRETIONARY PROGRAMS MAP-21 did away with most of the previous Federal Discretionary programs and rolled them into other legislation and/or consolidated programs. However, those which remain and those which potentially may be added to future legislation are considered for the purposes of the financial forecast concerning the RTP. Key Assumptions: EDCTC will continue to receive Federal Discretionary Program funds in a manner consistent with historical apportionments El Dorado County Program Level: $64.7 Million Chapter 13 Financial Element Page 116
121 FEDERAL TRANSIT ADMINISTRATION (FTA) The FTA provides the financial assistance to develop new transit systems and improve, maintain, and operate existing transit networks. FTA oversees funding to state and local transit providers through regional FTA offices. The FTA programs include: Section 5307 Urbanized Area Formula Grant Program This program funds routine capital investments, including bus purchases and small transit system operating expenses. FTA funds are allocated annually to urbanized areas, as defined by the most current Census (2010), according to the formula based on population, a portion goes to areas under 200,000, and a portion goes to areas over 200,000 persons. Section 5310 Elderly Persons and Persons with Disabilities Formula Program This program provides funds for transit service and programs to serve the special needs of transit dependent populations and enhance mobility of seniors and persons with disabilities. Funds are allocated through a competitive process. Section 5311 Rural Area Formula Program This program funds transit service in rural areas of a population less than 50,000 people and for operating and capital grants for intercity facilities and services. Section 5337 State of Good Repair This new formula-based State of Good Repair program is FTA s first stand-alone initiative written into law that is dedicated to repairing and upgrading the nation s rail transit system and high-intensity motor bus systems that use high-occupancy vehicle lanes. These funds reflect a commitment to ensuring transit operates safely, efficiently, reliably, and sustainably. Section 5339 Bus and Bus Facilities This program provides capital funding to replace and rehabilitate buses and related equipment. Funds are allocated both directly to transit agencies and distributed through a competitive process. Key Assumptions: EDCTC will continue to receive FTA funds in a manner consistent with historical apportionments El Dorado County Program Level: $51.5 Million HIGHWAY SAFETY IMPROVEMENT PROGRAM (HSIP) The HSIP was continued within MAP-21. The HSIP is a core highway safety improvement program that funds transportation safety enhancements on any public owned roadway or bicycle/pedestrian network. Key Assumptions: EDCTC will continue to receive HSIP funds in a manner consistent with historical apportionments El Dorado County Program Level: Competitive STATE TRANSPORTATION REVENUE SOURCES Within California transportation funding is a coordinated effort between the California State Legislature, California Transportation Commission (CTC), and Caltrans. Through the annual state budget cycle the Governor and Legislature appropriate funds for the transportation network. Furthermore, the Legislature may choose to identify and designate funding for transportation projects statutorily. The CTC consists of nine Governor appointed voting members, one appointed member each by the Senate Rules Committee and Speaker of the Assembly, and two non-voting ex-officio members. The CTC is responsible for: Recommending policies and funding priorities to the Legislature Providing project oversight for the state Adopting state transportation programs Approving projects nominated for funding by Caltrans and regional agencies. Chapter 13 Financial Element Page 117
122 The State Department of Transportation, or Caltrans, supports the transportation network primarily through planning, design, construction, and maintenance. Caltrans is also responsible for developing the interregional transportation capital improvement projects for consideration by the CTC. Caltrans works closely with Federal and local agencies to advance the transportation network of the state. In addition to the state agencies which are involved with transportation, there are 110 federally recognized tribes, and many non-recognized tribes residing in the state that have transportation needs. Tribal governments establish plans and policies that are used to prioritize projects through tribal transportation improvement plans, making them eligible for federal funding. The state transportation network receives funding from federal, state, local governments, and private investments. Regional and local governments provide approximately 49% in transportation funding, whereas, the state provides 27% and the federal government provides 24%. The state collects transportation revenue through a variety of means which include: State Fuel Excise Tax: As of July 1, 2014, California collects 36 /gallon excise tax on gasoline and 11 /gallon on diesel fuel generating approximately $3.0 billion a year. More recently the State BOE voted unanimously February 24 to set the rate to reflect a 6-cent reduction. The new rate of 30 cents per gallon will take effect July 1, State Sales Tax: As of January 2013, the Board of Equalization (BOE) collects a 6.50% state base sales and use tax and a 1% local uniform tax totaling to a statewide tax rate of 7.50%. The Transportation Development Act (TDA) allows each county to impose a 0.25% sales tax for transportation purposes through the Local Transportation Fund (LTF). The Public Transportation Account (PTA) provides funding for local transit, as outlined in the Transportation Development Act. The sole source of revenue for this Account is from the state sales tax on diesel fuel. The sales and use tax on diesel fuel is an additional 1.75% on top of the base sales tax (7.50%) for FY and thereafter according to Revenue and Taxation Code , , and The additional 1.75% on top of base sales tax on diesel fuel is dedicated to State Transit Assistance fund (STA) for operation and capital purposes. Truck Weight Fees: The state collects commercial vehicle weight fees generating approximately $900 million a year. Fees are collected and deposited into the State Highway Account then transferred to the general fund to pay for transportation debt of previous bond measures. Local and Other Funds: Local sales tax measures, the Transportation Development Act, transit fares, and other funding sources provide additional funding for various transportation purposes. Local Sales Tax Measures: Counties are allowed to adopt a sales tax increase for transportation programs, subject to two-thirds local voter approval. Transportation Development Act (TDA): Provides local agencies with funding for transportation and transit purposes through the LTF and the STA. Local General Funds and Other Local Funds: This includes property taxes, developer fees, street assessments, bonds, fines, and forfeitures. Motor Vehicle License and Other Fees: The state also collects vehicle license, registration, and driver license fees. STATE TRANSPORTATION IMPROVEMENT PROGRAM (STIP) The STIP is a five-year multimodal program which is funded through the State Highway Account and other sources. All STIP projects must be capital projects (including project development costs) needed to improve transportation. These projects generally include, but are not limited to, improving state highways, local roads, public transit, intercity rail, pedestrian and bicycle facilities, grade separations, transportation system management, transportation demand management, sound walls, intermodal facilities, safety, and environmental enhancement and mitigation. STIP funding is split into two programs, 25% to the Interregional Transportation Improvement Program (ITIP) for projects nominated by Caltrans, and 75% to County Shares for the State s 58 counties for projects nominated in each county s Regional Transportation Improvement Program (RTIP). The overall STIP is Chapter 13 Financial Element Page 118
123 adopted by the California Transportation Commission, which can accept or reject each RTIP and ITIP in its entirety. Key Assumptions: ITIP will continue to receive 25% and RTIP will continue to receive 75% of the total STIP allocations from the Highway Trust Fund, State Highway Account, Public Transportation Account, and the new excise tax on gasoline. The recent BOE adjustment to the tax is expected to reduce near-term STIP funding levels. El Dorado County Program Level: $146.1 Million STATE HIGHWAY OPERATIONS AND PROTECTION PROGRAM (SHOPP) The SHOPP is a ten-year program developed by Caltrans for the expenditure of transportation funds for major capital improvements that are necessary to preserve and protect the state highway system. Projects included in the SHOPP are limited to capital improvements relative to maintenance, safety, and rehabilitation of state highways and bridges which do not add capacity to the system. Key Assumptions: Based on transfers from the State Highway Account, Federal Trust Fund, and the excise tax on gasoline. The recent BOE adjustment to the tax is expected to reduce nearterm SHOPP funding levels. El Dorado County Program Level: $293.1 Million ACTIVE TRANSPORTATION PROGRAM (ATP) As discussed under Federal Transportation the ATP consolidates existing federal and state transportation programs, including the Transportation Alternatives Program (TAP), Bicycle Transportation Account (BTA), and State Safe Routes to School (SR2S), into a single program with a goal to make California a national leader in active transportation. The purpose of the ATP is to encourage increased use of active modes of transportation by achieving the following goals: Increase the proportion of trips accomplished by biking and walking Increase safety and mobility for non-motorized users Advance the active transportation efforts to achieve greenhouse gas reduction goals Enhance public health Ensure that disadvantaged communities fully share in the benefits of the program Provide a broad spectrum of projects to benefit many types of active transportation users Key Assumptions: EDCTC will continue to receive ATP funds in a manner consistent with historical apportionments which align with the funding programs contained within the ATP El Dorado County Program Level: Competitive STATE TRANSIT ASSISTANCE (STA) FUND In addition to the LTF, the Transportation Development Act of 1971 also established a program of direct subvention for transit services through state generated funding, known as the Public Transportation Account. Funds are allocated through the annual state budget. Distribution is calculated by the State Controller and administered by the regional transportation planning agency. Funds are distributed under Section of the Public Utilities Code based on population, and under Section based on the fares generated by the various transit operators. Key Assumptions: STA will receive $ $387,798,000 million statewide for FY2015/2016. Beginning in FY and thereafter, 75% of diesel sales tax revenues are transferred from the PTA to STA. El Dorado County Program Level: $34.3 Million Chapter 13 Financial Element Page 119
124 STATE HIGHWAY MAINTENANCE State Highway Maintenance provides funding to support maintenance efforts on the state highways and roadways. Key Assumptions: State Highway Maintenance will continue to receive transfers from the State Highway Account at an escalating rate indexed to inflation. El Dorado County Program Level: $181.8 Million CALIFORNIA AID TO AIRPORTS PROGRAM (CAAP) The CAAP encompasses three different programs administered by Caltrans Division of Aeronautics. These include discretionary grants for capital improvements, annual grants of $10,000 each to general aviation airports, and matching funds for Federal Aviation Administration (FAA) grants. Key Assumptions: El Dorado County Airports will continue to receive CAAP funds in a manner consistent with historical apportionments El Dorado County Program Level: $300,000 CAAP El Dorado County Program Level: $500,000 AIP FREEWAY SERVICE PATROL (FSP) The El Dorado County FSP program is administered by the California Highway Patrol (CHP), Caltrans, and EDCTC. Funding is allocated formulaically based upon lane miles, population, and congestion. The FSP serves to mitigate congestion along primary corridors. Key Assumptions: EDCTC will continue to receive FSP funds in a manner consistent with historical apportionments El Dorado County Program Level: $2.2 Million LOCAL TRANSPORTATION REVENUE SOURCES LOCAL TRANSPORTATION FUND (LTF) The Transportation Development Act (TDA) of 1971 added one-quarter percent to the statewide sales tax to fund transit services throughout the state. This funding, known as the Local Transportation Fund, are returned to the county of origin for use to operate the transit systems in that area. The funds are administered by the regional transportation planning agency in accordance with TDA regulations. While the primary focus of the LTF is transit service, there are provisions for use of the funds for other transportation modes. For example, under Section of the TDA statute, regions may elect to set aside up to two percent of the LTF for pedestrian and bicycle projects. In regions with less than 500,000 in population, some funds may also be used for street and road purposes upon completion of an annual unmet transit needs process. Key Assumptions: one quarter percent general sales tax for transportation will remain in place at existing rate. El Dorado County Program Level: $120.9 Million GAS TAX SUBVENTIONS Gas tax revenues are generated through a 36 cent per gallon excise tax on motor fuel imposed by the State of California. Gas tax funds are distributed to cities and counties formulaically to be used for street and road maintenance. Subventions are expected to continue for local jurisdictions based on existing formulas. Key Assumptions: Subventions will continue to flow to cities and counties based on existing formulas. El Dorado County Program Level: $90.3 Million Chapter 13 Financial Element Page 120
125 GAS TAX SWAP (Gasoline Excise Tax Subvention) Forty-four percent of the new gasoline excise tax is directed to local jurisdictions to support street and road maintenance to replace decreased Proposition 42 funding. The state will annually adjust the excise tax to account for the decreased gasoline sales tax. Key Assumptions: The state will adjust the excise tax annually to compensate for the loss of the gasoline sales tax. El Dorado County Program Level: $98.8 Million TRANSIT FARES Funds generated by passenger fares on transit are used to help fund that transit system. Under the requirements of the TDA, fares must generate at least 10% of the operating revenue for rural transit systems and 20% for others. Key Assumptions: Transit fare forecasts are based on historical average fare box recovery, projected vehicle service hours, and operating costs per vehicle service hours. El Dorado County Program Level: $97.8 Million CALTRANS DISCRETIONARY PROGRAMS The Federal Highway Administration administers discretionary programs through its various offices and with the assistance of Caltrans. Discretionary programs, such as the ATP, TIGER, etc, represent special funding categories where Caltrans solicits for candidates and selects projects for funding based on applications received. Each program has its own eligibility and selection criteria that are established by law, by regulation, or administratively. Key Assumptions: Assume 5% of statewide total goes to the SACOG region. El Dorado County Program Level: $59.0 Million LOCAL STREETS AND ROADS FUNDS At the discretion of the City Council or El Dorado County Board of Supervisors, City and County general funds, Traffic Impact Mitigation (TIM) fees, and other funding generated primarily from property and local sales taxes may be used to augment transportation funding. Under state law, jurisdictions may impose fees on development that mitigate their impacts on local services. One common TIM fee is for traffic generated by new development along the existing transportation system. TIM fees are supported by a traffic study that establishes a nexus between necessary roadway improvements and the new traffic generated by the development, as required by AB For a complete list of these projects, please contact the appropriate jurisdiction. With high demand on such funds, and generally low availability, general funds are not considered a strong source of transportation funding. Key Assumptions: Based on ten-year historical average of budget information provided by local jurisdictions to the California State Controller. Contains all revenues from local sources dedicated to local streets and roads. El Dorado County Program Level: $1.4 Billion PROJECT EXPENDITURE AND ESTIMATED REVENUE COMPARISON Projected expenditures associated with the Regional Transportation Plan must be constrained within the anticipated revenues. In Table 13-4 the short-term and long-term action plans for each mode are compared with the anticipated revenues for the timeframe. Table 13-4 shows a nominal surplus in both the short-term and long-term planning horizons. It is assumed that reasonably available forecasted revenue is sufficient over the entire planning period to fund programmed and planned improvements. Pursuant to the 2010 California RTP Guidelines all project cost estimates are adjusted in this financial comparison for year of expenditure Dollars for those projects which have completion year estimates available. The annual forecast inflation factors provided by SACOG were used to estimate year of expenditure dollars for those Chapter 13 Financial Element Page 121
126 projects which do not have year of completion estimates. All year of expenditure cost estimates are adjusted to be consistent with SACOG financial forecast projections. TABLE 13-5: Expenditure Estimates and Estimated Revenue Comparison (Dollars adjusted for inflation to 2035 in millions) Transportation Mode Short-Term Action Plan (Nominal Dollars) Long-Term Action Plan (Nominal Dollars) Regional Road Network $918,510,749 $1,163,115,846 Transit $134,558,489 $170,209,310 Aviation $18,139,054 $7,798,788 Freight Movement N/A Non-Motorized Transportation $51,183,830 $53,334,013 Transportation Systems Management N/A Intelligent Transportation Systems $27,241,185 $18,831,903 Total Expenditures $1,149,633,307 $1,413,289,860 Total Estimated Revenues $1,204,970,000 $1,580,460,000 Revenue/Expenditure Comparison $55,336,693 $167,170,140 Source: SACOG Draft MTP 2035 Forecast REGIONAL ROAD NETWORK Revenue sources applicable to funding regional road network projects are included in Table The estimate of expenditures for the regional road network short-term action plan (Table 6-5 of Chapter 6) is $918.5 Million in nominal dollars. The list of projects reflects identified safety, bridge, maintenance and other projects on US50, SR49, and regionally significant projects within El Dorado County and the City of Placerville. It also includes all projects listed in the City of Placerville and El Dorado County Traffic Impact Mitigation Fee programs. The short-term and long-term regional road network action plans are consistent with the El Dorado County Regional Transportation Improvement Program (Tables 6-1 and 6-2 of Chapter 6 of the RTP), the El Dorado County General Plan, and the City of Placerville General Plan. TRANSIT Revenue sources applicable to funding transit projects are included in Table The estimate of expenditures to support transit operations and maintenance and to implement the short-term action plan, (Table 7-4) is $ The list of projects reflects the Western El Dorado County Short-Range Transit Plan and maintains current service levels throughout the planning horizon. The transit long-term action plan (Table 7-5) includes several projects for which estimates have not yet been developed. The list of projects reflects the Western El Dorado County Long-Range Transit Plan. AVIATION The three airports included in this RTP are in the FAA s National Plan of Integrated Airport Systems (NPIAS). Being a NPIAS airport qualifies an airport to apply for the FAA s Airport Improvement Program (AIP) grants. Additional information on the NPIAS can be found at: Revenue sources applicable to funding aviation projects are included in Table The estimate of expenditures to support the Cameron Park, Georgetown, and Placerville Airport operations (Tables 8-3, 8-4, and 8-5) is $18.1 Million, funded with a combination of California Aid to Airports Program funds, special district funds and user fees. The short-term and long-term action plan is consistent with the Cameron Park, Georgetown, and Placerville Airport Master Plans. Chapter 13 Financial Element Page 122
127 FREIGHT MOVEMENT Revenue sources applicable to funding freight movement functions, and associated projects, are reflected in the regional road network, transit, aviation, and intelligent transportation systems short- and long-term action plans. NON-MOTORIZED TRANSPORTATION Revenue sources applicable to funding non-motorized transportation projects are included in Table The estimate of expenditures for non-motorized transportation short-term action plan (Table 10-3 of Chapter 10) is $51.2 Million. Expenditures to implement the short-term, non-motorized transportation action plan are funded with a combination of ATP funds, Regional Surface Transportation Program funds, Congestion Mitigation and Air Quality funds, Transportation Development Act funds, and other sources. The non-motorized transportation long-term action plan does not include expenditure estimates. TRANSPORTATION SYSTEMS MANAGEMENT Revenue sources applicable to funding Transportation Systems Management functions, and associated projects, are reflected in the regional road network, transit, non-motorized and intelligent transportation systems short-term and long-term action plans. INTELLIGENT TRANSPORTATION SYSTEMS Revenue sources applicable to funding Intelligent Transportation Systems projects are included in Table Federal Discretionary Programs, as well as traditional regional road network fund sources, are the most likely sources to fund these systems. The estimate of expenditures for the intelligent transportation systems short-term action plan (Table 12-1 of Chapter 12) is $27.3 Million. The short-term and long-term action plans are consistent with the El Dorado County ITS Master Plan. PLANNING AND ADMINISTRATION Revenue sources applicable to funding EDCTC s planning and administration are included in Table Planning and administration includes the operations of the EDCTC office and the planning efforts for which EDCTC staff is responsible. It also includes collaborative efforts with adjacent jurisdictions and partner agencies. The estimate of expenditures for the Planning and Administration during the planning period is $30.4 Million. SUMMARY The Regional Transportation Plan identifies a new list of projects. Based on the revenue and expenditure analysis derived from the SACOG Draft 2035 MTP and local jurisdiction forecast, the El Dorado County region will have the necessary funds to implement all of the regions identified transportation projects during the 20-year horizon of this plan. In 2014, a collaborative effort between statewide transportation agencies, local municipalities, and transportation professionals developed the California Statewide Local Streets and Roads Needs Assessment. The Assessment identified a total statewide funding need of $108 billion over the next ten years, and a shortfall of $56.1 billion for pavements, $20.9 billion for essential components and $1.3 billion for bridges. The total shortfall is $78.3 billion over the next ten years. Table 13-5 represents the unconstrained, or unfunded, projects listed in the RTP and includes those projects which have been identified to meet the future demand beyond Chapter 13 Financial Element Page 123
128 TABLE 13-6: Unfunded Projects (nominal dollars in millions) Project Description Cost Responsible Agencies Estimate Cold Springs Road Connection to Placerville Drive and Pierroz $3,865,000 City of Placerville, EDCTC Road reconfiguration Emigrant Ravine Road Extension Clay Street to Carson Road $15,422,000 City of Placerville, EDCTC Main Street Realignment at Spanish Ravine Road Washington $8,121,768 Caltrans, EDCTC Street to Broadway Mallard Lane Extension to Placerville Drive $3,756,000 City of Placerville, EDCTC Mallard Lane/Ray Lawyer Drive Extension connecting to Mallard at Placerville Drive and connecting Mallard to Green Wing and Green Valley Road $10,785,362 Caltrans, City of Placerville, EDCTC Mosquito Road Interchange $60,000,000 Caltrans, EDCTC Ray Lawyer Forni Road to SR 49 Parallel Capacity Improvements $40,000,000 El Dorado County, Caltrans, EDCTC Ray Lawyer Drive Extension-West $16,046,000 City of Placerville, EDCTC U.S. 50/Cambridge Road Interchange Improvements Phase 1 $7,843,000 El Dorado County, Caltrans U.S. 50/Cambridge Road Interchange Improvements Phase 2 $11,935,000 El Dorado County, Caltrans US 50 WB Auxiliary Lane in Placerville, from west of Coloma Road $20,000,000 Caltrans offramp to the Placerville Drive offramp, (PM /17.778) US 50/Cameron Park Drive Interchange Improvements $47,626,000 El Dorado County, Caltrans Washington Street and Turner Street Widening $9,458,060 City of Placerville, EDCTC Western Placerville Interchanges Phase 3 US 50 Interchange and $23,524,651 City of Placerville, EDCTC operational improvements at Placerville Drive and Forni Road/Fair Lane TOTAL $278,382,841 FUNDING STRATEGY CONCEPTS The financial projections do not keep pace with the significant transportation infrastructure improvements necessary to address the existing multi-modal needs in El Dorado County. This section of the Financial Element presents options that El Dorado County could consider in order to obtain additional revenues. Several funding mechanisms are introduced; however, the funding strategies are presented for information purposes and are not presented as recommendations for the Regional Transportation Plan. LOCAL TRANSPORTATION SALES TAX Since 1984, state law has permitted counties to impose a sales tax dedicated to transportation purposes with the approval of a majority of the county voters. Approximately 17 counties passed transportation sales taxes between 1984 and 1994, generating billions of dollars for transportation purposes in those counties. In 1995, however, it was determined by the State Supreme Court that transportation sales taxes were special taxes and under Proposition 62, would require a two-thirds majority vote. As of the November 2014 election, 19 counties have passed a local transportation sales tax. The estimated annual sales tax is $3.79 billion. LOCAL OPTION MOTOR VEHICLE FUEL TAX The State raised the gas tax through the passage of Proposition 111 in The California gasoline tax is now at 52 cents per gallon, while the Federal gasoline tax remains at 18 cents per gallon. Senate Bill 215 authorizes counties to hold an election to tax local sales of gasoline. An increase in fuel tax requires a two-thirds approval of the general electorate. The statutes do not limit the amount of tax increase that may be voted upon. One advantage to a motor vehicle fuel tax is that it is user-oriented. Fuel consumption is related to roadway use, thus users bear the burden of costs commensurate with their use. Chapter 13 Financial Element Page 124
129 PUBLIC/PRIVATE PARTNERSHIPS Public/private partnerships involve cooperative development of projects involving the efforts of a private company and a public agency. Examples of joint development include the private development of a public facility, cooperative financing of public facilities, transfer of development rights, and density bonuses. The legal basis for joint development depends on the circumstances of the agreement; however, generally the authority to require dedication of land or exactions as a condition of development derives from the agency s police power to protect public interests. PEAK HOUR CONGESTION PRICING This is a fee charged to those using transportation facilities during the peak period. As a user charge, it is neither a tax nor a toll and, therefore, not subject to state or federal tax restrictions. Congestion pricing, while raising additional funds, has secondary benefits for transportation systems. The imposition of user charges creates a disincentive to the use of transportation systems during peak periods. This provides motivation for transportation system users to spread their use to non-peak periods. As a result, the system demand is more evenly distributed, thus creating greater efficiency of use. BOND MEASURES Cities and counties may issue general obligation bonds payable through increased property taxes by a two-thirds majority vote of the general electorate. These bonds may be used to fund government services, including transportation improvements. ROAD USER CHARGE PROPOSAL The California Road Charge Technical Advisory Committee was established in 2014 by Senate Bill 1077 (Chapter 835, Statutes of 2014). SB 1077 created the California Road Usage Charge Pilot Program and tasked the Chair of the Commission, in consultation with the California State Transportation Agency (CalSTA) to convene a fifteen member Technical Advisory Committee (TAC) to study road usage charge alternatives to the gas tax, gather public comment, and make recommendations to CalSTA regarding the design of a road usage charge pilot program. The TAC may also make recommendations on the criteria to be used to evaluate the pilot program. CalSTA is charged with implementing a pilot program by January 1, 2017 and reporting its findings on the pilot program to the TAC, the Commission, and the appropriate policy and fiscal committees of the Legislature by June 30, Chapter 13 Financial Element Page 125
130 Air Quality Conformity Chapter 14 REGULATORY STRUCTURE AND RESPONSIBILITIES Responsibility for air quality planning involves a wide variety of agencies and groups at the federal, state, regional, and local levels. Some of these agencies have actual regulatory authority, while others are responsible for development and implementation of programs and procedures aimed at reducing air pollution levels. The U.S. Environmental Protection Agency (EPA) is the lead federal agency responsible for setting the National Ambient Air Quality Standards (NAAQS) and for establishing federal motor vehicle emission standards. The EPA also has the authority under the Clean Air Act to require preparation of state plans for air quality and may approve or disapprove state air quality plans. The California Air Resources Board (CARB) is the lead state agency responsible for setting the California Ambient Air Quality Standards (CAAQS) and for preparing and submitting a state air quality plan to EPA. In preparing the state plan, CARB reviews and approves regional air quality plans and then incorporates them into a State Implementation Plan (SIP). Air Districts have primary responsibility for preparation, adoption, and implementation of stationary, and area emission control measures. In El Dorado County, the El Dorado County Air Quality Management District is in the Sacramento Air Quality Management Area. The Sacramento Area Council of Governments (SACOG) is the designated Metropolitan Planning Organization for the Sacramento Metropolitan Area. SACOG also has responsibility for making findings of conformity required under section 176(c) of the federal Clean Air Act within the Sacramento Federal Non-attainment Area (SFNA) for ozone and PM standards. Senate Bill 375 (SB 375), which went into effect in 2009, added statutes to the California Government Code to encourage planning practices that create sustainable communities and reduce greenhouse gas (GHG) emissions. SB 375 calls for each Metropolitan Planning (MPO) organization to prepare a Sustainable Communities Strategy (SCS) as an integrated element of the Metropolitan Transportation Plan (MTP). The SCS is intended to show how integrated land use and transportation planning can lead to lower GHG emissions from autos and light trucks. The Sacramento Area Council of Governments (SACOG) serves as the MPO for the greater Sacramento region which includes the West Slope of El Dorado County, the area in which EDCTC has jurisdiction. SACOG works closely with EDCTC to incorporate the RTP into the MTP/SCS to ensure the region meets those GHG reduction targets. Sustainability is defined as simultaneously meeting current economic, environmental, and community needs, while ensuring that the ability of future generations to meet their needs is not jeopardized. A prosperous economy, a healthy environment, and social equity are described as the Three E s of sustainability. Furthermore, many state, regional, and local governments are beginning to explore how potential climate change impacts could affect their natural and man-made resources. Damage to transportation infrastructure from extreme weather events can be physically and fiscally difficult to repair. As part of the SACOG region El Dorado County s west slope and this RTP fall within SACOG Sacramento Region Climate Adaptation Plan found here Transportation strategies contained in the RTP investing in public transit system, managing transportation demand, making transportation system improvements, and continuing to expand and improve bike and pedestrian facilities are major components of this strategy. Chapter 14 Air Quality Conformity Page 126
 The MCAB, an area of approximately 11,000 square miles, consists of Plumas, Sierra, Nevada, Amador, Calaveras, Tuolumne, and Mariposa counties, in addition to the west slope of")

131 ENVIRONMENTAL SETTING El Dorado County includes portions of two California air basins: Mountain Counties (MCAB), and Lake Tahoe (LTAB). (Refer to Figure 14-1) The MCAB, an area of approximately 11,000 square miles, consists of Plumas, Sierra, Nevada, Amador, Calaveras, Tuolumne, and Mariposa counties, in addition to the west slope of El Dorado County and the central portion of Placer County. The majority of the MCAB is located in the northern Sierra Nevada area with the western boundary of the basin extending into the Sacramento Valley. The portion of El Dorado County within the MCAB is the area in which EDCTC has jurisdiction. The LTAB consists of the eastern portion of El Dorado County, the eastern portion of Placer County, and Lake Tahoe. The LTAB is defined by the area within the 7,000-foot contour, which is continuous around the lake, and Tahoe City. The Tahoe Metropolitan Planning Organization has jurisdiction over the portion of El Dorado County within the LTAB. The MCAB falls within the broader boundary of the Sacramento Federal Nonattainment Area (SFNA) for which SACOG air quality conformity responsibility. MAP 14-1: Air Basins and Air Quality Monitoring Station Locations Chapter 14 Air Quality Conformity Page 127
4. ENVIRONMENTAL IMPACT ANALYSIS 9. TRANSPORTATION AND TRAFFIC
 4. ENVIRONMENTAL IMPACT ANALYSIS 9. TRANSPORTATION AND TRAFFIC 4.9.1 INTRODUCTION The following section addresses the Proposed Project s impact on transportation and traffic based on the Traffic Study
Basalt Creek Transportation Refinement Plan Recommendations
 Basalt Creek Transportation Refinement Plan Recommendations Introduction The Basalt Creek transportation planning effort analyzed future transportation conditions and evaluated alternative strategies for
Circulation in Elk Grove includes: Motor vehicles, including cars and trucks
 Circulation, as it is used in this General Plan, refers to the many ways people and goods move from place to place in Elk Grove and the region. Circulation in Elk Grove includes: Motor vehicles, including
Corpus Christi Metropolitan Transportation Plan Fiscal Year Introduction:
 Introduction: The Safe, Accountable, Flexible, Efficient Transportation Equity Act: A Legacy for Users (SAFETEA-LU) has continued the efforts started through the Intermodal Surface Transportation Efficiency
TRANSIT & NON-MOTORIZED PLAN DRAFT FINAL REPORT Butte County Association of Governments
 1 INTRODUCTION Maintaining a high quality of life is the essence of this plan for transit and non-motorized transportation in Butte County. Curbing greenhouse gas emissions (GHG) by reducing congestion,
Transportation Master Plan Advisory Task Force
 Transportation Master Plan Advisory Task Force Network Alternatives & Phasing Strategy February 2016 BACKGROUND Table of Contents BACKGROUND Purpose & Introduction 2 Linking the TMP to Key Council Approved
2040 RTP. Chapter 6: Investments in our Transportation Future
 2040 RTP Chapter 6: Investments in our Transportation Future This chapter describes the transportation investments proposed for the San Benito region that support the goals and objectives of the Regional
Bicycle Master Plan Goals, Strategies, and Policies
 Bicycle Master Plan Goals, Strategies, and Policies Mobilizing 5 This chapter outlines the overarching goals, action statements, and action items Long Beach will take in order to achieve its vision of
Exhibit 1 PLANNING COMMISSION AGENDA ITEM
 Exhibit 1 PLANNING COMMISSION AGENDA ITEM Project Name: Grand Junction Circulation Plan Grand Junction Complete Streets Policy Applicant: City of Grand Junction Representative: David Thornton Address:
MCTC 2018 RTP SCS and Madera County RIFP Multi-Modal Project Eval Criteria GV13.xlsx
 MCTC 8 RTP SCS and Madera County RIFP Multi-Modal Project Eval Criteria GV.xlsx Madera County Transportation Commission Regional Transportation Plan / Sustainable Communities Strategy Multi-Modal Project
Solana Beach Comprehensive Active Transportation Strategy (CATS)
") Solana Beach Comprehensive Active Transportation Strategy (CATS) 3.0 Goals & Policies The Solana Beach CATS goals and objectives outlined below were largely drawn from the Solana Beach Circulation Element
Solana Beach Comprehensive Active Transportation Strategy (CATS) 3.0 Goals & Policies The Solana Beach CATS goals and objectives outlined below were largely drawn from the Solana Beach Circulation Element
TABLE OF CONTENTS. Executive Summary
 Executive Summary Background... ES-1 Pedestrian Network... ES-2 Bikeway Network... ES-2 Collision History... ES-2 Public Input... ES-4 Conclusions and Recommendations... ES-4 1. Introduction and Setting
SANTA CLARA COUNTYWIDE BICYCLE PLAN August 2008
 SANTA CLARA COUNTYWIDE BICYCLE PLAN August 2008 To assist VTA and Member Agencies in the planning, development and programming of bicycle improvements in Santa Clara County. Vision Statement To establish,
New Measure A Expenditure Categories DEFINITIONS OF ELIGIBLE EXPENDITURES Adopted March 8, 2007
 New Measure A Expenditure Categories DEFINITIONS OF ELIGIBLE EXPENDITURES Adopted March 8, 2007 City Street and County Road Maintenance Program The preservation and keeping of public street and road rights-of-way
APPROVE A RESOLUTION ADOPTING A COMPLETE STREETS POLICY
 STAFF REPORT MEETING DATE: September 13, 2016 TO: FROM: City Council Bob Brown, Community Development Director Russ Thompson, Public Works Director Patrick Filipelli, Management Analyst 922 Machin Avenue
2014 Capital Improvement Program Current Year Projects for:
 2014 Capital Improvement Program Current Year Projects for: West Slope Road/Bridge Capital Improvement Program Tahoe Environmental Improvement Program Airport Capital Improvement Program Transportation
CITY OF COCOA BEACH 2025 COMPREHENSIVE PLAN. Section VIII Mobility Element Goals, Objectives, and Policies
 CITY OF COCOA BEACH 2025 COMPREHENSIVE PLAN Section VIII Mobility Element Goals, Objectives, and Policies Adopted August 6, 2015 by Ordinance No. 1591 VIII MOBILITY ELEMENT Table of Contents Page Number
2045 Long Range Transportation Plan. Summary of Draft
 2045 Long Range Transportation Plan Summary of Draft Fredericksburg Area Metropolitan Planning Organization The George Washington Region includes the City of Fredericksburg and the counties of Caroline,
Proposed. City of Grand Junction Complete Streets Policy. Exhibit 10
 Proposed City of Grand Junction Complete Streets Policy Exhibit 10 1 City of Grand Junction Complete Streets Policy Vision: The Complete Streets Vision is to develop a safe, efficient, and reliable travel
I-105 Corridor Sustainability Study (CSS)
") I-105 Corridor Sustainability Study (CSS) Metro Streets and Freeways Subcommittee March 21, 2019 Gary Hamrick Cambridge Systematics, Inc. I-105 CSS Project History & Background Funded by Caltrans Sustainable
I-105 Corridor Sustainability Study (CSS) Metro Streets and Freeways Subcommittee March 21, 2019 Gary Hamrick Cambridge Systematics, Inc. I-105 CSS Project History & Background Funded by Caltrans Sustainable
Best Southwest Transportation Committee. North Central Texas Council of Governments Transportation Department
 Best Southwest Transportation Committee North Central Texas Council of Governments Transportation Department The The Regional Regional Veloweb Veloweb Review Review NCTCOG Bicycle and Pedestrian Program
FUNDING SOURCES CHAPTER 6
 CHAPTER 6 6.1 BICYCLE 6.1.1 Local 6.1.2 Regional 6.1.3 State 6.1.4 Federal 6.1.5 Public Facilities 6.1.6 Bicycle Registration and Licensing Fees 6.1.7 Summary Table 6.1 of Bicycle Funding Sources 6 2 6.2
ACTIVE TRANSPORTATION/NONMOTORIZED TRANSPORTATION
 ACTIVE TRANSPORTATION/NONMOTORIZED TRANSPORTATION BACKGROUND Active transportation, also known as nonmotorized transportation, is increasingly recognized as an important consideration when planning and
City of Hamilton s Transportation Master Plan (TMP) Public Consultation 3 December 2015
 Public Consultation 3 December 2015") City of Hamilton s Transportation Master Plan (TMP) Public Consultation 3 December 2015 McPhail Transportation Planning Services Ltd. AGENDA 6:00 7:00 pm Viewing Boards / Q & A with the Team 7:00 7:50
City of Hamilton s Transportation Master Plan (TMP) Public Consultation 3 December 2015 McPhail Transportation Planning Services Ltd. AGENDA 6:00 7:00 pm Viewing Boards / Q & A with the Team 7:00 7:50
EXHIBIT B. Bass Lake Rd US 50 to Hollow Oak Rd 2 Lanes with unimproved median and 4 foot paved shoulders. $ %
 Fee Program Project List - 2004 General Plan Cost Estimate 2004 Alternative Route Study West Valley Condition 27 Alternative connection between, Feasibility study. Included in /White Rock Connector. south
COMMUNITY PARTICIPATION CHAPTER 8
 COMMUNITY PARTICIPATION CHAPTER 8 8.1 ROLE OF THE CITY S BICYCLE ADVISORY COMMISION 8.2 BICYCLE TRANSPORTATION PLAN STAKEHOLDERS 8.2.1 Stakeholders 8.2.2 Stakeholders Letters of Recommendations 8.3 CITY
5. Pedestrian System. Accomplishments Over the Past Five Years
 5. Pedestrian System Accomplishments Over the Past Five Years The Alamo Area Metropolitan Planning Organization (MPO) and its partner agencies recognize the importance of improving pedestrian mobility.
Diamond Springs Parkway Project
 Diamond Springs Parkway Project Public Information Meeting, Monday, March 18, 2013 330 Fair Lane, Building A, Placerville County Board of Supervisors Meeting Room, 6:30 8:00 p.m. PRESENTED BY: County of
Tulsa Metropolitan Area LONG RANGE TRANSPORTATION PLAN
 Tulsa Metropolitan Area LONG RANGE TRANSPORTATION PLAN Indian Nations Council of Governments August 2005 CONTACTING INCOG In developing the Destination 2030 Long Range Transportation Plan, INCOG s Transportation
 MEMORANDUM - CITY OF PASADENA Department Of Transportation DATE: OCTOBER 21, 2008 TO: ENVIRONMENTAL ADVISORY COMMISSION FROM: ~ FRED C. DOCK, DIRECTOR OF TRANSPORTATION SUBJECT: UPDATE ON DEPT. OF TRANSPORTATION
NOTICE OF AVAILABILITY/NOTICE OF COMMENT PERIOD OF A DRAFT EIR/EIS/EIS FOR PUBLIC REVIEW AND HEARINGS
 Tahoe Transportation District 128 Market Street, Suite 3F Stateline, NV 89449 Phone: (775) 589-5500 www.tahoetransportation.org Federal Highway Administration 650 Capitol Mall, Suite 4-100 Sacramento,
Clackamas County Comprehensive Plan
 ROADWAYS The County s road system permits the movement of goods and people between communities and regions, using any of a variety of modes of travel. Roads provide access to virtually all property. They
Goal 3: Foster an environment of partnerships and collaboration to connect our communities and regions to one another.
 Non-Motorized Transportation Plan (NMTP) Draft Vision, Goal and,, Tri-County Regional Planning Commission (TCRPC) Purpose The purpose of the Tri-County Regional Planning Commission (TCRPC) Non-Motorized
4 Ridership Growth Study
 Clause 4 in Report No. 15 of Committee of the Whole was adopted, without amendment, by the Council of The Regional Municipality of York at its meeting held on November 16, 2017. 4 Ridership Growth Study
TOWN OF PORTLAND, CONNECTICUT COMPLETE STREETS POLICY
 TOWN OF PORTLAND, CONNECTICUT COMPLETE STREETS POLICY I. VISION, GOALS & PRINCIPLES VISION To improve the streets of Portland making them safer and more accessible for all users including pedestrians,
TRANSPORTATION TRAINING TOPICS. April 6, 2010
 TRANSPORTATION TRAINING TOPICS April 6, 2010 Roles of Transportation Providers Context and Policy Makers Division of Transportation and Traffic Other City Operations Other Transportation Operators CMA
Scope of Services BICYCLE/PEDESTRIAN PLAN FOR THE INDIAN RIVER COUNTY MPO
 I. INTRODUCTION Scope of Services BICYCLE/PEDESTRIAN PLAN FOR THE INDIAN RIVER COUNTY MPO The Indian River County Metropolitan Planning Organization (MPO) Bicycle and Pedestrian Plan was completed in 1997.
Portland International Airport Bicycle and Pedestrian Plan (October 2003) Staff Acknowledgements
 Staff Acknowledgements") Portland International Airport Bicycle and Pedestrian Plan (October 2003) Staff Acknowledgements Scott King, Senior Aviation Planner Jason Gately, Senior Aviation Planner Preston Beck, Associate Planner
Portland International Airport Bicycle and Pedestrian Plan (October 2003) Staff Acknowledgements Scott King, Senior Aviation Planner Jason Gately, Senior Aviation Planner Preston Beck, Associate Planner
BIKE PLAN CONTENTS GATEWAY
 CONTENTS Acknowledgments...vii Great Rivers Greenway District Board of Directors... vii Great Rivers Greenway District Staff... vii Project Consultants... vii Committees... viii Citizens Advisory Committee
CITY OF BLOOMINGTON COMPLETE STREETS POLICY
 CITY OF BLOOMINGTON COMPLETE STREETS POLICY POLICY OBJECTIVE: The City of Bloomington will enhance safety, mobility, accessibility and convenience for transportation network users of all ages and abilities,
Living Streets Policy
 Living Streets Policy Introduction Living streets balance the needs of motorists, bicyclists, pedestrians and transit riders in ways that promote safety and convenience, enhance community identity, create
MnDOT Implementation of Complete Streets Policy. January 2014
 MnDOT Implementation of Complete Streets Policy January 2014 1 Prepared by Minnesota Department of Transportation 395 John Ireland Boulevard Saint Paul, Minnesota 55155-1899 Phone: 651-296-3000 Toll-Free:
NM-POLICY 1: Improve service levels, participation, and options for non-motorized transportation modes throughout the County.
 Transportation PRINCE WILLIAM COUNTY 2008 COMPREHENSIVE PLAN NON-MOTORIZED PLAN CONTENTS Goals, Policies, and Action Strategies Table 4 (Bike Facility Classifications and Descriptions) Table 5 (Bike Facility
APPENDIX B: FUNDING MATRIX
 APPENDIX B: FUNDING MATRIX 101752 B - 1 FEDERAL SAFETEA-LU -- Congestion Mitigation and Air Quality Improvement Program (CMAQ) SAFETEA-LU -- Surface Transportation Program (STP)/Congestion Mitigation and
The Florida Bicycle and Pedestrian Partnership Council
 The Florida Bicycle and Pedestrian Partnership Council Input to the Update of the Florida Transportation Plan March 2015 This document presents input from the Florida Bicycle and Pedestrian Advisory Council
Chapter VISION, MISSION, AND GOALS AND OBJECTIVES. Vision. Mission. Goals and Objectives CONNECTING COMMUNITIES ACROSS THE ST.
 VISION, MISSION, AND GOALS AND OBJECTIVES Chapter 3 The Plan s vision, mission, and goals and objectives were developed through a series of interactive exercises with the Citizens Advisory Committee (CAC)
Regional Transportation Needs Within Southeastern Wisconsin
 Regional Transportation Needs Within Southeastern Wisconsin #118274 May 24, 2006 1 Introduction The Southeastern Wisconsin Regional Planning Commission (SEWRPC) is the official areawide planning agency
Perryville TOD and Greenway Plan
 Perryville TOD and Greenway Plan Greenway Glossary Pathway: A bicycle and pedestrian path separated from motorized vehicular traffic by an open space, barrier or curb. Multi-use paths may be within the
REGIONAL BICYCLE AND PEDESTRIAN DESIGN GUIDELINES
 REGIONAL BICYCLE AND PEDESTRIAN DESIGN GUIDELINES November 16, 2011 Deb Humphreys North Central Texas Council of Governments Bicycle and Pedestrian Advisory Committee Snapshot of the Guide 1. Introduction
VDOT BICYCLE & PEDESTRIAN IMPLEMENTATION GUIDE FOR LOCALITY INVOLVEMENT April 2017
 VDOT BICYCLE & PEDESTRIAN IMPLEMENTATION GUIDE FOR LOCALITY INVOLVEMENT April 2017 1 TABLE OF CONTENTS Topic Page(s) About this Guide 3 Encouraging development of bicycle and pedestrian plans by localities
University of Victoria Campus Cycling Plan Terms of Reference. 1.0 Project Description
 University of Victoria Campus Cycling Plan Terms of Reference 1.0 Project Description The Campus Cycling Plan, a first for the University, will provide a comprehensive and coordinated approach to support
Washington DC Section of ITE Project Briefing
 Washington DC Section of ITE Project Briefing November 5, 2015 Renée Hamilton, VDOT, Deputy District Administrator I-66 Outside the Beltway Improvement Area Project Location Virginia 2 Purpose and Need
2.0 Existing Conditions
 20 2.0 Existing Conditions 2.1 Land Use, Future Growth Patterns, Physical Barriers Geographic Overview Sutter County s land use pattern is characterized by extensive agricultural areas, significant natural
Purpose and Need. Chapter Introduction. 2.2 Project Purpose and Need Project Purpose Project Need
 Chapter 2 Purpose and Need 2.1 Introduction The El Camino Real Bus Rapid Transit (BRT) Project (Project) would make transit and other transportation improvements along a 17.6-mile segment of the El Camino
APPENDIX G: INTERSECTION NEEDS AT OKEECHOBEE BOULEVARD
 APPENDIX G: INTERSECTION NEEDS AT OKEECHOBEE BOULEVARD INTERSECTION NEEDS AT SR 7 and OKEECHOBEE BOULEVARD SR 7 Extension Project Development and Environment (PD&E) Study From Okeechobee Boulevard (SR
WEST AND SOUTH WEST RING ROAD DOWNSTREAM TRAFFIC IMPACTS
 Page 1 of 9 EXECUTIVE SUMMARY Alberta Transportation ( AT ) is preparing to construct the final sections of the Calgary Ring Road. This includes the South West Ring Road ( SWRR ) (from Lott Creek Blvd
City of Novi Non-Motorized Master Plan 2011 Executive Summary
 City of Novi Non-Motorized Master Plan 2011 Executive Summary Prepared by: February 28, 2011 Why Plan? Encouraging healthy, active lifestyles through pathway and sidewalk connectivity has been a focus
General Plan Circulation Element Update Scoping Meeting April 16, 2014 Santa Ana Senior Center, 424 W. 3rd Street, Santa Ana, CA 92701
 General Plan Circulation Element Update Scoping Meeting April 16, 2014 Santa Ana Senior Center, 424 W. 3rd Street, Santa Ana, CA 92701 Meeting Agenda 1. Purpose of Scoping Meeting 2. Project Overview 3.
Moving Cambridge. City of Cambridge Transportation Master Plan Public Consultation Centre. March 7, :00 8:00 PM.
 City of Cambridge Transportation Master Plan Public Consultation Centre March 7, 2018 5:00 8:00 PM Region of Waterloo City of Cambridge Transportation Master Plan Public Consultation Centre March 7, 2018
AMATS Complete Streets Policy
 AMATS Complete Streets Policy Table of Contents: Section 1. Definition of Complete Streets Section 2. Principles of Complete Streets Section 3. Complete Streets Policy Section 4. Consistency Section 5.
Funding Sources Appendix I. Appendix I. Funding Sources. Virginia Beach Bikeways and Trails Plan 2011 Page I-1
 Funding Sources Virginia Beach Bikeways and Trails Plan 2011 Page I-1 Funding Sources Federal and state agencies provide funding for local bikeway and trail projects. Descriptions follow for programs that
North Coast Corridor:
 North Coast Corridor: Connecting People, Transportation & Environment Legislative Hearing: 11.8.10 1 North Coast Corridor Region s Lifeline A Regional Strategy Mobility, Economy & Environment North Coast
Non-Motorized Transportation 7-1
 Non-Motorized Transportation 7-1 Transportation facilities no longer mean just accommodating a vehicle powered by a combustion engine. Pedestrian and non-motorized facilities are important modes of travel
Transportation Authority of Marin Renew Existing ½-cent Transportation Sales Tax
 Transportation Authority of Marin Renew Existing ½-cent Transportation Sales Tax Request for Approval of the Final Sales Tax Renewal Expenditure Plan Town of Tiburon June 20, 2018 Request Council to Approve
El Dorado County. Bicycle Transportation Plan. edctc. November prepared by el dorado county TRANSPORTATION COMMISSION
 El Dorado County Bicycle Transportation Plan November 2010 prepared by el dorado county edctc TRANSPORTATION COMMISSION ACKNOWLEDGEMENTS 2010 El Dorado County Bicycle Transportation Plan Adopted by the
Climate Change Action Plan: Transportation Sector Discussion Paper: Cycling
 Climate Change Action Plan: Transportation Sector Discussion Paper: Cycling ontario.ca/climatechange Contents 1. Minister of Transportation s message... 3 2. Introduction... 5 3. Sector Overview and Support
Memorandum. Fund Allocation Fund Programming Policy/Legislation Plan/Study Capital Project Oversight/Delivery Budget/Finance Contract/Agreement Other:
 Memorandum Date: November 20, 2017 To: Transportation Authority Board From: Eric Cordoba Deputy Director Capital Projects Subject: 12/5/17 Board Meeting: San Francisco Freeway Corridor Management Study
Performance Criteria for 2035 Long Range Transportation Plan
 Minimizing Impacts on Natural, Historic, Cultural or Archeological Resources 2035 LRTP Weighting Factor: 7% Objective 1.1: Use appropriate planning and design criteria to protect and enhance the built
APPENDIX D: SACRAMENTO URBAN AREA TRANSPORTATION PRIORITIES
 1 County County County County 2 Yolo Arterial Roadway Collector Roadway Urban Residential Street Rural Residential Roadway I-80 / U.S. 50 Bus/Carpool Lanes in both directions Richards Blvd PM Yol 80 0.237
ACTIVE TRANSPORTATION
 ACTIVE TRANSPORTATION Mobility 2040 Supported Goals Improve the availability of transportation options for people and goods. Support travel efficiency measures and system enhancements targeted at congestion
Los Altos Hills Town Council - June 18, 2015 Palo Alto City Council June 22, AGENDA ITEM #2.B Presentation
 Los Altos Hills Town Council - June 18, 2015 Palo Alto City Council June 22, 2015 AGENDA ITEM #2.B Presentation Previous Presentations Los Altos Hills Town Council in May 2014 and February 2015 Palo Alto
Michael Parmer, Management Aide, City Manager's Office
 P139 STAFF REPORT f CITY NL- NAGER' S OFFICE RANCHO Date: C;UCAMONGA To: From: Subject: Mayor and Members of the City Council John R. Gillison, City Manager Michael Parmer, Management Aide, City Manager's
The Role of MPOs in Advancing Safe Routes to School through the Transportation Alternatives Program
 The Role of MPOs in Advancing Safe Routes to School through the Transportation Alternatives Program In 2012, Congress made changes to Federal funding for Safe Routes to School that gave some metropolitan
IMPLEMENTATION STRATEGIES
 GEORGETOWN SIDEWALK MASTER PLAN 34% of funding is dedicated to Downtown Overlay District sidewalks 28% of funding is recommended within 1/4 mile of Southwestern University 26% of funding is recommended
MOUNTAIN HOUSE SPECIFIC PLAN I 9.1 INTRODUCTION ASSUMPTIONS TRANSPORTATION FACILITIES TRANSPORTATION IMPROVEMENTS PHASING 9.
 CHAPTER NINE: TRANSPORTATION AND CIRCULATION 9.1 INTRODUCTION 9.1 9.2 ASSUMPTIONS 9.1 9.3 TRANSPORTATION FACILITIES 9.1 9.4 TRANSPORTATION IMPROVEMENTS PHASING 9.3 LIST OF FIGURES LIST OF TABLES Figure
STUDY ADVISORY COMMITTEE. October 8, 2015
 STUDY ADVISORY COMMITTEE October 8, 2015 Study Purpose evaluate the long-term transportation strategies and investments needed to sustain the county s economic health and quality of life in the coming
12 RECOMMENDATIONS Road Improvements. Short Term (generally the next five years)
") 12 RECOMMENDATIONS Recommendations are based on the technical analysis of existing and future road and active transportation conditions, the results of the review of existing City policies and public feedback.
12 RECOMMENDATIONS Recommendations are based on the technical analysis of existing and future road and active transportation conditions, the results of the review of existing City policies and public feedback.
Berkeley Strategic Transportation Plan A-76
 Berkeley Strategic Transportation Plan A-76 Appendices 1. A Team Effort 2. Where We ve Been A-11 Berkeley Strategic Transportation Plan Alameda County Transportation Plan Alameda County will be served
Appendix T-2: Transportation Facilities Inventory
 Appendix T-2: Transportation Facilities Inventory Roads, Highways and Bridges The Georgia Department of Transportation (GDOT) maintains centerline mile measures for all counties in Georgia based on functional
Service Business Plan
 Service Business Plan Service Name Transportation Planning Service Type Public Service Owner Name Kaylan Edgcumbe Budget Year 2019 Service Owner Title Service Description Manager of Transportation Planning
Transportation in Washoe County. Lee Gibson, Executive Director February 15, 2011
 Transportation in Washoe County Lee Gibson, Executive Director February 15, 2011 RTC OF WASHOE COUNTY Metropolitan Planning Organization Meet long term needs Deliver federal funding Program projects in
EXECUTIVE SUMMARY... vii 1 STUDY OVERVIEW Study Scope Study Area Study Objectives
 Contents EXECUTIVE SUMMARY... vii 1 STUDY OVERVIEW... 1-1 1.1 Study Scope... 1-1 1.2 Study Area... 1-1 1.3 Study Objectives... 1-3 2 EXISTING CONDITIONS... 2-1 2.1 Existing Freeway Conditions... 2-4 2.1.1
AGENDA ITEM NO. 5b HCAOG TAC meeting of May 8, 2014
 Humboldt County Association of Governments Eureka, CA, 95501 AGENDA ITEM NO. 5b HCAOG TAC meeting of May 8, 2014 DATE: May 1, 2014 TO: HCAOG Technical Advisory Committee (TAC) FROM:, SUBJECT: Letters of
Appendix T 1: Additional Supporting Data
 Appendix T 1: Additional Supporting Data Project Delivery Delays with the implementation of the 2000 TIP became apparent early in the decade. In response to direction among policy officials, ARC began
Bicycle and Pedestrian
 Bicycle and Pedestrian Planning for Bikeable and Walkable Communities W H O L E H E A L T H C O N F E R E N C E 0 3 / 2 2 / 2 0 1 6 R O Y G O T H I E P E N N D O T B I C Y C L E - P E D E S T R I A N C
Hennepin County Bicycle and Pedestrian Planning
 Hennepin County Bicycle and Pedestrian Planning 1 Value of bicycle and sidewalk systems Safety Livability Mobility Health Personal Finances Economic Sustainability Clean Air Recreation Parking and congestion
Stakeholder Communication and Public Involvement Plan
 Stakeholder Communication and Public Involvement Plan Arkansas Statewide Bicycle and Pedestrian Transportation Plan Plan purpose: The Arkansas State Bicycle and Pedestrian Plan will establish a framework
Washington Metropolitan Area Transit Authority Board Action/Information Summary. MEAD Number:
 Washington Metropolitan Area Transit Authority Board Action/Information Summary Action Information MEAD Number: 100962 Resolution: Yes No TITLE: Bicycle and Pedestrian Access Improvements Study PURPOSE:
Context of Transportation Planning in the Central Lane Metropolitan Planning Organization (MPO) Area
 Area") May 2017 May 2017 Context of Transportation Planning in the Central Lane Metropolitan Planning Organization (MPO) Area There are four adopted transportation plans which cover the Central Lane MPO area,
May 2017 May 2017 Context of Transportation Planning in the Central Lane Metropolitan Planning Organization (MPO) Area There are four adopted transportation plans which cover the Central Lane MPO area,
CITY OF LOS ANGELES INTER-DEPARTMENTAL MEMORANDUM
 CITY OF LOS ANGELES INTER-DEPARTMENTAL MEMORANDUM Date: December 12,2011 To: Honorable City Council c/o City Clerk, Room 395, City Hall Attention: Honorable Bill Rosendahl, Chair, Transportation Committee
COUNCIL POLICY NAME: COUNCIL REFERENCE: 06/119 06/377 09/1C 10llC 12/1C INDEX REFERENCE: POLICY BACKGROUND
 COUNCIL POLICY NAME: COUNCIL ADVISORY COMMITTEES - TERMS OF REFERENCE ISSUED: APRIL 3, 2006 AMENDED: NOVEMBER 27, 2006 NOVEMBER 23, 2009 JANUARY 11, 2010 DECEMBER 17, 2012 POLICY COUNCIL REFERENCE: 06/119
Corporate. Report COUNCIL DATE: June 26, 2006 NO: C012 COUNCIL-IN-COMMITTEE. TO: Mayor & Council DATE: June 22, 2006
 Corporate NO: C012 Report COUNCIL DATE: June 26, 2006 COUNCIL-IN-COMMITTEE TO: Mayor & Council DATE: June 22, 2006 FROM: General Manager, Engineering FILE: 0410-20(MoT/Gate) SUBJECT: Surrey Response on
We believe the following comments and suggestions can help the department meet those goals.
 The Honorable Secretary Anthony Foxx The Secretary of Transportation United States Department of Transportation 1200 New Jersey Avenue, SE Washington, DC 20590 August 30, 2013 Dear Secretary Foxx, Thank
Bicycle & Pedestrian Access Master Plan
 Maryland Department of Transportation Bicycle & Pedestrian Access Master Plan Making Maryland the Best State for Bicyclists and Pedestrians October 2002 Introduction.................................................3
SUMMARY OF TRANSPORTATION INVESTMENTS
 Santa Cruz County 2016 Measure D: Transportation Improvement Expenditure Plan - Approved by over 2/3 of Santa Cruz County voters on November 8, 2016 - Overview Measure D, the 2016 Transportation Improvement
South King County High-Capacity Transit Corridor Study
 HIGH-CAPACITY TRANSIT CORRIDOR STUDY South King County Corridor South King County High-Capacity Transit Corridor Study Corridor Report August 2014 South King County High Capacity Transit Corridor Report
CITY OF SPOKANE VALLEY Request for Council Action
 CITY OF SPOKANE VALLEY Request for Council Action Meeting Date: December 16, 2014 Department Director Approval: Check all that apply: consent old business new business public hearing information admin.
APPENDIX C. Systems Performance Report C-1
 APPENDIX C Systems Performance Report C-1 System Performance Report & Requirements According to the FAST Act, a long range transportation plan needs to include a system performance report and subsequent
Clay Street Bridge Replacement Project
 Clay Street Bridge Replacement Project Frequently Asked Questions (FAQs) The project is located in downtown Placerville on Clay Street between US Highway 50 and Main Street and Cedar Ravine Road. The proposed
Public Transportation and Bicycle & Pedestrian Stakeholder Webinar. April 11, :30 PM
 Public Transportation and Bicycle & Pedestrian Stakeholder Webinar April 11, 2013 1:30 PM Public Transportation and Bicycle & Pedestrian Webinar April 11, 2013 1:30 PM MULTIMODAL TRANSPORTATION PLAN Vision,