Technical Paper No. 310 Household Harvests of Moose, Caribou, Bears, and Wolves in 8 Central Kuskokwim Region Communities, Alaska,
|
|
|
- Darcy Jefferson
- 5 years ago
- Views:
Transcription

1 Technical Paper No. 310 Household Harvests of Moose, Caribou, Bears, and Wolves in 8 Central Kuskokwim Region Communities, Alaska, by Tracie Krauthoefer Caroline Brown and David Koster June 2015 Alaska Department of Fish and Game Division of Subsistence
2 Symbols and Abbreviations The following symbols and abbreviations, and others approved for the Système International d'unités (SI), are used without definition in the reports by the Division of Subsistence. All others, including deviations from definitions listed below, are noted in the text at first mention, as well as in the titles or footnotes of tables, and in figure or figure captions. Weights and measures (metric) centimeter deciliter gram hectare kilogram kilometer liter meter milliliter millimeter cm dl g ha kg km L m ml mm Weights and measures (English) cubic feet per second ft 3 /s foot ft gallon gal inch in mile mi nautical mile nmi ounce oz pound lb quart qt yard yd Time and temperature day d degrees Celsius C degrees Fahrenheit F degrees kelvin K hour h minute min second s Physics and chemistry all atomic symbols alternating current AC ampere A calorie cal direct current DC hertz Hz horsepower hp hydrogen ion activity (negative log of) ph parts per million ppm parts per thousand ppt, volts V watts W General all commonly-accepted abbreviations e.g., Mr., Mrs., AM, PM, etc. all commonly-accepted professional titles e.g., Dr., Ph.D., R.N., etc. Alaska Administrative Code AAC compass directions: east E north N south S west W copyright corporate suffixes: Company Co. Corporation Corp. Incorporated Inc. Limited Ltd. District of Columbia D.C. et alii (and others) et al. et cetera (and so forth) etc. exempli gratia (for example) e.g. Federal Information Code FIC id est (that is) i.e. latitude or longitude lat. or long. monetary symbols (U.S.) $, months (tables and figures): first three letters (Jan,...,Dec) registered trademark trademark United States (adjective) U.S. United States of America (noun) USA U.S.C. United States Code U.S. state use two-letter abbreviations (e.g., AK, WA) Measures (fisheries) fork length mideye-to-fork mideye-to-tail-fork standard length total length FL MEF METF SL TL Mathematics, statistics all standard mathematical signs, symbols and abbreviations alternate hypothesis H A base of natural logarithm e catch per unit effort CPUE coefficient of variation CV common test statistics (F, t, 2, etc.) confidence interval CI correlation coefficient (multiple) R correlation coefficient (simple) r covariance cov degree (angular ) degrees of freedom df expected value E greater than > greater than or equal to harvest per unit effort HPUE less than < less than or equal to logarithm (natural) ln logarithm (base 10) log logarithm (specify base) log 2, etc. minute (angular) ' not significant NS null hypothesis H O percent % probability P probability of a type I error (rejection of the null hypothesis when true) probability of a type II error (acceptance of the null hypothesis when false) second (angular) " standard deviation SD standard error SE variance population Var sample var
3 TECHNICAL PAPER NO. 310 HOUSEHOLD HARVESTS OF MOOSE, CARIBOU, BEARS, AND WOLVES IN CENTRAL KUSKOKWIM REGION COMMUNITIES, ALASKA, by Tracie Krauthoefer and David Koster Alaska Department of Fish and Game, Division of Subsistence, Anchorage and Caroline Brown Alaska Department of Fish and Game, Division of Subsistence, Fairbanks Alaska Department of Fish and Game Division of Subsistence 1300 College Road Fairbanks, AK June 2015
4 The Division of Subsistence Technical Paper series was established in 1979 and represents the most complete collection of information about customary and traditional uses of fish and wildlife resources in Alaska. The papers cover all regions of the state. Some papers were written in response to specific fish and game management issues. Others provide detailed, basic information on the subsistence uses of particular communities which pertain to a large number of scientific and policy questions. Technical Paper series reports are available through the Alaska State Library and on the Internet: This publication has undergone editorial and professional review. Tracie Krauthoefer and David Koster Alaska Department of Fish and Game, Division of Subsistence 333 Raspberry Road, Anchorage, AK and Caroline Brown Alaska Department of Fish and Game, Division of Subsistence 1300 College Road, Fairbanks, AK This document should be cited as: Krauthoefer, T., C. Brown, and D. Koster Household harvests of moose, caribou, bears, and wolves in Central Kuskokwim region communities, Alaska, Alaska Department of Fish and Game Division of Subsistence Technical Paper No. 310, Fairbanks. The Alaska Department of Fish and Game (ADF&G) administers all programs and activities free from discrimination based on race, color, national origin, age, sex, religion, marital status, pregnancy, parenthood, or disability. The department administers all programs and activities in compliance with Title VI of the Civil Rights Act of 1964, Section 504 of the Rehabilitation Act of 1973, Title II of the Americans with Disabilities Act (ADA) of 1990, the Age Discrimination Act of 1975, and Title IX of the Education Amendments of If you believe you have been discriminated against in any program, activity, or facility please write: ADF&G ADA Coordinator, P.O. Box , Juneau AK U.S. Fish and Wildlife Service, 4040 N. Fairfax Drive, Suite 300 Webb, Arlington VA Office of Equal Opportunity, U.S. Department of the Interior, Washington DC The department s ADA Coordinator can be reached via phone at the following numbers: (VOICE) , (Statewide Telecommunication Device for the Deaf) , (Juneau TDD) , or (FAX) For information on alternative formats and questions on this publication, please contact: ADF&G Division of Subsistence at
5 TABLE OF CONTENTS List of Tables... ii List of Figures... iii List of Appendices... iv 1. Introduction...1 Project Background...1 Managing Moose in the Central Kuskokwim Region...1 Regulatory History...2 Objectives Methods...6 Data Collection...6 Data Analysis Survey Results...11 Moose...11 Caribou...18 Black Bears...22 Brown Bears...26 Gray Wolves Discussion and Conclusions...34 Sample Sizes and Results...34 Comparisons to Earlier Research...34 Moose...34 Caribou...36 Black Bears...37 Brown Bears...38 Gray Wolves...38 The Role of Household Harvest Data in Regulatory Issues...38 Acknowledgements...40 References Cited...41 i
6 LIST OF TABLES Table Table 1. Survey design and sample sizes, Central Kuskokwim communities, harvest survey...8 Table 2. Survey design and sample sizes, Central Kuskokwim communities, harvest survey...8 Table 3. Survey design and sample sizes, Central Kuskokwim communities, harvest survey...8 Table 4. Estimated participation in the use and harvest of moose, Central Kuskokwim communities, April 2003 March Table 5. Estimated participation in the use and harvest of moose, Central Kukskokwim communities, April 2004 March Table 6. Estimated participation in the use and harvest of moose, Central Kuskokwim communities, April 2005 March Table 7. Estimated participation in the use and harvest of caribou, Central Kuskokwim communities, April 2003 March Table 8. Estimated participation in the use and harvest of caribou, Central Kuskokwim communities, April 2004 March Table 9. Estimated participation in the use and harvest of caribou, Central Kuskokwim communities, April 2005 March Table 10. Estimated participation in the use and harvest of black bear, Central Kuskokwim communities, April 2003 March Table 11. Estimated participation in the use and harvest of black bear, Central Kuskokwim communities, April 2004 March Table 12. Estimated participation in the use and harvest of black bear, Central Kuskokwim communities, April 2005 March Table 13. Estimated participation in the use and harvest of brown bear, Central Kuskokwim communities, April 2003 March Table 14. Estimated participation in the use and harvest of brown bear, Central Kuskokwim communities, April 2004 March Table 15. Estimated participation in the use and harvest of brown bear, Central Kuskokwim communities, April 2003 March Table 16. Estimated participation in the use and harvest of gray wolf, Central Kuskokwim communities, April 2003 March Table 17. Estimated participation in the use and harvest of gray wolf, Central Kuskokwim communities, April 2004 March ii
7 LIST OF TABLES, CONTINUED Table 18. Estimated participation in the use and harvest of gray wolf, Central Kuskokwim communities, April 2005 March Table 19. Moose harvests per household, Central Kuskokwim communities, and LIST OF FIGURES Figure Figure 1. Map of the Central Kuskokwim River region...3 Figure 2. Map of Central Kuskokwim region Uniform Coding Units (UCUs)...17 iii
8 Appendix LIST OF APPENDICES Appendix A. Survey Instrument...43 Appendix B. Additional Tables...49 Table B1. Parts of resource used, Central Kuskokwim communities, April 2003 March Table B2. Parts of resource used, Central Kuskokwim communities, April 2004 March Table B3. Parts of resource used, Central Kuskokwim communities, April 2005 March Table B4. Comparison of moose harvests and uses in the season to prior years, Central Kuskokwim communities...53 Table B5. Comparison of moose harvests and uses in the season to prior years, Central Kuskokwim communities...54 Table B6. Comparison of moose harvests and uses in the season to prior years, Central Kuskokwim communities...55 Table B7. Estimated moose hunting effort, Central Kuskokwim communities, April 2003 March Table B8. Estimated moose hunting effort, Central Kuskokwim communities, April 2004 March Table B9. Estimated moose hunting effort, Central Kuskokwim communities, April 2005 March Table B10. Estimated moose harvests by sex and month, Central Kuskokwim communities, April 2003 March Table B11. Estimated moose harvests by sex and month, Central Kuskokwim communities, April 2004 March Table B12. Estimated moose harvests by sex and month, Central Kuskokwim communitites, April 2005 March Table B13. Estimated moose harvests by Game Management Unit (GMU) and Uniform Coding Unit (UCU), Central Kuskokwim communities, April 2003 March Table B14. Estimated moose harvests and households harvesting on state and federal lands, Central Kuskokwim communities, April 2003 March Table B15. Estimated moose harvests by GMU and UCU, Central Kuskokwim communities, April 2004 March Table B16. Estimated moose harvests and households harvesting on state and federal lands, Centrak Kuskokwim communities, April 2004 March Table B17. Estimated moose harvests by GMU and UCU, Central Kuskokwim communities, April 2005 March iv
9 LIST OF APPENDICES, CONTINUED Table B18. Estimated moose harvests and households harvesting on state and federal lands, Central Kuskokwim communities, April 2005 March Table B19. Estimated caribou harvests by sex and month, Central Kuskokwim communities, April 2003 March Table B20. Estimated caribou harvests by sex and month, Central Kuskokwim communities, April 2004 March Table B21. Estimated caribou harvests by sex and month, Central Kuskokwim communities, April 2005 March Table B22. Estimated caribou harvests by GMU and UCU, Central Kuskokwim communities, April 2003 March Table B23. Estimated caribou harvests by GMU and UCU, Central Kuskokwim communities, April 2004 March Table B24. Estimated caribou harvests by GMU and UCU, Central Kuskokwim communities, April 2005 March Table B25. Estimated caribou harvests and households harvesting on state and federal lands, Central Kuskokwim communities, April 2003 March Table B26. Estimated caribou harvests and households harvesting on state and federal lands, Central Kuskokwim communities, April 2004 March Table B27. Estimated caribou harvests and households harvesting on state and federal lands, Central Kuskokwim communities, April 2005 March Table B28. Reported availability of caribou for subsistence hunting, Central Kuskokwim communities, and prior years...76 Table B29. Reported availability of caribou for subsistence hunting, Central Kuskokwim communities, and prior years...77 Table B30. Reported availability of caribou for subsistence hunting, Central Kuskokwim communities, and prior years...78 Table B31. Estimated black bear harvests by sex and month, Central Kuskokwim communities, April 2003 March Table B32. Estimated black bear harvests by sex and month, Central Kuskokwim communities, April 2004 March Table B33. Estimated black bear harvests by sex and month, Central Kuskokwim communities, April 2005 March Table B34. Estimated black bear harvests by GMU and UCU, Central Kuskokwim communities, April 2003 March v
10 LIST OF APPENDICES, CONTINUED Table B35. Estimated black bear harvests by GMU and UCU, Central Kuskokwim communities, April 2004 March Table B36. Estimated black bear harvests by GMU and UCU, Central Kuskokwim communities, April 2005 March Table B37. Estimated black bear harvests and households harvesting on state and federal lands, Central Kuskokwim communities, April 2003 March Table B38. Estimated black bear harvests and households harvesting on state and federal lands, Central Kuskokwim communities, April 2004 March Table B39. Estimated black bear harvests and households harvesting on state and federal lands, Central Kuskokwim communities, April 2005 March Table B40. Estimated brown bear harvests by sex and month, Central Kuskokwim communities, April 2003 March Table B41. Estimated brown bear harvests by GMU and UCU, Central Kuskokwim communities, April 2003 March Table B42. Estimated brown bear harvests and households harvesting on state and federal lands, Central Kuskokwim communities, April 2003 March Table B43. Estimated brown bear harvests and households harvesting on state and federal lands, Central Kuskokwim communities, April 2004 March Table B44. Estimated brown bear harvests and households harvesting on state and federal lands, Central Kuskokwim communities, April 2005 March Table B45. Estimated brown bear harvests by sex and month, Central Kuskokwim communities, April 2004 March Table B46. Estimated brown bear harvests by GMU and UCU, Central Kuskokwim communities, April 2004 March Table B47. Estimated brown bear harvests by sex and month, Central Kuskokwim communities, April 2005 March Table B48. Estimated brown bear harvests by GMU and UCU, Central Kuskokwim communities, April 2005 March Table B49. Estimated gray wolf harvests by sex and month, Central Kuskokwim communities, April 2003 March Table B50. Estimated gray wolf harvests by sex and month, Central Kuskokwim communities, April 2004 March Table B51. Estimated gray wolf harvests by sex and month, Central Kuskokwim communities, April 2005 March vi
11 LIST OF APPENDICES, CONTINUED Table B52. Estimated gray wolf harvests by GMU and UCU, Central Kuskokwim communities, April 2003 March Table B53. Estimated gray wolf harvests by GMU and UCU, Central Kuskokwim communities, April 2004 March Table B54. Estimated gray wolf harvests by GMU and UCU, Central Kuskokwim communities, April 2005 March Table B55. Estimated gray wolf harvests and households harvesting on state and federal lands, Central Kuskokwim communities, April 2003 March Table B56. Estimated gray wolf harvests and households harvesting on state and federal lands, Central Kuskokwim communities, April 2004 March Table B57. Estimated gray wolf harvests and households harvesting on state and federal lands, Central Kuskokwim communities, April 2005 March vii
12 ABSTRACT This report summarizes the harvest and uses of moose Alces alces, caribou Rangifer tarandus, black bears Ursus americanus, brown bears Ursus arctos, and gray wolves Canis lupus over the 3-year period from April 2003 to March 2006 in 8 Central Kuskokwim River region communities. The major driving forces behind the implementation of harvest surveys in the Central Kuskokwim region were area residents concerns over the diminishing abundance of moose and, consequently, the diminishing ability to harvest amounts of moose meat reasonably necessary for subsistence uses. This research directly supports the formal planning process for moose management initiated by the Alaska Department of Fish and Game (ADF&G) in coordination with the U. S. Fish and Wildlife Service (USFWS), local communities and hunters, and other users in the Central Kuskokwim region. The research was funded by the USFWS through an ANILCA 809 agreement and performed by the ADF&G Division of Subsistence. Data were collected through annual in-person household surveys administered by research assistants hired in each community. Between 2003 and 2006, hunters from the communities of Lower Kalskag, Upper Kalskag, Aniak, Chuathbaluk, Crooked Creek, Red Devil, Sleetmute, and Stony River harvested an estimated range of 69 to 107 moose, depending on the study year. The data set also includes information about hunters per community, average hunter days per harvested moose, and seasonality of harvest. Hunters also reported harvesting estimated ranges of 29 to 225 caribou, 28 to 40 black bears, 1 to 3 brown bears, and 45 to 83 gray wolves between 2003 and The report also compares data from the survey years with data from earlier baseline and survey efforts in the central Kuskokwim area and discusses them within the regulatory context. Key words: moose, caribou, black bear, brown bear, gray wolf, Kuskokwim River, Lower Kalskag, Upper Kalskag, Aniak, Chuathbaluk, Crooked Creek, Sleetmute, Red Devil, Stony River, subsistence hunting, harvest monitoring viii
13 1. INTRODUCTION Project Background Accurate harvest estimates are an essential component of state and federal management of sustainable fish and wildlife populations in Alaska. Harvest and use data contribute to the assessment of harvest activities as well as to the provision of customary and traditional use opportunities provided by state and federal laws (AS and ANILCA Title VIII). This report addresses the need for accurate harvest and use data by presenting, analyzing, and discussing the results of 3 consecutive big game harvest surveys conducted in 8 Central Kuskokwim region communities for the following 12-month periods: April 2003 to March 2004 (Year 1); April 2004 to March 2005 (Year 2); and April 2005 to March 2006 (Year 3). Participant communities are, from downriver to upriver, Lower Kalskag, Upper Kalskag, Aniak, Chuathbaluk, Crooked Creek, Red Devil, Sleetmute, and Stony River (Figure 1). Harvest tickets and the attached harvest reports are required in regulatory hunts for moose Alces alces and for caribou Rangifer tarandus in all areas south of the Yukon River. Harvest tickets are available free of charge from license vendors and the offices of the Alaska Department of Fish and Game (ADF&G). Harvest tickets must be carried in the field and validated as soon as an animal is harvested. Hunters are required to report their harvests, which are compiled in a statewide database maintained by the ADF&G Division of Wildlife Conservation. 1 Although the harvest ticket database is a primary source of harvest information, an earlier study demonstrated that it may substantially underestimate the harvests of hunters residing in Alaska s rural communities (Andersen and Alexander 1992). According to Andersen and Alexander s research, the harvest database captures an average of approximately 28% of the harvest documented in ADF&G Division of Subsistence household surveys. Harvest tickets do not usually measure the same harvest levels as the household surveys for a variety of reasons. Rural hunters expressed concerns that the harvest ticket system is not compatible with local patterns of hunting effort and meat sharing characteristic of subsistence economies. For example, some individuals reported that they hunted and harvested wildlife without possessing a hunting license or a harvest ticket (Andersen and Alexander 1992). Such hunting was typically organized around groups of related households, with harvests distributed to many households in the community through the hunting efforts of one individual who was often responsible for the provision of moose meat to the households. Also, for households that are heavily reliant on wild foods as a source of protein, it is probably necessary to harvest more than 1 moose. It is unlikely that hunters report the illegal harvest of second or subsequent animals (Andersen and Alexander 1992). For these and other reasons, hunters may fail to return harvest tickets, or harvest tickets may reflect only a portion of the actual harvest. Previous and continuing Division of Subsistence research demonstrated that in many small communities, a subset of super-households harvest most of the community s supply of wild resources (Wolfe 1987). This pattern is sometimes referred to as the rule, based on quantitative analyses of community harvest patterns, in which about 30% of the households often produced 70% or more of the total community harvest of wild foods in pounds edible weight (Magdanz et al. 2005; Wolfe 1987; Wolfe et al. 2010). Face-toface, in person household surveys are designed to account for these patterns and more accurately estimate harvests by community, thus providing more reliable data for management purposes. Managing Moose in the Central Kuskokwim Region Central Kuskokwim region residents have long expressed concerns over the diminishing abundance of moose and, consequently, the diminishing ability to harvest amounts of moose meat reasonably necessary for subsistence (5 AAC (8)). Community residents were particularly concerned that the influx of nonlocal hunters to the area, especially in ADF&G Game Management Unit (GMU) 19A, might adversely affect an already depressed moose population. 1. Winfonet is the ADF&G Division of Wildlife Conservation s intranet website. The site provides a wide variety of tools to allow users to access, update, and download different kinds of data, including big game harvest data. 1
14 In October 2002, ADF&G hosted the Aniak Regional Moose Summit in order to address concerns about moose populations in the Kuskokwim and Lower Yukon regions, including in GMU 19A. ADF&G initiated a formal planning process with support from the U. S. Fish and Wildlife Service (USFWS). The planning process resulted in the establishment of the Central Kuskokwim Moose Management Planning Committee (CKMC). The CKMC brought together a diverse group of individuals representing resident subsistence hunters; area state fish and game advisory committees; state, federal, and tribal agencies; big game guides and transporters; and conservation organizations. The primary objectives of the CKMC were 1) to review the biological and harvest information about moose in order to restore and maintain area moose populations that would ensure reasonable subsistence opportunities and provide for high levels of human consumptive uses, and 2) to address concerns about predation and the overall health of the ecosystem (Alaska Board of Game 2004). The CKMC met 7 times throughout 2003 and 2004 to develop a consensus plan for moose management in units 19A and 19B. This project emerged from the planning committee s recommendation to provide an accurate estimate of the number of moose harvested and used by residents of the study communities. This information could then be compared to earlier baseline subsistence harvest estimates to reveal general trends in harvest patterns over time. Additionally, these data can be compared to harvest estimates of nonlocal hunters (i.e., hunters with resident hunting licenses or identification cards whose permanent residence is outside the project communities, such as residents of GMU 18 or urban areas, and who reported a successful hunt) and nonresident hunters (i.e., hunters who purchased nonresident hunting licenses and who reported a successful hunt). Nonlocal and nonresident harvest data are derived from the Division of Wildlife harvest database in order to broaden the scale of estimated moose harvests in GMU 19A. Regulatory History A brief introduction to the recent management of moose in the Central Kuskokwim area, specifically changes in GMU 19A resulting from the CKMC findings, provides an important context for this report. In 2003, the Alaska Board of Game (BOG) instituted a 5-year moratorium on moose hunting in the lower Kuskokwim River portion of GMU 18 that compounded competition concerns between local and nonlocal users of GMU 19A moose resources. The structure of the moratorium was similar to a moose hunting moratorium implemented in the lower Yukon River portion of GMU 18. The BOG decision was based on the demonstrated low moose density compared to relative habitat availability in GMU 18. ADF&G, the Lower Kuskokwim Fish and Game Advisory Committee (LKAC), the USFWS Yukon Delta National Wildlife Refuge, the USFWS Office of Subsistence Management, the Association of Village Council Presidents (AVCP), and nearly every community in the lower Kuskokwim River region supported this decision (ADF&G 2003; AVCP 2003; Perry 2006; USFWS 2003). Residents from the communities of Grayling, Anvik, Shageluk, and Holy Cross were also concerned about declining moose abundance in GMU 19A (Brown et al. 2004a). They believed that this circumstance would increase competition for moose on their traditional hunting grounds in GMU 21E, even though there had been no reports of harvests in GMU 21 from the ADF&G household surveys for that year. ADF&G implemented the moose-hunting moratorium in the lower Kuskokwim River portion of GMU 18 during the following regulatory year, fall Residents of the communities in GMU 19A attended meetings of both the state-sponsored Central Kuskokwim Fish and Game Advisory Committee (CKAC) and the CKMC. They expressed their concerns about the effects of the moratorium, including a potential increase in the number of lower Kuskokwim (GMU 18) residents hunting in GMU 19A. Despite failing to obtain consensus, the CKAC reached a majority opinion to 1) prohibit nonresident hunting in GMU 19A, 2) create a state registration permit hunt 2 in GMU 19A open only to residents of the state, 2. A registration hunt must take place under a registration permit, which, according to 5 AAC (33), is a hunting permit issued to a person who agrees to the conditions specified for each hunt. Permits are issued in the order applications are received, beginning on a date announced by ADF&G and continuing throughout the open season, or until the season is closed by emergency order when a harvest quota is reached, or until a predetermined number of permits have been issued. 2

15 3 Figure 1. Map of the Central Kuskokwim River region.
16 3) eliminate the winter moose season in GMU 19A, and 4) shorten the nonresident season in GMU 19B from 25 days to 20 days. The CKAC also reached a majority opinion to recommend predator management programs in GMU 19A and GMU 19B. The majority opinion was submitted to the BOG for consideration at their February March 2004 meeting. In response to the concerns voiced by residents attending the CKAC and CKMC meetings, and upon recommendation of the CKMC, the BOG adopted most of the recommendations into permanent regulation. However, the recommendation to prohibit nonresident hunting in GMU 19A was adopted for only 1 year, to be reconsidered at the March 2005 BOG meeting, when more data would be available. The BOG instituted a moose registration hunt (RM640) in GMU 19A, which was later implemented during the fall 2004 moose season. The CKMC continued to meet following the 2004 BOG meeting, resulting in the submission of recommendations for the March 2005 BOG meeting that were nearly identical to those submitted for the 2004 meeting. BOG members again voted to adopt the committee s recommendations for 1 year and resolved to reconsider the situation once more in BOG members based their decisions, in part, on the first year of harvest data from the household surveys (presented later in this report) as well as GMU 19A moose population estimates generated by the ADF&G Division of Wildlife Conservation. Based on ADF&G surveys in 1998 and 2001, the GMU 19A total moose population was estimated to number between 6,800 and 11,300 moose (Alaska Board of Game 2004:4). At its March 2006 meeting, the BOG again took up the issue of GMU 19A moose and considered a proposal to retain the nonresident prohibition, close resident hunting, and implement a Tier II hunt 3 in portions of GMU 19A. This proposal was based on a GMU 19A moose population estimate revised by ADF&G in February 2005 to 2,700 to 4,250 moose as a result of using geospatial population estimation techniques. Observations by the Division of Wildlife Conservation of low cow to calf and bull to cow ratios and Division of Subsistence household survey data also supported the proposal (Alaska Board of Game 2006). Residents of Sleetmute, Stony River, and Red Devil testified against the establishment of a Tier II hunt, favoring instead a complete closure or moratorium on moose hunting in the area in order to give the moose population every opportunity to rebound (Alaska Board of Game 2006). Rather than a Tier II hunt, residents of Aniak, Crooked Creek, Chuathbaluk, and Bethel favored the continuation of the registration permit program with mandatory 48-hour reporting and a unitwide harvest limit of 50 bulls. All users agreed upon the need for actions restricting the harvest. After discussion, the BOG closed the eastern portion of GMU 19A, around Sleetmute, Stony River, and Red Devil, to all hunting, and it found compelling biological evidence to establish a Tier II hunt in the downriver portion of the unit. In May 2006, the BOG published its findings regarding hunting in GMU 19A, noting that the size of the moose population, then estimated to be 2,700 to 4,250 animals, was considerably smaller than the objective of 7,600 to 9,300 moose, and that the objective had not been achieved in 5 years. The BOG noted that their concerns about moose abundance had resulted in a considerable reduction in the number allowed for harvest. The BOG also noted the increasingly restrictive regulations on harvests, seasons, and bag limits implemented since The BOG concluded that the abundance of this moose population would continue to decline in the absence of prudent predator control and regulatory restrictions, and it adopted a combination of these 2 strategies in an attempt to allow the moose population to recover. Objectives In order to collect data that would produce accurate harvest estimates by community in support of the moose planning effort in the Central Kuskokwim region, the Division of Subsistence designed the harvest survey to achieve 2 primary objectives. 3. State Tier II hunts are held when there is not enough of a game population with customary and traditional uses to provide a reasonable opportunity for subsistence uses. Hunters must answer questions on an application concerning their dependence on the game for their livelihood and availability of alternative resources. Applications are scored based on responses to the questionnaire, and permits are issued to those with the highest scores. 4
17 1. Document the harvest and uses of moose, caribou, black bears (Ursus americanus), brown bears (Ursus arctos), and gray wolves (Canis lupus) by residents of 8 Central Kuskokwim communities through in-person interviews using a systematic survey. Elements of the survey include: a. Documentation of actual harvests by household, including sex of the animal and location and seasonality of harvest; b. Documentation of use patterns (e.g., sharing) between households; c. Information about hunter effort in moose hunting based on: i. The proportion of the total population that hunted, ii. The success rates of hunters, iii. The time required to achieve a successful harvest, and iv. The average number of moose harvested per household. 2. Facilitate local capacity building and involvement of local communities in moose management by hiring and training local research assistants to conduct data collection; assist with data cleaning, coding, and verification; assist with the analysis of data; and review the written report detailing research findings. The project met both objectives. 5
18 2. METHODS Data Collection ADF&G divisions of Subsistence and Wildlife Conservation conducted the projects in partnership with the Kuskokwim Native Association (KNA), area secondary schools (in ), traditional councils in the communities, and local research assistants. The USFWS funded the research through an ANILCA Section 809 agreement. The respective tribal governments approved the research prior to the start of each project. Although the projects focused on the harvests and uses of moose, the household survey instrument (Appendix A) included other big game, thus expanding the big game harvest database for the area. Surveyors collected data on the harvests and uses of moose, caribou, black bears, brown bears, and gray wolves over a 3-year period by residents in the communities of Lower Kalskag, Upper Kalskag, Aniak, Chuathbaluk, Crooked Creek, Sleetmute, Red Devil, and Stony River. Figure 1 shows locations of these communities. The survey measured harvest and uses of big game through the collection of data about the proportion of households in the total population that harvested, attempted to harvest, and used big game; the number of animals harvested; and the locations of the harvests. The survey also asked residents how their harvests of moose and caribou during the study years compared to previous years harvests (i.e., last 4 to 5 years and last 9 to 10 years) and how well their harvests met their subsistence needs. The results reported here represent 3 years of systematic collection of big game data in the Central Kuskokwim River area. In Year 1 and Year 2, surveys were administered during April and May (of 2004 and 2005, respectively). In Year 3, because of scheduling conflicts, surveys were not conducted until September, October, and November (2006); therefore, Year 3 data may not be strictly comparable with data collected in Year 1 and Year 2. The methods employed in each project year were based on prior division research projects in Grayling, Anvik, Shageluk, Holy Cross, Alatna, Allakaket, Bettles, Evansville, Galena, Huslia, Kaltag, Nulato, Ruby, and Tanana (Andersen et al. 1998, 2000, 2001, 2004; Brown et al. 2004a; Brown et al. 2004b). The survey form was reviewed by the CKAC and participating communities prior to finalization. Community household lists, originally compiled during Division of Subsistence salmon harvest surveys in fall 2003 (Simon et al. 2007), were updated to reflect current households in each community by school teachers, tribal council members, and other community members immediately prior to the survey effort. In Year 1 ( ), in response to a suggestion from the CKMC, the project was designed to include teaching outreach education to students in the communities of GMU 19A. Approval for the project was obtained from the village or tribal council in each community prior to beginning training and research efforts. Following community approval, ADF&G wildlife education specialists sent a curriculum developed specifically for the project to participating teachers. After completing the curriculum, which contained lessons on moose biology, wildlife management, and the state regulatory process, Division of Subsistence staff trained students to conduct household surveys in their community. This approach provided students with a context for the project questions and contributed to their knowledge of the regulatory system as well as important issues related to hunting big game prior to their delivery of the household survey. Students conducted the household surveys under direct supervision of their teachers. They worked in teams of 2, and their teachers determined which households each team would survey in order to avoid duplication of effort. Although the curriculum focused on moose, students also discussed other big game, and their surveys included questions about caribou, black bears, brown bears, and gray wolves. In Year 2 ( ), with the exception of Aniak, division researchers worked directly with individual tribal councils to identify complete household lists for survey administration and to select and train local research assistants to administer the household surveys. In Aniak, ADF&G worked with the KNA to select a local research assistant who would administer the surveys. Division researchers conducted the household surveys in Red Devil and Chuathbaluk, because no residents were interested in administering the survey. Following the identification and hiring of local research assistants, division researchers traveled to each community to train assistants in the administration of face-to-face household surveys. During training, 6
19 and with the help of tribal council members and other community members, research assistants edited and updated the previous year s household lists for their community. In Year 3 ( ), with the exception of Aniak, local research assistants conducted the house-to-house surveys. In Aniak, the division again worked with the KNA to administer the survey with local research assistants trained by the division. Data Analysis In all project years, there were several levels of review of completed forms: on the community level by student surveyors and teachers in Year 1, and by local research assistants and project coordinators in years 2 and 3. Division of Subsistence staff then reviewed survey instruments for errors of logic or omission and resolved problems directly with the surveyors. Because the population size of most of the communities was small, researchers used a census approach in each community. In Year 1, a total of 424 households were identified in the 8 communities (Table 1). Surveys were completed in 252 households, more than one-half (59%) of all households. Although surveyors attempted to contact unsurveyed households a minimum of 3 separate times, they were unable to establish contact with a number of households. The lowest contact rate occurred in Lower Kalskag, where 34 of the estimated 72 (47%) households were contacted and surveyed. The highest contact rate occurred in Stony River, where 17 of the 18 (94%) households were contacted and surveyed. With the exception of Lower Kalskag, at least one-half of all households in each community participated in the Year 1 survey. In Year 2, a total of 398 households were identified in the 8 project communities (Table 2). Surveys were completed with 277 households, representing almost three-quarters (70%) of all households. The lowest contact rate occurred in Stony River, where 5 of the estimated 15 (33%) households were contacted and surveyed, which was in sharp contrast to Year 1, when 94% of households participated in the survey. The highest contact rate occurred in Upper Kalskag, where 50 of the 51 (98%) households were surveyed. With the exception of Stony River, more than one-half of all households in each community participated in the Year 2 project. In Year 3, a total of 465 households were identified in the project communities, and surveys were completed in 258, over one-half (56%) of total households (Table 3). Similarly to Year 2, the lowest contact rate was in Stony River, where 3 of the estimated 17 households were contacted and interviewed, representing 18% of community households. The highest survey rates were in Red Devil (77%) and Aniak (74%). With the exception of Stony River, Lower Kalskag, and Sleetmute, at least one-half of all households were surveyed in Year 3. Between Year 1 and Year 2, the total estimated human population and total number of households declined slightly, from 1,508 people in Year 1 to 1,329 in Year 2, a 12% decline, and from 424 households in Year 1 to 398 in Year 2, a decline of 6% (tables 1 and 2). The average total estimated human population for the 3 project years was 1,477 residents, with surveyed households representing an average 903 residents (tables 1, 2, and 3). However, the sample of 252 households in Year 1 was expanded in Year 2 to include an additional 25 surveyed households for a total of 277 households, a 10% increase (tables 1 and 2). In Year 2, this sample represented an increase from 883 to 947 individuals, a 7% increase. The Year 3 sample of 258 households was more similar to that of Year 1, with an estimated surveyed population of 878 people (tables 1 and 3). The number of surveyed households in Year 1 and Year 3 was nearly identical (252 and 258 households, respectively). The range in community population size was considerable during the 3 project years. For all years, the combined population of 3 communities, Aniak, Lower Kalskag, and Upper Kalskag, represented about 70% of the total estimated population in all study communities: 70% (1,055 individuals) in Year 1; 72% (956 individuals) in Year 2; and 72% (1,146 individuals) in Year 3 (tables 1, 2, and 3). Other communities with total estimated populations over 100 people included Crooked Creek and Chuathbaluk in Year 1 and Year 7
20 Table 1. Survey design and sample sizes, Central Kuskokwim communities, harvest survey. Households Sampled household population Population Estimated community population Community Type of design Total number Sample goal Number surveyed Percentage sampled Unable to contact Declined survey Aniak Census % Chuathbaluk Census % Crooked Creek Census % Lower Kalskag Census % Red Devil Census % Sleetmute Census % Stony River Census % Upper Kalskag Census % All communities % Source ADF&G Division of Subsistence household surveys, Table 2. Survey design and sample sizes, Central Kuskokwim communities, harvest survey. Households Sampled household population Population Estimated community population Community Type of design Total number Sample goal Number surveyed Percentage sampled Unable to contact Declined survey Aniak Census % Chuathbaluk Census % Crooked Creek Census % Lower Kalskag Census % Red Devil Census % Sleetmute Census % Stony River Census % Upper Kalskag Census % All communities % Source ADF&G Division of Subsistence household surveys, Table 3. Survey design and sample sizes, Central Kuskokwim communities, harvest survey. Households Sampled household population Population Estimated community population Community Type of design Total number Sample goal Number surveyed Percentage sampled Unable to contact Declined survey Aniak Census % Chuathbaluk Census % Crooked Creek Census % Lower Kalskag Census % Red Devil Census % Sleetmute Census % Stony River Census % Upper Kalskag Census % All communities % Source ADF&G Division of Subsistence household surveys,
21 3 and Crooked Creek in Year 2. All other communities in all years had fewer than 100 people. In summary, community size during the 3 project years ranged from an average estimated 515 residents in Aniak to an average estimated 38 in Red Devil. All surveys were entered into Microsoft SQL 1 server databases using a double data-entry method, in which surveys are entered twice, by 2 different people, and the differences resolved. Results from surveyed households were expanded to unsurveyed households following the method below, in order to generate total harvest estimates for each community. Fractions of animals are a result of extrapolation. The estimates of harvests and use practices were calculated based upon the application of weighted means, which is a standard method for expanding sampled data (Cochran 1977). In community-based surveys, each community is a separate stratum for the purpose of generating estimates. In some cases, the community is subdivided into separate strata in order to adjust for potential bias. For this project, the sample mean of the harvests was applied to households that were not contacted or who refused to participate. The formula for standard expansion is: n N X C = x i n where: x = household harvest, i = ith household in the community, n = number of sampled households in the community, N = total number of households in the community, and X C = total estimated community harvest A calculation for the relative precision of the mean, or likelihood that an unknown value falls within a certain distance from the mean, is also produced. This value is shown as a confidence interval (CI) expressed as a percent. A standard of 95% CI is used for all calculations. The first step in calculating the confidence interval is the calculation of the standard error of the mean, which includes the finite population correction factor: s n = 1 sx n N where: ( ) t α 2 sx CI % ± = x t α/2 = Student s t statistic for given alpha level (α) with n-1 degrees of freedom (95%) (CI with n-1 degrees of freedom), s = the standard deviation of household harvest, x = sample mean of household harvest, n = number of households in the community, or sample size, and N = total households in the community. i= 1 1. Product names are given because they are established standards for the State of Alaska or for scientific completeness; they do not constitute product endorsement. 9
22 Small CL percentages indicate that an estimate is likely to be very close to the actual mean of the sample. Larger percentages mean that estimates could be further from the mean of the sample. The corrected final data from the household survey will be added to the Division of Subsistence Community Subsistence Information System (CSIS) 2. This publicly-accessible database includes community-level study findings. 2. Alaska Department of Fish and Game (ADF&G) Division of Subsistence, Juneau. Community Subsistence Information System: CSIS. 10
23 3. SURVEY RESULTS Three annual big game surveys in the 8 Central Kuskokwim communities of Aniak, Chuathbaluk, Crooked Creek, Lower Kalskag, Red Devil, Sleetmute, Stony River, and Upper Kalskag provided baseline estimates of the numbers of moose, caribou, black bears, brown bears, and gray wolves harvested, numbers of households that attempted to harvest, and the uses and sharing of the harvested species. These baseline estimates were an important component of the Central Kuskokwim Moose Planning effort between 2002 and Moose In all years, moose was the most widely used and hunted animal surveyed in the studied communities. During Year 1 of the survey in all communities combined, there were an estimated 426 moose hunters, representing approximately 28% of the region s local population (Table 4). Of these 426 hunters, an estimated 96 hunters (23%) successfully harvested approximately 107 moose in In Year 1, 76% of households in the Central Kuskokwim area reported using moose, 57% attempted to harvest moose, and 22% of all households successfully harvested 1 or more moose. At the community level, the percentage of households using moose ranged from 29% in Chuathbaluk to 100% in Crooked Creek; attempts to harvest ranged from 33% in Red Devil to 67% in Crooked Creek. Harvests ranged from 2 moose in Red Devil to 30 moose in Lower Kalskag. Accounting for community population differences, per capita harvest rates for moose in Year 1 ranged from 0.04 to 0.13, with an average for all communities of 0.07 moose per capita. The survey also asked about use patterns of moose in each community. In Year 1 ( ), most households in each community reported using moose meat and fat (67 to 96% of households and 50 to 78% of households, respectively) (Table B1). Additionally, an average of 61% of households in the area reported using bone/marrow and 57% reported using organs. Finally, approximately 37% and 30% of responding area households reported using the head and hooves, respectively, of the moose they harvested. In Year 2, percentages of households using and harvesting moose were somewhat lower. Overall, 68% of households in the Central Kuskokwim area reported using moose while 61% attempted to harvest and only 16% actually harvested a moose (Table 5). At the community level, the percentage of households using moose ranged from 36% in Lower Kalskag to 86% in Crooked Creek; attempts to harvest ranged from 25% in Red Devil to 76% in Upper Kalskag. Harvests ranged from 0 moose in Red Devil and Stony River to 39 in Aniak; per capita rates ranged from 0 moose in Red Devil and Stony River to 0.08 in Aniak, with a regional average of 0.05 moose per person in Table B2 describes the patterns of use by area residents. In , while there was little reported use of moose antlers and hides, most households reported using the meat (81%) and fat (71%). Lesser but measureable percentages of households reported using bone/marrow (52%), organs (36%), and heads (15%), similar levels as Year 1. In Year 3 of the survey project, covering , 61% of households in the Central Kuskokwim area reported using moose, while 48% reported attempting to harvest moose, and 19% of households harvested 1 or more moose (Table 6). At the community level, the percentage of households using moose ranged from 20% in Red Devil to 80% in Aniak; attempts to harvest ranged from 0% in Red Devil to 67% in Stony River. Harvests ranged from 0 moose in Red Devil and Sleetmute to 46 moose in Aniak. The harvest in reflects regulatory changes that eliminated the winter subsistence hunt as well as the shift to a registration hunt for state residents. Per capita harvests ranged from 0 moose in Red Devil and Sleetmute (where there was no harvest) to 0.29 in Stony River, with a regional average of 0.05 moose per person. The percentages of households reporting the use of various moose parts was lower in Year 3 than in the previous 2 years (Table B3). Averages of 66% and 40% of area residents reported using moose meat and fat respectively. 11
24 Table 4. Estimated participation in the use and harvest of moose, Central Kuskokwim communities, April 2003 March Using Percentage of households Attempting harvest Harvesting Receiving Giving away Total for Estimated number of moose harvested Per 95% confidence limit of total harvest Estimated hunter information Successful All hunters hunters b Percentage of population Harvest per hunter Harvest per hunter Community community household capita Percentage Low a High Number Number Aniak 85.4% 62.2% 14.6% 74.4% 15.9% % % Chuathbaluk 29.4% 35.3% 17.6% 23.5% 17.6% % % Crooked Creek 100.0% 66.7% 25.9% 85.2% 33.3% % % Lower Kalskag 73.5% 61.8% 23.5% 61.8% 23.5% % % Red Devil 91.7% 33.3% 16.7% 75.0% 16.7% % % Sleetmute 58.6% 44.8% 31.0% 48.3% 24.1% % % Stony River 70.6% 64.7% 23.5% 52.9% 23.5% % % Upper Kalskag 73.5% 58.8% 29.4% 58.8% 26.5% % % All communities 76.2% 57.1% 21.8% 63.9% 21.8% % % Source ADF&G Division of Subsistence household surveys, a. Low estimates are based on the actual reported take of moose. b. Maximum of 1 successful hunter counted per moose harvested. Per
25 Table 5. Estimated participation in the use and harvest of moose, Central Kukskokwim communities, April 2004 March Using Percentage of households Attempting harvest Harvesting Receiving Giving away Total for Estimated number of moose harvested 95% confidence limit of total harvest Per Estimated hunter information Successful All hunters hunters b Percentage of population Harvest per hunter Harvest per hunter Community community household capita Percentage Low a High Number Number Aniak 80.4% 70.7% 22.8% 65.2% 23.9% % % Chuathbaluk 58.8% 35.3% 5.9% 52.9% 11.8% % % Crooked Creek 86.2% 69.0% 10.3% 82.8% 13.8% % % Lower Kalskag 35.6% 40.7% 16.9% 23.7% 8.5% % % Red Devil 75.0% 25.0% 0.0% 75.0% 0.0% % % Sleetmute 82.4% 70.6% 11.8% 76.5% 23.5% % % Stony River 60.0% 60.0% 0.0% 60.0% 0.0% % % Upper Kalskag 72.0% 76.0% 16.0% 64.0% 14.0% % % All communities 68.2% 61.4% 16.2% 58.1% 15.9% % % Source ADF&G Division of Subsistence household surveys, a. Low estimates are based on the actual reported take of moose. b. Maximum of 1 successful hunter counted per moose harvested. Per
26 Table 6. Estimated participation in the use and harvest of moose, Central Kuskokwim communities, April 2005 March Using Percentage of households Attempting harvest Harvesting Receiving Giving away Total for Estimated number of moose harvested 95% confidence limit of total harvest Per household Per Percentage of capita Percentage Low a High Number population Estimated hunter information Successful All hunters hunters b Harvest per hunter Harvest per hunter Community community Number Aniak 79.8% 62.1% 25.0% 60.5% 21.8% % % Chuathbaluk 28.6% 28.6% 9.5% 23.8% 0.0% % % Crooked Creek 64.7% 52.9% 35.3% 41.2% 29.4% % % Lower Kalskag 40.0% 30.0% 3.3% 36.7% 3.3% 2.8 < % % Red Devil 20.0% 0.0% 0.0% 20.0% 0.0% % % Sleetmute 31.6% 15.8% 0.0% 31.6% 0.0% % % Stony River 66.7% 66.7% 66.7% 33.3% 33.3% % % Upper Kalskag 58.8% 50.0% 17.6% 44.1% 14.7% % % All communities 61.2% 47.7% 18.6% 47.3% 15.1% % % Source ADF&G Division of Subsistence household surveys, a. Low estimates are based on the actual reported take of moose. b. Maximum of 1 successful hunter counted per moose harvested.
27 By virtue of their larger human populations, the 3 larger communities, Aniak, Lower Kalskag, and Upper Kalskag, had more hunters and harvested more moose. Together, hunters in these 3 communities harvested 75 moose, or 70% of the total local moose harvest in Year 1; 60 moose, or 87% of the total, in Year 2; and 61 moose, or 70% of the total, in Year 3 (tables 4, 5, and 6). Given the variance in estimated population sizes for the 8 surveyed communities, proportionate totals (e.g., the proportion of households attempting to harvest and the proportion of successful harvests) were a better index of hunting activity and success on a community level than a simple comparison of harvest totals, which are closely related to the size of the hunting population. The results for the 3 study years spanning from April 2003 to March 2006 results documented residents high value of moose as a source of protein. In all years, most households used moose: Year 1, 76%; Year 2, 68%; and Year 3, 61%. Many households attempted to harvest moose (57%, 61%, and 48%), but few were successful (22%, 16%, and 19%) (tables 4, 5, and 6). Comparisons to earlier harvest years often provide context for single year harvest estimates. This is especially important in areas such as the Central Kuskokwim, where community residents have long expressed concerns about declining moose populations and hunting success. In addition to collecting quantitative harvest data, surveyors asked residents to compare their harvests of moose in the study year with their harvests 4 to 5 years ago and 9 to 10 years ago. The majority of responding households indicated that they harvested fewer moose in all study years than in the previous 5 or 10 years. The exceptions were Crooked Creek and Lower Kalskag in Year 2. In Year 3, the exceptions were Sleetmute, Stony River, and Crooked Creek. A poor sample may explain the inclusion of Sleetmute, which harvested 0 moose in Year 3. Only 26% of responding households answered the question comparing harvests to the prior 4 to 5 years (tables B4, B5, and B6). Many factors contributed to the duration and success of individual and household moose hunting efforts. As noted above, in all years, the majority of surveyed households reported that their harvest in these survey years was considerably less than their harvests 4 or 5 years ago (tables B4, B5, and B6). Moose hunting effort in this survey was measured by asking households to estimate the number of days each hunter in that household spent hunting for moose. These data are presented in tables B7, B8, and B9. In Year 1, an estimated 426 individuals, or 28% of the estimated area population, spent a total of 4,591 hunter-days in pursuit of moose, an indication of the importance of moose as a subsistence resource in the Central Kuskokwim region (tables 1 and B7). Of the 426 individuals who hunted, only a little more than one-fifth (96 hunters, or 23%) successfully harvested a moose (Table B7). Successful households spent an average of 15 days hunting for each moose harvested; successful and unsuccessful households, combined, spent an average of 11 days hunting. In Year 2, an estimated 410 individuals, or 31% of the area population, spent a total of 4,819 hunter-days in pursuit of moose (tables 2 and B8). Of the 410 hunters, less than one-fifth (69 hunters, or 17%) successfully harvested a moose. Households in the region that harvested a moose (successful households) spent an average of 18 days hunting for each moose harvested; together, successful and unsuccessful households spent an average of 12 days hunting. In Year 3, an estimated 372 hunters, 23% of the area population, spent a total of 4,442 hunter-days hunting moose (tables 3 and B9). Only one-fourth of these hunters (88 individuals, or 24%) harvested a moose. Successful hunters spent an average of 21 days hunting for each moose harvested. Together, successful and unsuccessful households spent an average of 12 days hunting, approximately the same estimated total as Year 2. In all 3 years, Chuathbaluk and Lower Kalskag reported the lowest time investment per moose; however, hunters in those communities required more time in subsequent years compared to the first year of the survey (Year 1: 3 and 4 days, respectively; Year 2: 14 and 10 days; Year 3: 4 and 5 days). In all years, the majority of moose harvests occurred in September (tables B10, B11, and B12). In Year 1, moose harvests occurred in the months of August, September, October, December, and February, with 74% occurring in September. In the last 2 survey years, moose harvests occurred in 3 months only: in Year 2, moose were harvested in September (97%), December, and February, and in Year 3, moose were harvested 15
28 in August, September (94%) and January (with 2 harvested in an unknown month). September is also the only month with reported cow harvests in any of the survey years. Bulls constituted the largest portion of the total moose harvested in all project communities, in all years. In Year 1, the sex composition of the total moose harvested consisted of 72 bulls (68% of the total harvest), 8 cows (8% of the total), and 26 moose of unknown sex (Table B10). In Year 2, bulls constituted 93% of the total harvest (65 of 69 total moose), with 5 moose of unknown sex and no reported cow harvest (Table B11). In Year 3, bulls constituted 98% of the total harvest (86 of 88 moose), with 2 moose of unknown sex and no reported cow harvest (Table B12). The locations of Year 1 harvests are summarized by GMU and Uniform Coding Unit (UCU) 1 in Table B13 (see also Figure 2). Of the estimated 107 moose harvested by the 8 survey communities in Year 1, most (64, or 60%) were taken in 14 UCUs of GMU 19A, while 14 moose (14%) were taken in 2 UCUs of GMU 18 (Table B13). Together these areas represented 74% of the total harvest. Three moose (3%) were taken in GMU 19B, 2 moose (2%) in GMU 19D, and the remainder (21%) in unreported locations. Moose harvests were unevenly split between state and federal land in ; 41% of the harvest occurred on state land, while 20% occurred on federal land (the land status for 43% of the harvest was unknown) (Table B14). Table B14 shows the breakdown of harvest by land status and by community in All communities harvested moose from at least 2 UCUs in Year 1 (Table B13). Aniak, Lower Kalskag, and Upper Kalskag hunters utilized at least 5 UCUs for hunting moose during Year 1. All communities harvested moose within GMU 19A. Likely because of geographical proximity, only residents of Lower Kalskag and Upper Kalskag harvested moose in GMU 18, and only Aniak and Red Devil hunters harvested moose in GMU 19B. Additionally, Stony River was the only community that reported harvesting moose in GMU 19D. The hunters of Aniak, the largest community, harvested 3 times the number of moose than many other communities in Year 1 ( ) and used 6 UCUs. The extensive travel for harvests likely reflected less abundant local moose populations, among other factors, and most GMU 19A residents emphasized that more travel was required to harvest moose than in the past. The exception to this was hunters from Lower Kalskag and Chuathbaluk, who invested fewer hunting days per harvested moose (Table B7). In Year 2, with the exception of Red Devil and Stony River, all communities harvested at least 1 moose (Table B15). All successful communities harvested at least 1 moose in GMU 19A. Of the estimated 69 moose harvested by the 8 survey communities, 51 (74%) were taken in 11 UCUs in GMU 19A. Harvests in other areas included 5 moose (8%) in GMU 21E, 4 moose (6%) in GMU 18, 3 moose (5%) in GMU 21A, and 2 moose (24%) in GMU 19D; the remaining 3 moose (5%) were harvested in unreported locations. Table B16 shows the harvest on state and federal land by community for Of the 69 moose harvested, 59% (41 moose) were harvested on state land, and the land status for 41% of the harvest (28 moose) was reported as unknown. The locations of moose harvests in Year 3 are summarized by community in Table B17. Of the 88 harvested moose, 62 (71%) were taken in GMU 19A, and 13 moose (15%) were harvested in GMU 21A and GMU 21E. Additionally, 6 moose (7%) were harvested from GMU 19D, and another 6 moose (7%) were taken from unreported locations. Every community that harvested moose hunted in GMU 19A, and 3 communities harvested only from this area (Chuathbaluk, Crooked Creek, and Lower Kalskag). Aniak hunters hunted in 4 GMU subunits to harvest an estimated 46 moose, the largest harvest of the surveyed communities in Year 3 ( ). For the regulatory year, residents reported the land status of the harvest locations for nearly the entire moose harvest (86 of 88 moose, or 99% of the harvest) as unknown. In Year 3, more than twice as many moose were harvested in unknown locations than in Year 1 or Year 2. Table B18 shows moose harvests on state and federal land in Year The ADF&G Division of Wildlife Conservation subdivides each GMU into UCUs for more precision when generating harvest and effort statistics. 16
29 17!!!!!!!!! Aniak Crooked Creek Holy Cross Upper Kalskag Lower Kalskag Red Devil Sleetmute Stony River Chuathbaluk 19D D D D D D D D D D C D D D A D A A D C A B B B B B D D A B D D A B B A B B A A A A A A A A A A A A A A B B B B B B B A A A A D D E E A E E E E E E A A E A 0101 Map credit: Sally Timp Figure 2. Map of Central Kuskokwim region Uniform Coding Units (UCUs).
30 Caribou The Year 1 survey resulted in an estimated total harvest of 225 caribou (Table 7), more than twice the number of moose harvested in the same period. However, fewer households in the region reported using or attempting to harvest caribou than moose (tables 4 and 7). In Chuathbaluk, however, the estimated use of caribou was greater than that of moose. Overall, 48% of all households in the Central Kuskokwim region used caribou; 35% of households attempted to harvest caribou; and 25% of households successfully harvested 1 or more caribou (Table 7). Likely due to the variability of annual caribou migration routes, the Year 2 survey resulted in an estimated total harvest of 29 caribou (Table 8), an 87% reduction compared to the harvest of the previous year. The proportion of all households in the Central Kuskokwim region using caribou (24%) was one-half that of the previous year (48%) (tables 7 and 8). Fewer households attempted to harvest caribou in Year 2 than in Year 1, and only 4% of households successfully harvested 1 or more caribou, compared to 25% of households the previous year. Although all communities had households that hunted, only 5 communities harvested caribou, with a narrow range of success: from 8 caribou by Aniak residents to 3 caribou by Red Devil residents. Central Kuskokwim hunters harvested more caribou in Year 3 (63 animals) than in Year 2, but still considerably fewer than were harvested in Year 1 (tables 7, 8, and 9). The proportion of households in the area that used (24%) and attempted to harvest (24%) caribou was the same or nearly the same as Year 2, and the proportion of harvesting households, although still a small number, was twice that of Year 2 (9% compared to 4%) (tables 8 and 9). Of the 5 communities attempting to harvest, only 3 harvested caribou; the majority of animals (68%) were taken by Aniak; Upper Kalskag captured 25% of the harvest and Chuathbaluk took the rest (Table 9). The total harvest of 225 caribou in Year 1 included 84 bulls, 43 cows, and 98 caribou of unknown sex (Table B19). Lower Kalskag, Upper Kalskag, and Aniak harvested the greatest number of caribou, accounting for 78% (176 caribou) of the total taken by Central Kuskokwim communities. Harvests occurred in August and October through March. Sixty-one percent of the harvests was taken in December, January, and February. The total harvest of 29 caribou in year 2 comprised 20 bulls, 6 cows, and 3 caribou of unknown sex (Table B20). Lower Kalskag, Aniak, and Stony River harvested the greatest number of caribou, accounting for 75% (22 caribou) of the total harvest. In Year 2, caribou were harvested in fewer months than the previous year: hunting occurred in December, February, and March; and the majority of the harvests (71%) were accomplished in December and March. Unlike the 2 preceding years, the total harvest of 63 caribou in Year 3 was composed of an almost equal number of bulls (24) and cows (21), along with 19 animals of unknown sex (Table B21). Harvests occurred in every month except May, June, July, and October; the largest harvests were taken in December and January. In Year 1, households throughout GMU 19A reported poor accessibility to or availability of caribou during the project year even though harvests were considerable and a large percentage of hunters were successful. Although GMU 19A is included in the northern reaches of the migratory range of the Mulchatna caribou herd, residents said that caribou were often inaccessible or it required significant travel to hunt them. In all years, hunters from communities in the upper reaches of the Central Kuskokwim region, such as Stony River, Red Devil, and Sleetmute, reported that they did not have accessibility and availability of caribou. However, in all 3 years, the majority of harvests came from GMU 19A (tables B22, B23, and B24). In Year 1, every community harvested at least 1 caribou in GMU 19A; 68% of the total was harvested in 19A. Aniak, the top harvesting community, hunted and harvested in 5 UCUs of 19A. Lower Kalskag was the only community to harvest from GMU 18. Tables B25, B26, and B27 describe the percentages of caribou harvested on state and federal land in all study years. Table B23 summarizes the locations of caribou harvests for each project community by GMU and UCU during Year 2. Ninety-five percent of caribou were harvested in GMU 19A; 55% of those harvested in GMU 19A came from UCU 19A 0201, which is located south of Aniak, between the Aniak and Kuskokwim rivers. 18
31 Table 7. Estimated participation in the use and harvest of caribou, Central Kuskokwim communities, April 2003 March Using Percentage of households Attempting harvest Harvesting Receiving Giving away Total for community Estimated number of caribou harvested Per household Estimated hunter information Successful All hunters hunters b Percentage of population Harvest per hunter Harvest per hunter Community Percentage Low a High Number Number Aniak 61.0% 42.7% 25.6% 40.2% 23.2% % % Chuathbaluk 58.8% 35.3% 35.3% 52.9% 29.4% % % Crooked Creek 25.9% 14.8% 7.4% 22.2% 7.4% % % Lower Kalskag 35.3% 38.2% 29.4% 17.6% 20.6% % % Red Devil 66.7% 33.3% 25.0% 50.0% 16.7% % % Sleetmute 24.1% 10.3% 10.3% 24.1% 13.8% % % Stony River 52.9% 47.1% 29.4% 35.3% 23.5% % % Upper Kalskag 52.9% 47.1% 35.3% 29.4% 29.4% % % All communities 48.0% 35.3% 24.6% 32.9% 21.0% % % Source ADF&G Division of Subsistence household surveys, a. Low estimates are based on the actual reported take of caribou. b. Maximum of 1 successful hunter counted per caribou harvested. Per capita 95% confidence limit of total harvest
32 Table 8. Estimated participation in the use and harvest of caribou, Central Kuskokwim communities, April 2004 March Using Percentage of households Estimated number of caribou harvested Estimated hunter information b 95% confidence limit of total harvest Attemptin g harvest Harvesting Receiving Giving away Total for community Per household Per capita Percentage Low a High Number All hunters Percentage of population Harvest per hunter Successful hunters Harvest Number per hunter Community Aniak 23.9% 29.3% 2.2% 22.8% 0.0% % Chuathbaluk 41.2% 5.9% 0.0% 41.2% 0.0% % Crooked Creek 17.2% 31.0% 0.0% 17.2% 0.0% % Lower Kalskag 10.2% 6.8% 5.1% 5.1% 1.7% % Red Devil 50.0% 25.0% 25.0% 25.0% 12.5% % Sleetmute 17.6% 29.4% 0.0% 17.6% 0.0% % Stony River 60.0% 60.0% 20.0% 40.0% 0.0% % Upper Kalskag 30.0% 44.0% 6.0% 24.0% 6.0% % All communities 23.5% 26.4% 4.0% 19.9% 1.8% % Source ADF&G Division of Subsistence household surveys, a. Low estimates are based on the actual reported take of caribou. b. Hunter information was not collected for caribou.
33 Table 9. Estimated participation in the use and harvest of caribou, Central Kuskokwim communities, April 2005 March Using Percentage of households Attempting harvest Harvesting Receiving Giving away Estimated number of caribou harvested 95% confidence limit of total harvest Total for Per household Per Percentage of capita Percentage Low a High Number population Estimated hunter information Successful All hunters hunters b Harvest per hunter Harvest per hunter Community community Number Aniak 29.0% 36.3% 12.1% 20.2% 8.1% % % Chuathbaluk 23.8% 14.3% 9.5% 14.3% 0.0% % % Crooked Creek 17.6% 5.9% 0.0% 17.6% 0.0% % % Lower Kalskag 13.3% 6.7% 0.0% 13.3% 0.0% % % Red Devil 0.0% 10.0% 0.0% 0.0% 0.0% % % Sleetmute 15.8% 0.0% 0.0% 15.8% 0.0% % % Stony River 33.3% 0.0% 0.0% 33.3% 0.0% % % Upper Kalskag 26.5% 32.4% 14.7% 14.7% 8.8% % % All communities 23.6% 24.4% 8.5% 17.1% 5.0% % % Source ADF&G Division of Subsistence household surveys, a. Low estimates are based on the actual reported take of caribou. b. Maximum of 1 successful hunter counted per caribou harvested.
34 In Year 3, 95% of the harvest was from GMU 19: primarily GMU 19A, where 88% were harvested (Table B24). Six percent of the harvest was from GMU 19B. Households from Aniak reported harvests from a number of locations. In contrast, Upper Kalskag, the next most successful community, harvested from only 1 location. Residents reported that access to caribou varies annually, depending on the movements and proximity of the caribou herds such as the Mulchatna, Farewell-Big River, and Beaver Mountains herds. Caribou were often inaccessible to residents, or residents had to travel long distances in order to reach them, especially hunters from communities in the upper reaches of the Central Kuskokwim region, such as Stony River, Red Devil, and Sleetmute. However, in Year 1, households in Aniak, the community with the highest harvest of caribou (88 animals) and Chuathbaluk, which had a harvest of 18 caribou, overwhelmingly reported fair to good accessibility and availability of caribou (tables 7 and B28). Most households in Crooked Creek, Red Devil and Sleetmute reported availability to be poor (Table B28). In Year 2 of the survey ( ), most households in the entire region reported the availability of caribou as poor, consistent with the much lower harvest in Year 2 than in Year 1 (Table B29). Finally, in Year 3, 3 of the 5 communities that responded to this question overwhelmingly reported poor caribou availability (Table B30). The other 2 communities Aniak and Upper Kalskag reported more variable availability of caribou from poor to fair. Aniak and Upper Kalskag were 2 of the only 3 communities that harvested caribou in Year 3 ( ). Responses to the question of caribou availability 4 to 5 years ago and 9 to 10 years ago varied greatly, again, likely reflecting the fluctuations in sizes of caribou populations in addition to changing migration routes (Table B28) (Alaska Board of Game 2011). In Year 1, the greatest percentage of households in Aniak, Crooked Creek, and Stony River reported that caribou availability and accessibility 9 to 10 years prior was fair to good, though a measurable percentage of households still reported poor availability of caribou. The residents of Chuathbaluk, Lower Kalskag, and Upper Kalskag reported availability to have been poor to fair. An equal number of respondents (44%) in Red Devil reported availability to have been either poor or good, with 11% stating that it was fair. In Year 2, the majority of reporting households in all of the communities stated that caribou availability 9 to 10 years ago was fair to good, however, 40% of households in Sleetmute also described caribou availability as poor (Table B29). In Year 3, of those communities that provided responses (Aniak, Chuathbaluk, Crooked Creek, Red Devil, and Upper Kalskag), all said that caribou availability and accessibility 9 to 10 years prior was fair to good (Table B30). Black Bears In Year 1, hunters from 7 of the 8 survey communities harvested an estimated total of 28 black bears (Table 10). Community harvests ranged from 1 bear to 11 bears, with the exception of Aniak, which had no reported harvest; residents there also reported the lowest uses (1% of households) and fewest households attempting to harvest (2%) black bears. Crooked Creek reported a much larger black bear harvest than any other community: an estimated 11 black bears (39% of total harvest). Hunters from Chuathbaluk, Sleetmute, and Stony River were the most successful; each household that hunted was successful in harvesting at least 1 bear. Table B1 shows the percentage of households using various parts of the resource for Relatively small percentages of households in each community used black bear, but of those that did, most used the meat and fat. Black bear harvests in Year 1 included 18 males (64%), 1 female (5%), and 9 bears (31%) of unknown sex (Table B31). Harvests occurred primarily during the summer, over the months of June, July, August, and September, with the exception of 2 bears (7%) taken in April. Over one-third of the total was harvested during August (10 bears, or 36%). In Year 2, an estimated total of 40 black bears was harvested by hunters from the 8 survey communities (Table 11). Every project community reported harvesting at least 1 black bear. Hunters from Lower Kalskag and Red Devil had high success rates: households that reported hunting also reported harvesting. Red Devil reported the largest harvest: 9 black bears (22% of the regional total). The highest percentage of households using black bears occurred in Crooked Creek (41%), while the lowest occurred in Aniak (4%). Black bear harvests consisted of 21 males (53%), 3 females (7%), and 16 bears (41%) of unreported sex (Table 22
35 Table 10. Estimated participation in the use and harvest of black bear, Central Kuskokwim communities, April 2003 March Using Percentage of households Attempting harvest Harvesting Receiving Giving away Estimated number of black bears harvested 95% confidence limit of total harvest Total for community Per household Per capita Estimated Hunter Information Successful All hunters hunters b Percentage of population Harvest per hunter Harvest per hunter Community Percentage Low a High Number Number Aniak 1.2% 2.4% 0.0% 1.2% 0.0% % % Chuathbaluk 29.4% 11.8% 11.8% 17.6% 5.9% % % Crooked Creek 18.5% 22.2% 18.5% 0.0% 11.1% % % Lower Kalskag 8.8% 8.8% 2.9% 5.9% 2.9% % % Red Devil 16.7% 16.7% 8.3% 8.3% 0.0% % % Sleetmute 3.4% 3.4% 3.4% 0.0% 0.0% % % Stony River 11.8% 11.8% 11.8% 5.9% 11.8% % % Upper Kalskag 14.7% 23.5% 8.8% 5.9% 8.8% % % All communities 9.5% 10.3% 6.0% 4.0% 4.0% % % Source ADF&G Division of Subsistence household surveys, a. Low estimates are based on the actual reported take of black bear. b. Maximum of 1successful hunter counted per black bear harvested.
36 Table 11. Estimated participation in the use and harvest of black bear, Central Kuskokwim communities, April 2004 March Using Percentage of households Estimated number of black bears harvested Estimated hunter information 95% confidence limit of total harvest All hunters Attempting harvest Harvesting Receiving Giving away Total for community Per household Per Percentage of capita Percentage Low a High Number population Harvest per hunter Successful hunters b Harvest per hunter Community Number Aniak 4.3% 9.8% 4.3% 1.1% 3.3% % % Chuathbaluk 11.8% 11.8% 5.9% 5.9% 5.9% % % Crooked Creek 41.4% 51.7% 17.2% 24.1% 6.9% % % Lower Kalskag 8.5% 5.1% 5.1% 5.1% 0.0% % % Red Devil 12.5% 12.5% 12.5% 0.0% 12.5% % % Sleetmute 17.6% 11.8% 5.9% 11.8% 0.0% % % Stony River 40.0% 40.0% 20.0% 20.0% 20.0% % % Upper Kalskag 6.0% 16.0% 6.0% 0.0% 6.0% % % All communities 11.6% 15.2% 6.9% 5.4% 4.0% % % Source ADF&G Division of Subsistence household surveys, a. Low estimates are based on the actual reported take of black bear. b. Maximum of 1 successful hunter counted per black bear harvested.
37 Table 12. Estimated participation in the use and harvest of black bear, Central Kuskokwim communities, April 2005 March Using Percentage of households Estimated number of black bears harvested Estimated hunter information 95% confidence limit of total harvest All hunters Attempting harvest Harvesting Receiving Giving away Total for community Per household Per Percentage of capita Percentage Low a High Number population Harvest per hunter Successful hunters b Harvest per hunter Community Number Aniak 11.3% 14.5% 4.0% 7.3% 3.2% % % Chuathbaluk 14.3% 9.5% 9.5% 4.8% 9.5% % % Crooked Creek 35.3% 17.6% 11.8% 23.5% 5.9% % % Lower Kalskag 16.7% 6.7% 3.3% 13.3% 3.3% % % Red Devil 0.0% 0.0% 0.0% 0.0% 0.0% % % Sleetmute 0.0% 0.0% 0.0% 0.0% 0.0% % % Stony River 33.3% 0.0% 0.0% 33.3% 0.0% % % Upper Kalskag 11.8% 17.6% 5.9% 5.9% 2.9% % % All communities 12.8% 12.0% 4.7% 8.1% 3.5% % % Source ADF&G Division of Subsistence household surveys, a. Low estimates are based on the actual reported take of black bears. b. Maximum of 1 successful hunter counted per black bear harvested.
38 B32). Of the few households that used black bear, most used the meat and fat (Table B2). There was also measureable use of the black bear hides. Year 2 harvests occurred primarily during the months of April, May, and September, in contrast to the Year 1 harvests, which occurred primarily during June through September. Thirteen bears were harvested in September, likely in conjunction with moose hunting. At least 2 bears each month were taken during June, July, August, and March. In Year 3, estimated harvest of black bears was 29 animals, which was similar to the Year 1 harvest (Table 12). Communities that hunted black bears harvested a range of 3 bears at Lower Kalskag to 8 bears in Upper Kalskag. Three communities did not attempt to harvest black bears (Red Devil, Sleetmute, and Stony River). Nearly all harvested bears were male (23 bears, or 79%) (Table B33). Four females and 2 bears of unknown sex composed the rest of the harvest. Black bears were harvested from April through October; the majority (57%) were taken in September. As with moose, fewer households reported using black bear in (Table B3). Of the households that used black bear, between 20% and 100% reported using the meat, and 17% to 100% of households reported using the fat. The locations of black bear harvests for each community are summarized by GMU and UCU in tables B34, B35, and B36. In Year 1, the majority of black bears were harvested in GMU 18 and GMU 19A (Table B34). Lower Kalskag hunters harvested bears only in GMU 18, while Chuathbaluk, Crooked Creek, Red Devil, Sleetmute, and Stony River residents harvested bears exclusively in GMU 19A. Upper Kalskag residents harvested bears in both units, and they took 2 bears from unreported locations. With the exception of Upper Kalskag, where at least 3 hunting locations were reported, communities whose residents hunted black bears did so in only the 1 or 2 UCUs closest to their communities. Tables B37, B38, B39 describe the percentages of black bears harvested on state and federal land in each study year. In Year 2, harvests occurred in 2 more identified units than were reported in Year 1, which may have been a factor in the relatively large harvest in (tables B34 and B35). Black bears were harvested in GMU 18, GMU 19A, GMU 19D, and GMU 21A (Table B35). However, households in Aniak, Chuathbaluk, Crooked Creek, Sleetmute, and Stony River harvested bears in GMU 19A only. Red Devil hunters harvested bears exclusively in GMU 21A. Upper Kalskag residents reported harvesting bears in both GMU 18 and GMU 19, and they also harvested 2 bears from unknown locations. With the exception of Lower Kalskag, Crooked Creek, and Aniak, whose households hunted in at least 3 locations, communities that reported hunting black bears used only 1 or 2 locations. In Year 3, harvests occurred in 3 GMUs: 18, 19A, and 21E (Table B36). The majority (82%) of black bear harvests occurred in GMU 19A. Three communities harvested exclusively in this unit (Chuathbaluk, Crooked Creek, Lower Kalskag). In all 3 years, most communities harvested black bears from only 1 or 2 UCUs (tables B34, B35, B36). However, Crooked Creek residents during Year 2 and Year 3 reported harvesting from 3 UCUs, as did Lower Kalskag residents in Year 2 and Upper Kalskag residents in Year 3. Aniak residents harvested from 4 UCUs in both Year 2 and Year 3. Brown Bears The reported harvest of brown bears in the Central Kuskokwim area remained small throughout the study years. Aniak households harvested an estimated 2 brown bears in Year 1 (Table 13). Both were male, both were taken in May, and both came from GMU 19A, UCU 0103 (tables B40 and B41). Tables B42, B43, and B44 describe the percentages of brown bears harvested on state and federal land in each study year. Only 1% of households in Aniak reported use of brown bears, and no other communities reported uses or attempted harvest. Only 1 brown bear was taken in Year 2, reported by a household in Lower Kalskag (Table 14). The harvested bear was male and was taken in an unknown month from GMU 19A, UCU 0101 (tables B45 and B46). In Year 3, Aniak residents harvested an estimated total of 3 bears in GMU 21E and other, unknown locations; months of harvest are unknown (tables 15, B47, and B48). 26
39 Table 13. Estimated participation in the use and harvest of brown bear, Central Kuskokwim communities, April 2003 March Using Percentage of households Attempting harvest Harvesting Receiving Giving away Estimated number of brown bears harvested 95% confidence limit of total harvest a Estimated hunter information Successful All hunters hunters b Community Total for community Per household Per capita Percentage Low High Number Percentage of population Harvest per hunter Harvest Number per hunter Aniak 1.2% 2.4% 1.2% 0.0% 0.0% % % Chuathbaluk 0.0% 0.0% 0.0% 0.0% 0.0% % % Crooked Creek 0.0% 0.0% 0.0% 0.0% 0.0% % % Lower Kalskag 0.0% 0.0% 0.0% 0.0% 0.0% % % Red Devil 0.0% 0.0% 0.0% 0.0% 0.0% % % Sleetmute 0.0% 0.0% 0.0% 0.0% 0.0% % % Stony River 0.0% 0.0% 0.0% 0.0% 0.0% % % Upper Kalskag 0.0% 0.0% 0.0% 0.0% 0.0% % % All communities 0.4% 0.8% 0.4% 0.0% 0.0% % % Source ADF&G Division of Subsistence household surveys, a. Only 1 brown bear harvest was reported, so no confidence interval could be calculated. Low and high estimates are based on reported and expanded numbers. b. Maximum of 1 successful hunter counted per brown bear harvested.
40 Table 14. Estimated participation in the use and harvest of brown bear, Central Kuskokwim communities, April 2004 March Using Percentage of households Estimated number of brown bears harvested Estimated hunter information b 95% confidence limit of total harvest a All hunters Attempting harvest Harvesting Receiving Giving away Total for community Per household Per Percentage of capita Percentage Low High Number population Harvest per hunter Successful hunters Community Number Aniak 0.0% 2.2% 0.0% 0.0% 0.0% % Chuathbaluk 0.0% 0.0% 0.0% 0.0% 0.0% % Crooked Creek 0.0% 0.0% 0.0% 0.0% 0.0% % Lower Kalskag 3.4% 1.7% 1.7% 3.4% 0.0% % Red Devil 12.5% 0.0% 0.0% 12.5% 0.0% % Sleetmute 0.0% 0.0% 0.0% 0.0% 0.0% % Stony River 0.0% 0.0% 0.0% 0.0% 0.0% % Upper Kalskag 0.0% 2.0% 0.0% 0.0% 0.0% % All communities 1.1% 1.4% 0.4% 1.1% 0.0% % Source ADF&G Division of Subsistence household surveys, a. Only 1 brown bear harvest was reported, so no confidence interval could be calculated. Low and high estimates are based on reported and expanded numbers. b. Hunter information was not collected for brown bear. Harvest per hunter
41 Table 15. Estimated participation in the use and harvest of brown bear, Central Kuskokwim communities, April 2003 March Using Percentage of households Estimated number of brown bears harvested Estimated hunter information 95% confidence limit of total harvest a Attempting harvest Harvesting Receiving Giving away Total harvest for Per household All hunters Per Percentage of capita Percentage Low High Number population Harvest per hunter Successful hunters b Harvest per hunter Community community Number Aniak 2.4% 7.3% 1.6% 0.8% 0.0% % % Chuathbaluk 0.0% 0.0% 0.0% 0.0% 0.0% % % Crooked Creek 0.0% 0.0% 0.0% 0.0% 0.0% % % Lower Kalskag 0.0% 0.0% 0.0% 0.0% 0.0% % % Red Devil 0.0% 0.0% 0.0% 0.0% 0.0% % % Sleetmute 0.0% 0.0% 0.0% 0.0% 0.0% % % Stony River 0.0% 0.0% 0.0% 0.0% 0.0% % % Upper Kalskag 0.0% 0.0% 0.0% 0.0% 0.0% % % All communities 1.2% 3.5% 0.8% 0.4% 0.0% % % Source ADF&G Division of Subsistence household surveys, a. Only 1 brown bear harvest was reported, so no confidence interval could be calculated. Low and high estimates are based on reported and expanded numbers. b. Maximum of 1 successful hunter counted per brown bear harvested.
42 Gray Wolves An estimated total of 72 gray wolves were harvested in the area in Year 1; 45 in Year 2; and 83 in Year 3 (tables 16, 17, and 18). In all 3 years, all households that attempted to harvest wolves were successful. Wolf hunting appears to be a specialized household pursuit: although few households in Aniak reported any use of wolves or attempts to harvest them, hunters from this community overwhelmingly took most of the harvests in all years, especially in Years 2 and 3. Aniak hunters took more than one-half (38 wolves, or 53%) of the total harvest in Year 1; 30 wolves, or 68% in Year 2; and 52 wolves, or 62% in Year 3, largely due to the efforts of a few Aniak trappers. Upper Kalskag obtained the second largest harvests in Year 1 and Year 3, (19 and 20 wolves, respectively). Other communities exhibited a fair amount of variation in participation over the 3 years. In all years, the majority of gray wolves were taken in the fall and winter months of October through March (tables B49, B50, B51). A large proportion (31%) of the harvest in Year l was taken in unknown months, compared with years 2 and 3. Year 2 had 2 wolf harvests and Year 3 had 3 wolf harvests in unknown months. In all years, more male gray wolves than females were harvested: 15 males (20%) in Year 1, 19 males (43%) in Year 2, and 27 males (33%) in Year 3. Of the total harvested in Year 1, 52 wolves (72%) were of an unknown sex; in Year 2, 9 wolves (20%) were unknown; and in Year 3, almost one-half (39 wolves, or 46%) were of unknown sex. Gray wolves were taken primarily from GMU 19A in all years: 61% in Year 1, 80% in Year 2, and 79% in Year 3 (tables B52, B53, and B54). In Year 1, the rest of the harvest was from GMU 19B and at least 2 unknown UCUs (the site of one of the harvests from an unknown location was in GMU 19A, but the specific UCU was not reported). Tables B55, B56, and B57 describe the percentages of gray wolves harvested on state and federal land. In Year 2, gray wolves were harvested from GMU 21E as well as GMU 19A. In contrast, in Year 3, in addition to GMU 19A, hunters used 3 units, including GMU 18, GMU 19B, and GMU 21E. Residents used a total of 8 UCUs the first year, though, in general, each community used only 2 or 3 UCU locations. In the second year, residents used a total of 7 UCUs, though most communities generally used 1 or 2 UCUs. Many more UCUs were hunted in Year 3, totaling 14 UCUs and at least 2 unknown UCUs. 30
43 Table 16. Estimated participation in the use and harvest of gray wolf, Central Kuskokwim communities, April 2003 March Using Percentage of households a Estimated number of gray wolves harvested Estimated hunter information Attempting harvest Harvesting Receiving Giving away 95% confidence limit of total harvest All hunters Successful hunters c Community Total for community Per household Per capita Percentage Low b High Number Percentage of population Harvest per hunter Harvest Number per hunter Aniak 4.9% 4.9% 4.9% 0.0% 2.4% % % Chuathbaluk 0.0% 0.0% 0.0% 0.0% 0.0% % % Crooked Creek 18.5% 18.5% 18.5% 0.0% 3.7% % % Lower Kalskag 0.0% 0.0% 0.0% 0.0% 0.0% % % Red Devil 25.0% 25.0% 25.0% 0.0% 0.0% % % Sleetmute 6.9% 6.9% 6.9% 0.0% 0.0% % % Stony River 0.0% 0.0% 0.0% 0.0% 0.0% % % Upper Kalskag 11.8% 11.8% 11.8% 0.0% 2.9% % % All communities 7.1% 7.1% 7.1% 0.0% 1.6% % % Source ADF&G Division of Subsistence household surveys, a. Percentages of households harvesting and attempting harvest are based on households reporting successful harvest. b. Low estimates are based on the actual reported take of gray wolves. c. Maximum of 1 successful hunter counted per gray wolf harvested.
44 Table 17. Estimated participation in the use and harvest of gray wolf, Central Kuskokwim communities, April 2004 March Using Percentage of households a Estimated number of gray wolves harvested Estimated hunter information Attempting harvest Harvesting Receiving Giving away Total for Per 95% confidence limit of total harvest All hunters Per Percentage of capita Percentage Low b High Number population Harvest per hunter Successful hunters c Harvest per hunter Community community household Number Aniak 6.5% 6.5% 6.5% 0.0% 0.0% % % Chuathbaluk 5.9% 5.9% 5.9% 0.0% 0.0% % % Crooked Creek 0.0% 0.0% 0.0% 0.0% 0.0% % % Lower Kalskag 0.0% 0.0% 0.0% 0.0% 0.0% % % Red Devil 12.5% 12.5% 12.5% 0.0% 12.5% % % Sleetmute 5.9% 5.9% 5.9% 0.0% 0.0% % % Stony River 0.0% 0.0% 0.0% 0.0% 0.0% % % Upper Kalskag 4.0% 4.0% 4.0% 0.0% 2.0% % % All communities 4.0% 4.0% 4.0% 0.0% 0.7% % % Source ADF&G Division of Subsistence household surveys, a. Percentages of households harvesting and attempting harvest are based on households reporting successful harvest. b. Low estimates are based on the actual reported take of gray wolves. c. Maximum of 1 successful hunter counted per gray wolf harvested.
45 Table 18. Estimated participation in the use and harvest of gray wolf, Central Kuskokwim communities, April 2005 March Using Percentage of households a Estimated number of gray wolves harvested Estimated hunter information Attempting harvest Harvesting Receiving Giving away Total harvest for Per household 95% confidence limit of total harvest All hunters Per Percentage of capita Percentage Low b High Number population Harvest per hunter Successful hunters c Harvest per hunter Community community Number Aniak 8.9% 5.6% 5.6% 4.0% 3.2% % % Chuathbaluk 4.8% 4.8% 4.8% 0.0% 0.0% % % Crooked Creek 5.9% 5.9% 5.9% 0.0% 0.0% % % Lower Kalskag 0.0% 0.0% 0.0% 0.0% 0.0% % % Red Devil 0.0% 0.0% 0.0% 0.0% 0.0% % % Sleetmute 0.0% 0.0% 0.0% 0.0% 0.0% % % Stony River 33.3% 33.3% 33.3% 0.0% 0.0% % % Upper Kalskag 14.7% 11.8% 11.8% 2.9% 0.0% % % All communities 7.4% 5.4% 5.4% 2.3% 1.6% % % Source ADF&G Division of Subsistence household surveys, a. Percentages of households harvesting and attempting to harvest are based on households reporting successful harvest. b. Low estimates are based on the actual reported take of gray wolves c. Maximum of 1 successful hunter counted per gray wolf harvested.
46 4. DISCUSSION AND CONCLUSIONS Sample Sizes and Results The accuracy of household surveys is dependent on the in-person collection of data and the sampling method. The results of this project were significant because they were obtained from substantial samples, in terms of the proportions of total households surveyed (at least one-half of total households areawide). The sampled total population of 903 people represented 61% of the total estimated population (tables 1, 2, and 3). The survey also used a method which has become standard in these types of projects (Andersen et al. 1998, 2000, 2001, 2004; Brown and Koster 2005; Brown et al. 2004a). Year 1 and Year 3 were very similar in terms of estimated human population sizes, number of surveyed households, and number of household members surveyed, while the sample in Year 2 represented a slight increase in surveyed households and household members. In all 3 years, there was a high degree of community involvement, so that surveys were completed in over one-half (59% and 56%) of total households in Year 1 and Year 3 and nearly three-quarters (70%) of total households in Year 2. Comparisons to Earlier Research In general, the Central Kuskokwim region has not been the subject of significant qualitative or quantitative research attention to subsistence practices and concerns. Prior to this big game research, 2 projects collected big game harvest data in this area. The first was conducted by Division of Subsistence researchers in Chuathbaluk and Sleetmute from June 1982 through May 1983 (Charnley 1984). Data were obtained from key respondent interviews, geospatial mapping of harvest use areas, participant observation, and household surveys of all moose hunters that included questions about harvest, sharing, hunt location, seasonality, and hunter effort. In , Chuathbaluk had an estimated human population of 132 individuals in 29 households, and Sleetmute s population was approximately 101 people in 28 households, similar to the contemporary community sizes estimated in the current project. A baseline project was conducted from October 1983 to April 1984 in Stony River (Kari 1985). Kari s methods included participant observation, geospatial mapping of harvest use areas, and key respondent interviews. However, Kari s work did not include the collection of quantitative data that assessed household or community harvests of subsistence resources. Additionally, in 1979 and again in 1981, the Division of Subsistence conducted food surveys in the Central Kuskokwim communities (Stony River, Sleetmute, Red Devil, Georgetown, Chuathbaluk, Upper Kalskag, and Lower Kalskag) (Charnley 1984; Jonrowe 1980; Stickney 1981). These surveys were designed to collect information about the subsistence resources used by Central Kuskokwim communities, along with general seasonal resource utilization patterns. As a result, these surveys contribute limited comparable quantitative information on moose harvests and uses. The 1979 survey focuses specifically on moose and provides community harvest estimates based on data from 48% of area households (Jonrowe 1980). The project was very limited in scope, however, and a detailed review revealed a number of methodological problems (Stickney 1981). Where relevant, data from Jonrowe s (1980) report will be introduced in the following discussion. Moose Comparison of the results from this project with results from earlier projects suggested continuity in customary harvests and uses of moose, although data from the 1980s were incomplete and not directly comparable with the household data in this project. In all Central Kuskokwim communities, moose was the largest or second largest protein source, behind fish, especially Pacific salmon Oncorhynchus spp and whitefishes Coregonus, Prosopium, and Stenodus spp. 34
47 In the 1970s and early 1980s, most area households attempted to harvest moose (Charnley 1984; Jonrowe 1980; Stickney 1981). In Stony River, hunters noted the importance of moose, which, they said, was a large animal that yielded more meat than caribou. Stony River residents also commented that moose meat had a better flavor and higher nutritional value than caribou. Although only active hunters were interviewed in Chuathbaluk and Sleetmute, results from both communities indicated that most households attempted to harvest 2 moose annually. Although many (65%) Stony River households hunted for moose, success was rare: 24% of households harvested 4 moose, a success rate comparable to that in this project (Kari 1985; tables 4, 5, and 6). Kari (1985) and Charnley (1983) reported that moose was shared widely among households in Stony River, Sleetmute, and Chuathbaluk, a finding consistent with data in this project for Year 1 and Year 3 (tables 4, 5, and 6). In Year 2, Stony River residents did not report harvesting any moose; however, they did report using and receiving moose, perhaps from another community, or perhaps from unsurveyed households. Similarly, Charnley (1983) describes case studies of meat distribution and sharing by Chuathbaluk and Sleetmute hunters in Although Stony River residents indicated that they often hunted moose year-round, in , they reported hunting moose only during the fall and winter established seasons (September, November, December, and February); the majority of the harvest occurred in September (Kari 1985). The harvest patterns for this project were therefore consistent with data from early projects: most moose were taken in September in all 3 years (tables B10, B11, and B12). Stony River residents appear to be beginning to use a different area for harvesting moose than they used previously, although firm conclusions are difficult to draw with a small number of years to compare. For example, in the early 1980s, Stony River residents reported hunting primarily on the Kuskokwim, Stony, and Swift rivers, as well as the Tatlawiksuk, Big, and Holitna rivers. Most moose were taken within onehalf mile of the rivers (Kari 1985). Between 2003 and 2006, the use area around Stony River changed considerably from that described in 1983; in , Stony River residents used largely the same area, and in , they were reporting harvests in other areas (tables B13, B15, and B17). This change was likely the result of a decreased local moose population that forced hunters into nearby areas to harvest. Another clearly continued trend has been residents concerns about low abundance of moose and the related difficulties of harvesting them. One way to quantify these concerns is through success rates and measurements of hunter effort. Looking specifically at Chuathbaluk and Sleetmute in the September season only (when the majority of harvest takes place), 72% of Chuathbaluk households and 57% of Sleetmute households attempted to harvest moose (Charnley 1983). In contrast, averages of 33% of Chuathbaluk households and 44% of Sleetmute households hunted between 2003 and 2006, a notable decline in both communities (tables 4, 5, and 6). According to Charnley (1983), 7 Chuathbaluk households (24%) successfully harvested a moose, compared to a 3-year average of 11% between 2003 and 2006 (tables 4, 5, and 6). Similarly, 12 Sleetmute households, or 43% of the community, successfully harvested a moose in , but between , only 14% of Sleetmute households were able to harvest a moose (Charnley 1983; tables 4, 5, and 6). Both communities have experienced significant declines in both the number of hunting households and their success rates between and , attesting to residents concerns over declining moose populations, increased difficulties of successfully harvesting a moose, and resulting regulatory restrictions on moose harvesting. Success rates are also reflected in the per household moose harvest for a community. With some exceptions, average household moose harvest rates declined, both compared to earlier projects and during the three years of this project. Success rates in resulted in averages of 0.6 moose harvested per household in Chuathbaluk and 0.7 moose per household in Sleetmute (Charnley 1983; Table 19). Between 2003 and 2006, the average harvest level of moose was 0.1 moose per household in both Chuathbaluk and Sleetmute (Table 19). Within the survey years, average moose harvested per household regionwide did not change much, from 0.3 in Year 1, to 0.2 in both Year 2 and Year 3. There was more variation at the community level: per household harvest levels in Aniak increased in Year 2 and Year 3 compared to Year 1, and both Crooked Creek and Stony River per household harvest levels declined in Year 2, but increased considerably in Year 3. The percentage of successful households areawide over the 3 years clustered around 35
48 Table 19. Moose harvests per household, Central Kuskokwim communities, and Per household moose harvest Community Aniak No data available Chuathbaluk Crooked Creek No data available Lower Kalskag No data available < 0.1 Red Devil No data available Sleetmute Stony River No data available Upper Kalskag No data available All communities No data available Source Charnley 1984; ADF&G Division of Subsistence household surveys, 2004, 2005, and %, but uses of moose by households over the 3 years ranged from 61% to 76% for all communities (tables 4, 5, and 6). As noted in the Introduction, previous research has demonstrated that in many small communities a small subset of super-households harvest most of the communities wild resources (Wolfe 1987; Wolfe et al. 2010). A second way to quantify local concerns about low moose densities and increased hunting competition is through an analysis of hunter effort, or the amount of time it takes a hunter to harvest a moose. Hunter effort has been analyzed elsewhere as one indicator of the health of a particular moose population (Andersen et al. 2004; Brown et al. 2004a; Brown et al. 2004b). Increasing hunter effort may indicate that moose are less available, thus necessitating more time in the field for successful hunters. Charnley asked hunters to document how many days they spent in pursuit of moose in (Charnley 1983). Considering the September hunts only, all Chuathbaluk hunters reported an average of 69 hunter-days per moose harvested in , and Sleetmute hunters reported an average of 10 hunter-days per moose harvested. Considering the total number of days spent by all Chuathbaluk hunters in the field in pursuit of moose, Chuathbaluk hunters spent an average of 61 hunter-days per moose harvested between 2003 and Sleetmute hunters reported an average of 61 hunter-days spent in pursuit of moose. This appears to be an increase in the amount of time spent hunting moose in Sleetmute and roughly the same amount of time invested by Chuathbaluk hunters over time, which is also consistent with the concerns expressed by local residents about increasing difficulty in harvesting moose. Additionally, moose population surveys during this time documented significant declines in the area moose populations (Seavoy 2006). It is likely that the declines in total harvests were related to declining abundance rather than reduced hunting effort, because the number of days spent hunting by successfully harvesting households increased. In summary, this project documented the importance of moose as a staple in the Central Kuskokwim area. It also highlighted the increasing amount of time needed to harvest a moose, the potentially greater travel necessary for a significant harvest or the utilization of different use areas, and a low success rate, in terms of proportions of successful hunters, in all 3 years. Caribou Central Kuskokwim households considered caribou to be an important food source; they used it to supplement moose harvests in all 8 project communities. Central Kuskokwim communities harvested 225 caribou in Year 1, 29 in Year 2, and 63 in Year 3 (tables 7, 8, and 9). According to Charnley (1984:221), Chuathbaluk and Sleetmute residents rarely went caribou hunting because the long distances required to reach the caribou and the animals wide distribution in small, scattered groups meant a significant investment of time, effort, and money that was not worth the 2 animal bag limit in However, the Year 1 data from Chuathbaluk suggest that the situation has changed since the mid-1980s; in , Chuathbaluk households reported good access and good harvests. Regulations in allowed for the harvest 36
49 of up to 5 caribou (Woolington 2005). More than one-third of households at Chuathbaluk attempted to hunt and successfully harvested 18 caribou in Year 1 (Table 7). In Year 2, however, very few households (6%) attempted to harvest caribou, and none were successful, perhaps reflecting residents knowledge that the caribou were not easily accessible in (Table 8). In Year 3, there was a greater attempt to harvest compared to the previous year: 14% of households attempted to harvest caribou in Year 3 (Table 9). However, Chuathbaluk was 1 of only 3 communities that successfully harvested caribou in Year 3. The variation in the sizes of the caribou harvests, as well as in the level of community interest in hunting caribou, reflected the uncertain accessibility of caribou from the location of these communities at the northern edge of the Mulchatna herd s range. In contrast with Chuathbaluk and Sleetmute in the 1980s, most households in Stony River in hunted caribou every year to supplement moose meat and to provide a welcome change of diet (Kari 1985). Stony River households reported a tendency to focus greater effort on hunting caribou during years when moose meat was insufficient. In Year 1 and Year 2 of this project, a significant percentage of households in Stony River hunted caribou (47% and 60%, respectively) and were successful (29% and 20%), in spite of the overall low harvest in Year 2, a harvest and use pattern consistent with that reported for the 1980s (tables 7 and 8). However, in Year 3, no households in Stony River reported attempting to harvest caribou (Table 9). Kari (1985) documented that Stony River hunters used the flats between the Cheneetnuk and Tatlawiksuk rivers, between the Swift and Stony rivers, and between the Stony and Holitna rivers for caribou hunting; Stony River hunters used generally the same areas between 2003 and Not surprisingly, communities reported satisfaction with caribou hunting in Year 1, when 58% of hunters reported success (Table 7). In spite of the significant decline in Year 2 harvests compared with those in Year 1, approximately the same proportion of households that hunted in Year 2 also hunted in Year 3 (tables 7, 8, and 9). The variation in annual harvest numbers in the 3 years of this project reflected the variable migratory routes of Mulchatna caribou in spite of the fact that GMU 19A, which provided most of the harvests each year, included the northern reaches of the migratory range of the Mulchatna caribou herd. In summary, the results of this project suggested that caribou played an important role in the diet of Central Kuskokwim residents, second only to moose, but there was considerable variation in success from year to year, depending on the migration routes of the caribou. Black Bears In this project, only a small fraction of the area s households attempted to harvest black bears, ranging from 10% to 15% (tables 10, 11, and 12). Hunters from each community except Aniak made a combined harvest of 28 black bears; Crooked Creek hunters took the largest number (11 bears, 38% of the total harvest) (Table 10). Year 2 harvests were nearly 50% more (40) than those of Year 1, and every community harvested at least 1 bear (Table 11). In Year 3, the estimated harvest of black bears was 29, 28% lower than the previous year, but nearly identical with the Year 1 harvest (tables 10, 11, and 12). Hunting for bears occurred in 1 UCU that was used almost exclusively for black bear hunting by the community in the unit. In earlier projects, Charnley (1984) and Kari (1985) reported data on black bear hunting. Charnley (1984) estimated that Chuathbaluk residents harvested a total of 6 black bears in the season, levels which closely match harvest estimates between 2003 and 2006 (tables 10, 11, and 12). Additionally, Charnley (1984) reported that Chuathbaluk hunters took more bears than Sleetmute hunters, which residents attributed to the higher number of fish camps located near berry patches, both of which attracted bears. This pattern persisted in this project: Sleetmute harvests were one-half of those taken by Chuathbaluk hunters in Year 1 and Year 2, and Sleetmute residents did not hunt or harvest black bears in Year 3. The early ethnographic sources also provided a way to compare the seasonality and locations of harvests. Chuathbaluk and Sleetmute residents hunted black bears in the fall and summer, while at fish camp and while berry picking (Charnley 1984). In contrast, Stony River residents harvested black bears in spring, when sources of fresh meat were scarce (Kari 1985). Between 2003 and 2006, these 3 communities reported harvests in fall months only, except for 2 bears by Sleetmute hunters in May of (tables B31, 37
50 B32, and B33). As with moose, Stony River residents hunted black bear along the Swift and Stony rivers between 2003 and Kari s (1985) description of the location of Stony River residents black bear harvests was also corroborated during this project. In summary, few households in the area attempt to harvest black bears. The project documented considerable variation in community interest in harvesting black bears and in the total annual harvests over time. Brown Bears The minimal harvest of brown bears by Central Kuskokwim hunters between 2003 and 2006 is consistent with earlier quantitative and ethnographic accounts of brown bear hunting in the area. According to Charnley (1984), adult brown bears were generally only taken for their hides, because residents considered the meat of mature brown bears tough and ill-tasting, although the meat from brown bear cubs was considered desirable. No brown bears were harvested during the project period by Chuathbaluk nor Sleetmute residents. Charnley (1984) noted that most of the brown bears killed in years prior to that project were nuisance animals or were considered to be threats to human safety. Kari (1985) reported that Stony River residents no longer harvested brown bears for food. She suggested that residents stopped hunting brown bears in the 1940s. Results from this project suggested that the pattern of harvesting brown bears only in defense of life or property has continued. Gray Wolves A small proportion of households in all 3 years in this project attempted to harvest and actually harvested gray wolves (tables 16, 17, and 18). Three communities reported no participation in wolf harvesting (Chuathbaluk, Lower Kalskag, and Stony River). Charnley (1984) reported that Chuathbaluk and Sleetmute trappers considered gray wolves uncommon in the Central Kuskokwim area. Most trappers took only a few, if any, wolves in a season. Data from the surveys confirmed the minimal use or hunting of wolves by Chuathbaluk and Sleetmute residents (tables 16, 17, and 18). However, these data also documented more substantial harvests of wolves in other communities, such as Aniak (38 wolves) and Upper Kalskag (19 wolves). This increase may have reflected community efforts to control wolf predation on moose; many residents perceived that wolves were too numerous in the region and were negatively affecting Central Kuskokwim moose populations. The Role of Household Harvest Data in Regulatory Issues Survey data from this project suggested that moose availability in the Central Kuskokwim region for customary and traditional uses declined over the 3 survey years. These long-standing local concerns about declining moose populations were later corroborated by the updated Division of Wildlife Conservation moose population estimates (Seavoy 2006). During its March and May 2006 meetings, the BOG implemented regulatory restrictions to subsistence. With very few exceptions, data reviewed for all 3 project years, including the numbers of animals harvested, hunter success rates, the investment of hunter time needed for success, and per household moose harvest, reflected the increasing difficulties Central Kuskokwim River community residents faced when attempting to harvest moose for customary and traditional uses. Comparisons with data from earlier projects, although very limited, also supported the view that both the moose population and hunting success levels have declined. These data, along with updated moose population data, were critical to the BOG s decisions regarding subsistence hunting restrictions and establishment of an intensive management program. This project highlighted the vulnerability of moose populations in the Central Kuskokwim area. One recommendation stemming from this project is to establish regular mechanisms that would more closely assess moose abundance, both through projects led by Division of Wildlife biologists as well as household or community survey projects led by Division of Subsistence resource specialists. We also recommend that hunters who live in the communities be more systematically involved when providing their input and assessments. The Central Kuskokwim Fish and Game Advisory Committee and the Central Kuskokwim 38
51 Moose Management Planning Committee should be encouraged and supported in their efforts to explore approaches and possible solutions to declining moose populations in the area. Finally, a project examining in more detail the sharing of moose meat between communities would better estimate the impact of a reduction of a major resource. Sharing between communities may be as important, or more important, than sharing within a community when coping with a declining moose population. 39
52 ACKNOWLEDGEMENTS The authors would like to thank the following for approving this 3-year project: the Kuskokwim Native Association, the Native Village of Lower Kalskag, the Native Village of Upper Kalskag, the Aniak Traditional Council, the Curarpalek Traditional Council, the Crooked Creek Traditional Council, the Red Devil Traditional Council, the Sleetmute Traditional Council, and the Stony River Traditional Council. In addition, special recognition goes to the Central Kuskokwim Fish and Game Advisory Committee and the Central Kuskokwim Moose Management Planning Committee for their support and assistance in the development of this project. In Year 1 ( ), very special thanks go to the students who administered the surveys at Aniak High School; George Morgan, Sr. High School; Johnny John, Sr. School; George Willis School; Jack Egnaty, Sr. School; Gusty Michael School; and Crow Village Sam School. Thanks also to the teachers who coordinated the students and surveys: Craig Luchsinger, Jackie Konig, Charlie and Linda Thacker, Scott Leslie, Michael Day, Molly Sakar, Elizabeth Biska, and Steve Kenrick. Special recognition goes to Steve Kenrick for his initial suggestion to involve students in the harvest surveys and his overall coordination efforts. Special recognition also goes to Dwayne Hoffman of the Kuskokwim Native Association for his coordination with community traditional councils and schools as well as for his assistance in student training sessions. In Year 2 ( ), very special thanks go to Evan and Naeman Holscher in Lower Kalskag, Margaret Mute in Kalskag, Dwayne Hoffman in Aniak, Roxanne Sakar in Crooked Creek, Richard Egnaty in Sleetmute, and Aggie Waskey in Stony River. Thanks to Sara Gilk, ADF&G, for her assistance in Red Devil, and Janet Bavilla, also of ADF&G, for her assistance in Chuathbaluk. In Year 3 ( ), special recognition goes to Calvin Simeon and David Orabutt of the Kuskokwim Native Association for their coordination, oversight, and assistance with the Aniak surveys and to Zach Liller, who conducted the surveys in Aniak. Finally, sincere thanks go to other Division of Subsistence staff who contributed to the research effort: Jim Simon provided support and guidance; Anne Shinkwin reviewed and edited the draft report; Robert Walker and Bridget Easley provided guidance on data analysis; Erin Gagnon provided data entry; Mike Taras developed the Division of Wildlife curriculum for the Year 1 project; and Luke Schulze provided GIS support and maps. Most of all, thanks go to Susan Vanek, who provided invaluable assistance throughout all phases of the Year 1 project. In addition, in Year 3, Dave Koster provided guidance on data analysis; Heather Bishop, Nicole Cummings, and River Ramuglia provided data entry; and Janet Bavilla and Loren St. Amand conducted surveys in 7 of the 8 project communities. Lastly, this work could not have been done without funding from the U.S. Fish and Wildlife Service. Thank you everyone. 40
53 REFERENCES CITED Alaska Board of Game Authorizing wolf predation control in the Unit 19(A) portion of the Central Kuskokwim Wolf Predation Control Area with airborne or same day airborne shooting. Alaska Board of Game Findings for the Alaska Board of Game, BOG, Unit 19A intensive management supplemental findings. Alaska Board of Game: Anchorage Findings for the Alaska Board of Game BOG, Units 9B, 17, 18, and 19B (Mulchatna Caribou Herd) Intensive Management Supplemental Findings. Alaska Department of Fish and Game Division of Wildlife Conservation Preliminary recommendations, Board of Game proposals, November Alaska Department of Fish and Game: Juneau. Andersen, D.B. and C.L. Alexander Subsistence hunting patterns and compliance with moose harvest reporting requirements in rural Interior Alaska. Alaska Department of Fish and Game, Division of Subsistence Technical Paper No. 215: Juneau. Andersen, D.B., C. Brown, R. Walker, and G. Jennings The harvest of moose, caribou, and bear in middle Yukon and Koyukuk river communities. Alaska Department of Fish and Game, Division of Subsistence, Technical Paper No. 278: Juneau. Andersen, D.B., C.J. Utermohle, and L. Brown The harvest of moose, caribou, and bear in middle Yukon and Koyukuk river communities, Alaska. Alaska Department of Fish and Game, Division of Subsistence, Technical Paper No. 245: Juneau The harvest of moose, caribou, and bear in ten middle Yukon and Koyukuk river communities. Alaska Department of Fish and Game, Division of Subsistence, Technical Paper No. 251: Juneau. Andersen, D.B., C.J. Utermohle, and G. Jennings 2001.The harvest of moose, caribou, and bear in ten middle Yukon and Koyukuk river communities. Alaska Department of Fish and Game, Division of Subsistence Technical Paper No. 262: Juneau. Association of Village Council Presidents, Office of Administration Letter supporting Proposal 2, Record Copy No. 19, Alaska Board of Game meeting, November 1 4, Brown, C. and D. Koster The harvest of moose, caribou, bear and wolves in the lower middle Yukon River communities of Grayling, Anvik, Shageluk, and Holy Cross. Alaska Department of Fish and Game, Division of Subsistence Technical Paper No. 298: Juneau. Brown, C.L., R.J. Walker, and S.B. Vanek 2004a. The harvest of moose, caribou, bear and wolves in the lower middle Yukon River communities of Grayling, Anvik, Shageluk, and Holy Cross. Alaska Department of Fish and Game, Division of Subsistence Technical Paper No. 281: Juneau. 2004b. The harvest of moose, caribou, and bear in middle Yukon and Koyukuk river communities. Alaska Department of Fish and Game, Division of Subsistence, Technical Paper No. 280: Juneau. Charnley, S Moose hunting in two central Kuskokwim communities: Chuathbaluk and Sleetmute. Alaska Department of Fish and Game, Division of Subsistence Technical Paper No. 76: Bethel Human ecology of two central Kuskokwim communities: Chuathbaluk and Sleetmute. Alaska Department of Fish and Game Division of Subsistence, Technical Paper No. 81: Juneau. Cochran, W.G Sampling techniques, 3rd edition. John Wiley & Sons: New York. 41
54 Jonrowe, D Middle Kuskokwim food survey December Alaska Department of Fish and Game, Division of Subsistence Technical Paper No. 51: Bethel. Kari, P.R Wild resource use and economy of Stony River Village. Alaska Department of Fish and Game, Division of Subsistence, Technical Paper No. 108: Juneau. Perry, P Unit 18 moose management report [in] P. Harper, editor Moose management report of survey and inventory activities 1 July June Alaska Department of Fish and Game. Project 1.0: Juneau. Seavoy, R.J Unit 19 moose [in] P. Harper, editor Moose management report of survey and inventory activities 1 July June Alaska Department of Fish and Game, Project 1.0: Juneau. Simon, J., T. Krauthoefer, D. Koster, and D. Caylor Subsistence salmon harvest monitoring report, Kuskokwim fisheries management area, Alaska, Alaska Department of Fish and Game, Division of Subsistence Technical Paper No. 313: Juneau. Stickney, A.A Middle Kuskokwim food survey II. Alaska Department of Fish and Game, Division of Subsistence Technical Paper No. 53: Bethel. US Fish and Wildlife Service Office of Subsistence Management Comments on Alaska Board of Game Proposals, Public Comment No. PC7, Alaska Board of Game meeting, November 1 4, US Fish and Wildlife Service: Anchorage. Wolfe, R.J The super-household: specialization in subsistence economies. Paper presented at the 14th annual meeting of the Alaska Anthropological Association, March 1987, Anchorage, Alaska. Alaska Department of Fish and Game Division of Subsistence: Juneau. Wolfe, R.J., C.L. Scott, W.E. Simeone, C.J. Utermohle, and M.C. Pete The super-household in Alaska Native subsistence economies. Final Report to the National Science Foundation, Project ARC Woolington, J.D Mulchatna caribou management report, Units 9B, 17, 18 south, 19A and 19B [in] C. Brown, editor Caribou management report of survey-inventory activities 1 July June Alaska Department of Fish and Game: Juneau. 42
55 Appendix A. SURVEY INSTRUMENT 43
56 CENTRAL KUSKOKWIM BIG GAME SURVEY HOW MANY PEOPLE LIVED IN THE HOUSEHOLD THIS PAST YEAR? COMMUNITY ARE ANY MEMBERS OF THIS HOUSEHOLD ALASKA NATIVE? YES NO HOUSEHOLD ID NUMBER INTERVIEWER'S INITIALS MOOSE DATE 1 DID MEMBERS OF YOUR HOUSEHOLD USE OR HUNT MOOSE THIS PAST YEAR (BETWEEN APRIL 2003 AND MARCH 2004)? YES NO IF YES, PLEASE COMPLETE THE FOLLOWING SECTIONS. 2 DURING THIS PAST YEAR, DID MEMBERS OF YOUR HOUSEHOLD: USE Moose? YES NO HUNT Moose? YES NO HARVEST Moose? YES NO RECEIVE** Moose? YES NO GIVE Moose? YES NO **(Including moose from guiding operations) 2a-2b (FOR HOUSEHOLDS WHO RECEIVED MEAT FROM GUIDING OPERATIONS) 2a WHAT TYPE OF MEAT WERE YOU GIVEN? (EXAMPLE: HIND QUARTER, NECK, ETC.) 44 2b HOW MUCH DID THIS SOURCE OF MEAT CONTRIBUTE TO FULFILLING YOUR HOUSEHOLD NEEDS? 0-25% 25-50% 50-75% % 3 HOW MANY MEMBERS OF THIS HOUSEHOLD HUNTED MOOSE IN THE LAST 12 MONTHS? 4 HOW MANY DAYS DID EACH HUNTER SPEND HUNTING MOOSE IN THE LAST 12 MONTHS? (please add below the amount of days each hunter spent hunting any moose HUNTER #1: days HUNTER #2: days HUNTER #3: days HUNTER #4: days HUNTER #5: days over the last year) 5 HOW MANY MOOSE WERE HARVESTED LAST YEAR BY MEMBERS OF THIS HOUSEHOLD? (include any potlatch moose taken by this household) MOOSE M LOCATION (UCU) S or F M or F APR MAY JUN JUL AUG SEP OCT NOV DEC JAN FEB MAR DID THE AMOUNT OF MOOSE YOU HARVESTED OR RECEIVED LAST YEAR MEET THE NEEDS OF YOUR HOUSEHOLD? YES NO IF NO, PLEASE COMPLETE THE FOLLOWING SECTIONS. 6a HOW MUCH MORE WOULD YOU HAVE NEEDED? 6b HOW LONG HAS IT BEEN SINCE YOU LAST MET THE NEEDS OF YOUR HOUSEHOLD, IN REGARDS TO MOOSE HARVESTED OR RECEIVED?
57 CENTRAL KUSKOKWIM BIG GAME SURVEY (page 2) MOOSE (Continued) 7a IF YOU HARVESTED OR USED MOOSE LAST YEAR, HOW DID YOUR HARVEST OR USE OF MOOSE IN 2003 COMPARE TO THE: LAST 4 OR 5 YEARS? WE HARVESTED OR USED MORE MOOSE THAN THE LAST 4-5 YEARS WE HARVESTED OR USED LESS MOOSE THAN THE LAST 4-5 YEARS OUR HARVEST OR USE OF MOOSE WAS ABOUT THE SAME AS THE LAST 4-5 YEARS (MORE) (LESS) (SAME) 7b IF YOU HARVESTED OR USED MOOSE LAST YEAR, HOW DID YOUR HARVEST OR USE OF MOOSE IN 2003 COMPARE TO: 9-10 YEARS AGO WE HARVESTED OR USED MORE MOOSE THAN 9-10 YEARS AGO WE HARVESTED OR USED LESS MOOSE THAN 9-10 YEARS AGO OUR HARVEST OR USE OF MOOSE WAS ABOUT THE SAME AS 9-10 YEARS AGO (MORE) (LESS) (SAME) 45 8 WHAT PARTS OF THE MOOSE DID YOU USE? Antlers Hide Meat Fat Bone/Marrow Organs Head Feet/Hooves Other (Please Describe) WOLVES 1 DID MEMBERS OF YOUR HOUSEHOLD SHOOT OR TRAP WOLVES THIS PAST YEAR (BETWEEN APRIL 2003 AND MARCH 2004?) YES NO IF YES, PLEASE COMPLETE THE FOLLOWING SECTIONS. 2 DURING THIS PAST YEAR, DID MEMBERS OF YOUR HOUSEHOLD: USE Wolves? YES NO GIVE Wolves? YES NO RECEIVE Wolves? YES NO 3 HOW MANY MEMBERS OF THIS HOUSEHOLD TRAPPED OR SHOT WOLVES IN THE LAST 12 MONTHS? 4 HOW MANY WOLVES WERE HARVESTED LAST YEAR BY MEMBERS OF THIS HOUSEHOLD? WOLVES WOLVES W LOCATION (UCU) S or F M or F Month Shoot? Trap? W LOCATION (UCU) S or F M or F Month Shoot? Trap?
58 CENTRAL KUSKOKWIM BIG GAME SURVEY (page 3) CARIBOU 1 DID MEMBERS OF YOUR HOUSEHOLD USE OR HUNT CARIBOU THIS PAST YEAR (BETWEEN APRIL 2003 AND MARCH 2004?) YES NO IF YES, PLEASE COMPLETE THE FOLLOWING SECTIONS. 2 DURING THIS PAST YEAR, DID MEMBERS OF YOUR HOUSEHOLD: USE Caribou? YES NO HUNT Caribou? YES NO HARVEST Caribou? YES NO RECEIVE Caribou? YES NO GIVE Caribou? YES NO 3 HOW MANY CARIBOU WERE HARVESTED LAST YEAR BY MEMBERS OF THIS HOUSEHOLD? CARIBOU C LOCATION (UCU) S or F M or F APR MAY JUN JUL AUG SEP OCT NOV DEC JAN FEB MAR UNK HOW WOULD YOU DESCRIBE THE AVAILABILITY OF CARIBOU IN YOUR AREA FOR SUBSISTENCE HUNTING THIS SEASON: NOT AVAILABLE (POOR) SOMEWHAT AVAILABLE (FAIR) READILY AVAILABLE (GOOD) (POOR) (FAIR) (GOOD) 5 HOW WOULD YOU DESCRIBE THE AVAILABILITY OF CARIBOU IN YOUR AREA FOR SUBSISTENCE HUNTING 4-5 YEARS AGO: NOT AVAILABLE (POOR) SOMEWHAT AVAILABLE (FAIR) READILY AVAILABLE (GOOD) (POOR) (FAIR) (GOOD) 6 HOW WOULD YOU DESCRIBE THE AVAILABILITY OF CARIBOU IN YOUR AREA FOR SUBSISTENCE HUNTING 9-10 YEARS AGO: NOT AVAILABLE (POOR) SOMEWHAT AVAILABLE (FAIR) READILY AVAILABLE (GOOD) (POOR) (FAIR) (GOOD)
59 CENTRAL KUSKOKWIM BIG GAME SURVEY (page 4) BLACK BEAR 1 DID MEMBERS OF YOUR HOUSEHOLD USE OR HUNT BLACK BEAR THIS PAST YEAR (BETWEEN APRIL 2003 AND MARCH 2004)? YES NO IF YES, PLEASE COMPLETE THE FOLLOWING SECTIONS. 2 DURING THIS PAST YEAR, DID MEMBERS OF YOUR HOUSEHOLD: USE Black Bear? YES NO HUNT Black Bear? YES NO HARVEST Black Bear? YES NO RECEIVE Black Bear? YES NO GIVE Black Bear? YES NO 3 HOW MANY MEMBERS OF THIS HOUSEHOLD HUNTED BLACK BEAR IN THE LAST 12 MONTHS? 4 HOW MANY BLACK BEAR WERE HARVESTED LAST YEAR BY MEMBERS OF THIS HOUSEHOLD? 5 WHAT PARTS OF THE BEAR DID YOU USE? Hide Meat Fat BLACK BEAR BL LOCATION (UCU) S or F M or F APR MAY JUN JUL AUG SEP OCT NOV DEC JAN FEB MAR UNK BROWN BEAR 1 DID MEMBERS OF YOUR HOUSEHOLD USE OR HUNT BROWN BEAR THIS PAST YEAR (BETWEEN APRIL 2003 AND MARCH 2004)? YES NO IF YES, PLEASE COMPLETE THE FOLLOWING SECTIONS. 2 DURING THIS PAST YEAR, DID MEMBERS OF YOUR HOUSEHOLD: USE Brown Bear? YES NO HUNT Brown Bear? YES NO HARVEST Brown Bear? YES NO RECEIVE Brown Bear? YES NO GIVE Brown Bear? YES NO 3 HOW MANY BROWN BEAR WERE HARVESTED LAST YEAR BY MEMBERS OF THIS HOUSEHOLD? 4 WHAT, IF ANY, PARTS OF THE BEAR DID YOU USE? Hide Meat Fat BROWN BEAR BR LOCATION (UCU) S or F M or F APR MAY JUN JUL AUG SEP OCT NOV DEC JAN FEB MAR UNK 1 2
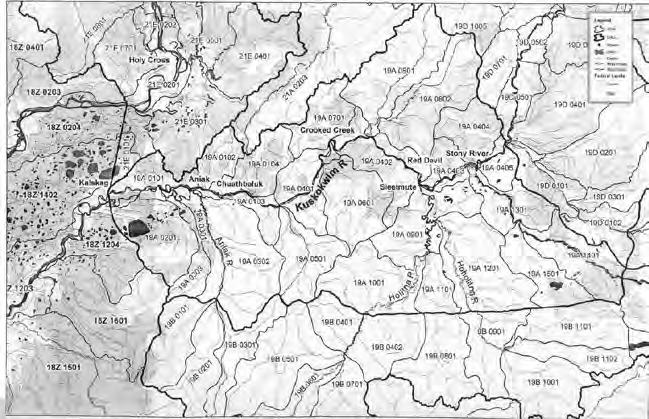
60 48
The Harvest of Moose, Caribou, Bear, and Gray Wolf in the Lower-Middle Yukon River Communities of Grayling, Anvik, Shageluk, and Holy Cross
 Technical Paper No. 305 The 2004 2005 Harvest of Moose, Caribou, Bear, and Gray Wolf in the Lower-Middle Yukon River Communities of Grayling, Anvik, Shageluk, and Holy Cross by Caroline L. Brown and David
2013 Kotzebue Sound Salmon Fisheries Management Plan
 Regional Information Report 3A13-04 2013 Kotzebue Sound Salmon Fisheries Management Plan by Jim Menard Alaska Department of Fish and Game May 2013 Divisions of Sport Fish and Commercial Fisheries Symbols
Findings of the Alaska Board of Game BOG
 Purpose and Need Findings of the Alaska Board of Game 2004-150-BOG Authorizing Wolf Predation Control in the Unit 19(A) Portion of the Central Kuskokwim Wolf Predation Control Area With Airborne or Same
Stock Assessment of Sockeye Salmon from the Buskin River, Kodiak, Alaska, 2000
 Annual Project Report No. FIS 00-032 USFWS Office of Subsistence Management Fishery Information Services Division Stock Assessment of Sockeye Salmon from the Buskin River, Kodiak, Alaska, 2000 by Donn
Special Publication No Subsistence Harvests of Land Mammals in Bethel, Alaska, 2011
 Special Publication No. 2014-01 Subsistence Harvests of Land Mammals in Bethel, Alaska, 2011 by David M. Runfola, Andrew R. Brenner, and David S. Koster March 2014 Alaska Department of Fish and Game Division
Fishery Management Report No Fishery Management Plan for the South Alaska Peninsula Area State-Waters Pacific Cod Season, 2013
 Fishery Management Report No. 13-01 Fishery Management Plan for the South Alaska Peninsula Area State-Waters Pacific Cod Season, 2013 by Trent Hartill Alaska Department of Fish and Game January 2013 Divisions
Susitna-Watana Hydroelectric Project Document ARLIS Uniform Cover Page
 Alaska Resources Library & Information Services Document ARLIS Uniform Cover Page Title: Wildlife harvest analysis study, Study plan Section 10.20 : Final study plan SuWa 200 Author(s) Personal: Author(s)
Regional Information Report No. 3A Norton Sound Salmon Fisheries Outlook and Management Strategies
 Regional Information Report No. 3A15-02 2015 Norton Sound Salmon Fisheries Outlook and Management Strategies by Jim Menard May 2015 Alaska Department of Fish and Game Division of Commercial Fisheries Symbols
Special Publication No. BOF
 Special Publication No. BOF 2015-02 Customary and Traditional Use Worksheet and Options for Amounts Reasonably Necessary for Subsistence: Tanner Crab, Dungeness Crab, Shrimp, and Miscellaneous Shellfish,
Alaska Peninsula-Aleutian Islands Management Area Food and Bait Herring Fishery Management Plans, 2015
 Fishery Management Report No. 15-26 Alaska Peninsula-Aleutian Islands Management Area Food and Bait Herring Fishery Management Plans, 2015 by Charles W. Russell Alaska Department of Fish and Game May 2015
Subsistence Wildlife Harvests in Kotzebue, Alaska,
 Special Publication No. SP2014-03 Subsistence Wildlife Harvests in Kotzebue, Alaska, 2012 2013 by Anna R. Godduhn, Nicole M. Braem, and Marylynne L. Kostick July 2014 Alaska Department of Fish and Game
Stock Assessment of Sockeye and Coho Salmon from Billy s Hole, Prince William Sound, Alaska, 2003
 Annual Project Report No. FIS 03-033 USFWS Office of Subsistence Management Fishery Information Services Division Stock Assessment of Sockeye and Coho Salmon from Billy s Hole, Prince William Sound, Alaska,
The Alaska Department of Fish and Game administers all programs and activities free from discrimination on the basis of sex, color, race, religion,
 The Alaska Department of Fish and Game administers all programs and activities free from discrimination on the basis of sex, color, race, religion, national origin, age, marital status, pregnancy, parenthood,
ALASKA DEPARTMENT OF FISH AND GAME STAFF COMMENTS INTERIOR REGION REGULATORY PROPOSALS ALASKA BOARD OF GAME MEETING FAIRBANKS, ALASKA FEBRUARY
 ALASKA DEPARTMENT OF FISH AND GAME STAFF COMMENTS INTERIOR REGION REGULATORY PROPOSALS ALASKA BOARD OF GAME MEETING FAIRBANKS, ALASKA FEBRUARY 14-23, 2014 The following staff comments were prepared by
CFEC Permit Holdings, Harvests, and Estimated Gross Earnings by Resident Type in the Bristol Bay Salmon Gillnet Fisheries
 CFEC Permit Holdings, Harvests, and Estimated Gross Earnings by Resident Type in the Bristol Bay Salmon Gillnet Fisheries Photo courtesy of Lindsey Bloom CFEC Report 09-1N February, 2009 Commercial Fisheries
Findings of the Alaska Board of Game BOG
 Findings of the Alaska Board of Game 2004-148-BOG Authorizing Predator Control in the Western Cook Inlet Area in Unit 16B with Airborne or Same Day Airborne Shooting March 10, 2004 Purpose This action
IN THE SUPERIOR COURT FOR THE STATE OF ALASKA THIRD JUDICAL DISTRICT AT ANCHORAGE ) ) ) ) ) ) ) ) ) ) ) ) ) ) ) ) ) )
 ) ) ) ) ) ) ) ) ) ) ) ) ) ) ) ) )") Michael J. Frank Alaska Bar No. 7410076 TRUSTEES FOR ALASKA 1026 West 4th Avenue, Suite 201 Anchorage, Alaska 99501 Phone: (907 276-4244 Fax: (907 276-7110 Valerie L. Brown Alaska Bar No. 9712099 LAW OFFICE
Michael J. Frank Alaska Bar No. 7410076 TRUSTEES FOR ALASKA 1026 West 4th Avenue, Suite 201 Anchorage, Alaska 99501 Phone: (907 276-4244 Fax: (907 276-7110 Valerie L. Brown Alaska Bar No. 9712099 LAW OFFICE
Alaska Peninsula-Aleutian Islands Management Area Food and Bait Herring Fishery Management Plans, 2013
 Fishery Management Report No. 13-13 The 2013 Dutch Harbor Food and Bait purse seine fishery allocation is corrected in the current publication. Nichols, Nathaniel W., 5/24/13 Alaska Peninsula-Aleutian
Findings and Guidelines Wednesday, March 12, 2003 Page 1
 Findings and Guidelines Wednesday, March 12, 2003 Page 1 Findings of the Board of Game and Guidelines for a Unit 19D East Predation Control Program March 12, 2003 I. Overview Of Project Development And
Fishery Data Series No Distribution and Run Timing of Stocked McDonald Lake Sockeye Salmon,
 Fishery Data Series No. 15-38 Distribution and Run Timing of Stocked McDonald Lake Sockeye Salmon, 2011 2014 by Malika T. Brunette, Andrew W. Piston, and Steven C. Heinl Alaska Department of Fish and Game
Bison Identification Guide and Quiz
 Bison Identification Guide and Quiz Alaska Department of Fish and Game Division of Wildlife Conservation 2009 2 All winter photos by Mike Taras. All summer photos by Steve DuBois. The Alaska Department
Technical Paper No. 418 Kodiak City, Larsen Bay and Old Harbor: An Ethnographic Study of Traditional Subsistence Salmon Harvests and Uses
 Technical Paper No. 418 Kodiak City, Larsen Bay and Old Harbor: An Ethnographic Study of Traditional Subsistence Salmon Harvests and Uses by Meredith A. Marchioni, James A. Fall, Brian Davis and Garrett
INFORMATIONAL LEAFLET NO. 2. Length-Width Relationships of Carapace. Measurements of the King Crab
 INFORMATIONAL LEAFLET NO. 2 Length-Width Relationships of Carapace Measurements of the King Crab (Parali thodes camtschatica) Roy Ri ckey-westward Regional Di rector Alaska Department of Fish and Game
Special Publication No. BOG Customary and Traditional Use Worksheet: Snowy Owl, Game Management Units 17, 18, 22, 23, and 26
 Special Publication No. BOG 2016-05 Customary and Traditional Use Worksheet: Snowy Owl, Game Management Units 17, 18, 22, 23, and 26 Prepared by Alaska Department of Fish and Game, Division of Subsistence
Northern Cook Inlet Chinook and Coho Salmon Escapement Surveys for
 Regional Operational Plan SF.2A.2013.16 Northern Cook Inlet Chinook and Coho Salmon Escapement Surveys for 2013-2015 by Samantha Oslund Alaska Department of Fish and Game June 2013 Divisions of Sport Fish
SOUTH UNIMAK AND SHUMAGIN ISLANDS JUNE SALMON FISHERY MANAGEMENT PLAN, 2003
 SOUTH UNIMAK AND SHUMAGIN ISLANDS JUNE SALMON FISHERY MANAGEMENT PLAN, 2003 By Arnold R. Shaul Charles Burkey, Jr. and Joseph J. Dinnocenzo Regional Information Report 1 No. 4K03-20 Alaska Department of
Chignik Area Subsistence Salmon Fisheries Research Report to the Alaska Board of Fisheries, January 2011
 Special Publication No. BOF 2010-06 RC 3 Tab 9 Chignik Area Subsistence Salmon Fisheries Research Report to the Alaska Board of Fisheries, January 2011 by Lisa Hutchinson-Scarbrough, Terri Lemons, James
Subsistence Harvests of Pacific Halibut in Alaska, 2010
 Technical Paper No. 367 Subsistence Harvests of Pacific Halibut in Alaska, 2010 by James A. Fall and David Koster January 2012 Alaska Department of Fish and Game Division of Subsistence Symbols and Abbreviations
SOUTHEASTERN DISTRICT MAINLAND (ALASKA PENINSULA AREA) SALMON MANAGEMENT PLAN, 1994
 SALMON MANAGEMENT PLAN, 1994") SOUTHEASTERN DISTRICT MAINLAND (ALASKA PENINSULA AREA) SALMON MANAGEMENT PLAN, 1994 James N. McCullough and Rodney D. Campbell Regional Information ~ e~ort' No. 4K94-14 Alaska Department of Fish and Game
SOUTHEASTERN DISTRICT MAINLAND (ALASKA PENINSULA AREA) SALMON MANAGEMENT PLAN, 1994 James N. McCullough and Rodney D. Campbell Regional Information ~ e~ort' No. 4K94-14 Alaska Department of Fish and Game
DEPARTMENT OF FISH AND GAME
 Sean Parnell, GOVERNOR DEPARTMENT OF FISH AND GAME November 4, 2011 DIVISION OF SPORT FISH 3298 Douglas Place Homer, AA 99603-8027 PHONE: (907) 235-8191 FAX: (907) 235-2448 and Douglas Island Center Bldg
Federal Aid in Wildlife Restoration Annual Performance Report of Survey-Inventory Activities 1 July June IS 0 N
 Alaska Department of Fish and Game Division of Wildlife Conservation Federal Aid in Wildlife Restoration Annual Performance Report of Survey-Inventory Activities 1 July 1991-30 June 1992 8 IS 0 N Susan
Port Graham: Holdings of Limited Entry Permits, Sablefish Quota Shares, and Halibut Quota Shares Through 1998 and Data On Fishery Gross Earnings
 Port Graham: Holdings of Limited Entry Permits, Sablefish Quota Shares, and Halibut Quota Shares Through 1998 and Data On Fishery Earnings CFEC Report 99-Port Graham-SN Alaska Commercial Fisheries Entry
Charter Boat Fishing in Lake Michigan: 2015 Illinois Reported Harvest
 Illinois Department of Natural Resources Division of Fisheries Charter Boat Fishing in Lake Michigan: 2015 Illinois Reported Harvest Steven R. Robillard Illinois Department of Natural Resources Lake Michigan
A Study of Commercial Fishing Gear Selectivity During the 2012/13 Aleutian Islands Golden King Crab Fishery East of 174 W Longitude
 Fishery Data Series No. 13-41 A Study of Commercial Fishing Gear Selectivity During the 2012/13 Aleutian Islands Golden King Crab Fishery East of 174 W Longitude by Vicki Vanek, Douglas Pengilly, and M.
North Alaska Peninsula Salmon Management Plan, 2013
 Fishery Management Report No. 13-16 North Alaska Peninsula Salmon Management Plan, 2013 by Robert L. Murphy and Dawn M. Wilburn Alaska Department of Fish and Game April 2013 Divisions of Sport Fish and
Dauphin Lake Fishery. Status of Walleye Stocks and Conservation Measures
 Dauphin Lake Fishery Status of Walleye Stocks and Conservation Measures Date: December, 21 Dauphin Lake Fishery Status of Walleye Stocks and Conservation Measures Background: Walleye stocks in Dauphin
Charter Boat Fishing in Lake Michigan: 2017 Illinois Reported Harvest
 Illinois Department of Natural Resources Division of Fisheries Charter Boat Fishing in Lake Michigan: 2017 Illinois Reported Harvest Steven R. Robillard Illinois Department of Natural Resources Lake Michigan
Salmon bycatch patterns in the Bering Sea pollock fishery
 Salmon bycatch patterns in the Bering Sea pollock fishery James Ianelli Seattle, WA Data from the North Pacific Observer Program (Fisheries Monitoring and Assessment) were analyzed for seasonal, temporal,
Regional Information Report 5J
 Regional Information Report 5J.2016-06 Does the Queets Exploitation Rate Indicator Stock Represent the Distribution of Fishery Impacts of Washington Coastal Chinook Salmon Stocks in Pacific Salmon Treaty
DEER HUNT RESULTS ON ALABAMA WILDLIFE MANAGEMENT AREAS ANNUAL REPORT, CHRISTOPHER W. COOK STUDY LEADER MAY, 2006
 DEER HUNT RESULTS ON ALABAMA WILDLIFE MANAGEMENT AREAS ANNUAL REPORT, 2005-2006 CHRISTOPHER W. COOK STUDY LEADER MAY, 2006 ALABAMA DIVISION OF WILDLIFE AND FRESHWATER FISHERIES Federal Aid Project funded
PROCEDURE MANUAL of 6. Moose Harvest Management. This Procedure Replaces: None
 4 7 01.07.3 1 of 6 This Procedure Replaces: None Staff, Organizations Directly Affected: Director Regional Managers Wildlife Management Staff First Nations Resident Hunters Guide Outfitters Policy Cross-Reference:
ECONOMIC IMPACTS AND CONTRIBUTIONS OF SPORTFISHING IN ALASKA
 ECONOMIC IMPACTS AND CONTRIBUTIONS OF SPORTFISHING IN ALASKA 2 0 0 7 R E P O R T A Message from the Director CHARLIE SWANTON, DIRECTOR ADF&G, DIVISION OF SPORT FISH Alaska supports arguably some of the
Regional Operational Plan SF.4A Alaska Statewide Sport Fish Harvest Survey, 2014
 Regional Operational Plan SF.4A.2013.07 Alaska Statewide Sport Fish Harvest Survey, 2014 by William J. Romberg and Gretchen Jennings Alaska Department of Fish and Game August 2013 Divisions of Sport Fish
Methodology for ISER Surveys of Alaska Halibut Fishermen
 Methodology for ISER Surveys of Alaska Halibut Fishermen by Gunnar Knapp Institute of Social and Economic Research University of Alaska Anchorage 3211 Providence Drive Anchorage, Alaska 99508 907-786-7710
Susitna Watana Hydroelectric Project (FERC No ) Past and Current Big Game and Furbearer Harvest Analysis 2012 Technical Memorandum
 Past and Current Big Game and Furbearer Harvest Analysis 2012 Technical Memorandum") (FERC No. 14241) Past and Current Big Game and Furbearer Harvest Analysis 2012 Technical Memorandum Prepared for Prepared by Alexander K. Prichard, Nathan A. Schwab, and Brian E. Lawhead ABR, Inc. Environmental
(FERC No. 14241) Past and Current Big Game and Furbearer Harvest Analysis 2012 Technical Memorandum Prepared for Prepared by Alexander K. Prichard, Nathan A. Schwab, and Brian E. Lawhead ABR, Inc. Environmental
Wolf Management in Alaska with an Historic Perspective
 ADF&G -> Wildlife Home -> Management -> Wolves www.wildlife.alaska.gov Wolf Management in Alaska with an Historic Perspective Presentation to the Alaska Board of Game March 2002 by Wayne L. Regelin, Director
Full summaries of all proposed rule changes, including DMU boundary descriptions, are included in the additional background material.
 The Florida Fish and Wildlife Conservation Commission (FWC) implemented a public outreach and input process in 2013 and 2014 in management Zones A, B and C. The goal of this process was to present the
Origins of Chinook Salmon in the Yukon River Fisheries, 2011
 Fishery Data Series No. 15-15 Origins of Chinook Salmon in the Yukon River Fisheries, 2011 by Larry DuBois Alaska Department of Fish and Game June 2015 Divisions of Sport Fish and Commercial Fisheries
2001 REVIEW OF THE ATLANTIC STATES MARINE FISHERIES COMMISSION FISHERY MANAGEMENT PLAN FOR WEAKFISH (Cynoscion regalis)
") 2001 REVIEW OF THE ATLANTIC STATES MARINE FISHERIES COMMISSION FISHERY MANAGEMENT PLAN FOR WEAKFISH (Cynoscion regalis) Plan Review Team Rick Cole, DE Louis Daniel, NC Charles Lesser, DE Rob O Reilly,
2001 REVIEW OF THE ATLANTIC STATES MARINE FISHERIES COMMISSION FISHERY MANAGEMENT PLAN FOR WEAKFISH (Cynoscion regalis) Plan Review Team Rick Cole, DE Louis Daniel, NC Charles Lesser, DE Rob O Reilly,
Subsistence Harvests of Pacific Halibut in Alaska, 2008
 Technical Paper No. 348 Subsistence Harvests of Pacific Halibut in Alaska, 2008 by James A. Fall and David Koster January 2010 Alaska Department of Fish and Game Division of Subsistence Symbols and Abbreviations
ALASKA DEPARTMENT OF FISH AND GAME
 RC 2 ALASKA DEPARTMENT OF FISH AND GAME STAFF COMMENTS COMMERCIAL, PERSONAL USE, SPORT, GUIDED SPORT, AND SUBSISTENCE FINFISH REGULATORY PROPOSALS COMMITTEE OF THE WHOLE GROUPS 1 6 FOR THE UPPER COOK INLET
CHAPTER 10 TOTAL RECREATIONAL FISHING DAMAGES AND CONCLUSIONS
 CHAPTER 10 TOTAL RECREATIONAL FISHING DAMAGES AND CONCLUSIONS 10.1 INTRODUCTION This chapter provides the computation of the total value of recreational fishing service flow losses (damages) through time
Thomas Bay Baseline Investigation
 Regional Information Report No. 1J16-10 Thomas Bay Baseline Investigation by Patrick Fowler and Troy Thynes Alaska Department of Fish and Game November 2016 Divisions of Sport Fish and Commercial Fisheries
A.M. The time between 12:00 midnight and 12:00 noon. Houghton Mifflin Co. 1 Grade 4 Unit 5
 A.M. The time between 12:00 midnight and 12:00 noon. Houghton Mifflin Co. 1 Grade 4 Unit 5 bar graph A graph in which information is shown by means of rectangular bars. Favorite Sea Creature Sea Creature
Application of a New Method for Monitoring Lake Trout Abundance in Yukon: Summer Profundal Index Netting (SPIN)
") Application of a New Method for Monitoring Lake Trout Abundance in Yukon: Summer Profundal Index Netting (SPIN) Prepared by: Lars Jessup Nathan Millar November 2011 Application of a New Method for Monitoring
Application of a New Method for Monitoring Lake Trout Abundance in Yukon: Summer Profundal Index Netting (SPIN) Prepared by: Lars Jessup Nathan Millar November 2011 Application of a New Method for Monitoring
[Docket No. FWS R6 ES ; FXES FF09E42000] Endangered and Threatened Wildlife and Plants; Removing the Greater Yellowstone
![[Docket No. FWS R6 ES ; FXES FF09E42000] Endangered and Threatened Wildlife and Plants; Removing the Greater Yellowstone](/thumbs/84/89556590.jpg "[Docket No. FWS R6 ES ; FXES FF09E42000] Endangered and Threatened Wildlife and Plants; Removing the Greater Yellowstone") This document is scheduled to be published in the Federal Register on 09/07/2016 and available online at http://federalregister.gov/a/2016-21368, and on FDsys.gov DEPARTMENT OF THE INTERIOR Fish and Wildlife
This document is scheduled to be published in the Federal Register on 09/07/2016 and available online at http://federalregister.gov/a/2016-21368, and on FDsys.gov DEPARTMENT OF THE INTERIOR Fish and Wildlife
Fishery Management Report No Area Management Report for the Recreational Fisheries of the Southwest Alaska Sport Fish Management Area, 1999
 Fishery Management Report No. 01-6 Area Management Report for the Recreational Fisheries of the Southwest Alaska Sport Fish Management Area, 1999 by Dan O. Dunaway and Sandra Sonnichsen March 2001 Alaska
Fishery Management Report No Pasagshak River Weir Report, 2015
 Fishery Management Report No.15-37 Pasagshak River Weir Report, 2015 by Mark J. Witteveen Alaska Department of Fish and Game September 2015 Divisions of Sport Fish and Commercial Fisheries Symbols and
Proposal for cooperation between GRASP and the CMS Gorilla Agreement
 Proposal for cooperation between GRASP and the CMS Gorilla Agreement Background Great Apes Survival Partnership The Great Apes Survival Partnership (GRASP) was founded in 2001 at the World Summit on Sustainable
Tanana Chiefs Conference, Fisheries Program. Henshaw Creek Science & Culture Camp, 2016
 Henshaw Creek Science & Culture Camp, 2016 Tanana Chiefs Conference, Fisheries Program Fairbanks, Alaska November, 2016 The Tanana Chiefs Conference s Fisheries Program strives to continually build educational
Customary and Traditional Use Worksheet, Brown Bears, Game Management Unit 25 (Interior Alaska)
") Special Publication No. BOG 2017-03 Customary and Traditional Use Worksheet, Brown Bears, Game Management Unit 25 (Interior Alaska) Prepared by Alaska Department of Fish and Game, Division of Subsistence
Special Publication No. BOG 2017-03 Customary and Traditional Use Worksheet, Brown Bears, Game Management Unit 25 (Interior Alaska) Prepared by Alaska Department of Fish and Game, Division of Subsistence
CRACIUN RESEARCH. June 20, 2011 A M A R K E T R E S E A R C H S T CHA
 CRACIUN RESEARCH A M A R K E T R E S E A R C H S T U D Y CHA June 20, 2011 Craciun Research Anchorage. Seattle. Washington, DC 907.279.3982 www.craciunresearch.com 2011 Craciun Research. All rights reserved.
Agreement Between the Government of Canada and the Government of the United States of America on the Conservation of the Porcupine Caribou Herd
 Agreement Between the Government of Canada and the Government of the United States of America on the Conservation of the Porcupine Caribou Herd Ottawa, July 17, 1987 In force, July 17, 1987 The Government
Regional Information Report 5J13-12 Report to the Alaska State Legislature on Status of Cook Inlet Coho and Sockeye Salmon Genetic Projects, 2013
 Regional Information Report 5J13-12 Report to the Alaska State Legislature on Status of Cook Inlet Coho and Sockeye Salmon Genetic Projects, 2013 by Nick DeCovich, Andy Barclay, Chris Habicht, Mark Willette,
Stakeholder Activity
 Stakeholder Activity Stakeholder Group: Wilderness Advocates For the stakeholder meeting, your group will represent Wilderness Advocates. Your job is to put yourself in the Wilderness Advocate s shoes
Thought the number of households in their community that met their harvest needs were: Between 26-50% Survey Results 2017
 People who filled out this survey: Participated in harvest activities: More than the average household About the same as other households Less than other households Not sure Ranked these 10 factors as
[Docket No. FWS R7 NWRS ; FF07R00000 FXRS Obligation
 This document is scheduled to be published in the Federal Register on 11/09/2017 and available online at https://federalregister.gov/d/2017-24324, and on FDsys.gov Billing Code 4333-15 DEPARTMENT OF THE
Wildlife Ad Awareness & Attitudes Survey 2015
 Wildlife Ad Awareness & Attitudes Survey 2015 Contents Executive Summary 3 Key Findings: 2015 Survey 8 Comparison between 2014 and 2015 Findings 27 Methodology Appendix 41 2 Executive Summary and Key Observations
Fishery Manuscript Series No Escapement Goal Recommendations for Select Arctic Yukon Kuskokwim Region Salmon Stocks, 2016
 Fishery Manuscript Series No. 15-08 Escapement Goal Recommendations for Select Arctic Yukon Kuskokwim Region Salmon Stocks, 2016 by Jan M. Conitz Kathrine G. Howard and Matthew J. Evenson Alaska Department
Subsistence-Recreational Conflicts Along the Togiak, Kanektok, and Goodnews Rivers: A Summary
 Special Publication No. SP1989-001 Subsistence-Recreational Conflicts Along the Togiak, Kanektok, and Goodnews Rivers: A Summary by Robert J. Wolfe 1989 Alaska Department of Fish and Game Division of Subsistence
Technical Paper No. 316 Alaska Subsistence Salmon Fisheries 2003 Annual Report
 Technical Paper No. 316 Alaska Subsistence Salmon Fisheries 2003 Annual Report by Caroline L. Brown, David Caylor, Jesse Dizard, James A. Fall, Susan Georgette, Tracie Krauthoefer, and Michael Turek September
Kodiak Sockeye Salmon Test Fishery Operational Plan, by Michelle L. Moore
 Kodiak Sockeye Salmon Test Fishery Operational Plan, 2013 by Michelle L. Moore Alaska Department of Fish and Game April 2013 Divisions of Sport Fish and Commercial Fisheries Symbols and Abbreviations The
USEFUL RELATIONSHIPS
 Use the chart below for the homework problems in this section. USEFUL RELATIONSHIPS U.S. Customary 12 in. = 1 ft 3 ft = 1 yd 280 ft = 1 mi 16 oz = 1 lb 2000 lbs = 1 T 8 fl oz = 1 c 2 c = 1 pt 2 pts = 1
2012 Wildlife Studies
 2012 Wildlife Studies Prepared by Cardno ENTRIX Agency Meeting on Draft 2012 Study Descriptions December 8, 2011 1 Project Components 2 Project Region ADF&G GMUs 3 Wildlife Studies for 2012 W-S1: Wildlife
Report to the Joint Standing Committee on Inland Fisheries and Wildlife
 Report to the Joint Standing Committee on Inland Fisheries and Wildlife As Required by 12 Section 10107-A White-tailed Deer Population Management Written By: Wildlife Management Staff, Inland Fisheries
Copyright 2018 by Jamie L. Sandberg
 Copyright 2018 by Jamie L. Sandberg All rights reserved. This book or any portion thereof may not be reproduced or used in any manner whatsoever without the express written permission of the publisher,
Fishery Data Series No Kodiak Management Area Salmon Escapement and Catch Sampling Results, 2015
 Fishery Data Series No. 16-19 Kodiak Management Area Salmon Escapement and Catch Sampling Results, 2015 by Michelle L. Wattum Alaska Department of Fish and Game April 2016 Divisions of Sport Fish and Commercial
RE: Request for Audit of Ineligible Federal Aid Grants to Alaska Department of Fish & Game for Support of Predator Management
 June 30, 2014 Ms. Kim Elmore Assistant Inspector General Audits, Inspections & Evaluations Office of Inspector General U.S. Department of Interior 1849 C Street, NW, Mail Stop 4428 Washington, DC 20240
Youngs Creek Hydroelectric Project
 Youngs Creek Hydroelectric Project (FERC No. 10359) Resident Trout Monitoring Plan Annual Report 2014 Survey Prepared by: Everett, WA November 2014 Final This document has been prepared for the District.
Fishery Data Series No Salmon Age and Sex Composition and Mean Lengths for the Yukon River Area, 2011
 Fishery Data Series No. 14-57 Salmon Age and Sex Composition and Mean Lengths for the Yukon River Area, 2011 by Kyle J. Schumann Alaska Department of Fish and Game December 2014 Divisions of Sport Fish
ALASKA DEPARTMENT OF FISH AND GAME DIVISION OF COMMERCIAL FISHERIES NEWS RELEASE
 ALASKA DEPARTMENT OF FISH AND GAME DIVISION OF COMMERCIAL FISHERIES NEWS RELEASE Sam Cotten, Commissioner Scott Kelley, Director Contact: Anchorage Regional Office Holly Carroll, Area Management Biologist
Fishery Manuscript Series No Hatchery Chum Salmon Contribution to Southern Southeast Alaska Commercial Net Fisheries,
 Fishery Manuscript Series No. 13-1 Hatchery Chum Salmon Contribution to Southern Southeast Alaska Commercial Net Fisheries, 26 21 by Malika T. Brunette Andrew W. Piston Steven C. Heinl and Susan K. Doherty
Rock Creek Huntington County Supplemental Evaluation
 Rock Creek Huntington County Supplemental Evaluation Date of Survey: September 8 to September 10, 2008 Biologist: Rod A. Edgell Survey Objectives: Conduct population estimates for game fish at Rock Creek
IMPROVING POPULATION MANAGEMENT AND HARVEST QUOTAS OF MOOSE IN RUSSIA
 IMPROVING POPULATION MANAGEMENT AND HARVEST QUOTAS OF MOOSE IN RUSSIA Vladimir M. Glushkov Research Institute of Game Management and Fur Farming, Kirov, Russia. ABSTRACT: Annual harvest quotas for moose
Chum Salmon Stock Status and Escapement Goals in Southeast Alaska
 Special Publication No. 11-21 Chum Salmon Stock Status and Escapement Goals in Southeast Alaska by Andrew W. Piston and Steven C. Heinl Alaska Department of Fish and Game December 2011 Divisions of Sport
2010 Wildlife Management Unit 510 moose
 2010 Wildlife Management Unit 510 moose Photo: Shevenell Webb Section Authors: Kristina Norstrom and Shevenell Webb Suggested Citation: Norstrom, K., and S. Webb. 2010. Wildlife Management Unit 510 moose.
National Oceanic and Atmospheric Administration. Fisheries of the Caribbean, Gulf of Mexico, and South
 This document is scheduled to be published in the Federal Register on 07/13/2016 and available online at http://federalregister.gov/a/2016-16510, and on FDsys.gov Billing Code: 3510-22-P DEPARTMENT OF
ATLANTIC SALMON NEWFOUNDLAND AND LABRADOR, SALMON FISHING AREAS 1-14B. The Fisheries. Newfoundland Region Stock Status Report D2-01
 Fisheries Pêches and Oceans et Océans DFO Science Newfoundland Region Stock Status Report D2-01 ATLANTIC SALMON NEWFOUNDLAND AND LABRADOR, SALMON FISHING AREAS 1-14B Background There are 15 Atlantic salmon
EXECUTIVE SUMMARY Feasibility Study on the Reintroduction of Gray Wolves to the Olympic Peninsula
 EXECUTIVE SUMMARY Feasibility Study on the Reintroduction of Gray Wolves to the Olympic Peninsula Prepared by U.S. Fish and Wildlife Service Western Washington Office Introduction Historical records indicate
Valdez Fish & Game Advisory Committee January 26, 2018 Valdez Council Chambers
 Valdez Fish & Game Advisory Committee January 26, 2018 Valdez Council Chambers I. Meeting was called to order by Chair Hope Upicksoun at 6:34 pm II. III. IV. Members Present: Hope Upicksoun, Tim Bouchard,
Minnesota Department of Natural Resources Fisheries Division, Lake Superior Area
 Minnesota F-9-R(P)- Study 4 Job 616 Minnesota Department of Natural Resources Fisheries Division, Lake Superior Area Coaster Brook Trout Status in Minnesota-Lake Superior Tributaries Following Regulation
Fishery Data Series No Abundance and Length Composition of Cutthroat Trout in Florence Lake, Southeast Alaska, 2002
 Fishery Data Series No. 16-41 Abundance and Length Composition of Cutthroat Trout in Florence Lake, Southeast Alaska, 2002 by Peter D. Bangs and David C. Love Alaska Department of Fish and Game October
Fisheries Off West Coast States; Coastal Pelagic Species Fisheries; Annual. AGENCY: National Marine Fisheries Service (NMFS), National Oceanic and
, National Oceanic and") This document is scheduled to be published in the Federal Register on 06/30/2017 and available online at https://federalregister.gov/d/2017-13685, and on FDsys.gov Billing Code 3510-22-P DEPARTMENT OF
This document is scheduled to be published in the Federal Register on 06/30/2017 and available online at https://federalregister.gov/d/2017-13685, and on FDsys.gov Billing Code 3510-22-P DEPARTMENT OF
Hunter and Angler Expenditures, Characteristics, and Economic Effects, North Dakota,
 Agribusiness and Applied Economics Report No. 507-S January 2003 Hunter and Angler Expenditures, Characteristics, and Economic Effects, North Dakota, 2001-2002 Dean A. Bangsund and F. Larry Leistritz*
Bering Sea Salmon Bycatch Update North Pacific Fishery Management Council, July 2017
 Bering Sea Salmon Bycatch Update North Pacific Fishery Management Council, July 2017 Salmon are caught incidentally in the Bering Sea and Aleutian Islands (BSAI) offshore trawl fisheries, especially in
Original language: English CoP17 Doc CONVENTION ON INTERNATIONAL TRADE IN ENDANGERED SPECIES OF WILD FAUNA AND FLORA
 Original language: English CoP17 Doc. 39.2 CONVENTION ON INTERNATIONAL TRADE IN ENDANGERED SPECIES OF WILD FAUNA AND FLORA Seventeenth meeting of the Conference of the Parties Johannesburg (South Africa),
FISHERY MANAGEMENT PLAN FOR THE RED KING CRAB COMMERCIAL FISHERY IN BRISTOL BAY REGISTRATION AREA T, Rance Morrison
 FISHERY MANAGEMENT PLAN FOR THE RED KING CRAB COMMERCIAL FISHERY IN BRISTOL BAY REGISTRATION AREA T, 1999 by Rance Morrison Regional Information Report 1 No. 4K00-6 Alaska Department of Fish and Game Division
Origins of Chinook Salmon in the Yukon River Fisheries, 2012
 Fishery Data Series No. 15-16 Origins of Chinook Salmon in the Yukon River Fisheries, 2012 by Larry DuBois Alaska Department of Fish and Game June 2015 Divisions of Sport Fish and Commercial Fisheries
Agenda Item Summary BACKGROUND. Attachment 1
 Agenda Item Summary Attachment 1 BACKGROUND Oregon s recreational abalone fishery was suspended by emergency rule beginning January 1, 2018. This suspension was due to 1) low densities of red abalone,
SUBSISTENCE USE OF THE SOUTHERN ALASKA PENINSULA CARIBOU HERD
 SUBSISTENCE USE OF THE SOUTHERN ALASKA PENINSULA CARIBOU HERD James A. Fall, Robert J. Walker, and Ronald T. Stanek Technical Paper No. 191 This research was partially supported by ANILCA Federal Aid funds,