Technical Paper No. 418 Kodiak City, Larsen Bay and Old Harbor: An Ethnographic Study of Traditional Subsistence Salmon Harvests and Uses
|
|
|
- Ronald Lang
- 5 years ago
- Views:
Transcription

1 Technical Paper No. 418 Kodiak City, Larsen Bay and Old Harbor: An Ethnographic Study of Traditional Subsistence Salmon Harvests and Uses by Meredith A. Marchioni, James A. Fall, Brian Davis and Garrett Zimpleman June 2016 Alaska Department of Fish and Game Division of Subsistence
2 Symbols and Abbreviations The following symbols and abbreviations, and others approved for the Système International d'unités (SI), are used without definition in the reports by the Division of Subsistence. All others, including deviations from definitions listed below, are noted in the text at first mention, as well as in the titles or footnotes of tables, and in figure or figure captions. Weights and measures (metric) centimeter deciliter gram hectare kilogram kilometer liter meter milliliter millimeter cm dl g ha kg km L m ml mm Weights and measures (English) cubic feet per second ft 3 /s foot ft gallon gal inch in mile mi nautical mile nmi ounce oz pound lb quart qt yard yd Time and temperature day d degrees Celsius C degrees Fahrenheit F degrees kelvin K hour h minute min second s Physics and chemistry all atomic symbols alternating current AC ampere A calorie cal direct current DC hertz Hz horsepower hp hydrogen ion activity (negative log of) ph parts per million ppm parts per thousand ppt, volts V watts W General Alaska Administrative Code AAC all commonly-accepted abbreviations e.g., Mr., Mrs., AM, PM, etc. all commonly-accepted professional titles e.g., Dr., Ph.D., R.N., etc. compass directions: east E north N south S west W copyright corporate suffixes: Company Co. Corporation Corp. Incorporated Inc. Limited Ltd. District of Columbia D.C. et alii (and others) et al. et cetera (and so forth) etc. exempli gratia (for example) e.g. Federal Information Code FIC id est (that is) i.e. latitude or longitude lat. or long. monetary symbols (U.S.) $, months (tables and figures) first three letters (Jan,...,Dec) registered trademark trademark United States (adjective) U.S. United States of America (noun) USA U.S.C. United States Code U.S. state two-letter abbreviations (e.g., AK, WA) Measures (fisheries) fork length mideye-to-fork mideye-to-tail-fork standard length total length FL MEF METF SL TL Mathematics, statistics all standard mathematical signs, symbols and abbreviations alternate hypothesis H A base of natural logarithm e catch per unit effort CPUE coefficient of variation CV common test statistics (F, t, 2, etc.) confidence interval CI correlation coefficient (multiple) R correlation coefficient (simple) r covariance cov degree (angular ) degrees of freedom df expected value E greater than > greater than or equal to harvest per unit effort HPUE less than < less than or equal to logarithm (natural) ln logarithm (base 10) log logarithm (specify base) log 2, etc. minute (angular) ' not significant NS null hypothesis H O percent % probability P probability of a type I error (rejection of the null hypothesis when true) probability of a type II error (acceptance of the null hypothesis when false) second (angular) " standard deviation SD standard error SE variance population Var sample var
3 TECHNICAL PAPER NO. 418 KODIAK CITY, LARSEN BAY AND OLD HARBOR: AN ETHNOGRAPHIC STUDY OF TRADITIONAL SUBSISTENCE SALMON HARVESTS AND USES by Meredith A. Marchioni Coastal Connections, LLC, Anchorage and James A. Fall, Brian Davis, and Garrett Zimpleman Alaska Department of Fish and Game, Division of Subsistence, City Alaska Department of Fish and Game Division of Subsistence 333 Raspberry Road Anchorage, AK June 2016 Development and publication of this manuscript were partially financed by funds from the Office of Subsistence Management (OSM) of the U.S. Fish and Wildlife service under Cooperative Agreement #
4 The Division of Subsistence Technical Paper series was established in 1979 and represents the most complete collection of information about customary and traditional uses of fish and wildlife resources in Alaska. The papers cover all regions of the state. Some papers were written in response to specific fish and game management issues. Others provide detailed, basic information on the subsistence uses of particular communities which pertain to a large number of scientific and policy questions. Technical Paper series reports are available through the Alaska Resources Library and Information Services (ARLIS), the Alaska State Library and on the Internet: This publication has undergone editorial and professional review. Meredith A. Marchioni Coastal Connections, LLC 732 O Street, Apt 2, Anchorage, AK USA James A. Fall, Brian Davis, and Garrett Zimpleman Alaska Department of Fish and Game Division of Subsistence 333 Raspberry Road, Anchorage, AK USA This document should be cited as: Marchioni, M. A., J. F. Fall, B. Davis, and G. Zimpleman Kodiak City, Larsen Bay and Old Harbor: An Ethnographic Study of Traditional Subsistence Salmon Harvests and Uses. Alaska Department of Fish and Game Division of Subsistence, Technical Paper No. 418, Anchorage. The Alaska Department of Fish and Game (ADF&G) administers all programs and activities free from discrimination based on race, color, national origin, age, sex, religion, marital status, pregnancy, parenthood, or disability. The department administers all programs and activities in compliance with Title VI of the Civil Rights Act of 1964, Section 504 of the Rehabilitation Act of 1973, Title II of the Americans with Disabilities Act (ADA) of 1990, the Age Discrimination Act of 1975, and Title IX of the Education Amendments of If you believe you have been discriminated against in any program, activity, or facility please write: ADF&G ADA Coordinator, P.O. Box , Juneau, AK, U.S. Fish and Wildlife Service, 4401 N. Fairfax Drive, MS 2042, Arlington, VA, Office of Equal Opportunity, U.S. Department of the Interior, 1849 C Street NW, MS 5230, Washington, D.C The department s ADA Coordinator can be reached via phone at the following numbers: (Voice) , (Statewide Telecommunication Device for the Deaf) , (Juneau TDD) , or (Fax) For information on alternative formats and questions on this publication, please contact: ADF&G Division of Subsistence at
5 TABLE OF CONTENTS Page List of Tables... v List of Figures... vii List of Plates... viii List of Appendices... viii Abstract... ix 1. Introduction... 1 Overview of Current State and Federal Fishing Regulations... 1 Stimulus and Need For This Project: Permit Returns... 2 Research Background Research Methods... 5 Systematic Household Surveys... 5 Difficulties with a Stratified Sample in Kodiak City... 6 Survey Data Entry and Analysis... 7 Key Respondent Interviews... 9 Participant Observation... 9 Education Household Survey Results Demography Kodiak Island Borough population characteristics from US Census and AK Department of Labor Kodiak Road System Larsen Bay: Survey and U.S. Census Old Harbor: Survey and US Census Kodiak Road Connected Area Salmon Harvest and Use Patterns Survey results: salmon harvests and uses Comparisons with Other Years Location of Harvests Equipment ownership and use Commercial fishing involvement Larsen Bay Survey results: salmon harvests and uses Comparisons with other years Comparisons with permit results ii
6 Location of Harvests Equipment ownership and use Commercial fishing involvement Old Harbor Survey results: salmon harvests and uses Comparisons with other years Comparisons with permit results Location of Harvests Equipment ownership and use Commercial fishing involvement Reasons for Living in the Community Key Respondent Interview and Participant Observation Results Larsen Bay Subsistence Harvest Key Respondent Subsistence Harvesting Processing and Sharing Patterns by Subsistence Users Key Respondent Dry Fish Smoked Fish Key Respondent Dry Fish Smoked Fish Salted Fish Key Respondent Dry Fish Smoked Fish Larsen Bay Fishing locations Old Harbor Subsistence Harvest Key Respondent Trip to Sockeye Salmon Fishing Locations Processing Smoked Sockeye Salmon Key Respondent First Trip to Big Creek Second Trip to Big Creek Third Trip to Big Creek Old Harbor Fishing Locations iii
7 Kodiak City Key Respondent Kodiak City Tour of Smokehouse Kodiak City Fishing Locations Discussion Subsistence Salmon Fisheries On and Off the Road System Acquisition of Subsistence Knowledge: Social Networks and Gear Preferences Community Resilience Dealing with Lack of Subsistence Salmon: Society, Economics, and Subsistence: Environmental Change and Resource Availability: Permit System Reliability and Compliance Comparison with Williams, L., P. Coiley-Kenner, and D. Koster. (2010) Technical Paper Subsistence Salmon Permits Understanding Subsistence A Visit to Karluk Conclusion Recommendations Acknowledgements References iv
8 LIST OF TABLES Table Page 1. Project staff Kodiak Borough population Ethnic Composition of Kodiak Island Borough Communities, Population estimates, Kodiak City, Alaska, 2010 and Demographic characteristics, Kodiak City, Alaska, Population profile, Kodiak City, Alaska permit holders, Population profile, Kodiak City, Alaska other residents, Population estimates, Larsen Bay, Alaska, 2010 and Demographic characteristics, Larsen Bay, Alaska, Population profile, Larsen Bay, Alaska, Population estimates, Old Harbor, Alaska, 2010 and Demographic characteristics, Old Harbor, Alaska, Population profile, Old Harbor, Alaska, Reported harvests and uses of salmon, Kodiak road system permit holders, Reported harvests and uses of salmon, Kodiak road system other residents, Estimated percentages of salmon harvested by gear type, resource, and total salmon harvest, Kodiak road system permit holders, Estimated percentages of salmon harvested by gear type, resource, and total salmon harvest, Kodiak road system other residents, Percentage of households using geartype to harvest salmon by gear type, Kodiak road system permit holders, Alaska, Percentage of households using geartype to harvest salmon by gear type, Kodiak road system other residents, Alaska, Kodiak road system: number of permits issued and returned, and reported salmon harvests by species, Changes in household uses of resources compared to recent years, Kodiak road system, Reasons for less household uses of salmon compared to recent years, Kodiak road system, Reasons for more household uses of salmon compared to recent years, Kodiak road system, Resources households reporteded needing more of, Kodiak road system, Reported impact to households reporting that they did not get enough salmon, Kodiak road system, Things households reported doing differently as the result of not getting enough of a resource, Kodiak road system, Estimated harvest of salmon by gear and location, Kodiak City permit holders, Percentage of harvest from location of salmon by gear, Kodiak permit holders, Estimated harvest of salmon by gear and location, Kodiak other residents, Percentage of harvest from location of salmon by gear, Kodiak other residents, Comparison of reported length of time households have used the same fishing location, Kodiak City, Alaska, Reported household use of gillnets, Study communities, Who taught households to use gillnets, study communities, 2012 (asked of those who used gillnet in 2012) Comparative summary of households not using gillnets, study communities, Summary of reported rod and reel use in study communities, Reasons respondents did not use rod and reel, study communities Ownership of boats and subsistence nets, all study communities, v
9 38. Participation in Commercial Fishing and Percentage of income from commercial fishing, study communities, Commercial fishing species and locations of households in Larsen Bay, Alaska, Estimated harvests and uses of fish resources, Larsen Bay, Alaska, Estimated harvest of salmon by gear type and resource, Larsen Bay, Alaska, Estimated percentages of salmon harvested by gear type, resource, and total salmon harvest, Larsen Bay, Alaska, Percentage of households using gear type to harvest salmon by gear type, Larsen Bay, Alaska, Changes in household uses of resources compared to recent years, Larsen Bay, Alaska, Reasons for less household uses of resources compared to recent years, Larsen Bay, Alaska, Reasons for more household uses of resources compared to recent years, Larsen Bay, Alaska, Reported impact to households reporting that they did not get enough of a type of resource, Larsen Bay, Alaska, Resources households reporteded needing more of, Larsen Bay, Alaska, Things households reported doing differently as the result of not getting enough of a resource, Larsen Bay, Alaska, Number of permits issued and returned, and reported salmon harvests by species, Larsen Bay, Alaska, Estimated harvest of salmon by gear and location, Larsen Bay, Alaska, Percentage of harvest from location of salmon by gear, Larsen Bay, Alaska, Reported length of time households have used the same fishing location, Larsen Bay, Alaska, Estimated harvests and uses of fish resources, Old Harbor, Alaska, Estimated harvest of salmon by gear type and resource, Old Harbor, Alaska, Estimated percentages of salmon harvested by gear type, resource, and total salmon harvest, Old Harbor, Alaska, Percentage of households using geartype to harvest salmonby gear type, Old Harbor, Alaska, Changes in household uses of resources compared to recent years, Old Harbor, Alaska, Reasons for less household uses of resources compared to recent years, Old Harbor, Alaska, Reasons for more household uses of resources compared to recent years, Old Harbor, Alaska, Reported impact to households reporting that they did not get enough of a type of resource, Old Harbor, Alaska, Resources households reported needing more of, Old Harbor, Alaska, Things households reported doing differently as the result of not getting enough of a resource, Old Harbor, Alaska, Number of permits issued and returned, and reported salmon harvests by species, Old Harbor, Alaska, Estimated harvest of salmon by gear and location, Old Harbor, Alaska, Percentage of harvest by location of salmon by gear, Old Harbor, Alaska, Reported length of time households have used the same fishing location, Old Harbor, Alaska, Reasons for continuing to live in community Reported amounts of salmon given and received, study communities, vi
10 70. Sample achievement, Kodiak road system, Sample acheivement, Larsen Bay, Sample acheivement, Old Harbor, LIST OF FIGURES Figure Page 1. Location of study communities Kodiak City CDPs Ethnic makeup of Kodiak Island Borough, Population profile, Kodiak road system permit holders, Population profile, Kodiak road system other residents, Population history, Larsen Bay, Alaska, Population profile, Larsen Bay, Alaska, Population history, Old Harbor, Alaska, Population profile, Old Harbor, Alaska, Kodiak road system: number of subsistence permits returned, Kodiak road system: Total salmon reported from subsistence permit and estimated from surveys, Composition of salmon harvest, Kodiak road system permit holders, Composition of salmon harvest, Kodiak road system other residents, Kodiak road system samples, 2012: salmon by source (pounds usable weight) Salmon harvests by gear type, Kodiak road system, Percentage of pounds of salmon harvested by source, Kodiak road system communities, 1991, 1992, 1993, and Percentage of households reporting whether they had enough resources, Kodiak road system, Salmon harvest locations, Kodiak road system communities, Responses to the question, "Who taught you to use a gillnet?" All communities, Reasons for using a gillnet to harvest salmon, all communities, Reasons for not using a gillnet, all communities, Composition of salmon harvest, Larsen Bay, Alaska, Salmon harvest by gear type, Larsen Bay, Alaska, Percentage of households reporting whether they had enough resources, Larsen Bay, Alaska, estimated salmon harvests, lb per person, Larsen Bay, Alaska, 1982, 1986, , 1997, , and Percentage of salmon harvested by source, Larsen Bay, Alaska 1986, 1989, , 1997, , and Comparisons of permit and survey data, Larsen Bay, Alaska, Salmon harvest locations, Larsen Bay, Alaska, Composition of salmon harvest, Old Harbor, Alaska, Salmon harvest by gear type, Old Harbor, Alaska Percentage of households reporting whether they had enough resources, Old Harbor, Alaska, Estimated salmon harvests, lb per person, Old Harbor, Alaska, 1982, 1986, , , and Percentage of pounds of salmon harvested by source, Old Harbor, Alaska, 1986, , , and Comparison of survey and permit data, Old Harbor, Alaska, vii
11 35. Salmon harvest locations, Old Harbor, Alaska, Top reason for residing in community, all communities, Reasons cited for residing in community, all communities, LIST OF PLATES Plate Page 1. Key Respondent in his work skiff, Larsen Bay, Alaska Drying shack on top of smokehouse, Larsen Bay, Alaska Smokehouse fire pit and deflector, Larsen Bay, Alaska Key respondent showing her smokehouse, Larsen Bay, Alaska Smokehouse, firepit, and deflector, Larsen Bay, Alaska Tonya Lee and key respondent baiting longline skate Key respondent with octopus caught on longline skate Aerial view of Big Creek with Old Harbor airstrip at bottom right Fishing for coho salmon on the banks of Big Creek, Old Harbor, Alaska Fighting a coho salmon on the bank of Big Creek, Old Harbor, Alaska Seining coho salmon Big Creek, Old Harbor, Alaska Key respondent preparing smoked salmon for jarring, Kodiak City Fishing for coho salmon Pasagshak River, Kodiak City LIST OF APPENDICES Appendix Page Appendix A Kodiak Subsistence Permits Appendix B Survey Instrument Appendix C Conversion Factors Appendix D Additional Tables Appendix E Lee Family Subsistence Salmon Fishing Trip at the Buskin Outlet, June 8, viii
12 ABSTRACT Salmon have been an important contributor to the subsistence diet of people living on Kodiak Island for centuries. Between 2012 and 2014, research conducted by the Alaska Department of Fish and Game Division of Subsistence and the Kodiak National Wildlife Refuge documented traditional ecological knowledge (TEK) and subsistence harvests and use of salmon in the Kodiak Island communities of Kodiak City, Larsen Bay, and Old Harbor. Researchers conducted key respondent interviews, frequently taking part in fishing activities alongside community members. Data indicate that all or nearly all of the study households used salmon for subsistence purposes. In all communities, the species most harvested was sockeye salmon. Gear types used by fishers included subsistence gillnets and seines, rod and reel, and removal of salmon for home use from commercial catch. Social networks operate to create access to salmon for residents of each community, through education, sharing of gear, or through gifts of salmon between households. These networks are organized around family relationships as well as non-related friends and coworkers. Salmon are generally smoked, dried, or jarred for use over the remainder of the year. When salmon are scarce, people in each community turned to buying store-bought food or substituted other subsistence foods. Key words: Kodiak, Kodiak City, Larsen Bay, Old Harbor, Chinook salmon, chum salmon, coho salmon, pink salmon, sockeye salmon, gillnet, setnet, purse seine, rod and reel, subsistence, traditional ecological knowledge ix
13 This page intentionally left blank. x
14 1. INTRODUCTION The goal of this project was to document traditional ecological knowledge (TEK) and subsistence harvests and use of salmon in the Kodiak Island communities of Kodiak City, Larsen Bay, and Old Harbor (Figure 1). The Alaska Department of Fish and Game Division of Subsistence partnered with the Kodiak National Wildlife Refuge (KNWR) to complete both objectives; other parties involved in project design and public outreach include the Alutiiq Museum, the Kodiak Area Native Association, the Sun aq Tribe of Kodiak, and fisheries managers in the Kodiak office of the Alaska Department of Fish and Game (ADF&G). The inclusion of traditional ecological knowledge (TEK) has benefited research concerning human ecology and natural resource science, lines of inquiry that until recently have depended solely on the strictures of Western science. TEK is the result of a process wherein people acquire detailed information about their local environments, observations of order, relationships, changes over time, and systems of cause-and-effect, which are then incorporated into the social and intellectual systems through which individuals and culture groups understand their place in the natural order. With its foundation in observation, TEK has the power to produce synthetic knowledge using the fundamental precepts of deductive reasoning. Documenting TEK has opened access to unique datasets, which focus on long-term correlative observations, and has made those data available to Western scientists for use in the management of natural resources (Wheeler and Craver 2005; Williams et al. 2010). Household harvest surveys, primarily those conducted by the Alaska Department of Fish and Game Division of Subsistence, have provided comprehensive data describing the role played by wild foods in Alaska communities, data that contribute directly to the management and regulation of fisheries. Household data are combined and analyzed to generate a profile of the community s subsistence harvest activities, including patterns of use, seasonality, participation, cooperation, and food distribution, as well as the relationship between wild food harvest and other socio-economic variables such as income and work schedule. In addition to quantifiable data, survey projects often collect additional information related to observations of individual fish species, larger fish populations, marine communities and other particular observations about fish health, abundance, and condition. These firsthand observations help fishery managers identify new management concerns and information needs. Community household harvest survey efforts are revisited in many communities, resulting in a series of subsistence snapshots. These measures of community subsistence prove essential for implementing state and federal subsistence laws and regulations. OVERVIEW OF CURRENT STATE AND FEDERAL FISHING REGULATIONS In March 1988 the Alaska Board of Fisheries made a positive C&T use determination for all species of salmon in the waters immediately surrounding the Kodiak Archipelago (5 AAC ). State subsistence regulations allow qualified Alaska residents to harvest salmon in the Kodiak Management Area (KMA) using seine and gillnet gear. A subsistence fishing permit is required, and fishing is allowed daily from 0600 hours to 2100 hours on a year-round basis. One exception is subsistence fishing from commercial fishing seine boats, where a gillnet may be used to harvest subsistence salmon at any time between June 1 and September 15 (5 AAC (a)(2)). For most waters within the KMA there is no harvest limit for salmon. Until 2008 there had been a limit throughout the KMA of 25 fish for the head of household and 25 fish for each additional household member, but this limit now only exists in fresh waters and salt waters near Kodiak City, within one mile from shore in the area beginning at Crag Point near the end of Anton Larsen Bay Road in the north, extending to Saltery Cove on Ugak Bay in the south (5 AAC ). No limits exist in parts of the KMA near Larsen Bay or Old Harbor. Federal subsistence management regulations mirror state regulations in most cases, except that they only apply to rural residents of the Kodiak Island Borough. Federal subsistence regulations for federally- 1
15 managed waters also expand the allowable gear type to include rod and reel. Also, fishing under federal regulations is open 24 hours a day. Individuals qualified to participate under the federal rules must obtain a permit from ADF&G in Kodiak City and record their harvest on that permit. Note that rod and reel harvests described in this report may have been conducted under either state or federal regulations. Federal subsistence regulations allow rod and reel as an allowable gear type, but rod and reel is defined under state regulations as a sport fishing method. The Kodiak National Wildlife Refuge has been issuing a separate permit for federally-qualified residents to subsistence fish for salmon on federal waters in the KMA. Cinda Childers, Refuge Clerk in the KNWR office, was able to report that the permit was first issued around 2010 to a small number of recipients 1. Ms. Childers said that the federal permit is intended to supplement the state subsistence permit, which is still required to be in the fisher s possession when fishing under the federal subsistence program. Since 2010 the number of requests for these permits has grown, with 20 issued in 2015 and 36 issued as of June 30, Although the permit probably existed at the time of this research project, neither ADF&G nor KNWR project partners were able to access information about the permit. The permits used for both state and federal subsistence fishing are shown in Appendix A. STIMULUS AND NEED FOR THIS PROJECT: PERMIT RETURNS Data used in assessing the harvest, use, and dependence on many wild foods by Alaska residents are collected infrequently and with varying degrees of accuracy. On Kodiak Island, ADF&G conducts two different programs to collect subsistence harvest data. The Division of Subsistence conducts household harvest surveys, a format used for over 20 years to collect comprehensive subsistence data. Systematic, in-person household harvest survey projects are conducted in select communities once every few years. This method produces the most accurate harvest, measures used by the Alaska Board of Fisheries and Board of Game when making regulatory decisions concerning access and dependence under the Alaska Subsistence Law (Fall and Shanks 2000). Annual subsistence harvests of salmon on Kodiak Island are tracked by ADF&G Division of Commercial Fisheries based in Kodiak City. As part of the program, ADF&G sends out subsistence fishing permits at the beginning of the year to anyone who returned a permit the previous year, and requires that recipients record their harvest on the permit and return the permit after the conclusion of the salmon season (Jackson et al. 2012). However, a large number of mail-out permits are returned to ADF&G by the U.S. Postal Service marked undeliverable. Harvests reported on returned permits are not expanded or otherwise used by managers as a basis for estimating the harvest of fishers who did not receive (or return) their permits. As a result, annual harvest estimates are based solely on the harvests enumerated on permits that find their way back to the Kodiak ADF&G office. A review of the permit program by the Division of Subsistence in Kodiak Island communities in 2005 (Williams et al. 2010) concluded that lost and unreturned permits were indeed contributing to an underestimation of subsistence salmon harvests and a misrepresentation of the importance of salmon to Kodiak Island residents. Miscalculating these factors creates a problem for managers of some of Alaska s fisheries who are required by law to provide for basic subsistence needs but are unable to adequately account for those needs. Public outreach and education efforts following the 2005 Division of Subsistence study attempted to increase participation in the subsistence salmon permit system; people in the remote Kodiak Island communities of Akhiok, Larsen Bay, Old Harbor, Ouzinkie, and Port Lions were encouraged to request permits, fill them out accurately, and return them on time to the ADF&G office in Kodiak City for 1. Cinda Childers, Refuge Clerk, Kodiak National Wildlife Refuge, personal communication, June 30,
16 tabulation. The outreach effort was meant to emphasize to fishers the importance of accurate harvest data to future management decisions and protection of subsistence rights. Despite these efforts, Kodiak Island salmon permit harvest data continued to show a steady decrease between 1999 and 2009, dropping during that time from an estimated 33,480 to 27,947 salmon (tables 20, 50, and 64) (Fall et al. 2014). At the Alaska Board of Fisheries meeting held in Kodiak in 2010, the board chairman pointed to recent years data and decided that permit participation and harvest recording continued to be inadequate. The chairman emphasized the need for more accurate and dependable Kodiak Island salmon harvest data. In 2011 the Office of Subsistence Management prepared a Priority Information Needs document with the Kodiak/Aleutians Regional Advisory Council that included an information need related to the environmental, demographic, regulatory, cultural, and socioeconomic factors affecting harvest levels of salmon for subsistence in the Kodiak Area. This project was conducted in response to both these requests for information. Through a combination of household harvest surveys, key respondent interviews, and participant observation methods, the project sought to address the following research questions: 1. What are the historic use patterns of subsistence salmon fisheries that can be accessed by the Kodiak archipelago road system and by more isolated communities? 2. What local knowledge do subsistence salmon harvesters hold regarding the social-ecological system of the Kodiak archipelago of which the subsistence salmon fishery is a part? 3. How have cultural, social, and economic factors shaped the Kodiak subsistence salmon fishery over time? The household harvest survey produced a single-year harvest estimate for two of the three communities (Larsen Bay and Old Harbor), adding a new year s worth of data to the Division s harvest database and enhancing the harvest database that will assist fishery managers. The intent of the surveys in the Kodiak road system area was not to produce a harvest estimate, but rather to document use patterns of fishery participants and other area households. Survey respondents were given the opportunity to express their views, observations, and concerns, which were documented in addition to quantifiable harvest survey data. The project s effort to conduct key respondent interviews and participant observation outings produced qualitative and spatial data related to environmental, cultural, and socioeconomic aspects of the fishery, in addition to observations made in historic context and other comments related to the permit system currently in place. Specific project objectives were: 1. To compile and update data on the harvest of salmon in the Kodiak archipelago road system and the case study communities of Larsen Bay and Old Harbor and to compare and contrast the road system fishery and the fishery of the more isolated communities. 2. To describe current (2012 study year) subsistence harvest and use patterns of salmon on the Kodiak archipelago including harvest locations. Evaluate whether educational efforts in Larsen Bay and Old Harbor increased the accuracy of permit data over time. 3. To collect and discuss local knowledge about patterns and trends of salmon harvests and salmon stock diversity, including changes in location over time. 4. To identify factors of the social-ecological system of the Kodiak archipelago that shape contemporary subsistence harvesting patterns and uses of salmon by residents of Kodiak City and the nearby road system, and the study communities of Larsen Bay and Old Harbor. 3
17 RESEARCH BACKGROUND The harvest and use of wild resources in communities on Kodiak Island has been documented several times in the past (Mishler 2001; Williams et al. 2010), showing how subsistence continues to be an important part of personal identity, family life, and community well-being (Fall 1999). Besides marine mammals, shellfish, birds and eggs, plants, and freshwater fish like trout and char, salmon consistently rank among the most important of all subsistence resources, both in terms of overall pounds of usable food, and as the focus of participation and social connectivity. The strong connection between humans and salmon is one that has existed on the Kodiak Archipelago for a thousand years or more (Steffian and Saltonstall 2004). Over time the terms of this relationship have changed with the introduction of new harvest technologies, modes of social and economic organization, food alternatives, legal jurisdictions, and regulatory restrictions. Changes in human population and other variables have also caused systemic change. Communities with larger populations and greater exposure to technology, consumer goods, economic alternatives, civil infrastructure, and industrial development experience these shifts in a different way than smaller, more remote communities. Several reports written in recent years highlight both the traditional aspects of Kodiak Island subsistence and the contemporary aspects of the ages-old system. Craig Mishler s book Black Ducks and Salmon Bellies: An Ethnography of Old Harbor and Ouzinkie, Alaska, describes the way subsistence embodies historical elements of social organization, industrial development, cultural identity, and natural resource policy in two Kodiak Island communities (Mishler 2001). Other work has a particular focus on socioeconomic and cultural changes that are brought about by shifts in local participation in the commercial fishing industry (Donkersloot and Carothers 2016), an aspect of local Alaskan economies that directly influences subsistence, cultural identity, and traditional values (Reedy-Maschner 2010; Wolfe 1984). Kodiak s subsistence activities have also been influenced by changes in demography, transportation technology, employment levels, disasters such as the Exxon Valdez Oil Spill, and other variables that define the modern American community (Fall 2006). The field of cultural anthropology has addressed the need to define the effects that natural resource managers and fisheries policy makers have on socio-economic systems, community organization, and cultural identity. The term political ecology has been used to define the anthropological study of the relationships between social systems and natural resources as they are mediated by managers (Robbins 2012). On Kodiak Island, management and policy have been shown to influence not only the practice of subsistence salmon fishing, but also the way people view themselves, their communities, and their future prospects in relationship to salmon. Fisheries management relies on observations and calculations focusing on the way fish live, reproduce, move, and die within a set of known environmental parameters. In the 21st century, however, environmental change is rearranging those parameters, as well as the patterns of access and harvest employed by local fishers. This project sought to explore those parameters by answering the three research questions listed above. 4
18 2. RESEARCH METHODS In order to address the research questions and study objectives, the project employed three social science methods: systematic household surveys with a census or a sample of each community, interviews with key respondents, and participant observation with subsistence harvesters and processors. All three research methods were successfully executed in Old Harbor, Larsen Bay, and Kodiak City, however researchers had to make multiple trips to each of the three communities and implement more than one method during each visit. Participant observation was not included within the original study proposal. Division of Subsistence personnel determined it was necessary to utilize this method to enhance researchers understanding of the fisheries and the communities when interpreting quantitative data. In October of 2011, prior to conducting research, Marchioni obtained approval from the Larsen Bay Tribal Council. In March 2012, she traveled to Larsen Bay and Old Harbor to present the goals of the study, answer any questions, and request advice and support from the councils. At this meeting the Old Harbor Tribal Council provided a letter of support for the Division of Subsistence and the Kodiak National Wildlife Refuge to conduct research. The Old Harbor Tribal Council and Larsen Bay Tribal Council were both supportive of the project and provided assistance both initially and throughout the two and a half years of fieldwork. In each study community a local research assistant (LRA) was hired to assist Marchioni and Lee in conducting surveys and identifying individuals for key respondent interviews. Both tribal councils were helpful in recommending individuals to be LRAs and key respondents. LRAs allow the Division of Subsistence to engage communities in the process of collecting data. According to Bernard (2006) when a researcher has built up rapport and trust in a field situation, people are more likely to give accurate and reliable information. In the absence of time to build rapport and trust, the Division of Subsistence uses LRA s to make research participants more comfortable during interviews. LRAs also provide invaluable information to researchers about how to frame questions to better accommodate each community and each household. Table 1 lists all project participants. The list includes individuals involved in project management, field research, qualitative and quantitative data entry and analysis, map production, and report writing. SYSTEMATIC HOUSEHOLD SURVEYS In March 2013, researchers conducted systematic household surveys in Kodiak City, Old Harbor, and Larsen Bay. The Division of Subsistence uses systematic household surveys to survey a representative sample of the population of a community. Surveys are done door to door with either a sample of the community, or a census of the community depending on size. After obtaining household lists from Old Harbor and Larsen Bay tribal councils, surveys were done with a census of willing and available households in Old Harbor and Larsen Bay. In Kodiak City, a list of residential property owners was acquired from the Kodiak City administrative offices and was used by researchers to create a stratified, random sample. The sample was stratified by households that had acquired a subsistence salmon permit for the year prior (2012) and those households which had not. Households in each stratum were randomized and a sample was drawn from each group. Of the 1,611 households who had been issued a permit in 2012, 100 were randomly selected for a survey; for the other 2,827 households in Kodiak, an additional 100 were selected. Using a stratified sample often improves the representativeness of the sample by reducing sampling error. It can produce a weighted mean that has less variability than the arithmetic mean of a simple random sample of the population. However, due to several unique factors specific to Kodiak City, stratifying the population by permit holders and non-permit holders proved to be an inefficient choice (discussed in the Difficulties with a Stratified Sample in Kodak City section below) Local research assistants (LRAs) in Old Harbor and Larsen Bay helped determine which households on each list were vacant or not available at the time of research, who lived in each household, and which 5
19 individuals were not full-time residents. LRAs were trained to conduct the surveys, which they would do depending on their level of comfort in a given household. All LRAs were accompanied by Marchioni, Lee, or another ADF&G researcher. Systematic household surveys asked participants to estimate their household s salmon harvest for the entirety of the year prior (2012). The location of salmon harvest was also recorded on the survey form. All survey data were collected at the household level to protect the identities of all participants. Surveys were used to meet objective 1; to compile and update data on the harvest of salmon in the Kodiak archipelago road system and the communities of Larsen Bay and Old Harbor and objective 2; to describe the current subsistence harvest and use patterns of salmon on the Kodiak archipelago including harvest locations. The survey gathered basic demographic information for each household, as well as participation, harvest, use, processing, and sharing information of salmon by species, location, seasonality, and gear type. The surveys were also designed to address objective 3; to collect and discuss local knowledge about patterns and trends of salmon harvests and salmon stock diversity, including changes in location over time and objective 4; to identify factors of the social-ecological system of the Kodiak archipelago that shape contemporary subsistence harvesting patterns and uses of salmon by residents of Kodiak City and the nearby road system, and the study communities of Larsen Bay and Old Harbor. Data collected during each household harvest survey document how people value salmon and salmon fishing. Survey questions addressed how people learned to subsistence fish for salmon, who taught them, why they continue to engage in subsistence fishing, and how their practices, harvest timing, and locations have changed with a changing environment. The second part of objective 2 was to describe current harvest locations. Originally, the household survey included a mapping exercise where respondents would record detailed documentation of harvest locations and other salmon-related observations directly onto paper maps, which would then be digitized and analyzed using Geographic Information Systems (GIS) software. When the research started, however, an error was discovered in the format of the paper survey maps, which made digitizing the information impossible. While the mapping exercise failed, harvest location data were successfully captured on pages 4 6 of the survey form, data used to describe harvest locations for each salmon species by community. A blank copy of the survey form is included for reference in Appendix B. Difficulties with a Stratified Sample in Kodiak City Five factors unique to Kodiak City made stratifying the sample by the subsistence salmon permit holders list and the City of Kodiak s property owner list difficult and inefficient. First, the subsistence permit list did not include the names of all household members, and provided contact information consisting mainly of P.O. boxes, not physical addresses. The list of all household owners provided by the City of Kodiak had only physical addresses and an incomplete list of owner names (the household owner s name was unavailable for many households). So when researchers attempted to distinguish which households to remove from the population list because the residents had a permit in 2012, it proved excessively difficult. For example, when visiting those houses randomly selected from the household owners list that did not have a subsistence salmon permit, fifty percent of the time the person occupying the household had a subsistence salmon permit on which they had written their P.O. Box for a mailing address and were renting the dwelling (the owner, according to the property list, did not live in the house and had not acquired a subsistence salmon permit in 2012). In this instance, researchers could not interview the household as they should have been included within the permit holder stratum and to maintain randomness they could only be interviewed when pulled from that stratum s list. This example also speaks to the second and third unique factors to Kodiak City that made this sampling strategy difficult. The second being that multiple residential properties in Kodiak City are owned by one person and that one person may not have obtained a subsistence salmon permit but the renters of their 6
20 several properties may have. The third factor is that many Kodiak City households are owned by people who live off island most of the year, or the entire year, and rent their households out during the winter or summer months or both. The majority of the population of Kodiak who either rent or own their residence use a post office box as their mailing address on subsistence permits. The fourth factor impacting the stratified sampling strategy was that a large number of Kodiak City residential properties are inhabited by multiple families and individuals. Employees in the city administration office alluded to the fact that many households along the road system rent out rooms and efficiencies in their houses, which are not distinguished in any city or municipality record. A common occurrence was when a researcher would approach a property and immediately notice an obvious separate entrance, or the person answering the door said they rented a room along with three other people, two of which were using one subsistence salmon permit but had no relation to each other, and none of them owned the dwelling unit. The household owner had been stratified as a non-subsistence salmon permit holder. So these individuals, while willing to participate, could not be surveyed unless their names were randomly sampled from the permit holder list. A fifth factor influencing the efficiency of the research was that the population was all inclusive of the Kodiak Road system, and not just Kodiak City. CDP s and established communities along the road system were included in the Kodiak City population. When the population was stratified and then sampled, residential properties in these communities would randomly appear. The same factors that made stratifying Kodiak City population difficult also applied to these properties. In these instances, researchers would have to travel over an hour each direction to find that the owner of the property, who did not have a subsistence permit, was not living at the property. The renter, who often times did have a permit, could not be sampled because their name had not appeared on the other stratum list. These five factors made stratifying the Kodiak City road system sample a learning experience. For Alaska communities that support a significant number of people employed seasonally in the fishing and processing industries, such as Kodiak City, the challenges involved in planning this project stressed the importance of requiring both mailing and physical addresses, names of all individuals in a household, and phone numbers or addresses on subsistence permits. Without this information, attempting to stratify these large communities with transient populations may produce numbers that do not represent the true behavior of a community s full-time residents. In the end, surveys were conducted with 89 households from the permitted stratum and 121 were completed with the non-permitted stratum. Tables describing the sampling of Kodiak City households, both permitted and other, are contained in Appendix D, Table 1. Sampling information for the other study communities are in Appendix D, Table 2 (Larsen Bay) and Table 3 (Old Harbor). Survey Data Entry and Analysis Systematic subsistence household harvest survey design followed ADF&G Division of Subsistence household survey methodology used to develop community harvest estimates. Results from surveyed households were expanded to derive community harvest estimates. Fractions of species numbers result from the expansion procedure and are rounded to the nearest tenth in accompanying report tables. All data were coded for data entry by Division of Subsistence staff in Anchorage. Surveys were reviewed and coded by the project leads in each community for consistency. Responses were coded following standardized conventions used by the Division of Subsistence to facilitate data entry. Information management staff within the Division of Subsistence set up database structures within Microsoft SQL Server 2 at ADF&G in Anchorage to hold the survey data. The database structures included rules, 2. Product names are given because they are established standards for the State of Alaska or for scientific completeness; they do not constitute product endorsement. 7
21 constraints, and referential integrity to ensure that data were entered completely and accurately. Data entry screens were available on a secured internal network. Daily incremental backups of the database occurred, and transaction logs were backed up hourly. Full backups of the database occurred twice weekly. This ensured that no more than one hour of data entry would be lost in the unlikely event of a catastrophic failure. All survey data were entered twice and each set compared in order to minimize data entry errors. Once data were entered and confirmed, information was processed with the use of Statistical Package for the Social Sciences (SPSS) software, version 21. Initial processing included the performance of standardized logic checks of the data. Logic checks are often needed in complex data sets where rules, constraints, and referential integrity do not capture all of the possible inconsistencies that may appear. Harvest data collected as numbers of salmon were converted to pounds usable weight. The average round weight of salmon is calculated yearly by the Division of Commercial Fisheries for various fishing districts throughout Alaska. For this study, those round weights were converted to pounds usable weight using a standard formula. Appendix C contains the conversion factors for the five species of salmon. ADF&G staff also used SPSS for analyzing the survey information. Analyses included review of raw data frequencies, cross tabulations, table generation, estimation of population parameters, and calculation of confidence intervals for the estimates. Missing information was dealt with on a case-by-case basis according to standardized practices, such as minimal value substitution or using an averaged response for similarly-characterized households. Typically, missing data are an uncommon, randomly-occurring phenomenon in household surveys conducted by the division. In unusual cases where a substantial amount of survey information was missing, the household survey is treated as a non-response and not included in community estimates. ADF&G researchers documented all adjustments. Harvest estimates and responses to all questions were calculated based upon the application of weighted means (Cochran 1977). These calculations are standard methods for extrapolating sampled data. As an example, the formula for harvest expansion is H h S (1) h h (2) n where: H the total estimated harvest (numbers of resource or pounds) for the community i, h the mean harvest of returned surveys, h the total harvest reported in returned surveys, n the number of returned surveys, and S the number of households in a community. As an interim step, the standard deviation (SD) (or variance [V], which is the SD squared) was also calculated with the raw, unexpanded data. The standard error (SE) (or SD of the mean) was also calculated for each community. This was used to estimate the relative precision of the mean, or the likelihood that an unknown value would fall within a certain distance from the mean. In this study, the relative precision of the mean is shown in the tables as a confidence limit (CL), expressed as a percentage. Once SE was calculated, the CL was determined by multiplying the SE by a constant that reflected the level of significance desired, based on a normal distribution. The value of the constant is derived from the t-distribution, and varies slightly depending upon the size of the community. Though there are numerous ways to express the formula below, it contains the components of a SD, V, and SE: 8
22 C. L. % where: s sample standard deviation, n sample size, h mean harvest of returned surveys, N population size, and t / s n N n N 1 h t / student s t statistic for alpha level ( =.95) with n 1 degrees of freedom. Small CL percentages indicate that an estimate is likely to be very close to the actual mean of the sample. Larger CL percentages mean that estimates could be further from the mean of the sample. The corrected final data from the household survey for Larsen Bay and Old Harbor will be added to the Division of Subsistence Community Subsistence Information System (CSIS). This publicly-accessible database includes community-level study findings. Results, discussion, and conclusions regarding systematic household surveys are presented in Chapter 3. KEY RESPONDENT INTERVIEWS Semi-structured interviews were conducted with high harvesters and elders in each community. The semistructured interviews used the research questions and objectives as a loose guide, and the interviewer remained free to branch into other topics if they felt the information could be useful to the study objectives. A total of seven key respondents were interviewed; one in Kodiak City, two in Old Harbor, and four in Larsen Bay. Due to the population size of Kodiak City, key respondents were identified by individuals who worked at ADF&G, the Sun aq Tribe, the Wildlife Refuge, and the Alutiiq Museum. Key respondents were also identified during harvest surveys when researchers encountered an individual who was a high harvester, had lived on Kodiak Island for a long time (often times an elder), knew a great deal about subsistence or fit all three criteria. In the end, time constraints and conflicting time schedules only allowed one key respondent interview in Kodiak city. Key respondents were identified more easily in Larsen Bay and Old Harbor. The tribal councils provided recommendations for interview subjects and researchers selected additional individuals during household harvest surveys. All key respondent interviews were open-ended, conducted either in household or public settings depending on the wishes of the interviewee, and ran anywhere from one to four hours. Interviewees were asked questions about how local salmon runs have changed over time (run health, run timing, etc.), how they learned their current subsistence practices, how subsistence harvesting and processing techniques have changed over time, what they believe is affecting the salmon runs, and how they value subsistence and salmon. Researchers would allow interviewees to respond to questions for as long as they wanted and their answers would often direct researchers to their next question. If an interviewee permitted, the interviews were recorded and transcribed at a later date. Interviews were documented with researcher notes and/or audio recordings. Audio recordings were transcribed by Marchioni and ADF&G graduate intern Hannah Johnson. Transcriptions were reviewed and summarized in the Key Respondent Interview sections in Chapter 4. PARTICIPANT OBSERVATION Participant observation and photography were used to document each community s current subsistence harvesting and processing practices. Participant observation involves researchers immersing themselves (3) 9
23 in a culture and learning to remove themselves every day from that immersion so they can intellectualize what they have seen and heard, put it into perspective, and write about it convincingly (Bernard 2006:344). Participant observation in the conduct of scientific research about cultural groups is useful for four reasons. Participant observation makes it possible to collect all kinds of data; helps a researcher ask culturally appropriate questions; allows a researcher to speak with confidence about the meaning of data; and allows many difficult research problems to be addressed adequately (Bernard 2006: ). As Bernard describes, it is difficult for an anthropologist to portray the behaviors and beliefs of the people in any culture without the use of participant observation. While the original research proposal for this study did not include participant observation as a method, it was deemed necessary by the Division of Subsistence in order to properly characterize contemporary subsistence salmon practices, to gain better rapport with residents, and to properly interpret the data collected during surveys and interviews. Subsistence salmon harvesters chosen for participant observation were identified during surveys and interviews, and by recommendations of the tribal councils. Due to inclement and unpredictable weather on Kodiak Island, the project length needed to be extended after several failed attempts by Marchioni and Lee to fly to the communities of Old Harbor and Larsen Bay to conduct participant observation and interviews. After multiple failed attempts, Marchioni and Lee were successful in conducting participant observation with three families harvesting salmon by rod and reel and setnet in Old Harbor during August and September of 2014, one family harvesting salmon by setnet in Larsen Bay during September of Lee observed two families harvesting with rod and reel and setnet in Kodiak City during September of Participant observation was documented using photography and field notes. All photographs, and the adjoining notes, were also coded and are described in chapters 3 and 4. Results, discussion, and conclusions regarding participant observation are presented in chapters 4 and 5. EDUCATION The original project proposal and investigation plan did not include an education component, but due to the expressed interest of local people and the opportunity to engage subsistence users at community events being held at the same time as field research, Lee and Marchioni made time to create one. In Old Harbor (2012), Lee and Marchioni conducted informal educational workshops with children at the schools about the importance of the Division of Subsistence and the Kodiak Wildlife Refuge, what the Division of Subsistence uses subsistence harvest data for, and why subsistence harvest research is important. The community of Karluk was not part of the survey study, but during a visit to nearby Larsen Bay researchers learned of an opportunity to meet with schoolchildren there and held a brief workshop in that community in September of A summary of the Karluk workshop, as well as results from impromptu interviews and observations made concerning subsistence salmon in that community, are included in the Discussion in Chapter HOUSEHOLD SURVEY RESULTS DEMOGRAPHY Kodiak Island Borough population characteristics from US Census and AK Department of Labor The Kodiak Island Borough includes 11 incorporated communities and census designated places (CDP); a relatively large portion of the borough s population lives outside these 11 places, primarily along the road system on the northeast portion of Kodiak Island. In this report, the Kodiak road system consists of Kodiak City, Kodiak Station CDP, Women s Bay CDP, Chiniak CDP, and the balance of the Kodiak Borough; it excludes the seven named places off the road system (Table 2, Figure 1, Figure 2). 10
24 According to Alaska Department of Labor estimates, the population of the Kodiak Island Borough was 13,797 in 2014, up from the US Census count of 13,477 for 2010 but slightly lower than the 13,913 estimated by the US Census for In 2014, 94.7% of the borough s population (13,063 of 13,797) lived along the road system, with the remainder living in the seven small, remote communities (Table 2). Data collected by the US Census Bureau s American Community Survey provide an annual average of demographic characteristics for the five-year period , which show that the Kodiak Island Borough is ethnically diverse (Table 3, Figure 3). For the borough overall, the ethnic composition was 54.6% white, 20.9% Asian, 14.7% Alaska Native, and 9.7% other races, including those in the two or more races category. The Asian population was concentrated in Kodiak City itself; Kodiak City s population was 41.7% Asian and contained 90.1% of the borough s Asian population. Of the road system s population, 10.1% was Alaska Native; for the seven communities off the road system, the total population was 68.0% Alaska Native. Of the borough s total Alaska Native population, 66.1% lived in places along the road system. Considering those individuals of two or more races, there were 2,673 individuals of Alaska Native heritage living in the Kodiak Island Borough (19.2%) for the time period. Of these, 1,955 (73%) lived along road system, and 718 (27%) lived in non-road system communities. Kodiak Road System Demographic characteristics were very similar for the two Kodiak road system samples, subsistence permit holders, and other households (Table 4, Table 5). Average household size was 3.0 for the permit sample and 2.9 for other households. Average age was 35.2 years for the permit sample and 34.3 years for other households. A slightly larger percentage of the permit group s households was Alaska Native (at least one household head Alaska Native), at 18.0% compared to 15.7% for the non-permit-holding group. However, when considering all household members, the non-permit group was 16.3% Alaska Native compared to 13.8% for the permit group. Also, on average, those households with permits had lived in the community longer, at 26.0 years for household heads compared to 22.7 years for other households. Analysis of demographic data produced population profiles depicting permit households (Table 6 and Figure 4) and other households (Table 7, Figure 5). Larsen Bay: Survey and U.S. Census This study identified 26 households in Larsen Bay in 2012 with an estimated population of 77. This population is lower than the U.S. Census estimate for 2012 of 34 households with 87 people and the fiveyear average for from the American Community Survey of 44 households with 95 people (Table 8). Based on the household surveys, in 2012, 88% of Larsen Bay s population was Alaska Native, higher than the 76% estimate for 2012 from the U.S. Census and 72% estimated for by the American Community Survey (Table 9). The 2012 population estimate for Larsen Bay confirms to the trend evident in the U.S. Census data (Figure 6). After climbing from a population of 72 in 1960 to 109 in 1970, Larsen Bay topped out in 1980 at 168 permanent residents. The last 36 years, however, have seen the population decreasing steadily, with the number of permanent residents in 2012 approximating that of 56 years ago. The age and gender makeup of the 2012 Larsen Bay population is profiled in Table 10 and Figure 7. In 2012, the average household size was 2.9 people, the average age 36.9 years, and the average length of residency in the community by household heads was 31.0 years (Table 9). Old Harbor: Survey and US Census This study identified 78 households in Old Harbor in 2012 with an estimated population of 202. This is lower than the U.S. Census estimate for 2012 of 84 households with 218 people and the five-year average 11
25 for from the American Community Survey of 84 households with 243 people (Table 11). Based on the household surveys, in 2012, 85% of Old Harbor s population was Alaska Native, similar to the 89% estimate for 2012 from the U.S. Census and the 86% estimate for from the American Community Survey (Table 12). Population changes in Old Harbor mirror the trends in Larsen Bay (Figure 8). Old Harbor increased its number of permanent residents from 193 in 1960 to 290 in 1970, reaching a maximum of 340 in Then a 36 year decline set in, with the current population representing only about two-thirds of the population of Table 13 and Figure 9 provide a population profile for Old Harbor in 2012 based on age and gender. In 2012, the average household size was 2.6 people, the average age 35.2 years, and the average length of residency in the community by household heads was 36.8 years (Table 12). KODIAK ROAD CONNECTED AREA Salmon Harvest and Use Patterns Residents of the Kodiak Island Borough harvest salmon for home use primarily from three fisheries: removal of fish from their commercial catches (often called home pack ), Kodiak Management Area (KMA) subsistence fisheries, and rod and reel fishing. (Note that the household survey did not differentiate between salmon harvested with rod and reel under state and federal regulations.) There is also a small level of participation in subsistence and personal use fisheries located elsewhere in Alaska outside the KMA. For example, in 2012, 17 Kodiak residents obtained permits for Cook Inlet personal use salmon fisheries, with an estimated harvest of 296 salmon (Fall et al. 2014:186); three Kodiak households obtained Chitina personal use dip net permits, but none of these permits were returned (Fall et al. 2014:215). In 2012, 1,446 households living in the Kodiak Road system area returned subsistence salmon permits to ADF&G, out of an estimated total number of households of 4,210 3, thus representing 34.3% of the road area population. (Figure 10 depicts the number of subsistence permits returned to ADF&G by households in Kodiak City and other road system areas over the last 15 years.) The random sample of 89 subsistence permit holders was intended to represent the patterns of this group; the random sample of 121 households was intended to document harvest and use patterns of non-permit holding households (65.7% of roadconnected households). The following discussion will compare these two patterns. However, due to the small sample sizes, total harvests for the Kodiak road-connected area have not been estimated based on survey results. Figure 11 depicts reported harvests of salmon by residents of the Kodiak road system in the subsistence fishery from 1999 through 2013, and compares those with estimated harvests from comprehensive surveys conducted for 1991, 1992, and Survey results: salmon harvests and uses Most households in both Kodiak samples used salmon in 2012: 99% of the permit sample and 92% of non-permit holding households. However, the permit sample was more involved in harvesting activities: 89% attempted salmon harvests (using any method) and 87% were successful, compared to 60% and 58%, respectively, for the households without subsistence permits. The households without permits were 3. American Community Survey. ACS Demographic and Housing Estimates, American Community Survey 5-Year Estimates. Washington, D.C.: U.S. Department of Commerce, U.S. Census Bureau,
26 more likely to receive salmon (61%) than those with permits (46%); conversely, 55% of permitted households gave away salmon, compared to 36% of the non-permit group (Table 14, Table 15). On average, households with subsistence permits harvested 209 lb of salmon (69.8 lb per capita). Salmon harvests by non-permit households were lower: 84.2 lb per household (28.5 lb per capita) (Table 14, Table 15). By species, the composition of the harvests by Kodiak road system households was, as measured in pounds usable weight, broadly similar for the two groups. The harvest by permit holders was 65% sockeye salmon, 25% coho salmon, 7% Chinook salmon, 2% pink salmon, and 1% chum salmon (Table 16, Figure 12). For other households, the harvest composition was 55% sockeye salmon, 28% coho salmon, 8% Chinook salmon, 7% pink salmon, and 2% chum salmon (Table 17, Figure 13). The Kodiak households with permits on average obtained most of their salmon harvests in the subsistence fishery (51%), followed by rod and reel (32%) and commercial removal (17%) (Table 16, Figure 14). Although the non-permit group obtained a similar percentage of their salmon from commercial removal (20%), most of their harvest was accomplished with rod and reel (57%). Although none of the households in this group held subsistence permits in 2012, 23% of their salmon harvest came from subsistence nets (Table 17). Ten percent of these households reported harvesting salmon with subsistence nets, seines, or dip nets, compared to 51% of the households in the sample of permit holders (Table 18, Table 19). Figure 15 shows harvests by species by gear type for the Kodiak samples. Figure 16 compares salmon harvests for home use by gear type for the three prior study years for which data are available for Kodiak road system communities from comprehensive household surveys (data from CSIS). In all three years, rod and reel provided the most salmon, with an annual average of 49% of the total salmon harvest and a range from 42% to 54%. In comparison, combining results from the two samples for 2012 shows that 43% of the Kodiak sample s harvest was produced by rod and reel fishing. The 2012 combined sample harvested 39% of its salmon with subsistence gear, compared to an annual average of 34% from , with a range of 31% to 39%. Removal of salmon from commercial harvests accounted for 19% of the combined harvest for 2012, compared to an annual average of 17% for and a range from 7% to 25%. Table 20 reports the number of returned subsistence permits for the Kodiak road connected areas and reported harvests for 1986 through 2013, as well as average harvest per returned permit. The average harvest per permit over that time period was 19.2 salmon, ranging from 27.3 in 1989 to 14.4 in In comparison, surveyed Kodiak households with permits harvested on average 24.9 salmon in subsistence nets or seines in The average harvest for returned permits in 2012 was 15.2 salmon. Comparisons with Other Years Interviewed households in Kodiak were asked to compare their uses of salmon in 2012 with other recent years. If a change had occurred, they were asked to provide reasons for the change. For the Kodiak permit sample, most respondents (47%) said their uses were about the same, while 36% reported lower uses, and 17% reported higher uses (Table 21). In contrast, for the sample of other households, the most respondents said their uses were lower in 2012 (46%), while 31% reported using about the same amount of salmon, and 14% said they used more. Nine percent of this group said they did not regularly use salmon. For both groups, shortage of time due to work commitments was the most frequently cited reason for lower uses. For the permit group, personal and family reasons and did not need as much salmon tied for second as an explanation for lower uses. For the non-permit group, lack of harvest effort was the second most frequently cited reason for lower uses (Table 22). Most frequently, the permit group cited increased effort and more success at harvesting as reasons for higher salmon use levels in For the other group, receiving more salmon was the most common reason for higher uses (Table 23). Interviewed households in Kodiak were also asked if they got enough salmon in the 2012 study year. If the answer was no, they were asked to evaluate the impact as minor, major, or severe and to describe any actions they took in response to not having enough salmon. In both samples, 37% of 13
27 respondents said they did not get enough salmon in When asked about their need for more salmon in 2012, more households in both samples named sockeye salmon above other species (Table 24). However, coho salmon and Chinook salmon were also missed by a significant number of non-permit households. Regarding the impact of this salmon shortage, most of these households (55% of permit holders, 56% of other households) said the impact was minor; about 27% of both groups said the impact was major, while 12% of permit households and 10% of other households described the impact as severe (Table 25). The most commonly reported action in response to not having enough salmon was to purchase more commercial foods as replacements (69%), followed by substituting other subsistence foods (23%) and doing without (19%) (Table 26). While all respondents from the permit sample answered the got enough question, 9% of respondents in the other sample did not, citing the fact that they do not use the resource. The percent difference in response to the got enough question is illustrated in Figure 17. Location of Harvests Certain fishing locations were popular with both the group of Kodiak City households that had subsistence permits and the group that did not. All reported harvest locations are listed on tables Table 27 and Table 29 list harvest numbers by location, and Table 28 and Table 30 list those harvests as relative percentages. The waters in the Buskin River and immediately offshore from the mouth were the most productive of all the different fishing locations reported by Kodiak City residents. Fishers with subsistence permits caught 181 coho salmon and 409 sockeye salmon on the Buskin, as well as 12 pink salmon, eight chum salmon, and one Chinook salmon. Non-permit holders likewise harvested intensively on the Buskin, taking 150 coho salmon, 162 pink salmon, 266 sockeye salmon, and one Chinook salmon. Subsistence permit holders also fished intensively at several other locations, including Moser Bay (200 sockeye salmon), Chiniak (48 pink salmon, 74 Chinook salmon, 30 sockeye salmon), Pasagshak (712 sockeye salmon, 4 pink salmon, 53 coho salmon) and the Port Lions area (582 sockeye salmon). Nonpermit holders utilized some of the same locations including Pasagshak (93 coho salmon, 102 sockeye salmon), Chiniak (30 Chinook salmon, 7 coho salmon), in the vicinity of Port Lions (58 sockeye salmon), as well as spots near Kodiak such as Olds River, Buoy 4, Long Island, and Woody Island. Of the Kodiak City permit-holding households, 20% harvested coho salmon in the Buskin River Area, and 27% harvested sockeye salmon there, using both subsistence gillnet and rod-and-reel. Similarly, 17% of the non-permit households harvested coho salmon there and 20% harvested sockeye salmon; these nonpermit households used a greater variety of methods to harvest sockeye salmon at the Buskin, however, including beach seine and dip net (Table 28 and Table 30). Figure 18 depicts all the harvest locations identified by the Kodiak City permit and other samples. Kodiak households that held subsistence salmon permits in 2012 were more likely than other households to fish for salmon in the same location annually, 74% compared to 50%. On average, respondents from the permit sample who fished had done so at their 2012 location for 22 years; the average for other households was 18 years (Table 31). Equipment ownership and use The survey asked a series of questions about respondents experience with using gillnets in the subsistence salmon fishery. (Note that this survey question only asked the respondent about their use of gillnet. It is possible that some responses might reflect use of seine as well as gillnet.) Fifty-two percent of the Kodiak permit sample reported using a subsistence gillnet, with an average of 22 years of experience with this type of harvest gear (Table 32). Almost all households in this sample that used gillnets in 2012 did so in cooperation with other households (87%), with a mean of fishing with 2.6 other 14
28 households and a range of one to 13 other households. Most households fished with other permit-holding households (85%), but 6 households said their partner fishing households did not hold permits. Fifty-six permit of the permit sample owned a gillnet (Table 32). Of the sample of other households, 17 (14%) said they used a gillnet to harvest salmon in 2012 (despite not holding a permit). This group had, on average, 17 years of experience using gillnets for harvesting salmon. Most of these households (76%) fished with other households; by the report of the respondent, seven (54%) of these households had subsistence permits and (62%) reported the harvest on a permit. Respondents were asked who taught them to use gillnets for subsistence salmon fishing. The most frequent response for both Kodiak samples was friend : 41% of the permit sample and 53% of the sample of other households. Fifteen percent of the permit sample and 12% of the other sample were selftaught. The remainder learned from various relatives (Figure 19, Table 33). Most of the gillnet users in the Kodiak samples said they used a gillnet because it is easy and efficient and superior to using a rod and reel (57% of permit sample, 76% of other household sample). Some also cited learning the method as a child, life-long use, and heritage as a reason for using gillnets, as well as collaborating with other households or regulations that allow larger harvests than using a rod and reel under state sport fishing rules (Figure 20). Of the 43 households in the Kodiak permit sample (48%) that did not use gillnets in 2012, 27 (63%) had done so in the past. In the sample of other Kodiak households, 27 of the 104 households not using gillnets in 2012 had used gillnets in the past (26%) (Table 34). A variety of reasons were offered by respondents in both samples for not using this gear type (Figure 21), including a preference for using rod and reel, no time, not owing the equipment (a net or a boat or both), or never learning how to use a gillnet. Respondents were also asked about their experience using rod and reel as a method to harvest salmon for home use. Most respondents in both Kodiak samples used rod and reel to harvest salmon in 2012: 67% of the subsistence permit sample and 58% of the other household sample (Table 35). Notably, 23% of these households in the permit salmon and 9% in the other household sample said they recorded rod and reel harvests on subsistence permits. Although there was a range of experience within both samples using rod and reel, on average the permit sample had used rod and reel for 27 years and the other household sample for 23 years. Of all households, 86% of the permit sample and 57% of the other household sample had some experience with using rod and reel for salmon harvests. A small number of respondents offered reasons for not using rod and reel. Among the permit holding group, the inefficiency of the method compared to gillnets was cited. For the other household group, the reasons most cited were lack of knowledge of how to fish with a rod and reel, no time to go fishing, or disinterest in fishing or using fish (Table 36). Most of the households in the Kodiak permit sample (65%) owned boats or subsistence nets (56%); 49% owned both. In contrast, only 19% of the sample of other Kodiak households owned boats, 19% owned subsistence nets, and 13% owned both (Table 37). Kodiak survey respondents who used gillnets in the subsistence salmon fishery in 2012 and participated with other families were asked how did you split your catch. By far, most responded that the fish were split evenly. Some explained that the division took into account family size. Commercial fishing involvement As noted earlier, retention of salmon from households commercial harvests accounted for about 19% of the salmon harvest for home use by the Kodiak samples in As shown in Table 38, 32% of the households from the subsistence permit sample and 12% of the other household sample participated in commercial fishing in For these households, commercial fishing was a significant source of cash income, providing over 75% of total income for 54% of participants from the permit sample and 36% of 15
29 participants in the other household sample. Table 39 shows the geographic location of the commercial fisheries participated in by both samples in LARSEN BAY Survey results: salmon harvests and uses All Larsen Bay households used salmon for subsistence purposes in 2012; most also fished for (81%), successfully harvested (76%), received (57%), and gave away (57%) salmon. The estimated harvest was 3,053 salmon for 12,621 usable pounds (including salmon retained from commercial catch for home use). On average, this accounted for 485 lb of salmon per household and 164 lb per capita. By species, the harvest by weight consisted of 87% sockeye salmon, 9% coho salmon, 3% pink salmon, and 1% Chinook salmon. There was no reported chum salmon harvest in 2012 (Table 40, Figure 22). Of the total pounds of salmon harvested for home use by Larsen Bay households in 2012, 58% was obtained by removal from households commercial harvests, 35% was harvested with subsistence nets or seines, and 7% was obtained with rod and reel (Table 38, Table 39). Commercial removal produced 63% of the sockeye salmon harvests. The most coho salmon were harvested with rod and reel (48%). Rod and reel and commercial removal accounted for all the Chinook salmon harvests. Subsistence nets and seines accounted for most of the harvest of pink salmon (Figure 23). An estimated 10 Larsen Bay households (38%) removed salmon from commercial harvests for home use in Eleven (43%) households used subsistence methods, with nine using set gillnets and five using seines. Additionally, ten Larsen Bay households (38%) used rod and reel to procure salmon for home use in 2012 (Table 43). Comparisons with other years When asked to compare their salmon uses in 2012 with other recent years, 67% of Larsen Bay respondents said uses were lower, 19% said they were about the same, and 14% said they were higher (Table 44). Time conflicts created by jobs (36% of those with lower uses) was the most frequent reason cited for lower uses, followed by resources less available (21%), lack of effort (14%), and less sharing (14%) (Table 45). The only reasons cited for higher uses were needed more (one household with higher uses; 50%) and more success (one household; 50%) (Table 46). Sixty seven percent of Larsen Bay households reported that they did not harvest enough salmon in 2012 (Figure 24). Of those, 86% said the effect was minor, 7% said it was major, and 7% said the effect was severe (Table 47). Most households (18%) needed more sockeye salmon (Table 48). The primary response by Larsen Bay households to not harvesting enough salmon was to purchase more commercial foods (70% of those reporting a response), followed by replacing salmon with other subsistence foods (50%) (Table 49). (Although not captured on the survey form, respondents mentioned using halibut, crab, octopus, and cod to make up for lack of salmon.) Estimated salmon harvests in Larsen Bay based on household surveys have ranged from 68 lb per capita in 1989 (the year of the Exxon Valdez oil spill) to 399 lb per capita in 2004 (almost twice as high as any other estimate) (Figure 25). The estimate of lb per capita for 2012 is similar to estimates for 2005 (153 lb per capita) and 2003 (181 lb per person), but notably lower than the 399 lb per capita estimate for In all years for which data are available except 1986, 1997, and 2012, subsistence gear (nets and seines) produced the largest portion of Larsen Bay s salmon harvests for home use, ranging from 54% in 2003 to 92% in 1989 (Figure 26). In 1986 and 2012, removal from commercial harvests accounted for, respectively, 54% and 58% of the harvest, compared to, respectively, 42% and 35% for subsistence gear. In 1997, rod and reel accounted for 44% of the Larsen Bay harvest, compared to 41% for subsistence gear 16
30 and 15% from commercial removals. The portion of the harvest taken with rod and reel ranged from 4% in 1986 to 44% in Comparisons with permit results Table 50 shows participation in the subsistence salmon fishery by Larsen Bay residents from 1986 through 2013 and reported harvests by species based upon permit returns, as well as average harvests per returned permit. Over this period, total reported harvests for Larsen Bay have ranged from 307 salmon in 1988 to 1,598 salmon in The long-term average annual harvest is 750 salmon and the recent tenyear average is 835 salmon. The average annual composition of the Larsen Bay harvest was 87% sockeye salmon, 6% coho salmon, 4% pink salmon, 2% Chinook salmon, and 1% chum salmon. Participation in the permit fishery ranged from five returned permits in 1998 to 33 in 2007, for an annual average of 17 permits and a recent ten-year average of 22. Seventeen Larsen Bay households returned subsistence permits in 2012 and 11 of those included positive harvest numbers. Household harvest surveys match that measure of participation; 11 households reported salmon harvest for 2012, either with a subsistence gillnet or seine. The harvest estimates are different, however; the 2012 salmon harvest reported on permits is 431 individual fish caught with gillnet or seine, while household harvest survey estimated 1,069 salmon caught using the same subsistence methods. The significance of a 250 percent difference indicates the continued challenge of estimating harvest using permit return data alone (Figure 27). From 1986 through 2013, the average returned Larsen Bay permit reported a harvest of 45.2 salmon; the recent ten-year average is 37.4 (Table 50). The average household harvest in the subsistence fishery for 2012 based on surveys was 101 salmon (42.6 salmon is average for all households and 52.6 for all fishing households), compared to 25.4 salmon based on returned permits. Location of Harvests Tables 51 and 52 report the location of salmon harvests by Larsen Bay households in Households in Larsen Bay harvested every species of salmon except chum salmon, and reported noncommercial harvests with reference to specific fishing locations. The most productive fishing spot was the mouth of the Karluk River where Larsen Bay households harvested 576 sockeye salmon. The Karluk area was also used to harvest coho salmon (21 fish) and pink salmon (56). The community s namesake, Larsen Bay, was also an important fishing spot. All salmon species except chum salmon were harvested there, including 404 sockeye salmon, 25 pink salmon, 21 coho salmon and 6 Chinook salmon. The other spots mentioned, and species harvested there include locations in Uyak Bay like Humpy Creek (coho salmon, pink salmon and sockeye salmon) and Brown s Lagoon (coho salmon). On the exposed outer coastline, Larsen Bay households traveled to Sevenmile Beach (for Chinook salmon). As measured by local participation, the sockeye salmon fishery in Larsen Bay was the most important for that community (Table 52). Thirty-eight percent of households fished the local waters for that species, almost 30% more participation than at the next most popular sockeye salmon fishing place, Karluk. Sockeye salmon harvests at these two locations tell a different story, however, as fishers caught 30% less sockeye salmon in Larsen Bay than in and around the Karluk River (Table 51). Other locations used by Larsen Bay households include Larsen Bay for Chinook salmon (14.3%) and Karluk for coho salmon (9.5%) and pink salmon (9.5%) (Table 52). Figure 28 is a map showing the locations where Larsen Bay households reported harvesting salmon in Sixty-seven percent of Larsen Bay households said they fished for salmon in the same location annually. On average, respondents who fished had done so at their 2012 location for 46 years, with a range of 12 to 17
31 73 years (Table 53). Three Larsen Bay households that said they changed sites from year to year explained they did so because the best locations for harvests shift from year to year. Equipment ownership and use The survey asked a series of questions about Larsen Bay respondents experience with using gillnets in the subsistence salmon fishery. (Note that this survey question only asked the respondent about their use of gillnets. It is possible that some responses might reflect use of seines as well as gillnets. Also, commercial fishers who participated in the subsistence fishery using a commercial boat and commercial gear were likely included in this measurement.) In Larsen Bay, 52% of households used gillnets to harvest subsistence salmon, with an average of 36 years of experience with this type of harvest gear. Four of these households (36%) operated gillnets with one other household in 2012; none fished with more than one other household. Respondents all said that the other households they fished with had subsistence permits. Thirty-eight percent of Larsen Bay households owned a gillnet (Table 32). Larsen Bay respondents were asked who taught them to use a gillnet for subsistence salmon fishing All Larsen Bay households learned from relatives, with a parent being the most common relative mentioned (55%). No Larsen Bay users of gillnets were self-taught or had learned from friends (Figure 19, Table 33). Most of the gillnet users in Larsen Bay said they use gillnets because it is easy and more effective than rod and reel for harvesting the large numbers of salmon needed for subsistence uses in the community, or that they grew up using gillnets as part of their way of life (Figure 20). Of the ten households in the Larsen Bay sample (48%) that did not use gillnets in 2012, seven (70%) had done so in the past (Table 34). A common reason for discontinued use of gillnets was a lowered need for salmon or receiving enough salmon from others (Figure 21). Larsen Bay respondents were also asked about their experience using rod and reel to harvest salmon for home use. Most Larsen Bay households used rod and reel to harvest salmon in 2012 (57%) (Table 35). Notably, even though it is not a legal gear type and there is no way to distinguish harvest-by-gear-type on the permit, a full 50% of these households said they recorded rod and reel harvests on subsistence permits. There was a range of experience using rod and reel in Larsen Bay, with an average of 27 years and a range of from one to 65 years. Of all Larsen Bay households, 76% had some experience using rod and reel to harvest salmon for home use. Only one Larsen Bay respondent offered a reason for not using rod and reel, saying, I tried [using] it once and didn t like it (Table 36). Of all Larsen Bay households, 43% owned boats and 38% owned subsistence nets; 33% owned both (Table 37). Larsen Bay respondents who used gillnets in the subsistence salmon fishery in 2012 and participated with other families were asked how did you split your catch. Most responded that the fish were divided 50/50. One respondent said he gave to others what they wanted. Commercial fishing involvement As noted earlier, retention of salmon from households commercial harvests accounted for about 58% of the salmon harvest for home use by Larsen Bay households in As shown in Table 38, 38% of Larsen Bay households participated in commercial fishing in For these households, commercial fishing was a significant source of cash income, providing over 50% of total income for 50% of the participants. Table 39 shows the geographic location of the commercial fisheries participated in by Larsen Bay households surveyed in
32 OLD HARBOR Survey results: salmon harvests and uses All Old Harbor households used salmon for subsistence purposes in 2012; most also fished for (81%), successfully harvested (81%), received (77%), and gave away (63%) salmon. The estimated harvest was 7,842 salmon for 33,213 usable pounds. On average, households harvested 426 lb of salmon, 165 lb per capita. By species, the harvest by weight consisted of 38% coho salmon, 34% sockeye salmon, 15% pink salmon, 7% chum salmon, and 6% Chinook salmon (Table 54, Figure 29). Of the total pounds of salmon harvested for home use by Old Harbor households in 2012, 58% was harvested with subsistence nets or seines, 22% with rod and reel, and 19% removed from commercial harvests (Table 55, Table 56). Most Chinook salmon were harvested with rod and reel (75%). Subsistence nets and seines accounted for most of the harvest of the other four species (Figure 30). An estimated 18 Old Harbor households (23%) removed salmon from their commercial harvests for home use in Thirty-three (42%) households used subsistence methods, with 31 households using set gillnets and eight using seines. Additionally, 57 Old Harbor households (73%) used rod and reel to procure salmon for home use (Table 57). Comparisons with other years When asked to compare their salmon uses in 2012 with other recent years, 45% of Old Harbor respondents said uses were about the same, 40% said they were lower, and 15% said they were higher (Table 58, Figure 31). Personal reasons (24% of those with lower uses) was the most frequent reason cited for lower harvests, followed by weather (18%), lack of effort (18%), and lack of equipment (12%) (Table 59). The most-cited reasons for higher uses were had more help (29% of those with higher uses) and more success (29%) (Table 60). Twenty-eight percent of Old Harbor households reported that they did not harvest enough salmon in 2012 (Figure 31). Of those, 46% said the effect was minor, 46% said it was major, and 8% said the effect was severe (Table 61). Most frequently, Old Harbor households reported needing more coho salmon or sockeye salmon (Table 62). The primary action by Old Harbor households in response to not harvesting enough salmon was to purchase more commercial foods (Table 63). Estimated salmon harvests in Old Harbor based on household surveys have ranged from lb per capita in 1991 to lb per capita in 1982 (Figure 32). The estimate of lb per capita for 2012 is very similar to estimates for 2005 (162.0 lb per capita) and 2003 (166.2 lb per person), but lower than the 215 lb per capita estimate for In all years for which data are available except 1986, subsistence gear (nets and seines) produced the largest portion of Old Harbor s salmon harvests for home use, ranging from 47% in 2003 to 71% in 2004 (Figure 33). In 1986, removal from commercial harvests accounted for 57% of the harvest, compared to 31% for subsistence gear. The portion of the harvest taken with rod and reel has ranged from 12% in 1986 to 42% in Comparisons with permit results Table 64 shows participation in the subsistence fishery by Old Harbor residents from 1986 through 2013 and reported harvests by species based upon permit returns. Over this period, total reported harvests for Old Harbor have ranged from 661 salmon in 1998 to 3,303 salmon in 2005; the long-term annual average harvest was 1,604 salmon and the recent ten-year average was 1,771 salmon. The composition of the annual average harvest based on permit returns was 47% coho salmon, 27% sockeye salmon, 20% pink salmon, 6% chum salmon, and 0.3% Chinook salmon. Participation in the permit fishery ranged from ten 19
33 returned permits in 1998 to 49 in 2001, for an annual average of 25 permits and a recent ten-year average of 29 permits. Twenty Old Harbor households returned subsistence permits in 2012 and 18 reported fishing, compared to an estimated 33 households who harvested salmon with either subsistence gillnets or seines based on the household survey results. Because ADF&G maintains no record of the number of subsistence permits issued, official subsistence harvests in the Kodiak Management Area are based solely on returned permits and are reported harvests only. Reported subsistence harvests for 2012 for Old Harbor were substantially lower for all species but Chinook salmon compared to estimates from the household surveys (Figure 34). From 1986 through 2013, the average reported harvest was 64.3 salmon; with the recent ten-year average being 62.2, based on returned Old Harbor permits. The average household harvest in the subsistence fishery for 2012, based on surveys, was salmon (59.9 salmon is average for all households; 73.7 for all fishing households), compared to 59.3 salmon based on returned permits. Location of Harvests Tables 65 and 66 report the location of salmon harvests by Old Harbor households in Old Harbor households used a large number of locations to procure subsistence salmon. The most productive spot was Big Creek, located just northeast of the village. In 2012 fishers harvested 1,197 coho salmon, 200 chum salmon, and 293 pink salmon from Big Creek. The community of Old Harbor sits on the shore of Sitkalidak Strait, a protected waterway between Sitkalidak Island and Kodiak Island where in 2012 local fishers harvested 205 chum salmon, 293 pink salmon, and 3,001 sockeye salmon. South of the community on Sitkalidak Island, subsistence fishing in the waters in-and-around Newman Bay produced 423 pink salmon, 65 chum salmon, and 727 sockeye salmon. All five species of salmon were harvested in Barling Bay, 5 8 miles south of Old Harbor on Sitkalidak Strait, including 200 chum salmon and 400 coho salmon. Other spots used in 2012 include waters near Old Harbor ( the culvert, Three Sisters, Lighthouse) and on nearby Sitkalidak Island (Port Hobron, Tanginak, Ocean Beach, Rolling Bay). The most popular place for Old Harbor residents to fish for salmon was Big Creek (Table 65). This local creek was used by 33% of households for coho salmon fishing and 17% of households for pink salmon fishing. (The Big Creek coho salmon fishery was also the most important fishery in terms of pounds harvested [Table 65].) Other places used intensively by Old Harbor residents include Barling Bay for coho salmon (17% of households) and chum salmon (10% of households); the culvert was fished by 10% of households for pink salmon; Newman Spit was fished by 10% of households for sockeye salmon (and was also the most productive sockeye salmon fishery [Table 66]); Sitkalidak Strait was fished by 8% of households for sockeye salmon; and Three Sisters was fished by 6% of households for Chinook salmon. Figure 35 shows the primary fishing locations reported by Old Harbor households for Fifty four percent of Old Harbor households said they fished for salmon in the same location annually. On average, Old Harbor respondents who fished had done so for an average of 44 years at their 2012 location, with a range of two to 77 years (Table 67). Two Old Harbor respondents, who said they changed sites from year to year, explained that the best locations for harvests shift from year to year. One said, I go where the fish are. Equipment ownership and use The survey asked a series of questions about respondents experience with using gillnets in the subsistence salmon fishery. (Note that this survey question only asked the respondent about their use of gillnets. It is possible that some responses might reflect use of seines as well as gillnets.) In Old Harbor, 56% of households used gillnets in 2012, with an average of 26 years of experience with this type of harvest gear. Seventeen of these households (63%) operated gillnets cooperatively with at least one other household; the mean was fishing with 2.6 other households and the range was from one to five 20
34 households. Six of these Old Harbor respondents said that the other households with whom they fished held subsistence permits, but in the other 11 cases the other households did not have permits. Forty percent of Old Harbor households owned a gillnet (Table 32). Old Harbor respondents were asked who taught them to use gillnets for subsistence fishing. Most Old Harbor households (67%) learned from relatives, with parent being the most common relative named (41%). Nineteen percent of Old Harbor users of gillnets were self-taught but just one (4%) had learned from friends (Figure 19, Table 33). Most of the gillnet users in Old Harbor (52%) said they used a gillnet because it is easy and more efficient than rod and reel for harvesting the large numbers of salmon needed for subsistence uses in the community. Some (22%) also said that they used gillnets because they grew up using them (Figure 20). Of the 21 households in the Old Harbor sample (44%) that did not use gillnets in 2012, 11 (52%) had done so in the past (Table 34). Common reasons for no longer using gillnets were no time to invest in harvesting or receiving enough salmon from others (Figure 21). Old Harbor respondents were also asked about their experience using rod and reel as gear to harvest salmon for home use. Most Old Harbor households used a rod and reel to harvest salmon in 2012 (81%) (Table 35). Notably, 23% of these households said they recorded rod and reel harvests on subsistence permits. There was a range of experience using rod and reel among Old Harbor respondents, with an average of 39 years and a range of from three to 74 years. Of all households, 89% had some experience using rod and reel to harvest salmon for home use. Only one Old Harbor respondent offered a reason for not using rod and reel, saying I never wanted to (Table 36). Of all Old Harbor households, 60% owned boats and 40% owned subsistence nets; 38% owned both (Table 37). Old Harbor respondents who used gillnets in the subsistence salmon fishery in 2012 and participated with other families were asked how did you split your catch. Most Old Harbor respondents said that the fish were divided evenly or equally. One respondent who had cooperatively used a seine said that people took what they needed and we released the rest Commercial fishing involvement As noted earlier, retention of salmon from households commercial harvests accounted for about 19% of the salmon harvest for home use by Old Harbor households in As shown in Table 38, 31% of Old Harbor households were engaged in commercial fishing in For these households, commercial fishing was a significant source of cash income, providing over 75% of total income for 60% of participants. Table 39 shows the geographic location of the commercial fisheries participated in by Old Harbor households interviewed in REASONS FOR LIVING IN THE COMMUNITY Survey respondents in Kodiak, Larsen Bay, and Old Harbor were asked what are the reasons you continue to live in their community. They were asked to state the most important reason first, followed by up to two other reasons. Responses were open-ended and were coded to one of 14 categories for further analysis. Table 68 summarizes the results for the four samples, reporting the first reason given and the percentage of respondents giving each response as one of the top three reasons. Results for Larsen Bay and Old Harbor were broadly similar to each other, with the top response for both communities being it is home. It is home was also the most frequently cited reason overall in both Larsen Bay and Old Harbor, with 52.4% and 41.7%, respectively, mentioning it as the first, second, or third reason for living in the community (Figure 37). However, if the two subsistence-related reasons are 21
35 combined, they were most frequently cited in both Larsen Bay (66.7%) and Old Harbor (60.5%), with quality of life-related reasons also popular. In contrast, jobs was the top reason cited for living in the Kodiak road system area by both the permitholding sample (29.2%) and the other household sample (26.3%) (Table 68, Figure 36). Jobs also ranked first for both samples for all responses combined (Figure 32). However, a much larger percentage of respondents cited subsistence-related reasons (either availability of foods or way of life) from the permit holding group (59.5%; very similar to Larsen Bay and Old Harbor) than from the other households group (25.4%). Presence of family members was a frequently cited reason for living in Kodiak for both samples. 22
36 4. KEY RESPONDENT INTERVIEW AND PARTICIPANT OBSERVATION RESULTS This chapter documents the subsistence harvesting and processing practices of key respondents within each of the three study communities. Although participant observation was not a method included in the original proposal, during the course of fieldwork researchers decided it was a necessary and appropriate means of collecting important context within which to explain survey and interview results. Unusual salmon run timing in 2013 and 2014 made participant observation difficult, but in these circumstances researchers were still able to document practices through in-depth, semi-structured interviews and observation of fishing practices, including preservation techniques associated with smokehouses and drying shacks. The chapter is divided into three parts, one for each study community. Within each community discussion are sections that focus on either the practices of a specific key respondent, the events of a particular fishing trip, or both. LARSEN BAY SUBSISTENCE HARVEST Key Respondent 1 Researchers were in Larsen Bay from June in 2014 and learned that much of the season s salmon had already been harvested for subsistence by a single commercial setnetter (Key Respondent 1) who resided in Larsen Bay for the majority of the year and elsewhere in Alaska the rest of the year. Key Respondent 1 was man in his 30s, born and raised on Kodiak Island who had been commercial setnetting out of Larsen Bay over 20 years. He was interviewed on June 11th in Larsen Bay by Lee and Marchioni and spoke about working with his crew at his commercial setnet site and bringing salmon home to the community..we took about fish in the early part of the season and we gave them to everybody in town. People were asking for us to get fish. This year was successful and we went as the whole village. We had two guys [deckhands] and between the two of them I think they are related to every single person in the village. They gave some out to people and then they made a lot of [raw] fillets for the elders. Key Respondent 1 obtained his fish from his seven commercial setnetting locations in Uyak Bay. One net was set just across from the community of Larsen Bay, while the other six nets were within approximately ten nautical miles north and south of Larsen Bay on the west coast of Uyak Bay. Upon returning with sockeye salmon, Larsen Bay residents came to the beach where the skiffs landed and took the fish to their households for individual processing. Key Respondent 1 reported he had been doing this for years and feels it is an important and efficient way to distribute salmon to the community, many of whom are of advanced age. This was particularly important in 2014 as the salmon came very early and many people were not ready for commercial fishing, let alone subsistence fishing. Well, we saw it coming in about mid-april when the sun came out and it was 70 degrees. They [the salmon] don t have calendars. But it was 70 degrees; they thought it was the middle of summer, and thought, Oh gosh, let s get up to the river! They didn t know that it was the end of April or May when it got warm. Marchioni and Lee accompanied Key Respondent 1 on his commercial skiffs and documented the commercial harvesting techniques he had used during the earlier subsistence harvest (Plate 1). Each net was set, or tied off, to shore on one end, and the other end was anchored to the bottom with a buoy attached. There is a lead line that lies on the bottom of the ocean floor, a cork line, which floats on the water s surface, and webbed monofilament line covering the entire space between the two lines. 23
37 The fishers checked their six nets morning, afternoon, and evening. Lee and Marchioni went out during the noon trip to pick the nets. Marchioni went in the skiff with the permit holder and one deckhand. Lee, a skiffman, and a deckhand were in the second skiff. Each skiff went in a different direction and was responsible for the three setnets in that direction. Once at the net, Marchioni observed the deckhand grab the end of the setnet anchored to the ocean floor with a boat hook and pull the net in through two metal poles welded to the end of the skiff, over a hydraulic roller, and into the center of the skiff. Metal poles and hydraulic rollers were stationed on either side of the skiff to pull the net into the boat. When a fish came up in the net someone would pick the fish out and throw it into the open fish box lined with an open brailer bag. When enough fish were collected the skiff would navigate over to the tender where the brailer bag would be lifted into the tender by a crane and the amount of fish would be accounted for on the fish ticket. During 2014, this commercial fisher provided much of the community of Larsen Bay with salmon. The survey data collected in 2013, for the 2012 harvest year, supported this finding. Subsistence Harvesting Processing and Sharing Patterns by Subsistence Users While Key Respondent 1 provided a large number of the salmon to the community of Larsen Bay, other households also harvested and shared salmon. There were two households of middle aged single men who went out in their skiffs and harvested salmon with subsistence nets to distribute throughout the community. Due to the early salmon run in June 2014, Lee and Marchioni missed the harvesting and processing of salmon in Larsen Bay. However, through interviews and descriptive tours of smokehouses and drying shacks, they were able to document the processing activities of three subsistence harvesters and/or processors in Larsen Bay. Key Respondent 2 Key Respondent 2 was a man in his 70s who was interviewed on June 12, 2014 in Larsen Bay. He was considered a knowledgeable harvester in the community and was interviewed by Lee and Marchioni about his subsistence practices. Key Respondent 2 was born in Karluk and moved in to Larsen Bay in 1967 when his father was transferred by his employer, Alaska Packers. Key Respondent 2 recalled during the interview that subsistence fishing had changed substantially in Larsen Bay since he was a child. I hated subsistence fishing. We would get 300 in the spring and 300 in the fall. Us kids, we were packing fish left and right. Every family put up 300. And they put up like 300 dry fish too. Now we don t depend on it as much. When we were kids we would play all day, have dry fish off the rack and then go back and play. Key Respondent 2 lives in Larsen Bay from late spring through early fall and does summer and fall subsistence salmon fishing; however he now spends several months each winter in the Lower 48. He targets sockeye salmon using a skiff and drift gillnet in July. Usually he said he goes up to the Karluk River mouth, but in July of 2013 and 2014, he did the majority of his sockeye salmon fishing at Telrod Cove, a small bay on Spiridon Inlet about 20 miles by boat northeast of Larsen Bay because the weather was calmer there than at Karluk. He typically trolls for coho salmon in the fall nearby the mouth of the Karluk River (usually harvesting about 30). Salmon are dried in the spring and smoked throughout the summer and fall. Each year he aims to put up 50 smoked sockeye salmon, 25 dried sockeye salmon, 25 frozen sockeye salmon, 30 smoked coho salmon, and 20 frozen and smoked Chinook salmon. He shares much of his catch with his mother and the rest of his extended family. When he leaves for the Lower 48 he takes 75 salmon meals with him, and is then able to eat salmon all year round. These numbers are different from the numbers he says each household needed when he was a child. He attributes this change primarily to increased access to store bought foods, and secondarily to the aging and dwindling population of Larsen Bay. 24
38 Dry Fish To make dry fish, Key Respondent 2 places raw salmon in a brine of five lb of salt and five gallons of water for five minutes. This was a method he learned when visiting friends in Fairbanks. When he uses this method, the salmon are hung immediately to begin drying. After the salmon are sufficiently dry, after approximately three weeks, the dry fish are vacuum packed and frozen. He does not can or jar salmon because the process is too labor intensive, and he also mentioned that the local demand for jarred salmon is currently met by the cannery, which gives free canned salmon to all the seniors. Smoked Fish Prior to smoking, Key Respondent 2 splits all salmon with the pectoral fins intact, which he said allows the oils to slide off and prevent the meat from drying. Prior to smoking, the raw split salmon are salted all over their flesh and then stacked for 14 hours. The salmon are then rinsed five times; otherwise the salt makes them turn white. He smokes his subsistence salmon, meat facing outwards, over a smoldering fire for two weeks. Cottonwood is used for smoking, and the metal tub holding the wood is covered with a metal sheet to deflect heat and smoke at all times. This is a standard process for residents of Larsen Bay. Researchers observed that the average smokehouse in Larsen Bay measures between six to eight feet tall, with width and depth falling somewhere between three and five feet. This smokehouse was of a similar dimension, and as with all smokehouses in Larsen Bay, there were no fish hanging in the bottom two-thirds of the structure. Fish remained at the farthest points from the smoking cottonwood so they did not become dried out or overly saturated with smoke. All smokehouses had what appeared to be unintentional ventilation near the ground and up along the roof, but there was also no attempt to prevent leakage. Smokehouse doors were always kept closed; however when a smokehouse was checked the door remained open for several minutes every couple of hours which allowed fresh air to circulate. Key Respondent 3 Key Respondent 3 was a woman in her 70s who moved to Larsen Bay about 50 years ago after meeting her husband, who is from Kodiak. She and her husband lived together year round in Larsen Bay. Lee and Marchioni interviewed her and her husband on June 10, 2014 in Larsen Bay. This couple used to do all of their subsistence harvesting on their own, but age and health have made it so that in recent years they have come to rely on others. We would get in the skiff and go to Karluk and fish down there [when they were younger]. We would bring back about 100 to 120 fish. Most of this, when I did it, I would just give them away. This household received their salmon from three different Larsen Bay households in One was that of the commercial setnetter (Key Respondent 1), one was that of a single man who does subsistence fishing and the third was another elderly couple who still go subsistence fishing when they are able. Key Respondent 3 split all of her 96 fish, hanging 65 in her smokehouse, and putting 31 up to hang above her smokehouse in her drying shack. Dry Fish The drying shack has three wooden 2 X2 square beams positioned horizontally across a small frame of 2 X4 beams and nails. The shack is secured to the roof of the smokehouse (Plate 2). The entire drying shack is covered by a mosquito net primarily to prevent blue flies from getting on the meat and laying their eggs. Roughly 15 split sockeye salmon hung on each of the dowels. Prior to hanging the fish on the drying rack, Key Respondent 3 rinses the salmon with fresh water. No salt or brine is used for the dry fish. The split salmon were hung by their caudal fins, meat facing out, with the pectoral fins still attached. The woman said the pectoral fins remained attached because they gave her 25
39 something to grab onto when she was splitting fish. All other fins and fish heads were removed. The edges of the mosquito net were held down on all sides loosely by 2 X4 s. She lets the salmon remain in the drying shack for approximately a month, and once deemed fully dry, they are removed and can just be kept on your shelf and will last all winter. Smoked Fish The smokehouse was made entirely of wood and had five wood 2 X2 cross beams inside to hang fish on; all five beams were on the same level in the upper one-third of the approximately seven-foot-tall smokehouse (a relatively standard height for smokehouses in Larsen Bay). The smokehouse was approximately four feet in width and depth. There were approximately a dozen fish on each 2 x2 wood beam. There was no floor to the smoke house, only the ground where a metal tub with smoking cottonwood logs rested (Plate 3). A piece of metal lay on top of the tub to prevent smoke from hitting the fish in a concentrated amount. This particular individual only used cottonwood logs she found on the beaches near Larsen Bay. The door to the smoke house remained closed at all times, which, along with the smoke, prevented flies from getting to the meat. Before being hung in the smokehouse raw split salmon are first washed with fresh water and then laid flat on a polyethylene sheet skin down. Salt is sprinkled on the meat side of the fillets and then layered meat side up. The fillets are left to salt for approximately 16 hours, then they are washed really good to ensure all of the salt is off. The fillets are hung in the smoke house by the split that ends at the caudal fin, meat side facing out. Fish will hang in the smokehouse for approximately ten days (more if the weather is cold) before being removed and placed in food saver bags. Warm weather will cause the fish to smoke at a quicker rate, and if there is a lot of moisture in the air the fish will need to be attended more often to watch for mold and flies. Key Respondent 3 does not freeze or jar her smoked fish, but just keeps it in the food saver bags on the shelf. Salted Fish During the fall months, Key Respondent 3 will salt both bright sockeye salmon and bright coho salmon. She will place a lot of salt on the fish and then layer them in a large fish tote. The fish will get very hard after about three or four weeks. She will then take the fish out of the container, remove the salt, and slice the meat very thin. The slices will soak in water to remove the salt, and at that point she says the fish is cured. She uses pickling spices, vinegar and onion to pickle her salted fish. Key Respondent 4 Lee and Marchioni were able to conduct an interview with Key Respondent 4, a female resident of Larsen Bay in her 70 s living with her husband, on June 12, She had lived in Larsen Bay since she was a child and moved there from Karluk with her family. Researchers discussed her processing techniques of the salmon she received from Key Respondent 1 s large, community subsistence harvest. Dry Fish Key Respondent 4 did not dry her sockeye salmon and did not have a drying shack. She spoke of how her mother had one that was attached to the roof of the smokehouse just as the residents of the other households. She said her mother s smokehouse was huge half as big as the house it was flat on top because she dried fish on top. Her smokehouse is smaller than her mother s because she never needed as much salmon as her family did when she was a child. As other respondents noted, the emphasis when they were children was on subsistence foods, and recently, more options are available to supplement subsistence foods. Smoked Fish She described her smoking process as researchers toured her smokehouse. Similar to the other households, Key Respondent 4 had a wooden smokehouse with split sockeye salmon hanging with the 26
40 meat facing out (Plate 4). On the ground rested a metal tub with cottonwood smoking slowly through two sheets of metal (Plate 5). Placing the metal sheets on the smoking tub was a technique her mother taught her so the fish did not get cooked. If fish became cooked, they would become too dry and community members deem them ruined. This was the same reason given by all Larsen Bay residents for covering their smoking cottonwood. Metal rods were placed width-wise in two lower rows and six upper rows in the top one-third of the smokehouse. The two lower rods had seven fish on one and three on the other, and the three upper rods had five fish hanging on each. When asked, Key Respondent 4 said she just hung them and did not pay attention to where with the exception of providing at least an inch of space in between fillets. All fish were split the same as that of the other households visited, with the pectoral fins still attached. The woman checked her smokehouse every eight hours, the same frequency as the other households. [The commercial fisher in Larsen Bay, Key Respondent 1] always give[s] me fish. That s who I got my fish from. I am smoking ten smoked fish for them. He always thinks of the people here. He always brings all the elders fish when he first comes out [he lives elsewhere during the winter] it s always subsistence, for the elders. He s the only one who gets any of us fish anymore. Everybody else, they just don t even care. Key Respondent 4 is like other people in Larsen Bay who believe that interest in subsistence fishing activities is declining locally in Larsen Bay. Reasons for the current lack of interest include the aging population, and elders hold that the few younger residents are not contributing what they should be in the way of subsistence. The effect of changing demographics will be discussed in Chapter 5. Larsen Bay Fishing locations In 2013 and 2014, residents of Larsen Bay spoke of the Karluk River as being the primary location where they harvest their salmon. Residents troll for coho salmon and Chinook salmon in the salt water just outside the mouth of the river primarily in the fall. Pink salmon, chum salmon, and sockeye salmon are targeted in the fresh water within the first few miles of the mouth of the Karluk River with a subsistence seine or drift gillnet during the spring and summer months. Telrod Cove on Spiridon Inlet was another watershed where people spoke of harvesting their sockeye salmon with a seine or drift gillnet during the late spring and summer months. Other locations within a 20 nautical mile radius of the Karluk River in Uyak Bay, and around the northwest corner turning into Shelikof Strait, were also noted as locations where people would harvest salmon historically. Karluk remained the primary location due to its accessibility and productivity for the residents of Larsen Bay. OLD HARBOR SUBSISTENCE HARVEST From August 30th to September 3rd of 2014, Lee and Marchioni traveled to Old Harbor to document the coho salmon and sockeye salmon harvesting practices of Old Harbor residents. Weather, run timing, and fieldwork responsibilities elsewhere prevented Marchioni and Lee from getting to Old Harbor until after the sockeye salmon run had finished, however a high harvester in the community took them out to see the locations where sockeye salmon were harvested and to review the sockeye salmon subsistence harvesting process. The coho salmon were running up Big Creek when they arrived, and researchers were able to document the fishing practices of several families during three trips up the river. Key Respondent 5 Trip to Sockeye Salmon Fishing Locations Lee and Marchioni left the dock with three Old Harbor community members around 1000 hours on August 31, The owner (Key Respondent 5) of the small boat with an outboard motor is a high harvester and provides subsistence foods for many members of the community. Key Respondent 5 was in her early 40s and grew up in Old Harbor but had spent several years living elsewhere for school and 27
41 work. Her mother was a high harvester as well, and she had been subsistence and commercial fishing since she was a child. Her eight-year-old son accompanied her and researchers on this trip, as well as her niece (also under ten), and another resident of Old Harbor in his early 20s. She first took researchers to tour Barling Bay where she and many community members use setnets to fish for salmon. Subsistence set gillnets are set in various locations near the mouth of the river to catch sockeye salmon as they school at low tide before heading up the river to spawn. The shoreline of Barling Bay provides space for the setnets of several families. All gear is brought out to the location at the start of the day, and families remain there all day tending to their nets. The nets are set on shore, and the entire net is drawn out into the salt water until the cork line, the webbing and the lead line are in their proper place and are taut. The lead line has an anchor attached, and the cork line has a buoy attached; both are pulled taut and released. Families remain onshore or in their boats while the net is fishing. The net is checked when corks bob or go under, which is an indicator that there are fish caught in the net. Families will pull their nets back into their boats and take them, and their salmon harvest, back to Old Harbor at the end of a day of fishing. Community members also troll for coho salmon and Chinook salmon and sink pots for tanner crab in Barling Bay. No bait is used for coho salmon, only hoochie mommas (spinners), and herring or less desirable salmon meat are used as bait for Chinook salmon and crab pots. Some Tanner crab pots were checked on this trip, and a longline halibut skate was set with some herring and some pink salmon bellies for bait. Newman Spit was the next stop, a point of land just opposite Barling Bay in Sitkalidak Strait (approximately a 20 minute skiff ride from the mouth of the river in Barling Bay). This spit of land is another spot where many Old Harbor residents go to use a subsistence setnet for sockeye salmon. Salmon harvested at Newman Spit are said not to be part of one particular salmon run, rather they are fish headed to different places in the Gulf of Alaska and Bristol Bay. More crab pots were checked near the Three Sisters location, and one contained a large octopus that was kept for the family s dinner (Plate 7). Researchers were taken on a detour to Port Hobron where the key respondent showed them the old whaling station. The whaling station consisted of much debris from old wooden and metal structures, including large tanks that once held whale oil, and it was noted by the key respondent the oil surrounding the tanks on that warm sunny day was old whale oil that had leaked out. Key Respondent 5 headed back to Old Harbor around 1600 hours and docked her boat. She had to get back to work so the boat was left as-is, and one of the halibut skates was left out to be collected later that evening. After a late trip out to Big Creek, researchers accompanied her back out to pull up her 22 hook halibut skate that had hooked three halibut; one was approximately 25 pounds, and two were pounds. There was also an octopus on the line. She was very happy with the catch, and later that night she brought the researchers some fried octopus. Processing Smoked Sockeye Salmon On September 2, 2014, Lee and Marchioni went to the house of Key Respondent 5. She gave them a tour of her smokehouse which was about twice the width and depth of the other smokehouses that researchers visited in Old Harbor and Larsen Bay (approximately seven feet tall, four feet deep, and seven feet wide). There were four 2 x2 s laid width-wise in the smokehouse near the top. There were two lower rails and two upper rails, but all four were in the top 30 percent of the approximately seven-foot tall smokehouse. The floor was just the ground and there was the same type of metal tub as used in Larsen Bay with smoking cottonwood and a metal cover to dissipate the smoke. The fish were split and hung by the tails with meat facing out, the same as was done by Larsen Bay residents. However, unlike the technique used by key respondents in Larsen Bay, none of the pectoral fins remained on the fillets. When researchers arrived, the smokehouse was full of cold smoked salmon that had been hanging for approximately five days. Much of the smokehouse was emptied that day, and the salmon were brought 28
42 inside in buckets for Lee, Marchioni, Key Respondent 5 and her son, and three other residents of Old Harbor, to begin processing. First the caudal fin and the skin was removed from every fillet. Then the fillets were cut into chunks that would fit in either pint jars or half-pint jars depending on assignment. Once removed from the smokehouse nothing was done to clean, rinse, or dry the meat before it was cut into chunks and squeezed into jars. The chunks were wrapped around each other; roughly three chunks could fit in any jar if cut properly and squeezed. When asked why she did not make strips with the smoked fish prior to jarring them Key Respondent 5 said she liked chunks better. The jars with the chunks were then garnished with various combinations of lemon, pepper, salt, cilantro, green peppers, and onions. The jars were then sealed and placed in the pressure cooker. This process continued until one am when researchers felt it appropriate to leave the family who would be letting the pressure cookers continue through the night. Key Respondent 6 First Trip to Big Creek Immediately after the trip to Barling Bay on August 31, researchers joined another high harvester (Key Respondent 6) in Old Harbor for a trip to Big Creek. Key Respondent 6 was born and raised in Old Harbor, a commercial seiner for over 30 years, and was currently in his late 50s. This excursion included four other people: another Old Harbor resident and his grandson, a man visiting from Larsen Bay, and the eight-year old son of Key Respondent 5. The boat left the dock at around 1700 hours to catch the high tide; otherwise the key respondent s large metal skiff would not make it up Big Creek. Even being high tide, the skiff got stuck several times and Key Respondent 6 had to get out and push the skiff over the sand humps. There was roughly a four-hour window when the boat could make it in and out of Big Creek because of the tide schedule. As the boat made its way up Big Creek, it passed several Old Harbor families along the river banks with rod and reels and much smaller aluminum skiffs. Most nights during the coho salmon run residents would come out to Big Creek to harvest salmon. Researchers talked to residents and learned most were able to catch their limit when they went out; however the practice seemed to be social as much as it was for subsistence. Key Respondent 6 headed far up Big Creek to Beaver Pond where all passengers tried to harvest coho salmon but were unsuccessful, so they headed back towards the mouth. A few residents were found successfully fishing at a fork in the river, so Key Respondent 6 decided to have his passengers try fishing this location (Plate 9). In a discussion with resident fishers about technique, Marchioni was told that hooking a coho salmon had to do with the speed and motion of both jigging and reeling. The technique involved casting the line far from shore, jigging the lure for a few seconds, then reeling the lure and hook back to the bank with proper speed and fluency. Several passengers caught coho salmon that were each around 20 pounds. No bait was used, just spinners and/or rubber worm lures. The boat headed in around 2000 hours, and a consensus was made to leave at 0600 hours the following morning. Second Trip to Big Creek At 0600 hours on September 1, 2014, Key Respondent 6 picked up Lee and Marchioni who accompanied him and three others: the eight-year old son of Key Respondent 5 and the man who was visiting (both were present on the first trip to Big Creek), and a different resident of Old Harbor. The boat was pulled over and anchored within about a mile of the mouth of Big Creek because the tide was still too low to go any farther up. Researchers accompanied harvesters as they walked up the well-worn bear and human trails along the river banks. Lines were dropped and if nothing was caught for a period of time then the group would continue walking. When the water was low enough they crossed the river and tried fishing on the other side. Eventually a coho salmon was caught, hit with a fish club, and left on the beach. Another family came out around 0800 hours in a much lighter, shallower skiff, and they shuttled the 29
43 group up river. Here, many people were able to hook coho salmon and eventually plastic totes were brought over to put fish in. Rod and reel fishing involved the same basic method for every resident fishing that day. Lines were thrown in the water with spinners and hooks and then reeled back until the hook made it back to the rod or a fish was caught. The technique of every individual was a little different; some people jigged for longer than others, some people would stop and jig intermittently, some people only used their lucky spinners. After several hours the group walked back to the large skiff and loaded their fish and themselves on the skiff and headed back to Old Harbor. Third Trip to Big Creek September 2, 2014, researchers accompanied Key Respondent 6 again out to Big Creek where they would meet another family to harvest coho salmon with a seine. They headed out about 0500 hours and went directly to where the other family was fishing in a deeper section of the river, several miles from the mouth. When it was time to use the net, the male head of the accompanying household held one end of the seine on the beach and walked it along as Key Respondent 6 navigated his boat straight across the river while carefully feeding the seine out, and then he turned the boat and moved along the opposing bank for a while. Eventually, he gradually navigated the boat towards the beach as the entire seine net had been let out. The man on the shore continued to walk slowly with his end while Key Respondent 6 pulled the seine toward the man on the bank by moving the boat toward him (Plate 11). The seine was submerged in shallow water, so fish were active but remained under water. Each family took only what they needed and carefully threw the remaining coho salmon (approximately 25) back in the river. Unfortunately, very close to the mouth of Big Creek the skiff became lodged on a very large, unexpected sandbar. After an hour of trying to move the skiff between the three of them it was decided to be pointless. Lee and Marchioni had to catch a plane so Key Respondent 6 made arrangements for a friend to come and get him and the fish, and then he would come back for the boat at the next high tide. Lee and Marchioni walked through the river in their chest waders the two miles to the airstrip where they were met by both plane and gear. As they flew out they saw Key Respondent 6 being picked up by another boat. Old Harbor Fishing Locations Systematic household survey results include data on salmon harvest locations used in 2012 (Table 65 and Table 66, discussed in Chapter 3). During Key Respondent Interviews included in this chapter, three of those locations were addressed specifically: Barling Bay, Three Sisters, and Big Creek. Residents fish Barling Bay and Three Sisters with set gillnets from late May through July for sockeye salmon and in August and September they troll for coho salmon. Big Creek is fished for pink salmon and chum salmon throughout the summer, but primarily for coho salmon in August and September. Salmon were also said to be harvested at Barnabas Rock (or Ronnie s Rock), which is roughly ten nautical miles southeast of Old Harbor. The other location where many of the residents of Old Harbor fish for coho salmon is at the culvert. The culvert is located in between the old and new sections of the community, and it empties into a lagoon where coho salmon spawn during late summer and early fall. No one was fishing in the body of water called the culvert during the time when Lee and Marchioni were there in 2014; however survey respondents mentioned that this was a location used often by residents, particularly children and elderly. Rod and reel is used, and people can simply drive a four-wheeler or truck, or just walk to the culvert to get their salmon. 30
44 KODIAK CITY Researchers accompanied one family from Kodiak City while they fished for coho salmon with rod and reel at Pasagshak in early September Lee and Marchioni did several key respondent interviews and tours of smokehouses in Kodiak City during the September trip in Also, earlier in 2014, Lee accompanied a family while they subsistence fished for sockeye salmon. Key Respondent 7 Kodiak City Tour of Smokehouse Key Respondent 7 was a woman in her 60s who lived with her son, who was in his early 20 s. She is a high harvester in the Kodiak City community, a member of the Sun aq Tribe, born and raised in Kodiak City, and was mentioned by many individuals as a subsistence user during surveys. She did a key respondent interview with researchers and gave them a descriptive tour of her smokehouse and everything that goes into harvesting and processing salmon. She owns a small skiff and outboard motor that she uses to drift gillnet for sockeye salmon in salt water near the mouth of the Buskin River. Coho salmon and Chinook salmon are caught on rod and reel from the Pasagshak and Buskin rivers, as well as trolled for in front of the Buskin River. She likes to get about 70 sockeye salmon, 20 coho salmon, several pink salmon, and only a couple Chinook salmon for her household and her family. She hard and cold smokes her sockeye salmon and coho salmon while Chinook salmon get kippered. Meat is brined overnight, and then it is laid out until it is a little tacky; next it is put in the smoker. She likes to go out one time in the beginning of the season and get a large amount of sockeye salmon to hard smoke. Then throughout the season she will kipper the salmon she gets. She will hard smoke her fish anywhere from days. She does not dry salmon, and only dries halibut on occasion. When she makes kippered salmon is it smoked for six to eight hours in a commercial, electric smoker rather than in a smokehouse. Smoked and fresh pack salmon are jarred. She puts chunks of smoked salmon in the jars, not strips, just as the key respondent in Old Harbor. Tonya Lee accompanied a Kodiak family on a fishing trip in June Her first-hand account with photos is attached as Appendix E. Kodiak City Fishing Locations The residents along the Kodiak City road system use the entire island as their fishing grounds. Many Kodiak City residents work in the commercial fishing industry and will spend the summer months either on a boat or at a setnet site somewhere around the island. These residents will often harvest their subsistence salmon while they are at their summer houses and cabins. Many Kodiak city residents who do not work in the commercial fishery own boats, skiffs, and kayaks that they use to access both nearby and remote locations around Kodiak to harvest salmon. The saltwater right outside the mouth of the Buskin River is a popular place to gillnet for sockeye salmon and pink salmon during the summer months. Monashka Bay, Pauls Bay, and Kizhuyak Bay are a few of many locations within 30 nautical miles north and south of Kodiak City where residents will go to harvest sockeye salmon, chum salmon, and pink salmon with a gillnet, or to seine or troll for coho salmon and Chinook salmon. A large portion of the Kodiak City population, however, either prefers to stay near the city or does not have the resources to venture very far. These residents tend to use one of the many productive watersheds along the road system. Pasagshak River, American River, Olds River, and the Buskin River are all watersheds where coho salmon can be harvested during the fall months with rod and reel. Many common threads tie the harvest and use practices of key respondents in these three communities together. Most notably being similar drying and smoking techniques, less salmon being harvested and processed than in the past, dealing with the earlier arrival of salmon runs (and changes in run timing in general), and a reliance on rod and reel as a method of harvesting salmon for home use. There are also 31
45 profound differences between these communities. Similarities and differences will be addressed in the Discussion Chapter of this report. 32
46 5. DISCUSSION The project had four study objectives: 1. To compile and update data on the harvest of salmon in the Kodiak archipelago road system and the case study communities of Larsen Bay and Old Harbor and to compare and contrast the road system fishery and the fishery of the more isolated communities. 2. To describe current (2012 study year) subsistence harvest and use patterns of salmon on the Kodiak archipelago including harvest locations. Evaluate whether educational efforts in Larsen Bay and Old Harbor increased the accuracy of permits over time. 3. To collect and discuss local knowledge about patterns and trends of salmon harvests and salmon stock diversity, including changes in location over time. 4. To identify factors of the social-ecological system of the Kodiak archipelago that shape contemporary subsistence harvesting patterns and uses of salmon by residents of Kodiak City and the nearby road system, and the study communities of Larsen Bay and Old Harbor. Data useful in meeting objectives 1 and 2 were collected during the household survey. Survey respondents provided information about participation in various aspects of the subsistence salmon fishery, including effort, success, sharing/receiving, family participation, acquisition of subsistence techniques, preference for fishing gear and personal history using a number of gear types. Survey respondents also identified where they fished in 2012 and described how many years they have fished at these same locations. These data, presented in Chapter 2, will be discussed in this chapter to identify the subsistence patterns that define the road-connected areas of Kodiak City as well as in the isolated communities of Larsen Bay and Old Harbor. To meet part of Objective 2, the original project proposal included plans for a detailed documentation of harvest locations using geographic information systems (GIS) software and analysis. However, in the course of conducting the household harvest surveys, an error was discovered in the format of the paper survey maps; researchers had intended for these survey data to be digitally integrated into a geographic information system for further analysis, but the formatting error made digitizing the information impossible. In the end, the place names written down on pages four through six of the survey served as the means of documenting the use of various subsistence harvest locations for each community. Those locations and their importance to each community s subsistence economy were discussed in Chapter 3 (Tables 27 30, 51 52, and 65 66). Chapter 2 also contains a discussion of survey data relevant to Objective 2, determining whether an educational effort started in 2006 has resulted in local fishers recording salmon harvests more accurately on subsistence fishing permits. Overall, community salmon harvest estimates generated using information recorded on individual subsistence permits remain significantly lower than community harvest estimates created using data gathered during a face-to-face survey. Objectives 3 and 4 directed the researchers to describe local knowledge related to salmon ecology (changes in abundance and location over time) and as a discussion of social and economic factors that shape subsistence salmon fishing on Kodiak Island today. Researchers were able to collect information addressing both these aspects. Social, demographic, and economic measures for each community were collected by the survey and were described in Chapter 2. Key respondent interviews presented in Chapter 3 address the issues identified in Objective 3 by providing specific descriptions of changing salmon ecology, including to the effect early summer is having on salmon run-timing. 33
47 SUBSISTENCE SALMON FISHERIES ON AND OFF THE ROAD SYSTEM In comparing the subsistence salmon fisheries of those communities on and off the road system, two differences and one similarity became apparent. Differences center on the acquisition of subsistence knowledge and the methods used. Key respondent interviews and personal discussions with community members led researchers to conclude that subsistence users in all three study communities shared similar concerns about the way fisheries resources are being managed and maintaining access to those resources. Acquisition of Subsistence Knowledge: Social Networks and Gear Preferences People living in communities located off the road system (Old Harbor and Larsen Bay) more often learned how to subsistence fish from family members. During interviews, it was apparent that residents of Old Harbor and Larsen Bay had learned how to harvest and process salmon at a very young age from some member of their family: an aunt, uncle, grandparent, or parent. For women and men, the familial relation and gender of the instructor tended to differ depending on what skill was learned. Men and women who learned how to fish, regardless of their gender, tended to have learned from a male relative. In Old Harbor there were a few exceptions. For instance, one family had several generations of female fishers who taught their daughters and sons how to fish. However, going back in time, these women at one point had learned from a male relative. In regards to processing fish, men and women tended to have learned how to process from a female family member. The older the individual, the greater chance this was the case. Kodiak residents on the road system tended to have learned how to both fish for salmon and process salmon from a friend, a neighbor, or a colleague. While this pattern constituted the majority of the residents on the Kodiak Road system, there were exceptions. Residents who were interviewed that either belonged to the Sun aq tribe, grew up in a community off the road system, or whose family lived on Kodiak Island for multiple generations were more likely to have learned from a family member. Researchers were told by respondents and other contacts with the community that a significant part of the Kodiak road system population consists of recent migrants (within the last five to ten years) to the area, an aspect of demography that would help explain why the majority of people learned to subsistence fish from a work colleague, a friend, or a neighbor. Recent arrivals to Kodiak were surveyed for this project, and researchers heard some describe how they had learned to fish by trial and error; this was particularly common among residents using rod and reel. Residents of the Kodiak road system who hold subsistence permits do so with the intention to harvest salmon with some kind of net for efficiency and to obtain a large amount of fish to store for the winter. Researchers were interested to see that the people who utilize nets are also well versed in rod and reel and used those gear types most often when targeting coho salmon and Chinook salmon. Kodiak road system residents used multiple methods to harvest their subsistence salmon, including home pack from commercial boats, subsistence gillnet, and rod and reel. Research suggested that the majority of recent arrivals (within the last five years) to Kodiak procured the majority of their salmon with rod and reel. Residents who had lived on Kodiak for over ten years, or for generations, tended to use a gillnet, often in addition to rod and reel. Residents who worked on a commercial salmon boat, or had a family member who did, often got the majority of their salmon from home pack. Many elders, or people without the means or money to harvest fish themselves but who had been in the community for a long time, were given salmon from other harvesters. The road system provides convenient access to several rivers where residents can park, walk a short distance, and use a rod and reel to harvest salmon. The road system also provides opportune access to many boat ramps where small boats can easily be launched. All survey respondents answered questions about their experience using rod and reel to harvest salmon. The majority of respondents in both of the Kodiak samples (permit holders and non-permit holders) used rod and reel to harvest salmon in 2012: 67% of the subsistence permit holder sample and 58% of the nonpermit holder sample (Table 32). Of all households, 86% of the permit holder sample and 57% of the 34
48 other non-permit holder sample had some experience using rod and reel to harvest salmon. Researchers found that people who hold subsistence salmon permits do so with the intention of efficiently harvesting large quantities of salmon to store for the winter. People who utilized nets were also well versed in rod and reel, and were likely to use rod and reel to acquire fresh coho salmon during the fall months, as well as Chinook salmon year round. This is not surprising given the high importance placed on coho salmon and Chinook salmon in the community of Kodiak City. Notably, half of the Kodiak residents who do not hold a subsistence permit reported using rod and reel. However, the majority of residents who did not use rod and reel acquired salmon from other harvesters. Data acquired from subsistence salmon harvest surveys and subsistence permits showed the importance of salmon to the entirety of the Kodiak community. In Old Harbor and Larsen Bay, fishers obtained the majority of their subsistence salmon from subsistence gillnets, seines, or home pack from commercial boats. Larsen Bay was unique in that the majority of subsistence salmon acquired in 2012 came from commercial boats, whereas the majority of salmon in Old Harbor came from subsistence gillnets and rod and reel. Communities on the road system have access to both saltwater and freshwater fisheries for all species of salmon and with several gear types. Communities off the road system each have access to various salmon runs; however access to such a variety of species, rivers, and designated fisheries is not as possible as it is for residents along the road system. Lastly, participants in all subsistence salmon fisheries on Kodiak Island expressed concern about protecting their access to subsistence in both the state and federal management systems. Subsistence salmon fishers on and off the road system feel their federal and state subsistence rights have been challenged recently, and they place great value on their ability to participate in subsistence salmon fisheries. Without prompting, subsistence salmon harvesters, processors, and receivers spoke of the importance of their legal right to access and participate in the subsistence fishery, a right which people feel has come under fire during recent debate on whether or not the road-system portions of Kodiak Island should be listed as non-rural (by the Federal Subsistence Board) and non-subsistence by the Alaska Joint Board of Fish and Game. COMMUNITY RESILIENCE Dealing with Lack of Subsistence Salmon: Based on per capita harvest estimates the survey data indicate that, compared to residents of the Kodiak road system, residents of Old Harbor and Larsen Bay are more dependent on locally harvested salmon for subsistence use. There are places to buy food in both Old Harbor and in Larsen Bay, but the options are dramatically fewer than in Kodiak City where the options for purchasing different foods are plentiful, including the option of purchasing locally caught fish. Interestingly, during times of scarcity, people turned to buying store-bought food in about the same proportion (70%) for each study community. Fiftypercent of Larsen Bay residents turned to other subsistence foods as replacement, while the proportions were lower for Kodiak (23%) and Old Harbor (10%). No respondents in Kodiak City or Larsen Bay reported offsetting the need with public assistance, but 9% of people in Old Harbor did use public assistance during times of shortage. Doing without was an option reported by 9% of Old Harbor residents and 19% of Kodiak road system residents; no one in Larsen Bay reported that as an option. Society, Economics, and Subsistence: Changing demographics may have a significant impact on trends in subsistence. Due to advancing age, disability, work commitments, or lack of family connections, certain people may be unable to fish for themselves or get fish they desire from others. Reasons given for getting less fish than desired in 2012 point to scarcity of resources, but also changes in social relationships that might result in scarcity for some households (Table 59, 22, 49). 35
49 Notable demographic change has been documented in recent decades for both Old Harbor and Larsen Bay, one that could reasonably be expected to have a direct result on subsistence practices. Larsen Bay lost 54% of its population between 1980 and 2012 (Figure 6). During a 2003 Division of Subsistence study, 14.3% of the population were aged 60 years and over, higher than other comparable communities in the area (Fall 2006); in 2012 it had increased to 17% (Table 10). Old Harbor is undergoing similar depopulation, with a population that has decreased by 40.5% since 1980 (Figure 8). The contribution of key individuals or families known as super households has been documented throughout rural Alaska by the Division of Subsistence (Wolfe 1987). With a small number of fishing families producing a significant amount of wild food available to the community, population loss can have a serious effect on people s access to those food resources. Participation in commercial fishing can impact subsistence in a community by creating access to boats, nets and gear; providing logistical support for fishing trips; introducing commercially-caught fish into the local subsistence economy as home pack ; and injecting economic resources into the community that support purchase of subsistence equipment (Reedy-Maschner 2010) (Wolfe et al. 1993) (Wolfe 1987). Being so closely linked, changes in the local commercial fishery can impact residents access to wild food resources. In terms of earned income, commercial fishing was less important to Larsen Bay than it was to Old Harbor and the Kodiak road system area, where a majority of fishing households earned nearly all their income from that industry (Table 38). But while the contribution of money earned by commercial fishing was less important to Larsen Bay, the relative value of home pack was much greater (Table 41). The current level of participation in commercial fishing is depicted in Table 38. In Old Harbor, and the Kodiak road system subsistence permit holder group, the percent of households involved in the industry is around 30%. Larsen Bay s participation is slightly higher at 38%, while the Kodiak non-permit sample is 12%. It is interesting to note that in the Kodiak road system, households that obtain a subsistence salmon fishing permit tend to fish commercially, depend on home pack, and share salmon in ways that mirror the rural communities of Larsen Bay and Old Harbor much more than their non-subsistence permit holding neighbors (Table 69). Demographics measuring mean age, length of residency, even proportions of Alaska Natives relative to other cultural groups, the two Kodiak road system groups are quite similar (Table 5). The data indicate that the only difference that makes the permit holders sample s dependence on salmon similar to Larsen Bay and Old Harbor is their possession of a subsistence salmon fishing permit. Home pack (fish retained from commercial harvest for subsistence use) is a significant contribution to the overall fish harvested and used for subsistence. Old Harbor dominates giving and receiving, when the exchange of commercially-caught home pack fish is measured on average by household (Table 69). And yet, the overall contribution of home pack salmon is far greater in Larsen Bay, where 58% of all household salmon came from the commercial fishery, compared to 19% in Old Harbor and 19% in Kodiak City. Figure 40 depicts the 20-year shift in gear types contributing to Larsen Bay s annual subsistence salmon harvest (Fall 2006). The contribution on commercially-caught salmon has tripled since 1992, while the relative importance of subsistence methods has decreased by about half. For Old Harbor the shifting importance of commercially-caught salmon is less clear. Although the amount of commercial fishing activity by residents of that community has decreased steadily over the past 20 years (Figure 41), the dependence on fish retained from commercial nets for home use has fluctuated greatly (Fall 2006): in 1986, home pack accounted for 29% of total subsistence salmon; by 1991 it had diminished to 17%. By 2003 the contribution was down to 6% (Fall 2006). In 2012, the contribution of home pack to Old Harbor subsistence salmon was even higher than it was 20 years before. The variability of the importance of this gear type indicates that, while the community s demographic profile mirrors Larsen Bay in increasing average age and decreasing population size, demographics alone cannot explain the changes in relative importance of this method. 36
50 To determine the social, economic, and logistical effects that commercial fishing has on community subsistence is a complicated process. Data related to population size and participation in the industry contribute to the discussion, but to sufficiently understand the connections a more detailed socioeconomic analysis should be undertaken. Environmental Change and Resource Availability: When researchers were planning this study, household harvest surveys included both a place to record 2012 salmon harvest by location, as well as a detailed mapping component wherein respondents would use a map to document harvest locations used in the past and currently. On the map survey respondents would also be asked to include additional geographic information about changes in salmon location, habitat, and availability over time. When the mapping exercise failed (see Methods chapter) the research lost a large portion of its intended geographic/location database. Had historical harvest location data been properly documented this discussion could have pointed out differences with harvest locations of Also, data on environmental change observed in particular locations would have been collected and discussed. As it is, the research can only draw from the information collected during Key Respondent interviews. Larsen Bay fishers reported a surprisingly early arrival of salmon in the early summer of 2012, a significant change that Key Respondents attributed to the unusually warm weather. Increased air temperature was understood by the respondents to have affected the water in some way, affecting the marine life and inviting salmon to return much earlier than usual. Key Respondents in Larsen Bay said that both the subsistence and commercial fishers were caught off-guard by the early return, and they were almost too late. Other details related to changing resource availability were captured in the comments section of the survey. In Old Harbor, for example, survey respondents indicated that Kiliuda Bay, northeast of the community, was a productive salmon fishing ground until it was disturbed by the 1964 earthquake and tidal wave. Ocean Beach is still a location used by Old Harbor fishers seeking coho salmon (Table 65, Table 66, Figure 35) but survey respondents said it had been productive for sockeye salmon and pink salmon in the past. Other resources that were more available in the past include Chinook salmon and pink salmon in Sitkalidak Strait, Chinook salmon at Cape Barnabas, and sockeye salmon at Newman Bay. Resilience is the ability of an organism or a community to absorb external stressors and maintain a healthy equilibrium state; with the current level of stressors affecting Larsen Bay and Old Harbor, the fact that the average person there still has access to more than 160 pounds of salmon in 2012 should be taken as evidence of positive resilience. PERMIT SYSTEM RELIABILITY AND COMPLIANCE For the 2012 calendar year, 1,446 Kodiak road system residents returned subsistence salmon permits with a reported total harvest of 22,048 salmon, or 15.2 salmon per household (Table 20). This is more than 50% less than the 33 salmon (minus rod and reel harvest) per household estimated for permit-holders (Table 14). Table 20 shows that permit-reported harvests have been consistent over the past 30 years, and it is reasonable to assume that those reports are consistently under-representative of the actual harvest. Survey data in 2012 showed that 74% of Kodiak City households that had subsistence permits fished with other permit holding households (Table 32). Survey respondents told researchers that there are many newer Kodiak residents who came to the Island for jobs in the fishing industry or at the Coast Guard Station, and that these recent arrivals often go fishing with long-time Kodiak residents knowledgeable about subsistence gear and permits. Survey participants also explained that subsistence gear is expensive, and Kodiak is a welcoming community, so many families share gear; therefore, multiple households will be recorded on one permit. 37
51 Reported subsistence harvests for 2012 by Larsen Bay permit holders were substantially lower for all species but Chinook salmon compared to estimates from the household surveys (Figure 23). The same was true for Old Harbor where 2012 permit returns accounted for significantly lower numbers for all species except Chinook salmon compared to survey estimates (Figure 30). COMPARISON WITH WILLIAMS, L., P. COILEY-KENNER, AND D. KOSTER. (2010) TECHNICAL PAPER Williams et. al. (2010) noted widespread misunderstanding about how and why subsistence salmon harvest information was tracked and used by state and federal agencies. They delineated three specific concerns often cited in association with salmon harvest tracking: subsistence fishing should not be tracked through a permit program since harvesting salmon is a right; harvest information could be used to limit future salmon harvests; and information on the subsistence salmon permits is confusing. In 2012 through 2014, Lee and Marchioni heard the same concerns in Old Harbor, Larsen Bay, and Kodiak City. Both harvest survey and key respondents spoke of how subsistence salmon fishing was an inherent right for the residents of their communities and that federal and state managers place excessive scrutiny on harvest limits and harvest quantities. Concern about tracking harvest in particular was noted by many elders, including one who said:...before statehood we just went outside and lived our lives. Then the word subsistence came up, and from that point forward it was no longer about living, but about counting our food. Concern may be attributed in part to recent review of the Kodiak area s rural and subsistence area status, respectively by both the Federal Subsistence Board (FSB) and the State of Alaska Joint Board of Fisheries and Game (Joint Board). Between , following the release of census data, the FSB reviewed Kodiak information to determine if the area should be reclassified as a nonrural place (Fall 2013). In 2007, the FSB released a decision retaining Kodiak s rural designation, citing marginal population growth the high cost of food, remoteness, and the high use of subsistence resources as primary factors for their decision (Fall 2013:115). Six years later, in October 2013, the Joint Board considered a proposal to create a Kodiak non-subsistence area (Fall 2013). After hearing presentations related to subsistence harvest and customary and traditional use, as well as pertinent information related to demography, economy, as well as social and logistical aspects of life on Kodiak Island the Joint Board ultimately voted down the proposal, and Kodiak continues to be outside the boundaries for any non-subsistence areas under the state management system. However, shining a spotlight on Kodiak area subsistence during deliberations and study for both Board actions has raised concern among residents that their ability to conduct subsistence is at risk, and could continue to be so in the future. Harvest tracking projects and the permit system likely exaggerate this concern, leaving residents to fear that reporting harvest amounts above or below what regulators are expecting may further jeopardize access to subsistence. Specifically, Marchioni and Lee heard concern from residents of all three study communities that reporting harvest numbers different from those anticipated by fishery managers may result in FSB and Board of Fisheries proposals to limit gear, change season dates, or change harvest limits. SUBSISTENCE SALMON PERMITS Residents reporting through Division of Subsistence research conducted on Kodiak Island in also reported ambiguity in the language on the Kodiak subsistence salmon permit and resulting confusion on the part of area residents (Williams et al. 2010); it should be noted that permit language at the time of this study remained the same as during the study. In 2012, residents in Larsen Bay and Old 38
52 Harbor expressed confusion over how to acquire a permit and if permits were even needed; residents in Kodiak City generally understood that permits were needed, but were confused about how to record harvest on their permit, and what to do if harvest allowed by their permit was not enough. The primary source of confusion stems from fishing area location language on the permit, which cites regulations, rather than a narrative description of fishing area location. Also leading to confusion is that there is no language on the permit itself referencing the fact that additional permits may be issued upon request. Marchioni and Lee heard from many subsistence fishers that they were not aware additional permits could be obtained; fishers were uncertain about when and where to obtain additional permits, were confused about harvest limits, and perceived resistance from fishery managers when trying to acquire additional permits. Many fishers noted that instead they had either not harvested as much salmon as they needed or had not recorded all their harvest, because to do so they would have needed another permit. As noted by Williams et al. (2010), the permit system continues to present an opportunity for education and outreach. UNDERSTANDING SUBSISTENCE During surveys in Kodiak City in 2012, researchers encountered frustration with recently relocated Coast Guard members by some long-time Kodiak residents. Residents expressed concern that Coast Guard members temporarily stationed in Kodiak may be harvesting fish under subsistence regulations before they are considered Alaska residents and legally entitled to do so. The 22,000-acre U.S. Coast Guard Support Center at Kodiak Station is the largest U.S. Coast Guard (USCG) base in the United States. In 2006, Kodiak Station employed 1,130 active duty USCG personnel and 320 civilian employees (Kodiak Island Borough and Community Development Department 2008:Chapter 5, pages 11 12). If new Coast Guard employees are in fact participating in the subsistence fishery prior to meeting legal requirements for subsistence harvest, targeted outreach and education regarding subsistence regulations is needed. In contrast, Marchioni and Lee also encountered frustration with long-time Kodiak residents by more recently relocated residents who felt some take more fish than needed. Marchioni and Lee were told this several times, with salmon cited as example of more than would be needed. Fifty to one hundred fish is not an uncommon number harvested by any individual household annually in many Alaska rural communities, as reported in numerous technical papers. To help resolve frustration, education and outreach targeted for USCG and newly located residents should also include subsistence and Alaska Native ethnography components. A VISIT TO KARLUK During the trip in September 2013, Lee and Marchioni traveled to Karluk to fish with a family from Larsen Bay. However, when they arrived they were notified that one of the individuals in the family had become ill and could not make the trip. Lee and Marchioni attempted to have someone from Karluk take them fishing, but the community was well underway with their sport fish guiding operations and had clients in their lodges and no time to take researchers out. Lee and Marchioni called for the next plane to pick them up; however, that was not until the end of the day. Researchers were then afforded the opportunity to do a presentation about subsistence at the Karluk School. They each gave a presentation on the importance of subsistence to the children and asked them about what they believed subsistence was and why it was important to them and their community. Lee and Marchioni were soon accompanied by an elder lady from the community who said they should talk to her brother about subsistence because he did a lot of it for the community. They spoke with the woman for a short while and then went to the house of her brother. He was more than happy to sign a release and speak to Lee and Marchioni about subsistence in Karluk and Larsen Bay. 39
53 The elder spoke a great deal about subsistence and the Karluk River; however, there were a few specifics he mentioned that pertained to subsistence fishing done by residents of Larsen Bay. He spoke of how Chinook salmon no longer run up the Karluk River, and he does not know why this is the case. He spoke of Karluk children s disinterest in participating in subsistence fishing, which researchers also found during interviews with elders in Larsen Bay. He also mentioned that many of the sport and subsistence fishers in Karluk were very unhappy that the purse seine fishery had been opened right to the mouth of the Karluk River. Upon calling the regional manager of the commercial salmon fisheries, Marchioni was told that sockeye salmon counts past the Karluk weir had exceeded escapement goals and therefore the commercial fishery had to be opened to the mouth of the Karluk River. CONCLUSION The ethnographic observations made by Marchioni and Lee during fieldwork for this project, including details on harvest methods, locations, social organization, preservation methods, and sharing, depict the subsistence salmon fisheries of Kodiak Island within the contemporary sociocultural context. Documented case studies illustrate the range of behaviors that constitute the human aspect of the fishery and provide information useful to managers in interpreting regulations and analyzing permit data. Likewise, household harvest survey results in Larsen Bay and Old Harbor offer harvest data against which to compare subsistence permit return data, and key respondent interviews characterize use and participation in the permit system, both sources of contextual information useful to managers wanting to better understand permit harvest data. Time has influenced the way people fish for subsistence salmon on Kodiak Island, and recent changes in population, economics, technology, and the local commercial fishery, as well as environmental changes, have all contributed to the way people access and use salmon today. Despite changes, people continue to depend on salmon as a source of nutrition, social organization, and cultural continuity. In the future, providing enough salmon to meet subsistence needs will depend on effective communication between subsistence users and fisheries managers. 40
54 6. RECOMMENDATIONS It is recommended that Division of Subsistence work with the Division of Commercial Fisheries to revise the language on the subsistence salmon permits. If the permit reflected the actual language in the regulation book by stating that additional permits are available upon request, then subsistence fishers may be more likely to record accurate harvest numbers. With the exception of Chinook salmon, harvest numbers reported on returned subsistence salmon permits for 2012 for Old Harbor and Larsen Bay were substantially lower for all species, than was found during the subsistence household harvest surveys. Researchers found during interviews that residents of these communities were often confused by the way the current permit system worked and the fact they could obtain more than one permit. This confusion led to a fear of reporting more salmon than was allowed on the subsistence permit, and therefore a good deal of salmon went unreported. This was also evident in the research described by Williams et al. (2010). It was evident from both the comparison of survey and permit data that the outreach efforts of Williams et al. (2010) have not been long lasting. Further education and outreach efforts are recommended to boost permit returns and more accurate subsistence harvest numbers. Researchers recommend that the Kodiak National Wildlife Refuge and the Alaska Department of Fish and Game work together on Kodiak Island to provide education and outreach regarding federal and state fishery management jurisdictions, permits, and regulations, as well as the importance of collecting accurate subsistence harvest numbers. It is also recommended that the Kodiak National Wildlife Refuge and the Alaska Department of Fish and Game educate each other regarding their regulations and permitting process. If both agencies are informed of the other s permitting processes, they can provide direction to residents who are confused when they come to one office or the other. Over the last decade, the rural and subsistence statuses of Kodiak City have been challenged twice at the federal level and once at the state level, respectively. Including a place to record rod and reel harvest taken under federal subsistence regulations on state subsistence fishing permits would provide more accurate information regarding household salmon harvest by Kodiak City residents, and the Board of Fisheries and Federal Subsistence Board members would gain a better understanding of the community s true dependence on salmon. 41
55 Table 1. Project staff Name Involvement Organization Research Director James Fall ADF&G Division of Subsistence Principal Investigator Meredith Marchioni ADF&G Division of Subsistence Project Partner Tonya Lee Kodiak National Wildlife Refuge Data Management Lead David S. Koster ADF&G Division of Subsistence Programmer Garrett Zimpleman ADF&G Division of Subsistence Data Entry Theresa Quiner ADF&G Division of Subsistence Barbara Dodson ADF&G Division of Subsistence Hannah Johnson ADF&G Division of Subsistence Data Analysis Garrett Zimpleman ADF&G Division of Subsistence Publications Lead Adam Knight ADF&G Division of Subsistence Field Assistants Lisa Hutchinson-Scarbrough ADF&G Division of Subsistence Brianna Bierma ADF&G Division of Subsistence Bronwyn Jones ADF&G Division of Subsistence Margaret Cunningham ADF&G Division of Subsistence Local Research Assistants Kaarlie Stralie Kodiak City Elinor Ramos Kodiak City Robert O'Day Kodiak City Sorona Dolph Kodiak City Virginia Andrewvitch Kodiak City Zora Inga Old Harbor Frieda Panamaroff Larsen Bay 42
56 Table 2. Kodiak Borough population Kodiak City Kodiak Station Kodiak Island Road System Women's Bay Chiniak Remainder Road system subtotal Change over decade Alaska Native population Percent age Other Kodiak Borough Borough total Borough Totals Change over decade Alaska Native population ,628 3,550 6, , ,798 3,052 1,460 8,310 35% 1,099 9,409 31% ,756 1, ,716 8,947 8% % 992 9,939 6% 1,884 19% ,365 2, ,220 12,307 38% 1,285 10% 1,002 13,309 34% 2,126 16% ,334 1, ,991 12,905 5% 1,696 13% 1,008 13,913 5% 2,452 18% ,130 1, ,590 12,787-1% 1,872 15% ,592-2% 2,488 18% ,329 1, ,598 13, ,797 Source US Bureau of Census and AK Department of Labor Note Blank cells mean data are not available because census areas are not established. Percent age 43
57 Table 3. Ethnic Composition of Kodiak Island Borough Communities, A. Individuals appportioned to one race or two or more races (totals must equal 100%) Percentage of total population Population White Black AK Native Asian Pacific Islander Two or Other Race more races Akhiok % 8.7% 71.8% 2.9% 0.0% 0.0% 3.9% Alenena % 0.0% 0.0% 0.0% 0.0% 0.0% 0.0% Chiniak % 0.0% 0.0% 0.0% 0.0% 0.0% 0.0% Karluk % 0.0% 100.0% 0.0% 0.0% 0.0% 0.0% Kodiak City 6, % 0.0% 8.6% 41.7% 1.7% 3.2% 7.5% Kodiak Station 1, % 2.4% 0.2% 3.2% 2.8% 0.5% 4.9% Larsen Bay % 5.8% 59.6% 0.0% 0.0% 0.0% 0.0% Old Harbor % 0.7% 84.7% 0.0% 1.9% 0.0% 6.7% Ouzinkie % 0.0% 76.0% 2.2% 1.1% 0.0% 2.5% Port Lions % 0.9% 53.5% 0.0% 0.0% 0.9% 0.4% Womens Bay % 7.4% 16.6% 1.4% 0.0% 9.0% 1.4% Balance of census area 4, % 0.0% 15.5% 5.3% 0.0% 0.0% 5.0% Kodiak Borough 13, % 0.8% 14.7% 20.9% 1.1% 2.1% 5.7% Kodiak Road system 12, % 0.8% 10.5% 22.5% 1.1% 2.2% 5.9% Not road System 1, % 1.6% 68.0% 0.9% 0.8% 0.2% 2.9% B. Race alone or in combination with another race (total may exceed 100%)) Percentage of total population Pacific Population White Black AK Native Asian Islander Other Race Akhiok % 8.7% 75.7% 2.9% 0.0% 0.0% Alenena % 0.0% 0.0% 0.0% 0.0% 0.0% Chiniak % 0.0% 0.0% 0.0% 0.0% 0.0% Karluk % 0.0% 100.0% 0.0% 0.0% 0.0% Kodiak City 6, % 0.0% 14.4% 43.6% 2.2% 7.2% Kodiak Station 1, % 3.4% 2.4% 5.0% 2.8% 0.9% Larsen Bay % 5.8% 59.6% 0.0% 0.0% 0.0% Old Harbor % 0.7% 91.4% 0.0% 1.9% 0.0% Ouzinkie % 2.2% 76.4% 2.2% 3.3% 0.0% Port Lions % 0.9% 53.9% 0.0% 0.0% 0.9% Womens Bay % 7.4% 16.6% 1.4% 0.0% 10.4% Balance of census area 4, % 0.2% 20.1% 5.3% 0.0% 0.6% Kodiak Borough 13, % 1.0% 19.2% 22.0% 1.4% 4.2% Kodiak Road system 12, % 0.9% 15.2% 23.7% 1.4% 4.5% Not road system 1, % 2.2% 70.3% 0.9% 1.4% 0.2% Source American Community Survey, at Alaska Department of Labor website Note Kodiak road system includes Chiniak, Kodiak city, Kodiak Station, Womens Bay, and Balance of census area. 44
58 Table 4. Population estimates, Kodiak City, Alaska, 2010 and Census (2010) 5-year American Community Survey ( ) Permit holders (2013) Other residents (2013) Total population Households Population Alaska Native Population Percentage 13.8% 9.7% 13.8% 16.3% Sources U.S. Census Bureau (2011) for 2010 estimate; U.S. Census Bureau for American Community Survey 5-year survey estimate; and ADF&G Division of Subsistence household surveys, 2013, for 2012 estimate. Note Census estimates include Kodiak City only. Household survey data has not been expanded, the census area includes Kodiak City, Womans Bay, and Chiniak. 45
59 Table 5. Demographic characteristics, Kodiak City, Alaska, Permit holders Kodiak residents Other residents Characteristics Household size Mean Minimum 1 1 Maximum 8 7 Age Mean Minimum a 0 1 Maximum Median Length of residency Total population Mean Minimum a 0 1 Maximum Heads of household Mean Minimum a 1 1 Maximum Alaska Native households b Number Percentage 18.0% 15.7% Source ADF&G Division of Subsistence household surveys, a. A minimum age of 0 (zero) is used for infants who are less than 1 year of age. b. The estimated number of households in which at least 1 head of household is Alaska Native. 46
60 Table 6. Population profile, Kodiak City, Alaska permit holders, Male Female Total Age Number Percentage Cumulative percentage Number Percentage Cumulative percentage Number Percentage Cumulative percentage % 6.2% % 5.0% % 5.6% % 15.5% % 14.9% % 15.3% % 24.4% % 21.1% % 22.9% % 36.3% % 28.6% % 32.8% % 41.5% % 31.1% % 36.7% % 46.1% % 36.0% % 41.5% % 52.3% % 44.7% % 48.9% % 58.5% % 51.6% % 55.4% % 63.2% % 59.6% % 61.6% % 75.6% % 70.2% % 73.2% % 83.9% % 76.4% % 80.5% % 87.6% % 81.4% % 84.7% % 91.2% % 88.2% % 89.8% % 93.8% % 93.2% % 93.5% % 95.9% % 95.7% % 95.8% % 97.4% % 96.9% % 97.2% % 97.9% % 97.5% % 97.7% % 97.9% % 98.1% % 98.0% % 97.9% % 98.1% % 98.0% % 97.9% % 98.1% % 98.0% % 97.9% % 98.1% % 98.0% Missing % 100.0% % 100.0% % 100.0% Total % 100.0% % 100.0% % 100.0% Source ADF&G Division of Subsistence household surveys,
61 Table 7. Population profile, Kodiak City, Alaska other residents, Male Female Total Age Number Percentage Cumulative percentage Number Percentage Cumulative percentage Number Percentage Cumulative percentage % 4.7% % 5.9% % 5.2% % 10.7% % 9.3% % 10.1% % 22.8% % 17.8% % 20.6% % 34.2% % 25.4% % 30.3% % 38.3% % 31.4% % 35.2% % 42.3% % 40.7% % 41.6% % 45.6% % 45.8% % 45.7% % 52.3% % 51.7% % 52.1% % 59.1% % 62.7% % 60.7% % 67.1% % 72.0% % 69.3% % 76.5% % 81.4% % 78.7% % 84.6% % 89.8% % 86.9% % 92.6% % 94.9% % 93.6% % 96.0% % 98.3% % 97.0% % 98.0% % 98.3% % 98.1% % 98.7% % 98.3% % 98.5% % 98.7% % 98.3% % 98.5% % 98.7% % 98.3% % 98.5% % 98.7% % 98.3% % 98.5% % 98.7% % 98.3% % 98.5% % 98.7% % 98.3% % 98.5% Missing % 100.0% % 100.0% % 100.0% Total % 100.0% % 100.0% % 100.0% Source ADF&G Division of Subsistence household surveys, 20xx. 48
62 Table 8. Population estimates, Larsen Bay, Alaska, 2010 and Census (2010) 5-year American Community Survey ( ) This study (2013) Total population Households Population Alaska Native Population Percentage 75.9% 71.6% 87.7% Sources U.S. Census Bureau (2011) for 2010 estimate; U.S. Census Bureau for American Community Survey 5-year survey estimate; and ADF&G Division of Subsistence household surveys, 2013, for 2012 estimate. Note Census estimates include Larsen Bay city 49
63 Table 9. Demographic characteristics, Larsen Bay, Alaska, Community Characteristics Larsen Bay Household size Mean 2.9 Minimum 1 Maximum 6 Age Mean 36.9 Minimum a 0 Maximum 73 Median 39 Length of residency Total population Mean 23.5 Minimum a 1 Maximum 73 Heads of household Mean 31.0 Minimum a 2 Maximum 73 Alaska Native households b Number 24.7 Percentage 95.0% Source ADF&G Division of Subsistence household surveys, a. A minimum age of 0 (zero) is used for infants who are less than 1 year of age. b. The estimated number of households in which at least 1 head of household is Alaska Native. 50
64 Table 10. Population profile, Larsen Bay, Alaska, Male Female Total Age Number Percentage Cumulative percentage Number Percentage Cumulative percentage Number Percentage Cumulative percentage % 11.4% % 3.8% % 8.2% % 17.1% % 11.5% % 14.8% % 25.7% % 15.4% % 21.3% % 34.3% % 19.2% % 27.9% % 37.1% % 30.8% % 34.4% % 40.0% % 34.6% % 37.7% % 42.9% % 38.5% % 41.0% % 51.4% % 50.0% % 50.8% % 54.3% % 57.7% % 55.7% % 62.9% % 61.5% % 62.3% % 68.6% % 65.4% % 67.2% % 82.9% % 84.6% % 83.6% % 85.7% % 92.3% % 88.5% % 91.4% % 96.2% % 93.4% % 100.0% % 96.2% % 98.4% % 100.0% % 96.2% % 98.4% % 100.0% % 96.2% % 98.4% % 100.0% % 96.2% % 98.4% % 100.0% % 96.2% % 98.4% % 100.0% % 96.2% % 98.4% % 100.0% % 96.2% % 98.4% Missing % 100.0% % 100.0% % 100.0% Total % 100.0% % 100.0% % 100.0% Source ADF&G Division of Subsistence household surveys,
65 Table 11. Population estimates, Old Harbor, Alaska, 2010 and Census (2010) 5-year American Community Survey ( ) This study (2013) Total population Households Population Alaska Native Population Percentage 89.0% 86.0% 84.7% Sources U.S. Census Bureau (2011) for 2010 estimate; U.S. Census Bureau for American Community Survey 5-year survey estimate; and ADF&G Division of Subsistence household surveys, 2013, for 2012 estimate. Note Census estimates include Old Harbor city 52
66 Table 12. Demographic characteristics, Old Harbor, Alaska, Community Characteristics Old Harbor Household size Mean 2.6 Minimum 1 Maximum 7 Age Mean 35.1 Minimum a 1 Maximum 79 Median 36 Length of residency Total population Mean 27.4 Minimum a 1 Maximum 71 Heads of household Mean 36.8 Minimum a 1 Maximum 71 Alaska Native households b Number 71.5 Percentage 91.7% Source ADF&G Division of Subsistence household surveys, a. A minimum age of 0 (zero) is used for infants who are less than 1 year of age. b. The estimated number of households in which at least 1 head of household is Alaska Native. 53
67 Table 13. Population profile, Old Harbor, Alaska, Male Female Total Age Number Percentage Cumulative percentage Number Percentage Cumulative percentage Number Percentage Cumulative percentage % 2.9% % 3.7% % 3.3% % 13.0% % 14.8% % 13.8% % 15.9% % 25.9% % 20.3% % 27.5% % 35.2% % 30.9% % 31.9% % 38.9% % 35.0% % 37.7% % 44.4% % 40.7% % 40.6% % 51.9% % 45.5% % 52.2% % 64.8% % 57.7% % 60.9% % 74.1% % 66.7% % 66.7% % 74.1% % 69.9% % 78.3% % 83.3% % 80.5% % 82.6% % 88.9% % 85.4% % 89.9% % 94.4% % 91.9% % 94.2% % 98.1% % 95.9% % 98.6% % 98.1% % 98.4% % 100.0% % 100.0% % 100.0% % 100.0% % 100.0% % 100.0% % 100.0% % 100.0% % 100.0% % 100.0% % 100.0% % 100.0% % 100.0% % 100.0% % 100.0% % 100.0% % 100.0% % 100.0% Missing % 100.0% % 100.0% % 100.0% Total % 100.0% % 100.0% % 100.0% Source ADF&G Division of Subsistence household surveys,
68 Table 14. Reported harvests and uses of salmon, Kodiak road system permit holders, Percentage of households Harvest weight (lb) Harvest amount a Use Attempt Harvest Receive Give Mean per Per Mean per Resource % % % % % Total household capita Total Unit household Salmon , ,274.2 Ind Chum salmon Ind. 0.2 Coho salmon , Ind. 9.9 Chinook salmon , Ind. 2.6 Pink salmon Ind. 1.9 Sockeye salmon , ,966.4 Ind Unknown salmon Ind. 0.0 Source ADF&G Division of Subsistence household surveys, a. Summary rows that include incompatible units of measure have been left blank. 55 Table 15. Reported harvests and uses of salmon, Kodiak road system other residents, Percentage of households Harvest weight (lb) Harvest amount a Resource Use % Attempt % Harvest % Receive % Give % Total Mean per household Per capita Total Unit Mean per household Salmon , ,366.8 Ind Chum salmon Ind. 0.2 Coho salmon , Ind. 4.5 Chinook salmon Ind. 1.3 Pink salmon Ind. 2.1 Sockeye salmon , ,372.9 Ind Unknown salmon Ind. 0.0 Source ADF&G Division of Subsistence household surveys, a. Summary rows that include incompatible units of measure have been left blank.
69 Table 16. Estimated percentages of salmon harvested by gear type, resource, and total salmon harvest, Kodiak road system permit holders, Subsistence methods Percentage Removed from commercial catch Gillnet or seine Seine Other Subsistence gear, any method Rod and Reel Dipnet Any method Resource base Number Pounds Number Pounds Number Pounds Number Pounds Number Pounds Number Pounds Number Pounds Number Pounds Salmon Gear type 100.0% 100.0% 100.0% 100.0% 100.0% 100.0% 100.0% 100.0% 100.0% 100.0% 100.0% 100.0% 100.0% 100.0% 100.0% 100.0% Resource 16.9% 17.2% 48.2% 46.1% 0.7% 0.5% 3.0% 3.5% 51.9% 50.1% 30.6% 32.0% 0.7% 0.7% 100.0% 100.0% Total 16.9% 17.2% 48.2% 46.1% 0.7% 0.5% 3.0% 3.5% 51.9% 50.1% 30.6% 32.0% 0.7% 0.7% 100.0% 100.0% Chum salmon Gear type 0.0% 0.0% 0.5% 0.7% 13.8% 23.2% 0.0% 0.0% 0.6% 0.9% 0.5% 0.6% 0.0% 0.0% 0.5% 0.6% Resource 0.0% 0.0% 50.0% 50.0% 20.0% 20.0% 0.0% 0.0% 70.0% 70.0% 30.0% 30.0% 0.0% 0.0% 100.0% 100.0% Total 0.0% 0.0% 0.2% 0.3% 0.1% 0.1% 0.0% 0.0% 0.3% 0.4% 0.1% 0.2% 0.0% 0.0% 0.5% 0.6% Coho salmon Gear type 22.6% 26.6% 5.1% 6.4% 13.7% 20.7% 40.4% 42.0% 7.3% 9.0% 42.6% 48.7% 13.7% 16.8% 20.7% 24.8% Resource 18.4% 18.4% 11.8% 11.8% 0.5% 0.5% 5.9% 5.9% 18.2% 18.2% 62.9% 62.9% 0.5% 0.5% 100.0% 100.0% Total 3.8% 4.6% 2.4% 2.9% 0.1% 0.1% 1.2% 1.5% 3.8% 4.5% 13.0% 15.6% 0.1% 0.1% 20.7% 24.8% Chinook salmon Gear type 8.0% 9.6% 0.2% 0.2% 0.0% 0.0% 46.3% 49.0% 2.9% 3.6% 8.7% 10.1% 0.0% 0.0% 5.5% 6.7% Resource 24.7% 24.7% 1.7% 1.7% 0.0% 0.0% 25.5% 25.5% 27.2% 27.2% 48.1% 48.1% 0.0% 0.0% 100.0% 100.0% Total 1.4% 1.7% 0.1% 0.1% 0.0% 0.0% 1.4% 1.7% 1.5% 1.8% 2.6% 3.2% 0.0% 0.0% 5.5% 6.7% Pink salmon Gear type 1.4% 0.8% 0.9% 0.6% 69.0% 52.0% 6.2% 3.2% 2.1% 1.3% 8.6% 4.9% 0.0% 0.0% 4.0% 2.4% Resource 5.9% 5.9% 11.3% 11.3% 11.8% 11.8% 4.7% 4.7% 27.8% 27.8% 66.2% 66.2% 0.0% 0.0% 100.0% 100.0% Total 0.2% 0.1% 0.4% 0.3% 0.5% 0.3% 0.2% 0.1% 1.1% 0.7% 2.6% 1.6% 0.0% 0.0% 4.0% 2.4% Sockeye salmon Gear type 68.0% 63.0% 93.3% 92.1% 3.5% 4.1% 7.1% 5.8% 87.1% 85.2% 39.7% 35.8% 86.3% 83.2% 69.4% 65.5% Resource 16.5% 16.5% 64.8% 64.8% 0.0% 0.0% 0.3% 0.3% 65.1% 65.1% 17.5% 17.5% 0.8% 0.8% 100.0% 100.0% Total 11.5% 10.8% 45.0% 42.5% 0.0% 0.0% 0.2% 0.2% 45.2% 42.7% 12.1% 11.5% 0.6% 0.6% 69.4% 65.5% Unknown salmon Gear type 0.0% 0.0% 0.0% 0.0% 0.0% 0.0% 0.0% 0.0% 0.0% 0.0% 0.0% 0.0% 0.0% 0.0% 0.0% 0.0% Resource 0.0% 0.0% 0.0% 0.0% 0.0% 0.0% 0.0% 0.0% 0.0% 0.0% 0.0% 0.0% 0.0% 0.0% 0.0% 0.0% Total 0.0% 0.0% 0.0% 0.0% 0.0% 0.0% 0.0% 0.0% 0.0% 0.0% 0.0% 0.0% 0.0% 0.0% 0.0% 0.0% Source ADF&G Division of Subsistence household surveys, 2014.
70 Table 17. Estimated percentages of salmon harvested by gear type, resource, and total salmon harvest, Kodiak road system other residents, Subsistence methods Percentage Removed from commercial catch Gillnet or seine Seine Other Subsistence gear, any method Rod and Reel Dipnet Any method Resource base Number Pounds Number Pounds Number Pounds Number Pounds Number Pounds Number Pounds Number Pounds Number Pounds Salmon Gear type 100.0% 100.0% 100.0% 100.0% 100.0% 100.0% 100.0% 100.0% 100.0% 100.0% 100.0% 100.0% 100.0% 100.0% 100.0% 100.0% Resource 19.9% 20.1% 21.1% 20.8% 1.6% 1.5% 0.1% 0.2% 22.9% 22.5% 56.6% 56.8% 0.6% 0.6% 100.0% 100.0% Total 19.9% 20.1% 21.1% 20.8% 1.6% 1.5% 0.1% 0.2% 22.9% 22.5% 56.6% 56.8% 0.6% 0.6% 100.0% 100.0% Chum salmon Gear type 4.7% 6.3% 0.2% 0.3% 0.0% 0.0% 0.0% 0.0% 0.2% 0.3% 0.1% 0.2% 0.0% 0.0% 1.1% 1.4% Resource 88.0% 88.0% 4.0% 4.0% 0.0% 0.0% 0.0% 0.0% 4.0% 4.0% 8.0% 8.0% 0.0% 0.0% 100.0% 100.0% Total 0.9% 1.3% 0.0% 0.1% 0.0% 0.0% 0.0% 0.0% 0.0% 0.1% 0.1% 0.1% 0.0% 0.0% 1.1% 1.4% Coho salmon Gear type 5.1% 6.1% 10.6% 13.0% 0.0% 0.0% 100.0% 100.0% 10.4% 12.7% 35.0% 42.3% 0.0% 0.0% 23.2% 28.1% Resource 4.4% 4.4% 9.7% 9.7% 0.0% 0.0% 0.5% 0.5% 10.2% 10.2% 85.4% 85.4% 0.0% 0.0% 100.0% 100.0% Total 1.0% 1.2% 2.2% 2.7% 0.0% 0.0% 0.1% 0.2% 2.4% 2.9% 19.8% 24.0% 0.0% 0.0% 23.2% 28.1% Chinook salmon Gear type 14.9% 18.2% 0.6% 0.8% 0.0% 0.0% 0.0% 0.0% 0.6% 0.7% 6.6% 8.0% 0.0% 0.0% 6.8% 8.4% Resource 43.6% 43.6% 1.9% 1.9% 0.0% 0.0% 0.0% 0.0% 1.9% 1.9% 54.5% 54.5% 0.0% 0.0% 100.0% 100.0% Total 3.0% 3.7% 0.1% 0.2% 0.0% 0.0% 0.0% 0.0% 0.1% 0.2% 3.7% 4.6% 0.0% 0.0% 6.8% 8.4% Pink salmon Gear type 5.7% 3.4% 0.0% 0.0% 0.0% 0.0% 0.0% 0.0% 0.0% 0.0% 17.3% 10.5% 0.0% 0.0% 10.9% 6.6% Resource 10.4% 10.4% 0.0% 0.0% 0.0% 0.0% 0.0% 0.0% 0.0% 0.0% 89.6% 89.6% 0.0% 0.0% 100.0% 100.0% Total 1.1% 0.7% 0.0% 0.0% 0.0% 0.0% 0.0% 0.0% 0.0% 0.0% 9.8% 5.9% 0.0% 0.0% 10.9% 6.6% Sockeye salmon Gear type 69.7% 66.0% 88.6% 85.9% 100.0% 100.0% 0.0% 0.0% 88.9% 86.3% 40.9% 39.0% 100.0% 100.0% 58.0% 55.4% Resource 24.0% 24.0% 32.3% 32.3% 2.8% 2.8% 0.0% 0.0% 35.0% 35.0% 39.9% 39.9% 1.1% 1.1% 100.0% 100.0% Total 13.9% 13.3% 18.7% 17.9% 1.6% 1.5% 0.0% 0.0% 20.3% 19.4% 23.1% 22.1% 0.6% 0.6% 58.0% 55.4% Unknown salmon Gear type 0.0% 0.0% 0.0% 0.0% 0.0% 0.0% 0.0% 0.0% 0.0% 0.0% 0.0% 0.0% 0.0% 0.0% 0.0% 0.0% Resource 0.0% 0.0% 0.0% 0.0% 0.0% 0.0% 0.0% 0.0% 0.0% 0.0% 0.0% 0.0% 0.0% 0.0% 0.0% 0.0% Total 0.0% 0.0% 0.0% 0.0% 0.0% 0.0% 0.0% 0.0% 0.0% 0.0% 0.0% 0.0% 0.0% 0.0% 0.0% 0.0% Source ADF&G Division of Subsistence household surveys, 2014.
71 Table 18. Percentage of households using geartype to harvest salmon by gear type, Kodiak road system permit holders, Alaska, Commercial Harvest Subsistence Net Rod & Reel Other method Total harvest Resource No. % No. % No. % No. % No. % Salmon Chum salmon Coho salmon Chinook salmon Pink salmon Sockeye salmon Unknown salmon All resources Source ADF&G Division of Subsistence household surveys, Table 19. Percentage of households using geartype to harvest salmon by gear type, Kodiak road system other residents, Alaska, Commercial Harvest Subsistence Net Rod & Reel Other method Total harvest Resource No. % No. % No. % No. % No. % Salmon Chum salmon Coho salmon Chinook salmon Pink salmon Sockeye salmon Unknown salmon Source ADF&G Division of Subsistence household surveys, 2013.
72 Table 20. Kodiak road system: number of permits issued and returned, and reported salmon harvests by species, Number of permits Reported harvests Year Issued Returned Chinook Sockeye Coho Chum Pink Total ,613 4, ,407 15, ,958 4, ,441 14, ,431 3, , ,327 3, ,043 15, ,183 3, , ,270 3, , ,549 5, , ,670 3, , , ,940 4, , ,822 3, , , ,219 3, , , ,715 4, ,001 31, ,885 3, ,011 19, , ,974 3, , , ,273 3, , , ,069 3, , , ,133 3, , , ,292 3, , , ,411 3, , , ,921 4, , , ,860 3, , , ,844 2, , , ,994 2, , , ,974 2, , , ,372 2, , , ,232 1, , , ,436 1, , , ,155 1, ,402 5-year average , ,034 1, , year average , ,520 2, ,212 Historical average , ,804 3, , Source ASFDB Note Blank cells indicate data not available. 59
73 Table 21. Changes in household uses of resources compared to recent years, Kodiak road system, Households reporting use Households not Sampled Valid Total households Less Same More using Resource category households responses a Number Percentage Number Percentage Number Percentage Number Percentage Number Percentage Permit holders % % % % 0 0.0% Other residents % % % % % Source ADF&G Division of Subsistence household surveys, a. Valid responses do not include households that did not provide any response. Table 22. Reasons for less household uses of salmon compared to recent years, Kodiak road system, Resource category Valid responses a Households reporting reasons for less use Family/ Resources less Weather/ personal available Too far to travel Lack of equipment Less sharing Lack of effort Unsuccessful environment Number Percentage Number Percentage Number Percentage Number Percentage Number Percentage Number Percentage Number Percentage Number Percentage 60 Table 22. Continued. Permit holders % 3 10% 0 0.0% 3 10% 0 0% 2 7% % % Other residents % 7 13% 0 0.0% 3 6% 7 13% 11 20% 5 9.3% 3 5.6% -continued- Households reporting Working/ Small/ Equipment/ Used other Valid reasons for Other reasons no time Regulations diseased animals Did not get enough Did not need fuel expense resources Resource category responses a less use Number Percentage Number Percentage Number Percentage Number Percentage Number Percentage Number Percentage Number Percentage Number Percentage Permit holders % % 0 0.0% 0 0.0% 0 0.0% % 0 0.0% 0 0.0% Other residents % % 0 0.0% 0 0.0% 2 3.7% % 0 0.0% 0 0.0% Source ADF&G Division of Subsistence household surveys, a. Valid responses do not include households that did not provide any response and households reporting never using the resource.
74 Table 23. Reasons for more household uses of salmon compared to recent years, Kodiak road system, Valid responses a Households reporting reasons for more use Increased availability Used other resources Favorable weather Needed more Increased effort Had more help Resource category Number Percentage Number Percentage Number Percentage Number Percentage Number Percentage Number Percentage Number Percentage Permit holders % 0 0.0% 0 0.0% 1 7.1% % % % Other residents % 1 5.9% 0 0.0% % % % 0 0.0% Received more 61 -continued- Table 23. Continued. Households reporting Store-bought Got/ Valid reasons for Other Regulations Traveled farther M ore success Needed less expense fixed equipment Resource category responses a more use Number Percentage Number Percentage Number Percentage Number Percentage Number Percentage Number Percentage Number Percentage Permit holders % 0 0.0% 0 0.0% % 0 0.0% 1 7.1% 0 0.0% Other residents % 0 0.0% 0 0.0% % 0 0.0% 0 0.0% 0 0.0% Source ADF&G Division of Subsistence household surveys, a. Valid responses do not include households that did not provide any response and households reporting never use. Table 24. Resources households reporteded needing more of, Kodiak road system, Permit holders Other residents Resource Households needing Percentage of households Households needing Percentage of households Salmon 5 1.9% 4 1.1% Chum salmon 1 0.4% 0 0 Coho salmon 8 3.0% % Chinook salmon 7 2.6% % Pink salmon 0 0.0% 1 0.3% Sockeye salmon % % Source ADF&G Division of Subsistence household surveys, 2013.
75 Table 25. Reported impact to households reporting that they did not get enough salmon, Kodiak road system, Households not getting enough. Impact to those not getting enough. Sample Valid responses a Did not get enough No response Not noticeable Minor Major Severe Resource category households Number Percentage Number Percentage Number Percentage Number Percentage Number Percentage Number Percentage Number Percentage Permit holders % % 2 6.1% 0 0.0% % % % Other residents % % 3 7.3% 0 0.0% % % 4 9.8% Source ADF&G Division of Subsistence household surveys, a. Includes households failing to respond to the question and those households that never used the resource. Table 26. Things households reported doing differently as the result of not getting enough of a resource, Kodiak road system, Replaced with Used more other subsistence Asked others for Valid Bought/bartered commercial foods foods help Made do without Resource category responses a Number Percentage Number Percentage Number Percentage Number Percentage Number Percentage Salmon % % % 0 0.0% % -continued- Table 26. Continued. Increased effort to Obtained food from Got public Valid harvest Worked more other sources assistance Other reasons Resource category responses a Number Percentage Number Percentage Number Percentage Number Percentage Number Percentage Salmon % 0 0.0% 0 0.0% 0 0.0% 1 3.8% Source ADF&G Division of Subsistence household surveys, 20xx. a. Includes households failing to respond to the question and those households that never used the resource.
76 Table 27. Estimated harvest of salmon by gear and location, Kodiak City permit holders, Chum salmon Number of Commercial gear gillnet Subsistence methods Seine Other Methods Subsistence gear, any method Rod and Reel Dipnet Total Location households a Number Pounds Number Pounds Number Pounds Number Pounds Number Pounds Number Pounds Number Pounds Number Pounds Total harvest All subsistence fishing locations Buskin area Chiniak area Kalsin area Spruce Island Womens Bay continued- 63
77 64 Table 27. Page 2 of 5 Coho salmon Subsistence methods Subsistence gear, Number of Commercial gear gillnet Seine Other Methods any method Rod and Reel Dipnet Total Location households a Number Pounds Number Pounds Number Pounds Number Pounds Number Pounds Number Pounds Number Pounds Number Pounds Total harvest , ,614.2 All subsistence fishing locations , ,763.4 Unknown American River Big bay Bouy Buskin area Chiniak area Danger Bay Dog Salmon Creek Kalsin area Karluk area Kupreanof area Lake Myam Little waterfall Lituik Long Island Mill Bay Mission Bay Monashka Moser Bay Myan Olds River Olga Bay Paramanof area Pasagshak Pauls Bay Pillar Creek Portage Roslyn Creek Saltery area Sand Point area Ugak Island Uganik Womens Bay Commercial fishery continued-
78 65 Table 27. Page 3 of 5 Chinook salmon Subsistence methods Subsistence gear, Number of Commercial gear gillnet Seine Other Methods any method Rod and Reel Dipnet Total Location householdsa Number Pounds Number Pounds Number Pounds Number Pounds Number Pounds Number Pounds Number Pounds Number Pounds Total harvest ,247.0 All subsistence fishing locations Unknown American River Bouy Buskin area Chiniak area Long Island Marmot Bay Monashka Narrow Strait Olds River Pasagshak Port Lions area Ugak Island Womens Bay Commercial fishery continued-
79 66 Table 27. Page 4 of 5 Pink salmon Subsistence methods Subsistence gear, Number of Commercial gear gillnet Seine Other Methods any method Rod and Reel Dipnet Total Location householdsa Number Pounds Number Pounds Number Pounds Number Pounds Number Pounds Number Pounds Number Pounds Number Pounds Total harvest All subsistence fishing 21 locations Unknown American River Bouy Buskin area Chiniak area Kalsin area Long Island Middle Bay Mill Bay Olds River Pasagshak Port Lions area Roslyn Creek Russian River Saltery area Womens Bay Commercial fishery continued-
80 67 Table 27. Page 5 of 5 Sockeye salmon Subsistence methods Subsistence gear, Number of Commercial gear gillnet Seine Other Methods any method Rod and Reel Dipnet Total Location householdsa Number Pounds Number Pounds Number Pounds Number Pounds Number Pounds Number Pounds Number Pounds Number Pounds Total harvest , , , , , , , ,205.0 All subsistence fishing 62 locations , , , , , , ,188.9 Unknown Afognak area Bristol bay Buskin area , , ,682.8 Chiniak area Kupreanof area Letnik Lipsett Little waterfall Lituik Marmot Bay Moser Bay Mossel Bay Olds River Olga Bay Ouzinkie area Pasagshak , , ,931.1 Pauls Bay Port Lions area , , ,394.6 Saltery area Spruce Island Waterfall Bay Commercial fishery , ,016.1 Source ADF&G Division of subsistence household surveys, 2012.
81 Table 28. Percentage of harvest from location of salmon by gear, Kodiak permit holders, Chum salmon Subsistence methods Percentage of Commercial gear gillnet Seine Other Methods Subsistence gear, any method Rod and Reel Dipnet Total Location households a Number Pounds Number Pounds Number Pounds Number Pounds Number Pounds Number Pounds Number Pounds Number Pounds Total harvest 0% 0% 100% 100% 100% 100% 0% 0% 100% 100% 100% 100% 0% 0% 100% 100% All subsistence fishing locations 5.6% 0% 0% 100% 100% 100% 100% 0% 0% 100% 100% 100% 100% 0% 0% 100% 100% Buskin area 2.2% 0% 0% 80% 80% 0% 0% 0% 0% 57% 57% 0% 0% 0% 0% 40% 40% Chiniak area 1.1% 0% 0% 0% 0% 0% 0% 0% 0% 0% 0% 50% 50% 0% 0% 15% 15% Kalsin area 1.1% 0% 0% 0% 0% 0% 0% 0% 0% 0% 0% 50% 50% 0% 0% 15% 15% Spruce Island 1.1% 0% 0% 0% 0% 100% 100% 0% 0% 29% 29% 0% 0% 0% 0% 20% 20% Womens Bay 1.1% 0% 0% 20% 20% 0% 0% 0% 0% 14% 14% 0% 0% 0% 0% 10% 10% -continued- 68
82 69 Table 28. Page 2 of 5 Coho salmon Subsistence methods Percentage of Commercial gear gillnet Seine Other Methods Subsistence gear, any method Rod and Reel Dipnet Total Location households a Number Pounds Number Pounds Number Pounds Number Pounds Number Pounds Number Pounds Number Pounds Number Pounds Total harvest 100.0% 100.0% 100.0% 100.0% 100.0% 100.0% 100.0% 100.0% 100.0% 100.0% 100.0% 100.0% 100.0% 100.0% 100.0% 100.0% All subsistence fishing locations 56.2% 0.0% 0.0% 100.0% 100.0% 100.0% 100.0% 100.0% 100.0% 100.0% 100.0% 100.0% 100.0% 100.0% 100.0% 81.6% 81.6% Unknown 4.5% 0.0% 0.0% 0.0% 0.0% 0.0% 0.0% 0.0% 0.0% 0.0% 0.0% 2.2% 2.2% 0.0% 0.0% 1.4% 1.4% American River 5.6% 0.0% 0.0% 0.0% 0.0% 0.0% 0.0% 0.0% 0.0% 0.0% 0.0% 2.0% 2.0% 0.0% 0.0% 1.2% 1.2% Big bay 1.1% 0.0% 0.0% 0.0% 0.0% 0.0% 0.0% 0.0% 0.0% 0.0% 0.0% 1.1% 1.1% 0.0% 0.0% 0.7% 0.7% Bouy 4 6.7% 0.0% 0.0% 0.0% 0.0% 0.0% 0.0% 0.0% 0.0% 0.0% 0.0% 13.5% 13.5% 0.0% 0.0% 8.5% 8.5% Buskin area 20.2% 0.0% 0.0% 63.1% 63.1% 0.0% 0.0% 0.0% 0.0% 41.0% 41.0% 20.7% 20.7% 0.0% 0.0% 20.5% 20.5% Chiniak area 7.9% 0.0% 0.0% 0.0% 0.0% 0.0% 0.0% 57.4% 57.4% 18.6% 18.6% 12.9% 12.9% 0.0% 0.0% 11.5% 11.5% Danger Bay 1.1% 0.0% 0.0% 0.0% 0.0% 0.0% 0.0% 0.0% 0.0% 0.0% 0.0% 1.8% 1.8% 0.0% 0.0% 1.1% 1.1% Dog Salmon Creek 1.1% 0.0% 0.0% 0.0% 0.0% 0.0% 0.0% 19.1% 19.1% 6.2% 6.2% 0.0% 0.0% 0.0% 0.0% 1.1% 1.1% Kalsin area 3.4% 0.0% 0.0% 7.6% 7.6% 0.0% 0.0% 0.0% 0.0% 5.0% 5.0% 3.4% 3.4% 0.0% 0.0% 3.1% 3.1% Karluk area 1.1% 0.0% 0.0% 0.0% 0.0% 0.0% 0.0% 0.0% 0.0% 0.0% 0.0% 1.3% 1.3% 0.0% 0.0% 0.8% 0.8% Kupreanof area 1.1% 0.0% 0.0% 11.5% 11.5% 0.0% 0.0% 0.0% 0.0% 7.5% 7.5% 0.0% 0.0% 0.0% 0.0% 1.4% 1.4% Lake Myam 1.1% 0.0% 0.0% 0.0% 0.0% 0.0% 0.0% 0.0% 0.0% 0.0% 0.0% 0.9% 0.9% 0.0% 0.0% 0.6% 0.6% Little waterfall 1.1% 0.0% 0.0% 1.0% 1.0% 0.0% 0.0% 0.0% 0.0% 0.6% 0.6% 0.0% 0.0% 0.0% 0.0% 0.1% 0.1% Lituik 1.1% 0.0% 0.0% 0.0% 0.0% 0.0% 0.0% 0.0% 0.0% 0.0% 0.0% 0.9% 0.9% 0.0% 0.0% 0.6% 0.6% Long Island 2.2% 0.0% 0.0% 0.0% 0.0% 0.0% 0.0% 0.0% 0.0% 0.0% 0.0% 0.9% 0.9% 0.0% 0.0% 0.6% 0.6% Mill Bay 1.1% 0.0% 0.0% 0.0% 0.0% 0.0% 0.0% 0.0% 0.0% 0.0% 0.0% 0.9% 0.9% 0.0% 0.0% 0.6% 0.6% Mission Bay 1.1% 0.0% 0.0% 0.0% 0.0% 0.0% 0.0% 0.0% 0.0% 0.0% 0.0% 0.0% 0.0% 0.0% 0.0% 0.0% 0.0% Monashka 1.1% 0.0% 0.0% 0.0% 0.0% 0.0% 0.0% 0.0% 0.0% 0.0% 0.0% 1.4% 1.4% 0.0% 0.0% 0.9% 0.9% Moser Bay 1.1% 0.0% 0.0% 9.6% 9.6% 0.0% 0.0% 0.0% 0.0% 6.2% 6.2% 0.4% 0.4% 0.0% 0.0% 1.4% 1.4% Myan 1.1% 0.0% 0.0% 0.0% 0.0% 0.0% 0.0% 0.0% 0.0% 0.0% 0.0% 1.8% 1.8% 0.0% 0.0% 1.1% 1.1% Olds River 5.6% 0.0% 0.0% 0.6% 0.6% 100.0% 100.0% 0.6% 0.6% 3.0% 3.0% 2.5% 2.5% 100.0% 100.0% 2.6% 2.6% Olga Bay 2.2% 0.0% 0.0% 0.0% 0.0% 0.0% 0.0% 19.1% 19.1% 6.2% 6.2% 2.7% 2.7% 0.0% 0.0% 2.8% 2.8% Paramanof area 1.1% 0.0% 0.0% 0.0% 0.0% 0.0% 0.0% 0.0% 0.0% 0.0% 0.0% 0.7% 0.7% 0.0% 0.0% 0.5% 0.5% Pasagshak 7.9% 0.0% 0.0% 1.9% 1.9% 0.0% 0.0% 0.0% 0.0% 1.2% 1.2% 9.2% 9.2% 0.0% 0.0% 6.0% 6.0% Pauls Bay 2.2% 0.0% 0.0% 1.9% 1.9% 0.0% 0.0% 0.0% 0.0% 1.2% 1.2% 0.9% 0.9% 0.0% 0.0% 0.8% 0.8% Pillar Creek 4.5% 0.0% 0.0% 0.0% 0.0% 0.0% 0.0% 0.0% 0.0% 0.0% 0.0% 1.4% 1.4% 0.0% 0.0% 0.9% 0.9% Portage 1.1% 0.0% 0.0% 0.0% 0.0% 0.0% 0.0% 0.0% 0.0% 0.0% 0.0% 0.2% 0.2% 0.0% 0.0% 0.1% 0.1% Roslyn Creek 1.1% 0.0% 0.0% 0.0% 0.0% 0.0% 0.0% 0.0% 0.0% 0.0% 0.0% 0.2% 0.2% 0.0% 0.0% 0.1% 0.1% Saltery area 3.4% 0.0% 0.0% 0.0% 0.0% 0.0% 0.0% 0.0% 0.0% 0.0% 0.0% 13.5% 13.5% 0.0% 0.0% 8.5% 8.5% Sand Point area 1.1% 0.0% 0.0% 0.0% 0.0% 0.0% 0.0% 0.0% 0.0% 0.0% 0.0% 0.2% 0.2% 0.0% 0.0% 0.1% 0.1% Ugak Island 1.1% 0.0% 0.0% 0.0% 0.0% 0.0% 0.0% 0.0% 0.0% 0.0% 0.0% 1.8% 1.8% 0.0% 0.0% 1.1% 1.1% Uganik 1.1% 0.0% 0.0% 0.0% 0.0% 0.0% 0.0% 0.0% 0.0% 0.0% 0.0% 0.5% 0.5% 0.0% 0.0% 0.3% 0.3% Womens Bay 3.4% 0.0% 0.0% 2.9% 2.9% 0.0% 0.0% 3.8% 3.8% 3.1% 3.1% 0.2% 0.2% 0.0% 0.0% 0.7% 0.7% Commercial fishery 7.9% 100.0% 100.0% 0.0% 0.0% 0.0% 0.0% 0.0% 0.0% 0.0% 0.0% 0.0% 0.0% 0.0% 0.0% 18.4% 18.4% -continued-
83 70 Table 28. Page 3 of 5 Commercial gear gillnet Seine Other Methods Chinook salmon Subsistence methods Percentage of Subsistence gear, any method Rod and Reel Dipnet Total Location households a Number Pounds Number Pounds Number Pounds Number Pounds Number Pounds Number Pounds Number Pounds Number Pounds Total harvest 100.0% 100.0% 100.0% 100.0% 0.0% 0.0% 100.0% 100.0% 100.0% 100.0% 100.0% 100.0% 0.0% 0.0% 100.0% 100.0% All subsistence fishing locations 30.3% 0.0% 0.0% 100.0% 100.0% 0.0% 0.0% 100.0% 100.0% 100.0% 100.0% 100.0% 100.0% 0.0% 0.0% 75.3% 75.3% Unknown 2.2% 0.0% 0.0% 0.0% 0.0% 0.0% 0.0% 0.0% 0.0% 0.0% 0.0% 0.9% 0.9% 0.0% 0.0% 0.4% 0.4% American River 3.4% 0.0% 0.0% 0.0% 0.0% 0.0% 0.0% 0.0% 0.0% 0.0% 0.0% 5.3% 5.3% 0.0% 0.0% 2.6% 2.6% Bouy 4 9.0% 0.0% 0.0% 0.0% 0.0% 0.0% 0.0% 0.0% 0.0% 0.0% 0.0% 36.3% 36.3% 0.0% 0.0% 17.4% 17.4% Buskin area 1.1% 0.0% 0.0% 0.0% 0.0% 0.0% 0.0% 0.0% 0.0% 0.0% 0.0% 0.9% 0.9% 0.0% 0.0% 0.4% 0.4% Chiniak area 7.9% 0.0% 0.0% 0.0% 0.0% 0.0% 0.0% 51.7% 51.7% 48.4% 48.4% 38.1% 38.1% 0.0% 0.0% 31.5% 31.5% Long Island 2.2% 0.0% 0.0% 0.0% 0.0% 0.0% 0.0% 3.3% 3.3% 3.1% 3.1% 0.9% 0.9% 0.0% 0.0% 1.3% 1.3% Marmot Bay 1.1% 0.0% 0.0% 0.0% 0.0% 0.0% 0.0% 0.0% 0.0% 0.0% 0.0% 0.0% 0.0% 0.0% 0.0% 0.0% 0.0% Monashka 1.1% 0.0% 0.0% 50.0% 50.0% 0.0% 0.0% 0.0% 0.0% 3.1% 3.1% 0.0% 0.0% 0.0% 0.0% 0.9% 0.9% Narrow Strait 1.1% 0.0% 0.0% 0.0% 0.0% 0.0% 0.0% 10.0% 10.0% 9.4% 9.4% 0.0% 0.0% 0.0% 0.0% 2.6% 2.6% Olds River 2.2% 0.0% 0.0% 0.0% 0.0% 0.0% 0.0% 0.0% 0.0% 0.0% 0.0% 8.8% 8.8% 0.0% 0.0% 4.3% 4.3% Pasagshak 3.4% 0.0% 0.0% 50.0% 50.0% 0.0% 0.0% 0.0% 0.0% 3.1% 3.1% 2.7% 2.7% 0.0% 0.0% 2.1% 2.1% Port Lions area 1.1% 0.0% 0.0% 0.0% 0.0% 0.0% 0.0% 0.0% 0.0% 0.0% 0.0% 0.9% 0.9% 0.0% 0.0% 0.4% 0.4% Ugak Island 1.1% 0.0% 0.0% 0.0% 0.0% 0.0% 0.0% 0.0% 0.0% 0.0% 0.0% 5.3% 5.3% 0.0% 0.0% 2.6% 2.6% Womens Bay 2.2% 0.0% 0.0% 0.0% 0.0% 0.0% 0.0% 35.0% 35.0% 32.8% 32.8% 0.0% 0.0% 0.0% 0.0% 8.9% 8.9% Commercial fishery 10.1% 100.0% 100.0% 0.0% 0.0% 0.0% 0.0% 0.0% 0.0% 0.0% 0.0% 0.0% 0.0% 0.0% 0.0% 24.7% 24.7% -continued-
84 71 Table 28. Page 4 of 5 Pink salmon Subsistence methods Percentage of Commercial gear gillnet Seine Other Methods Subsistence gear, any method Rod and Reel Dipnet Total Location households a Number Pounds Number Pounds Number Pounds Number Pounds Number Pounds Number Pounds Number Pounds Number Pounds Total harvest 100.0% 100.0% 100.0% 100.0% 100.0% 100.0% 100.0% 100.0% 100.0% 100.0% 100.0% 100.0% 0.0% 0.0% 100.0% 100.0% All subsistence fishing locations 23.6% 0.0% 0.0% 100.0% 100.0% 100.0% 100.0% 100.0% 100.0% 100.0% 100.0% 100.0% 100.0% 0.0% 0.0% 94.1% 94.1% Unknown 2.2% 0.0% 0.0% 15.8% 15.8% 0.0% 0.0% 0.0% 0.0% 6.4% 6.4% 4.5% 4.5% 0.0% 0.0% 4.7% 4.7% American River 2.2% 0.0% 0.0% 0.0% 0.0% 0.0% 0.0% 0.0% 0.0% 0.0% 0.0% 9.8% 9.8% 0.0% 0.0% 6.5% 6.5% Bouy 4 1.1% 0.0% 0.0% 0.0% 0.0% 0.0% 0.0% 0.0% 0.0% 0.0% 0.0% 2.7% 2.7% 0.0% 0.0% 1.8% 1.8% Buskin area 4.5% 0.0% 0.0% 36.8% 36.8% 0.0% 0.0% 0.0% 0.0% 14.9% 14.9% 3.9% 3.9% 0.0% 0.0% 6.8% 6.8% Chiniak area 5.6% 0.0% 0.0% 0.0% 0.0% 100.0% 100.0% 100.0% 100.0% 59.6% 59.6% 17.9% 17.9% 0.0% 0.0% 28.4% 28.4% Kalsin area 3.4% 0.0% 0.0% 0.0% 0.0% 0.0% 0.0% 0.0% 0.0% 0.0% 0.0% 20.6% 20.6% 0.0% 0.0% 13.6% 13.6% Long Island 1.1% 0.0% 0.0% 0.0% 0.0% 0.0% 0.0% 0.0% 0.0% 0.0% 0.0% 2.7% 2.7% 0.0% 0.0% 1.8% 1.8% Middle Bay 1.1% 0.0% 0.0% 0.0% 0.0% 0.0% 0.0% 0.0% 0.0% 0.0% 0.0% 4.5% 4.5% 0.0% 0.0% 3.0% 3.0% Mill Bay 1.1% 0.0% 0.0% 0.0% 0.0% 0.0% 0.0% 0.0% 0.0% 0.0% 0.0% 2.7% 2.7% 0.0% 0.0% 1.8% 1.8% Olds River 1.1% 0.0% 0.0% 0.0% 0.0% 0.0% 0.0% 0.0% 0.0% 0.0% 0.0% 0.9% 0.9% 0.0% 0.0% 0.6% 0.6% Pasagshak 1.1% 0.0% 0.0% 0.0% 0.0% 0.0% 0.0% 0.0% 0.0% 0.0% 0.0% 3.6% 3.6% 0.0% 0.0% 2.4% 2.4% Port Lions area 1.1% 0.0% 0.0% 26.3% 26.3% 0.0% 0.0% 0.0% 0.0% 10.6% 10.6% 0.0% 0.0% 0.0% 0.0% 3.0% 3.0% Roslyn Creek 1.1% 0.0% 0.0% 0.0% 0.0% 0.0% 0.0% 0.0% 0.0% 0.0% 0.0% 0.9% 0.9% 0.0% 0.0% 0.6% 0.6% Russian River 1.1% 0.0% 0.0% 0.0% 0.0% 0.0% 0.0% 0.0% 0.0% 0.0% 0.0% 8.9% 8.9% 0.0% 0.0% 5.9% 5.9% Saltery area 2.2% 0.0% 0.0% 0.0% 0.0% 0.0% 0.0% 0.0% 0.0% 0.0% 0.0% 3.9% 3.9% 0.0% 0.0% 2.6% 2.6% Womens Bay 2.2% 0.0% 0.0% 21.1% 21.1% 0.0% 0.0% 0.0% 0.0% 8.5% 8.5% 12.5% 12.5% 0.0% 0.0% 10.7% 10.7% Commercial fishery 1.1% 100.0% 100.0% 0.0% 0.0% 0.0% 0.0% 0.0% 0.0% 0.0% 0.0% 0.0% 0.0% 0.0% 0.0% 5.9% 5.9% -continued-
85 72 Table 28. Page 5 of 5 Commercial gear gillnet Seine Other Methods Sockeye salmon Subsistence methods Percentage of Subsistence gear, any method Rod and Reel Dipnet Total Location households a Number Pounds Number Pounds Number Pounds Number Pounds Number Pounds Number Pounds Number Pounds Number Pounds Total harvest 100.0% 100.0% 100.0% 100.0% 100.0% 100.0% 100.0% 100.0% 100.0% 100.0% 100.0% 100.0% 100.0% 100.0% 100.0% 100.0% All subsistence fishing locations 69.7% 0.0% 0.0% 100.0% 100.0% 100.0% 100.0% 100.0% 100.0% 100.0% 100.0% 100.0% 100.0% 100.0% 100.0% 83.5% 83.5% Unknown 4.5% 0.0% 0.0% 1.3% 1.3% 0.0% 0.0% 0.0% 0.0% 1.3% 1.3% 1.9% 1.9% 0.0% 0.0% 1.2% 1.2% Afognak area 2.2% 0.0% 0.0% 1.1% 1.1% 0.0% 0.0% 0.0% 0.0% 1.1% 1.1% 0.0% 0.0% 0.0% 0.0% 0.7% 0.7% Bristol bay 1.1% 0.0% 0.0% 0.6% 0.6% 0.0% 0.0% 0.0% 0.0% 0.6% 0.6% 0.0% 0.0% 0.0% 0.0% 0.4% 0.4% Buskin area 27.0% 0.0% 0.0% 14.4% 14.4% 0.0% 0.0% 0.0% 0.0% 14.3% 14.3% 25.4% 25.4% 0.0% 0.0% 13.8% 13.8% Chiniak area 2.2% 0.0% 0.0% 0.3% 0.3% 0.0% 0.0% 0.0% 0.0% 0.3% 0.3% 4.8% 4.8% 0.0% 0.0% 1.0% 1.0% Kupreanof area 1.1% 0.0% 0.0% 1.3% 1.3% 0.0% 0.0% 0.0% 0.0% 1.3% 1.3% 0.0% 0.0% 0.0% 0.0% 0.8% 0.8% Letnik 1.1% 0.0% 0.0% 0.1% 0.1% 0.0% 0.0% 0.0% 0.0% 0.1% 0.1% 0.0% 0.0% 0.0% 0.0% 0.0% 0.0% Lipsett 1.1% 0.0% 0.0% 0.4% 0.4% 0.0% 0.0% 0.0% 0.0% 0.4% 0.4% 0.0% 0.0% 0.0% 0.0% 0.2% 0.2% Little waterfall 1.1% 0.0% 0.0% 0.9% 0.9% 0.0% 0.0% 0.0% 0.0% 0.9% 0.9% 0.0% 0.0% 0.0% 0.0% 0.6% 0.6% Lituik 1.1% 0.0% 0.0% 0.0% 0.0% 0.0% 0.0% 0.0% 0.0% 0.0% 0.0% 0.4% 0.4% 0.0% 0.0% 0.1% 0.1% Marmot Bay 1.1% 0.0% 0.0% 1.1% 1.1% 0.0% 0.0% 0.0% 0.0% 1.1% 1.1% 0.0% 0.0% 0.0% 0.0% 0.7% 0.7% Moser Bay 2.2% 0.0% 0.0% 10.4% 10.4% 0.0% 0.0% 0.0% 0.0% 10.3% 10.3% 0.0% 0.0% 0.0% 0.0% 6.7% 6.7% Mossel Bay 1.1% 0.0% 0.0% 1.5% 1.5% 0.0% 0.0% 0.0% 0.0% 1.4% 1.4% 0.0% 0.0% 0.0% 0.0% 0.9% 0.9% Olds River 1.1% 0.0% 0.0% 0.0% 0.0% 0.0% 0.0% 0.0% 0.0% 0.0% 0.0% 0.8% 0.8% 0.0% 0.0% 0.1% 0.1% Olga Bay 3.4% 0.0% 0.0% 1.9% 1.9% 0.0% 0.0% 0.0% 0.0% 1.9% 1.9% 0.0% 0.0% 0.0% 0.0% 1.2% 1.2% Ouzinkie area 1.1% 0.0% 0.0% 0.0% 0.0% 0.0% 0.0% 0.0% 0.0% 0.0% 0.0% 0.2% 0.2% 0.0% 0.0% 0.0% 0.0% Pasagshak 24.7% 0.0% 0.0% 29.7% 29.7% 0.4% 0.4% 100.0% 100.0% 30.0% 30.0% 25.4% 25.4% 0.4% 0.4% 24.0% 24.0% Pauls Bay 2.2% 0.0% 0.0% 4.4% 4.4% 0.0% 0.0% 0.0% 0.0% 4.3% 4.3% 0.0% 0.0% 0.0% 0.0% 2.8% 2.8% Port Lions area 10.1% 0.0% 0.0% 27.7% 27.7% 99.6% 99.6% 0.0% 0.0% 27.6% 27.6% 4.6% 4.6% 99.6% 99.6% 19.6% 19.6% Saltery area 9.0% 0.0% 0.0% 0.0% 0.0% 0.0% 0.0% 0.0% 0.0% 0.0% 0.0% 36.4% 36.4% 0.0% 0.0% 6.4% 6.4% Spruce Island 1.1% 0.0% 0.0% 1.1% 1.1% 0.0% 0.0% 0.0% 0.0% 1.1% 1.1% 0.0% 0.0% 0.0% 0.0% 0.7% 0.7% Waterfall Bay 1.1% 0.0% 0.0% 1.9% 1.9% 0.0% 0.0% 0.0% 0.0% 1.9% 1.9% 0.0% 0.0% 0.0% 0.0% 1.2% 1.2% Commercial fishery 13.5% 100.0% 100.0% 0.0% 0.0% 0.0% 0.0% 0.0% 0.0% 0.0% 0.0% 0.0% 0.0% 0.0% 0.0% 16.5% 16.5% Source ADF&G Division of subsistence household surveys, a. The sum of the number of households in this table may not be equal to the total number of harvesting households because respondents were able to identify multiple harvest locations.
86 Table 29. Estimated harvest of salmon by gear and location, Kodiak other residents, Coho salmon Subsistence methods Subsistence gear, Number of Commercial gear gillnet Seine Other Methods any method Rod and Reel Dipnet Total Location households Number Pounds Number Pounds Number Pounds Number Pounds Number Pounds Number Pounds Number Pounds Number Pounds Total harvest , ,865.8 All subsistence fishing locations , ,740.5 Unknown American River Bouy Buskin area Cape Gravel Chiniak area Kalsin area Kodiak area Letnik Long Island Mayflower Middle Bay Mill Bay Old Harbor Olds River Pasagshak Russian River Saltery area Three sisters Woody Island Commercial fishery continued- Chum salmon Subsistence methods Subsistence gear, Number of Commercial gear gillnet Seine Other Methods any method Rod and Reel Dipnet Total Location households Number Pounds Number Pounds Number Pounds Number Pounds Number Pounds Number Pounds Number Pounds Number Pounds Total harvest All subsistence fishing locations Kodiak area Olds River Pasagshak Commercial fishery continued- 73 Table 29. Continued
87 Table 29. Page 2 of 3 Pink salmon Subsistence methods Subsistence gear, Number of Commercial gear gillnet Seine Other Methods any method Rod and Reel Dipnet Total Location households Number Pounds Number Pounds Number Pounds Number Pounds Number Pounds Number Pounds Number Pounds Number Pounds Total harvest All subsistence fishing locations Unknown American River Buskin area Kodiak area Monashka Pillar Creek Russian River Saltery area Womens Bay Woody Island Commercial fishery continued- Chinook salmon Subsistence methods Subsistence gear, Number of Commercial gear gillnet Seine Other Methods any method Rod and Reel Dipnet Total Location households Number Pounds Number Pounds Number Pounds Number Pounds Number Pounds Number Pounds Number Pounds Number Pounds Total harvest All subsistence fishing locations Unknown American River Bouy Buskin area Cape Gravel Chiniak area Kodiak area Mayflower Monashka Old Harbor Olds River Three sisters Commercial fishery continued- 74 Table 29. Continued.
88 Table 29. Page 3 of 3 Sockeye salmon Subsistence methods Subsistence gear, Number of Commercial gear gillnet Seine Other Methods any method Rod and Reel Dipnet Total Location households Number Pounds Number Pounds Number Pounds Number Pounds Number Pounds Number Pounds Number Pounds Number Pounds Total harvest , , , , , ,648.7 All subsistence fishing locations , , , , ,295.1 Unknown Afognak area Bouy Buskin area ,094.4 Kodiak area Letnik Mill Bay Monashka Old Harbor Pasagshak Pillar Creek Port Lions area Saltery area , ,110.9 Commercial fishery , ,353.6 Source ADF&G Division of subsistence household surveys,
89 Table 30. Percentage of harvest from location of salmon by gear, Kodiak other residents, Coho salmon Subsistence methods Subsistence gear, Percentage of Commercial gear gillnet Seine Other Methods any method Rod and Reel Dipnet Total Location households Number Pounds Number Pounds Number Pounds Number Pounds Number Pounds Number Pounds Number Pounds Number Pounds Total harvest 100.0% 100.0% 100.0% 100.0% 0.0% 0.0% 100.0% 100.0% 100.0% 100.0% 100.0% 100.0% 0.0% 0.0% 100.0% 100.0% All subsistence fishing locations 37.2% 0.0% 0.0% 100.0% 100.0% 0.0% 0.0% 100.0% 100.0% 100.0% 100.0% 100.0% 100.0% 0.0% 0.0% 95.6% 95.6% Unknown 3.3% 0.0% 0.0% 0.0% 0.0% 0.0% 0.0% 0.0% 0.0% 0.0% 0.0% 20.7% 20.7% 0.0% 0.0% 17.7% 17.7% American River 1.7% 0.0% 0.0% 0.0% 0.0% 0.0% 0.0% 0.0% 0.0% 0.0% 0.0% 1.5% 1.5% 0.0% 0.0% 1.3% 1.3% Bouy 4 2.5% 0.0% 0.0% 0.0% 0.0% 0.0% 0.0% 100.0% 100.0% 5.4% 5.4% 0.9% 0.9% 0.0% 0.0% 1.3% 1.3% Buskin area 17.4% 0.0% 0.0% 60.4% 60.4% 0.0% 0.0% 0.0% 0.0% 57.1% 57.1% 25.2% 25.2% 0.0% 0.0% 27.3% 27.3% Cape Gravel 0.8% 0.0% 0.0% 0.0% 0.0% 0.0% 0.0% 0.0% 0.0% 0.0% 0.0% 0.9% 0.9% 0.0% 0.0% 0.7% 0.7% Chiniak area 2.5% 0.0% 0.0% 0.0% 0.0% 0.0% 0.0% 0.0% 0.0% 0.0% 0.0% 1.5% 1.5% 0.0% 0.0% 1.3% 1.3% Kalsin area 0.8% 0.0% 0.0% 0.0% 0.0% 0.0% 0.0% 0.0% 0.0% 0.0% 0.0% 0.4% 0.4% 0.0% 0.0% 0.4% 0.4% Kodiak area 1.7% 0.0% 0.0% 0.0% 0.0% 0.0% 0.0% 0.0% 0.0% 0.0% 0.0% 0.4% 0.4% 0.0% 0.0% 0.4% 0.4% Letnik 0.8% 0.0% 0.0% 0.0% 0.0% 0.0% 0.0% 0.0% 0.0% 0.0% 0.0% 0.2% 0.2% 0.0% 0.0% 0.2% 0.2% Long Island 0.8% 0.0% 0.0% 0.0% 0.0% 0.0% 0.0% 0.0% 0.0% 0.0% 0.0% 2.6% 2.6% 0.0% 0.0% 2.2% 2.2% Mayflower 0.8% 0.0% 0.0% 11.3% 11.3% 0.0% 0.0% 0.0% 0.0% 10.7% 10.7% 0.0% 0.0% 0.0% 0.0% 1.1% 1.1% Middle Bay 0.8% 0.0% 0.0% 0.0% 0.0% 0.0% 0.0% 0.0% 0.0% 0.0% 0.0% 2.1% 2.1% 0.0% 0.0% 1.8% 1.8% Mill Bay 0.8% 0.0% 0.0% 0.0% 0.0% 0.0% 0.0% 0.0% 0.0% 0.0% 0.0% 4.3% 4.3% 0.0% 0.0% 3.6% 3.6% Old Harbor 0.8% 0.0% 0.0% 18.9% 18.9% 0.0% 0.0% 0.0% 0.0% 17.9% 17.9% 0.0% 0.0% 0.0% 0.0% 1.8% 1.8% Olds River 5.0% 0.0% 0.0% 0.0% 0.0% 0.0% 0.0% 0.0% 0.0% 0.0% 0.0% 3.8% 3.8% 0.0% 0.0% 3.3% 3.3% Pasagshak 7.4% 0.0% 0.0% 0.0% 0.0% 0.0% 0.0% 0.0% 0.0% 0.0% 0.0% 19.8% 19.8% 0.0% 0.0% 16.9% 16.9% Russian River 0.8% 0.0% 0.0% 0.0% 0.0% 0.0% 0.0% 0.0% 0.0% 0.0% 0.0% 4.3% 4.3% 0.0% 0.0% 3.6% 3.6% Saltery area 4.1% 0.0% 0.0% 9.4% 9.4% 0.0% 0.0% 0.0% 0.0% 8.9% 8.9% 10.2% 10.2% 0.0% 0.0% 9.7% 9.7% Three sisters 0.8% 0.0% 0.0% 0.0% 0.0% 0.0% 0.0% 0.0% 0.0% 0.0% 0.0% 0.9% 0.9% 0.0% 0.0% 0.7% 0.7% Woody Island 0.8% 0.0% 0.0% 0.0% 0.0% 0.0% 0.0% 0.0% 0.0% 0.0% 0.0% 0.4% 0.4% 0.0% 0.0% 0.4% 0.4% Commercial fishery 2.5% 100.0% 100.0% 0.0% 0.0% 0.0% 0.0% 0.0% 0.0% 0.0% 0.0% 0.0% 0.0% 0.0% 0.0% 4.4% 4.4% -continued- Chum salmon Subsistence methods Subsistence gear, Percentage of Commercial gear gillnet Seine Other Methods any method Rod and Reel Dipnet Total Location households Number Pounds Number Pounds Number Pounds Number Pounds Number Pounds Number Pounds Number Pounds Number Pounds Total harvest 100% 100% 100% 100% 0% 0% 0% 0% 100% 100% 100% 100% 0% 0% 100% 100% All subsistence fishing locations 2.5% 0% 0% 100% 100% 0% 0% 0% 0% 100% 100% 100% 100% 0% 0% 12% 12% Kodiak area 0.8% 0% 0% 0% 0% 0% 0% 0% 0% 0% 0% 0% 0% 0% 0% 0% 0% Olds River 0.8% 0% 0% 0% 0% 0% 0% 0% 0% 0% 0% 100% 100% 0% 0% 8% 8% Pasagshak 0.8% 0% 0% 100% 100% 0% 0% 0% 0% 100% 100% 0% 0% 0% 0% 4% 4% Commercial fishery 1.7% 100% 100% 0% 0% 0% 0% 0% 0% 0% 0% 0% 0% 0% 0% 88% 88% -continued- 76 Table 30. Continued.
90 Table 30. Page 2 of 3. Pink salmon Subsistence methods Subsistence gear, Percentage of Commercial gear gillnet Seine Other Methods any method Rod and Reel Dipnet Total Location households Number Pounds Number Pounds Number Pounds Number Pounds Number Pounds Number Pounds Number Pounds Number Pounds Total harvest 100.0% 100.0% 0.0% 0.0% 0.0% 0.0% 0.0% 0.0% 0.0% 0.0% 100.0% 100.0% 0.0% 0.0% 100.0% 100.0% All subsistence fishing locations 14.0% 0.0% 0.0% 0.0% 0.0% 0.0% 0.0% 0.0% 0.0% 0.0% 0.0% 100.0% 100.0% 0.0% 0.0% 89.6% 89.6% Unknown 2.5% 0.0% 0.0% 0.0% 0.0% 0.0% 0.0% 0.0% 0.0% 0.0% 0.0% 13.4% 13.4% 0.0% 0.0% 12.0% 12.0% American River 0.8% 0.0% 0.0% 0.0% 0.0% 0.0% 0.0% 0.0% 0.0% 0.0% 0.0% 2.2% 2.2% 0.0% 0.0% 1.9% 1.9% Buskin area 5.8% 0.0% 0.0% 0.0% 0.0% 0.0% 0.0% 0.0% 0.0% 0.0% 0.0% 69.8% 69.8% 0.0% 0.0% 62.5% 62.5% Kodiak area 0.8% 0.0% 0.0% 0.0% 0.0% 0.0% 0.0% 0.0% 0.0% 0.0% 0.0% 0.0% 0.0% 0.0% 0.0% 0.0% 0.0% Monashka 0.8% 0.0% 0.0% 0.0% 0.0% 0.0% 0.0% 0.0% 0.0% 0.0% 0.0% 2.2% 2.2% 0.0% 0.0% 1.9% 1.9% Pillar Creek 1.7% 0.0% 0.0% 0.0% 0.0% 0.0% 0.0% 0.0% 0.0% 0.0% 0.0% 3.4% 3.4% 0.0% 0.0% 3.1% 3.1% Russian River 0.8% 0.0% 0.0% 0.0% 0.0% 0.0% 0.0% 0.0% 0.0% 0.0% 0.0% 2.2% 2.2% 0.0% 0.0% 1.9% 1.9% Saltery area 1.7% 0.0% 0.0% 0.0% 0.0% 0.0% 0.0% 0.0% 0.0% 0.0% 0.0% 3.4% 3.4% 0.0% 0.0% 3.1% 3.1% Womens Bay 0.8% 0.0% 0.0% 0.0% 0.0% 0.0% 0.0% 0.0% 0.0% 0.0% 0.0% 0.0% 0.0% 0.0% 0.0% 0.0% 0.0% Woody Island 0.8% 0.0% 0.0% 0.0% 0.0% 0.0% 0.0% 0.0% 0.0% 0.0% 0.0% 3.4% 3.4% 0.0% 0.0% 3.1% 3.1% Commercial fishery 2.5% 100.0% 100.0% 0.0% 0.0% 0.0% 0.0% 0.0% 0.0% 0.0% 0.0% 0.0% 0.0% 0.0% 0.0% 10.4% 10.4% -continued- Chinook salmon Subsistence methods Subsistence gear, Percentage of Commercial gear gillnet Seine Other Methods any method Rod and Reel Dipnet Total Location households Number Pounds Number Pounds Number Pounds Number Pounds Number Pounds Number Pounds Number Pounds Number Pounds Total harvest 100.0% 100.0% 100.0% 100.0% 0.0% 0.0% 0.0% 0.0% 100.0% 100.0% 100.0% 100.0% 0.0% 0.0% 100.0% 100.0% All subsistence fishing locations 18.2% 0.0% 0.0% 100.0% 100.0% 0.0% 0.0% 0.0% 0.0% 100.0% 100.0% 100.0% 100.0% 0.0% 0.0% 56.4% 56.4% Unknown 3.3% 0.0% 0.0% 0.0% 0.0% 0.0% 0.0% 0.0% 0.0% 0.0% 0.0% 12.2% 12.2% 0.0% 0.0% 6.7% 6.7% American River 4.1% 0.0% 0.0% 66.7% 66.7% 0.0% 0.0% 0.0% 0.0% 66.7% 66.7% 10.3% 10.3% 0.0% 0.0% 6.8% 6.8% Bouy 4 3.3% 0.0% 0.0% 0.0% 0.0% 0.0% 0.0% 0.0% 0.0% 0.0% 0.0% 13.7% 13.7% 0.0% 0.0% 7.5% 7.5% Buskin area 0.8% 0.0% 0.0% 0.0% 0.0% 0.0% 0.0% 0.0% 0.0% 0.0% 0.0% 1.1% 1.1% 0.0% 0.0% 0.6% 0.6% Cape Gravel 0.8% 0.0% 0.0% 0.0% 0.0% 0.0% 0.0% 0.0% 0.0% 0.0% 0.0% 2.3% 2.3% 0.0% 0.0% 1.2% 1.2% Chiniak area 2.5% 0.0% 0.0% 0.0% 0.0% 0.0% 0.0% 0.0% 0.0% 0.0% 0.0% 34.2% 34.2% 0.0% 0.0% 18.6% 18.6% Kodiak area 0.8% 0.0% 0.0% 0.0% 0.0% 0.0% 0.0% 0.0% 0.0% 0.0% 0.0% 0.0% 0.0% 0.0% 0.0% 0.0% 0.0% Mayflower 0.8% 0.0% 0.0% 33.3% 33.3% 0.0% 0.0% 0.0% 0.0% 33.3% 33.3% 0.0% 0.0% 0.0% 0.0% 0.6% 0.6% Monashka 0.8% 0.0% 0.0% 0.0% 0.0% 0.0% 0.0% 0.0% 0.0% 0.0% 0.0% 2.3% 2.3% 0.0% 0.0% 1.2% 1.2% Old Harbor 0.8% 0.0% 0.0% 0.0% 0.0% 0.0% 0.0% 0.0% 0.0% 0.0% 0.0% 4.6% 4.6% 0.0% 0.0% 2.5% 2.5% Olds River 3.3% 0.0% 0.0% 0.0% 0.0% 0.0% 0.0% 0.0% 0.0% 0.0% 0.0% 16.0% 16.0% 0.0% 0.0% 8.7% 8.7% Three sisters 0.8% 0.0% 0.0% 0.0% 0.0% 0.0% 0.0% 0.0% 0.0% 0.0% 0.0% 3.4% 3.4% 0.0% 0.0% 1.9% 1.9% Commercial fishery 3.3% 100.0% 100.0% 0.0% 0.0% 0.0% 0.0% 0.0% 0.0% 0.0% 0.0% 0.0% 0.0% 0.0% 0.0% 43.6% 43.6% -continued- 77 Table 30. Continued.
91 Table 30. Page 3 of 3. Sockeye salmon Subsistence methods Percentage of Commercial gear gillnet Seine Other Methods Subsistence gear, any method Rod and Reel Dipnet Total Location households Number Pounds Number Pounds Number Pounds Number Pounds Number Pounds Number Pounds Number Pounds Number Pounds Total harvest 100.0% 100.0% 100.0% 100.0% 100.0% 100.0% 0.0% 0.0% 100.0% 100.0% 100.0% 100.0% 100.0% 100.0% 100.0% 100.0% All subsistence fishing locations 36.4% 0.0% 0.0% 100.0% 100.0% 100.0% 100.0% 0.0% 0.0% 100.0% 100.0% 100.0% 100.0% 100.0% 100.0% 76.0% 76.0% Unknown 3.3% 0.0% 0.0% 11.3% 11.3% 0.0% 0.0% 0.0% 0.0% 10.4% 10.4% 7.2% 7.2% 0.0% 0.0% 6.5% 6.5% Afognak area 0.8% 0.0% 0.0% 38.4% 38.4% 0.0% 0.0% 0.0% 0.0% 35.3% 35.3% 0.0% 0.0% 0.0% 0.0% 12.4% 12.4% Bouy 4 0.8% 0.0% 0.0% 0.0% 0.0% 0.0% 0.0% 0.0% 0.0% 0.0% 0.0% 0.0% 0.0% 0.0% 0.0% 0.0% 0.0% Buskin area 19.8% 0.0% 0.0% 27.1% 27.1% 26.3% 26.3% 0.0% 0.0% 27.0% 27.0% 24.5% 24.5% 13.3% 13.3% 19.4% 19.4% Kodiak area 0.8% 0.0% 0.0% 0.0% 0.0% 0.0% 0.0% 0.0% 0.0% 0.0% 0.0% 0.8% 0.8% 0.0% 0.0% 0.3% 0.3% Letnik 0.8% 0.0% 0.0% 11.3% 11.3% 0.0% 0.0% 0.0% 0.0% 10.4% 10.4% 0.0% 0.0% 0.0% 0.0% 3.6% 3.6% Mill Bay 0.8% 0.0% 0.0% 0.0% 0.0% 0.0% 0.0% 0.0% 0.0% 0.0% 0.0% 2.7% 2.7% 0.0% 0.0% 1.1% 1.1% Monashka 0.8% 0.0% 0.0% 0.0% 0.0% 0.0% 0.0% 0.0% 0.0% 0.0% 0.0% 0.0% 0.0% 20.0% 20.0% 0.2% 0.2% Old Harbor 1.7% 0.0% 0.0% 2.3% 2.3% 0.0% 0.0% 0.0% 0.0% 2.1% 2.1% 1.1% 1.1% 0.0% 0.0% 1.2% 1.2% Pasagshak 8.3% 0.0% 0.0% 0.0% 0.0% 52.6% 52.6% 0.0% 0.0% 4.2% 4.2% 15.0% 15.0% 0.0% 0.0% 7.4% 7.4% Pillar Creek 0.8% 0.0% 0.0% 0.0% 0.0% 0.0% 0.0% 0.0% 0.0% 0.0% 0.0% 0.0% 0.0% 0.0% 0.0% 0.0% 0.0% Port Lions area 2.5% 0.0% 0.0% 9.7% 9.7% 0.0% 0.0% 0.0% 0.0% 8.9% 8.9% 2.7% 2.7% 0.0% 0.0% 4.2% 4.2% Saltery area 8.3% 0.0% 0.0% 0.0% 0.0% 21.1% 21.1% 0.0% 0.0% 1.7% 1.7% 46.0% 46.0% 66.7% 66.7% 19.7% 19.7% Commercial fishery 5.8% 100.0% 100.0% 0.0% 0.0% 0.0% 0.0% 0.0% 0.0% 0.0% 0.0% 0.0% 0.0% 0.0% 0.0% 24.0% 24.0% Source ADF&G Division of subsistence household surveys,
92 Table 31. Comparison of reported length of time households have used the same fishing location, Kodiak City, Alaska, Households using the same location annually Permit holders Other residents Number Percentage a 74.2% 50.4% Mean years used Minimum years used Maximum years used Source ADF&G Division of Subsistence household surveys, a Percentage based upon total number of survey respondants. 79
93 Table 32. Reported household use of gillnets, Study communities, Kodiak: Permit holders Kodiak: Other households Larsen Bay Old Harbor Respondents Households using setnets Number Percentage 52.4% 56.3% 51.7% 14.0% Mean years used Median years used Min years used Max years used Households fishing with others Number Percentage a 36.4% 63.0% 87.0% 76.5% Mean others fished with Median others fished with Min others fished with Max others fished with Households fishing with other permit holding households Households recording harvest on a permit Households owning a net Number Percentage 38.1% 39.6% 56.2% 19.0% Source ADF&G Division of Subsistence household surveys, a. Percentage of households reporting use of setnet for subsistence fishing. 80
94 Table 33. Who taught households to use gillnets, study communities, 2012 (asked of those who used gillnet in 2012). Households reporting Relation Larsen Bay Old Harbor Kodiak: Permit holders Kodiak: Other residents Grandparent 0.0% 14.8% 0.0% 0.0% Parent or parent-in-law 54.5% 40.7% 19.6% 11.8% Other relationship 36.4% 11.1% 15.2% 0.0% Friend 0.0% 3.7% 41.3% 52.9% Self 0.0% 18.5% 15.2% 11.8% Unknown 9.1% 11.1% 8.7% 23.5% Source Division of Subsistence household surveys,
95 Table 34. Comparative summary of households not using gillnets, study communities, Kodiak: Permit holders Kodiak: Other residents Larsen Bay Old Harbor Respondents Households not using setnets Number Percentage 47.6% 43.8% 48.3% 86.0% Households using setnets in the past Number Percentage a 70.0% 52.4% 62.8% 26.0% Source ADF&G Division of Subsistence household surveys, a. Percentage of households not using setnets in
96 Table 35. Summary of reported rod and reel use in study communities, Kodiak Permit holders Kodiak Other residents Larsen Bay Old Harbor Respondents Households using rod and reel in Number Percentage 57.1% 81.3% 67.4% 57.9% Households recording rod and reel harvest on permit Number Percentage a 50.0% 23.1% 23.3% 8.6% Number of years rod and reel used Mean Median Min Max Households not using rod and reel in Number Percentage 38.1% 18.8% 32.6% 42.1% Households ever using rod and reel. Number Percentage b 50.0% 88.9% 86.2% 56.9% Source ADF&G Division of Subsistence household surveys, a. Percentage based on number of households reporting of use of rod and reel in b. Percentages based on number of households reporting no use of rod and reel in
97 Table 36. Reasons respondents did not use rod and reel, study communities Larsen Bay Old Harbor Kodiak permit holders Kodiak other households No interest 100% 100% 50% 47% Inefficient 0% 0% 50% 0% Don't know how to use 0% 0% 0% 20% No equipment 0% 0% 0% 13% Non-responsive 0% 0% 0% 13% No response 0% 0% 0% 7% Source ADF&G Division of Subsistence household surveys,
98 Table 37. Ownership of boats and subsistence nets, all study communities, Kodiak permit holders Kodiak other households Larsen Bay Old Harbor Respondents Own boat 42.9% 60.4% 65.2% 19.0% Own subsistence net 38.1% 39.6% 56.2% 19.0% Own both 33.3% 37.5% 49.4% 13.2% Source ADF&G Division of Subsistence household surveys, Table 38. Participation in Commercial Fishing and Percentage of income from commercial fishing, study communities, Total households interviewed Total households commercial fishing Percentage commercial fishing Percentage of commercial fishing households reporting percent of income from commercial fishing No response % 26-50% 51-75% % Community Larsen Bay % 0.0% 12.5% 37.5% 0.0% 37.5% 12.5% Old Harbor % 0.0% 0.0% 20.0% 6.7% 13.3% 60.0% Permit holders % 10.7% 3.6% 21.4% 7.1% 3.6% 53.6% Other residents % 14.3% 0.0% 28.6% 14.3% 7.1% 35.7% Source ADF&G Division of Subsistence, household surveys,
99 Table 39. Commercial fishing species and locations of households in Larsen Bay, Alaska, Number of households reporting commercial fishing Kodiak permit holders Kodiak other households Area Resource Larsen Bay Old Harbor Alaska Peninsula Cod Bering Sea & Aleutian Islands Crabs Pacific halibut Walleye pollock (whiting) Bristol Bay Crabs Salmon Sockeye salmon Kodiak Island Black rockfish Cod Dungeness crab Pacific (gray) cod Pacific halibut Rockfish Sablefish (black cod) Salmon Tanner crab Unknown cod Walleye pollock (whiting) Southeast Pacific halibut Pacific herring Unspecified Cod Crabs Fish Marine invertebrates Pacific halibut Pacific herring Sablefish (black cod) Salmon Species unspecified Tanner crab Source ADF&G Division of subsistence household surveys,
100 Table 40. Estimated harvests and uses of fish resources, Larsen Bay, Alaska, Percentage of households Harvest weight (lb) Harvest amount a 95% Resource Use % Attempt % Harvest % Receive % Give % Total Mean per household Per capita Total Unit Mean per household confidence limit (±) Salmon , ,053.1 Ind Chum salmon Ind Coho salmon , Ind Chinook salmon Ind Pink salmon Ind Sockeye salmon , ,652.0 Ind Source ADF&G Division of Subsistence household surveys, a. Summary rows that include incompatible units of measure have been left blank. 87
101 Table 41. Estimated harvest of salmon by gear type and resource, Larsen Bay, Alaska, Subsistence methods Removed from commercial catch Gillnet Seine Other method Subsistence gear, any method Rod and reel Dipnet Any method Resource Number Pounds Number Pounds Number Pounds Number Pounds Number Pounds Number Pounds Number Pounds Number Pounds Salmon 1, , , , , , , ,620.8 Chum salmon Coho salmon ,156.9 Chinook salmon Pink salmon Sockeye salmon 1, , , , , ,911.4 Source ADF&G Division of Subsistence household surveys,
102 Table 42. Estimated percentages of salmon harvested by gear type, resource, and total salmon harvest, Larsen Bay, Alaska, Subsistence methods Percentage Removed from commercial catch Gillnet or seine Seine Other Subsistence gear, any method Rod and Reel Dipnet Any method Resource base Number Pounds Number Pounds Number Pounds Number Pounds Number Pounds Number Pounds Number Pounds Number Pounds Salmon Gear type 100.0% 100.0% 100.0% 100.0% 100.0% 100.0% 100.0% 100.0% 100.0% 100.0% 100.0% 100.0% 0.0% 0.0% 100.0% 100.0% Resource 57.7% 57.9% 9.6% 9.7% 25.9% 25.2% 0.8% 0.5% 36.3% 35.4% 6.0% 6.7% 0.0% 0.0% 100.0% 100.0% Total 57.7% 57.9% 9.6% 9.7% 25.9% 25.2% 0.8% 0.5% 36.3% 35.4% 6.0% 6.7% 0.0% 0.0% 100.0% 100.0% Chum salmon Gear type 0.0% 0.0% 0.0% 0.0% 0.0% 0.0% 0.0% 0.0% 0.0% 0.0% 0.0% 0.0% 0.0% 0.0% 4.9% 6.7% Resource 0.0% 0.0% 0.0% 0.0% 0.0% 0.0% 0.0% 0.0% 0.0% 0.0% 0.0% 0.0% 0.0% 0.0% 100.0% 100.0% Total 0.0% 0.0% 0.0% 0.0% 0.0% 0.0% 0.0% 0.0% 0.0% 0.0% 0.0% 0.0% 0.0% 0.0% 4.9% 6.7% Coho salmon Gear type 3.1% 3.9% 17.4% 21.7% 1.3% 1.6% 0.0% 0.0% 5.5% 7.1% 58.1% 65.4% 0.0% 0.0% 7.2% 7.0% Resource 24.6% 24.6% 22.9% 22.9% 4.5% 4.5% 0.0% 0.0% 27.4% 27.4% 48.0% 48.0% 0.0% 0.0% 100.0% 100.0% Total 1.8% 2.3% 1.7% 2.1% 0.3% 0.4% 0.0% 0.0% 2.0% 2.5% 3.5% 4.4% 0.0% 0.0% 7.2% 7.0% Chinook salmon Gear type 1.1% 1.3% 0.0% 0.0% 0.0% 0.0% 0.0% 0.0% 0.0% 0.0% 6.8% 7.7% 0.0% 0.0% 9.1% 17.3% Resource 60.0% 60.0% 0.0% 0.0% 0.0% 0.0% 0.0% 0.0% 0.0% 0.0% 40.0% 40.0% 0.0% 0.0% 100.0% 100.0% Total 0.6% 0.8% 0.0% 0.0% 0.0% 0.0% 0.0% 0.0% 0.0% 0.0% 0.4% 0.5% 0.0% 0.0% 9.1% 17.3% Pink salmon Gear type 1.1% 0.7% 8.5% 5.3% 7.1% 4.6% 100.0% 100.0% 9.5% 6.2% 13.5% 7.6% 0.0% 0.0% 11.7% 6.2% Resource 12.5% 12.5% 16.7% 16.7% 37.5% 37.5% 16.7% 16.7% 70.8% 70.8% 16.7% 16.7% 0.0% 0.0% 100.0% 100.0% Total 0.6% 0.4% 0.8% 0.5% 1.8% 1.2% 0.8% 0.5% 3.4% 2.2% 0.8% 0.5% 0.0% 0.0% 11.7% 6.2% Sockeye salmon Gear type 94.8% 94.1% 74.2% 73.0% 91.7% 93.8% 0.0% 0.0% 85.0% 86.7% 21.6% 19.2% 0.0% 0.0% 66.7% 62.4% Resource 63.0% 63.0% 8.2% 8.2% 27.3% 27.3% 0.0% 0.0% 35.5% 35.5% 1.5% 1.5% 0.0% 0.0% 100.0% 100.0% Total 54.7% 54.5% 7.1% 7.1% 23.7% 23.6% 0.0% 0.0% 30.8% 30.7% 1.3% 1.3% 0.0% 0.0% 66.7% 62.4% Source ADF&G Division of Subsistence household surveys, 2014.
103 Table 43. Percentage of households using gear type to harvest salmon by gear type, Larsen Bay, Alaska, Subsistence methods Removed from Subsistence gear, any commercial catch Gillnet Seine Other method method Rod & Reel Total harvest Resource No. % No. % No. % No. % No. % No. % No. % Salmon Chum salmon Coho salmon Chinook salmon Pink salmon Sockeye salmon Source ADF&G Division of Subsistence household surveys,
104 Table 44. Changes in household uses of resources compared to recent years, Larsen Bay, Alaska, Households reporting use Households not Sampled Valid Total households Less Same More using Resource category households responses a Number Percentage Number Percentage Number Percentage Number Percentage Number Percentage Salmon % % % % 0 0.0% Source ADF&G Division of Subsistence household surveys, a. Valid responses do not include households that did not provide any response. 91
105 Table 45. Reasons for less household uses of resources compared to recent years, Larsen Bay, Alaska, Table 45. Continued. Households reporting Family/ Resources less Weather/ Valid reasons for personal available Too far to travel Lack of equipment Less sharing Lack of effort Unsuccessful environment Resource category responses a less use Number Percentage Number Percentage Number Percentage Number Percentage Number Percentage Number Percentage Number Percentage Number Percentage Salmon % 3 21% 0 0.0% 1 7% 2 14% 2 14% 0 0.0% 1 7.1% -continued- Households reporting Working/ Small/ Equipment/ Used other Valid reasons for Other reasons no time Regulations diseased animals Did not get enough Did not need fuel expense resources Resource category responses a less use Number Percentage Number Percentage Number Percentage Number Percentage Number Percentage Number Percentage Number Percentage Number Percentage Salmon % % 0 0.0% 0 0.0% 0 0.0% 0 0.0% 0 0.0% 0 0.0% Source ADF&G Division of Subsistence household surveys, a. Valid responses do not include households that did not provide any response and households reporting never using the resource. 92
106 Table 46. Reasons for more household uses of resources compared to recent years, Larsen Bay, Alaska, Resource category Number Percentage Number Percentage Number Percentage Number Percentage Number Percentage Number Percentage Number Percentage Salmon % 0 0.0% 0 0.0% 0 0.0% % 0 0.0% 0 0.0% Table 46. Continued. Valid responses a Households reporting reasons for more use Increased availability Used other resources Favorable weather Received more Needed more Increased effort Had more help -continued- Households reporting Store-bought Got/ Valid reasons for Other Regulations Traveled farther M ore success Needed less expense fixed equipment Resource category responses a more use Number Percentage Number Percentage Number Percentage Number Percentage Number Percentage Number Percentage Number Percentage Salmon % 0 0.0% 0 0.0% % 0 0.0% 0 0.0% 0 0.0% Source ADF&G Division of Subsistence household surveys, a. Valid responses do not include households that did not provide any response and households reporting never use. 93
107 Table 47. Reported impact to households reporting that they did not get enough of a type of resource, Larsen Bay, Alaska, Households not getting enough. Impact to those not getting enough. Sample Valid responses a Did not get enough No response Not noticeable Minor Major Severe Resource category households Number Percentage Number Percentage Number Percentage Number Percentage Number Percentage Number Percentage Number Percentage Salmon % % 0 0.0% 0 0.0% % 1 7.1% 1 7.1% Source ADF&G Division of Subsistence household surveys, a. Includes households failing to respond to the question and those households that never used the resource. Table 48. Resources households reporteded needing more of, Larsen Bay, Alaska, Resource Households needing Percentage of households Salmon 2 3.2% Coho salmon 2 3.2% Sockeye salmon % Source ADF&G Division of Subsistence household surveys, Table 49. Things households reported doing differently as the result of not getting enough of a resource, Larsen Bay, Alaska, Replaced with Used more other subsistence Asked others for Valid Bought/bartered commercial foods foods help Made do without Resource category responses a Number Percentage Number Percentage Number Percentage Number Percentage Number Percentage Salmon % % % 0 0.0% 0 0.0% -continued- Table n-m. Continued. Increased effort to Obtained food from Got public Valid harvest Worked more other sources assistance Other reasons Resource category responses a Number Percentage Number Percentage Number Percentage Number Percentage Number Percentage Salmon % 0 0.0% 0 0.0% 0 0.0% 0 0.0% Source ADF&G Division of Subsistence household surveys, 20xx. a. Includes households failing to respond to the question and those households that never used the resource.
108 Table 50. Number of permits issued and returned, and reported salmon harvests by species, Larsen Bay, Alaska, Year Issued Returned Chinook Sockeye Coho Chum Pink Total , , , , , , , year average year average Historical average Number of permits Source ASFDB Note Blank cells indicate data not available. Reported harvests
109 Table 51. Estimated harvest of salmon by gear and location, Larsen Bay, Alaska, Table 50. Continued. Coho salmon Subsistence methods Subsistence gear, Number of Commercial gear Gillnet Seine Other Methods any method Rod and Reel Dipnet Total Location households Number Pounds Number Pounds Number Pounds Number Pounds Number Pounds Number Pounds Number Pounds Number Pounds Total harvest ,156.9 All subsistence fishing locations Browns Lagoon Humpy Creek Karluk area Larsen Bay Commercial fishery continued- Chinook salmon Subsistence methods Subsistence gear, Number of Commercial gear Gillnet Seine Other Methods any method Rod and Reel Dipnet Total Location households Number Pounds Number Pounds Number Pounds Number Pounds Number Pounds Number Pounds Number Pounds Number Pounds Total harvest All subsistence fishing locations Larsen Bay Seven mile Commercial fishery continued- 96
110 Table 50. Page 2 of 2. Pink salmon Subsistence methods Subsistence gear, Number of Commercial gear Gillnet Seine Other Methods any method Rod and Reel Dipnet Total Location households Number Pounds Number Pounds Number Pounds Number Pounds Number Pounds Number Pounds Number Pounds Number Pounds Total harvest All subsistence fishing locations Unknown Humpy Creek Karluk area Larsen Bay Commercial fishery continued- Table 50. Continued. Sockeye salmon Subsistence methods Subsistence gear, Number of Commercial gear Gillnet Seine Other Methods any method Rod and Reel Dipnet Total Location households Number Pounds Number Pounds Number Pounds Number Pounds Number Pounds Number Pounds Number Pounds Number Pounds Total harvest 1, , , , , ,911.4 All subsistence fishing locations , , ,034.5 Humpy Creek Karluk area , , ,368.7 Larsen Bay , ,660.7 Commercial fishery 7 1, , , ,876.9 Source ADF&G Division of subsistence household surveys,
111 Table 52. Percentage of harvest from location of salmon by gear, Larsen Bay, Alaska, Chinook salmon Subsistence methods Subsistence gear, Percentage of Commercial gear Gillnet Seine Other Methods any method Rod and Reel Dipnet Total Location households Number Pounds Number Pounds Number Pounds Number Pounds Number Pounds Number Pounds Number Pounds Number Pounds Total harvest 100.0% 100.0% 0.0% 0.0% 0.0% 0.0% 0.0% 0.0% 0.0% 0.0% 100.0% 100.0% 0.0% 0.0% 100.0% 100.0% All subsistence fishing locations 14.3% 0.0% 0.0% 0.0% 0.0% 0.0% 0.0% 0.0% 0.0% 0.0% 0.0% 100.0% 100.0% 0.0% 0.0% 40.0% 40.0% Larsen Bay 14.3% 0.0% 0.0% 0.0% 0.0% 0.0% 0.0% 0.0% 0.0% 0.0% 0.0% 50.0% 50.0% 0.0% 0.0% 20.0% 20.0% Seven mile 4.8% 0.0% 0.0% 0.0% 0.0% 0.0% 0.0% 0.0% 0.0% 0.0% 0.0% 50.0% 50.0% 0.0% 0.0% 20.0% 20.0% Commercial fishery 14.3% 100.0% 100.0% 0.0% 0.0% 0.0% 0.0% 0.0% 0.0% 0.0% 0.0% 0.0% 0.0% 0.0% 0.0% 60.0% 60.0% -continued- Coho salmon Subsistence methods Subsistence gear, Percentage of Commercial gear Gillnet Seine Other Methods any method Rod and Reel Dipnet Total Location households a Number Pounds Number Pounds Number Pounds Number Pounds Number Pounds Number Pounds Number Pounds Number Pounds Total harvest 100.0% 100.0% 100.0% 100.0% 100.0% 100.0% 0.0% 0.0% 100.0% 100.0% 100.0% 100.0% 0.0% 0.0% 100.0% 100.0% All subsistence fishing locations 28.6% 0.0% 0.0% 100.0% 100.0% 100.0% 100.0% 0.0% 0.0% 100.0% 100.0% 100.0% 100.0% 0.0% 0.0% 75.4% 75.4% Browns Lagoon 4.8% 0.0% 0.0% 85.4% 85.4% 0.0% 0.0% 0.0% 0.0% 71.4% 71.4% 0.0% 0.0% 0.0% 0.0% 19.6% 19.6% Humpy Creek 4.8% 0.0% 0.0% 0.0% 0.0% 0.0% 0.0% 0.0% 0.0% 0.0% 0.0% 2.3% 2.3% 0.0% 0.0% 1.1% 1.1% Karluk area 9.5% 0.0% 0.0% 0.0% 0.0% 100.0% 100.0% 0.0% 0.0% 16.3% 16.3% 10.5% 10.5% 0.0% 0.0% 9.5% 9.5% Larsen Bay 9.5% 0.0% 0.0% 14.6% 14.6% 0.0% 0.0% 0.0% 0.0% 12.2% 12.2% 87.2% 87.2% 0.0% 0.0% 45.3% 45.3% Commercial fishery 14.3% 100.0% 100.0% 0.0% 0.0% 0.0% 0.0% 0.0% 0.0% 0.0% 0.0% 0.0% 0.0% 0.0% 0.0% 24.6% 24.6% -continued- Table 51. Continued. 98
112 Table 51. Page 2 of 2. Pink salmon Subsistence methods Subsistence gear, Percentage of Commercial gear Gillnet Seine Other Methods any method Rod and Reel Dipnet Total Location households Number Pounds Number Pounds Number Pounds Number Pounds Number Pounds Number Pounds Number Pounds Number Pounds Total harvest 100.0% 100.0% 100.0% 100.0% 100.0% 100.0% 100.0% 100.0% 100.0% 100.0% 100.0% 100.0% 0.0% 0.0% 100.0% 100.0% All subsistence fishing locations 23.8% 0.0% 0.0% 100.0% 100.0% 100.0% 100.0% 100.0% 100.0% 100.0% 100.0% 100.0% 100.0% 0.0% 0.0% 87.5% 87.5% Unknown 4.8% 0.0% 0.0% 0.0% 0.0% 0.0% 0.0% 100.0% 100.0% 23.5% 23.5% 0.0% 0.0% 0.0% 0.0% 16.7% 16.7% Humpy Creek 4.8% 0.0% 0.0% 0.0% 0.0% 0.0% 0.0% 0.0% 0.0% 0.0% 0.0% 100.0% 100.0% 0.0% 0.0% 16.7% 16.7% Karluk area 9.5% 0.0% 0.0% 0.0% 0.0% 100.0% 100.0% 0.0% 0.0% 52.9% 52.9% 0.0% 0.0% 0.0% 0.0% 37.5% 37.5% Larsen Bay 4.8% 0.0% 0.0% 100.0% 100.0% 0.0% 0.0% 0.0% 0.0% 23.5% 23.5% 0.0% 0.0% 0.0% 0.0% 16.7% 16.7% Commercial fishery 4.8% 100.0% 100.0% 0.0% 0.0% 0.0% 0.0% 0.0% 0.0% 0.0% 0.0% 0.0% 0.0% 0.0% 0.0% 12.5% 12.5% -continued- Table 51. Continued. Sockeye salmon Subsistence methods Subsistence gear, Percentage of Commercial gear Gillnet Seine Other Methods any method Rod and Reel Dipnet Total Location households Number Pounds Number Pounds Number Pounds Number Pounds Number Pounds Number Pounds Number Pounds Number Pounds Total harvest 100.0% 100.0% 100.0% 100.0% 100.0% 100.0% 0.0% 0.0% 100.0% 100.0% 100.0% 100.0% 0.0% 0.0% 100.0% 100.0% All subsistence fishing locations 52.4% 0.0% 0.0% 100.0% 100.0% 100.0% 100.0% 0.0% 0.0% 100.0% 100.0% 100.0% 100.0% 0.0% 0.0% 37.0% 37.0% Humpy Creek 4.8% 0.0% 0.0% 0.0% 0.0% 0.0% 0.0% 0.0% 0.0% 0.0% 0.0% 3.1% 3.1% 0.0% 0.0% 0.0% 0.0% Karluk area 19.0% 0.0% 0.0% 0.0% 0.0% 74.4% 74.4% 0.0% 0.0% 57.2% 57.2% 93.8% 93.8% 0.0% 0.0% 21.7% 21.7% Larsen Bay 38.1% 0.0% 0.0% 100.0% 100.0% 25.6% 25.6% 0.0% 0.0% 42.8% 42.8% 3.1% 3.1% 0.0% 0.0% 15.2% 15.2% Commercial fishery 33.3% 100.0% 100.0% 0.0% 0.0% 0.0% 0.0% 0.0% 0.0% 0.0% 0.0% 0.0% 0.0% 0.0% 0.0% 63.0% 63.0% Source ADF&G Division of subsistence household surveys,
113 Table 53. Reported length of time households have used the same fishing location, Larsen Bay, Alaska, Households using the same location annually Number 14 Percentage a 66.7% Mean years used 45.6 Minimum years used 12.0 Maximum years used 73.0 Source ADF&G Division of Subsistence household surveys, a. Percentage based upon total number of survey respondents. 100
114 Table 54. Estimated harvests and uses of fish resources, Old Harbor, Alaska, Percentage of households Harvest weight (lb) Harvest amount a 95% Resource Use % Attempt % Harvest % Receive % Give % Total Mean per household Per capita Total Unit Mean per household confidence limit (±) Salmon , ,841.5 Ind Chum salmon , Ind Coho salmon , ,443.3 Ind Chinook salmon , Ind Pink salmon , ,914.3 Ind Sockeye salmon , ,710.5 Ind Source ADF&G Division of Subsistence household surveys, a. Summary rows that include incompatible units of measure have been left blank. Table 55. Estimated harvest of salmon by gear type and resource, Old Harbor, Alaska, Subsistence methods Removed from commercial catch Gillnet Seine Other method Subsistence gear, any method Rod and reel Dipnet Any method Resource Number Pounds Number Pounds Number Pounds Number Pounds Number Pounds Number Pounds Number Pounds Number Pounds Salmon 1, , , , , , , , , , , ,212.8 Chum salmon , ,217.3 Coho salmon , , , , , , , , ,754.0 Chinook salmon , ,086.7 Pink salmon , , , , , , ,002.7 Sockeye salmon , , , , , , ,152.1 Source ADF&G Division of Subsistence household surveys, 2013.
115 Table 56. Estimated percentages of salmon harvested by gear type, resource, and total salmon harvest, Old Harbor, Alaska, Subsistence methods Percentage Removed from commercial catch Gillnet or seine Seine Other Subsistence gear, any method Rod and Reel Dipnet Any method Resource base Number Pounds Number Pounds Number Pounds Number Pounds Number Pounds Number Pounds Number Pounds Number Pounds Salmon Gear type 100.0% 100.0% 100.0% 100.0% 100.0% 100.0% 0.0% 0.0% 100.0% 100.0% 100.0% 100.0% 0.0% 0.0% 100.0% 100.0% Resource 21.0% 19.4% 43.0% 38.4% 16.6% 20.0% 0.0% 0.0% 59.6% 58.4% 19.4% 22.3% 0.0% 0.0% 100.0% 100.0% Total 21.0% 19.4% 43.0% 38.4% 16.6% 20.0% 0.0% 0.0% 59.6% 58.4% 19.4% 22.3% 0.0% 0.0% 100.0% 100.0% Chum salmon Gear type 3.9% 5.9% 2.9% 4.5% 8.8% 10.0% 0.0% 0.0% 4.6% 6.4% 6.7% 8.1% 0.0% 0.0% 4.9% 6.7% Resource 17.1% 17.1% 26.1% 26.1% 29.9% 29.9% 0.0% 0.0% 56.0% 56.0% 26.9% 26.9% 0.0% 0.0% 100.0% 100.0% Total 0.8% 1.1% 1.3% 1.7% 1.5% 2.0% 0.0% 0.0% 2.7% 3.7% 1.3% 1.8% 0.0% 0.0% 4.9% 6.7% Coho salmon Gear type 11.7% 15.7% 7.9% 11.0% 85.0% 86.8% 0.0% 0.0% 29.4% 37.0% 57.7% 61.9% 0.0% 0.0% 7.2% 7.0% Resource 7.9% 7.9% 11.0% 11.0% 45.2% 45.2% 0.0% 0.0% 56.2% 56.2% 35.9% 35.9% 0.0% 0.0% 100.0% 100.0% Total 2.5% 3.0% 3.4% 4.2% 14.1% 17.4% 0.0% 0.0% 17.5% 21.6% 11.2% 13.8% 0.0% 0.0% 7.2% 7.0% Chinook salmon Gear type 5.8% 7.9% 0.1% 0.1% 0.0% 0.0% 0.0% 0.0% 0.1% 0.1% 19.3% 21.1% 0.0% 0.0% 9.1% 17.3% Resource 24.4% 24.4% 0.8% 0.8% 0.0% 0.0% 0.0% 0.0% 0.8% 0.8% 74.8% 74.8% 0.0% 0.0% 100.0% 100.0% Total 1.2% 1.5% 0.0% 0.1% 0.0% 0.0% 0.0% 0.0% 0.0% 0.1% 3.8% 4.7% 0.0% 0.0% 9.1% 17.3% Pink salmon Gear type 31.8% 21.3% 31.8% 22.0% 6.3% 3.2% 0.0% 0.0% 24.7% 15.6% 15.6% 8.4% 0.0% 0.0% 11.7% 6.2% Resource 27.3% 27.3% 56.0% 56.0% 4.2% 4.2% 0.0% 0.0% 60.3% 60.3% 12.4% 12.4% 0.0% 0.0% 100.0% 100.0% Total 6.7% 4.1% 13.7% 8.4% 1.0% 0.6% 0.0% 0.0% 14.7% 9.1% 3.0% 1.9% 0.0% 0.0% 11.7% 6.2% Sockeye salmon Gear type 46.7% 49.3% 57.2% 62.3% 0.0% 0.0% 0.0% 0.0% 41.3% 41.0% 0.6% 0.5% 0.0% 0.0% 66.7% 62.4% Resource 28.4% 28.4% 71.2% 71.2% 0.0% 0.0% 0.0% 0.0% 71.2% 71.2% 0.4% 0.4% 0.0% 0.0% 100.0% 100.0% Total 9.8% 9.5% 24.6% 23.9% 0.0% 0.0% 0.0% 0.0% 24.6% 23.9% 0.1% 0.1% 0.0% 0.0% 66.7% 62.4% Source ADF&G Division of Subsistence household surveys, 2014.
116 Table 57. Percentage of households using geartype to harvest salmonby gear type, Old Harbor, Alaska, Subsistence methods Removed from Subsistence gear, any commercial catch Gillnet Seine Other method method Rod & Reel Total harvest Resource No. % No. % No. % No. % No. % No. % No. % Salmon Chum salmon Coho salmon Chinook salmon Pink salmon Sockeye salmon Source ADF&G Division of Subsistence household surveys,
117 Table 58. Changes in household uses of resources compared to recent years, Old Harbor, Alaska, Households reporting use Households not Sampled Valid Total households Less Same More using Resource category households responses a Number Percentage Number Percentage Number Percentage Number Percentage Number Percentage Salmon % % % % 0 0.0% Source ADF&G Division of Subsistence household surveys, a. Valid responses do not include households that did not provide any response. Table 59. Reasons for less household uses of resources compared to recent years, Old Harbor, Alaska, Households reporting Family/ Resources less Weather/ Valid reasons for personal available Too far to travel Lack of equipment Less sharing Lack of effort Unsuccessful environment Resource category responses a less use Number Percentage Number Percentage Number Percentage Number Percentage Number Percentage Number Percentage Number Percentage Number Percentage Salmon % 1 6% 0 0.0% 2 12% 1 6% 3 18% 1 5.9% % -continued- Table 59. Continued. Households reporting Working/ Small/ Equipment/ Used other Valid reasons for Other reasons no time Regulations diseased animals Did not get enough Did not need fuel expense resources Resource category responses a less use Number Percentage Number Percentage Number Percentage Number Percentage Number Percentage Number Percentage Number Percentage Number Percentage Salmon % % 0 0.0% 0 0.0% 0 0.0% 0 0.0% 0 0.0% 0 0.0% Source ADF&G Division of Subsistence household surveys, a. Valid responses do not include households that did not provide any response and households reporting never using the resource.
118 Table 60. Reasons for more household uses of resources compared to recent years, Old Harbor, Alaska, Resource category Number Percentage Number Percentage Number Percentage Number Percentage Number Percentage Number Percentage Number Percentage Salmon % 0 0.0% 0 0.0% % % % % Table 60. Continued. Valid responses a Households reporting reasons for more use Increased availability Used other resources Favorable weather Received more Needed more Increased effort Had more help -continued- Households reporting Store-bought Got/ Valid reasons for Other Regulations Traveled farther M ore success Needed less expense fixed equipment Resource category responses a more use Number Percentage Number Percentage Number Percentage Number Percentage Number Percentage Number Percentage Number Percentage Salmon % 0 0.0% 0 0.0% % 0 0.0% 0 0.0% 0 0.0% Source ADF&G Division of Subsistence household surveys, a. Valid responses do not include households that did not provide any response and households reporting never use. 105 Table 61. Reported impact to households reporting that they did not get enough of a type of resource, Old Harbor, Alaska, Households not getting enough. Impact to those not getting enough. Sample Valid responses a Did not get enough No response Not noticeable Minor Major Severe Resource category households Number Percentage Number Percentage Number Percentage Number Percentage Number Percentage Number Percentage Number Percentage Salmon % % 0 0.0% 0 0.0% % % 1 7.7% Source ADF&G Division of Subsistence household surveys, a. Includes households failing to respond to the question and those households that never used the resource. Table 62. Resources households reported needing more of, Old Harbor, Alaska, Resource Households needing Percentage of households Coho salmon 8 6.5% Chinook salmon 2 1.6% Pink salmon 2 1.6% Sockeye salmon 5 4.0% Source ADF&G Division of Subsistence household surveys, 2013.
119 Table 63. Things households reported doing differently as the result of not getting enough of a resource, Old Harbor, Alaska, Replaced with Used more other subsistence Asked others for Valid Bought/bartered commercial foods foods help Made do without Resource category responses a Number Percentage Number Percentage Number Percentage Number Percentage Number Percentage Salmon % % 1 9.1% 0 0.0% 1 9.1% -continued- Table 63. Continued. Increased effort to Obtained food from Got public Valid harvest Worked more other sources assistance Other reasons Resource category responses a Number Percentage Number Percentage Number Percentage Number Percentage Number Percentage Salmon % 0 0.0% 0 0.0% 1 9.1% 0 0.0% Source ADF&G Division of Subsistence household surveys, 20xx. a. Includes households failing to respond to the question and those households that never used the resource. 106
120 Table 64. Number of permits issued and returned, and reported salmon harvests by species, Old Harbor, Alaska, Number of permits Reported harvests Year Issued Returned Chinook Sockeye Coho Chum Pink Total , , , , , , , , , , , , , , , , , , , ,304 1, , , , , , , , , , ,258 5-year average , year average ,771 Historical average ,604 Source ASFDB Note Blank cells indicate data not available. 107
121 Table 65. Estimated harvest of salmon by gear and location, Old Harbor, Alaska, Table 65. Continued. Coho salmon Chum salmon Subsistence methods Subsistence gear, Number of Commercial gear Gillnet Seine Other Methods any method Rod and Reel Dipnet Total Location households Number Pounds Number Pounds Number Pounds Number Pounds Number Pounds Number Pounds Number Pounds Number Pounds Total harvest , ,217.3 All subsistence fishing locations , ,838.3 Unknown Barling Bay Big Creek ,165.5 Culvert Lighthouse Newman Spit Old Harbor Three sisters Commercial fishery continued- Subsistence methods Subsistence gear, Number of Commercial gear Gillnet Seine Other Methods any method Rod and Reel Dipnet Total Location households Number Pounds Number Pounds Number Pounds Number Pounds Number Pounds Number Pounds Number Pounds Number Pounds Total harvest , , , , , , , , ,754.0 All subsistence fishing locations , , , , , , , ,744.6 Unknown Barling Bay , ,044.3 Big Creek , , , , ,247.9 Culvert Lighthouse Midway Bay Ocean Beach Sitkaladak Strait Three sisters Commercial fishery , , continued-
122 Table 65. Page 2 of 3 Chinook salmon 109 Table 65. Continued. Pink salmon Subsistence methods Subsistence gear, Number of Commercial gear Gillnet Seine Other Methods any method Rod and Reel Dipnet Total Location households Number Pounds Number Pounds Number Pounds Number Pounds Number Pounds Number Pounds Number Pounds Number Pounds Total harvest , ,086.7 All subsistence fishing locations , ,578.0 Unknown Barling Bay Ghost Rocks Newman Bay Old Harbor Port Hobron Sitkaladak Strait , ,086.5 South Strait Tanginak Three sisters Commercial fishery continued- Subsistence methods Subsistence gear, Number of Commercial gear Gillnet Seine Other Methods any method Rod and Reel Dipnet Total Location households Number Pounds Number Pounds Number Pounds Number Pounds Number Pounds Number Pounds Number Pounds Number Pounds Total harvest , , , , , , ,002.7 All subsistence fishing locations , , , , , ,635.2 Unknown Barling Bay Big Creek Culvert Lighthouse Newman Spit , , ,104.2 Old Harbor Port Hobron Sitkaladak Strait Three sisters Commercial fishery , , continued-
123 110 Table 65. Page 2 of 3 Sockeye salmon Subsistence methods Subsistence gear, Number of Commercial gear Gillnet Seine Other Methods any method Rod and Reel Dipnet Total Location households Number Pounds Number Pounds Number Pounds Number Pounds Number Pounds Number Pounds Number Pounds Number Pounds Total harvest , , , , , , ,152.1 All subsistence fishing locations , , , , , ,983.0 Unknown , , ,671.5 Barling Bay Cow Creek Egg Island Kazuyak Bay Kivak Lighthouse Loni's Rock Newman Bay Newman Point Newman Spit , , ,253.1 Port Hobron Rolling Bay Sitkaladak Strait , , ,236.9 Commercial fishery , ,169.1 Source ADF&G Division of subsistence household surveys, 2012.
124 Table 66. Percentage of harvest by location of salmon by gear, Old Harbor, Alaska, Table 66. Continued. Chum salmon Subsistence methods Percentage Subsistence gear, of Commercial gear Gillnet Seine Other Methods any method Rod and Reel Dipnet Total Location households Number Pounds Number Pounds Number Pounds Number Pounds Number Pounds Number Pounds Number Pounds Number Pounds Total harvest 100.0% 100.0% 100.0% 100.0% 100.0% 100.0% 0.0% 0.0% 100.0% 100.0% 100.0% 100.0% 0.0% 0.0% 100.0% 100.0% All subsistence fishing locations 27.1% 0.0% 0.0% 100.0% 100.0% 100.0% 100.0% 0.0% 0.0% 100.0% 100.0% 100.0% 100.0% 0.0% 0.0% 82.9% 82.9% Unknown 2.1% 0.0% 0.0% 16.4% 16.4% 0.0% 0.0% 0.0% 0.0% 7.6% 7.6% 0.0% 0.0% 0.0% 0.0% 4.3% 4.3% Barling Bay 10.4% 0.0% 0.0% 0.0% 0.0% 0.0% 0.0% 0.0% 0.0% 0.0% 0.0% 15.9% 15.9% 0.0% 0.0% 4.3% 4.3% Big Creek 10.4% 0.0% 0.0% 16.4% 16.4% 100.0% 100.0% 0.0% 0.0% 61.1% 61.1% 68.3% 68.3% 0.0% 0.0% 52.6% 52.6% Culvert 2.1% 0.0% 0.0% 0.0% 0.0% 0.0% 0.0% 0.0% 0.0% 0.0% 0.0% 7.9% 7.9% 0.0% 0.0% 2.1% 2.1% Lighthouse 2.1% 0.0% 0.0% 0.0% 0.0% 0.0% 0.0% 0.0% 0.0% 0.0% 0.0% 3.2% 3.2% 0.0% 0.0% 0.9% 0.9% Newman Spit 2.1% 0.0% 0.0% 65.6% 65.6% 0.0% 0.0% 0.0% 0.0% 30.5% 30.5% 0.0% 0.0% 0.0% 0.0% 17.1% 17.1% Old Harbor 2.1% 0.0% 0.0% 0.0% 0.0% 0.0% 0.0% 0.0% 0.0% 0.0% 0.0% 3.2% 3.2% 0.0% 0.0% 0.9% 0.9% Three sisters 4.2% 0.0% 0.0% 1.6% 1.6% 0.0% 0.0% 0.0% 0.0% 0.8% 0.8% 1.6% 1.6% 0.0% 0.0% 0.9% 0.9% Commercial fishery 4.2% 100.0% 100.0% 0.0% 0.0% 0.0% 0.0% 0.0% 0.0% 0.0% 0.0% 0.0% 0.0% 0.0% 0.0% 17.1% 17.1% -continued- Coho salmon Subsistence methods Percentage Subsistence gear, of Commercial gear Gillnet Seine Other Methods any method Rod and Reel Dipnet Total Location households Number Pounds Number Pounds Number Pounds Number Pounds Number Pounds Number Pounds Number Pounds Number Pounds Total harvest 100.0% 100.0% 100.0% 100.0% 100.0% 100.0% 0.0% 0.0% 100.0% 100.0% 100.0% 100.0% 0.0% 0.0% 100.0% 100.0% All subsistence fishing locations 64.6% 0.0% 0.0% 100.0% 100.0% 100.0% 100.0% 0.0% 0.0% 100.0% 100.0% 100.0% 100.0% 0.0% 0.0% 92.1% 92.1% Unknown 4.2% 0.0% 0.0% 30.3% 30.3% 0.0% 0.0% 0.0% 0.0% 5.9% 5.9% 6.5% 6.5% 0.0% 0.0% 5.7% 5.7% Barling Bay 16.7% 0.0% 0.0% 0.0% 0.0% 14.7% 14.7% 0.0% 0.0% 11.8% 11.8% 26.1% 26.1% 0.0% 0.0% 16.0% 16.0% Big Creek 33.3% 0.0% 0.0% 15.2% 15.2% 66.2% 66.2% 0.0% 0.0% 56.2% 56.2% 48.5% 48.5% 0.0% 0.0% 49.0% 49.0% Culvert 14.6% 0.0% 0.0% 0.0% 0.0% 0.0% 0.0% 0.0% 0.0% 0.0% 0.0% 9.6% 9.6% 0.0% 0.0% 3.5% 3.5% Lighthouse 4.2% 0.0% 0.0% 0.0% 0.0% 0.0% 0.0% 0.0% 0.0% 0.0% 0.0% 1.5% 1.5% 0.0% 0.0% 0.5% 0.5% Midway Bay 2.1% 0.0% 0.0% 0.0% 0.0% 11.8% 11.8% 0.0% 0.0% 9.5% 9.5% 0.0% 0.0% 0.0% 0.0% 5.3% 5.3% Ocean Beach 4.2% 0.0% 0.0% 0.0% 0.0% 7.4% 7.4% 0.0% 0.0% 5.9% 5.9% 0.9% 0.9% 0.0% 0.0% 3.7% 3.7% Sitkaladak Strait 2.1% 0.0% 0.0% 54.5% 54.5% 0.0% 0.0% 0.0% 0.0% 10.7% 10.7% 0.0% 0.0% 0.0% 0.0% 6.0% 6.0% Three sisters 4.2% 0.0% 0.0% 0.0% 0.0% 0.0% 0.0% 0.0% 0.0% 0.0% 0.0% 6.9% 6.9% 0.0% 0.0% 2.5% 2.5% Commercial fishery 8.3% 100.0% 100.0% 0.0% 0.0% 0.0% 0.0% 0.0% 0.0% 0.0% 0.0% 0.0% 0.0% 0.0% 0.0% 7.9% 7.9% -continued-
125 Table 66. Page 2 of Table 66. Continued. Chinook salmon Subsistence methods Percentage Subsistence gear, of Commercial gear Gillnet Seine Other Methods any method Rod and Reel Dipnet Total Location households Number Pounds Number Pounds Number Pounds Number Pounds Number Pounds Number Pounds Number Pounds Number Pounds Total harvest 100.0% 100.0% 100.0% 100.0% 0.0% 0.0% 0.0% 0.0% 100.0% 100.0% 100.0% 100.0% 0.0% 0.0% 100.0% 100.0% All subsistence fishing locations 25.0% 0.0% 0.0% 100.0% 100.0% 0.0% 0.0% 0.0% 0.0% 100.0% 100.0% 100.0% 100.0% 0.0% 0.0% 75.6% 75.6% Unknown 2.1% 0.0% 0.0% 0.0% 0.0% 0.0% 0.0% 0.0% 0.0% 0.0% 0.0% 8.3% 8.3% 0.0% 0.0% 6.2% 6.2% Barling Bay 2.1% 0.0% 0.0% 0.0% 0.0% 0.0% 0.0% 0.0% 0.0% 0.0% 0.0% 0.6% 0.6% 0.0% 0.0% 0.4% 0.4% Ghost Rocks 2.1% 0.0% 0.0% 0.0% 0.0% 0.0% 0.0% 0.0% 0.0% 0.0% 0.0% 0.6% 0.6% 0.0% 0.0% 0.4% 0.4% Newman Bay 2.1% 0.0% 0.0% 0.0% 0.0% 0.0% 0.0% 0.0% 0.0% 0.0% 0.0% 2.8% 2.8% 0.0% 0.0% 2.1% 2.1% Old Harbor 4.2% 0.0% 0.0% 0.0% 0.0% 0.0% 0.0% 0.0% 0.0% 0.0% 0.0% 6.6% 6.6% 0.0% 0.0% 5.0% 5.0% Port Hobron 4.2% 0.0% 0.0% 0.0% 0.0% 0.0% 0.0% 0.0% 0.0% 0.0% 0.0% 6.1% 6.1% 0.0% 0.0% 4.5% 4.5% Sitkaladak Strait 4.2% 0.0% 0.0% 0.0% 0.0% 0.0% 0.0% 0.0% 0.0% 0.0% 0.0% 69.6% 69.6% 0.0% 0.0% 52.1% 52.1% South Strait 2.1% 0.0% 0.0% 0.0% 0.0% 0.0% 0.0% 0.0% 0.0% 0.0% 0.0% 2.8% 2.8% 0.0% 0.0% 2.1% 2.1% Tanginak 2.1% 0.0% 0.0% 100.0% 100.0% 0.0% 0.0% 0.0% 0.0% 100.0% 100.0% 0.0% 0.0% 0.0% 0.0% 0.8% 0.8% Three sisters 6.3% 0.0% 0.0% 0.0% 0.0% 0.0% 0.0% 0.0% 0.0% 0.0% 0.0% 2.8% 2.8% 0.0% 0.0% 2.1% 2.1% Commercial fishery 10.4% 100.0% 100.0% 0.0% 0.0% 0.0% 0.0% 0.0% 0.0% 0.0% 0.0% 0.0% 0.0% 0.0% 0.0% 24.4% 24.4% -continued- Pink salmon Subsistence methods Percentage Subsistence gear, of Commercial gear Gillnet Seine Other Methods any method Rod and Reel Dipnet Total Location households Number Pounds Number Pounds Number Pounds Number Pounds Number Pounds Number Pounds Number Pounds Number Pounds Total harvest 100.0% 100.0% 100.0% 100.0% 100.0% 100.0% 0.0% 0.0% 100.0% 100.0% 100.0% 100.0% 0.0% 0.0% 100.0% 100.0% All subsistence fishing locations 52.1% 0.0% 0.0% 100.0% 100.0% 100.0% 100.0% 0.0% 0.0% 100.0% 100.0% 100.0% 100.0% 0.0% 0.0% 72.7% 72.7% Unknown 4.2% 0.0% 0.0% 16.2% 16.2% 0.0% 0.0% 0.0% 0.0% 15.1% 15.1% 0.0% 0.0% 0.0% 0.0% 9.1% 9.1% Barling Bay 6.3% 0.0% 0.0% 2.3% 2.3% 0.0% 0.0% 0.0% 0.0% 2.1% 2.1% 4.8% 4.8% 0.0% 0.0% 1.9% 1.9% Big Creek 16.7% 0.0% 0.0% 9.8% 9.8% 100.0% 100.0% 0.0% 0.0% 16.2% 16.2% 44.5% 44.5% 0.0% 0.0% 15.3% 15.3% Culvert 10.4% 0.0% 0.0% 0.5% 0.5% 0.0% 0.0% 0.0% 0.0% 0.4% 0.4% 31.5% 31.5% 0.0% 0.0% 4.2% 4.2% Lighthouse 2.1% 0.0% 0.0% 0.0% 0.0% 0.0% 0.0% 0.0% 0.0% 0.0% 0.0% 2.1% 2.1% 0.0% 0.0% 0.3% 0.3% Newman Spit 4.2% 0.0% 0.0% 39.4% 39.4% 0.0% 0.0% 0.0% 0.0% 36.6% 36.6% 0.0% 0.0% 0.0% 0.0% 22.1% 22.1% Old Harbor 4.2% 0.0% 0.0% 0.0% 0.0% 0.0% 0.0% 0.0% 0.0% 0.0% 0.0% 6.8% 6.8% 0.0% 0.0% 0.8% 0.8% Port Hobron 2.1% 0.0% 0.0% 0.0% 0.0% 0.0% 0.0% 0.0% 0.0% 0.0% 0.0% 5.5% 5.5% 0.0% 0.0% 0.7% 0.7% Sitkaladak Strait 4.2% 0.0% 0.0% 27.3% 27.3% 0.0% 0.0% 0.0% 0.0% 25.4% 25.4% 0.0% 0.0% 0.0% 0.0% 15.3% 15.3% Three sisters 4.2% 0.0% 0.0% 4.5% 4.5% 0.0% 0.0% 0.0% 0.0% 4.2% 4.2% 4.8% 4.8% 0.0% 0.0% 3.1% 3.1% Commercial fishery 8.3% 100.0% 100.0% 0.0% 0.0% 0.0% 0.0% 0.0% 0.0% 0.0% 0.0% 0.0% 0.0% 0.0% 0.0% 27.3% 27.3% -continued-
126 113 Table 66. Page 3 of 3 Sockeye salmon Subsistence methods Percentage of Commercial gear Gillnet Seine Other Methods Subsistence gear, any method Rod and Reel Dipnet Total Location households Number Pounds Number Pounds Number Pounds Number Pounds Number Pounds Number Pounds Number Pounds Number Pounds Total harvest 100.0% 100.0% 100.0% 100.0% 0.0% 0.0% 0.0% 0.0% 100.0% 100.0% 100.0% 100.0% 0.0% 0.0% 100.0% 100.0% All subsistence fishing locations 41.7% 0.0% 0.0% 100.0% 100.0% 0.0% 0.0% 0.0% 0.0% 100.0% 100.0% 100.0% 100.0% 0.0% 0.0% 71.6% 71.6% Unknown 4.2% 0.0% 0.0% 21.0% 21.0% 0.0% 0.0% 0.0% 0.0% 21.0% 21.0% 0.0% 0.0% 0.0% 0.0% 15.0% 15.0% Barling Bay 4.2% 0.0% 0.0% 0.4% 0.4% 0.0% 0.0% 0.0% 0.0% 0.4% 0.4% 16.7% 16.7% 0.0% 0.0% 0.4% 0.4% Cow Creek 2.1% 0.0% 0.0% 2.1% 2.1% 0.0% 0.0% 0.0% 0.0% 2.1% 2.1% 0.0% 0.0% 0.0% 0.0% 1.5% 1.5% Egg Island 2.1% 0.0% 0.0% 4.2% 4.2% 0.0% 0.0% 0.0% 0.0% 4.2% 4.2% 0.0% 0.0% 0.0% 0.0% 3.0% 3.0% Kazuyak Bay 2.1% 0.0% 0.0% 8.4% 8.4% 0.0% 0.0% 0.0% 0.0% 8.4% 8.4% 0.0% 0.0% 0.0% 0.0% 6.0% 6.0% Kivak 2.1% 0.0% 0.0% 2.0% 2.0% 0.0% 0.0% 0.0% 0.0% 2.0% 2.0% 0.0% 0.0% 0.0% 0.0% 1.4% 1.4% Lighthouse 2.1% 0.0% 0.0% 0.0% 0.0% 0.0% 0.0% 0.0% 0.0% 0.0% 0.0% 50.0% 50.0% 0.0% 0.0% 0.2% 0.2% Loni's Rock 2.1% 0.0% 0.0% 5.5% 5.5% 0.0% 0.0% 0.0% 0.0% 5.5% 5.5% 0.0% 0.0% 0.0% 0.0% 3.9% 3.9% Newman Bay 2.1% 0.0% 0.0% 2.1% 2.1% 0.0% 0.0% 0.0% 0.0% 2.1% 2.1% 0.0% 0.0% 0.0% 0.0% 1.5% 1.5% Newman Point 6.3% 0.0% 0.0% 7.2% 7.2% 0.0% 0.0% 0.0% 0.0% 7.2% 7.2% 0.0% 0.0% 0.0% 0.0% 5.1% 5.1% Newman Spit 10.4% 0.0% 0.0% 28.2% 28.2% 0.0% 0.0% 0.0% 0.0% 28.2% 28.2% 33.3% 33.3% 0.0% 0.0% 20.2% 20.2% Port Hobron 2.1% 0.0% 0.0% 1.3% 1.3% 0.0% 0.0% 0.0% 0.0% 1.3% 1.3% 0.0% 0.0% 0.0% 0.0% 1.0% 1.0% Rolling Bay 2.1% 0.0% 0.0% 1.9% 1.9% 0.0% 0.0% 0.0% 0.0% 1.9% 1.9% 0.0% 0.0% 0.0% 0.0% 1.4% 1.4% Sitkaladak Strait 8.3% 0.0% 0.0% 15.6% 15.6% 0.0% 0.0% 0.0% 0.0% 15.6% 15.6% 0.0% 0.0% 0.0% 0.0% 11.1% 11.1% Commercial fishery 18.8% 100.0% 100.0% 0.0% 0.0% 0.0% 0.0% 0.0% 0.0% 0.0% 0.0% 0.0% 0.0% 0.0% 0.0% 28.4% 28.4% Source ADF&G Division of subsistence household surveys, 2012.
127 Table 67. Reported length of time households have used the same fishing location, Old Harbor, Alaska, Households using the same location annually Number 26 Percentage a 54.2% Mean years used 44.3 Minimum years used 2.0 Maximum years used 77.0 Source ADF&G Division of Subsistence household surveys, a Percentage based upon total number of survey respondants. 114
128 Table 68. Reasons for continuing to live in community. Top reason for residing in community Cited reasons (first, second, or third choice) Kodiak Kodiak Coded reason Larsen Bay permit Old Harbor holders Kodiak other Larsen Bay permit Old Harbor holders Kodiak other Culture 0.0% 0.0% 2.2% 5.1% 0.0% 2.1% 11.2% 11.0% Family 0.0% 6.3% 14.6% 16.1% 19.0% 18.8% 27.0% 36.4% Feel safe 0.0% 0.0% 1.1% 4.2% 4.8% 2.1% 6.7% 11.9% Freedom 0.0% 0.0% 1.1% 0.0% 0.0% 6.3% 3.4% 0.8% Good air 0.0% 0.0% 0.0% 0.0% 0.0% 2.1% 3.4% 1.7% It is home 38.1% 31.3% 9.0% 10.2% 52.4% 41.7% 20.2% 18.6% Job 9.5% 4.2% 29.2% 26.3% 14.3% 14.6% 40.4% 44.1% Lower cost of living 0.0% 6.3% 1.1% 0.0% 4.8% 14.6% 1.1% 1.7% Quality of life 9.5% 12.5% 6.7% 10.2% 23.8% 14.6% 14.6% 23.7% Quiet/peaceful 9.5% 8.3% 0.0% 4.2% 38.1% 33.3% 5.6% 13.6% Sense of community 0.0% 0.0% 11.2% 5.9% 0.0% 4.2% 25.8% 24.6% Subsistence foods 14.3% 6.3% 10.1% 1.7% 28.6% 29.2% 33.7% 7.6% Subsistence lifestyle 9.5% 14.6% 9.0% 7.6% 38.1% 31.3% 25.8% 17.8% The natural environment 9.5% 10.4% 4.5% 8.5% 23.8% 27.1% 15.7% 32.2% n=48 of 48 households in Old Harbor gave at least one reason, as did 21 of the 21 Larsen Bay households, 89 of the 89 Kodiak permit holder sample, and 118 of the 1221 households in the "other" Kodiak sample. 115
129 Table 69. Reported amounts of salmon given and received, study communities, Received salmon Gave Away Salmon Resource/Community Number of salmon 1 Number of Mean per Households 2 household 3 1 Number of salmon 2 Number of Households 3 Mean per Household Chinook salmon Old Harbor Larsen Bay Kodiak permit holders Kodiak Other Residents Chum salmon Old Harbor Larsen Bay Kodiak permit holders Kodiak Other Residents Coho salmon Old Harbor Larsen Bay Kodiak permit holders Kodiak Other Residents Pink salmon Old Harbor Larsen Bay Kodiak permit holders Kodiak Other Residents Sockeye salmon Old Harbor Larsen Bay Kodiak permit holders Kodiak Other Residents Total number of salmon reported received or given away 2 Number of households that provided an estimate 3 Mean for those households that provided an estimate 116
130 117 Figure 1. Location of study communities.
131 118 Figure 2. Kodiak City CDPs.
132 119 Figure 3. Ethnic makeup of Kodiak Island Borough,
133 Figure 4. Population profile, Kodiak road system permit holders, Figure 5. Population profile, Kodiak road system other residents,

134 Figure 6. Population history, Larsen Bay, Alaska,
135 Figure 7. Population profile, Larsen Bay, Alaska,

136 Figure 8. Population history, Old Harbor, Alaska,
137 Figure 9. Population profile, Old Harbor, Alaska,

138 125 Figure 10. Kodiak road system: number of subsistence permits returned,
139 126 Figure 11. Kodiak road system: Total salmon reported from subsistence permit and estimated from surveys,


140 Figure 12. Composition of salmon harvest, Kodiak road system permit holders, Figure 13. Composition of salmon harvest, Kodiak road system other residents,

141 128 Figure 14. Kodiak road system samples, 2012: salmon by source (pounds usable weight).
142 Figure 15. Salmon harvests by gear type, Kodiak road system,

143 Figure 16. Percentage of pounds of salmon harvested by source, Kodiak road system communities, 1991, 1992, 1993, and

144 Figure 17. Percentage of households reporting whether they had enough resources, Kodiak road system,
145 Figure 18. Salmon harvest locations, Kodiak road system communities,

146 Figure 19. Responses to the question, "Who taught you to use a gillnet?" All communities,
147 Figure 20. Reasons for using a gillnet to harvest salmon, all communities,
148 Figure 21. Reasons for not using a gillnet, all communities,

149 Figure 22. Composition of salmon harvest, Larsen Bay, Alaska,
150 Figure 23. Salmon harvest by gear type, Larsen Bay, Alaska,

151 138 Figure 24. Percentage of households reporting whether they had enough resources, Larsen Bay, Alaska, 2012.
152 139 Figure 25. estimated salmon harvests, lb per person, Larsen Bay, Alaska, 1982, 1986, , 1997, , and 2012.

153 140 Figure 26. Percentage of salmon harvested by source, Larsen Bay, Alaska 1986, 1989, , 1997, , and 2012.
154 141 Figure 27. Comparisons of permit and survey data, Larsen Bay, Alaska, 2012.
155 142 Figure 28. Salmon harvest locations, Larsen Bay, Alaska, 2012.

156 Figure 29. Composition of salmon harvest, Old Harbor, Alaska,
157 Figure 30. Salmon harvest by gear type, Old Harbor, Alaska
158 145 Figure 31. Percentage of households reporting whether they had enough resources, Old Harbor, Alaska, 2012.

159 146 Figure 32. Estimated salmon harvests, lb per person, Old Harbor, Alaska, 1982, 1986, , , and 2012.

160 147 Figure 33. Percentage of pounds of salmon harvested by source, Old Harbor, Alaska, 1986, , , and 2012.
161 148 Figure 34. Comparison of survey and permit data, Old Harbor, Alaska, 2012.
162 149 Figure 35. Salmon harvest locations, Old Harbor, Alaska, 2012.
163 150 Figure 36. Top reason for residing in community, all communities, 2012.

164 151 Figure 37. Reasons cited for residing in community, all communities, 2012.

165 152 Plate 1. Key Respondent in his work skiff, Larsen Bay, Alaska.

166 153 Plate 2. Drying shack on top of smokehouse, Larsen Bay, Alaska.

167 Plate 3. Smokehouse fire pit and deflector, Larsen Bay, Alaska. 154

168 155 Plate 4. Key respondent showing her smokehouse, Larsen Bay, Alaska.

169 Plate 5. Smokehouse, firepit, and deflector, Larsen Bay, Alaska. 156

170 157 Plate 6. Tonya Lee and key respondent baiting longline skate.

171 Plate 7. Key respondent with octopus caught on longline skate. 158

172 159 Plate 8. Aerial view of Big Creek with Old Harbor airstrip at bottom right.

173 160 Plate 9. Fishing for coho salmon on the banks of Big Creek, Old Harbor, Alaska.

174 161 Plate 10. Fighting a coho salmon on the bank of Big Creek, Old Harbor, Alaska.

175 162 Plate 11. Seining coho salmon Big Creek, Old Harbor, Alaska.

176 163 Plate 12. Key respondent preparing smoked salmon for jarring, Kodiak City.

177 164 Plate 13. Fishing for coho salmon Pasagshak River, Kodiak City.
178 ACKNOWLEDGEMENTS The U.S. Fish and Wildlife Service Office of Subsistence Management Fisheries Resource Monitoring Program provided $172,657 in funding for this two-year project through award number F12AC This report was submitted as the final report to U.S. Fish and Wildlife Service Office of Subsistence Management Fisheries Resource Monitoring Program for project number The authors would like to thank the people of Kodiak City, Larsen Bay and Old Harbor for volunteering their time, interest and energy to make this research project possible. Tonya Lee of the Kodiak National Wildlife Refuge was instrumental in carrying out fieldwork in Kodiak City, Larsen Bay and Old Harbor. Additional support came from the Larsen Bay Tribal Council and the Old Harbor Tribal Council. Tracie Krauthoefer of Corvus Culture provided valuable support in compiling research materials and preparing this report. Division of Subsistence staff contributors include Davin Holen who assisted the Principal Investigators in designing the project s investigation plan and Adam Knight who edited the final draft. 165
179 REFERENCES Bernard, H.R Research methods in anthropology: Qualitative and quantitative approaches, 4th edition edition. AltaMira Press: Lanham, MD. ISBN Cochran, W.G Sampling techniques, 3rd edition. John Wiley & Sons: New York. Donkersloot, R. and C. Carothers 2016 The Graying of the Alaskan Fishing Fleet. Environment: Science and Policy for Sustainable Development 58(3), pages Fall, J.A Patterns of subsistence uses of fish and wildlife resources in the area of the Exxon Valdez oil spill [in] L.J. Field, J.A. Fall, T.S. Nighswander, N. Peacock, and U. Varanasi, editors Evaluating and communicating subsistence seafood safety in a cross-cultural context: lessons learned from the Exxon Valdez oil spill. Society of Environmental Toxicology and Chemistry (SETAC): Pensacola, FL Update of the status of subsistence uses in Exxon Valdez oil spill area communities, Alaska Department of Fish and Game Division of Subsistence, Technical Paper No. 312: Juneau Report on proposed changes to nonsubsistence areas. Alaska Department of Fish and Game Division of Subsistence, Technical Paper No. 386: Anchorage Subsistence in Alaska: a year 2012 update. Alaska Department of Fish and Game Division of Subsistence: Anchorage. Fall, J.A., N.M. Braem, S.S. Evans, L. Hutchinson-Scarbrough, B. Jones, R. La Vine, T. Lemons, M.A. Marchioni, E. Mikow, J.T. Ream, and L.A. Sill 2014 Alaska subsistence and personal use salmon fisheries 2012 annual report. Alaska Diepartment of Fish and Game Division of Subsistence, Technical Paper No. 406: Anchorage. Fall, J.A. and R. Shanks 2000 Statewide Subsistence Fisheries Harvest Monitoring Strategy. U.S. Fish and Wildlife Service, Office of Subsistence Management, Fisheries Resource Monitoring Program Final Report (Study No ). Alaska Department of Fish and Game, Division of Subsistence: Anchorage. Jackson, J., J. Dinnocenzo, G. Spalinger, and M. Keyse 2012 Kodiak Management Area commercial salmon fishery annual management report, Alaska Department of Fish and Game, Fishery Management Report No : Anchorage. Kodiak Island Borough and Community Development Department 2008 Kodiak Island Borough Comprehensive Plan Update. Kodiak Island Borough Community Development Department under the direction of the Kodiak Island Borough Planning & Zoning Commission and Assembly: Kodiak. Mishler, C Black ducks and salmon bellies: an ethnography of Old Harbor and Ouzinkie, Alaska, Report for U.S. Minerals Management Service, Cooperative Agreement Alaska Department of Fish and Game Division of Subsistence, Technical Memorandum No. 7: Anchorage. Reedy-Maschner, K.L Aleut identities: tradition and modernity in an indigenous fishery, 61st book in the McGill-Queen s native and northern series. McGill-Queen s Univ. Press: Montréal, Québec. 166
180 Robbins, P Political ecology: a critical introduction, Critical introductions to geography, 2nd ed edition. J. Wiley & Sons: Chichester, West Sussex ; Malden, MA. Steffian, A.F. and P.G. Saltonstall 2004 Settlements of the Ayakulik-Red River drainage, Kodiak Archipelago, Alaska: comprehensive project report Report prepared for the U.S. Fish and Wildlife Service, Alaska Office of Visitors Services and Communication and the Kodiak National Wildlife Refuge. Alutiiq Museum and Archeological Repository: Kodiak. Wheeler, P. and A. Craver 2005 Office of Subsistence Management and Issues and Challenges of Integrating Tek into Subsistence Fisheries Management. Practicing Anthropology 27(1), pages Williams, L., P. Coiley-Kenner, and D. Koster 2010 Subsistence harvests and uses of salmon, trout, and char in Akhiok, Larsen Bay, Old Harbor, Ouzinkie, and Port Lions, Alaska, 2004 and Alaska Department of Fish and Game Division of Subsistence,Technical Paper No Wolfe, R.J Subsistence-Based Socioeconomic Systems in Alaska: An Introduction. Alaska Department of Fish and Game Division of Subsistence, Special Publication No. SP : Juneau The super-household: specialization in subsistence economies. Paper presented at the 14th annual meeting of the Alaska Anthropological Association, March 1987, Anchorage, Alaska. Alaska Department of Fish and Game Division of Subsistence: Juneau. Wolfe, R.J., W.E. Simeone, C.J. Utermohle, M.C. Pete, and National Science Foundation 1993 The sharing, distribution, and exchange of wild resources in Alaska: a compendium of materials presented to the Alaska Board of Fisheries. Alaska Department of Fish and Game Division of Subsistence: Juneau. 167
181 APPENDIX A KODIAK SUBSISTENCE PERMITS 168


182 State of Alaska subsistence fishing permit, Kodiak area. 169


183 State of Alaska subsistence fishing permit, Kodiak area. Page 2 of
184 Federal subsistence fishing permit, Kodiak area. 171


185 Federal subsistence fishing permit, Kodiak area Page 2 of
186 APPENDIX B SURVEY INSTRUMENT 173


187 174
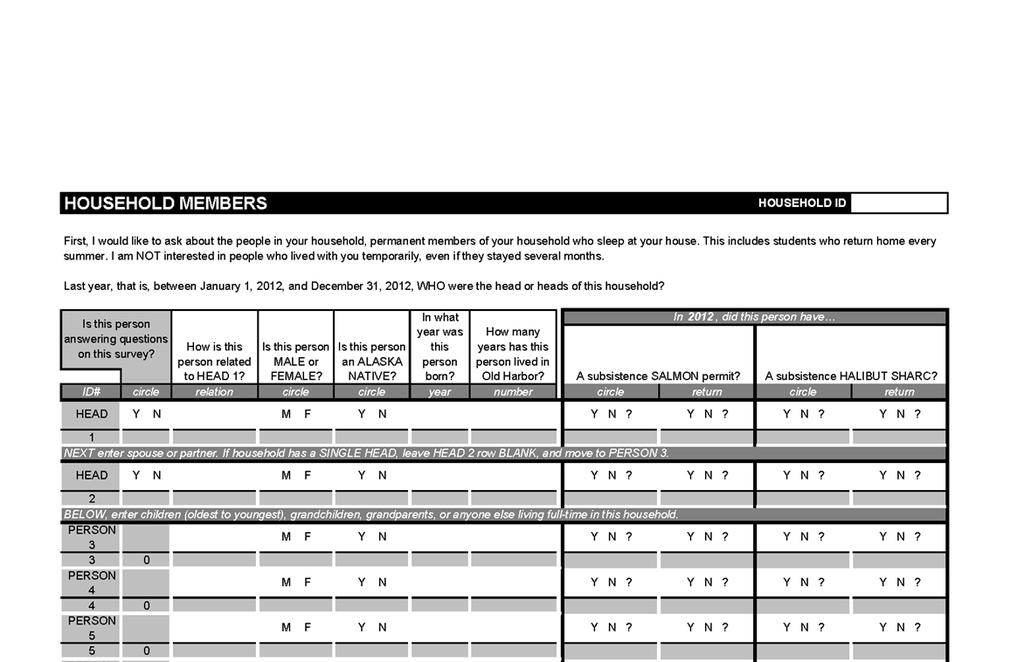
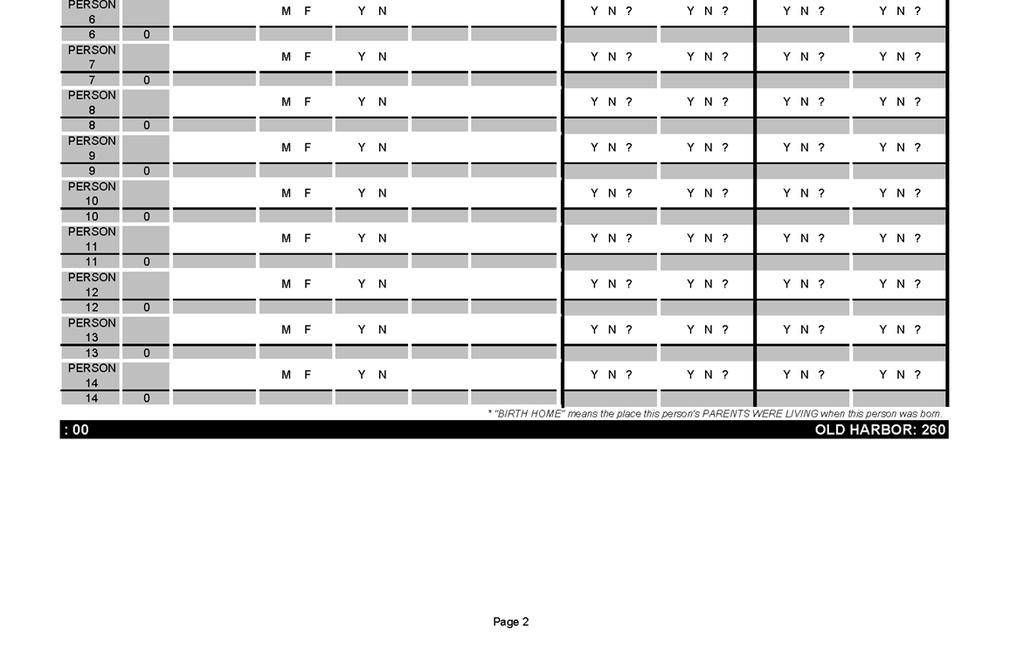
188 175
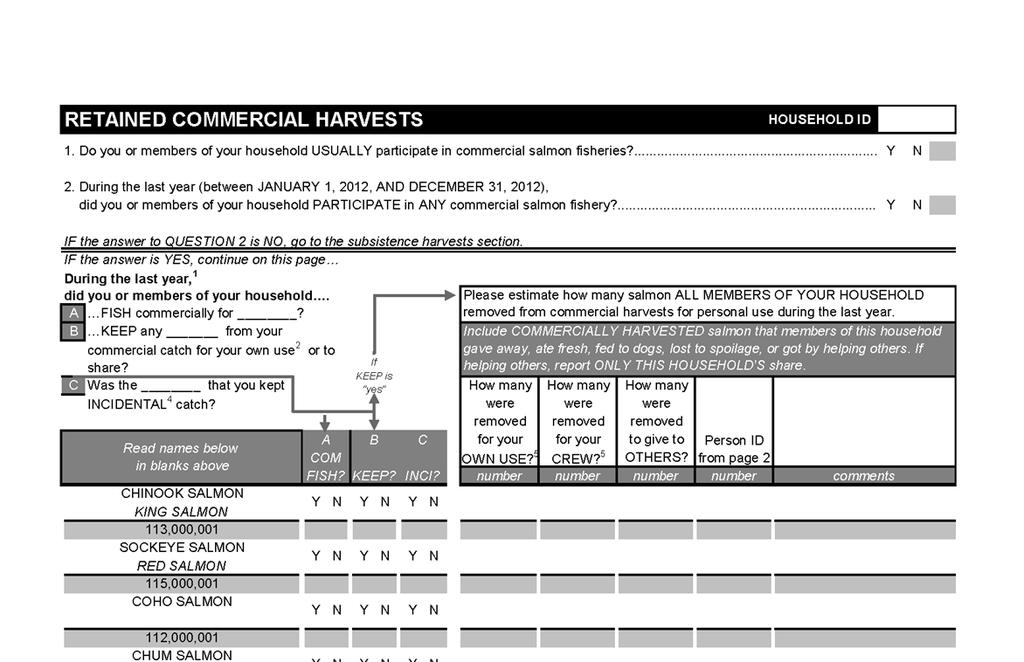
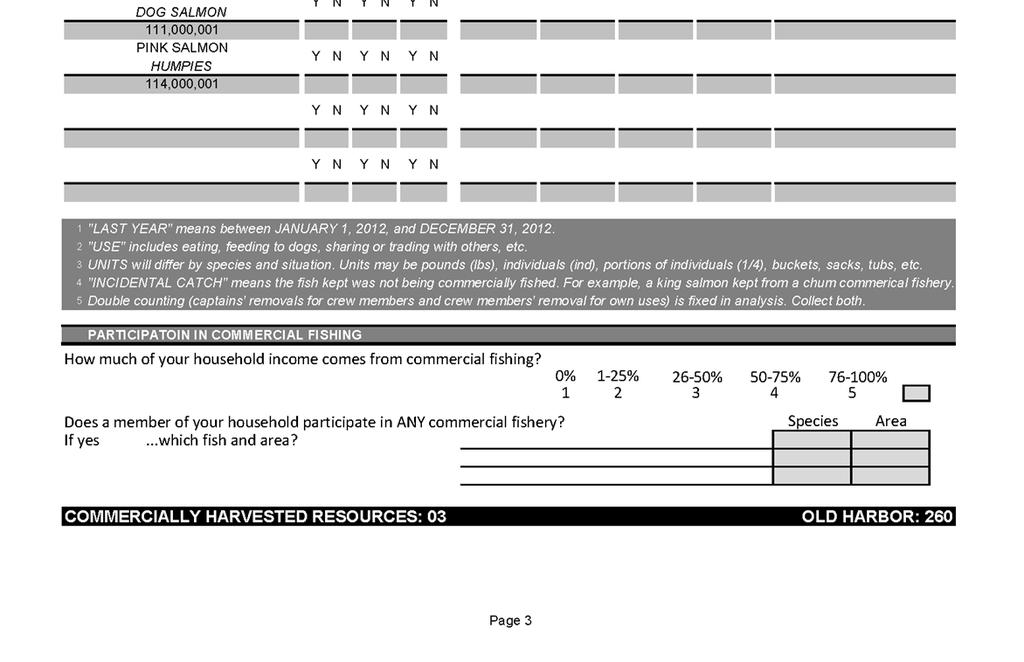
189 176
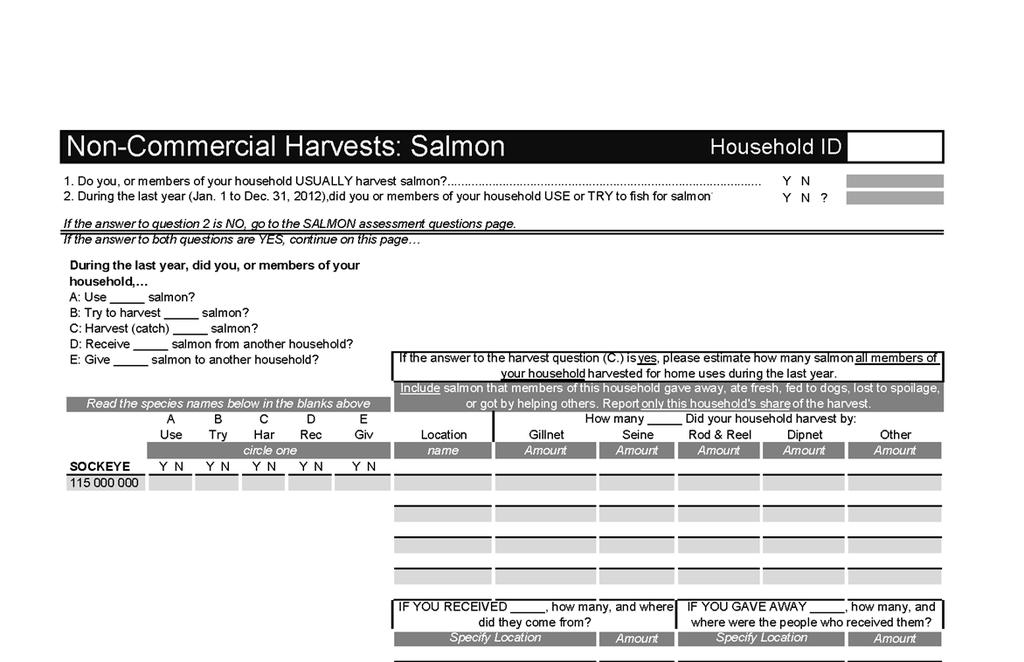
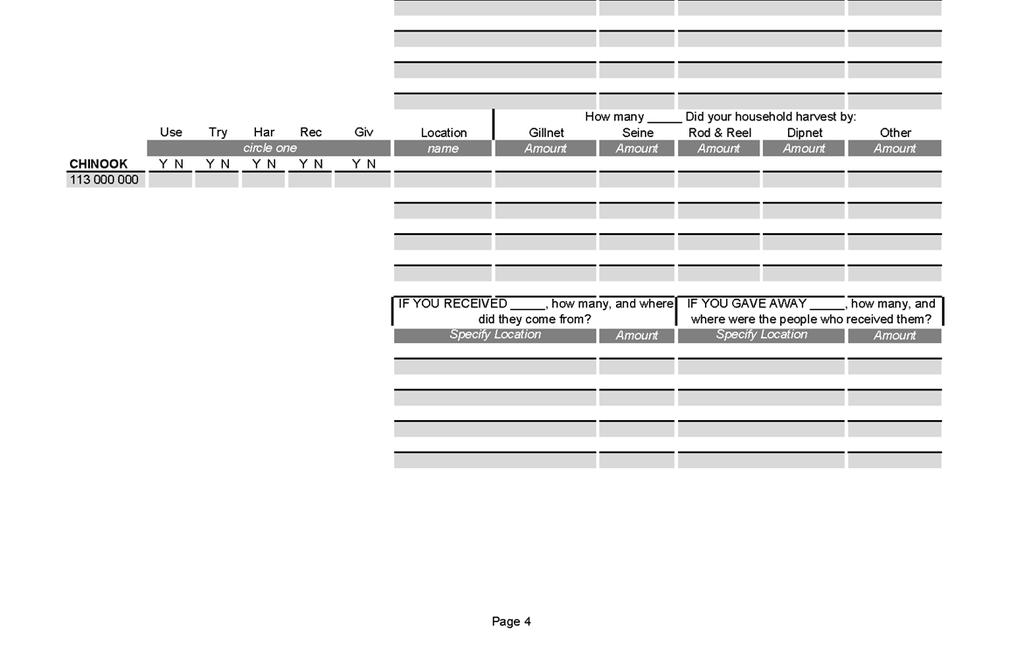
190 177
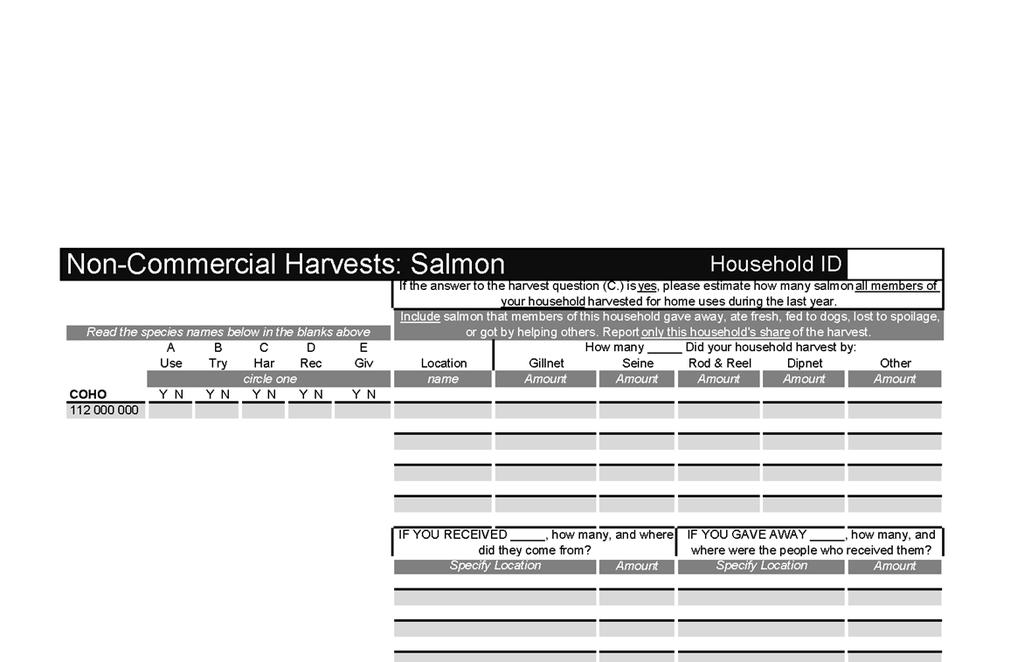
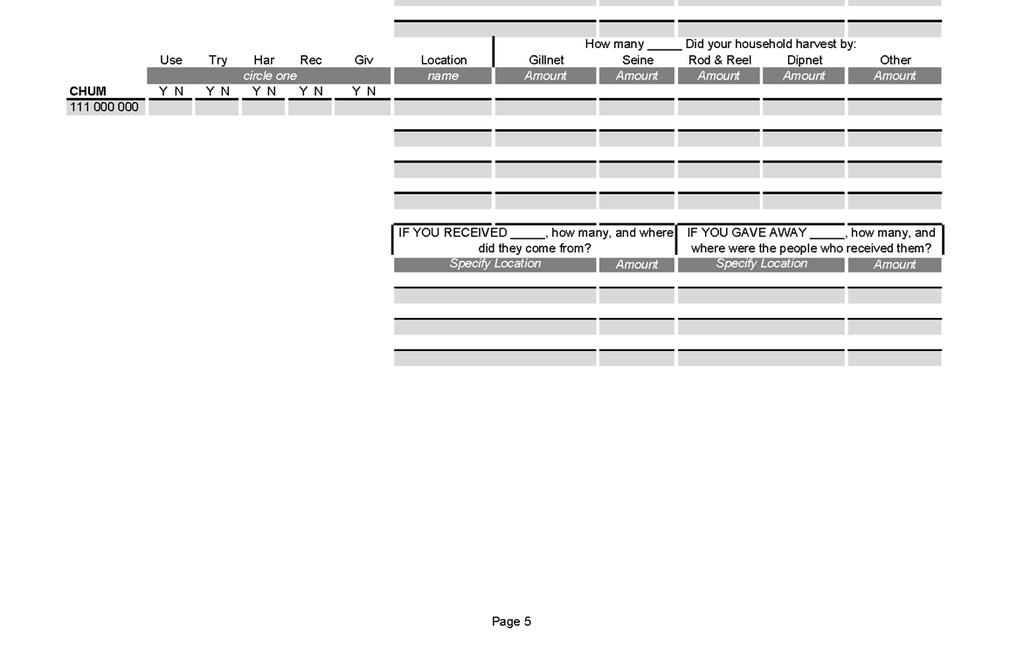
191 178
192 179
193 180


194 181
195 APPENDIX C CONVERSION FACTORS 182
196 The following table presents the conversion factors used in determining how many pounds were harvested of each resource surveyed. For instance, if respondents reported harvesting ten sockeye salmon, the quantity would be multiplied by the appropriate conversion factor (in this case 4.11) to show a harvest of lb of sockeye. Resource Unit Conversion Factor Chum salmon Individual 5.83 Coho salmon Individual 5.22 Chinook salmon Individual 5.31 Pink salmon Individual 2.61 Sockeye salmon Individual 4.11 Source ADF&G Division of Subsistence household surveys Note These estimated pounds usable weight were calculated using the average round weight of each species determined by the Division of Commercial Fisheries for the Kodiak area in The relatively small size of Chinook salmon reflects the round weight estimate produced by the Division of Commercial Fisheries. 183
197 APPENDIX D ADDITIONAL TABLES 184
198 Table 70. Sample achievement, Kodiak road system, Permit holders Random nonpermit holders Number of dwelling units 1, Interview goal Households interviewed Households failed to contact Households declined to be interviewed 34 8 Households moved or nonresident 5 1 Total households attempted to interview Refusal rate 25% 7% Final estimate of permanent households 1, Percentage of total households interviewed 6% 4% Interview weighting factor Sampled population 624 Estimated population 624 Source ADF&G Division of Subsistence household surveys,
199 Table 71. Sample acheivement, Larsen Bay, Number of dwelling units 34 Interview goal 28 Households interviewed 21 Households failed to contact 4 Households declined to be interviewed 1 Households moved or nonresident 2 Total households attempted to interview 26 Refusal rate 5% Final estimate of permanent households 26 Percentage of total households interviewed 81% Interview weighting factor 1.2 Sampled population 62 Estimated population 77 Source ADF&G Division of Subsistence household surveys,
200 Table 72. Sample acheivement, Old Harbor, Number of dwelling units 84 Interview goal 78 Households interviewed 48 Households failed to contact 23 Households declined to be interviewed 7 Households moved or nonresident 0 Total households attempted to interview 78 Refusal rate 13% Final estimate of permanent households 78 Percentage of total households interviewed 62% Interview weighting factor 1.6 Sampled population 124 Estimated population 202 Source ADF&G Division of Subsistence household surveys,
201 APPENDIX E LEE FAMILY SUBSISTENCE SALMON FISHING TRIP AT THE BUSKIN OUTLET, JUNE 8,
202 The following is a first-person account of a family salmon fishing trip written by Co-PI Tonya Lee. Lee is a long-time resident of the Kodiak road system and has participated in subsistence activities frequently over the years. Her written account and the photos are included here with her and her family s permission. We were planning to head to Uyak to work on our hunting cabin, but weather came in and kept us from traveling that weekend. Sunday worked out for subsistence fishing, which we were also ready and waiting to do. We often fish with friends so we can share the work and the catch. Usually George and another dad will harvest, and I enjoy the packing and processing, so I will meet them when they are done to help filet and package. We love to share ways of preparing and processing with other families. If George does not have another buddy to fish with, I enjoy going fishing as well. This year my family (4 of us) went with our friends and their six-year old son. George has a small boat, named Little Big Boat that is too small and would not be comfortable for all seven of us to fish all day, so we split the time in the boat. We packed some sandwiches and headed to the Buskin around 1200 hours on Sunday afternoon, June 8. The plan was to have the two men and my 12-year-old boy (Nevin) get started setting the net, and us moms and two younger children (Carlie and Destyn) were to hang out and play on the Buskin beach. Then, when they were ready, we would give them their sandwiches and trade off. The net was set approximately 1300 hours on Sunday. There were about ten other boats in the bay also setting nets, fishing for Buskin reds like us. After a couple of hours, Nevin rowed our little inflatable raft (which was brought out with the Little Big Boat ) to shore where we were playing on the beach to grab the sandwiches and trade off with the other kids. Carlie and Destyn then rowed back out to the boat to fish with the men. Everybody got a sandwich by this time and we were all happy. It was a nice day, with only a very light shower for part of the day. Nevin then attempted to sport fish on the Buskin River. The first spot he chose (the Pumphouse) was full of other anglers. He chose a quieter spot closer to the mouth (broken bridge # 1). He was not successful at catching with his fly rod, but he did run into a bear on the other side of the river directly from him. The picture he got was fuzzy, because his main concern at that time was not trying to get a good picture, but about what the bear wanted to do. The younger kids fished for a while then traded with Nevin again. By the time we looked at the clock it was after 2000 hours. George wanted to stay until 2100 hours, to see if more fish would show, but we pulled the net about 2015 hours. We caught five fish and fileted them at the CG base cleaning station. We use this facility because it is convenient to where George parks his boat. As a ten-year member of the Coast Guard Auxiliary, George is available to assist in rescues when boaters need assistance. His boat is conveniently parked by trailer at his work, not far from the Coast Guard launching station. After fileting the fish, we bagged them temporarily and put them on ice for the night. The next day we vacuumed sealed the fish for the freezer. Since we only got five filets each (2½ fish each), we will go out again as soon as the opportunity arises. Pasagshak Bay is a favorite spot in early July to gillnet for reds. We also like to go to Litnik to harvest our salmon. We like to smoke, can, and freeze our fish each year and eat them throughout the winter in many ways. We catch a lot of silvers in the late summer and fall and eat lots of other seafood throughout the year. 189

, then made the")
203 This is one of the main reasons we live on Kodiak Island for the fresh air, fishing and fun, not to mention fantastic weather and fabulous scenery. Our families played and ate lunch on the beach (above), then made the transition to the fishing boat in the bay by rafting out to the men (below). 190
.")


204 Our fishing gear just before setting the net at the Buskin (left). Then the net was set. This view looks southwest toward Chiniak (right). 191 While the other kids were in the boat, Nevin took it upon himself to catch a fish. The first spot was too crowded so he found a quieter spot down the river.


205 Another fishing boat with a gillnet in Womens Bay at the Buskin outlet. Our fishing partners at the cleaning and packing stations. 192
2013 Kotzebue Sound Salmon Fisheries Management Plan
 Regional Information Report 3A13-04 2013 Kotzebue Sound Salmon Fisheries Management Plan by Jim Menard Alaska Department of Fish and Game May 2013 Divisions of Sport Fish and Commercial Fisheries Symbols
Special Publication No. BOF
 Special Publication No. BOF 2015-02 Customary and Traditional Use Worksheet and Options for Amounts Reasonably Necessary for Subsistence: Tanner Crab, Dungeness Crab, Shrimp, and Miscellaneous Shellfish,
Stock Assessment of Sockeye Salmon from the Buskin River, Kodiak, Alaska, 2000
 Annual Project Report No. FIS 00-032 USFWS Office of Subsistence Management Fishery Information Services Division Stock Assessment of Sockeye Salmon from the Buskin River, Kodiak, Alaska, 2000 by Donn
Regional Information Report No. 3A Norton Sound Salmon Fisheries Outlook and Management Strategies
 Regional Information Report No. 3A15-02 2015 Norton Sound Salmon Fisheries Outlook and Management Strategies by Jim Menard May 2015 Alaska Department of Fish and Game Division of Commercial Fisheries Symbols
Fishery Management Report No Fishery Management Plan for the South Alaska Peninsula Area State-Waters Pacific Cod Season, 2013
 Fishery Management Report No. 13-01 Fishery Management Plan for the South Alaska Peninsula Area State-Waters Pacific Cod Season, 2013 by Trent Hartill Alaska Department of Fish and Game January 2013 Divisions
Alaska Peninsula-Aleutian Islands Management Area Food and Bait Herring Fishery Management Plans, 2015
 Fishery Management Report No. 15-26 Alaska Peninsula-Aleutian Islands Management Area Food and Bait Herring Fishery Management Plans, 2015 by Charles W. Russell Alaska Department of Fish and Game May 2015
SOUTHEASTERN DISTRICT MAINLAND (ALASKA PENINSULA AREA) SALMON MANAGEMENT PLAN, 1994
 SALMON MANAGEMENT PLAN, 1994") SOUTHEASTERN DISTRICT MAINLAND (ALASKA PENINSULA AREA) SALMON MANAGEMENT PLAN, 1994 James N. McCullough and Rodney D. Campbell Regional Information ~ e~ort' No. 4K94-14 Alaska Department of Fish and Game
SOUTHEASTERN DISTRICT MAINLAND (ALASKA PENINSULA AREA) SALMON MANAGEMENT PLAN, 1994 James N. McCullough and Rodney D. Campbell Regional Information ~ e~ort' No. 4K94-14 Alaska Department of Fish and Game
The Harvest of Moose, Caribou, Bear, and Gray Wolf in the Lower-Middle Yukon River Communities of Grayling, Anvik, Shageluk, and Holy Cross
 Technical Paper No. 305 The 2004 2005 Harvest of Moose, Caribou, Bear, and Gray Wolf in the Lower-Middle Yukon River Communities of Grayling, Anvik, Shageluk, and Holy Cross by Caroline L. Brown and David
Stock Assessment of Sockeye and Coho Salmon from Billy s Hole, Prince William Sound, Alaska, 2003
 Annual Project Report No. FIS 03-033 USFWS Office of Subsistence Management Fishery Information Services Division Stock Assessment of Sockeye and Coho Salmon from Billy s Hole, Prince William Sound, Alaska,
Technical Paper No. 310 Household Harvests of Moose, Caribou, Bears, and Wolves in 8 Central Kuskokwim Region Communities, Alaska,
 Technical Paper No. 310 Household Harvests of Moose, Caribou, Bears, and Wolves in 8 Central Kuskokwim Region Communities, Alaska, 2003 2006 by Tracie Krauthoefer Caroline Brown and David Koster June 2015
Chignik Area Subsistence Salmon Fisheries Research Report to the Alaska Board of Fisheries, January 2011
 Special Publication No. BOF 2010-06 RC 3 Tab 9 Chignik Area Subsistence Salmon Fisheries Research Report to the Alaska Board of Fisheries, January 2011 by Lisa Hutchinson-Scarbrough, Terri Lemons, James
SOUTH UNIMAK AND SHUMAGIN ISLANDS JUNE SALMON FISHERY MANAGEMENT PLAN, 2003
 SOUTH UNIMAK AND SHUMAGIN ISLANDS JUNE SALMON FISHERY MANAGEMENT PLAN, 2003 By Arnold R. Shaul Charles Burkey, Jr. and Joseph J. Dinnocenzo Regional Information Report 1 No. 4K03-20 Alaska Department of
Fishery Management Report No Pasagshak River Weir Report, 2015
 Fishery Management Report No.15-37 Pasagshak River Weir Report, 2015 by Mark J. Witteveen Alaska Department of Fish and Game September 2015 Divisions of Sport Fish and Commercial Fisheries Symbols and
INFORMATIONAL LEAFLET NO. 2. Length-Width Relationships of Carapace. Measurements of the King Crab
 INFORMATIONAL LEAFLET NO. 2 Length-Width Relationships of Carapace Measurements of the King Crab (Parali thodes camtschatica) Roy Ri ckey-westward Regional Di rector Alaska Department of Fish and Game
CFEC Permit Holdings, Harvests, and Estimated Gross Earnings by Resident Type in the Bristol Bay Salmon Gillnet Fisheries
 CFEC Permit Holdings, Harvests, and Estimated Gross Earnings by Resident Type in the Bristol Bay Salmon Gillnet Fisheries Photo courtesy of Lindsey Bloom CFEC Report 09-1N February, 2009 Commercial Fisheries
Alaska Peninsula-Aleutian Islands Management Area Food and Bait Herring Fishery Management Plans, 2013
 Fishery Management Report No. 13-13 The 2013 Dutch Harbor Food and Bait purse seine fishery allocation is corrected in the current publication. Nichols, Nathaniel W., 5/24/13 Alaska Peninsula-Aleutian
North Alaska Peninsula Salmon Management Plan, 2013
 Fishery Management Report No. 13-16 North Alaska Peninsula Salmon Management Plan, 2013 by Robert L. Murphy and Dawn M. Wilburn Alaska Department of Fish and Game April 2013 Divisions of Sport Fish and
Fishery Data Series No Distribution and Run Timing of Stocked McDonald Lake Sockeye Salmon,
 Fishery Data Series No. 15-38 Distribution and Run Timing of Stocked McDonald Lake Sockeye Salmon, 2011 2014 by Malika T. Brunette, Andrew W. Piston, and Steven C. Heinl Alaska Department of Fish and Game
Fishery Data Series No Kodiak Management Area Salmon Escapement and Catch Sampling Results, 2015
 Fishery Data Series No. 16-19 Kodiak Management Area Salmon Escapement and Catch Sampling Results, 2015 by Michelle L. Wattum Alaska Department of Fish and Game April 2016 Divisions of Sport Fish and Commercial
The Alaska Department of Fish and Game administers all programs and activities free from discrimination on the basis of sex, color, race, religion,
 The Alaska Department of Fish and Game administers all programs and activities free from discrimination on the basis of sex, color, race, religion, national origin, age, marital status, pregnancy, parenthood,
Cook Inlet Habitat Conservation Strategy
 Cook Inlet Habitat Conservation Strategy What is the Cook Inlet Habitat Conservation Strategy? It s a new effort to tie together all of NOAA Fisheries habitat-related science and management activities
ECONOMIC IMPACTS AND CONTRIBUTIONS OF SPORTFISHING IN ALASKA
 ECONOMIC IMPACTS AND CONTRIBUTIONS OF SPORTFISHING IN ALASKA 2 0 0 7 R E P O R T A Message from the Director CHARLIE SWANTON, DIRECTOR ADF&G, DIVISION OF SPORT FISH Alaska supports arguably some of the
Red Salmon Lake Data Report 2011
 Red Salmon Lake Data Report 2011 Prepared by: Nathan Weber, Biologist February 2012 The Red Salmon Lake Project was made possible through an Alaskan Sustainable Salmon Fund grant received from the Alaska
Subsistence Harvests of Pacific Halibut in Alaska, 2010
 Technical Paper No. 367 Subsistence Harvests of Pacific Halibut in Alaska, 2010 by James A. Fall and David Koster January 2012 Alaska Department of Fish and Game Division of Subsistence Symbols and Abbreviations
Charter Boat Fishing in Lake Michigan: 2017 Illinois Reported Harvest
 Illinois Department of Natural Resources Division of Fisheries Charter Boat Fishing in Lake Michigan: 2017 Illinois Reported Harvest Steven R. Robillard Illinois Department of Natural Resources Lake Michigan
The Next Generation of Fishermen in the Kodiak Archipelago:
 The Next Generation of Fishermen in the Kodiak Archipelago: Exploring Dynamics Contributing to the Graying o the Fleet in Alaska s Commercial Fishing Industry Danielle Ringer Kodiak Team: Courtney Carothers,
DEPARTMENT OF FISH AND GAME
 Sean Parnell, GOVERNOR DEPARTMENT OF FISH AND GAME November 4, 2011 DIVISION OF SPORT FISH 3298 Douglas Place Homer, AA 99603-8027 PHONE: (907) 235-8191 FAX: (907) 235-2448 and Douglas Island Center Bldg
Kodiak Sockeye Salmon Test Fishery Operational Plan, by Michelle L. Moore
 Kodiak Sockeye Salmon Test Fishery Operational Plan, 2013 by Michelle L. Moore Alaska Department of Fish and Game April 2013 Divisions of Sport Fish and Commercial Fisheries Symbols and Abbreviations The
1999 On-Board Sacramento Regional Transit District Survey
 SACOG-00-009 1999 On-Board Sacramento Regional Transit District Survey June 2000 Sacramento Area Council of Governments 1999 On-Board Sacramento Regional Transit District Survey June 2000 Table of Contents
Charter Boat Fishing in Lake Michigan: 2015 Illinois Reported Harvest
 Illinois Department of Natural Resources Division of Fisheries Charter Boat Fishing in Lake Michigan: 2015 Illinois Reported Harvest Steven R. Robillard Illinois Department of Natural Resources Lake Michigan
Judd Lake Adult Sockeye Salmon Data Report 2012
 Judd Lake Adult Sockeye Salmon Data Report 2012 Prepared by: Nathan Weber, Biologist July 2013 The Judd Lake Project was made possible through a State of Alaska Designated Legislative Grant. This page
A Study of Commercial Fishing Gear Selectivity During the 2012/13 Aleutian Islands Golden King Crab Fishery East of 174 W Longitude
 Fishery Data Series No. 13-41 A Study of Commercial Fishing Gear Selectivity During the 2012/13 Aleutian Islands Golden King Crab Fishery East of 174 W Longitude by Vicki Vanek, Douglas Pengilly, and M.
ALASKA DEPARTMENT OF FISH AND GAME
 RC 2 ALASKA DEPARTMENT OF FISH AND GAME STAFF COMMENTS COMMERCIAL, PERSONAL USE, SPORT, GUIDED SPORT, AND SUBSISTENCE FINFISH REGULATORY PROPOSALS COMMITTEE OF THE WHOLE GROUPS 1 6 FOR THE UPPER COOK INLET
Thomas Bay Baseline Investigation
 Regional Information Report No. 1J16-10 Thomas Bay Baseline Investigation by Patrick Fowler and Troy Thynes Alaska Department of Fish and Game November 2016 Divisions of Sport Fish and Commercial Fisheries
By: Howard D. Tait Division of Biological Research Juneau, Alaska. February 23,
 By: Howard D. Tait Division of Biological Research Juneau, Alaska February 23, 1962 - -- --- - INFORMATIONAL LEAFLET NO. 9 Kitoi Bay Research Station - Its Development, Accomplishments and Future Howard
Subsistence Harvests of Pacific Halibut in Alaska, 2008
 Technical Paper No. 348 Subsistence Harvests of Pacific Halibut in Alaska, 2008 by James A. Fall and David Koster January 2010 Alaska Department of Fish and Game Division of Subsistence Symbols and Abbreviations
A SURVEY OF 1997 COLORADO ANGLERS AND THEIR WILLINGNESS TO PAY INCREASED LICENSE FEES
 Executive Summary of research titled A SURVEY OF 1997 COLORADO ANGLERS AND THEIR WILLINGNESS TO PAY INCREASED LICENSE FEES Conducted by USDA Forest Service Rocky Mountain Research Station Fort Collins,
USEFUL RELATIONSHIPS
 Use the chart below for the homework problems in this section. USEFUL RELATIONSHIPS U.S. Customary 12 in. = 1 ft 3 ft = 1 yd 280 ft = 1 mi 16 oz = 1 lb 2000 lbs = 1 T 8 fl oz = 1 c 2 c = 1 pt 2 pts = 1
Port Graham: Holdings of Limited Entry Permits, Sablefish Quota Shares, and Halibut Quota Shares Through 1998 and Data On Fishery Gross Earnings
 Port Graham: Holdings of Limited Entry Permits, Sablefish Quota Shares, and Halibut Quota Shares Through 1998 and Data On Fishery Earnings CFEC Report 99-Port Graham-SN Alaska Commercial Fisheries Entry
Regional Operational Plan SF.4A Alaska Statewide Sport Fish Harvest Survey, 2014
 Regional Operational Plan SF.4A.2013.07 Alaska Statewide Sport Fish Harvest Survey, 2014 by William J. Romberg and Gretchen Jennings Alaska Department of Fish and Game August 2013 Divisions of Sport Fish
Alaska Sustainable Salmon Fund Statement of Work
 Alaska Sustainable Salmon Fund Statement of Work I. Project Title: Pasagshak Escapement Monitoring Phase 3 II. Project Number: III. Principal Investigator Michelle Wattum, Fishery Biologist II Alaska Department
Fishery Manuscript Series No Hatchery Chum Salmon Contribution to Southern Southeast Alaska Commercial Net Fisheries,
 Fishery Manuscript Series No. 13-1 Hatchery Chum Salmon Contribution to Southern Southeast Alaska Commercial Net Fisheries, 26 21 by Malika T. Brunette Andrew W. Piston Steven C. Heinl and Susan K. Doherty
Susitna-Watana Hydroelectric Project Document ARLIS Uniform Cover Page
 Alaska Resources Library & Information Services Document ARLIS Uniform Cover Page Title: Wildlife harvest analysis study, Study plan Section 10.20 : Final study plan SuWa 200 Author(s) Personal: Author(s)
Prince William Sound Aquaculture Corporation Economic Impact Update for 2010
 Prince William Sound Aquaculture Corporation Economic Impact Update for 2010 PWSAC has a Significant Impact on Alaska Salmon Fisheries During the past four seasons, salmon reared and released by the Prince
Northern Cook Inlet Chinook and Coho Salmon Escapement Surveys for
 Regional Operational Plan SF.2A.2013.16 Northern Cook Inlet Chinook and Coho Salmon Escapement Surveys for 2013-2015 by Samantha Oslund Alaska Department of Fish and Game June 2013 Divisions of Sport Fish
A.M. The time between 12:00 midnight and 12:00 noon. Houghton Mifflin Co. 1 Grade 4 Unit 5
 A.M. The time between 12:00 midnight and 12:00 noon. Houghton Mifflin Co. 1 Grade 4 Unit 5 bar graph A graph in which information is shown by means of rectangular bars. Favorite Sea Creature Sea Creature
Chapter 20. Sampling the Recreational Creel
 Chapter 20 Sampling the Recreational Creel 20.1 Introduction - Creel Surveys Management requires information Environment in which fish lives Management requires information (cont.) *Other organisms with
Chum Salmon Stock Status and Escapement Goals in Southeast Alaska
 Special Publication No. 11-21 Chum Salmon Stock Status and Escapement Goals in Southeast Alaska by Andrew W. Piston and Steven C. Heinl Alaska Department of Fish and Game December 2011 Divisions of Sport
Northern Chatham Strait Sockeye Salmon: Updated Stock Status, Fishery Management, and Subsistence Fisheries
 Regional Information Report No. 1J12-14 Northern Chatham Strait Sockeye Salmon: Updated Stock Status, Fishery Management, and Subsistence Fisheries by Julie Bednarski, David K. Harris, Kevin Monagle, Steven
Technical Paper No. 381 Alaska Subsistence and Personal Use Salmon Fisheries 2010 Annual Report
 Technical Paper No. 381 Alaska Subsistence and Personal Use Salmon Fisheries 2010 Annual Report by James A. Fall Benjamin M. Balivet Andrew R. Brenner Sarah S. Evans Davin Holen Lisa Hutchinson-Scarbrough
Hugh Smith Lake Sockeye Salmon Studies, 2013
 Fishery Data Series No. 15-07 Hugh Smith Lake Sockeye Salmon Studies, 2013 by Malika T. Brunette and Andrew W. Piston Alaska Department of Fish and Game March 2015 Divisions of Sport Fish and Commercial
Regional Information Report 5J
 Regional Information Report 5J.2016-06 Does the Queets Exploitation Rate Indicator Stock Represent the Distribution of Fishery Impacts of Washington Coastal Chinook Salmon Stocks in Pacific Salmon Treaty
Evaluating the Influence of R3 Treatments on Fishing License Sales in Pennsylvania
 Evaluating the Influence of R3 Treatments on Fishing License Sales in Pennsylvania Prepared for the: Pennsylvania Fish and Boat Commission Produced by: PO Box 6435 Fernandina Beach, FL 32035 Tel (904)
OR DUNGENESS CRAB FISHERY:
 E 55 OR DUNGENESS CRAB FISHERY: an economic analysis of productivity and profitability David S. Liao Joe B. Stevens OREGON STATE UNIVERSITY SEA GRANT COLLEGE PROGRAM Publication no. ORESU-T-75-005 AGRICULTURAL
Dauphin Lake Fishery. Status of Walleye Stocks and Conservation Measures
 Dauphin Lake Fishery Status of Walleye Stocks and Conservation Measures Date: December, 21 Dauphin Lake Fishery Status of Walleye Stocks and Conservation Measures Background: Walleye stocks in Dauphin
Special Publication No. BOG Customary and Traditional Use Worksheet: Snowy Owl, Game Management Units 17, 18, 22, 23, and 26
 Special Publication No. BOG 2016-05 Customary and Traditional Use Worksheet: Snowy Owl, Game Management Units 17, 18, 22, 23, and 26 Prepared by Alaska Department of Fish and Game, Division of Subsistence
Kodiak Management Area Salmon Escapement and Catch Sampling Results, 2006
 Fishery Management Report No. 07-14 Kodiak Management Area Salmon Escapement and Catch Sampling Results, 2006 by M. Birch Foster Alaska Department of Fish and Game April 2007 Divisions of Sport Fish and
CRACIUN RESEARCH. June 20, 2011 A M A R K E T R E S E A R C H S T CHA
 CRACIUN RESEARCH A M A R K E T R E S E A R C H S T U D Y CHA June 20, 2011 Craciun Research Anchorage. Seattle. Washington, DC 907.279.3982 www.craciunresearch.com 2011 Craciun Research. All rights reserved.
Socioeconomic Impacts of Crab Rationalization on the Aleutian East Borough Communities of False Pass, Akutan, and King Cove
 Socioeconomic Impacts of Crab Rationalization on the Aleutian East Borough Communities of False Pass, Akutan, and King Cove Dr. Marie Lowe Dr. Gunnar Knapp Assistant Professor of Anthropology Professor
Bison Identification Guide and Quiz
 Bison Identification Guide and Quiz Alaska Department of Fish and Game Division of Wildlife Conservation 2009 2 All winter photos by Mike Taras. All summer photos by Steve DuBois. The Alaska Department
Methodology for ISER Surveys of Alaska Halibut Fishermen
 Methodology for ISER Surveys of Alaska Halibut Fishermen by Gunnar Knapp Institute of Social and Economic Research University of Alaska Anchorage 3211 Providence Drive Anchorage, Alaska 99508 907-786-7710
Charter Boat Catch and Effort from the Michigan Waters of the Great Lakes, 1994
 Michigan DNR STATE OF MICHIGAN DEPARTMENT OF NATURAL RESOURCES Number 95-3 April 3, 1997 Boat Catch and Effort from the Michigan Waters of the Great Lakes, 1994 Gerald P. Rakoczy and Ronald F. Svoboda
Wildlife Ad Awareness & Attitudes Survey 2015
 Wildlife Ad Awareness & Attitudes Survey 2015 Contents Executive Summary 3 Key Findings: 2015 Survey 8 Comparison between 2014 and 2015 Findings 27 Methodology Appendix 41 2 Executive Summary and Key Observations
Peace River Water Use Plan. Monitoring Program Terms of Reference. GMSMON-1 Peace River Creel Survey
 Peace River Water Use Plan Monitoring Program Terms of Reference GMSMON-1 Peace River Creel Survey April 10, 2008 Terms of Reference for the Peace River Water Use Plan Monitoring Program: Peace River Creel
Regional Information Report No. 4K13-06 Chinook Salmon Genetics Sampling Along the Alaska Peninsula and Adjacent Areas Operational Plan, 2013
 Regional Information Report No. 4K13-06 Chinook Salmon Genetics Sampling Along the Alaska Peninsula and Adjacent Areas Operational Plan, 2013 by Mark J. Witteveen and Tyler H. Dann Alaska Department of
Overview of herring related findings of NCEAS Portfolio Effects Working Group
 Overview of herring related findings of NCEAS Portfolio Effects Working Group Northwest Eric Ward, Rich Brenner eric.ward@noaa.gov richard.brenner@alaska.gov September 8, 2017 Acknowledgments Thanks to
Swan Lake Sockeye Salmon Smolt Data Report 2010
 Swan Lake Sockeye Salmon Smolt Data Report 2010 Prepared by: Nathan Weber, Biologist June 2013 The Swan Lake Project was made possible through enhancement taxes paid by the commercial fishermen in Area
Subsistence-Recreational Conflicts Along the Togiak, Kanektok, and Goodnews Rivers: A Summary
 Special Publication No. SP1989-001 Subsistence-Recreational Conflicts Along the Togiak, Kanektok, and Goodnews Rivers: A Summary by Robert J. Wolfe 1989 Alaska Department of Fish and Game Division of Subsistence
ESTIMATED RETURNS AND HARVEST OF COLUMBIA RIVER FALL CHINOOK 2000 TO BY JOHN McKERN FISH PASSAGE SOLUTIONS
 ESTIMATED RETURNS AND HARVEST OF COLUMBIA RIVER FALL CHINOOK 2000 TO 2007 BY JOHN McKERN FISH PASSAGE SOLUTIONS ESTIMATED RETURNS AND HARVEST OF COLUMBIA RIVER FALL CHINOOK 2000 TO 2007 This analysis of
ALASKA DEPARTMENT OF FISH AND GAME DIVISION OF COMMERCIAL FISHERIES NEWS RELEASE
 ALASKA DEPARTMENT OF FISH AND GAME DIVISION OF COMMERCIAL FISHERIES NEWS RELEASE Sam Cotten, Commissioner Scott Kelley, Director Contact: Cordova ADF&G Stormy Haught, PWS Finfish Research Biologist 401
Chignik Bay, Chignik Lagoon, Chignik Lake, and Perryville: an Ethnographic Study of Traditional Subsistence Salmon Harvests and Uses
 Technical Paper No. 390 Chignik Bay, Chignik Lagoon, Chignik Lake, and Perryville: an Ethnographic Study of Traditional Subsistence Salmon Harvests and Uses by Lisa Hutchinson-Scarbrough, Meredith A. Marchioni,
Department of Fish and Game
 Department of Fish and Game DIVISION OF SPORT FISH 3298 Douglas Place Homer, AK 99603 Main: 907-235-8191 Fax: 907-235-2448 P.O. Box 110024 Juneau, AK 99811-0024 Main: 907-465-4270 Fax: 907-465-2034 October
FISHERY MANAGEMENT PLAN FOR THE RED KING CRAB COMMERCIAL FISHERY IN BRISTOL BAY REGISTRATION AREA T, Rance Morrison
 FISHERY MANAGEMENT PLAN FOR THE RED KING CRAB COMMERCIAL FISHERY IN BRISTOL BAY REGISTRATION AREA T, 1999 by Rance Morrison Regional Information Report 1 No. 4K00-6 Alaska Department of Fish and Game Division
ALABAMA HUNTING SURVEY
 ALABAMA HUNTING SURVEY 2010-2011 SEASON Randy Liles STUDY LEADER Federal Assistance Project funded by your purchase of hunting licenses and equipment. ALABAMA DIVISION OF WILDLIFE AND FRESHWATER FISHERIES
The 2001 Economic Benefits of Hunting, Fishing and Wildlife Watching in MISSOURI. Prepared by:
 The 2001 Economic Benefits of Hunting, Fishing and Wildlife Watching in MISSOURI Prepared by: Southwick Associates, Inc. PO Box 6435 Fernandina Beach, FL 32035 Ph (904) 277-9765 Fax (904) 261-1145 Email:
Impacts of Halibut IFQs and Changing Kodiak Communities. Courtney Carothers University of Washington
 Impacts of Halibut IFQs and Changing Kodiak Communities Courtney Carothers University of Washington Alaska Fishing Communities Conference Anchorage, AK September 2006 Dissertation Research 12 months of
U.S. Fish and Wildlife Service Native American Crosscut Funding
 U.S. Fish and Wildlife Service Native American Crosscut Funding Tribal / Interior Budget Council National Budget Meeting L Enfant Plaza Hotel Washington, DC November 8, 2013 U.S. Fish and Wildlife Service
2016 Capital Bikeshare Member Survey Report
 2016 Capital Bikeshare Member Survey Report Prepared by: LDA Consulting Washington, DC 20015 (202) 548-0205 February 24, 2017 EXECUTIVE SUMMARY Overview This report presents the results of the November
Salmon bycatch patterns in the Bering Sea pollock fishery
 Salmon bycatch patterns in the Bering Sea pollock fishery James Ianelli Seattle, WA Data from the North Pacific Observer Program (Fisheries Monitoring and Assessment) were analyzed for seasonal, temporal,
Seafood Industry. The 2012 Juneau and Southeast Alaska Economic Indicators 11/1/12 Page 60
 Seafood Industry In 2011, fishermen in Southeast landed 395,628,268 pounds of fish with an ex vessel value of $391,091,684. This harvest resulted in 272.6 million pounds of product, with a wholesale value
Application of a New Method for Monitoring Lake Trout Abundance in Yukon: Summer Profundal Index Netting (SPIN)
") Application of a New Method for Monitoring Lake Trout Abundance in Yukon: Summer Profundal Index Netting (SPIN) Prepared by: Lars Jessup Nathan Millar November 2011 Application of a New Method for Monitoring
Application of a New Method for Monitoring Lake Trout Abundance in Yukon: Summer Profundal Index Netting (SPIN) Prepared by: Lars Jessup Nathan Millar November 2011 Application of a New Method for Monitoring
Economic Values of Sport, Personal Use, and Commercial Salmon Fishing in Upper Cook Inlet. (Executive Summary)
") Economic Values of Sport, Personal Use, and Commercial Salmon Fishing in Upper Cook Inlet (Executive Summary) Kenai river sportfishing association p.o. box 1228 Soldotna, alaska 99669 January 2008 Kenai
Economic Values of Sport, Personal Use, and Commercial Salmon Fishing in Upper Cook Inlet (Executive Summary) Kenai river sportfishing association p.o. box 1228 Soldotna, alaska 99669 January 2008 Kenai
DEER HUNT RESULTS ON ALABAMA WILDLIFE MANAGEMENT AREAS ANNUAL REPORT, CHRISTOPHER W. COOK STUDY LEADER MAY, 2006
 DEER HUNT RESULTS ON ALABAMA WILDLIFE MANAGEMENT AREAS ANNUAL REPORT, 2005-2006 CHRISTOPHER W. COOK STUDY LEADER MAY, 2006 ALABAMA DIVISION OF WILDLIFE AND FRESHWATER FISHERIES Federal Aid Project funded
SOCIETAL GOALS TO DETERMINE ECOSYSTEM HEALTH: A FISHERIES CASE STUDY IN GALVESTON BAY SYSTEM, TEXAS
 SOCIETAL GOALS TO DETERMINE ECOSYSTEM HEALTH: A FISHERIES CASE STUDY IN GALVESTON BAY SYSTEM, TEXAS Anthony S. Pait, NOAA, National Centers for Coastal Ocean Science Thomas P. O Connor, David R. Whitall,
Fishery Data Series No Abundance and Length Composition of Cutthroat Trout in Florence Lake, Southeast Alaska, 2002
 Fishery Data Series No. 16-41 Abundance and Length Composition of Cutthroat Trout in Florence Lake, Southeast Alaska, 2002 by Peter D. Bangs and David C. Love Alaska Department of Fish and Game October
Rock Creek Huntington County Supplemental Evaluation
 Rock Creek Huntington County Supplemental Evaluation Date of Survey: September 8 to September 10, 2008 Biologist: Rod A. Edgell Survey Objectives: Conduct population estimates for game fish at Rock Creek
UPPER COOK INLET COMMERCIAL HEFGUNG AND SMELT FISHERIES, 1998
 UPPER COOK INLET COMMERCIAL HEFGUNG AND SMELT FISHERIES, 1998 Report for the Alaska Board of Fisheries BY Jeff Fox REGIONAL INFORMATION REPORT NO. 2A98-29 Alaska Department of Fish and Game Division of
Kenai River Sockeye Escapement Goals. United Cook Inlet Drift Association
 Kenai River Sockeye Escapement Goals United Cook Inlet Drift Association 2014 Evaluating Sockeye Escapement Goals in the Kenai River Utilizing Brood Tables and Markov Tables This presentation pertains
SOUTH UNIMAK AND SHUMAGIN ISLANDS JUNE SALMON FISHERY MANAGEMENT PLAN, Arnold Shaul Robert Berceli Rodney Campbell and Jim Cofske
 SOUTH UNIMAK AND SHUMAGIN ISLANDS JUNE SALMON FISHERY MANAGEMENT PLAN, 1997 By Arnold Shaul Robert Berceli Rodney Campbell and Jim Cofske Regional Information Report 1 No. 4K97-29 Alaska Department of
Report to the Benjamin Hair-Just Swim For Life Foundation on JACS4 The Jefferson Area Community Survey
 Report to the Benjamin Hair-Just Swim For Life Foundation on JACS4 The Jefferson Area Community Survey Prepared by: Kara Fitzgibbon, M.A. Research Analyst Matthew Braswell, M.A. Research Analyst Yuliya
Annual Pink Shrimp Review
 Annual Pink Shrimp Review Oregon Department of Fish and Wildlife ODFW Marine Region, Marine Science Dr., Bldg. #3, Newport, OR 97365 (503) 867-4741 TO: FROM: OREGON SHRIMP INDUSTRY BOB HANNAH, PINK SHRIMP
Fishery Management Report No Area Management Report for the Recreational Fisheries of the Southwest Alaska Sport Fish Management Area, 1999
 Fishery Management Report No. 01-6 Area Management Report for the Recreational Fisheries of the Southwest Alaska Sport Fish Management Area, 1999 by Dan O. Dunaway and Sandra Sonnichsen March 2001 Alaska
Fishery Data Series No Migratory Timing and Abundance Estimates of Sockeye Salmon into Upper Cook Inlet, Alaska, 2012
 Fishery Data Series No. 14-25 Migratory Timing and Abundance Estimates of Sockeye Salmon into Upper Cook Inlet, Alaska, 2012 by Aaron W. Dupuis and T. Mark Willette Alaska Department of Fish and Game May
OPTIMUM ESCAPEMENT GOALS FOR CHINOOK SALMON IN THE TRANSBOUNDARY ALSEK RIVER
 Canadian Science Advisory Secretariat Science Advisory Report 2011/019 OPTIMUM ESCAPEMENT GOALS FOR CHINOOK SALMON IN THE TRANSBOUNDARY ALSEK RIVER Chinook salmon adult spawning phase. DFO website. Figure
Chum Salmon Stock Status and Escapement Goals in Southeast Alaska
 Special Publication No. 14-13 Chum Salmon Stock Status and Escapement Goals in Southeast Alaska by Andrew W. Piston and Steven C. Heinl Alaska Department of Fish and Game September 2014 Divisions of Sport
Regional Information Report 5J13-12 Report to the Alaska State Legislature on Status of Cook Inlet Coho and Sockeye Salmon Genetic Projects, 2013
 Regional Information Report 5J13-12 Report to the Alaska State Legislature on Status of Cook Inlet Coho and Sockeye Salmon Genetic Projects, 2013 by Nick DeCovich, Andy Barclay, Chris Habicht, Mark Willette,
Recreational Fisheries in the Prince William Sound Management Area,
 Fishery Management Report No. 14-44 Recreational Fisheries in the Prince William Sound Management Area, 211 213 by Mike Thalhauser Alaska Department of Fish and Game November 214 Divisions of Sport Fish
Socioeconomic Characteristics of Payang Seine (Lampara) and Driftnet Fisheries in West Sumatra, Indonesia
 and Driftnet Fisheries in West Sumatra, Indonesia") SOCSCIENCE Editor : K. Viswanathan Social, Economic and Policy Aspects of Fisheries Socioeconomic Characteristics of Payang Seine (Lampara) and Driftnet Fisheries in West Sumatra, Indonesia L.W. Zen, S.Y.
SOCSCIENCE Editor : K. Viswanathan Social, Economic and Policy Aspects of Fisheries Socioeconomic Characteristics of Payang Seine (Lampara) and Driftnet Fisheries in West Sumatra, Indonesia L.W. Zen, S.Y.
Executive Administrator
 March 3, 2017 Representative Louise Stutes, Chairman House Special Committee on Fisheries Alaska State Legislature State Capitol Juneau, AK 99801-1182 RE: Support for HB128 Shellfish Enhancement Dear Chairman
Department of Fish and Game
 MEMORANDUM TO: THRU: Kevin Duffy Deputy Commissioner Juneau Rob Bentz Deputy Director Division of Sport Fish Juneau State Of Alaska Department of Fish and Game DATE: September 21, 21 TELEPHONE NO: 465-6187