COMMERCIAL POLICY STUDY UPDATE
|
|
|
- Chloe Whitehead
- 5 years ago
- Views:
Transcription


1 BACKGROUND & ANALYSIS REPORT for the Community of Stouffville COMMERCIAL POLICY STUDY UPDATE October 2012 AND W. SCOTT MORGAN & ASSOCIATES
2 Community of Stouffville Commercial Policy Study Update Background and Analysis Report Table of Contents 1. Why is The Town undertaking a Commercial Policy Study Update? What is the purpose of the Commercial Policy Study Update? What is the Study Process? How does the Update relate to the 2005 Commercial Policy Study? What are the components of the Community of Stouffville s Existing Retail Commercial Hierarchy? Existing Hierarchy Stouffville s Closest Competition How adequate is the supply of lands set aside for commercial purposes? Who is shopping in the Community of Stouffville and what are they shopping for? Market Study Conclusions Implications for the Current Commercial Planning Policy Framework APPENDIX I: Projections of Residual Market Demands
3 Community of Stouffville Commercial Policy Study Update Background and Analysis Report 1. Why is The Town undertaking a Commercial Policy Study Update? In 2005, Council adopted a Commercial Policy Study, which assessed the commercial land use requirements of the Community of Stouffville in the context of emerging residential growth. The strategy projected commercial land use needs through to the 2011 time period based upon the growth projections at that time. Given that the Commercial Policy Study is now over five (5) years old, the Town determined that it was necessary to revisit the original study assumptions to confirm their validity and to maintain a responsive commercial policy framework in the Stouffville Secondary Plan to assess future commercial development applications and to guide commercial land use policy. In particular, the Study is being undertaken in the context of updated population forecasts (York Region, May 31, 2012) which indicate that current population levels in the Town of Whitchurch-Stouffville will increase by about 50% over the next 19 years ( ) from 41,235 in 2012 to 60,600 in What is the purpose of the Commercial Policy Study Update? The Update to the Study is to assess the implications of growth to date on the commercial area, and to examine commercial land use requirements through to the year This comprehensive review will assess the adequacy of the supply of lands set aside for commercial purposes and recommend whether any revisions are required to land use designations and policies/zone standards to protect the planned function of each commercial area in the Community. 3. What is the Study Process? The Commercial Policy Study Update involves the following tasks: Phase 1: Task 1.1 Project Initiation This Task involved the initiation of the study process including the initial public notice and stakeholder consultation. This task is complete. Task 1.2 Background Analysis Task 1.2 involved a comprehensive market study to identify retail commercial needs, in particular the magnitude, timing and mix of any required future additions to the Community of Stouffville s existing commercial development 1

4 Community of Stouffville Commercial Policy Study Update Background and Analysis Report that are warranted in the long and short term. The results of the market work are reflected in this Background and Analysis Report, with the detailed analysis found in Appendix I, Projections of Residual Market Demands. The release of this report concludes the work in Task 1.2. Task 1.3 Draft Background Report Initial Review The review of the Background and Analysis Report will be carried out with the public and key stakeholders in Task 1.3. This input will inform the work in Phase 2. Phase 2: Task 2.1 Official Plan and Zoning By-law Amendments A report outlining specific recommendations for amendments to the Official Plan and Zoning By-law will be developed based on the input in Task 1.3. The report will then be submitted to Council. Based on Council s direction, formal Secondary Plan and Zoning By-law amendments will be prepared and released for public review. Task 2.2 Public Review A formal public review of the amendments will be carried out before they are submitted to Council for approval. 2
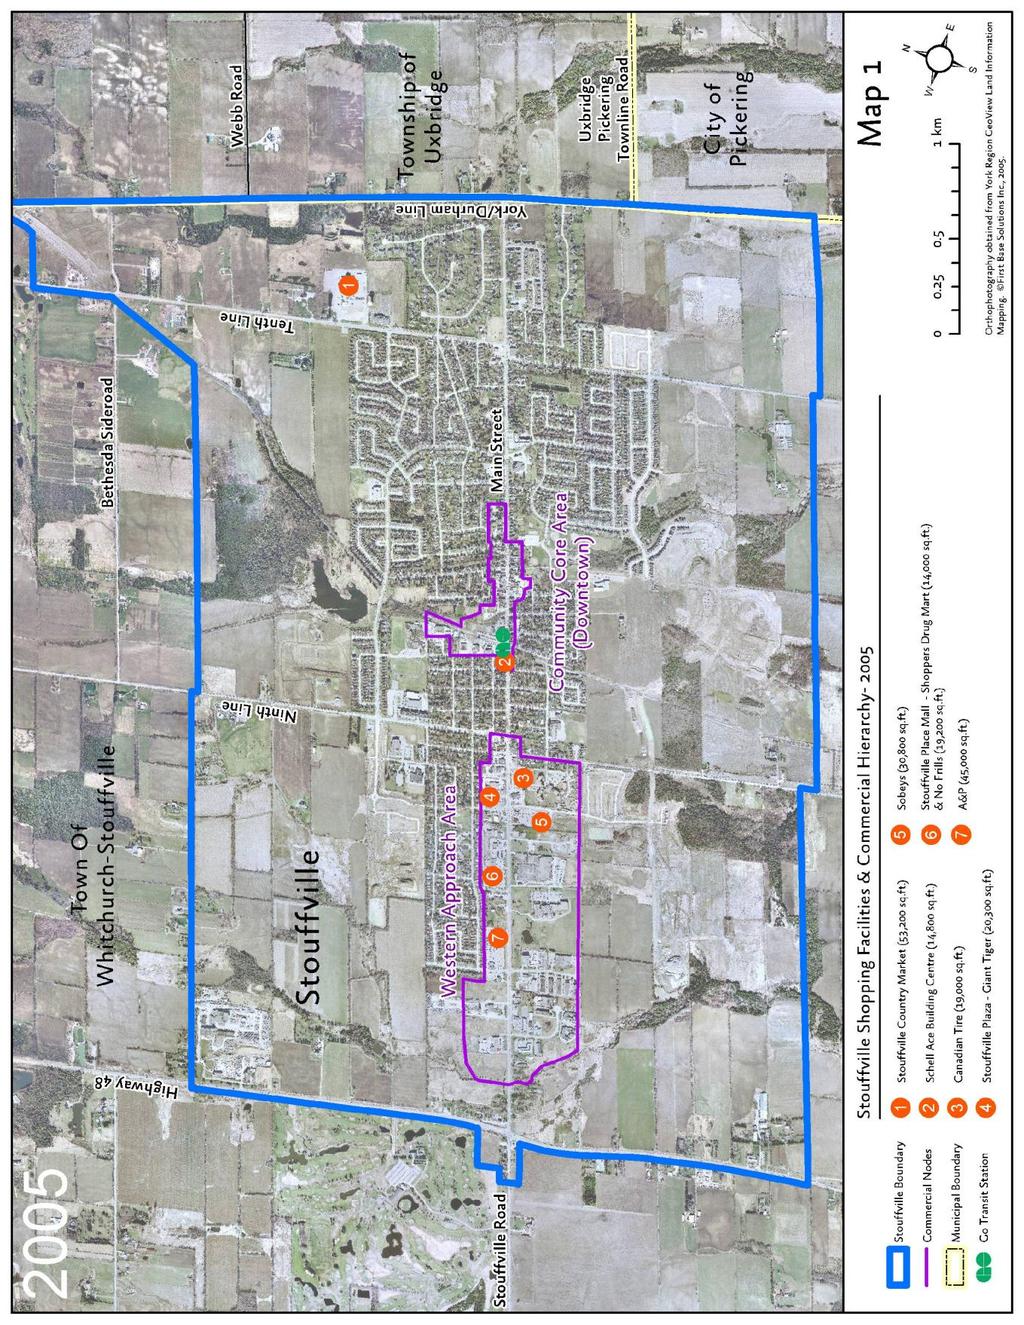
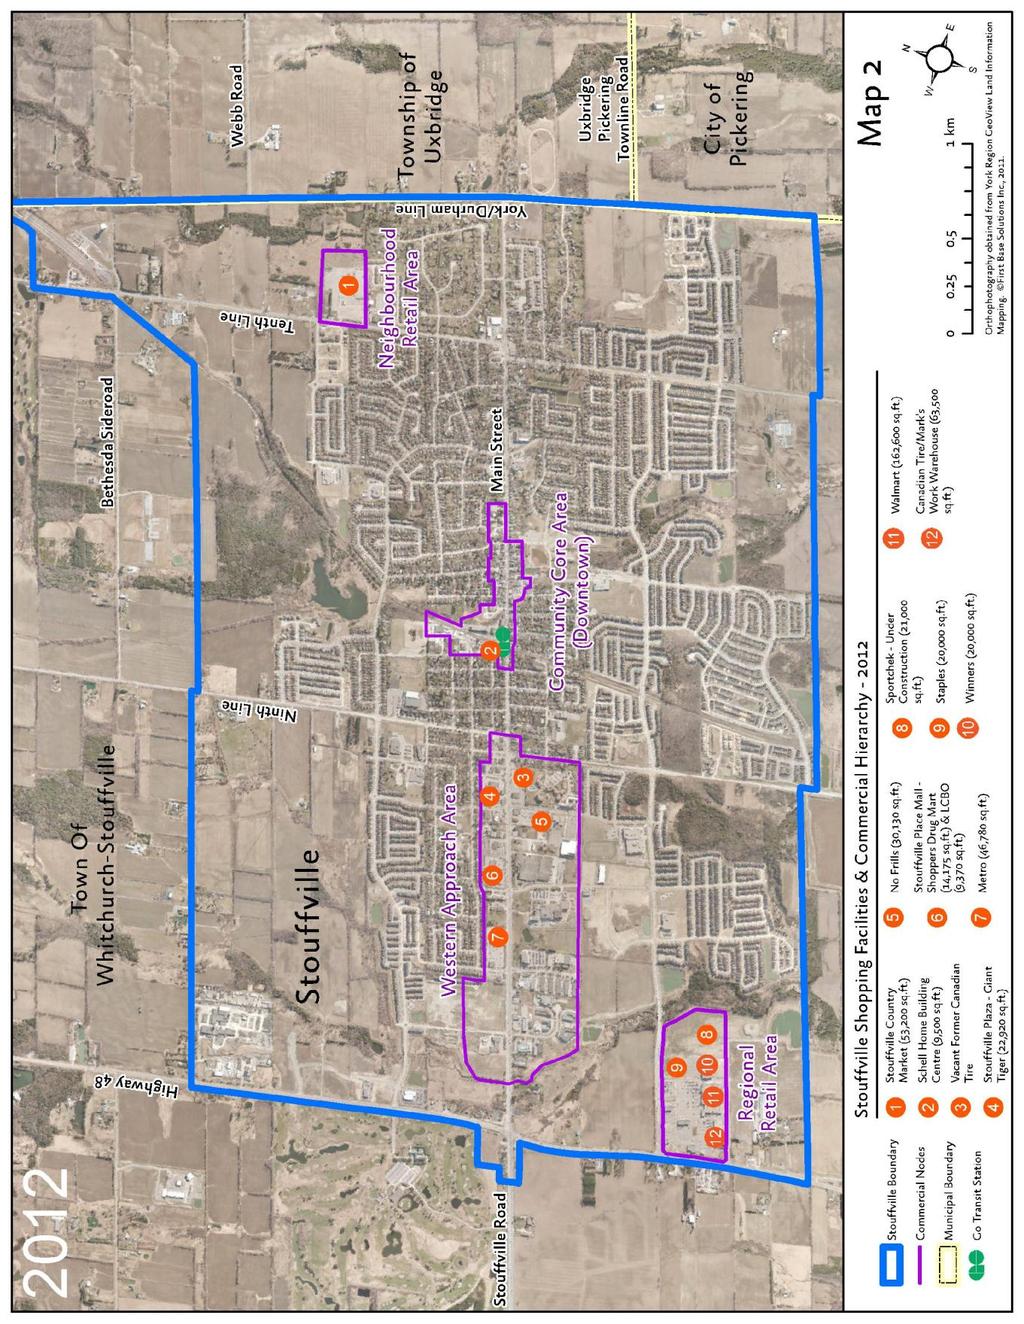
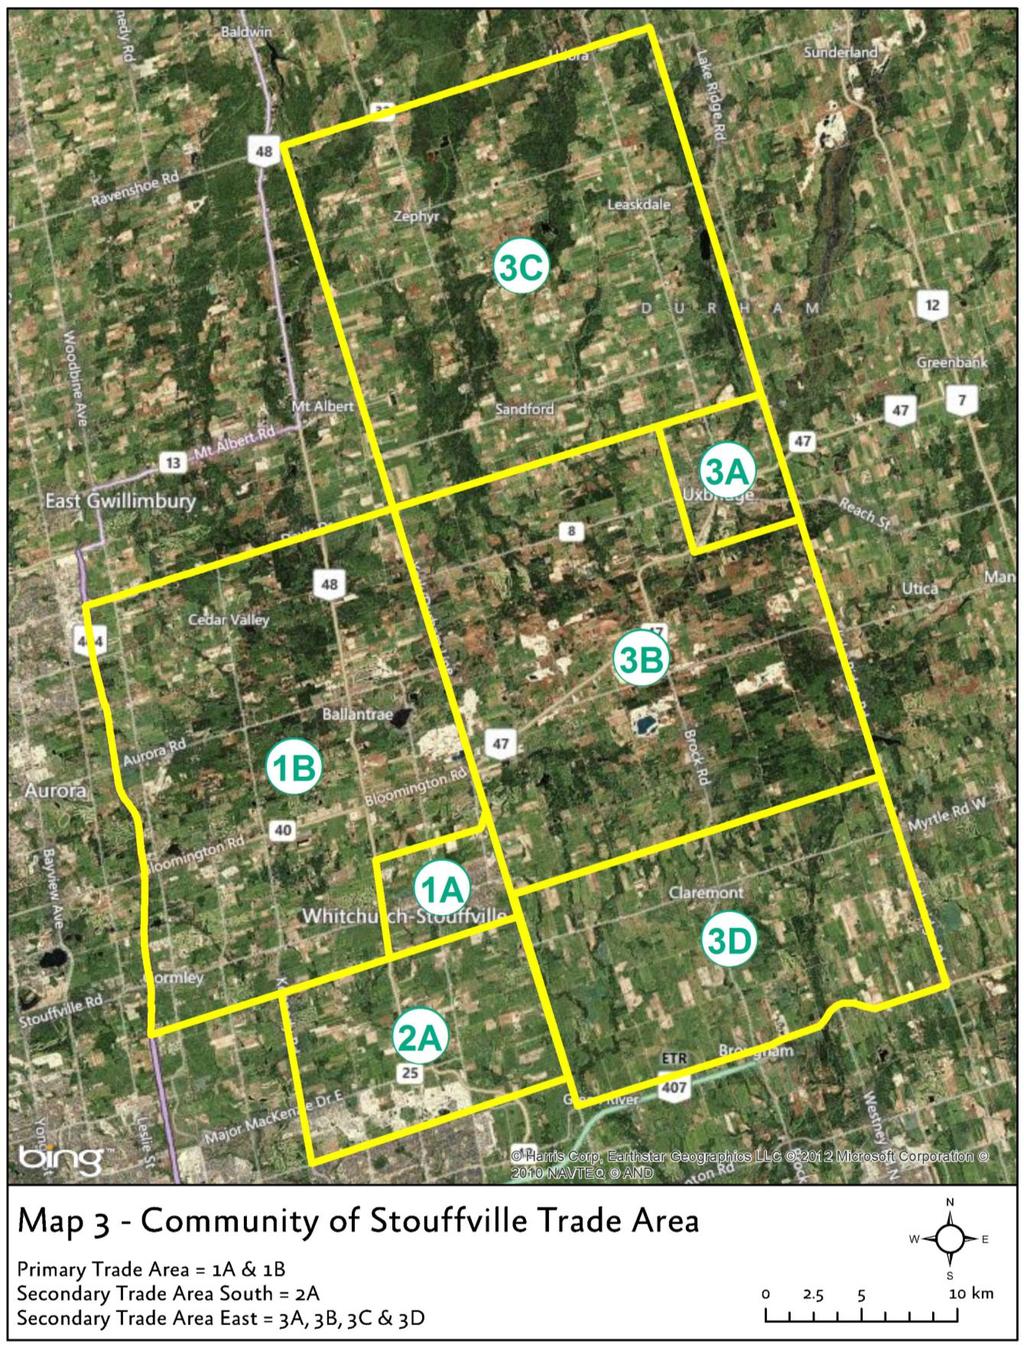
5 Community of Stouffville Commercial Policy Study Update Background and Analysis Report 4. How does the Update relate to the 2005 Commercial Policy Study? The 2005 Commercial Policy Study took the form of a peer review by the Town s consultants of market studies submitted by proponents of two major commercial developments. Those market studies were carried out by Malone Given Parsons Ltd. and urbanmetrics inc. The 2005 review resulted in the establishment of a new regional commercial designation at Hoover Park Drive and Highway 48 (Hoover Park Town Centre), and policies that would protect and preserve commercial development opportunities in the Community Core Area (Downtown Stouffville) and the Western Approach Area (see Maps 1 & 2). In addition, a Neighbourhood Retail Area to permit the development of a node of neighbourhood focused commercial activity was identified on the eastern side of the Community. The updated market projections underlying the current Study Update found in Appendix I to this report, repeat the empirical research undertaken in 2005 by Malone Given Parsons Ltd. (MGP). MGP tested a trade area for the Community of Stouffville that included Whitchurch-Stouffville as the Primary Trade Area and secondary zones in Northeast Markham (Secondary Trade Area South) and Uxbridge/North Pickering (Secondary Zone East) (see Map 3). The updated empirical research includes licence plate surveys that confirm the previously defined trade area, and a consumer telephone survey within those same trade area boundaries. An updated floor space inventory has also been compiled. 5. What are the components of the Community of Stouffville s Existing Retail Commercial Hierarchy? 5.1 Existing Hierarchy The commercial hierarchy is spread over three key nodes - the Downtown, the Western Approach Area, and the Hoover Park Town Centre power centre. There is also a Neighbourhood Retail Area on the eastern side of the Community (See Map 2). These nodes are differentiated by function, separated by distance, yet distributed to facilitate cross-shopping and outflow reduction. 3
6 Community of Stouffville Commercial Policy Study Update Background and Analysis Report 4
7 Community of Stouffville Commercial Policy Study Update Background and Analysis Report 5
8 Community of Stouffville Commercial Policy Study Update Background and Analysis Report 6
 has about 150,000 square feet of remaining development potential.")

9 Community of Stouffville Commercial Policy Study Update Background and Analysis Report With respect to significant new commercial development potential within the existing designations: Hoover Park Town Centre (Regional Retail Area) has about 150,000 square feet of remaining development potential. Hoover Park Town Centre Photo Credit: Google Streetview April 2009 The Western Approach Area includes the former Anderson Haulage site (now Minto/Trinity) 1 which has zoning approvals for about 70,000 square feet of commercial space, as well as 12,190 square feet of commercial space as part of a mixed use development. Western Approach Area and Anderson Haulage Site Photo Credit: Google Streetview April 2009 The Western Approach Area also has a number of other sites which have over 100,000 square feet of commercial development potential including the vacant former Canadian Tire site (about 2 acres on the south side of Main Street at Winona where the former 19,000 square foot facility has been razed), Houston Motors auto dealership (about 4 acres), and the Town s Works Yard (about 4.75 acres). 1 Note: Previously this site was zoned to permit a total gross floor area between 17,000 and 30,657 square metres (182, ,000 square feet) of commercial space. Town Council adopted a zoning by-law amendment which reduced the amount of commercial space to 6,425 square metres (70,000 square feet) on September 4, In addition, a mixed commercial residential development is proposed which includes 1,133 square metres (12,190 square feet) of commercial space. 7
 has small lot potential")


10 Community of Stouffville Commercial Policy Study Update Background and Analysis Report Former Canadian Tire Site in Western Approach Area - Photo Credit: Google Streetview June 2009 The Gateway Mixed Use Area (Ringwood area) has small lot potential for restaurants, boutiques, and offices, notwithstanding flood plain, environmental, access and property fragmentation constraints. Ringwood Mixed Used Area Photo Credit: Google Streetview April 2009 The Stouffville Country Market in the east end has a protected allocation of 125,000 square feet, and there is some remaining potential for additional development in the Neighbourhood Commercial Area designation which applies to the Market site. Stouffville Country Market Photo Credit: Google Streetview April
.")
11 5.2 Stouffville s Closest Competition Community of Stouffville Commercial Policy Study Update Background and Analysis Report The Community of Stouffville s closest retail commercial competition is found in Markham at the Metrus and former Emerson Electric sites a little more than 3 miles to the south of the Town boundary (see Map 4). These power centres have attracted a limited number of anchor stores, but have a range of banking and small store permissions. 9
12 Community of Stouffville Commercial Policy Study Update Background and Analysis Report 6. How adequate is the supply of lands set aside for commercial purposes? There has been an increase in the amount of retail commercial space in the Community of Stouffville since The 2005 inventory in the Community of Stouffville identified approximately 475,000 square feet of retail commercial space. In comparison to the 2005 inventory, the current study s 2012 inventory in the Community of Stouffville consists of approximately 900,000 square feet of retail commercial space as illustrated in Figure 1. However, the differences between the 2005 and 2012 inventory in part reflect the fact that non-retail space (personal and other services, bank, and Liquor/beer/wine space) were tallied only in the Downtown area in Excluding the non-retail categories, the greatest square footage gains have been in the Department Store and Non-Department Store Non-Food Store Retail (NFSR) categories. In addition, vacant space has declined significantly. The Supermarket/Grocery category has changed modestly as a result of Wal-mart s food component replacing the Sobey s closure. Overall, the retail inventory, including vacant space, has increased by over 235,000 square feet since The inventory indicates that with respect to existing development, vacancies now make up less than 1% of existing retail commercial space -- well below the normal range of 5% to 7% typical of most markets. This low vacancy rate appears to point to the relative good health of the retail commercial hierarchy, and the generally productive performance levels of existing space (i.e. sales per square foot)would appear to suggest that the market is under-stored. 10
13 Community of Stouffville Commercial Policy Study Update Background and Analysis Report Figure Floorspace Inventory (Total: 910,120 ft 2 ) *Includes 27,000 square feet of supermarket-equivalent space in Walmart Other Space NEC, 26,908sf, 3.0% Liquor/Beer/Wine, 13,770sf, 1.5% Vacancy, 4,000sf, 0.4% Bank/Trust, 24,215sf, 2.7% Supermarket/ Grocery *, 103,911sf, 11.4% Specialty Food, 21,900sf, 2.4% Restaurants, 117,747sf, 12.9% Other Services, 59,232sf, 6.5% Dep't Store (nonfood), 135,600sf, 14.9% Professional Services, 45,240sf, 5.0% Personal Services, 37,670sf, 4.1% HI, 26,860sf, 3.0% Non-Dep t Store, 293,067sf, 32.2% As a result of these significant inventory changes, the retail market shares obtained in the 2005 consumer telephone survey have also changed significantly. The current supply of vacant commercially designated lands, including the remaining 150,000 square feet at Hoover Park Town Centre and the 82,000 square feet of commercial development approved on the former Anderson Haulage lands in the Western Approach, would appear to exceed demands until 2021 based on the projections of residual market demands for retail and selected commercial uses found in Appendix I to this report. However, by 2031 there would appear to be a supply deficit of approximately 14 acres (150,000 square feet at 25% coverage), recognizing that market projections beyond five years cannot be regarded as conclusive. 11
14 Community of Stouffville Commercial Policy Study Update Background and Analysis Report 7. Who is shopping in the Community of Stouffville and what are they shopping for? The licence plate survey and the consumer survey confirm that the Community of Stouffville continues to draw customers (post-power centre) from the same trade area defined by the 2005 study (pre-power centre). The Hoover Park Town Centre attracts the highest level of inflow (40%) followed by the Downtown (35%), followed by the Western Approach Area (30%). These inflow levels are higher than those obtained in the 2005 MGP study. This appears to indicate that the expansion of the commercial hierarchy to include the regional node (Hoover Park Town Centre) has been beneficial to the Community of Stouffville as a whole with respect to inflow. However, high local capture rates from Primary Trade Area residents of more than 60% are confined to generally lower order goods (with some exceptions). These high capture rates are also found primarily at the anchor stores at Hoover Park Town Centre. For example, although the average department store capture is 56.7%, Wal-Mart s local capture is 94.4% of the Primary Trade Area residents spending in all Wal-Mart stores. Significant merchandising gaps are evident where local capture rates from Primary Trade Area residents are low or negligible (i.e. less than 40%), primarily for medium to higher order comparison goods shopping categories. These include: most fashion categories; certain specialty retail categories including books, camera/photo supply, gifts/novelty, hobby/toy/craft, art supply/gallery, fabric/yarn and musical instruments; certain home furnishings and interior décor categories including furniture/appliances, TV/electronics/computer, bath/bedding/linen, lighting/carpet/other décor and antiques; and, home improvement. This indicates that the Community still has a large outflow of dollars. It also suggests understoring and the need for the Community of Stouffville to attract certain types of new retail stores to catch up with population growth. Past gains in local capture rates have come through the attraction of new anchor stores at the Hoover Park Town Centre. Future gains may be a combination of attracting anchor and non-anchor specialty stores in the weaker categories. The findings indicate that Stouffville retailers have good opportunities for increased sales from both the Primary and Secondary Trade Areas. 12
15 Community of Stouffville Commercial Policy Study Update Background and Analysis Report Some suggested opportunities (see Figure 2) include: Small department store in the medium term such as a Marshall s; Regional chain store anchor use such as a TSC in the medium term; New format drug store in the medium term; Fashion and accessory space in the short to medium term; A small infusion of home furnishings space; and, Electronics and computer space in the short term. Figure 2: Local Capture Rates by Stouffville Stores 0% 10% 20% 30% 40% 50% 60% 70% 80% 90% 100% Supermarket Specialty Food Department Store General Merchandise Home and Auto Supply (HAAS) (Canadian Tire / TSC Store) Tires, Batteries, Accessories /Automotive Specialty Store Men s & Ladies Wear Family Wear / Unisex Children s Wear Shoes Jewellery Clothing Accessories Luggage & Leather Goods Stationery / Office Supply Book Store / News Dealer Record / CD / Tape Camera / Photo Supply Gift / Novelty / Greeting Card / Party Supply Sporting Goods Hobby / Toy / Craft Art Gallery & Artist Supply Musical Instruments Pet / Pet Supply Fabric or Yarn Shop Florist Drug / Discount Drug Furniture & Appliances TV / Stereo / Electronics / Computer Lighting / Carpet / Other Interior Décor China / Glassware / Kitchenware / Cutlery Bath / Bedding / Linen Telephone/Cell Phone/Vacuum/Sewing Machine Antiques Home Improvement / Lumber / Building Supply Hardware/Paint/Paper/Glass/Electrical/Plumbing Nursery / Garden Centre Primary Trade Area Secondary Trade Area South Secondary Trade Area East 13
16 Community of Stouffville Commercial Policy Study Update Background and Analysis Report 8. Market Study Conclusions The purpose of this commercial study update is to investigate whether the existing commercial policies are succeeding in achieving a balanced yet maturing commercial hierarchy. The maturation process involves filling out the remaining development capacity at the Hoover Park Town Centre and the Western Approach Area with medium to higherorder retail uses, and the development of the Gateway Mixed Use Area designation at Highway 48 and Main Street. The rate of maturation of the commercial hierarchy is a consideration in policy terms and at play in economic terms. The general conclusion of the analysis is that, in market terms, the commercial policies are succeeding, but slowly based on the following indicators: In a slowing retail development environment, Stouffville continues to serve a consistent trade area with a shift to increased regional draws. Placed in an overall economic context, the retail commercial development market in the GTA has been in general malaise (inconsistent/mushy) for some time. Even before the effects of the 2008 economic contraction, there were signs that the retail development industry was slowing, as was evident in longstanding power centre approvals in high growth markets not being built out in a timely manner. While caught up in that economic context, the results of this current analysis indicates that the Community of Stouffville continues to serve a consistent trade area, but with a shift to increased regional draws. Current market shares obtained by Stouffville retailers are drawn mostly from the Community of Stouffville, supplemented by moderate yet consistent support coming from Stouffville s secondary market areas. Increased regional draws are generally specific to the Hoover Park Town Centre, but are shared by the other commercial nodes to a much lesser degree. Regional draws have improved since the regional centre (Hoover Park Town Centre) began development. This is primarily due to the draws of the new anchor stores. However, new smaller-scale non-anchor space has not shared a similar expansion in other parts of the community, particularly in the Western Approach Area, notwithstanding the increased regional draws and inflow that the new anchor stores have brought into the local market. 14
17 Community of Stouffville Commercial Policy Study Update Background and Analysis Report The retail commercial hierarchy is in relative good heath with a low vacancy rate and productive performance levels of existing space, but this is off-set by significant merchandising gaps. The low vacancy rate appears to point to the relative good health of the retail commercial hierarchy. This, together with the generally productive performance levels of the existing space (i.e. good sales per square foot), suggest that the market is understored. This is coincidental with the fact that significant merchandising gaps are evident primarily for medium to higher order comparison goods shopping categories such as most fashion categories, and electronics and computer goods. Despite the merchandising gaps, the current under-storing, and today s low vacancy rates, the analysis does not identify a significant supply deficit until after 2021 (by 2026 and 2031). At the macro level, the supply of vacant commercially designated lands, including the 82,000 square feet of commercial development currently approved on the former Anderson Haulage lands in the Western Approach, would be sufficient to meet market demands until 2021 when the market would be in relative equilibrium. By 2026 a supply deficit of approximately 10.5 acres (rounded) would emerge. At 25% coverage, this supply surplus would translate into 115,000 square feet. By 2031, the supply deficit would approximate 14 acres, which at 25% coverage would translate into 150,000 square feet. Therefore, it can be concluded that the 2005 Commercial Policy Update which resulted in the creation of the regional node, and the efforts the Town has made in support of the Downtown, appear to have created a generally healthy commercial hierarchy. The support for the Downtown has resulted in a stronger centre, while the addition of the regional node has significantly reduced the outflow for lower order goods. At the same time, there are a number of factors at play which affect the rate of maturation, and are evidenced in the difficulty in leasing out space at Hoover Park Town Centre, and the lack of interest in development of major potential commercial sites in the Western Approach Area. Some of the factors affecting the rate of maturation of the commercial hierarchy include population growth and policy controls on the regional node and the Western Approach. Other factors are those affecting developers and tenants including: 15
18 Community of Stouffville Commercial Policy Study Update Background and Analysis Report current leasing competition between developers (e.g. Hoover Park Town Centre versus Emerson Electric/Metrus in Markham); previous and prospective leasing deals with tenants (e.g. rental trade-offs depending on the strength of individual markets); tenant fears of cannibalizing the sales of their existing stores in proximate markets; tenant concerns over the rate of local population growth in smaller markets; tenant reluctance to commit to riskier development models (e.g. mixed use buildings) in smaller markets; and, lack of tenants appropriate for the market (e.g. new-format tenants are already in the market, few U.S. entry prospects, limited second store options). Other less tangible factors may affect consumers. For example, residents new to the Community of Stouffville might still have ties to other locales because they work in other communities or still go to their current doctors or dentists or other special services outside of Stouffville and continue to shop outside Stouffville as well. In addition, the lack of interest in development in the Western Approach Area may also reflect a lack of perceived identity for the Western Approach Area. The recent application for a reduction in the amount of commercial space on the former Anderson Haulage site in the Western Approach Area was a result of a lack of anchor tenant interest. This may reflect the fact that, despite the strong policy direction in the Secondary Plan, the Western Approach Area is not perceived by retailers to have a retail commercial identity similar to the regional node and the Downtown. This factor may also be explain why no proposals have come forward for other significant sites in this Area including the vacant former Canadian Tire lands at 9 th and Main, the Houston Motors site, or the Town s Works Yard site. The lack of development in the Gateway Mixed Use Area designation at Highway 48 and Main Street because of a range of constraints (e.g. floodplain, property fragmentation) may also be a consideration. This area would serve as the entrance to the Western Approach Area, and the lack of a gateway and related exposure on Highway 48 contributes to a lack of identity in the Western Approach Area. In summary, despite the apparent slow maturation of the commercial hierarchy in the Community of Stouffville, the hierarchy is serving a high income area with good population growth prospects. However, the Community of Stouffville must contend with market issues that affect longer term market projections to Therefore, while a supply deficit has been identified post 2021 which is projected to increase to 150,000 square feet by 2031, consideration has to be given to these market issues in determining whether there is an actual need to designate additional commercial space to replace the reduced supply at the 16
19 Community of Stouffville Commercial Policy Study Update Background and Analysis Report current time. This is particularly the case as market projections beyond five years cannot be regarded as conclusive. Given the uncertainties in the market, consideration should be given as to whether it would be premature to designate additional lands for commercial development at the current time which might put at risk the achievement of the planned function of the current three nodes and the Neighbourhood Retail Area. Based on the available information, it may be preferable to continue to monitor the situation and to encourage commercial intensification in the Downtown and Western Approach Area (i.e. through continued implementation of the Downtown Community Improvement Plan and support for investments in transit supportive mixed-use / multi storey, higher density intensification, infill, development / redevelopment, and expansion / relocation); and to work with Hoover Park Town Centre to encourage the completion of that development. In particular, consideration needs to be given to assessing how to better position the Western Approach Area in the market to capitalize on the identified merchandising gaps. The longer term strategy should seek to achieve a market equilibrium position (neither under-stored nor over-stored) through incremental expansion in line with emerging market opportunities, most notably through the market absorption of the remaining lands at the Hoover Park Town Centre; through the market absorption of other vacant commercially designated lands or other suitable lands (e.g. the Town s Works Yard); and through other intensification along the commercial corridor in the Western Approach Area and in the Downtown. 17
20 Community of Stouffville Commercial Policy Study Update Background and Analysis Report 9. Implications for the Current Commercial Planning Policy Framework The Community of Stouffville Secondary Plan which is found in Section 12 of the Town s Official Plan establishes the policy framework for commercial development in the Community of Stouffville. The key current commercial policy directions are outlined below together with questions/directions for consideration in the context of the current update of the market study findings: Downtown Policy Direction: Maintain the downtown as a central meeting place and shopping area for the community recognizing its important contribution to the character of the community. Discussion The maintenance and enhancement of the Downtown as a shopping area is a key direction throughout the Plan found in the Community Vision, as well as the land use and design policies. The market study results appear to indicate that the policy framework and the efforts of the Town and the business community to implement the directions in the Plan have been successful. However, past experience in the community and elsewhere indicates that the maintenance of that success can be a challenge. At the same time, the role of the Downtown as a shopping area continues to be important to implement a key part of the Community Vision. Questions/Future Directions Are the current policy directions with respect to the Downtown which provide for its protection and enhancement sufficient to ensure its continued success as a shopping area for the community? Regional Retail Centre (Hoover Park Town Centre) Policy Direction: Major retail uses may be permissible in a manner that is complementary to, and does not undermine, the function of the Western Approach Area, the Core Area, or the Neighbourhood Retail Area. Discussion The policies for the Regional Retail Center found in Section A of the Plan, establish minimum floor areas for large retail stores to assist in ensuring that the 18
21 Community of Stouffville Commercial Policy Study Update Background and Analysis Report development in this area fulfills its function which is to act as a trade centre and specialty retailing node serving a broad regional market. The policies are also designed to ensure that uses which could undermine the planned function of other commercial areas are not permitted or are limited in size. These policies prohibit: large retail stores that are under 371 square metres in gross floor area; recreational vehicle sales and service; financial institutions until such time as an office building with a minimum gross floor area of 4,460 square metres and a height of a minimum of three storeys is constructed; liquor and/or beer retail stores and outlets; food supermarkets, food stores or grocery stores except that the sale of groceries or similar food or retail products is permitted in a portion of a large retail store where the store has a minimum gross floor area of 10,000 square metres and no more than 2,500 square metres gross floor area of the store is devoted to the sale of groceries or similar food or retail products. In addition, the policies require a minimum of two retail operations having a minimum commercial floor area of 10,000 square metres and 5,575 square metres respectively. Further, personal service establishments are permitted provided they have a gross floor area of not less than 92 square metres; and eating establishments are permitted provided that they do not exceed an aggregate gross floor area of 2,370 square metres. Questions/Future Directions Is a minimum size of 371 square metres (4,000 square feet) for large retail stores still appropriate? Are financial institutions still important anchors for the Downtown and Western Approach Area? Should such uses still continue to be prohibited in the Regional Retail Centre until an office building is located in the area? Are liquor and beer retail stores and outlets still important anchors for the Downtown and Western Approach Area? Should such uses still continue to be prohibited in the Regional Retail Centre? Can exceptions be made for small outlets which form part of a larger store? Are food supermarkets, food stores and grocery stores still important anchors for the Downtown and Western Approach Area? Should such uses still continue to be prohibited in the Regional Retail Centre? Can additional 19
22 Community of Stouffville Commercial Policy Study Update Background and Analysis Report exceptions be made similar to the 2,500 square metres of floor area permitted in a store over 10,000 square metres? Can personal service establishments of less than 92 square metres be permitted in the Regional Retail Centre? Are restaurants still important anchors in the Downtown and Western Approach Area? Should additional restaurants be permitted in the Regional Retail Centre above the current 2,730 square metre cap? Western Approach Area The intent for the Western Approach Area is to create a diverse, thriving commercial district combined with a range of uses including employment, entertainment and residential uses. Discussion The Western Approach Area includes the Western Approach Mixed Use and the Western Approach Commercial designations. The general policy direction is the same with a focus on mixed use development, and strong policy direction with respect to urban design. However, the permitted uses are slightly broader in the Mixed Use Area including data processing, education and training, medium density residential and automotive campus, while the Commercial designation is more focused on commercial uses. Questions/Future Directions What additional or refined policy direction is required to encourage redevelopment of the major vacant sites in the Western Approach Area? Would combining the two existing land use designations which are similar assist in creating a clearer identity for the area? What other additional or refined policy direction would assist in clarifying identity of this area and its role in the community? Gateway Mixed Use Area The policy direction for this area is the creation of a unique and special mixed use district which promotes commercial development integrated with residential uses. Special architectural and landscaping treatment is required to strengthen the area s identity and improve the quality of the public realm. 20
23 Community of Stouffville Commercial Policy Study Update Background and Analysis Report Discussion The lack of development in the Gateway Mixed Use Area designation at Highway 48 and Main Street because of a range of constraints (e.g. floodplain, property fragmentation) is an issue given that this is the main entrance to the community from Highway 48. Further, this area also serves as the entrance to the Western Approach Area. The lack of a gateway and related exposure on Highway 48 may contribute to a lack of identity in the Western Approach Area. Questions/Future Directions Is the lack of development in this area and the lack of an established gateway to the community in this location hindering development in the Western Approach area and contributing to its lack of identity? What additional or refined policy direction or other action by the Town is required to resolve the constraints to development in this area? Would a detailed tertiary plan which includes a detailed approach for addressing constraints to development assist in resolving the situation? Should a Community Improvement Plan be considered to assist in the redevelopment of this area? Neighbourhood Retail Area The Neighbourhood Retail Area designation currently applies only to a site on the east side of 10 th Line north of Main Street, although the policies recognize the potential for the designation of additional areas. The planned function is as a commercial district which provides a range of goods and services designed to meet the day to day requirements of the area residential neighbourhoods. Mixed use is promoted as part of this designation. Discussion The lands in the Neighbourhood Retail Area designation are currently utilized for the Stouffville Country Market. It is unclear when or if redevelopment will occur. At the same time, commercial development has occurred at the intersection of the 10 th Line and Main Street particularly in the northeast quadrant which provides some of the services intended for the Neighbourhood Retail Area. However, the Town is currently carrying out a Growth Management Strategy to evaluate the need for additional growth 21
24 Community of Stouffville Commercial Policy Study Update Background and Analysis Report in Phase 3 of the Coummunity of Stouffville. If additional growth is approved, the subject site will be more centrally located to the expanded urban area and its potential for redevelopment may increase. Questions/Future Directions Should the lands at Main Street and 10 th Line or other sites be recognized as a Neighbourhood Retail Area? What is the potential for the development of the current Neighbourhood Retail Area considering future development of Phase 3 of the Community of Stouffville? 22
25 APPENDIX I COMMUNITY OF STOUFFVILLE COMMERCIAL POLICY STUDY UPDATE PROJECTIONS OF RESIDUAL MARKET DEMANDS 2014, 2016, 2021, 2026, & 2031 RETAIL & SELECTED COMMERCIAL USES OCTOBER 2012 Acronyms: FSR: NFSR: GAFO: HAAS: TBA: HI: FIRE: SBM: GLA: NAICS: Food Store Retail Non-Food Store Retail General Merchandise / Apparel / Furnishings / Other Retail Home and Auto Supply Tires, Batteries & Accessories Home Improvement Finance / Insurance / Real Estate Services to Business Management Gross Leasable Area North American Industrial Classification System - 1 -
26 1. Introduction -- Planning and Market Study Context: The Town of Whitchurch-Stouffville is currently conducting an update of the Community of Stouffville Commercial Policy Study (Study Update). The Study Update is to assess the implications of growth to date on the commercial districts, and to examine commercial land use requirements through to the Year This comprehensive review will assess the adequacy of the supply of lands set aside for commercial purposes and recommend whether any revisions are required to land use designations and policies/zone standards to protect the planned function of each commercial area in the Community. The Study is being undertaken in the context of population forecasts (York Region, May 31, 2012) which indicate that current population levels in the Town of Whitchurch-Stouffville will increase by about 50% over the next 19 years ( ): up from to to 41,235 in the 2012 base year (Watson & Associates), 55,800 by 2021 (York Region), and 60,600 by 2031 (York Region) The Town last undertook such a commercial policy study in The 2005 study took the form of a peer review by the Town s consultants of market studies submitted by proponents of two major commercial developments. Those market studies were carried out by Malone Given Parsons Ltd. and urbanmetrics inc. The 2005 review resulted in the establishment of a new regional commercial designation at Hoover Park Drive and Highway 48 (Hoover Park Town Centre), and policies that would protect and preserve commercial development opportunities in the Community Core Area (Downtown Stouffville) and the Western Approach Area. In addition, a Neighbourhood Retail Area to permit the development of a node of neighbourhoodfocused commercial activity was identified on the eastern side of the Community (See Maps 1 & 2). The updated market projections underlying the current Commercial Policy Study Update repeat the empirical research undertaken in 2005 by Malone Given Parsons Ltd. (MGP). MGP tested a trade area for the Community of Stouffville that included Whitchurch-Stouffville as the Primary Trade Area and secondary zones in Northeast Markham (Secondary Trade Area South) and Uxbridge/North Pickering (Secondary Zone East) (see Map 3). The updated empirical research includes licence plate surveys that confirm the previously defined trade area, and a consumer telephone survey within those same trade area boundaries. An updated floor space inventory has also been compiled. The results of this research are summarized in the following sections
27 - 3 -
28 - 4 -
29 - 5 -
30 2. Licence Plate Surveys: Licence plate surveys (proxies for customer origins) were conducted by Corey F. Doyle, Research Consultant, on Thursday, Friday and Saturday, May 22, 23, and 24, The licence plate survey data (coded by the Ontario Ministry of Transportation, and compiled and mapped by GEOmarketing Solutions Inc.) are featured in Appendix D of the Study Update. The percentage of customer origins derived by the three existing commercial nodes is summarized in Figure 1 as follows 1 : Figure 1: 2012 Customer Origins by Existing Commercial Nodes 0% 10% 20% 30% 40% 50% 60% 70% 80% 90% 100% 1A 1B 2A Downtown Power Centre Western Approach All Plates 3A 3B 3C 3D TRADE AREA INFLOW 1 Note: Tables on which Figures are based are found in Appendix E to the report
31 These data confirm that the Community of Stouffville continues to draw customers (postpower centre) from the same trade area defined by the 2005 MGP study (pre-power centre). The Hoover Park Town Centre attracts the highest level of inflow (40%) followed by the Downtown (35%), followed by the Western Approach Area (30%). These inflow levels are higher than those obtained in the 2005 MGP study (as seen in Figure 2). This indicates that the expansion of the commercial hierarchy to include the regional node (Hoover Park Town Centre) has been beneficial to the Community of Stouffville. Figure 2: 2005 Customer Origins by Existing Commercial Nodes 0% 10% 20% 30% 40% 50% 60% 70% 80% 90% 100% 1A 1B Downtown Can. Tire former A&P former No Frills former Sobeys former 2A 3A+3B+3C+ 3D TRADE AREA INFLOW 3. Consumer Telephone Survey: - 7 -
32 3.1 Survey Methodology The professional survey firm of Network Research Field Services conducted a consumer telephone survey of the retail expenditure patterns of Trade Area residents over the month of June Sample sizes for the Primary Trade Area (Zones 1A + 1B) and Secondary Trade Area East (Zones 3A + 3B + 3C + 3D) are proportionate to the distribution of population in these zones in A separate stand-alone survey of 200 was conducted in the Secondary Trade Area South (Markham Zone 2A) because of this zone s high population level. By gender, the sampling was split roughly 75% female and 25% male. The survey asked respondents where and how much they spent over a prescribed recall period (calibrated at 3 months) in 36 retail store categories, including FSR (2 food store categories) + NFSR (1 department store category plus 30 non-department store GAFO categories) + HI spending (3 categories including garden supply/nursery). The results of the Consumer Telephone Survey are compiled in Appendix C of the Study as follows: Appendix C-1 Primary Trade Area Expenditures (Row and Column Totals) Appendix C-2 Secondary Trade Area East Expenditures (Row and Column Totals) Appendix C-3 Secondary Trade Area South Expenditures (Row and Column Totals) Appendix C-4 Head of Household (Gender) Appendix C-5 Average Size of Household Appendix C-6 Respondent Age Profile Appendix C-7 Respondent Employment Profile Appendix C-8 Head of Household Shopping Frequency by Store Type Appendix C-9 Head of Household Average Amount Spent by Store Type - 8 -
33 The total sample size of 850 completed surveys was split numerically as follows: TRADE AREA No. of Surveys Primary Trade Area: Total 400 Community of Stouffville Zone 1A 265 Rural Whitchurch- Stouffville Zone 1B 135 Secondary Trade Area East: Total 250 Urban Uxbridge Zone 3A 135 Rural Uxbridge South Zone 3B 46 Rural Uxbridge North Zone 3C 50 Pickering - N. of Hwy. 7 Zone 3D 19 Secondary Trade Area South: 200 Markham - N. of 16 th /E. of Kennedy Zone 2A 200 TOTAL SURVEYS 850 Local capture rates by Stouffville merchants are derived from these survey results. These are subsequently applied as base year capture rates in the calculations of residual (warranted) square footages. 3.2 Local Capture Rates by Stouffville Merchants Figure 3 features the local capture rates that Stouffville merchants obtain from residents of the Primary Trade Area, the Secondary Trade Area South, and the Secondary Trade Area East (as summarized from Appendices C-1 to C-3): - 9 -
34 Figure 3: Local Capture Rates by Stouffville Stores 0% 10% 20% 30% 40% 50% 60% 70% 80% 90% 100% Supermarket Specialty Food Department Store General Merchandise Home and Auto Supply (HAAS) (Canadian Tire / TSC Store) Tires, Batteries, Accessories /Automotive Specialty Store Men s & Ladies Wear Family Wear / Unisex Children s Wear Shoes Jewellery Clothing Accessories Luggage & Leather Goods Stationery / Office Supply Book Store / News Dealer Record / CD / Tape Camera / Photo Supply Gift / Novelty / Greeting Card / Party Supply Sporting Goods Hobby / Toy / Craft Art Gallery & Artist Supply Musical Instruments Pet / Pet Supply Fabric or Yarn Shop Florist Drug / Discount Drug Furniture & Appliances TV / Stereo / Electronics / Computer Lighting / Carpet / Other Interior Décor China / Glassware / Kitchenware / Cutlery Bath / Bedding / Linen Telephone/Cell Phone/Vacuum/Sewing Machine Antiques Home Improvement / Lumber / Building Supply Hardware/Paint/Paper/Glass/Electrical/Plumbing Nursery / Garden Centre Primary Trade Area Secondary Trade Area South Secondary Trade Area East
35 Highest Local Capture Rates (60%-100%): High local capture rates from Primary Trade Area residents of more than 60% (meaning reciprocal outflow levels of less than 40%) are confined to generally lower order goods (with some higher order exceptions). Local capture rates in the 60% to 100% range are listed from highest to lowest as follows: Department Store (Wal-Mart only) 94.4% Stationery / Office Supply 93.8% General Merchandise 93.8% HAAS (Canadian Tire) 91.5% Drug / Discount Drug 89.9% Pet / Pet Supply 83.5% Supermarket 80.3% Jewellery 68.8% Florist 67.3% Family Wear 61.4% Specialty Food 60.9% High local capture rates of more than 60% have been induced largely but not exclusively by the anchor stores at the regional node. For example, although the average department store capture is 56.7%, Wal-Mart s local capture is very high at 94.4% of Primary Trade Area residents spending in all Wal-Mart stores. The introduction of Staples at Hoover Park Town Centre has resulted in the very high capture rate in the Stationery / Office Supply category. Winners and Canadian Tire/Marks Work Warehouse are other examples. Similarly, Sportchek (under construction at Hoover Park Town Centre) is expected to greatly improve on the very low 16.7% local capture rate in the Sporting Goods category. These results point to the success of the regional node in performing its regional function for certain but not all retail categories. Lowest Local Capture Rates (0%-40%): Merchandising gaps are evident where local capture rates from Primary Trade Area residents are low or negligible (here defined as less than 40%). Local capture rates of less than 40% are obtained generally in medium to higher order comparison goods shopping categories. These include:
36 Shopping Category Fashion Categories: Local Capture Rate by Stouffville Stores Percent of FSR + NFSR + HI Spending men s and ladies wear 19.3% representing 2.6% children s wear 1.7% representing 1.4% shoes 0.0% representing 1.5% clothing accessories 0.0% representing 0.8% luggage and leather goods 0.0% representing 1.1% Specialty Retail Categories: books 0.0% representing 0.9% records/cd/tape 0.0% representing 1.1% camera/photo supply 0.0% representing 3.6% gifts/novelty 3.5% representing 0.5% sporting goods 16.7% representing 2.3% hobby/toy/craft 38.2% representing 1.5% art supply/gallery 29.0% representing 1.1% fabric/yarn 15.4% representing 0.9% musical instruments 0.0% representing 1.5% Home Furnishings and Interior Décor Categories: furniture/appliances 30.9% representing 9.2% TV/electronics/computer 2.9% representing 3.2% lighting/carpet/other décor 23.3% representing 2.6% china/glass//kitchenware 0.0% representing 0.7% bath/bedding/linen 0.0% representing 1.4% Phone/Vacuum/Sew. Machi ne 33.8% representing 1.1% Antiques 25.3% representing 1.3% Home Improvement HI/lumber/building supply 34.1% representing 6.5% hrdwr/paint/glass/elect/plumb 31.1% representing 2.6% Total (less than 40% local capture) 49.4%
37 3.3 Implications of Survey with respect to Local Capture Rates: Stouffville retailers obtain relatively low local capture rates of less than 40% (i.e. from 0% to 40%) from Primary Trade Area residents for spending categories that comprise almost 50% of their spending (actually 49.4% in bar above). With so much outflow (60%+) across such a large proportion of spending (almost 50%), this is less than an optimal situation. It suggests current under-storing and the need for the Community of Stouffville to attract certain types of new retail stores to catch up with the population growth. Past gains in local capture rates have come through the attraction of new anchor stores at the regional node. Future gains may be a combination of attracting anchor and non-anchor specialty stores in the weaker categories. However, this implies that efforts by Stouffville retailers to increase local capture rates in spending categories that are now less than 40% would be targeting 5 of every 10 dollars (i.e. across all categories in the previous bullet points). The opportunity to target such a large proportion of spending is encouraging for the future maturing of the Community of Stouffville s commercial hierarchy as the population increases. This also implies that Stouffville retailers have weakest local capture rates from Secondary Trade Area residents in categories that represent half of their spending as well. These findings support the general proposition that Stouffville retailers have good opportunities for increased penetrations of both the Primary Trade Area and the two Secondary Trade Area zones. While most gaps are coincident with lower local capture rates, the proximity of competitive facilities will continue to moderate the prospects for outflow recovery. 3.4 Local Capture Rates for Agglomerated Retail Store Types: Local capture rates that Stouffville merchants obtain from each Trade Area zone for nine (9) agglomerated store types (i.e. agglomerated from the 36 store categories listed in Figure 3 above) are as follows:
38 Figure 4 - Percent Local Capture Rates by Stouffville Stores 0% 10% 20% 30% 40% 50% 60% 70% 80% 90% 100% Department Store Other General Merchandise Drug and Personal Care Fashion & Accessories Home Furnishings/Electronics Primary Trade Area Secondary Trade Area South Secondary Trade Area East Other Specialty Non- Department Home Improvement Supermarket/Grocery Store Specialty Food Store These local capture rates are applied as base year shares in the residual calculations for the same nine (9) agglomerated spending categories (in Tables of this Study Update). 3.5 Respondent Shopping Frequency by Store Type: The following summary compares shopping frequency by store type and the percentage of total amount spent for the entire sample (Appendix C-9 reveals there is little variation in shopping frequency across the three Trade Area zones): Shopping Frequency By Store Type % of Total $ Spent 80% - 100% of Respondents Shopped at: Supermarket / Superstore incl. Costco food) 18.0% Major or Discount Department Store 3.6% Subtotal 21.6% 60% - 80% of Respondents Shopped at: Drug or Discount Drug Store 3.2% Home & Auto Supply / Canadian Tire/TSC 2.1% HI: Lumber / Building Supply 6.5% General Merchandise Including Costco 1.9% Subtotal 13.6% Subtotal 60% - 100% 35.2%
39 30% - 40% of Respondents Shopped at: HI: Nursery / Garden Ctr. 1.9% Stationery of Office Supply Store 1.3% Family Wear / Unisex Clothing 2.0% Subtotal 5.1% 20% - 30% of Respondents Shopped at: Book Store or News Dealer 0.9% Pet or Pet supply Store 1.2% Specialty Food Store 3.0% Shoe Store 1.5% Hobby/Toy/Craft Store 1.5% TV / Stereo / Electronics / Computer 3.2% Subtotal 11.3% 10% - 20% of Respondents Shopped at: Men's or Ladies' Wear Store 2.6% Sporting Goods Store 2.3% Gift/Novelty/Greeting Card/Party 0.5% Florist 0.9% HI: Hardware/ Paint/Paper/Electrical/Plu 2.6% Furniture / Appliance Store 9.2% Lighting / Carpet / Interior Décor 2.6% Telephone/Cell Phone/Vacuum/Sew. Machine 1.1% Subtotal 21.7% Fewer than 10% of Respondents Shopped at: Fabric of Yarn Store 0.9% Children's Wear Store 1.4% Bath/Bedding/Linen Store 0.7% Jewellery Store 6.5% Camera or Photographic Supply Store 3.6% TBA (Tires/Batteries/Accessories) 5.9% Art Gallery/Artists' Supply Store 1.1% China/Glassware/Kitchenware/Cutlery 0.7% Musical Instrument & Supply Store 1.5% Record / CD / Tape Store 1.1% Luggage and Leather Goods Store 1.1% Antiques Shop 1.3% Clothing Accessories Store 0.8% Subtotal 26.7% Total Amount Spent by Household Head 100%
40 Implications: Respondents generally have the highest frequency of shopping in lower-order anchor stores (including discount department stores) which represent about 1/3 rd of respondent spending. Respondents generally have the lowest frequency of shopping in non-anchor higher-order specialty stores which represent about 2/3 rds of respondent spending. These findings confirm that shoppers in the Stouffville market have typical/normal shopping patterns in terms of shopping frequency and percentage spent by store type. 4. Community of Stouffville Floorspace Inventory: & 2005 Inventories There has been an increase in the amount of retail commercial space in the Community of Stouffville since The 2005 inventory in the Community of Stouffville identified approximately 475,000 square feet of retail commercial space. In comparison to the 2005 inventory, the current study s 2012 inventory in the Community of Stouffville consists of approximately 900,000 square feet of retail commercial space broken down as follows (See Maps 1 & 2):
41 Figure Floorspace Inventory (Total: 910,120 ft 2 ) *Includes 27,000 square feet of supermarket-equivalent space in Walmart Other Space NEC, 26,908sf, 3.0% Liquor/Beer/Wine, 13,770sf, 1.5% Vacancy, 4,000sf, 0.4% Bank/Trust, 24,215sf, 2.7% Supermarket/ Grocery *, 103,911sf, 11.4% Specialty Food, 21,900sf, 2.4% Restaurants, 117,747sf, 12.9% Other Services, 59,232sf, 6.5% Dep't Store (nonfood), 135,600sf, 14.9% Professional Services, 45,240sf, 5.0% Personal Services, 37,670sf, 4.1% HI, 26,860sf, 3.0% Non-Dep t Store, 293,067sf, 32.2% The differences between the 2005 and 2012 inventory in part reflect the fact that non-retail space (personal and other services, bank, and Liquor/beer/wine space) were tallied only in the Downtown area in 2005, with the result that longitudinal comparisons to the current study are only available for the retail categories (FSR + NFSR + HI space). The 2005 inventory is broken down as follows (i.e. MGP s 2005 inventory is converted to NAICS nomenclature here to facilitate comparisons):


, 0, 0.")
42 Figure Floorspace Inventory (Total: 475,300 ft 2 ) Vacancy, 17,400sf, 3.7% Bank/Trust, 12,000sf, 2.5% Restaurants, 29,100sf, 6.1% Supermarket/ Grocery *, 95,000sf, 20.0% Other Services, 77,100sf, 16.2% Specialty Food, 29,300sf, 6.2% Dep't Store (non-food), 0, 0.0% Personal Services, 8,500sf, 1.8% HI, 24,500sf, 5.2% Non-Dep t Store, 182,400sf, 38.4%
43 4.2 Comparison between 2005 and 2012 The differences between the 2005 and 2012 FSR, NFSR, HI and Vacant space are as follows: Inventory Inventory Difference % Change 8, % Specialty -7, % Subtotal FSR 1, % Dep't 135, % Non-Dep t 110, % Subtotal 246, % 2, % -13, % TOTAL 236, % Excluding the non-retail categories, the greatest square footage gains have been in the Department Store and Non-Department Store NFSR categories. Vacant space has declined significantly. The Supermarket/Grocery category has changed modestly as a result of Wal-Mart s food component replacing the Sobeys closure. Overall, the retail inventory, including vacant space, has increased by over 235,000 square feet since the 2005 CPR. As a result of these significant inventory changes, the retail market shares obtained in the 2005 consumer telephone survey have also changed significantly. 4.3 Vacant Space The floorspace inventory indicates that with respect to existing development, vacancies now make up less than 1% of existing retail commercial space -- well below the normal range of 5% to 7% typical of most markets. This low vacancy rate appears to point to the relative good health of the retail commercial hierarchy, and the generally productive performance levels of existing space (i.e. sales per square foot) would appear to suggest that the market may be under-stored
44 5. Community of Stouffville s Existing Retail Commercial Hierarchy: 5.1 Commercial Nodes The existing commercial hierarchy is spread over three nodes (the Downtown, the Western Approach Area, and the Hoover Park Town Centre power centre ). There is also a site designated Neighbourhood Retail Area (Stouffville Country Market) on the east side of the Community. These nodes are differentiated by function, separated by distance, yet distributed to facilitate cross-shopping and outflow reduction. (See Map 2) 5.2 New Commercial Development Potential With respect to significant new commercial development potential: Hoover Park Town Centre (Regional Retail Area) has about 150,000 square feet of remaining development potential. The Western Approach Area includes the former Anderson Haulage site (now Minto/Trinity) 2 which has zoning approvals for about 70,000 square feet of commercial space, as well as 12,190 square feet of commercial space as part of a mixed use development. The Western Approach Area also has a number of other sites which have over 100,000 square feet of commercial development potential including the vacant former Canadian Tire site (about 2 acres on the south side of Main Street at Winona where the former 19,000 square foot facility has been razed), Houston Motors auto dealership (about 4 acres), and the Town s Works Yard (about 4.75 acres). The Gateway Mixed Use Area (Ringwood area) has small lot potential for restaurants, boutiques, and offices, notwithstanding flood plain, environmental, access and property fragmentation constraints. The Stouffville Country Market in the east end has a protected allocation of 125,000 square feet, and there is some remaining potential for additional development in the Neighbourhood Commercial Area designation which applies to the Market site. 2 Note: Previously this site was zoned to permit a total gross floor area between 17,000 and 30,657 square metres (182, ,000 square feet) of commercial space. Town Council adopted a zoning by-law amendment which reduced the amount of commercial space to 6,425 square metres (70,000 square feet) on September 4, In addition, a mixed commercial residential development is proposed which includes 1,133 square metres (12,190 square feet) of commercial space
45 6. Closest Retail Commercial Competition: The Community of Stouffville s closest retail commercial competition is found in Markham at the Metrus and former Emerson Electric sites a little more than 3 miles south of the Whitchurch-Stouffville / Markham boundary. (See Map 4) Like the Hoover Park Town Centre, the power centre uses at the Metrus and former Emerson Electric sites have entered the market late in the developmental life cycle of power centres. Like the Hoover Park Town Centre, the power centre uses at the Metrus and former Emerson Electric sites have attracted a limited number of anchor stores: Hoover Park Town Centre: Wal-Mart, Staples, Winners, Canadian Tire and its affiliates Mark s Work Warehouse and Sportchek (under construction) versus Metrus et al: Home Depot, The Brick, Shoppers, Food Basics, and Petsmart. Unlike the Hoover Park Town Centre, the power centre uses at the Metrus and former Emerson Electric sites are less restricted in terms of having banking and small store retail permissions. The following uses are located in and around Metrus Properties Power Centre on Markham Rd. /Hwy. 48 (square footages are rounded). S/W Quadrant Markham Rd. and Castlemore Ave. f/s Home Depot 102,500 sq. ft. f/s CIBC 7,000 f/s Vacant Unit 1,580 Henry s Photo 3,500 f/s Bank of Montreal 6,000 f/s Shoppers Drug Mart 18,000 N/E Quadrant Markham Rd. and Castlemore Ave. f/s The Brick 46,700 sq. ft. N/W Quadrant Markham Rd. and Castlemore Ave. Large Strip Food Basics 47,900 Petsmart 20,000 Vacant 30,000 f/s T.D. Canada Trust 6,500 CRU Strip Iris Optician 1,500 Great Clips (Barber) 1,
46 Nails & Spa 1,500 CRU Strip Pizza Nova 1,300 Subway 1,300 Sushi Sushi 1,300 EB Games 1,300 Popeyes Chicken 1,300 f/s Scotiabank 6,500 Upper Village Dental 2,000 CRU Strip Nothing But Noodles 1,500 Vacant 1,500 Salon Concepts 1,000 N.R. Medical Clinic 2,900 This node is differentiated from the Hoover Park Town Centre by having: 4 banks 1 supermarket 1 big-box home improvement store 1 big-box furniture / appliance / electronics store 1 mini-box drug store 1 mini-box pet food store 11 units below 1,500 square feet 1 medical + 1 dental with combined space of about 5,000 square feet
47 - 23 -
48 7. Analysis of Retail and Selected Commercial Space Demand and Supply 7.1 Methodology This study examines retail and selected commercial space demands and supply. This terminology is NAICS-based, and includes uses listed in Appendix B-2. 3 The study is what is termed a residual analysis. A residual analysis is defined as a projection over time of the ease with which new space can enter the market ( ease of entry calculations) in response to population and real expenditure growth without causing transfers of sales away from existing competitive stores. It is a conservative methodology based purely on growth in market demand without factoring in additional market opportunity through sales transfers. In carrying out the analysis of retail and selected commercial space demands and supply, the following methodology was used: the 2012 base year (current/reference) distribution of spending of Trade Area residents based on the local (Community of Stouffville) capture rates from the 2012 consumer telephone survey in Community s Trade Area, macro-level residual demands for new space in the Community of Stouffville (where residuals represent the ease of entry of new space without sales transfers away from existing retail and selected commercial operators) as tested in 2014, 2016, 2021, 2026, and 2031, within the Community of Stouffville, the current built supply (inventory) of retail and selected commercial floorspace (FSR + NFSR + HI + Restaurant + Liquor/Beer/Wine + Personal Services + Financial Services + Other Services + Local Office + Vacant space), 3 retail uses that correspond in Appendix B-2 to Study Codes 1 to 123, including food stores, pharmacies and personal care stores, GAFO stores (General merchandise and department stores, Apparel and accessories stores, Furniture, home furnishings, and electronics stores, and Other retail stores), and Building and Outdoor Home Supply stores; and selected commercial uses that correspond to Study Codes 124 to 130 (financial / banking services); 137 to 143 (professional services); 151 to 155 (doctor / dentist / other health services); 172 to 174 (restaurant / food services); and 184 to 196 (personal services)
49 the differences over time between projected supply (built supply + designated/zoned land supply + vacancy uptake) and macro-level demands that might warrant any future expansions of the retail commercial infrastructure, at the macro-level, the Community of Stouffville s future land requirements and phasing of the warranted square footages. 7.2 Inputs and Assumptions Inputs and assumptions on which the analysis is based include: Residuals versus Per Capita Space Planning Ratios: Residuals (or residual demands) are additional dollar amounts over and above the base year sales achieved by the existing competition that are available to new competition as a result of population growth and real expenditure growth in the defined market area. The residual dollar amounts translate into warranted square footages by dividing the available residual dollars by standardized sales performance levels. Residual demands can be expressed as dollar amounts or their square footage equivalents. Residual demands are projected for the following retail/commercial categories: Supermarket/Grocery portion of FSR Specialty Food portion of FSR Department Store portion of NFSR (= GAFO / DRUG) Non-Department Store portion of NFSR General Merchandise Stores Apparel & Accessories Stores Furniture / Home Furnishings / Electronics Stores Other Retail Stores Pharmacies and Personal Care Stores HAAS/TBA HI Personal Services (e.g. Barber/Beauty, Weight Loss, Shoe & Other Repair Services, Dry Cleaner/Laundromat) Restaurant L/B/W (Liquor/Beer/Wine) Per capita space planning ratios are standardized amounts of space (expressed in square footages per capita) that represent the physical space required to serve each person in a defined market area over a one year period (e.g. typically 1.0 square feet of financial institution space is required physically for each person to be served in a particular market area). Per capita space planning ratios are used to project macro-level space demands for Other Service, Financial Institution, and Local Office space (FIRE and SBM)
50 Data Assumptions: 2012 constant dollars (i.e dollars updated by one year s real growth to 2012) 2012 base year 2012 retail commercial floor space inventory - dated July 31, 2012 (existing market supply) 2012 licence plate surveys (proxy customer origins and inflow), and 2012 consumer telephone survey (current distribution of expenditures) A basic assumption underlying this study reflects the general marketplace expectation that the per capita income and expenditure levels of Trade Area residents will remain at current levels (i.e. no erosion by economic instability). Other assumptions or clarifications are made at appropriate points in the text. Any major change affecting the assumptions would warrant a re-visitation of this study s findings. Regional Trade Area Delineation: The Community of Stouffville-centered regional Trade Area defined and analyzed in this study has been investigated in market studies and peer reviews going back to The defined trade area represents a relatively large, growing, and consistent part of the Community of Stouffville s trading geography and population base from which the Community of Stouffville s 2012 inventory of retail commercial space is expected to derive consistent market support over the forecast period. The stability of this economic geography is linked to the strengthening of the Community of Stouffville s retail offerings over time to better serve its local and regional markets. Trade Area Per Capita Household Incomes: The average per capita household incomes in the Trade Area (2006 & 2001 Census data) compared to the provincial average (index = 100.0) are as follows: 2006 Census 2001 Census Primary Trade Area (W-S) Secondary Trade Area South (NE Markham) Secondary Trade Area East (Uxbridge/Pickering) Total Trade Area
51 Significant gains in the Primary Trade Area and the Secondary Trade Area East are in contrast to the declining incomes in the Secondary Trade Area South. Per capita household incomes in the Primary Trade Area (the Town of Whitchurch-Stouffville) are amongst the highest in the province. A number of factors contribute to this: The Town of Whitchurch-Stouffville s labour force participation rate (69.6%) and employment rate (66.6%) exceed the provincial averages (67% and 63% respectively) while the Town s unemployment rate (4.3%) falls below the provincial average (6%). The percentages of Town residents with university education (21%) and high school education 30%) are on par with the province (20% and 27% respectively), while the percentage of Town residents with college education (30%) exceeds the provincial average (27%). Home ownership in the Town of Whitchurch-Stouffville (85.3%) is well above the provincial average (71%). Trade Area Incomes / Expenditures and Projected Population Growth: Appendix A-1 provides regression equations that link per capita household incomes in the Primary and Secondary Zones to per capita FSR, NFSR, HAAS/TBA, HI, Personal Service, Restaurant, and Liquor/Beer/Wine expenditures. Appendix A-2 features preliminary revised 2011 Ontario per capita FSR, NFSR (GAFO + Drugs), and HI expenditures. Appendix A-3 calculates per capita household income indexes (2006 Census data for income earned in 2005) and per capita expenditure indexes for the Trade Area based on the footnoted regression equations and relative to the provincial average. Appendix A-4 calculates the resultant 2011 per capita expenditures by retail commercial space category (FSR, NFSR, HAAS/TBA, HI, Personal Service, Restaurant, and Liquor/Beer/Wine) for the Primary and Secondary Trade Area zones. Appendix A-5 provides detailed calculations of the projected population growth unadjusted and adjusted for the Census undercount for the Primary and Secondary Trade Area zones from 2012 to Trade Area Population Projections: Population projections (Table 1 attached 4 and Figure 7 below) are adjusted for the Census undercount. 4 Note: Tables 1-24 follow the text of the report, but precede the Appendices
52 The Primary Trade Area (Town of Whitchurch-Stouffville) is projected to grow from about 41,200 persons (rounded) in the 2012 base year to reach about 60,600 persons by 2031 (for rounded overall growth of 19,400 persons over 19 years, averaging about 1,000 persons per year). These Primary Trade Area population projections follow rapid growth seen in the period 2006 to 2011 (about 3,000 persons per year over 5 years). This means that over a broader 25-year time period 2006 to 2031, the Town s population will have increased almost two-and-a-half times (by about 35,000 persons over 25 years, averaging about 1,400 persons per year). STA South Area is projected to grow from about 50,000 persons (rounded) in 2012 to reach about 58,000 persons by 2031 (for rounded overall growth of less than 8,000 persons). STA East Area is projected to grow from about 24,000 persons (rounded) in 2012 to reach about 25,000 persons by 2031 (for rounded overall growth of less than 1,000 persons). Population Projections 70,000 60,000 50,000 40,000 30,000 20,000 10,000 PTA STA South STA East Figure 7 - Population Projections Year The Community of Stouffville s Trade Area as a whole is projected to grow by about 28,000 persons to raise the 2012 base year population from about 115,300 persons (rounded) to about 143,000 persons in
53 7.3 Analysis Based on the inputs and assumptions the following calculations were carried out: Trade Area Expenditure Potentials: Tables 2 to 9 calculate expenditure potentials for the following categories by multiplying the projected population base in Table 1 by corresponding per capita expenditures: NFSR (GAFO / DRUG) + HI, FSR, Personal Service, Restaurant, and Liquor/Beer/Wine (L/B/W) Per capita space planning ratios are also used to estimate the amount of warranted square footage in the Other Service, Financial Institution, and Local Office categories in Table 21. Real Expenditure Growth: Real growth factors (per annum compounded exclusive of inflation) beyond the 2012 base year are applied to the expenditure potentials as follows: 1.5% to NFSR (GAFO / DRUG) + HI expenditures to 2016, and 0% thereafter; 0.5% to FSR and Personal Service expenditures to 2016, 0.25% to 2021, and 0% thereafter; 0.25% to Restaurant expenditures to 2021, and 0% thereafter; and 0.25% to L/B/W expenditures to 2021, and 0% thereafter; and Market Demands: The base year Trade Area shares and future Trade Area shares of NFSR + HI and FSR spending for the three Trade Area zones are summarized in Table 10. The base year and future Trade Area shares of NFSR + HI spending in Table 10 are incorporated into the residual space calculations in Tables Tables deal with lower order spending on Personal Service, Restaurant, and Liquor/Beer/Wine, and hence deal only with the spending of Primary Trade Area residents. This is unlike Tables which deal with higher order NFSR + HI market support attracted from the three Trade Area zones
54 Residual Space Estimates: In the following discussions, the residual dollars available in the market are defined to mean the dollar amounts left over after the base year sales of the existing competition in the Community of Stouffville are reserved or held constant over the forecast period without sales transfers. The available residual dollars are translated into residual square footages warranted in the market in future years in line with market growth. This involves dividing the residual dollars available within each spending category under investigation by an appropriate sales performance level per square foot. Translating the available residual dollars into residual square footages provides the necessary guidance to calculate future commercial land requirements to meet the growth in market demands. Residual space calculations identify the amount of floor area which can be supported in the market to the year 2031 based on projected population and income growth. Residual space calculations are based on base year local capture rates (market shares) from the consumer telephone survey and rounded future market shares that reflect population growth as the principal driver of the warranted retail space additions. The residual space demands are set out below and summarized in Figure 8 which follows: Department Store Residuals (Table 11): The existing department store space (Wal-Mart 135,600 square feet) is performing at $345 per square foot. Residual department store square footages are calculated at $425 per square foot: 2016: 31,000 square feet (rounded) 2021: 43,000 square feet (rounded) 2026: 49,000 square feet (rounded) 2031: 51,000 square feet (rounded) These residuals might be sufficient to support an anchor use such as Marshall s (typically 20,000 square feet) in the medium term. The residuals would not be sufficient to support other U.S. entries such as Kohl s in the medium term (typically 60,000 square feet). Other General Merchandise Residuals (Table 12): Existing Other General Merchandise space (94,790 square feet) achieves productive base year sales of $447 per square foot. Residual square footages are calculated at $400 per square foot:
55 2016: 32,000 square feet (rounded) 2021: 47,000 square feet (rounded) 2026: 54,000 square feet (rounded) 2031: 58,000 square feet (rounded) These residuals might be sufficient to support a regional chain store anchor use such as a TSC store (Tractor Supply Company typically in the range of 20,000 square feet) in the medium term. Drug & Personal Care Residuals (Table 13): The existing Drug & Personal Care space (37,487 square feet) achieves productive base year sales of $990 per square foot. Drug & Personal Care residuals are calculated at $950 per square foot: 2016: 12,000 square feet (rounded) 2021: 20,000 square feet (rounded) 2026: 23,000 square feet (rounded) 2031: 25,000 square feet (rounded) These residuals might support a new format drug store in the range of 18,000 to 20,000 square feet in the medium term. Fashion & Accessories Residuals Table 14): The existing Fashion & Accessories space (40,180 square feet) achieves relatively low base year sales of $227 per square foot. Fashion & Accessories residuals are calculated at $300 per square foot: 2016: 22,000 square feet (rounded) 2021: 29,000 square feet (rounded) 2026: 31,000 square feet (rounded) 2031: 33,000 square feet (rounded) These residuals would support a needed infusion of Fashion & Accessories space in the short to medium term since this is one category where current local capture rates are relatively low and the current provision of such space is meager. Home Furnishings Residuals (Table 15): The existing Home Furnishings space (44,600 square feet) achieves base year sales of $271 per square foot. Home Furnishings residuals are calculated at $300 per square foot: 2016: 12,000 square feet (rounded) 2021: 17,000 square feet (rounded) 2026: 20,000 square feet (rounded) 2031: 21,000 square feet (rounded)
56 These residuals would support a relatively small infusion of new space compared to the current provision. The most vital infusion needed is in the electronics and computer category. Other Non-Department Store Residuals (Table 16): The existing Other Non-Department Store / Specialty space (75,980 square feet) achieves relatively low base year sales of $259 per square foot. Residuals are calculated at $350 per square foot: 2016: 22,000 square feet (rounded) 2021: 32,000 square feet (rounded) 2026: 36,000 square feet (rounded) 2031: 38,000 square feet (rounded) Home Improvement Residuals (Table 17): The existing HI space (26,860 square feet) achieves very productive base year sales of $1,052 per square foot (including contractor sales). HI residuals are calculated at $335 per square foot: 2016: 14,000 square feet (rounded) 2021: 29,000 square feet (rounded) 2026: 35,000 square feet (rounded) 2031: 38,000 square feet (rounded) Supermarket Residuals (Table 18): The existing Supermarket space (103,910 square feet including 27,000 square feet of Wal-Mart food space) achieves productive average base year sales of $757 per square foot. Supermarket residuals are calculated at $525 per square foot: 2016: 33,000 square feet (rounded) 2021: 56,000 square feet (rounded) 2026: 66,000 square feet (rounded) 2031: 71,000 square feet (rounded) Specialty Food Residuals (Table 19): The existing Specialty Food space (21,900 square feet) achieves productive base year sales of $460 per square foot. Specialty Food residuals are calculated at $275 per square foot: 2016: 4,000 square feet (rounded) 2021: 9,000 square feet (rounded) 2026: 11,000 square feet (rounded) 2031: 13,000 square feet (rounded)
57 Personal Service Residuals (Table 20): The existing Personal Service space (37,670 square feet) achieves average base year sales of $225 per square foot. Personal Service residuals are calculated at $225 per square foot: 2016: 8,000 square feet (rounded) 2021: 14,000 square feet (rounded) 2026: 18,000 square feet (rounded) 2031: 19,000 square feet (rounded) Restaurant Residuals (Table 21): The existing Restaurant space (117,750 square feet) achieves average base year sales of $250 per square foot. Restaurant residuals are calculated at $225 per square foot as follows: 2016: 31,000 square feet (rounded) 2021: 48,000 square feet (rounded) 2026: 56,000 square feet (rounded) 2031: 60,000 square feet (rounded) Liquor/Beer/Wine Residuals (Table 22): The existing Liquor/Beer/Wine space (13,770 square feet) achieves highly productive base year sales of $1,425 per square foot. L/B/W residuals are calculated at $900 per square foot as follows: 2016: 6,000 square feet (rounded) 2021: 9,000 square feet (rounded) 2026: 11,000 square feet (rounded) 2031: 12,000 square feet (rounded) Summary of Residual Retail & Selected Commercial + Other Space: Table 23 reproduces from Tables 11 to 22 the estimates of residual space warranted over the projection period. As well, space planning ratios for the Other Service, Financial Institution, and Local Office categories are applied to the population growth within Town over the forecast period. The total Retail and Selected Commercial residual demands plus demands for Other Space based on space planning ratios are featured in the lower box on Table 23 overleaf attached and chart below
58 Figure 8 - Stouffville Summary Demands and Residual Space Square Feet (Thousands) Department Store Space Other General Merchandise NFSR Space Drug & Personal Care NFSR Space Fashion & Accessories NFSR Space Home Furnishings NFSR Space Other Non-Dep't Store NFSR Space Home Improvement NFSR Space Supermarket FSR Space Specialty Food FSR Space Personal Service Space Restaurant Space Liquor / Beer / Wine Space Table 24(a) simply reproduces the demands for total Retail and Selected Commercial residual space plus for Other Space from the lower box in Table 23 overleaf as follows: o 2016: 285,000 square feet (rounded) o 2021: 455,000 square feet (rounded) o 2026: 535,000 square feet (rounded) o 2031: 570,000 square feet (rounded)
59 In Table 24(b), the potential supply consists of about 420,000 square feet of Vacant Designated Commercial Land Supply (as derived in Table 25 for the regional node, the Western Approach Area, and various other sites such as the Town s Work yard, the vacant former Canadian Tire site, and the Houston Motors site that has re-development potential). In Table 24(c), the potential Vacant Designated Commercial supply less the Retail and Selected Commercial + Other Space demands (Table 24(b) less Table 24(a)) yields the featured square footage surpluses and/or shortages of supply over demand: o 2016: 135,000 square feet (rounded surplus) o 2021: -35,000 square feet (rounded relative equilibrium) o 2026: -115,000 square feet (rounded shortfall) o 2031: -150,000 square feet (rounded shortfall) Converting these square footages to acreages at 25% coverage, the shortfall in supply would persist until 2031 when a supply shortfall of approximately 13.8 acres would remain. Macro-Level Findings: At the macro level, the supply of vacant commercially designated lands, including the 82,000 square feet of commercial development currently approved on the former Anderson Haulage lands in the Western Approach, would be sufficient to meet market demands until 2021 when the market would be in relative equilibrium. However, by 2026 a supply deficit of approximately 10.5 acres (rounded) would emerge. At 25% coverage, this supply surplus would translate into 115,000 square feet. By 2031, the supply deficit would approximate 14 acres, which at 25% coverage would translate into 150,000 square feet
60 8. Conclusions: The purpose of this commercial study update is to investigate whether the existing commercial policies are succeeding in achieving a balanced yet maturing commercial hierarchy. The maturation process involves filling out the remaining development capacity at the Hoover Park Town Centre and the Western Approach Area with medium to higher-order retail uses, and the development of the Gateway Mixed Use Area designation at Highway 48 and Main Street. The rate of maturation of the commercial hierarchy is a consideration in policy terms and at play in economic terms. The general conclusion of the analysis is that, in market terms, the commercial policies are succeeding, but slowly based on the following indicators: In a slowing retail development environment, Stouffville continues to serve a consistent trade area with a shift to increased regional draws. Placed in an overall economic context, the retail commercial development market in the GTA has been in general malaise (inconsistent/mushy) for some time. Even before the effects of the 2008 economic contraction, there were signs that the retail development industry was slowing, as was evident in longstanding power centre approvals in high growth markets not being built out in a timely manner. While caught up in that economic context, the results of this current analysis indicates that the Community of Stouffville continues to serve a consistent trade area, but with a shift to increased regional draws. Current market shares obtained by Stouffville retailers are drawn mostly from the Community of Stouffville, supplemented by moderate yet consistent support coming from Stouffville s secondary market areas. Increased regional draws are generally specific to the Hoover Park Town Centre, but are shared by the other commercial nodes to a much lesser degree. Regional draws have improved since the regional centre (Hoover Park Town Centre) began development. This is primarily due to the draws of the new anchor stores. However, new smaller-scale non-anchor space has not shared a similar expansion in other parts of the community, particularly in the Western Approach Area, notwithstanding the increased regional draws and inflow that the new anchor stores have brought into the local market. The retail commercial hierarchy is in relative good heath with a low vacancy rate and productive performance levels of existing space, but this is off-set by significant merchandising gaps. The low vacancy rate appears to point to the relative good health of the retail commercial hierarchy. This, together with the generally productive performance levels of the existing
61 space (i.e. good sales per square foot), suggest that the market is under-stored. This is coincidental with the fact that significant merchandising gaps are evident primarily for medium to higher order comparison goods shopping categories such as most fashion categories, and electronics and computer goods. Despite the merchandising gaps, the current under-storing, and today s low vacancy rates, the analysis does not identify a significant supply deficit until after 2021 (by 2026 and 2031). At the macro level, the supply of vacant commercially designated lands, including the 82,000 square feet of commercial development currently approved on the former Anderson Haulage lands in the Western Approach, would be sufficient to meet market demands until 2021 when the market would be in relative equilibrium. By 2026 a supply deficit of approximately 10.5 acres (rounded) would emerge. At 25% coverage, this supply surplus would translate into 115,000 square feet. By 2031, the supply deficit would approximate 14 acres, which at 25% coverage would translate into 150,000 square feet. Therefore, it can be concluded that the 2005 Commercial Policy Update which resulted in the creation of the regional node, and the efforts the Town has made in support of the Downtown, appear to have created a generally healthy commercial hierarchy. The support for the Downtown has resulted in a stronger centre, while the addition of the regional node has significantly reduced the outflow for lower order goods. At the same time, there are a number of factors at play which affect the rate of maturation, and are evidenced in the difficulty in leasing out space at Hoover Park Town Centre, and the lack of interest in development of major potential commercial sites in the Western Approach Area. Some of the factors affecting the rate of maturation of the commercial hierarchy include population growth and policy controls on the regional node and the Western Approach. Other factors are those affecting developers and tenants including: current leasing competition between developers (e.g. Hoover Park Town Centre versus Emerson Electric/Metrus in Markham); previous and prospective leasing deals with tenants (e.g. rental trade-offs depending on the strength of individual markets); tenant fears of cannibalizing the sales of their existing stores in proximate markets; tenant concerns over the rate of local population growth in smaller markets; tenant reluctance to commit to riskier development models (e.g. mixed use buildings) in smaller markets; and,
62 lack of tenants appropriate for the market (e.g. new-format tenants are already in the market, few U.S. entry prospects, limited second store options). Other less tangible factors may affect consumers. For example, residents new to the Community of Stouffville might still have ties to other locales because they work in other communities or still go to their current doctors or dentists or other special services outside of Stouffville and continue to shop outside Stouffville as well. In addition, the lack of interest in development in the Western Approach Area may also reflect a lack of perceived identity for the Western Approach Area. The recent application for a reduction in the amount of commercial space on the former Anderson Haulage site in the Western Approach Area was a result of a lack of anchor tenant interest. This may reflect the fact that, despite the strong policy direction in the Secondary Plan, the Western Approach Area is not perceived by retailers to have a retail commercial identity similar to the regional node and the Downtown. This factor may also be explain why no proposals have come forward for other significant sites in this Area including the vacant former Canadian Tire lands at 9 th and Main, the Houston Motors site, or the Town s Works Yard site. The lack of development in the Gateway Mixed Use Area designation at Highway 48 and Main Street because of a range of constraints (e.g. floodplain, property fragmentation) may also be a consideration. This area would serve as the entrance to the Western Approach Area, and the lack of a gateway and related exposure on Highway 48 contributes to a lack of identity in the Western Approach Area. In summary, despite the apparent slow maturation of the commercial hierarchy in the Community of Stouffville, the hierarchy is serving a high income area with good population growth prospects. However, the Community of Stouffville must contend with market issues that affect longer term market projections to Therefore, while a supply deficit has been identified post 2021 which is projected to increase to 150,000 square feet by 2031, consideration has to be given to these market issues in determining whether there is an actual need to designate additional commercial space to replace the reduced supply at the current time. This is particularly the case as market projections beyond five years cannot be regarded as conclusive. Given the uncertainties in the market, consideration should be given as to whether it would be premature to designate additional lands for commercial development at the current time which might put at risk the achievement of the planned function of the current three nodes and the Neighbourhood Retail Area. Based on the available information, it may be preferable to continue to monitor the situation and to encourage commercial intensification in the Downtown and Western Approach Area (i.e. through continued implementation of the Downtown Community Improvement Plan and support for investments in transit supportive mixed-use / multi storey, higher density intensification, infill, development / redevelopment, and expansion / relocation); and to work with Hoover Park Town Centre to encourage the completion of that development. In particular, consideration needs to be given to assessing
63 how to better position the Western Approach Area in the market to capitalize on the identified merchandising gaps. The longer term strategy should seek to achieve a market equilibrium position (neither understored nor over-stored) through incremental expansion in line with emerging market opportunities, most notably through the market absorption of the remaining lands at the Hoover Park Town Centre; through the market absorption of other vacant commercially designated lands or other suitable lands (e.g. the Town s Works Yard); and through other intensification along the commercial corridor in the Western Approach Area and in the Downtown
64 OCTOBER 4, 2012 TABLE 1 TRADE AREA POPULATION PROJECTIONS ADJUSTED FOR CENSUS UNDERCOUNT Census Census Census Base Year Trade Area: Primary Trade Area Whitchurch-Stouffville (Zones 1A + 1B) Population 22,009 24,390 Adjusted Population Projection * 22,889 25,460 40,400 41,235 45,320 49,400 55,800 59,100 60,600 Cumulative Growth from ,085 8,165 14,565 17,865 19,365 Average Annual Growth (%) 5.0% 5.0% 3.9% 3.1% 2.5% Average Annual Growth (#) 2,042 2,041 1,618 1,276 1,019 Secondary Zone South -NE Markham (Zone 2A = N of 16th/E of Kennedy) Population 9,195 37,066 Adjusted Population Projection * 9,565 38,550 48,050 49,950 50,900 51,850 53,750 55,650 57,550 Cumulative Growth from ,900 3,800 5,700 7,600 Average Annual Growth (%) 1.0% 1.0% 0.8% 0.8% 0.8% Average Annual Growth (#) Secondary Zone East (Zones 3A + 3B + 3C + 3D) Population 20,257 21,959 Adjusted Population Projection * 21,065 22,840 23,900 24,100 24,200 24,300 24,500 24,700 24,900 Cumulative Growth from Average Annual Growth (%) 0.2% 0.2% 0.2% 0.2% 0.2% Average Annual Growth (#) Trade Area Population 51,461 83,415 Adjusted Population Projection * 53,519 86, , , , , , , ,050 Cumulative Growth 5,135 10,265 18,765 24,165 27,765 Average Annual Growth (%) 2.2% 2.2% 1.8% 1.5% 1.3% Average Annual Growth (#) 2,567 2,566 2,085 1,726 1,461 * Rounded adjustment for census undercount = 1.04 per Annual Demographic Statistics, Cat ). Assumptions: Whitchurch-Stouffville populations with undercount = from York Region Population Estimate May 31, 2012 Secondary Trade Area South (Zone 2A = N of 16th/E of Kennedy) assumes approximately 3,000 new units by Secondary Trade Area East (Zones 3A + 3B + 3C + 3D = Uxbridge plus Pickering N of Hwy 7) assumes approximately 300 new units by 2031.
65 OCTOBER 4, 2012 TABLE 2 TRADE AREA "NFSR" (GAFO + DRUG) & "HI" COMBINED EXPENDITURE POTENTIAL Base Year Trade Area Primary Trade Area - Whitchurch-Stouffville Population (Zones 1A + 1B) 40,400 41,235 45,320 49,400 55,800 59,100 60,600 Per Capita Expenditure ($) * $6,756 $6,857 $7,065 $7,278 $7,462 $7,462 $7,462 Expenditure Potential ($ m's) na $282.8 $320.2 $359.5 $416.4 $441.0 $452.2 Secondary Zone South -NE Markham Population (Zone 2A = N of 16th/E of Kennedy) 48,050 49,950 50,900 51,850 53,750 55,650 57,550 Per Capita Expenditure ($) * $5,221 $5,299 $5,459 $5,624 $5,767 $5,767 $5,767 Expenditure Potential ($ m's) na $264.7 $277.9 $291.6 $310.0 $320.9 $331.9 Secondary Zone East Population (Zones 3A + 3B + 3C + 3D) 23,900 24,100 24,200 24,300 24,500 24,700 24,900 Per Capita Expenditure ($) * $6,121 $6,213 $6,401 $6,594 $6,761 $6,761 $6,761 Expenditure Potential ($ m's) na $149.7 $154.9 $160.2 $165.6 $167.0 $168.3 Subtotal Whitchurch-Stouffville Trade Area na $697.2 $752.9 $811.4 $892.0 $928.9 $952.4 * Relative to a combined 2011 Ontario average per capita NFSR (Non Food Store Retail = "GAFO + DRUG") + "HI" (Home Improvement) expenditure of $5,543 per Appendices A-2 to A-4. Assume real 1.5% per annum compounded to the year 2016, and 0.5% to 2021, and 0% beyond 2021 to TABLE 3 TRADE AREA "NFSR" (GAFO / DRUG) LESS HAAS/TBA EXPENDITURE POTENTIAL Base Year Trade Area Primary Trade Area - Whitchurch-Stouffville Population (Zones 1A + 1B) 40,400 41,235 45,320 49,400 55,800 59,100 60,600 Per Capita Expenditure ($) * $5,473 $5,555 $5,723 $5,896 $6,045 $6,045 $6,045 Expenditure Potential ($ m's) na $229.1 $259.4 $291.3 $337.3 $357.3 $366.3 Secondary Zone South -NE Markham Population (Zone 2A = N of 16th/E of Kennedy) 48,050 49,950 50,900 51,850 53,750 55,650 57,550 Per Capita Expenditure ($) * $4,229 $4,292 $4,422 $4,556 $4,671 $4,671 $4,671 Expenditure Potential ($ m's) na $214.4 $225.1 $236.2 $251.1 $259.9 $268.8 Secondary Zone East Population (Zones 3A + 3B + 3C + 3D) 23,900 24,100 24,200 24,300 24,500 24,700 24,900 Per Capita Expenditure ($) * $4,959 $5,033 $5,186 $5,342 $5,477 $5,477 $5,477 Expenditure Potential ($ m's) na $121.3 $125.5 $129.8 $134.2 $135.3 $136.4 Subtotal Whitchurch-Stouffville Trade Area na $564.8 $609.9 $657.3 $722.6 $752.5 $771.5 * Relative to the 2011 Ontario average per capita NFSR (Non Food Store Retail = "GAFO + DRUG") expenditure LESS "HAAS/TBA" (Home & Auto Supply and Tires/Batteries/Accessories) expenditure ($4,823 minus $333 = $4,490) per Appendices A-2 to A-4. Assume real 1.5% per annum compounded to the year 2016, and 0.5% to 2021, and 0% beyond 2021 to 2031.
66 OCTOBER 4, 2012 TABLE 4 TRADE AREA "HI" (HOME IMPROVEMENT) EXPENDITURE POTENTIAL Base Year Trade Area Primary Trade Area - Whitchurch-Stouffville Population (Zones 1A + 1B) 40,400 41,235 45,320 49,400 55,800 59,100 60,600 Per Capita Expenditure ($) * $878 $891 $918 $946 $970 $970 $970 Expenditure Potential ($ m's) na $36.7 $41.6 $46.7 $54.1 $57.3 $58.8 Secondary Zone South -NE Markham Population (Zone 2A = N of 16th/E of Kennedy) 48,050 49,950 50,900 51,850 53,750 55,650 57,550 Per Capita Expenditure ($) * $678 $688 $709 $730 $749 $749 $749 Expenditure Potential ($ m's) na $34.4 $36.1 $37.9 $40.3 $41.7 $43.1 Secondary Zone East Population (Zones 3A + 3B + 3C + 3D) 23,900 24,100 24,200 24,300 24,500 24,700 24,900 Per Capita Expenditure ($) * $795 $807 $831 $856 $878 $878 $878 Expenditure Potential ($ m's) na $19.4 $20.1 $20.8 $21.5 $21.7 $21.9 Subtotal Whitchurch-Stouffville Trade Area na $90.6 $97.8 $105.4 $115.9 $120.7 $123.7 * Relative to the 2011 Ontario average per capita "HI" (Home Improvement) expenditure of $720 per Appendices A-2 to A-4. Assume real 1.5% per annum compounded to the year 2016, and 0.5% to 2021, and 0% beyond 2021 to TABLE 5 TRADE AREA "HAAS / TBA" (HOME & AUTO SUPPLY + TIRES/BATTERIES/ACCESSORIES) EXPENDITURE POTENTIAL Base Year Trade Area Primary Trade Area - Whitchurch-Stouffville Population (Zones 1A + 1B) 40,400 41,235 45,320 49,400 55,800 59,100 60,600 Per Capita Expenditure ($) * $405 $411 $423 $436 $447 $447 $447 Expenditure Potential ($ m's) na $17.0 $19.2 $21.6 $25.0 $26.4 $27.1 Secondary Zone South -NE Markham Population (Zone 2A = N of 16th/E of Kennedy) 48,050 49,950 50,900 51,850 53,750 55,650 57,550 Per Capita Expenditure ($) * $313 $318 $327 $337 $346 $346 $346 Expenditure Potential ($ m's) na $15.9 $16.7 $17.5 $18.6 $19.2 $19.9 Secondary Zone East Population (Zones 3A + 3B + 3C + 3D) 23,900 24,100 24,200 24,300 24,500 24,700 24,900 Per Capita Expenditure ($) * $367 $373 $384 $395 $405 $405 $405 Expenditure Potential ($ m's) na $9.0 $9.3 $9.6 $9.9 $10.0 $10.1 Subtotal Whitchurch-Stouffville Trade Area na $41.8 $45.1 $48.6 $53.5 $55.7 $57.1 * Relative to the 2011 Ontario average per capita "HAAS/TBA" (Home & Auto Supply + Tires/Batteries/Accessories) expenditure of $333 per Appendices A-2 to A-4. Assume real 1.5% per annum compounded to the year 2016, and 0.5% to 2021, and 0% beyond 2021 to 2031.
67 OCTOBER 4, 2012 TABLE 6 TRADE AREA "FSR" (FOOD STORE RETAIL) EXPENDITURE POTENTIAL Base Year Trade Area Primary Trade Area - Whitchurch-Stouffville Population (Zones 1A + 1B) 40,400 41,235 45,320 49,400 55,800 59,100 60,600 Per Capita Expenditure ($) * $2,292 $2,303 $2,327 $2,350 $2,379 $2,379 $2,379 Expenditure Potential ($ m's) na $95.0 $105.4 $116.1 $132.8 $140.6 $144.2 Secondary Zone South -NE Markham Population (Zone 2A = N of 16th/E of Kennedy) 48,050 49,950 50,900 51,850 53,750 55,650 57,550 Per Capita Expenditure ($) * $2,159 $2,170 $2,192 $2,214 $2,241 $2,241 $2,241 Expenditure Potential ($ m's) na $108.4 $111.5 $114.8 $120.5 $124.7 $129.0 Secondary Zone East Population (Zones 3A + 3B + 3C + 3D) 23,900 24,100 24,200 24,300 24,500 24,700 24,900 Per Capita Expenditure ($) * $2,237 $2,248 $2,271 $2,293 $2,322 $2,322 $2,322 Expenditure Potential ($ m's) na $54.2 $55.0 $55.7 $56.9 $57.4 $57.8 Subtotal Whitchurch-Stouffville Trade Area na $257.5 $271.9 $286.6 $310.1 $322.7 $331.0 * Relative to the 2011 Ontario average per capita "FSR" (Food Store Retail) expenditure of $2,187 per Appendices A-2 to A-4. Assume real 0.5% per annum compounded to the year 2016, and 0.25% to 2021, and 0% beyond 2021 to 2031). TABLE 7 TRADE AREA PERSONAL SERVICE EXPENDITURE POTENTIAL Base Year Trade Area Primary Trade Area - Whitchurch-Stouffville Population (Zones 1A + 1B) 40,400 41,235 45,320 49,400 55,800 59,100 60,600 Per Capita Expenditure ($) * $324 $326 $329 $332 $336 $336 $336 Expenditure Potential ($ m's) na $13.4 $14.9 $16.4 $18.8 $19.9 $20.4 * Relative to the 2011 Ontario average per capita Personal Service expenditure of $274 per Appendices A-2 to A-4. Assume real 0.5% per annum compounded to the year 2016, and 0.25% to 2021, and 0% beyond 2021 to 2031). TABLE 8 TRADE AREA RESTAURANT EXPENDITURE POTENTIAL Base Year Trade Area Primary Trade Area - Whitchurch-Stouffville Population (Zones 1A + 1B) 40,400 41,235 45,320 49,400 55,800 59,100 60,600 Per Capita Expenditure ($) * $992 $994 $999 $1,004 $1,017 $1,017 $1,017 Expenditure Potential ($ m's) na $41.0 $45.3 $49.6 $56.8 $60.1 $61.6 * Relative to the 2011 Ontario average per capita Restaurant expenditure of $827 per Appendices A-2 to A-4. Assume real 0.25% per annum compounded to the year 2021 and 0% beyond 2021 to 2031).
68 OCTOBER 4, 2012 TABLE 9 TRADE AREA LIQUOR/BEER/WINE EXPENDITURE POTENTIAL Base Year Trade Area Primary Trade Area - Whitchurch-Stouffville Population (Zones 1A + 1B) 40,400 41,235 45,320 49,400 55,800 59,100 60,600 Per Capita Expenditure ($) * $694 $696 $699 $703 $712 $712 $712 Expenditure Potential ($ m's) na $28.7 $31.7 $34.7 $39.7 $42.1 $43.1 * Relative to the 2011 Ontario average per capita Liquor / Beer / Wine expenditure of $559 per Appendices A-2 to A-4. Assume real 0.25% per annum compounded to the year 2021 and 0% beyond 2021 to 2031). TABLE 10 BASE YEAR TRADE AREA SHARES OF "NFSR" + "HI" EXPENDITURE POTENTIAL BY ZONE Base Year Forecast Years Ontario PTA STA-South STA-East Ontario PTA STA-South STA-East BASE YEAR 2011 * * Projection Period Department Store 14.8% 14.7% 18.3% 12.8% 14.8% 15.0% 18.5% 13.0% Other General Merchandise 14.2% 13.8% 10.6% 18.2% 14.2% 14.5% 10.5% 18.0% Drug & Personal Care 17.1% 13.4% 10.0% 10.9% 17.1% 14.0% 10.5% 11.0% Fashion & Accessories 13.9% 8.8% 16.1% 7.9% 13.9% 11.5% 16.0% 8.5% Home Furnishings 14.8% 12.3% 11.5% 9.4% 14.8% 13.0% 11.5% 11.0% Other Non-dep't store NFSR 12.2% 10.8% 12.3% 12.6% 12.2% 12.0% 12.5% 13.5% Non-department Store 72.2% 59.1% 60.5% 59.0% 72.2% 65.0% 61.0% 62.0% HI 13.0% 26.2% 21.2% 28.2% 13.0% 20.0% 20.5% 25.0% Subtotal NFSR 100.0% 100.0% 100.0% 100.0% 100.0% 100.0% 100.0% 100.0% Supermarket & Grocery 87.1% 83.3% 82.1% 86.9% 87.1% 85.0% 82.5% 87.0% Specialty Food 12.9% 16.7% 17.9% 13.2% 12.9% 15.0% 17.5% 13.0% Subtotal FSR 100.0% 100.0% 100.0% 100.0% 100.0% 100.0% 100.0% 100.0% * Reference: Appendix A-2
69 OCTOBER 4, 2012 TABLE 11 DEPARTMENT STORE SHARE OF "NFSR" (GAFO / DRUG) & "HI" DEMANDS & RESIDUAL SPACE Base Year Trade Area Primary Trade Area - Whitchurch-Stouffville Population (Zones 1A + 1B) Expenditure Potential ($ m's) $282.8 $320.2 $359.5 $416.4 $441.0 $452.2 Dep't Store Share of NFSR + HI 14.7% 15.0% $48.0 $53.9 $62.5 $66.1 $67.8 Local Capture 56.7% 57.0% $27.4 $30.7 $35.6 $37.7 $38.7 Secondary Zone South -NE Markham Population (Zone 2A = N of 16th/E of Kennedy) Expenditure Potential ($ m's) $264.7 $277.9 $291.6 $310.0 $320.9 $331.9 Dep't Store Share of NFSR + HI 18.3% 18.5% $51.4 $54.0 $57.3 $59.4 $61.4 Local Capture 8.3% 8.5% $4.4 $4.6 $4.9 $5.0 $5.2 Secondary Zone East Population (Zones 3A + 3B + 3C + 3D) Expenditure Potential ($ m's) $149.7 $154.9 $160.2 $165.6 $167.0 $168.3 Dep't Store Share of NFSR + HI 12.8% 13.0% $20.1 $20.8 $21.5 $21.7 $21.9 Local Capture 2.7% 3.0% $0.6 $0.6 $0.6 $0.7 $0.7 Stouffville Local Share Without Inflow $28.1 $32.3 $36.0 $41.1 $43.4 $44.5 Plus Inflow 40.0% 40.0% *** $21.6 $24.0 $24.0 $24.0 $24.0 Total Potential Stouffville Local Capture $46.8 $53.9 $59.9 $65.1 $67.4 $68.5 Less Existing Competition: 135,600 sf GLA (Regional Centre) $345 /sf GLA $46.8 $46.8 $46.8 $46.8 $46.8 $46.8 Residual Sales Demand $0.0 $7.2 $13.2 $18.3 $20.6 $21.7 Warranted sf $425 /sf GLA 0 16,836 30,967 43,129 48,500 51,170 * Base year shares from consumer telephone survey. ** Base year inflow adjusted from licence plate surveys. *** Assume future 40.0% until 2016 and declining in percentage terms thereafter.
70 OCTOBER 4, 2012 TABLE 12 OTHER GENERAL MERCHANDISE SHARE OF "NFSR" (GAFO / DRUG) & "HI" DEMANDS & RESIDUAL SPACE Base Year Trade Area Primary Trade Area - Whitchurch-Stouffville Population (Zones 1A + 1B) Expenditure Potential ($ m's) $282.8 $320.2 $359.5 $416.4 $441.0 $452.2 Other Gen'l Merch. Share of NFSR + HI 13.8% 14.5% $46.4 $52.1 $60.4 $63.9 $65.6 Local Capture 72.3% 72.5% $33.7 $37.8 $43.8 $46.4 $47.5 Secondary Zone South -NE Markham Population (Zone 2A = N of 16th/E of Kennedy) Expenditure Potential ($ m's) $264.7 $277.9 $291.6 $310.0 $320.9 $331.9 Other Gen'l Merch. Share of NFSR + HI 10.6% 10.5% $29.2 $30.6 $32.5 $33.7 $34.8 Local Capture 15.4% 15.5% $4.5 $4.7 $5.0 $5.2 $5.4 Secondary Zone East Population (Zones 3A + 3B + 3C + 3D) Expenditure Potential ($ m's) $149.7 $154.9 $160.2 $165.6 $167.0 $168.3 Other Gen'l Merch. Share of NFSR + HI 18.2% 18.0% $27.9 $28.8 $29.8 $30.1 $30.3 Local Capture 5.0% 5.0% $1.4 $1.4 $1.5 $1.5 $1.5 Stouffville Local Share Without Inflow $33.9 $39.6 $44.0 $50.3 $53.1 $54.5 Plus Inflow 20.0% 20.0% *** $9.9 $11.0 $11.0 $11.0 $11.0 Total Potential Stouffville Local Capture $42.3 $49.5 $55.0 $61.3 $64.1 $65.4 Less Existing 94,790 sf GLA **** $447 /sf GLA $42.3 $42.3 $42.3 $42.3 $42.3 $42.3 Residual Sales Demand $0.0 $7.1 $12.6 $19.0 $21.7 $23.1 Warranted sf $400 /sf GLA 0 17,836 31,620 47,424 54,372 57,790 * Base year shares from consumer telephone survey. ** Base year inflow adjusted from licence plate surveys. *** Assume future 20.0% until 2016 and declining in percentage terms thereafter. **** Includes Giant Tiger and Canadian Tire and other HAAS/TBA.
71 OCTOBER 4, 2012 TABLE 13 DRUG & PERSONAL CARE SHARE OF "NFSR" (GAFO / DRUG) & "HI" DEMANDS & RESIDUAL SPACE Base Year Trade Area Primary Trade Area - Whitchurch-Stouffville Population (Zones 1A + 1B) Expenditure Potential ($ m's) $282.8 $320.2 $359.5 $416.4 $441.0 $452.2 Drug & Personal Care Share of NFSR + HI 13.4% 14.0% $44.8 $50.3 $58.3 $61.7 $63.3 Local Capture 89.9% 90.0% $40.3 $45.3 $52.5 $55.6 $57.0 Secondary Zone South -NE Markham Population (Zone 2A = N of 16th/E of Kennedy) Expenditure Potential ($ m's) $264.7 $277.9 $291.6 $310.0 $320.9 $331.9 Drug & Personal Care Share of NFSR + HI 10.0% 10.5% $29.2 $30.6 $32.5 $33.7 $34.8 Local Capture 2.6% 2.5% $0.7 $0.8 $0.8 $0.8 $0.9 Secondary Zone East Population (Zones 3A + 3B + 3C + 3D) Expenditure Potential ($ m's) $149.7 $154.9 $160.2 $165.6 $167.0 $168.3 Drug & Personal Care Share of NFSR + HI 10.9% 11.0% $17.0 $17.6 $18.2 $18.4 $18.5 Local Capture 8.9% 9.0% $1.5 $1.6 $1.6 $1.7 $1.7 Stouffville Local Share Without Inflow $36.2 $42.6 $47.7 $54.9 $58.1 $59.5 Plus Inflow 2.5% 2.5% *** $1.1 $1.2 $1.2 $1.2 $1.2 Total Potential Stouffville Local Capture $37.1 $43.7 $48.9 $56.1 $59.3 $60.7 Less Existing 37,487 sf GLA $990 /sf GLA $37.1 $37.1 $37.1 $37.1 $37.1 $37.1 Residual Sales Demand $0.0 $6.6 $11.8 $19.0 $22.2 $23.6 Warranted sf $950 /sf GLA 0 0 6,924 12,376 20,021 23,332 24,861 * Base year shares from consumer telephone survey. ** Base year inflow adjusted from licence plate surveys. *** Assume future 2.5% until 2016 and declining in percentage terms thereafter.
72 OCTOBER 4, 2012 TABLE 14 FASHION & ACCESSORIES SHARE OF "NFSR" (GAFO / DRUG) & "HI" DEMANDS & RESIDUAL SPACE Base Year Trade Area Primary Trade Area - Whitchurch-Stouffville Population (Zones 1A + 1B) Expenditure Potential ($ m's) $282.8 $320.2 $359.5 $416.4 $441.0 $452.2 Fashion & Accessories Share of NFSR + HI 8.8% 11.5% $36.8 $41.3 $47.9 $50.7 $52.0 Local Capture 26.2% 28.5% $10.5 $11.8 $13.6 $14.5 $14.8 Secondary Zone South -NE Markham Population (Zone 2A = N of 16th/E of Kennedy) Expenditure Potential ($ m's) $264.7 $277.9 $291.6 $310.0 $320.9 $331.9 Fashion & Accessories Share of NFSR + HI 16.1% 16.0% $44.5 $46.7 $49.6 $51.3 $53.1 Local Capture 0.9% 1.0% $0.4 $0.5 $0.5 $0.5 $0.5 Secondary Zone East Population (Zones 3A + 3B + 3C + 3D) Expenditure Potential ($ m's) $149.7 $154.9 $160.2 $165.6 $167.0 $168.3 Drug & Personal Care Share of NFSR + HI 7.9% 8.5% $13.2 $13.6 $14.1 $14.2 $14.3 Local Capture 3.1% 3.0% $0.4 $0.4 $0.4 $0.4 $0.4 Stouffville Local Share Without Inflow $7.3 $11.3 $12.7 $14.6 $15.4 $15.8 Plus Inflow 20.0% 20.0% *** $2.8 $3.2 $3.2 $3.2 $3.2 Total Potential Stouffville Local Capture $9.1 $14.2 $15.8 $17.7 $18.6 $18.9 Less Existing 40,180 sf GLA $227 /sf GLA $9.1 $9.1 $9.1 $9.1 $9.1 $9.1 Residual Sales Demand $0.0 $5.0 $6.7 $8.6 $9.4 $9.8 Warranted sf $300 /sf GLA 0 16,828 22,354 28,707 31,467 32,760 * Base year shares from consumer telephone survey. ** Base year inflow adjusted from licence plate surveys. *** Assume future 20% until 2016 and declining in percentage terms thereafter.
73 OCTOBER 4, 2012 TABLE 15 HOME FURNISHINGS SHARE OF "NFSR" (GAFO / DRUG) & "HI" DEMANDS & RESIDUAL SPACE Base Year Trade Area Primary Trade Area - Whitchurch-Stouffville Population (Zones 1A + 1B) Expenditure Potential ($ m's) $282.8 $320.2 $359.5 $416.4 $441.0 $452.2 Home Furnishings Share of NFSR + HI 12.3% 13.0% $41.6 $46.7 $54.1 $57.3 $58.8 Local Capture 18.8% 19.0% $7.9 $8.9 $10.3 $10.9 $11.2 Secondary Zone South -NE Markham Population (Zone 2A = N of 16th/E of Kennedy) Expenditure Potential ($ m's) $264.7 $277.9 $291.6 $310.0 $320.9 $331.9 Home Furnishings Share of NFSR + HI 11.5% 11.5% $32.0 $33.5 $35.6 $36.9 $38.2 Local Capture 6.4% 6.5% $2.1 $2.2 $2.3 $2.4 $2.5 Secondary Zone East Population (Zones 3A + 3B + 3C + 3D) Expenditure Potential ($ m's) $149.7 $154.9 $160.2 $165.6 $167.0 $168.3 Home Furnishings Share of NFSR + HI 9.4% 11.0% $17.0 $17.6 $18.2 $18.4 $18.5 Local Capture 4.1% 4.0% $0.7 $0.7 $0.7 $0.7 $0.7 Stouffville Local Share Without Inflow $9.1 $10.7 $11.8 $13.3 $14.0 $14.4 Plus Inflow 25.0% 25.0% *** $3.6 $3.9 $3.9 $3.9 $3.9 Total Potential Stouffville Local Capture $12.1 $14.2 $15.7 $17.3 $17.9 $18.3 Less Existing 44,600 sf GLA $271 /sf GLA $12.1 $12.1 $12.1 $12.1 $12.1 $12.1 Residual Sales Demand $0.0 $2.1 $3.6 $5.2 $5.9 $6.2 Warranted sf $300 /sf GLA 0 7,165 12,049 17,264 19,584 20,799 * Base year shares from consumer telephone survey. ** Base year inflow adjusted from licence plate surveys. *** Assume future 25% until 2016 and declining in percentage terms thereafter.
74 OCTOBER 4, 2012 TABLE 16 OTHER NON-DEPARTMENT STORE SHARE OF "NFSR" (GAFO / DRUG) & "HI" DEMANDS & RESIDUAL SPACE Base Year Trade Area Primary Trade Area - Whitchurch-Stouffville Population (Zones 1A + 1B) Expenditure Potential ($ m's) $282.8 $320.2 $359.5 $416.4 $441.0 $452.2 Other Non-Dep't Store Share of NFSR + HI 10.8% 12.0% $38.4 $43.1 $50.0 $52.9 $54.3 Local Capture 46.8% 47.0% $18.1 $20.3 $23.5 $24.9 $25.5 Secondary Zone South -NE Markham Population (Zone 2A = N of 16th/E of Kennedy) Expenditure Potential ($ m's) $264.7 $277.9 $291.6 $310.0 $320.9 $331.9 Other Non-Dep't Store Share of NFSR + HI 12.3% 12.5% $34.7 $36.5 $38.7 $40.1 $41.5 Local Capture 2.5% 2.5% $0.9 $0.9 $1.0 $1.0 $1.0 Secondary Zone East Population (Zones 3A + 3B + 3C + 3D) Expenditure Potential ($ m's) $149.7 $154.9 $160.2 $165.6 $167.0 $168.3 Other Non-Dep't Store Share of NFSR + HI 12.6% 13.5% $20.9 $21.6 $22.4 $22.5 $22.7 Local Capture 3.6% 4.0% $0.8 $0.9 $0.9 $0.9 $0.9 Stouffville Local Share Without Inflow $15.8 $19.8 $22.1 $25.3 $26.8 $27.4 Plus Inflow 20.0% 20.0% *** $4.9 $5.5 $5.5 $5.5 $5.5 Total Potential Stouffville Local Capture $19.7 $24.7 $27.6 $30.9 $32.3 $33.0 Less Existing 75,980 sf GLA $259 /sf GLA $19.7 $19.7 $19.7 $19.7 $19.7 $19.7 Residual Sales Demand $0.0 $5.0 $7.9 $11.2 $12.6 $13.3 Warranted sf $350 /sf GLA 0 14,271 22,458 31,864 35,951 37,873 * Base year shares from consumer telephone survey. ** Base year inflow adjusted from licence plate surveys. *** Assume future 20.0% until 2016 and declining in percentage terms thereafter.
75 OCTOBER 4, 2012 TABLE 17 HOME IMPROVEMENT ("HI") SHARE OF "NFSR" (GAFO / DRUG) & "HI" DEMANDS & RESIDUAL SPACE Base Year Trade Area Primary Trade Area - Whitchurch-Stouffville Population (Zones 1A + 1B) Expenditure Potential ($ m's) $282.8 $320.2 $359.5 $416.4 $441.0 $452.2 Home Improvement Share of NFSR + HI 26.2% 20.0% $64.0 $71.9 $83.3 $88.2 $90.4 Local Capture 35.5% 42.5% $27.2 $30.6 $35.4 $37.5 $38.4 Secondary Zone South -NE Markham Population (Zone 2A = N of 16th/E of Kennedy) Expenditure Potential ($ m's) $264.7 $277.9 $291.6 $310.0 $320.9 $331.9 Home Improvement Share of NFSR + HI 21.2% 20.5% $57.0 $59.8 $63.5 $65.8 $68.0 Local Capture 0.7% 1.0% $0.6 $0.6 $0.6 $0.7 $0.7 Secondary Zone East Population (Zones 3A + 3B + 3C + 3D) Expenditure Potential ($ m's) $149.7 $154.9 $160.2 $165.6 $167.0 $168.3 Home Improvement Share of NFSR + HI 28.2% 25.0% $38.7 $40.1 $41.4 $41.7 $42.1 Local Capture 2.0% 2.5% $1.0 $1.0 $1.0 $1.0 $1.1 Stouffville Local Share Without Inflow $27.5 $28.8 $32.2 $37.1 $39.2 $40.2 Plus Inflow 2.5% 2.5% *** $0.7 $0.8 $0.8 $0.8 $0.8 Total Potential Stouffville Local Capture $28.2 $29.5 $33.0 $37.9 $40.0 $41.0 Less Existing 26,860 sf GLA $1,052 /sf GLA $28.2 $28.2 $28.2 $28.2 $28.2 $28.2 Residual Sales Demand $0.0 $1.2 $4.7 $9.6 $11.8 $12.7 Warranted sf $335 /sf GLA 0 3,704 14,140 28,773 35,114 38,046 * Base year shares from consumer telephone survey. ** Base year inflow adjusted from licence plate surveys. *** Assume future 4.0% until 2016 and declining in percentage terms thereafter.
76 OCTOBER 4, 2012 TABLE 18 SUPERMARKET / GROCERY DEMANDS & RESIDUAL SPACE Base Year Trade Area Primary Trade Area - Whitchurch-Stouffville Population (Zones 1A + 1B) Expenditure Potential ($ m's) $95.0 $105.4 $116.1 $132.8 $140.6 $144.2 Supermarket 83.3% 85.0% $89.6 $98.7 $112.9 $119.5 $122.6 Local Capture 80.3% 80.5% $72.1 $79.4 $90.8 $96.2 $98.7 Secondary Zone South -NE Markham Population (Zone 2A = N of 16th/E of Kennedy) Expenditure Potential ($ m's) $108.4 $111.5 $114.8 $120.5 $124.7 $129.0 Supermarket 82.1% 82.5% $92.0 $94.7 $99.4 $102.9 $106.4 Local Capture 5.9% 6.0% $5.5 $5.7 $6.0 $6.2 $6.4 Secondary Zone East Population (Zones 3A + 3B + 3C + 3D) Expenditure Potential ($ m's) $54.2 $55.0 $55.7 $56.9 $57.4 $57.8 Supermarket 86.9% 87.0% $47.8 $48.5 $49.5 $49.9 $50.3 Local Capture 12.4% 12.5% $6.0 $6.1 $6.2 $6.2 $6.3 Stouffville Local Share Without Inflow $74.7 $83.6 $91.2 $103.0 $108.6 $111.3 Plus Inflow 5.0% 5.0% *** $4.4 $4.8 $4.8 $4.8 $4.8 Total Potential Stouffville Local Capture $78.6 $88.0 $96.0 $107.8 $113.4 $116.1 Less Existing 103,911 sf GLA (including Wal-Mart 27,000 ft²) $757 /sf GLA $78.6 $78.6 $78.6 $78.6 $78.6 $78.6 Residual Sales Demand $0.0 $9.4 $17.4 $29.2 $34.8 $37.5 Warranted sf $500 per sf GLA 0 18,865 34,714 58,367 69,635 $525 per sf GLA 0 17,966 33,061 55,588 66,319 71,469 * Base year estimate from consumer telephone survey. ** Estimated from licence plate surveys and floorspace inventory. *** Assume 5.0% until 2016 and declining in percentage terms thereafter.
77 OCTOBER 4, 2012 TABLE 19 SPECIALTY FOOD DEMANDS & RESIDUAL SPACE Base Year Trade Area Primary Trade Area - Whitchurch-Stouffville Population (Zones 1A + 1B) Expenditure Potential ($ m's) $95.0 $105.4 $116.1 $132.8 $140.6 $144.2 Specialty Food 16.7% 15.0% $15.8 $17.4 $19.9 $21.1 $21.6 Local Specialty Food Capture 60.6% 60.5% $9.6 $10.5 $12.0 $12.8 $13.1 Secondary Zone South -NE Markham Population (Zone 2A = N of 16th/E of Kennedy) Expenditure Potential ($ m's) $108.4 $111.5 $114.8 $120.5 $124.7 $129.0 Specialty Food 17.9% 17.5% $19.5 $20.1 $21.1 $21.8 $22.6 Local Specialty Food Capture 0.0% 0.0% $0.0 $0.0 $0.0 $0.0 $0.0 Secondary Zone East Population (Zones 3A + 3B + 3C + 3D) Expenditure Potential ($ m's) $54.2 $55.0 $55.7 $56.9 $57.4 $57.8 Specialty Food 13.2% 13.0% $7.1 $7.2 $7.4 $7.5 $7.5 Local Specialty Food Capture 3.24% 3.5% $0.3 $0.3 $0.3 $0.3 $0.3 Stouffville Local Share Without Inflow $9.8 $9.8 $10.8 $12.3 $13.0 $13.4 Plus Inflow 2.5% 2.5% *** $0.3 $0.3 $0.3 $0.3 $0.3 Total Potential Stouffville Local Capture $10.1 $10.1 $11.1 $12.6 $13.3 $13.6 Less Existing 21,900 sf $460 /sf GLA $10.1 $10.1 $10.1 $10.1 $10.1 $10.1 Residual Sales Demand $0.0 $0.0 $1.0 $2.5 $3.2 $3.6 Warranted sf $250 per sf GLA 0 0 3,979 10,058 12,917 $275 per sf GLA 0 0 3,618 9,144 11,743 12,928 * From consumer telephone survey. ** Base year inflow = consultant judgment. *** Assume 2.5% until 2016 and declining in percentage terms thereafter.
78 OCTOBER 4, 2012 Base Year Trade Area Primary Trade Area - Whitchurch-Stouffville Population (Zones 1A + 1B) Expenditure Potential ($ m's) $13.4 $14.9 $16.4 $18.8 $19.9 $20.4 Local 60.0% 60.0% $8.9 $9.8 $11.3 $11.9 $12.2 Stouffville Local Share Without Inflow $8.1 $8.9 $9.8 $11.3 $11.9 $12.2 Plus Inflow TABLE 20 PRIMARY TRADE AREA PERSONAL SERVICE DEMANDS & RESIDUAL 5.0% * 5.0% ** $0.5 $0.5 $0.5 $0.5 $0.5 Total Potential Stouffville Local Capture $8.5 $9.4 $10.4 $11.8 $12.4 $12.7 Less Existing 37,670 sf $225 /sf GLA $8.5 $8.5 $8.5 $8.5 $8.5 $8.5 Residual Sales Demand $0.0 $0.9 $1.9 $3.3 $4.0 $4.3 Warranted sf $200 per sf GLA 0 4,667 9,419 16,496 19,826 $225 per sf GLA 0 4,149 8,373 14,663 17,623 $250 per sf GLA 0 3,734 7,536 13,197 15,861 17,072 * Consultant estimate. ** Assume 5.0% until 2016 and declining in percentage terms thereafter.
79 OCTOBER 4, 2012 Base Year Trade Area Primary Trade Area - Whitchurch-Stouffville Population (Zones 1A + 1B) Expenditure Potential ($ m's) $41.0 $45.3 $49.6 $56.8 $60.1 $61.6 Local 55.0% * 55.0% * $24.9 $27.3 $31.2 $33.1 $33.9 Stouffville Local Share Without Inflow $22.6 $24.9 $27.3 $31.2 $33.1 $33.9 Plus Inflow TABLE 21 PRIMARY TRADE AREA RESTAURANT DEMANDS & RESIDUAL 23.5% * 25.0% ** $8.3 $9.1 $9.1 $9.1 $9.1 Total Potential Stouffville Local Capture $29.5 $33.2 $36.4 $40.3 $42.2 $43.0 Less Existing 117,747 sf $250 /sf GLA $29.5 $29.5 $29.5 $29.5 $29.5 $29.5 Residual Sales Demand $0.0 $3.7 $6.9 $10.8 $12.7 $13.5 Warranted sf $200 per sf GLA 0 18,669 34,529 54,144 63,374 $225 per sf GLA 0 16,595 30,693 48,128 56,333 $250 per sf GLA 0 14,936 27,624 43,315 50,699 54,056 * Consultant estimate. ** Assume 25.0% until 2016 and declining in percentage terms thereafter.
80 OCTOBER 4, 2012 Base Year Trade Area Primary Trade Area - Whitchurch-Stouffville Population (Zones 1A + 1B) Expenditure Potential ($ m's) $28.7 $31.7 $34.7 $39.7 $42.1 $43.1 Local 65.0% * 67.5% * $21.4 $23.4 $26.8 $28.4 $29.1 Stouffville Local Share Without Inflow $18.6 $21.4 $23.4 $26.8 $28.4 $29.1 Plus Inflow TABLE 22 PRIMARY TRADE AREA LIQUOR/BEER/WINE DEMANDS & RESIDUAL 5.0% * 5.0% ** $1.1 $1.2 $1.2 $1.2 $1.2 Total Potential Stouffville Local Capture $19.6 $22.5 $24.7 $28.0 $29.6 $30.3 Less Existing 13,770 sf $1,425 /sf GLA $19.6 $19.6 $19.6 $19.6 $19.6 $19.6 Residual Sales Demand $0.0 $2.9 $5.0 $8.4 $10.0 $10.7 Warranted sf $850 per sf GLA 0 3,396 5,925 9,888 11,752 $900 per sf GLA 0 3,207 5,596 9,338 11,100 $950 per sf GLA 0 3,038 5,301 8,847 10,515 11,274 * Consultant estimate. ** Assume 5.0% until 2016 and declining in percentage terms thereafter.
81 OCTOBER 4, 2012 TABLE 23 STOUFFVILLE SUMMARY DEMANDS & RESIDUAL SPACE Base Year Trade Area Department Store $425 /sf GLA 0 16,836 30,967 43,129 48,500 51,170 Other General Merchandise NFSR $400 /sf GLA 0 17,836 31,620 47,424 54,372 57,790 Drug & Personal Care NFSR $950 /sf GLA 0 6,924 12,376 20,021 23,332 24,861 Fashion & Accessories NFSR $300 /sf GLA 0 16,828 22,354 28,707 31,467 32,760 Home Furnishings NFSR $300 /sf GLA 0 7,165 12,049 17,264 19,584 20,799 Other Non-Dep't Store NFSR $350 /sf GLA 0 14,271 22,458 31,864 35,951 37,873 Home Improvement NFSR $335 /sf GLA 0 3,704 14,140 28,773 35,114 38,046 Supermarket FSR $525 /sf GLA 0 17,966 33,061 55,588 66,319 71,469 Specialty Food FSR $275 /sf GLA 0 0 3,618 9,144 11,743 12,928 Personal Service $225 /sf GLA 0 4,149 8,373 14,663 17,623 18,968 Restaurant $225 /sf GLA 0 16,595 30,693 48,128 56,333 60,062 Liquor / Beer / Wine $900 /sf GLA 0 3,207 5,596 9,338 11,100 11,900 TOTAL RETAIL & SELECTED COMMERCIAL Mid Range 0 125, , , , ,625
82 OCTOBER 4, 2012 TABLE 23, CONTINUED ZONE 1 (Stouffville) SUMMARY DEMANDS & RESIDUAL SPACE PER CAPITA SPACE RATIOS AND WARRANTED SPACE BASED ON CUMULATIVE POPULATION GROWTH Pop'n Pop'n Pop'n Pop'n Pop'n Pop'n Whitchurch-Stouffville Population Projection 41,235 45,320 49,400 55,800 59,100 60,600 Cumulative Growth 4,085 8,165 14,565 17,865 19,365 Warranted Space Based on Per Capita Space Ratios Sq. Ft. Sq. Ft. Sq. Ft. Sq. Ft. Sq. Ft. Sq. Ft Other Service 0.9 sf per capita 0 3,676 7,349 13,109 16,079 17,429 Financial Institution 1.0 sf per capita 0 4,085 8,165 14,565 17,865 19,365 Local Office 5.0 sf per capita * 0 20,423 40,825 72,825 89,325 96,825 Total Warranted Space Based on Per Capita Ratios 0 28,183 56, , , ,619 * Includes Finance/Insurance/Real Estate (FIRE) + Services to Business Management (SBM) + Medical/Dental/Veterinary + Misc. Office. TOTAL RETAIL & SELECTED COMMERCIAL RESIDUALS PLUS WARRANTED OTHER SPACE BASED ON PER CAPITA SPACE RATIOS Mid Range 0 153, , , , ,243
83 OCTOBER 4, 2012 TABLE 24 COMPARISON OF SQUARE FOOTAGE DEMANDS AND POTENTIAL SUPPLY TABLE 24(a) "RETAIL & SELECTED COMMERCIAL" RESIDUAL DEMANDS Total "Retail / Selected Commercial" Demands (Sq. Ft.) 0 153, , , , ,243 Rounded "Retail / Selected Com'l" Demands (Sq. Ft.) 0 150, , , , ,000 TABLE 24(b) VACANT DESIGNATED "COMMERCIAL" SQUARE FOOTAGE SUPPLY Square Footage Supply Vacant/Designated Commercial Land Supply (Ref: Table 25): 420, , , , , ,000 Subtotal Square Footage Supply 420, , , , , ,000 TABLE 24(c) VACANT DESIGNATED "COMMERCIAL" SUPPLY LESS RETAIL & SELECTED COMMERCIAL DEMANDS Surplus (+) / Shortfall (-) of Supply Over Demand (Sq. Ft.) 420, , ,000-35, , ,000 Additional Land Requirement (acres): Acres Acres Acres Acres Acres 25.0% coverage (acres) Surplus Surplus Surplus Equilibrium Shortfall Shortfall TABLE 25 VACANT DESIGNATED COMMERCIAL SUPPLY (GFA) PLUS EMPLOYMENT LAND CONVERSION GFA (sq ft) Commercial Designated GLA - Regional Centre 150,000 Commercial Designated GLA - Minto / Trinity (former Anderson Haulage) 82,190 Other vacant designated commercial lands (net acres) Works Yard ,728 Mo Motors & former Canadian Tire ,780 Houston Motors ,560 Subtotal GFA coverage 117,068 Flea Market (protected 125,000 ft² less 53,000 ft² existing 72,000 Total Supply (GFA) 421,258 Rounded Total Supply (GFA) 420,000
84 APPENDIX A INCOME & EXPENDITURE DATA & TETRAD ANALYSES A-1
85 APPENDIX A 1 INCOME/EXPENDITURE INDEXING METHODOLOGY (REGRESSION ANALYSIS) Av. Per Capita Income of (x) Per Capita Indexes (y1) (y2) (n) Income Quintile Income NFSR FSR 1 $12, $17, $23, $31, $55, All Classes $30, Source: Statistics Canada Survey of Household Spending in 2009 for NFSR & FSR. =detailed av. household exp. by household income quintile, Ontario 2009 (12/17/10 62FPY032) REGRESSION EQUATION y = a + bx where n = number of income classes where x = independent variable or Income Index where y = dependent variable or Expenditure Index b = n( xy) ( x) ( y) and a = y b( x) n( x2) ( x)2 n INCOME/EXPENDITURE REGRESSION EQUATIONS NFSR Expenditure Index: FSR Expenditure Index: Personal Service Expenditure Index: Restaurant Expenditure Index: Liquor/Beer/Wine Expenditure Index: y1 = (x) y2 = (x) y3 = (x) y4 = (x) y5 = (x)
86 APPENDIX A ESTIMATES OF ONTARIO RETAIL SALES BY TRADE GROUP TOTAL Per Capita * % % NAICS FSR (Food Store Retail) D 090 Supermarket & Grocery Stores 25,485.4 $1, % 87.1% D 100 Convenience & Specialty Food Stores 3,764.0 $ % 12.9% TOTAL FSR 29,249.4 Per Capita FSR * = $2, % 100.0% Add back WMC food sales = $130 Per Capita FSR + WMC * = $2,317 NFSR (Non-Food Store Retail) % % "GAFO + DRUGS " (Formerly Department Store Type Merchandise) B 030 Furniture Stores 3,453.9 $258 B 040 Home Furnishings Stores 2,151.8 $161 B 060 Home electronics + appliance + computer/software 5,338.3 $399 Subtotal 10,944.0 $ % 14.76% E 120 Pharmacies and personal care stores 12,705.5 $ % 17.14% F 140 Clothing stores 7,970.9 $596 Shoe Stores 1,170.2 $88 F 150 Jewellery, clothing accessories, and luggage & leather stores 1,166.3 $87 Subtotal 10,307.4 $ % 13.91% G 170 Department stores (excluding concessions) ** 10,989.4 $ % 14.83% G 180 Other general merchandise stores (incl. Can. Tire + TSC + Costco) 10,532.6 $ % 14.21% Subtotal 21,522.0 $1, % 29.03% H 160 Sporting goods, hobby, music and book stores 4,133.4 $309 H 190 Miscellaneious store retail (90%) 3,297.3 $247 Subtotal 7,430.7 $ % 10.02% Tires + Batteries + Auto Parts & Accessories (TBA) 1,583.7 $ % 2.14% Subtotal 1,583.7 $ % 2.14% "HI" C 080 Building material and garden equipment and supplies dealers 9,633.3 $ % Subtotal 9,633.3 $ % TOTAL NFSR = "GAFO + DRUG" 64,493.3 $4, % Per Capita (Subtract est'd WMC food sales) ** = $130 Per Capita * $4,693 TOTAL NFSR + HI = "GAFO + DRUG" + "HI" 74,126.6 $5, % Per Capita (Subtract est'd WMC food sales) ** = $130 Per Capita * $5,413 Dep't. Store Share of NFSR = "GAFO + DRUG" $822/$4823 = 17.0% Dep't. Store Share of "NFSR" less $130 per capita $822/$4693 = 17.5% Dep't. Store Share of NFSR + HI $822/$5543 = 14.8% Dep't. Store Share of NFSR + HI less $130 per capita $822/$5413 = 15.2% * Per 13,373,000 persons (per July - September 2011 estimate from Statistics Canada Quarterly Demographic Statistics, including net undercoverage of non-permanent residents and returning Canadians (July to September, 2011, Cat. # X, Table 1). Source: Retail Trade, Statistics Canada Cat. # , Table 3-7, December, 2011, with preliminary December estimates. ** Morgan estimate.
87 APPENDIX A-3 TRADE AREA INCOME AND EXPENDITURE INDEXES Per Cap Per Cap NFSR Pop'n HH Total HH HH HH GAFO + Drug (Excluding Number Income Income Income Income FSR & HI Per. Serv. Rest. L/B/W Trade Area Undercount) HH's ($) ($ m's) ($) Index Index Index Index Index Index Ontario ,410,046 4,219,410 $66, ,008 $24, ,160,280 4,554,250 $77, ,081 $29, Zone 1A Community of Stouffville ,428 4,003 $78, $27, ,410 4,404 $92, $32, ,036 Zone 1B Rural Whitchurch-Stouffville ,581 3,457 $115, $37, ,961 4,118 $137, $47, ,592 Primary Trade Area - Whitchurch-Stouffville (= Zone 1A + Zone 1B) ,009 7,460 $95, $32, ,371 8,522 $114, $40, ,628 Zone 2A - Part Markham Secondary Trade Area South ,195 2,931 $86, $27, ,066 11,062 $88, $26, ,158 Zone 3A - Community of Uxbridge Secondary Trade Area East ,600 3,016 $72, $25, ,845 3,523 $87, $31, ,333 Zone 3B - Rural Uxbridge South Secondary Trade Area East ,735 1,579 $88, $29, ,212 1,760 $125, $42, ,312 Zone 3C - Rural Uxbridge North Secondary Trade Area East ,147 1,350 $78, $25, ,232 1,431 $88, $29, ,978 Zone 3D - Rural Pickering North of Hwy 7 Secondary Trade Area East , $94, $30, , $109, $37, ,365 Secondary Trade Area East (= Zones 3A + 3B + 3C + 3D) ,257 6,840 $80, $27, ,959 7,614 $99, $34, ,988 Trade Area ,461 17, ,578 1,518 $29, ,396 27,198 $99,488 2,706 $32, ,774
88 APPENDIX A-4 TRADE AREA FSR, GAFO + DRUG, HI, HAAS/TBA, PERSONAL SERVICE, RESTAURANT AND L/B/W EXPENDITURE LEVELS NFSR NFSR less Per Cap 2005 FSR NFSR + HI (GAFO + Drug) HAAS/TBA HI HAAS/TBA Per. Serv. Rest. L/B/W HH Income Income Per Cap Per Cap Per Cap Per Cap Per Cap Per Cap Per Cap Per Cap Per Cap Trade Area ($) Index Exp. Exp. Exp. Exp. Exp. Exp. * Exp. Exp. Exp. Ontario $29, $2,187 $5,543 $4,823 $4,490 $720 $333 $274 $827 $559 Primary Trade Area = Whitchurch-Stouffville (= Zones 1A + 1B) $40, $2,292 $6,756 $5,879 $5,473 $878 $405 $324 $992 $694 Secondary Trade Area East (= Zones 3A + 3B + 3C + 3D) $34, $2,237 $6,121 $5,326 $4,959 $795 $367 $298 $905 $623 Secondary Trade Area South (= Zone 2A) $26, $2,159 $5,221 $4,543 $4,229 $678 $313 $260 $783 $523 Trade Area Income Index The estimated 2011 Ontario per capita Personal Service expenditure assumes 1.75% real and inflationary annual growth from 2004 to 2011 against the 2003 estimate of $240 per capita. = 8 years times 1.75% = 14.0% = $274 The estimated 2011 Ontario per capita Restaurant expenditure assumes 1.75% real and inflationary annual growth from 2004 to 2011 against the 2003 estimate of $725 per capita. = 8 years times 1.75% = 14.0% = $827 The estimated 2011 Ontario per capita L/B/W (liquor/beer/wine) expenditure assumes 2.0% real and inflationary annual growth to 2011 against the 2005 estimate of $499 per capita. = 6 years times 2.0% = 12.0% = $559 The estimated 2011 HAAS/TBA shares of "NFSR" + "HI" = = 6.0% of $5,543 per capita = $333 Regression equations applied to 2011 per capita expenditures: NFSR +HI Expenditure Index = (Income Index) FSR Expenditure Index = (Income Index) Restaurant Expenditure Index = (Income Index) Personal Service Expenditure Index = (Income Index) Liquor/Beer/Wine Expenditure Index = (Income Index)
89 APPENDIX A-5 TRADE AREA CENSUS POPULATIONS WITH CENSUS UNDERCOUNT ADJUSTMENTS 2006 June 2009 Community Watson & York Region Profiles Associates OP 2010 Census Dev. Charge as revised Subdivision Bkgrd Study 31/05/2012 Unadjusted Adjusted Unadjusted Adjusted Adjusted Adjusted Adjusted Adjusted Adjusted Adjusted Pop'n Adjust't Pop'n Pop'n Pop'n Pop'n Pop'n Pop'n Pop'n Pop'n Pop'n Trade Area 2001 (%) Primary Trade Area - Whitchurch-Stouffville 22, % 22,889 24,390 25,460 40,400 41,235 49,400 55,800 59,100 60,600 Av. An. Pop'n Growth ( base) 2, ,041 1, Av. An. Pop'n Growth ( base) 2,629 Unadjusted Adjusted Unadjusted Adjusted Adjusted Adjusted Adjusted Adjusted Adjusted Adjusted Pop'n Adjust't Pop'n Pop'n Pop'n Pop'n Pop'n Pop'n Pop'n Pop'n Pop'n 2001 (%) Zone 2A - Markham (NE Part) (N of 16th/ E of Kennedy) Secondary Trade Area South 9, % 9,565 37,066 38,550 48,050 49,950 51,850 53,750 55,650 57,550 Av. An. Pop'n Growth 1,900 1,900 1,900 1,900 1,900 1,900 Zones 3A + 3B + 3C + 3D Secondary Trade Area East 20, % 21,065 21,959 22,840 23,900 24,100 24,300 24,500 24,700 24,900 Av. An. Pop'n Growth ( base) Secondary Trade Area 29, % 30,630 59,025 61,390 71,950 74,050 76,150 78,250 80,350 82,450 Av. An. Pop'n Growth ( base) 2,112 2,101 2,100 2,100 2,100 2,100 Trade Area 51, % 53,520 83,415 86, , , , , , ,050 Av. An. Pop'n Growth ( base) 5,100 2,936 10,265 8,500 5,400 3,600
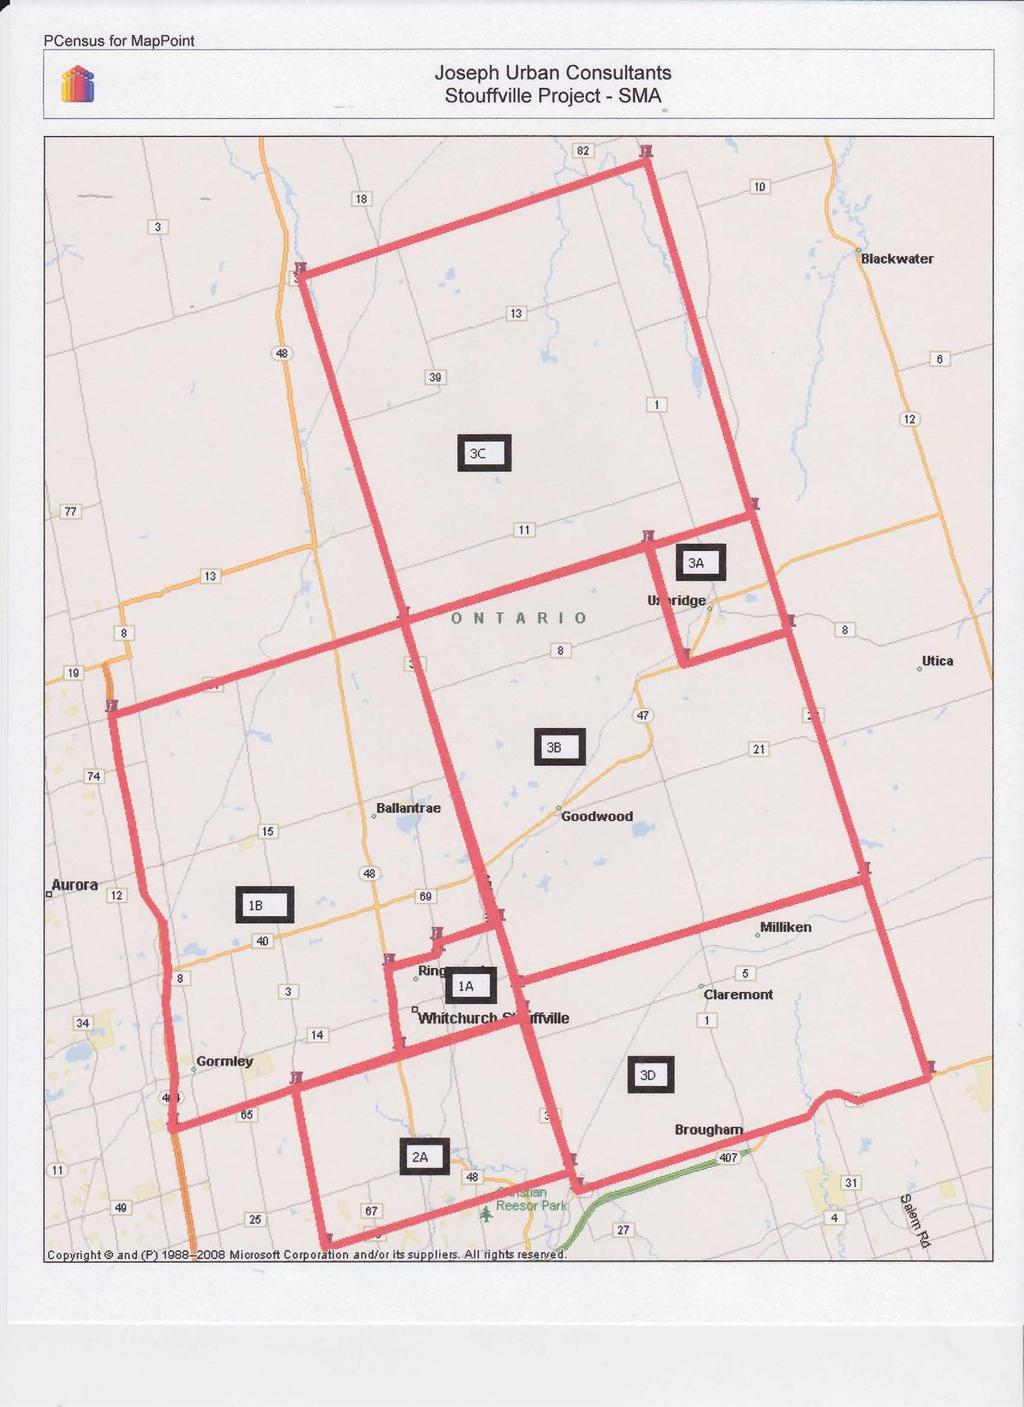
90
91 ,.. PCen~us for MapPoint 2011 Census Population and Dwelling Counts 2011.!p'pulation 1A Joseph Urban Consultants Stouffville Project - SMA 25,036 1B 12,592 2A 48,158 3A 12, Private Dwellings Occupied by Usual Residents 8,866 8,552 4,748 4,493 14,013 13,767 4,632 4,494 Land Area, sq kin Persons per sq km Dwellings per sq km 1, Land Area, sq mi Persons per sq mi Dwellings per sq mi Data Quality Target Type Dissemination Block... Dissemination Block... Dissemination Block... Dissemination Block... Total Census Block Records Represented in the Study Area Total Census Block Records Represented in the Study Area DAs with Indian Reservation Refusal o o o o 2011 Population and dwelling counts in this category represent actual (unsuppressed) data. * 2006 Populations are estimated for dissemination areas that have changed in 2011.
92 ,. PCensus for MapPoint 2011 Joseph Urban Consultants Stouffville Project - SMA Census 38 3C 3D Population and Dwelling Counts 2011 Population 4,312 3,978 2, Private Dwellings 1,538 1, Occupied by Usual Residents 1,478 1, Land An!a, sq km Persons per sq km Dwellings per sq km Land Area, sq mi Persons per sq mi Dwellings per sq mi Data Quality Target Type Dissemination Block... Dissemination Block... Dissemination Block... Total Census Block Records Represented in the Study Area Total Census Block Records Represented in the Study Area DAs with Indian Reservation Refusal o o o 2011 Population and dwelling counts in this category represent actual (unsuppressed) data. * 2006 Populations are estimated for dissemination areas that have changed in 2011.
93 PCensus for MapPoint 2006 Joseph Urban Consultants Stouffville Project - SMA.. Census 1A 18 2A Census Snapshot % % % Total Population 12,410 11,961 37,066 Males 5,921 48% 6,031 50% 18,168 49% Females 6,490 52% 5,930 50% 18,898 51% 2006 Population by Age 12,410 11,961 37,066 oto 4 years 715 6% 484 4% 3,231 9% 5 to 19 years 2,695 22% 2,266 19% 7,337 20% 20 to 24 years 725 6% 654 5% 1,874 5% 25 to 34 years 1,208 10% 841 7% 6,025 16% 35 to 44 years 2,023 16% 1,710 14% 7,296 20% 45 to 54 years 2,004 16% 2,163 18% 5,045 14% 55 to 64 years 1,262 10% 1,931 16% 2,850 8% 65 to 74 years 790 6% 1,189 10% 1,985 5% 75 to 84 years 663 5% 565 5% 1,088 3% 85 years and over 279 2% 179 1% 231 1% Average age of population Median age Families 3,456 3,655 10,863 Persons per family Two-parent families 3,035 88% 3,357 92% % With no children at home 1,154 33% 1,613 44% % With children at home 1,881 54% 1,749 48% 6,788 62% Lone-parent families % 293 8% 1,116 10% Children per family Households 4,404 4,118 11,062 Persons in private households 12,230 11,810 37,029 Persons per household Average household income $ 92,699 $ 137,790 $ 88,200 Occupied Dwellings 4,405 4,132 11,060 Owned Dwellings % 3,741 91% 10,485 95% Rented Dwellings % 361 9% 532 5% Dominant building type Single detached... Single detached... Single detached... Dominant period of construction Average value of dwelling $ 377,831 $ 607,948 $ 402,529 Average gross monthly rent $ 856 $ 899 $ 1,251 Top 5 visible minorities Black 29% Chinese 55% Chinese 60% Chinese 26% South Asian 24% South Asian 22% South Asian 21% SEAsian 6% Filipino 6% Filipino 8% Black 6% Black 6% West Asian 8% Filipino 4% SEAsian 2% Dominant Demographics Official Home Language English English English Non-official Home Language Italian Chinese Chinese Recent Immigrant Places of Birth Northem Europe United States of... EastemAsia
94 PCensus for MtiPPoint I 2006 Joseph Urban Consultants Stouffville Project - SMA -- - Census 3A 38 3C Census Snapshot % % % Total Population 9,845 5,212 4,232 Males 4,769 48% 2,662 51% 2,152 51% Females 5,076 52% 2,550 49% 2,080 49% 2006 Population by Age 9,845 5,212 4,232 oto 4 years 545 6% 210 4% 207 5% 5 to 19 years 2,375 24% 1,103 21% % 20 to 24 years 527 5% 314 6% 240 6% 25 to 34 years 866 9% 331 6% 322 8% 35 to 44 years 1,638 17% % % 45 to 54 years 1,628 17% % % 55 to 64 years 896 9% % % 65 to 74 years 626 6% 450 9% 296 7% 75 to 84 years 514 5% 271 5% 158 4% 85 years and over 175 2% 50 1% 41 1% Average age of population Median age Families 2,805 1,572 1,237 Persons per family Two-parent families 2,415 86% 1,417 90% 1,086 88% With no children at home % % % With children at home 1,472 52% % % Lone-parent families % 144 9% % Children per family Households 3,523 1,760 1,431 Persons in private households 9,753 5,189 4,238 Persons per household Average household income $ 87,437 $ 125,970 $ 88,028 Occupied Dwellings 3,538 1,765 1,420 Owned Dwellings 2,925 83% 1,563 89% 1,275 90% Rented Dwellings % % % Dominant building type Single detached... Single detached... Single detached... Dominant period of construction Before 1946 Average value of dwelling $ 359,250 $ 487,883 $ 385,748 Average gross monthly rent $ 848 $ 753 $ 625 Top 5 visible minorities Chinese 40% South Asian 31% Chinese 31% South Asian 36% Black 18% Black 19% Black 17% Japanese 16% South Asian 13% Latin American 8% Chinese 16% Filipino 13% Filipino 0% Latin American 12% Latin American 9% Dominant Demographics Official Home Language English English English Non-official Home Language Dutch Italian German Recent Immigrant Places of Birth Northern Europe Northem Europe Southeast Asia
95 Joseph Urban Consultants Stouffville Project - SMA. Total Population Males Females 2006 Census Census Snapshot 2006 Population by Age oto 4 years 5 to 19 years 20 to 24 years 25 to 34 years 35 to 44 years 45 to 54 years 55 to 64 years 65 to 74 years 75 to 84 years 85 years and over Average age of population Median age Families Persons per family Two-parent families With no children at home With children at home Lone-parent families Children per family Households Persons in private households Persons per household Average household income $ Occupied Dwellings Owned Dwellings Rented Dwellings 3D % 2,670 1,355 51% 1,315 49% 2, % % 190 7% 220 8% % % % 185 7% 90 3% 25 1% % % % 75 10% , , % % Dominant building type Single detached... Dominant period of construction Before 1946 Average value of dwelling $ 477,175 Average gross monthly rent $ 931 Top 5 visible minorities Chinese 73% Arab 13% South Asian 13% Black 0% Filipino 0% Dominant Demographics Official Home Language Non-official Home Language Recent Immigrant Places of Birth English Urdu Southeast Asia
96 , Joseph PCensus for Ma Point Urban Consultants Stouffville Project - SMA Census 1A 18 2A Census Snapshot --I2ta1 Populatio!! 11,428 % base 10,581 % base 9,195 Al base Males 5,519 48% 5,376 51% 4,470 49% Females 5,909 52% 5,205 49% 4,725 51% 2001 Population by Age 11,428 GAl base 10,581 0/0 base 9,195 % base Oto 4 years 730 6% 529 5% 691 8% 5 to 19 years 2,651 23% 2,334 22% 1,857 20% 20 to 24 years 529 5% 524 5% 444 5% 25 to 34 years 1,255 11% 1,084 10% 1,434 16% 35 to 44 years 2,180 19% 1,886 18% 1,858 20% 45 to 54 years 1,635 14% 1,816 17% 1,213 13% 55 to 64 years 955 8% 1,199 11% 721 8% 65 to 74 years 750 7% 770 7% 632 7% 75 to 84 years 474 4% 345 3% 323 4% 85 years and over 227 2% 82 1% 59 1% Average age of population Median age Dominant age group 5 to 19 years 23% 5 to 19 years 22% 35 to 44 years 20% Families 3,212 % base 3,047 Al base 2,733 % base Persons per family Two-parent families 2,797 87% 2,823 93% 2,505 92% With no children at home % 1,076 35% % With children at home 1,809 56% 1,752 58% 1,603 59% Lone-parent families % 178 6% 215 8% Total children at home 4,154 3,841 3,241 Children per family Households 4,003 3,457 2,931 Persons in private households 11,308 10,504 9,198 Persons per household Average 2000 household income $ 78,547 $ 115,771 $ 86,344 Occupied Dwellings 3,998 % base 3,456 % base 2,937 % base Owned Dwellings 3,168 79% 2,932 85% 2,677 91% Rented Dwellings % % 253 9% Single detached houses 2,879 72% 3,306 96% 2,126 72% Semi-detachedlrow/duplex % 71 2% % Apartments % 53 2% 199 7% Movable dwelling 0 0% 10 0% 0 0% Dominant building type Single detached... 72% Single detached... 96% Single detached... 73% Dominant Demographics Official Home Language English 100% English 100% English 100% Non-official Home Language Romanian 33% Chinese 32% Chinese 92% Immigrant Place of Birth United Kingdom 48% United Kingdom 25% Hong Kong 46% Ethnic Origin Canadian 24% English 20% Chinese 36% Religion Roman Catholic 22% Roman Catholic 24% No religion 31% Educational Attainment Grades 9 to 13 31% Grades 9 to 13 31% University 35% Labour by Industry Retail trade 11% Construction 12% Manufacturing 15% Labour by Occupation Business, financ... 24% Business, financ... 22% Business, financ... 26%
97 [c. w, MaePoint Joseph Urban Consultants Stouffville Project - SMA Census 3A 38 3C Census Snapshot -Imal Population 8,600 % base 4,735 % base 4,147 % base Males % % % Females % % % 2001 Population by Age 8,600 % base 4,735 % base 4,147 % base Ot04 years 556 6% 234 5% 259 6% 5 to 19 years % % % 20 to 24 years 374 4% 231 5% 169 4% 25 to 34 years % 410 9% % 35 to 44 years % % % 45 to 64 years % % % 55 to 64 years 669 8% % 390 9% 65 to 74 years 582 7% 363 8% 262 6% 75 to 84 years 433 5% 132 3% 113 3% 85 years and over 163 2% 37 1% 1 0% Average age of population Median age Dominant age group 5 to 19 years 25% 5 to 19 years 22% 5 to 19 years 25% Families 2,417 % base 1,398 % base 1,205 % base Persons per family Two-parent families % 1,294 93% % With no children at home % % % With children at home % % % Lone-parent families % 91 6% 98 8% Total children at home ,551 Children per family Households Persons in private households 8, Persons per household Average 2000 household income $ $ $ 78,245 Occupied Dwellings 3,011 % base 1,579 % base 1,350 % base Owned Dwellings 2,403 80% 1,332 84% 1,221 90% Rented Dwellings % % % Single detached houses % % % Semi-detached/row/duplex % 29 2% 0 0% Apartments % 30 2% 10 1% Movable dwelling 0 0% 0 0% 0 0% Dominant building type Single detached... 73% Single detached... 96% Single detached... 99% Dominant Demographics Official Home Language English 100% English 100% English 100% Non-official Home Language Korean 80% Italian 62% Chinese 100% Immigrant Place of Birth United Kingdom 56% United Kingdom 29% United Kingdom 38% Ethnic Origin English 25% English 22% Canadian 24% Religion No religion 25% United Church 21% No religion 27% Educational Attainment Grades 9 to 13 35% Grades 9 to 13 36% Grades 9 to 13 37% Labour by Industry Retail trade 13% Retail trade 11% Agriculture, fore... 13% Labour by Occupation Sales & service... 26% Management oc... 20% Sales & service... 18%
98 PCensus for MapPoint Joseph Urban Consultants Stouffville Project - SMA 2001 Census 3D Census Snapshot Total Population 2,775 % base Males 1,420 51% Females 1,355 49% 2001 Population by Age 2,775 % base oto 4 years 115 4% 5 to 19 years % 20 to 24 years 160 6% 25 to 34 years % 35 to 44 years % 45 to 54 years % 55 to 64 years % 65 to 74 years 160 6% 75 to 84 years 75 3% 85 years and over 40 1% Average age of population 36.3 Median age 38.1 Dominant age group 5 to 19 years 23% Families 780 % base Persons per family 3.2 Two-parent families % With no children at home % With children at home % Lone-parent families 90 12% Total children at home 1,020 Children per family 1.3 Households 895 Persons in private households 2,765 Persons per household 3.1 Average 2000 household income $ 94,048 Occupied Dwellings 900 % base Owned Dwellings % Rented Dwellings % Single detached houses % Semi-detached/row/duplex 15 2% Apartments 15 2% Movable dwelling 0 0% Dominant building type Single detached... 97% Dominant Demographics Official Home Language English 100% Non-official Home Language Italian 100% Immigrant Place of Birth United Kingdom 52% Ethnic Origin English 25% Religion No religion 27% Educational Attainment Grades 9 to 13 33% Labour by Industry Construction 12% Labour by Occupation Trades, transpor... 21%
99 APPENDIX B RETAIL COMMERCIAL FLOORSPACE INVENTORY B-1
100 APPENDIX B STOUFFVILLE RETAIL AND SERVICE FLOORPSPACE INVENTORY 27 Drug Subtotal Cosmetic Home Sport/Hobby Can Tire Non-Dep't Total Home Ctr. Total Stouffville Retail and Service Inventory Super- Major 25 Other Optician 19 Fashion Furnishings Music/Bk/Art + TSC 28 Store NFSR Hardware NFSR Liquor 24 Rest. & FIRE & Other Corey Doyle - July 30, 2012 Total market / Spec. Subtotal Discount 26 Gen'l Pers'l Care & Computers Forist/Gift Tires 30 NFSR Space Bldg. Sply. + HI Beer 22 Fast Food Personal Bank Prof'l Med/Other Vacant Space Street Study NAICS Space Grocery Food FSR Dep't Store Merch Access. Electronics Used/Misc. A/P/A 29 (GAFO/DRUG) (GAFO/DRUG) Nursery Space Wine 23 Drinking Services Trust Services Services * Space NEC No. Store Name Store Type Code Code GLA GLA GLA GLA GLA GLA GLA GLA GLA GLA GLA GLA GLA GLA GLA GLA GLA GLA GLA GLA GLA GLA GLA NODE 1 - DOWNTOWN STOUFFVILLE N/S Main Street 6102 EXPRESS NAILS SPA Beauty Salon ,000 1, MOKSHA YOGA Education Service ,200 1, MAYER'S PET SHOP Pet & Pet Supply ,000 1,000 1,000 1,000 1, GEORGE W. BRODIE, CGA Accounting ,500 1, RACOTEK COMPUTER SERVICES Computer and Software ,100 1,100 1,100 1,100 1, STONEHOUSE TRAVEL Travel Agencies ,200 1, FISHBONE BISTRO Full-Service Restaurant ,400 1, RED BULB ESPRESSO BAR Limited-Service Rest PIZZA PIZZA Fast Food MR. SUB Fast Food ,200 2, FAME MEN'S HAIR STYLIST Barber ,400 1, STOUFF. PICTURE FRAMING STUDIO Art & Frames ,400 1,400 1,400 1,400 1, H & R BLOCK Accounting ,900 1, STOUFFVILLE MONUMENT WORKS Monuments ,000 1,000 1,000 1,000 1, CANDLELIGHT AND MEMORIES Gift/Novelty/Souvenir THE EARL OF WHITCHURCH Drinking Place ,300 2, IDEAL TILE & CARPET Floor Coverings ,800 4,800 4,800 4,800 4, EDWARD JONES Brokerage ,200 1, STOUFFVILLE X-RAY & ULTRASOUND Other Health Service ,000 1, DR. SHELDON LAZIER & ASSOCIATES Offices of Dentists ,000 2, JOINT VENTURE FITNESS & PHYSIO. Other Health Service ,400 1, DR. PAMELA COOPER Offices of Physicians ,200 1, STOUFFVILLE HEALTH CENTRE Offices of Physicians ,200 1, IDA Drugs Pharmacy / Drug Store ,400 2,400 2,400 2,400 2, MARIO'S HARISTYLING Barber ALSOP INSURANCE BROKERS INC. Insurance ,000 1, BASICALLY BAGELS Fast Food ,900 1, LATCHAM GALLERY Art & Frames ,200 1,200 1,200 1,200 1, CARE & SHARE THRIFT SHOP Used Merchandise ,900 7,900 7,900 7,900 7, GIAN CARLOS ITALIAN BAKERY / DELI Bakery LA CUISINE DE MA MERE Full-Service Restaurant COWLICK DESIGN & SCREEN PRINTING Other Service CDC COMPUTER LIQUIDATORS Computer and Software CRYSTAL JEWELLERS Jewellery Stores MOONFLOWER'S MAGICAL TOUCH Miscellaneous Retail ,000 1,000 1,000 1,000 1, PIZZA Fast Food BIRKETT HASSARD INSUR. BROKERS Insurance ,500 1, SAVEX LOTTO MART Convenience Stores ,400 2,400 2, THE REPEAT RIDER Sporting Goods Stores ,100 2,100 2,100 2,100 2, BELLE NY NAIL SALON Beauty Salon HEARING CARE CLINIC Other Medical ,000 1, STOUFFVILLE SUN-TRIBUNE Other Service 201 NA 1,000 1, VIVID OPTICAL Optician ,000 1,000 1,000 1,000 1, GOOD EATS RESTAURANT Full-Service Restaurant ,700 1, THE MEAT MERCHANT Meat Markets ,400 2,400 2, BUGGY'S Full-Service Restaurant ,800 1, FICKLE PICKLE Full-Service Restaurant ,500 3, CURVES Fitness and Rec'l Sports ,200 2, FOR THE LOVE OF JO Limited-Service Rest ,100 1, CHIC THRILLS LADIES UPSCALE RESALE Used Clothing ,800 1,800 1,800 1,800 1, CONCRETE BOOKS Used Books ,800 1,800 1,800 1,800 1, HEADLINES SALON & SPA Beauty Salon ,800 1, THE GIRLS BRA BOUTIQUE Women's Clothing Stores ,000 1,000 1,000 1,000 1,000 Page 1 of 7
101 APPENDIX B STOUFFVILLE RETAIL AND SERVICE FLOORPSPACE INVENTORY 27 Drug Subtotal Cosmetic Home Sport/Hobby Can Tire Non-Dep't Total Home Ctr. Total Stouffville Retail and Service Inventory Super- Major 25 Other Optician 19 Fashion Furnishings Music/Bk/Art + TSC 28 Store NFSR Hardware NFSR Liquor 24 Rest. & FIRE & Other Corey Doyle - July 30, 2012 Total market / Spec. Subtotal Discount 26 Gen'l Pers'l Care & Computers Forist/Gift Tires 30 NFSR Space Bldg. Sply. + HI Beer 22 Fast Food Personal Bank Prof'l Med/Other Vacant Space Street Study NAICS Space Grocery Food FSR Dep't Store Merch Access. Electronics Used/Misc. A/P/A 29 (GAFO/DRUG) (GAFO/DRUG) Nursery Space Wine 23 Drinking Services Trust Services Services * Space NEC No. Store Name Store Type Code Code GLA GLA GLA GLA GLA GLA GLA GLA GLA GLA GLA GLA GLA GLA GLA GLA GLA GLA GLA GLA GLA GLA GLA 6336 STATE FARM INSURANCE Insurance ,200 1, THICKETWOOD VETERINARY SERVICES Veterinary Services ANN'S FABRICS & SEWING CENTRE Sewing, Needlework ,400 1,400 1,400 1,400 1, THE CO-OPERATORS Insurance ,200 1, MORRA CARUSO LAW OFFICE Offices of Lawyers ,000 1, WINE CREATIONS Wine Making Supplies ,400 1,400 1,400 1,400 1, INSIDE OUT DECORATING Paint and Wallpaper ,400 6,400 6, CARD'S TV & APPLIANCES Appl.+TV+Electronics ,400 6,400 6,400 6,400 6, NANCY'S PIZZA Fast Food ,200 1, B J GIFT & VARIETY Convenience Stores ,000 1,000 1,000 Subtotal 105, ,700 6, ,400 1,400 14,300 21, ,600 40,600 6,400 47, ,500 5, ,000 11, ,200 S/S Main Street 6131 THOMAS & PELMAN Offices of Lawyers ,200 2, INDEPENDENT PLANNING GROUP INC. Investment Advice ,100 6, FAMILY PHYSICIANS Offices of Physicians ,800 1, ANNIE'S KITCHEN Full-Service Restaurant ,400 2, SUTTON GROUP Real Estate ,100 1, PASTAGGIO PANINI Full-Service Restaurant ,500 1, STOUFFVILLE CHIROPRACTIC Other Medical ,000 1, J M FARQUHARSON REALTY LTD. Real Estate AXION-BRILLINGER INSUR. SERVICES Insurance ,000 1, WE ROCK SCHOOL OF MUSIC Education ,000 1, PACE CREDIT UNION Local Credit Union ,000 3, LINDY'S FLORAL BOUTIQUE Florists TOKYO SUSHI Fast Food ,300 1, CIBC Banking ,500 3, SCOTIABANK Banking ,000 3, STOUFFVILLE FINE FURNITURE / ACC. Furniture Stores ,800 9,800 9,800 9,800 9, THE HEARTY ARTICHOKE Health Food ,300 1,300 1, TURACK RAGUSEO LESTI GILLIANT LLP Accounting ,400 2, STOUFFVILLE FLORIST INC. Florists ,400 1,400 1,400 1,400 1, BUTTON, ARMSTRONG & NESS Offices of Lawyers ,200 2, LA ORTHO Offices of Dentists ,200 1, SALLY HARRIS BARRISTER & SOLICITOR Offices of Lawyers ,200 1, PHOENIX HEALTH & WELLNESS CTR. Other Out-Patient Care ,200 1, DEPRESSION INK Tattoo Parlour ,200 1, K9'S IN KAHOOTS Pet & Pet Supply ,200 1,200 1,200 1,200 1, TRILIS HAIR STUDIO Beauty Salon ,200 1, CENTURY 21 LEADING EDGE REALTY Real Estate ,200 1, REID'S ANTIQUES & CONSIGNMENT Antiques ,200 1,200 1,200 1,200 1, THE CORNER HOUSE RESTAURANT Full-Service Restaurant ,000 2, PROGRESSIVE MONTESSORI ACADEMY Education ,400 2, COUNTRY HAIR Beauty Salon ,000 1, FRANK'S AND SON BARBER SHOP Barber ,000 1,000 Freel Lane 0 20 YOUNG DRIVERS OF CANADA Education Service TRUE PATH YOGA Fitness and Rec'l Sports NORTHERN TRANSPORT'N SERVICE Other Service 201 NA THE ALCOVE HAIR STUDIO Beauty Salon COMPASS INSURANCE BROKERS Insurance ,000 1, RAYMOND JAMES LTD. Investment Advice WELCOME HOME LIFESTYLES Other Service 201 NA 1,500 1,500 Page 2 of 7
102 APPENDIX B STOUFFVILLE RETAIL AND SERVICE FLOORPSPACE INVENTORY 27 Drug Subtotal Cosmetic Home Sport/Hobby Can Tire Non-Dep't Total Home Ctr. Total Stouffville Retail and Service Inventory Super- Major 25 Other Optician 19 Fashion Furnishings Music/Bk/Art + TSC 28 Store NFSR Hardware NFSR Liquor 24 Rest. & FIRE & Other Corey Doyle - July 30, 2012 Total market / Spec. Subtotal Discount 26 Gen'l Pers'l Care & Computers Forist/Gift Tires 30 NFSR Space Bldg. Sply. + HI Beer 22 Fast Food Personal Bank Prof'l Med/Other Vacant Space Street Study NAICS Space Grocery Food FSR Dep't Store Merch Access. Electronics Used/Misc. A/P/A 29 (GAFO/DRUG) (GAFO/DRUG) Nursery Space Wine 23 Drinking Services Trust Services Services * Space NEC No. Store Name Store Type Code Code GLA GLA GLA GLA GLA GLA GLA GLA GLA GLA GLA GLA GLA GLA GLA GLA GLA GLA GLA GLA GLA GLA GLA Edward Street 67 FUJIYAMA JAPANESE RESTAURANT Full-Service Restaurant ,600 2, KINGFISHER INTERNATIONAL INC. Other Service 201 NA 2,700 2, SCHELL LUMBER HOME BUILDING CTR. Home Improvement ,500 9,500 9,500 Civic Ave. 34 STRAWBERRY PATCH MONTESSORI SCHOOL Education Service ,500 1, STOUFFVILLE MEDICAL CENTRE Physicians ,700 1, STOUFFVILLE PHYSIOTHERAPY + ORTHO. CTROther Medical ,700 1,700 Commercial Street 10 YORK DANCE ACADEMY Education ,500 1,500 Park Drive 12 PARK DRIVE DENTAL Dentist Office ,200 2,200 Subtotal 92, ,300 1, ,800 4, ,500 14,500 9,500 24, ,800 4,900 9,500 20,900 16, ,200 SUBTOTAL NODE 1 - DOWNTOWN STOUFFVILLE 197, ,000 8, ,400 1,400 24,100 26, ,100 55,100 15,900 71, ,300 10,500 9,500 31,900 27, ,400 NODE 2 - WESTERN APPROACH AREA 0 Main Street West - North Side Strip Plaza 5402 THE SOURCE Consumer Electronics ,000 2,000 2,000 2,000 2, MYUNG'S TAEKWONDO Athletic Instruction ,800 2, STAKEOUT DINING ROOM & LOUNGE Full-Service Restaurant ,600 5, MODERN HOME FURNITURE Furniture Store ,600 4,600 4,600 4,600 4, STATE FARM INSURANCE Insurance ,200 2, SMILE WORK DENTAL CENTRE Offices of Dentists ,700 3, TANNING WORLD Personal Service ,000 2, PATTI-LYNN INTERIORS Paint and Wallpaper ,960 10,960 10,960 Subtotal 33, , ,600 6,600 10,960 17, ,600 2, ,200 6, Strip Plaza 5534 NICKLE GATE VARIETY Convenience Stores FIRST CHOICE HAIR CUTTERS Hair Care/Esthetics TIM HORTON'S Limited-Service Rest ,200 2,200 Subtotal 3, , Strip Plaza 5612 METRO Supermarket ,780 46,780 46, HARVEY'S/SWISS CHALET Full-Service Restaurant ,340 7, SCOTIABANK Bank ,000 5, BETZ POOLS LTD. Hot Tubs/Swim'g Pools ,500 6,500 6,500 6,500 6,500 Subtotal 69,000 46, , , ,500 6, , , , Strip Plaza 5710 LCBO L/B/W (Liquor/Beer/Wine) ,370 9, SHOPPERS DRUG MART Pharmacies and Drug Stor ,175 14,175 14,175 14,175 14, BARTHAU JEWELLERS Jewellery Stores ,800 1,800 1,800 1,800 1, STOUFFVILLE FISH & CHIPS & SEAFOOD Limited-Service Rest ,800 1, PIZZAVILLE Limited-Service Rest ,800 1, M & M MEAT SHOPS Meat Markets ,800 1,800 1, PET CULTURE Pet and Pet Supply ,800 1,800 1,800 1,800 1,800 Subtotal 32, ,800 1, ,175 1, , ,775 17, ,775 9,370 3, Page 3 of 7
103 APPENDIX B STOUFFVILLE RETAIL AND SERVICE FLOORPSPACE INVENTORY 27 Drug Subtotal Cosmetic Home Sport/Hobby Can Tire Non-Dep't Total Home Ctr. Total Stouffville Retail and Service Inventory Super- Major 25 Other Optician 19 Fashion Furnishings Music/Bk/Art + TSC 28 Store NFSR Hardware NFSR Liquor 24 Rest. & FIRE & Other Corey Doyle - July 30, 2012 Total market / Spec. Subtotal Discount 26 Gen'l Pers'l Care & Computers Forist/Gift Tires 30 NFSR Space Bldg. Sply. + HI Beer 22 Fast Food Personal Bank Prof'l Med/Other Vacant Space Street Study NAICS Space Grocery Food FSR Dep't Store Merch Access. Electronics Used/Misc. A/P/A 29 (GAFO/DRUG) (GAFO/DRUG) Nursery Space Wine 23 Drinking Services Trust Services Services * Space NEC No. Store Name Store Type Code Code GLA GLA GLA GLA GLA GLA GLA GLA GLA GLA GLA GLA GLA GLA GLA GLA GLA GLA GLA GLA GLA GLA GLA Strip Plaza 5812 MAUSAM FINE INDIAN RESTAURANT Full-Service Restaurant ,200 1, EGGXPERTS Full-Service Restaurant ,400 1, SUBWAY Limited-Service Rest ,200 1, ENTERPRISE RENT-A-CAR Car Rental and Leasing 201 NA 1,400 1,400 Subtotal 5, , ,400 Giant Tiger Plaza 5898 GIANT TIGER Other General Merchandis ,290 22,290 22,290 22,290 22, NYS STEAK CO. (f/s) Full-Service Restaurant ,200 4, COUNTRY STYLE (f/s) Limited-Service Rest ,400 2, STOUFFVILLE CLEANERS Dry Cleaning ,750 2, EVANGELOS FINE JEWELLERY Jewellery Stores ,280 1,280 1,280 1,280 1, FAME INTERNATIONAL SALON & SPA Hair Care+Esthetic Servic ,100 1, BASKIN ROBBINS Limited-Service Rest ,100 1, SNAP FITNESS Fitness and Rec'l Sports ,100 1, CHINA GARDEN Limited-Service Rest ,100 1, U WEIGHT LOSS CLINIC Weight Loss Ctr ,200 3, CENTERPIECE FLOWERS Florists ,100 1,100 1,100 1,100 1, GLOBAL PET FOODS Pet and Pet Supplies Store ,600 1,600 1,600 1,600 1, THE BEER STORE L/B/W (Liquor/Beer/Wine) ,400 4, PIZZA NOVA Limited-Service Rest ,680 1,680 Subtotal 49, , , , ,270 26, ,270 4,400 10,480 7, ,100 Strip Plaza WILD WING Full-Service Restaurant ,400 1, MAC'S Gas Bar / C-Stores ,800 1,800 1, EDWARD JONES Insurance ,200 1, WATER DEPOT Water Supply/Irrigation ,200 1,200 1,200 1,200 1, CADET CLEANERS Dry Cleaning Subtotal 6, ,800 1, , ,200 1, , , , Winona Drive 27 NAPA AUTO PARTS Auto Parts ,800 5,800 5,800 5,800 5,800 Subtotal 5, ,800 5,800 5, , West Lawn Cres. 24 PET VALU Pet & Pet Supply ,700 2,700 2,700 2,700 2, ADVANCED CHIROPRACTIC + WELLNESS Other Health Care ,500 4,500 Subtotal 7, , ,700 2, , , Main Street West - South Side THE LION OF STOUFFVILLE Full-Service Restaurant ,300 5, DELIVILLE Limited-Service Rest REMAX ALL-STARS REALTY INC. Real Estate ,200 2,200 Subtotal 8, , , Stouffville Shopping Plaza 5887 NO FRILLS Supermarket ,131 30,131 30, T-D CANADA TRUST Bank ,100 5, EASTSIDE MARIO'S Full-Service Restaurant ,000 4, STOUFFVILLE VETERINARY CLINIC Other Medical ,600 4, CAPTAIN GEORGE'S FISH & CHIPS Limited-Service Rest ,500 1,500 Subtotal 45,331 30, , , ,100 4, Page 4 of 7
104 APPENDIX B STOUFFVILLE RETAIL AND SERVICE FLOORPSPACE INVENTORY 27 Drug Subtotal Cosmetic Home Sport/Hobby Can Tire Non-Dep't Total Home Ctr. Total Stouffville Retail and Service Inventory Super- Major 25 Other Optician 19 Fashion Furnishings Music/Bk/Art + TSC 28 Store NFSR Hardware NFSR Liquor 24 Rest. & FIRE & Other Corey Doyle - July 30, 2012 Total market / Spec. Subtotal Discount 26 Gen'l Pers'l Care & Computers Forist/Gift Tires 30 NFSR Space Bldg. Sply. + HI Beer 22 Fast Food Personal Bank Prof'l Med/Other Vacant Space Street Study NAICS Space Grocery Food FSR Dep't Store Merch Access. Electronics Used/Misc. A/P/A 29 (GAFO/DRUG) (GAFO/DRUG) Nursery Space Wine 23 Drinking Services Trust Services Services * Space NEC No. Store Name Store Type Code Code GLA GLA GLA GLA GLA GLA GLA GLA GLA GLA GLA GLA GLA GLA GLA GLA GLA GLA GLA GLA GLA GLA GLA Sandiford Drive Strip Plaza 28 MCDONALDS (f/s) Fast Food ,600 3, ROYAL BANK (f/s) Bank ,615 4, STOUF. NUCLEAR & CARDIAC IMAGING Other Medical ,000 3, MAIN SANDIFORD DENTAL Dentist Office ,000 2, PLATINUM TANNING Beauty Salon ,400 1, SALON 2000 Beauty Salon ,400 1, UPPER - OFFICES Offices 202 NA 8,000 8,000 Subtotal 24, ,600 2,800 4, , ,000 Ringwood Drive Stouffville Mews 15 MAKI ZUSHI (f/s) Full-Service Restaurant ,300 3, TOYS R US EXPRESS Toys ,300 4,300 4,300 4,300 4, QUIZNO'S Fast Food ,400 1, CAS MASSIMO SALON Beauty Salon ,400 1, OPTOMETRIST'S OFFICE Optician ,400 1,400 1,400 1,400 1, EAST 148 CLOTHING CO. Unisex ,400 1,400 1,400 1,400 1, DOMINO'S PIZZA Fast Food ,400 1,400 Subtotal 14, ,400 1, , ,100 7, , ,100 1, Strip PLaza 18 Classic Greek (f/s) Fast Food Restaurant ,720 1, GOLDEN EAGLE ART GALLERY Art Dealer ,780 2,780 2,780 2,780 2, SHELL'S NAILS & SPA Beauty Salon ,692 1, THE UPS STORE Business Service 201 NA 1,774 1, HOLLYWOOD PIZZA Full-Service Restaurant ,890 1, THAI ONE ON Full-Service Restaurant ,079 2, FINEST CHINESE Full-Service Restaurant ,638 2, THE PULSE TOTAL FITNESS Fitness Gym ,760 1, LAUNDROMAT Laundry ,740 1, DUNDEE WEALTH MANAGEMENT Financial Service ,740 1, BOYD'S SOURCE FOR SPORTS (f/s) Sporting Goods ,600 5,600 5,600 5,600 5, RANDY'S REFRIG'N & APPLIANCE SERV. Home Appliances ,000 3,000 3,000 3,000 3, JOLANA'S EXCEPTIONAL HOME DÉCOR Home Décor ,900 1,900 1,900 1,900 1,900 Subtotal 30, ,900 8, ,280 13, , ,327 3, , ,534 SUBTOTAL NODE 2 - WESTERN APPROACH AREA 335,044 76,911 4,400 81, ,290 15,575 4,480 11,500 27,580 5,800 87,225 87,225 10,960 98,185 13,770 66,247 18,842 14,715 11,940 16, ,034 NODE 3 - STOUFFVILLE POWER CENTRE Stouffville Power Centre Hyw. 48 & Hoover Park Drive 1010 STAPLES BUSINESS DEPOT Office Supply ,000 20,000 20,000 20,000 20, WINNERS Ladies Wear ,000 20,000 20,000 20,000 20, TIM HORTON'S Fast Food Restaurant ,000 3, BOU CLAIR Bed & Bath ,000 6,000 6,000 6,000 6, REITMANS Ladies Wear ,000 6,000 6,000 6,000 6, FUTURE 21,000 ft² = under construction WAL-MART SUPERCENTER Discount Dep't Store , , , , BOSTON PIZZA (f/s) Fast Food Restaurant ,500 6, DOLLARAMA Dollar Store ,300 9,300 9,300 9,300 9, BULK BARN Bulk Food ,000 5,000 5, TELUS Cell Phone ,500 1,500 1,500 1,500 1, ROGERS PLUS Cell Phone ,500 1,500 1,500 1,500 1,500 Page 5 of 7
105 APPENDIX B STOUFFVILLE RETAIL AND SERVICE FLOORPSPACE INVENTORY 27 Drug Subtotal Cosmetic Home Sport/Hobby Can Tire Non-Dep't Total Home Ctr. Total Stouffville Retail and Service Inventory Super- Major 25 Other Optician 19 Fashion Furnishings Music/Bk/Art + TSC 28 Store NFSR Hardware NFSR Liquor 24 Rest. & FIRE & Other Corey Doyle - July 30, 2012 Total market / Spec. Subtotal Discount 26 Gen'l Pers'l Care & Computers Forist/Gift Tires 30 NFSR Space Bldg. Sply. + HI Beer 22 Fast Food Personal Bank Prof'l Med/Other Vacant Space Street Study NAICS Space Grocery Food FSR Dep't Store Merch Access. Electronics Used/Misc. A/P/A 29 (GAFO/DRUG) (GAFO/DRUG) Nursery Space Wine 23 Drinking Services Trust Services Services * Space NEC No. Store Name Store Type Code Code GLA GLA GLA GLA GLA GLA GLA GLA GLA GLA GLA GLA GLA GLA GLA GLA GLA GLA GLA GLA GLA GLA GLA 1076 THAI VILLA Fast Food Restaurant ,500 1, SGT. PEPPERS PUB & GRILL Fast Food Restaurant ,000 3, GREAT CLIPS Barber / Beauty ,500 1, KATHY NAILS & SPA Beauty ,500 1, SUBWAY Fast Food Restaurant ,500 1, EXTREME PITA Fast Food Restaurant ,500 1, HOOVER PARK DENTAL Dental Offices ,500 1, A & W Fast Food Restaurant ,800 1, CANADIAN TIRE HAAS / TBA ,200 55,200 55,200 55,200 55, MARK'S WORK WAREHOUSE Family Clothing ,300 8,300 8,300 8,300 8,300 NODE 3 - STOUFFVILLE POWER CENTRE 318, ,000 5, ,600 9, ,300 9,000 20,000 55, , , , ,800 3, , NODE 4 - MISCELLANEOUS LOCATIONS Main Street East Strip Plaza - s/w at Stouffer St SOFT WATER LAUNROMAT Laundry ,100 1, SANI FRESH CLEANERS Dry Cleaner ,100 1, DENTISTRY ON MAIN Dentist Office ,100 1, A. MAWANI, FAMILY HEALTH+ Doctor's Office ,100 1, MASTER HAIR PLACE Beauty Salon ,100 1, PS PHARMASAVE Drug Store ,200 2,200 2,200 2,200 2, STOUFFVILLE PIZZA Fast Food ,100 1, VACANT Vacant ,100 1, CONVENIENCE MARKET Convenience Stores ,200 2,200 2, STOUFFVILLE VILLAGE CHILD CARE Child Care ,500 5, STOUFFVILLE VARIETY Convenience Stores ,300 2,300 2, VACANT Vacant ,900 2,900 East End Corners Strip Plaza - n/w at Tenth Line SHOPPERS DRUG MART Drug Store ,512 18,512 18,512 18,512 18, ANYTIME FITNESS Fitness Gym ,474 4, FAMILY PHYSICIANS Doctor's Office ,111 1, SHIN DENTISTRY Dentist Office ,119 2, C.M.L. HEALTHCARE Diagnostic Lab ,902 1, HAPPY NAILS & SPA Beauty Salon ,028 2, LITTLE CAESAR'S Fast Food ,300 1,300 Hwy FRONTIER TRADING POST Miscellaneous ,200 2,200 2,200 2,200 2,200 Stouffville Road 5208 TOWN & COUNTRY ANIMAL HOSPITAL Other Medical ,300 1, GALLO REAL ESTATE LTD. Real Estate ,400 1,400 SUBTOTAL NODE 4 - MISCELLANEOUS LOCATIONS 59, ,500 4, ,200 18, , ,912 22, , ,400 5, ,400 14,132 4,000 4,474 GRAND TOTAL - ALL LOCATIONS 910,090 76,911 21,900 98, ,600 33,790 37,487 40,180 44,600 75,980 61, , ,637 26, ,497 13, ,747 37,670 24,215 45,240 59,232 4,000 26,908 Page 6 of 7
106 APPENDIX B STOUFFVILLE RETAIL AND SERVICE FLOORPSPACE INVENTORY 27 Drug Subtotal Cosmetic Home Sport/Hobby Can Tire Non-Dep't Total Home Ctr. Total Stouffville Retail and Service Inventory Super- Major 25 Other Optician 19 Fashion Furnishings Music/Bk/Art + TSC 28 Store NFSR Hardware NFSR Liquor 24 Rest. & FIRE & Other Corey Doyle - July 30, 2012 Total market / Spec. Subtotal Discount 26 Gen'l Pers'l Care & Computers Forist/Gift Tires 30 NFSR Space Bldg. Sply. + HI Beer 22 Fast Food Personal Bank Prof'l Med/Other Vacant Space Street Study NAICS Space Grocery Food FSR Dep't Store Merch Access. Electronics Used/Misc. A/P/A 29 (GAFO/DRUG) (GAFO/DRUG) Nursery Space Wine 23 Drinking Services Trust Services Services * Space NEC No. Store Name Store Type Code Code GLA GLA GLA GLA GLA GLA GLA GLA GLA GLA GLA GLA GLA GLA GLA GLA GLA GLA GLA GLA GLA GLA GLA 2012 SUMMARY BY NODE: SUBTOTAL NODE 1: DOWNTOWN STOUFFVILLE (Sq. Ft.) 197, ,000 8, ,400 1,400 24,100 26, ,100 55,100 15,900 71, ,300 10,500 9,500 31,900 27, ,400 Row (%) 100% 0.0% 4.1% 4.1% 0.0% 0.0% 1.7% 0.7% 12.2% 13.3% 0.0% 27.9% 27.9% 8.1% 36.0% 0.0% 15.4% 5.3% 4.8% 16.2% 14.0% 0.0% 4.3% Column (%) 21.7% 0.0% 36.5% 8.1% 0.0% 0.0% 9.1% 3.5% 54.0% 34.5% 0.0% 18.8% 12.1% 59.2% 14.7% 0.0% 25.7% 27.9% 39.2% 70.5% 46.6% 0.0% 31.2% SUBTOTAL NODE 2 - WESTERN APPROACH AREA (Sq. Ft.) 335,044 76,911 4,400 81, ,290 15,575 4,480 11,500 27,580 5,800 87,225 87,225 10,960 98,185 13,770 66,247 18,842 14,715 11,940 16, ,034 Row (%) 100% 23.0% 1.3% 24.3% 0.0% 6.7% 4.6% 1.3% 3.4% 8.2% 1.7% 26.0% 26.0% 3.3% 29.3% 4.1% 19.8% 5.6% 4.4% 3.6% 4.8% 0.0% 4.2% Column (%) 36.8% 100.0% 20.1% 82.3% 0.0% 66.0% 41.5% 11.1% 25.8% 36.3% 9.5% 29.8% 19.1% 40.8% 20.3% 100.0% 56.3% 50.0% 60.8% 26.4% 27.0% 0.0% 52.2% SUBTOTAL NODE 3 - STOUFFVILLE POWER CENTRE (Sq. Ft.) 318, ,000 5, ,600 9, ,300 9,000 20,000 55, , , , ,800 3, , Row (%) 100% 0.0% 1.6% 1.6% 51.0% 2.9% 0.0% 10.8% 2.8% 6.3% 17.3% 40.1% 91.1% 0.0% 91.1% 0.0% 5.9% 0.9% 0.0% 0.0% 0.5% 0.0% 0.0% Column (%) 35.0% 0.0% 22.8% 5.1% 100.0% 27.5% 0.0% 85.4% 20.2% 26.3% 90.5% 43.6% 63.7% 0.0% 60.2% 0.0% 16.0% 8.0% 0.0% 0.0% 2.5% 0.0% 0.0% SUBTOTAL NODE 4 - MISCELLANEOUS LOCATIONS (Sq. Ft.) 59, ,500 4, ,200 18, , ,912 22, , ,400 5, ,400 14,132 4,000 4,474 Row (%) 100% 0.0% 7.6% 7.6% 0.0% 3.7% 31.3% 0.0% 0.0% 3.7% 0.0% 38.7% 38.7% 0.0% 38.7% 0.0% 4.1% 9.0% 0.0% 2.4% 23.9% 6.8% 7.6% Column (%) 6.5% 0.0% 20.5% 4.6% 0.0% 6.5% 49.4% 0.0% 0.0% 2.9% 0.0% 7.8% 5.0% 0.0% 4.7% 0.0% 2.0% 14.1% 0.0% 3.1% 23.9% 100.0% 16.6% GRAND TOTAL - ALL LOCATIONS (Sq. Ft.) 910,090 76,911 21,900 98, ,600 33,790 37,487 40,180 44,600 75,980 61, , ,637 26, ,497 13, ,747 37,670 24,215 45,240 59,232 4,000 26,908 Row (%) 100% 8.5% 2.4% 10.9% 17.9% 3.7% 4.1% 4.4% 4.9% 8.3% 6.7% 32.2% 50.1% 3.0% 53.0% 1.5% 12.9% 4.1% 2.7% 5.0% 6.5% 0.4% 3.0% Column (%) 100% 100% 100% 100% 100% 100% 100% 100% 100% 100% 100% 100% 100% 100% 100% 100% 100% 100% 100% 100% 100% 100% 100% * Medical / Dental / Veterinary / Laboratory / Clinic = 46,132 ft² = 70% of total Medical / Other Services Column Page 7 of 7
107 APPENDIX B-2 RETAIL COMMERCIAL INVENTORY CLASSIFICATION BY TYPE (NAICS 2002-BASED) NAICS STUDY Store Type Code Code FOOD STORES Supermarkets and Grocery Stores Supermarket Grocery Store Convenience and Specialty Food Stores Convenience Store Meat Fish and Seafood Fruits and Vegetables Bakery Candy and Nut Herbs and Spices Milk / Cheese / Ice Cream / Dairy Products Coffee and Tea Soft Drinks Health Food (not supplements) (e.g. Noah's Natural Foods) Delicatessen Bulk Food Other Specialty Food PHARMACIES AND PERSONAL CARE STORES Pharmacies Pharmacy / Drug Store Cosmetics / Beauty Supply / Perfume Personal Care Stores Optician Health Supplements (not food) (e.g. General Nutrition Centre, Nutrition House) Medical Aids and Equipment (e.g. hearing aids, orthopaedic aids, oxygen) BEER, WINE AND LIQUOR STORES Beer Wine Liquor GAFO: GENERAL MERCHANDISE STORES Department Stores Traditional Department Store Discount Department Store Warehouse Membership Clubs Warehouse Membership Club Home and Auto Supply Stores Home and Auto Supply (e.g. Canadian Tire, TSC Stores) Automotive Parts and Accessories Tires Other General Merchandise Stores Catalogue Sales Showroom (e.g. Sears Catalogue and Sears Dealer stores) Dollar Store (e.g. Dollarama, Buck or Two) Variety Store (e.g. Bargain Shop, Giant Tiger, Liquidation World) General Store (e.g. Co-Op, Country Depot, "farmer's supply" stores)
108 APPENDIX B-2 RETAIL COMMERCIAL INVENTORY CLASSIFICATION BY TYPE (NAICS 2002-BASED) NAICS STUDY Store Type Code Code GAFO: APPAREL AND ACCESSORIES STORES Clothing Stores Men's Clothing Women's Clothing Children's and Infants' Clothing Family Clothing Athletic Clothing (not uniforms) Fur Leather Apparel Bridal Lingerie Maternity Outerwear Swimwear Uniforms and Work Clothing Other Clothing Shoe Stores Men's Shoes Women's Shoes Children's Shoes Family Shoes Athletic Shoes Clothing Accessories and Jewellery Stores Costume Jewellery Clothing Accessories (e.g. handbags, hosiery, hats, scarves, ties, gloves, umbrellas) Jewellery Luggage and Leather Goods GAFO: FURNITURE, HOME FURNISHINGS AND ELECTRONICS STORES Furniture Stores Household Furniture Household Furniture and Appliance Office Furniture (if it sells to consumers) Outdoor Furniture Mattress Home Furnishings Stores Floor Coverings (e.g. carpet, tile, wood, linoleum) Window Treatments (e.g. drapery, curtain, blinds) Print and Picture Frame Bedding / Linen / Bath China / Glassware / Cutlery / Kitchenware Housewares Mirrors Pottery Lamps and Lighting Fixtures Fireplace Accessories Computer and Software Stores Computer Hardware and Software (e.g. CompuSmart)
109 APPENDIX B-2 RETAIL COMMERCIAL INVENTORY CLASSIFICATION BY TYPE (NAICS 2002-BASED) NAICS STUDY Store Type Code Code Home Electronics and Appliance Stores Household Appliance Consumer Electronics (e.g. TV, radio, stereo) Household Appliance and Electronics Satellite Receivers Telephone (including cellular phone) Personal Care Appliance Sewing Machines Vacuum Cleaners Room Air Conditioners Camera and Photography Supply GAFO: OTHER RETAILERS Sporting Goods, Hobby, Music and Book Stores Bicycles Fitness Equipment Bait and Tackle / Firearms Other Sporting Goods (including uniforms) Hobby, Toy and Game (including arts and crafts, console game stores) (e.g. EB Games, MicroP Sewing, Needlework and Piece Goods (including yarn and fabric) Musical Instruments and Supplies Books and News Pre-Recorded Tapes, Compact Discs and Records Miscellaneous Store Retailers Florist Office Supply and Stationery (including office furniture if not selling to consumers) Gift, Novelty and Souvenir Greeting Cards Used Clothing Used Furniture / Antiques Used Appliances Used Books Other Used Merchandise (not pawnshops) Pet and Pet Supply Art Dealer Beer and Wine-Making Supply Art Supply Auctioneering Hot Tubs / Whirlpools / Swimming Pools Coins and Stamps Autographs, Cards and Collectibles Party Supply Tobacco Tombstones Other Miscellaneous Retailer (including water systems)
110 APPENDIX B-2 RETAIL COMMERCIAL INVENTORY CLASSIFICATION BY TYPE (NAICS 2002-BASED) NAICS STUDY Store Type Code Code BUILDING AND OUTDOOR HOME SUPPLIES STORES Home Centres and Hardware Stores Home Improvement Centre Hardware Store Specialized Building Materials and Garden Stores Paint and Wallpaper Kitchen Cabinets / Doors and Windows Electrical Supply Plumbing Lumber Other Building Materials (e.g. brick and tile, fencing, glass, roofing) Outdoor Power Equipment (e.g. lawnmowers) Nursery / Garden Centre (including lawn ornaments) SERVICES Financial Institutions Bank Credit Union Other Depository Institution (e.g. provincial savings and loans) Other Lending Services Consumer Lending (e.g. personal credit and loan companies) Pawnbroker Mortgage and Loan Broker Cheque Cashing Service Consumer Rental Services Car Rental Electronics and Appliance Rental Formal Wear and Costume Rental Video Tape and Disc Rental Other Consumer Goods Rental (e.g. furniture, sports equipment, party supply) General Rental Centre Professional Services Investment Advice / Financial Planning Insurance Agent / Broker Real Estate Agent / Broker Legal (e.g. lawyer, notary, paralegal) Accounting (e.g. accountant, tax preparer, bookkeeper, payroll service) Photographer Veterinarian Administrative Services Employment Service Business Service Centre (e.g. photocopying service, private mail centre) Travel Service (e.g. travel agent, tour operator, auto club, ticket agent, tourist bureau) Educational Services Business and Secretarial School Computer Training Athletic Instruction (e.g. gymnastics club, martial arts club) Other School (e.g. driver training, tutoring) Health Care Services Physician (including psychiatrist) Dentist Other Health Practitioner (e.g. chiropractor, optometrist, psychologist, other therapist) Out-Patient Care Centre (e.g. family planning,, substance abuse, community health) Medical and Diagnostic Laboratory
111 APPENDIX B-2 RETAIL COMMERCIAL INVENTORY CLASSIFICATION BY TYPE (NAICS 2002-BASED) NAICS STUDY Store Type Code Code Social Services Individual and Family Service (e.g. family counselling, big brothers and sisters) Community Food, Housing, Emergency Relief Service (e.g. food bank, meals on wheels) Vocational Rehabilitation Service Child Day-Care Service Arts, Entertainment and Recreation Facilities Movie Theatre / Cinema Live Theatre Sports Arena / Stadium Amusement Arcade Casino Lottery Ticket Vendor Other Gambling Facility (e.g. bingo parlour, off-track betting) Marina Fitness and Recreational Sports Centre Bowling Alley Billiard Hall Other Amusement and Recreation Facility (e.g. amusement rides, miniature golf) Food Services Full-Service Restaurant Limited-Service Eating Place (e.g. fast food, take-out, doughnut shop, cafeteria) Drinking Places (e.g. bars, pubs, lounges, night clubs, taverns) Automotive Repair and Maintenance Mechanical and Electrical (e.g. general repair, specialty repair of muffler, brake, transmission) Body, Paint, Interior and Glass Car Wash Other Automotive Repair and Maintenance (e.g. lubrication, emission testing, undercoating) Personal Goods Repair and Maintenance Home and Garden Equipment Appliance (including consumer electronics) Reupholstery and Furniture Repair (including furniture refinishing) Footwear and Leather Goods Repair Other Personal and Household Goods (e.g. garments, bicycles, jewellery, watches, key duplicati Personal and Laundry Services Barber Shop (i.e. men only) Beauty Salon (i.e. women only; includes nail salons, manicures, pedicures) Unisex Hair Salon (i.e. men and women) Weight Loss Centre (e.g. Jenny Craig, Herbal Magic) Hair Removal / Hair Replacement Ear Piercing / Tattooing / Tanning Salon Other Personal Care Service (e.g. bath house, massage parlour) Coin-Operated Laundry Dry Cleaning Linen and Uniform Supply Pet Care (e.g. animal shelter, boarding kennel, pet grooming) Photo Finishing Service (e.g. one hour photo finishing services, not camera shops) All Other Personal Service (e.g. party planning, personal shopping, psychic, shoe shine, escorts VACANT SPACE NA 200 OTHER NON-RETAIL SPACE NA 201 GENERAL OFFICE SPACE NA 202 GAFO: OTHER RETAILERS [EXCLUDED] Miscellaneous Store Retailers [EXCLUDED] Mobile Homes NA
112 APPENDIX B-2 RETAIL COMMERCIAL INVENTORY CLASSIFICATION BY TYPE (NAICS 2002-BASED) NAICS STUDY Store Type Code Code AUTOMOTIVE [EXCLUDING AUTOMOTIVE PARTS AND ACCESSORIES STORES AND TIRE DEALERS] Vehicle Dealers [EXCLUDING AUTOMOTIVE PARTS AND ACCESSORIES STORES AND TIRE DEALERS] New Cars NA Used Cars NA Recreational Vehicles NA Motorcycles NA Boats NA Other Motor Vehicles (e.g. ATVs, snowmobiles, trailers, aircraft) NA Gasoline Stations Gasoline Station with Convenience Store Gasoline Station without Convenience Store NA NON-STORE RETAILERS Electronic Shopping and Mail-Order Houses NA Vending Machine Operators NA Fuel Dealer NA Other Direct Selling Establishments NA
113 APPENDIX C CONSUMER TELEPHONE SURVEY C-1
114 APPENDIX C-1 (ROW TOTAL) LOCATIONAL DISTRIBUTION OF PRIMARY ZONE (WHITCHURCH-STOUFFVILLE) EXPENDITURES Major Retail Locations Schell Lumber Giant Tiger / No Frills Wal-Mart / CTC Downtown Metro / LCBO / Beer Staples / Mark's Other Subtotal Markham Markham Store Type Stouffville Western Approach SmartCentres Stouffville Stouffville Uxbridge Markville S.C. Hwy 7 Corridor ($) (%) ($) (%) ($) (%) ($) (%) ($) (%) ($) (%) ($) (%) ($) (%) FSR (Food Store Retail) Stores Supermarkets Specialty Food Costco (food) Subtotal Department Stores Sears Bay Zellers Wal-Mart Subtotal General Merchandise HAAS (Can. Tire/TSC) Tire, Battery, or Automotive Specialty Store Costco (non-food) Apparel/Accessories Stores Mens & Ladies Wear Family Wear/Unisex Childrens Wear Shoe Stores Jewellery Stores Clothing Accessories Stores Luggage & Leather Goods Stores Subtotal Other NFSR (Non-Food Store Retail/Specialty DSTM) Stores Stationery/Office Supply Book Store or News Dealer Record/CD/Tape Camera/Photo Supply Gift/Novelty/Greeting Card/Party Supply Sporting Goods Stores Hobby/Toy/Craft Store Art Gallery/Artists Supply Musical Instrument/Supply Pet/Pet Supply Stores Fabric or Yarn Store Drug / Discount Drug Stores Florist Subtotal Home Furnishings/Home Improvement/Building Supply Furniture/Appliances TV/Stereo/Electronics/Computer Lighting/Carpet/Other Int. Decor China/Glassware/Kitchenware/Cutlery Store Bath/Bedding/Linen Store Telephone/Cell Phone/Vacuum/Sewing Machine Antiques Shop Home Improvement/Lumber & Building Supply Hardware/Paint/Paper/Glass/Electrical/Plumbing Supply Nursery or Garden Centre Subtotal Total NFSR + HI
115 APPENDIX C-1 (ROW TOTAL) LOCATIONAL DISTRIBUTION OF PRIMARY ZONE (WHITCHURCH-STOUFFVILLE) EXPENDITURES Major Retail Locations Other Subtotal Newmarket Other Richmond Aurora Other All Other Store Type Markham Markham Upper Canada Mall Newmarket Hill Power Centre Aurora Locations ($) (%) ($) (%) ($) (%) ($) (%) ($) (%) ($) (%) ($) (%) ($) (%) FSR (Food Store Retail) Stores Supermarkets Specialty Food Costco (food) Subtotal Department Stores Sears Bay Zellers Wal-Mart Subtotal General Merchandise HAAS (Can. Tire/TSC) Tire, Battery, or Automotive Specialty Store Costco/Sam's Club (non-food) Apparel/Accessories Stores Mens & Ladies Wear Family Wear/Unisex Childrens Wear Shoe Stores Jewellery Stores Clothing Accessories Stores Luggage & Leather Goods Stores Subtotal Other NFSR (Non-Food Store Retail/Specialty DSTM) Stores Stationery/Office Supply Book Store or News Dealer Record/CD/Tape Camera/Photo Supply Gift/Novelty/Greeting Card/Party Supply Sporting Goods Stores Hobby/Toy/Craft Store Art Gallery/Artists Supply Musical Instrument/Supply Pet/Pet Supply Stores Fabric or Yarn Store Drug / Discount Drug Stores Florist Subtotal Home Furnishings/Home Improvement/Building Supply Furniture/Appliances TV/Stereo/Electronics/Computer Lighting/Carpet/Other Int. Decor China/Glassware/Kitchenware/Cutlery Store Bath/Bedding/Linen Store Telephone/Cell Phone/Vacuum/Sewing Machine Antiques Shop Home Improvement/Lumber & Building Supply Hardware/Paint/Paper/Glass/Electrical/Plumbing Supply Nursery or Garden Centre Subtotal Total NFSR + HI
116 APPENDIX C-1 (ROW TOTAL) LOCATIONAL DISTRIBUTION OF PRIMARY ZONE (WHITCHURCH-STOUFFVILLE) EXPENDITURES Major Retail Locations Subtotal Grand Study Area Total All Store Type Outflow Locations ($) (%) ($) (%) FSR (Food Store Retail) Stores Supermarkets Specialty Food Costco (food) Subtotal Department Stores Sears Bay Zellers Wal-Mart Subtotal General Merchandise HAAS (Can. Tire/TSC) Tire, Battery, or Automotive Specialty Store Costco/Sam's Club (non-food) Apparel/Accessories Stores Mens & Ladies Wear Family Wear/Unisex Childrens Wear Shoe Stores Jewellery Stores Clothing Accessories Stores Luggage & Leather Goods Stores Subtotal Other NFSR (Non-Food Store Retail/Specialty DSTM) Stores Stationery/Office Supply Book Store or News Dealer Record/CD/Tape Camera/Photo Supply Gift/Novelty/Greeting Card/Party Supply Sporting Goods Stores Hobby/Toy/Craft Store Art Gallery/Artists Supply Musical Instrument/Supply Pet/Pet Supply Stores Fabric or Yarn Store Drug / Discount Drug Stores Florist Subtotal Home Furnishings/Home Improvement/Building Supply Furniture/Appliances TV/Stereo/Electronics/Computer Lighting/Carpet/Other Int. Decor China/Glassware/Kitchenware/Cutlery Store Bath/Bedding/Linen Store Telephone/Cell Phone/Vacuum/Sewing Machine Antiques Shop Home Improvement/Lumber & Building Supply Hardware/Paint/Paper/Glass/Electrical/Plumbing Supply Nursery or Garden Centre Subtotal Total NFSR + HI
117 APPENDIX C-1 (COLUMN TOTAL) LOCATIONAL DISTRIBUTION OF PRIMARY ZONE (WHITCHURCH-STOUFFVILLE) EXPENDITURES Major Retail Locations Schell Lumber Giant Tiger / No Frills Wal-Mart / CTC Downtown Metro / LCBO / Beer Staples / Mark's Other Subtotal Markham Markham Store Type Stouffville Western Approach SmartCentres Stouffville Stouffville Uxbridge Markville S.C. Hwy 7 Corridor ($) (%) ($) (%) ($) (%) ($) (%) ($) (%) ($) (%) ($) (%) ($) (%) FSR (Food Store Retail) Stores Supermarkets Specialty Food Costco (food) Subtotal Department Stores Sears Bay Zellers Wal-Mart Subtotal General Merchandise HAAS (Can. Tire/TSC) Tire, Battery, or Automotive Specialty Store Costco (non-food) Apparel/Accessories Stores Mens & Ladies Wear Family Wear/Unisex Childrens Wear Shoe Stores Jewellery Stores Clothing Accessories Stores Luggage & Leather Goods Stores Subtotal Other NFSR (Non-Food Store Retail/Specialty DSTM) Stores Stationery/Office Supply Book Store or News Dealer Record/CD/Tape Camera/Photo Supply Gift/Novelty/Greeting Card/Party Supply Sporting Goods Stores Hobby/Toy/Craft Store Art Gallery/Artists Supply Musical Instrument/Supply Pet/Pet Supply Stores Fabric or Yarn Store Drug / Discount Drug Stores Florist Subtotal Home Furnishings/Home Improvement/Building Supply Furniture/Appliances TV/Stereo/Electronics/Computer Lighting/Carpet/Other Int. Decor China/Glassware/Kitchenware/Cutlery Store Bath/Bedding/Linen Store Telephone/Cell Phone/Vacuum/Sewing Machine Antiques Shop Home Improvement/Lumber & Building Supply Hardware/Paint/Paper/Glass/Electrical/Plumbing Supply Nursery or Garden Centre Subtotal Total NFSR + HI
118 APPENDIX C-1 (COLUMN TOTAL) LOCATIONAL DISTRIBUTION OF PRIMARY ZONE (WHITCHURCH-STOUFFVILLE) EXPENDITURES Major Retail Locations Other Subtotal Newmarket Other Richmond Aurora Other All Other Store Type Markham Markham Upper Canada Mall Newmarket Hill Power Centre Aurora Locations ($) (%) ($) (%) ($) (%) ($) (%) ($) (%) ($) (%) ($) (%) ($) (%) FSR (Food Store Retail) Stores Supermarkets Specialty Food Costco (food) Subtotal Department Stores Sears Bay Zellers Wal-Mart Subtotal General Merchandise HAAS (Can. Tire/TSC) Tire, Battery, or Automotive Specialty Store Costco (non-food) Apparel/Accessories Stores Mens & Ladies Wear Family Wear/Unisex Childrens Wear Shoe Stores Jewellery Stores Clothing Accessories Stores Luggage & Leather Goods Stores Subtotal Other NFSR (Non-Food Store Retail/Specialty DSTM) Stores Stationery/Office Supply Book Store or News Dealer Record/CD/Tape Camera/Photo Supply Gift/Novelty/Greeting Card/Party Supply Sporting Goods Stores Hobby/Toy/Craft Store Art Gallery/Artists Supply Musical Instrument/Supply Pet/Pet Supply Stores Fabric or Yarn Store Drug / Discount Drug Stores Florist Subtotal Home Furnishings/Home Improvement/Building Supply Furniture/Appliances TV/Stereo/Electronics/Computer Lighting/Carpet/Other Int. Decor China/Glassware/Kitchenware/Cutlery Store Bath/Bedding/Linen Store Telephone/Cell Phone/Vacuum/Sewing Machine Antiques Shop Home Improvement/Lumber & Building Supply Hardware/Paint/Paper/Glass/Electrical/Plumbing Supply Nursery or Garden Centre Subtotal Total NFSR + HI
119 APPENDIX C-1 (COLUMN TOTAL) LOCATIONAL DISTRIBUTION OF PRIMARY ZONE (WHITCHURCH-STOUFFVILLE) EXPENDITURES Major Retail Locations Subtotal Grand Study Area Total All Store Type Outflow Locations ($) (%) ($) (%) FSR (Food Store Retail) Stores Supermarkets Specialty Food Costco (food) Subtotal Department Stores Sears Bay Zellers Wal-Mart Subtotal General Merchandise HAAS (Can. Tire/TSC) Tire, Battery, or Automotive Specialty Store Costco (non-food) Apparel/Accessories Stores Mens & Ladies Wear Family Wear/Unisex Childrens Wear Shoe Stores Jewellery Stores Clothing Accessories Stores Luggage & Leather Goods Stores Subtotal Other NFSR (Non-Food Store Retail/Specialty DSTM) Stores Stationery/Office Supply Book Store or News Dealer Record/CD/Tape Camera/Photo Supply Gift/Novelty/Greeting Card/Party Supply Sporting Goods Stores Hobby/Toy/Craft Store Art Gallery/Artists Supply Musical Instrument/Supply Pet/Pet Supply Stores Fabric or Yarn Store Drug / Discount Drug Stores Florist Subtotal Home Furnishings/Home Improvement/Building Supply Furniture/Appliances TV/Stereo/Electronics/Computer Lighting/Carpet/Other Int. Decor China/Glassware/Kitchenware/Cutlery Store Bath/Bedding/Linen Store Telephone/Cell Phone/Vacuum/Sewing Machine Antiques Shop Home Improvement/Lumber & Building Supply Hardware/Paint/Paper/Glass/Electrical/Plumbing Supply Nursery or Garden Centre Subtotal Total NFSR + HI
120 APPENDIX C-2 (ROW TOTAL) LOCATIONAL DISTRIBUTION OF SECONDARY ZONE EAST EXPENDITURES Major Retail Locations Schell Lumber Giant Tiger / No Frills Wal-Mart / CTC Downtown Metro / LCBO / Beer Staples / Mark's Other Subtotal Markham Markham Store Type Stouffville Western Approach SmartCentres Stouffville Stouffville Uxbridge Markville S.C. Hwy 7 Corridor ($) (%) ($) (%) ($) (%) ($) (%) ($) (%) ($) (%) ($) (%) ($) (%) FSR (Food Store Retail) Stores Supermarkets Specialty Food Costco (food) Subtotal Department Stores Sears Bay Zellers Wal-Mart Subtotal General Merchandise HAAS (Can. Tire/TSC) Tire, Battery, or Automotive Specialty Store Costco (non-food) Apparel/Accessories Stores Mens & Ladies Wear Family Wear/Unisex Childrens Wear Shoe Stores Jewellery Stores Clothing Accessories Stores Luggage & Leather Goods Stores Subtotal Other NFSR (Non-Food Store Retail/Specialty DSTM) Stores Stationery/Office Supply Book Store or News Dealer Record/CD/Tape Camera/Photo Supply Gift/Novelty/Greeting Card/Party Supply Sporting Goods Stores Hobby/Toy/Craft Store Art Gallery/Artists Supply Musical Instrument/Supply Pet/Pet Supply Stores Fabric or Yarn Store Drug / Discount Drug Stores Florist Subtotal Home Furnishings/Home Improvement/Building Supply Furniture/Appliances TV/Stereo/Electronics/Computer Lighting/Carpet/Other Int. Decor China/Glassware/Kitchenware/Cutlery Store Bath/Bedding/Linen Store Telephone/Cell Phone/Vacuum/Sewing Machine Antiques Shop Home Improvement/Lumber & Building Supply Hardware/Paint/Paper/Glass/Electrical/Plumbing Supply Nursery or Garden Centre Subtotal Total NFSR + HI
121 APPENDIX C-2 (ROW TOTAL) LOCATIONAL DISTRIBUTION OF SECONDARY ZONE EAST EXPENDITURES Major Retail Locations Other Subtotal Newmarket Other Richmond Aurora Other All Other Store Type Markham Markham Upper Canada Mall Newmarket Hill Power Centre Aurora Locations ($) (%) ($) (%) ($) (%) ($) (%) ($) (%) ($) (%) ($) (%) ($) (%) FSR (Food Store Retail) Stores Supermarkets Specialty Food Costco (food) Subtotal Department Stores Sears Bay Zellers Wal-Mart Subtotal General Merchandise HAAS (Can. Tire/TSC) Tire, Battery, or Automotive Specialty Store Costco (non-food) Apparel/Accessories Stores Mens & Ladies Wear Family Wear/Unisex Childrens Wear Shoe Stores Jewellery Stores Clothing Accessories Stores Luggage & Leather Goods Stores Subtotal Other NFSR (Non-Food Store Retail/Specialty DSTM) Stores Stationery/Office Supply Book Store or News Dealer Record/CD/Tape Camera/Photo Supply Gift/Novelty/Greeting Card/Party Supply Sporting Goods Stores Hobby/Toy/Craft Store Art Gallery/Artists Supply Musical Instrument/Supply Pet/Pet Supply Stores Fabric or Yarn Store Drug / Discount Drug Stores Florist Subtotal Home Furnishings/Home Improvement/Building Supply Furniture/Appliances TV/Stereo/Electronics/Computer Lighting/Carpet/Other Int. Decor China/Glassware/Kitchenware/Cutlery Store Bath/Bedding/Linen Store Telephone/Cell Phone/Vacuum/Sewing Machine Antiques Shop Home Improvement/Lumber & Building Supply Hardware/Paint/Paper/Glass/Electrical/Plumbing Supply Nursery or Garden Centre Subtotal Total NFSR + HI
122 APPENDIX C-2 (ROW TOTAL) LOCATIONAL DISTRIBUTION OF SECONDARY ZONE EAST EXPENDITURES Major Retail Locations Subtotal Grand Study Area Total All Store Type Outflow Locations ($) (%) ($) (%) FSR (Food Store Retail) Stores Supermarkets Specialty Food Costco (food) Subtotal Department Stores Sears Bay Zellers Wal-Mart Subtotal General Merchandise HAAS (Can. Tire/TSC) Tire, Battery, or Automotive Specialty Store Costco (non-food) Apparel/Accessories Stores Mens & Ladies Wear Family Wear/Unisex Childrens Wear Shoe Stores Jewellery Stores Clothing Accessories Stores Luggage & Leather Goods Stores Subtotal Other NFSR (Non-Food Store Retail/Specialty DSTM) Stores Stationery/Office Supply Book Store or News Dealer Record/CD/Tape Camera/Photo Supply Gift/Novelty/Greeting Card/Party Supply Sporting Goods Stores Hobby/Toy/Craft Store Art Gallery/Artists Supply Musical Instrument/Supply Pet/Pet Supply Stores Fabric or Yarn Store Drug / Discount Drug Stores Florist Subtotal Home Furnishings/Home Improvement/Building Supply Furniture/Appliances TV/Stereo/Electronics/Computer Lighting/Carpet/Other Int. Decor China/Glassware/Kitchenware/Cutlery Store Bath/Bedding/Linen Store Telephone/Cell Phone/Vacuum/Sewing Machine Antiques Shop Home Improvement/Lumber & Building Supply Hardware/Paint/Paper/Glass/Electrical/Plumbing Supply Nursery or Garden Centre Subtotal Total NFSR + HI
123 APPENDIX C-2 (COLUMN TOTAL) LOCATIONAL DISTRIBUTION OF SECONDARY ZONE EAST EXPENDITURES Major Retail Locations Schell Lumber Giant Tiger / No Frills Wal-Mart / CTC Downtown Metro / LCBO / Beer Staples / Mark's Other Subtotal Markham Markham Store Type Stouffville Western Approach SmartCentres Stouffville Stouffville Uxbridge Markville S.C. Hwy 7 Corridor ($) (%) ($) (%) ($) (%) ($) (%) ($) (%) ($) (%) ($) (%) ($) (%) FSR (Food Store Retail) Stores Supermarkets Specialty Food Costco (food) Subtotal Department Stores Sears Bay Zellers Wal-Mart Subtotal General Merchandise HAAS (Can. Tire/TSC) Tire, Battery, or Automotive Specialty Store Costco (non-food) Apparel/Accessories Stores Mens & Ladies Wear Family Wear/Unisex Childrens Wear Shoe Stores Jewellery Stores Clothing Accessories Stores Luggage & Leather Goods Stores Subtotal Other NFSR (Non-Food Store Retail/Specialty DSTM) Stores Stationery/Office Supply Book Store or News Dealer Record/CD/Tape Camera/Photo Supply Gift/Novelty/Greeting Card/Party Supply Sporting Goods Stores Hobby/Toy/Craft Store Art Gallery/Artists Supply Musical Instrument/Supply Pet/Pet Supply Stores Fabric or Yarn Store Drug / Discount Drug Stores Florist Subtotal Home Furnishings/Home Improvement/Building Supply Furniture/Appliances TV/Stereo/Electronics/Computer Lighting/Carpet/Other Int. Decor China/Glassware/Kitchenware/Cutlery Store Bath/Bedding/Linen Store Telephone/Cell Phone/Vacuum/Sewing Machine Antiques Shop Home Improvement/Lumber & Building Supply Hardware/Paint/Paper/Glass/Electrical/Plumbing Supply Nursery or Garden Centre Subtotal Total NFSR + HI
124 APPENDIX C-2 (COLUMN TOTAL) LOCATIONAL DISTRIBUTION OF SECONDARY ZONE EAST EXPENDITURES Major Retail Locations Other Subtotal Newmarket Other Richmond Aurora Other All Other Store Type Markham Markham Upper Canada Mall Newmarket Hill Power Centre Aurora Locations ($) (%) ($) (%) ($) (%) ($) (%) ($) (%) ($) (%) ($) (%) ($) (%) FSR (Food Store Retail) Stores Supermarkets Specialty Food Costco (food) Subtotal Department Stores Sears Bay Zellers Wal-Mart Subtotal General Merchandise HAAS (Can. Tire/TSC) Tire, Battery, or Automotive Specialty Store Costco (non-food) Apparel/Accessories Stores Mens & Ladies Wear Family Wear/Unisex Childrens Wear Shoe Stores Jewellery Stores Clothing Accessories Stores Luggage & Leather Goods Stores Subtotal Other NFSR (Non-Food Store Retail/Specialty DSTM) Stores Stationery/Office Supply Book Store or News Dealer Record/CD/Tape Camera/Photo Supply Gift/Novelty/Greeting Card/Party Supply Sporting Goods Stores Hobby/Toy/Craft Store Art Gallery/Artists Supply Musical Instrument/Supply Pet/Pet Supply Stores Fabric or Yarn Store Drug / Discount Drug Stores Florist Subtotal Home Furnishings/Home Improvement/Building Supply Furniture/Appliances TV/Stereo/Electronics/Computer Lighting/Carpet/Other Int. Decor China/Glassware/Kitchenware/Cutlery Store Bath/Bedding/Linen Store Telephone/Cell Phone/Vacuum/Sewing Machine Antiques Shop Home Improvement/Lumber & Building Supply Hardware/Paint/Paper/Glass/Electrical/Plumbing Supply Nursery or Garden Centre Total NFSR + HI
125 APPENDIX C-2 (COLUMN TOTAL) LOCATIONAL DISTRIBUTION OF SECONDARY ZONE EAST EXPENDITURES Major Retail Locations Subtotal Grand Study Area Total All Store Type Outflow Locations ($) (%) ($) (%) FSR (Food Store Retail) Stores Supermarkets Specialty Food Costco (food) Subtotal Department Stores Sears Bay Zellers Wal-Mart Subtotal General Merchandise HAAS (Can. Tire/TSC) Tire, Battery, or Automotive Specialty Store Costco (non-food) Apparel/Accessories Stores Mens & Ladies Wear Family Wear/Unisex Childrens Wear Shoe Stores Jewellery Stores Clothing Accessories Stores Luggage & Leather Goods Stores Subtotal Other NFSR (Non-Food Store Retail/Specialty DSTM) Stores Stationery/Office Supply Book Store or News Dealer Record/CD/Tape Camera/Photo Supply Gift/Novelty/Greeting Card/Party Supply Sporting Goods Stores Hobby/Toy/Craft Store Art Gallery/Artists Supply Musical Instrument/Supply Pet/Pet Supply Stores Fabric or Yarn Store Drug / Discount Drug Stores Florist Subtotal Home Furnishings/Home Improvement/Building Supply Furniture/Appliances TV/Stereo/Electronics/Computer Lighting/Carpet/Other Int. Decor China/Glassware/Kitchenware/Cutlery Store Bath/Bedding/Linen Store Telephone/Cell Phone/Vacuum/Sewing Machine Antiques Shop Home Improvement/Lumber & Building Supply Hardware/Paint/Paper/Glass/Electrical/Plumbing Supply Nursery or Garden Centre Total NFSR + HI
126 APPENDIX C-3 (ROW TOTAL) LOCATIONAL DISTRIBUTION OF SECONDARY ZONE SOUTH EXPENDITURES Major Retail Locations Schell Lumber Giant Tiger / No Frills Wal-Mart / CTC Downtown Metro / LCBO / Beer Staples / Mark's Other Subtotal Markham Markham Store Type Stouffville Western Approach SmartCentres Stouffville Stouffville Uxbridge Markville S.C. Hwy 7 Corridor ($) (%) ($) (%) ($) (%) ($) (%) ($) (%) ($) (%) ($) (%) ($) (%) FSR (Food Store Retail) Stores Supermarkets Specialty Food Costco (food) Subtotal Department Stores Sears Bay Zellers Wal-Mart Subtotal General Merchandise HAAS (Can. Tire/TSC) Tire, Battery, or Automotive Specialty Store Costco (non-food) Apparel/Accessories Stores Mens & Ladies Wear Family Wear/Unisex Childrens Wear Shoe Stores Jewellery Stores Clothing Accessories Stores Luggage & Leather Goods Stores Subtotal Other NFSR (Non-Food Store Retail/Specialty DSTM) Stores Stationery/Office Supply Book Store or News Dealer Record/CD/Tape Camera/Photo Supply Gift/Novelty/Greeting Card/Party Supply Sporting Goods Stores Hobby/Toy/Craft Store Art Gallery/Artists Supply Musical Instrument/Supply Pet/Pet Supply Stores Fabric or Yarn Store Drug / Discount Drug Stores Florist Subtotal Home Furnishings/Home Improvement/Building Supply Furniture/Appliances TV/Stereo/Electronics/Computer Lighting/Carpet/Other Int. Decor China/Glassware/Kitchenware/Cutlery Store Bath/Bedding/Linen Store Telephone/Cell Phone/Vacuum/Sewing Machine Antiques Shop Home Improvement/Lumber & Building Supply Hardware/Paint/Paper/Glass/Electrical/Plumbing Supply Nursery or Garden Centre Subtotal Total NFSR + HI
127 APPENDIX C-3 (ROW TOTAL) LOCATIONAL DISTRIBUTION OF SECONDARY ZONE SOUTH EXPENDITURES Major Retail Locations Other Subtotal Newmarket Other Richmond Aurora Other All Other Store Type Markham Markham Upper Canada Mall Newmarket Hill Power Centre Aurora Locations ($) (%) ($) (%) ($) (%) ($) (%) ($) (%) ($) (%) ($) (%) ($) (%) FSR (Food Store Retail) Stores Supermarkets Specialty Food Costco (food) Subtotal Department Stores Sears Bay Zellers Wal-Mart Subtotal General Merchandise HAAS (Can. Tire/TSC) Tire, Battery, or Automotive Specialty Store Costco/Sam's Club (non-food) Apparel/Accessories Stores Mens & Ladies Wear Family Wear/Unisex Childrens Wear Shoe Stores Jewellery Stores Clothing Accessories Stores Luggage & Leather Goods Stores Subtotal Other NFSR (Non-Food Store Retail/Specialty DSTM) Stores Stationery/Office Supply Book Store or News Dealer Record/CD/Tape Camera/Photo Supply Gift/Novelty/Greeting Card/Party Supply Sporting Goods Stores Hobby/Toy/Craft Store Art Gallery/Artists Supply Musical Instrument/Supply Pet/Pet Supply Stores Fabric or Yarn Store Drug / Discount Drug Stores Florist Subtotal Home Furnishings/Home Improvement/Building Supply Furniture/Appliances TV/Stereo/Electronics/Computer Lighting/Carpet/Other Int. Decor China/Glassware/Kitchenware/Cutlery Store Bath/Bedding/Linen Store Telephone/Cell Phone/Vacuum/Sewing Machine Antiques Shop Home Improvement/Lumber & Building Supply Hardware/Paint/Paper/Glass/Electrical/Plumbing Supply Nursery or Garden Centre Subtotal Total NFSR + HI
128 APPENDIX C-3 (ROW TOTAL) LOCATIONAL DISTRIBUTION OF SECONDARY ZONE SOUTH EXPENDITURES Major Retail Locations Subtotal Grand Study Area Total All Store Type Outflow Locations ($) (%) ($) (%) FSR (Food Store Retail) Stores Supermarkets Specialty Food Costco (food) Subtotal Department Stores Sears Bay Zellers Wal-Mart Subtotal General Merchandise HAAS (Can. Tire/TSC) Tire, Battery, or Automotive Specialty Store Costco (non-food) Apparel/Accessories Stores Mens & Ladies Wear Family Wear/Unisex Childrens Wear Shoe Stores Jewellery Stores Clothing Accessories Stores Luggage & Leather Goods Stores Subtotal Other NFSR (Non-Food Store Retail/Specialty DSTM) Stores Stationery/Office Supply Book Store or News Dealer Record/CD/Tape Camera/Photo Supply Gift/Novelty/Greeting Card/Party Supply Sporting Goods Stores Hobby/Toy/Craft Store Art Gallery/Artists Supply Musical Instrument/Supply Pet/Pet Supply Stores Fabric or Yarn Store Drug / Discount Drug Stores Florist Subtotal Home Furnishings/Home Improvement/Building Supply Furniture/Appliances TV/Stereo/Electronics/Computer Lighting/Carpet/Other Int. Decor China/Glassware/Kitchenware/Cutlery Store Bath/Bedding/Linen Store Telephone/Cell Phone/Vacuum/Sewing Machine Antiques Shop Home Improvement/Lumber & Building Supply Hardware/Paint/Paper/Glass/Electrical/Plumbing Supply Nursery or Garden Centre Subtotal Total NFSR + HI
129 APPENDIX C-3 (COLUMN TOTAL) LOCATIONAL DISTRIBUTION OF SECONDARY ZONE SOUTH EXPENDITURES Major Retail Locations Schell Lumber Giant Tiger / No Frills Wal-Mart / CTC Downtown Metro / LCBO / Beer Staples / Mark's Other Subtotal Markham Markham Store Type Stouffville Western Approach SmartCentres Stouffville Stouffville Uxbridge Markville S.C. Hwy 7 Corridor ($) (%) ($) (%) ($) (%) ($) (%) ($) (%) ($) (%) ($) (%) ($) (%) FSR (Food Store Retail) Stores Supermarkets Specialty Food Costco (food) Subtotal Department Stores Sears Bay Zellers Wal-Mart Subtotal General Merchandise HAAS (Can. Tire/TSC) Tire, Battery, or Automotive Specialty Store Costco (non-food) Apparel/Accessories Stores Mens & Ladies Wear Family Wear/Unisex Childrens Wear Shoe Stores Jewellery Stores Clothing Accessories Stores Luggage & Leather Goods Stores Subtotal Other NFSR (Non-Food Store Retail/Specialty DSTM) Stores Stationery/Office Supply Book Store or News Dealer Record/CD/Tape Camera/Photo Supply Gift/Novelty/Greeting Card/Party Supply Sporting Goods Stores Hobby/Toy/Craft Store Art Gallery/Artists Supply Musical Instrument/Supply Pet/Pet Supply Stores Fabric or Yarn Store Drug / Discount Drug Stores Florist Subtotal Home Furnishings/Home Improvement/Building Supply Furniture/Appliances TV/Stereo/Electronics/Computer Lighting/Carpet/Other Int. Decor China/Glassware/Kitchenware/Cutlery Store Bath/Bedding/Linen Store Telephone/Cell Phone/Vacuum/Sewing Machine Antiques Shop Home Improvement/Lumber & Building Supply Hardware/Paint/Paper/Glass/Electrical/Plumbing Supply Nursery or Garden Centre Subtotal Total NFSR + HI
130 APPENDIX C-3 (COLUMN TOTAL) LOCATIONAL DISTRIBUTION OF SECONDARY ZONE SOUTH EXPENDITURES Major Retail Locations Other Subtotal Newmarket Other Richmond Aurora Other All Other Store Type Markham Markham Upper Canada Mall Newmarket Hill Power Centre Aurora Locations ($) (%) ($) (%) ($) (%) ($) (%) ($) (%) ($) (%) ($) (%) ($) (%) FSR (Food Store Retail) Stores Supermarkets Specialty Food Costco (food) Subtotal Department Stores Sears Bay Zellers Wal-Mart Subtotal General Merchandise HAAS (Can. Tire/TSC) Tire, Battery, or Automotive Specialty Store Costco (non-food) Apparel/Accessories Stores Mens & Ladies Wear Family Wear/Unisex Childrens Wear Shoe Stores Jewellery Stores Clothing Accessories Stores Luggage & Leather Goods Stores Subtotal Other NFSR (Non-Food Store Retail/Specialty DSTM) Stores Stationery/Office Supply Book Store or News Dealer Record/CD/Tape Camera/Photo Supply Gift/Novelty/Greeting Card/Party Supply Sporting Goods Stores Hobby/Toy/Craft Store Art Gallery/Artists Supply Musical Instrument/Supply Pet/Pet Supply Stores Fabric or Yarn Store Drug / Discount Drug Stores Florist Subtotal Home Furnishings/Home Improvement/Building Supply Furniture/Appliances TV/Stereo/Electronics/Computer Lighting/Carpet/Other Int. Decor China/Glassware/Kitchenware/Cutlery Store Bath/Bedding/Linen Store Telephone/Cell Phone/Vacuum/Sewing Machine Antiques Shop Home Improvement/Lumber & Building Supply Hardware/Paint/Paper/Glass/Electrical/Plumbing Supply Nursery or Garden Centre Total NFSR + HI
131 APPENDIX C-3 (COLUMN TOTAL) LOCATIONAL DISTRIBUTION OF SECONDARY ZONE SOUTH EXPENDITURES Major Retail Locations Subtotal Grand Study Area Total All Store Type Outflow Locations ($) (%) ($) (%) FSR (Food Store Retail) Stores Supermarkets Specialty Food Costco (food) Subtotal Department Stores Sears Bay Zellers Wal-Mart Subtotal General Merchandise HAAS (Can. Tire/TSC) Tire, Battery, or Automotive Specialty Store Costco (non-food) Apparel/Accessories Stores Mens & Ladies Wear Family Wear/Unisex Childrens Wear Shoe Stores Jewellery Stores Clothing Accessories Stores Luggage & Leather Goods Stores Subtotal Other NFSR (Non-Food Store Retail/Specialty DSTM) Stores Stationery/Office Supply Book Store or News Dealer Record/CD/Tape Camera/Photo Supply Gift/Novelty/Greeting Card/Party Supply Sporting Goods Stores Hobby/Toy/Craft Store Art Gallery/Artists Supply Musical Instrument/Supply Pet/Pet Supply Stores Fabric or Yarn Store Drug / Discount Drug Stores Florist Subtotal Home Furnishings/Home Improvement/Building Supply Furniture/Appliances TV/Stereo/Electronics/Computer Lighting/Carpet/Other Int. Decor China/Glassware/Kitchenware/Cutlery Store Bath/Bedding/Linen Store Telephone/Cell Phone/Vacuum/Sewing Machine Antiques Shop Home Improvement/Lumber & Building Supply Hardware/Paint/Paper/Glass/Electrical/Plumbing Supply Nursery or Garden Centre Total NFSR + HI
132 APPENDIX C-4 HEAD OF HOUSEHOLD (GENDER) Rural Total Total Urban Stouffville W.-Souffville W.-Souffville Sample Size PTA PTA PTA (#) (%) (#) (%) (#) (%) (#) (%) Head of Household (Gender) Female Male Total Urban Rural Uxbridge S. Rural Uxbridge N. Total Uxbridge South of Davis Dr. North of Davis Dr. Uxbridge STA East STA East STA East STA East (#) (%) (#) (%) (#) (%) (#) (%) Head of Household (Gender) Female Male Total Markham Pickering Total North of 16th North of Hwy. 7 Uxbridge + Pickering Total PTA East of Kennedy STA East STA East + STA East STA South (#) (%) (#) (%) (#) (%) (#) (%) Head of Household (Gender) Female Male Total APPENDIX C-5 AVERAGE SIZE OF HOUSEHOLD Rural Total Total Urban Stouffville W.-Souffville W.-Souffville Sample Size PTA PTA PTA Average Urban Rural Uxbridge S. Rural Uxbridge N. Total Uxbridge South of Davis Dr. North of Davis Dr. Uxbridge STA East STA East STA East STA East Average na Pickering Total Markham - N. of 16th North of Hwy. 7 Uxbridge + Pickering Total PTA E. of Kennedy STA East STA East + STA East STA South Average
133 APPENDIX C-6 AGE PROFILE OF RESPONDENTS Rural Total Total Urban Stouffville W.-Souffville W.-Souffville Sample Size PTA PTA PTA (#) (%) (#) (%) (#) (%) (#) (%) Age Profile Under Total Refusals Total With Refusals Urban Rural Uxbridge S. Rural Uxbridge N. Total Uxbridge South of Davis Dr. North of Davis Dr. Uxbridge STA East STA East STA East STA East (#) (%) (#) (%) (#) (%) (#) (%) Age Profile Under Total Refusals Total With Refusals Pickering Total Markham - N. of 16th North of Hwy. 7 Uxbridge + Pickering Total PTA E. of Kennedy STA East STA East + STA East STA South (#) (%) (#) (%) (#) (%) (#) (%) Age Profile Under Total Refusals Total With Refusals
134 APPENDIX C-7 EMPLOYMENT PROFILE OF RESPONDENTS Rural Total Total Urban Stouffville W.-Souffville W.-Souffville Sample Size PTA PTA PTA (#) (%) (#) (%) (#) (%) (#) (%) Employment Profile Employed FT Employed PT Self Employed Unemployed Retired Student Homemaker Disabled Refused Total Urban Rural Uxbridge S. Rural Uxbridge N. Total Uxbridge South of Davis Dr. North of Davis Dr. Uxbridge STA East STA East STA East STA East (#) (%) (#) (%) (#) (%) (#) (%) Employment Profile Employed FT Employed PT Self Employed Unemployed Retired Student Homemaker Disabled Refused Total Pickering Total Markham - N. of 16th North of Hwy. 7 Uxbridge + Pickering Total PTA E. of Kennedy STA East STA East + STA East STA South (#) (%) (#) (%) (#) (%) (#) (%) Employment Profile Employed FT Employed PT Self Employed Unemployed Retired Student Homemaker Disabled Refused Total
135 APPENDIX C-8 # OF HOUSEHOLD HEADS SHOPPED AT STORE TYPE IN RECALL PERIOD (HIGHEST TO LOWEST FREQUENCY) Whitchurch-Stouffville Total Markham Total Primary Trade Area Uxbridge + Pickering Part Sample Size PTA STA East STA South Store Type (#) (%) (#) (%) (#) (%) (#) (%) 80% - 100% of Respondents Shopped at: Supermarket / Superstore Incl. Costco (food) Major or Discount Department Store % - 80% of Respondents Shopped at: Drug or Discount Drug Store Home & Auto Supply / Canadian Tire/TSC % - 70% of Respondents Shopped at: HI: Lumber / Building Supply General Merchandise Including Costco No store type had a shopping frequency in the 40% - 60% range 30% - 40% of Respondents Shopped at: HI: Nursery / Garden Ctr Stationery of Office Supply Store Family Wear / Unisex Clothing % - 30% of Respondents Shopped at: Book Store or News Dealer Pet or Pet supply Store Specialty Food Store Shoe Store Hobby/Toy/Craft Store TV / Stereo / Electronics / Computer % - 20% of Respondents Shopped at: Men's or Ladies' Wear Store Sporting Goods Store Gift/Novelty/Greeting Card/Party Florist HI: Hardware/ Paint/Paper/Electrical/Plumbing Furniture / Appliance Store Lighting / Carpet / Interior Décor Telephone/Cell Phone/Vacuum/Sewing Machine Fewer than 10% of Respondents Shopped at: Fabric or Yarn Store Children's Wear Store Bath/Bedding/LinenStore Jewellery Store Camera or Photographic Supply Store TBA (Tires/Batteries/Accessories) Art Gallery/Artists' Supply Store China/Glassware/Kitchenware/Cutlery Musical Instrument & Supply Store Record / CD / Tape Store Luggage and Leather Goods Store Antiques Shop Clothing Accessories Store Total Purchases 7,678 3,649 2,320 1,709 Average Purchases per Respondent
136 APPENDIX C-9 HEAD OF HOUSEHOLD AVERAGE AMOUNT SPENT AT STORE TYPE IN RECALL PERIOD Whitchurch-Stouffville Uxbridge + Markham Total Sample Primary Trade Area Pickering (Part) Amount Spent PTA STA East STA South Store Type ($) (%) ($) (%) ($) (%) ($) (%) 80% - 100% of Respondents Shopped at: Supermarket / Superstore Incl. Costco (food) % % % % Major or Discount Department Store % % % % Subtotal % % % % 60% - 80% of Respondents Shopped at: Drug or Discount Drug Store % % % % Home & Auto Supply / Canadian Tire/TSC % % % % HI: Lumber / Building Supply % % % % General Merchandise Including Costco % % % % Subtotal % % % % Subtotal 60% - 100% of Respondents Shopped % % % % 30% - 40% of Respondents Shopped at: HI: Nursery / Garden Ctr % % % % Stationery of Office Supply Store % % % % Family Wear / Unisex Clothing % % % % Subtotal % % % % 20% - 30% of Respondents Shopped at: Book Store or News Dealer % % % % Pet or Pet supply Store % % % % Specialty Food Store % % % % Shoe Store % % % % Hobby/Toy/Craft Store % % % % TV / Stereo / Electronics / Computer % % % % Subtotal % % % % 10% - 20% of Respondents Shopped at: Men's or Ladies' Wear Store % % % % Sporting Goods Store % % % % Gift/Novelty/Greeting Card/Party % % % % Florist % % % % HI: Hardware/ Paint/Paper/Electrical/Plumbing % % % % Furniture / Appliance Store % % % % Lighting / Carpet / Interior Décor % % % % Telephone/Cell Phone/Vacuum/Sewing Machine % % % % Subtotal % % % % Fewer than 10% of Respondents Shopped at: Fabric of Yarn Store % % % % Children's Wear Store % % % % Bath/Bedding/Linen Store % % % % Jewellery Store % % % % Camera or Photographic Supply Store % % % % TBA (Tires/Batteries/Accessories) % % % % Art Gallery/Artists' Supply Store % % % % China/Glassware/Kitchenware/Cutlery % % % % Musical Instrument & Supply Store % % % % Record / CD / Tape Store % % % % Luggage and Leather Goods Store % % % % Antiques Shop % % % % Clothing Accessories Store % % % % Subtotal % % % % Total Amount Spent by Household Head ($) 9, % 8, % 9, % 11, %
137 NETWORK RESEARCH INFO RECHERCHE Toronto Montreal Contacts Report Timestamp: 10:29:38 AM, Jul/17/12 Study#: 3374 Topic: Stouffville Shopping Company: Contact: Scott Morgan OVERALL 1Not in the sample area 2Q.A - Not male/female head of household 3Q.B - No shopping in the last 3 months 4QUOTA FULL - MALE/FEMALE HEAD OF HOUSEHOLD 76 QUALIFIED RESPONDENT BREAK OFF 77 ILLNESS, INCAPABLE 78 BUSY 79 FAX/MODEM 80 HOUSEHOLD REFUSAL 81 LANGUAGE 84 BUSINESS/RESIDENTIAL 85 NO ANSWER 86 ANSWERING MACHINE 87 RESPONDENT REFUSAL 88 SELECTED/ELIGIBLE RESP. NOT AVAILABLE 89 NOT IN SERVICE 980 TOTAL NUMBERS ATTEMPTED 981 TOTAL ELIGIBLE NUMBERS 982 TOTAL ASKED 983 TOTAL CO-OPERATIVE CONTACTS 985 REFUSAL RATE 986 RESPONSE RATE 994 TOTAL QUALIFIED 995 TOTAL TERMINATES 996 AVG. LENGTH OF INTERVIEW 997 INCIDENCE (WITH QUAL REF) 998 INCIDENCE (WITHOUT QUAL REF) 999 COMPLETED INTERVIEW
138 1 No. (...) INTERVIEWER RECORD: 2012 Interview completed with: (Circle One) Quota Female head of 75% Male head of 25% Interviews To Be Completed In: Pop'n Pop'n (%) Quota Sample Areas Sample Area 1A - Community of Stouffville (Urban Area) 25, % 265 Sample Area 1B - balance of Whitchurch Stouffville 12, % 135 Subtotal Whitchurch-Stouffville 37, % 400 Sample Area 3A - Community of Uxbridge (Urban Area) 12, % 130 Sample Area 3B - Balance of Uxbridge South of Davis Dr. 4, % 50 Sample Area 3C - Balance of Uxbridge North of Davis Dr. 3, % 45 Sample Area 3D - Pickering North of Highway 7 2, % 25 Subtotal STA 22, % 250 Subtotal Stouffville Trade Area without Sample Area 2A (Markham) 60, % 650 Sample Area 2A - Markham N. of 16th Ave. + E. of Kennedy Rd. 48,158 Stand-alone 200 TOTAL SAMPLE 108, Mr. [ ] Mrs. [ ] Miss [ ] Phone: (First Name) (Surname) Address: Date: Community: Postal Code (6 digits): Nearest Lot & Concession Line: (Rural Residents Only) TOWN OF WHITCHURCH-STOUFFVILLE CONSUMER TELEPHONE EXPENDITURE SURVEY Time Time Started: [ ] A.M. Finished: [ ] A.M. [ ] P.M. [ ] P.M. SUPERVISOR: IF YOU HAVE CHECKED EACH PAGE, INITIAL HERE... Good I am calling on behalf of NETWORK RESEARCH, a market research company. Our firm has been retained by the Town of Whitchurch-Stouffville to conduct a survey of people's shopping habits, and I would like to ask you a few questions. A. Are you the female/male head of the household? (Circle One) IF NEITHER AVAILABLE, TERMINATE INTERVIEW AND RECORD. (Circle One) WATCH QUOTAS Female head of household Male head of household
139 2 B. In the LAST THREE MONTHS, have you done any shopping whatsoever? Yes... 1 (Go to 1(a)) No... 2 TERMINATE INTERVIEW & RECORD. 1(a) In just the PAST THREE MONTHS have you shopped at MAJOR OR DISCOUNT DEPARTMENT STORES such as The Bay, Sears, Zellers, or Wal-Mart, but excluding Sears Catalogue stores? Yes... 1 (Go to 1(b)) No... 2 SKIP TO QUESTION 2(a) FOR EACH STORE RESPONSE, ASK Q.1(b) AND Q.1(c) TOGETHER. 1(b) What is the name of the department store or stores and where is it located? Just give me the name of the shopping centre or two closest intersecting streets as well as the community in which it is located. (CIRCLE APPROPRIATE CODE(S) BELOW OR SPECIFY) 1(c) During the PAST THREE MONTHS, approximately how much did you spend at (NAME OF STORE)? Qu. 1(b) Qu. 1(b) Qu. 1 (c) Name Location Code Amount Spent Wal-Mart Stouffville - Hwy. 48 (Markham Rd.) and Hoover Park Dr. - Stouffville Gateway Centre -1- $... Wal-Mart Uxbridge - Toronto St. & Welwood Dr. -2- $... Wal-Mart Pickering - Hwy. 401 & Brock Rd. North -3- $... Wal-Mart Markham - Markville Shopping Centre (Hwy. 7 & McCowan Rd.) -4- $... Wal-Mart Richmond Hill - Major Mackenzie Dr. & Bayview Ave. -5- $... Wal-Mart Aurora - SmartCentres' Power Centre (Hwy. 404 & Wellington St.) -6- $... Wal-Mart Newmarket - Hwy. 11 (Yonge St.) & Green Lane -7- $... Wal-Mart Vaughan (Maple) - Hwy. 400 & Hwy $... Wal-Mart -9- $... Wal-Mart -10- $... Zellers Richmond Hill - Hillcrest Mall (Yonge St. & Carrville Rd.) -11- $... Zellers Aurora - Bayview Ave. & Wellington St.) -12- $... Zellers Newmarket - Upper Canada Mall - Hwy. 11 (Yonge St.) & Davis Dr $... Zellers Newmarket Town Centre - Leslie St. & Davis Dr $... Zellers -15- $... Zellers -16- $... Sears Markham - Markville Shopping Centre (Hwy. 7 & McCowan Rd.) -17- $... Sears Pickering - Pickering Town Centre (Kingston Rd. & Liverpool Rd.) -18- $... Sears Newmarket - Upper Canada Mall - Hwy. 11 (Yonge St.) & Davis Dr $... Sears -20- $... The Bay Markham - Markville Shopping Centre (Hwy. 7 & McCowan Rd.) -21- $... The Bay Pickering - Pickering Town Centre (Kingston Rd. & Liverpool Rd.) -22- $... The Bay Newmarket - Upper Canada Mall - Hwy. 11 (Yonge St.) & Davis Dr $... The Bay Richmond Hill - Hillcrest Mall (Yonge St. & Carrville Rd.) -24- $... The Bay -25- $... OTHER (PLEASE SPECIFY) $ $...
140 3 1(d) Have you shopped at any other MAJOR or DISCOUNT DEPARTMENT STORE in the past THREE MONTHS (NAME OF STORE)? IF YES, REPEAT QUESTION 1b) to 1 c) AS OFTEN AS NECESSARY. IF NO, GO TO QUESTION 2a). 2(a) In just the PAST THREE MONTHS, have you shopped at any GENERAL MERCHANDISE STORE, such as a dollar store, a general store, Giant Tiger, Stedmans, The Bargain Shop, or a Sears Catalogue or Dealer store, including any NON-FOOD SHOPPING at Costco? Yes... 1 (Go to Q.2(b) No... 2 SKIP TO QUESTION 3(a) FOR EACH STORE RESPONSE, ASK Q.2(b) AND Q.2(c) TOGETHER. 2(b) 2(c) What is the name of the store or stores, and where is it located? Just give me the name of the shopping centre or the name of the community in which it is located. During the PAST THREE MONTHS, approximately how much did you spend at (NAME OF STORE)? Qu. 2(b) Qu. 2(b) Circle Qu. 2(c) Name Location Code Amount Spent (PLEASE SPECIFY) Giant Tiger Stouffville Main St. & West St. -1- $... Mighty Bucks Stouffville Ringwood Plaza -2- $ $... OTHER (PLEASE SPECIFY) $ $... COSTCO (Non-Food Only) -17- $... 3(a) In just the PAST THREE MONTHS have you shopped at any of the following CLOTHING, CLOTHING ACCESSORIES, SHOE, JEWELLERY, or LUGGAGE and LEATHER GOODS stores? i) A men's or ladies' wear Yes... 1 GO TO Q.3(b store? No... 2 SKIP TO (ii) ii) A family wear or unisex Yes... 1 GO TO Q.3(b apparel store? No... 2 SKIP TO (iii) iii) A children's wear store? Yes... 1 GO TO Q.3(b No... 2 SKIP TO (iv) iv) A shoe store? Yes... 1 GO TO Q.3(b No... 2 SKIP TO (v) v) A jewellery store? Yes... 1 GO TO Q.3(b No... SKIP TO (vi) vi) A clothing accessories store such as a handbag, Yes... 1 GO TO Q.3(b hosiery, hat, scarf, tie, glove or umbrella store? No... SKIP TO (vii) vii) A luggage and leather goods store? Yes... 1 GO TO Q.3(b No... SKIP TO 4(a)
141 FOR EACH STORE RESPONSE, ASK Q.3(b) and Q.3(c) TOGETHER 4 3(b) 3(c) What is the name of the store or stores and where is it located? During the PAST THREE MONTHS, approximately how much did you spend at (NAME OF STORE)? Q. 3(b) Q. 3(b) Q. 3(c) Name Location Code Amount Spent (PLEASE SPECIFY) -1- $ $ $ $ $ $... OTHER (PLEASE SPECIFY) $ $... 4(a) During the PAST THREE MONTHS, have you shopped at any of the following SPECIALTY STORES? i) A stationery or office supply store? Yes... 1 GO TO Q.4(b No... 2 SKIP TO (ii) ii) A book store or news dealer? Yes... 1 GO TO Q.4(b No... 2 SKIP TO (iii) iii) A record, CD, or tape store? Yes... 1 GO TO Q.4(b No... 2 SKIP TO (iv) iv) A camera or photography supply store? Yes... 1 GO TO Q.4(b No... 2 SKIP TO (v) v) A gift, novelty, greeting card, or party supply Yes... 1 GO TO Q.4(b store? No... SKIP TO (vi) vi) A sporting goods store Yes... 1 GO TO Q.4(b (excluding athletic clothing)? No... 2 SKIP TO (vii) vii) A hobby, toy or crafts store? Yes... 1 GO TO Q.4(b No... 2 SKIP TO (viii) viii) An art gallery or artists supply store? Yes... 1 GO TO Q.4(b No... 2 SKIP TO (ix) ix) A musical instrument and supply store? Yes... 1 GO TO Q.4(b No... 2 SKIP TO (x) x) A pet or pet supply store? Yes... 1 GO TO Q.4(b No... 2 SKIP TO (xi) xi) A fabric or yarn store? Yes... 1 GO TO Q.4(b No... 2 SKIP TO (xii) xii) A florist Yes... 1 GO TO Q.4(b No... 2 SKIP TO 5(a) FOR EACH STORE RESPONSE, ASK Q.4(b) and Q.4(c) TOGETHER
142 5 4(b) 4(c) What is the name of the store or stores and where is it located? During the PAST THREE MONTHS, approximately how much did you spend at (NAME OF STORE)? Q. 4(b) Q. 4(b) Q. 4(c) Name Location Code Amount Spent (PLEASE SPECIFY) -1- $ $ $ $ $... OTHER (PLEASE SPECIFY) $ $... 5(a) During the PAST SIX MONTHS, have you shopped at any of the following HOME FURNISHINGS & HOME DECOR STORES i) A furniture store, warehouse or Yes... 1 GO TO Q.5(b appliance store? No... 2 SKIP TO (ii) ii) A TV, stereo, electronics or Yes... 1 GO TO Q.5(b computer store? No... 2 SKIP TO (iii) iii) A lighting, carpet or other Yes... 1 GO TO Q.5(b interior decorating store? No... 2 SKIP TO (iv) iv) A china, glassware, kitchenware, Yes... 1 GO TO Q.5(b or cutlery store? No... 2 SKIP TO (v) v) A bath, bedding or linen shop? Yes... 1 GO TO Q.5(b No... SKIP TO (vi) vi) A telephone, cell phone, vacuum Yes... 1 GO TO Q.5(b cleaner or sewing machine shop? No... 2 SKIP TO (vii) vii) An antiques shop? Yes... 1 GO TO Q.5(b No... SKIP TO 6(a) FOR EACH STORE RESPONSE, ASK Q.5(b) and Q.5(c) TOGETHER 5(b) 5(c) What is the name of the store or stores and where is it located? During the PAST SIX MONTHS, approximately how much did you spend at (NAME OF STORE)? Q. 5(b) Q. 5(b) Q. 5(c) Name Location Code Amount Spent (PLEASE SPECIFY) -1- $ $ $...
143 -5- $ $ $ $ $ $... OTHER (PLEASE SPECIFY) $ $ (a) During the PAST THREE MONTHS, have you shopped at any of the following HOME IMPROVEMENT, PAINT, WALLPAPER, and HARDWARE STORES (NOTE: Include Lumber Yards and Home Improvement Centres) i) A Home Improvement Centre or Lumber Yes... 1 GO TO Q.5(b Yard or Building Material store? No... 2 SKIP TO (ii) ii) A hardware, paint and paper, glass, electrical Yes... 1 GO TO Q.5(b supply or plumbing store? No... 2 SKIP TO (iii) iii) A nusery or garden centre? Yes... 1 GO TO Q.5(b No... 2 SKIP TO 7(a) FOR EACH STORE RESPONSE, ASK Q.5(b) and Q.5(c) TOGETHER 6(b) 6(c) What is the name of the store or stores and where is it located? During the PAST THREE MONTHS, approximately how much did you spend at (NAME OF STORE)? Q. 6(b) Q. 6(b) Q. 6(c) Name Location Code Amount Spent (PLEASE SPECIFY) Stouffville Schell Ace Building Centre S. Side Main, E. of Edward -1- $... Whitchurch-Stouffville Ratcliffe Lumber Gormley - Hwy. 8 N. of Stouffville Rd. -2- $... Markham Home Depot - Markham Rd. & 14th Ave. -3- Markham Home Depot - Woodbine Ave. & Hwy $... Markham Home Depot - Hwy. 48 near Major Mackenzie -5- $ $... OTHER (PLEASE SPECIFY) $ $... 7(a) During the PAST THREE MONTHS, have you shopped at a HOME & AUTO SUPPLY STORE such as CANADIAN TIRE or TSC (Tractor Supply Company) or a TIRE, BATTERY & ACCESSORIES store such as a muffler, auto glass, or oil and lube shop? i) A Home & Auto Supply store such as Yes... 1 GO TO Q.7(b Canadian Tire or TSC? No... 2 SKIP TO (iii) ii) A Tire, Battery, or Automotive Specialty store Yes... 1 GO TO Q.7(b such as a muffler, auto glass, or oil and lube shop? No... 2 SKIP TO 8(a) Q. 7(b) Q. 7(b) Q. 7(c)
144 7 Name Location Code Amount Spent (PLEASE SPECIFY) i) Stouffville Canadian Tire Hwy 48 & Hoover Park Dr. -1- $... i) Uxbridge Canadian Tire Toronto Rd. & 6th Concession -2- $... i) Stouffville UAP/NAPA S. of Main St. E. of Hwy $... i) Richmond Hill Canadian Tire -4- $... i) Markham Canadian Tire -5- $... i) Aurora Canadian Tire -6- $... ii) Newmarket Canadian Tire -7- $... ii) TSC Store -8- $... ii) TSC Store -9- $... ii) TSC Store -10- $... iii) Other -11- $... iii) Other -12- $... iii) Other -13- $... OTHER (PLEASE SPECIFY) $ $... 8(a) In the PAST MONTH, have you shopped for Food at a SUPERMARKET, SUPERSTORE or COSTCO? Yes... 1 GO TO Q.8(b) No... 2 SKIP TO 9(a) IF YES, ASK Q.6(b) and Q.6(c) TOGETHER 8(b) 8(c) What is the name of the store or stores, and where is it located? (CIRCLE THE APPROPRIATE CODE(S) OR SPECIFY BELOW) During the PAST MONTH, approximately how much did you spend at (NAME OF STORE)? Qu. 8(b) Qu. 8(b) Qu. 8(c) Name Location Code Amount Spent Stouffville No Frills Main & 9th Line -1- $... A&P Main & Sandale Rd. -2- $... Wal-Mart Hwy 48 & Hoover Park Dr. -3- $... Uxbridge Zehrs Toronto Rd. & Welwood Dr. -4- OTHER (PLEASE SPECIFY) -5- $ $ $ $ $ $... COSTCO (Food Only) -8- $... $...
145 8 9(a) In just the PAST MONTH, have you shopped in a SPECIALTY FOOD store such as a convenience store, jug milk store, bakery, meat market, delicatessen or a fruit or vegetable store? Yes... 1 GO TO Q.9(b) No... 2 SKIP TO 10(a) FOR EACH STORE RESPONSE, ASK Q.9(b) and Q.9(c) TOGETHER 9(b) 9(c) What is the name of the store or stores, and where is it located? During the PAST MONTH, approximately how much did you spend at (NAME OF STORE)? Qu. 9(b) Qu. 9(b) Qu. 9(c) Name Location Code Amount Spent (PLEASE SPECIFY) Stouffville Historic Downtown -1- $... Western Approach Area (Main Street W. of Downtown) -2- $... Hwy 48 & Hoover Park Dr. -3- Uxbridge -4- $ $ $... Other -7- $ $ $ $... OTHER (PLEASE SPECIFY) $ $ $... 10(a) In just the PAST MONTH, have you shopped at a DRUG OR DISCOUNT DRUG STORE? FOR EACH STORE RESPONSE, ASK 10(b) and 10(c) TOGETHER Yes... 1 GO TO Q.10(b) No... 2 SKIP TO BASIC DATA 10(b) 10(c) What is the name of the store or stores, and where is it located? During the PAST MONTH, approximately how much did you spend at (NAME OF STORE)? Qu. 10(b) Qu. 10(b) Qu. 10(c) Name Location Code Amount Spent (PLEASE SPECIFY) Stouffville IDA Drugs Main St. N. Side -1- $... Shoppers Drug Mart Stouffville Place Mall Main St. N. Side -2- $... Houston Pharmacy Main St. N. Side $ $ $...
146 OTHER (PLEASE SPECIFY) $ $ $... 9 BASIC DATA Finally, these last questions will help us classify your answers and compare them with others we get in this survey. A. How many people are living in your home? (CIRCLE ONE) (or more) 8 (refused) B. In which of the following age groups are you? (READ LIST & CIRCLE ONE) Under or 65 & over...6 Refused (DO NOT READ)...7 C. Are you... (READ LIST) Employed full time outside the home?...1 Employed part time outside the home?...2 Unemployed...3 Retired...4 Student...5 Homemaker...6 Other (Specify)...7 THANK YOU VERY MUCH FOR YOUR CO-OPERATION.
147 APPENDIX D LICENCE PLATE SURVEYS D-1
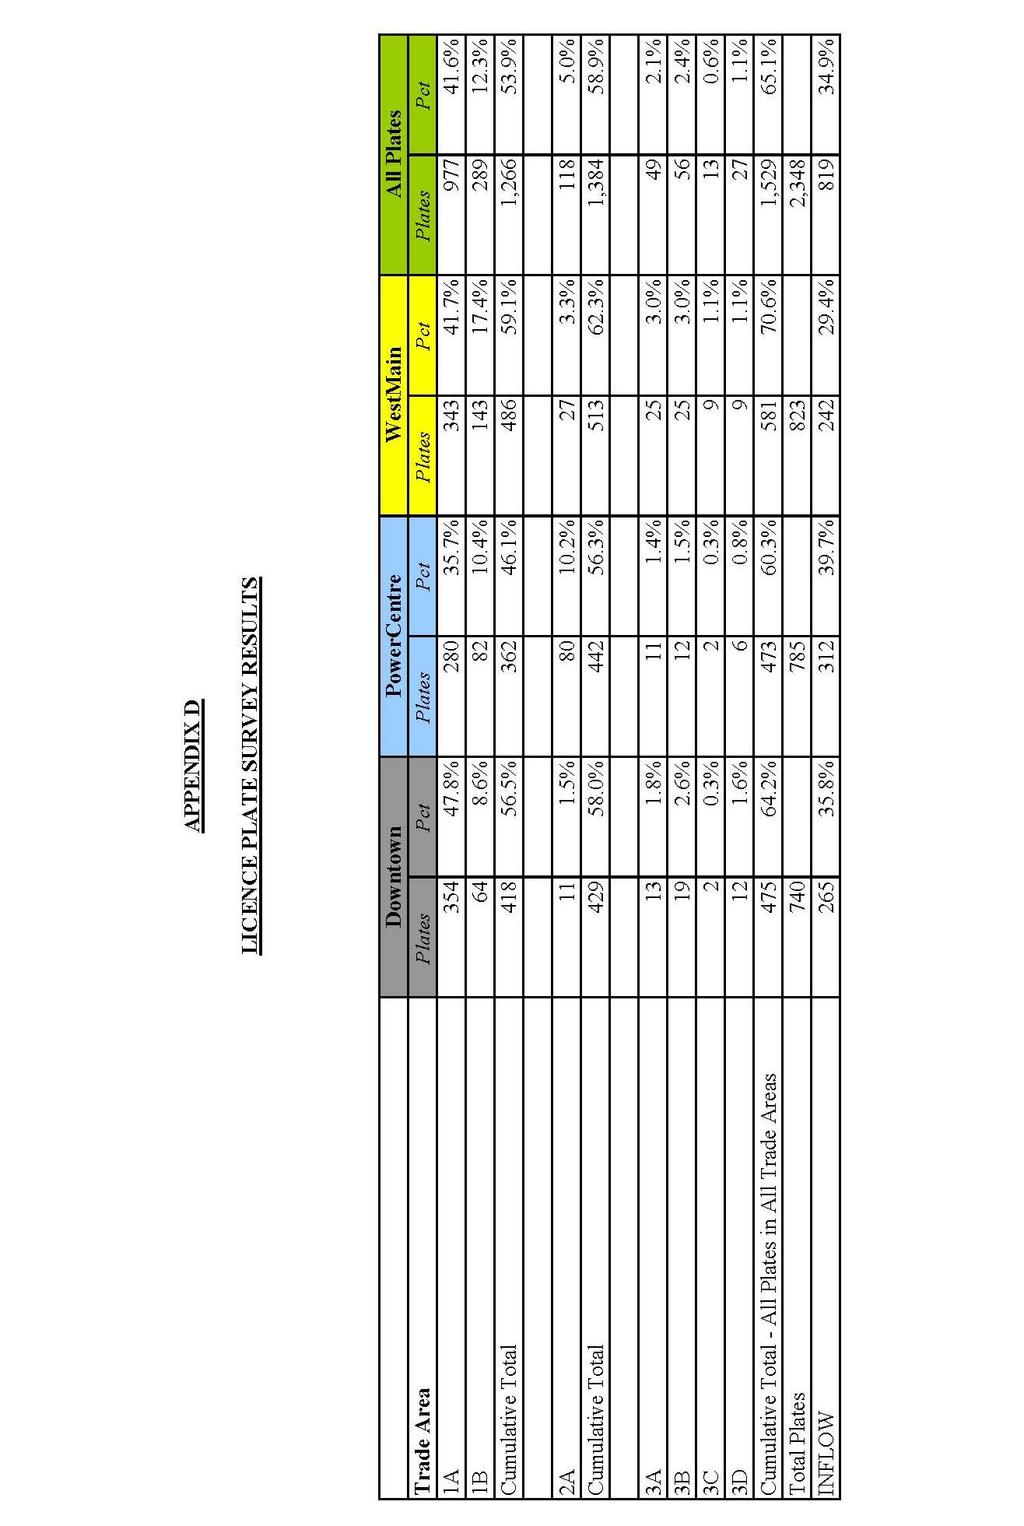
148 D-2
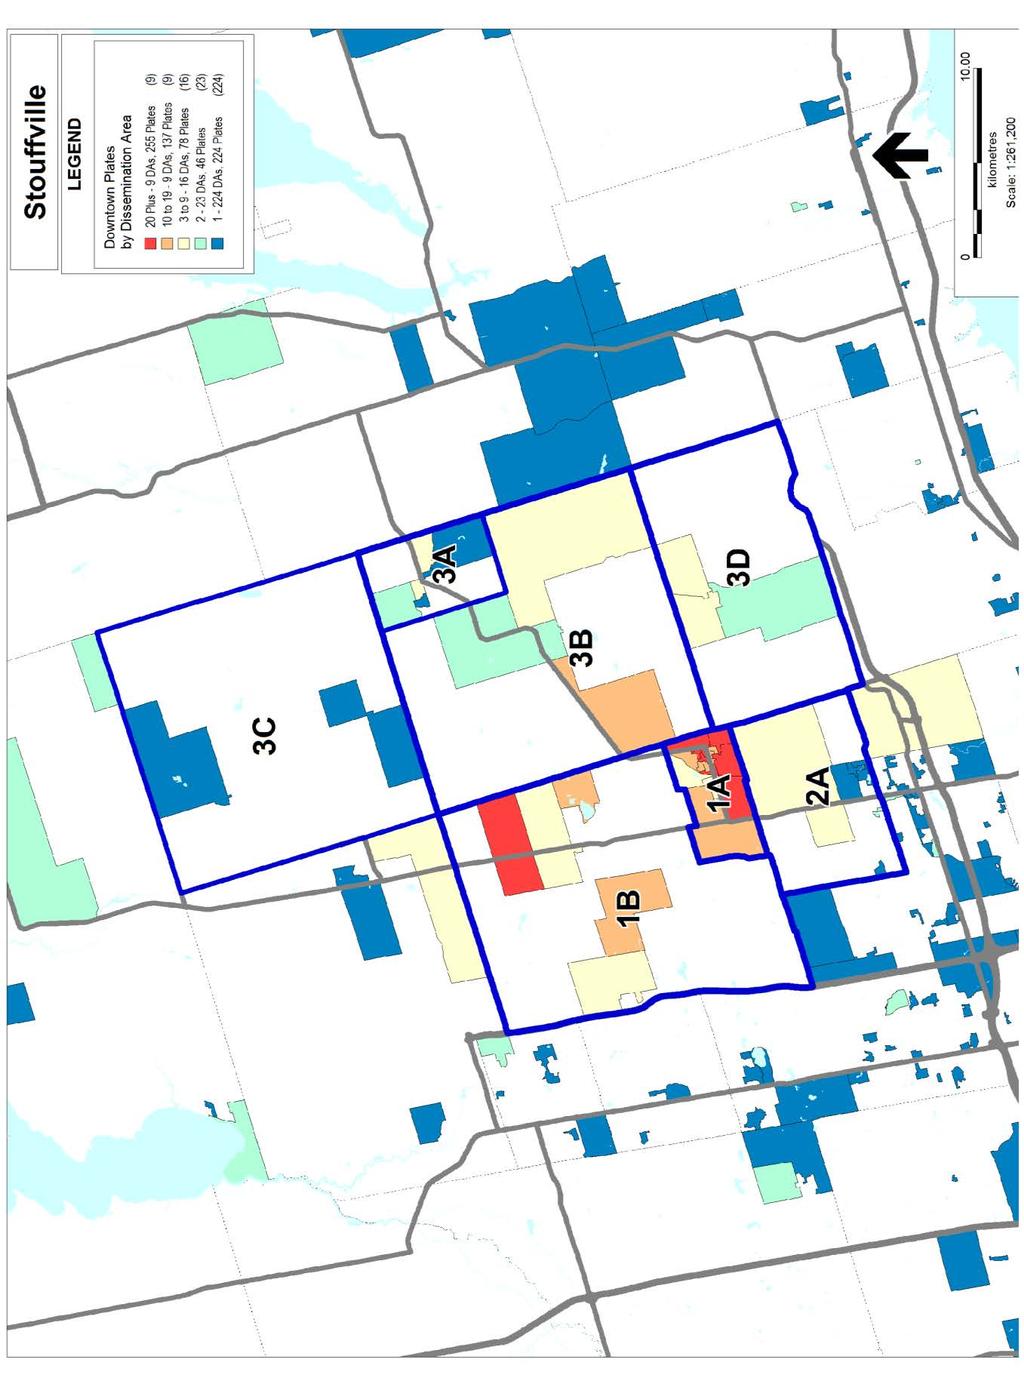
149 D-3
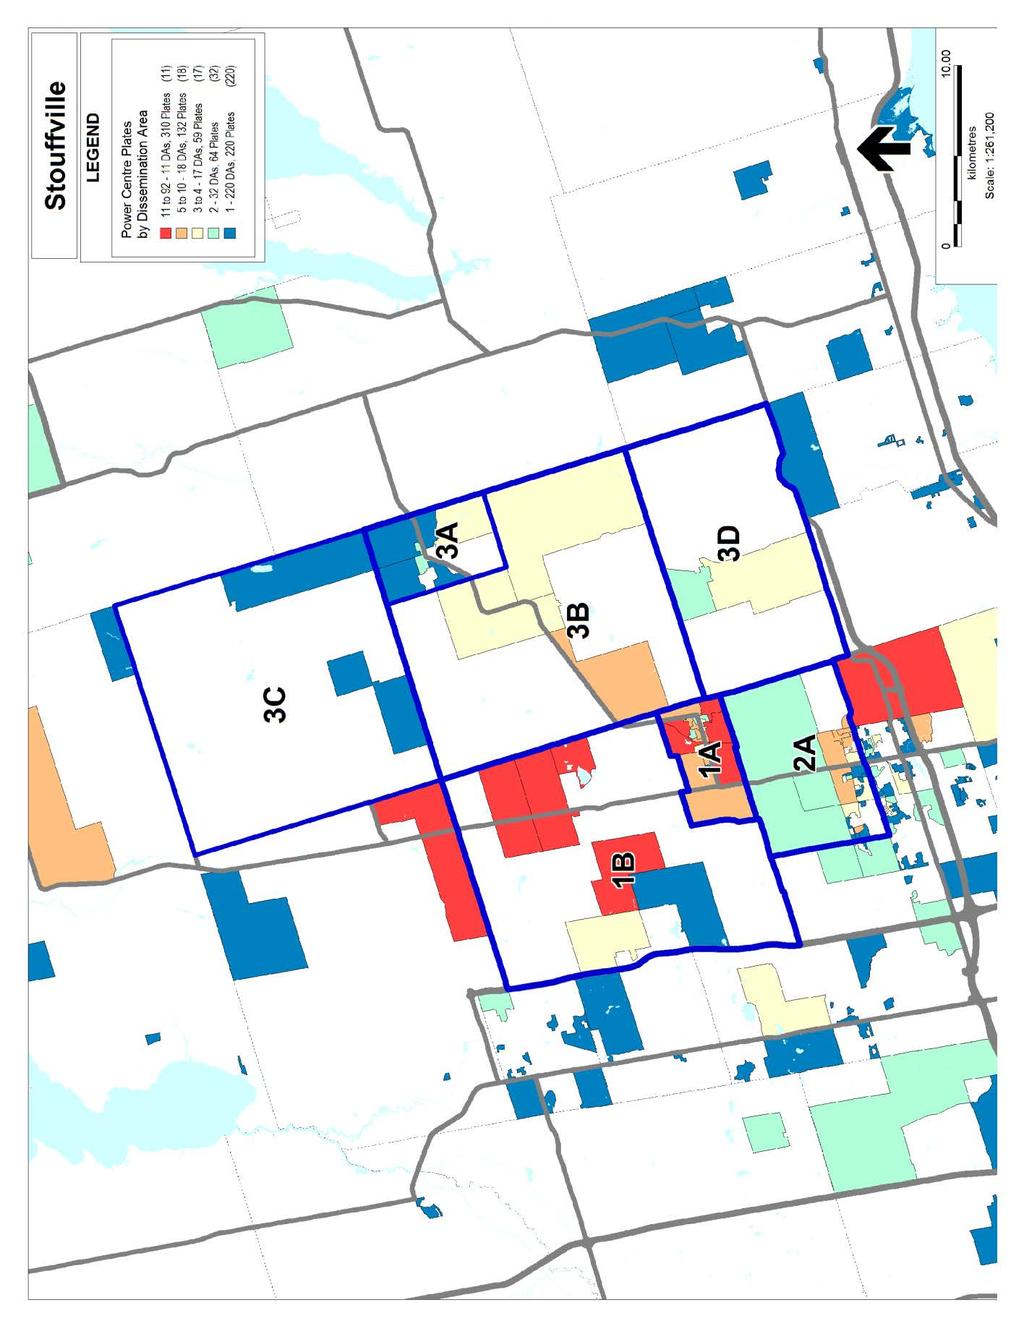
150 D-4
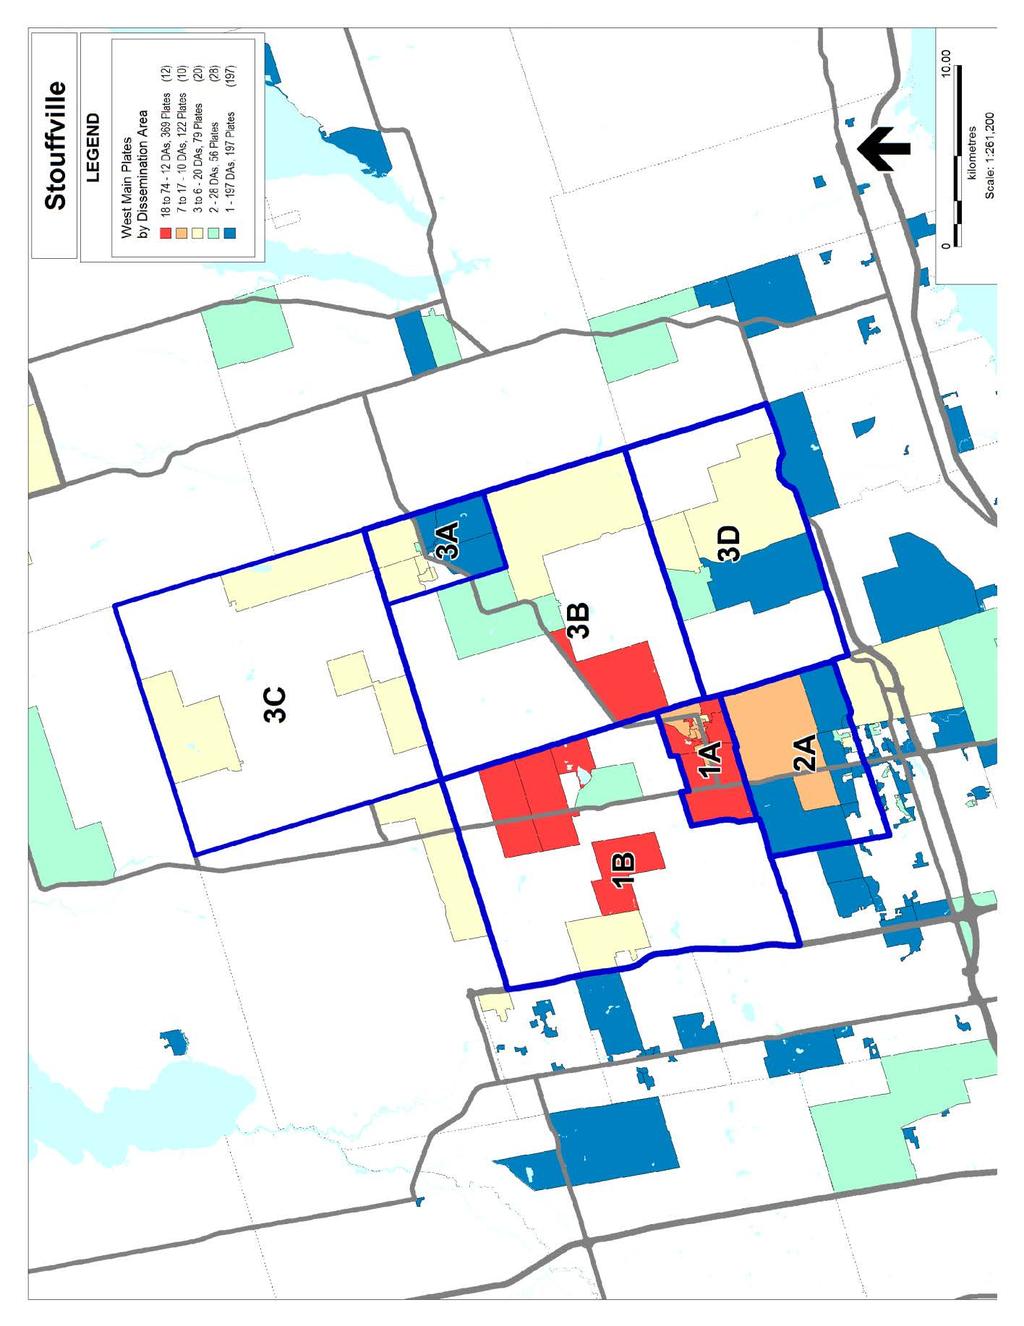
151 D-5
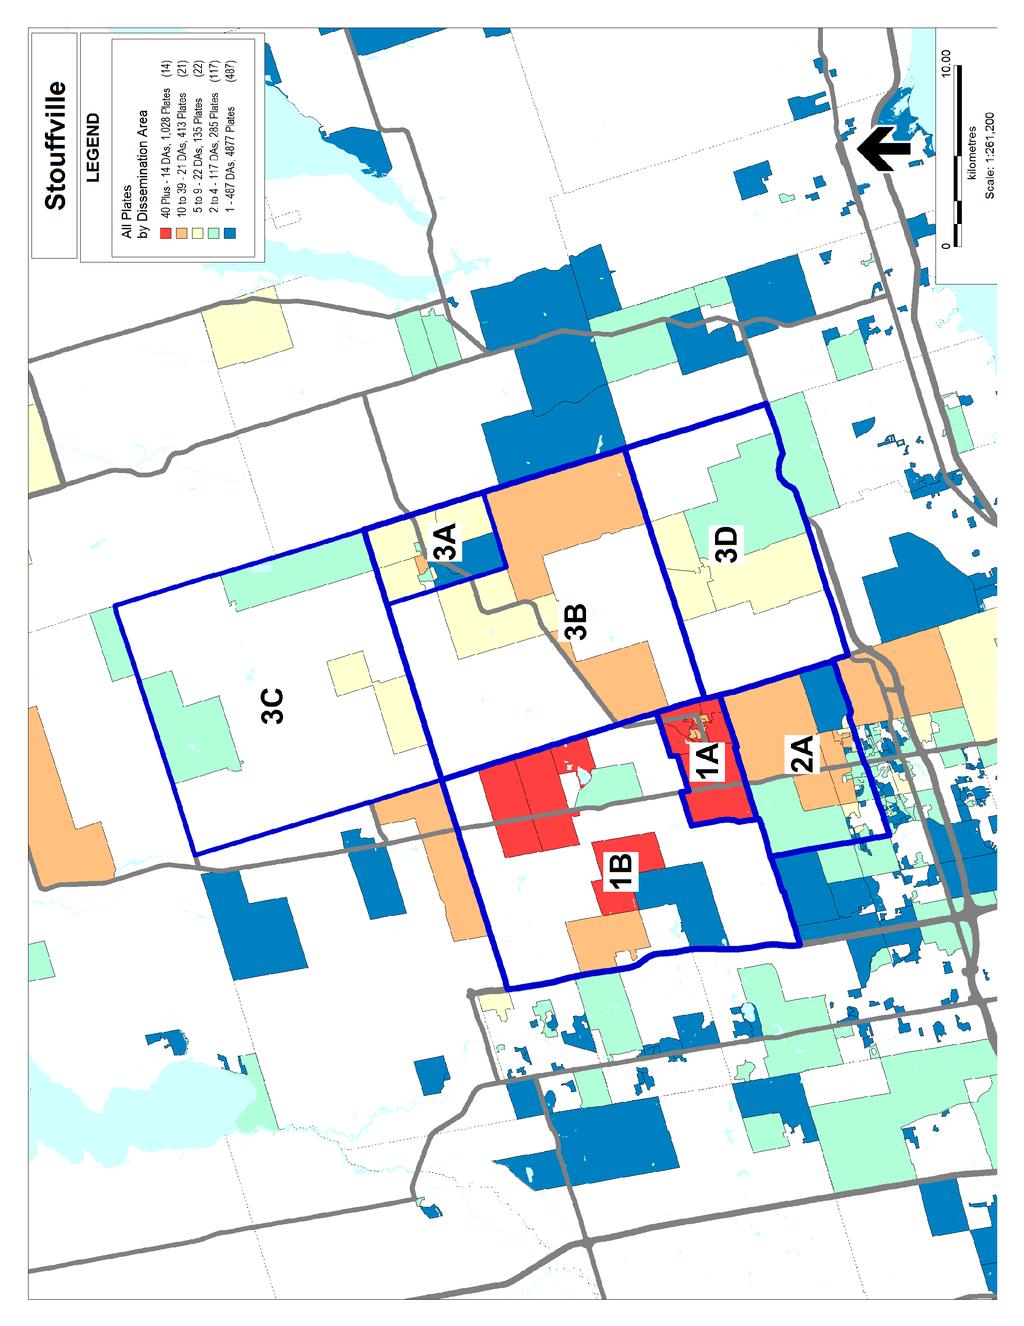
152 D-6
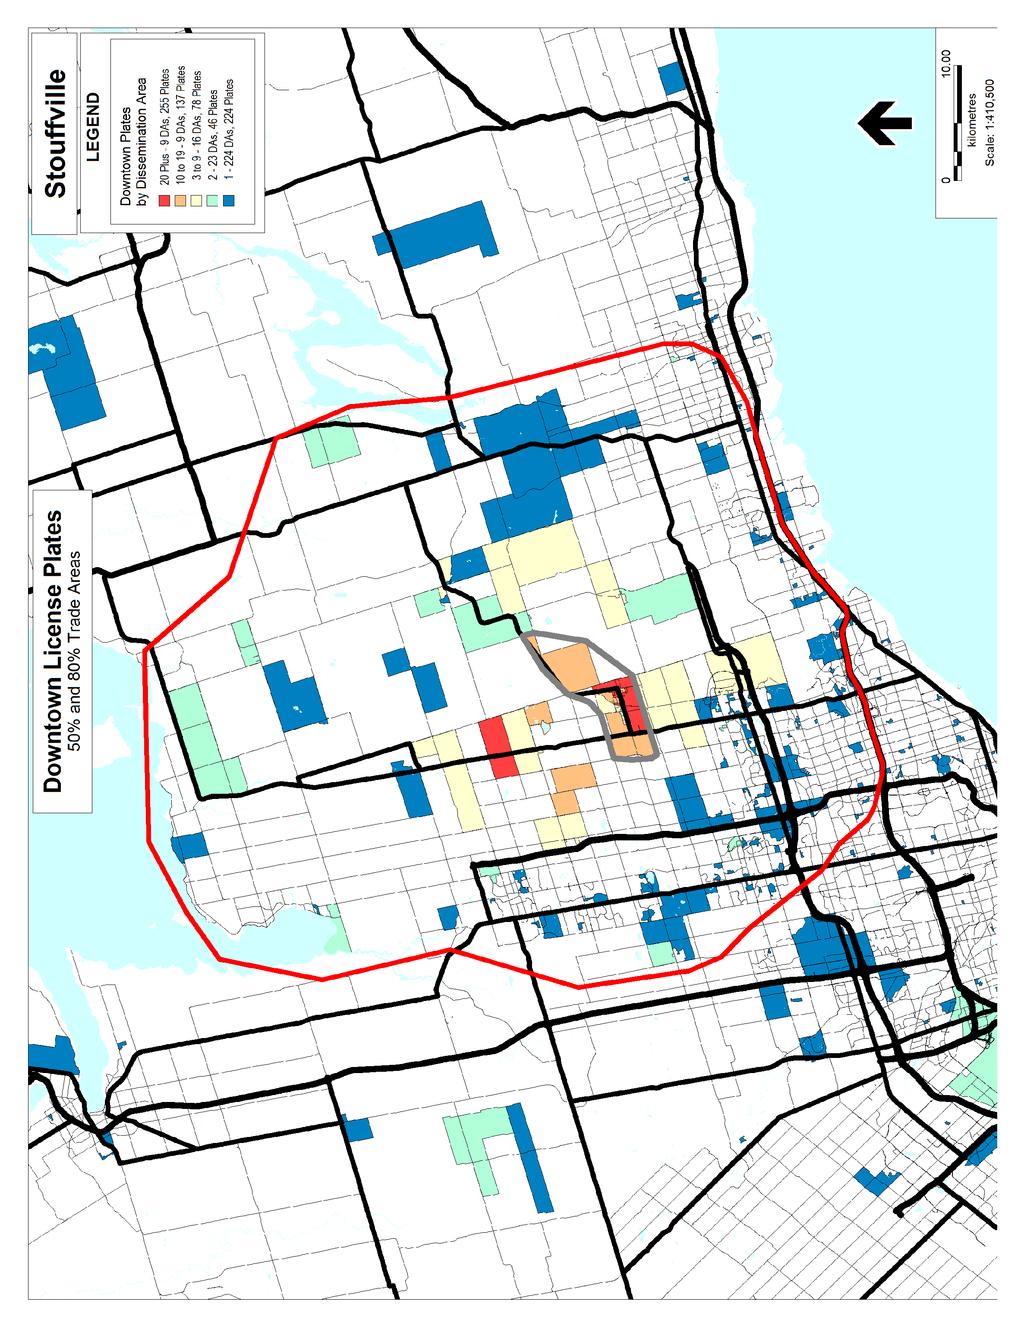
153 D-7
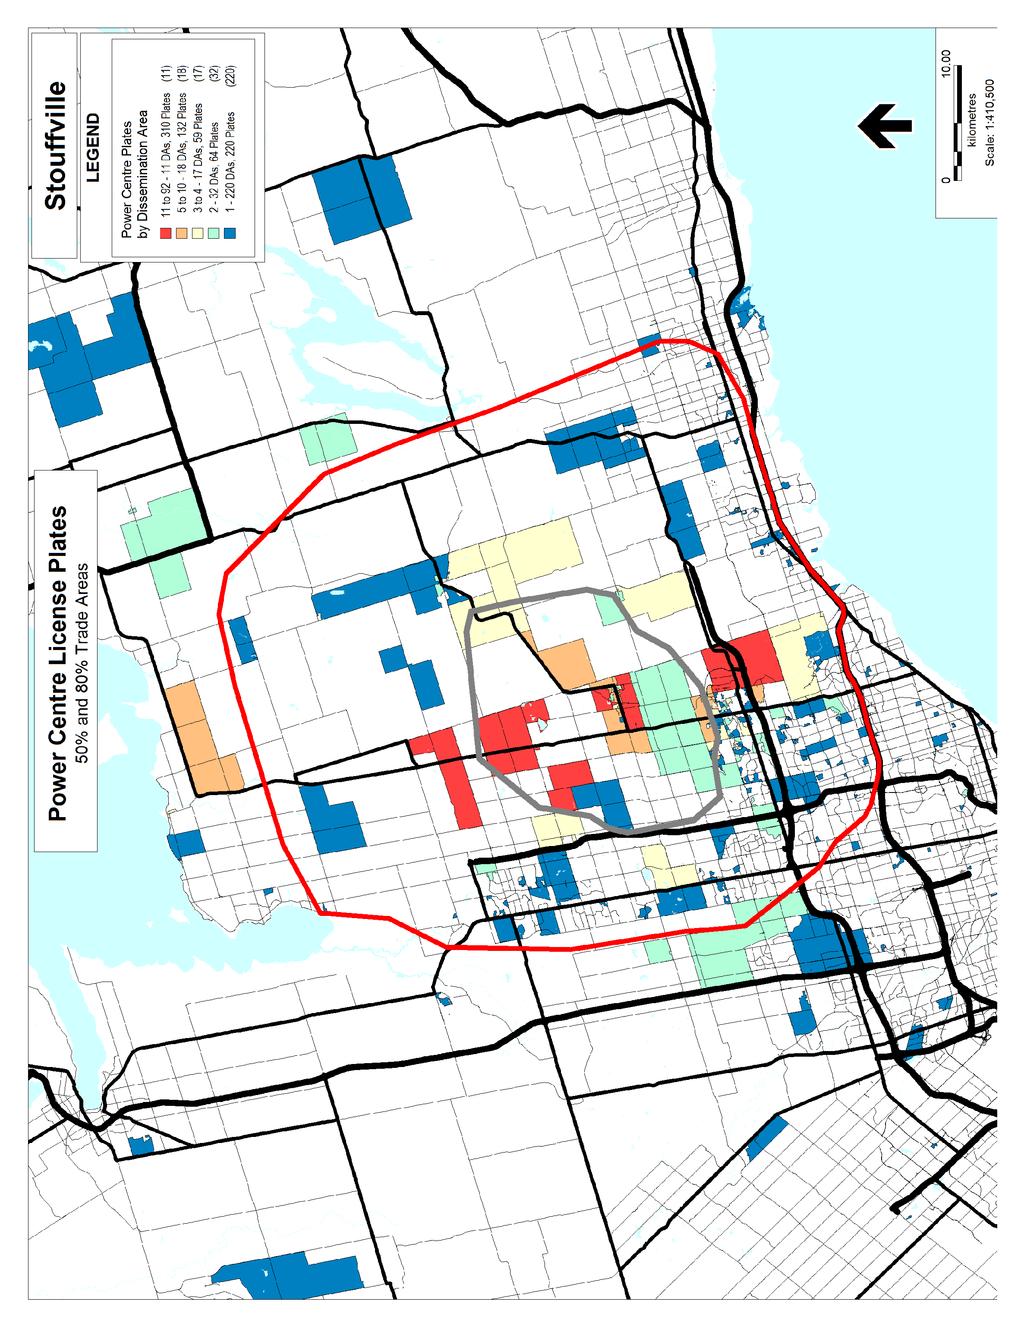
154 D-8
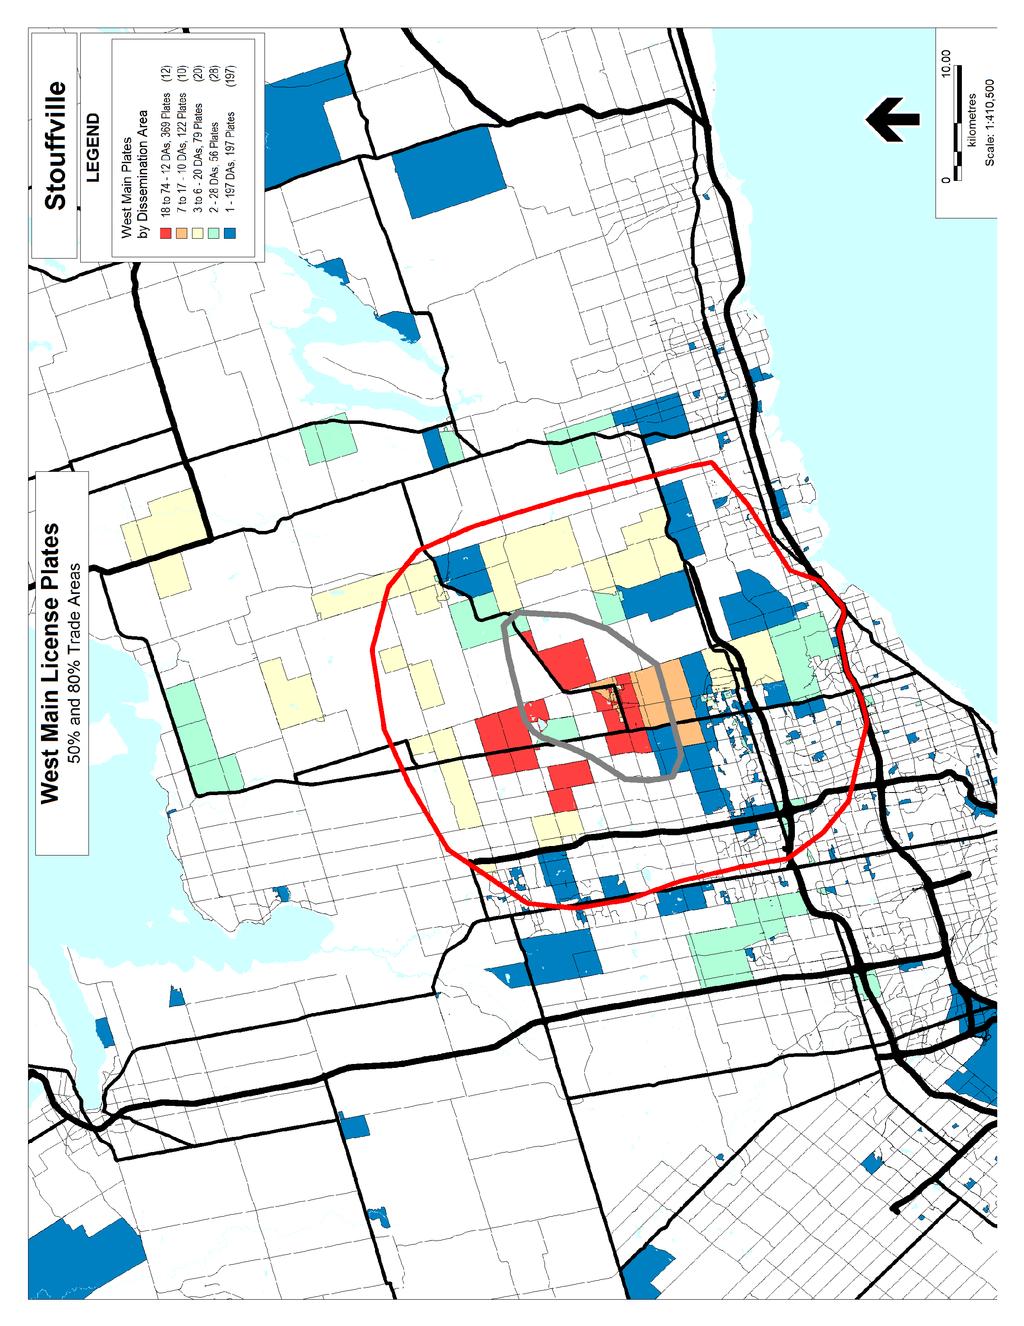
155 D-9
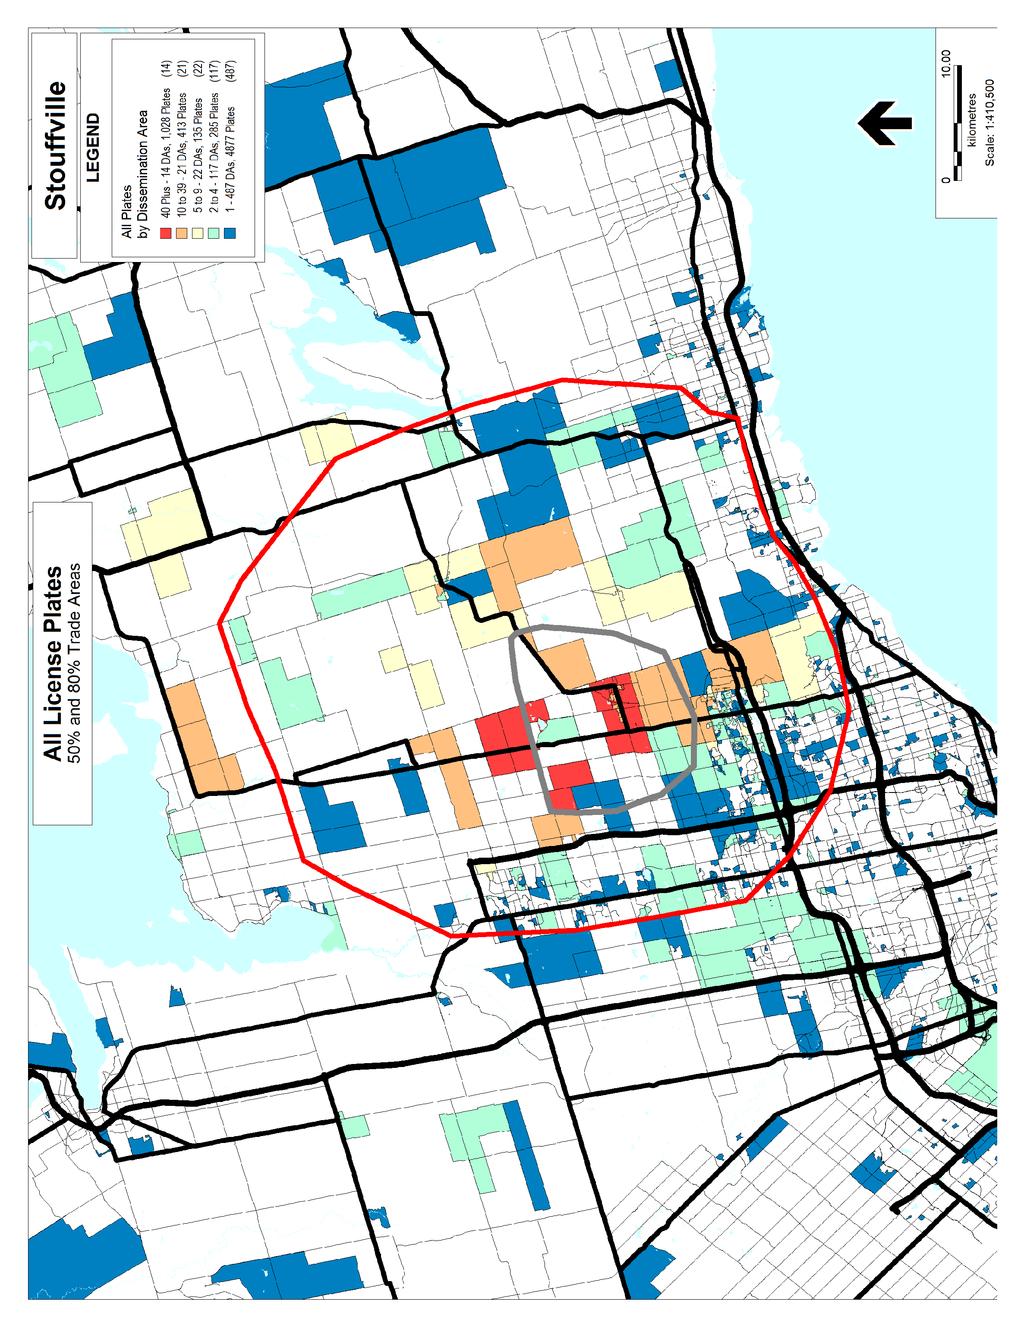
156 D-10
1499 Easton Road 1499 Easton Road, Kintnersville, PA 18930
 1499 Easton Road 1499 Easton Road, Kintnersville, PA 18930 Joseph Leone Coldwell Banker 686 Dekalb Pike,Blue Bell, PA 19422 jfleone1@gmail.com (610) 551-5830 License: AB066230 1499 Easton Road $350,000
Available +/- 26 Acres of Land Peachtree Industrial Boulevard & North Price Road Sugar Hill, Gwinnett County, GA 30518
 Available +/- 26 Acres of Land Peachtree Industrial Boulevard & North Price Road Sugar Hill, Gwinnett County, GA 30518 Located between Peachtree Industrial Blvd and North Price Rd The Jordan Company Rob
CITY OF ALPHARETTA DOWNTOWN MASTER PLAN TRAFFIC EVALUATION
 CITY OF ALPHARETTA DOWNTOWN MASTER PLAN TRAFFIC EVALUATION June 2015 CITY OF ALPHARETTA DOWNTOWN MASTER PLAN TRAFFIC EVALUATION Introduction The Alpharetta Downtown Master Plan was developed in the fall
OAKRIDGE CENTRE RETAIL IMPACT ASSESSMENT
 OAKRIDGE CENTRE RETAIL IMPACT ASSESSMENT Coriolis Consulting Corp. and Site Economics Ltd. June 2013 Objectives 1. Evaluate risk of material decline in viability of existing commercial locations in City
MEETING Agenda. Introductions. Project Overview. Key Study Components. Alternative Station Concepts. Preferred Station Concept. Next Steps.
 City GARLAND Council ROADVISION Briefing STUDY VISION STUDY Dallas, TX April 8, 2010 1 1 MEETING Agenda Introductions Project Overview Key Study Components Alternative Station Concepts Preferred Station
The Future of Retailing in Canada to 2018
 Comprehensive data overview of the market, with retail sales value and forecasts to 2018 Report Code: RT0191MR Report Price: US$4,950 (Single Copy) www.conlumino-winesandspirits.com Summary The Future
Exhibit 1 PLANNING COMMISSION AGENDA ITEM
 Exhibit 1 PLANNING COMMISSION AGENDA ITEM Project Name: Grand Junction Circulation Plan Grand Junction Complete Streets Policy Applicant: City of Grand Junction Representative: David Thornton Address:
The Future of Retailing in Norway to 2018
 Comprehensive data overview of the market, with retail sales value and forecasts to 2018 Report Code: RT0197MR Report Price: US$4,950 (Single Copy) www.conlumino-winesandspirits.com Summary The Future
The Future of Retailing in the Philippines to 2018
 Comprehensive data overview of the market, with retail sales value and forecasts to 2018 Report Code: RT0185MR Report Price: US$4,950 (Single Copy) www.conlumino-winesandspirits.com Summary "The Future
Appendix 1 Transit Network Analysis
 Appendix 1 Transit Network Analysis APPENDIX 1 TRANSIT NETWORK ANALYSIS The purpose of this appendix is to provide an update on the transit network analysis as it pertains to: i. SmartTrack ii. Scarborough
Oakridge Centre Retail Impact Assessment
 Oakridge Centre Retail Impact Assessment Draft June 2013 Prepared for: City of Vancouver By: Coriolis Consulting Corp. Site Economics Ltd. Table of Contents Summary... 1 1.0 Introduction... 2 1.1 Background...
ADOT Statewide Bicycle and Pedestrian Program Summary of Phase IV Activities APPENDIX B PEDESTRIAN DEMAND INDEX
 ADOT Statewide Bicycle and Pedestrian Program Summary of Activities APPENDIX B PEDESTRIAN DEMAND INDEX May 24, 2009 Pedestrian Demand Index for State Highway Facilities Revised: May 29, 2007 Introduction
Transportation Master Plan Advisory Task Force
 Transportation Master Plan Advisory Task Force Network Alternatives & Phasing Strategy February 2016 BACKGROUND Table of Contents BACKGROUND Purpose & Introduction 2 Linking the TMP to Key Council Approved
University of Victoria Campus Cycling Plan Terms of Reference. 1.0 Project Description
 University of Victoria Campus Cycling Plan Terms of Reference 1.0 Project Description The Campus Cycling Plan, a first for the University, will provide a comprehensive and coordinated approach to support
OPEN HOUSE WELCOME Bronte Village Growth Area Review
 OPEN HOUSE WELCOME Bronte Village Growth Area Review Bronte Village is a growth area. Learn more! Introduction Bronte Village is a growth area. What is that? Bronte Village is one of six growth areas identified
Appendix C. Corridor Spacing Research
 Appendix C. Corridor Spacing Research Task 3 of the Twin Cities Bicycle Study called for the development of bicycle corridor spacing guidelines. This section summarizes research of the spacing of planned
Midtown Corridor Alternatives Analysis
 Midtown Corridor Alternatives Analysis Ridership Forecast Methodology and Results December 2013 Prepared by the SRF Consulting Group Team for Table of Contents Introduction... 1 Methodology... 1 Assumptions...
Standing Committee on Policy and Strategic Priorities. Mount Pleasant Industrial Area Parking Strategy and Access Improvements
 POLICY REPORT Report Date: April 23, 2018 Contact: Lon LaClaire Contact No.: 604.873.7722 RTS No.: 9944 VanRIMS No.: 08-2000-20 Meeting Date: May 16, 2018 TO: FROM: SUBJECT: Standing Committee on Policy
MOUNT CLEMENS, MICHIGAN
 Prepared For: Mount Clemens Downtown Development Authority Downtown District Plan MOUNT CLEMENS, MICHIGAN Prepared By: Michigan State University Practicum Josh Croff Emily Gehle Justin Habalewsky Daniel
4 Ridership Growth Study
 Clause 4 in Report No. 15 of Committee of the Whole was adopted, without amendment, by the Council of The Regional Municipality of York at its meeting held on November 16, 2017. 4 Ridership Growth Study
Additional Policies & Objectives for Local Area Plans Ashbourne LAP. Ashbourne
 Ashbourne Strategic Policies SP 1 To operate an Order of Priority for the release of residential lands in compliance with the requirements of CS OBJ 6 of the County Development Plan as follows: i) The
Public Meeting #1 January 30, 2018
 Public Meeting #1 January 30, 2018 Meeting Outline Mayor s Introduction Presentation Q&A Group Activities Wrap-up Presentation Outline Introduction Existing Conditions Market Assessment Break-out Setup
Active Transportation Infrastructure Investment A Business Case
 Active Transportation Infrastructure Investment A Business Case In 2016, the Real Estate Foundation awarded the Capital Regional District a $50,000 grant for Shifting Gears: Land Use Change through Active
Speed Limit Policy Isle of Wight Council
 APPENDIX B Speed Limit Policy Isle of Wight Council 2009 Contents Section 1 Introduction 1.1 Links with the Local Transport Plan Section 2 Speed Limits on Urban Roads and Residential Areas 2.1 20mph Limits
Comments The Plan for Port Whitby
 Comments The Plan for Port Whitby April 24th, 2013 Community Meeting #2 Summary Report Prepared by GLPi April 29th, 2013 1 Introduction The purpose of the Port Whitby Secondary Plan Update, Community Improvement
Access BART: TOD and Improved Connections. October 29, 2008
 Access BART: TOD and Improved Connections October 29, 2008 1 Access BART Study Goals Evaluate at the system-level land use and access scenarios to optimize ridership Identify station clusters that provide
Rochester Area Bike Sharing Program Study
 roc bike share Rochester Area Bike Sharing Program Study Executive Summary ~ January 2015 JANUARY 2015 8484 Georgia Avenue, Suite 800 Silver Spring, MD 20910 3495 Winton Pl., Bldg E, Suite 110 Rochester,
Guidelines for Providing Access to Public Transportation Stations APPENDIX C TRANSIT STATION ACCESS PLANNING TOOL INSTRUCTIONS
 APPENDIX C TRANSIT STATION ACCESS PLANNING TOOL INSTRUCTIONS Transit Station Access Planning Tool Instructions Page C-1 Revised Final Report September 2011 TRANSIT STATION ACCESS PLANNING TOOL INSTRUCTIONS
PEDESTRIAN ACTION PLAN
 ATTACHMENT 2 CITY OF SANTA MONICA PEDESTRIAN ACTION PLAN CITY OF SANTA MONICA PEDESTRIAN ACTION PLAN This page intentionally left blank EXECUTIVE SUMMARY CHAPTER 1 EXECUTIVE SUMMARY Setting the Stage
ATTACHMENT 4 - TDM Checklist. TDM Checklist Overview
 ATTACHMENT 4 - TDM Checklist TDM Checklist Overview The proposed checklist rates developments on the degree to which they are TDM and transit supportive. Points are assigned based on the level of transit
APPENDIX 2 PROPOSAL FOR REPLACEMENT FOR POOLE (DOLPHIN) LEISURE CENTRE FINAL SPECIFICATION
 LEISURE CENTRE FINAL SPECIFICATION") APPENDIX 2 PROPOSAL FOR REPLACEMENT FOR POOLE (DOLPHIN) LEISURE CENTRE FINAL SPECIFICATION 1 PURPOSE 1.1 To provide the following information and supporting evidence for the Member decision (reference
APPENDIX 2 PROPOSAL FOR REPLACEMENT FOR POOLE (DOLPHIN) LEISURE CENTRE FINAL SPECIFICATION 1 PURPOSE 1.1 To provide the following information and supporting evidence for the Member decision (reference
ECONOMIC DEVELOPMENT ELEMENT
 ECONOMIC DEVELOPMENT ELEMENT Background The Economic Development Element considers labor force and labor force characteristics, employment by place of work and residence, and analysis of the community
TRAFFIC SIGNALS OR ROUNDABOUT AT THIS UNUSUAL INTERSECTION?
 TRAFFIC SIGNALS OR ROUNDABOUT AT THIS UNUSUAL INTERSECTION? Presenting Author Phil Weber, P.Eng. GHD Inc. (The Home of Ourston Engineering) 11 Allstate Parkway, Suite 310 Markham, ON L3R 9T8 Phone (905)
COMMERCIAL DEVELOPMENT 2015 ROBERTSON ROAD OTTAWA, ONTARIO TRANSPORTATION BRIEF. Prepared for:
 COMMERCIAL DEVELOPMENT 2015 ROBERTSON ROAD OTTAWA, ONTARIO TRANSPORTATION BRIEF Prepared for: First Bay Properties Inc. 311 Richmond Road, Suite 203 Ottawa, ON K1Z 6X3 August 8, 2017 117-663 Brief_1.doc
Indiana Electricity Projections: The 2018 Forecast Update
 Indiana Electricity Projections: The 2018 Forecast Update State Utility Forecasting Group The Energy Center at Discovery Park Purdue University West Lafayette, Indiana October 2018 Summary This report
RANDWICK CITY COUNCIL Residential Discussion Paper SUMMARY DOCUMENT
 RANDWICK CITY COUNCIL Residential Discussion Paper SUMMARY DOCUMENT Residential Discussion Paper Summary Sheet Background Randwick City Council is reviewing our local planning and development controls
Lucintel. Publisher Sample
 Lucintel http://www.marketresearch.com/lucintel-v2747/ Publisher Sample Phone: 800.298.5699 (US) or +1.240.747.3093 or +1.240.747.3093 (Int'l) Hours: Monday - Thursday: 5:30am - 6:30pm EST Fridays: 5:30am
ITEM 2.3 South of Fraser Rapid Transit Surrey-Langley technology decision. That the Mayors Council on Regional Transportation receive this report.
 TO: FROM: Mayors Council on Regional Transportation Geoff Cross, Vice President of Planning and Policy DATE: September 27, 2017 SUBJECT: ITEM 2.3 South of Fraser Rapid Transit Surrey-Langley technology
Regional Transportation Needs Within Southeastern Wisconsin
 Regional Transportation Needs Within Southeastern Wisconsin #118274 May 24, 2006 1 Introduction The Southeastern Wisconsin Regional Planning Commission (SEWRPC) is the official areawide planning agency
2010 Pedestrian and Bicyclist Special Districts Study Update
 2010 Pedestrian and Bicyclist Special Districts Study Update Pedestrian and Bicyclist Special Districts Program Overview H-GAC s Special Districts Program aims to provide strategic investments in pedestrian
1999 On-Board Sacramento Regional Transit District Survey
 SACOG-00-009 1999 On-Board Sacramento Regional Transit District Survey June 2000 Sacramento Area Council of Governments 1999 On-Board Sacramento Regional Transit District Survey June 2000 Table of Contents
City of Novi Non-Motorized Master Plan 2011 Executive Summary
 City of Novi Non-Motorized Master Plan 2011 Executive Summary Prepared by: February 28, 2011 Why Plan? Encouraging healthy, active lifestyles through pathway and sidewalk connectivity has been a focus
Portland International Airport Bicycle and Pedestrian Plan (October 2003) Staff Acknowledgements
 Staff Acknowledgements") Portland International Airport Bicycle and Pedestrian Plan (October 2003) Staff Acknowledgements Scott King, Senior Aviation Planner Jason Gately, Senior Aviation Planner Preston Beck, Associate Planner
Portland International Airport Bicycle and Pedestrian Plan (October 2003) Staff Acknowledgements Scott King, Senior Aviation Planner Jason Gately, Senior Aviation Planner Preston Beck, Associate Planner
The Future of Retailing in the South Africa to 2018
 The Future of Retailing in the South Africa to 2018 Consumer and retailer trends, issues and market dynamics Report Code: RT0160MR Report Price: US$4,950 (Single Copy) www.conlumino-winesandspirits.com
Fixed Guideway Transit Outcomes on Rents, Jobs, and People and Housing
 Fixed Guideway Transit Outcomes on Rents, Jobs, and People and Housing Arthur C. Nelson, Ph.D., ASCE, FAICP Professor of Planning and Real Estate Development University of Arizona 1 Changing Transportation
EXECUTIVE SUMMARY OF CALEDON TRANSPORTATION NEEDS STUDY
 EXECUTIVE SUMMARY OF CALEDON TRANSPORTATION NEEDS STUDY The Caledon Transportation Needs Study has been undertaken as a joint project by the Town of Caledon and the Region of Peel to determine the existing
The Route 29 Corridor Study was initiated at the request of Virginia s Commonwealth
 CHAPTER 2: Study Background and approach The Route 29 Corridor Study was initiated at the request of Virginia s Commonwealth Transportation Board in response to requests from members of the General Assembly
The University of Georgia
 The University of Georgia Center for Agribusiness and Economic Development College of Agricultural and Environmental Sciences Economic Impacts of Alabama Quail Hunting Prepared by: Archie Flanders and
Proposed. City of Grand Junction Complete Streets Policy. Exhibit 10
 Proposed City of Grand Junction Complete Streets Policy Exhibit 10 1 City of Grand Junction Complete Streets Policy Vision: The Complete Streets Vision is to develop a safe, efficient, and reliable travel
COUNCIL POLICY NAME: COUNCIL REFERENCE: 06/119 06/377 09/1C 10llC 12/1C INDEX REFERENCE: POLICY BACKGROUND
 COUNCIL POLICY NAME: COUNCIL ADVISORY COMMITTEES - TERMS OF REFERENCE ISSUED: APRIL 3, 2006 AMENDED: NOVEMBER 27, 2006 NOVEMBER 23, 2009 JANUARY 11, 2010 DECEMBER 17, 2012 POLICY COUNCIL REFERENCE: 06/119
HENDERSON DEVELOPMENT 213, 217, 221, 221 ½, 223 HENDERSON AVENUE and 65 TEMPLETON STREET OTTAWA, ONTARIO TRANSPORTATION OVERVIEW.
 HENDERSON DEVELOPMENT 213, 217, 221, 221 ½, 223 HENDERSON AVENUE and 65 TEMPLETON STREET OTTAWA, ONTARIO TRANSPORTATION OVERVIEW Prepared for: 2294170 Ontario Inc. February 2, 2017 117-652 Report_1.doc
LEED Pilot Credit Library
 Pilot Credit 13: Bicycle Network, Storage, and Shower Rooms Applicable Rating Systems >> Requirements >> Submittals >> Additional Questions >> Background Information >> Changes >> Applicable Rating Systems
TRAFFIC IMPACT STUDY CRITERIA
 Chapter 6 - TRAFFIC IMPACT STUDY CRITERIA 6.1 GENERAL PROVISIONS 6.1.1. Purpose: The purpose of this document is to outline a standard format for preparing a traffic impact study in the City of Steamboat
Stakeholder Meeting Handouts. January 2013
 January 2013 Stakeholder Meeting Handouts The Case FOR Parking Minimum Requirements Reduce street congestion around the development site Avoid parking spillover Create orderly development patterns Anticipate
Berwick Health and Education Precinct: Casey Amendment C207 (Part 1) Submission to Planning Panels Victoria
 Submission to Planning Panels Victoria") Berwick Health and Education Precinct: Casey Amendment C207 (Part 1) Submission to Planning Panels Victoria August 2018 CONTENTS 1 Executive summary... 1 2 Summary of the amendment... 2 3 Submission...
Berwick Health and Education Precinct: Casey Amendment C207 (Part 1) Submission to Planning Panels Victoria August 2018 CONTENTS 1 Executive summary... 1 2 Summary of the amendment... 2 3 Submission...
5858 N COLLEGE, LLC N College Avenue Traffic Impact Study
 5858 N COLLEGE, LLC nue Traffic Impact Study August 22, 2016 Contents Traffic Impact Study Page Preparer Qualifications... 1 Introduction... 2 Existing Roadway Conditions... 5 Existing Traffic Conditions...
Welcome. The Brooklin Secondary Plan and Transportation Master Plan are collectively referred to as the Brooklin Study.
 Welcome The Town of Whitby is undertaking a study to prepare a Secondary Plan and Transportation Master Plan to guide and manage growth in the Brooklin area. The Brooklin Secondary Plan and Transportation
Shockoe Bottom Preliminary Traffic and Parking Analysis
 Shockoe Bottom Preliminary Traffic and Parking Analysis Richmond, Virginia August 14, 2013 Prepared For City of Richmond Department of Public Works Prepared By 1001 Boulders Pkwy Suite 300, Richmond, VA
Douglas Land Use and Transportation Strategy (DLUTS) Summary. August 2013
 Summary. August 2013") Douglas Land Use and Transportation Strategy (DLUTS) Summary August 2013 Background Douglas is a large and popular residential suburb of approximately 30,000 persons on the periphery of Cork City along
Douglas Land Use and Transportation Strategy (DLUTS) Summary August 2013 Background Douglas is a large and popular residential suburb of approximately 30,000 persons on the periphery of Cork City along
Webinar: The Association Between Light Rail Transit, Streetcars and Bus Rapid Transit on Jobs, People and Rents
 Portland State University PDXScholar TREC Webinar Series Transportation Research and Education Center (TREC) 11-15-2016 Webinar: The Association Between Light Rail Transit, Streetcars and Bus Rapid Transit
CHAPTER 7 ACCESS MANAGEMENT. Background. Principles of Access Management. Hennepin County Transportation Systems Plan (HC-TSP)
") CHAPTER 7 ACCESS MANAGEMENT Background Principles of Access Management Hennepin County Transportation Systems Plan (HC-TSP) Chapter 7 Access Management 7.1 Background Access management has become an important
CHAPTER 7 ACCESS MANAGEMENT Background Principles of Access Management Hennepin County Transportation Systems Plan (HC-TSP) Chapter 7 Access Management 7.1 Background Access management has become an important
DATE: June 22, General Release SUBMITTED BY: LAND DEVELOPMENT SERVICES. RE: City Centre Survey Results
 DATE: June 22, 2018 TO: General Release SUBMITTED BY: LAND DEVELOPMENT SERVICES RE: City Centre Survey Results The following is a summary of preliminary findings for the Community Identity and Vision survey.
Indian River County Impact Fee Update Study. FINAL REPORT Executive Summary
 Impact Fee Update Study FINAL REPORT Executive Summary Prepared for: Community Development Dept. Planning Division 1801 27 th Street, Building A Vero Beach, FL 32960 ph (772) 226-1237 September 26, 2014
Main-McVay Transit Study: Phase 2 Options Definition and High Level Constraints Evaluation
 Main-McVay Transit Study: Phase 2 Options Definition and High Level Constraints Evaluation APRIL 2016 A collaborative study between: For Additional Information or to Comment If you would like additional
Ann Arbor Downtown Street Plan
 1 Ann Arbor Downtown Street Plan Public Workshop #1 We know that. 2 Public right-of-way (streets, sidewalks, and alleys) make up 30% of the total District area of downtown. Streets need to provide mobility
 Time of Change We Are Growing We Are An Attractive Place To Live We Are Age Diverse + Living Longer 50000 40000 30000 20000 10000 0 2010 Census Job Density Housing Sheds Transit Sheds The Project FUNDING
Travel and Rider Characteristics for Metrobus
 Travel and Rider Characteristics for Metrobus 040829040.15 Travel and Rider Characteristics for Metrobus: 2012-2015 Overview The Miami Dade County Metropolitan Planning Organization (MPO) conducted a series
South King County High-Capacity Transit Corridor Study
 HIGH-CAPACITY TRANSIT CORRIDOR STUDY South King County Corridor South King County High-Capacity Transit Corridor Study Corridor Report August 2014 South King County High Capacity Transit Corridor Report
February 10, 2015 Project: P
 Project: 142110P Transportation Planning Transit Planning Traffic Engineering Parking Planning Chris Corosky Armel Corporation Commerce Court West, 199 Bay Street, Suite 2900 P.O. Box 459, Toronto, Ontario
City of Elizabeth City Neighborhood Traffic Calming Policy and Guidelines
 City of Elizabeth City Neighborhood Traffic Calming Policy and Guidelines I. Purpose: The City of Elizabeth City is committed to ensure the overall safety and livability of residential neighborhoods. One
Executive Summary Route 30 Corridor Master Plan
 Route Corridor Master Plan Project Overview The Route Corridor Master Plan is a coordinated multimodal transportation and land use plan for the entire stretch of Route through East Whiteland Township,
162 RESIDENTS ATTENDED 2 DAYS OF WORKSHOPS 15 TABLE DISCUSSIONS WHAT WE HEARD. Oakridge Municipal Town Centre Workshops PLANNING PROGRAM
 OAKRIDGE MTC WORKSHOP 2017 CAMBIE CORRIDOR Phase 3 STEP 3: 3: October June 2017 CAMBIE CORRIDOR PLANNING PROGRAM 2 DAYS OF WORKSHOPS 15 TABLE DISCUSSIONS 162 RESIDENTS ATTENDED WHAT WE HEARD Oakridge Municipal
WILMAPCO Public Opinion Survey Summary of Results
 Wilmington Area Planning Council WILMAPCO Public Opinion Survey Summary of Results Prepared by: 2955 Valmont Road, Suite 300 Boulder, Colorado 80301 t: 303-444-7863 f: 303-444-1145 www.n-r-c.com Table
Discussion Paper Men s and Boy s Competition Review 26 May 2017
 BACKGROUND As we enter into the third year of the Men s National Premier League (NPL) three-year licence period, and having launched the Women s NPL off the back of last year s Women s and Girl s Competition
Rural Exceptions 101r-200r (Section 240)
") Rural s 101r-200r (Section 240) I 101r AG[101r] - the maximum number of persons in a group home is 25 102r RC [102r] all uses other than hotel and restaurant, take-out 103r RU [103r] - service and repair
Rural s 101r-200r (Section 240) I 101r AG[101r] - the maximum number of persons in a group home is 25 102r RC [102r] all uses other than hotel and restaurant, take-out 103r RU [103r] - service and repair
CITY OF COCOA BEACH 2025 COMPREHENSIVE PLAN. Section VIII Mobility Element Goals, Objectives, and Policies
 CITY OF COCOA BEACH 2025 COMPREHENSIVE PLAN Section VIII Mobility Element Goals, Objectives, and Policies Adopted August 6, 2015 by Ordinance No. 1591 VIII MOBILITY ELEMENT Table of Contents Page Number
TRANSPORTATION NEEDS ASSESSMENT
 TRANSPORTATION NEEDS ASSESSMENT A travel demand analysis was carried out to determine the operational issues and the potential benefit that adding traffic capacity would have on the road network. All the
Overview. Existing Conditions. Corridor Description. Assessment
 Overview A study of the 23 rd Street corridor was undertaken to document the existing conditions, analyze traffic operations, and recommend remedies for deficient situations Although 23 rd Street is frequently
Mobility and Congestion
 Technical Memorandum Mobility and Congestion Prepared for: Prepared by: September 25, 2013 1 Table of Contents 1. Introduction... 1 2. Congestion Forecasting Process... 1 2.1 Mobility and Congestion Terms...
Basalt Creek Transportation Refinement Plan Recommendations
 Basalt Creek Transportation Refinement Plan Recommendations Introduction The Basalt Creek transportation planning effort analyzed future transportation conditions and evaluated alternative strategies for
TRANSIT & NON-MOTORIZED PLAN DRAFT FINAL REPORT Butte County Association of Governments
 1 INTRODUCTION Maintaining a high quality of life is the essence of this plan for transit and non-motorized transportation in Butte County. Curbing greenhouse gas emissions (GHG) by reducing congestion,
Sixth Line Development - Transit Facilities Plan
 Memorandum Date: November 13, 2012 To: From: c.c. Subject: Rob Freeman (Freeman Planning) Kevin Phillips Sixth Line Development - Transit Facilities Plan 33016631 This memo was prepared to review the transit
7 NE 145TH STREET STATION TOD POTENTIAL
 7 NE 145TH STREET STATION TOD POTENTIAL Key Findings The 145th Street Station area has limited TOD potential, primarily because of its location in an area that is currently zoned predominantly single-family
Operational Comparison of Transit Signal Priority Strategies
 Operational Comparison of Transit Signal Priority Strategies Revision Submitted on: November, 0 Author: Adriana Rodriguez, E.I Assistant Engineer Parsons Brinckerhoff 0 South Orange Avenue, Suite 00 Orlando,
WELCOME. Purpose of the Open House. Update you on the project. Present a draft recommended plan. Receive your input
 WELCOME Purpose of the Open House The Town of Smiths Falls has initiated the Beckwith Street Redevelopment Plan that includes the preparation of a streetscape functional design for the renewal of Beckwith
2011 Origin-Destination Survey Bicycle Profile
 TRANS Committee 2011 Origin-Destination Survey National Capital Region December 2012 TRANS Committee Members: City of Ottawa, including OC Transpo Ville de Gatineau Société de transport de l Outaouais
EXECUTIVE SUMMARY: TRANSIT-ORIENTED DEVELOPMENT IN SMITHS FALLS, ONTARIO; A COMPARISON BETWEEN TWO SITES
 EECUTIVE SUMMARY: TRANSIT-ORIENTED DEVELOPMENT IN SMITHS FALLS, ONTARIO; A COMPARISON BETWEEN TWO SITES Topic and Purpose In 2007, the Mayor of Ottawa s Task Force on Transportation suggested adding a
Living Streets response to the Draft London Plan
 Living Streets response to the Draft London Plan Contents Living Streets response to the Draft London Plan... 1 About Living Streets... 2 Summary... 2 Consultation response... 3 Chapter 1: Planning London
3.0 Future Conditions
 3.0 Future Conditions In order to be able to recommend appropriate improvements to the transportation system of the Town, it is important to first understand the nature and volume of traffic that is expected
City of Wayzata Comprehensive Plan 2030 Transportation Chapter: Appendix A
 A1. Functional Classification Table A-1 illustrates the Metropolitan Council s detailed criteria established for the functional classification of roadways within the Twin Cities Metropolitan Area. Table
Additional Policies & Objectives for Local Area Plans Ashbourne LAP. Ashbourne
 Ashbourne Strategic Policies SP 1 To operate an Order of Priority for the release of residential lands in compliance with the requirements of CS OBJ 6 of the County Development Plan as follows: i) The
Building a Liveable Ottawa 2031 Backgrounder 4: Kanata/Stittsville
 Building a Liveable Ottawa 2031 Backgrounder 4: Kanata/Stittsville Wards 4, 6 and 23 Official Plan Transportation Master Plan Cycling Plan Pedestrian Plan October 2013 ottawa.ca/liveableottawa Building
Review of Considerations and Requirements for Automated Enforcement
 Review of Considerations and Requirements for Automated Enforcement Summary: The purpose of this report is to provide information related to expanding the use of automated enforcement in the City of Toronto,
Rural Ontario s Hidden Sector: The Economic Importance of the Horse Industry Final Report
 Rural Ontario s Hidden Sector: The Economic Importance of the Horse Industry Final Report - 2009 Photo Credit: J.W. Wilton Dr. Bronwynne Wilton and Dr. Wayne Caldwell University of Guelph 1 Executive Summary
Prepared For: Shieldbay Developments Inc. c/o Matson, McConnell Ltd. 2430A Bloor Street West Toronto, Ontario M6S 1P9.
 Prepared For: Shieldbay Developments Inc. c/o Matson, McConnell Ltd. 2430A Bloor Street West Toronto, Ontario M6S 1P9 Prepared By: URS Canada Inc. 4 th Floor, 30 Leek Crescent Richmond Hill, Ontario L4B
2.0 Existing Conditions
 20 2.0 Existing Conditions 2.1 Land Use, Future Growth Patterns, Physical Barriers Geographic Overview Sutter County s land use pattern is characterized by extensive agricultural areas, significant natural
NORTHGATE MIXED USE DEVELOPMENT Permitted Uses
 EXHIBIT D - 3/16/17 ORDINANCE NO. N.C. (2d) AN ORDINANCE OF THE CITY COUNCIL OF THE CITY OF VALLEJO AMENDING THE NORTHGATE SPECIFIC PLAN/MASTER PLAN REGARDING ALCOHOL SALES, SERVICE AND PRODUCTION ESTABLISHMENTS
Property Owner Survey Results
 Property Owner Survey Results 1. What are the most positive aspects of the Golden Mile? (check all that apply) Response Response Existing mix of businesses 50.0% 20 Good access to major roads 85.0% 34
City of Charlottesville Bicycle and Pedestrian Master Plan Update
 City of Charlottesville Bicycle and Pedestrian Master Plan Update September 17, 2014 I. Welcome and meeting overview II. Project status update III. Network overview IV. Break-out groups Pedestrian Network
APPENDIX 2 LAKESHORE ROAD TRANSPORTATION REVIEW STUDY EXECUTIVE SUMMARY
 APPENDIX 2 LAKESHORE ROAD TRANSPORTATION REVIEW STUDY EXECUTIVE SUMMARY Appendix 2 City of Mississauga Lakeshore Road FINAL REPORT Transportation Review Study December 2010 EXECUTIVE SUMMARY Study Purpose