Productivity (Recruits-per-Spawner) Data for Sockeye, Pink, and Chum Salmon from British Columbia
|
|
|
- Mae Greene
- 6 years ago
- Views:
Transcription
1 Productivity (Recruits-per-Spawner) Data for Sockeye, Pink, and Chum Salmon from British Columbia A.D. Ogden, J.R. Irvine, K.K. English, S. Grant, K.D. Hyatt, L. Godbout, and C.A. Holt Fisheries and Oceans Canada Pacific Biological Station 3190 Hammond Bay Road Nanaimo, British Columbia V9T 6N Canadian Technical Report of Fisheries and Aquatic Sciences 3130
2 Canadian Technical Report of Fisheries and Aquatic Sciences Technical reports contain scientific and technical information that contributes to existing knowledge but which is not normally appropriate for primary literature. Technical reports are directed primarily toward a worldwide audience and have an international distribution. No restriction is placed on subject matter and the series reflects the broad interests and policies of Fisheries and Oceans Canada, namely, fisheries and aquatic sciences. Technical reports may be cited as full publications. The correct citation appears above the abstract of each report. Each report is abstracted in the data base Aquatic Sciences and Fisheries Abstracts. Technical reports are produced regionally but are numbered nationally. Requests for individual reports will be filled by the issuing establishment listed on the front cover and title page. Numbers in this series were issued as Technical Reports of the Fisheries Research Board of Canada. Numbers were issued as Department of the Environment, Fisheries and Marine Service, Research and Development Directorate Technical Reports. Numbers were issued as Department of Fisheries and Environment, Fisheries and Marine Service Technical Reports. The current series name was changed with report number 925. Rapport technique canadien des sciences halieutiques et aquatiques Les rapports techniques contiennent des renseignements scientifiques et techniques qui constituent une contribution aux connaissances actuelles, mais qui ne sont pas normalement appropriés pour la publication dans un journal scientifique. Les rapports techniques sont destinés essentiellement à un public international et ils sont distribués à cet échelon. II n'y a aucune restriction quant au sujet; de fait, la série reflète la vaste gamme des intérêts et des politiques de Pêches et Océans Canada, c'est-à-dire les sciences halieutiques et aquatiques. Les rapports techniques peuvent être cités comme des publications à part entière. Le titre exact figure au-dessus du résumé de chaque rapport. Les rapports techniques sont résumés dans la base de données Résumés des sciences aquatiques et halieutiques. Les rapports techniques sont produits à l'échelon régional, mais numérotés à l'échelon national. Les demandes de rapports seront satisfaites par l'établissement auteur dont le nom figure sur la couverture et la page du titre. Les numéros 1 à 456 de cette série ont été publiés à titre de Rapports techniques de l'office des recherches sur les pêcheries du Canada. Les numéros 457 à 714 sont parus à titre de Rapports techniques de la Direction générale de la recherche et du développement, Service des pêches et de la mer, ministère de l'environnement. Les numéros 715 à 924 ont été publiés à titre de Rapports techniques du Service des pêches et de la mer, ministère des Pêches et de l'environnement. Le nom actuel de la série a été établi lors de la parution du numéro 925.
3 Canadian Technical Report of Fisheries and Aquatic Sciences PRODUCTIVITY (RECRUITS-PER-SPAWNER) DATA FOR SOCKEYE, PINK, AND CHUM SALMON FROM BRITISH COLUMBIA A.D. Ogden 1, J.R. Irvine 1,2, K.K. English 3, S. Grant 4, K.D. Hyatt 1, L. Godbout 1, and C.A. Holt 1 1 Pacific Biological Station Fisheries and Oceans Canada 3190 Hammond Bay Road Nanaimo, B.C. V9T 6N7 2 Corresponding author, james.irvine@dfo-mpo.gc.ca 3 LGL Limited 9768 Second Street Sidney, B.C. V8L 3Y8 4 Fisheries and Oceans Canada Annacis Parkway Delta, B.C. V3M 6A2
4 Her Majesty the Queen in Right of Canada, 2015 Cat. No. Fs97-6/3130E ISBN ISSN (print version) Cat. No. Fs97-6/3130E-PDF ISBN ISSN (PDF version) Correct citation for this publication: Ogden, A.D., Irvine, J.R., English, K.K., Grant, S., Hyatt, K.D., Godbout, L., and Holt, C.A Productivity (Recruits-per-Spawner) data for Sockeye, Pink, and Chum Salmon from British Columbia. Can. Tech. Rep. Fish. Aquat. Sci. 3130: vi + 57 p. ii
5 Contents Abstract...v 1 Introduction Methods Data assembly Input datasets Data quality criteria Background Data types and data quality criteria Results Structure of the database Fraser River Sockeye Salmon Pink Salmon Inner South Coast (non-fraser River) and Columbia/Okanagan Sockeye Salmon Pink Salmon (odd and even return years) Chum Salmon Outer South Coast West Coast Vancouver Island Sockeye Salmon North and Central Coast Overview Sockeye Salmon Pink Salmon (odd and even return years) Chum Salmon Examples of time series Discussion Recommendations iii
6 Acknowledgements References cited Tables Figures Appendices Appendix A: Escapement data quality estimation Appendix B: Harvest data quality estimation for Fraser River Sockeye Salmon. 46 Appendix C: Conservation Unit (CU) Type Appendix D: North and Central Coast model assumptions and uncertainties Appendix E: North and Central Coast methods Appendix F: Database limitations Data Data quality ratings iv
7 Abstract Ogden, A.D., Irvine, J.R., English, K.K., Grant, S., Hyatt, K.D., Godbout, L., and Holt, C.A Productivity (Recruits-per-Spawner) data for Sockeye, Pink, and Chum Salmon from British Columbia. Can. Tech. Rep. Fish. Aquat. Sci. 3130: vi + 57 p. In order to be able to track patterns of salmon recruitment variability among salmon populations in British Columbia and to improve our understanding of the environmental and biological mechanisms that influence these patterns, we assembled productivity (i.e. recruits per spawner) estimates for British Columbian Sockeye, Pink, and Chum Salmon and provide these on a publicly accessible internet link ( Annual estimates, by brood year, of spawner numbers, catch, and population and age composition were obtained from regional experts and organized in a simple database that we describe in this report. Time series were organized by species and biological or spatial unit (Conservation Unit, Pacific Fisheries Management Area, or aggregates of these). Data quality criteria that delineated three categories of data quality, unique to each data type (spawner, catch, and age structure estimates), were used to rate each data type by return year in each time series, and the overall recruit-per-spawner estimates were rated by brood year. The annual data quality ratings of the component data were then used to rate annual recruit-per-spawner data by species and biological or spatial unit and also to generate global estimates across all years for each time series. These data replace previously published estimates, given our more detailed exploration of temporal changes in both field assessment methods and data quality, where both will serve as a useful starting point to assist analysts with their interpretation of data reliability and results. Included in the report are two example plots of recruits-per-spawner time series. We recommend that these data be updated on a regular basis and consideration be given to expanding the dataset to other species and areas. v
8 Résumé Ogden, A.D., Irvine, J.R., English, K.K., Grant, S., Hyatt, K.D., Godbout, L., et Holt, C.A Données sur la productivité (recrues par géniteur) pour le saumon rouge, rose et kéta en Colombie-Britannique. Can. Tech. Rep. Fish. Aquat. Sci. 3130: vi + 57 p. Afin de pouvoir faire le suivi des tendances en matière de variabilité du recrutement parmi les populations de saumon en Colombie-Britannique et de mieux comprendre les mécanismes environnementaux et biologiques qui influencent ces tendances, nous avons assemblé des estimations de la productivité (c.-à-d., le nombre de recrues par géniteur) pour les saumons rouges, roses et kéta de la Colombie-Britannique et les avons publiées sur un lien Internet accessible par le public ( Des estimations annuelles, par année d éclosion, du nombre de géniteurs, des prises, de la population et de sa composition par âge ont été obtenues auprès d experts régionaux et ont été organisées dans une simple base de données que nous décrivons dans ce rapport. Les séries chronologiques ont été organisées par espèce et par unité biologique ou spatiale (Unité de conservation, Secteur de gestion des pêches du Pacifique, ou agrégats de celles-ci). Des critères de qualité des données qui délimitaient trois catégories de qualité des données, particulières à chaque type de données (estimations des géniteurs, des prises et de la structure d âge), ont été utilisés pour évaluer chaque type de donnée par année de montaison dans chaque série chronologique, et les estimations globales du nombre de recrues par géniteur ont été évaluées par année d éclosion. Les évaluations de la qualité des données de composantes annuelles ont ensuite servi à évaluer les données annuelles sur le nombre de recrues par géniteur, par espèce et unité biologique et spatiale, et à produire des estimations globales pour toutes les années dans chaque série chronologique. Ces données remplacent les estimations déjà publiées, compte tenu de notre exploration plus détaillée des changements temporels dans les méthodes d évaluation sur le terrain et la qualité des données, qui serviront tous les deux de point de départ utile pour aider les analystes dans leur interprétation de la fiabilité des données et des résultats. Le rapport contient deux exemples de graphique des séries chronologiques sur le nombre de recrues par géniteur. Nous recommandons de mettre à jour régulièrement ces données et d envisager d étendre l ensemble de données à d autres espèces et secteurs. vi
9 1 Introduction In order to be able to track patterns of recruitment variability among salmon populations in British Columbia (BC), and to improve our understanding of the environmental and biological mechanisms that influence these patterns, we assembled productivity (i.e., recruits per spawner, the number of adult salmon produced per spawner) estimates for British Columbia Sockeye, Pink, and Chum Salmon into a database, grouping them where possible into Wild Salmon Policy Conservation Units (CUs) in four regions (Figure 1). Data for Coho and Chinook Salmon are not included. A similar project was undertaken by researchers working under the direction of Randall Peterman at Simon Fraser University (SFU), who compiled a recruits-per-spawner dataset comprised of 29 Sockeye Salmon populations (Peterman et al. 1998), 43 Pink Salmon populations (Pyper et al. 2001), and 67 Chum Salmon populations (Pyper et al. 2002) from Washington, BC, and Southeast Alaska. These data have been used by these and other researchers to evaluate survival and productivity patterns in the Pacific Northwest (e.g., Dorner et al. 2013, Peterman et al. 2012, Dorner et al. 2008, Mueter et al. 2007, Mueter et al. 2005, Mueter et al. 2002a and 2002b). The SFU database was later updated for these three species, and several new time series were added by Brigitte Dorner and Greg Ruggerone, for use in the MALBEC project (Mantua et al. 2007). Our goal to develop a publicly accessible productivity (recruits-per-spawner, R/S) database for BC salmon required us to: 1. Assemble, verify and update R/S time series for BC Sockeye, Pink and Chum Salmon (sections 2.1 and 2.2); 2. Collate related metadata 1 where available (section 2.2); 3. Rate the quality of the data in each time series, which required developing data quality criteria (Section 2.3); 4. Provide high-level summaries of the data and their quality (Section 3); and 5. Present these data and metadata in an accessible format that can be updated regularly. 6. Publish this report and provide the data on a publicly accessible internet site. The data are publicly accessible through the Government of Canada s Open Data Portal at 1 The term metadata, as used in this document, refers to descriptive data, i.e., data about data.
10 2 Methods 2.1 Data assembly Productivity data, including spawning escapement and recruitment data, were compiled for BC Sockeye, Pink and Chum Salmon (Table 1). In two cases where recruitment data were not available directly, escapement and additional data (i.e., catch and age composition) were used to calculate recruitment with the guidance of the data providers (details provided in sections and 3.4.1). Where available, we included in the database additional data (e.g., harvest rates, data quality ratings). Particular data sets were excluded from the database, based on advice from regional experts. For example, there were substantial gaps and inconsistencies in time series of escapements and age composition data for Fraser River Chum Salmon that made creation of a reliable R/S time series impossible (J. Tadey, DFO, pers. comm.). Datasets excluded due to poor quality (see section 2.3.2) or unavailable R/S time series included most notably Fraser River Chum Salmon, West Coast of Vancouver Island Chum Salmon, Inner South Coast Sockeye Salmon, relatively small stocks of Sockeye Salmon from the Southwest Coast of Vancouver Island, and all species for Yukon-Transboundary). Data were organized by CU when possible. In cases where data were not available at the CU level, such as when catch could not be reliably partitioned by individual CUs, data from multiple CUs were aggregated. Therefore, the database contains data from four kinds of biological or spatial unit: CUs, subsets of CUs, small aggregates of CUs, and broader Pacific Fisheries Management Areas (PFMAs, also called Statistical Areas that include all CUs within a particular Area). We use the term unit to apply to any or all of these CU aggregation levels. A CU is a group of wild salmon sufficiently isolated from other groups that, if extirpated is very unlikely to recolonize naturally within an acceptable timeframe, such as a human lifetime or a specified number of salmon generations (DFO 2005). A list of CUs (version 4) updated from Holtby and Ciruna (2007) is available in DFO s New Salmon Escapement Database (NuSEDS) 2, which is online (internal to DFO) at or from Bruce Baxter (DFO, PBS, Nanaimo). For the North and Central Coast data, we report the data both by CU and by PFMA as described in English et al. (2012). DFO Statistical Areas that were used to define BC PFMAs are accessible online at: Pink and Chum Salmon for the Inner South Coast (non-fraser) are reported by aggregates, each made up of more than one CU. For the general structure of the salmon productivity database, see section NuSEDS data are currently available from pacgis01.dfo-mpo.gc.ca/mapster30/#/silvermapster. Escapement data from DFO s NuSEDS database are publicly available online at 2
11 2.2 Input datasets Data sets included in the database included escapement data, catch data, and recruitment data (see section 3.1 for definitions and further detail). Catches in multi-stock fisheries were partitioned into units as appropriate. In addition, escapement and catch data required ageing information to correctly apportion recruitment to the various age classes. Escapement data were provided either directly from Regional DFO staff or extracted from the DFO NuSEDS database (e.g., North and Central Coast Salmon Database). Escapement data varied in quality for various reasons, including the study design methods used (high versus low precision methods) and local habitat and environmental conditions that influenced the implementation of the employed enumeration methodology (Irvine and Nelson 1995). Catch data were estimated for various fisheries, with commercial catch comprising the largest (and, depending on the unit, often the only) portion of the total estimated harvest for the units in the database. Recreational, First Nations, test fishery, and demonstration fishery catches were included in catches, when possible. Fisheries in many commercial catch PFMAs catch multiple CUs, so to identify the proportion of the catch attributable to a specific CU (or other unit), run timing, DNA, and/or scale information was used when available. Similar information was used to assign catches to particular units for fisheries in near-terminal areas. For Sockeye and Chum Salmon, ages of fish in the catch and/or (more often) the escapement were often recorded in the Pacific Ageing Data System (PADS), accessible only from the more comprehensive NuSEDS database internal to DFO. Age data were required in order to estimate recruits by brood year (parental year). For most units, age compositions were applied to the total return, regardless of whether age compositions were estimated from the catch or the escapement. Fraser Sockeye CU recruitment data also included some estimates of en-route mortality, in addition to catch and escapement information. Recruitment data may or may not include precocious males (i.e., jacks), which return one year earlier from sea than adult age classes. Age compositions were not needed to estimate Pink Salmon recruitments, because these fish mature exclusively as two-year-old fish. Wherever possible, metadata on factors influencing salmon productivity were included. These data came primarily from published reports, but also from notes in input data spreadsheets and communications with data providers. Metadata comments have been added to the database mainly for escapement, and usually for species-unit combinations whose metadata were relatively easy to access. The user should check meta-data with the original sources given in Table 1. 3
12 2.3 Data quality criteria Background This is the first time that consistent data quality criteria, as applied to the various data components that collectively comprise productivity, have been combined as a single productivity quality rating across multiple units for BC salmon. Not surprisingly, there were numerous challenges in developing data quality criteria. Quality categorization approaches by individual data providers varied. To ensure that categorization was repeatable and transparent, criteria were developed that could be applied to all of the disparate units in BC; some units were data rich, while others were data poor, given reliance on procedures for extracting abundance estimates of sub-units in various mixed-stock fisheries or in terminal spawning areas through statistical reconstruction or expansion techniques respectively. It was also considered important to develop criteria that would capture data quality at different spatial and temporal scales and be as consistent as feasible across species and datasets. To provide consistency in the data quality criteria across multiple units, categories that were relative not to the best or the worst cases, but instead relative to all the units and species with their various approaches of calculating R/S time series were developed. In addition to rating annual data quality criteria, we wanted to generate data quality rating summaries for each species for broad areas and multiple years. There were also significant concerns with providing a single R/S data quality rating for entire time series. In particular, giving a single rating for a time series might result in database users ignoring the details of individual years and methodological changes over time. Thus, a data user might miss the fact that the quality of some time series was highly variable. To address the issue of changing methodology over time, in the database summaries we separated one CU, Fraser River Pink Salmon (odd return years), into four time periods based on different escapement methodologies. Comments columns (metadata) in both the database summary spreadsheet and the main data spreadsheet also addressed this issue. In addition, changes in data quality ratings over time are apparent in the main data spreadsheet and decadal summary sheet (see section 3.1) Data types and data quality criteria Recruits-per-spawner (R/S) estimates, and therefore the data quality ratings associated with them, generally depended upon spawning escapement, catch, and age composition estimates, each of which could vary in data quality. We therefore developed data quality criteria for R/S (RQ) and for the three main data types that were involved in R/S calculations: spawning escapement (SQ), catch (CQ) and age composition (AQ). Each was assessed annually on a five-point scale. The five categories of data quality, Excellent (5), Very Good (4), Good (3), Fair (2), and Poor (1), were defined differently for each data type (see below). As mentioned earlier, some time series that were made up primarily of Poor quality data were excluded from the productivity database. 4
13 Escapement Escapement data quality criteria have been previously applied to salmonids (see Appendix A and the review in Knudsen 1999). Escapement data were generally more consistently available from our sources than other data types and typically had more associated metadata than catch, ageing, or population composition data. The data quality criteria in this section borrowed heavily from those used in Grant et al. (2011), which in turn were modeled on the data quality criteria used by NuSEDS. English et al. s (2010; 2012) escapement data quality criteria (specifically their Q1, described in Appendix A) were similar to those of Grant et al. (2011). Excellent (5) Absolute abundance estimate. Consisted of direct and accurate counts at locations that included almost all spawners (e.g., complete fence estimate with virtually no bypass). Typically >90% of the unit had excellent enumeration in the given return year. Very Good (4) Absolute abundance estimate. High precision enumeration methods (e.g. mark recapture; DIDSON with excellent visibility; serial counts for area under-the-curve [AUC] estimation that were calibrated for measures of observer efficiency and survey life that included five or more surveys, etc.). Typically >80% of the unit had Very Good enumeration in the given return year. Good (3) Method was based on reliable sampling or indexing techniques (e.g., four or more visual inspections with good visibility together with medium-quality AUC estimates that may have included site-specific survey life estimates; DIDSON with some visualization issues; three or more visual inspections for peak counts). Expansions from reliably-enumerated streams (i.e., individually Good or Excellent) to estimates of escapement for larger regions (e.g., CUs) in which the index streams comprised between > 50% (in numbers) of the total escapement in the relevant unit, and 60% x 74% of streams in CU were included in total escapement. Typically >80% of the unit had Good enumeration in the given return year. Fair (2) Based on estimates of relative spawner abundance. Methods were based on sampling or indexing techniques that were generally acceptable for salmon, but there were various problems with questionable observations and missing data. Estimates of moderate reliability based on two or more visual inspections per stream (e.g., low-quality AUC estimate) counted as Fair. Expansions from reliablyenumerated streams (i.e., individually Good or Excellent) to estimates of escapement for larger regions (e.g., CUs) in which the surveyed streams comprised >30% of the average total escapement in the unit. Typically >80% of the unit had Fair enumeration in the given return year. Poor (1) Based on estimates of relative spawner abundance. Methods were based on questionable observations or indices or were influenced by poor visibility or substantial missing data. Estimates of poor reliability due to few surveys ( 2 in a given return year). Presence/non-detected data. Typically, <30% (in numbers) of the total escapement in the relevant unit were included in the estimate. 5
14 Catch We found only one prior formulation of catch data quality criteria, but it had not been used in practice (Knudsen 2007); our criteria borrowed heavily from it. Two main components in the quality of catch data were: (1) the quality of the original catch data (potentially from commercial, recreational and First Nations fisheries), including whether most known catches were included; and (2) the methods and sample sizes used to partition catch from multi-stock fisheries into their component units. It was not feasible to assign quality ratings for these separate components, but we kept both in mind when rating catch data. English et al. (2011) assessed the catch for Fraser River Sockeye Salmon from 2001 to 2009 to be of overall Good accuracy and Medium reliability (definitions reproduced here in Appendix B). Using our criteria, this translated into Good (3.0) and was used for our default assessment of the first component of catch data quality for all species, when there was no information to the contrary; but for many units and species, the second component decreased the rating. For units and regions in which there were little or no easily-accessible metadata, we relied on expert opinion to assign catch data quality. The two components of catch data quality were referred to by (a) and (b), respectively, in the criteria that follow. Excellent (5) (a) Catches included substantial recreational and/or First Nations catches, and these were estimated with at least good reliability, in addition to Excellent quality commercial catch estimates. Alternatively, recreational or First Nations catches were not included, but were assumed to be negligible. (b) In mixed-stock fisheries, harvest estimates consisted of direct, accurate counts or observations from a specific location where all harvests could be attributed to the population in question (e.g., terminal fisheries that catch a single CU). Total catch may have been estimated by expanding a sample if all sampled fish were attributable to the population in question. Very Good (4) (a) Catches included substantial recreational and/or First Nations catches, and these catches were estimated with at least moderate reliability, in addition to Very Good quality commercial catch estimates. Alternatively, recreational and First Nations catches were not included, but were negligible. (b) In mixed-stock fisheries, harvest estimates consisted of direct, accurate counts or observations from a specific location where the contribution of a given population could be assigned based on a reliable identification characteristic such as scale pattern recognition, DNA or markrecapture. Total catch may have been estimated by expanding a subsample. The method for assigning proportions of the harvest to each population was verified each year. If all catch for an aggregate could be attributed reliably to the population aggregate, and the return was reported by the aggregate, this situation was also considered Very Good. Good (3) - (a) Catches included substantial recreational and/or First Nations catches, and these were estimated with at least moderate reliability, in addition to Good quality commercial catch estimates. (b) In mixed-stock fisheries, catch from a CU was determined using run timing,, and population-specific run timing was verified each year. 6
15 Fair (2) (a) Catches were thought to include substantial recreational and/or First Nations catches, but these were not included, or were poorly estimated. (b) Catch composition was based on some logic about the relative run sizes or timing patterns of the mixed stocks or estimated from a relationship developed in only a few recent years, but not based on information from the current year, or there was evidence that run timing was similar from year to year, for most years. Poor (1) (a) Catches were thought to include substantial recreational and/or First Nations catches, but these were not included. (b) Catch partitioning of the harvest was based on poorly defined techniques Age composition As with catch data, we found only one prior formulation of age composition data quality criteria, but it had not been used in practice (Knudsen 2007); our criteria borrow heavily from it. The quality of ageing data were categorized according to the ageing methods used and whether the ageing estimates were applied to the same unit and time period from which the data were taken. The issue of partitioning into component CUs as mentioned for catch applies to age composition data as well, and was incorporated into the criteria that follow. Pink salmon spawners were not assessed in the database for quality of age composition because they were assumed to be consistently one age (2 years old). Excellent (5) Age composition estimates were based on reliable, repeatable techniques, with adequate numbers of samples taken directly from the populations in question such that the variance of the age estimate was small. Age composition estimates represented the year to which they were applied. Very Good (4) Age composition estimates were based on reliable, repeatable techniques, with adequate numbers of samples usually taken from the population in question. Age composition estimates may have been from another year if there was low inter-annual variability. Good (3) Age composition estimates were determined in a representative way for the whole aggregate, but were also applied to the whole aggregate s return, and the age composition was estimated yearly with adequate sample size. Fair (2) Estimates were based on somewhat questionable techniques and small sample sizes. Age composition estimates were from another year even though there was noticeable inter-annual variability. Alternatively, an average age composition was used for all or multiple years in the time series for an entire CU or statistical area, but was based on a good sample size in terms of number of years covered, and based on a reliable method of age determination. Poor (1) Age composition estimates were from only one or two other years and/or were estimated from small sample numbers or from literature estimates applying to the whole species. Or for cases in 7
16 which the average age composition was applied to multiple years, the age composition was based on small sample sizes, or few years of data Recruits per spawner Annual data quality ratings of R/S were defined as: RQ = CQ+AQ SQ+( ) 2 2 where SQ, CQ, AQ, and RQ are the data quality ratings of spawning escapement, catch, age composition, and recruits per spawner, respectively. Pink Salmon AQ was always 5.0 (Very Good) because of their single age class. We weighted the SQ rating higher than either CQ or AQ both because there was usually more confidence (less uncertainty) associated with the escapement data, and because escapement was in both the numerator and the denominator of R/S. In the database summary spreadsheet arranged by species and unit (see section 3.1), we averaged the annual data quality ratings for the whole time series to provide an overall data quality rating for R/S. 3 Results As mentioned, because of the unavailability of data or because the data were of Poor quality, we excluded datasets for Fraser River Chum Salmon, most Inner South Coast (non-fraser) and West Coast of Vancouver Island Sockeye Salmon, West Coast of Vancouver Island Pink and Chum Salmon, and all Yukon-Transboundary species. 3.1 Structure of the database The data are available at the Government of Canada Open Data Portal: Four *.csv files, one *.rtf file, and a *.pdf version of this document are available for download (Table 2). The three data files are as follows. Each spreadsheet contains data for all three species. 1. Salmon_RS_Database.csv. Data from the regional experts were assembled and stored in this main spreadsheet (Figure 2). It shows the species, annual spawner, recruit, return, ageing, recruit per spawner, annual data quality ratings (SQ, CQ, AQ, and RQ), metadata, and other data such as exploitation rate. Sockeye and Chum Salmon age classes were converted into the 8
17 European ageing system (Groot and Margolis 1991 provide a description in their preface). Within a region and species, e.g., NCC Sockeye Salmon, all the CUs or other units are listed alphabetically. 2. Salmon_RS_Time_Series_Summary.csv. This spreadsheet summarizes each time series contained in the main worksheet, by species and unit, including the CU type, the first and last brood years of the R/S time series, mean data quality ratings by return years, and metadata applying to the whole time series (Figure 3). 3. Salmon_RS_Decadal_Summary.csv. This spreadsheet provides a summary of the mean data quality ratings for each decade by species and unit (Figure 4). It is organized differently than the previous two. There are four blocks of data, one for each of Sockeye, Pink (odd), Pink (even) and Chum Salmon, with separate column headers at the row above the data for the species. For all three species, the first three columns designate species, decade, and data quality type, but all following columns for each species give unit names. For NCC units, the whole PFMA data quality ratings are reported before (i.e., to the left of) the ratings for the individual CUs (or subsets of CUs) that are associated with the PFMAs. The regions in which the units occur are not listed here; e.g., the Anderson/Seton Early Summer Sockeye Salmon CU is listed, but not the fact that it is from the Fraser region. Also note that mean data quality ratings are included for a decade if there are R/S data in at least two years for the unit in the indicated decade. Three additional files available from the Data Portal are: 4. Salmon_RS_Field_Definitions.csv defines the fields (i.e., column headers) in the three data spreadsheets (Figure 5). 5. Salmon_RS_README.rtf is a document giving an overview of the *.csv files, and directing the data user to this Technical Report. 6. Canadian_Technical_Report_3130.pdf is a copy of this report. Metadata are included in the comments columns of the main database spreadsheet and in the summary spreadsheet. They include comments about escapement, catch, age and productivity; however, escapement metadata are best represented. Metadata come from reports, the data sheets provided by regional experts, and personal communication. These sources are cited in the main and summary spreadsheets, and the citations are included in this report s bibliography. In the main database spreadsheet, i.e., Salmon_RS_Database.csv, escapement, catch, and returns are aligned with return (spawning) year. Proportions of returns-at-age are associated with summed catch plus escapement (i.e., returns) in the return year. Recruits are back-calculated (from returns and proportions of age at return) to align with the brood year that produced them (i.e. parental spawning year); thus, recruits differ from returns for Chum and Sockeye Salmon that can return to spawn at multiple age classes. Note that the quality ratings of escapement, catch, and ageing data are also aligned with the return year. Calculated R/S data quality ratings are also aligned with return year, even though recruits are aligned with brood year. To reiterate, in the database, returns are aligned with the year in which those salmon returned to spawn, and recruits are aligned with brood year, the spawning year of 9
18 their parents. Thus the Year column in the main database spreadsheet does a double duty; a single year column is used for both brood year and return year. Since Pacific Salmon CUs were described in Holtby and Ciruna (2007), there have been various revisions, the most recent of which are detailed in the internal NuSEDS database (Bruce Baxter, pers. comm.). As a result, the CU type of some CUs has changed since The CU types for the CUs used in the productivity database are given in the summary file, Salmon_RS_Time_Series_Summary.csv, and are described in Appendix C. Figure 1 shows the geographic boundaries of the regions referred to in the report and database, and into which the CUs are grouped. The freshwater extent for a CU of one species sometimes overlaps with that of a CU of another salmon species that is grouped into a different region. The only such region relevant to the productivity database is shown with cross-hatching on the map (Figure 1). For Sockeye, Chum and even-year returning Pink Salmon, the ISC is shown by the regions in orange plus the crosshatched region. However, one odd-year returning Pink Salmon CU, Homathko-Klinaklini-Smith-Rivers- Bella Coola-Dean (odd), is considered part of the NCC and has a range that includes the hatched area (see Holtby and Ciruna 2007, Figure 16 for the northern part of the CU s range). If there were Sockeye or Chum Salmon CUs included in our database that spawn in northwest Vancouver Island streams, there would also be an overlap of species-region combinations at the northern tip of Vancouver Island. However, the only productivity data we have for the northern tip of Vancouver Island in the current database are for the Nahwitti Pink (odd) CU, and these are included in the ISC (non-fraser) odd Pink Salmon aggregate, even though geographically that area is on the Outer South Coast. 3.2 Fraser River Sockeye Salmon The time series of recruits and spawners for Fraser River Sockeye Salmon CUs are the longest and most consistently assessed time series in BC. The most recent time series (last update July 2014) included effective female spawners, and numbers of recruits-at-age for 19 CUs (that included one aggregate of two CUs: Chilko-S/Chilko-ES, counted here as two CUs). Effective female spawners were defined as the product of the total female spawners multiplied by female spawner success, where female spawner success was calculated as the proportion of eggs (0%, 50%, or 100%) successfully spawned, based on spawning ground carcass surveys (Grant et al. 2011). Because effective total (male plus female) spawners were not available at the time of this report, productivity for Fraser Sockeye specifically included recruits-per-effective female spawner (R/EFS). The R/EFS time series ranged in length from 39 to 60 years, ending in the 2006 brood year for most CUs; the R/EFS calculation included the sum of all 10
19 recruits-by-age (i.e., including precocious males) in the numerator and effective female spawners in the denominator. The escapement time series were previously rated on a 5-point scale that applied to each whole time series (Grant et al. 2011, Grant and Pestal 2012; Appendix A, this document); all were rated Good, Very Good, or Excellent, and those evaluations were included in the Sockeye Salmon productivity database summary sheet. Grant et al. (2011) provided extensive escapement metadata which are also summarized in our database both annually and by whole time series in comments columns. Fraser Sockeye Salmon CUs that did not have recruitment data (i.e. Chilliwack-ES, Harrison (D/S)-L; Nahatlach- ES, Taseko-ES, and Widgeon (River-type)) were not included in the productivity database (Grant et al. 2011). We also (1) modified the 5-point scale of Grant et al. (2011) for the data quality criteria (see section 2.3.2), and (2) used their classifications as the basis of our annual ratings for the Fraser River Sockeye Salmon escapement data quality ratings, as follows. First, the data quality ratings from Grant et al. (2011) for whole time series were entered as-is into the annual data quality rating column for escapement; this is the default value that is referred to in the SQ notes column of the main spreadsheet for Fraser Sockeye Salmon. Next, our data quality ratings in relevant years were changed to reflect metadata as given in the results section of Grant et al. (2011), especially regarding the history of each individual CU, and in accordance with our revised categories of escapement data quality (section ). Our annual escapement data quality ratings for the Fraser River Sockeye Salmon CUs therefore ranged from Good (3.0) to Excellent (5.0). Fraser River Sockeye Salmon recruitment data combine escapement, catch, and en-route loss estimates. These data were collected and managed by two key agencies: DFO and the Pacific Salmon Commission 3 (PSC). Spawning escapement and spawner success were assessed by DFO and various First Nations. Catches were assessed by a combination of Federal (DFO in Canada), Canadian First Nations, State (Washington and Alaska), and U.S. tribal (e.g. Northwest Indian Fisheries Commission) agencies, which provided total Sockeye Salmon catch estimates for specific areas where Fraser Sockeye were caught. En-route loss (i.e., upstream mortality not accounted for in the catch and escapement estimates) was estimated by a subset of the Pacific Salmon Treaty s Fraser Panel Technical Committee. En-route loss estimates, referred to as run-size adjustments (RSAs), have been assessed since 1992, excluding 1993 and 1995 (PSC 2012, Figure 8). Population identification and age (assessed by the PSC) was assigned to catch, and age was assigned to escapement by the PSC; the age composition of catch and escapement was used to generate the recruitment data. DFO was responsible for maintaining escapement data and the PSC was responsible for generating and maintaining the catch, escapement, RSA and recruitment by population and age. Prior to 1992, because RSAs were rarely estimated, total return numbers, and consequently R/S, may have been negatively biased in years when en-route mortality occurred but was not included in estimates of that year s total return (English et al. 2011). With respect to the catch component of total recruits, an independent review summarized the quality of DFO s catch monitoring programs (commercial, recreational, First Nations) for Fraser Sockeye Salmon 3 Contact the PSC for additional information about Fraser sockeye productivity time series ( Robson Street, Vancouver, B.C., Canada V6E 1B5) 11
20 ( ) as having Good accuracy, unknown precision and Medium reliability (Table 2 in English et al. 2011, Appendix B in this report). Therefore, we assessed the default catch data quality rating as Good (3.0) for all years. Fraser Sockeye Salmon catch has been partitioned into populations since the 1950s using scale circuli patterns (Henry 1961; Gable and Cox-Rogers 1993), and recently using DNA markers (Beacham et al. 2004; Grant et al. 2011; Irvine and Akenhead 2013). Based on catch partitioning, we rated catch data quality as Good (3.0) post-2001 when DNA began to be used, and Fair (2.0) for all previous years when scales were the primary means of determining population composition. Although detailed information on ageing data quality were not available at the time of this report, we rated the ageing data as Good (3.0). The DFO and PSC have a long history of ageing Fraser River sockeye salmon although many details are not published. In the 2004 return season (the most recent year for which PSC provided much detail of their ageing methods), PSC analyzed opercular tissue punches, scales and other data from almost 8,000 Sockeye Salmon from catches in United States management Areas 7 and 7A, and in Canadian PFMAs 12, 13, 20 and 29 to determine the population-specific age composition from mixed-stock catches (PSC 2008). We rated ageing quality for these relatively well-studied populations as Good (3.0) for all years of the Fraser time series Pink Salmon The R/S time series for the odd-year returning Fraser River Pink Salmon CU was provided in Grant et al. (2014). Few Pink Salmon currently return to the Fraser River in even-numbered years although there may have been significant numbers in the early 1900s (Irvine et al. 2014). Since 1957, four separate approaches have been used to estimate escapement (Grant et al. 2014, Table 1; Irvine et al. 2014). Because there were no calibrations among methods (Grant et al. 2014), the escapement time series was separated in the database for the Fraser Pink Salmon aggregate into four time periods; we cautions users about comparing abundances among these periods. (1) From , various stream-specific escapement enumeration methods were used. A two-tiered escapement assessment program resulted in a high percentage (average 92%) of the total Fraser Pink Salmon escapement during those years being estimated using high-precision methods (i.e., mark recapture or fence counts). The Fraser River systems that were assessed, along with assessment methods and timeframes, are detailed in Appendix Table A1 in Grant et al. (2014). (2) The individual system assessments for Fraser Pink Salmon were consolidated into a single system-wide assessment from During this period a system-wide mark-recapture live recovery program was conducted to assess total escapement in the Fraser watershed, with upstream catch removed from these estimates (see Tables 1, 2 & 4 in Grant et al. 2014). (3) DFO terminated spawning ground assessments for Fraser Pink Salmon after 2001 and the PSC generated escapement estimates from indirectly by subtracting DFO catch estimates from PSC estimates of total return, which were estimated by test fisheries that were seaward of all fishing locations (Grant et al. 2014, Tables 1 & 5). These estimates are 12
21 considered the weakest of all the methods used over the entire time series because escapement was estimated only indirectly using these methods. (4) Finally from , system-wide hydro-acoustic estimates were generated (Grant et al. 2014, Tables 1, 6 & 7 and their Appendix D). Escapement data quality during: (1) was rated as Very Good (4.0); (2) , because system-wide live mark recapture methods were used, data quality was rated as Good (3.0); (3) , when test fishery methods were used, data quality was rated as Fair (2.0); and (4) , when hydro-acoustic methods were used, data quality was rated as Good (3.0), in accordance with the data quality criteria (section ). Grant et al. (2014) note that there are no detailed records quantifying the accuracy of total catch from all sectors for specific periods. However, typically recreational catch of Pink Salmon is < 5% of all catch, and First Nations FSC catch is also small; First Nations commercial license fisheries catch in recent years was estimated using the same methods as for general commercial catch licenses (Grant et al. 2014). Therefore, considering commercial catch to be essentially Good (section ), the total catch component of Fraser Pink Salmon was also Good from the perspective of catch itself. From 1959 to 1985, catch partitioning was accomplished using various methods, including backward-run reconstructions (Starr and Hilborn 1988), but all were based on run timing determined by markrecapture studies in 1959 and 1961 that partitioned catch into Fraser and non-fraser Pink Salmon catch (Grant et al. 2014). Therefore, we rated catch quality in 1959 to 1985 as Fair (2.0). In , protein electrophoretic analysis was used to separate catches of Fraser pink salmon from other populations, and in , microsatellite DNA analyses were used (Beacham et al. 2012) (Grant et al. 2014); therefore, we rated catch quality for as Good (3.0). 3.3 Inner South Coast (non-fraser River) and Columbia/Okanagan Sockeye Salmon We provide R/S time series for one CU, Osoyoos (Okanagan Lake); data were not available for 18 Inner South Coast Sockeye Salmon CUs. In May of 2014, we obtained data from Margot Stockwell (DFO, PBS, Nanaimo) and calculated recruitment with her oversight. The R/S time series covered 1985 to 2007 with no gaps. Escapement estimates were calculated using the AUC method applied to visual surveys made weekly by boat (Hyatt and Rankin 1999) during the spawning period in the Okanagan River where this CU spawns (Stockwell and Hyatt 2003), but prior to 1999, the AUCs were calibrated via a variety of methods (M. Stockwell, DFO, pers. comm.). We therefore rated the escapement data as Very Good (4.0) after 1999, but Good (3.0) prior to
22 The annual total number of Sockeye Salmon caught in all fisheries was calculated as the sum of the inriver catch above the Wells Dam counting windows and the estimated proportion of the in-river catch below the dam that was bound for the Okanagan River, including the brood stock taken in for the Yakima hatchery; marine harvest of this population is negligible in most years (M. Stockwell, DFO, pers. comm.). Annual proportions of Okanagan Sockeye Salmon caught below the Wells Dam were estimated as the proportion of Okanagan fish enumerated at Wells Dam divided by the total number of spawners for Wenatchee and Okanagan, enumerated at the Rock Island Dam before the Okanagan and Wenatchee populations split. We rated catch data quality as Very Good (4.0) for all years in the time series. The summed escapement and catch by return year yielded the return estimate, and recruits from individual brood years were calculated by using the proportional age composition in the return year, to assign numbers of returns to their brood years. Age composition was determined using various methods (see the database comments columns), so age data quality ranged from Fair (2.0) to Excellent (5.0). For further information on age data, see the Okanagan Fish and Water Management Tool Core Numbers and Traits Database (CNAT; program contacts Margot Stockwell or Kim Hyatt, DFO, PBS), maintained by the Salmon in Regional Ecosystems Program at the Pacific Biological Station, DFO (e.g., Hyatt and Stockwell 2010) Pink Salmon (odd and even return years) We received the ISC (non-fraser) (ISC) Pink Salmon R/S data from Pieter Van Will (DFO, Port Hardy) in November of 2013, for 1957 to 2009 for odd years, and 1954 to 2010 for even years. The odd return years included all five CUs that are defined for the Inner South Coast, and the even return years included both CUs. These aggregate time series were complete with no gaps. Where not otherwise indicated, much of the following information has been adapted from P. Van Will s spreadsheets. To fill gaps in the escapement time series, ISC Pink Salmon escapements were estimated by CU based on NuSEDS data, expanded for the average long-term contribution to total escapement as per methods described in English et al. (2004; 2010), but not expanded for observer efficiency because a 1.5 observer efficiency expansion was already taken into account in the NuSEDS data. Then escapement was summed across CUs. For example, escapement estimated for the Southern Inside (non-fraser) Pink Salmon even-year aggregate was the sum of the escapements from the Southern Fjords CU and the Georgia Strait CU. Escapement was summed for all the streams in the Southern Fjords (even) CU, some of which were assumed to be caught in PFMA 12, and some in PFMA 13. The same procedure was used for the Georgia Strait (even) CU, with fish originating from streams in that CU assumed to be caught in PFMAs and 28. The odd Pink Salmon Southern Inside (non-fraser) aggregate escapement was estimated in the same way, but for odd years, there were more component CUs: Southern Fjords (odd), Georgia Strait (odd), East Howe Sound-Burrard Inlet (odd), East Vancouver Island (odd), Nahwitti (odd), and a subset of the 14
23 Homathko-Klinaklini-Smith-Rivers-Bella Coola-Dean (odd). Because the North and Central Coast dataset (English et al. 2012) included the R/S time series for the whole of this latter CU, we subtracted the estimates of escapement and catch attributed to it in P. Van Will s dataset from the ISC aggregate. Most escapement data reported in NuSEDS were derived from aerial and stream walk inspections using peak count or area-under-the curve estimation with unknown accuracy and precision, although the enumerations are suspected to provide a reasonable index of abundance (Van Will et al. 2009b). We rated the quality of the escapement data for both even and odd ISC Pink Salmon as Fair (2.0). The annual catch data included commercial, First Nations, and recreational catch. Annual aggregate catch for even-year-returning Pink Salmon was the sum of catch for PFMAs 11-12, PFMA 13, and a minimal amount of catch from other unspecified areas. Returns were estimated as escapement plus catch in return year, and recruits from year t were the returns in year t + 2. Because we considered the aggregate catch, catch partitioning was not much of an issue for even-year Pink Salmon, as there was essentially no Fraser River or U.S. catch in even years (Van Will 2013). Therefore, catch data quality was rated as Very Good (4.0) for all even years. Odd-year returning catch data came from DFO yearly reports until 1987, then from the Pacific Salmon commission from 1989 onward (Van Will 2013). For odd-year Pink Salmon, the catch in some areas included Fraser and usually smaller proportions of U.S. Pink Salmon (Van Will 2013), and so had to be partitioned, which affected the catch data quality that we assigned. The catch data quality was therefore rated the same as for Fraser Pink Salmon: before 1987, the separation of Fraser and non-fraser ISC Pink Salmon catch was assumed to be Fair (2.0), from , catch data quality was rated as Good (3.0). P. Van Will (DFO, pers. comm.) further partitioned catch into the component CUs, but he recommended that we evaluate productivity at the aggregate level Chum Salmon We received the Inner South Coast (non-fraser) Chum Salmon data from Pieter Van Will in June of The time series was complete with no gaps from 1954 to The aggregate was comprised of the seven Chum Salmon CUs from this region. As with the ISC Pink Salmon data, to fill gaps in the escapement time series, ISC Chum Salmon escapements were estimated by CU based on NuSEDS data, expanded for the average long-term contribution to total escapement as per methods described in English et al. (2004; 2010), but not expanded for observer efficiency (adapted from P. Van Will s spreadsheets ). All major chum-producing streams were enumerated visually using multiple observations and area-under-the-curve estimates, primarily by stream walks and over-flights (Van Will et al 2009a). Smaller and remote streams are no longer enumerated, but most of the ISC escapement is concentrated in streams that are enumerated (Van Will et al 2009a). An additional expansion was used sporadically beginning in 1979 to expand escapement from the monitored streams to all streams, monitored and unmonitored. We reported 15
24 escapements aggregated for the whole Inner South Coast and rated the escapement quality as Fair (2.0) for all years. The catch was summed from multiple PFMAs in the ISC in which Chum Salmon are caught, and include commercial, recreational and First Nations fisheries (Van Will et al. 2009a). The catch data originally came from DFO s Fishery Operating System (FOS) and the sales slip database (Van Will et al. 2014). Chum catch in some ISC areas was a mixture of ISC (non-fraser), Fraser and U.S. origin fish; genetic stock identification has been used since 1985 for catch partitioning, but since 1994, its use has been more sporadic (Van Will et al. 2009a). Therefore, we rated catch as Good (3.0) for 1985 to 1994, and Fair (2.0) before and after those years. Although the data were also estimated by CU, based on the estimated yearly proportion of different CUs that were caught in each PFMA, P. Van Will (DFO, pers. comm.) recommended using the aggregate R/S data. A single age composition was used annually for the aggregate, and these estimates were most often made in Johnstone Strait test fisheries. When test fisheries were not used ( and ), PFMA 12 commercial fishery data were used instead. Age composition data were rated as Good (3.0) for all years. 3.4 Outer South Coast R/S data for Outer South Coast Pink and Chum Salmon CUs were unavailable. However, some West Coast Vancouver Island Chum Salmon data may be available in the future from Diana Dobson (DFO South Coast, Nanaimo) West Coast Vancouver Island Sockeye Salmon R/S data were available for two of 26 Sockeye Salmon CUs from the Outer South Coast. We received escapement, catch and age structure data for Great Central Lake and Sproat Lake Sockeye Salmon CUs from Diana Dobson in June 2014, and we generated R/S time series for for those CUs, with no gaps in the time series. Escapement included adult spawners only, excluding Gilbert-Rich ages 3 2 and 4 3 (i.e., European ages 1.1 and 2.1). Both CUs were caught in the Area 23 fisheries and migrate up the Somass River to their spawning grounds (Hyatt and Steer 1987, DFO 2012). Great Central Lake escapements were counted at either the Great Central or Stamp Falls fishways, and the Sproat escapement was counted at the Sproat Falls fishway (Hyatt et al 2015). Therefore, we rated escapement data quality as Very Good (4.0) for both CUs. Catch data from 1979 to 2009 for Area 23 included commercial, First Nations and recreational catch (DFO 2012), and these estimates were reasonably accurate (D. Dobson, pers. comm.). Some Henderson 16
25 CU fish were present in the catch attributed to Great Central and Sproat, thus positively biasing total return and recruitment estimates slightly, but Henderson Lake contributed only a small proportion to the catch, approximately 13% annually (D. Dobson, pers. comm.). In , Henderson fish were removed from the Barkley Sound aggregate catch using DNA results, but catch in those years did not yet affect the R/S time series reported in the database. Prior to 2012, a boxcar model was used to partition catch; run timing and population distribution assumptions for the three populations were based on population-specific parasite loads recorded for earlier catches (Steer et al. 1986; Steer and Hyatt 1987), and were not verified in all years (D. Dobson, pers. comm.). Therefore, we rated the catch data quality for catch as 2.5 for all years in both time series. The return included all age classes of spawning escapement, not just adults (by inspection of data spreadsheets). Commercial catch sampling and/or annual test fishing were carried out from 1980 to 2009 in Area 23 (DFO 2012), and were used to assess population composition and catch at age by CU (Steer et al, 1986; D. Dobson, pers. comm.). Approximately spawners were sampled in-river weekly at the Stamp and Sproat fishways during the spawning run for scales for ageing, and age composition was applied daily to spawners enumerated at each site, to generate yearly totals of escapement-at-age (E. Porszt, DFO, pers. comm.). Therefore, we rated the age composition data quality as Very Good (4.0) for both CUs. We estimated recruitment from the given datasets by summing the numbers of returns at age, which included all age classes of adult returns, for the appropriate brood years. In the original dataset, R/S was calculated for each age class of recruits; summing those R/S values yielded the same R/S time series as we obtained using our method of estimating recruits. Great Central Lake was fertilized from and from 1977-present, and Sproat Lake was fertilized in the summer of 1985 and for part of 1986 (Hyatt et al. 2004, DFO 2012); any analysis of CU productivity needs to take this into account. 3.5 North and Central Coast Overview The most recent R/S time series for the North and Central Coasts (NCC) were developed by English et al. (2012) and English (2013); the Sockeye, Pink and Chum Salmon data we used were last updated in May These data included escapement, recruitment, total catch, age composition, and exploitation rates, among other quantities, reported both by CU and PFMA. Data organized by both units are reproduced in the database, but more CUs are included in NCC PFMAs than are detailed in the database; for example, escapements reported for a PFMA may be greater than sums of escapement for CUs that are caught in that PFMA. 17
26 English et al. (2012) began with NuSEDS escapement data from indicator streams selected by regional biologists; these were assessed from Poor to Excellent in their survey quality ratings for escapement (i.e., the rating for their Q1 data quality criteria) with 81% assessed as either Fair or Good (see Appendix A for the rating scheme of English et al. 2012, and Tables 2-4 in English et al. 2012). They (1) expanded the sum of the NuSEDS escapement estimates for indicator streams to account for indicator streams that were not surveyed in a given year (i.e. adjusted observed escapement to all indicator streams by stratum, Appendix A in English et al. 2012), ; (2) used the average escapements for each stream in a CU or PFMA to calculate the expansion factor needed to expand the adjusted escapement indicator streams to an estimate of the total escapement within a CU or PFMA (Table A3 in English et al. 2012), and (3) expanded to account for observer efficiency, as estimated by regional biologists (Table A4 in English et al. 2012). The expansion factor for observer efficiency was held constant across all years for each species and SA so as not to affect trends in escapement estimates. For details of the escapement expansion methods, see English et al. 2012, Appendix A (reproduced here as Appendix E). English et al. (2012) also rated three aspects of annual escapement data quality (Appendix A): survey quality (Q1), which rated the quality of the escapement data for indicator streams; survey execution rating (Q2) based on the expansion factor used to account for streams not surveyed in a given year; and the index portion (Q3) based on the proportion of the CU s or PFMA s total escapement over a ten-year period (although the ratings were recorded annually) that was accounted for by the indicator stream(s). Their data quality ratings ranged from Poor (1.0) to Excellent (5.0) and are reproduced in our database. To determine escapement data quality for data provided for NCC CUs, we re-rated Q3 (Table 3), then took the lowest value of it, Q1 and Q2 as our rating of the overall annual escapement data quality. For PFMAs in which the original Q3 rating was <5, we adjusted the Q3 value given for the PFMA according to Table 3, but when the original Q3=5, we used the average value of the adjusted Q3 of component CUs as the adjusted Q3 for the PFMA, then took the lowest of Q1, Q2, and the adjusted Q3 as our escapement data quality rating. Catch was estimated for the NCC CUs and PFMAs differently compared to the other time series. Exploitation rate estimates are obtained for a CU or PFMA using the models or methods summarized in Table 1 in English et al. (2012). The NCC Sockeye, Pink and Chum Salmon CUs associated with each PFMA are listed in Tables 2 to 4 in English et al. (2012). Annual exploitation rates for each species in a PFMA (except for Skeena and Nass Sockeye Salmon, which had different annual estimates of exploitation rate within a PFMA) were then used in combination with the total escapement calculated by CU or PFMA to estimate the amount of catch attributable to a specific CU. Total annual return by CU or PFMA was calculated, as usual, as the annual sum of escapement and catch for that unit. The catch and exploitation rate estimates for PFMAs 3, 4, and 5 Sockeye Salmon CUs were derived from the latest version of the Northern Boundary Sockeye Run Reconstruction (NBSRR) Model (Alexander et al. in prep.). Average annual age compositions were applied across all years for Sockeye and Chum Salmon PFMAs and CUs except for Nass (PFMA 3) and Skeena (PFMA 4) Sockeye Salmon. Also, CUs in a PFMA often had the same average age composition, as for example: Spiller-Fitz-Hugh-Burke and Bella Coola-Dean River 18
27 CUs use the age composition data for PFMA 8 derived mostly from age samples for the Bella Coola River Late CU Chum Salmon. Those three CUs and the PFMA itself had the same average annual age composition for all years in their time series. Age composition was derived from the Pacific Region Salmon Age Database (English et al. 2012); see the comments section of the productivity database summary spreadsheet for more information, or Tables 2 to 4 in English et al. (2012). Other assumptions and uncertainties associated with the NCC run reconstructions were detailed in English et al. (2012) and were reproduced here in Appendix D. At the time of writing, work has begun on streamlining the process for updating the NCC Salmon Database, which includes all Pacific Salmon species. Contact Karl English for further details and data updates, or the Fisheries and Oceans Canada Prince Rupert field office (417-2nd Avenue West, Prince Rupert, BC V8J 1G8). In some cases, the CU names used by English et al. (2012) have been changed to the new CU names according to Holtby (2013); i.e., Sockeye Salmon CUs Damdochax updated as Damdochax/Wiminasik; Freeda as Freeda/Brodie; Tsimtack/Moore/Roger as Tsimtack Lake; Chum Salmon Stanley Creek as Stanley Creek Early. Tables 2-4 in English et al. (2012) for NCC Sockeye, Pink and Chum Salmon list numbers of streams associated with a CU that do not always correspond to the number of streams attributed to a CU in the most recent version of the CU list. For a list of which waterbodies were included in the CUs for NCC, contact Karl English or the Department of Fisheries and Oceans Prince Rupert field office (417-2nd Avenue West, Prince Rupert, BC V8J 1G8) Sockeye Salmon Most of the Sockeye Salmon R/S time series reported by PFMA began with the 1977 brood year, and all ended in the mid-2000s. For PFMA 4 Sockeye Salmon CUs, the R/S time series began as early as 1956 or 1957, and most ended in the mid-2000s. Fully 2/3 of the CUs had missing years of R/S data within the time series. For some of those, e.g., Curtis Inlet, Hartley Bay, and Mary Cove Creek, the time series were short and/or sporadic and therefore may be of little use for assessing productivity trends. However, the data reported by PFMA does not have missing years. The database contains 50 CUs of the 103 current NCC sockeye CUs, and five subsets of data from the Babine Complex CU. Asitika, Skeena River-high interior, Upper Nass, and Yeo CUs, and Backland (a former CU), had <5 years of R/S data and were therefore not included in the database although those data were available. PFMAs 2W and 5 do not have R/S time series included in our database because recruits were not calculated due to the unavailability of ageing data, but these PFMAs are included in the database because the CUs that were caught within them do have calculated R/S time series. First we will describe NCC Sockeye Salmon data in general, then the special cases of the Nass and Skeena regions. 19
28 We rated catch data quality as Fair (2.0) by PFMA because the catch was estimated by multiplying exploitation rate by escapement. In addition, for cases in which multiple CUs were caught in a single PFMA, the partitioning of the catch into CUs was determined by multiplication of exploitation rates for the whole PFMA times the escapement by CU. Quality ratings of catch data reported by CUs were always rated lower than the quality of catch data rated for the PFMA in which the CU was caught, because the catch of a specific CU may not have occurred completely within the PFMA to which it was attributed. Specifically, if >1 CU was caught in the PFMA, then the quality of catch data by CU was assessed as Poor (1.0), but if the CU was by itself in the PFMA, then it was assessed as 1.5. Many CUs within the Skeena (PFMA 4) and Nass (PFMA 3) aggregates have been extensively monitored, and therefore, most of those indicator streams were rated here as 5.0 for escapement data quality. For the CUs within the Skeena and Nass areas, exploitation rates were estimated annually using the Northern Boundary Sockeye Run Reconstruction model (English et al. 2004; 2005; Alexander et al. 2010; Alexander et al. unpublished mss.), and catches were estimated by multiplying exploitation rates and escapement data. However, catch partitioning was somewhat better than for other Sockeye Salmon populations in the NCC. Run timing offsets were estimated for CUs within the Nass and Skeena watersheds, and the same offsets were applied each year to the average run timing of all populations in the return year. For the Nass aggregate, average CU timing relative to the mean run timings were determined using DNA population composition from Hall et al. (2010) (Table B1 in English et al. 2012). The average CU run timing for CUs in the Skeena aggregate were derived from Cox-Rogers et al. (2004) (English et al. 2012). They were subsequently updated slightly and reapplied according to Table 1 in English (2013). Catch estimates were based on fishery-specific stock-composition data that were partitioned using run reconstructions. We rated the catch data quality for CUs that were part of the Nass and Skeena aggregates as Good (3.0). We assumed the quality of age composition data to be Fair (2.0) for populations that used an average age composition for all years in their time series, including the Nass and Skeena aggregates. Babine subpopulations were the only ones that had age composition estimated annually, and these were scored Very Good (4.0) Pink Salmon (odd and even return years) For odd return years, the R/S time series comprised eight of the 11 CUs. The odd-year time series for CUs in PFMAs 3-5 began in The time series for all other CUs began in 1979, and all time series ended in Similarly, the even-year time series for PFMAs 3-5 CU began in 1954, other CUs began in 1978, with most ending in Seven of eight CUs are covered in the database for even return years. Time series were complete except for three missing years for Odd-Year Pink Salmon, and two missing years in even return years, both late in the time series for PFMA 10. We assumed data quality for Pink Salmon (odd and even) catch in the NCC by PFMA was Fair (2.0) because the catch was estimated by multiplying exploitation rate by escapement. For cases in which 20
29 there was >1 CU listed as part of a PFMA, then quality of catch data as estimated for the CU was 1.5. For case in which there were >1 CU in a PFMA, or if a CU was caught in multiple PFMAs, its catch data quality was rated as Fair (1.0) Chum Salmon Most R/S time series by both CU and PFMA began in 1977, with only those CUs associated with PFMA 4 beginning as early as 1954, and most ended in Eighteen out of 20 CUs for NCC were covered. The sporadic time series as reported by CU were Stanley Creek, Middle Skeena, and Lower Skeena; however, there were no gaps in the time series reported by PFMA. The Lower Nass CU had <5 years of R/S time series data (because there were few years with catch data) and therefore was excluded from the database. We assumed data quality for Chum Salmon catch by PFMA was Fair (2.0). For cases in which there was only one CU listed as part of a PFMA, the quality of catch data was rated as 1.5, but where there were more than one CU in a PFMA, the quality of Chum Salmon catch was rated as Poor (1.0), according to the same reasoning as described for NCC Pink Salmon. Because each CU used the same average annual age composition for all years in the time series as each PFMA or grouping of CUs of which it was a part, we assumed quality of age data to be 2.0 for all populations. 3.6 Examples of time series To provide examples of the data contained in the database, two time series with corresponding R/S data quality (RQ) are provided in Figures 6 and 7. One of the better quality datasets (Figure 6) shows an unbroken time series of recruits-per-effective female spawner for combined Early Summer and Summer Chilko Sockeye Salmon CUs from the Fraser River region. The annual RQ is rated as Good (> 3.0) for most of the time series. Figure 7 shows the Middle Skeena Chum Salmon CU from the North and Central Coast region. The time series has various gaps, and the annual RQ ratings for available years are in the Poor to Fair range. Histograms of the mean RQ for Sockeye, Pink and Chum Salmon from the NCC and the South Coast (SC), including the Fraser River, show the frequency of RQ ratings for the different species and main regions, and also give an indication of the relative numbers of CUs in those regions (Figure 8). See section 4 for further discussion. 21
30 4 Discussion Because this is the first time British Columbia salmon productivity data have been compiled and assessed for quality, the dataset generated for our work differs and replaces the Canadian component of previously developed productivity databases for other externally driven projects (e.g., Dorner et al. 2013; Peterman and Dorner 2012; Mueter et al. 2009; Dorner et al. 2008, Mantua et al. 2007). Although most of our data were similar to the relevant data in the above studies, a preliminary comparison of the two sets of data demonstrated some major differences. Information and data we received from regional biologists were not always consistent with NuSEDS and sometimes added other dimensions to the assessment of the data quality. To properly evaluate temporal and spatial trends in salmon productivity, and thus to make the best use of the BC salmon escapement and recruitment data collected by DFO and other agencies, it is necessary to have an up-to-date, verified recruit-per-spawner dataset that is assembled in a single location. In addition, it is highly desirable for analysts to have some measure of the reliability of the data, especially given that data quality varies in consistency and methodology of collection across the province. To our knowledge, this is the first time that ratings of data quality have been systematically applied to multiple fishery data types. Figures 6 and 7 provide examples of productivity time series and their associated quality ratings. The Fraser Sockeye Salmon populations, including Chilko (Figure 6), tend to have higher productivity ratings (RQ) than other species and regions. The spike in productivity for brood year 1989 was likely due to lake fertilization that was conducted in 1988 (Grant et al. 2011; see also productivity comments column in the main database file, Salmon_RS_Database.csv). Bradford et al. (2000) found that fertilization appeared to increase smolt to adult survival in the ocean subsequent to fertilization due to increased smolt size; Sockeye Salmon leave Chilko Lake to migrate to sea as age 1 and 2 smolts. The response of the R/S estimate to the lake fertilization experiment underscores the importance of having a good biological understanding of the system wherever possible, and consulting the metadata where they are available. The analyst might choose to exclude productivity data associated with such perturbations to the system, depending upon the purpose of a specific analysis. Some time series in other regions have data gaps, and most have lower RQ ratings than Fraser Sockeye Salmon CUs; an example is the NCC Middle Skeena Chum CU (Figure 7). The analyst would reasonably have less confidence in the latter time series than the former for these reasons. Variability in data quality among species and regions (Figure 8) allow analysts to choose which time series and perhaps which regions to evaluate, again depending upon their goals. Although we endeavoured to identify and apply acceptable standards that applied across species and datasets, we encourage users of these datasets to consider alternative assumptions regarding the quality of the data. The overall data quality rating summaries by time series, even when rated highly, are not intended as stamps of approval for all years in the time series, and analysts are encouraged to carefully examine the comments columns in the database and the database summaries by species. In 22
31 general, it was difficult to come up with plausible ratings of catch and age composition data quality because metadata regarding these data are not readily available for most populations. Furthermore, data quality ratings are to be considered approximate; a rating of one time series as 3.2 does not make it significantly better than another time series rated as 3.0. In addition, analysts should make themselves aware of shifts in methodology and inter-annual changes in data quality, even for time series that are rated highly, and we recommend that they consult original sources of the data provided here. However, when a whole time series is rated more poorly, that should act as a flag for analysts to assess the annual time series data and to make decisions about whether to exclude some years from their analyses based on concerns about data quality. Also, the data quality ratings we assigned to various sets of catch and ageing data are approximate and may be refined in the future. For some limitations of the data and the data quality ratings, see Appendix F. It is also hoped that this productivity database will provide an example for other jurisdictions and perhaps act as a first step toward assembling a Pacific Salmon productivity database for the Pacific Rim. 4.1 Recommendations We highly recommend that this database be updated regularly to keep it current, and that all changes to the database, and reasons for these changes be documented. Addition recommendations (not prioritized) include: Expand database to include BC Chinook and Coho Salmon Expand database to include other salmon-producing regions of the North Pacific Incorporate more detailed comments from data providers and others to improve the data quality ratings, especially for catch and age composition data Utilize Stream Inspection Log (SIL) reports for escapement metadata Find and assemble additional metadata regarding escapement, catch, and ageing methodology, especially from older and unpublished sources Reassess methods of rating data quality, especially RQ Reassess methods of summarizing data quality for entire time series Investigate ways to bring relative proportions of catch and escapement into data quality ratings E.g., use a population's annual proportion of the run in its run timing group to inform catch data quality ratings Investigate alternate ways to combine data quality ratings from multiple return years into a single recruit-per-spawner data quality rating corresponding to brood year Add comments regarding whether precocious males were included in spawning escapement and catch Increase standardization of field protocols 23
32 To be consistent with data from other areas, update Fraser Sockeye Salmon information to report on R/S rather than R/EFS Acknowledgements We received datasets and other assistance from many individuals that we wish to thank: Bruce Baxter, Katrina Connors, Stephen Cox-Rogers, Diana Dobson, Brigitte Dorner, Peter Etherton, Michael Folkes, Matt Grinnell, Charles Hannah, Jason Hwang, Randall Peterman, Erin Porszt, Greg Ruggerone, Brian Spilsted, Margot Stockwell, Joe Tadey, and Pieter Van Will. Geoff Mullins of JKL Research Ltd. produced Fig. 1. We thank the Pacific Salmon Commission for their knowledge of and input on Fraser River Sockeye and Pink Salmon, and the many biologists and technicians who gathered the data included in the database. Funding for this project was provided DFO and the Canadian Space Agency s Government- Related Initiatives Program (GRIP). 24
33 References cited Alexander, R., English, K.K., Peacock, D., and Oliver, G Assessment of the Canadian and Alaskan Sockeye Stocks harvested in the northern boundary fisheries using run reconstruction techniques, Draft report for Pacific Salmon Comm., Northern Boundary Technical Committee. Alexander, R., English, K.K., Peacock, D., Cox-Rogers, S., and Piston, A. in prep. Assessment of the Canadian and Alaskan Sockeye Stocks harvested in the northern boundary fisheries using run reconstruction techniques, Draft report for Pacific Salmon Comm., Northern Boundary Technical Committee. Beacham, T.D., McIntosh, B., MacConnachie, C., Spilsted, B., and White, B Population structure of Pink Salmon (Oncorhynchus gorbuscha) in British Columbia and Washington, determined with microsatellites. Fish. Bull. 110: Beacham, T.D., Lapointe, M., Candy, J.R., McIntosh, B., MacConnachie, C., Tabata, A., Kaukinen, K., Deng, L., Miller, K.M., and Withler, R.E Stock identification of Fraser River Sockeye Salmon using microsatellites and major histocompatibility complex variation. Trans. Am. Fish. Soc. 133: Bradford, M.J., Pyper, B.J., and Shortreed, K.S Biological responses of sockeye salmon to the fertilization of Chilko Lake, a large lake in the interior of British Columbia. N. Am. J. Fish. Manage. 20: Cox-Rogers, S., Hume, J.M.B., and Shortreed, K.S Stock status and lake based production relationships for wild Skeena River Sockeye salmon. DFO Can. Sci. Advis. Sec. Doc. 2004/010: ii + 56 p. Cox-Rogers, S Skeena sockeye sub-stock run-timing and abundance evaluated using Tyee test fishery DNA: Fisheries and Oceans Canada Memorandum dated 23 February p. DFO (Fisheries and Oceans Canada) Canada s policy for the conservation of wild Pacific salmon. Fisheries and Oceans Canada, Vancouver, British Columbia. DFO (Fisheries and Oceans Canada) Assessment of Area 23 Sockeye and 2010 Forecast (Barkley Sound and Alberni Inlet). DFO Can. Sci. Advis. Sec. Sci. Advis. Rep. 2012/033. Dorner, B., Peterman, R.M., and Haeseker, S.L Historical trends in productivity of 120 Pacific Pink, Chum, and Sockeye Salmon stocks reconstructed by using a Kalman filter. Can. J. Fish. Aquat. Sci. 65:
34 Dorner, B., Holt, K.R., Peterman, R.M., Jordan, C., Larsen, D.P., Olsen, A.R., and Abdul-Aziz, O.I Evaluating alternative methods for monitoring and estimating responses of salmon productivity7 in the North Pacific to future climatic change and other processes: A simulation study. Fisheries Research 147: English, K, N. Blakely, Mochizuki, T., Sliwinski, C., and Blakely, A Fisheries resource manuals, North and Central coast. Canada. Dept. of Indian Affairs and Northern Development. iii+49 p. English, K.K., Alexander, R., Peacock, D., and Oliver, G Assessment of the Canadian and Alaskan Sockeye Stocks harvested in the northern boundary fisheries using run reconstruction techniques, Prepared for Pacific Salmon Comm. Northern Boundary Technical Committee. 59 p. English, K.K., Blakley, A.C., Mochizuki, T., and Robichaud, D Coast-wide review of B.C. salmon indicator streams and estimating escapement, catch and run size for each salmon conservation unit. Report prepared for Fisheries and Oceans Canada and Ecotrust. 69 p. English, K.K., Edgell, T.C., Bocking, R.C., Link, M., and Raborn, S Fraser River sockeye fisheries and fisheries management and comparison with Bristol Bay sockeye fisheries. LGL Ltd. Cohen Commission Tech. Rept. 7: 190p & appendices. Vancouver, English, K.K., Mochizuki, T., and Robichaud, D Review of North and Central Coast Salmon indicator streams and estimating escapement, catch and run size for each salmon Conservation Unit. Report prepared for Pacific Salmon Foundation (18 April 2012), 78 p. English, K.K Extended time-series of catch and escapement estimates for Skeena Sockeye, Pink, Chum, Coho and Chinook Salmon Conservation Units. Report prepared for Pacific Salmon Foundation. (May 2013) Gable, J., and Cox-Rogers. S Stock Identification of Fraser River Sockeye Salmon: Methodology and management application. Pacific Salmon Comm. Tech. Rep. No.5: 36p. Grant, S.C.H., MacDonald, B.L., Cone, T.E., Holt, C.A., Cass, A., Porszt, E.J., Hume, J.M.B.,and Pon, L.B Evaluation of uncertainty in Fraser Sockeye (Oncorhynchus nerka) Wild Salmon Policy status using abundance and trends in abundance metrics. DFO. Can. Sci. Advis. Sec. Res. Doc. 2011/087. viii p. Grant, S.C.H., and Pestal, G Integrated biological status assessments under the Wild Salmon Policy using standardized metrics and expert judgement: Fraser River Sockeye Salmon (Oncorhynchus nerka) case studies. Can. Sci. Advis. Sec. Res. Doc. 2012/206. v p. Grant, S.C.H., Townsend, M., White, B., and Lapointe, M Fraser River Pink Salmon (Oncorhynchus gorbuscha) data review: Inputs for biological status and escapement goals. Final Project Report to Southern Boundary Restoration and Enhancement Fund. viii
35 Groot, C., and Margolis, L. Pacific Salmon life histories University of British Columbia Press, Vancouver, B.C. Hall, P.E.D., Bocking, R.C., Hume, J.M.B., Selbie, D.T., Candy, J.R., Alexander, R.F., and Gottesfeld, A.S Status of Nass River Sockeye Salmon (Oncorhynchus nerka). Draft report submitted to DFO Can. Sci., Advis. Sec. Henry, K.A Racial identification of Fraser River Sockeye Salmon by means of scales and its application to salmon management. lnt. Pac. Salmon Fish. Comm. Bull. 12: 97 p. Holtby, L.B DecoderRing.xls. Unpublished report provided to B. Baxter, Fisheries and Oceans Canada, Pacific Biological Station, August Holtby, L.B., and Ciruna, K.A Conservation Units for Pacific Salmon under the Wild Salmon Policy. DFO Can. Sci., Advis. Sec. Doc. 2007/070. viii p. Hyatt, K.D., and Steer, G.J Barkley Sound sockeye salmon (Oncorhynchus nerka): Evidence for over a century of successful stock development, fisheries management, research and enhancement efforts. Pp in H. D. Smith, L. Margolis and C. C. Wood [Ed]. Sockeye salmon population biology and future management. Can. Spec. Publ. Fish. Aquat. Sci. 96: 486p. Hyatt K.D., and Rankin, D.P A habitat based evaluation of Okanagan sockeye salmon objectives. PSARC Working Paper S Canada Department of Fisheries and Oceans, Pacific Science Advisory Review Committee, Pacific Biological Station, Nanaimo: BC. gc.ca/csas/csas/publications/resdocs-docrech/1999/1999_191_e.htm Hyatt, K.D., McQueen, D.J., Shortreed, K.S., and Rankin, D.P Sockeye salmon (Oncorhynchus nerka) nursery lake fertilization: Review and summary of results. Environ. Rev. 12: Hyatt, K.D., and Stockwell, M.M Fish and Water Management Tool project assessments: record of management strategy and decisions for the water year. Can. Manuscr. Rep. Fish. Aquat. Sci. 2913: ix + 65 p. Hyatt, K.D., Stiff, H.W., Stockwell, M.M., Luedke, W., Rankin, D.P., Dobson, D., and Till, J A synthesis of adult Sockeye salmon migration and environmental observations for the Somass watershed, Can. Tech. Rep. Fish. Aquat. Sci. 3115: vii p. Irvine, J.R., and Akenhead, S.A Understanding smolt survival trends in Sockeye Salmon. Marine and Coastal Fisheries 5(1): Irvine, J.R., and Nelson, T.C Proceedings of the 1994 salmon escapement workshop plus an annotated bibliography on escapement estimation. Can. Manuscr. Rep. Fish. Aquat. Sci. 2305: 97 p. 27
36 Irvine, J.R., Michielsens, C.J.G., O Brien, M., White, B.A., and Folkes, M Increasing dominance of odd-year returning Pink Salmon. Transactions of the American Fisheries Society. 143 (4): Knudsen, E.E Managing Pacific salmon escapements: the gaps between theory and reality. In E.E. Knudsen, D.D. MacDonald, J.E. Williams, and D.W. Reiser. Sustainable Fisheries Management: Pacific Salmon, Lewis Publishers, Boca Raton, Florida. pp Knudsen, E.E Criteria for categorizing spawner/recruit data quality. In Hilborn, R., R. Lessard, D. Goodman, B. Bue, M. Adkison, J. Stanford, D. Whited, and E. Knudsen Arctic Yukon Kuskokwim sustainable salmon initiative project final product: Alternative methods for setting escapement goals in AYK. pp FR.pdf Mantua, N.J., Taylor, N.G., Ruggerone, G.T., Myers, K.W., Preikshot, D., Augerot, X., Davis, N.D., Dorner, B.,Hilborn, R., Peterman, R.M., Rand, P., Schindler, D., Stanford, J., Walker, R.V., and Walters, C.J The salmon MALBEC project: a North Pacific-scale study to support salmon conservation planning. North Pacific Anadromous Fish Commission Doc School of Aquatic and Fishery Sciences, University of Washington, Seattle, WA , U.S.A, 49 pp. Available from Mueter, F.J., Ware, D.M., and Peterman, R.M. 2002a. Spatial correlation patterns in coastal environmental variables and survival rates of Pacific salmon in the Northeast Pacific Ocean. Fisheries Oceanography 11(4): Mueter, F.J., Peterman, R.M., Pyper, B.J. 2002b. Opposite effects of ocean temperature on survival rates of 120 stocks of Pacific salmon (Oncorhynchus spp.) in northern and southern areas. Can. J. Fish. Aquat. Sci. 59(3): plus the erratum printed in Can. J. Fish. Aquat. Sci. 60: 757. Mueter, F.J., Pyper, B.J., and Peterman, R.M Relationships between coastal ocean conditions and survival rates of salmon in the Northeast Pacific Ocean at multiple lags. Transactions of the American Fisheries Society 134: Mueter, F.J., Boldt, J.L., Megrey, B.A., and Peterman, R.M Recruitment and survival of Northeast Pacific Ocean fish stocks: temporal trends, covariation, and regime shifts. Canadian Journal of Fisheries and Aquatic Sciences 64(6): Peterman, R.M., Pyper, B.J., Lapointe, M.F., Adkison, M.D., and Walters, C.J Patterns of covariation in survival rates of British Columbian and Alaskan sockeye salmon stocks. Can. J. Fish. Aquat. Sci. 55: Peterman, R.M., and B. Dorner A widespread decrease in productivity of sockeye salmon (Oncorhynchus nerka) populations in western North America. Can. J. Fish.Aquat. Sci. 69(8):
37 PSC (Pacific Salmon Commission) Report of the Fraser River Panel to the Pacific Salmon Commission on the 2004 Fraser River Sockeye Salmon fishing season. Prepared by the Pacific Salmon Commission, May p. PSC (Pacific Salmon Commission) Report of the Fraser River Panel to the Pacific Salmon Commission on the 2008 Fraser River Sockeye Salmon fishing season. Prepared by the Pacific Salmon Commission, May ii + 52 p. Pyper, B.J., Mueter, F.J., Peterman, R.M., Blackbourn, D.J., and Wood, C.C Spatial covariation in survival rates of Northeast Pacific pink salmon (Oncorhynchus gorbuscha). Can. J. Fish. Aquat. Sci. 58: Pyper, B.J., Mueter, F.J., Peterman, R.M., Blackbourn, D.J., and Wood, C.C Spatial covariation in survival rates of Northeast Pacific chum salmon (Oncorhynchus keta). Trans. Am. Fish. Soc. 131(3): plus the erratum printed in Trans. Am. Fish. Soc. 131(4):796. Starr, P., and Hilborn, R Reconstruction of harvest rates and stock contribution in gauntlet salmon fisheries: application to British Columbia and Washington Sockeye (Oncorhynchus nerka). Can. J. Fish. Aquat. Sci. 45: Steer, G.J., Cousens, N.B.F., Stiff, H., and Hyatt, K.D An analysis of gear selectivity and sources of bias in estimates of age and stock composition of the Barkley Sound sockeye salmon (Oncorhynchus nerka) catch. Can. Tech. Rep. Fish. Aquat. Sci. 1445: 77p. Steer, G.J., and Hyatt, K.D Use of a run timing model to provide in-season estimates of sockeye salmon (Oncorhynchus nerka) returns to Barkley Sound, Can.Tech. Rep. Fish. Aquat. Sci Stockwell, M.M., and Hyatt, K.D A summary of Okanagan sockeye salmon (Oncorhynchus nerka) escapement surveys by date and river segment from 1947 to Can. Data. Rep. Fish. Aquat. Sci. 1106: 34 p. plus data CDROM. Van Will, P Inner South Coast Pink stock reconstructions: escapement and total stock reconstructions by Conservation Units. Unpublished manuscript. (8 October, 2013) Van Will, P Inner South Coast Chum stock reconstructions: escapement and total stock reconstructions by Conservation Units (Fall Timed). Unpublished manuscript. (15 May 2014) Van Will P., Brahniuk, R., Hop Wo, L., and Pestal, G. 2009a. Certification Unit Profile: Inner South Coast Chum Salmon (Excluding Fraser River). Can. Manuscr. Rep. Fish. Aquat. Sci. 2876: vii + 63p. Van Will P., Brahniuk, R., and Pestal, G. 2009b. Certification Unit Profile: Inner South Coast Pink Salmon (Excluding Fraser River). Can. Manuscr. Rep. Fish. Aquat. Sci. 2877: vii + 63p. 29
38 Tables Table 1. Summary of data included in the database, with data sources. The Number of CUs column shows the numbers of CUs covered directly or indirectly (i.e., in the case of reporting by aggregate) in the database. The 51 NCC Sockeye Salmon CUs includes the 5 former CUs. The Publication column indicates any publications used as sources of data or metadata. Version Date indicates the last update of the source data. All datasets have escapement, catch and R/S data, and age composition data for Sockeye and Chum Salmon. The datasets vary in what other kinds of data are available. ISC is Inner South Coast, OSC is Outer South Coast (i.e., West Coast of Vancouver Island), NCC is North and Central Coast. Species Area Number of CUs Data Source Publication Sockeye ISC (Fraser) 19 S. Grant Grant et al. 2011; Grant and Pestal 2012 Version Date July 2014 Pink (even) Pink (odd) ISC (non-fraser) NA Okanagan 1 M. Stockwell & K. Hyatt Stockwell and Hyatt 2003 May 2014 OSC 2 D. Dobson DFO 2012 June 2014 NCC 51 K. English English et al. 2012; English 2013 ISC (Fraser) NA June 2014 ISC (non-fraser) 2 P. Van Will Sept 2013 OSC NA NCC 8 K. English English et al. 2012; English 2013 ISC (Fraser) 1 Grant et al. 2014, Table 1 June 2014 Grant et al May 2014 ISC (non-fraser) 5 P. Van Will Van Will et al. 2009b; Van Will et al Sept 2013 OSC NA NCC 8 K. English English et al. 2012; English 2013 Chum ISC (Fraser) NA ISC (non-fraser) 7 P. Van Will Van Will et al. 2009a; Van Will et al OSC NA NCC 18 K. English English et al. 2012; English 2013 June 2014 May 2014 & June 2014 June
39 Table 2. Files associated with the Sockeye, Pink and Chum Salmon Productivity (R/S) database. These files are available for download at: Note that this Technical Report is also available through the online Fisheries and Oceans Canada WAVES website at File name Salmon_RS_Database.csv Salmon_RS_Time_Series_Summary.csv Salmon_RS_Decadal_Summary.csv Salmon_RS_Field_Definitions.csv Salmon_RS_README.rtf Canadian_Technical_Report_3130.pdf Description Main Productivity (R/S) spreadsheet. Summaries of individual R/S time series of CUs and PFMAs by regions and species. Decadal averages of data quality by species, region, CU and PFMA. Description of the meanings of field names (column headers) of the other *.csv files. File saved in Rich Text Format, brief overview of *.csv files and explanations. Productivity (Recruits-per-Spawner) Data for Sockeye, Pink, and Chum Salmon from British Columbia. Canadian Technical Report of Fisheries and Aquatic Sciences
40 Table 3. Adjustment of the Q3 escapement quality rating from English et al. (2012). Q3 rated the proportion of the CU s or PFMA s total escapement that was accounted for by the indicator stream(s). The first four rows show the English et al. (2012) ratings for data quality rating Q3 and associated criteria (first three columns), and our revised ratings in the two columns on the right. The last four rows show our expansion of the English et al. (2012) Excellent category, with the adjusted ratings. Q3 rating Value Proportion total escapement Adjusted Q3 Revised Value Poor 1 <20% of the average total escapement for surveyed Poor 1 streams in the CU Fair % of the average total escapement for surveyed Poor 1 streams in the CU Good % of the average total escapement for surveyed Fair 2 streams in the CU Very Good % of the average total escapement for surveyed Fair 2 streams in the CU Excellent 5 >50% of the average total escapement for surveyed Fair 2 streams in the CU, and < 60% of streams in the CU were included in total escapement Excellent 5 >50% of the average total escapement for surveyed Good 3 streams in the CU, and 60% x 74% of streams in the CU were included in total escapement Excellent 5 >50% of the average total escapement for surveyed Very Good 4 streams in the CU, and 75% x 89% of streams in the CU were included in total escapement Excellent 5 >50% of the average total escapement for surveyed streams in the CU, and 90% x 100% of streams in the CU were included in total escapement Excellent 5 32
, Okanagan, Outer South Coast, and North and Central Coast (NCC).")
41 Figures Figure 1. Geographic boundaries of the regions referred to in the report and database: Fraser, Inner South Coast (ISC, non-fraser), Okanagan, Outer South Coast, and North and Central Coast (NCC). For convenience, the Osoyoos Sockeye Salmon CU has been grouped with ISC in the report, but is indicated here as its own region, the Okanagan. The cross-hatched area indicates an area that is part of the ISC for Sockeye, Chum and even-returning year Pink Salmon, but is part of the NCC for odd-year returning Pink Salmon (i.e., the Homathko-Klinaklini-Smith-Rivers-Bella Coola-Dean (odd) CU). For additional explanation, see section 3.1. (Map by JKL Research Ltd.) 33


.")
42 34 Figure2. Screen captures of the main database spreadsheet, Salmon_RS_Database.csv, showing all fields (column headers). For field definitions, see Figure 5.
43 35 Figure 3. Screen captures from the summary spreadsheet Salmon_RS_Time_Series_Summary.csv, showing all fields (column headers). For field definitions, see Figure 5.

44 36 Figure 4. Screen capture from the top left of the spreadsheet Salmon_RS_Decadal_Summary.csv, showing the beginning of the Sockeye Salmon section with the first eight of 91 columns. For field definitions of the first three columns, see Figure 5.

45 Figure 5. Screen capture of the Salmon_RS_Field_Definitions.csv file with the Description column wordwrapped. The file shows field descriptions for the files Salmon_RS_Database.csv, Salmon_RS_Decadal_Summary.csv, and Salmon_RS_Decadal_Summary.csv beginning in rows 2, 63, and 93, respectively (continued below). 37
.")
46 Figure 5 (continued). 38
.")
47 Figure 5 (continued). 39
48 Figure 6. Recruit-per-effective-female spawner time series plot of two Chilko Sockeye Salmon CUS (combined Early Summer and Summer) with the corresponding annual R/EFS data quality ratings (RQ). The extreme R/S estimate in brood year 1989 was associated with lake fertilization that was begun in The horizontal line shows the mean of the R/S estimates. Note that unlike Figure 7, the y-axis on the upper plot is shown in units of R/EFS. 40
49 Figure 7. Recruit-per-spawner time series plot of the Middle Skeena Chum CU from the North and Central Coast (NCC) region with the corresponding annual R/S data quality ratings (RQ). The horizontal line shows the mean of the R/S estimates. Note that unlike Figure 6, the y-axis on the upper plot is shown in units of R/S. 41
50 Figure 8. Number of CUs by R/S data quality rating (RQ) for Sockeye, Pink and Chum Salmon from the North and Central Coast and the South Coast (SC). SC Sockeye Salmon do not include the Osoyoos CU, but the latter is grouped with them here for convenience. Fraser River Sockeye Salmon CUs are included in the Southern BC and Okanagan Sockeye histogram. Both ecotypes of Pink Salmon are shown together, and the mean RQ for the whole time series of Fraser River Pink Salmon (odd) was used. 42
51 Appendices Appendix A: Escapement data quality estimation from Grant et al. (2011) (p. 30) : 1) Poor: an estimate with poor accuracy due to poor counting conditions, few surveys (one or two in a given year), incomplete time series, etc.; 2) Fair: an estimate using two or more visual inspections that occur during peak spawning where fish visibility is reasonable; methodology and data quality varies across the time series in terms of good to poor quality; 3) Good: four or more visual inspections with good visibility; 4) Very Good: an estimate of high reliability using mark recapture methods, DIDSON methods, or nearcomplete fence counts that have relatively high accuracy and precision. Visual surveys that have been calibrated with local fence programs; 5) Excellent: an unbreached fence estimate with extremely high accuracy given an almost complete census of counts. from English et al. (2012) data sheets Table A1. English et al. (2012) data quality estimation for three escapement data variables for the North and Central Coast (from Field Defns.xlsx). Field Name Definition Q1 Survey Quality Rating (1-5) Q2 Survey Execution Rating (1-5) Q3 Index Portion (1-5) from English et al (pp ): The relative survey rating scale presented in (Figures 3-7, lower graph) was comprised of three sub-ratings, which included: a) survey quality; b) survey execution and c) survey coverage for the indicator streams within each PFMA or CU. A five point scale was used for each of these three sub-ratings, where 1= a poor score and 5= an excellent score. The ratings for survey quality [data quality category Q1] were: 1) Poor quality - An estimate of poor reliability due to few surveys, counting deficiencies, etc. 43
52 2) Fair quality - An estimate of moderate reliability based on two or more visual inspections (i.e., low quality AUC estimate); 3) Good quality - An estimate of good reliability based on three or more visual inspections (i.e., medium quality AUC estimate); 4) Very Good quality - An estimate of high reliability based on MR data, almost complete fence counts, or high quality AUC estimates; 5) Excellent quality - An estimate of very high reliability from an unbreached fence count. The ratings for the degree to which the surveys of indicator streams were conducted (survey execution) were calculated based on the expansion factor used to account for indicator streams not surveyed in a given year [data quality category Q2]. The portion that the surveyed streams represent of the average escapement to all indicator stream was converted in to a rating of 1-5 as follows: 1) Poor execution 1-20% of the average escapement for indicator streams; 2) Fair execution 20-40% of the average escapement for indicator streams; 3) Good execution 40-60% of the average escapement for indicator streams; 4) Very Good execution 60-80% of the average escapement for indicator streams; and 5) Excellent execution % of the average escapement for indicator streams. The indicator streams represent a portion of the total escapement to all streams within a PFMA or CU (index portion) [data quality category Q3]. This portion provided another indication of survey coverage for a specific PFMA or CU. For example: if the indicator streams represented less than 10% of the average annual escapement to streams in a PFMA or CU over a 10 year period, a rating of 1 was assigned for that 10year period. The proportions were converted in to a rating of 1-5 as follows: 1) Poor <20% of the average total escapement for surveyed streams; 2) Fair 20-30% of the average total escapement for surveyed streams; 3) Good 30-40% of the average total escapement for surveyed streams; 4) Very Good 40-50% of the average total escapement for surveyed streams; and 5) Excellent >50% of the average total escapement for surveyed streams. The three sub-ratings are summed together to provide an overall rating of survey quality. A combined rating above 13 would be indicative of reliable escapement estimates. A score of 13 could occur when the average quality rating was at least good, % of the escapement to indicator streams was monitored, and the index streams represented more than 50% of the total escapement for a species to all streams within a PFMA or CU. The survey execution and index portion components of the overall survey rating can vary by year or decade. The survey quality component was usually constant over all years unless there was a change in the survey method for one or more of the indicator streams for a specific PFMA/CU/Species combination. from NuSEDs Table A2. Characterization of escapement estimates based on associations between survey method, reliability, accuracy and precision. SIL is Stream Inspection Log and SEN is Salmon Escapement Number. Direct or indirect survey life here indicates whether direct observations/estimates are made in monitoring, or indirect extrapolation is used from other studies. 44
53 Estimate Type Type-1, True Abundance, high resolution Type-2, True Abundance, medium resolution Type-3, Relative Abundance, high resolution Type-4, Relative Abundance, medium resolution Type-5, Relative Abundance, low resolution Survey Method(s) Analytical Method(s) total, seasonal counts through fence or fishway; simple, often virtually no bypass single step high effort (5 or more trips), standard methods (e.g. mark-recapture, serial counts for area under curve, etc...) high effort (5 or more trips), standard methods (e.g. equal effort surveys executed by walk, swim, overflight, etc.) low to moderate effort (1-4 trips), known survey method simple to complex multistep, but always rigorous simple to complex multistep, but always rigorous simple analysis by known methods low effort (e.g. 1 trip), use unknown to ill of vaguely defined, defined; inconsistent or poorly inconsistent or executed methods poorly executed Type-6, Presence or Absence any of above not required Reliability (within stock comparisons) Units Accuracy Precision Documentation reliable resolution of between year detailed SIL(s), SEN, field differences >10% (in absolute actual, very infinite i.e.+ or - notes or diaries, published absolute units) abundance high zero% report on methods reliable resolution of between year differences >25% (in absolute units) reliable resolution of between year differences >25% (in absolute units) reliable resolution of between year differences >200% (in relative units) uncertain numeric comparisons, but high reliability for presence or absence absolute abundance relative abundance linked to method relative abundance linked to method relative abundance, but vague or no i.d. on method moderate to high reliability for presence/absence (+) or (-) actual or assigned estimate and high assigned range and medium to high actual estimate, high to moderate detailed SIL(s), SEN, field notes or diaries, published report on methods assigned detailed SIL(s), SEN, field estimate, medium notes or diaries, published to high report on methods unknown unknown assumed fairly assumed fairly constant constant unknown assumed highly variable medium to high unknown assumed highly variable unknown complete SEN or equivalent with sufficient detail to verify both survey and analytical procedures incomplete SEN, only reliable to confirm estimate is from an actual survey any of above sufficient to confirm survey and reliable species i.d. 45
54 Appendix B: Harvest data quality estimation for Fraser River Sockeye Salmon from English et al. (2011) accuracy, precision & reliability as applied to harvest (p.15): Accuracy of the methods will be assessed by examining the type of data collected, survey design, estimation procedures, and whether the survey effort is adequate to derive an unbiased estimate. Precision of the methods and estimates will be assessed within years by examining the size of confidence intervals associated with the resulting estimates. Where possible, we provide the 95% confidence intervals expressed as a percentage of the estimate (e.g. ± 10%). Reliability of the methods will be qualitatively assessed on a relative basis (e.g., Method A is more reliable than Method B). Reliability of the estimates will also be qualitatively assessed on a relative basis using available information on the application of method (e.g., we assess whether the survey effort was sufficiently large in scope to produce a reliable estimate). from English et al (p. 17): For Table 2 and other similar summary tables in the report, we used the following qualitative rating scales for our evaluations of data quality: Accuracy = the degree managers can be confident that the reported catch reflects the actual harvest ( Fair = likely biased low in some or most years; Good = any bias is likely to be small; Very Good = complete enumeration of the catch). Precision = generally unknown for most fisheries, estimates of precision are provided where available and where catch estimates are a complete count, the precision rating was High ). Reliability = the degree managers can rely on the catch estimates for in-season and post-season assessments. These ratings are similar to the ratings for accuracy except biased estimates that received a Fair rating for accuracy could receive a Medium rating for reliability if the direction of the bias is known. 46
55 Appendix C: Conservation Unit (CU) Type Adapted from Holtby (2013). CU Type Current Deprecated Bin VReq[Bin] Explanation There is at least one site (population) where fish persist A CU that has been merged with one or more other CUs to make a completely new CU. Used to keep track of fish that are counted but not associated with any other CU. Not a CU but a category to hold sites that for some reason are not assigned to a CU. There are a number of reasons for a unit to be given this designation. Indicates that there is some doubt about the nature of the CU and validation is required. The most common use of the prefix is for sockeye CUs on the central and north coasts that were identified by presumed suitability rather than by actual verified records of persistent presence. The second most common use is for CUs that likely were valid but it is unknown if they persist. 47
56 Appendix D: North and Central Coast model assumptions and uncertainties from English et al. (2012), Appendix D (showing only passages relevant to Sockeye, Pink and Chum Salmon) Model Assumptions and Uncertainties Escapement Estimation The assumptions associated with deriving escapement estimates for a specific CU are: A. Assumption 1 - Selection of indicator streams: The escapement estimates for the selected set of indicator streams within a CU provide a reliable indication of the year to year variability and trends in escapement for that CU; B. Assumption 2 - Correction factors for missing estimates for indicator streams (Factor I): -The average of the available escapement estimates for each indicator streams within a CU represent the relative contribution of each indicator stream to the total for all indicator streams in a CU; C. Assumption 3- Correction factors for converting the total estimate for indicator streams to a total for all streams in a CU (Factor II): The average of the escapement estimates for the period when the largest number of streams were surveyed within a CU (e.g for many CUs) provide an adequate estimate of the contribution the indicator streams to the total escapement for a CU; D. Assumption 4 - Correction factor for observer efficiency (Factor III): on average the recorded escapement estimates for streams within a CU tend to underestimate the total escapement. a. For a specific species and statistical area, this correction factor is the same across all years; therefore, this factor will not affect the trend in escapement estimates. b. The purpose of this factor is to increase the escapement estimates in order to obtain a more realistic estimate of total run size and exploitation rate (ER) for some species and areas. c. This factor does not affect our ER estimates for those statistical areas and CUs where ERs were derived from analyses of CWT data (all coho and some Chinook CUs), the NBSRR model or the Chum Models which use the NBSRR harvest rates (HRs) to derive ERs for Area 3-5. E. For sockeye, pink and chum returns to Area 1, 2E, 2W and Areas 6-10 where run size is estimated by adding local area catch estimates to the escapement estimate (TCC&E), the above methods used to correct for escapement underestimation in the nuseds data will result in higher escapement estimates and thus lower ERs estimates. F. There are a few instances where indicator streams and the above correction factors were not used because better escapement estimates have been derived from other sources. For Nass (Area 3) sockeye and chinook, the escapement estimates were derived from markrecapture studies which estimate the total number of fish migrating upstream of a canyon in the lower Nass River (see Nisga a Fisheries Annual Reports and Appendix Table C1). For Skeena (Area 4) sockeye, the escapement time series was derived by combining sockeye counts from the Babine fence with escapement estimates for non-babine stocks (see Alexander et al. 2010). 48
57 Total Canadian Catch and Escapement (TCC&E) Estimates G. Assumption 5 Stock composition in fisheries: The sockeye, pink or chum harvested in a specific statistical area are destined to spawn in streams within that statistical area. H. Assumption 6 Catch estimates for Area 1, 2E, 2W and Area 6-10: The catch estimates derived from DFO databases for commercial fisheries in these statistical areas represent the vast majority of the harvest of sockeye, pink and chum in these statistical areas. I. Assumption 7 Alaska catch estimates: Alaska fisheries do not harvest significant numbers of sockeye, pink and chum salmon originating from Area 1, 2E, 2W and Area Northern Boundary Sockeye Run Reconstruction Model J. Assumption 8 Marine ERs for aggregate sockeye stocks : The combination of fishery specific stock composition estimates, migration route parameters and daily escapement estimates for Nass and Skeena sockeye used in the NBSRR model produce reliable estimates of the marine ERs for Canadian and Alaskan fisheries. K. Assumption 9 Marine ERs for Nass and Skeena sockeye CUs: the migration routes are that same for all Nass sockeye CUs and the available data on differences in migration timing for Nass sockeye CUs is sufficient to estimate marine ERs for Nass sockeye CUs. L. Assumption 10 Marine ERs for Skeena sockeye CUs: The migration routes are that same for all Skeena sockeye CUs and the available data on differences in migration timing for Skeena sockeye CUs is sufficient to estimate marine ERs for Skeena sockeye CUs. M. Assumption 11 Area 5 sockeye ERs: ERs for Area 5 sockeye stocks in Canadian and Alaskan fisheries are the same as those estimated for the Lakelse sockeye CU. N. Note: the ER estimates provided in Appendix B are marine ERs for each CU and the aggregate Nass and Skeena stocks. The NBSRR reports provide estimates of the total ERs for the aggregate Nass and Skeena sockeye stocks include in-river harvest of these stocks but estimates of the total ERs for each CU require further analyses to assign in-river harvests to specific sockeye CUs. Pink Salmon Run Reconstruction Model O. Assumption 12 HRs for Area 3 Inside and Area 4 pink salmon stocks : The combination of daily catch estimates, migration route, run timing and annual escapement estimates for Northern Boundary pink salmon stocks in the Gazey and English (2000) run reconstruction model produced reliable estimates of the HRs for Area 3 Inside and Area 4 pink salmon stocks in Area 3 and Area 4 fisheries and ERs in Alaskan fisheries. P. Assumption 13 Equal vulnerability: The vulnerability of each pink salmon stock in each Northern Boundary fishery will be proportional to the abundance of that stock in that fishery during each fishing period. Effort-Harvest Rate Analysis Models Q. Assumption 14 Area 3 HRs for Area 3 Inside pink salmon: The Effort-HR relationship derived for Area 3 Inside pink salmon stocks harvested in Area 3 fisheries for can be used to estimate annual HRs from annual fishing effort estimates for R. Assumption 15 Area 3x, 3y and 4 HRs for Area 4 pink salmon: The Effort-HR relationship derived for Area 4 pink salmon stocks in harvested Area 3x, 3y and 4 fisheries for can be used to estimate annual HRs from annual fishing effort estimates for
58 Chum Models S. Assumption 16 Area 3x, 3y and 4 HRs for Area 5 pink salmon: Only half (50%) of Area 5 pink salmon are vulnerable to fisheries in Area 3x, 3y and 4; and the run-timing of Area 5 pink salmon is one week later than that for Area 4 pink salmon. The Effort-HR relationship for Area 4 pink salmon stocks is appropriate for estimating HRs for Area 5 pink salmon stocks. T. Assumption 17 Alaska ERs for Area 3 Inside and Area 4 pink salmon: Effort-ER relationships for Area 3 Inside and Area 4 pink salmon stocks harvested in Alaska fisheries for can be used to estimate annual ERs from annual fishing effort estimates for U. Assumption 18 Alaska ERs for Area 5 pink salmon: ERs for Area 5 pink salmon in Alaskan fisheries is the same as that for Area 4 pink salmon. V. Assumption 19 Canadian ERs for Area 3 Inside, Area 4 and Area 5 pink salmon: The average portion that Area 3 and Area 4 HRs were of the total Canadian HRs during the period is appropriate for the to expand the above HRs to total Canadian HRs that can be combined with Alaskan ERs to compute total Canadian ERs for Area 3 Inside, Area 4 and Area 5 pink salmon stocks. W. Assumption 20 Canadian HRs for Area 3 chum stocks: Area 3 chum migrating through fisheries in Area 3, 4 and 5 have the same weekly HR as those estimated for co-migrating Nass (Area 3) sockeye using the NBSRR model; X. Assumption 21 Canadian HRs for Area 4 chum stocks: Area 4 chum migrating through fisheries in Area 3, 4 and 5 have the same weekly HRs as those estimated for co-migrating Skeena (Area 4) sockeye using the NBSRR model; Y. Assumption 22 Canadian HRs for Area 5 chum stocks: Area 5 chum migrating through fisheries in Area 3, 4 and 5 have the same weekly HRs as those estimated for co-migrating Skeena (Area 4) sockeye using the NBSRR model. Z. Assumption 23 Run timing for Area 3-5 chum salmon: The daily Nass fishwheel chum catch per effort provides a reasonable estimate of the run timing for Area 3 chum stocks; the Skeena test fishery provides a reasonable estimate of the run timing for Area 4 chum stocks; and the run timing for Area 5 chum was estimated to be one week later than that for Area 4 chum. AA. Assumption 24 Non-retention fisheries: The mortality rate for chum salmon released during non-retention fisheries was assumed to be 10% for purse seine fisheries and 60% for gillnet fisheries. Therefore, weekly HRs estimated for sockeye salmon were reduced by these factors during weeks when chum non-retention regulations were in effect. BB. Assumption 25 - Alaska ERs for Area 3 chum salmon: Area 3 chum migrating through Alaskan fisheries have the same annual ER as those estimated for Nass (Area 3) sockeye using the NBSRR model. CC. Assumption 26 - Alaska ERs for Area 4-5 chum salmon: Area 4 and 5 chum migrating through Alaskan fisheries have the same annual ER as those estimated for Skeena (Area 4) sockeye using the NBSRR model. 50

59 Appendix E: North and Central Coast methods from English et al. (2012), Appendix A 51
60 52
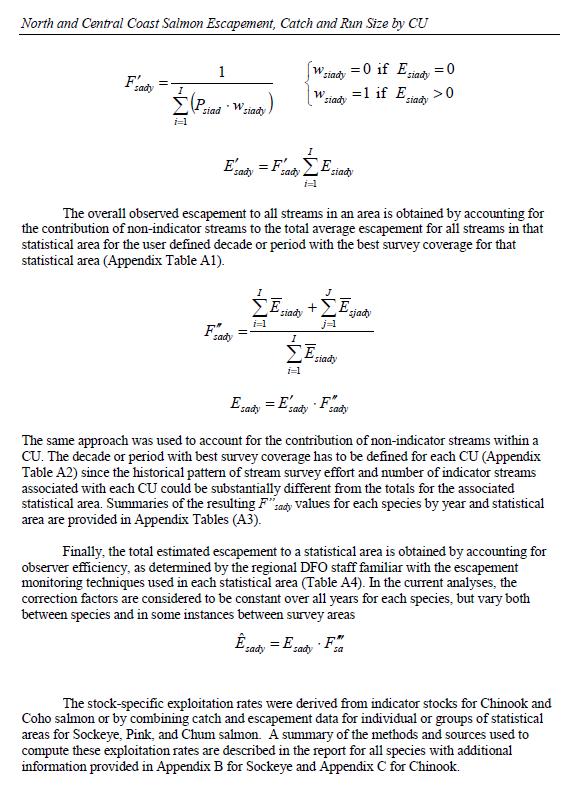
61 53
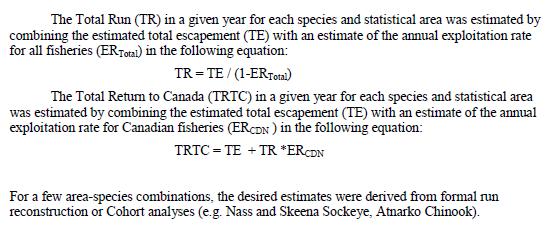
62 54
Review of North and Central Coast Salmon Indicator Streams and Estimating Escapement, Catch and Run Size for each Salmon Conservation Unit
 EA3357 Review of North and Central Coast Salmon Indicator Streams and Estimating Escapement, Catch and Run Size for each Salmon Conservation Unit Prepared by: Karl K. English, Tony Mochizuki, and Dave
"Recommended Improvements for the Next Pacific Salmon Treaty"
 "Recommended Improvements for the Next Pacific Salmon Treaty" Randall M. Peterman School of Resource and Environmental Management Simon Fraser University Burnaby, British Columbia, Canada Web site: http://www.rem.sfu.ca/fishgrp/
Pacific Herring Coded Wire Tagging Study: 2005 Recoveries
 Pacific Herring Coded Wire Tagging Study: 2005 Recoveries L. Flostrand and J.F. Schweigert Fisheries and Oceans Canada Science Branch, Pacific Region Pacific Biological Station Nanaimo, British Columbia
PRE-SEASON PLANNING FOR FRASER SALMON and STOCKS OF CONCERN. Forum on Conservation and Harvest Planning for Fraser Salmon January 22, 2010
 PRE-SEASON PLANNING FOR FRASER SALMON and STOCKS OF CONCERN Forum on Conservation and Harvest Planning for Fraser Salmon January 22, 2010 2 Outline South Coast Chinook Status Management Actions Recovery
OPTIMUM ESCAPEMENT GOALS FOR CHINOOK SALMON IN THE TRANSBOUNDARY ALSEK RIVER
 Canadian Science Advisory Secretariat Science Advisory Report 2011/019 OPTIMUM ESCAPEMENT GOALS FOR CHINOOK SALMON IN THE TRANSBOUNDARY ALSEK RIVER Chinook salmon adult spawning phase. DFO website. Figure
Proposed 2018 Fisheries Management Measures to Support Recovery of Interior Fraser River Steelhead
 Proposed 2018 Fisheries Management Measures to Support Recovery of Interior Fraser River Steelhead 22-March-2018 Spawning escapements of two Interior Fraser River steelhead stocks, Thompson and Chilcotin
Pacific Salmon Commission Technical Report No. 12
 A Comparison of Estimates of First Nations Catches of Fraser River Sockeye Salmon from 1996 to 1999 by Scale-based Discriminant Function Models and Run Reconstruction Models Jim Gable December, 2002 Pacific
2016 Fraser River Chinook Key Information for Management. FN Forum March 8-10 Nanaimo, BC
 2016 Fraser River Chinook Key Information for Management FN Forum March 8-10 Nanaimo, BC 1 Outline Provide background information, management objectives and fisheries management approach for: Fraser Spring
PRE-SEASON RUN SIZE FORECASTS FOR FRASER RIVER SOCKEYE SALMON IN 2010
 Pacific Region Canadian Science Advisory Secretariat Science Advisory Report 2010/031 PRE-SEASON RUN SIZE FORECASTS FOR FRASER RIVER SOCKEYE SALMON IN 2010 Figure 1. Sockeye salmon adult spawning phase.
Rivers Inlet Salmon Initiative
 Rivers Inlet Salmon Initiative 5-YEAR BUSINESS PLAN C AS E F O R S U P P O R T M AR C H 2 0 1 5 Dedication Rick Hansen had been inspired to go to Rivers Inlet in July 2010 by his good friend, and fellow
Risk Assessments in the Pacific Fisheries for BC & Yukon
 Risk Assessments in the Pacific Fisheries for BC & Yukon MARCH, 2017 CONTENTS Introduction to Risk Assessments... 2 Q&As on the Risk Assessment Process... 3 Overview of the Risk Assessment Tool... 4 Example
2017 PRE-SEASON EXPECTATIONS: 2017 OBSERVATIONS TO DATE:
 South Coast Salmon Bulletin #4 22 September, 2017 Escapement Update All salmon species - Strait of Georgia Stock Assessment SUMMARY: This bulletin details the current in-season escapement information for
Estimating Proportion of Large Salmon on Harry s River, Newfoundland Using a DIDSON Acoustic Camera
 Estimating Proportion of Large Salmon on Harry s River, Newfoundland Using a DIDSON Acoustic Camera Geoff Veinott and Don Caines Science Branch Department of Fisheries and Oceans P.O. Box 5667 St. John
ASMFC Stock Assessment Overview: Red Drum
 Purpose The purpose of this document is to improve the understanding and transparency of the Commission s stock assessment process and results. It is the first of several that will be developed throughout
Southern Gulf of St. Lawrence (4T) Herring
 Herring") Fisheries Pêches and Oceans et Océans DFO Science Stock Status B3-1 (22) Southern Gulf of St. Lawrence (4T) Herring Background Herring are a pelagic species which form schools during feeding and spawning
Fisheries Pêches and Oceans et Océans DFO Science Stock Status B3-1 (22) Southern Gulf of St. Lawrence (4T) Herring Background Herring are a pelagic species which form schools during feeding and spawning
Southern Gulf of St. Lawrence (4T) Herring
 Herring") Stock Status Report 24/23 Southern Gulf of St. Lawrence (4T) Herring Background Herring are a pelagic species which form schools during feeding and spawning periods. Herring in the southern Gulf of St.
Stock Status Report 24/23 Southern Gulf of St. Lawrence (4T) Herring Background Herring are a pelagic species which form schools during feeding and spawning periods. Herring in the southern Gulf of St.
ESTIMATED RETURNS AND HARVEST OF COLUMBIA RIVER FALL CHINOOK 2000 TO BY JOHN McKERN FISH PASSAGE SOLUTIONS
 ESTIMATED RETURNS AND HARVEST OF COLUMBIA RIVER FALL CHINOOK 2000 TO 2007 BY JOHN McKERN FISH PASSAGE SOLUTIONS ESTIMATED RETURNS AND HARVEST OF COLUMBIA RIVER FALL CHINOOK 2000 TO 2007 This analysis of
Recent Environmental Conditions and BC Salmon Outlook to 2020
 Recent Environmental Conditions and BC Salmon Outlook to 2020 K. Hyatt & S. Grant Pacific Biological Station, Nanaimo Contributors: I. Perry, L. Weitkamp, M. Galbraith, J. Boldt, P. Chandler, S. King,
***Please Note*** April 3, Dear advisory committee members:
 April 3, 29 Dear advisory committee members: The fifth meeting of the CHF advisory committee will be held April 13 in Grants Pass from 6:-8:3 PM, and the purpose of this document is to help committee members
Press Release New Bilateral Agreement May 22, 2008
 Informational Report 3 June 2008 Press Release New Bilateral Agreement May 22, 2008 The Pacific Salmon Commission is pleased to announce that it has recommended a new bilateral agreement for the conservation
Interior Fraser River Coho Management Post-season update and 2016 Fisheries Planning FN FORUM Meeting March 9, 2016 Draft 5
 Interior Fraser Coho Management 2015 Post-season update and 2016 Fisheries Planning FN FORUM Meeting March 9, 2016 Draft 5 1 Interior Fraser Coho Background In response to significant stock declines through
ATLANTIC SALMON NEWFOUNDLAND AND LABRADOR, SALMON FISHING AREAS 1-14B. The Fisheries. Newfoundland Region Stock Status Report D2-01
 Fisheries Pêches and Oceans et Océans DFO Science Newfoundland Region Stock Status Report D2-01 ATLANTIC SALMON NEWFOUNDLAND AND LABRADOR, SALMON FISHING AREAS 1-14B Background There are 15 Atlantic salmon
Summary of Morrison Creek Lamprey (Lampetra richardsoni variety marifuga) Trapping Studies
 Trapping Studies") Summary of Morrison Creek Lamprey (Lampetra richardsoni variety marifuga) Trapping Studies 2011-2014 J. Wade, and S. MacConnachie Fisheries and Oceans Canada Science Branch, Pacific Region Pacific Biological
Summary of Morrison Creek Lamprey (Lampetra richardsoni variety marifuga) Trapping Studies 2011-2014 J. Wade, and S. MacConnachie Fisheries and Oceans Canada Science Branch, Pacific Region Pacific Biological
ASSESSMENT OF SCALLOPS (PLACOPECTEN MAGELLANICUS) IN SCALLOP FISHING AREA (SFA) 29 WEST OF LONGITUDE 65 30'W
 IN SCALLOP FISHING AREA (SFA) 29 WEST OF LONGITUDE 65 30'W") Canadian Science Advisory Secretariat Science Advisory Report 2013/055 ASSESSMENT OF SCALLOPS (PLACOPECTEN MAGELLANICUS) IN SCALLOP FISHING AREA (SFA) 29 WEST OF LONGITUDE 65 30'W Figure 1. Location of
Canadian Science Advisory Secretariat Science Advisory Report 2013/055 ASSESSMENT OF SCALLOPS (PLACOPECTEN MAGELLANICUS) IN SCALLOP FISHING AREA (SFA) 29 WEST OF LONGITUDE 65 30'W Figure 1. Location of
Estimation of gillnet selectivity for Atlantic herring (Clupea harengus harengus L.) from the west coast of Newfoundland,
 from the west coast of Newfoundland,") Estimation of gillnet selectivity for Atlantic herring (Clupea harengus harengus L.) from the west coast of Newfoundland, 1997-2001 F. Grégoire and L. Lefebvre Department of Fisheries and Oceans Science
Estimation of gillnet selectivity for Atlantic herring (Clupea harengus harengus L.) from the west coast of Newfoundland, 1997-2001 F. Grégoire and L. Lefebvre Department of Fisheries and Oceans Science
August 3, To: Rob Jones NOAA Fisheries 1201 NE Lloyd Blvd, Suite 1100 Portland, Oregon Dear Mr. Jones,
 August 3, 2010 To: Rob Jones NOAA Fisheries 1201 NE Lloyd Blvd, Suite 1100 Portland, Oregon 97232 Dear Mr. Jones, Public Utility District No.1 of Chelan County (Chelan) respectfully submits the 2009 Wenatchee
Discussion Paper: February 15, 2018
 Discussion Paper: February 15, 2018 Proposed 2018 Salmon Fishery Management Measures to Support Chinook Salmon Prey Availability for Southern Resident Killer Whales Contents 1. Purpose... 2 1.0 Background...
What is causing declines in the annual returns of Fraser River sockeye salmon?
 What is causing declines in the annual returns of Fraser River sockeye salmon? Mike Lapointe, Catherine Michielsens; Pacific Salmon Commission Secretariat Sue Grant, Bronwyn MacDonald; Fisheries and Oceans
Okanagan Sockeye Reintroduction
 Okanagan Sockeye Reintroduction Backgrounder Elders accounts, and other forms of Traditional Ecological Knowledge (TEK) tell us that many species of salmon once came into the Okanagan Valley and tell us
Maintaining biodiversity in mixed-stock salmon fisheries in the Skeena watershed
 Maintaining biodiversity in mixed-stock salmon fisheries in the Skeena watershed A 130-year history Chris C. Wood Principle: Mixed-stock transboundary fisheries impose special requirements on management
We recommend that whenever possible you use the following guidelines for choosing the most sustainable options in 2010.
 Ocean Wise Seasonal salmon report 2010 NOTE: THE FOLLOWING RECOMMENDATIONS ARE BASED ON EARLY TEST FISHERY RESULTS. ACTUAL IN-SEASON RUN STRENGTH CAN CHANGE AND WILL BE UPDATED AS NECESSARY. Returns of
ASMFC Stock Assessment Overview: Red Drum
 Introduction This document presents a summary of the 217 stock assessments for red drum. These assessments were initially conducted through the Southeast Data, Assessment and Review (SEDAR) process using
Timing Estimation of Juvenile Salmonid Migration at Lower Granite Dam
 FISH PASSAGE CENTER 1827 NE 44 th Ave., Suite 240, Portland, OR 97213 Phone: (503) 230-4099 Fax: (503) 230-7559 http://www.fpc.org/ e-mail us at fpcstaff@fpc.org MEMORANDUM TO: FROM: FPAC The Files FPC
Distribution and recruitment of demersal cod (ages 0+, 1+ and 2+) in the coastal zone, NAFO Divisions 3K and 3L
 in the coastal zone, NAFO Divisions 3K and 3L") Citation with Citation par permission of the authors 1 autorisation des auteurs 1 DFO Atlantic Fisheries MPO Peches de l'atlantique Research Document 95/68 Document de recherche 95/68 Distribution and
Citation with Citation par permission of the authors 1 autorisation des auteurs 1 DFO Atlantic Fisheries MPO Peches de l'atlantique Research Document 95/68 Document de recherche 95/68 Distribution and
2017 PRE-SEASON EXPECTATIONS: 2017 OBSERVATIONS TO DATE:
 South Coast Salmon Bulletin #15 8 Decemeber, 2017 Escapement Update All salmon species - Strait of Georgia Stock Assessment SUMMARY: This bulletin details the current in-season escapement information for
Spring Run Chinook Escapement Study on the Upper Nanaimo River in 2012 and Historical Data Review
 Spring Run Chinook Escapement Study on the Upper Nanaimo River in 2012 and Historical Data Review N.M. Watson Fisheries and Oceans Canada Science Branch, Pacific Region Stock Assessment Division 3225 Stephenson
This document is a copy of an official work that is published by the Government of Canada. This reproduction has not been produced in affiliation
 This document is a copy of an official work that is published by the Government of Canada. This reproduction has not been produced in affiliation with, or with the endorsement of the Government of Canada.
2017 Fraser River Sockeye and Pink Pre-Season Run Size Forecasts
 2017 Fraser River Sockeye and Pink Pre-Season Run Size Forecasts Fisheries and Oceans Canada Pêches et Océans Canada B. MacDonald & *S. Grant Forum on Conservation & Harvest Planning for Fraser Salmon
ASSESSMENT OF HERRING IN THE SOUTHERN GULF OF ST. LAWRENCE (NAFO DIV. 4T)
") Canadian Science Advisory Secretariat Science Advisory Report 27/5 ASSESSMENT OF HERRING IN THE SOUTHERN GULF OF ST. LAWRENCE (NAFO DIV. 4T) Context The stock area for southern Gulf of St. Lawrence herring
Canadian Science Advisory Secretariat Science Advisory Report 27/5 ASSESSMENT OF HERRING IN THE SOUTHERN GULF OF ST. LAWRENCE (NAFO DIV. 4T) Context The stock area for southern Gulf of St. Lawrence herring
ASSESSMENT OF THE WEST COAST OF NEWFOUNDLAND (DIVISION 4R) HERRING STOCKS IN 2011
 HERRING STOCKS IN 2011") Canadian Science Advisory Secretariat Science Advisory Report 212/24 ASSESSMENT OF THE WEST COAST OF NEWFOUNDLAND (DIVISION 4R) HERRING STOCKS IN 211 Context Figure 1. Map of unit areas of NAFO Division
Canadian Science Advisory Secretariat Science Advisory Report 212/24 ASSESSMENT OF THE WEST COAST OF NEWFOUNDLAND (DIVISION 4R) HERRING STOCKS IN 211 Context Figure 1. Map of unit areas of NAFO Division
Chum Salmon in the Canadian Arctic: The past, the present and the future
 Photo: M. Gruben Photo: R. Popko Photo: K. Dunmall Chum Salmon in the Canadian Arctic: The past, the present and the future Karen Dunmall 1, 2 Rob Bajno 1, Margaret Docker 2, Jim Reist 1 1: Fisheries and
ALASKA DEPARTMENT OF FISH AND GAME DIVISION OF COMMERCIAL FISHERIES NEWS RELEASE
 ALASKA DEPARTMENT OF FISH AND GAME DIVISION OF COMMERCIAL FISHERIES NEWS RELEASE Sam Cotten, Commissioner Scott Kelley, Director Contact: Cordova ADF&G Steve Moffitt, PWS Finfish Research Biologist 401
2016 Fraser River Stock Assessment and Fishery Summary Chinook, Coho and Chum
 2016 Fraser River Stock Assessment and Fishery Summary Chinook, Coho and Chum 1 Background and Stock Assessment 2 Fraser River Chinook - Background Diverse group of populations exhibit a wide range of
Salmon Escapement to Englishman River, 2005
 Salmon Escapement to Englishman River, 2005 Ian Matthews and Alan Eden 1 South Coast Area Fisheries and Oceans Canada 3225 Stephenson Point Road Nanaimo, BC V9T 1K3 March 2005 1 365 Dunsmuir Rd, Qualicum
2013 WHITE SALMON CHINOOK SALMON VSP MONITORING. Jeremy Wilson Washington Department of Fish and Wildlife
 2013 WHITE SALMON CHINOOK SALMON VSP MONITORING Jeremy Wilson Washington Department of Fish and Wildlife Study Area Outline History of WDFW Chinook Monitoring in WS 2013 Objectives 2013 Study Design 2013
Canadian Journal of Fisheries and Aquatic Sciences. Canada s Wild Salmon Policy: an assessment of conservation progress in British Columbia
 Canada s Wild Salmon Policy: an assessment of conservation progress in British Columbia Journal: Canadian Journal of Fisheries and Aquatic Sciences Manuscript ID cjfas-2017-0127.r1 Manuscript Type: Rapid
Status Determination Criteria for Willapa Bay Natural Coho. Salmon Technical Team and Washington Department of Fish and Wildlife
 Agenda Item C.2.a Attachment 6 November 2013 Status Determination Criteria for Willapa Bay Natural Coho Salmon Technical Team and Washington Department of Fish and Wildlife Prepared by: Robert Kope Northwest
PRE-SEASON RUN SIZE FORECASTS FOR FRASER RIVER SOCKEYE AND PINK SALMON IN 2009
 Canadian Science Advisory Secretariat Science Advisory Report 2009/022 PRE-SEASON RUN SIZE FORECASTS FOR FRASER RIVER SOCKEYE AND PINK SALMON IN 2009 Figure 1. Sockeye adult spawning phase (source: DFO
TRAC. Document de référence 2011/03 Reference Document 2012/03
 CERT Comité d'évaluation des ressources transfrontalières TRAC Transboundary Resources Assessment Committee Document de référence 2011/03 Reference Document 2012/03 Ne pas citer sans autorisation des auteurs
Salmon bycatch patterns in the Bering Sea pollock fishery
 Salmon bycatch patterns in the Bering Sea pollock fishery James Ianelli Seattle, WA Data from the North Pacific Observer Program (Fisheries Monitoring and Assessment) were analyzed for seasonal, temporal,
ALASKA DEPARTMENT OF FISH AND GAME DIVISION OF COMMERCIAL FISHERIES NEWS RELEASE
 ALASKA DEPARTMENT OF FISH AND GAME DIVISION OF COMMERCIAL FISHERIES NEWS RELEASE Sam Cotten, Commissioner Scott Kelley, Director Contact: Cordova ADF&G Steve Moffitt, PWS Finfish Research Biologist 401
Stock status of Skeena River coho salmon
 DFO Science Pacific Region Stock Status Report D6-02 (1999) Stock status of Skeena River coho salmon Background The coho salmon (Oncorhynchus kisutch) is one of six species of anadromous Pacific salmon
NATIVE FISH CONSERVATION PLAN FOR THE SPRING CHINOOK SALMON ROGUE SPECIES MANAGEMENT UNIT
 Attachment 4 NATIVE FISH CONSERVATION PLAN FOR THE SPRING CHINOOK SALMON ROGUE SPECIES MANAGEMENT UNIT Figures in Draft Plan of February 28, 27 Figure 1. Map of the Rogue River Basin. PASSAGE ESTIMATES
Salmon age and size at maturity: Patterns and processes
 Salmon age and size at maturity: Patterns and processes 1. Age Designation 2. Variation among populations 1. Latitude 2. Within regions 3. Within watersheds 3. Variation within populations 1. Smolt size
Environmental Conditions: Informing Salmon Returns in 2019
 DFO State of the Salmon Program Environmental Conditions: Informing Salmon Returns in 2019 Sue Grant & Bronwyn MacDonald Developing Tools and Processes to Foster Salmon-Ecosystem integration Contact: Sue.Grant@dfo-mpo.gc.ca
ALASKA DEPARTMENT OF FISH AND GAME DIVISION OF COMMERCIAL FISHERIES NEWS RELEASE
 ALASKA DEPARTMENT OF FISH AND GAME DIVISION OF COMMERCIAL FISHERIES NEWS RELEASE Sam Cotten, Commissioner Scott Kelley, Director Contact: Cordova ADF&G Stormy Haught, PWS Finfish Research Biologist 401
2006 Nicomen Slough/Norrish Creek Recreational Fishery Assessment October 9 to November 30, 2006
 2006 Nicomen Slough/Norrish Creek Recreational Fishery Assessment October 9 to November 30, 2006 Prepared By: Jason Mahoney Assessment Biologist Stock Assessment Lower Fraser Area Regulations Regulations
SCALLOP FISHERY AREA/TIME CLOSURE TO PROTECT COD SPAWNING AGGREGATIONS IN 5Z (GEORGES BANK)
") Canadian Science Advisory Secretariat Maritimes Region Science Response 2014/023 SCALLOP FISHERY AREA/TIME CLOSURE TO PROTECT COD SPAWNING AGGREGATIONS IN 5Z (GEORGES BANK) Context The requirement to account
Canadian Science Advisory Secretariat Maritimes Region Science Response 2014/023 SCALLOP FISHERY AREA/TIME CLOSURE TO PROTECT COD SPAWNING AGGREGATIONS IN 5Z (GEORGES BANK) Context The requirement to account
HADDOCK ON THE SOUTHERN SCOTIAN SHELF AND IN THE BAY OF FUNDY (DIV. 4X/5Y)
") Canadian Science Advisory Secretariat Science Advisory Report 26/47 HADDOCK ON THE SOUTHERN SCOTIAN SHELF AND IN THE BAY OF FUNDY (DIV. 4X/5Y) Context Haddock (Melanogrammus aeglefinus) are found on both
Canadian Science Advisory Secretariat Science Advisory Report 26/47 HADDOCK ON THE SOUTHERN SCOTIAN SHELF AND IN THE BAY OF FUNDY (DIV. 4X/5Y) Context Haddock (Melanogrammus aeglefinus) are found on both
Hatcheries: Role in Restoration and Enhancement of Salmon Populations
 Hatcheries: Role in Restoration and Enhancement of Salmon Populations Hatcheries play a large role in the management, ecology, and evolution of Pacific salmon. Why were/are they built? What are the assumptions
There are two types of selective commercial fisheries conducted by Talok Fisheries:
 Lake Babine Nation Inland Fishery The inland commercial fishery on Lake Babine is operated by a private fishing company named Talok that is owned by the Lake Babine Nation (LBN). This company is governed
Canadian Manuscript Report of Fisheries and Aquatic Sciences #### CERTIFICATION UNIT PROFILE: FRASER RIVER CHUM SALMON. S.Grant and G.
 Submitted to the Marine Stewardship Council on June 1, 2009. The Manuscript Report will be available through DFO s library website at http://inter01.dfo-mpo.gc.ca/waves2/index.html Canadian Manuscript
Eastern and South Shore Nova Scotia Lobster LFAs The Fishery. DFO Atlantic Fisheries Stock Status Report 96/117E.
 Maritimes Region DFO Atlantic Fisheries Stock Status Report 96/117E Eastern and South Shore Nova Scotia Lobster LFAs 31-33 Background Lobsters first entering the fishery in LFAs 31, 32, and 33 are probably
Discussion on the Selection of the Recommended Fish Passage Design Discharge
 Discussion on the Selection of the Recommended Fish Passage Design Discharge Introduction The provision of fish passage is a requirement for most proposed culvert and bridge installations in Alberta, depending
Managing for Diversity
 Managing for Diversity Pacific Salmon Treaty Workshop: Stanford University, 15 November 2007 John D. Reynolds Tom Buell BC Leadership Chair in Salmon Conservation Department of Biology Simon Fraser University,
2018 Fraser River Fishery Summary to Accompany December 2018 Presentation for FORUM
 2018 Fraser River Fishery Summary to Accompany December 2018 Presentation for FORUM Chinook... 1 Coho... 3 Chum... 4 Sockeye... 5 Pink... 6 Chinook FSC Chinook directed fisheries were open year round Below
2017/2018 Salmon Fishery Planning
 2017/2018 Salmon Fishery Planning Sockeye and Pink Salmon Key Management Issues for 2017 FN Forum Meeting March 7-9 th, 2017 1. 2017 Management Issues Outline Fraser Sockeye and Pink Forecasts Environmental
ASSESSMENT OF THE STATUS OF NESTUCCA RIVER WINTER STEELHEAD
 ASSESSMENT OF THE STATUS OF NESTUCCA RIVER WINTER STEELHEAD Gary Susac and Steve Jacobs Coastal Salmonid Inventory Project Oregon Department of Fish and Wildlife August 21, 2001 INTRODUCTION This report
THE OREGON. PLAN for Salmon and Watersheds. Stock Assessment of Anadromous Salmonids, Report Number: OPSW-ODFW
 THE OREGON PLAN for Salmon and Watersheds Stock Assessment of Anadromous Salmonids, Report Number: OPSW-ODFW-1- The Oregon Department of Fish and Wildlife prohibits discrimination in all of it s programs
Fraser Sockeye Science Integration: 2018 Returns. Prepared by: Sue Grant & Bronwyn MacDonald, DFO State of Salmon Program
 Fraser Sockeye Science Integration: 2018 Returns Prepared by: Sue Grant & Bronwyn MacDonald, DFO State of Salmon Program 1 Fraser Sockeye Science Integration Across Salmon Life-History Stages Published
"A widespread decrease in productivity of sockeye salmon on the west coast of North America"
 "A widespread decrease in productivity of sockeye salmon on the west coast of North America" Randall M. Peterman 1 and Brigitte Dorner 2 1 School of Resource and Environmental Management (REM), Faculty
Salmon Escapement to Englishman River, 2002
 Salmon Escapement to Englishman River, 2002 Steve Baillie and Clay Young 1 South Coast Area Fisheries and Oceans Canada 3225 Stephenson Point Road Nanaimo, BC V9T 1K3 March 2003 1 Community Fisheries Development
PUTTING CANADA s WILD SALMON POLICY INTO ACTION
 PUTTING CANADA s WILD SALMON POLICY INTO ACTION Questions & Answers Watershed Watch Salmon Society The federal government has released a draft implementation plan for the Wild Salmon Policy are seeking
Salmon and Migratol~Y Trout of the N,anaimo 'River lind Adjacent Streams (Revised 1,973)
") .. '.' ~! ~j-:-t. ~" I. This s~rie~ includes " unpublished preliminary' reports. ana Glatd rec
.. '.' ~! ~j-:-t. ~" I. This s~rie~ includes " unpublished preliminary' reports. ana Glatd rec
Susitna-Watana Hydroelectric Project (FERC No ) Salmon Escapement Study Study Plan Section 9.7
 Salmon Escapement Study Study Plan Section 9.7") (FERC No. 14241) Salmon Escapement Study Study Plan Section 9.7 Part D: Supplemental Information to June 2014 Initial Study Report Prepared for Prepared by LGL Alaska Research Associates, Inc. & Alaska
(FERC No. 14241) Salmon Escapement Study Study Plan Section 9.7 Part D: Supplemental Information to June 2014 Initial Study Report Prepared for Prepared by LGL Alaska Research Associates, Inc. & Alaska
Exhibit 3. Fishery Clients: Vityaz-Avto and Delta Budget: $735,000
 Exhibit 3. Fishery Improvement Project (FIP) Work Plan for Western Kamchatka Fisheries harvesting the following salmon stocks: Ozernaya coho, Koshegochek coho and sockeye, Golygina coho and sockeye, Opala
Attachment 2 PETITIONERS
 Attachment 2 PETITION TO TEMPORARILY MODIFY FRESHWATER FISHERY REGULATIONS ADOPTED UNDER THE CONSERVATION PLAN FOR NATURALLY PRODUCED SPRING CHINOOK SALMON IN THE ROGUE RIVER (submitted September 26, 2017)
South Coast Salmon Bulletin August 30, 2018 Assessment Update Barkley/Alberni (Area 23) Terminal Chinook
 Terminal Chinook") 1 South Coast Salmon Bulletin August 30, 2018 Assessment Update Barkley/Alberni (Area 23) Terminal Chinook Pre-season Expectations Somass/Robertson Creek Hatchery chinook: The forecast terminal return
1 South Coast Salmon Bulletin August 30, 2018 Assessment Update Barkley/Alberni (Area 23) Terminal Chinook Pre-season Expectations Somass/Robertson Creek Hatchery chinook: The forecast terminal return
The FishSource Assessment System for Salmon Fisheries Version 2 August 22, 2013
 The FishSource Assessment System for Salmon Fisheries Version 2 August 22, 2013 FishSource, an online fisheries database managed by the Sustainable Fisheries Partnership (SFP), is envisioned as one-stop
Southern Gulf of St. Lawrence Herring
 Fisheries Pêches and Oceans et Océans DFO Science Stock Status Report B3-1(2) Background Southern Gulf of St. Lawrence Herring Herring are a pelagic species which form schools during feeding and spawning
PRELIMINARY 2017 SALMON OUTLOOK
 Preliminary Salmon, December, 2016 pg 1 of 27 PRELIMINARY SALMON OUTLOOK Since 2002, Pacific Region (BC & Yukon) Stock Assessment staff has provided a categorical outlook for the next year s salmon returns.
The Distribution and Abundance of Juvenile Salmonids and Other Species in the Courtenay River Estuary and Baynes Sound, 2000
 The Distribution and Abundance of Juvenile Salmonids and Other Species in the Courtenay Estuary and Baynes Sound, 2 J. A. Jenkins, B. A. Bravender, C. Beggs, B. Munro, and D. Miller Fisheries and Oceans
Rainy Lake Open-water Creel Survey:
 Rainy Lake Open-water Creel Survey: 21 11 Darryl McLeod District Update 212-1 Introduction An open-water creel survey was conducted on the Ontario portion of Rainy Lake from May 15 th (the opening of the
Southern Gulf of St. Lawrence Sea Scallop
 DFO Science Stock Status Report C3-16 (1998) 21 22 23 24 Southern Gulf of St. Lawrence Sea Scallop Background The sea scallop (Placopecten magellanicus), is a bivalve mollusc found only in the north-western
COLUMBIA RIVER SALMON AND STEELHEAD HARVEST 1980 TO by John McKern for The Columbia-Snake River Irrigators Association
 COLUMBIA RIVER SALMON AND STEELHEAD HARVEST 198 TO 26 by John McKern for The Columbia-Snake River Irrigators Association COLUMBIA RIVER SALMON AND STEELHEAD HARVEST 198 THROUGH 26 By John McKern FISH PASSAGE
THE CONFEDERATED TRIBES OF THE WARM SPRINGS RESERVATION OF OREGON
 THE CONFEDERATED TRIBES OF THE WARM SPRINGS RESERVATION OF OREGON To: Branch of Natural Resources P.0. Box C, Warm Springs, Oregon 97761 Phone (541) 553-2002/2003 Fax (541) 553-1994 The Independent Science
 Informational Report 1 USFWS Mass Marking Update April 2005 Update on USFWS 2005 Mass Marking Initiative Background Under Section 138 of FY 2003 Omnibus Appropriations Act (PL 108-7), Congress directed
TESTIMONY OF THE COLUMBIA RIVER TREATY TRIBES BEFORE PACIFIC FISHERIES MANAGEMENT COUNCIL April 12, 2010 Portland, OR
 Agenda Item H.1.f Supplemental Tribal Report 2 April 2010 TESTIMONY OF THE COLUMBIA RIVER TREATY TRIBES BEFORE PACIFIC FISHERIES MANAGEMENT COUNCIL April 12, 2010 Portland, OR Good day Mr. Chairman and
Kirt Hughes Washington Department of Fish and Wildlife Region 6 - Fish Program Manager
 Kirt Hughes Region 6 - Fish Program Manager Habitat Hatcheries Harvest Clean Water Act Shorelines Harvest Hydro Habitat Forest Practices Non-regulatory Programs Water Supply & Conservation Growth Management
Agenda Item Summary BACKGROUND. Public Involvement ISSUE ANALYSIS. Attachment 1
 Agenda Item Summary Attachment BACKGROUND Between 996 and 03 white sturgeon fisheries in the Columbia River downstream from Bonneville Dam were managed under a series of management accords between the
ASSESSMENT OF SHRIMP STOCKS IN THE ESTUARY AND GULF OF ST. LAWRENCE IN 2011
 Canadian Science Advisory Secretariat Science Advisory Report 212/6 ASSESSMENT OF SHRIMP STOCKS IN THE ESTUARY AND GULF OF ST. LAWRENCE IN 211 Figure 1. Shrimp fishing areas in the Estuary and Gulf of
Information Paper for SAN (CI-4) Identifying the Spatial Stock Structure of Tropical Pacific Tuna Stocks
 Identifying the Spatial Stock Structure of Tropical Pacific Tuna Stocks") Current knowledge, key uncertainties and future research directions for defining the stock structure of skipjack, yellowfin, bigeye and South Pacific albacore tunas in the Pacific Ocean Information Paper
Current knowledge, key uncertainties and future research directions for defining the stock structure of skipjack, yellowfin, bigeye and South Pacific albacore tunas in the Pacific Ocean Information Paper
SALMON FACTS. Chinook Salmon. Oncorhynchus tshawytscha
 SALMON FACTS Chinook Salmon Oncorhynchus tshawytscha Other names: king, tyee, blackmouth (immature) Average size: 10-15 lbs, up to 135 lbs Fall spawner; fall, spring, and summer runs Chinook salmon are
June 3, 2014 MEMORANDUM. Council Members. Stacy Horton, Policy Analyst, Washington. SUBJECT: Final 2012 Hatchery Fin Clip Report
 Bill Bradbury Chair Oregon Henry Lorenzen Oregon W. Bill Booth Idaho James A. Yost Idaho Jennifer Anders Vice Chair Montana Pat Smith Montana Tom Karier Washington Phil Rockefeller Washington June 3, 2014
2 Report of the Fraser River Panel to the Pacific Salmon Commission on the 2002 Fraser River Sockeye Salmon Fishing Season
 2 0 0 2 Report of the Fraser River Panel to the Pacific Salmon Commission on the 2002 Fraser River Sockeye Salmon Fishing Season Prepared by the Pacific Salmon Commission June, 2005 Pacific Salmon Commission
Atlantic Salmon Chaleur Bay SFA 15
 Fisheries Pêches and Oceans et Océans DFO Science Maritimes Region Stock Status Report D3-1(1998) Background Atlantic Salmon Chaleur Bay SFA 15 Salmon Fishing Area (SFA) 15 includes northern New Brunswick;
Chinook Salmon. The Yukon River Panel
 Chinook Salmon and The Yukon River Panel Jan Conitz, ADF&G UAF FISH 493 Discussion January 26, 2016 Discussion Outline I. Yukon River context Salmon and Yukon River basics Fishing and history on the Yukon
for Salmon and Watersheds
 for Salmon and Watersheds Stock Assessment of Anadromous Salmonids, Report Number: OPSW-ODFW-3- The Oregon Department of Fish and Wildlife prohibits discrimination in all of its programs and services on
Stock Assessment of Anadromous Salmonids, 2003 Report Number: OPSW-ODFW
 THE OREGON PLAN for Salmon and Watersheds Stock Assessment of Anadromous Salmonids, 3 Report Number: OPSW-ODFW-- The Oregon Department of Fish and Wildlife prohibits discrimination in all of its programs
Paper prepared by the Secretariat
 COMMISSION FOURTEENTH REGULAR SESSION Manila, Philippines 3 7 December 2017 REFERENCE DOCUMENT FOR REVIEW OF CMM 2005-03 AND FOR THE DEVELOPMENT OF HARVEST STRATEGIES UNDER CMM 2014-06 North Pacific Albacore