Lake Ontario Fish Communities and Fisheries: 2016 Annual Report of the Lake Ontario Management Unit
|
|
|
- Melvyn Morrison
- 6 years ago
- Views:
Transcription


1 Lake Ontario Fish Communities and Fisheries: 216 Annual Report of the Lake Ontario Management Unit
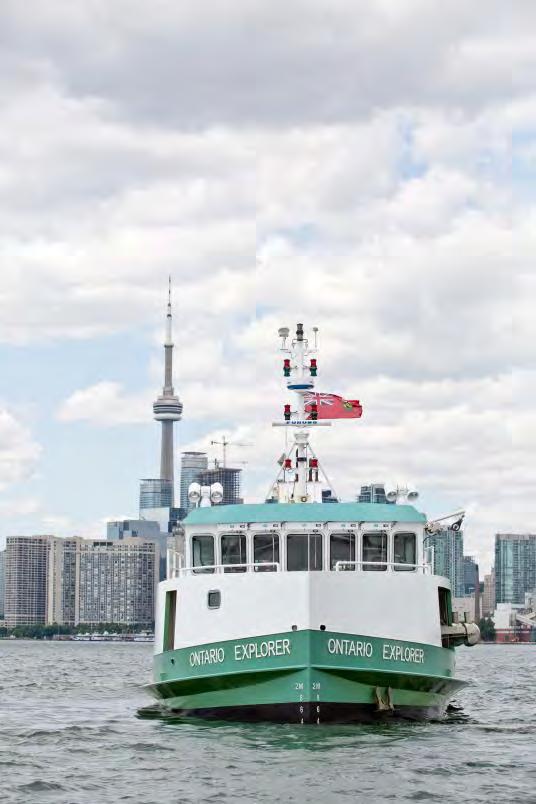
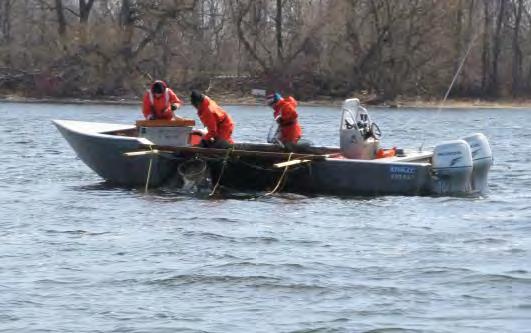
2 Cover Photos: (Left) MNRF s Ontario Explorer departing the Toronto Harbour, July 17, 216 (Right top) Ontario Explorer docked at the Glenora Fisheries Station, March 28, 216 (Right bottom) LOMU field crew trap netting Bay of Quinte Walleye for egg collection activities
3 LAKE ONTARIO FISH COMMUNITIES AND FISHERIES: 216 ANNUAL REPORT OF THE LAKE ONTARIO MANAGEMENT UNIT Prepared for the Great Lakes Fishery Commission 217 Lake Committee Meetings YPSILANTI, MI, USA March 2-24, , Queen s Printer for Ontario Printed in Picton, Ontario, Canada March 217 Report ISSN Please cite this report as follows: Ontario Ministry of Natural Resources and Forestry Lake Ontario Fish Communities and Fisheries: 216 Annual Report of the Lake Ontario Management Unit. Ontario Ministry of Natural Resources and Forestry, Picton, Ontario, Canada. This report is available online at:
4
5 TABLE OF CONTENTS Foreword... v 1. Index Fishing Projects 1.1 Ganaraska Fishway Rainbow Trout Assessment Lake Ontario and Bay of Quinte Fish Community Index Gill Netting Lake Ontario and Bay of Quinte Fish Community Index Trawling Lake Ontario Nearshore Community Index Netting Lake-wide Hydroacoustic Assessment of Prey Fish St. Lawrence River Fish Community Index Netting Lake St. Francis Credit River Chinook Salmon Spawning Index Juvenile Atlantic Salmon Parr Survey Credit River Atlantic Salmon Smolt Survey Juvenile Chinook Production Lake Ontario Spring Prey Fish Trawling Lake Ontario Fall Benthic Prey Fish Trawling Recreational Fishery 2.1 Fisheries Management Zone 2 Council (FMZ2) / Volunteer Angling Clubs Western Lake Ontario Boat Angling Fishery Lake Ontario Volunteer Angler Diary Program Bay of Quinte Ice Angling Survey Bay of Quinte Volunteer Walleye Angler Diary Program Commercial Fishery 3.1 Lake Ontario and St. Lawrence River Commercial Fishing Liaison Committee Quota and Harvest Summary Lake Whitefish Commercial Catch Sampling Age and Growth Summary Contaminant Monitoring Stocking Program 6.1 Stocking Summary Net Pens Stock Status 7.1 Chinook Salmon Rainbow Trout Lake Whitefish Walleye Northern Pike Pelagic Prey fish Alewife, Smelt Benthic Prey fish Round Goby, Slimy Sculpin, Deepwater Sculpin Species Rehabilitation 8.1 Introduction
6 8.2 Atlantic Salmon Restoration American Eel Restoration Deepwater Cisco Restoration Lake Trout Restoration Round Whitefish-Spawning Population Study Hamilton Harbour Walleye Reintroduction Lake Sturgeon Research Activities 9.1 Bloater restoration: Using acoustic telemetry to understand post-stocking behaviour Understanding depth and temperature preference of Lake Ontario salmonids using novel pop-off data storage tags An interactive tool for assessing the energetic demand of stocked predators in Lake Ontario Comparative Ecology of Juvenile Salmonids in Lake Ontario Station 81: Long-term monitoring at the base of Lake Ontario s food web Understanding the vulnerability of the Great Lakes and inland lakes of Ontario to invasive species spread and establishment Development of new fishway counting technology Partnerships 1.1 Walleye Spawn Collection Observations of aquatic invasive species in Lake Ontario Environmental Indicators 11.1 Water Temperature Wind Water Clarity Tributary Water Flow Staff Operational Field and Lab Schedule Publications
7 v Lake Ontario Fish Communities and Fisheries: 216 Annual Report of the Lake Ontario Management Unit Foreword The Lake Ontario Management Unit (LOMU) and the Lake Ontario research staff from the Applied Research and Monitoring Section are pleased to provide the 216 Annual Report of monitoring, assessment, research and management activities. Lake Ontario fisheries are managed by the Lake Ontario Committee, consisting of the Ontario Ministry of Natural Resources and Forestry (MNRF) in partnership with New York State, under the auspices of the Great Lakes Fishery Commission. The Lake Ontario Fish Community Objectives (213) provide bi-national fisheries management direction to protect and restore native species and to maintain sustainable fisheries. Our many partners include: New York State Department of Environmental Conservation (NYSDEC), Fisheries and Oceans Canada (DFO), the U.S. Fish and Wildlife Service (USFWS), U.S. Geological Survey (USGS) and many other Ontario provincial ministries and conservation authorities and U.S. state and federal agencies, universities and non-government partners. Lake Ontario, Bay of Quinte, and St. Lawrence River ecosystems have changed over the last two centuries in response to the pressures of industrial development, land settlement and agricultural practices, fishing, pollution, loss of native species, and the introduction of new species. Long-term fisheries and aquatic monitoring, assessment and research programs help understand these changes and support informed management decisions. These decisions need to consider the ecological realities that shape the fishery, such as the natural capacity of the lake to produce fish, the decline or recovery of native species, the impact of non-native species, changes to fish habitat, and climate change, along with social and economic objectives. Management highlights from 216 include the development of an Atlantic Salmon Restoration Program: Five Year Implementation Strategy 216/22, the release of Fishing in Your Backyard - An Urban Recreational Fisheries Strategy for the Lake Ontario Northwest Waterfront and the creation of a bi-national (Ontario/New York State) stakeholder forum. Management Unit staff participated in several public events including the Toronto Sportsmen s Show, Cottage Life Show, Belleville Cops Kids Fishing and Hamilton Harbour Fun Fishing events. The Management Unit partnered with the Port Credit Salmon and Trout Association to deliver the second Lake Ontario Salmon Symposium in Port Credit Ontario. Three public meetings were held in Port Hope, Port Credit and Whitby, as well, Management Unit staff attended several Angling Club meetings as invited speakers. The MNRF fish culture program and partners produced and stocked more than 2 million fish into Lake Ontario. The 216 Lake Unit assessment program included twelve index fishing programs, four recreational angler surveys, commercial fishery assessment and the age interpretation of 2,87 fish. Assessment program additions in 216 included: expansion of the off-shore large vessel trawling program to include Alewife, and other pelagic prey fish, monitoring in the spring; and acquisition of a new video fish counter to assess adult Atlantic Salmon returning to Lake Ontario tributaries. The assessment program continues to evolve, building on a strong base of long-term monitoring while developing new tools, techniques and expertise.

8 vi The Lake Ontario Research Program under Dr. Tim Johnson (Aquatic Monitoring and Research Section) continues to contribute new knowledge and tools to the Lake Ontario Management Team. Included in this report is an update on stocked Bloater behavior using acoustic telemetry; a modelling tool to support fish stocking decisions, research into trout and salmon movement and habitat use using pop-off data storage tags, and research into juvenile salmonid diets. We would like to express our sincere appreciation to the many partners and volunteers who contributed to the successful delivery of LOMU initiatives. Special thanks to: Aurora, Peterborough and Kemptville MNRF District offices for their ongoing cooperation and collaboration; the Credit Valley Conservation, Toronto Region Conservation and Ganaraska Region Conservation Authorities for helping to plan and deliver several key programs; and the Ontario Federation of Anglers and Hunters and the many other partners committed to the Lake Ontario Atlantic Salmon restoration program. Work with University of Windsor and Queen s University is ongoing and should provide unique insight into Lake Ontario fisheries. LOMU gratefully acknowledges the important contribution of the Lake Ontario Commercial Fishery Liaison Committee, the Fisheries Management Zone 2 Council (FMZ2) members, the Ringwood hatchery partnership with the Metro East Anglers, Chinook Net Pen Committee, Muskies Canada, the Ganaraska River Fishway Volunteers, and the participants in the angler diary and assessment programs. Our team of skilled and committed staff and partners delivered an exemplary program of over forty field, laboratory and analytical projects that will provide long-term benefits to the citizens of Ontario. We are pleased to share the important information about the activities and findings of the Lake Ontario Management Unit from 216. Andy Todd Lake Ontario Manager For more detailed information or copies of this report please contact: Lake Ontario Management Unit Ontario Ministry of Natural Resources and Forestry R.R. #4, 41 Hatchery Lane Picton, ON KK 2T CAN Telephone: (613) FAX: (613) This Annual Report is available online at:
9 1 1. Index Fishing Projects 1.1 Ganaraska Fishway Rainbow Trout Assessment M.J. Yuille, Lake Ontario Management Unit The number of Rainbow Trout runningup the Ganaraska River during spring to spawn has been estimated at the fishway on Corbett Dam, Port Hope, ON since Prior to 1987, the Rainbow Trout counts at the fishway were based completely on hand lifts and visual counts. Since 1987, fish counts were made with a Pulsar Model 55 electronic fish counter. Based on visual counts the electronic counter is about 85.5% efficient, and the complete size of the run has been estimated accordingly. In years where no observations were made, the run was estimated with virtual population analysis. The counter is usually operated from mid to late March until early May. In 216, the fish counter was installed on March 11th, 216 and ran until May 9th, 216. In 216, the Rainbow Trout run in the Ganaraska River was estimated at 4,987 fish, below the average for the previous 1 years (7,192 fish on average from 26 to 215). From 29 to 213, the Rainbow Trout run in the Ganaraska River increased. Since 213, the Rainbow Trout run in the Ganaraska River has declined. The total estimated run size from 216 is down 25% from 215 and down 59% from the peak in 213 (Fig and Table ). Rainbow Trout were measured and weighed during the spawning run in most years since Rainbow Trout body condition was determined as the estimated weight of a 635 mm fork length (25 inch) fish. In 216, the condition of male (2,842 g) and female (2,981 g) Rainbow Trout were slightly higher than in 215, however, male and female condition is 3% lower than the previous 1-year average (Fig and Table 1.1.2). The proportion of Rainbow Trout with Lamprey marks in the Ganaraska River has been reported since In 216, 27% of fish had Lamprey marks (wound or scar), representing a 7% increase from 215 (Fig ). Despite this recent increase, lamprey wounds on Ganaraska River Rainbow Trout in 216 is below the previous 1 year average (38%; Table 1.1.3). Number of fish Estimated Observed FIG Estimated and observed run of Rainbow Trout at the Ganaraska River fishway at Port Hope, Ontario during spring Section 1. Index Fishing Projects
10 2 TABLE Observed count and estimated run of Rainbow Trout moving upstream at the Ganaraska River fishway at Port Hope, Ontario during spring, Estimates for 198, 1982, 1984, 1986, 1992, and 22 were interpolated from adjacent years with virtual population analysis. Year Observed Estimated ,281 1, ,237 2, ,724 2, ,4 4, , ,36 7, , ,97 7, , ,188 14, , ,63 13, ,983 15, ,121 18, ,184 14, ,366 13, , ,233 8, ,249 7, ,859 9, ,84 9, ,696 8, ,88 5, ,76 6, ,382 4,5 21 5,365 6, , ,897 4, ,452 5, ,417 5, ,171 5, ,641 4, ,963 4, ,29 4, ,75 6, ,313 9, ,256 8, ,761 12, ,218 9, ,89 6, ,225 4,987 Weight (g) FIG Body condition (estimated weight at 635 mm fork length) of Rainbow Trout at the Ganaraska River fishway at Port Hope, Ontario during spring Open and filled circles represent male and female Rainbow Trout (respectively) Female Male Male Female Year Weight Sample Weight Sample (g) Size (g) Size , , , , , , , , , , , , , , , , , , , , , , , , , , , , , , , , , , , , , , , , , , , , , , , , , , , , , , , , , , , , , , , , , , Average 2,995 3, TABLE Body condition (estimated weight at 635 mm fork length) of Rainbow Trout at the Ganaraska River fishway at Port Hope, Ontario during spring, Section 1. Index Fishing Projects
11 3 Marks / fish Scars Wounds FIG Trend in lamprey marks on Rainbow Trout during the spring , at the Ganaraska River fishway at Port Hope, Ontario. Since 199, A1 and A2 marks (King and Edsall 1979) were called wounds and the remainder of marks were called scars to fit with historical classification. King, E.L. Jr. and Edsall, T.A Illustrated field guide for the classification of sea lamprey attack marks on great lakes lake trout. GLFC Special Publication TABLE Lamprey marks on Rainbow Trout in spring , at the Ganaraska River fishway, at Port Hope, Ontario. Since 199, A1 and A2 marks were called wounds and the remainder of marks were called scars to fit with historical classification. Year Wounds/ Scars/ Marks/ % with % with % with Sample fish fish fish wounds scars marks Size Section 1. Index Fishing Projects
12 4 1.2 Lake Ontario and Bay of Quinte Fish Community Index Gill Netting J. A. Hoyle, Lake Ontario Management Unit The Lake Ontario and Bay of Quinte annual gill netting program is used to monitor the abundance and biological characteristics of a diversity of warm, cool and cold-water fish species. Data from the program are used to help manage local commercial and recreational fisheries as well as for tracking long-term changes in the aquatic ecosystem. Gill net sampling areas are shown in Fig and the basic sampling design is summarized in Table Included in the design are fixed, single-depth sites and depthstratified sampling areas. In 216, each site or area was visited from one to three times within specified time-frames, and with one to three gill net gangs set during each visit. The annual index gill netting field work occurs during the summer months. Summer was chosen based on an understanding of water temperature stability, fish movement/migration patterns, fish growth patterns, and logistical considerations. The time-frames for completion of field work varies among sampling sites/areas (Table 1.2.1). This increases the probability of encountering a wide-range of water temperatures across the depth ranges sampled, both seasonally and by geographic area. In 216, several additional gill net sampling locations were sampled. This included sites that had been sampled in the past but not for several decades; these additional sites were EB1, EB3, EB4, and EB5 in the Kingston Basin of eastern Lake Ontario, and Trenton, Belleville, and Deseronto in the upper Bay of Quinte. Also, two extra sampling depths (4 and 5 m) were added to the three deep-water depth-stratified sampling transects in the open waters of Lake Ontario; FIG Map of north eastern Lake Ontario. Shown are eastern Lake Ontario and Bay of Quinte fish community index gill netting sites. Section 1. Index Fishing Projects
13 5 TABLE Sampling design of the Lake Ontario fish community index gill netting program (Lake Ontario) including geographic and depth stratification, number of visits, number of replicate gill net gangs set during each visit (by gill net length), and the time-frame for completion of visits. Also shown is the year in which gill netting at a particular area/site was initiated and the number of prior years that netting has occurred. Region name Area name Design Site name Replicates Depth (m) Visits 465' 5' Site location (approx) Latitude Longitude (dec deg) (dec deg) Visits x Replicates Time-frame Northwest Port Credit Depth stratified PC Jul 1-Jul Northwest Port Credit Depth stratified PC Jul 1-Jul Northwest Port Credit Depth stratified PC Jul 1-Jul Northwest Port Credit Depth stratified PC Jul 1-Jul Northwest Port Credit Depth stratified PC Jul 1-Jul Northwest Port Credit Depth stratified PC Jul 1-Jul Northwest Port Credit Depth stratified PC Jul 1-Jul Northwest Port Credit Depth stratified Jul 1-Jul Northwest Port Credit Depth stratified Jul 1-Jul Northwest Port Credit Depth stratified Jul 1-Jul Northwest Port Credit Depth stratified Jul 1-Jul Central Cobourg Depth stratified CB Jul 1-Sep Central Cobourg Depth stratified CB Jul 1-Sep Central Cobourg Depth stratified CB Jul 1-Sep Central Cobourg Depth stratified CB Jul 1-Sep Central Cobourg Depth stratified CB Jul 1-Sep Central Cobourg Depth stratified CB Jul 1-Jul Central Cobourg Depth stratified CB Jul 1-Jul Central Cobourg Depth stratified Jul 1-Jul Central Cobourg Depth stratified Jul 1-Jul Central Cobourg Depth stratified Jul 1-Jul Central Cobourg Depth stratified Jul 1-Jul Northeast Brighton Depth stratified BR Aug 1-Sep Northeast Brighton Depth stratified BR Aug 1-Sep Northeast Brighton Depth stratified BR Aug 1-Sep Northeast Brighton Depth stratified BR Aug 1-Sep Northeast Brighton Depth stratified BR Aug 1-Sep Northeast Middle Ground Fixed site MG Aug 1-Sep Northeast Wellington Depth stratified WE Aug 1-Sep Northeast Wellington Depth stratified WE Aug 1-Sep Northeast Wellington Depth stratified WE Aug 1-Sep Northeast Wellington Depth stratified WE Aug 1-Sep Northeast Wellington Depth stratified WE Aug 1-Sep Northeast Rocky Point Depth stratified RP Jul 21-Sep Northeast Rocky Point Depth stratified RP Jul 21-Sep Northeast Rocky Point Depth stratified RP Jul 21-Sep Northeast Rocky Point Depth stratified RP Jul 21-Sep Northeast Rocky Point Depth stratified RP Jul 21-Sep Northeast Rocky Point Depth stratified Jul 1-Jul Northeast Rocky Point Depth stratified Jul 1-Jul Northeast Rocky Point Depth stratified Jul 1-Jul Northeast Rocky Point Depth stratified Jul 1-Jul Northeast Rocky Point Depth stratified Jul 1-Jul Northeast Rocky Point Depth stratified Jul 1-Jul Kingston Basin Flatt Point Depth stratified FP Jul 1-Jul Kingston Basin Flatt Point Depth stratified FP Jul 1-Jul Kingston Basin Flatt Point Depth stratified FP Jul 1-Jul Kingston Basin Flatt Point Depth stratified FP Jul 1-Jul Kingston Basin Flatt Point Depth stratified FP Jul 1-Jul Kingston Basin Grape Island Depth stratified GI Jul 1-Jul Kingston Basin Grape Island Depth stratified GI Jul 1-Jul Kingston Basin Grape Island Depth stratified GI Jul 1-Jul Kingston Basin Grape Island Depth stratified GI Jul 1-Jul Kingston Basin Grape Island Depth stratified GI Jul 1-Jul Kingston Basin Melville Shoal Depth stratified MS Jul 1-Jul Kingston Basin Melville Shoal Depth stratified MS Jul 1-Jul Kingston Basin Melville Shoal Depth stratified MS Jul 1-Jul Kingston Basin Melville Shoal Depth stratified MS Jul 1-Jul Kingston Basin Melville Shoal Depth stratified MS Jul 1-Jul Jun 2-Jul 17; Jul 18-Aug Kingston Basin Eastern Basin Fixed site EB ; Aug 15 Sep Kingston Basin Eastern Basin Fixed site EB Kingston Basin Eastern Basin Fixed site EB Kingston Basin Eastern Basin Fixed site EB Kingston Basin Eastern Basin Fixed site EB Kingston Basin Eastern Basin Fixed site EB Start-up year Number years Jun 2-Jul 17; Jul 18-Aug 14; Aug 15 Sep Jun 2-Jul 17; Jul 18-Aug 14; Aug 15 Sep Jun 2-Jul 17; Jul 18-Aug 14; Aug 15 Sep Jun 2-Jul 17; Jul 18-Aug 14; Aug 15 Sep Jun 2-Jul 17; Jul 18-Aug 14; Aug 15 Sep Section 1. Index Fishing Projects
14 6 TABLE (continued). Sampling design of the Lake Ontario fish community index gill netting program (Bay of Quinte) including geographic and depth stratification, number of visits, number of replicate gill net gangs set during each visit (by gill net length), and the timeframe for completion of visits. Also shown is the year in which gill netting at a particular area/site was initiated and the number of prior years that netting has occurred. Region name Area Name Design Site name Replicates Site location (approx) Depth Latitude Longitude (m) Visits 465' 5' (dec deg) (dec deg) Visits x Replicates Time-frame Bay of Quinte Conway Depth stratified CO Jul 21-Aug Bay of Quinte Conway Depth stratified CO Jul 21-Aug Bay of Quinte Conway Depth stratified CO Jul 21-Aug Bay of Quinte Conway Depth stratified CO Jul 21-Aug Bay of Quinte Conway Depth stratified CO Jul 21-Aug Bay of Quinte Hay Bay Depth stratified HB Jun 15-Jul 15 (1 visit); Jul 21-Aug 21 (2 visits) Bay of Quinte Hay Bay Depth stratified HB Jun 15-Jul 15 (1 visit); Jul 21-Aug 21 (2 visits) Bay of Quinte Deseronto Fixed site DE Jun 15-Jul 15 (1 visit); Jul 21-Aug 21 (1 visit) Bay of Quinte Big Bay Fixed site BB Jun 15-Jul 15 (1 visit); Jul 21-Aug 21 (3 visits) Bay of Quinte Belleville Fixed site BE Jun 15-Jul 15 (1 visit); Jul 21-Aug 21 (1 visit) Bay of Quinte Trenton Fixed site TR Jun 15-Jul 15 (1 visit); Jul 21-Aug 21 (1 visit) Start-up year Number years Rocky Point, Cobourg and Port Credit. Sampling at all these additional sites will help better assess fish distribution patterns. Monofilament gill nets with standardized specifications are used (monofilament mesh replaced multifilament in 1992; only catches from 1992-present are tabulated below). Each gill net gang consists of a graded-series of ten monofilament gill net panels of mesh sizes from 38 mm (1½ in) to 152 mm (6 in) stretched mesh at 13 mm (½ in) intervals, arranged in sequence. However, a standard gill net gang may consist of one of two possible configurations. Either, all ten mesh sizes (panels) are 15.2 m (5 ft) in length (total gang length is m (5 ft)), or, the 38 mm (1½ in) mesh size (panel) is 4.6 m (15 ft) in length and the remaining mesh sizes are 15.2 m (5 ft) each in length (total gang length is m (465 ft)) (see Table 1.2.1). Note that use of the shorter 38 mm gill net panel is related to the processing time required to deal with large numbers of small fish (e.g., Alewife and Yellow Perch) caught in this small mesh size. Gill net gangs are connected in series (i.e., cork lines and lead lines attached), but are separated by a 15.2 m (5 ft) spacer to minimize "leading" of fish. The 152 mm (6 in) end of one gang is connected to the 38 mm (1 ½ in) gang of the adjoining gang. The entire gill net strap (all joined gangs) is set within 2.5 m of the site depth listed in Table Gill net set duration usually ranges from hr but can be up to three days for the deep-water Lake Ontario sites (4-14 m) at Rocky Point, Cobourg and Port Credit. Catches were summed across the ten mesh sizes from 1½-6 inch. In the case where the 38 mm mesh size used was 4.6 m in length, the catch in this mesh was adjusted (i.e., multiplied by 15.2/4.6) prior to summing the ten mesh sizes. Therefore, all reported catches represent the total catch in a m (5 ft) gang of gill net. In 216, 314 gill net samples were made from 21-Jun to 7-Sep. Thirty-five different species and over 5, individual fish were caught. About 85% of the observed catch was alewife (Table 1.2.2). Species-specific gill net catch summaries are shown by geographic area/ site in Tables Selected biological information is also presented below for Lake Whitefish and Walleye. Lake Ontario Northeast (Brighton, Wellington and Rocky Point) and Kingston Basin (Melville Shoal, Grape Island and Flatt Point) Nearshore Areas (Tables inclusive) Six depth-stratified sampling areas (Melville Shoal, Grape Island, Flat Point, Rocky Section 1. Index Fishing Projects
15 7 TABLE Species-specific total gill net catch in 216 from 21- Jun to 7-Sep. Standard catch is the observed catch expanded to represent the catch in a 5 ft panel length of 1 1/2 inch mesh size in cases where only 15 ft was used. A total of 314 gill nets were set and 35 species comprising 5,12 fish were caught. Species Observed catch Standard catch Mean weight (g) Lake Sturgeon Longnose Gar ,166 Bowfin 1 1 3,415 Alewife 43, 87,81 35 Gizzard Shad Coho Salmon 5 5 3,732 Chinook Salmon ,851 Rainbow Trout 3 3 1,123 Brown Trout ,53 Lake Trout ,443 Lake Whitefish Cisco Rainbow Smelt Northern Pike ,55 Longnose Sucker White Sucker Shorthead Redhorse Greater Redhorse 1 1 2,136 Common Carp 5 5 6,392 Golden Shiner Brown Bullhead Channel Catfish Burbot 6 6 2,861 White Perch White Bass Rock Bass Pumpkinseed Bluegill Smallmouth Bass Black crappie Yellow Perch 3,315 4,8 49 Walleye ,577 Round Goby Freshwater Drum ,177 Deepwater Sculpin Point, Wellington and Brighton) that employ a common and balanced sampling design were used here to provide a broad picture of the warm, cool and coldwater fish community inhabiting the open -coastal waters out to about 3 m water depth in the eastern half of Lake Ontario. Results were summarized and presented graphically (Fig ) to illustrate abundance trends of the most abundant fish species. Many species showed peak abundance levels in the early 199s followed by dramatic abundance decline. Alewife, the most common species caught, has occurred at very high abundance levels the last few years until 214 when abundance declined precipitously. Alewife abundance increased in 215 and again in 216. Yellow Perch remained at a very low level of abundance in 216. Lake Trout abundance declined in 216. In 214, Round Goby abundance declined to its lowest level since 24, and remained low in 215 but increased in 216. Walleye catch declined in 216. Lake Whitefish remain at a very low abundance level. Rock Bass, Smallmouth Bass, Chinook Salmon and Brown Trout abundance all declined in 216. Middle Ground (Table 1.2.9) Middle Ground represents one of our longest running gill netting locations. Seven species were caught at Middle Ground in 216. Yellow Perch dominated the catch. Walleye and White Sucker abundance increased in 216. Kingston Basin Deep Sites (EB2 and EB6; Tables and ) Two single-depth sites (EB2 and EB6) are used to monitor long-term trends in the deep water fish community the Kingston Basin. Results were summarized and presented graphically (Fig ) to illustrate abundance trends of the most abundant species (Alewife, Lake Trout, Lake Whitefish, Yellow Perch, Rainbow Smelt, Cisco, Chinook Salmon and Round Goby). Alewife catches were variable with high catches in some years, , 21, 212 and 216. Lake Trout, Lake Whitefish, Rainbow Smelt, and Cisco abundance Section 1. Index Fishing Projects
16 8 TABLE Species-specific catch per gillnet set at Brighton in Northeastern Lake Ontario, Annual catches are averages for 1-3 gillnet gangs set at each of 5 depths ( 7.5, 12.5, 17.5, 22.5 and 27.5 m) during each of 1-3 visits during summer. Mean catches for and time-periods are shown in bold. The total number of species caught and gillnets set each year are indicated mean mean Bowfin Alewife Gizzard Shad Coho Salmon Chinook Salmon Rainbow Trout Brown Trout Lake Trout Lake Whitefish Cisco (Lake Herring) Round Whitefish Rainbow Smelt Northern Pike White Sucker Lake Chub Common Carp Brown Bullhead Channel Catfish American Eel Burbot White Perch Rock Bass Pumpkinseed Smallmouth Bass Yellow Perch Walleye Round Goby Freshwater Drum Total catch Number of species Number of sets Section 1. Index Fishing Projects
17 9 TABLE Species-specific catch per gillnet set at Wellington in Northeastern Lake Ontario, Annual catches are averages for 1-3 gillnet gangs set at each of 5 depths ( 7.5, 12.5, 17.5, 22.5 and 27.5 m) during each of 1-3 visits during summer. Mean catches for and time-periods are shown in bold. The total number of species caught and gillnets set each year are indicated mean mean Alewife Gizzard Shad Chinook Salmon Rainbow Trout Brown Trout Lake Trout Lake Whitefish Cisco Round Whitefish Rainbow Smelt Northern Pike White Sucker Greater Redhorse Lake Chub Common Carp Brown Bullhead Burbot White Perch Rock Bass Smallmouth Bass Yellow Perch Walleye Round Goby Freshwater Drum Total catch Number of species Number of sets Section 1. Index Fishing Projects
18 1 TABLE Species-specific catch per gillnet set at Rocky Point (nearshore sites only) in Northeastern Lake Ontario, Annual catches are averages for 1-3 gillnet gangs set at each of 5 depths ( 7.5, 12.5, 17.5, 22.5 and 27.5 m) during each of 2-3 visits during summer. Mean catches for and time-periods are shown in bold. The total number of species caught and gillnets set each year are indicated mean mean Alewife Chinook Salmon Rainbow Trout Atlantic Salmon Brown Trout Lake Trout Lake Whitefish Cisco Chub Rainbow Smelt White Sucker Lake Chub Common Carp Brown Bullhead Channel Catfish Stonecat Burbot White Perch Rock Bass Smallmouth Bass Yellow Perch Walleye Round Goby Freshwater Drum Total catch Number of species Number of sets Section 1. Index Fishing Projects
19 11 TABLE Species-specific catch per gillnet set at Flatt Point in the Kingston Basin of Lake Ontario, Annual catches are averages for 1-3 gillnet gangs set at each of 5 depths ( 7.5, 12.5, 17.5, 22.5 and 27.5 m) during each of 2-3 visits during summer. Mean catches for and time-periods are shown in bold. The total number of species caught and gillnets set each year are indicated mean mean Lake Sturgeon Alewife Chinook Salmon Rainbow trout Brown Trout Lake Trout Lake Whitefish Cisco (Lake Herring) Coregonus sp Rainbow Smelt Northern Pike White Sucker Brown Bullhead Stonecat Burbot White Perch Rock Bass Smallmouth Bass Yellow Perch Walleye Round Goby Freshwater Drum Total catch Number of species Number of sets Section 1. Index Fishing Projects
20 12 TABLE Species-specific catch per gillnet set at Grape Island in the Kingston Basin of Lake Ontario, Annual catches are averages for 1-3 gillnet gangs set at each of 5 depths ( 7.5, 12.5, 17.5, 22.5 and 27.5 m) during each of 2-3 visits during summer. Mean catches for and time-periods are shown in bold. The total number of species caught and gillnets set each year are indicated mean mean Lake Sturgeon Alewife , , Chinook Salmon Brown Trout Lake Trout Lake Whitefish Cisco (Lake Herring) Rainbow Smelt Northern Pike White Sucker Silver Redhorse Brown Bullhead Channel Catfish Stonecat Burbot Threespine Stickleback White Perch Rock Bass Smallmouth Bass Yellow Perch Walleye Round Goby Freshwater Drum Total catch , ,141 Number of species Number of sets Section 1. Index Fishing Projects
21 13 TABLE Species-specific catch per gillnet set at Melville Shoal in the Kingston Basin of Lake Ontario, Annual catches are averages for 1-3 gillnet gangs set at each of 5 depths ( 7.5, 12.5, 17.5, 22.5 and 27.5 m) during each of 2-3 visits during summer. Mean catches for and time-periods are shown in bold. The total number of species caught and gillnets set each year are indicated mean mean Lake Sturgeon Alewife Gizzard Shad Chinook Salmon Rainbow Trout Brown Trout Lake Trout Lake Whitefish Cisco Coregonus sp Rainbow Smelt Northern Pike White Sucker Greater Redhorse Moxostoma sp Common Carp Channel Catfish Stonecat Burbot White Perch Rock Bass Pumpkinseed Smallmouth Bass Yellow Perch Walleye Round Goby Freshwater Drum Total catch Number of species Number of sets Section 1. Index Fishing Projects
22 14 FIG Abundance trends for the most common species caught in gill nets at six depth-stratified transects (nearshore out to 3 m) in northeastern Lake Ontario (Melville Shoal, Grape Island, Flatt Point, Rocky Point, Wellington and Brighton; see Fig ). Annual catch per gill net values were corrected (covariate) for the overall mean observed water temperature (14.3 o C). Dotted lines show 3-yr running averages (two years for first and last years graphed). Section 1. Index Fishing Projects
23 15 TABLE Species-specific catch per gill net set at Middle Ground in Northeastern Lake Ontario, (no sampling in 212). Annual catches are averages for 2 gill net gangs set during each of 1-3 visits during summer. Mean catches for and time-periods are shown in bold. The total number of species caught and gill nets set each year are indicated mean mean Longnose Gar Alewife Gizzard Shad Brown Trout Lake Trout Northern Pike White Sucker Common Carp Brown Bullhead White Perch Rock Bass Pumpkinseed Bluegill Smallmouth Bass Largemouth Bass Yellow Perch Walleye Freshwater Drum Total catch Number of species Number of sets Section 1. Index Fishing Projects
24 16 TABLE Species-specific catch per gillnet set at EB2 in the Kingston Basin of Lake Ontario, Annual catches are averages for 3-8 gillnet gangs set during each of 2-3 visits during summer. Mean catches for and time-periods are shown in bold. The total number of species caught and gillnets set each year are indicated mean mean Sea Lamprey Lake Sturgeon Alewife Chinook Salmon Rainbow Trout Atlantic Salmon Brown Trout Lake Trout Lake Whitefish Cisco Rainbow Smelt Burbot Trout-perch White Perch Rock Bass Smallmouth Bass Yellow Perch Walleye Round Goby Freshwater Drum Sculpin sp Total catch Number of species Number of sets Section 1. Index Fishing Projects
25 17 TABLE Species-specific catch per gillnet set at EB6 in the Kingston Basin of Lake Ontario, Annual catches are averages for 3-8 gillnet gangs set during each of 2-3 visits during summer. Mean catches for and time-periods are shown in bold. The total number of species caught and gillnets set each year are indicated mean mean Sea Lamprey Lake Sturgeon Alewife Chinook Salmon Rainbow Trout Brown Trout Lake Trout Lake Whitefish Cisco Rainbow Smelt Common Carp American Eel Burbot White Perch Yellow Perch Walleye Round Goby Total catch Number of species Number of sets Section 1. Index Fishing Projects
26 18 FIG Abundance trends (annual means) for the most common species caught in gill nets at the Kingston Basin deep sites, in eastern Lake Ontario (EB2 and EB6; see Fig ). Dotted lines show 3-yr running averages (two years for first and last years graphed). Section 1. Index Fishing Projects
27 19 declined throughout the 199s and remained low during the years that followed except that Lake Trout appears to be increasing gradually in recent years and Cisco abundance increased during Chinook Salmon catches were relatively high in 216. No Round Goby were caught in the past two years. Kingston Basin (additional gill netting in 216; Table ) Three additional Kingston Basin deep gill net sampling sites were netted in 216; EB1, EB3, EB4 and EB5). The sampling included a seasonal component (Jun-Sep). Together, along with EB2 and EB6), this netting provided a more complete description of the Kingston Basin deep-water fish community (Table ). Overall, the dominant species were Alewife, Lake Trout, Cisco, and Lake Whitefish; of note, Alewife catches were highest in July. Lakewide Depth Stratified Transects (Rocky Point, Cobourg, Port Credit; Tables ) In 216, for the third consecutive year, three lakewide depth-stratified gill net transects, spanning a wide depth range ( m), were sampled. Smallmouth Bass, Rock Bass, Yellow Perch, and White Perch were caught only in the east at Rocky Point. Coho Salmon, Rainbow Trout and Gizzard Shad were caught only in central Lake Ontario at Cobourg. Longnose Sucker was caught only in the west at Port Credit. Rocky Point Deep Sites (Table ) Ten species have been captured at the Rocky Point deep sampling sites since Alewife and Lake Trout were the two most abundant species. Lake Trout abundance was relatively stable from , declined significantly through 24 and recovered in the years following. Round Goby appeared for the first time in 212 (at the 6 m site) and were captured again in 215 and 216. Unlike Cobourg and Port Credit deep gill net sites (see below), Deepwater Sculpin had never been caught in the Rocky Point gill net sites until 215 but none was captured in 216. Cobourg (Tables and ) Nearshore sites ( m): Alewife dominated the catch at the Cobourg nearshore sites but the salmonid fish community was also well represented (Table ). Twelve species were caught in 216. Alewife catch declined significantly from but increased in 215 and again in 216. Deep sites (4-14 m): The deep sites at Cobourg were sampled again in 216 and with the additional depths (4 and 5 m) four species were caught: Alewife, Lake Trout, Cisco and Deepwater Sculpin. Alewife abundance was low in 216 (Table ). Port Credit (Tables and 1.2.2) Port Credit was sampled for the first time in 214 and sampling occurred again in 215 and in 216 with two additional deep sampling depths added (4 and 5 m). Nearshore sites ( m): Six species were caught in 216. Alewife dominated the catch. Other species caught included Round Goby, Lake Trout, White Sucker, Chinook Salmon and Longnose Sucker (Table ). Deep Sites (4-14 m): Five species were caught at the Port Credit deep sites: Alewife, Lake Trout, Deepwater Sculpin, Chinook Salmon and Burbot (Table 1.2.2). Bay of Quinte (Conway, Hay Bay and Big Bay; Tables inclusive) Three sites are used to monitor long-term trends in the Bay of Quinte fish community. Big Bay is a single-depth site; Hay Bay has two depths and Conway five depths. Average summer catch for the three sites are summarized graphically in Fig to illustrate abundance trends of the most abundant species from Yellow Perch abundance peaked in 1998, declined gradually through 213, and increased Section 1. Index Fishing Projects
28 2 TABLE Species-specific catch per gillnet set at six sites (EB1, EB2, EB3, EB4, EB5, EB6) in the Kingston Basin of Lake Ontario, 216. Catches are averages for 3 gillnet gangs set during each of 3 visits during summer. The total number of species caught and gillnets set each year are indicated. EB1 EB2 EB3 EB4 EB5 EB6 Species Jun Jul Aug Jun Jul Aug Jun Jul Aug Jun Jul Sep Jun Jul Sep Jun Jul Sep Lake Sturgeon Alewife , Chinook Salmon Brown Trout Lake Trout Lake Whitefish Cisco Rock Bass Yellow Perch Walleye Round Goby Total catch Number of species Number of sets Section 1. Index Fishing Projects
29 21 TABLE Species-specific catch per gillnet set at Rocky Point in northeastern Lake Ontario by site depth, 216. Catches are averages for 2 or 3 gill net gangs during each of 1 or 2 visits during summer. The total number of species caught and number of gill nets set are indicated. Northeast (Rocky Point) Site depth (m) Alewife Chinook Salmon Brown Trout Lake Trout Lake Whitefish Cisco Burbot White Perch Rock Bass Smallmouth Bass Yellow Perch Walleye Round Goby Total catch Number of species Number of sets TABLE Species-specific catch per gillnet set at Cobourg in north central Lake Ontario by site depth, 216. Catches are averages for 2 or 3 gill net gangs during each of 1 or 2 visits during summer. The total number of species caught and number of gill nets set are indicated. North Central (Cobourg) Site depth (m) Alewife Gizzard shad Coho salmon Chinook salmon Rainbow trout Brown trout Lake trout Lake whitefish Cisco White sucker Walleye Round goby Deepwater sculpin Total catch Number of species Number of sets TABLE Species-specific catch per gillnet set at Port Credit in northwestern Lake Ontario by site depth, 216. Catches are averages for 2 or 3 gill net gangs during each of 1 or 2 visits during summer. The total number of species caught and number of gill nets set are indicated. Northwest (Port Credit) Site depth (m) Alewife Chinook salmon Lake trout Longnose sucker White sucker Burbot Round goby Deepwater sculpin Total catch Number of species Number of sets Section 1. Index Fishing Projects
30 22 TABLE Species-specific catch per gillnet set at Rocky Point (deep sites only) in northeastern Lake Ontario, (no sampling in 26, 27 or 21). Annual catches are averages for 2 or 3 gillnet gangs set at each of up to 6 depths (4, 5, 6, 8, 1 or 14 m) during each of 2 visits during early-summer. Mean catches for and time-periods are shown in bold. The total number of species caught and gillnets set each year are indicated mean mean Alewife Lake Trout Lake Whitefish Cisco (Lake Herring) Coregonus sp Rainbow Smelt Burbot White Perch Round Goby Slimy Sculpin Deepwater Sculpin Total catch Number of species Number of sets Section 1. Index Fishing Projects
31 23 TABLE Species-specific catch per gill net set at Cobourg (nearshore sites only) in northeastern Lake Ontario, Annual catches are averages for 2 gill net gangs set at each of 5 depths (7.5, 12.5, 17.5, 22.5 and 27.5 m) during each of 1-3 visits during summer. The total number of species caught and gill nets set each year are indicated Alewife Gizzard Shad Coho Salmon Chinook Salmon Rainbow Trout Brown Trout Lake Trout Lake Whitefish Cisco Round Whitefish Rainbow Smelt White Sucker Greater Redhorse Burbot Smallmouth Bass Yellow Perch Walleye Round Goby Freshwater Drum Total catch Number of species Number of sets TABLE Species-specific catch per gill net set at Cobourg (deep sites only) in northeastern Lake Ontario, 1997, 1998, and Annual catches are averages for 2 or 3 gill net gangs set at each of 4-6 depths ( 4, 5, 6, 8, 1 and 14 m) during each of 1-2 visits during summer. The total number of species caught and gill nets set each year are indicated Alewife Brown Trout Lake Trout Cisco (Lake Herring) Rainbow Smelt Slimy Sculpin Deepwater Sculpin Total catch Number of species Number of sets TABLE Species-specific catch per gill net set at Port Credit (nearshore sites only) in northwestern Lake Ontario, Annual catches are averages for 2 gillnet gangs set at each of 5 depths ( 7.5, 12.5, 17.5, 22.5 and 27.5 m) during summer. The total number of species caught and gillnets set each year are indicated Alewife Chinook Salmon Atlantic Salmon Brown Trout Lake Trout Longnose Sucker White Sucker Round Goby Total catch Number of species Number of sets TABLE Species-specific catch per gill net set at Port Credit (deep sites only) in northwestern Lake Ontario, Annual catches are averages for 3 gillnet gangs set at each of 4-6 depths (4, 5, 6, 8, 1, and 14 m) during summer. The total number of species caught and gillnets set each year are indicated Alewife Chinook Salmon Lake Trout Burbot Deepwater Sculpin Total catch Number of species Number of sets Section 1. Index Fishing Projects
32 24 TABLE Species-specific catch per gillnet set at Conway in the Bay of Quinte, Annual catches are averages for 2-3 gillnet gangs set at each of 5 depths ( 7.5, 12.5, 2, 3 and 45 m) during each of 2-3 visits during summer. Mean catches for and time-periods are shown in bold. The total number of species caught and gillnets set each year are indicated mean mean Sea Lamprey Lake Sturgeon Longnose Gar Alewife Gizzard Shad Chinook Salmon Rainbow Trout Atlantic Salmon Brown Trout Lake Trout Lake Whitefish Cisco Coregonus sp Rainbow Smelt Northern Pike White Sucker Silver Redhorse Moxostoma sp Common Carp Brown Bullhead Channel Catfish Stonecat Burbot Trout-perch White Perch White Bass Rock Bass Pumpkinseed Smallmouth Bass Yellow Perch Walleye Round Goby Freshwater Drum Total catch Number of species Number of sets Section 1. Index Fishing Projects
33 25 TABLE Species-specific catch per gillnet set at Hay Bay in the Bay of Quinte, Annual catches are averages for 1-3 gillnet gangs set at each of 2 depths (7.5 and 12.5 m) during each of 1-3 visits during summer. Mean catches for and time-periods are shown in bold. The total number of species caught and gillnets set each year are indicated mean mean Sea Lamprey Lake Sturgeon Longnose Gar Alewife Gizzard Shad Chinook Salmon Rainbow trout Brown Trout Lake Trout Lake Whitefish Cisco (Lake Herring) Coregonus sp Rainbow Smelt Northern Pike White Sucker River Redhorse Common Carp Golden Shiner Spottail Shiner Brown Bullhead Channel Catfish Burbot White Perch White bass Rock Bass Pumpkinseed Bluegill Smallmouth Bass Black Crappie Yellow Perch Walleye Round Goby Freshwater Drum Total catch Number of species Number of sets Section 1. Index Fishing Projects
34 26 TABLE Species-specific catch per gillnet set at Big Bay in the Bay of Quinte, Annual catches are averages for 2 gillnet gangs set during each of 2-4 visits during summer. Mean catches for and time-periods are shown in bold. The total number of species caught and gillnets set each year are indicated mean mean Lake Sturgeon Longnose Gar Alewife Gizzard Shad Lake Whitefish Northern Pike Mooneye White Sucker Silver Redhorse Shorthead Redhorse Moxostoma sp Common Carp Brown Bullhead Channel Catfish Burbot White Perch White Bass Rock Bass Pumpkinseed Bluegill Smallmouth Bass Largemouth Bass Black Crappie Yellow Perch Walleye Round Goby Freshwater Drum Total catch Number of species Number of sets Section 1. Index Fishing Projects
35 27 FIG Abundance trends (annual means) for the most common species caught in gill nets at three areas in the Bay of Quinte (Conway, Hay Bay and Big Bay; see Fig ). Dotted lines show 3-yr running averages (two years for first and last years graphed). Section 1. Index Fishing Projects
36 28 over the last three years. In 214, White Perch abundance declined to its lowest level since 21, and in 215 and 216 it recovered slightly. Alewife abundance increased from 27-21, declined from , and increased significantly through 216. Walleye abundance declined from but has remained very stable since. Freshwater Drum and Gizzard Shad catches show no remarkable trends. White Sucker abundance declined since 1992, gradually levelling off in recent years. Brown Bullhead abundance has declined precipitously to low levels. Bluegill and Pumpkinseed abundance increased in the late-199s then declined through 24. Thereafter, Bluegill catches increased but Pumpkinseed catches did not. Cisco catches increased in the late-199s then declined; most recently Cisco catch increased in 215 and again in 216. Bay of Quinte (additional gill netting in 216; Table ) Three additional upper Bay of Quinte gill net sampling sites were netted in 216. The sampling included a seasonal component (June and August sampling). Together, along with Big Bay, this netting provided a more complete description of the upper Bay of Quinte fish community (Table ). Overall, the dominant species were Yellow Perch, Alewife, White Perch, Gizzard Shad, Freshwater Drum, Walleye and Longnose Gar. The following seasonal highlights were noted. Yellow Perch, Alewife and Walleye catches higher in June than in August. White Perch and Gizzard Shad catches were higher in August than in June. TABLE Species-specific catch per gill net set at upper Bay of Quinte gill net site locations (Trenton, Belleville, Big Bay and Deseronto) in June and August, 216. The total catch and the number of species caught and gill nets set are indicated. Trenton Belleville Big Bay Deseronto Species Jun Aug Jun Aug Jun Aug Jun Aug Total Longnose Gar Alewife Gizzard Shad Northern Pike White Sucker Shorthead Redhorse Greater Redhorse Common Carp Brown Bullhead Channel Catfish White Perch White Bass Rock Bass Pumpkinseed Bluegill Yellow Perch Walleye Freshwater Drum Total catch Number of species Number of sets Section 1. Index Fishing Projects
37 29 Species Highlights Lake Whitefish Fourty-five Lake Whitefish were caught and were interpreted for age in the 216 index gill nets (Table ). Fish ranged in age from 1-26 years but most fish (89%) were 1 years old or less. Eight (18%) whitefish were from the 213 year-class and seven (16%) were from the 212 year-class. Walleye Four hundred and six Walleye were caught and interpreted for age in the 216 index gill nets (Table ). One hundred and eighty-seven (87%) of 214 Walleye caught in the Bay of Quinte gill nets were age 1-4 years. In the Kingston Basin nearshore gill nets, 9% (145) of the 161 Walleye were age-5 or greater. Age-2 walleye from the 214 year-class were prominent in the age distribution. TABLE Age distribution of 45 Lake Whitefish sampled from summer index gill nets, by region, during 216. Also shown are mean fork length and mean weight. Age / Year-class Region Total Central 1 1 Northeast Kingston Basin (deep) Kingston Basin (nearshore) Bay of Quinte Total aged Mean fork length (mm) Mean weight (g) TABLE Age distribution of 46 Walleye sampled from summer index gill nets, by region, 216. Also shown are mean fork length, mean weight, mean GSI (females), and percent mature (females). GSI = gonadal somatic index calculated for females only as log1(gonad weight + 1)/log1(weight). Note that a GSI greater than approximately.25 indicates a mature female. Region Age / Year-class Total Central Northeast Middle Ground Kingston Basin Bay of Quinte Total aged Mean fork length (mm) Mean weight (g) Mean GSI (females) % mature Section 1. Index Fishing Projects
38 3 1.3 Lake Ontario and Bay of Quinte Fish Community Index Trawling J. A. Hoyle, Lake Ontario Management Unit Bottom trawling has been used to monitor the relative abundance of small fish species and the young of large-bodied species in the fish community since the 196s. After some initial experimentation with different trawl specifications, two trawl configurations (one for the Bay of Quinte and one for Lake Ontario) were routinely employed (see trawl specifications Table 1.3.1). In the Kingston Basin of eastern Lake Ontario, six sites, ranging in depth from about 2 to 35 m, were visited about four times annually up until 1992 when three sites were dropped. From 1992 to 215, three visits were made to each of three sites annually, and four replicate ½ mile trawls are made during each visit. After 1995, a deep water site was added outside the Kingston Basin, south of Rocky Point (visited twice annually with a trawling distance of 1 mile; about 1 m water depth), to give a total of four Lake sites (Fig ). In 214, a second trawl site/ depth was added at Rocky Point (6 m) and two trawl sites at each of Cobourg and Port Credit (6 3/4 Western (Poly) 3/4 Yankee Standard No. 35 (Bay Trawl) and 1 m depths at both locations). In 215, the Lake Ontario trawling was expanded significantly to include several more sampling depths at each of Rocky Point, Cobourg, and Port Credit. In 216 the three Kingston Basin sites that were dropped in 1992 were added back in to the sampling design, and trawling was not done at Cobourg or Port Credit. [Note that these sites were sampled in spring and fall prey fish assessments (see Section 1.11 and 1.12)]. In the Bay of Quinte, six fixed-sites, ranging in depth from about 4 to 21 m, are visited annually on two or three occasions during mid to late-summer. Four replicate ¼ mile trawls are made during each visit to each site. The 216 bottom trawl sampling design is shown in Table Thirty species and over 72, fish were caught in 78 bottom trawls in 216 (2-Jun to 7- Sep, Table 1.3.3). Alewife (27%), Gizzard Shad (18%), Round Goby (18%) and Yellow Perch (15%), collectively made up 86% of the catch by number. Species-specific catches in the 216 TABLE Bottom trawl specifications used in Eastern Lake Ontario and Bay of Quinte Fish Community sampling. (Lake Trawl) Head Rope Length (m) Foot Rope Length (m) Side Brail Height (m) Mesh Size (front) 4" knotted black poly 3.5" knotted green nylon Twine Type (middle) 3" knotted black poly 2.5" knotted nylon Before Codend 2" knotted black poly 2" knotted nylon 1.5" knotted black nylon (chafing gear) 1" knotted black nylon Codend Mesh Size.5" knotted white nylon.5" knotless white nylon Remarks: Fishing height 2. m Fishing height 1.9 m FISHNET gear dimensions FISHNET gear dimensions as per Casselman 92/6/8 as per Casselman 92/6/8 GRLEN:length of net N/A N/A GRHT:funnel opening height 2.25 m 2.3 m GRWID:intake width 6.8 m 9.9 m GRCOL:1 wt,2 bl,3 gn 2 7 (discoloured) GRMAT:1 nylon,2 ploypr. 2 1 GRYARN:1 mono,2 multi 2 2 GRKNOT:1 knotless,2 knots 2 2 Section 1. Index Fishing Projects
39 31 FIG Map of north eastern Lake Ontario. Shown are eastern Lake Ontario and Bay of Quinte fish community index bottom trawling site locations. TABLE Sampling design of the Lake Ontario fish community index bottom trawling program including geographic stratification, number of visits, number of replicate trawls made during each visit, and the time-frame for completion of visits. Also shown is the year in which bottom trawling at a particular area was initiated and the number of years that trawling has occurred. Note that in 216 a fourth visit was made to EB3 (Sep) and 4 replicate trawls were conducted. Area name Site name Depth (m) Visits* Replicates x distance Site location (approx) Latitude Longitude (dec deg) (dec deg) Visits x reps Time-frame Start-up year Kingston Basin EB x 1/2 mile Jun 2-Sep Kingston Basin EB x 1/2 mile Jun 2-Sep Kingston Basin EB x 1/2 mile Jun 2-Sep Kingston Basin EB x 1/2 mile Jun 2-Sep Kingston Basin EB x 1/2 mile Jun 2-Sep Kingston Basin EB x 1/2 mile Jul 1-Aug Rocky Point x 1/2 mile July Rocky Point x 1/2 mile July Rocky Point x 1/2 mile July Rocky Point x 1/2 mile July Rocky Point x 1/2 mile July Rocky Point x 1/2 mile July Rocky Point x 1/2 mile July Rocky Point x 1/2 mile July Bay of Quinte BQ x 1/4 mile Aug 1-Sep Bay of Quinte BQ x 1/4 mile Aug 1-Sep Bay of Quinte BQ x 1/4 mile Aug 1-Sep Bay of Quinte BQ x 1/4 mile Aug 1-Sep Bay of Quinte BQ x 1/4 mile Aug 1-Sep Bay of Quinte BQ x 1/4 mile Aug 1-Sep Number years Section 1. Index Fishing Projects
40 32 TABLE Species-specific total bottom trawl catch in 216 from 2-Jun to 7-Sep. Frequency of occurrence (FO) is the number of trawls, out of a possible 78, in which each species (3 species and 72,138 individual fish) was caught. Species FO Catch Biomass (kg) Mean weight (g) Longnose Gar Alewife 55 19, Gizzard Shad 34 12, Lake Trout Cisco Rainbow Smelt White Sucker Common Carp Golden Shiner Spottail Shiner 37 2, Brown Bullhead Channel Catfish American Eel Trout-perch White Perch 41 5, White Bass Pumpkinseed Bluegill Largemouth Bass Black Crappie Lepomis sp Yellow Perch 48 1, Walleye Johnny Darter Logperch Brook Silverside Round Goby 43 13, Freshwater Drum 37 2, Slimy Sculpin Deepwater Sculpin 8 1, Totals 72, trawling program are shown in Tables Lake Ontario Kingston Basin (Tables and 1.3.5) Bottom trawls were conducted at six sites from June to September 216. Seven species were caught with the most abundant species being Round Goby, Alewife and Rainbow Smelt. Round Goby abundance increased through the summer; TABLE Species-specific catch per trawl at six sites (EB1, EB2, EB3, EB4, EB5, EB6) in the Kingston Basin of Lake Ontario, 216. Catches are averages for the number of trawls indicated. The total number of fish and species caught and trawls conducted are indicated. Month Species Jun Jul Aug Sep Total Alewife Lake Trout Cisco Rainbow Smelt Walleye Round Goby Freshwater Drum Total catch Number of species Number of trawls catches were lowest in June and highest in September. Alewife catches were highest in June and July and very low in August and September. Trend through time catches for most common species are shown in Fig EB2 (Table 1.3.6) Four species: Round Goby, Alewife, Rainbow Smelt and Lake Trout were caught at EB2 in 216. One of the three Lake Trout caught, a young-of-the-year fish, was of wild origin (fork length 54 mm; weight 1 g). Threespine Stickleback, having risen to high levels of abundance in the late 199s, declined rapidly after 23 and was absent in the EB2 catches for the last 1 years. Slimy Sculpin, another formerly abundant species has also been absent for 1 years. EB3 (Table 1.3.7) Six species: Round Goby, Rainbow Smelt, Alewife, Cisco, Walleye and Freshwater Drum were caught at EB3 in 216. Round Goby, having first appeared in the EB3 catches in 24, now dominate the total catch but did decline in 216. Rainbow Smelt abundance was higher in the last two years. As was the case for EB2, Threespine Stickleback have been absent from the EB3 catches for 1 years. A number of Cisco were caught, ranging in fork length from mm, and weight from g. Section 1. Index Fishing Projects
41 33 TABLE Species-specific catch per trawl at six sites (EB1, EB2, EB3, EB4, EB5, EB6) by month in the Kingston Basin of Lake Ontario, 216. Catches are averages for 1 to 4 trawls during each of 3 or 4 visits during summer. The total number of fish and species caught and trawls conducted are indicated. EB1 EB2 EB3 EB4 EB5 EB6 Species Jun Jul Aug Jun Jul Aug Jun Jul Aug Sep Jun Jul Sep Jun Jul Sep Jun Jul Sep Total Alewife Lake Trout Cisco Rainbow Smelt Walleye Round Goby Freshwater Drum Total catch Number of species Number of trawls Section 1. Index Fishing Projects
42 34 25 Alewife 6 Threespine Stickleback 7 Johnny Darter Catch per Trawl Rainbow Smelt Catch per Trawl Round Goby Catch per Trawl Trout-perch Catch per Trawl Catch per Trawl Slimy Sculpin Catch per Trawl Catch per Trawl 2. Lake Trout Catch per Trawl Spottail Shiner Cisco Catch per Trawl Catch per Trawl 25 Lake Whitefish.4 Yellow Perch Catch per Trawl Catch per Trawl FIG Abundance trends (annual means) for the most common species caught in bottom trawls at three to six sites in the Kingston Basin, eastern Lake Ontario (EB1, EB2, EB3, EB4, EB5, EB6); see Fig ). Dotted lines show 3-yr running averages (two years for first and last years graphed). Section 1. Index Fishing Projects
43 35 TABLE Species-specific catch per trawl (12 min duration; 1/2 mile) by year in the fish community index bottom trawling program during summer at EB2, Kingston Basin, Lake Ontario. Catches are the mean number of fish observed for the number of trawls indicated. Total catch and number of species caught are indicated. Species mean Year mean Alewife Rainbow Trout Lake Trout Lake Whitefish Cisco (Lake Herring) Coregonus sp Rainbow Smelt Emerald Shiner Burbot Threespine Stickleback Trout-perch Yellow Perch Walleye Johnny Darter Round Goby Sculpin sp Slimy Sculpin Deepwater Sculpin Total catch Number of species Number of trawls Section 1. Index Fishing Projects
44 36 TABLE Species-specific catch per trawl (12 min duration; 1/2 mile) by year in the fish community index bottom trawling program during summer at EB3, Kingston Basin, Lake Ontario. Catches are the mean number of fish observed for the number of trawls indicated. Total catch and number of species caught are indicated. Species mean Year mean Alewife Gizzard Shad Chinook Salmon Lake Trout Lake Whitefish Cisco Rainbow Smelt White Sucker Common Carp Spottail Shiner American Eel Brook Stickleback Threespine Stickleback Trout-perch White Perch Pumpkinseed Smallmouth Bass Largemouth Bass Yellow Perch Walleye Johnny Darter Round Goby Freshwater Drum Sculpin sp Mottled Sculpin Slimy Sculpin Total catch Number of species Number of trawls Section 1. Index Fishing Projects
45 37 TABLE Species-specific catch per trawl (12 min duration; 1/2 mile) by year in the fish community index bottom trawling program during summer at EB6, Kingston Basin, Lake Ontario. Catches are the mean number of fish observed for the number of trawls indicated. Total catch and number of species caught are indicated. Species mean Year mean Alewife Lake Trout Lake Whitefish Cisco (Lake Herring) Rainbow Smelt Threespine Stickleback Trout-perch Yellow Perch Johnny Darter Round Goby Sculpin sp Slimy Sculpin Deepwater Sculpin Total catch Number of species Number of trawls Section 1. Index Fishing Projects
46 38 EB6 (Table 1.3.8) Four species: Round Goby, Alewife and Rainbow Smelt were caught at EB6 in 216. Rocky Point (Tables and 1.3.1) Three species: Deepwater Sculpin, Slimy Sculpin, and Rainbow Smelt were caught at Rocky Point in 216. Deepwater Sculpin were most common at 1 to 12 m water depth while Slimy Sculpin were most abundant at 9 m. Bay of Quinte Conway (Table ) Ten species were caught at Conway in 216. The most abundant species were Round Goby, Alewife, Yellow Perch, Cisco and White Sucker. Hay Bay (Table ) Thirteen species were caught at Hay Bay in 216. The most abundant species were Alewife, Gizzard Shad, Yellow Perch, White Perch and White Bass. Deseronto (Table ) Eighteen species were caught at Deseronto in 216. The most abundant species were Alewife, Yellow Perch, Gizzard Shad, White Perch, Spottail Shiner and Pumpkinseed. Big Bay (Table ) Nineteen species were caught at Big Bay in 216. The most abundant species were Gizzard Shad, Yellow Perch, White Perch, Alewife and Freshwater Drum. Three American Eel were caught. These were the first Eel caught at Big Bay since 22. Belleville (Table ) Nineteen species were caught at Belleville in 216. White Perch, Freshwater Drum, Yellow Perch and Spottail Shiner and were the most abundant species in the catch. TABLE Species-specific catch per trawl (adjusted to 12 min duration; 1/2 mile) in the fish community index bottom trawling program during summer at Rocky Point (multiple water depths), Lake Ontario, 216. Catches are the mean number of fish observed for the number of trawls indicated. Total catch and number of species caught are indicated. Trenton (Table ) Seventeen species were caught at Trenton in 216. The most abundant species were Yellow Perch, Alewife, White Perch, Largemouth Bass, Gizzard Shad and Round Goby. Species Trends (Fig ) Bottom trawl results were summarized across the six Bay of Quinte sites and presented graphically to illustrate abundance trends for major species in Fig All species show significant abundance changes over the long-term. The most abundant species remain White Perch, Yellow Perch, Alewife and Gizzard Shad. White Perch abundance declined significantly in 214, remained low in 215, and increased in 216. Yellow Perch remain abundant. Alewife abundance declined in 215 but was very high in 216. Most centrarchid species are currently at moderate to high levels of abundance as are Gizzard Shad, Spottail Shiner, Round Goby, Trout-perch, and Cisco. Species currently at low abundance levels relative to past levels include Brown Bullhead, Rainbow Smelt, White Sucker, Lake Whitefish, Johnny Darter and American Eel. Species Highlights Site depth (m) Site depth (m) Rainbow Smelt Slimy Sculpin Deepwater Sculpin Total catch Number of species Number of trawls Catches of age- fish in 216 for selected species and locations are shown in Tables for Lake Whitefish, Cisco, Yellow Perch and Walleye respectively. Section 1. Index Fishing Projects
47 39 TABLE Species-specific catch per trawl (adjusted to 12 min duration; 1/2 mile) by year in the fish community index bottom trawling program during summer at Rocky Point, 1 m depth only), eastern Lake Ontario. Catches are the mean number of fish observed for the number of trawls indicated. Total catch and number of species caught are indicated. No sampling in 26, 21. Species Year mean mean Alewife Lake Trout Lake Whitefish Rainbow Smelt Threespine Stickleback Rock Bass Round Goby Slimy Sculpin Deepwater Sculpin Total catch Number of species Number of trawls Section 1. Index Fishing Projects
48 4 TABLE Species-specific catch per trawl (6 min duration; 1/4 mile) by year in the fish community index bottom trawling program at Conway (24 m depth), Bay of Quinte. Catches are the mean number of fish observed at each site for the number of trawls indicated. Total catch and number of species caught are indicated. Species mean Year mean Silver Lamprey Alewife Gizzard Shad Chinook Salmon Brown Trout Lake Trout Lake Whitefish Cisco Coregonus sp Rainbow Smelt White Sucker Moxostoma sp Spottail Shiner American Eel Burbot Threespine Stickleback Trout-perch White Perch White Bass Rock Bass Bluegill Yellow Perch Walleye Johnny Darter Round Goby Freshwater Drum Sculpin sp Mottled Sculpin Slimy Sculpin Total catch Number of species Number of trawls Section 1. Index Fishing Projects
49 41 TABLE Species-specific catch per trawl (6 min duration; 1/4 mile) by year in the fish community index bottom trawling program at Hay Bay (7 m depth), Bay of Quinte. Catches are the mean number of fish observed for the number of trawls indicated. Total catch and number of species caught are indicated. Species mean Year mean Alewife Gizzard Shad Lake Whitefish Cisco Rainbow Smelt Northern Pike White Sucker Common Carp Golden Shiner Common Shiner Fathead Minnow Brown Bullhead Channel Catfish American Eel Burbot Trout-perch White Perch White Bass Sunfish Rock Bass Pumpkinseed Bluegill Smallmouth Bass Largemouth Bass Black Crappie Lepomis sp Yellow Perch Walleye Johnny Darter Logperch Brook Silverside Round Goby Freshwater Drum Slimy Sculpin Total catch Number of species Number of trawls Section 1. Index Fishing Projects
50 42 TABLE Species-specific catch per trawl (6 min duration; 1/4 mile) by year in the fish community index bottom trawling program at Deseronto (5 m depth), Bay of Quinte. Catches are the mean number of fish observed for the number of trawls indicated. Total catch and number of species caught are indicated. Species mean Year mean Longnose Gar Alewife Gizzard Shad Rainbow Smelt Northern Pike White Sucker Lake Chub Common Carp Emerald Shiner Spottail Shiner Brown Bullhead Channel Catfish Ictalurus sp American Eel Trout-perch White Perch White Bass Sunfish Rock Bass Pumpkinseed Bluegill Smallmouth Bass Largemouth Bass Black Crappie Lepomis sp Yellow Perch Walleye Johnny Darter Logperch Brook Silverside Round Goby Freshwater Drum Total catch Number of species Number of trawls Section 1. Index Fishing Projects
51 43 TABLE Species-specific catch per trawl (6 min duration; 1/4 mile) by year in the fish community index bottom trawling program at Big Bay (5 m depth), Bay of Quinte. Catches are the mean number of fish observed for the number of trawls indicated. Total catch and number of species caught are indicated. Species mean Year mean Longnose Gar Alewife Gizzard Shad Rainbow Smelt Northern Pike White Sucker Moxostoma sp Common Carp Emerald Shiner Spottail Shiner Brown Bullhead Channel Catfish Ictalurus sp American Eel Trout-perch White Perch White Bass Sunfish Rock Bass Pumpkinseed Bluegill Smallmouth Bass Largemouth Bass Black Crappie Lepomis sp Yellow Perch Walleye Johnny Darter Logperch Brook Silverside Round Goby Freshwater Drum Total catch Number of species Number of trawls Section 1. Index Fishing Projects
52 44 TABLE Species-specific catch per trawl (6 min duration; 1/4 mile) by year in the fish community index bottom trawling program at Belleville (5 m depth), Bay of Quinte. Catches are the mean number of fish observed for the number of trawls indicated. Total catch and number of species caught are indicated. Species mean Year mean Sea Lamprey Longnose Gar Alewife Gizzard Shad Rainbow Smelt Northern Pike Mooneye White Sucker Common Carp Spottail Shiner Brown Bullhead Channel Catfish American Eel Burbot Trout-perch White Perch White Bass Sunfish Rock Bass Pumpkinseed Bluegill Smallmouth Bass Largemouth Bass Black Crappie Lepomis sp Yellow Perch Walleye Johnny Darter Logperch Brook Silverside Round Goby Freshwater Drum Sculpin sp Total catch Number of species Number of trawls Section 1. Index Fishing Projects
53 45 TABLE Species-specific catch per trawl (6 min duration; 1/4 mile) by year in the fish community index bottom trawling program at Trenton (4 m depth), Bay of Quinte. Catches are the mean number of fish observed for the number of trawls indicated. Total catch and number of species caught are indicated. Species mean Year mean Alewife Gizzard Shad Rainbow Smelt Northern Pike Mooneye White Sucker Shorthead Redhorse Minnow Common Carp Spottail Shiner Brown Bullhead Channel Catfish American Eel Banded Killifish Burbot Trout-perch White Perch White Bass Sunfish Rock Bass Pumpkinseed Bluegill Smallmouth Bass Largemouth Bass Black Crappie Lepomis sp Yellow Perch Walleye Johnny Darter Logperch Brook Silverside Round Goby Freshwater Drum Total catch Number of species Number of trawls Section 1. Index Fishing Projects
54 46 14 White Perch 7 Yellow Perch 45 Alewife Catch per Trawl Catch per Trawl Catch per Trawl 4 Gizzard Shad 18 Trout-perch 9 Spottail Shiner Catch per Trawl Catch per Trawl Catch per Trawl Pumpkinseed 18 Freshwater Drum 7 Round Goby Catch per Trawl Catch per Trawl Catch per Trawl Brown Bullhead 3 Walleye 12 Rainbow Smelt Catch per Trawl Catch per Trawl Catch per Trawl FIG Abundance trends (annual means) for the most common species caught in bottom trawls at six sites in the Bay of Quinte (Conway, Hay Bay, Deseronto, Big Bay, Belleville and Trenton; see Fig ). Values shown here are 3-yr running averages (two years for first and last years graphed). Section 1. Index Fishing Projects
55 47 25 White Sucker 25 Bluegill 12 Logperch Catch per Trawl Catch per Trawl Catch per Trawl Catch per Trawl Catch per Trawl Catch per Trawl WhiteBass Largemouth Bass Lake Whitefish Johnny Darter 5 Black Crappie 4 Cisco Catch per Trawl Catch per Trawl Catch per Trawl Brook Silverside 1. Rock Bass.8 Common Carp Catch per Trawl Catch per Trawl Catch per Trawl FIG (continued). Abundance trends for the most common species caught in bottom trawls at six sites in the Bay of Quinte (Conway, Hay Bay, Deseronto, Big Bay, Belleville and Trenton; see Fig ). Values shown here are 3-yr running averages (two years for first and last years graphed). Section 1. Index Fishing Projects
56 48 TABLE Mean catch-per-trawl of age- Lake Whitefish at two sites, Conway in the lower Bay of Quinte and EB3 near Timber Island in eastern Lake Ontario, Four replicate trawls on each of two to four visits during August and early September were made at each site. Distances of each trawl drag were 1/4 mile for Conway and 1/2 mile for EB3. Conway N EB3 (Timber Island) Not a single age- Lake Whitefish was caught in 216 (Table ). Except for the 23 and 25 year-classes, age- Lake Whitefish catches have been low for more than a decade. By way of contrast, Lake Whitefish abundance measured at older ages suggests less variation in year-class strength over the same time-period. For example, the 24 year-class figures prominently, relative to the 23 and 25 yearclasses, in both index gill net surveys (Section 1.2) and the commercial harvest (Section 3.2). Age- Cisco catches at Conway in 216 were moderate relative to recent years (Table N TABLE Mean catch-per-trawl of age- Cisco at Conway in the lower Bay of Quinte, Four replicate trawls on each of two to four visits during August and early September were made at the Conway site. Distances of each trawl drag was 1/4 mile ). Conway Age- catches of Yellow Perch were high in 216 (Table ). Following two poor yearclasses in 212 and 213, the last three yearclasses of Yellow Perch were high. Following two exceptionally strong yearclasses in 214 and 215, the age- Walleye catches in 216 were low to moderate (Tables and ). Round Goby first appeared in bottom trawl catches in the Bay of Quinte in 21 and in the N Section 1. Index Fishing Projects
57 49 TABLE Mean catch-per-trawl of age- Yellow Perch at six Bay of Quinte sites, Four replicate trawls on each of two to three visits during August and early September were made at each site. Distance of each trawl drag was 1/4 mile. Trenton Belleville Big Bay Deseronto Hay Bay Conway Mean Number of trawls Kingston Basin of eastern Lake Ontario in 23. The species was caught at all Bay of Quinte trawling sites by 23, peaking in abundance, at each site, between 23 and 25. Catches have been quite variable since but remain high. Round Goby catches in the Kingston Basin increased and remain high in 216. Section 1. Index Fishing Projects
58 5 TABLE Mean catch-per-trawl of age- Walleye at six Bay of Quinte sites, Four replicate trawls on each of two to three visits during August and early September were made at each site. Distance of each trawl drag was 1/4 mile. Year Trenton Belleville Big Bay Deseronto Hay Bay Conway Mean Number of trawls TABLE Age distribution of 268 Walleye sampled from summer bottom trawls, Bay of Quinte, 216. Also shown are mean fork length and mean weight. Fish of less than 15 mm fork length were assigned an age of, fish between 15 and 29 mm were aged using scales; and those over 29 mm fork length were aged using otoliths. Age (years) Total Year-class Number Mean fork length (mm) Mean weight (g) Section 1. Index Fishing Projects
59 Lake Ontario Nearshore Community Index Netting J. A. Hoyle, Lake Ontario Management Unit The nearshore community index netting program (NSCIN) was initiated on the upper Bay of Quinte (Trenton to Deseronto), West Lake and Weller s Bay in 21, and was expanded to include the middle and lower reaches of the Bay of Quinte (Deseronto to Lake Ontario) in 22. In 26, the NSCIN program was conducted on Hamilton Harbour and the Toronto Harbour area thanks to partnerships developed with Fisheries and Oceans Canada and the Toronto and Region Conservation Authority. NSCIN was further expanded to other Lake Ontario nearshore areas in subsequent years (Table 1.4.1). The NSCIN protocol uses 6-foot trap nets and is designed to evaluate the abundance and other biological attributes of fish species that inhabit the littoral area. Suitable trap net sites are chosen from randomly selected UTM grids that contain shoreline in the nearshore area netted. Ecosystem (i.e., Index of Biotic Integrity or IBI) and fish community (e.g., proportion of piscivore biomass or PPB) level measures have been developed to assess relative health of Lake Ontario s nearshore areas. These assessments are particularly useful to monitor the on-going status of impaired fish communities in Lake Ontario Areas of Concern (AOCs) such as Hamilton and Toronto Harbours. In 216, NSCIN projects were completed at three nearshore areas: Hamilton Harbour, Toronto Harbour, and the upper Bay of Quinte (Fig ). Hamilton Harbour (partnership project with Fisheries and Oceans Canada) Twenty-four trap net sites were sampled on Hamilton Harbour from Aug 2-11 with water temperatures ranging from o C (Table 1.4.2). More than 12, fish comprising 23 species were captured (Table 1.4.3). The most abundant species by number were Brown Bullhead (8,149), White Perch (2,661), Bluegill (416), Channel Catfish (311), Walleye (111), and Common Carp (14). One American Eel was captured; total length of the eel was 846 mm and weight was 2,327 g. The age distribution and mean length by age-class of selected species are shown in Tables and Abundance trends for all species are presented in Table and graphically for selected species in Fig Of particular note TABLE Annual NSCIN trap net schedule for Lake Ontario nearshore areas, The numbers of trap net samples at each area in each year are indicated. Year Hamilton Harbour Toronto Islands Presquille Bay Weller's Bay West Lake East Lake Bay of Quinte Prince Edward Bay Upper Middle Lower North Channel Kingston Section 1. Index Fishing Projects
60 52 FIG Map of Lake Ontario indicating NSCIN trap net locations in Hamilton Harbour, Toronto Harbour and the upper Bay of Quinte, 216. TABLE Survey information for the 216 NSCIN trap net program on Hamilton Harbour, Toronto Harbour and the upper Bay of Quinte. Shown for each embayment are the survey dates, the range of observed surface water temperatures, the total number of trap net lifts, and the number of trap net lifts broken down by target sampling depth, and observed substrate and cover types. Hamilton Harbour Toronto Harbour Upper Bay of Quinte Survey dates Aug 2-11 Sep 6-15 Sep 6-23 Water temperature range ( o C) No. of trap net lifts No. of lifts by depth: Target (2-2.5 m) > Target < Target No. of lifts by substrate type: Hard Soft No. of lifts by degree of cover: None % % % Section 1. Index Fishing Projects
61 53 TABLE Species-specific catch in the 216 NSCIN trap net program in Hamilton Harbour, Toronto Harbour and the upper Bay of Quinte. Statistics shown include arithmetic and geometric mean catch-per-trap net (CUE), percent relative standard error of mean log1(catch+1), %RSE = 1*SE/mean, and mean fork or total length (mm). A total of 3 species were caught. Species Arithmetic mean Hamilton Harbour Toronto Harbour Upper Bay of Quinte Geometric mean Relative standard error (%) Mean length (mm) Arithmetic mean Geometric mean Relative standard error (%) Mean length (mm) Arithmetic mean Geometric mean Relative standard error (%) Longnose Gar Bowfin Alewife Gizzard Shad Rainbow Trout Northern Pike Quillback White Sucker Silver Redhorse Shorthead Redhorse Greater Redhorse River Redhorse Goldfish Common Carp Golden Shiner Fallfish Rudd Brown Bullhead Channel Catfish American Eel White Perch White Bass Rock Bass Pumpkinseed Bluegill Smallmouth Bass Largemouth Bass Black Crappie Yellow Perch Walleye Freshwater Drum Carassius Auratus x Cyprinus Carpio Notropis hybrids Mean length (mm) Total catch per net Number of species Number of nets Total catch 12,216 4,967 3,966 Section 1. Index Fishing Projects
62 54 Table Age distribution of selected species caught in Hamilton Harbour, Toronto Harbour and the upper Bay of Quinte, 216. Table Mean fork length (mm) of selected species caught in Hamilton Harbour, Toronto Harbour and the upper Bay of Quinte, 216. Age (years) / Year-class Age (years) / Year-class Location Species Location Species Hamilton Harbour Hamilton Harbour Northern Pike Northern Pike White Bass White Bass Pumpkinseed Pumpkinseed Bluegill Bluegill Smallmouth Bass 2 Smallmouth Bass 399 Largemouth Bass Largemouth Bass Black Crappie 12 2 Black Crappie Yellow Perch Yellow Perch Walleye 31 Walleye 516 Toronto Harbour Toronto Harbour Northern Pike Northern Pike Pumpkinseed Pumpkinseed Bluegill Bluegill Smallmouth Bass Smallmouth Bass Largemouth Bass 1 1 Largemouth Bass Black Crappie 3 1 Black Crappie Yellow Perch Yellow Perch Upper Bay of Quinte Upper Bay of Quinte Northern Pike Northern Pike Pumpkinseed Pumpkinseed Bluegill Bluegill Smallmouth Bass Smallmouth Bass Largemouth Bass Largemouth Bass Black Crappie Black Crappie Yellow Perch Yellow Perch Walleye Walleye Section 1. Index Fishing Projects
63 55 TABLE Species-specific abundance trends (mean catch per trap net) in Hamilton Harbour, Toronto Harbour and the upper Bay of Quinte. Annual total catch per net lift, number of net sets, and number of species are also indicated. Hamilton Harbour Toronto Harbour Upper Bay of Quinte Species Longnose Gar Spotted Gar.4 Bowfin Alewife Gizzard Shad Chinook Salmon.8 Rainbow Trout Atlantic Salmon.4 Brown Trout Lake Trout.5 Coregonus sp..25 Northern Pike Muskellunge.4.3 Suckers.5 Quillback White Sucker Bigmouth Buffalo Silver Redhorse Shorthead Redhorse Greater Redhorse River Redhorse Black Buffalo.4 Minnow.4 Goldfish Common Carp Golden Shiner Fallfish.3 Rudd Black Bullhead.5 Brown Bullhead Channel Catfish American Eel White Perch White Bass Rock Bass Green Sunfish.5 Pumpkinseed Bluegill Smallmouth Bass Largemouth Bass Black Crappie Yellow Perch Walleye Round Goby.5 Freshwater Drum Carassius auratus x Cyprinus carpio.25 Notropis hybrids.4 Total catch Number of net lifts Number of species Section 1. Index Fishing Projects
64 56 Catch per trap net Catch per trap net Catch per trap net Catch per trap net Catch per trap net Catch per trap net Northern pike Hamilton Harbour Toronto Harbour Upper Bay of Quinte Brown bullhead Hamilton Harbour Toronto Harbour Upper Bay of Quinte Channel catfish Hamilton Harbour Toronto Harbour Upper Bay of Quinte American eel Hamilton Harbour Toronto Harbour Upper Bay of Quinte White perch Hamilton Harbour Toronto Harbour Upper Bay of Quinte Pumpkinseed Hamilton Harbour Toronto Harbour Upper Bay of Quinte FIG Abundance trends for selected species caught in nearshore trap nets in Hamilton Harbour, Toronto Harbour and the upper Bay of Quinte. Values shown are annual arithmetic means. Section 1. Index Fishing Projects
65 57 Catch per trap net Catch per trap net Catch per trap net Catch per trap net Catch per trap net Catch per trap net Bluegill Hamilton Harbour Toronto Harbour Upper Bay of Quinte Smallmouth bass Hamilton Harbour Toronto Harbour Upper Bay of Quinte Largemouth bass Hamilton Harbour Toronto Harbour Upper Bay of Quinte Black crappie Hamilton Harbour Toronto Harbour Upper Bay of Quinte Yellow perch Hamilton Harbour Toronto Harbour Upper Bay of Quinte Walleye Hamilton Harbour Toronto Harbour Upper Bay of Quinte FIG (continued) Abundance trends for selected species caught in nearshore trap nets in Hamilton Harbour, Toronto Harbour and the upper Bay of Quinte. Values shown are annual arithmetic means. Section 1. Index Fishing Projects
66 58 was the strong showing of age-4 Walleye from the 212 Walleye stocking event (see Section 8.7) and the absence of Walleye from stocking events in the following years. Toronto Harbour (partnership project with Fisheries and Oceans Canada) Twenty-four trap net sites were sampled on Toronto Harbour from Sep 6-15 with water temperatures ranging from o C (Table 1.4.2). Nearly 5, fish comprising 24 species were captured (Table 1.4.3). The most abundant species by number were Brown Bullhead (3,849), Pumpkinseed (382), Rock Bass (29) and Common Carp (115). One American Eel was captured; total length of the eel was 74 mm and weight was 936 g. Upper Bay of Quinte Thirty-six trap net sites were sampled on the upper Bay of Quinte from Sep 6-23 with water temperatures ranging from o C (Table 1.4.2). Nearly 4, fish comprising 26 species were captured (Table 1.4.3). The most abundant species by number were Bluegill (2,71), Pumpkinseed (92), Brown Bullhead (142), Yellow Perch (139), Black Crappie (124) and White Perch (93). Three American Eel were caught. The eel were 666, 768 and 915 mm total length and weighed 637, 1,242 and 1,87 g in weight, respectively. Northern Pike abundance declined from 21-29, increased significantly in 21, declined from , remained steady until 215, then increased in 216. Brown Bullhead and Channel Catfish remained at low abundance. American Eel abundance increased in 216 compared to 215 but remained below the high abundance levels of 213 and 214. White Perch abundance was unusually high in 213 but very few were caught in 214 (7) and 215 (11). In 216, 93 were caught. Pumpkinseed abundance increased in 215 and deceased in 216. Bluegill abundance was similar to recent years. Smallmouth Bass abundance increased in 216. Largemouth Bass decreased slightly in 216. Black Crappie abundance declined in 214, 215 and again in 216 compared to 213. Yellow Perch abundance remained steady. Walleye abundance, having been unusually high in 213, declined in 214 and 215, and increased in 216 (Table and Fig ). Ecosystem Health Indices Indices have been developed based on the NSCIN trap netting to evaluate ecosystem health in Lake Ontario nearshore areas. The degree of exposure of the nearshore area sampled to Lake Ontario (e.g., highly sheltered embayments vs. those broadly exposed to the open waters of Lake Ontario) influences the ecosystem health indices. Therefore, indices are presented separately for sheltered and exposed embayments (Figs to 1.4.6). PPB Hamilton Harbour Sheltered Embayments Weller's Bay West Lake East Lake Bay of Quinte (upper) Target PPB >.2 Bay of Quinte (middle) FIG Proportion of total fish community biomass represented by piscivore species (PPB) in the nearshore trap net surveys in five sheltered Lake Ontario embayments (26-216). A PPB>.2 is indicative of a balanced trophic structure (depicted by a dashed line). Piscivore species included Longnose Gar, Bowfin, Northern Pike, Smallmouth Bass, Largemouth Bass, and Walleye. Error bars are +-2SE. Section 1. Index Fishing Projects
67 Exposed Embayments Target PPB >.2 embayments (Fig ). The PPB at Toronto Harbour was just below the target value and that of other exposed Lake Ontario embayments (Fig ). PPB at the upper Bay of Quinte was well above the target value. PPB Toronto Harbour Presqu'ile Bay Prince Edward Bay FIG Proportion of total fish community biomass represented by piscivore species (PPB) in the nearshore trap net surveys in three exposed Lake Ontario embayments (26-216). A PPB>.2 is indicative of a balanced trophic structure (depicted by a dashed line). Piscivore species included Longnose Gar, Bowfin, Northern Pike, Smallmouth Bass, Largemouth Bass, and Walleye. Error bars are +- 2SE. Piscivore Biomass A proportion of the fish community biomass comprised of piscivores (PPB) greater than.2 reflects a healthy trophic structure. The PPBs in 216 were.13,.18 and.28 in Hamilton Harbour, Toronto Harbour, and the upper Bay of Quinte, respectively. The PPB at Hamilton Harbour remained significantly below both.2 and that of other sheltered Lake Ontario Index of Biotic Integrity The index of biotic integrity (IBI) is a measure of ecosystem health. IBI classes can be described as follows: -2 very poor, 2-4 poor, 4-6 fair, 6-8 good, and 8-1 excellent ecosystem health. The IBIs were 47 (fair), 46 (fair) and 71 (good) in Hamilton Harbour, Toronto Harbour and the upper Bay of Quinte, respectively. The IBI at Hamilton Harbour remained significantly below those of other sheltered Lake Ontario embayments, while the IBI at the upper Bay of Quinte was similar to values at other Lake Ontario sheltered nearshore areas (Fig ). Toronto Harbour IBI was lower than other exposed embayments, (Fig 1.4.6). Trap Net and Electrofishing Comparison Electrofishing sampling was conducted in conjunction with trap net sampling at selected upper Bay of Quinte locations (2 of 36 sites). The standard Fisheries and Oceans 1 m transect IBI Hamilton Harbour Excellent Good Fair Poor Very Poor Sheltered Embayments Weller's Bay West Lake East Lake Bay of Quinte (upper) Bay of Quinte (middle) FIG Index of biotic integrity (IBI), as a measure of ecosystem health, in the nearshore trap net surveys in five sheltered Lake Ontario embayments (26-216). IBI classes can be described as follows: -2 very poor, 2-4 poor, 4-6 fair, 6-8 good, and 8-1 excellent ecosystem health. Error bars are +-2SE. Section 1. Index Fishing Projects
68 6 IBI Exposed Embayments Toronto Harbour Excellent Good Fair Poor Very Poor Presqu'ile Bay Prince Edward Bay FIG Index of biotic integrity (IBI), as a measure of ecosystem health, in the nearshore trap net surveys in three exposed Lake Ontario embayments (26-216). IBI classes can be described as follows: -2 very poor, 2-4 poor, 4-6 fair, 6-8 good, and 8-1 excellent ecosystem health. Error bars are +-2SE. sampling electrofishing protocol was used. Catch comparison by the two gear types is shown in Table A total of 32 species were caught; 26 by electrofishing and 25 by trap net sampling. Seven unique species were captured by electrofishing and six unique species by trap nets. A total of 784 fish were caught by electrofishing and 2,43 fish were caught by the trap nets. The most common species caught by electrofishing were Yellow Perch, Brook Silverside, Gizzard shad, Bluegill and Largemouth Bass, and for the trap nets were Bluegill, Pumpkinseed, Yellow Perch, Black Crappie and Largemouth Bass. Electrofishing sampling caught more small fish species such as cyprinids. Trap nets caught more centrarchids. Between gear differences in species composition were also reflected in the size distribution of fish caught in the two gear types; electrofishing gear tended to catch smaller-sized fish and trap net gear tended to catch more medium-sized fish (Fig ). FIG Species-specific catch-per-unit-effort for boat electrofishing and trap netting gear types in the upper Bay of Quinte in 216 for the 2 sites that were sampled by both gear types. A total of 32 species was caught by the two gear types. Gear type Species E-Fish Trap Net Longnose Gar.15.7 Bowfin.5.9 Alewife 1. - Gizzard Shad Northern Pike.15.4 White Sucker.2.25 Shorthead Redhorse -.5 Greater Redhorse -.2 River Redhorse -.55 Common Carp.3.15 Golden Shiner.15.2 Common Shiner.1 - Spottail Shiner.65 - Bluntnose Minnow.25 - Fallfish -.5 Brown Bullhead Channel Catfish American Eel.2.1 White Perch White Bass.5.3 Rock Bass Pumpkinseed Bluegill Smallmouth Bass.5.15 Largemouth Bass Black Crappie Lepomis sp Yellow Perch Walleye Logperch.8 - Brook Silverside Freshwater Drum.5.75 Number species Unique species 7 6 Common species Total fish caught 784 2,43 Section 1. Index Fishing Projects
69 61 Proportion of catch.1 Trap Netting Electrofishing Fork length (mm) FIG Size distribution of the fish caught during boat electrofishing and trap netting gear types in the upper Bay of Quinte in 216 for the 2 sites that were sampled by both gear types. Section 1. Index Fishing Projects
70 Lake-wide Hydroacoustic Assessment of Prey Fish J. P. Holden, Lake Ontario Management Unit M. J. Connerton, New York State Department of Environmental Conservation, Cape Vincent Fisheries Station B. C. Weidel, Unites States Geological Service, Oswego Hydroacoustic assessments of Lake Ontario prey fish have been conducted since 1991 with a standardized mid-summer hydroacoustic survey implemented in The survey is conducted jointly by the Ontario Ministry of Natural Resources and Forestry (OMNRF), the New York State Department of Environmental Conservation (NYSDEC) and the US Geological Survey (USGS). Results from the hydroacoustic survey complement information obtained in spring bottom trawl surveys; provides whole-lake indices of abundance; and describes midsummer distribution of pelagic prey fish species. The index survey consists of five, northsouth, shore-to-shore transects in the main lake, and one transect in the Kingston Basin (Fig ). Hydroacoustic data were collected beginning at approximately one hour after sunset from 1m of depth on one shore and running to 1m of depth on the opposite shore at or until approximately one hour before sunrise. Since 25, transects have been randomly selected annually from within 15 km corridors. The corridor approach was adopted to include a random component to the survey while accommodating logistical constraints such as suitable ports. A dogleg at the southern portions of transects 3, 4 and 5 is used to increase the length of the transect that occurs in less than 1 m of water along the southern shore which has a much steeper slope than the northern shore. Temperature profiles were conducted at multiple intervals along each transect. Since 1997, annual hydroacoustic survey index values have been calculated with slightly different methods (e.g., varying target strength thresholds, and species partitioning methods) and different analytical software, which has also evolved enabling more sophisticated approaches (e.g., noise filtering). In the 215 report, historical data were re-analyzed using a standardized approach to target strength thresholds for Alewife and Rainbow Smelt, noise filtering and species partitioning. Acoustic data can distinguish between position and sizes of targets but not species. Historical midwater trawling data (2 to 24) showed a thermal separation between the two primary species of interest, Alewife and Rainbow Smelt. Midwater tows in depths where water temperatures were 9 C or warmer were dominated by catches of Alewife (95% total catch weight of prey fish species) whereas tows in depths at temperatures below 9 C captured mostly Rainbow Smelt (84%). T1 T2 T3 FIG The Lake Ontario Lake-wide prey fish survey uses crosslake hydroacoustic transects. Transect corridors are logistically constrained but utilize a random starting point within the corridor for each annual survey. T4 T5 In addition to the standard index transects additional sampling effort has also been regularly conducted throughout the survey. Recently there was a focus on upward looking acoustics to quantify the relative proportion of the Alewife that occurred in the near surface portion of the water column unable to be measured by traditional down-looking acoustics. In 216, two additional projects were conducted to broaden the scope of the summer acoustic survey. Generally, the cross-lake transects sample lake depths in proportion to their overall area in the lake, however shallower depths, less than 3 m have Section 1. Index Fishing Projects
71 63 been underrepresented (Fig ). Additional transects were added to increase the shallow depths as well as look at the variability in the area where the thermocline intersects bottom where fish density has historically been highly variable. Sampling at depths from -2 meters was still underrepresented relative to lake area and will require more targeted sampling in the future. Midwater trawling was also conducted in eastern portions of Lake Ontario by NYSDEC and USGS in 216 in an effort to expand assessment of native Coregonid species (Cisco and Bloater). All transect paths are plotted in Fig Midwater trawls conducted in 216 show some mixing of Alewife and Rainbow Smelt, which may be a result of net contamination from warmer temperatures or variable fishing depths throughout the tow duration; the historical assumption of thermal separation (Fig ) of Alewife and Rainbow Smelt is still supported with these catches. Biological samples from midwater trawls suggest that the previous upper target strength level is generally too high based on the size distribution within the catch and has the potential to incorrectly categorize large species, like Cisco, that were abundant at several transects, as either Alewife or Rainbow Smelt. Based on an analysis of the length frequency distribution based on trawl catches of Cisco (Fig ) and the published relationship between fish size and target strength, the maximum target strength defining Alewife and Rainbow Smelt was lowered to -39 db and historical index values recalculated (Table 1.5.1). Catches of Cisco in 216 appear to be limited geographically to eastern portions of the lake and by depth (less Proportion.1.5 Proportion Smelt in Catch Bottom Depth (m) Lake Area Survey Survey + Additional FIG Distribution of survey depths (based on 5 m intervals) in the traditional survey transects and including the additional nearshore transect relative to lake area by depth.. FIG Proportion of Alewife and Rainbow Smelt weight contributing to the total catch weight within each midwater trawl Proportion Alewife in Catch 4 Count 2 FIG Spatial coverage of acoustic data collected in 216. Transects are categorized based the analysis to which each contributed Length (mm) FIG Length frequency of Cisco caught in midwater tows. Section 1. Index Fishing Projects
72 64 TABLE Acoustic parameter settings and target strength thresholds used for the 216 survey. Parameter Specification Sounder BioSonics DT-X Transducer Frequency 12 khz split beam Ping Rate 1 ping per second Pulse Width.4 milliseconds Analytical Software Echoview (version 7.1) Alewife target threshold range -5 to -39dB, water temp. > 9 C Rainbow Smelt target threshold range -52 to -39dB, water temp. =< 9 C Cisco target threshold range -39 to -3dB, all water temps. than 1 m); therefore the index for Cisco in 216 is reported as fish per hectare based on acoustic analysis of the transects where Cisco were captured rather than as a whole lake index until additional future sampling and analyses establishes their geographic extent throughout the lake Comparisons of Alewife biomass estimates between acoustics and spring bottom trawls show that surveys are correlated but that acoustic estimates of Alewife are lower. Vertical gillnets and towed up-looking acoustics show that a large proportion (on average 5%) of Alewife occupy the near-surface portion of the water column (<4 m depth) and are not detectable with the downlooking transducer used in the survey. While a significant proportion of the Alewife biomass is detected in this portion of the water column, the conversion still does not reconcile the difference between bottom trawl and acoustics population estimates. The values for Alewife reported here do not include a conversion factor to account for this unmeasured biomass and thus should be treated as an index of abundance between years and not as a whole lake population estimate. Alewife abundance in 216 increased relative to 215 estimates (Fig ). The increase in population is likely explained by increases in the age-1 population of Alewife. Differences between target strength distribution over the most recent years, where recruitment to age 1 in 214 and 215 was low, supports this assumption (Fig , see also Section 7.6). Alewife were spatially distributed throughout the lake (Fig ) but showed a bimodal distribution with bottom depth (Fig ). Distribution of Alewife during the survey however, varies from year to year and no Population Index Year FIG Abundance index (in millions of fish) of yearling-andolder Alewife from Summer acoustic estimates were not conducted in 1999 and 21. TargetCount 3e+8 2e+8 1e+8 e TS FIG Lake-wide estimates of Alewife partitioned by target strength in 1 db bins for surveys conducted from 214 to 216. consistent spatial trend has been found. Research to explain their distribution is ongoing. The additional shallow transects resulted in a marginally higher population estimate (663 million, 95% confidence interval million), but this was not statistically different than the standard population estimate (578 Section 1. Index Fishing Projects
73 65 FIG Relative distribution of Alewife determined by acoustics (fish/ha) observed during the hydroacoustic survey in July 216. Points are scaled to reflect observed density (fish/ha). Percentage Frequency Target Strength (db) Shallow Transects 6 FIG Relative frequency distribution of the size of Alewife, inferred by target strength, between the regular survey cross lake transects and the targeted nearshore transects. Density Index Bottom Depth FIG Relative distribution of Alewife (fish/ha) in proportion to Lake bottom depth of the 5 m portion of the transect. Population Index million, 95% confidence interval million). The size distribution (inferred by target strength distribution) does not indicate differences in size structure (Fig ). Rainbow Smelt abundance in 216 decreased relative to 215 estimates (Fig ). The highest densities of Rainbow Smelt were distributed along the southern shore (Fig ). The highest concentrations of Rainbow Smelt were found over bottom depths shallower than 75 m (Fig ). Midwater trawl catches support this limited distribution (Fig ). Cisco were infrequently caught during previous midwater trawling efforts (2-24). Further analysis is required to determine whether low catches during that time period are a function of spatial coverage of those surveys or low abundance and is not the primary focus of this report. Catches of Cisco were geographically Year FIG Abundance (in millions of fish) of yearling-and-older Rainbow Smelt from Summer acoustic estimates were not conducted in 1999 and 21 FIG Relative distribution of Rainbow Smelt (fish/ha) observed during the hydroacoustic survey in July 216. Points are scaled to reflect observed density (fish/ha). Section 1. Index Fishing Projects
74 66 confined to the transects along the eastern shore of Lake Ontario (Fig ). Both acoustic estimates and midwater trawls suggest peak abundance within a fairly narrow depth range (25 and 5 m; Fig and ). These depths are representative of water temperatures in the 1-15 C range, which is consistent with temperatures where Cisco are commonly caught in Community Index Gill Netting (Fig , see also Section 1.2 for methods and sites). Mean catch per trawl is more variable between transects (Fig ) than what the acoustic densities suggest (Fig ). Acoustic estimates however have the benefit of greater spatial range and the ability to sample the entire water column simultaneously. Despite those differences, overall density estimates between methods provide similar results. Midwater trawl catches estimate a density FIG Paired acoustic data collection and midwater trawls were conducted in the eastern portion of Lake Ontario. Filled points indicate tows were Cisco were caught. 1 Density Index Density (fish/ha) Bottom Depth FIG Relative distribution of Rainbow Smelt determined by acoustics (fish/ha) in proportion to lake bottom depth of the 5 m portion of the transect Depth in Water Column FIG Relative distribution of Cisco within the water column determined by acoustics (fish/ha). Data have been exported from acoustic software in 5 m depth bins and then horizontally jittered for plotting. FIG Relative catch of Rainbow Smelt (fish/1 min tow) relative to lake bottom depth where midwater tow occurred. FIG Relative catch of Cisco (fish/1 min tow) relative to lake bottom depth where midwater tow occurred. Section 1. Index Fishing Projects
75 67 of 36 fish per hectare and acoustic estimates range between 25 fish/ha using data from the entire transect to 51 fish/ha where acoustic data is limited specifically to the same area and water column the midwater trawls were conducted. Catch per 1 min Tow EB1 EB2 EB3 MEX SOU STO Transect FIG Catch variability in Cisco catches in midwater tows between transect areas. Boxes indicate 5% of the sample. Line within the box indicated the median catch. Whiskers extend to 1.5 times the interquartile range. Extreme values beyond 1.5 times the quantile range are indicated by single points. 2 FIG Relative catch of Cisco (fish/12 min tow) in Fish Community Index Trawling (Section 1.3) relative to temperature on the lake bottom where trawl is fished. Density (fish/ha) 1 EB1 EB2 EB3 MEX SOU STO Transect FIG Variability in Cisco density determined by acoustics between transect areas. Boxes indicate 5% of the sample. Line within the box indicated the median catch. Whiskers extend to 1.5 times the interquartile range. Extreme values beyond 1.5 times the quantile range are indicated by single points. Section 1. Index Fishing Projects
76 St. Lawrence River Fish Community Index Netting Lake St. Francis M.J. Yuille, Lake Ontario Management Unit Every other year in early fall, the Lake Ontario Management Unit conducts an index gillnet survey in Lake St. Francis. The catches are used to estimate fish abundance and measure biological attributes. Structures and tissues are collected for age determination, stomach content analyses, contaminant analyses and pathological examination. The survey is part of a larger effort to monitor changes in the fish communities in four distinct sections of the St. Lawrence River: Thousand Islands, Middle Corridor, Lake St. Lawrence and Lake St. Francis. This is coordinated with New York Department of Environmental Conservation (NYSDEC) to provide comprehensive assessment of fisheries resources in the upper St. Lawrence River. In 216, the survey was conducted during the period of September 6th to 19th. Thirty-six nets were deployed, using standard multi-panel gillnets with monofilament meshes ranging from 1 ½ to 6 inches at half-inch increments. The nets were fished for approximately 24 hours. In total, 544 fish were caught, which included 2 different fish species (Table 1.6.1). The average number of fish per set was 15.11, down 66% from 214. The number of fish per set continued to decline from the record high in 28 and is well below the average for the survey (Fig ). The diversity of species is the highest observed in this survey. The dominant species in the catch continued to be Yellow Perch (62% of the catch), followed by Rock Bass (18%; Fig ). In 216, a Lake Sturgeon was caught and released in TABLE Summary of catches per standard gillnet set in the Lake St. Francis Fish Community Index Netting Program, All catches prior to 22 were adjusted by a factor of 1.58 to be comparable to the new netting standard initiated in 22. No survey was conducted in Lake Sturgeon Longnose Gar Bowfin Alewife Salvelinus sp Northern Pike Muskellunge White Sucker Moxostoma sp Common Carp Golden Shiner Creek Chub Fallfish Brown Bullhead Rock Bass Pumpkinseed Bluegill Smallmouth Bass Largemouth Bass Black Crappie Yellow Perch Walleye Freshwater Drum All Species Count of Species Section 1. Index Fishing Projects
77 69 the fish community index gill nets; the last Lake Sturgeon caught in this program was in 28 (Table 1.6.1). Species Highlights Catches of Yellow Perch continued to decline from peak levels seen previously in 28 and 21 (Fig ). Current Yellow Perch catch per net (9.36 fish per net) is below the survey average (2.2 fish per net; Table 1.6.1). An increase in the catch of large fish (> 22 mm) observed in 28 has been followed by continued decline from 21 to 216 (Fig ). The catch per net of large fish in 216 (1.64 fish per net) was comparable to 214 (1.88 fish per net; Fig ) and was one of the lowest observed in the time series. Yellow Perch catch in 216 contained fish from age-2 to age-9 with age- 4 fish representing 45% of the total catch (Fig ). The centrarchids are represented by six species in Lake St. Francis: Rock Bass, Pumpkinseed, Bluegill, Smallmouth Bass, Largemouth Bass and Black Crappie (Fig and 1.6.6). While Rock Bass remain the most abundant of the centrarchids, catches in 216 were 54% of the previous decade. Smallmouth Bass catches declined in the 216 catch and are currently 64% below the previous 1 year average (Fig ). Growth as determined by mean length of age-1 Smallmouth Bass (164 mm in 216) declined 9% below the long-term average (18 mm, 1998 to 216), however age-5 mean fork length (41 mm) continues to remain above the long-term average (373 mm; Fig ). Pumpkinseed catches were unchanged from 214 to 216 (Fig ). Bluegill, Largemouth Bass and Black Crappie were historically at much lower levels than the former three species, and Catch per standard gillnet Catch per standard gillnet Large Small FIG Average catch per standard gillnet set of all species combined, Lake St. Francis, Survey was not conducted in Walleye 3% Yellow perch 62% Rock bass 18% Smallmouth bass 2% Other 14% Northern pike 1% FIG Species composition in the 216 Lake St. Francis community index gill netting program FIG Catches of small (<=22 mm total length) and large (> 22 mm total length) Yellow Perch in the Lake St. Francis community index netting program, Survey was not conducted in Number of Fish Age FIG Age distribution (bars) and mean fork length at age (mm) of Yellow Perch caught in Lake St. Francis, 216. Fork Length (mm) Section 1. Index Fishing Projects
78 7 Catch per standard gillnet Rock bass Pumpkinseed Smallmouth bass Catch per standard gillnet Black crappie Bluegill Largemouth bass FIG Rock Bass (circle), Pumpkinseed (triangle) and Smallmouth Bass (square) catches per standard gillnet set in Lake St. Francis, FIG Black crappie (circle), Bluegill (triangle) and Largemouth Bass (square) catches per standard gillnet set in Lake St. Francis, Catch per standard gillnet Large Small FIG Mean fork length (mm) of age-1 (square), age-3 (triangle) and age-5 (circle) Smallmouth Bass from 1998 to 216. Dashed lines represent the average fork length from 1998 to 216 for the aforementioned ages. remain so. While Largemouth Bass appear to have peaked in 212 catches, none were caught in the following 214 survey. In 216, Largemouth Bass CUE was above the previous 1 year average (Fig ). In 216, catches of Northern Pike were the lowest in the time series (Fig ). A total of five Northern Pike were caught in 216, ranging in from age-2 to age-9 (Fig ). Catches of small fish ( 5 mm) continue to remain low; in 216 only a single small Northern Pike was caught. Northern Pike abundances have been in decline since the early 199s and are currently at the lowest levels observed in the 32 year time series. No Muskellunge were caught in 216. FIG Catches of small (<= 5 mm total length) and large (> 5 mm total length) Northern Pike in the Lake St. Francis community index gill netting program, Survey was not conducted in Number of Fish Age FIG Age distribution (bars) and mean fork length (circles) at age of Northern Pike caught in Lake St. Francis, 216. Fork Length (mm) Section 1. Index Fishing Projects
79 Credit River Chinook Salmon Spawning Index M.J. Yuille and J.P. Holden, Lake Ontario Management Unit The Credit River, below the Kraft Dam in Streetsville, has been the long-term sampling site for Chinook Salmon gamete collection. Chinook Salmon are captured during the fall spawning run at the beginning of October using electrofishing gear. LOMU staff have utilized the spawn collections to index growth, condition and lamprey marking of Chinook Salmon. Weight and otoliths are collected from fish used in the spawn collection, which has the potential to be biased toward larger fish. To obtain a representative length sample of the spawning run, 5 fish per day were randomly selected, measured and checked for clips prior to fish being sorted for spawn collection and detailed sampling. Detailed sampling included collecting data on length, weight, fin clips, coded-wire tag (CWT), lamprey marks and a subsample also had otoliths collected for age determination. Samples for the 216 Chinook Salmon index were taken on October 4 6 and Detailed sampling occurred on 461 Chinook Salmon, 48 fish were sampled for the representative length sample and no Chinook Salmon were observed with an adipose fin clip. In 216, the mean length of age-3 females (867 mm) and males (875 mm) increased from 215 and are 2% and 4% below the long term average of 883 mm and 96 mm, respectively (Fig ). Length of age-2 females (742 mm) declined from 215 and is now 6% below the long term mean of 791 mm. Length of age-2 males (726 mm) also declined from 215 and is now 14% below the peak length observed in 213 (841 mm) and 9% below the average length (796 mm) for the time series ( ). The estimated weight (based on a log-log regression) of a 9 mm (total length) Chinook Salmon is used as an index of condition. In 216, female condition was comparable to 215, while the condition of males increased (Fig ). Female condition in 216 (7,832 g) is comparable to the average condition from 23 to 216 (7,738 g). Male condition (7,964 g) increased and is currently 8% above the average condition between 23 and 216. It should be noted that the absolute difference between maximum and minimum condition for female (1995 and 27) and male (1995 and 25) Chinook Salmon in this time series is 1,433 g and 1,149 g (respectively). 11 Age-3 Female Age-3 Male Age-2 Female Age-2 Male Fork Length (mm) Weight (kg) Female Male FIG Mean total length of age-2 and age-3 Chinook Salmon by sex, caught for spawn collection in the Credit River during the fall spawning run (approximately first week of October), FIG Condition index as the mean weight of a 9 mm (total length) Chinook Salmon in the Credit River during the spawning run (approximately first week of October), Section 1. Index Fishing Projects
80 Juvenile Atlantic Salmon Parr Survey M.D. Desjardins, Lake Ontario Management Unit In 216, Atlantic Salmon spring fingerlings (average 2 g) were stocked in the Credit River and its tributaries (Section 6) to restore self-sustaining populations (Section 8.2). The purpose of this survey was to evaluate growth and survival of Atlantic Salmon parr stocked as spring fingerlings and, in conjunction with smolt surveys (Section 1.9) evaluate the relative contribution of each river reach to the smolt migration. Atlantic Salmon parr were surveyed at six reaches in the Credit River and Black Creek (Table 1.8.1) during October 216, after most of the year s growth was complete, and when fish size (>98 mm) indicates potential smolting. Atlantic Salmon were captured by electrofishing. Largely, other species were released upon capture, and were not generally recorded. Biological information (length, weight) was collected on all Atlantic Salmon captured and fish were tagged with half-duplex passive integrated transponder (PIT) tags at all sites. Two thousand one hundred and sixty-seven (2,167) PIT tags were implanted into the body cavity of Atlantic Salmon parr (Table 1.8.2). Larger PIT tags (23 mm) were used on fish >18 mm. Smaller PIT tags (12 mm) were used on fish <18 and >68 mm. A piece of caudal or adipose fin was clipped from all Atlantic Salmon for genetic determination of strain, and provided a secondary mark. The smallest fish (<67 mm) were not PITtagged but these fish could be recognized on recapture by the fin clip used for a genetic sample. Repeat sampling occurred at three reaches to obtain population and density estimates. Eighty-three (83) tagged/marked Atlantic Salmon were recaptured generally at the same location (Table 1.8.2) as originally tagged. TABLE TABLE Location of stocked river reaches with geo-coordinates (downstream end) and dimensions of sampling sites in the Credit River, 216. Reach numbers (1-4) indicate relative watershed position with 1 denoting the furthest upstream reach and subsequent numbers increasing progressively downstream. Sites marked with an asterisk (*) were not stocked in 216 but were sampled to examine fish movement. Sub-watershed Reach Latitude Longitude Upper Credit Mainstem Stream length (m) Stream width (m) Area sampled (m 2 ) Days sampled 1 - Meadow (Forks Prov. Park) ' 8.87' Stuck truck (Forks Prov. Park) * ' 8.29' Brimstone (Forks Prov. Park) ' ' Ellies (Forks o' Credit Rd.) * ' ' West Credit Belfountain C.A ' 8.41' BlackCreek 6th Line ' ' TABLE Number of applied and recaptured PIT tags by location and Atlantic Salmon age-group in 216. Recaptures do not include fish tagged in previous years Reach Number of PIT tags Age Not tagged Recaptured Age 1 and older Number of PIT tags Not tagged Recaptured Total number Meadow (Forks Prov. Park) Stuck truck (Forks Prov. Park) Brimstone (Forks Prov. Park) Ellies (Forks o' Credit Rd.) Belfountain C.A th Line Total 1, ,38 Section 1. Index Fishing Projects
81 73 Twelve additional fish were recaptured from the previous years (215) tagging efforts. The size (fork length and weight) of age- stocked spring fingerling Atlantic Salmon (Table 1.8.3) following approximately five months of growth continues to be low relative to previous years. Average size of Atlantic Salmon at 6 th line, Brimstone, and at the Belfountain CA were amongst the smallest recorded since the beginning of the monitoring program. The Meadow site (Forks Provincial Park) was the only stocking location where more than one-half of the stocked Atlantic Salmon are likely to smolt in 217. Delayed smoltification at the remaining sites may result in higher than anticipated densities following next year s stocking events and fewer smolts produced in subsequent years. It is noteworthy to mention data collected from two stream sections that were not stocked in 216 (Ellies and Stuck truck). Fish found at these locations were likely displaced from upstream stocked reaches. Density of YOY Atlantic Salmon were very low at these sites (23 fish collected from roughly 9, m -2 of sampled habitat) however their mean size was larger than those captured at the nearest upstream stocked reach. Size distributions also indicate a higher proportion of smolts from these locations in 217 (Table 1.8.3). Data from these locations also confirm the theory that stocked fish stray little from initial stocking locations. Overall, the decline in the size of YOY Atlantic Salmon continues despite efforts since 214 to reduce the total density and biomass of stocked fish at each site (Table 1.8.4) while the density of stocked fingerlings, measured the following fall after five months of stream life, continue to meet assessment and recovery targets of.5-.5 fish m -2 (Table 1.8.5). TABLE Mean fork length and weight of sampled Atlantic Salmon by location and age group in 216. Length (mm) Weight (g) Age 1 and older Length Weight (mm) (g) Meadow (Forks Prov. Park) Stuck truck (Forks Prov. Park) Brimstone (Forks Prov. Park) Ellies (Forks o' Credit Rd.) Belfountain C.A th Line TABLE Estimated population size, density, and biomass of Age- Atlantic salmon at spring fingerling stocking locations in the Credit River in 216. Reach Reach Age/size (mm) Age Number Lower 95% CI % expected to smolt in 217 Upper 95% CI Density (No. m -2 ) Biomass (g m -2 ) Meadow (Forks Prov. Park) Age <98 1, , Age >98 1, , Brimstone (Forks Prov. Park) Age <98 5,247 2,972 8, Age >98 1, , West Credit Belfountain CA Age <98 2,586 1,848 3, Age > Section 1. Index Fishing Projects
82 74 TABLE trends in stocked Atlantic Salmon size / biomass at the time of stocking (May) vs size of electrofished Atlantic Salmon (October) and the likelihood of smolting for upper Credit River Main-stem stocking locations. Data for sites in reaches 1-4 as been pooled due to inconsistences of annual stocking. May October Year Stocked size (g) Stocked biomass (g) Fall size (g) % smolt , , , * , , * indicates year when the reduction of stocked biomass was initiated Section 1. Index Fishing Projects
83 Credit River Atlantic Salmon Smolt Survey M.D. Desjardins, Lake Ontario Management Unit Monitoring Atlantic Salmon throughout their life cycle is critical to the success of the Lake Ontario Atlantic Salmon Restoration Program and this information is necessary to choose best management strategies in the future. Collecting information while salmon are outmigrating to Lake Ontario is an important fisheries reference point, because it represents the outcome of stream-life and allows biologists to compare stream and lake survival. This is particularly important for the restoration program as it is implementing a stocking strategy that is exploring the use of three stocked life stages (spring fingerlings, fall fingerlings, and spring yearlings), and three strains (LeHave, Sebago, and Lac St. Jean). Assessing the relative contribution/ survival of the strains and life stages will allow for the optimization of the stocking program in the future and in turn improve the chances for restoration. In 216, the Lake Ontario Management Unit and Credit Valley Conservation conducted the sixth year of out-migrant sampling on the Credit River using a Rotary Screw Trap. The trap was deployed on April 11 soon after the stocking of spring yearling Atlantic Salmon which occurred on April 6 and 7 at Terra Cotta and Norval. Daily trap sampling occurred for the next 66 days until trap removal on June 16. In 216, 2,851 fish representing 22 species were collected (Table ). Atlantic Salmon catches in 216 were high, second only to catches in 215 (Table ). As in 215, these high catches are likely due to the close alignment of the dates of yearling stocking (April 6) and the commencement of trapping (April 11). Tissues from 417 Atlantic Salmon were submitted to MNRF Aquatic Research and Monitoring Section for genetic analysis to determine strain assignment and parentage (lifestage stocked). The proportion of each strain and life-stage caught in 216 reflects the amounts of each stocked. The most numerous strain caught across all life-stages was LaHave (85%) (Table TABLE List of species collected using the Rotary Screw Trap during 216. Species Catch Chinook Salmon 1,858 Atlantic Salmon 417 Common Shiner 331 Rainbow Darter 49 Sea lamprey 35 Stonecat 28 Blacknose dace 27 Rainbow Trout 27 Longnose Dace 23 Bluntnose Minnow 15 River Chub 6 Coho Salmon 6 Fathead Minnow 5 White Sucker 5 Hornyhead Chub 4 Golden Shiner 3 Brook Stickleback 3 Creek Chub 3 Johnny Darter 2 Fantail Darter 2 Northern Hog Sucker 1 Emerald Shiner 1 Total 2, ). This strain made up 8% of the spring fingerlings stocked in 215 and 1% of the spring yearlings stocked in 216. When examined across the six years of sampling ( ) the catches of Sebago and LaHave are similar comprising 45% and 47% respectively of the catch in years when stocking efforts are comparable between the strains. The Lac St. Jean strain does not represent a significant proportion of the smolt catch in any year, however, this strain was stocked only recently and not in numbers that are comparable to the other strains. Section 1. Index Fishing Projects
84 76 Once again, the poorest performing lifestage appears to be fall fingerlings. Since the onset of sampling fall fingerlings have never made up more than ten percent of the catch (Table 1.9.2). The most abundant life-stage was spring yearlings. This is the second sampling season where that life-stage dominated the catch at 55%. Prior to 215, the most abundant life-stage was spring fingerlings (Table 1.9.2). This shift in catch composition reflects changes to the spring yearling stocking strategy that came out of findings of the 214 Atlantic Salmon Science Workshop. The workshop called for the production of larger spring yearlings to improve their performance. An artifact of producing larger yearlings is a later stocking date. Yearling stocking shifted from mid-march ( ) to early April ( ). Stocking now occurs immediately prior to the commencement of sampling. The fact that yearling catches were low prior to this timing shift likely indicates that spring yearlings out-migrate soon after stocking and during the years when stocking was early (mid-march), the bulk of the yearling outmigration occurred prior to trap deployment. Since 215, catches are bimodal with an early peak reflecting spring yearling out-migration (mid April) and a later peak (early May) reflecting spring fingerling out-migration (Fig ). Overall, the performance of spring fingerling and spring yearling life-stages seems to be comparable now that the yearling stocking window has changed (Table 1.9.2). Of interest is the relative abundance of unassigned individuals. These are wild caught fish that cannot be traced back to hatchery mating records. Their abundance has been increasing accounting for over one third of the catch in most years after 214. The recent increase also seems to be skewed toward Sebago strain unassigned fish. It is important to note that Sebago strain Atlantic Salmon are stocked by New York State and these fish are encountered in Ontario tributaries. Wild crosses between New York and Ontario stocked Sebago strain would produce the unassigned classification; however, the high proportion of these fish in our assessments seems questionable and deserves more detailed assessment. TABLE Composition of the out-migrant catch by stocked life-stage and strain. Year Days sampled Atlantic Salmon catch Strain Fall fingerling Spring fingerling Parentage Spring yearling Unassigned Ambiguous strain LaHave Sebago LaHave Sebago LaHave Sebago LaHave Sebago Lac St. Jean 12 2 LaHave Sebago Lac St. Jean LaHave Sebago Lac St. Jean 4 Totals Section 1. Index Fishing Projects
85 77 16 Yearling Stocking Date Number Caught Yearling Stocking Date FIG Timing of the Atlantic Salmon catch Catches have been pooled ( ) and ( ) to display the shift in catch following the implementation of stocking changes initiated in the spring of 214. Note that high water events in 214 delayed sampling until late April in that year. Date Section 1. Index Fishing Projects
86 Juvenile Chinook Assessment M.J. Yuille, Lake Ontario Management Unit In recent years, the Lake Ontario Chinook Salmon Mass Marking Study indicated 4-6% of the Chinook Salmon in Lake Ontario originated from agency stocking programs and the remainder were of naturalized origin. In addition, many naturalized Chinook Salmon have been collected during electrofishing programs conducted in Lake Ontario tributaries. In 214, a program was initiated to assess naturalized production of juvenile Chinook Salmon in Lake Ontario streams. This program was based on previous surveys conducted during spring 1997 to 2. In 216, modifications to the survey resulted in the sampling of six Lake Ontario tributaries, which included: Bronte Creek, Oakville Creek, Duffins Creek, Wilmot Creek, Ganaraska River and Shelter Valley Creek. While the over-arching objectives of the juvenile Chinook assessment program remained intact (quantifying naturalized Chinook Salmon production), modifications were made to the program to allow for the development of a new assessment tool known as otolith microchemistry. Once refined, this technique may be used to distinguish between stocked and naturalized fish based on the chemical composition of the otolith, allowing us to track the contribution of naturalized fish to the Lake Ontario recreational fishery without the need of fin clips. During 216, juvenile Chinook Salmon were surveyed by electrofishing in six Lake Ontario tributaries (Table 1.1.1). The survey took place over three days spanning May 1-12, 216. With the exception of Oakville Creek, only one site was visited per tributary (Tables and 1.1.2). Estimated catches of age- Chinook Salmon were highest in Wilmot Creek (1,573.8 fish/site); approximately 5X higher than the Ganaraska River ( fish/site) and Shelter Valley Creek (249.4 fish/site; Figure and Table 1.1.1). Wilmot Creek had the highest age- Chinook Salmon biomass (8.83 g/m 2 ) followed by Shelter Valley Creek (3.25 g/m 2 ) and Ganaraska River (.94 g/m 2 ; Table 1.1.1). Chinook Salmon parr/smolts will be collected in the spring over the next two years to establish the micro-chemical baseline for the otoliths. Results will be made available in the following years. Year to year variability in abundance of Chinook Salmon in Lake Ontario streams is still not well understood. Moreover, a widespread increase in Chinook Salmon abundance across streams may be consistent with ecosystem changes in Lake Ontario over the last 2 years. Assessment of naturalized Chinook Salmon production in streams should provide additional insights into wild and naturalized fish production. Additionally, this program is providing essential baseline information for the development of a new assessment technique that will aid in estimating Chinook Salmon natural production in Lake Ontario. TABLE Location, sampling date site dimensions and abundance estimates (number, linear density (fish/m) and biomass (g/m 2 )) of age- Chinook Salmon in six Lake Ontario tributaries in 216. The abundance was estimated for each species at each site using: N = catch + (catch / (1/( )*mean weight*.27116)-1). The spatial coordinates are at the downstream end of each site. Site Latitude Longitude Date Bronte Creek BN ' ' May Oakville Creek OA ' ' May OA ' ' May Duffins Creek DU ' ' May Wilmot Creek WMA ' ' May Ganaraska River GN ' ' May Shelter Valley Cr. Site width (m) Site length (m) Estimated no. No./m g/m 2 SE9 44.4' ' May Section 1. Index Fishing Projects
87 79 TABLE Catch by species of fish in Lake Ontario tributaries during electrofishing surveys in 216. Age- 1+ Age- 1+ Age- 1+ Age- 1+ Sea lamprey Coho salmon Chinook salmon Rainbow trout Atlantic salmon White sucker Carps and minnows Hornyhead chub River chub Pugnose shiner Common shiner Fathead minnow Blacknose dace Longnose dace Creek chub Stonecat Rock bass Rainbow darter Fantail darter Johnny darter Mottled sculpin Site Date Bronte Creek BN4 May Oakville Creek OA2 May OA6 May Duffins Creek DU6 May Wilmot Creek WM1 May Ganaraska River GN1 May Shelter Valley Cr. SE9 May Section 1. Index Fishing Projects
88 Bronte Oakville Duffins Wilmot Ganaraska Density (fish * m 2 ) Shelter Valley River Sampled FIG Linear density (fish/m 2 ) of Chinook Salmon in 216 at sites in six Lake Ontario tributaries (Bronte Creek, Oakville Creek, Duffins Creek, Wilmot Creek, Ganaraska River and Shelter Valley Creek). Section 1. Index Fishing Projects
89 Lake Ontario Spring Prey Fish Trawling J.P. Holden, M.J. Yuille, J.A. Hoyle Lake Ontario Management Unit, MNRF M.G. Walsh, B.C. Weidel Lake Ontario Biological Station, USGS M.J. Connerton Cape Vincent Fisheries Station, NYSDEC Since 1978 the New York State Department of Environmental Conservation (NYSDEC) and the U.S. Geological Survey (USGS) have annually conducted 1-12 bottom trawl tows, primarily in US waters in early spring, to provide an index of Alewife abundance as well as biological attributes such as age distribution and body condition. As the dominant prey species in Lake Ontario, understanding Alewife abundance and age structure is important for assessing predator/prey balance and establishing safe stocking levels of predator species (i.e. Chinook Salmon and Lake Trout). In 216, the Ontario Ministry of Natural Resources and Forestry (OMNRF) joined the spring trawl survey for the first time, and an additional 46 Canadian sites were sampled. Trawling at Hamilton and Toronto (shallow sandy sites) was conducted by the USGS, while deep Toronto sites, Oshawa, Cobourg, Prince Edward County and in the Kingston Basin were sampled by OMNRF (Fig ). A total of 188 sites conducted throughout the lake were sampled in 216 (46 in Canadian waters, 142 in US waters) spanning bottom depths from 8-225m ( ft.) between April 19th and May 1th. As a whole, the survey generally samples depths in proportion to the lake area (Fig ) however there are differences in how those samples are distributed between jurisdictions (Fig ). The south shore has well distributed coverage as most depths between 8-2m can be surveyed at each transect. Bottom trawling along the north shore is less uniform due to a lack of FIG Geographic distribution of trawl sites conducted by MNRF, USGS and NYSDEC. Section 1. Index Fishing Projects
90 82 Proportion Lake Area Trawl Sites Upper Depth Limit (m) FIG Depth distribution of trawl sites relative to the lake area at depth. Tows CA Upper Depth Limit (m) FIG Comparison of depth distribution of trawls conducted in US and Canadian water. US All vessels followed a standardized trawl protocol that utilized a polypropylene mesh bottom trawl referred to as 3N1 (see Table for trawl dimensions) equipped with rubber discs that elevate the footrope off bottom to minimize catches of dreissenid mussels. NYSDEC and USGS vessels used USA Jet slotted, metal, cambered trawl doors (1.22m x.75m), while OMNRF used comparable Thyborne doors to spread the trawl. Trawl mensuration gear was used to record door spread, bottom time and headrope depth. A target of 1 min tow time was set for the survey as was a standardized 3:1 warp to bottom depth ratio. Species diversity varied between sites and depths (Fig ). Overall 2 different fish species were captured in the survey however 12 species were caught in five or fewer trawls. Rainbow Smelt, Alewife and Round Goby were the most commonly encountered species occurring in 47%, 41% and 36%, of the trawls, respectively. The ten most common species are listed in Table Spatial distribution of abundance is presented in Fig Alewife density is significantly higher than the other species (1-1x greater) and is presented with a different scale to maintain spatial trends. Rainbow Smelt and Round Goby abundance appears higher along suitable trawl sites at shallower depths. Attempts to trawl at depths shallower than 8 m at the current sites have consistently resulted in snags and torn trawl nets. Depths greater than 8 m, however, tend to be more bottom trawl friendly and thus there is an emphasis on conducting trawls at those depths along the north shore. During the day, in early spring, most Lake Ontario Alewife are found near the lake bottom in the warmer, deeper water (75 m 15 m) thus trawl sites in depths greater than 8 m provide suitable index sites for Alewife. Additionally, shallow tows (<4 m) in Ontario waters occur disproportionately in the Kingston Basin. Efforts continue to seek suitable trawl locations along the north shore portion of the main lake utilizing new technology such as side-scan sonar. TABLE Gear specifications for the polypropylene mesh bottom trawl referred to as 3N1, and equipped with rubber discs that elevate the footrope off bottom to minimize catches of dreissenid mussels. Component Headrope length Description 2 m Footrope length 22 m Codend mesh 15.2 mm knotless nylon Gear height 3.5 m Fishing width 7 m Composed of 1 mm Cookie sweep diameter rubber discs that sit description.3 m below the footrope Door weight 125 kg Door area.93 m 2 Door height 1.2 m Section 1. Index Fishing Projects
91 83 FIG Species diversity per trawl site. Points are scaled to number of species caught ranging from 1 to 1 species at the most diverse site. TABLE Ten most common species caught during the 216 spring bottom trawl survey. Species Number of Trawl Sites Percentage of Sites Rainbow smelt 9 48% Alewife 78 41% Round goby 68 36% Deepwater sculpin 51 27% Lake trout 46 24% Slimy sculpin 28 15% Threespine stickleback 19 1% Yellow perch 15 8% Lake whitefish 5 3% Spottail shiner 4 2% the south shore whereas Alewife seemed to have a patchy distribution throughout the lake. The higher abundance of Rainbow Smelt and Round Goby along the south shore may be related to available trawl sites in optimum depths (i.e. <1 m). Rainbow Smelt and to a lesser degree Round Goby, have abundances in depths shallower than 1 m (Fig ) and the number of sites trawled in those depths is greater on the south shore. Alewife catches peak between 8-1 m and while Deepwater Sculpin abundance peaks between m there is generally an increasing trend with depth. Section 1. Index Fishing Projects
92 84 4 Density (fish/m 2 ) Alew RbSm RGoby SlScul DwScul FIG Relative density (fish/m 2 ) of common species (Alewife, Rainbow Smelt, Round Goby, Slimy Sculpin and Deepwater Sculpin) catches throughout the survey area Fishing Depth FIG Relative density (fish/m 2 ) of common prey species (Alewife, Rainbow Smelt, Round Goby, Slimy Sculpin and Deepwater Sculpin) by trawl depth. Section 1. Index Fishing Projects
93 Lake Ontario Fall Benthic Prey Fish Assessment J.P. Holden, M.J. Yuille, J.A. Hoyle, Lake Ontario Management Unit, MNRF B.C. Weidel, Lake Ontario Biological Station, USGS M.J. Connerton, Cape Vincent Fisheries Station, NYSDEC The Lake Ontario offshore prey fish community was once a diverse mix of pelagic and benthic fish but by the 197s the only native fish species that remained abundant was Slimy Sculpin. Recent invasions of dressenid mussels and Round Goby have further changed the offshore fish community. The Lake Ontario Fall Benthic Prey Fish Assessment provides an index of how prey fish abundance, distribution and species composition has been altered through time due to environmental change and species invasions. A benthic prey fish assessment in the main basin of Lake Ontario has typically only been conducted by the US Geological Survey (USGS). The historical survey assessed prey fish along six southern-shore, US transects in depths from 8-15 m. However, the restricted geographic and depth coverage prevented this survey from adequately informing important benthic prey fish dynamics at a whole-lake scale, including monitoring the reappearance of Deepwater Sculpin. In 215, this program was expanded to include additional trawl sites conducted by OMNRF and New York Department of Environmental Conservation (NYSDEC). This section will emphasize lake wide results. Species specific results are reported in the Status of Stocks section of this report (Section 7). The 216 survey consisted of 142 trawls conducted from October 3-19 throughout the entire lake (Fig ). As a whole, the survey FIG Geographic distribution of trawl sites conducted by MNRF, USGS and NYSDEC. Section 1. Index Fishing Projects
94 86 generally samples depths in proportion to the lake area (Fig ) however there are differences in how those samples are distributed between jurisdictions (Fig ). Shallow tows (<4m) in Ontario waters are largely confined to the Kingston Basin. Efforts continue to find suitable trawl locations along the north shore portion of the main lake to improve the spatial coverage of this survey. All vessels used a similar trawl (3/4 Yankee Standard, see Section 1.3 for specifications) however doors and warp ratios varied between vessels. Depth loggers were used on USGS and OMNRF trawls to provide estimates of true bottom time in order to standardize catches to area swept..15 Lake Area Trawl Sites Species diversity varied between sites (Fig ). Overall 34 different fish species were captured in the survey however 2 species were encountered in five or fewer trawls. Alewife was the most common species encountered in catches (86% of trawls) followed by Round Goby (71%), Rainbow Smelt (61%), Deepwater Sculpin (44%) and Slimy Sculpin (33%) (Table ). Spatial distribution of abundance is presented in Fig Alewife and Round Goby densities were highest and are consistently found throughout the lake. Both Alewife and Rainbow Smelt are thought to be mostly pelagic (suspended) at this time of the year, so this benthic survey may not accurately reflect their distribution and density. Bottom depth has a strong effect on species abundance. Round Goby occupy depths shallower than Slimy Sculpin which are shallower than Deepwater Sculpin (Fig ). Proportion Upper Depth Limit (m) FIG Depth distribution of trawl sites relative to the lake area at depth. Tows CA US TABLE Percentage of trawls in which the ten most common species occurred. Species % Trawl Sites Alewife 86 Round Goby 7 Rainbow Smelt 61 Deepwater Sculpin 44 Slimy Sculpin 33 Yellow Perch 16 Lake Trout 15 Gizzard Shad 9 Brown Bullhead 8 Spottail Shiner Upper Depth Limit (m) FIG Comparison of depth distribution of trawls conducted in US and Canadian water. Section 1. Index Fishing Projects
95 87 FIG Species diversity per trawl site. Points are scaled to number of species caught ranging from 1 to 1 species at the most diverse site. 1.5 Density (fish/m 2 ) Alew RbSm RGoby SlScul DwScul Fishing Depth FIG Relative density (fish/m 2 ) of the most common species (Alewife, Rainbow Smelt, Round Goby, Slimy Sculpin and Deepwater Sculpin) catches throughout the survey area FIG Relative density (fish/m 2 ) of common prey species (Alewife, Rainbow Smelt, Round Goby, Slimy Sculpin and Deepwater Sculpin) by trawl depth. Section 1. Index Fishing Projects
96 88 2. Recreational Fishery 2.1 Fisheries Management Zone 2 Council (FMZ2) / Volunteer Angling Clubs C. Lake, Lake Ontario Management Unit Fisheries Management Zone 2 (FMZ2) Council provides recommendations to the Lake Ontario Manager regarding the management of the Lake Ontario recreational fishery. The FMZ 2 Council has spent many hours reviewing information, attending meetings, listening to issues, discussing options and providing advice. In 216, the Council provided a great deal of discussion and input on the question of appropriate stocking levels of predatory fishes (specifically, Chinook Salmon and Lake Trout), in light of back-to-back weaker than anticipated Alewife year-classes in 213 and 214 (Section 7.6). This has required participation in several face-to-face meetings as well as some council members representing Ontario at a bi-national forum with stakeholders from New York State. In April, a Trout and Salmon Symposium was held in Port Credit, that was very well attended, and co -hosted by MNRF s Lake Ontario Management Unit and the Port Credit Trout and Salmon Association. implementation of Lake Ontario s net pen rearing initiatives for Chinook Salmon (Section 6.2). Others help with the annual delivery of our stocking program through the operation of community based hatcheries. The Napanee Rod and Gun Club helps MNRF meet its stocking targets by rearing Brown Trout. The Credit River Anglers stock Rainbow Trout and Coho Salmon. The Metro- East Anglers, through their operation of the Ringwood hatchery, help the province meet its Rainbow Trout, Brown Trout, Atlantic Salmon, and Coho Salmon targets. Volunteers at the Ganaraska River-Corbett Dam Fishway spend many hours ensuring the fishway is operating properly, installing and maintaining the fish counter, helping to assess the spring Rainbow Trout population, and helping with fall Chinook Salmon egg collection. Numerous anglers / clubs also participate regularly by supplying catch and harvest information in our volunteer angler diary programs. Many of our volunteer clubs (councilaffiliated and others) also help with the physical delivery of several management programs. Multiple clubs help with the planning and Section 2. Recreational Fishery
97 Western Lake Ontario Boat Angling Fishery M. J. Yuille and N.J. Jakobi, Lake Ontario Management Unit Stocking of Coho Salmon and Chinook Salmon by New York State and Ontario in the late 196s created an angling fishery for salmon and trout in Lake Ontario. Rainbow Trout, Atlantic Salmon, Brown Trout and Lake Trout were lake stocked (see Section 6.1, 8.2, 8.5) creating a world-class fishery. Significant natural reproduction of Rainbow Trout and Chinook Salmon has further added to the quality of angling in Lake Ontario. OMNRF has surveyed this fishery in most years since This survey provides the only statistics for this fishery in Ontario waters and is the primary source for biological monitoring of salmon and trout in the Ontario waters of Lake Ontario. We have relied on catch rates to index the abundance of these salmon and trout populations. Moreover, this survey has provided a broad geographic and seasonal array of biological samples. This fishery was monitored at boat launch ramps during April to the end of August from the Niagara River to Wellington (Fig ). The survey design was similar to most previous surveys in the past three decades. The survey was temporally and spatially stratified by month and sectors (respectively, Fig ). Catch, harvest and effort information were obtained through angler interviews at selected high-effort ramps (one in each sector) after fishing trips were completed. Fishing effort was monitored by counting boat trailers at all ramps on a weekly basis. We limited interviews to the Niagara and Hamilton sectors in April and May, as past surveys indicated effort was sparse elsewhere during these months. Anglers were surveyed in all sectors from June to August. Fishery statistics for marina-based anglers were estimated based on the 211 marina based fishery scaled to the 216 ramp based fishery. FIG Spatial stratification of OMNRF Western Lake Ontario Angler Survey. Kingston Basin was not surveyed in 216. Section 2. Recreational Fishery
98 9 Angling statistics for the salmon and trout fishery in the Ontario waters of Lake Ontario for 1977 to 216 are provided in Table Angling effort in 216 (353, 945 angler-hrs; Fig ) has not varied greatly since 1994 (Fig ). The catches of Chinook Salmon remain high in 216, however catches of Rainbow Trout and Coho Salmon declined significantly since the last survey in 213 (Table 2.2.1; Fig ). Chinook Salmon dominated the catch (49,779), followed by Rainbow Trout (18,19), Lake Trout (6,814) and Coho Salmon (5,746). Together they represented about 97% of the total catch of all species. Of the six aforementioned salmon and trout species, anglers primarily targeted Chinook Salmon (77% of angling effort), followed by Rainbow Trout (49%) and Coho Salmon (2%; Fig ). Catch rates for the time series from show major shifts in salmon and trout populations and the quality of angling in Lake Ontario (Fig ). In 216, catch rates for Chinook Salmon were higher than the previous survey in 213, while catch rates for Rainbow Trout in 216 were significantly lower than 213 (Fig ). TABLE Angling statistics for the salmon and trout fishery in the Ontario waters of Lake Ontario (excluding Kingston Basin), 1977 to 216. Anglers were only allowed to fish with one rod prior to Year Chinook Salmon Rainbow Trout Coho Salmon Catch Harvest Effort Atlantic Salmon Brown Trout Lake Trout Chinook Salmon Rainbow Trout Coho Salmon Atlantic Salmon Brown Trout Lake Trout Rod-hr Angler-hr ,47 NA 72, NA NA 3,972 NA 72, NA NA 465, , ,928 2,19 97, ,892 2,96 97, , , ,774 5,769 79, ,774 5,756 79, ,86 656, ,73 5,435 74, ,512 2,447 4,126 66, , ,82 744, ,33 21,774 16, ,566 4,627 17,83 17,19 13, ,19 3, , , ,764 43,774 12, ,224 9,259 32,96 35,627 1, ,991 6, , , ,686 98,471 34,23 3,432 7,32 42, ,322 83,53 22, ,18 25,35 1,157,73 1,157, ,877 1,824 43,294 1,843 2,831 24, ,675 73,377 29, ,471 9,13 1,363,82 1,363, ,796 62,565 27, ,95 21,225 18,24 44,977 12, ,399 8,391 1,215,219 1,215, ,289 96,8 27,983 1,382 5,542 9,37 74,66 73,561 16, ,1 3,12 1,233,13 1,233, ,796 52,545 15, ,29 11,868 71,25 35,23 11, ,548 3,856 1,1,516 1,1, ,786 84,229 15,96 1,628 2,817 12,21 6,71 67,529 1, ,4 2,832 1,112,47 1,112, ,841 57,281 17, ,151 41,277 66,79 38,712 14, ,119 6,843 1,82,287 1,82, ,959 26,742 3,222 2,516 4,1 7,891 5,182 18,381 1, ,761 2,997 1,12,822 1,12, ,852 51,733 6,845 1,238 2,174 6,332 64,444 28,738 4, ,28 3, , , ,31 25,227 2, ,983 13,623 38,17 14,382 1, ,251 5,443 61,325 61, ,791 15,998 1, ,929 1,63 2,387 9, ,68 3, , , ,566 7,77 2, ,3 1,427 23,89 3,979 1, ,113 58,297 58, ,723 25,75 3, ,24 1,831 25,841 16,766 2, ,15 44, ,899 26,8 3, ,331 27,542 18,616 3, , , , ,612 9,45 2,95 2 1,52 4,638 27,352 5,284 1, ,6 453, ,14 16,683 2, ,58 3,8 18,525 1,828 1, , , ,699 1,876 1, ,54 7,341 1, , , ,5 7,176 2, ,216 15,843 4,437 1, ,11 286, ,298 4,583 1, ,29 17,263 3,57 1, , , ,711 16,154 1, ,214 18,61 15, , , ,584 25,169 2, ,522 1,397 11,88 2,73 1, ,586 34, ,172 25,588 7, ,392 1,756 17,82 16,185 5, , , , ,63 4,63 18, ,4 19,32 26,616 12, ,6 319, ,413 33,27 8, ,121 14,477 16,24 23,115 8, , , ,779 18,19 5, ,814 24,434 12,271 3, ,14 353,945 Section 2. Recreational Fishery
99 91 15 Angler-hr.4 Total 125 Rod-hr Chinook Salmon.3 Rainbow Trout Effort (hrs X 1) FIG Fishing effort (angler hours and rod hours) in the Ontario waters of Lake Ontario (excluding Kingston Basin), 1977 to 216. Anglers were only allowed to fish with one rod prior to Coho Chinook Rainbow Atlantic Brown Lake Catch rate (fish per angler-hr) FIG The catch rate (number of fish per angler hour) of salmon and trout in the Ontario waters of Lake Ontario (excluding Kingston Basin), 1977 to 216. Proportion of Total Effort (angler-hrs) FIG The proportion of angling effort (angler hours) for specific salmon and trout species relative to the total estimated angling effort in 216. Section 2. Recreational Fishery
, distribution, and movement of Chinook")
100 Lake Ontario Volunteer Angler Diary Program M. J. Yuille, Lake Ontario Management Unit A mass-marking and tag monitoring study was initiated in 28 by NYSDEC and OMNRF to determine the origin (stocked or wild), distribution, and movement of Chinook Salmon in Lake Ontario (see Section 2.2). All Chinook Salmon stocked into Lake Ontario from were marked with an adipose fin clip and a portion were also tagged with a coded-wire tags. Lake Ontario anglers have been contributing to the collection of data on Lake Ontario salmonids, including these marked Chinook Salmon, through a volunteer diary program. Since 211, anglers have participated in a volunteer diary program reporting catch, biological and fin clip information on Chinook Salmon from their annual fishing trips. In 214, the angler diary program expanded to collect catch and effort information as well as biological information on all Lake Ontario salmonid species (Coho Salmon, Chinook Salmon, Rainbow Trout, Atlantic Salmon, Brown Trout and Lake Trout) caught. This information was collected again in 216. In 216, 15 boats (anglers originating from Ontario and Québec, Fig ) participated in the program; a decrease of four participants from 215. Anglers participating in the diary program fished from April to October out of ports spanning from the Niagara River to Wellington, providing good temporal and spatial distribution of fishery information (see Section 2.2, Fig ). Of all participants, 53% were affiliated with an angling club and 13% were charter boat operators. In 216, anglers made 286 fishing trips and recorded data on 1,78 Lake Ontario salmonids (Tables and 2.3.2). Anglers were asked to record location (nearest port), disposition (kept or released), fish lengths and weights as well as examine every salmonid landed for fin clips. Of the five salmonid species, Chinook Salmon were targeted most frequently and represented the highest catch in 216 (Fig and Tables 2.3.1, and 2.3.3). Similar to FIG Geographical distribution of participants in the 216 Lake Ontario Volunteer Angler Diary program. Image courtesy of Google Earth. Section 2. Recreational Fishery
101 93 TABLE Distribution of angler catches and targets (in brackets) for the six Lake Ontario salmonid species across seven months (April September 216) as reported in the 216 Lake Ontario Angler Diary Program. 216 Lake Ontario Angler Diary Month Number of Coho Chinook Rainbow Atlantic Brown Lake Trips Salmon Salmon Trout Salmon Trout Trout Total April 8 1 (3) (7) 1 (3) -- 6 (7) 6 (4) 14 (24) May (11) 53 (31) 9 (5) 1 () (2) 23 (7) 15 (56) June (14) 121 (5) 22 (14) -- (6) 1 (1) 166 (94) July (37) 385 (11) 57 (51) 4 (1) (24) 17 (1) 56 (233) August 7 6 (16) 161 (69) 57 (28) 2 (1) 2 (15) 14 (7) 242 (136) September 13 (2) 31 (13) 1 (4) -- (1) 4 (2) 45 (22) Total (83) 751 (28) 156 (15) 7 (2) 8 (55) 74 (4) 1,78 (565) TABLE Distribution of angler catch and targets (in brackets) for the six Lake Ontario salmonid species across six sector locations as reported in the 216 Lake Ontario Angler Diary Program. See Section 2.2 Fig for a map of the six defined areas. 216 Lake Ontario Angler Diary Sector Number of Coho Chinook Rainbow Atlantic Brown Lake trips Salmon Salmon Trout Salmon Trout Trout Total Brighton-Wellington 64 1 (4) 214 (63) 6 (8) -- (6) 23 (4) 244 (85) Whitby-Cobourg (39) 129 (57) 12 (52) -- (32) 1 (7) 153 (187) East Toronto (2) 5 () () 13 (2) West Toronto Hamilton (25) 253 (9) 88 (26) 4 () 3 (4) 28 (17) 421 (162) Niagara (15) 139 (66) 44 (18) 3 (2) 5 (13) 21 (12) 237 (126) Undefined 2 11 (39) 129 (57) 12 (52) -- (32) 1 (7) 153 (187) Total (83) 751 (28) 156 (15) 7 (2) 8 (55) 74 (4) 1,78 (565) Prop. Sought Prop. Caught (a) (b) Coho Chinook Rainbow FIG Proportion of species sought (a) and caught (b) from all 286 trips recorded in the 15 Lake Ontario Volunteer angler diaries submitted to the Lake Ontario Management Unit. Species labels include Coho Salmon (Coho), Chinook Salmon (Chinook), Rainbow Trout (Rainbow), Atlantic Salmon (Atlantic), Brown Trout (Brown) and Lake Trout (Lake). Atlantic Brown Lake 214, Rainbow Trout were the second most frequently targeted and caught species in 216 (Fig , Tables and 2.3.2). In 216, Brown Trout had the highest percent harvest (88% of catch) followed by Coho Salmon (61%), Rainbow Trout (6%), Chinook Salmon (45%) and Lake Trout (19%) (Fig ). No clips were observed on any Coho or Atlantic Salmon caught. Thirty percent of Lake Trout, 3% of Chinook Salmon and 2% of Rainbow Trout caught had fin clips (Fig ). Seasonal and geographical catch summaries are provided in Tables and (respectively). Most angling trips were recorded in July and August (63% combined) and originated predominantly from Hamilton, Niagara and Brighton-Wellington sectors (79% of trips). Chinook Salmon were predominantly caught in July and August (73% of catch) and in the Hamilton and Whitby-Cobourg sectors (62% Section 2. Recreational Fishery
102 94 TABLE Annual angler participation and spatial distribution of Chinook Salmon captured in the Lake Ontario Volunteer Angler Diary Program, See Section 2.2 Fig for a map of the six defined areas. Chinook Salmon caught Survey Year Number of volunteer anglers Number of trips Niagara Hamilton West Toronto East Toronto Whitby- Cobourg Brighton- Wellington Undefined Total catch , , Total 138 2,95 2,31 1, ,127 1, , Coho Chinook Rainbow Atlantic Brown Lake Percent Release:Harvest Coho Chinook Rainbow Atlantic Brown Lake Percent Unclipped:Clipped FIG Percent released (grey) and harvested (white) for each salmonid species (Coho Salmon (Coho), Chinook Salmon (Chinook), Rainbow Trout (Rainbow) Atlantic Salmon (Atlantic), Brown Trout (Brown) and Lake Trout (Lake)) reported in the 216 Lake Ontario Angler Diary Program. FIG Percent composition of unclipped (grey) vs clipped (white) for each salmonid species (Coho Salmon (Coho), Chinook Salmon (Chinook), Rainbow Trout (Rainbow) Atlantic Salmon (Atlantic), Brown Trout (Brown) and Lake Trout (Lake)) reported in the 216 Lake Ontario Angler Diary Program.. combined). Most Rainbow Trout were caught in July and August (73% combined) and in the Niagara and Hamilton sectors (84% combined). Lastly, Lake Trout were predominantly caught in the Hamilton, Niagara and Brighton-Wellington sectors (97% of catch) evenly distributed throughout the April to September season (Table 2.3.1). We would like to thank all Lake Ontario Volunteer Angler Diary participants who generously volunteered their time to collect marking and biological information for this program. Participants that gave permission for their names to appear in this report include: Herman Baughman, Dan Brown, Bill Cuthill, Blair Cyr, Richard Dew, Al van Dusen, Gene Frederick, Ken Herrington, Jean-Marie LaFleche, Jack Laki, Andrew Lalonde, Jean Morneau, Al Oleksuik, Paul Paulin, Stan Smaggas, Shane Thombs and Bob Warner. Section 2. Recreational Fishery

103 Bay of Quinte Ice Angling Survey J. A. Hoyle, Lake Ontario Management Unit Only the ice-fishing component of the Bay of Quinte recreational angling fishery was monitored in 216; the open-water fishery was not surveyed. The ice-fishing survey was previously surveyed in 214. The ice-fishing survey was conducted from Trenton in the west to east of Glenora (Fig ). Angling effort was measured using aerial counts of anglers and huts (two days per week: one weekday and one weekend day). An on-ice angling component to the survey was also planned but poor ice conditions prevented this component of the survey from being completed. Total angling effort was estimated based on the proportion of aerial counts, per survey strata, in 216 (Table 2.4.1) compared to 214 and assuming only eight weeks of fishing in 216 compared to eleven weeks in 214. Similarly, catch and harvest per unit effort estimates from 214 were applied to FIG Map of the Bay of Quinte showing angling survey areas from Trenton in the west to east of Glenora. the 216 effort estimate to obtain an estimate of Walleye catch and harvest in the 216 ice fishery. Ice conditions were very poor. Sixteen aerial flights were conducted from Jan 14-Mar 1, 216 (Table 2.4.1). The maximum number of icehuts counted during aerial flights was 338 huts (January 23); while the maximum number of onice anglers observed was 237 (January 3). Figure and Table summarize icefishing survey results for The 216 survey estimated a total of 61,333 hours of icefishing effort. An estimated 6,524 and 4,43 Walleye were caught and harvested, respectively. TABLE Aerial angler (on-ice) and hut (portable and permanent) counts by date and day type for 16 aerial flights during winter 216. Date Day type On-ice Angling mode Portable hut Permanent hut Total count Jan-14 Weekday Jan-2 Weekday Jan-23 Weekend Jan-25 Weekday Jan-3 Weekend Jan-31 Weekend Feb-5 Weekday Feb-6 Weekend Feb-11 Weekday Feb-13 Weekend Feb-14 Weekend Feb-17 Weekday Feb-21 Weekend Feb-22 Weekday Feb-28 Weekend Mar-1 Weekday Average Section 2. Recreational Fishery
104 96 6, Released 4, Walleye catch 5, 4, 3, 2, Harvested Effort 3, 2, 1, Angling effort (hours) 1, FIG Bay of Quinte ice angling fishery statistics, , including angling effort (angler hours), and walleye catch and harvest (number of fish). TABLE Bay of Quinte ice angling fishery statistics, , including angling effort (angler hours), walleye catch and harvest rates (number of fish per hour), walleye catch and harvest (number of fish), and the mean weight (kg) of harvested walleye. *216 Walleye catch and harvest values were estimated based on 214 catch and harvest rates. Effort Catch rate Walleye Anglers Harvest rate Catch Harvest Mean weight (kg) , , , , , , , , , ,458 19, , , ,24 32, , ,494 43, , ,326 14, , ,6 8, , ,939 17, , ,468 2, , ,315 22, , ,167 6, , ,293 15, , ,949 9, , , ,61 2, , , ,413 4, , ,45 1, , ,48 11, , ,666 1, , ,943 8, , ,74 14, ,333.97*.69* 5,927 4,216 Section 2. Recreational Fishery

105 Bay of Quinte Volunteer Walleye Angler Diary Program J. A. Hoyle, Lake Ontario Management Unit A volunteer angler diary program was conducted during fall 216 on the Bay of Quinte. The diary program focused on the popular fall recreational fishery for trophy Walleye, primarily on the middle and lower reaches of Bay of Quinte. This was the fifth year of the diary program. Anglers that volunteered to participate were given a personal diary and asked to record information about their daily fishing trips and catch (see Fig ). A total of 13 diaries were returned as of February 217. We thank all volunteer anglers for participating in the program. A map showing the distribution of volunteer addresses of origin is shown in Fig Objectives of the diary program included: engage and encourage angler involvement in monitoring the fishery; characterize fall Walleye angling effort, catch, and harvest (including geographic distribution); characterize the size distribution of Walleye caught (kept and released); characterize species catch composition. Two of the 13 returned diaries reported zero fishing trips. The number of fishing trips reported in each of the remaining 11 diaries ranged from two to 2 trips. Fishing trips were reported for 59 out of a possible 1 calendar days from Sep 3 to Dec 11, 216. There were from one to four volunteer angler boats fishing on each of the 59 days, and a total of 93 trip reports targeted at Walleye; 33 charter boat trips and 6 non-charter boat trips (Table 2.5.1). Of the 93 FIG Volunteer angler diary used to record information about daily fishing trips and catch. Section 2. Recreational Fishery
.")
106 98 trips, 71 (76%) were made on Locations 2 and 3, the middle and lower reaches of the Bay of Quinte (see Fig ). The overall average fishing trip duration was 7.2 hours for charter boats and 4.3 hours for non-charter boats, and the average numbers of anglers per boat trip were 4.7 and 1.8 for charter and non-charter boats, respectively (Table 2.5.1). In Location 3, where two lines are permitted, most anglers used two lines (1.9 rods per angler on average). Fishing Effort A total of 1,62 angler hours of fishing effort was reported by volunteer anglers (Table 2.5.2). The seasonal pattern of fishing effort is shown in Fig Most fishing effort occurred in Location 2 (48%; middle Bay) (Fig ). Location 4 showed increased fishing effort compared to previous years. Catch FIG Map showing the distribution of volunteer addresses of origin. Image courtesy of Google Earth. Eight species and a total of 261 fish were reported caught by volunteer anglers. The number of Walleye caught was 184; 112 (61%) kept and 72 (39%) released (Table 2.5.3). The next most abundant species caught was Freshwater Drum (38) followed by Northern Pike (19), White Perch (11), and White Bass (5). Fishing Success The overall fishing success for Walleye in fall 216 was 2. Walleye per boat trip or.115 fish per angler hour of fishing (Table 2.5.2). Fifty Table Reported total number of boat trips, average trip duration, and average number of anglers per trip for charter and noncharter Walleye fishing trips during fall on the Bay of Quinte. Year Trip type Total number of boat trips Average trip duration (hours) Average number of anglers per trip 212 Charter Non-charter Charter Non-charter Charter Non-charter Charter Non-charter Charter Non-charter Section 2. Recreational Fishery
107 99 Table Reported total number of diaries (with at least one reported fishing trip), boat trips and effort, total angler effort, total number of Walleye caught, harvested, and released, average number of Walleye caught per boat fishing trip, average number of Walleye caught per boat hour, average number of Walleye caught per angler hour, and the "skunk" rate (percentage of trips with no Walleye catch) for Walleye fishing trips during fall on the Bay of Quinte. Year Statistic Number of diaries Number of boat trips Boat effort (hours) 1, ,375 1, Angler effort (hours) 5,915 3,93 5,164 5,266 1,62 Catch Harvest Released Fish per boat trip Fish per boat trip Fish per angler hour "Skunk rate" 36% 19% 27% 34% 44% Boat trips Boat trips (93) Angler effort (1,62 hours) Sep Oct Nov Dec FIG Seasonal breakdown (summarized by first and second half of each month from the first half of Sep to the first half of Dec) of fishing effort (boat trips and angler hours) reported by volunteer Walleye anglers during fall 216 on the Bay of Quinte. Boat trips Boat trips (93) Angler effort (1,62 hours) Angler effort (hours) Angler effort (hours) - Upper Bay Middle Bay Lower Bay Other FIG Geographic breakdown of fishing effort (boat trips and angler hours) reported by volunteer Walleye anglers during fall 216 on the Bay of Quinte. TABLE Number of fish, by species, reported caught (kept and released) by volunteer anglers during the fall Walleye diary program, Species Kept Released Kept Released Kept Released Kept Released Kept Released Longnose Gar 1 Chinook Salmon 1 2 Rainbow Trout 3 Brown Trout Lake Trout Lake Whitefish 1 Northern Pike White Perch White Bass Morone sp Sunfish 2 Smallmouth Bass Largemouth Bass Yellow Perch Walleye Freshwater Drum Section 2. Recreational Fishery
108 1 -six percent of all boat trips reported catching at least one Walleye ( skunk rate 44%). Seasonal fishing success, for geographic Locations 2 and 3 combined, is shown in Fig Success was highest in late September and low thereafter except for a high catch rate in December (by angler hour). Fishing success was higher in location 2 (middle Bay; 1.7 Walleye per boat trip or.128 fish per angler hour) than in Location 3 (lower Bay;.7 Walleye per boat trip or.33 fish per angler hour). Length Distribution of Walleye Caught Ninety-five percent of Walleye caught by volunteer anglers were between 14 and 3 inches in total length (Fig ). Over the five years of the volunteer angler diary program 2,24 Walleye lengths have been reported (Fig ). The proportion of Walleye released was highest for Catch per boat trip Catch per boat trip Catch per angler hour Sep Oct Nov Dec FIG Walleye fishing success (catch per boat trip and per angler hour) reported by volunteer Walleye anglers in areas 2 and 3 during fall 216 on the Bay of Quinte ((summarized by first and second half of each month from the first half of Sep to the first half of Jan). smallest and largest fish and lowest for fish of intermediate size. Only 16% of fish caught that were between 16 and 25 inches were released. Sixty-four percent of fish less than 16 inches and greater than 25 inches were released Catch per angler hour Number of fish Released Kept n= Total length (inches) FIG Length distribution of 183 Walleye caught (kept and released) by volunteer Walleye anglers during fall 216 on the Bay of Quinte. Number of fish Released Kept Proportion released n=2, Proportion released Total length (inches). FIG Length distribution of 2,34 Walleye caught (kept and released) by volunteer Walleye anglers during fall 212 to 216 on the Bay of Quinte. Also shown is the proportion of fish released (dotted line) Section 2. Recreational Fishery
109 11 3. Commercial Fishery 3.1 Lake Ontario and St. Lawrence River Commercial Fishing Liaison Committee A. Mathers, Lake Ontario Management Unit The Lake Ontario and St. Lawrence River Commercial Fishery Liaison Committee (LOLC) consists of Ontario Commercial Fishing License holders that are appointed to represent each of the quota zones, as well as representatives of the Ontario Commercial Fisheries Association, and MNRF. This committee provides advice to the Lake Ontario Manager on issues related to management of the commercial fishery and provides a forum for dialogue between the MNRF and the commercial industry. The committee met once during 216. One of the topics of discussion was the expansion of the American Eel trap and transport program (Section 8.3) to include a fall season. Other notable topics of discussion at the LOLC meeting included status of fish stocks, licence restrictions, quota and harvest levels for Yellow Perch, Lake Whitefish, Northern Pike and Walleye, as well as the quota pool system. Section 3. Commercial Fishery
110 Quota and Harvest Summary J. A. Hoyle, Lake Ontario Management Unit Lake Ontario supports a commercial fish industry; the commercial harvest comes primarily from the Canadian waters of Lake Ontario east of Brighton (including the Bay of Quinte, East and West Lakes) and the St. Lawrence River (Fig ). Commercial harvest statistics for 216 were obtained from the commercial fish harvest information system (CFHIS) which is managed, in partnership, by the Ontario Commercial Fisheries Association (OCFA) and MNRF. Commercial quota, harvest and landed value statistics for Lake Ontario, the St. Lawrence River and East and West Lakes, for 216, are shown in Tables (base quota), (issued quota), (harvest) and (landed value). The total harvest of all species was 438,826 lb ($632,677) in 216, up 72,121lb (2%) from 215. The harvest (landed value) for Lake Ontario, the St. Lawrence River, and East and West Lakes was 335,452 lb ($59,585), 73,935 lb ($11,263), and 29,439 lb ($34,683), respectively (Fig and Fig ). Yellow Perch, Lake Whitefish, Sunfish and Walleye were the dominant species in the harvest for Lake Ontario. Yellow Perch was dominant in the St. Lawrence River. Sunfish was the dominant fish in East and West Lakes. Major Fishery Trends Harvest and landed value trends for Lake Ontario and the St. Lawrence River are shown in Fig and Fig Having declined in the early 2s, commercial harvest appeared to have stabilized over the time-period at about 4, lb and 15, lb for Lake Ontario (Fig ) and the St. Lawrence River (Fig. FIG Map of Lake Ontario and the St. Lawrence River showing commercial fishing quota zones in Canadian waters. Section 3. Commercial Fishery
111 13 TABLE Commercial fish base quota (lb), by quota zone, in the Canadian waters of Lake Ontario and the St. Lawrence River, East and West Lakes (two Lake Ontario embayments), 216. Lake Ontario St. Lawrence River East Lake West Lake Base Quota by Waterbody Species Lake Ontario St. Lawrence River Black Crappie 4,54 3, 14,824 1,1 2,8 14,17 17,59 4,84 3,1 9,85 26,264 36,6 75,814 Bowfin Brown Bullhead Lake Whitefish 6,549 97,745 12,37 18, ,91 135,91 Sunfish 28,13 14,6 18,8 28,13 6,81 Walleye 4,21 34,431 9, ,893 48,893 Yellow Perch 28, ,778 8,742 1,936 1,4 55,181 66,251 18,48 1,12 3, , ,48 479,464 Total 71,91 249,954 17, ,77 14,78 69,351 83,841 22,888 18,82 31, ,26 176,8 8,572 Total TABLE Commercial fish issued quota (lb), by quota zone, in the Canadian waters of Lake Ontario and the St. Lawrence River, East and West Lakes (two Lake Ontario embayments), 216. Lake Ontario St. Lawrence River East Lake West Lake Issued Quota by Waterbody Species Lake Ontario St. Lawrence River Black Crappie 2,82 1,5 11, ,4 7,85 8,795 4,84 3,1 9,85 18,18 2,72 51,778 Bowfin Brown Bullhead Lake Whitefish 36 15,654 6,593 5, , ,392 Sunfish 28,13 14,6 18,8 28,13 6,81 Walleye 1,371 14,93 32, ,893 48,893 Yellow Perch 15,644 6,664 7,788 8,482 5,2 31,15 42,69 18,48 1,12 3, ,778 91, ,72 Total 48, ,721 89, ,32 7,64 38,235 5,864 22,888 18,82 31, ,81 111, ,75 Total TABLE Commercial harvest (lb), by quota zone, for fish species harvested from the Canadian waters of Lake Ontario and the St. Lawrence River, East and West Lakes (two Lake Ontario embayments), 216. Lake Ontario St. Lawrence River East Lake Species West Lake Lake Ontario Totals St. Lawrence River All Waterbodies Black Crappie , , ,195 5,93 2,845 1,973 Bowfin 34 1, ,569 1, ,125 6,85 8,655 Brown Bullhead , ,56 14, ,135 15,461 25,816 Common Carp ,52 1, , ,23 Freshwater Drum ,34 11,848 17,25 17,25 Cisco , ,71 1 3,744 Lake Whitefish 356 9,521 4, ,552 95,552 Northern Pike 4,15 1,19 17,38 1,742 2, ,43 23,94 2,692 29,452 Rock Bass ,651 1, ,218 5,926 1,64 9,734 Sunfish 2,4 5 31, , ,41 8,287 34,17 3,12 54,915 Walleye 985 1,644 22,748 25,377 25,377 White Bass ,16 3 6,585 6,588 White Perch , ,3 2, ,342 White Sucker 528 1,412 7,877 2, , ,825 Yellow Perch 1,751 6,66 41,953 36,395 9,528 15,348 17, ,165 41,95 129,373 Total 11,478 12, ,246 86,134 21,771 19,672 32,492 13,71 16, ,452 73, ,826 Section 3. Commercial Fishery
112 14 TABLE Commercial harvest (lb), price per lb, and landed value for fish species harvested from the Canadian waters of Lake Ontario and the St. Lawrence River, and the total for all waterbodies including East and West Lakes, 216. Species Lake Ontario Harvest Price per lb Landed value St. Lawrence River Harvest Price per lb Landed value All Waterbodies Harvest Price per lb Landed value Black Crappie 5,93 $3.43 $2,317 2,845 $2.69 $7,655 1,973 $3.9 $33,96 Bowfin 2,125 $.34 $718 6,85 $.81 $4,944 8,655 $.58 $5,13 Brown Bullhead 1,135 $.27 $2,719 15,461 $.43 $6,719 25,816 $.39 $1,1 Common Carp 4,738 $.16 $ $.3 $4 5,23 $.16 $846 Freshwater Drum 17,25 $.1 $1,677 17,25 $.1 $1,677 Cisco 3,71 $.28 $1,48 1 $.25 3,744 $.28 $1,55 Lake Whitefish 95,552 $1.39 $132,597 95,552 $1.39 $132,597 Northern Pike 23,94 $.3 $7,143 2,692 $.34 $924 29,452 $.3 $8,71 Rock Bass 5,926 $.61 $3,594 1,64 $.75 $1,223 9,734 $.64 $6,246 Sunfish 34,17 $1.25 $42,562 3,12 $1.15 $3,589 54,915 $1.22 $66,989 Walleye 25,377 $2.62 $66,51 25,377 $2.62 $66,51 White Bass 6,585 $.41 $2,721 6,588 $.41 $2,732 White Perch 2,55 $.45 $ $.45 $15 3,342 $.48 $1,6 White Sucker 11,893 $.1 $1, $.1 $14 12,825 $.1 $1,316 Yellow Perch 86,165 $2.61 $225,67 41,95 $1.82 $76, ,373 $2.27 $293,415 Total 335,452 $59,585 73,935 $11, ,826 $632, ) respectively. In 214, harvest declined again in both major geographic areas. In 215, harvest declined in the St. Lawrence River and increased slightly in Lake Ontario. Harvest increased significantly in both areas in 216. Major Species For major species, commercial harvest relative to issued and base quota information, including annual trends, is shown in Fig to Fig Price-per-lb trends are also shown. Species-specific price-per-lb values are means across quota zones within a major waterbody (i.e., Lake Ontario and the St. Lawrence River). Yellow Perch Yellow Perch 216 commercial harvest relative to issued and base quota by quota zone and total for all quota zones combined is shown in Fig Overall, 27% (129,373 lb) of the Yellow Perch base quota (479,464 lb) was harvested in 216 up from only 7% harvested the previous year. The highest Yellow Perch harvest came from quota zones 1-3 and 1-4. A very small proportion of base quota was harvested in most quota zones. Trends in Yellow Perch quota (base), harvest and price-per-lb are shown Fig Quota was reduced 2% in 216 in all quota zones except 1-7 where it remained the same as 215. Harvest increased in 216 in all the major quota zones (Fig ). Lake Whitefish Lake Whitefish 216 commercial harvest relative to issued and base quota by quota zone and total for all quota zones combined is shown in Fig Overall, 71% (95,552 lb) of the Lake Whitefish base quota was harvested in 216. Most of the Lake Whitefish harvest came from quota zone 1-2. Lake Whitefish is managed as one population across quota zones. Therefore, quota can be transferred among quota zones. Issued quota and harvest was significantly higher than base quota in quota zone 1-2 (Fig ). Relatively small proportions of base quota were harvested in quota zones 1-1, 1-3 and 1-4. Trends in Lake Whitefish quota (base), harvest and price-per-lb are shown in Fig Base quota was decreased by 1% in quota zones 1-1, 1-3, and 1-4, and increased in quota zone 1-2 by 15% plus the amount of the decrease in the Section 3. Commercial Fishery
113 15 Lake Ontario Lake Ontario Yellow Perch 26% Walleye 8% Sunfish 1% Northern Pike 7% Freshwater Drum 5% White Sucker 4% Brown Bullhead 3% White Bass 2% Other 12% Lake Whitefish 28% Total harvest: 335,452 lb Black Crappie 2% Other 5% Lake Whitefish 26% Walleye 13% Sunfish Yellow Perch 44% 8% Black Crappie 4% Other 3% Total value: $59,585 Northern Pike 1% Rock Bass 1% White Bass 1% Brown Bullhead 1% Freshwater Drum % Other 1% St. Lawrence River St. Lawrence River Bowfin 8% Brown Bullhead 21% Sunfish 4% Black Crappie 4% Northern Pike 4% Rock Bass 2% Brown Bullhead 7% Black Crappie 8% Bowfin 5% Sunfish 3% Rock Bass 1% Northern Pike 1% Yellow Perch 57% White Sucker % White Perch % Common Carp % Other % Yellow Perch 75% Other % White Perch % White Sucker % Common Carp % Other % Total harvest: 73,935 lb Total value $11,263 Northern Pike 1% Sunfish 6% East Lake and West Lake Rock Bass 7% Black Crappie 7% Yellow Perch 4% Other 5% White Perch 4% White Sucker 3% Total harvest: 29,439 lb Common Carp 2% Bowfin 2% Brown Bullhead 1% Other % Black Crappie 2% Sunfish 62% East Lake and West Lake Rock Bass Yellow Perch 4% 9% Northern Pike 2% White Perch 2% Bowfin 1% Other % Total value: $34,683 Brown Bullhead % White Sucker % Common Carp % Other % FIG Pie-charts showing breakdown of 216 commercial harvest by species (% by weight) for Lake Ontario (quota zones 1-1, 1-2, 1-3, 1-4 and 1-8), the St. Lawrence River (quota zones 1-5, 2-5 and 1-7), and for East and West Lakes combined. other three zones. These base quota adjustments reflected variation in annual harvest performance among the quota zones. In 216, an additional 2% of base quota was issued to a pool on November 1. Seasonal whitefish harvest and biological attributes (e.g., size and age structure) information are reported in Section 3.3. Lake Whitefish priceper-lb declined somewhat in 216 from peak levels the previous two years. FIG Pie-charts showing breakdown of 216 commercial harvest by species (% by landed value) for Lake Ontario (quota zones 1-1, 1-2, 1-3, 1-4 and 1-8), the St. Lawrence River (quota zones 1-5, 2-5 and 1-7), and for East and West Lakes combined. Walleye Walleye 216 commercial harvest relative to issued and base quota by quota zone and total for all quota zones combined is shown in Fig Walleye harvest increased in 216. Overall, 52% (25,377 lb) of the Walleye base quota (48,893 lb) was harvested. The highest Walleye harvest came from quota zone 1-4. Very small proportions of base quota were harvested in quota zones 1-1 and 1-2. Walleye (like Lake Section 3. Commercial Fishery
114 16 1,6, Lake Ontario $1,6, 1,4, 1,2, Harvest Value $1,4, $1,2, Harvest (lb) 1,, 8, 6, 4, 2, $1,, $8, $6, $4, $2, Value ($) $ FIG Total commercial fishery harvest and value for Lake Ontario (Quota Zones 1-1, 1-2, 1-3,1-4 and 1-8) , St. Lawrence River $5, Harvest (lb) 45, 4, 35, 3, 25, 2, 15, 1, 5, - Harvest Value $45, $4, $35, $3, $25, $2, $15, $1, $5, $ Value ($) FIG Total commercial fishery harvest and value for the St. Lawrence River (Quota Zones 1-5, 2-5 and 1-7), Whitefish) is managed as one fish population across quota zones. Therefore, quota can be transferred among quota zones 1-1, 1-2 and 1-4. In 216, this resulted in issued quota and harvest being considerably higher than base quota in quota zone 1-4 (Fig ). Trends in Walleye quota (base), harvest and price-per-lb are shown in Fig Quota has remained constant since the early 2s (just under 5, lb for all quota zones combined). Walleye price-per-lb has been trending higher for the last number of years. Black Crappie Black Crappie 216 commercial harvest relative to issued and base quota by quota zone Section 3. Commercial Fishery
115 17 Harvest/Quota (lb) 6, 5, 4, 3, 2, 1, Yellow Perch 129,373 Total 27% 39% Harvest/Quota (lb) 14, 12, 1, 8, 6, 4, 2, Yellow Perch Base Quota Issued Quota Harvest East Lake West Lake Lake Ontario St. Lawrence River Inland Lakes FIG Yellow Perch commercial harvest relative to issued and base quota (total for all quota zones combined; left panel) and by quota zone (right panel), , Quota Zone 1-2 Yellow Perch 3. 8, Quota Zone 1-5 Yellow Perch 3. Quota or Harvest (lb) 18, 16, 14, 12, 1, 8, 6, 4, 2, Price per lb ($) Quota or Harvest (lb) 7, 6, 5, 4, 3, 2, 1, Price per lb ($) Harvest Quota Price-per-lb Harvest Quota Price-per-lb 12, Quota Zone 1-3 Yellow Perch 3. 12, Quota Zone 2-5 Yellow Perch 3. Quota or Harvest (lb) 1, 8, 6, 4, 2, Price per lb ($) Quota or Harvest (lb) 1, 8, 6, 4, 2, Price per lb ($) Harvest Quota Price-per-lb Harvest Quota Price-per-lb 14, Quota Zone 1-4 Yellow Perch 3. 3, Quota Zone 1-7 Yellow Perch 3. Quota or Harvest (lb) 12, 1, 8, 6, 4, 2, Price per lb ($) Quota or Harvest (lb) 25, 2, 15, 1, 5, Price per lb ($) Harvest Quota Price-per-lb Harvest Quota Price-per-lb FIG Commercial base quota, harvest and price-per-lb for Yellow Perch in Quota Zones 1-2, 1-3, 1-4, 1-5, 2-5 and 1-7, Section 3. Commercial Fishery
116 18 Harvest/Quota (lb) 18, 16, 14, 12, 1, 8, 6, 4, 2, Lake Whitefish 95,552 Total 71% 58% Harvest/Quota (lb) 16, 14, 12, 1, 8, 6, 4, 2, Lake Whitefish Base Quota = 97,745 lb Base Quota Issued Quota Harvest East Lake West Lake Lake Ontario St. Lawrence River Inland Lakes FIG Lake Whitefish commercial harvest relative to issued and base quota (total for all quota zones combined; left panel) and by quota zone (right panel), 216. Quota or Harvest (lb) Quota Zone 1-1 Lake Whitefish 45, 4, 35, 3, 25, 2, 15, 1, 5, Price per lb ($) Quota or Harvest (lb) Quota Zone 1-3 Lake Whitefish 12, 1, 8, 6, 4, 2, Price per lb ($) Harvest Quota Price-per-lb Harvest Quota Price-per-lb 5, Quota Zone 1-2 Lake Whitefish 2. 14, Quota Zone 1-4 Lake Whitefish 2. Quota or Harvest (lb) 45, 4, 35, 3, 25, 2, 15, 1, 5, Price per lb ($) Quota or Harvest (lb) 12, 1, 8, 6, 4, 2, Price per lb ($) Harvest Quota Price-per-lb Harvest Quota Price-per-lb FIG Commercial base quota, harvest and price-per-lb for Lake Whitefish in Quota Zones 1-1, 1-2, 1-3 and 1-4, and total for all quota zones combined is shown in Fig Overall, only 14% (1,973 lb) of the Black Crappie base quota (76,114) was harvested in 216. The highest Black Crappie harvest came from quota zones 1-3, West Lake, and 1-5. Only a very small proportion of base quota was harvested in other quota zones. Trends in Black Crappie quota (base), harvest and price-per-lb are shown in Fig Black Crappie price-per-lb is currently high. Sunfish Sunfish 216 commercial harvest relative to issued and base quota by quota zone and total for all quota zones combined is shown in Fig Only quota zones 1-1 (embayment areas only), East Lake and West Lake have quotas for Sunfish; quota is unlimited in the other zones. Most Sunfish harvest comes from quota zone 1-3, East Lake and West Lake. Section 3. Commercial Fishery
117 19 Harvest/Quota (lb) 6, 5, 4, 3, 2, 1, Walleye 25,377 Total 52% Harvest/Quota (lb) 4, 35, 3, 25, 2, 15, 1, 5, Walleye Base Quota = 9452 lb Base Quota Issued Quota Harvest East Lake West Lake Lake Ontario St. Lawrence River Inland Lakes FIG Walleye commercial harvest relative to issued and base quota (total for all quota zones combined; left panel) and by quota zone (right panel), , Quota Zone 1-1 Walleye 3. 3, Quota Zone 1-4 Walleye 3. Quota or Harvest (lb) 7, 6, 5, 4, 3, 2, 1, Price per lb ($) Quota or Harvest (lb) 25, 2, 15, 1, 5, Price per lb ($) Harvest Quota Price-per-lb Harvest Quota Price-per-lb 7, Quota Zone 1-2 Walleye 3. Quota or Harvest (lb) 6, 5, 4, 3, 2, 1, FIG Commercial base quota, harvest and price-per-lb for Walleye in Quota Zones 1-1, 1-2 and 1-4, Trends in Sunfish quota (base), harvest and price-per-lb are shown in Fig In 216, harvest increased in quota zone 1-3. Sunfish price -per-lb is currently high. Brown Bullhead Harvest Quota Price-per-lb Brown Bullhead 216 commercial harvest relative to issued and base quota by quota zone and total for all quota zones combined is shown in Price per lb ($) Fig Quota was removed in quota zones 1-1, East Lake and West Lake in 216 and is now unlimited in all zones. Highest Brown Bullhead harvest came from quota zone 1-7. Trends in Brown Bullhead quota (base), harvest and price-per-lb are shown in Fig With the exception of quota zone 1-7, current harvest levels are extremely low relative to past levels. Northern Pike Northern Pike 216 commercial harvest by quota zone is shown in Fig Highest pike harvest came from quota zone 1-3. Trends in Northern Pike harvest and priceper-lb are shown in Fig In 216, harvest increased in all quota zones except 1-4 and 1-5. Section 3. Commercial Fishery
118 11 Harvest/Quota (lb) 8, 7, 6, 5, 4, 3, 2, 1, Black Crappie 1,973 Total 14% 21% Harvest/Quota (lb) 2, 18, 16, 14, 12, 1, 8, 6, 4, 2, Black Crappie Base Quota Issued Quota Harvest East Lake West Lake Lake Ontario St. Lawrence River Inland Lakes FIG Black Crappie commercial harvest relative to issued and base quota (total for all quota zones combined; left panel) and by quota zone (right panel), 216. Quota or Harvest (lb) Quota Zone 1-1 Black Crappie 5, 4,5 4, 3,5 3, 2,5 2, 1,5 1, Price per lb ($) Quota or Harvest (lb) Quota Zone 2-5 Black Crappie 3, 25, 2, 15, 1, 5, Price per lb ($) Harvest Quota Price-per-lb Harvest Quota Price-per-lb 18, Quota Zone 1-3 Black Crappie 4. 7, Quota Zone 1-7 Black Crappie 3. Quota or Harvest (lb) 16, 14, 12, 1, 8, 6, 4, 2, Price per lb ($) Quota or Harvest (lb) 6, 5, 4, 3, 2, 1, Price per lb ($) Harvest Quota Price-per-lb Harvest Quota Price-per-lb 35, Quota Zone 1-5 Black Crappie 3. 12, Quota Zone West Lake Black Crappie 4. Quota or Harvest (lb) 3, 25, 2, 15, 1, 5, Price per lb ($) Quota or Harvest (lb) 1, 8, 6, 4, 2, Price per lb ($) Harvest Quota Price-per-lb Harvest Quota Price-per-lb FIG Commercial base quota, harvest and price-per-lb for Black Crappie in Quota Zones 1-1, 1-3, 1-5, 2-5, 1-7 and West Lake, Section 3. Commercial Fishery
119 111 Harvest/Quota (lb) 35, 3, 25, 2, 15, 1, 5, Sunfish Base Quota Issued Quota Harvest East Lake West Lake Lake Ontario St. Lawrence River Inland Lakes FIG Sunfish commercial harvest relative to issued and base quota for quota zones 1-1, East Lake and West Lake, 216. The remaining quota zones have unlimited quota. 3, Quota Zone 1-1 Sunfish , Quota Zone 2-5 Sunfish 1.6 Quota or Harvest (lb) 25, 2, 15, 1, 5, Price per lb ($) Harvest (lb) 3, 25, 2, 15, 1, 5, Price per lb ($) Harvest Quota Price-per-lb Harvest Price-per-lb Harvest (lb) Quota Zone 1-3 Sunfish 1, 9, 8, 7, 6, 5, 4, 3, 2, 1, Harvest Price-per-lb Price per lb ($) Harvest (lb) Quota Zone 1-7 Sunfish 3, 25, 2, 15, 1, 5, Harvest Price-per-lb Price per lb ($) Harvest (lb) Quota Zone 1-4 Sunfish 2, 1,8 1,6 1,4 1,2 1, Harvest Price-per-lb Price per lb ($) Quota or Harvest (lb) East Lake Sunfish 18, 16, 14, 12, 1, 8, 6, 4, 2, Harvest Quota Price-per-lb Price per lb ($) 8, Quota Zone 1-5 Sunfish , West Lake Sunfish 1.4 Harvest (lb) 7, 6, 5, 4, 3, 2, 1, Harvest Price-per-lb Price per lb ($) Quota or Harvest (lb) 2, 15, 1, 5, Harvest Quota Price-per-lb Price per lb ($) FIG Commercial base quota, harvest and price-per-lb for Sunfish in Quota Zones 1-1, 1-3, 1-4, 1-5, 2-5 and 1-7, East Lake and West Lake, Section 3. Commercial Fishery
120 112 16, Brown Bullhead Harvest/Quota (lb) 14, 12, 1, 8, 6, 4, 2, East Lake West Lake Lake Ontario St. Lawrence River Inland Lakes FIG Brown Bullhead commercial harvest relative to issued and base quota for quota zones 1-1, East Lake and West Lake, 216. The remaining quota zones have unlimited quota. Quota or Harvest (lb) Quota Zone 1-1 Brown Bullhead 4, 3, 2, 1, Price per lb ($) Harvest (lb) Quota Zone 2-5 Brown Bullhead 45, 4, 35, 3, 25, 2, 15, 1, 5, Price per lb ($) Harvest Quota Price-per-lb Harvest Price-per-lb Harvest (lb) Quota Zone 1-3 Brown Bullhead 18, 16, 14, 12, 1, 8, 6, 4, 2, Price per lb ($) Quota or Harvest (lb) Quota Zone 1-7 Brown Bullhead 9, 8, 7, 6, 5, 4, 3, 2, 1, Price per lb ($) Harvest Price-per-lb Harvest Quota Price-per-lb Harvest (lb) Quota Zone 1-4 Brown Bullhead 1, 9, 8, 7, 6, 5, 4, 3, 2, 1, Price per lb ($) Quota or Harvest (lb) East Lake Brown Bullhead 16, 14, 12, 1, 8, 6, 4, 2, Price per lb ($) Harvest Price-per-lb Harvest Quota Price-per-lb Harvest (lb) Quota Zone 1-5 Brown Bullhead 6, 5, 4, 3, 2, 1, Price per lb ($) Quota or Harvest (lb) West Lake Brown Bullhead 3, 25, 2, 15, 1, 5, Price per lb ($) Harvest Price-per-lb Harvest Quota Price-per-lb FIG Commercial base quota, harvest and price-per-lb for Brown Bullhead in Quota Zones 1-1, 1-3, 1-4, 1-5, 2-5 and 1-7, East Lake and West Lake, Section 3. Commercial Fishery
121 113 Harvest (lb) 18, 16, 14, 12, 1, 8, 6, 4, 2, Northern Pike Base Quota Issued Quota Harvest East Lake West Lake Lake Ontario St. Lawrence River Inland Lakes FIG Northern Pike commercial harvest by quota zone, 216. In quota zones 2-5 and 1-7 no harvest is permitted; all other zones have unlimited quota. 8, Quota Zone 1-1 Northern Pike.35 14, Quota Zone 1-5 Northern Pike.4 Quota or Harvest (lb) 7, 6, 5, 4, 3, 2, 1, Price per lb ($) Quota or Harvest (lb) 12, 1, 8, 6, 4, 2, Price per lb ($) Harvest Price-per-lb Harvest Quota Price-per-lb 4, Quota Zone 1-2 Northern Pike.35 3, East Lake Northern Pike.35 Quota or Harvest (lb) 3,5 3, 2,5 2, 1,5 1, Price per lb ($) Quota or Harvest (lb) 2,5 2, 1,5 1, Price per lb ($) Harvest Price-per-lb Harvest Quota Price-per-lb 3, Quota Zone 1-3 Northern Pike.35 8, West Lake Northern Pike.35 Quota or Harvest (lb) 25, 2, 15, 1, 5, Price per lb ($) Quota or Harvest (lb) 7, 6, 5, 4, 3, 2, 1, Price per lb ($) Harvest Price-per-lb Harvest Quota Price-per-lb Quota or Harvest (lb) Quota Zone 1-4 Northern Pike 5, 4,5 4, 3,5 3, 2,5 2, 1,5 1, Price per lb ($) Harvest Price-per-lb FIG Commercial base quota, harvest and price-per-lb for Northern Pike in Quota Zones 1-1, 1-2, 1-3, 1-4, and 1-5, East Lake and West Lake, Section 3. Commercial Fishery
122 Lake Whitefish Commercial Catch Sampling J. A. Hoyle, Lake Ontario Management Unit Sampling of commercially harvested Lake Whitefish for biological information occurs annually. While total Lake Whitefish harvest can be determined from commercial fish Daily Catch Reports (DCRs; see Section 3.2), biological sampling of the catch is necessary to breakdown total harvest into size and age-specific harvest. Age-specific harvest data can then be used in catch-age modeling to estimate population size and mortality schedule. Commercial Lake Whitefish harvest and fishing effort by gear type, month and quota zone for 216 is reported in Table Most of the harvest was taken in gill nets, 96% by weight; 4% of the harvest was taken in impoundment gear. Ninety-five percent of the gill net harvest occurred in quota zone 1-2. Forty-six percent of the gill net harvest in quota zone 1-2 was taken in November. In quota zone 1-3 most impoundment gear harvest and effort occurred in October (Table 3.3.1). Cumulative daily commercial Lake Whitefish harvest relative to quota milestones is shown in Fig About 47, lbs were harvested before November 1, the date on which an additional 2% of base quota was issued to the pool. Biological sampling focused on the November spawning-time gill net fishery on the south shore of Prince Edward County (quota zone 1-2), and the October/November spawning-time impoundment gear fishery in the Bay of Quinte (quota zone 1-3). The Lake Whitefish sampling design involves obtaining large numbers of length tally measurements and a smaller length-stratified sub-sample for more detailed biological sampling for the lake (quota zone 1-2) and bay (quota zone 1-3) spawning stocks. Whitefish length and age distribution information is presented in (Fig and Fig ). In total, fork length was measured for 2,476 fish and age was interpreted using otoliths for 263 fish (Table 3.3.2, Fig TABLE Lake Whitefish harvest (lbs) and fishing effort (yards of gill net or number of impoundment nets) by gear type, month and quota zone. Harvest and effort value in bold italic represent months and quota zones where whitefish biological samples were collected. Harvest (lbs) Effort (number of yards or nets) Gear type Month Gill net Jan 128 1, Feb Mar ,2 1,4 Apr 293 3,2 May 2, , 48 Jun 8,291 24,13 Jul 17,189 44,52 Aug 7,514 24,76 Sep 6,871 26,8 Oct 3,951 8, Nov , , 31,3 28 Dec ,3 1,28 Impoundment Mar Apr 3 12 May Jun 5 2 Sep 7 4 Oct Nov 4, Section 3. Commercial Fishery
123 115 16, Lake Whitefish Harvest (lb) Issued quota 163,392 lb 14, Base quota 135,91 lb 12, Harvest (lb) 1, 8, 6, Total harvest 95,552 lb 4, 2, TABLE Age-specific vital statistics of Lake Whitefish sampled and harvested including number aged, number measured for length, and proportion by number of fish sampled, harvest by number and weight (kg), and mean weight (kg) and fork length (mm) of the harvest for quota zones 1-2 and 1-3, 216. Age (years) Number aged - 1-Jan 1-Feb 1-Mar 1-Apr 1-May 1-Jun 1-Jul 1-Aug 1-Sep 1-Oct 1-Nov 1-Dec FIG Cumulative daily commercial Lake Whitefish harvest (216) relative to quota milestones. Quota zone 1-2 (Lake stock) Quota zone 1-3 (Bay stock) Sampled Harvested Sampled Harvested Mean Mean Number Weight weight length Age Number Number Weight lengthed Proportion Number (kg) (kg) (mm) (years) aged lengthed Proportion Number (kg) ,861 5, ,65 5, ,221 2, ,81 2, ,569 12, ,897 4, ,558 3, ,92 1, Mean weight (kg) Total 135 1, ,8 41,6 Total ,936 1,96 Weighted Weighted mean mean.984 Mean length (mm) Section 3. Commercial Fishery
124 116 Proportion of harvest Proportion of harvest Fork length (mm) FIG Size and age distribution (by number) of Lake Whitefish sampled in quota zone 1-2 during the 216 commercial catch sampling program. and 3.3.3). Quota Zone 1-2 (Lake Stock) Mean fork length =479 mm (n = 1567) Quota Zone 1-2 (Lake Stock) Mean age = 9.1 years (n = 11) Age (years) Lake Ontario Gill Net Fishery (quota zone 1-2) The mean fork length and age of Lake Whitefish harvested during the gill net fishery in quota zone 1-2 were 479 mm and 9.1 years respectively (Fig ). Fish ranged from ages 4-23 years. The most abundant age-classes in the fishery were aged 6-11 years which together comprised 83% of the harvest by number (8% by weight). Bay of Quinte November Impoundment Gear Fishery (quota zone 1-3) Mean fork length and age were 446 mm and 8.9 years, respectively (Fig ). Fish ranged from ages 2-25 years. The most abundant age-classes in the fishery were aged 5-11 years which together comprised 81% of the harvest by number (74% by weight). FIG Size and age distribution (by number) of Lake Whitefish sampled in quota zone 1-3 during the 216 commercial catch sampling program. Condition Lake Whitefish (Bay of Quinte and Lake Ontario spawning stocks; sexes combined) relative weight (see Rennie et al. 28) is shown in Fig Condition declined markedly in 1994 and remained low but stable. Relative weight (%) Proportion of harvest Proportion of harvest Fork length (mm) Quota Zone 1-3 (Bay Stock) Mean fork length =446 mm (n = 99) Quota Zone 1-3 (Bay Stock) Body Condition Mean age = 8.9 years (n = 162) Age (years) Bay Stock Lake Stock FIG Lake Whitefish (Lake Ontario and Bay of Quinte spawning stocks and sexes combined) relative weight (see 1 Rennie et al. 28), Rennie, M.D. and R. Verdon. 28. Development and evaluation of condition indices for the Lake Whitefish. N. Amer. J. Fish. Manage. 28: Section 3. Commercial Fishery
125 Age and Growth Summary S. Kranzl and J. A. Hoyle, Lake Ontario Management Unit Biological sampling of fish from Lake Ontario Management Unit field projects routinely involves collecting and archiving structures used for such purposes as age interpretation and validation, origin determination (e.g. stocked versus wild), life history characteristics and other features of fish growth. Coded wire tags, embedded in the nose of fish prior to stocking, are sometimes employed to uniquely identify individual fish (e.g., to determine stocking location and year, when recovered). In 216, a total of 2,87 structures were processed from 11 different field projects (Table 4.1) and interpreted from 14 different fish species (Table 4.2) TABLE 4.1. Project-specific summary of age and growth structures interpreted for age (n=2,87) in support of 11 different Lake Ontario Management Unit field projects, 216 (CWT, Code Wire Tags). Project Species Structure n Ganaraska Rainbow Trout Assessment Rainbow Trout Scales 121 Lake Ontario and Bay of Quinte Community Index Gillnetting Northern Pike Cleithra 16 Walleye Otoliths 47 Lake Whitefish Otoliths 46 Lake Trout Otoliths 53 Chinook CWT 39 Lake Trout CWT 137 Lake Ontario and Bay of Quinte Community Index Trawling Walleye Otoliths 68 Walleye Scales 128 Cisco Otoliths 9 Community Index Netting continued Northern Pike Cleithra 12 White Bass Scales 11 Pumpkinseed Scales 15 Bluegill Scales 29 Smallmouth Bass Scales 2 Largemouth Bass Scales 4 Black Crappie Scales 13 Yellow Perch Scales 13 Walleye Otoliths 31 Upper Bay of Quinte Nearshore Community Index Netting Northern Pike Cleithra 18 Pumpkinseed Scales 31 Bluegill Scales 32 Smallmouth Bass Scales 6 Largemouth Bass Scales 35 Black Crappie Scales 32 Yellow Perch Scales 32 Walleye Otoliths 3 continued Toronto Nearshore Community Index Netting Lake St. Francis Western Lake Ontario Creel Northern Pike Cleithra 31 Pumpkinseed Scales 3 Bluegill Scales 13 Smallmouth Bass Scales 4 Largemouth Bass Scales 3 Black Crappie Scales 4 Yellow Perch Scales 29 Northern Pike Cleithra 5 Smallmouth Bass Scales 1 Yellow Perch Scales 14 Walleye Otoliths 17 Chinook Salmon Otoliths 137 Credit River Chinook Assessment and Egg Collection Chinook Salmon Otoliths 2 Ganaraska Chinook Assessment and Egg Collection Chinook Salmon Otoliths 7 Commercial Catch Sampling Lake Whitefish Otoliths 267 Total 2,87 Section 4. Age and Growth Summary
126 118 TABLE 4.2. Species-specific summery of age and growth structures interpreted for age (n=2,87) in 216. Structure Species Scales Otoliths Cleithra Code Wire Tags Total Black Crappie Bluegill Chinook Salmon Lake Trout Lake Whitefish Cisco 9 9 Largemouth Bass Northern Pike Pumpkinseed Rainbow Trout Smallmouth Bass Walleye White Bass Yellow Perch Total 737 1, ,87 Section 4. Age and Growth Summary
 cooperates annually with several agencies to collect fish samples for contaminant testing.")
127 Contaminant Monitoring S. Kranzl and J. A. Hoyle, Lake Ontario Management Unit Lake Ontario Management Unit (LOMU) cooperates annually with several agencies to collect fish samples for contaminant testing. In 216, 293 contaminant samples were collected for Ontario s Ministry of the Environment and Climate Change (MOECC) Guide to Eating Ontario Fish program (Table 5.1). Samples were primarily collected using existing fisheries assessment programs on Lake Ontario, Bay of Quinte and the St. Lawrence. Fig. 5.1 is a map showing locations ( Blocks ) for contaminant sample collections. A summary of the number of fish samples collected by species, for contaminant analysis by the MOECC from 2 to 216 is shown in Table Hamilton Harbour harbour area 4. Toronto Offshore Area open water from east of Clarkson Harbour to Scarborough Bluffs 4a. Toronto Waterfront Area nearshore area from the west side of Humber Bay Park to the east side of Ashbridges Bay Park (including Toronto Islands) 6. Northwestern Lake Ontario from east of Scarborough Bluffs to Colborne 8. Northeastern Lake Ontario from east of Colborne to south of the area from Main Duck Island across to Point Traverse 15. Lake St. Francis St. Lawrence River from downstream of the Moses Saunders Dam to Quebec border TABLE 5.1. Number of fish samples provided to MOECC for contaminant analysis, by region and species, 216. Region Block Species Total Hamilton Harbour 3 Walleye 3 Northern Pike 8 Smallmouth Bass 2 White Perch 4 Common Carp 1 Toronto Offshore 4 Lake Trout 1 White Sucker 2 Toronto Waterfront 4a Gizzard Shad 6 Northern Pike 1 Yellow Perch 9 White Sucker 8 Pumpkinseed 9 Smallmouth Bass 4 Freshwater Drum 1 Northwest Lake Ontario 6 Lake Trout 8 (Cobourg) White Sucker 1 Gizzard Shad 1 Walleye 2 Northeast Lake Ontario 8 Lake Whitefish 8 (Rocky Point, Wellington, Walleye 1 Brighton) Yellow Perch 1 White Sucker 1 Common Carp 4 Lake Trout 1 Northern Pike 2 Smallmouth Bass 1 Freshwater Drum 1 Lake St. Francis 15 Smallmouth Bass 9 Walleye 14 Yellow Perch 2 Northern Pike 4 Rock Bass 2 Pumpkinseed 6 Freshwater Drum 1 Largemouth Bass 2 Total 293 FIG Map showing locations ( Blocks ) for contaminant sample collections. Section 5. Contaminant Monitoring
128 12 TABLE 5.2. Summary of the number of fish samples collected, by species, for contaminant analysis by the MOECC, Year Species Black Crappie Bluegill Brown Bullhead Brown Trout Channel Catfish Chinook Salmon Coho Salmon 1 3 Common Carp 7 14 Freshwater Drum Gizzard Shad 7 Lake Herring 18 Lake Trout Lake Whitefish Largemouth Bass Northern Pike Pumpkinseed Rainbow Smelt 3 Rainbow Trout Rock Bass Silver Redhorse 1 Smallmouth Bass Walleye White Bass 2 White Perch White Sucker Yellow Perch Total Section 5. Contaminant Monitoring
. Fig. 6.1.2 shows stocking trends in the Ontario waters of Lake Ontario from 1968 to 216. Table 6.1.2 provides detailed information on fish stocking for 216.")
129 Stocking Program 6.1 Stocking Summary C. Lake, Lake Ontario Management Unit In 216, OMNRF stocked approximately 2.3 million salmon and trout into Lake Ontario (Table 6.1.1; Fig ). This number of fish equaled approximately 42,6 kilograms of biomass added to the Lake (Fig ). Fig shows stocking trends in the Ontario waters of Lake Ontario from 1968 to 216. Table provides detailed information on fish stocking for 216. Approximately 533, Chinook Salmon spring fingerlings were stocked at various locations to provide put-grow-and-take fishing opportunities. NYSDEC stocked an additional 6, Chinook in the Niagara River to compensate for an unforeseen production shortfall in Ontario. These fish are not reported here, so the total number stocked for 216 appears slightly lower than normal. All Chinook Salmon for the Lake Ontario program were produced at Normandale Fish Culture Station. About 225, (42% of total stocking) Chinook Salmon were held in pens at eight sites in Lake Ontario for a short period of time prior to stocking. This ongoing project is being done in partnership with local angler and community groups. It is hoped that pen-imprinting will help improve returns of mature adults to these areas in the fall, thereby enhancing local near shore and tributary fishing opportunities. See section 6.2 for a detailed report of the 216 net pen program. Atlantic Salmon were stocked in support of an ongoing program to restore self-sustaining populations of this native species to the Lake TABLE Fish stocked into the Ontario waters of Lake Ontario for 216, and targets for 217. FIG Top panel: number of fish stocked into the Ontario waters of Lake Ontario (excluding fry and eggs in 216. Total = 2,315,687. Bottom panel: biomass of fish stocked into the Ontario waters of Lake Ontario (excluding fry and eggs in 216. Total = 43,552 kg. Section 6. Stocking Program

130 122 FIG Trends in salmon and trout stocking in Ontario waters of Lake Ontario, Section 6. Stocking Program
131 123 Ontario basin (Section 8.2). Approximately 417, Atlantic Salmon of various life stages were stocked in 216 into various tributaries including: Credit River, Duffins Creek and Cobourg Brook. New for 216, the Ganaraska River was also stocked with advanced life stages (spring yearlings and older), with the goal of establishing a fishery. OMNRF is working cooperatively with the Ontario Federation of Anglers and Hunters and a network of other partners to plan and deliver this phase of Atlantic Salmon restoration, including setting stocking targets to help meet program objectives. Atlantic Salmon are produced at both OMNRF and partner facilities. Three Atlantic Salmon brood stocks from different source populations in Nova Scotia, Quebec and Maine are currently housed at OMNRF s Harwood and Normandale Fish Culture Stations. All fish have been genotyped to facilitate follow-up assessment on stocked fish and their progeny in the wild. Over 5, Lake Trout spring yearlings were stocked in the spring of 216 as part of an established, long-term rehabilitation program, supporting of the Lake Trout Stocking Plan (Section 8.5). Three strains, originating from Seneca Lake, Slate Islands and Michipicoten Island are stocked as part of our annual target. An additional number of Lake Trout (173,) were stocked in the fall of 216 as fall fingerlings. This was done in order to meet new Lake Trout stocking targets in 217 more quickly. Approximately 16, Bloater were stocked in 216. This small relative of the Lake Whitefish was an important prey item for Lake Trout until the late 195 s when both species were extirpated. A coordinated program involving staff from the US and Canada resulted in the initial stocking of approximately 15, Bloater being stocked in 213. MNRF Fish Culture Section staff continue to work with our partner agencies to advance our understanding of the complicated process of rearing Bloater. See section 8.4 for a detailed description of this restoration effort. Rainbow Trout (143,) and Brown Trout (218,) were stocked at various locations to support shore and boat fisheries. Community hatcheries contribute to the stocking of both of these species see Table for details. Coho Salmon were produced by stocking partner Metro East Anglers (approximately 5, fall fingerlings). Coho Salmon and Rainbow Trout were also produced by the Credit River Angler s Association, but data were not submitted to MNRF. Walleye were once again stocked into Hamilton Harbour in an effort to establish native, predatory fish to help in the recovery of the fish community, which is currently dominated by Channel Catfish and Brown Bullhead. Approximately 168, Walleye fry were stocked in the spring of 216, followed by over 115, fry stocked in July. OMNR remains committed to providing diverse fisheries in Lake Ontario and its tributaries, based on wild and stocked fish, as appropriate. Detailed information about OMNRF s 216 stocking activities is found in Table Section 6. Stocking Program
132 124 Continued on next page Section 6. Stocking Program
133 125 Continued on next page Section 6. Stocking Program
134 126 Continued on next page Section 6. Stocking Program
135 127 Section 6. Stocking Program

136 Chinook Salmon Net Pen Imprinting Project C. Lake, Lake Ontario Management Unit The net pen is a floating enclosure that is tied to a pier or other nearshore structure, and is used to temporarily house and acclimatize young Chinook Salmon prior to their release. The fish are held in the net pens for approximately 4-5 weeks, and are managed by local angler groups, who monitor the health of the fish and ensure the fish are fed and the pens are cleaned regularly. Several of the clubs also use the net pens as an outreach tool, involving their local community during delivery and/or release of the fish. Compared to fish released directly from the hatchery, net pen fish are larger, survive better and may have a greater degree of site fidelity, or imprinting, to the stocking site based on marking experiments conducted by the New York Department of Environmental Conservation (NYSDEC). As a result of their time in the net pens as young fish, it is hoped that mature fish will return to the area and provide a quality near shore fall fishery for anglers. Net pens were first used in the Ontario waters of Lake Ontario in 23, when pens were installed in Barcovan and Wellington. Beginning in 28, the program expanded west across a number of locations. The program has evolved over the years, with some sites dropped while other sites have been added or expanded. A thorough review of the history of the program was described in the 214 Annual Report. 216 Net Pen Program A total of 224,933 Chinook Salmon were held at 8 sites (17 net pens) in 216. This represents 42% of the total number stocked (533,123; Fig a). Overall, fish growth and health was reported as good, with few mortalities. Fish were delivered to the pens at 3.8g and weighed 9.45g when released 33 days later (average values across all pen sites). Table shows site-specific details on fish size, duration of penning, and numbers released. Combination temperature/dissolved oxygen data loggers were deployed into one net pen per site so that the health and growth of the fish can be better understood. Degree days, a metric that incorporates site temperature and length of time in the pen, was calculated and included in Table Examining degree days helps make between-site comparisons easier when looking at fish growth. The net pen program has increased considerably over the years, with more net pen a) b) FIG a) Number of Chinook Salmon released (23-216) from net pens versus those stocked traditionally (Ontario data only; New York data not shown); b) Average density (g/l) of Chinook Salmon held per net pen. The guideline of 32 g/l is represented by the dashed line. Section 6. Stocking Program
 is used as a guide.")
137 129 sites and a greater percentage of Chinook Salmon allocated to the program. In order to ensure good fish health and growth, a maximum density of 32 g/l (grams of fish per liter of water) is used as a guide. The volume of the standard net pen is 4 liters, so the maximum number of 8. g fish that should be held in an individual net pen is 16,. The Ontario program has taken a conservative approach, generally stocking a maximum of 15, fish in a pen. Fig.6.2.1b shows the average density of fish (at time of release) in the net pens, with the guideline (32 g/l) denoted by the horizontal dotted line. The average net pen density has been below the guideline every year, but has increased in recent years. TABLE Summary data of the 216 Chinook Salmon net pen program. Section 6. Stocking Program
138 13 7. Stock Status 7.1 Chinook Salmon M. J. Yuille and J. P. Holden, Lake Ontario Management Unit Chinook salmon were stocked in Lake Ontario beginning in 1968 to suppress an overabundant Alewife population, provide a recreational fishery and restore predator-prey balance to the fish community. At present Chinook Salmon are the most sought after species in the main basin recreational fishery, which is supported by a mix of stocked and naturalized fish. Salmon returning to rivers to spawn also support important shore and tributary fisheries. In 216, Chinook Salmon represented 12% of the total number of fish stocked and 6% of total biomass stocked into Lake Ontario by MNRF (Section 6.1). Ontario s Chinook Salmon stocking levels have remained relatively constant since 1985 (5, fish target) (Fig ), however cuts to NY stocking rates were agreed upon during lake wide cuts in Despite recent stable stocking levels, Chinook Salmon CUE in the Fish Community Index Gill Netting has been variable, but 216 showed an increase relative to 215 (Fig.7.1.2). CUE in 216 gill nets marks the first increase in Chinook Salmon catches since 211 (Fig.7.1.2). Chinook Salmon mark and tag monitoring data were reported from five Lake Ontario Management Unit (LOMU) surveys: i) Western Lake Ontario Boat Angling Survey (Section 2.2), ii) Chinook Salmon Angling Tournament and Derby Sampling, iii) Lake Ontario Volunteer Angler Diary Program (Section 2.3), iv) Eastern Lake Ontario and Bay of Quinte Fish Community Index Gill Netting (Section 1.2) and v) Credit River Chinook Salmon Spawning Index (Section 1.7). Gill nets caught small Chinook Salmon and complement the angler programs that caught larger fish (Fig ). 216 officially marks the end of the Chinook Salmon CWT study. In general, the maximum age of a Lake Ontario Chinook Salmon is 4 years. The last stocking event related to the Mark and Tag program was in 211, thus all fish associated with this program left the Lake Ontario ecosystem in the fall of 215. New York State Department of Environmental Conservation (NYSDEC) will be collaborating with the Lake Ontario Management Unit in writing a final report on the Chinook Salmon CWT study in the near future. Currently, NYSDEC has been stocking Chinook and Coho Fish Stocked (X 1) NYSDEC OMNRF FIG Number of Chinook Salmon stocked by New York State Department of Environmental Conservation (NYSDEC) and MNRF from (Section 6.1). CUE YEAR FIG Number of Chinook Salmon caught per gill net (CUE) from the Fish Community Index Gill Netting Program (see Section 1.2) from Section 7. Stock Status
139 131 Salmon with adipose clips and CWTs to assess the effectiveness of net pen stocking. Anglers that observed fish with an adipose fin clip in 216 were likely catching fish associated with this NYSDEC program. Note that Coho Salmon stocked by MNRF, via Metro East Anglers, also have adipose clips but do not have CWTs. CWTs collected from the Chinook Salmon Mark and Tag program from 29 to 215 showed a mixed population of Chinook Salmon (natural vs. stocked and New York vs. Ontario fish) originating from geographically widespread stocking locations. The mark and tag monitoring program confirmed that Chinook Salmon returns to the Credit River tend to originate from fish stocked in the Credit River with a few strays from Bronte Creek stocking locations. Catch per unit effort (CUE), total catch and total harvest is assessed by the Western Lake Ontario Boat Fishery (Section 2.2). In 216, total effort increased slightly from 213 (Fig ) and total catch and harvest were 8% and 9% above the mean through 1997 to 216 (Fig ). Release rates in both the Western Lake Ontario Boat Fishery and the Lake Ontario Volunteer Angler Program (Section 2.3) have generally increased through time (Sections 2.2 and 2.3). In 216, the release rates in the Western Lake Ontario Boat Fishery declined to 5% from the 24 to 216 average of 59%. Chinook Salmon release rates reported in the Lake Ontario Volunteer Angler Program were lower in 216 (55%) compared to 215 (68%) and 214 (65%). CUE (No./Ang-hr) CUE Effort FIG Catch rate (CUE) of Chinook Salmon and annual total effort (rod-hrs) in the Ontario waters of Lake Ontario (excluding the Eastern Basin), 1977 to Effort (Rod-hr X 1,) 2 (a) Number of Fish (b) Number of Fish Fork Length (mm) FIG Size distribution (fork length in mm) of Chinook Salmon caught (a) in the Fish Community Index Gill Netting Program from (Section 1.2) and (b) by anglers in the Western Lake Ontario Angler Survey from 1995 to 216. Section 7. Stock Status
140 Credit River Spawning Index Western Basin Angler Survey Salmon Tournament Sampling 9. Weight (kg) FIG Number of Chinook Salmon caught (closed circle) and harvested (open circle) annually in the Ontario waters of Lake Ontario (excluding he Eastern Basin), 1977 to 216. Dashed line represents the mean catch and harvest from 1997 to 216. The condition of Lake Ontario Chinook Salmon has been evaluated through three separate LOMU programs: i) Credit River Chinook Salmon Spawning Assessment (Section 1.7), ii) Chinook Salmon Tournament Sampling and iii) Western Lake Ontario Angler Survey (Section 2.2). Chinook Salmon in the Credit River index have a lower condition relative to fish sampled in the lake during mid-summer when condition should be at a maximum. Chinook Salmon condition, evaluated using data from the Credit River Chinook Spawning Index Program (Section 1.7) has declined since 1989 (Fig ). In 212, Credit River Chinook Salmon condition was the lowest in the time series. Since 212, Chinook Salmon condition in the Credit River has increased. In contrast, these overall trends were not observed in either the Western Lake Ontario Boat Fishery or the tournament sampling (Fig ). Despite the decline in Chinook Salmon condition from 211 to 213 in the Western Lake Ontario Boat Fishery, the 216 condition index increased and is above the long-term 1995 to 216 average. A similar decline in condition was observed in Chinook Salmon sampled in tournaments; however the condition declines observed in the angler survey and tournament sampling are subtle relative to observations in the Credit River condition index (Fig ). The Lake Ontario Management Unit continued to sample Chinook Salmon on the Ganaraska River in 216 with the goal of diversifying Chinook Salmon egg collection sources. In contrast to the Credit River, where FIG Condition index of Chinook Salmon from Credit River Spawning Index (circle), Western Basin Angling Survey (square) and the Salmon Tournament Sampling (triangle) from Condition index is the predicted weight (based on a log-log regression) of a 9 mm total length Chinook Salmon. adult returns are predominantly stocked fish, adult Chinook Salmon returning to the Ganaraska River to spawn are naturalized. In contrast to observations in 215, the average fork length of adults returning to the Ganaraska River was lower than those returning to the Credit River. Condition of the Chinook Salmon returning to the Ganaraska River in 216 was slightly lower than 215 and remained below Chinook Salmon condition on the Credit River. In 216, average weight and length of adult Chinook Salmon returning to the Credit River declined for the third year in a row (see Section 1.7, Fig ). Despite this decline in overall size, the condition of these returning fish has either remained stable (females) or increased (males) since 212 (see Section 1.7, Fig ). Using Chinook Salmon otoliths, in-year growth was calculated by measuring the distance from the last annuli to the outer edge of the otolith. Chinook Salmon experienced exceptional in-year growth from 21 to 212, followed by a sharp decline in 213 (Fig ). In 214, Chinook Salmon growth was the second lowest in the time series, increasing from 213 levels (lowest in the time series), however it remains below the average growth from 28 (Fig ). In-year growth was determined to be correlated with summer water temperatures (Section 11.1). Mean summer temperatures for Lake Ontario were above the long-term average in 216; a sharp contrast to the 214 and 215 Section 7. Stock Status
141 133 Salmon Growth Above Average Below Year FIG Mean in-year growth determined by otolith measurements of age-2 and age-3 Chinook Salmon collected during the Credit River Spawning Index (Section 1.7). seasons, which marked the coldest mean summer water temperatures recorded since 22 (see Section 11.1). In addition, the winter of 216 was significantly less severe compared to the previous two years (see Section 11.1). While, these two factors may not be the driving force behind Chinook Salmon growth and condition and catch per unit effort in the recreational fishery, they likely have a significant contribution, as cooler temperatures are associated with lower metabolic activity and growth. Section 7. Stock Status
142 Rainbow Trout M. J. Yuille, Lake Ontario Management Unit The Lake Ontario fish community is a mix of non-native and remaining native species. Rainbow Trout, a non-native species, was intentionally introduced to Lake Ontario in 1968 and has since become naturalized (naturally reproducing fish). Rainbow Trout are the primary target for tributary anglers, who take advantage of the seasonal staging and spawning runs of this species and are the second most sought-after species in the Ontario waters of the Lake Ontario offshore salmon and trout fishery. In addition, the spring and fall spawning runs attract high numbers of tourists to local tributaries to watch these fish jump at fishways and barriers along their spawning migration. For all of these reasons, Rainbow Trout are not only ecologically important to Lake Ontario but recreationally and economically important as well. The OMNRF stocks only Ganaraska River strain Rainbow Trout into Lake Ontario. Rainbow Trout represent 6.1% of all fish stocked by number and 6.1% of the biomass into Lake Ontario by the OMNRF. In 216, 143,698 Rainbow Trout were stocked, slightly below the 27 to 216 average of 164,56 (Fig ). The spring spawning run of Rainbow Trout in the Ganaraska River has been estimated at the fishway at Port Hope since 1974 (see Section 1.1). In 216, the Rainbow Trout run in the Ganaraska River declined to 4,987 from 6,669 in 215 and remains below the previous 1 year average (7,13 fish from ; Fig ). The Lake Ontario ecosystem has changed dramatically during this time series (e.g., phosphorus abatement, dreissenid mussel invasion, round goby invasion). During this time period (1974 to 216), Rainbow Trout condition has declined (Fig a). With the exceptions of 1994 and 1996, the highest condition values occurred in the 197 s, prior to invasion of Zebra Mussels, Quagga Mussels and Round Goby. Condition declined through the 198 s to a low point in From 199 to 216, the long-term trend shows slight decline in relative weight. Data on Rainbow Trout condition over the past 1 years are the most informative for the current population (Fig b). Rainbow Trout condition declined to a low in 28 then has increased up to 213, the highest in the whole time series since In 215, Rainbow Trout condition declined significantly, to the lowest point since Rainbow Trout condition has remained unchanged from 215 to 216 (Fig b). After a sharp increase in catch per unit effort (CUE) from 1979 to 1984 (the highest in the 34 year time series), the CUE declined until 24 in the Western Lake Ontario Boat Fishery (Fig ). After 24 (the lowest CUE since1982), the CUE steadily increased to 213. The Lake Ontario Management Unit, did not Fish Stocked (X 1) NYSDEC OMNRF Number of fish Estimated Observed FIG Number of Rainbow Trout stocked by New York State Department of Environmental Conservation (NYSDEC) and OMNRF from (see Section 6.1) FIG Estimated run of Rainbow Trout at the Ganaraska River fishway at Port Hope, Ontario from Section 7. Stock Status
143 135 evaluate the Western Lake Ontario Boat Fishery in 214 or 215, but Rainbow Trout CUE in 216 showed a significant decline, falling below the average CUE for both the full time series ( ) and the past 1 years (27 to 216; Fig ). Effort in this fishery has remained fairly stable since 1994 (Fig ). Total numbers of Rainbow Trout caught and harvested in the Western Lake Ontario Boat Fishery naturally followed the same trends found in CUE with total harvest generally lower than total catch (Fig ). In the fall of 214, New York anglers reported and New York State Department of Environmental Conservation (NYSDEC) observed disoriented Rainbow Trout in the Salmon River, New York. After hearing these reports, the Lake Ontario Management Unit actively searched for distressed and disoriented Rainbow Trout in Lake Ontario tributaries, however, none were observed. Tissues from distressed Rainbow Trout collected by NYSDEC contained low levels of Thiamine (Vitamin B1). Despite not observing distressed Rainbow Trout in Ontario, it remains uncertain if low Thiamine levels are having an impact on Rainbow Trout in Canadian waters. Relative Condition Relative Condition (a) (b) FIG Relative weight of Rainbow Trout sampled at the Ganaraska River fishway at Port Hope, Ontario for (a) the whole time series and (b) a 1 year average (27 216; see Section 1.1) While the condition of Rainbow Trout in 216 has not declined from 215, the number of fish passing through the Ganaraska Fishway during the spring spawning run continued to decline (Figs and 7.2.3, see also Section 1.1). It is unknown whether these declines are related to the Thiamine issues observed in 214 in New York, a result of lower than average seasonal summer temperatures in 214 and 215 (Section 11.1), more severe winters in and (see Section 11.1), or below average flows during the spawning runs (Section 11.4), but it is likely the combination of multiple factors. CUE (No./Ang-hr) CUE Effort FIG Catch rate (CUE) of Rainbow Trout and total effort (rodhrs) in the Ontario waters of Lake Ontario (excluding Kingston Basin), FIG Number of Rainbow Trout caught (closed circle) and harvested (open circle) annually by the boat fishery in the Ontario waters of Lake Ontario (excluding Kingston Basin), The dashed line represents the mean catch and harvest from 2 to Effort (Rod-hr X 1,) Section 7. Stock Status
144 Lake Whitefish J. A. Hoyle, Lake Ontario Management Unit Lake Whitefish is a prominent member of the eastern Lake Ontario cold-water fish community and an important component of the local commercial fishery. Two major spawning stocks are recognized in Canadian waters: one spawning in the Bay of Quinte and the other in Lake Ontario proper along the south shore of Prince Edward County. A third spawning area is Chaumont Bay in New York State waters of eastern Lake Ontario. Commercial Fishery Lake Whitefish commercial quota and harvest increased from the mid-198s through the mid-199s, declined through to the mid-2s then stabilized at a relatively low level (Fig ). Quota and harvest averaged 12, lb and 8, lb respectively, over the time-period. In 216, base quota was 135,91 lb, issued quota was 163,392 lb and the harvest was 95,552 lb (Section 3.2). In recent years, most of the harvest occurs in quota zone 1-2, eastern Lake Ontario (Fig ). Here, most of the harvest occurs at spawning time in November and early December (Fig ). Although harvest at other times of the year is less than at spawning time, considerable gill net fishing effort does occur. Highest harvest rates (HUE) occur at spawning time. The age distribution of Lake Whitefish harvested is comprised of many age-classes (Fig ). Most fish are age-5 to age-13. Abundance Lake Whitefish abundance is assessed in a number of programs. Summer gill net sampling is used to assess relative abundance of juvenile and Quota or Harvest (lb) FIG Lake Whitefish commercial quota and harvest, Harvest (lb) 9, 8, 7, 6, 5, 4, 3, 2, 1, - 7, 6, 5, 4, 3, 2, 1, - Lake Whitefish Quota and Harvest Year Quota Harvest FIG Lake Whitefish commercial harvest by quota zone, Effort (yards) Harvest (lb) 45, 4, 35, 3, 25, 2, 15, 1, 5, Effort Spawn Other , 35, 3, 25, 2, 15, 1, HUE 5, Harvest Spawn Other HUE Spawn 1.4 Other FIG Commercial Lake Whitefish gill net fishing effort (top panel), harvest (middle panel), and harvest-per-unit-effort (HUE; bottom panel) in quota zone 1-2, Spawn includes November and December, and Other includes January through October. Section 7. Stock Status
145 137 Proportion of harvest Proportion of harvest FIG Lake Whitefish age distributions (by number) in the 216 quota zones 1-2 (upper panel) and 1-3 (lower panel) fall commercial fisheries. adult fish in eastern Lake Ontario (Fig , and see Section 1.2). Young-of-the-year (YOY) abundance is assessed in bottom trawls (Section 1.3) at Conway (lower Bay of Quinte) and Timber Island (EB3 in eastern Lake Ontario) (Fig ). Lake Whitefish abundance, like commercial harvest, has been stable at a relatively low level for the last decade. Young-of-the-year catches have been variable. Growth Trends in length-at-age for Lake Whitefish caught during summer assessment gill nets for age -2, age-3, and age-1 (males and females) fish are shown in Fig Generally, fork length-at-age declined during the 199s then stabilized in the early 2s. Condition Quota Zone 1-2 (Lake Stock) Age (years) Quota Zone 1-3 (Bay Stock) Mean age = 9.1 years (n = 11) Mean age = 8.9 years (n = 162) Age (years) Trends in Lake Whitefish condition during summer and fall are shown in Fig Condition was high from , declined through Condition then increased to intermediate levels for Lake Whitefish sampled during summer but condition remained low for fish sampled during fall. Commercial Harvest Commercial harvest (x1 lb) Sub-adult and Adult Lake Whitefish (Assessment Gill Nets) 3. Catch per gill net Catch per trawl Young of the year (Assessment Trawls) FIG Lake Whitefish commercial harvest (upper panel). Lake Whitefish abundance in eastern Lake Ontario assessment gill nets, (sub-adult and adult; middle panel) and bottom trawls, (young-of-the-year; lower panel). Fork length (mm) Age-2 Age-3 Age-1 Female FIG Trends in Lake Whitefish fork length-at-age for age-2, age-3, age-1 males and females, caught in summer assessment gill nets, Overall Status Age-1 Male Year Following severe decline in abundance, commercial harvest, growth and condition, during the 199s, the eastern Lake Ontario Lake Whitefish population appears to have stabilized at a much reduced but stable level of abundance, and condition. Section 7. Stock Status
146 138 1 Summer Relative weight Relative weight Fall Spawning Bay Stock Lake Stock FIG Condition (relative weight) of Lake Whitefish sampled during summer assessment gill net surveys in eastern Lake Ontario (upper panel error bars ±2SE) and fall commercial catch sampling (lower panel) in the Bay of Quinte ( Bay Stock ) and the south shore Prince Edward County ( Lake Stock ), Section 7. Stock Status
147 Walleye J. A. Hoyle, Lake Ontario Management Unit Walleye is the Bay of Quinte fish community s primary top piscivore and of major interest to both commercial (Section 3.2) and recreational fisheries (Section 2.4). The Walleye population in the Bay of Quinte and eastern Lake Ontario is managed as a single large stock. The Walleye s life history-specific movement and migration patterns between the bay and the lake determines the seasonal distribution patterns of the fisheries. Understanding Walleye distribution is also crucial to interpret summer assessment netting results (Sections 1.2 and 1.3). After spawning in April, mature Walleye migrate from the Bay of Quinte toward eastern Lake Ontario to spend the summer months. These mature fish return back up the bay in the fall to over-winter. Immature Walleye generally remain in the bay year-round. Recreational Fishery The recreational fishery consists of a winter ice-fishery and a three season (spring/summer/ Walleye catch (number) FIG Bay of Quinte recreational angling effort and walleye catch (released and harvested) during the winter ice-fishery, No data for 26, 28, or 215. Walleye catch (number) 6, 5, 4, 3, 2, 1, - 35, 3, 25, 2, 15, 1, 5, - Released Harvested Effort Released Harvested Effort , 35, 3, 25, 2, 15, 1, 5, FIG Bay of Quinte recreational angling effort and walleye catch (released and harvested) during the open-water fishery, No data for 27, , or , 6, 5, 4, 3, 2, 1, - Angling effort (hours) Angling effort (hours) fall) open-water fishery. Most Walleye harvest by the recreational fishery occurs in the upper and middle reaches of the Bay of Quinte during the winter ice-fishery (Fig ) and the spring/early summer open-water fishery. All sizes of fish are caught during winter while mostly juvenile fish (age-2 and age-3) are caught during spring and summer. A popular trophy Walleye fishery occurs each fall based on the large, migrating fish in the middle and lower reaches of the Bay of Quinte at that time (see Section 2.5). Trends in the open-water fishery are shown in Fig (see also Section 2.4). Annual Walleye angling effort and catch (ice and open-water fisheries combined) has been relatively stable averaging about 33, hours and 55, fish during the last decade. Commercial Fishery Walleye harvest by the commercial fishery is highly regulated and restricted. No commercial Walleye harvest is permitted in the upper and middle reaches of the bay (Trenton to Glenora). A relatively modest Walleye commercial quota Quota or Harvest (lb) Harvest (lb) 9, 8, 7, 6, 5, 4, 3, 2, 1, - FIG Walleye commercial quota and harvest, , 3, 2, 1, - Harvest Quota FIG Walleye commercial harvest by quota zone, Section 7. Stock Status
148 14 (48,546 lbs; Fig ) is allocated in the lower Bay of Quinte and Lake Ontario with additional seasonal, gear, and fish-size restrictions. The commercial harvest of Walleye was 25,377 lbs in 216. Commercial Walleye harvest has shifted location from quota zone 1-2 to 1-4 over the last decade (Fig ). This shift has likely resulted in smaller, younger Walleye being harvested but this has not been measured. Annual Harvest Total annual Walleye harvest in the recreational and commercial fisheries (by number and weight) over the last decade (27-216) is given in Table The recreational fishery takes about 8% of the annual harvest with the open-water component of the recreational fishery making up 58% (by number) of total annual harvest. Abundance Walleye abundance is assessed in a number of programs. Summer gill net sampling (Section 1.2) is used to assess relative abundance of juvenile (Bay of Quinte) and adult (eastern Lake Ontario) fish (Fig ). Fig shows the 215 Walleye age distribution in these two geographic areas. Young-of-the-year (YOY) abundance is assessed in Bay of Quinte bottom trawls (Fig ; Section 1.3). Except for an unusually high catch in 213, juvenile abundance in the Bay of Quinte has been relatively stable since 21 (Fig ). In eastern Lake Ontario index gill nets, after an unusually low catch in 213, Walleye abundance in eastern Lake Ontario increased to a level TABLE Mean annual Walleye harvest by major fishery over the last decade (27-216). Annual Walleye Harvest Number % by of fish weight Pounds of fish % by number Commercial 23,8 9,232 22% 2% Recreational Open-water Angling 52,548 26,51 5% 58% Ice Angling 29,393 9,814 28% 22% Total 15,21 45,97 1% 1% similar to that observed in the previous few years (Fig ). The 214 catch of YOY Walleye in bottom trawls was the highest since 1994 (Fig ) and the 215 year-class was also very large. The 216 year-class was of moderate strength. These recent year-classes foreshadow continued stability in the Walleye population and fisheries. Growth FIG Walleye abundance in summer gill nets in the Bay of Quinte, (upper panel) and eastern Lake Ontario, (lower panel). Number of Fish Number of Fish Catch per trawl Catch per gill net Catch per gill net Walleye length-at-age for age-2 and age-3 Bay of Quinte Eastern Lake Ontario Bay of Quinte Lake Age Ontario (years) Age (years) FIG Walleye age distribution in 216 summer gill nets in the Bay of Quinte (upper panel) and eastern Lake Ontario (lower panel) Year-class FIG Young-of-the-year Walleye catch per trawl in the Bay of Quinte, Section 7. Stock Status
149 141 Fork length (mm) FIG Trends in Walleye fork length-at-age for age-2, age-3, age-1 males and females, caught in summer assessment gill nets, juvenile fish and age-1 mature fish (males and females separated) is shown in Fig Length -at-age increased for juvenile (age-2 and 3) fish in 2 and remained stable since. For mature fish (age-1), length-at-age has remained stable with females being larger than males. Condition Walleye condition (relative weight) is shown in Fig Condition has remained stable in Bay of Quinte fish (immature) and showed an increasing trend in Lake Ontario (mature fish) until 214 when condition declined sharply; condition increased in 215 and held steady in 216. Other Walleye Populations Age-2 Age-3 Age-1 Male Age-1 Female The Bay of Quinte/eastern Lake Ontario Walleye population is the largest on Lake Relative weight (Wr) Year FIG Trends in Walleye condition (relative weight), caught in summer assessment gill nets, Ontario; smaller populations exist in other nearshore areas of the lake and St. Lawrence River. Walleye in these other areas are regularly assessed with a standard trap net program (Nearshore Community Index Netting; see Section 1.4). Mean (26-216) Walleye trap net catches in 13 geographic nearshore areas are shown in Fig Highest Walleye abundance occurs in the Bay of Quinte, East Lake, West Lake, Weller s Bay and Hamilton Harbour. Walleye abundance increased in Hamilton Harbour following 212 Walleye stocking efforts (see Section 8.7). Overall Status Bay of Quinte Lake Ontario Walleye Condition The overall status of Lake Ontario Walleye is good. The Bay of Quinte/eastern Lake Ontario population did decline during the 199s but stabilized at levels that still supports a high quality fishery. Fish per trap net Hamilton Harbour Toronto Presqu'ile Weller's Harbour Bay Bay West Lake East Lake Prince Edward Bay Upper Bay of Quinte Middle Bay of Quinte Lower Bay of Quinte North Thousand Lake St. Channel Kingston Islands Francis FIG Walleye abundance (mean annual number of fish per trap net) in 13 geographic nearshore areas of Lake Ontario and the St. Lawrence River arranged from west (Hamilton Harbour) to east (Lake St. Francis). Catches are annual means for all sampling from and time-periods with individual areas having been sampled from one to ten years over the eleven year time-period. Section 7. Stock Status

150 Northern Pike M. Hanley, Lake Ontario Management Unit Northern Pike (Esox lucius) are a coolwater piscivore which are native to Lake Ontario and the St. Lawrence River. They are most often associated with shallow, weedy areas of lakes and rivers and are classified as ambush predators. Northern Pike are popular sportfish in Lake Ontario and the St. Lawrence River. In addition, they have been permitted as a harvested species in the commercial fishery in the Bay of Quinte and the Eastern Basin of Lake Ontario beginning in the fall of 26 (see Section 3.2). Northern Pike are an indicator species of water-level changes, as flooding in the spring initiates spawning due to improved access to nursery habitat in flooded marshes and weedy shallow bays. Additionally, water levels determine offspring survival and subsequent recruitment. Years with high water levels that are maintained for a long period of time are associated with strong year-classes of Northern Pike. In assessment gear, Northern Pike are most often encountered during the Nearshore Community Index Netting (NSCIN) program (see Section 1.4). The NSCIN program began in 21 and is performed annually in the Upper Bay of Quinte. Additionally, this program is undertaken in various other locations in Lake Ontario and the St. Lawrence River on a yearly rotating basis (see Section 1.4). Catch per unit effort (CUE) of Northern Pike in NSCIN nets in the Upper Bay of Quinte from (.28 pike/net) had remained at half of the long term average (.56 pike/net), but in 216, CUE (.53 pike/net) came very close to this long-term average (Fig ). A target catch rate of.69 fish/net in the NSCIN program was set in the Bay of Quinte Fisheries Management Plan (BQFMP) to provide an index identifying changes in abundance. Similar to recent years, the CUE of pike in Upper Bay of Quinte NSCIN nets did not reach this target (Fig ). Other locations around Lake Ontario and the St. Lawrence River are also used in the NSCIN program to assess fish communities throughout the system. In 216, the Toronto Waterfront and Hamilton Harbor locations were sampled in addition to the Upper Bay of Quinte. These two Areas of Concern (AOCs) have been chosen as sampling locations every second year since 26 to determine species composition and abundance in these high profile AOCs. Northern Pike are often caught in Hamilton Harbour and Toronto Harbour NSCIN trap nets so these locations were used to compare average CUE and average length of pike captured in the Upper Bay of Quinte (Fig ). In comparing the three locations, Toronto Waterfront trap nets capture the most pike and the largest pike when compared to the other two locations. The Upper Bay of Quinte captures the smallest and fewest pike, while Hamilton Harbor is an intermediate type between the two (Fig ). Northern Pike are captured in the gill nets used in the Community Index Netting Program in the Lake St. Francis region of the St. Lawrence River (see Section 1.6). Catch per standard gill net in 216 was lower than in 214 and shows a continued decline in CUE in this area (Fig ). Pike captured from gill nets are predominantly large fish (>5 mm) and very few small fish FIG Northern Pike abundance in the Upper Bay of Quinte Nearshore Community Index Netting program (no netting in 26). The dotted line indicates the long-term CUE average and the solid line represents the BQFMP target CUE. Section 7. Stock Status


151 143 (<5 mm) are caught (Fig.7.5.3). Annual harvest of Northern Pike in commercial fishery nets in Lake Ontario was higher in 216 compared to the two previous years (Fig ). This trend is consistent with the CUE increase seen in the NSCIN trap nets in the Upper Bay of Quinte. As has been the case in previous years, the majority, 71.3%, of Northern Pike harvest was reported in the Bay of Quinte, with only 28.7% of the total harvest reported from all other areas in Lake Ontario (see Section 3.2). FIG Mean length and mean catch in Nearshore Community Index Netting Program of Northern Pike in three different locations. Each point represents the mean length and CUE of Northern Pike through time at each location. Error bars are ±1 standard error. FIG Catch per unit effort of Northern Pike in Community Index gill nets in Lake St. Francis from Each bar is divided into small (<5 mm) and large (>5 mm) Northern Pike CUE. FIG Annual harvest (lbs) of Northern Pike in commercial fishery nets in Lake Ontario, including the Bay of Quinte, from Section 7. Stock Status
152 Pelagic Prey Fish J.P. Holden, M.J. Yuille, J.A. Hoyle Lake Ontario Management Unit B.C. Weidel, M.G. Walsh Lake Ontario Biological Station, USGS M.J. Connerton Cape Vincent Fisheries Station, NYSDEC Alewife Alewife are the dominant prey fish in Lake Ontario and are the primary prey item for important pelagic predators (e.g., Chinook Salmon, Rainbow Trout) as well as other recreationally important species such as Walleye and Lake Trout. It is important to monitor Alewife abundance because significant declines in their abundances in Lakes Huron and Michigan lead to concurrent declines in Alewife-dependent species, such as Chinook Salmon. However, having Alewife as the principal prey item can lead to a thiamine deficiency in fish that eat Alewife, which has been linked to undesirable outcomes like reproductive failure in Lake Trout as well as Early Mortality Syndrome (EMS). The stock status of Alewife as it relates to predator-prey balance in Lake Ontario requires a whole-lake assessment. Acoustic estimates (Section 1.7) are used in conjunction with estimates derived from the New York State Department of Environmental Conservation (NYSDEC) and U.S. Geological Survey (USGS) spring bottom trawl program that included MNRF participation for the first time in 216 (Section 1.11). Index values between acoustic and spring bottom trawls show differences in year over year trends. The acoustic index increased in 216 whereas the bottom trawl index declined (Fig ). While comparisons of these two indices are ongoing, the difference between the trends in 216 is most likely related to the sensitivity of each index to the abundance of age-1 fish. A more comprehensive analysis of the entire spring trawl time series is reported in the New York Annual Report. Conducting spring trawls lake-wide in 216 provided several new insights to Alewife assessment. In contrast to a more even distribution in the summer (see Section 1.5, Fig ), Alewife are distributed off-shore Relative Abundance Year FIG Alewife abundance through time in the Spring Trawling Index (Age 2 and older Alewife per 1 min trawl ) and the MNRF/ NYSDEC Acoustic survey (whole lake index of Age 1 and older Alewife, in millions ). Acoustic estimates were not conducted in 1999 and 21. FIG Spatial differences in relative abundance of yearling (age -1) and adult (age-2+) caught in the spring trawl program (Section 1.11). Triangles indicate trawls that did not catch any Alewife. Circles are scaled relative to the number of Alewife in a 1 min trawl. Acoustic Spring Trawl Section 7. Stock Status

153 145 (generally depths > 7m) at the time bottom trawling was conducted (Fig ). Yearling (age-1) Alewife appear to have had a more patchy distribution in 216 compared to adult Alewife. Of particular note was a single tow near Toronto that caught over 4, adult Alewife. The size distribution of Alewife throughout the lake however shows a similar pattern of low abundance of Alewife in the 1 to 15mm (TL) size range which represents the 213 and 214 cohorts (Fig ). The Fish Community Index Gill Netting (Section 1.2) and Trawling programs (Section 1.3) provide localized trends but may not reflect whole lake abundance trends due to the relatively restricted geographical area of these surveys. A comparison of Acoustics, Trawling and Gill Netting shows little synchrony in abundance trends (Fig ) however neither Fish Community Index Gill Netting nor Trawling are specifically designed to index Alewife. Of note is the increasing trend observed in gill nets, which is not evident in the trawl programs. This trend is reflective of a change in Alewife size rather than absolute abundance. Index gill nets are limited in the size of mesh that effectively target small fish and are selective for only the largest Alewife, which make up small proportion of the total population. The trend, while not reflective of general lake wide abundance, does indicate an increase in abundance of the largest Alewife. This may indicate a change in growth or proportional size structure of the population. Differences between geographic regions sampled in Fish Community Index trawling highlight how Alewife occupy these areas during the summer months. Data from the past five years (211 to 216) is presented in aggregate to increase sample size. Shallow depths have the highest catch numbers (fish/trawl) of Alewife (Fig ) but are generally sampling small, often young-of-year (age-) Alewife (Fig ) and are generally confined to the Bay of Quinte (Fig ). Biomass (kg/trawl) is variable with depth (Fig ) but depths shallower than 5m tend to have the highest density. Relative Abundance Acoustic Gill Net Trawl 2 21 Year FIG Comparison of the size distribution (TL, mm) of Alewife captured in Spring Bottom trawling (Section 1.11) in Canadian (CA) and American (US) waters in 216. FIG Alewife trend in abundance between acoustic assessment (Section 1.5), gill nets (Section 1.2) and trawls (Section 1.3). Note that each program provides a relative index on a different scale. The acoustic index is an index of whole-lake population (in millions). Gill nets are indexed as kg per 24hr net set. Trawls are indexed as kg per 12 min. tow. Section 7. Stock Status
154 N (x 1) per Trawl 6 3 ZONE BQ KBasin Lake Mean Weight (g) Bottom Depth (m) Fig Relative abundance (N/1 min tow) of Alewife for each depth sampled in Fish Community Index Trawling (Section 1.3) from 211 to 216. Symbols indicate the geographic area of the survey where the depth was sampled (BQ = Bay of Quinte, Lake = Main Lake Basin, KBasin = Kingston Basin). FIG Mean size of Alewife for each area sampled (BQ = Bay of Quinte, Lake = Main Lake Basin, KBasin = Kingston Basin) in Fish Community Index Trawling (Section 1.3) from 211 to BQ KBasin Lake Zone 4 Kg per Trawl 3 2 ZONE BQ KBasin Lake Bottom Depth (m) FIG Mean size of Alewife for each depth sampled in Fish Community Index Trawling (Section 1.3) from 211 to 216. Symbols indicate the geographic area of the survey where the depth was sampled (BQ = Bay of Quinte, Lake = Main Lake Basin, KBasin = Kingston Basin). Fish body condition quantifies on average how fat or thin individual fish are within a population. Changes in condition may indicate increased competition for food, reduced availability of food, changes in environmental conditions or a combination of these factors. Alewife condition is indexed as the predicted weight (based on a log-log regression) of a 137mm (TL) fish (Fig ). Recent years (since 29) have shown greater variability in year to year changes in condition. The condition index for 216 was the second highest of the time series and the four highest years have all occurred since 29. FIG Relative density (kg/12 min tow) of Alewife for each depth sampled in Fish Community Index Trawling (Section 1.3) from 211 to 216. Symbols indicate the geographic area of the survey where the depth was sampled (BQ = Bay of Quinte, Lake = Main Lake Basin, KBasin = Kingston Basin). Condition Index Year FIG Alewife condition, represented as the predicted weight (g, based on a log-log regression) of a 137 mm (total length) Alewife from the Fish Community Index trawls in the Kingston Basin only conducted in mid-summer. Section 7. Stock Status
155 147 Rainbow Smelt Rainbow Smelt are the second most abundant pelagic prey species in Lake Ontario. Alewife however, contributes the majority of fish biomass in predator diets even during high periods of Rainbow Smelt abundance. High abundance of Rainbow Smelt has been thought to negatively impact native species. For example, the decline of the native Cisco population in the 194s coincided with high abundance of Rainbow Smelt. Rainbow Smelt from 1997 to present show a similar trend to the Kingston Basin trawls suggesting a lake wide decline. Similar to the acoustic survey (Section 1.5), summer trawl catches show Rainbow Smelt being confined to a relatively narrow depth range. Numbers (N/trawl, Fig ) and biomass (kg/trawl, Fig ) both peak in depths between 3 and 5m with large catches generally confined to Kingston Basin sites. Following a dramatic decline of Rainbow Smelt in the 199s, Rainbow Smelt populations have been variable but at a lower level (Fig ). Fish Community Index Trawling (Section 1.3) based estimates of Kingston Basin Rainbow Smelt density peaked at 1,982 fish/ha with an average density of 861 fish/ha between 1992 and The whole lake acoustic estimates of N (x 1) per Trawl ZONE BQ KBasin Lake. 5 1 Bottom Depth (m) FIG Relative abundance (N/12 min tow) of Rainbow Smelt for each depth sampled in Fish Community Index Trawling (Section 1.3) from 211 to 216. Symbols indicate the geographic area of the survey where the depth was sampled (BQ = Bay of Quinte, Lake = Main Lake Basin, KBasin = Kingston Basin). 7.5 Kg per Trawl 5. ZONE BQ KBasin Lake 2.5. FIG Rainbow Smelt trend in abundance between acoustic assessment (Section 1.5) and trawls (Section 1.3). Note that each program provides a relative index on a different scale. The acoustic index is an index of whole-lake population (in millions). Trawls are indexed as kg per 12 min. tow with trawl regions indicated by grey shading (BQ = Bay of Quinte, Lake = Main Lake Basin, KBasin = Kingston Basin). 5 1 Bottom Depth (m) FIG Relative density (kg/12 min tow) of Rainbow Smelt for each depth sampled in Fish Community Index Trawling (Section 1.3) from 211 to 216. Symbols indicate the geographic area of the survey where the depth was sampled (BQ = Bay of Quinte, Lake = Main Lake Basin, KBasin = Kingston Basin). Section 7. Stock Status
156 Benthic Prey Fish J.P. Holden, M.J. Yuille, J.A. Hoyle Lake Ontario Management Unit B.C. Weidel Lake Ontario Biological Station, USGS M.J. Connerton Cape Vincent Fisheries Station, NYSDEC Round Goby Round Goby were first documented in Lake Ontario in 1998 and have since become a dominant species in the nearshore and offshore benthic fish community. Round Goby are nearshore residents during summer, but migrate to depths up to 15 m during winter, where for half of the year, it also fills a major component of the offshore benthic fish community. Round Goby eat dreissenid mussels extensively, but their prey in offshore waters also includes freshwater shrimp (Mysis diluviana) and other invertebrates. Since first detected in Fish Community Index Trawling in 23 (Section 1.3) Round Goby abundance increased to peak levels in 21 and has subsequently decreased (Fig ). Abundance in 216 increased in both the Bay of Quinte (BQ) and Kingston Basin (KBasin) trawl sites. The addition of a fall trawl survey in 215 (Section 1.11) and spring trawling in 216 (Section 1.1) allows for a seasonal comparison of depth movement. Trawl gear (net and doors) and tow durations differ between programs, so only comparisons on relative distribution and N per Trawl Year ZONE BQ KBasin FIG Relative abundance (N/12 min tow) of Round Goby in Fish Community Index Trawling (Section 1.3) from 1992 to 216. Symbols indicate the geographic area of the survey where the trawls were conducted (BQ = Bay of Quinte, KBasin = Kingston Basin). general catch observations are appropriate at this time. There is a shift to deeper waters between summer and fall in trawl programs (Fig ). The most notable observation is that Round Goby were rarely caught during the spring survey. The trawl configuration we used catches Round Goby frequently when used in US waters. The sites used in the spring are also the same trawl sites used in the fall suggesting it is not purely a habitat issue. Shallow sites (<8 m) along the north shore of Lake Ontario have a large number of boulders and attempts to trawl many of these sites have resulted in snagged or torn nets. Also, Canadian trawl sites were sampled to maximum depth of 14 m. It is possible that Round Goby are occupying these areas where the trawl survey is not currently sampling. Future work to identify suitable trawl sites and alternative methods to sample boulder rich areas is ongoing. Catch Per Trawl Bottom Depth (m) FIG Relative abundance (N/tow) of Round Goby for each depth sampled in Spring Prey Fish Trawling ( Spring, Section 1.11), Fish Community Index Trawling ( Summer, Section 1.3) and Fall Benthic Prey Fish Trawling ( Fall, Section 1.12) in 216. Y-axis ranges vary due to differences in trawling gear and tow times. Spring Summer Fall Section 7. Stock Status
157 149 When first detected, the mean size of Round Goby was quite large. As they became established, recruitment increased, predator species began to utilize them as prey and the mean size declined to relatively stable level since 21 (Fig ). There is no clear difference in the size between the Bay of Quinte and the Kingston Basin suggesting similar recruitment, survival and predation in both areas. The mean size observed in both the Bay of Quinte and the Kingston Basin decreased in 216 however the decrease was greater in Kingston Basin. Slimy Sculpin By the 197s, the once diverse native prey base had largely collapsed with Slimy Sculpin being one of the last remaining offshore native prey species. Historically, Slimy Sculpin would have been the primary prey item for Lake Trout and even as recently as the mid-199s this species was second only to Alewife as the most abundant prey item consumed by Lake Trout (Section 8.5, Fig ). The offshore depths that are the core habitat for Slimy Sculpin however have historically not been well represented in Fish Community Index Trawling (Section 1.3) and catches have typically been quite low (Fig ). 8 6 Additional trawl programs in the spring (Section 1.11) and fall (Section 1.12) have an emphasis on the offshore habitats and provide greater insight to the abundance and distribution of the species. Slimy Sculpin catches in the 216 fall trawl program show that the distribution is concentrated in offshore sites around the 1 m depth contour (Fig ). The additional main lake trawl transects and depths added to Fish Community Index Trawling (Section 1.3) in 214 show a similar trend with depth with additional observations at 6m (Fig and Fig ). The majority of the sites shallower than 6 m occur within the Kingston Basin and the Bay of Quinte; while the main basin sites shallower than 8 m are N per Trawl Year ZONE BQ KBasin Lake FIG Relative abundance (N/12 min tow) of Slimy Sculpin in Fish Community Index Trawling (Section 1.3) from 1992 to 216. Symbols indicate the geographic area of the survey where the trawls were conducted (BQ = Bay of Quinte, KBasin = Kingston Basin, Lake = Main Basin). Mean Weight (g) 4 ZONE BQ KBasin Year FIG Annual mean weight of Round Goby caught in Fish Community Index Trawling (Section 1.3) from 24 to 216. Bay of Quinte (BQ, circles) and Kingston Basin (KBasin, triangles) catches are reported separately. FIG Spatial differences in relative abundance in Slimy Sculpin caught in the Fall Benthic Prey Fish Trawl (Section 1.12) in 216. Open circles indicate tows that caught zero Slimy Sculpin. Filled circles are scaled by catch per trawl. The dotted line indicates the 1 Section 7. Stock Status
158 15 underrepresented in Canadian trawl programs. While the relative biomass peaks around 1m, individual fish size increases with depth (Fig ). Since 1996, no Deepwater Sculpin were collected in Fish Community Index programs until 25, when they were collected in the trawls at Rocky Point. As recently as 213, catches Deepwater Sculpin Deepwater Sculpin were once abundant in the main basin of Lake Ontario. By the 197s, Lake Ontario s native fish stocks, including Deepwater Sculpin, had been pushed to near extinction. After 1972, Deepwater Sculpin had not been detected in Lake Ontario until 1996, when one was caught in Fish Community Index Trawling (Fig ; Section 1.3). Mean Weight (g) Bottom Depth (m) FIG Mean size of Slimy Sculpin for each depth sampled in Fish Community Index Trawling (Section 1.3) from 211 to 216. N per Trawl Bottom Depth (m) ZONE BQ KBasin Lake FIG Relative abundance (N/12 min tow) of Slimy Sculpin for each depth sampled in Fish Community Index Trawling ( Summer, Section 1.3) from 211 to 216. Symbols indicate the geographic area of the survey where the trawls were conducted (BQ = Bay of Quinte, KBasin = Kingston Basin, Lake = Main Basin) Relative Abundance Gill Net Trawl Kg per Trawl ZONE BQ KBasin Lake Year Historic New Depths. 5 1 Bottom Depth (m) FIG Relative biomass (kg/12 min tow) of Slimy Sculpin for each depth sampled in Fish Community Index Trawling ( Summer, Section 1.3) from 211 to 216. Symbols indicate the geographic area of the survey where the trawls were conducted (BQ = Bay of Quinte, KBasin = Kingston Basin, Lake = Main Basin). FIG Relative abundance (N/12 min tow) of Deepwater Sculpin in Fish Community Index Gill Nets (top panel, Section 1.2) and Trawling (bottom panel, Section 1.3) from 21 to 216. Gill net relative abundance is reported as fish per net set and Trawl relative abundance is fish per 12 min tow. Symbols on trawl plot indicate whether the relative abundance uses only the historic sampling sites (circles, Rocky Point 6 and 1 m and EB sites) or includes all the sites in recently modified to the sampling protocol (triangles, see Section 1.3 for details). Section 7. Stock Status
159 151 remained relatively low in index gillnets and trawls. Catches increased first in gillnets in 213 followed by increased catchs in trawls during 215. Main lake assessment sites were expanded in 214 to include offshore sites at Cobourg and Port Credit. Subsequently in 215, the offshore trawl protocol reduced sampling at the 6 and 1 m sites in favour of adding additional trawl sites at 1 m depth increments out to 14 m. This approach parallels the approach utilized in the fall trawl program (added in 216, Section 1.12) and the spring trawl program (added in 216, Section 1.11). The addition of these sites has increased the index of abundance for the time series, however, the increasing trend is still evident when restricted to the traditional 6 and 1 m Rocky Points sites (Fig , bottom panel). The additional depths sampled beyond 1 m have increased our understanding of the abundance, distribution and population demographics of Lake Ontario Deepwater Sculpin. Deepwater Sculpin are occasionally caught in Kingston Basin but the core of Deepwater Sculpin habitat is in depths greater than 1m (Fig ). The historic 1 m Rocky Point site is on the shallow edge of the depths that Deepwater Sculpin inhabit with abundance and biomass increasing with depth (Fig and Fig ). Both total biomass and mean size increase with depth (Fig ). N (x 1) per Trawl FIG Relative abundance (N/12 min tow) of Deepwater Sculpin for each depth sampled in Fish Community Index Trawling ( Summer, Section 1.3) from 211 to 216. Symbols indicate the geographic area of the survey where the trawls were conducted (BQ = Bay of Quinte, KBasin = Kingston Basin, Lake = Main Basin). Kg per Trawl Bottom Depth (m) 5 1 Bottom Depth (m) ZONE BQ KBasin Lake ZONE BQ KBasin Lake FIG Relative biomass (kg/12 min tow) of Deepwater Sculpin for each depth sampled in Fish Community Index Trawling ( Summer, Section 1.3) from 211 to 216. Symbols indicate the geographic area of the survey where the trawls were conducted (BQ = Bay of Quinte, KBasin = Kingston Basin, Lake = Main Basin). 4 Mean Weight (g) FIG Spatial differences in relative abundance in Deepwater Sculpin caught in the Fall Benthic Prey Fish Trawl (Section 1.12) in 216. Open circles indicate tows that caught zero Slimy Sculpin. Filled circles are scaled by catch per trawl. The dotted line indicates the 1m bathymetric contour. 5 1 Bottom Depth (m) FIG Mean size of Slimy Sculpin for each depth sampled in Fish Community Index Trawling (Section 1.3) from 211 to 216. Section 7. Stock Status
160 Species Rehabilitation 8.1 Introduction A. Mathers, Lake Ontario Management Unit OMNRF works with many partners government agencies, non-government organizations and interested individuals at local, provincial and national levels to monitor, protect and restore the biological diversity of fish species in the Lake Ontario basin (including the lower Niagara River and the St. Lawrence River downstream to the Quebec-Ontario border). Native species restoration is the center piece of LOMU's efforts to restore the biodiversity of Lake Ontario. The sections following describe the planning and efforts to restore Atlantic Salmon, American Eel, Bloater, Lake Trout, Walleye, Round Whitefish and Lake Sturgeon. Some of these species have been extirpated while others were once common but are now considered rare, at least in some locations in the lake. Successful restoration of these native species would be a significant milestone in improving Ontario s biodiversity and help to address Ontario s commitments under the GLFC s Fish Community Objectives and commitments identified in the Great Lakes Water Quality Agreement. Section 8. Species Rehabilitation
161 Atlantic Salmon Restoration M.D. Desjardins, Lake Ontario Management Unit Atlantic Salmon were extirpated from Lake Ontario by the late 18s, primarily as a result of the loss of spawning and nursery habitat in streams. As a top predator, they played a key ecological role in the offshore fish community. They were also a valued resource for aboriginal communities and early Ontario settlers. As such, Atlantic Salmon are recognized as an important part Ontario s natural and cultural heritage. Originating as a small stocking program in 1987, the Lake Ontario Atlantic Salmon Restoration Program has developed into a significant partnership combining the efforts of the Ministry of Natural Resources and Forestry (MNRF), the Ontario Federation of Anglers and Hunters (OFAH), and many corporate and community partners. Since 26, significant progress has been made through enhancements in fish production, community involvement, research and assessment, and habitat enhancement. However, progress toward some program benchmarks has not kept pace. Specifically, the program has failed to generate sufficient numbers of returning adult fish to achieve program goals. Highlights of progress made in 216, include the formation of watershed specific habitat teams. Habitat issues have been prioritized and strategies drafted for each bestbet watershed. Barrier mitigation options are being investigated on Cobourg Brook and fish way efficiency studies are being considered on other tributaries. The Ganaraska River was stocked with yearling Atlantic Salmon (Section 6.3) to create a future recreational fishery and a new state of the art fish counter /camera has been installed in the fish way on Corbett s Dam. This new technology will vastly improve our ability to monitor returning adult salmon (Section 9.9). Scoping for the placement of an additional counter /camera is underway for the Streetsville Dam on the Credit River. In 215, the program steering committee developed a revised five-year plan (216-22) with new priorities and performance measures to accelerate restoration with emphasis on improving adult returns. Plan priorities include: enhancing program delivery and review, optimizing fish culture practices, prioritizing habitat issues, developing fish passage strategies (e.g., Cobourg Creek); and creating a recreation tributary fishery in the Ganaraska River. Section 8. Species Rehabilitation
162 American Eel Restoration M. Hanley and A. Mathers, Lake Ontario Management Unit Background The American Eel (Anguilla rostrata) was historically an important predator in the nearshore fish community of Lake Ontario and the upper St. Lawrence River (LO-SLR). They also functioned as an important component of the LO-SLR commercial fishery during the latter part of the 2th century, and are highly valued by indigenous peoples. American Eel abundance declined in the LO-SLR system as a result of the cumulative effects of eel mortality during downstream migration due to hydro-electric turbines, reduced access to habitat imposed by man-made barriers to upstream migration, commercial harvesting, contaminants, and loss of habitat. By 24, American Eel abundance had declined to levels that warranted closure of all commercial and recreational fisheries for eel in Ontario to protect those that remained. In 27, American Eel was identified as Endangered under Ontario s Endangered Species Act (ESA). In 212, the Committee on the Status of Endangered Wildlife in Canada (COSEWIC) recommended that American Eel be identified as Threatened under the Canadian Species at Risk Act. These events led to additional efforts to protect and restore the American Eel. This section describes the current status of American Eel in LO-SLR, as well as actions taken by the Lake Ontario Management Unit and its partners to reverse the decline of American Eel populations in Lake Ontario and the St. Lawrence River. Indices of Eel Abundance Moses Saunders Eel Ladder Operation The largest barriers to both upstream and downstream migration of American Eels are power dams in the St. Lawrence River. One of these dams, the Moses Saunders Dam, is located on the upper St. Lawrence River between Cornwall, Ontario and Massena, New York. In 1974, an eel ladder was put in place on the Ontario portion of the dam (R.H. Saunders Hydroelectric Dam) in order to aid in the upstream passage of American Eel. The maintenance and operation of the ladder has been maintained and upgraded through collaborations between OMNRF and Ontario Power Generation (OPG) in the years since, and OPG took full responsibility of the operation and maintenance of the ladder in 27. In 216, the Saunders eel ladder was in operation 24 hours a day from June 15 to October 15. Over the course of these four months, passive integrated transponder (PIT) tag readers and an electronic fish counter were used to monitor the use of the ladder and quantify the number of eels passing upstream. The PIT tag reader and counter operated 98-1% of the time and when they were not in operation, any eels passing through were kept in a collection tank and were manually counted in order to collect all data. In 216, a total of 6,192 eels successfully passed through the OPG eel ladder (Fig ). This number represents the lowest recorded number of eels passed in the last six years. The majority of eels passed through the ladder during a six week period from early July to late August and most (96.9%) moved through during hours of darkness from 22: to 6:. The number of eels passed through the OPG ladder was approximately equal to the number of eels that passed through a second eel ladder on the New York portion of the Moses Saunders Dam (Moses Ladder),where 6,262 eels successfully exited the Moses Ladder. The Moses Ladder has been in operation since 26 and has been maintained by the New York Power Authority (NYPA). Historically, the NYPA ladder passed more eels than the OPG ladder with approximately 3,5 more eels travelling through the Moses Ladder in 215. Section 8. Species Rehabilitation
163 155 The combined number of eels that passed through both ladders (12,454 eels) was the lowest since 24 when only the OPG ladder was in operation, but overall combined eel numbers exiting both ladders have increased since 21. However, the number of eels ascending the ladders in 216 is less than 2% of the level of recruitment identified as a long-term indicator in the Lake Ontario Fish Community Objectives for American Eel (FCO 1.3; at least one million eels ascending the ladders annually). A sub-sample of eels was collected from the OPG ladder and biological characteristics were measured during 216. The average length (43.2 ± 74.9 mm, n=559, range: mm) and average weight (94.9g ± 56.2 g, n=559, range: g) was similar for what has been observed in recent years with a trend for slightly larger fish in the last three years. These values are also similar to the average length (428.9 mm, n=515) and weight (117.2 g, n=515) recorded from the NYPA ladder. Lake Ontario and Upper St. Lawrence River Assessment programs In 216, the abundance of larger yellow eels in the LO-SLR was measured with several assessment programs. Bottom trawling in the Bay of Quinte has been conducted since 1972 as part of the fish community index program. The average catch of American Eel in 511 trawls conducted (June-September at sites upstream of Glenora) between 1972 and 1996 was 2. eels per trawl. No eels were captured in the 36 trawls conducted between 23 and 211 and either zero or one eel was captured during the bottom trawls conducted annually between 212 and 216. Nearshore trap netting was conducted using the NSCIN fish community index protocol (see Section 1.4). During 216, one eel was captured in 24 nets set in Hamilton Harbor, one eel was captured in 24 nets set in Toronto Harbor, and three eels were captured in 36 nets set in the Upper Bay of Quinte Total number of eels Moses (NY) Saunders (ON) FIG Total number of eels ascending the eel ladders at the Moses-Saunders Dam, Cornwall, Ontario from During 1996, the ladder operated however no counts were made. Section 8. Species Rehabilitation
164 156 Tail Water Survey In 216, surveys were conducted by OPG to collect dead eels in the Canadian water from the tailwater of the Moses-Saunders Dam. The surveys followed standardized routes, which extended approximately 1 km downstream of the dam along the Canadian shoreline. Tailwater surveys were conducted twice a week on each Tuesday and Friday from June 3 to September 3, 216. Investigators working in a boat searched the specified area for dead and injured American Eels that were floating or submerged along or near the shoreline. In 216, a total of 64 eels were collected during 35 surveys. OPG observed an average of 2. eels per day while NYPA observed 1.1 eels per day (Fig ). The average length of whole eels (n=19) collected by OPG was 845 ± 135 mm (mean ± SD) (Fig ). American Eels were observed during 27 of the 35 survey days and 72% of the collections in 216 occurred in August and September. Most eels (92%) were collected when water temperatures were greater than or equal to 2 C. Restoration Efforts Effectiveness Monitoring of Stocked Eels In one component of the OPG Action Plan for Offsetting Turbine Mortality of American Eel, over 4 million glass eels were stocked into the LO -SLR between 26 and 21. All stocked eels Average number per day NYPA OPG Method 1 OPG Method FIG Average number of eels observed per day in the tailwaters of the Moses-Saunders Dam Note that the OPG sampling methodology and route changed in 27. were purchased from commercial fisheries in Nova Scotia and were marked with oxytetracycline to distinguish them from eels that migrated naturally. Prior to stocking, health screening for a wide variety of fish pathogens (including Anguillicolodes crassus) was conducted at the Atlantic Veterinary College. As prescribed in the current Action Plan, eels have not been stocked since 21. DFO and OPG have collaborated to monitor the effectiveness of American Eel stocking through the electrofishing of preestablished transects in the St. Lawrence River (Jones Creek, Grenadier Island, and Rockport) and the Bay of Quinte (Deseronto, Big Bay, and Hay Bay). In the spring of 216, 16 transects were sampled in these areas and a total of 326 eels were enumerated. Of the 326 American Eels observed or netted, 12 were captured, 31 were measured and weighed before being released, and 71 were sacrificed for age, growth, and origin assessment. Density estimates have fallen approximately 5% in the St. Lawrence River and 25% in the Bay of Quinte since the peak density in 213 (Fig ). In 216, density estimates remained similar to 215 in both the St. Lawrence River (79.3 ± 12.3 eels/ha) and the Bay of Quinte (96. ± 18.3 eels/ha). The decline in overall density is not surprising as natural recruitment remains low, stocking has not occurred since 21, and the number of eels out-migrating is increasing. Biomass estimates have increased for the Bay of Quinte (51.1 ± 8.4 kg/ha), but Length (cm) Length (cm) Age (yrs) Age (years) FIG Length (mean ± standard deviation) and age (mean ± standard deviation) of eels collected in the tail-waters of the Moses- Saunders Dam Section 8. Species Rehabilitation
165 157 decreased for the St. Lawrence River (34.2 ± 5.1 kg/ha) (Fig ). Mean capture length was similar in all areas again in 216. Mean length has increase in the upper St. Lawrence River by 3 mm in the past three years. An increase of 18 mm in mean length has been observed in the Bay of Quinte over the same time period. The large increase in mean length in the Bay of Quinte has brought the size of eels in this area to that of the St. Lawrence River. The absence of new recruits (either through stocking or natural recruitment) is notable in the relatively high mean capture lengths. Of the 71 eels that were sacrificed, ages were obtained from 7 (32 from the St. Lawrence River and 38 from the Bay of Quinte). For the first time, no eels from the 27 stocked yearclass were captured, and for the fourth year in a row no eels from the 26 stocking event were collected. Given the current growth rates, it is estimated that the majority of stocked eels will out-migrate within the next five years. Trap and Transport Safe downstream passage past hydro turbines during the eel s spawning migration is an obstacle to restoration of eel that is identified in the OPG Action Plan. Trap and Transport (T&T) of large yellow eels was initiated in 28 as an OPG pilot project to investigate this alternative for mitigating mortality of eels in the turbines at the Saunders Hydroelectric Dam. The project also involved local commercial fishers and the Québec Mean density (eels/ha) Upper St Lawrence River Bay of Quinte FIG Mean eels per hectare ± standard error of stocked American eel enumerated in spring transects, by study area. Ministère des Forêts, de la Faune et des Parcs (MFFP). LOMU staff assisted OPG in the collection of eels captured in local commercial fisheries and transport of these fish from LO-SLR to Lac St. Louis (a section of the St. Lawrence River below all barriers to downstream migration). During , only eels collected during the spring commercial fishery were included in T&T. In 215 and 216, eels collected during the fall commercial fishery in areas upstream of the dam were also included in the T&T project in an effort to increase the numbers of eels transported. A total of 2,211 large yellow eels (583 and 15 from Lake St. Francis in the spring and fall respectively, and 527 and 996 from above the Moses-Saunders Dam during the spring and fall respectively) were released into Lac St. Louis immediately downstream of the Beauharnois Hydroelectric Dam as part of the T&T program (Fig ). During release, all T&T eels were observed to be in good health and swam away from the release site and down towards the substrate. The mortality of large yellow eels during the spring capture phase of the program has been low with only three eels dying in 216. During the fall T&T, the mortality was high during the first week with 44 mortalities. However, this was attributed to high water temperatures and only four additional eels died during the remaining three weeks once the water temperature cooled. Mean biomass (kg/ha) Upper St Lawrence River Bay of Quinte FIG Mean biomass (mean kg per hectare ± standard error) of eels captured in the Upper St. Lawrence River and the Bay of Quinte using electrofishing from Sampling took place in the spring and fall from and only in the spring from Section 8. Species Rehabilitation
166 158 MFFP Silver Eel Fishery Monitoring To monitor the long-term survival, condition, maturation, and migration of the transported yellow eels, staff from MFFP attempted to recover eels tagged during previous years T&T in the silver eel fishery in the St. Lawrence River estuary. MFFP staff sampled 11, 17 eels (89.9% of the total harvest) from the silver eel fishery during the fall of 216. A total of 26 PIT tagged eels were detected from this sample. Two of these originated from T&T operations in the St. Lawrence watershed and were both transferred in 211. It should be noted that T&T eels have not been PIT tagged since 212 with the exception of the eels that also received an acoustic tag (see below). Results of this survey suggest that after four years, over 75% of the transported eels have migrated towards the spawning ground. The T&T project continued to demonstrate that, where abundant, large yellow eels can be caught, held for brief periods, and transported successfully with limited mortality and no behavioural or physical consequence. Acoustic Telemetry to Track Movement In the fall of 215 and the spring and fall of 216, 92 eels collected in the T&T program were implanted with acoustic tags and released into the Bay of Quinte. Acoustic tags are small, soundemitting devices that are used to track fish movement. The tag is identified by a submerged, stationary receiver when the fish swims past it. Number of Eels Fall LO-SLR Spring LO-SLR Fall LSF Spring LSF FIG Total number of eels collected in the Trap and Transport program from Each total is divided into the locations at which the eels were captured in commercial fishery nets. Acoustic tags were surgically implanted into the abdominal cavity of the eels with 13 eels tagged in the fall of 215, 39 eels tagged in the spring of 216, and 4 eels tagged in the fall of 216. In the Bay of Quinte, 43 receivers have been placed in 14 arrays throughout the Bay and into the Eastern Basin of Lake Ontario in order to track movements. Additional receivers were placed above the Iroquois Dam and in Quebec at the Beauharnois Hydro Dam to detect eels moving downstream. To date, all eels have been detected, but it is presumed that three eels have died (Table 8.3.1). Of the 92 eels tagged, 7 have left the Bay of Quinte, 31 have been identified at the Iroquois Dam, and seven have been identified at Beauharnois (Table 8.3.1). In addition, four of the 12 eels from the 215 fall tagging session that left the Bay of Quinte were detected by receivers in the estuary of the St. Lawrence River. Eels that are tagged and released in the fall leave the Bay of Quinte much more quickly than those tagged in the spring and make their way to Iroquois in half the time. Eels that were released in the spring took an average of 11 ± 7.3 weeks (mean ± SD) to leave the Bay of Quinte, while eels tagged in the fall left the bay in an average of 2 ± 1.6 weeks (mean ± SD). Eels released in the spring took an average of 56 ± 3.1 days (mean ± SD) to reach Iroquois after leaving the Bay of Quinte, while those released in the fall reached Iroquois an average of 24 ± 15.2 days (mean ± SD) after leaving the Bay. Additionally, movement seems to take place predominantly at night, where 68% of detections were collected in darkness, defined as the time between one hour after sunset and one hour before sunrise. Future work in this area is focused on VEMCO Positioning Information at the Iroquois Dam. If there is a particular path through the dam that the eels tend to favor, this information could be used to aid their passage. Preliminary analysis shows that GPS locations were identified for 26 of the 31 detected. Twenty-two eels had multiple locations (up to 9) determined. Twenty of these eels moved at night and only 2 of the eels were headed towards the eastern third of the dam (Fig ). Additionally, it is of interest to gather Section 8. Species Rehabilitation

167 159 TABLE Fate of tags implanted in American Eels. Fate estimates on the survival of eels during their passage through the dam and so these estimates will be part of the work planned for 217. Eel Passage Research Center Fall 215 Spring 216 Fall 216 Total # Tags Dead Eels Still in BQ Left BQ Iroquois Detection Quebec Detection Since 213, the Eel Passage Research Center (EPRC) has conducted research to evaluate potential techniques to concentrate outmigrating eels for downstream transport around turbines at Moses-Saunders and Beauharnois Hydroelectric Dams to mitigate mortality in turbines. EPRC is coordinated by Electric Power Research Institute and primary funders of the research include OPG, Hydro Quebec, and the United States Fish and Wildlife Service (through a funding arrangement from NYPA). Four research projects were undertaken or completed during 216: laboratory studies of eel behavior in response to various behavioral cues recent research on the effect of light on outmigrating eels and recent advancements in lighting technology computational fluid dynamics model development for Iroquois control dam and Beauharnois approach channel Assessment of three sonar technologies to study downstream migrating American Eel approach and behavior at Iroquois Dam and Beauharnois Power Canal. Future Work In 217, many of the projects described above will continue. The OPG and DFO monitoring of the effectiveness of American Eel stocking will be undertaken again in the spring of 217. The OPG and OMNRF trap and transport program is scheduled again for spring and fall 217. At the Moses-Saunders Dam, the tailwater surveys and the operation of the eel ladder will also occur again in 217. Restoration of American Eel in Lake Ontario and the St. Lawrence River has been identified as a Fish Community Objective for Lake Ontario. The abundance of eels moving into the system via the ladders at the Moses-Saunders Dam and the number of mature eels leaving the system are much lower than the FCO long-term indicators. However, the mortality rate of eels migrating downstream towards the spawning grounds has decreased as a result of the Trap and Transport project. In addition, a collaborative effort to develop methods of reducing mortality of eels during their downstream migration has been initiated. Although the Fish Community Objective related to American Eels has not been achieved, the activities summarized in this report show that some progress has been made. FIG Image of Iroquois Water Control Structure in the upper St. Lawrence River. Lines represent the track of tagged eels (as detected by acoustic receivers) during September to December 216. Locations of the eels were calculated from receiver data by VPS ( Section 8. Species Rehabilitation
168 Deepwater Cisco Restoration C. Lake and M. Hanley, Lake Ontario Management Unit Prior to the mid-195s, Lake Ontario was home to a very diverse assemblage of deepwater ciscoes including Bloater (Coregonus hoyi), Kiyi (C. kiyi), and Shortnose Cisco (C. reighardi). Currently, only the Lake Herring (C. artedi) remains in Lake Ontario. Re-establishing selfsustaining populations of Bloater in Lake Ontario is the focus of a cooperative, international effort between the Ontario Ministry of Natural Resources and Forestry (OMNRF), the New York State Department of Environmental Conservation (NYSDEC), the U.S. Fish and Wildlife Service (USFWS), the U.S. Geological Survey (USGS) and the Great Lakes Fishery Commission (GLFC). The Lake Ontario Committee has set a goal to establish a self-sustaining population of Bloater in Lake Ontario within 25 years. The objectives and strategies for the establishment of Bloater are specified in a draft strategic plan, which is currently under review. The plan addresses: sources of gametes, culture facilities, culture capacity, stocking, detection of wild fish, increasing our understanding of ecological consequences, research needs, and public education. Potential long-term benefits of restoring Bloater include: restoring historical food web structure and function in Lake Ontario, increasing the diversity of the prey fish community, increasing resistance of the food web to new species invasions, increasing production of salmon and trout by reducing thiaminase impacts of a diet based on Alewife and Rainbow Smelt, and supporting a small commercial fishery. Potential risks associated with the reintroduction of Bloater relate to the unpredictability of food web interactions in an evolving Lake Ontario ecosystem. Accepting some risk and uncertainty, doing the necessary science to increase understanding and minimize risk, and adapting management strategies accordingly are prerequisites for successful restoration of Bloater in Lake Ontario. In November 216, the OMNRF successfully released 161,68 Bloater (9,35 sub -adults and 71,375 fall yearlings) into the eastern basin of Lake Ontario. The stocked fish were released near Main Duck Island in the St. Lawrence Channel. This location was chosen based on assumed habitat suitability as well as to support the Aquatic Research and Monitoring Section s (ARMS) acoustic telemetry project. A large acoustic array has been assembled and maintained in this area by ARMS in order to track the movements of Bloater (see Section 9.1). OMNRF sampled 155 individual Bloaters from the stocking event. Length, weight, and sex were recorded for each individual. Of the 155 fish, 47.7% were male (74 individuals) and 52.3% were female (81 individuals). The average fork length of the Bloaters sampled was mm and there was no statistical difference in length between males and females (ANOVA, F(1) =.33, p=.57). The average weight of fish was 37.9 g, and again no statistical difference was found between the average weight of males and females (ANOVA, F(1) = 1.2, p=.27). The length-weight relationship for these Bloater is found in Fig The re-introduction of Bloater to Lake Ontario is consistent with bi-national commitments to diversify the offshore prey fish community, increase and restore native fish biodiversity, and restore historical ecosystem structure and function. Continued collection of eggs from the wild and development of a cultured brood stock will result in more fish being stocked in future years. A key restoration goal with this program is to be able to stock 5, fish per year. To help achieve this goal, broodstock development continues at White Lake Fish Culture Station. Section 8. Species Rehabilitation
169 161 FIG Length-weight relationship of the Bloater that were sampled by OMNRF during the 216 stocking event (n=155). Average length and weight of the fish was mm and 37.9 g respectively. Section 8. Species Rehabilitation
170 Lake Trout Restoration J. P. Holden and M. J. Yuille, Lake Ontario Management Unit B. Metcalfe, Aquatic Research and Monitoring Section Lake Trout were extirpated in Lake Ontario in the 195s. The loss of this top predator and valued commercial species caused both ecological and economic damage. Rehabilitation of Lake Trout in Lake Ontario began in the 197s with Sea Lamprey control and stocking of hatchery fish. The first joint Canada/U.S. plan outlining the objectives and strategies for the rehabilitation efforts was formulated in 1983 (referred to henceforth as the strategy ), and revisions in 199, 1998, and most recently in 214 were made to evaluate the methodology and the progress of rehabilitation. The two objectives of the strategy are: 1) increase abundance of stocked adult Lake Trout to a level allowing for significant natural reproduction and 2) improve production of wild offspring and their recruitment to adult stock. Prior to 1996, Lake Trout were monitored with a targeted bi-national Lake Trout netting program. Since 1996, in Canadian waters of Lake Ontario the Lake Trout targets have been evaluated based on catches in a subsample of sites in the Fish Community Index Gill Netting (Section 1.2). Relative abundance is tracked across three areas of the survey: Kingston Basin (Grape Island, Melville Shoal, EB2, EB6, and Flatt Point), Main Lake (Rocky Point, Brighton and Wellington), and Deep Main Lake (Rocky Point deep sites) at sites where the water temperature on lake bottom is below 12 C. Pre-1996 indices back to 1992 from the Fish Community Index Gill Netting (Section 1.2) have been added to the current status report. Lake Trout abundance experienced a significant period of decline that began in the early 199s and reached a low point in 25 (Fig ). Since 25, Catch per Gill Net Kingston Basin Lake Lake Deep Year FIG Catch per unit effort of mature Lake Trout by area. Inset shows mean trend of the three areas combined since 25. there has been a gradual increase in the relative abundance of adult Lake Trout, although catches are still well below those seen in the 199s. During 216, abundance marginally decreased in the Kingston Basin and Main Lake, while the abundance in the Deep Main Lake increased from 215 catches. Overall, there is still an increasing trend in catch. The strategy specifically identifies the abundance of female Lake Trout greater than 4, g as an important indicator of the health of the spawning stock. The current catch per unit effort (CUE, number per 24 hr gill net set) is on an increasing trend since 25; however, it has been relatively stable since 213 and decreased in Kingston Basin sites (Lake Deep Excluded Index) (Fig ). Survival of juvenile Lake Trout was identified as one factor contributing to the decline in abundance. Catches of age-3 fish per half million fish stocked is used as an index of juvenile survival. Survival to age- 3 of the 213 cohort (sampled in 216) is well below the target of 1.5 identified in the strategy (Fig ). This index has become increasingly variable in recent years. As a measure of improved production of wild offspring and recruitment to the adult life stage, the strategy sets a target of wild fish to levels greater than observed between 1994 and 211 (Ontario target = 13.6 wild fish per 1 standard gill net sets). The occurrence of wild Lake Trout is measured through catches of fish that do not bear hatchery fin clips (i.e., unclipped). Stable isotope analysis suggested that more than 9% of unclipped fish were of wild origin. Catches of wild Lake Trout decreased in 216 and Catch per Gill Net All Zones Lake Deep Excluded Year FIG Relative abundance of mature female Lake Trout greater than 4 g. Trend is present with and without Lake Deep sites as they were not conducted in all years. Section 8. Species Rehabilitation
171 163 remains below target (Fig ). Ages of unclipped Lake Trout captured between 25 and 216 were interpreted through examination of otoliths and determined that several cohorts were present. Year class strength was assessed based on multiple years of catches and showed several strong year classes between 1998 and 23 (Fig ). Catches of small Lake Trout in the Fish Community Index Trawling (Section 1.3) are generally low but can provide some additional insight on wild recruitment. Small numbers of wild young-of-year (YOY) fish have been occurring more frequently in recent years and 216 is the highest combined catch of wild age- and age-1 fish in the time series (Fig ). The effectiveness of Sea Lamprey control is monitored through the number of A1 wounds (fresh with no healing) observed on Lake Trout. The strategy sets a target of less than two A1 wounds per 1 Lake Trout. The target has been consistently met since 1996 with the exception of 212 (Fig ). The strategy also calls for Ontario to continue stocking 5, Lake Trout yearlings annually to INDEX COHORT FIG Catch per unit effort (CUE) of age-3 Lake Trout standardized to 5, stocked. The Lake Trout Management Strategy target has established a target CUE = 1.5. increase adult biomass to levels that would facilitate natural reproduction. Ontario stocks three strains of Lake Trout to maximize genetic diversity and develop a strain that is well adapted to present conditions in Lake Ontario. In 216, a total of 52,249 Lake Trout yearlings were stocked in addition to 173,28 fall fingerlings spread across all basins of the lake. A breakdown of Lake Trout stocking numbers, locations and strains is included in Table Since 1998, Lake Trout stocked by MNRF have been clipped with multiple fin clips (an adipose clip and one other), and contain no coded wire tags (CWT). US stocked fish have continued to use only adipose clips paired with CWT. This difference in marking allows for an evaluation of fish straying. In 216, of the 519 Lake Trout sampled in the Fish Community Index Gill Netting (Section 1.2), 183 Lake Trout were caught with only an adipose clip, and of these, 121 had a CWT recovered. This suggests that at least 23%, but as much as 35% of Lake Trout caught in Ontario waters originated from New York stocking. Catch location and stocking origin sites are mapped in Fig Of particular note, one Lake Trout captured near Amherst Island had been stocked in Lake Erie. Proportional Year Class Strength Cohort FIG Proportional year class strength of unclipped Lake Trout captured in the Fish Community Index Gill Netting (Section 1.2) caught between 25 and 216. Catch per 1 Nets Year FIG Catch of unclipped Lake Trout per 1 standardized nets. Dotted line indicates Lake Trout Management Strategy target of 13.7 fish per 1 standardized nets. Standardized Catch Age-1 Age Year FIG Catches of age- and age-1 Lake Trout in the Fish Community Index Trawling (Section 1.3). Catches are standardized to a 32 trawl program. Section 8. Species Rehabilitation
172 164 The body condition of Lake Trout is reported as the predicted weight, based on a log-log regression, of a 68 mm (fork length) Lake Trout. While below the peak condition index observed in 211 and 213, Lake Trout condition in 216 remains above the average for the time series ( ; Fig ). A long term analysis of diet items from adult lake trout (>45mm TL) shows that Alewife are the most consumed diet item by weight (Fig 8.5.1). Since their establishment in Lake Ontario, Round Goby have displaced Slimy Sculpin in Lake Trout diets. Rainbow Smelt are commonly consumed but their importance varies among years. Other prey such as darter and shiner species are consumed in relatively small proportion compared to Alewife, Rainbow Smelt, Round Goby and historically Slimy Sculpin. Catch and harvest of Lake Trout in the recreational fishery is assessed through the Western Lake Ontario Boat Angling Survey (Section 2.2). The estimated recreational catch of Lake Trout in the Ontario waters of Lake Ontario was 6,814 fish in 216; a significant decline (47%) from the previous 213 catch estimate (Fig ). Harvest in 216 (12% of catch) was higher than 213 (4% of catch), but remains just below the average harvest rate since 2 (15% of catch; Fig ). Of the salmon and trout species targeted in Lake Ontario, Lake Trout was the third most frequently caught species behind Chinook Salmon and Rainbow Trout, although the majority of the catch in 216 (99%) was isolated in the western end of Lake Ontario (Niagara and Hamilton Areas; Fig ). Of the Lake Trout sampled by creel technicians, it was determined that the majority of fish were of hatchery origin (89%) and 78% were stocked in U.S. waters (based on clip data). An angler survey was last conducted in the Kingston Basin in 1992 and suggested that Lake Trout catches were 3.5 times higher in the Kingston Basin compared to catches observed in the Western Lake Ontario Boat Angling Survey. Scaling the 216 western basin harvest to account for Kingston Basin harvest results in 3,667 Lake Trout per year being harvested, which is below the strategy s maximum recommended harvest of 5, fish from Ontario waters. The Lake Ontario Volunteer Angler Diary Program (Section 2.3) provides additional information Wounding Rate (Scars per 1 fish) A1 A2 Weight (kg) of a 68mm (FL) fish Year Year FIG Sea Lamprey scarring rate. Dotted line indicates the Lake Trout Management Strategy target of a maximum of two A1 wounds (fresh with no healing) per 1 Lake Trout. FIG Lake Trout Condition Index is the predicted weight of a 68 mm (fork length) Lake Trout. Error bar indicate the 95% confidence intervals. 1 Percent Composition by Weight FIG Catch and generalized origin location of US stocked Lake Trout captured in Fish Community Index Gill Netting (Section 1.2) gill net sets. Black circles indicate the catch location. Open circles indicate the generalized stocking area. The single grey triangle indicates a Lake Trout captured that was initially stocked in Lake Erie YEAR Alew RbSme Other RGoby SlScul FIG Diet composition (percent composition by weight) of Lake Trout captured in Fish Community Index Gill Netting (Section 1.2) gill net sets. Section 8. Species Rehabilitation
173 165 on the recreational fishery for Lake Trout. Diaries were submitted from 15 anglers in 216. A total of 286 trips were recorded and 4 (14%) were reported as targeting Lake Trout. Trips that targeted Lake Trout occurred in all Sectors but 29 (73%) of the trips occurred in the Hamilton and Niagara Sectors. Anglers reported catching 74 Lake Trout, which was the fourth most abundant species after Chinook Salmon, Rainbow Trout and Coho Salmon in the 216 catch. Consistent with the Western Lake Ontario Boat Angling Survey, diary anglers reported releasing a large proportion (81%) of the Lake Trout caught. There is no commercial harvest of Lake Trout in Lake Ontario; however, some fisheries (primarily the gill net fishery) do capture Lake Trout as by-catch (non-target captures). Commercial fishers are required to report by-catch on their Daily Catch Record. A total of 5,141 lbs (2,332 kg) of Lake Trout were reported as by-catch in 216 (Fig ) and is the highest within the time series (24-216). Quota Zone 1-2 (see Section 3.2 for description of Quota Zones) makes up the largest proportion of the reported by-catch. Data on the size of the Lake Trout caught as by-catch is not available. However, using the mean weight of Lake Number Caught (x 1,) Year FIG Estimated catch and harvest of Lake Trout in the Western Lake Ontario Boat Angling Fishery survey. Percent Released Year Catch Harvest FIG Percentage of Lake Trout released in the Western Lake Ontario Boat Angling Fishery. Trout in the Fish Community Index Gill Netting (Section 1.2), by-catch in the commercial fishery was estimated at approximately 66 Lake Trout in 216. The expanded transects and depths in the Fish Community Index Gill Netting (Sections 1.2) provide an opportunity to contrast new sites with the established index sites. Overall, the size distribution of Lake Trout captured at western gill net sites was similar to the traditional index sites (Fig ). Gill net catch per standard set (standardized to 24 hrs) was variable within zones (Fig ) but the general trend is that Conway and Kingston Basin sites had a slightly higher mean catch than the main lake sites (Fig ). Noteworthy, however, is that comparisons of CUE among Zones is complicated by unbalanced sampling, and how CUE is influenced by depth (Fig ) and bottom temperature (Fig ). Weight (1s lbs) FIG By-catch of Lake Trout in the gill net fishery reported by commercial fishers on Daily Catch Records. FLEN Year Conway KBasin LakeEast LakeWest ZONE FIG Comparison of size distribution across Lake Ontario of Lake Trout captured in Fish Community Index Gill Netting (Section 1.2). Median value is indicated by the solid line. Boxes and whiskers capture 5% and 95%, respectively, of the values. Values beyond the 95% quantile are represented individually as solid circles. Specific transects have been assigned to broader groups (LakeWest = Port Credit, Cobourg, Brighton and Wellington; LakeEast = Rocky Point; KBasin= EB sites, Flatt Point, Grape Island and Melville Shoal; Conway = Conway). Section 8. Species Rehabilitation
174 166 6 Catch per 24 Hour Gill Net Set 4 2 ZONE Conway KBasin LakeEast LakeWest Mean Catch per 24 Hour Gill Net Set FIG Spatial distribution of Lake Trout catch per standardize 24 hr gill net set in the Fish Community Index Gill Netting Program (Section 1.2). Point shape indicates Zone. Point size is scaled to CUE Bottom Depth (m) FIG Relationship between net depth of bottom set gill nets and Lake Trout catch per standardized 24 hr gill net set combined for all sites in Fish Community Index Gill Netting (Section 1.2). The trend line has been fitted with a non-linear loess fit. 6 Catch per 24 Hour Gill Net Set 4 2 Conway KBasin LakeEast LakeWest ZONE FIG Comparison of catches of Lake Trout per standardized 24hr set time Lake Ontario captured in Fish Community Index Gill Netting (Section 1.2). Median value is indicated by the solid line. Boxes and whiskers capture 5% and 95%, respectively, of the values. Values beyond the 95% quantile are represented individually as solid circles. Specific transects have been assigned to broader groups (LakeWest = Port Credit, Cobourg, Brighton and Wellington; LakeEast = Rocky Point; KBasin= EB sites, Flatt Point, Grape Island and Melville Shoal; Conway = Conway). Catch per 24 Hour Gill Net Set Bottom Temperature C FIG Relationship between water temperature at net depth of bottom set gill nets and Lake Trout catch per standardized 24 hr gill net set combined for all sites in Fish Community Index Gill Netting (Section 1.2). The trend line has been fitted with a non-linear loess fit. Section 8. Species Rehabilitation

175 Round Whitefish Spawning Population Study J. Wood, C. Wilson, Aquatic Research and Monitoring Section J. A. Hoyle, Lake Ontario Management Unit The genetic stock structure of Round Whitefish (Prosopium cylindraceum) in Lake Ontario was assessed to test for the potential presence of cryptic stocks in Ontario waters. Historical and contemporary samples collected from Round Whitefish from three locations in Lake Ontario (Darlington, Pickering, and Peter Rock, Fig ) during fall spawning were analyzed using microsatellite DNA markers. Individual-based analyses of multilocus genotypes failed to identify significant genetic differences or discrete genetic populations among Round Whitefish from the different sampling locations. Results of this study will help inform ongoing management of this native coregonid species. A final report on this work is available online at: repository/mon/31/33712.pdf FIG Map of Lake Ontario showing locations (Pickering, Darlington, and Peter Rock) of Round Whitefish tissue sample collections. Section 8. Species Rehabilitation
176 Hamilton Harbour Walleye Reintroduction J. A. Hoyle, Lake Ontario Management Unit J. L. Brooks, Carleton University, Ottawa D. T. Reddick, Fisheries & Oceans Canada, CCIW, Burlington Past Restoration Efforts Walleye declined in Hamilton Harbour in the early 19s and were not observed in various fish surveys conducted during the mid-19s. Walleye were reintroduced in Hamilton Harbour through adult transfer and spring fingerling stocking of Bay of Quinte strain in the 199s (Table 8.7.1). This initial stocking effort was part of the local Remedial Action Plan (RAP) objective to increase top predators in the Hamilton Harbour fish community. All Walleye subsequently caught in trap net assessments during 26 and 28 had DNA showing Bay of Quinte origin, consistent with the 199s stocking program. Walleye abundance declined and disappeared from the trap net surveys between 26 and 212 (Fig ). Current Restoration Efforts Since 212, Walleye stocking has been conducted annually and included a variety Walleye life-stages (Table 8.7.1). In 216, 1, 1-month (stocked on May 25) old fry and 115,722 summer fingerlings (June 3) were stocked. Monitoring and Assessment Nearshore Fish Community Index Trap Netting (NSCIN) NSCIN was conducted on Hamilton Harbour in August 216 (see Section 1.4). A mean catch of 4.6 Walleye per trap net was observed (Fig ). This exceeds the Fish per trap net Restoration target Year FIG Walleye catch (number of fish per trap net lift) for years indicated. TABLE Walleye stocked into Hamilton Harbour, and target for 216*. Year Month Life-Stage Mean weight (g) Number of fish Source 1993 October adult transferred from Bay of Quinte 1994 October adult 1,5 129 transferred from Bay of Quinte 1997 October adult 9 13 transferred from Bay of Quinte 1998 September adult 1, transferred from Bay of Quinte 1999 July 3-months.5 6, White Lake FCS (Bay of Quinte strain) 212 July 3-months 1. 1, White Lake FCS (Bay of Quinte strain) 212 November adult 1,5 74 White Lake FCS (Bay of Quinte strain) 213 July 3-months.5 1, White Lake FCS (Bay of Quinte strain) 214 June Swim-up fry n/a 95, White Lake FCS (Bay of Quinte strain) 215 May Swim-up fry n/a 1,17,625 White Lake FCS (Bay of Quinte strain) 215 July 3-months.3 52,963 White Lake FCS (Bay of Quinte strain) 216 May Swim-up fry n/a 168, White Lake FCS (Bay of Quinte strain) 216 June 3-months ,722 White Lake FCS (Bay of Quinte strain) Section 8. Species Rehabilitation
.")
177 169 restoration target of 2 fish per net established prior to commencement of the 212 Walleye stocking initiative. The mean catch of 4.6 fish per net also compares favourably to that from other Lake Ontario and St. Lawrence River nearshore areas (see Section 1.4 and Section 7.4). Fourteen of the 24 trap net sets in Hamilton Harbour caught at least one Walleye (Fig ). Walleye were captured throughout Hamilton Harbour where suitable trap net sampling locations were located. Largest catches occurred at a trap net in the extreme west end of the harbour (n=59) and in two nets set at an extreme east end location (n=17 and 9). Hamilton Harbour Lake Ontario Age was interpreted (otoliths) for a random sample of 31 of the 111 Walleye caught. These 31 fish ranged in length from 474 to 571 mm fork length. All were age-4 and likely from the 212 stocking event. Walleye caught ranged in size from mm fork length (mean 534 mm; Fig ). Comparing the size of the 4-year-old fish with the length distribution of all 111 fish caught suggested that all but one of the Walleye were age-4. A single larger, presumably older, Walleye (fork length 61 mm) was also caught. Results of the 212 Walleye stocking continue to be very successful. Subsequent stocking events have been less successful to date. Seventeen of 22 males and eight of nine female Walleye were judged to be mature in August 216 and capable of spawning in spring 217. As in 215, some of the Walleye caught in 216 were provided to Fisheries and Oceans staff for an acoustic tagging study. Spawning Assessment In April 216, Fisheries and Oceans (DFO) completed the first walleye spawning assessment in Hamilton Harbour to determine if the stocked walleye population would be attempting to spawn, as a successful cohort was approaching the appropriate age and size to reproduce. Electrofishing was used to sample along the shoreline in 1-3 m water depth, beginning a halfhour after dark until 1:am EST. Water clarity prevented visual observation for walleye congregations, so 1 second transects were FIG Map of Hamilton Harbour showing number of Walleye caught, in August 216, at each trap net location. A total of 111 Walleye were captured. Map courtesy of Google Earth. used to locate congregations of walleye. Due to time constraints, sampling was focused on the eastern shoreline south of Indian Creek along Eastport Drive to the Port Authority cells, along the western shore south of the Desjardin Canal to Bayfront Park boat ramp, and along the south shore from the Bayfront boat ramp to Macassa Bay, and within the Ottawa street slip. Water temperatures ranged from 6.8 and 11.1 o C at all locations except the Ottawa Street slip which was 15 o C, due to the warm water outflow from the steel mill. Walleye were captured along all shorelines. A total of 56 walleye were observed, 49 of which were captured for non-lethal sampling purposes (Table 8.7.2). Of the 49 fish captured, 2 were ripe females, and 48 were ripe males. Despite differing weather conditions and variable water temperatures, walleye congregations were located at the same general sites, both nights of sampling along the eastern shoreline, suggesting spawning behaviour. These fish ranged in length from 42 to 62 mm fork length (Fig ). One large male walleye above the size range expected was captured along the western shore with a total length of 65 mm and a weight of 396 g. Acoustic Tagging Study Acoustic biotelemetry allows continual, year-round, monitoring of fish locations. Beginning in summer 215, 5 sexually mature Section 8. Species Rehabilitation
178 17 Fish per trap net Fish per trap net Number of fish Fish per trap net (August) Fork length (mm) 215 (August) Fork length (mm) 216 (April) Fork length (mm) (August) Fork length (mm) FIG Size distribution of Walleye caught during NSCIN trap net surveys conducted in Hamilton Harbour in August of 214, 215 and 216, and during the Walleye spawning assessment in April 216. Walleye have been captured during the OMNRF s trap netting and DFO s electro-fishing efforts and internally tagged with acoustic transmitters (V13 transmitters, 13 mm diameter, 48 mm length, 3- year battery, Vemco, Halifax, NS). Fixed acoustic biotelemetry receivers (Fig ) have been placed throughout and adjacent to the Harbour to determine seasonal residency patterns of Walleye, with a particular focus on identifying aggregation areas during the spawning season. Receivers were downloaded in October 216 and have shown some interesting preliminary results. Of the first 25 tags deployed in 215, 17 survived the tagging process and 16 of these remained within the boundaries of Hamilton Harbour throughout the spring (216) spawning period. Six of these individuals had exited the Harbour, east through the canal, towards the end of September (216). Hamilton Harbour experiences hypoxia and anoxia issues, particularly during the stratification period during the summer, therefore we suspect this may have pushed the Walleye out of the area. Of the 25 Walleye tagged in the summer of 216, 23 survived, and eight of these also exited the harbour in late August, potentially for the same reason. The receiver download in April, 217 will Section 8. Species Rehabilitation

179 171 TABLE Electrofishing sampling summary for the April 216 Walleye spawning assessment in Hamilton Harbour. Location Sampling period Fish observed Fish captured Total sampling time Eastern shore Night seconds Night seconds Western shore Night 1 Not Sampled Not Sampled Not Sampled Night seconds Southern shore Night seconds Night seconds Total All Nights determine if these Walleye had returned after the fall breakdown of the harbour s thermal stratification. Fig shows the interpolated hourly points for the initial 17 walleye (deployed in 215) movements from fall 215 to summer 216. Concluding Remarks An adequate level of top fish predators, such as Walleye, helps to achieve a balanced trophic structure in the fish community, and also complements local remedial action to improve water quality and restore fish habitat in Hamilton Harbour. All indications to date are that the 212 Walleye stocking effort in Hamilton Harbour was highly successful in terms of survival and growth rates. An ongoing plan is in place to monitor contaminant levels for the Hamilton Harbour Walleye. To help further evaluate stocking success, local anglers are encouraged to report on any Walleye caught in Hamilton Harbour. The next trap net survey is planned for 218. Spawning assessment and acoustic biotelemetry studies are on-going. Of particular interest, moving forward, is identification of Walleye survival bottlenecks during early life history stages. FIG Interpolated points of 17 walleye (Sander vitreus) positions per hour between October 215 and October 216. Crosses illustrate acoustic receiver locations. It is important to note that tagged walleye may be using the coastal areas on the outside of this array perimeter, however, the type of interpolation we have used repositions their location within this outer boundary. Section 8. Species Rehabilitation
180 Lake Sturgeon C. Lake and M. Hanley, Lake Ontario Management Unit Lake Sturgeon (Acipenser fulvescens) were a key component of the fish community in Lake Ontario and the Upper St. Lawrence River in the past, but are now listed as threatened under the Endangered Species Act (ESA) in this area. As is outlined in the recovery strategy (RS) for Lake Sturgeon the recovery goal for Lake Sturgeon in Ontario is to maintain existing Lake Sturgeon populations throughout their current range and where feasible, to restore, rehabilitate or reestablish, self-sustaining Lake Sturgeon populations which are viable in the long term within their current habitat and/or within habitats they have historically occupied, in a manner consistent with maintaining ecosystem integrity and function. For more information on the RS of Lake Sturgeon, please visit environment-and-energy/species-at-risk/ stdprod_8634.pdf. In order to achieve the goals set out in the RS for Lake Sturgeon, more information is needed related to the current distribution and abundance. LOMU aims to add to this knowledge through tagging and tracking adult Lake Sturgeon. Through the use of acoustic tags, information on movement and habitat use of Lake Sturgeon in the Bay of Quinte will be collected, which will help to address key knowledge gaps identified in the RS and will contribute to the continued rehabilitation of this species. Queen s University, with MNRF assistance, deployed 16 acoustic receiver arrays in the Bay of Quinte and Eastern Lake Ontario during early summer 215. Arrays were installed to monitor movements of Smallmouth and Largemouth Bass, however, they also allow monitoring of any species fitted with a compatible tag. Information on movements of Lake Sturgeon (as they are highly migratory) would address knowledge gaps identified in ESA RS s and assists in the development of actions that will promote their recovery. A better understanding of how Lake Sturgeon fit into the existing fish community in the Bay of Quinte, would help evaluate the potential use of stocking to reintroduce sturgeon into others areas and help identify important habitats to inform restoration efforts. Acoustic tagging has significant advantages over traditional techniques in addressing these knowledge gaps for Lake Sturgeon. Monitoring the movements of adult Lake Sturgeon could contribute to the knowledge needed to properly identify areas that are suitable for the restoration of Lake Sturgeon in waters they have formerly occupied and are capable of providing habitat requirements for all life history stages. From May 16 to May 27, 216, hook lines were deployed in the Trent River in order to capture adult Lake Sturgeon for implantation of acoustic tags. Hook-lines were set downstream of the dam in the Trent River over a distance of approximately 1.3 kilometers (Fig ). Circle hooks were attached to each main line at approximately 1 m intervals and were baited with salted or unsalted alewife or chicken hearts. Each main line had between individual hooks (average = 2), adjusted as required by site. The hook lines were anchored at each end with chain anchors and were left for approximately 24 hours. In addition to the use of hook lines, electrofishing was done throughout the survey area in an effort to capture Lake Sturgeon. During the survey period, electrofishing was conducted on six days for a total of minutes (avg min/day). Unfortunately over the course of the two week field season, no Lake Sturgeon were captured. The hook-lines had very little nontarget species by-catch; only 1 Freshwater Drum was captured on this gear. While electrofishing, a number of species were captured. The most predominantly captured species included various Redhorse species, Longnose Gar, Common Carp, American Eel, and various sunfishes. Muskellunge, Walleye, and Smallmouth Bass were also captured, but in lower incidences than the other species listed above. Section 8. Species Rehabilitation

181 173 FIG Locations of hook-lines deployed in the Trent River in 216 Section 8. Species Rehabilitation
, Aaron Fisk, Scott Colborne (Great Lakes Institute for Environmental")

182 Research Activities 9.1 Bloater Restoration: Using Acoustic Telemetry to Understand Post-stocking Behaviour Project leads: Tim Johnson (OMNRF-ARMS), Aaron Fisk, Scott Colborne (Great Lakes Institute for Environmental Research, University of Windsor), Eddie Halfyard (The Nova Scotia Salmon Association) Collaborators: Lake Ontario Management Unit, New York State Department of Environmental Conservation Funding: Great Lakes Protection Act / Canada- Ontario Agreement, Great Lakes Fish and Wildlife Restoration Act, Great Lakes Fisheries Commission Historically, a diverse assemblage of Deepwater Ciscoes (5 species), including Bloater (Coregonus hoyi), inhabited Lake Ontario. Since that time, only the shallow water form (C. artedi) remains. OMNRF and New York State Department of Environmental Conservation have jointly developed a plan to re-establish a selfsustaining Deepwater Cisco population with a target to stock 5, juvenile Bloater annually (see Section 8.4). One question requiring investigation is what will happen to the stocked fish after introduction. Do hatchery fish survive in the wild? How does survival change over time? Do they quickly disperse or do they stay close to their stocking site? Do they school closely together and move as a group? What is their seasonal habitat use and occupied depth and temperature? Answering these questions using acoustic telemetry is the focus of this research. This update provides initial analyses of data obtained between November 215 and May 216; the next scheduled download of the receivers is in May 217. In November of 215 we tagged 7 yearling Bloater (mean length 174 mm) with either Vemco V7- or V9-69 khz tags, and released those fish, along with ~1,7 untagged yearlings and ~38, untagged fingerlings into the centre of a pre-established acoustic array in eastern Lake Ontario (Fig ). The receiver array (n=8 Vemco VR2W 69 khz receivers) detected 68 of the 7 tagged Bloater, amounting to 577,361 detections over the 6 ½ months. November, the month of release, had the highest number of detections, followed by May (the month of recovery) with lower numbers of detections during the winter months (Fig ). Initially, the highest number of detections was near the point of release, but within 1.2 days Bloater were detected in the northern portion of the St. Lawrence channel, representing the maximum extent of the array (linear distance 13.6 km from point of release). We estimate that 55% FIG Acoustic receiver layout in the St Lawrence Channel of eastern Lake Ontario used to assess post-stocking behaviour and survival of Bloater, Coregonus hoyi. The array consists of eighty 69 khz receivers. The star indicates the point of release, while the circles indicate receivers that were downloaded in May 216 to assess initial post-stocking behaviour. FIG Monthly sum of detections (bars) and number of unique Bloaters detected per month (numbers within bars). Section 9. Research Activities
183 175 of the tagged Bloater emigrated from the array (average 12.9 ± 31.8 days post release, range.4 to d). Bloater appear to have largely emigrated along the long-axis of the channel, with about half of the fish moving toward the Lake Ontario main basin. Preliminary analyses suggest the stocked Bloater were more likely to occur where other Bloater were detected, suggestive of a schooling behaviour characteristic of wild populations. At the time that the array was downloaded (6 ½ months post-release), eight tags (12%) were actively moving within the array. If we exclude the individuals that emigrated from the array (for which we are unable to assign fate), six-month survival would be estimated at 26% (8/31). More unique tags were detected in May (n=23) than in any month other than November when the Bloater were released, suggesting that some fish returned to the array in May further substantiating our interpretation that some of the Bloater survived beyond the 6 ½ month study period. All receivers downloaded in May were redeployed, along with 23 additional receivers to continue to track the behaviour and survival of stocked Bloater. In November 216, 161,68 Bloater (see Section 8.4) were stocked by MNRF including 24 tagged fish. Half of these tagged Bloater contained V9 detection tags used in 215, while the other half contained V9-pt tags which report on the depth and temperature of the fish as it moves through the array. This information will further our understanding of factors influencing the behaviour and distribution of Bloater. Additional funding from the Great Lakes Fishery Commission will enable us to tag additional Bloater in 217 and 218, while also collecting in situ environmental and biological data further informing our knowledge of Bloater ecology and their potential to re-establish in Lake Ontario. With support from Ontario s Great Lakes Protection Act and NYSDEC, we tagged 3 adult Lake Trout on spawning shoals in the vicinity of our array, with the hope that we will learn more about the interaction between Bloater and Lake Trout; a predator that historically preyed upon Bloater in Lake Ontario. We expect to tag more Lake Trout and sub-adult Chinook Salmon in 217 and will report on all three species in future Annual Reports. Section 9. Research Activities
184 Understanding Depth and Temperature Preference of Lake Ontario Salmonids Using Novel Popoff Data Storage Tags Project leads: Tim Johnson (OMNRF-ARMS), Aaron Fisk, Graham Raby, Tom Stewart (Great Lakes Institute for Environmental Research, University of Windsor) Collaborators: New York State Department of Environmental Conservation Funding: Great Lakes Protection Plan / Canada- Ontario Agreement, Great Lakes Fisheries Commission Lake Ontario contains six salmonid species, with potential for inter-species competition for food resources. Recreational fisheries for Chinook Salmon (Oncorhynchus tshawytscha) and Rainbow Trout (Oncorhynchus mykiss) are sometimes perceived to be in conflict with efforts to rehabilitate Atlantic Salmon (Salmo salar) and Lake Trout (Salvelinus namaycush), owing to concerns about competition for food and spawning habitat. Understanding the movement, behaviour, and habitat preferences of these species in a large and ever-changing ecosystem like Lake Ontario is not an easy task. Pop-off data storage tags (pdst) became available for freshwater fish for the first time in 213 and provide an opportunity to collect new and unprecedented information on depth and temperature of fishes in the wild. These pdst record data at specified time intervals and then release from the fish on a programmed date, floating to the surface where they can be recovered. In the first year of the study, 214, we attached 22 pdsts to trout and salmon in Lake Ontario, with the tags programmed to record depth and temperature every 7 s before popping off the fish after one year. Recovery of these tags has relied on tags being found and returned by the public a $1 reward has been offered as an incentive. Among the 22 fish tagged in 214, six tags were recovered (27%) among these six, the longest interval between tagging and tag recapture was 466 days. Among 56 fish we tagged in 215 (scheduled pop off in summer or fall 216), 15 have thus far been returned to us (27%), although we expect a few more of these tags to be found in the spring and/or summer of 217. In our final year of tagging (216), we deployed an additional 4 tags, which are not scheduled to pop off until July 217. In total, we have tagged 118 fish with 33 tags recovered at the time of writing (Table 9.2.1). The tags recovered in each year have been a mixture of: a) fish caught by anglers with tags still attached (n=7), b) tags found on shore, popped-off as scheduled (n=11), c) tags found on shore, popped/broken off prematurely (n=2), and d) tags found on shore with the bridle still attached, indicating the fish likely died at some point after release (n=13, all hatchery fish) (Fig 9.2.1). The most obvious trend that appears when visually examining the data for each fish is a remarkable variation within and among individuals in vertical distribution and behaviour (Fig ). For instance, some individuals will exhibit strong diel (day-night) vertical movement patterns while other individuals show little or no diel behaviour (Fig ). TABLE Number of fish tagged and tags recovered, by species in Lake Ontario between 214 and 216. Days elapsed is the range of days between when then fish was released and the tag recovered. Linear distance is the straight line distance from the point of release of the tagged fish and the reported location where the tag was found, and should not be viewed as an indicator of fish movement. Number tagged Number recovered Days elapsed Linear distance (km) Chinook Lake Trout wild Apr-66 Lake Trout hatchery Atlantic wild Atlantic hatchery Rainbow Trout Brown Trout Oct-45 Section 9. Research Activities
 each recapture point (the large symbols) indicates the number of days between release and recapture of the tag/fish.")
185 177 FIG Maps of release and recapture locations for pdsts for Chinook Salmon (upper left), Lake Trout (upper right) and Rainbow and Brown Trout (combined, lower) in Lake Ontario The numbers shown above (or adjacent to) each recapture point (the large symbols) indicates the number of days between release and recapture of the tag/fish. Bridle refers to the plastic components used to externally attach to the fish via plastic monofilament lines running through the dorsal musculature. FIG Depth distribution for two different Chinook Salmon during the month of July 215. The dark bands represent nighttime, while the white bands represent daytime. Section 9. Research Activities
.")
186 178 As expected, some differences among species emerge (Fig ). The two species for which we have the greatest number of returned tags are Chinook and Lake Trout (nine and six respectively, among Charter-caught fish). These show clear differentiation in thermal and vertical habitat use at most times of the year. In general, Lake Trout seem to be much less active than Chinook in terms of vertical movements, often staying within 1-2 m of the same depth for an entire day, whereas Chinook frequently undergo vertical movements of 1-2 m or more. Median depth for Chinook ranged between ~1-2 m during the summer fishing months (May through September), whereas the median depth for Lake Trout was ~2-4 m, although, there was some overlap in the depth distribution for the two species in most of these months (Fig a). As expected, Rainbow Trout and especially Brown Trout appear to be more surface oriented than either Chinook Salmon or Lake Trout, but we have very few tags on which to base these generalizations at this point (Fig a). One between-species difference that is very clear from the tags we have been able to retrieve so far is the enormous divergence in vertical behaviour and thermal experience between Chinook Salmon and Lake Trout during the winter (Fig a and b). Chinook Salmon primarily occupied waters in the 4-5 C range, while Lake Trout were mostly confined to the -4 C range. More interestingly, Chinook appear to forage very actively in the winter and in the deeper parts of the lake, based on the enormous depth ranges (Fig a) exhibited by fish on a monthly, daily, and even hourly basis (for an example of this behaviour see Fig ). FIG Species comparison of depth (upper) and temperature (lower) distributions by month. The numbers along the bottom of each plot indicate the number of unique fish represented in the dataset for each month. The centre-line in the boxplots shows the median value, the upper and lower ends of each box represent the 75th and 25th percentiles, respectively, and the whiskers show either the maximum/minimum value or 1.5 times the inter-quartile range (the length of the box), whichever is closer to the median. In most cases, additional values are shown beyond the whiskers (i.e., beyond 1.5 the inter-quartile range). Traces for each tag were manually inspected and data removed after the tag released from the fish or after the time the fish was caught. Likewise, the first 1 days of each tag s data was trimmed off to allow the fish a recovery period following capture and tagging. Section 9. Research Activities
, while the (virtually-flat) bottom line corresponds to temperature (right axis).")
187 179 FIG Depth and temperature data for one week in February 216 for a Chinook salmon in Lake Ontario. The top line corresponds to the left axis (depth), while the (virtually-flat) bottom line corresponds to temperature (right axis). Daytime is marked by white vertical bands, while nighttime is marked with grey bands. Date (year-month-day) and time are shown on the x-axis. Given that 28 more tags are scheduled to release from fish in 217 and that a few more already-released tags may be found and returned throughout 217, analyses of these data aimed at quantifying interspecific, seasonal, and diel differences in depth and temperature will not be finalized until early 218. The data collected through this study will be used to provide never before seen detail of the temperature and behaviour of these trout and salmon species in Lake Ontario. Such information can be used to drive bioenergetic models to understand growth rate potential and food consumption rates, as well as an improved understanding of the potential resource overlap among multiple species. Modelled results will help us better understand the interaction amongst predators and between predators and their food, as well as how species may respond to climatic and other environmental changes. Section 9. Research Activities

188 An Interactive Tool for Assessing the Energetic Demand of Stocked Predators in Lake Ontario Project Leads: Jeff Buckley & Tim Johnson (OMNRF-ARMS) Partners: Lake Ontario Management Unit, New York State Department of Environmental Conservation, United States Geological Survey. Funding: OMNRF-ARMS base Lake Ontario and its tributaries provide world-class angling opportunities and fuel a multi -million dollar recreational fishery. Alewife, the most abundant prey fish species in Lake Ontario, is a major prey item for these salmon and trout species; however, each salmon and trout species utilizes this prey resource differently throughout their life histories. As changes to stocking levels occur and the effectiveness of net pen stocking is better understood, the Lake Ontario Committee expressed interest in developing a tool, modeling the effects of different stocking scenarios on prey availability. In response, an interactive tool was developed to visualize how different stocking scenarios (total numbers stocked and which species) could affect the total consumption of prey species (specifically Alewife). The outputs from these models will aid lake managers in stocking decisions with the ultimate goal of maintaining predator-prey balance in Lake Ontario. The tool uses an underlying bioenergetics model based on the diet, physiology, and survival of predator species. The tool uses input stocking numbers for six predator species: Chinook Salmon (Oncorhynchus tshawytscha), Coho FIG User interface for the primary predator energy demand tool. Bar graph shows the total annual consumption by stocked predators. Past consumption is based on historic stocking data. Future consumption is updated in real time with slider inputs of stocking numbers for each species/year. Section 9. Research Activities


189 181 Salmon (O. kisutch), Atlantic Salmon (Salmo salar), Lake Trout (Salvelinus namaycush), Rainbow Trout (O. mykiss), and Brown Trout (Salmo trutta). With these data it calculates the total annual consumption for each predator. The tool requires no previous knowledge of bioenergetics models, but allows managers to easily use them to model effects of different predator stocking scenarios. Fig shows the primary user interface of the tool. Users can set individual stocking levels for each predator up to five years into the future. The bioenergetics model output is translated into a simple timeline showing the expected predator demand, which includes past consumption based on historic stocking data, and expected consumption up to 1 years into the future. The tool also contains a secondary interface that allows the user to visualize the change in consumption for a predator species given different long-term, consistent, stocking levels. For example, Fig a shows the reduction in consumption by stocked Chinook Salmon when a 25% reduction from current stocking numbers is applied for the next five years. Fig b shows how the same decrease in Lake Trout stocking over the next five years would affect consumption. Despite a decrease in stocking by an equal proportion of fish in both scenarios, a decrease in Chinook is expected to result in a substantially larger decrease in prey consumption as individual Chinook Salmon eat a significantly larger amount of prey than Lake Trout over their lifetime. (a) (b) FIG Secondary user interface for the predator energy demand tool. Graph shows total consumption by Chinook salmon (a) and Lake Trout (b). User selects a species and inputs two stocking scenarios. Output figure shows predicted change in consumption for each scenario (white and black area graphs) over the following decade given a consistent use of input stocking numbers. Section 9. Research Activities
 Collaborators: Lake Ontario Management Unit, Toronto and Region Conservation")
190 Comparative Ecology of Juvenile Salmonids in Lake Ontario Project leads: Changhai Zhu & Tim Johnson (OMNRF-ARMS) Collaborators: Lake Ontario Management Unit, Toronto and Region Conservation Authority, New York State Department of Environmental Conservation Funding: Great Lakes Protection Act / Canada- Ontario Agreement Lake Ontario contains two native (Atlantic Salmon (Salmo salar) and Lake Trout (Salvelinus namaycush)) and four introduced salmonid species (Chinook Salmon (Oncohynchus tshawytscha), Coho Salmon (O. kisutch), Brown Trout (Salmo trutta), and Rainbow Trout (O. mykiss)). These fish species are important both ecologically and economically. Adult salmonids function as top predators in the Lake Ontario fish community and support a large recreational fishery. While the stream dwelling juvenile life stage and lake dwelling adult life stage have both been well studied, very little is known about the ecology of these fish at the juvenile life stage when they first exit natal streams and begin their lake dwelling phase. This transition from lotic to lentic habitats likely bring with it new challenges (e.g., possibly different food resources, fish community inhabitants, and fish community interactions) that may influence their success later in life. Improved understanding of this life stage could provide valuable insight into the ecology of these species and improve our knowledge of fish production. To address this knowledge gap we collected diet and stable isotope samples from lake dwelling juvenile fish throughout the course of three summers ( ) largely from Canadian waters of Lake Ontario. With these data we explored ecological differences in morphology, feeding, and trophic position amongst juvenile salmonid species during the first year of their residency in Lake Ontario. We utilized a variety of metrics to build a cohesive ecological story. Length/weight relationships and body size were used to approximate growth rates. Stomach contents and stable isotopes were used to examine variation in diet composition as well as niche space occupancy and overlap among juvenile salmonids. Additionally, energy density was used as a measure of overall well-being. By using this suite of metrics, our interpretation of inter- and intra-specific differences in growth and diet was robust, and provided greater confidence in ascribing differences to intrinsic and environmental variability in the nearshore of Lake Ontario. Between May 212 and October 214, a total of 1,881 salmonids were collected from over 3 different locations across Lake Ontario (Fig ). Multiple sampling gears (e.g., small-mesh gillnets, beach seines, electrofishing) were used to target juvenile salmonids. Using break-point analysis on our entire catch we determined that FIG Map of Lake Ontario and sampling sites. Size of diamonds are related to the number of fish sampled at each location. Very small: < 2, small: 2-49, medium: 5 99, large: > 1. Section 9. Research Activities


191 183 the transition to piscivory (a diet composed entirely of prey fish) was essentially complete in fish >32mm in length. Thus, we termed fish <32 mm juveniles and limited our analysis to these 449 individual fish. We further subdivided the juveniles into three size groups based on the level of piscivory that was observed. Fish less than 1 mm consumed no fish and were classified as small. Fish between 1-2 mm showed some evidence of piscivory and were classified as medium. Fish larger than 2 mm exhibited a high degree of piscivory and were classified as large. While all salmonid species generally exhibited isometric growth (weight increased as the cube of length), Lake Trout and Brown Trout were slightly heavier at a given length than the other species. Diet compositions suggested this may be due to their tendency to shift to a diet dominated by prey fish at a smaller size compared to the other salmonid species. Stomach contents were fairly uniform and similar amongst species within the small size category (Fig ). All salmonid species underwent a diet shift from predominantly aquatic insects when they were small to predominantly fish as they grew larger. As a species, Rainbow Trout has the most diverse diets, with invertebrates continuing to contribute prominently in all size categories. Energy density (J g -1 body mass) increased throughout the year (even after controlling for increases in fish size). From an ecological perspective, this suggested that prey availability was likely not limiting in terms of quality or quantity since fish were able to exceed the caloric intake necessary to support basic metabolic functions. Amongst the five species, Brown Trout had higher energy densities than all others (except for Atlantic Salmon, which were assumed to be of recent hatchery origin based on isotopic signatures). The high proportion of prey fish in Brown Trout diets likely contributed to their elevated energy densities. Overlap of isotopically derived niche space was high and generally indicated that the juvenile salmonids occupied a similar trophic level and that they derived their energy from similar sources (Fig ). That said, Lake Trout and Brown Trout had the most unique isotopic niches although the differences were not statistically significant. In the case of Lake Trout this could have been due to their unique life history at this age (i.e., juvenile Lake Trout do not have a stream dwelling life stage, and occupy habitats further offshore than the other species). In the case of Brown Trout the uniqueness of the niche is more difficult to explain and may simply be a spurious result of the inclusion of some fish of suspected recent hatchery origin. Overall, the five salmonid species appear to have similar growth rates, condition, diets, and utilize similar resources. The differences that were observed tended to be in individual metrics (e.g., diet composition) rather than across all traits for a given species suggesting that none of the salmonid species greatly differed from the others in terms of diets, resources consumed, energy (a) (b) (c) FIG Proportion by volume of prey items found in stomachs of juvenile salmonids in three size classes: a) <1 mm fork length, b) 1-2 mm fork length, and c) 2-32 mm fork length. Section 9. Research Activities
192 184 FIG % probability ellipses for juvenile salmonid stable isotope signatures. stores, or growth and development. These results suggest that at this life stage, all of the salmonid species present in Lake Ontario have the potential to use and consume similar resources. Section 9. Research Activities
193 Station 81: Long-term Monitoring at the Base of Lake Ontario s Food Web Project leads: Carolina Taraborelli & Jeff Buckley (OMNRF-ARMS) Collaborators: Lake Ontario Management Unit, Fisheries and Oceans Canada Funding: OMNRF-ARMS base, Great Lakes Protection Act / Canada-Ontario Agreement Lower trophic levels, including algae and zooplankton, fill an essential role in the Lake Ontario food web. These biological communities are the primary source of food to many important prey fish species. Therefore, an understanding of the lower trophic levels aids in the management of larger piscivorous species. Long-term monitoring is an important tool in understanding how changes in the physical and chemical condition of a lake affect the food web. Beginning in 1981, Fisheries and Oceans Canada (DFO) began reporting on the lower trophic levels, as well as physical and chemical condition of Lake Ontario at Station 81 (Fig ). Sampling continued each summer until 1995 when the program was cancelled. Data collected through this monitoring program culminated in a report that demonstrated the response of lower trophic levels to the large decrease in phosphorous loadings in the lake and the initial establishment of dreissenid mussels (Johannsson et al. 1998). with the Lake Ontario Management Unit and DFO. Station 81 is located in the centre of the eastern basin of Lake Ontario (44º 1.2 N, 76º 4.23 W; Fig ). In 216, samples were collected bi-weekly from May 1th to October 19th. Data collected included profiles of temperature, dissolved oxygen, chlorophyll-a (an index of the amount of algae), Secchi depth (transparency), water samples for nutrient analysis, and samples describing the phytoplankton and zooplankton communities. In 216, stratification of the water column was first observed on June 14th and was last observed on October 3rd. Secchi depth varied between 5 m and 18.5 m, with a mean of 8.7 m. Mean daily water temperature ranged from 6.1 C to 23.2 C, with the highest average temperature observed on August 8. Nutrient, phytoplankton, and zooplankton samples are currently being analysed. Since 1981, an overall trend of increasing mean annual water temperature has been observed at Station 81 (Fig ). The lowest mean annual temperature was in 1982 (12.5 C), while the highest annual temperature was observed in 212 (16.2 C). In 27, OMNRF s Aquatic Research and Monitoring Section reinstated the long-term monitoring program at Station 81 in collaboration FIG Map of Lake Ontario showing location of Station 81. FIG Mean annual epilimnetic water temperature from 1981 to 216. Daily water temperature was calculated as the mean temperature of the water column from the surface to the thermocline, or to 2 m depth if no thermocline existed. Annual means were seasonally weighted between April 1 and October 31. Trend line is the least-squares linear regression of water temperature over time. Section 9. Research Activities
 have declined since the 197s in response to reduced")
194 186 Finally, long-term monitoring of the lake s tiniest biota can give us insight into how the lake s chemical and physical conditions influence the lake s biotic communities. Average annual chlorophyll a levels and average annual primary productivity levels (estimates of the lake s capacity to produce fish food ) have declined since the 197s in response to reduced nutrient levels in the lake. Both have, however, been relatively constant over the past decade (Fig ). Johannsson, O. E., Millard, E. S., Ralph, K. M., Myles, D. D., Graham, D. M., Taylor, W. D., Allen, R. E. The changing pelagia of Lake Ontario (1981 to 1995): A report of the DFO long-term biomonitoring (bioindex) program. Can. Tech. Rep. Fish. Aquat. Sci. No. 2243: i-ix+278pp. (a) (b) FIG a) Average annual chlorophyll a levels; and, b) average annual Primary Productivity levels measured at Station 81 (May - Oct.). Bars represent means with standard errors. Section 9. Research Activities
195 Understanding the Vulnerability of the Great Lakes and Ontario s Inland Lakes to Invasive Species Spread and Establishment Project leads: Jeff Buckley, Graham Mushet & Tim Johnson (MNRF-ARMS), Len Hunt & Allison Bannister (MNRF-CNFER), Andrew Drake (DFO) Funding: Great Lakes Protection Act / Canada- Ontario Agreement, Natural Heritage Policy Section Invasive species pose a threat to the function and diversity of aquatic communities. Over 2 species of fish, plants, and invertebrates are currently listed as potential aquatic invaders of Ontario and neighbouring jurisdictions in Canada and the U.S. Here we report on our continued progress to undertake on a vulnerability assessment of Ontario and the Great Lakes to the spread and establishment of aquatic invasive species. This project investigates both human facilitation of the introduction and spread of invasive species, as well as the environmental factors that mediate their survival and establishment. Previous work focusing on human dimensions examines how metrics of attraction and accessibility of lakes can define likely pathways of invasive species spread. For example, the size and location of towns and the quality and locations of destination lakes can influence the likelihood of aquatic invasive species arrival through recreational boating. More recent research has focused on assessing how the thermal habitat of inland lakes will change over time due to climate change as well as determining habitat suitability for invasive species in the Great Lakes. Climate change will affect the habitat of aquatic species as rising temperatures and changes in precipitation may increase access to new habitat for warm water species, while reducing or shifting habitat northward for cool and cold water species. Previously, Minns and Shuter (212) developed a seasonal temperature model (STM) to determine temperature characteristics of inland lakes in Ontario. The STM is used to estimate the volume of discrete thermal bins (i.e C) present in a lake given local climatic conditions and morphological characteristics of the lake. We applied the STM to lakes sampled through Ontario s Broad-Scale Monitoring program using climate projection data from three climate scenarios and three time periods. Lakes will see a significant decrease in cold water habitat (8-2 C), and complementary increases in warm water habitat (>25 C), with longer-term and more severe scenarios resulting in the greatest amount of change (Fig ). Modification of the STM was required to accommodate high temperatures predicted for the long-term (271-21) time period and in the minimal climate change mitigation scenario (rcp85). For the Great Lakes, habitat data for fish, invertebrates, and plants have been collected in the form of basin-wide geospatial layers (e.g., depth, temperature, relative exposure, light attenuation), and preliminary habitat suitability models have been developed to identify areas in the Great Lakes that provide optimal habitat for potential invasive species. An initial grouping of species and subsequent habitat suitability analysis has been generated for invasive fish. Taxa were first divided into thermal guilds (cold, cool, warm) (Fig a). These thermal guilds were then further divided into predominantly offshore or predominantly nearshore species. Wind and wave exposure were applied as a third criterion as they are also important determinants of fish habitat, and because they tend to correlate with other important variables such as substrate and submerged aquatic vegetation cover. Suitability scores were determined by computing the geometric mean of suitability scores representing habitat preference assigned to ranges of the environmental variables. An example habitat suitability analysis for a warm-water, nearshore fish that prefers lowenergy environments indicated that Lake Erie, Section 9. Research Activities
.")
 fish species classification scheme b) results from a habitat suitability analysis in the Great Lakes for a warm-water, nearshore fish that prefers protected environments (i.e. low relative exposure).")

196 188 (a) (b) FIG Gains (a) and losses (b) of thermal habitat Relative to current (27-215) habitat. Thermal habitat is measured in mean annual proportional volume of a given temperature range. Temperature projections are based on the medium climate mitigation scenario (rcp45). (a) (b) FIG a) fish species classification scheme b) results from a habitat suitability analysis in the Great Lakes for a warm-water, nearshore fish that prefers protected environments (i.e. low relative exposure). Areas with high suitability are indicated by the black boxes (Green Bay in Lake Michigan, Saginaw Bay in Lake Huron, Lake Erie west basin, and the Bay of Quinte in Lake Ontario). Lake Ontario, Lake Huron, and Lake Michigan provide low-quality habitat in the majority of their nearshore zones, whereas Lake Superior provides little-to-no habitat for a fish species of this type (Fig b). Areas of higher habitat suitability tended to be in large embayments in Lake Michigan, Lake Huron, and Lake Ontario, as well as in Lake St. Clair and the western basin of Lake Erie. Section 9. Research Activities


197 Development of New Fishway Counting Technology N.J. Jakobi and M.J. Yuille, Lake Ontario Management Unit Lake Ontario is home to a multi-million dollar recreational salmon and trout fishery and its tributaries provide spawning habitat to several migratory salmon and trout species (e.g., Chinook Salmon, Coho Salmon, Rainbow Trout and Brown Trout). In addition, LOMU is working to restore Atlantic Salmon to Lake Ontario. Understanding migration timings and patterns of these species is critical to evaluate the success of restoration efforts and to determine potential overlap between species when using essential spawning and nursery areas. Monitoring and counting these fish during their spawning migration provides LOMU with an index of the species population status in the lake proper. In the spring of 216, LOMU acquired the Riverwatcher Fish Counting system by VAKI (Fig ) to assist in identifying adult Atlantic Salmon returning to spawn in the Ganaraska River. The new counter will augment the current resistivity counter that has been traditionally used on the Ganaraska fishway (Corbett Dam, Port Hope, Ontario) for enumerating the spring Rainbow Trout spawning run (see Section 1.1.1). The Riverwatcher Fish Counting system automatically counts fish as they pass through the counting tunnel and records both a silhouette image and short high resolution video for each individual fish (Fig ). These features enable the user to identify species, sex, size and presence/absence of fin clips. The system also records water temperatures and estimates the total length of each fish from the silhouette image. The ability to identify the species of each fish passing through the Ganaraska Fishway will allow LOMU staff to determine whether any of the recently stocked Atlantic Salmon (see Section 6.1 and 8.2) have returned to spawn. With the assistance of the Ganaraska River fishway volunteer group and OMNRF FIG The VAKI Riverwatcher fish counter. FIG Silhouette and video image collected by the Riverwatcher fish counter to assist with species identification and length. Section 9. Research Activities
.")

198 19 Peterborough district staff, LOMU completed the on-site installation of the Riverwatcher in September, 216 (Fig ). LOMU staff field tested the new fish counter system during the 216 fall salmon and trout spawning run (Fig ). These tests showed the fish counter successfully counted fish over a wide range of sizes (estimated length range 9 to 127 mm), allowed the user to accurately identify each passing fish to species and recorded water temperature simultaneously. Data collected by Riverwatcher in the fall of 216 has confirmed that multiple salmon and trout species including Chinook Salmon, Coho Salmon, Rainbow Trout, Brown Trout and Pink Salmon utilize the Ganaraska Fishway to navigate upstream of the Corbett Dam to access spawning habitat. The data collected by the Riverwatcher Fish Counter system will be able to determine whether adult Atlantic Salmon are returning to the tributaries to spawn and to understanding species specific run timings and patterns. In the spring of 217, the Riverwatcher system will be calibrated to allow for comparison to the historical data series (see Section 1.1.1). The Riverwatcher system on the Ganaraska River will be fully operational by the fall of 217. LOMU is exploring the feasibility of installing and operating the Riverwatcher Fish Counter system in the Streetsville Fishway on the Credit River, Mississauga, Ontario. The Credit River was selected as a priority river for Atlantic Salmon restoration (see Section 8.2) and the use of this fish counter technology on that river will help evaluate the success of restoration efforts. FIG VAKI Riverwatcher fish counter and frame designed for the Ganaraska Fishway. FIG VAKI Riverwatch fish counter in the Ganaraska Fishway. Section 9. Research Activities
 worked in conjunction with MNRF s White Lake Fish Culture Station (FCS) to collect Bay of Quinte Walleye")
199 Partnerships 1.1 Walleye Spawn Collection J.A. Hoyle, Lake Ontario Management Unit In April 216 the Lake Ontario Management Unit (LOMU) worked in conjunction with MNRF s White Lake Fish Culture Station (FCS) to collect Bay of Quinte Walleye gametes. Similar projects were conducted in spring In 216, trap nets were set at six sites (Fig , Table 1.1.1): Sherman s Point, Trumpour Point, three locations on the high shore Prince Edward County, and Indian Point. The trap nets were set beginning on April 5 in shoreline areas thought to be inhabited by Walleye that were staging to spawn. Netting took place from April Water temperature ranged from o C over this time period. Walleye, in spawning condition, were brought by boat to the Glenora Fisheries Station. White Lake FCS staff collected gametes from 19 Walleye families. Approximately three million eggs were collected and transferred to the White Lake FCS. Walleye gametes collected in 216 will be used to supply walleye fingerlings for stocking in inland lakes. The 216 spawn collection will also provide wild gametes for restoration Walleye stocking in Hamilton Harbour. Twenty-one species and a total of 839 fish including 78 Walleye were caught in 216 (Table 1.1.2). Other commonly caught species included: Cisco (223), Yellow Perch (122), White Sucker (17), Northern Pike (52), Largemouth Bass (51), Black Crappie (45), Pumpkinseed (43), Bluegill (39), and Brown Bullhead (33). Catches FIG Map of Bay of Quinte showing trap net locations for the 216 Walleye spawn collection. Also shown is the location of a water temperature logger. Map courtesy of Google Earth. Section 1. Partnerships


200 192 TABLE Location and sampling information for the Bay of Quinte Walleye egg collection program, 216. TABLE Summary of fish captured (21 species) at six locations during the Bay of Quinte Walleye egg collection program, 216. Section 1. Partnerships

.")
 FIG. 1.1.2. Size distribution of (1 mm fork length categories) of 94 Walleye caught and measured during the egg collection program, April 216.")
 at 1 m depth, east side of Long Reach near Sherman s Point, March 18-April 3, 216. Section 1.")
201 193 in 216 are compared with those in 214 and 215 in Table A total of 23 species was caught in the last three years. TABLE Summary of fish captured (23 species) during the Walleye egg collection program, April 214, 215 and 216. The size distribution of 94 Walleye measured for fork length is shown in Fig Walleye sex (male, female, immature) and state of maturity information is shown in Table Water temperature was recorded continuously at a Long Reach shoreline site near Sherman s Point (Fig ). Water temperature increased to about 6 o C in late March then declined and remained lower for a period of time before increasing again after mid-april (Fig ) Male Female Unknown Count of fish Fork length category (mm) FIG Size distribution of (1 mm fork length categories) of 94 Walleye caught and measured during the egg collection program, April 216. Totals: 41 males, 41 females and 12 unknown sex. TABLE Sex and gonad classification (based on external characteristics) for 94 Walleye caught and sampled during the 216 Walleye egg collection program. FIG Mean daily water temperature (recorded at 1 hour intervals) at 1 m depth, east side of Long Reach near Sherman s Point, March 18-April 3, 216. Section 1. Partnerships
202 Observations of Aquatic Invasive Species in Lake Ontario M. Hanley, Lake Ontario Management Unit The Lake Ontario Management Unit continues to monitor both Lake Ontario and the Bay of Quinte for invading aquatic species. In 216, edna sampling was completed as a means to monitor the area for Asian Carp. In addition a report of a Tench (Tinca tinca) was received from the St. Lawrence River. Continued monitoring of Lake Ontario for Asian Carp through edna sampling Asian carps are a collection of carp native to China and Southern Russia which includes Grass, Bighead, Silver, and Black Carp. Asian carps were introduced in the United States in the 196s and 197s in an effort to control algae and zooplankton in aquaculture ponds. They have since become established in the Mississippi River Basin and throughout the eastern United States. In parts of the Mississippi River, they have been successful in replacing native species. There is concern that these species may become established in the Great Lakes due to their affinity for cool to moderate water temperatures. The nearshore Great Lakes region is similar to their native range and has been identified as suitable Asian carp habitat through risk assessment. Asian carp pose a threat to the Great Lakes due to their large size, their high fecundity, and their ability to consume large amounts of aquatic plants, algae, and plankton. These factors have led to concerns for the impacts of Asian carp on native species in Lake Ontario. Asian carps weight two to four kg but can weigh up to 4 kg and grow to more than a metre in length They are able to grow more than 25 cm in their first year alone. Asian carp are able to eat 2% of their body weight in plankton each day and reproduce very rapidly. For these reasons, there is concern that Asian carps could compete with native fish species in Lake Ontario if they were to become established. Bighead and Silver carp consume zooplankton and phytoplankton respectively while Grass carp eat aquatic plants and Black carp eat freshwater snails and mussels. Grass carp are able to eliminate large areas of aquatic plants that are important as fish food and as spawning and nursery habitats. Black carp could reduce the abundance of native snails and mussels as well as other invertebrates. Bighead and Silver carp could consume large amounts of the plankton biomass available as food for native fish species. All Asian carps can also compete directly with native fish for space and habitat. Fisheries and Oceans Canada (DFO), under its Asian Carp Program, conducts early detection surveillance activities to detect Asian carps in the Canadian waters of the Great Lakes basin as soon as possible after potential arrival and before a population could establish. A co-ordinated response system to evaluate any observations of Asian carp has also been established between DFO and MNRF. Conservation Authorities have also participated in these response activities. All these agencies conduct fisheries assessment and sampling activities in Lake Ontario. This type of lake-wide assessment, along with commercial fishers, also contribute to our ability to detect this invasive species. Although eight Grass Carp were captured in Lake Ontario in 215, in 216 no Asian carp were detected through netting methods completed by DFO in the Canadian Waters of Lake Ontario. In addition to the Asian carp targeted netting efforts of DFO and OMNRF electrofishing and netting methods, OMNRF monitors Lake Ontario and the Bay of Quinte for Asian carps using environmental DNA (edna). edna sampling detects DNA shed from fish species and uses various genetic markers to identify which fish species left behind the DNA sample. In this monitoring program, the water samples collected in each area are assessed for the presence of the genetic markers of each of the four species of Asian carps listed above. In aquatic environments, edna is diluted and distributed by currents and other hydrological processes, lasting about 7 21 Section 1. Partnerships

203 195 days, depending on environmental conditions. LOMU staff collected water samples during the weeks of August 29 to September 2 and September 5 to September 9, 216 following MNRF s edna monitoring and surveillance standard operating procedures (Wilson et al., 214). During these two weeks, 17 sites were sampled; locations within West Lake, East Lake, Presqu ile Bay, Weller s Bay, Trenton, Salmon River, Muscote Bay, and Marysville Creek were all surveyed (FIG ). The number of locations where a water sample was collected within each site is outlined in TABLE Water samples were filtered at OMNRF Aquatic Research and Monitoring Section Genetics Laboratory or at the Lake Ontario Management Unit. No genetic markers from any of the four species of Asian carps were detected at any of the sampled sites. Wilson, C., J. Bronnenhuber, M.Boothroyd, C.Smith, and K. Wozney Environmental DNA (edna) monitoring and surveillance: field and laboratory standard operating procedures. OMNRF Aquatic Research Series Capture of Tench in the St. Lawrence River On September 23, 216, the Lake Ontario Management Unit (LOMU) received a report of a possible Tench (Tinca tinca), an invasive fish, that was caught in Lake St. Francis near Bainsville, Ontario by a commercial fisher (FIG ). Using a photograph, the fish was identified as a Tench by MNRF (FIG ). The identity was confirmed by a professor at the University of Toronto that is conducting research on Tench. The fish was frozen and shipped to LOMU for further identification and biological sampling and the stomach will be given to McGill University for further study. The Tench was male, 395 mm long and weighed 1,111 g. Tench are a member of the Cyprinidae (carps and minnows) family and are usually 2-25 cm long and can reach a maximum size of 7 cm. They are dark olive to pale golden tan with a white to bronze belly and reddish-orange eyes. Their fins are dark and rounded with no bony spines and the scales are small and embedded in thick skin. The mouth is narrow and there is a small barbel at each corner. Male Tench are easily identifiable by a thick, fleshy, and flattened FIG Locations of Asian Carp edna sampling in 216. TABE The number of locations within a site where water samples were collected, and the location of filtering. Site Number of locations sampled within the site Location of filtering West Lake 3 ARMS East Lake 3 ARMS Presqu'ile Bay 3 LOMU Weller's Bay 2 LOMU Trenton 3 LOMU Salmon River 1 LOMU Muscote Bay 1 LOMU Marysville Creek 1 LOMU second ray on their pelvic fins where females do not possess a thickened second ray. Tench are native to Europe and Western Asia. To date, a wild population of Tench is not known to occur in any Ontario waters. A population of Tench was found in an isolated farm pond near Orangeville, Ontario in 214. This population was eradicated through actions taken by MNRF and the landowner in fall 214 and spring 215. Monitoring activities in the pond and adjacent streams have continued in 216 to ensure that the project was a success. In Canada the fish is found only in the Columbia watershed in British Columbia and the Richelieu River in Quebec. It is well established in the United States, particularly in the Mississippi River watershed. The Section 1. Partnerships


204 196 Cornwall Brockville Kingston Location of Trap FIG Location of the Trap net in Lake St. Francis that captured the Tench. population in Quebec is believed to be the result of an illegal fish stocking event in the mid-198 s whereby the fish escaped into the Richelieu River. Tench have expanded their range in the area of the St. Lawrence River around Montreal. The province of Quebec has discovered Tench in baitfish buckets alongside other fish species. Tench are a competitor with native minnows, bullheads and suckers for food. By consuming large quantities of aquatic snails which feed on algae, Tench may contribute to nuisance algal blooms. They are known to increase turbidity through their foraging activities, similar to Common Carp, when populations are high. Along with the 46 nets used by the commercial fisher who captured the Tench, LOMU community index netting in the Lake St. Francis area using 36 gill net sets and did not detect any Tench. Crews electrofished the area during the week of September 26, 216 in response to this report and found no Tench. The St. Lawrence River Institute of Environmental Studies has been conducting a minnow survey to evaluate fish community health in Lake St. FIG Photograph of the Tench that was captured in Lake St. Francis by a commercial fisherman in 216. Francis for the last year. Information sheets and signs have been prepared by the OMNRF and OFAH in order to provide Tench identification characteristics to commercial bait harvesters and anglers so as to avoid dispersal through baitfish buckets. In order to increase monitoring efforts in the future, MNRF Aquatic Research and Monitoring Section and Natural Heritage Section are collaborating to develop techniques to test for the edna of Tench. Section 1. Partnerships
Lake Ontario Fish Communities and Fisheries: 2017 Annual Report of the Lake Ontario Management Unit
 Lake Ontario Fish Communities and Fisheries: 2017 Annual Report of the Lake Ontario Management Unit Cover Photos: (Left) MNRF s Ontario Explorer on Lake Ontario (Right top) Walleye equipped with acoustic
LAKE ONTARIO FISH COMMUNITIES AND FISHERIES: 2013 ANNUAL REPORT OF THE LAKE ONTARIO MANAGEMENT UNIT
 LAKE ONTARIO FISH COMMUNITIES AND FISHERIES: 2013 ANNUAL REPORT OF THE LAKE ONTARIO MANAGEMENT UNIT LAKE ONTARIO FISH COMMUNITIES AND FISHERIES: 2013 ANNUAL REPORT OF THE LAKE ONTARIO MANAGEMENT UNIT
LAKE ONTARIO FISH COMMUNITIES AND FISHERIES: 2007 ANNUAL REPORT OF THE LAKE ONTARIO MANAGEMENT UNIT
 LAKE ONTARIO FISH COMMUNITIES AND FISHERIES: 2007 ANNUAL REPORT OF THE LAKE ONTARIO MANAGEMENT UNIT LAKE ONTARIO FISH COMMUNITIES AND FISHERIES: 2007 ANNUAL REPORT OF THE LAKE ONTARIO MANAGEMENT UNIT
Highlights of the Annual Lake Committee Meetings Great Lakes Fishery Commission proceedings held in Ypsilanti, MI
 Inland Seas Angler GREAT LAKES BASIN REPORT Special Report Lake Ontario A Publication of the Great Lakes Sport Fishing Council May 2009 http://www.great-lakes.org Vol. 20, No. 7 Highlights of the Annual
Lake St. Clair Fish Community and Fishery
 Lake St. Clair Fish Community and Fishery Megan Belore Ontario Ministry of Natural Resources and Forestry Mike Thomas Michigan Department of Natural Resources Fish Community Fish Community Mixture of warm
FISH COMMUNITIES AND FISHERIES OF THE THOUSAND ISLANDS AND MIDDLE CORRIDOR
 St. Lawrence River Discussion Paper FISH COMMUNITIES AND FISHERIES OF THE THOUSAND ISLANDS AND MIDDLE CORRIDOR Issues Below is a synopsis of fish community issues and proposed management approaches. More
Thunder Bay River Assessment Appendix. Appendix 2
 Appendix 2 Known past and present fish distributions in the River system. Distribution of fishes were compiled from Bailey et al. (2003) and from records located at the Michigan Department of Natural Resources
Job 1 Part JOB 1, PART 2: SUMMARY OF CONOWINGO DAM WEST FISH LIFT OPERATIONS, 2009
 2.0 JOB 1, PART 2: SUMMARY OF CONOWINGO DAM WEST FISH LIFT OPERATIONS, 2009 Lawrence M. Miller Normandeau Associates U. S. Fish and Wildlife Service 1921 River Road Harrisburg, Pennsylvania Drumore, Pennsylvania
2011 Status of Major Stocks. Lake Erie Management Unit March 2012
 211 Status of Major Stocks Lake Erie Management Unit March 212 The Lake Erie Management Unit of the Ontario Ministry of Natural Resources is responsible for managing the fishery resources of the Ontario
LAKE ONTARIO FISH COMMUNITIES AND FISHERIES: 2001 ANNUAL REPORT OF THE LAKE ONTARIO MANAGEMENT UNIT
 LAKE ONTARIO FISH COMMUNITIES AND FISHERIES: 21 ANNUAL REPORT OF THE LAKE ONTARIO MANAGEMENT UNIT LAKE ONTARIO FISH COMMUNITIES AND FISHERIES: 21 ANNUAL REPORT OF THE LAKE ONTARIO MANAGEMENT UNIT Prepared
JOB 1, PART 2. SUMMARY OF CONOWINGO DAM WEST FISH LIFT OPERATIONS 2011
 JOB 1, PART 2. SUMMARY OF CONOWINGO DAM WEST FISH LIFT OPERATIONS 2011 Michael L. Hendricks Pennsylvania Fish and Boat Commission 1735 Shiloh Rd. State College, Pa 16801 INTRODUCTION The shore-based trapping
Impacts of Aquatic Invasive Species on the Lake Superior Fishery. by Jeff Gunderson Minnesota Sea Grant Program
 Impacts of Aquatic Invasive Species on the Lake Superior Fishery by Jeff Gunderson Minnesota Sea Grant Program Can humans really impact the fishery of such a large waterbody? Lake Superior Fishery Change
STUDY PERFORMANCE REPORT
 STUDY PERFORMANCE REPORT State: Michigan Study No.: 427 Project No.: F-81-R-1 Title: Measurement of sportfishing harvest in lakes Michigan, Huron, Erie, and Superior Period Covered: October 1, 1999 to
Species Highlights Alewife Moderate decline in numbers; 1998 year class still dominant (Chapter 1) Poor body condition (Chapter 1) Rainbow smelt Very
 Poor body condition (Chapter 1) Rainbow smelt Very") Species Highlights Alewife Moderate decline in numbers; 1998 year class still dominant (Chapter 1) Poor body condition (Chapter 1) Rainbow smelt Very low abundance (Chapter 1) Poor body condition (Chapter
Species Highlights Alewife Moderate decline in numbers; 1998 year class still dominant (Chapter 1) Poor body condition (Chapter 1) Rainbow smelt Very low abundance (Chapter 1) Poor body condition (Chapter
SUMMARY OF CONOWINGO DAM WEST FISH LIFT OPERATIONS 2012
 SUMMARY OF CONOWINGO DAM WEST FISH LIFT OPERATIONS 2012 Michael L. Hendricks Pennsylvania Fish and Boat Commission 1735 Shiloh Rd. State College, Pa 16801 INTRODUCTION The shore-based trapping device at
Climate Change Impacts on Great Lakes Fishes
 Climate Change Impacts on Great Lakes Fishes Stuart A. Ludsin ludsin.1@osu.edu Changing Climate Webinar Series The Ohio State University 19 April 2011 Today s Presentation Great Lakes Fish Community A
Summary of 2012 DNR and Partners Fisheries Surveys in St. Clair/Lake Erie and Fishery Forecast for 2013
 Summary of 2012 DNR and Partners Fisheries Surveys in St. Clair/Lake Erie and Fishery Forecast for 2013 LE/LSC Citizens Fishery Advisory Committee April 2, 2013 Michael Thomas Fisheries Research Biologist
Geology. Key Factors. Overfishing. Great Lakes Fishes. Historical Fishing. About 10,000 years since last glacial retreat very young ecologically
 Great Lakes Fishes Geology About 10,000 years since last glacial retreat very young ecologically Largest surface freshwater system on earth 21% of world s supply 84% of North America s supply Five unique
Kawartha Lakes Fisheries. Dan Taillon Peterborough District Mike Rawson Kawartha Lakes Fisheries Assessment Unit
 Kawartha Lakes Fisheries Dan Taillon Peterborough District Mike Rawson Kawartha Lakes Fisheries Assessment Unit Presentation Outline State of the Kawartha Lakes Fishery Index netting data Angler creel
Keuka Lake State of the Lake 2017
 Keuka Lake State of the Lake 2017 1 2 Lake Characteristics Third largest by area of the Finger Lakes 11,730 ac Deep and steep sided - max 185 ft mean 101 ft Two story fishery (warmwater/coldwater) 178,800
Status of the Lake Erie Fish Community Jeff Tyson, Ohio Division of Wildlife
 Status of the Lake Erie Fish Community 2010 Jeff Tyson, Ohio Division of Wildlife Status of the Lake Erie Fish Community 2010 Physical Environment/Fish Community West to east gradient in depth, temperature,
Renseignements supplémentaires. Supplementary Information. Présentation du Ministère des Richesses naturelles de l Ontario
 Deep Geologic Repository Joint Commission d examen conjoint du projet de stockage dans des couches géologiques profondes PMD 13-P1.6B File / dossier : 8.01.07 Date: 2013-10-01 Edocs: 4209085 Supplementary
Great Lakes Coastal Wetland Communities: Vulnerabilities to Climate Change and Response to Adaptation Strategies
 Great Lakes Coastal Wetland Communities: Vulnerabilities to Climate Change and Response to Adaptation Strategies CCAF Wetlands Study Investigators: Susan Doka Fisheries & Oceans, Great Lakes Lab for Fisheries
LAKE DIANE Hillsdale County (T8-9S, R3W, Sections 34, 3, 4) Surveyed May Jeffrey J. Braunscheidel
 Surveyed May Jeffrey J. Braunscheidel") Michigan Department of Natural Resources Status of the Fishery Resource Report No. 2003-4, 2003 LAKE DIANE Hillsdale County (T8-9S, R3W, Sections 34, 3, 4) Surveyed May 2001 Jeffrey J. Braunscheidel Environment
Michigan Department of Natural Resources Status of the Fishery Resource Report No. 2003-4, 2003 LAKE DIANE Hillsdale County (T8-9S, R3W, Sections 34, 3, 4) Surveyed May 2001 Jeffrey J. Braunscheidel Environment
Status of Lake Erie s Western Basin Fish Populations: Trends and Environmental Conditions
 Status of Lake Erie s Western Basin Fish Populations: Trends and Environmental Conditions Jeff Tyson Ohio Department of Natural Resources Ohio Division of Wildlife Status of the Lake Erie s Western Basin
Onondaga Lake Fishery: 2011 Fact Sheet
 October, 2011 Onondaga County Department of Water Environment Protection SUNY College of Environmental Science and Forestry Joanne M. Mahoney, County Executive Tom Rhoads, P.E., Commissioner Onondaga Lake
Black Sturgeon Regional Plan
 Black Sturgeon Regional Plan This is one of twenty Regional Plans that support implementation of the Lake Superior Biodiversity Conservation Strategy (Strategy). The Strategy, prepared and overseen by
Quemahoning Reservoir
 Pennsylvania Fish & Boat Commission Biologist Report Quemahoning Reservoir Somerset County May 2011 Trap Net, Gill Net and Electrofishing Survey Quemahoning Reservoir is an 899 acre impoundment located
Fisheries Management Zone 10:
 Fisheries Management Zone 10: Lake Trout Operational Objectives and Management Photo Credit: www.jamessmedleyoutdoors.com 2 FMZ 10: Lake Trout Operational Objectives and Management Lake trout are the second
December 18, Dear Sir/Madam,
 December 18, 2000 Dear Sir/Madam, We are writing to bring you up-to-date on our efforts to develop fish community objectives for the St. Lawrence River. First of all, we want to thank you for participating
Crawford Reservoir. FISH SURVEY AND MANAGEMENT INFORMATION Eric Gardunio, Fish Biologist Montrose Service Center
 FISH SURVEY AND MANAGEMENT INFORMATION General Information: Crawford Reservoir is a popular fishery that provides angling opportunity for yellow perch, channel catfish, northern pike, rainbow trout, black
Fisheries and Lake Management Planning. CAP Mtg Nov21,2012 Brett Tregunno Aquatic Biologist, Kawartha Conservation
 Fisheries and Lake Management Planning CAP Mtg Nov21,2012 Brett Tregunno Aquatic Biologist, Kawartha Conservation Outline Aquatic Habitat Types Fish Communities Significance of Resource Current Management
Status and Trends of the Lake Superior Fish Community,
 Status and Trends of the Lake Superior Fish Community, 1978-2015 An Overview of the USGS Lake Superior Monitoring and Research Program Owen Gorman, Mark Vinson & Daniel Yule Lake Superior Biological Station
Future of Lake Whitefish and Lake Trout Populations in The Great Lakes
 Future of Lake Whitefish and Lake Trout Populations in The Great Lakes Mark P. Ebener Inter-Tribal Fisheries and Assessment Program Chippewa Ottawa Resource Authority Lake Trout (Salvelinus namaycush)
Lake Ontario Stocking Program Review November 2014
 Lake Ontario Stocking Program Review November 2014 Ministry of Natural Resources and Forestry Fish and Wildlife Services Branch Lake Ontario Management Unit 41 Hatchery LN, Picton, ON Lake Ontario Stocking
STUDY PERFORMANCE REPORT
 STUDY PERFORMANCE REPORT State: Michigan Study No.: 427 Project No.: F-81-R-2 Title: Measurement of sportfishing harvest in lakes Michigan, Huron, Erie, and Superior Period Covered: October 1, 2000 to
NEVADA DEPARTMENT OF WILDLIFE STATEWIDE FISHERIES MANAGEMENT
 NEVADA DEPARTMENT OF WILDLIFE STATEWIDE FISHERIES MANAGEMENT FEDERAL AID JOB PROGRESS REPORTS F-20-52 2016 LAKE TAHOE WESTERN REGION NEVADA DEPARTMENT OF WILDLIFE, FISHERIES DIVISION ANNUAL PROGRESS REPORT
JadEco, LLC PO BOX 445 Shannon, IL 61078
 Introduction: With the assistance of Lake Holiday staff and volunteers, we were able to conduct an AC electrofishing survey on May 8, 27. Water temperatures were 2.3 C (8.5 F) and water clarity was decent
Busse Reservoir South Lateral Pool Population Survey
 Busse Reservoir South Lateral Pool Survey Located in Elk Grove Village south of Higgins Rd. between RT 53/I-290 and Arlington Heights Rd. Busse Reservoir is comprised of three pools making up a total of
Elk Lake, Antrim and Grand Traverse counties T. 28, 29 N., R. 8, 9 W., Sec. many. Lake surveys. began at 40 feet
 Elk Lake, Antrim and Grand Traverse counties T. 28, 29 N., R. 8, 9 W., Sec. many Physical and chemical data surveyed August 1931 Temperature ( F) Secchi disk (feet) 9. 6 Surface 74 Bottom 45 PH 8.0 Thermocline
NEVADA DEPARTMENT OF WILDLIFE STATEWIDE FISHERIES MANAGEMENT
 NEVADA DEPARTMENT OF WILDLIFE STATEWIDE FISHERIES MANAGEMENT FEDERAL AID JOB PROGRESS REPORTS F-20-48 2012 RYE PATCH RESERVOIR WESTERN REGION NEVADA DEPARTMENT OF WILDLIFE, FISHERIES DIVISION JOB PROGRESS
Little Calumet River Rapid Response Fish Identification and Enumeration Branch Summary Report
 Little Calumet River Rapid Response Fish Identification and Enumeration Branch Summary Report Introduction A rotenone rapid response was completed on a 2.6-mile section of the Little Calumet River immediately
Great Lakes fish consumption advisories: Is mercury. a concern? Supplemental Material. Satyendra P. Bhavsar *, Emily Awad, Chris G. Mahon, Steve Petro
 Suppl Mtrls (not cover letter - place cover letter in "comments") Supplemental Material Great Lakes fish consumption advisories: Is mercury a concern? Satyendra P. Bhavsar *, Emily Awad, Chris G. Mahon,
Columbia Lake Dam Removal Project
 Columbia Lake Dam Removal Project The Columbia Lake dam located 1/4 mile upstream of the Paulins Kill River's confluence with the Delaware River in Knowlton Township, Warren County has been proposed for
Ecosystem Monitoring Project 2014 Fish Sampling Update
 Ecosystem Monitoring Project 2014 Fish Sampling Update Lyndal Johnson, Sean Sol, Dan Lomax, Paul Chittaro, David Teel, and Gina Ylitalo NOAA Fisheries Northwest Fisheries Science Center, Seattle, WA, USA
Investigating reproduction and abundance of bighead carp (Hypophthalmichthys nobilis) and silver carp (H. molitrix) in the Greenup pool, Ohio River
 and silver carp (H. molitrix) in the Greenup pool, Ohio River") Investigating reproduction and abundance of bighead carp (Hypophthalmichthys nobilis) and silver carp (H. molitrix) in the Greenup pool, Ohio River Nathan Fleshman Dr. Thomas Jones Photo: USGS Photo: USGS
Investigating reproduction and abundance of bighead carp (Hypophthalmichthys nobilis) and silver carp (H. molitrix) in the Greenup pool, Ohio River Nathan Fleshman Dr. Thomas Jones Photo: USGS Photo: USGS
Lower Lake Committees Meetings March 27-28, 2018 Hilton Toronto Markham Suites Hotel Markham, Ontario DRAFT AGENDA. Lake Ontario Committee Meeting
 Lower Lake Committees Meetings March 27-28, 2018 Hilton Toronto Markham Suites Hotel Markham, Ontario DRAFT AGENDA Lake Ontario Committee Meeting Tuesday, March 27 10:00 am 1. LOC Introductions - Andy
BIG TWIN LAKE Kalkaska County (T28N, R05W, Section 18, and T28N, R06W, Section 13) Surveyed May 1999
 Surveyed May 1999") Michigan Department of Natural Resources Status of the Fishery Resource Report No. 2001-1, Year 2001 BIG TWIN LAKE Kalkaska County (T28N, R05W, Section 18, and T28N, R06W, Section 13) Surveyed May 1999
Michigan Department of Natural Resources Status of the Fishery Resource Report No. 2001-1, Year 2001 BIG TWIN LAKE Kalkaska County (T28N, R05W, Section 18, and T28N, R06W, Section 13) Surveyed May 1999
U. S. Fish and Wildlife Service Connecticut River Coordinator s Office. Ken Sprankle Connecticut River Coordinator
 U. S. Fish and Wildlife Service Connecticut River Coordinator s Office Ken Sprankle Connecticut River Coordinator Largest river basin in New England 400 miles long 11,250 mile 2 area Over 2,700 dams identified
Untested Assumptions in Fisheries Management: the role of competition in Brook Trout declines?
 Untested Assumptions in Fisheries Management: the role of competition in Brook Trout declines? Brian Morrison Fisheries Biologist Ganaraska Region Conservation Authority November 22, 2012 Alternate Titles
Rolling Knolls Pond Population Survey
 Located near the town of Elgin on the west side of Rohrssen Rd. between Illinois Route 58 and U.S.- 20. This small 1.8 acre pond has a maximum depth of 7.5 feet and is occasionally influenced by Poplar
Alcona Dam Pond Alcona County (T25N, R5E, Sections various) Surveyed June 6-12 and September 16, 2003
 Surveyed June 6-12 and September 16, 2003") Michigan Department of Natural Resources Status of the Fishery Resource Report No. 2004-6, Year 2004 Alcona Dam Pond Alcona County (T25N, R5E, Sections various) Surveyed June 6-12 and September 16, 2003
Michigan Department of Natural Resources Status of the Fishery Resource Report No. 2004-6, Year 2004 Alcona Dam Pond Alcona County (T25N, R5E, Sections various) Surveyed June 6-12 and September 16, 2003
Michigan Dept. of Natural Resources Status of the Fishery Resource Report Page 1. Weber Lake Cheboygan County, T34N, R3W, Sec.
 Michigan Dept. of Natural Resources 2012-143 Status of the Fishery Resource Report Page 1 Weber Lake Cheboygan County, T34N, R3W, Sec. 31 Neal Godby, Fisheries Biologist Environment Weber Lake is a 28.5-acre
Methods for Evaluating Shallow Water Habitat Restoration in the St. Clair River
 Methods for Evaluating Shallow Water Habitat Restoration in the St. Clair River Objectives Document fish use of restoration sites Spawning Presence of larvae, juvenile, and adult fish Quantify differences
Cedar Lake Comprehensive Survey Report Steve Hogler and Steve Surendonk WDNR-Mishicot
 Cedar Lake- 2006 Comprehensive Survey Report Steve Hogler and Steve Surendonk WDNR-Mishicot ABSTRACT Cedar Lake is a 142 acre lake located in the southwest corner of Manitowoc County. It is a seepage lake
Summary of and Initial Response to public comments on MN Department of Natural Resources proposal to manage new waters for Muskellunge
 Summary of and Initial Response to public comments on MN Department of Natural Resources proposal to manage new waters for Muskellunge Summary of and Initial Response to public comments: This document
SUMMARY REPORT FOR LAKE ST. MALO FISHERIES ASSESSMENT. Prepared for the St. Malo and District Wildlife Association
 SUMMARY REPORT FOR LAKE ST. MALO FISHERIES ASSESSMENT Prepared for the St. Malo and District Wildlife Association Presented by August 25, 2014 Study dates thus far: Date Tasks February 16 Fishing derby;
NEVADA DEPARTMENT OF WILDLIFE STATEWIDE FISHERIES MANAGEMENT
 NEVADA DEPARTMENT OF WILDLIFE STATEWIDE FISHERIES MANAGEMENT FEDERAL AID JOB PROGRESS REPORTS F-2-49 213 RYE PATCH RESERVOIR WESTERN REGION NEVADA DEPARTMENT OF WILDLIFE, FISHERIES DIVISION ANNUAL PROGRESS
Fish Community. Fish Habitat, Streams and Rivers
 Clear, Ston(e)y and White Lake Plan Fish Community The lakes support a cool/warm water fishery including muskellunge, walleye, largemouth and smallmouth bass, yellow perch, pumpkinseed, rockbass, blue
NORTHWEST SCIENCE AND INFORMATION
 Science and Information Branch NORTHWEST SCIENCE AND INFORMATION Aquatics Update 2002-1 Fall Walleye Index Netting (FWIN) and Trap Netting Summary for Niobe Lake, 2000 by T. Cano Introduction Since 1981,
Rivers Inlet Salmon Initiative
 Rivers Inlet Salmon Initiative 5-YEAR BUSINESS PLAN C AS E F O R S U P P O R T M AR C H 2 0 1 5 Dedication Rick Hansen had been inspired to go to Rivers Inlet in July 2010 by his good friend, and fellow
Charter Boat Fishing in Lake Michigan: 2015 Illinois Reported Harvest
 Illinois Department of Natural Resources Division of Fisheries Charter Boat Fishing in Lake Michigan: 2015 Illinois Reported Harvest Steven R. Robillard Illinois Department of Natural Resources Lake Michigan
Bode Lake - South Population Survey
 Bode Lake - South Survey Located in Hoffman Estates on the north side of Bode Rd. 1 mile west of Barrington Rd. Bode Lake is made up of two lakes along Poplar Creek; the larger and deeper Bode Lake South
Dauphin Lake Fishery. Status of Walleye Stocks and Conservation Measures
 Dauphin Lake Fishery Status of Walleye Stocks and Conservation Measures Date: December, 21 Dauphin Lake Fishery Status of Walleye Stocks and Conservation Measures Background: Walleye stocks in Dauphin
Laurentian Great Lakes and their invasive species. Jeff Gunderson Minnesota Sea Grant College Program
 Laurentian Great Lakes and their invasive species Jeff Gunderson Minnesota Sea Grant College Program Largest Group of Freshwater Lakes in the World Contain 21% of the worlds surface freshwater Variety
Crooked Lake Oakland County (T4N, R9E, Sections 3, 4, 9) Surveyed May James T. Francis
 Surveyed May James T. Francis") Michigan Department of Natural Resources Status of the Fishery Resource Report No. 2004-1, 2004 Crooked Lake Oakland County (T4N, R9E, Sections 3, 4, 9) Surveyed May 2002 James T. Francis Environment Crooked
Michigan Department of Natural Resources Status of the Fishery Resource Report No. 2004-1, 2004 Crooked Lake Oakland County (T4N, R9E, Sections 3, 4, 9) Surveyed May 2002 James T. Francis Environment Crooked
Ohio Lake Erie Fisheries Report For 2002
 Ohio Lake Erie Fisheries Report For 2002 Summary and Excerpts from the March 2003 report by the Lake Erie Fisheries Units of the Ohio Department of Natural Resources, Division of Wildlife Note: Tables
NEVADA DEPARTMENT OF WILDLIFE STATEWIDE FISHERIES MANAGEMENT
 NEVADA DEPARTMENT OF WILDLIFE STATEWIDE FISHERIES MANAGEMENT FEDERAL AID JOB PROGRESS REPORTS F-20-48 2012 LAKE TAHOE WESTERN REGION Contents NEVADA DEPARTMENT OF WILDLIFE, FISHERIES DIVISION ANNUAL PROGRESS
HUBBARD LAKE Alcona County (T27N, R7E; T28N, R7E) Surveyed May and September Tim A. Cwalinski
 Surveyed May and September Tim A. Cwalinski") Michigan Department of Natural Resources Status of the Fishery Resource Report No. 2003-1, 2003 HUBBARD LAKE Alcona County (T27N, R7E; T28N, R7E) Surveyed May and September 1996 Tim A. Cwalinski Environment
Michigan Department of Natural Resources Status of the Fishery Resource Report No. 2003-1, 2003 HUBBARD LAKE Alcona County (T27N, R7E; T28N, R7E) Surveyed May and September 1996 Tim A. Cwalinski Environment
Indiana Administrative Code Page IAC Aquaculture permit Authority: IC Affected: IC Sec. 17. (a) A person must not
 A person must not") Indiana Administrative Code Page 71 312 IAC 9-10-17 Aquaculture permit Affected: IC 14-22-27 Sec. 17. (a) A person must not import, raise, sell, or transport fish into or within Indiana without an aquaculture
Indiana Administrative Code Page 71 312 IAC 9-10-17 Aquaculture permit Affected: IC 14-22-27 Sec. 17. (a) A person must not import, raise, sell, or transport fish into or within Indiana without an aquaculture
ADOPT-A-STREAM WATERSHED APPROACH COMMUNITY-BASED STEWARDSHIP. Nova Scotia Salmon Association March 2005
 ADOPT-A-STREAM A WATERSHED APPROACH TO COMMUNITY-BASED STEWARDSHIP Nova Scotia Salmon Association March 2005 This manual is a revised and updated version of the 1994 Adopt-a-Stream manual that was prepared
Sag Quarry - West Population Survey
 Located in Lemont on RT 83 and Archer Ave. just north of 111 th St. Like Sag Quarry East, this lake is an old limestone quarry, 14 acres in size and with a maximum depth of 10.3 feet. The species found
Current Status and Management Recommendations for the Fishery in the Cloverleaf Chain of Lakes
 Current Status and Management Recommendations for the Fishery in the Cloverleaf Chain of Lakes Jason Breeggemann Senior Fisheries Biologist Wisconsin Department of Natural Resources Outline DNR fisheries
NEVADA DEPARTMENT OF WILDLIFE STATEWIDE FISHERIES MANAGEMENT
 NEVADA DEPARTMENT OF WILDLIFE STATEWIDE FISHERIES MANAGEMENT FEDERAL AID JOB PROGRESS REPORTS F-20-49 2013 LAKE TAHOE WESTERN REGION NEVADA DEPARTMENT OF WILDLIFE, FISHERIES DIVISION ANNUAL PROGRESS REPORT
MIDDLE FORK RESERVOIR Wayne County 2004 Fish Management Report. Christopher C. Long Assistant Fisheries Biologist
 MIDDLE FORK RESERVOIR Wayne County 2004 Fish Management Report Christopher C. Long Assistant Fisheries Biologist FISHERIES SECTION INDIANA DEPARTMENT OF NATURAL RESOURCES DIVISION OF FISH AND WILDLIFE
Lake information report
 Lake information report: Minnesota DNR Page of 5 Lake information report jf Prinlable senior Name: Spring Nearest Town: Spring Lake (Scott) Primary County: Scott Survey Date: 08/02/200 Inventory Number:
2017 Lake Winnebago Bottom Trawling Assessment Report
 217 Lake Winnebago Bottom Trawling Assessment Report Adam Nickel, Winnebago System Gamefish Biologist, March 218 There were several highlights from the 217 Lake Winnebago bottom trawling survey, including
Invasive Fish in the Cariboo Region. Russell Bobrowski Fisheries Biologist, BC Gov Cariboo Region Dec 19, 2017
 Invasive Fish in the Cariboo Region Russell Bobrowski Fisheries Biologist, BC Gov Cariboo Region Dec 19, 2017 Cariboo - Fishery Combination of productive lake and river fisheries 700 lakes with known game
In each summer issue of Lake
 The 2000 Lake Erie Walleye Report by Rick Kubb In each summer issue of Lake Erie Walleye Magazine, we provide a synopsis of the walleye fishery in Lake Erie based on the scientific reports produced by
Introduction: JadEco, LLC PO BOX 445 Shannon, IL 61078
 Introduction: was contacted to collected data on the fishery for Lake Holiday. AC Electroshocking was conducted at 2 locations on September 28, 2015. Fish population data was collected for a total of 100
Public Input to St. Lawrence River Fisheries Community Objectives
 Public Input to St. Lawrence River Fisheries Community Objectives Tommy L. Brown, Human Dimensions Research Unit, Cornell University Steven R. LaPan, New York State Department of Environmental Conservation,
NEVADA DEPARTMENT OF WILDLIFE STATEWIDE FISHERIES MANAGEMENT
 NEVADA DEPARTMENT OF WILDLIFE STATEWIDE FISHERIES MANAGEMENT FEDERAL AID JOB PROGRESS REPORTS F-20-52 2016 Lake Tahoe Rainbow Trout Study WESTERN REGION NEVADA DEPARTMENT OF WILDLIFE, FISHERIES DIVISION
THE FISHERY IN KENNEBEC LAKE Prepared by: Cam McCauley Landscape Planning Biologist Peterborough District, i t Kingston
 THE FISHERY IN KENNEBEC LAKE Prepared by: Cam McCauley Landscape Planning Biologist Peterborough District, i t Kingston 613-531-57055705 Questions 1. How many walleye and age structure now? 2. Status of
(date are inclusive)
") Kind of Fish and Locality Methods Permitted Open Season (date are inclusive) Bag Limit Maximum or Minimum Size Limits (a) LARGE MOUTH AND SMALLMOUTH BASS. (i) All waters Hook & Line ice fishing (including
Kind of Fish and Locality Methods Permitted Open Season (date are inclusive) Bag Limit Maximum or Minimum Size Limits (a) LARGE MOUTH AND SMALLMOUTH BASS. (i) All waters Hook & Line ice fishing (including
Okanagan Sockeye Reintroduction
 Okanagan Sockeye Reintroduction Backgrounder Elders accounts, and other forms of Traditional Ecological Knowledge (TEK) tell us that many species of salmon once came into the Okanagan Valley and tell us
Tampier Lake Population Survey
 Located in Palos Park on 131 st St. between Wolf and Will-Cook Rd. s. Tampier Lake has 131 acres of fishable water, with a maximum depth of 9.4 feet. Walleye, northern pike, largemouth bass and channel
Schiller Pond Population Survey
 Located in the town of Schiller Park on Irving Park Rd. just west of Cumberland Ave. This small 6 acre pond has a maximum depth of 6.3 feet. In addition to largemouth bass and bluegill, Schiller Pond is
Lake Butte des Morts Commercial Seining Project Report
 Lake Butte des Morts Commercial Seining Project Report Adam Nickel, Winnebago Gamefish (excluding sturgeon) Biologist, 22 December 2014 Conducting comprehensive fish surveys on the Upriver Lakes, including
Who is developing this NAAHP?
 National Aquatic Animal Health Plan and Viral Hemorrhagic Septicemia (VHS) North Carolina Aquaculture Conference Atlantic City, NC February 9, 2007 Dr. Gary Egrie Who is developing this NAAHP? The Joint
Lake information report
 Page 1 of 6 Lake information report Name: Saganaga Nearest Town: Grand Marais Primary County: Cook Survey Date: 08/08/2011 Inventory Number: 16063300 walleye stocking. Purchase a walleye stamp. Your voluntary
Charter Boat Fishing in Lake Michigan: 2017 Illinois Reported Harvest
 Illinois Department of Natural Resources Division of Fisheries Charter Boat Fishing in Lake Michigan: 2017 Illinois Reported Harvest Steven R. Robillard Illinois Department of Natural Resources Lake Michigan
Highlights of Native Fish Rehabilitation Activities in the Great Lakes. Presented By: Arunas Liskauskas, Ontario Ministry of Natural Resources
 Highlights of Native Fish Rehabilitation Activities in the Great Lakes Presented By: Arunas Liskauskas, Ontario Ministry of Natural Resources In this presentation Focus on activities from 2002 to 2007
STUDY PERFORMANCE REPORT
 STUDY PERFORMANCE REPORT State: Michigan Project No.: F-81-R-3 Study No.: 491 Title: Evaluation of lake sturgeon Acipenser fulvescens populations in the St. Clair River and Lake St. Clair Period Covered:
Big Bend Lake Population Survey
 Big Bend Lake Survey Located in Des Plaines on East River Rd. just south of Golf Rd. This 27 acre body of water has a depth of 27.8 feet; however because it is connected to the Des Plaines River by a spillway,
Maple Lake Population Survey
 Maple Lake Survey Located in Willow Springs approximately 1 mile west of Willow Springs Rd. (104 th Ave.) at Wolf Rd. and 95 th St. Constructed in the 1920 s this 60 acre lake drops down to 20.4 feet in
Striped Bass and White Hybrid (x) Striped Bass Management and Fishing in Pennsylvania
 Striped Bass Management and Fishing in Pennsylvania") Striped Bass and White Hybrid (x) Striped Bass Management and Fishing in Pennsylvania Prepared by R. Lorantas, D. Kristine and C. Hobbs PFBC Warmwater Unit 2005 (stocking numbers updated after 2005) Goal:
Striped Bass and White Hybrid (x) Striped Bass Management and Fishing in Pennsylvania Prepared by R. Lorantas, D. Kristine and C. Hobbs PFBC Warmwater Unit 2005 (stocking numbers updated after 2005) Goal:
Adapting to Climate Change In Coastal Environments
 Adapting to Climate Change In Coastal Environments Peter Nimmrichter, P.Eng. AMEC Earth and Environmental, Mississauga, Ontario 19/11/2007 1 The Great Lakes Watershed The Great Lakes cover an area of 244,160
NEVADA DEPARTMENT OF WILDLIFE STATEWIDE SPORT FISHERIES MANAGEMENT
 NEVADA DEPARTMENT OF WILDLIFE STATEWIDE SPORT FISHERIES MANAGEMENT FEDERAL AID JOB PROGRESS REPORT F-2-52 216 WILDHORSE RESERVOIR EASTERN REGION NEVADA DEPARTMENT OF WILDLIFE, FISHERIES DIVISION ANNUAL
Study 9.5 Fish Distribution and Abundance in the Upper Susitna River
 Initial Study Report Meeting Study 9.5 Fish Distribution and Abundance in the Upper Susitna River October 15, 2014 Prepared by R2 Resource Consultants, Inc. 10/15/2014 1 Study 9.5 Objectives 1. Describe
First Nations Fish Habitat Program Discussion Workbook
 First Nations Fish Habitat Program Discussion Workbook The First Nations Fish Habitat Program is a joint initiative of the Centre for Indigenous Environmental Resources (CIER) and The Southern Chiefs Organization