Subsistence Harvests of Pacific Halibut in Alaska, 2006
|
|
|
- Willa Maude Jenkins
- 6 years ago
- Views:
Transcription

1 Technical Paper No. 333 Subsistence Harvests of Pacific in Alaska, 2006 by James A. Fall, David Koster, and Michael Turek December 2007 Alaska Department of Fish and Game Division of Subsistence
2 Symbols and Abbreviations The following symbols and abbreviations, and others approved for the Système International d'unités (SI), are used without definition in the following reports by the Divisions of Sport Fish and of Commercial Fisheries: Fishery Manuscripts, Fishery Data Series Reports, Fishery Management Reports, and Special Publications. All others, including deviations from definitions listed below, are noted in the text at first mention, as well as in the titles or footnotes of tables, and in figure or figure captions. Weights and measures (metric) centimeter deciliter gram hectare kilogram kilometer liter meter milliliter millimeter cm dl g ha kg km L m ml mm Weights and measures (English) cubic feet per second ft 3 /s foot ft gallon gal inch in mile mi nautical mile nmi ounce oz pound lb quart qt yard yd Time and temperature day d degrees Celsius C degrees Fahrenheit F degrees kelvin K hour h minute min second s Physics and chemistry all atomic symbols alternating current ampere calorie direct current hertz horsepower hydrogen ion activity (negative log of) parts per million parts per thousand volts watts AC A cal DC Hz hp ph ppm ppt, V W General Alaska Administrative Code all commonly accepted abbreviations AAC e.g., Mr., Mrs., AM, PM, etc. all commonly accepted professional titles e.g., Dr., Ph.D., R.N., etc. compass directions: east E north N south S west W copyright corporate suffixes: Company Co. Corporation Corp. Incorporated Inc. Limited Ltd. District of Columbia D.C. et alii (and others) et al. et cetera (and so forth) etc. exempli gratia (for example) e.g. Federal Information Code FIC id est (that is) i.e. latitude or longitude lat. or long. monetary symbols (U.S.) $, months (tables and figures): first three letters Jan,...,Dec registered trademark trademark United States (adjective) U.S. United States of America (noun) USA U.S.C. United States Code U.S. state use two-letter abbreviations (e.g., AK, WA) Measures (fisheries) fork length mideye-to-fork mideye-to-tail-fork standard length total length FL MEF METF SL TL Mathematics, statistics all standard mathematical signs, symbols and abbreviations alternate hypothesis H A base of natural logarithm e catch per unit effort CPUE coefficient of variation CV common test statistics (F, t, χ 2, etc.) confidence interval CI correlation coefficient (multiple) R correlation coefficient (simple) r covariance cov degree (angular ) degrees of freedom df expected value E greater than > greater than or equal to harvest per unit effort HPUE less than < less than or equal to logarithm (natural) ln logarithm (base 10) log logarithm (specify base) log 2, etc. minute (angular) ' not significant NS null hypothesis H O percent % probability P probability of a type I error (rejection of the null hypothesis when true) α probability of a type II error (acceptance of the null hypothesis when false) β second (angular) " standard deviation SD standard error SE variance population Var sample var
3 TECHNICAL PAPER NO. 333 SUBSISTENCE HARVESTS OF PACIFIC HALIBUT IN ALASKA, 2006 by James A. Fall Alaska Department of Fish and Game, Division of Subsistence, Anchorage David Koster Alaska Department of Fish and Game, Division of Subsistence, Anchorage and Michael Turek Alaska Department of Fish and Game, Division of Subsistence, Juneau Alaska Department of Fish and Game Division of Subsistence PO Box , Juneau, Alaska December 2007 Preparation of this report was supported through NOAA Award No. NANMF , U.S. Department of Commerce, National Oceanic and Atmospheric Administration, National Marine Fisheries Service.
4 The Division of Subsistence Technical Paper Series was established in 1979 and represents the most complete collection of information about customary and traditional uses of fish and wildlife resources in Alaska. The papers cover all regions of the state. Some papers were written in response to specific fish and game management issues. Others provide detailed, basic information on the subsistence uses of particular communities which pertain to a large number of scientific and policy questions. Technical Paper Series reports are available through the Alaska State Library and on the Internet: James A. Fall and David Koster Alaska Department of Fish and Game, Division of Subsistence, 333 Raspberry Road, Anchorage, Alaska 99518, USA and Michael Turek Alaska Department of Fish and Game, Division of Subsistence, P.O. Box , Juneau, Alaska , USA This document should be cited as: Fall, James A., David Koster, and Michael Turek Subsistence harvests of Pacific halibut in Alaska, Alaska Department of Fish and Game, Division of Subsistence, Technical Paper No. 333, Juneau. The Alaska Department of Fish and Game (ADF&G) administers all programs and activities free from discrimination based on race, color, national origin, age, sex, religion, marital status, pregnancy, parenthood, or disability. The department administers all programs and activities in compliance with Title VI of the Civil Rights Act of 1964, Section 504 of the Rehabilitation Act of 1973, Title II of the Americans with Disabilities Act (ADA) of 1990, the Age Discrimination Act of 1975, and Title IX of the Education Amendments of If you believe you have been discriminated against in any program, activity, or facility please write: ADF&G ADA Coordinator, P.O. Box , Juneau AK U.S. Fish and Wildlife Service, 4040 N. Fairfax Drive, Suite 300 Webb, Arlington VA Office of Equal Opportunity, U.S. Department of the Interior, Washington DC The department s ADA Coordinator can be reached via phone at the following numbers: (VOICE) , (Statewide Telecommunication Device for the Deaf) , (Juneau TDD) , or (FAX) For information on alternative formats and questions on this publication, please contact: ADF&G, Division of Subsistence, Website:
5 TABLE OF CONTENTS Page LIST OF TABLES...iii LIST OF FIGURES...iii APPENDIX TABLES...iv LIST OF ACRONYMS USED IN THE REPORT...v ACKNOWLEDGMENTS...vi ABSTRACT...vii SUBSISTENCE HARVESTS OF PACIFIC HALIBUT IN ALASKA, vii EXECUTIVE SUMMARY...viii CHAPTER 1: BACKGROUND AND METHODS...1 BACKGROUND...1 PROJECT OBJECTIVES...2 DATA COLLECTION METHODS...2 Public Outreach...2 Mailed Household Survey...2 Community Visits...4 In-season Harvest Monitoring in St. Paul...5 In-season Harvest Monitoring in Sitka and Kodiak...6 SAMPLE ACHIEVEMENT...6 DATA ANALYSIS...7 Data Entry...7 Analysis: Development of Harvest Estimates...7 Supplemental Mailing and In-Season Study...10 Products...11 CHAPTER 2: FINDINGS...13 SUBSISTENCE HALIBUT HARVESTS IN Estimated of Subsistence Fishers...13 Estimated Alaska Subsistence Harvests in 2006 by SHARC Type and Regulatory Area...14 Estimated Alaska Subsistence Harvests in 2006 by Harvest Location...15 Subsistence Harvests by Place of Residence...18 Subsistence Harvests by Gear Type...18 of Hooks with Setline Gear...19 Sport Harvests of by SHARC Holders...19 Estimated Average Net Weights of Subsistence and Sport-Caught...20 ROCKFISH HARVESTS...21 LINGCOD HARVESTS...22 i
6 TABLE OF CONTENTS (Continued) Page CHAPTER 3: DISCUSSION...23 COMPARISONS WITH OTHER HARVEST ESTIMATES...23 COMMUNITY CASE STUDIES...24 Sitka (Regulatory Area 2C)...24 Petersburg (Regulatory Area 2C)...25 Cordova (Regulatory Area 3A)...27 Port Graham (Regulatory Area 3A)...28 Kodiak City and Road System (Regulatory Area 3A)...29 Sand Point (Regulatory Area 3B)...30 Unalaska/Dutch Harbor (Regulatory Area 4A)...32 Toksook Bay (Regulatory Area 4E)...33 Tununak (Regulatory Area 4E)...34 COMPARISONS WITH NONSUBSISTENCE HARVESTS IN CHAPTER 4: CONCLUSIONS AND RECOMMENDATIONS...37 SUMMARY AND CONCLUSIONS...37 RECOMMENDATIONS...39 REFERENCES CITED...41 REPORT TABLES...43 REPORT FIGURES...67 APPENDIX A: LIST OF ELIGIBLE TRIBES AND RURAL COMMUNITIES (FROM FEDERAL REGISTER)...99 APPENDIX B: LETTER SENT TO TRIBES ABOUT THE PROJECT APPENDIX C: NEWSPAPER NOTICE APPENDIX D: SURVEY FORM APPENDIX E: SURVEY INSTRUCTIONS APPENDIX F: RESPONSES TO FREQUENTLY ASKED QUESTIONS APPENDIX G: APPENDIX TABLES APPENDIX H: PROJECT FINDINGS SUMMARY ii
7 LIST OF TABLES Table Page 1. Population of rural communities eligible to participate in the Alaska subsistence halibut fishery, 2000 and Project chronology, 2006 study year Sample achievement, Alaska subsistence halibut survey for 2006 by eligible Alaska tribe, eligible Alaska rural community, and place of residence of SHARC holders Estimated Alaska subsistence harvests of halibut, sport halibut harvests by SHARC holders, and incidental harvests of lingcod and rockfish by SHARC type and regulatory area of the tribe or rural community of registration by the SHARC holder, Age of subsistence halibut registration certificate holders by SHARC type, Estimated Alaska subsistence harvests of halibut by halibut regulatory area, and subarea fished and by gear type, and estimated sport harvests by SHARC holders, Alaska subsistence halibut harvests in 2003, 2004, 2005, and 2006 by geographic area fished of hooks usually fished, setline (stationary) gear, Alaska subsistence halibut fishery, Average net weight of subsistence and sport harvested halibut, 2006, by regulatory area fished Estimated harvests of lingcod and rockfish by SHARC holders while subsistence fishing for halibut, by regulatory area and geographic subarea fish, Estimated harvests of halibut by gear type and participation in subsistence and sport fisheries, selected Alaska communities, 2003, 2004, 2005, and Estimated harvests of halibut for home use, Sitka Estimated harvests of halibut for home use, Petersburg Estimated harvests of halibut for home use, Cordova Estimated harvests of halibut for home use, Port Graham Estimated harvests of halibut for home use, Kodiak Road System removals in Alaska by regulatory area, Comparison of selected SHARC results, 2003, 2004, 2005 and 2006 study years LIST OF FIGURES Figure Page 1. Regulatory areas for the Pacific halibut fishery of surveys returned and return rates for subsistence halibut surveys by SHARC type, Subsistence halibut harvest survey return rates, communities and tribes with more than 100 SHARCs issued, Return rate by place of residence, of survey responses by response category, of SHARCs issued and estimated number of subsistence halibut fishers in Alaska by SHARC type, 2003, 2004, 2005, and Age of subsistence halibut registration certificate holders by SHARC Type, Estimated number of subsistence halibut fishers, 2003, 2004, 2005, and 2006 by regulatory area of tribe or rural community Estimated number of subsistence halibut fishers by place of residence (selected communities), 2003, 2004, 2005, and Estimated subsistence harvest of halibut in Alaska, 2006, by regulatory area of tribe and rural community, in pounds net weight Estimated Alaska subsistence halibut harvests in pounds net weight by SHARC type, 2003, 2004, 2005, and Percentage of tribal subsistence halibut harvest by tribe, Percentage of rural community subsistence halibut harvest by community, Percentage of subsistence halibut harvest by regulatory area fished, Alaska subsistence halibut harvests by geographic area, Percentage of Alaska subsistence halibut harvest by geographic area, iii
8 LIST OF FIGURES (Continued) Figure Page 17. Estimated subsistence halibut harvests, pounds net weight, by regulatory area fished, 2003, 2004, 2005, and Change in Alaska subsistence halibut harvests from 2005 to 2006 by regulatory area fished Change in Alaska subsistence halibut harvests from 2003 to 2006 by regulatory area fished Average subsistence harvest of halibut per fisher in Alaska, 2006, by regulatory area, in pounds net weight Average subsistence harvest of halibut per fisher in Alaska, 2006, by regulatory area, in number of fish Alaska subsistence halibut harvests by place of residence, Percentage of subsistence halibut harvest by gear type by regulatory area, of hooks usually fished, percentage of fishers using setline (stationary) gear, Alaska subsistence halibut fishery, Estimated incidental harvest of rockfish in the Alaska subsistence halibut fishery, 2003, 2004, 2005, and 2006 by regulatory area fished Percentage of incidental harvest of rockfish by regulatory area fished, Estimated incidental harvest of lingcod in the Alaska subsistence halibut fishery, 2003, 2004, 2005 and 2006, by regulatory area fished Percentage of incidental harvest of lingcod by regulatory area fished, Estimated harvests of halibut for home use, Port Graham removals, Alaska, removals in Alaska by regulatory area and removal category, APPENDIX TABLES Appendix Table Page 1. Results from returned surveys by eligible Alaska Tribe, eligible Alaska rural community, and place of residence, Reported harvests of halibut in number of fish by return category, eligible Alaska Tribe, eligible Alaska rural community, and community of residence, Estimated Alaska subsistence harvests of halibut by eligible Alaska Tribe and eligible Alaska Rural community, by gear type and regulatory area in number of fish and pounds net weight, Estimated subsistence and sport harvests of halibut and harvests of lingcod and rockfish by place of residence, Estimated subsistence harvests of halibut by gear type and place of residence, Estimated number of SHARC holders who either subsistence or sport fished for halibut by place of residence, Estimated subsistence harvests of halibut and sport harvests of halibut, pounds net weight, and incidental harvests of lingcod and rockfish by eligible Alaska Tribe and eligible Alaska rural community SHARC holders, iv
9 LIST OF ACRONYMS USED IN THE REPORT ADF&G ANHSC ANSHWG BOF CDQ CPDB CSIS EVOS IPHC LAMP NMFS NPFMC RAM PID/DAV SHARC STA SWHS Alaska Department of Fish and Game Alaska Native Harbor Seal Commission Alaska Native Subsistence Working Group Alaska Board of Fisheries Community Development Quota Community Profile Database (of the Division of Subsistence) Community Subsistence Information System (of the Division of Subsistence) Exxon Valdez Oil Spill International Pacific Commission Local area management plan National Marine Fisheries Service North Pacific Fishery Management Council Restricted Access Management Office, NMFS Permanent identification cards issued to Alaska residents over 60 years of age (PID) and sport fishing licenses issued to disabled veterans (DAV) Subsistence Registration Certificate Sitka Tribe of Alaska Alaska Sport Fishing Statewide Harvest Survey v
10 ACKNOWLEDGMENTS First and foremost, we thank the thousands of individuals who took the time to voluntarily respond to the mailed survey form. This report would not be possible without their cooperation. Jay Ginter of the National Marine Fisheries Service (NMFS), as the lead subsistence halibut regulatory contact, facilitated the grant that funded this project and also provided other project support. Staff within the Restricted Access Management program of NMFS (RAM) administered the subsistence halibut registration certificate (SHARC) program and helped provide information to the public about the research. We thank Tracy Buck, Marie Beierly, Allen Butner, Amberly Lail, Clydina Bailey, Tamara Bledsoe, Toni Fratzke, and Jessica Gharrett. Five other RAM staff also contributed significantly to program development and administration, but are no longer with the NMFS, Alaska Region: Phil Smith, Kathleen Coleman, Mindy Jones, Troy Ryder, and Robin Martin. We gratefully acknowledge the input and support of the Alaska Native Subsistence Working Group. We also thank the many tribal governments that granted approvals for the several survey projects with which the subsistence halibut research was coordinated, and the local research assistants who helped with these projects. Especially, we thank the Sitka Tribe of Alaska (Ms.Robi Craig), the Hydaburg Cooperative Association (Anthony Christianson), and the Angoon Cooperative Association (Juanita Silva) for assisting with administering surveys in their communities. Matt Kookesh of the Southeast Alaska Inter-Tribal Fish and Wildlife Commission was responsible for conducting interviews with SHARC holders in Ketchikan and Saxman. Staff of the Central Bering Sea Fishermen s Association who helped with project outreach, reviewed SHARC lists, and administered the in-season harvester interview project included Rena Kudrin, Phillip Lestenkof, Nadesda Lynnette Philemonoff, and Raymond Melovidov. Special thanks are also extended to tribal administrator Cecelia White of the Nunakauyak Traditional Council her helpful support in administering surveys in Toksook Bay. In addition to the co-authors of this report, other Division of Subsistence staff who assisted with research, data management, and report preparation included Heather Bishop, Nicole Cummings, Rada Nordstrand, Chloe Dunlap, River Ramuglia, Mike Turek, Mathew Brock, Nancy Ratner, Davin Holen, Lisa Scarbrough, Ron Stanek, Ted Krieg, Tracie Krauthoefer, Sverre Pedersen, and Bridget Easley. Ana Lewis and Peggy Lewerenz provided project administrative support. Nonpermanent employees Dana Brockman and Tonya Lee conducted the in-season harvest monitoring project in Kodiak that provided some of the information on that community included in this report. Heather Gilroy and Gregg Williams (staff to the International Pacific Commission) provided background information and comments on a draft of this report. Several of the abovementioned ADF&G and NMFS staff also offered comments and suggestions on the preliminary draft, as did Elizabeth Andrews and Scott Meyer of ADF&G. The authors of this report are of course responsible for any errors or deficiencies that the report may still contain. vi
11 ABSTRACT SUBSISTENCE HARVESTS OF PACIFIC HALIBUT IN ALASKA, 2006 This report describes the results of the fourth annual study to estimate the subsistence halibut harvest in Alaska since the National Marine Fisheries Service adopted rules governing subsistence halibut fishing in Data were collected through a voluntary mail-out survey of all holders of subsistence halibut registration certificates (SHARC). The survey response rate was 59% (8,426 surveyed of 14,206 SHARC holders.). An estimated 5,909 individuals participated in the subsistence fishery for halibut in 2006, compared to 5,621 in 2005; 5,984 in 2004; and 4,942 in The estimated harvest in 2006 was 54,089 halibut, comprising 1,125,312 pounds (+/- 2.9%) net weight. This compares to a harvest estimate of 55,875 fish comprising 1,178,222 pounds (+/-3.0%) in 2005; 52,412 fish comprising 1,193,162 pounds (+/- 1.5%) in 2004; and 43,926 halibut comprising 1,041,330 pounds (+/- 3.9%) in Of the total subsistence halibut harvest in 2006, 70% was harvested with setline gear and 30% with handoperated gear. As in 2003, 2004, and 2005, the largest portion of the Alaska subsistence halibut harvest in 2006 occurred in Regulatory Area 2C (Southeast Alaska), 52%, followed by Area 3A (Southcentral Alaska), 34%. Subsistence harvests represent about 1.5% of the total halibut removals in Alaska in The harvest estimates based on the surveys for 2003, 2004, 2005, and 2006 serve as a basis for understanding the overall harvest, annual variability in catch, and whether any increase in harvest may be associated with implementation of the new regulations. Although the 2006 harvest estimate is about the same as the 2005 and 2004 estimates and somewhat higher than the 2003 estimate, there are no certain trends in the fishery based on these four study years. The report recommends that research be continued for at least one more year, so that at least five years of data under the current set of regulations can be evaluated. vii
12 EXECUTIVE SUMMARY This report presents findings of a study designed to estimate the subsistence harvest of Pacific halibut Hippoglossus stenolepis in Alaska in The Division of Subsistence of the Alaska Department of Fish and Game conducted the study through NOAA Award No. NA04NMF from the U.S. Department of Commerce, National Oceanic and Atmospheric Administration, the National Marine Fisheries Service (NMFS). In May 2003, NMFS published federal regulations implementing a subsistence halibut fishery in Alaska for qualified individuals who are residents of 117 rural communities or members of 123 Alaska Native tribes with traditional uses of halibut. The year 2006 was the fourth in which subsistence halibut fishing took place under these regulations. Subsistence fishers are required to obtain a subsistence halibut registration certificate (SHARC) from NMFS before fishing. At the end of 2006, 14,206 individuals held SHARCs, compared to 14,306 by the end of 2005 (a decrease of 1% from 2005 to 2006); 13,813 by the end of 2004 (an increase of 3% from 2004 to 2006); and 11,635 by the end of 2003 (a 22% increase from 2003 to 2006). Harvest information was collected by means of a mail-out survey. The one-page survey form was mailed to all SHARC holders in early 2007, with two follow-up mailings. Household visits supplemented the mailings in selected communities. In total, 8,426 surveys were returned, a response rate of 59%. Participation in the survey was voluntary. According to the study findings, an estimated 5,909 individuals participated in the subsistence halibut fishery in 2006, compared to an estimated 5,621 in 2005; 5,984 in 2004; and 4,942 in The estimated harvest in 2006 was 54,089 halibut (+/- 2.8%) comprising 1,125,312 pounds (+/- 2.9%) net weight. ( Net weight is 75% of round or live weight; the estimated harvest was 1,500,416 pounds round weight.) This compares to a harvest estimate of 55,875 fish (+/- 3.0%) comprising 1,178,222 pounds (+/- 3.0%) net weight in 2005; 52,412 fish (+/- 1.6%) comprising 1,193,162 pounds (+/-1.5%) in 2004; and 43,926 halibut comprising 1,041,330 pounds net weight (+/- 3.9%) in The 2006 harvest was about 4% lower than the estimated harvest for The 2005 harvest was about 1% lower than the estimated harvest for 2004, whereas the 2004 harvest estimate was 15% higher than the 2003 harvest estimate. The 2006 estimated harvest was 8% higher than the estimate for Of the total subsistence halibut harvest in 2006, 782,532 pounds (70%) were harvested with setline (stationary) gear (longlines or skates) and 342,779 pounds (30%) were harvested with hand-operated gear (rod and reel or handline). This was similar to the harvest by gear type in 2005 (70% setline and 30% hand-operated gear), 2004 (74% setline and 26% hand-operated gear), and 2003 (72% setline and 28% hand-operated gear). Of those subsistence fishers using setline gear in 2006, the most (38%) usually fished with 30 hooks, the maximum number allowed by regulation in all areas except Areas 4C, 4D, and 4E (where regulations establish no hook limit). Subsistence fishers also harvested an estimated 16,945 rockfish Sebastes spp. and 3,486 lingcod Ophiodon elongatus in 2006 while fishing for halibut. In 2005, subsistence halibut fishers harvested an estimated 12,395 rockfish and 2,355 lingcod. In 2004, subsistence halibut fishers harvested 19,001 rockfish and 4,407 lingcod. In 2003, subsistence halibut fishers had an estimated incidental harvest of 14,870 rockfish and 3,298 lingcod. Based upon fishing locations, the largest portion of the Alaska subsistence halibut harvest in 2006 occurred in Regulatory Area 2C (Southeast Alaska), 52% (580,117 pounds); followed by: viii
13 Area 3A (Southcentral Alaska), 34% (379,258 pounds); Area 4E (East Bering Sea Coast), 6% (70,743 pounds); Area 3B (Alaska Peninsula), 4% (48,547 pounds); Area 4A (Eastern Aleutian Islands), 2% (27,062 pounds); Area 4C (Pribilof Islands), less than 1% (8,529 pounds); Area 4D (Central Bering Sea), less than 1% (8,297 pounds); and Area 4B (Western Aleutian Islands), less than 1% (2,761 pounds). In 2005, 2004, and 2003 as well, Area 2C and Area 3A accounted for over 85% of the subsistence halibut harvests. The proportion of the statewide subsistence halibut harvest occurring in Area 2C declined to 52% in 2006 and 51% in 2005, compared to 57% in 2004 and 60% in Correspondingly, the portion occurring in Area 3A increased to 34% in 2006, 36% in 2005, and 34% in 2004, compared to 27% in Preliminary data from the International Pacific Commission combined with the findings of this study indicate that million pounds (net weight) of halibut were removed from Alaskan waters in Of this total, the subsistence harvest accounted for 1.5%. Commercial harvests took 70.1% of the halibut, followed by bycatch in other commercial fisheries (14.5%), sport harvests (11.7%), and wastage in the commercial fishery (2.2%). This report describes the results of the fourth annual study to estimate the subsistence halibut harvest in Alaska since NMFS adopted rules governing subsistence halibut fishing in May The harvest estimates based on the SHARC surveys for the 2003, 2004, 2005, and 2006 fishing seasons serve as a basis for understanding the overall harvest, annual variability in catch, and whether any increase in harvest may be associated with implementation of the new regulations. Demonstrating changes in the magnitude of the Alaska subsistence halibut harvest resulting from the new regulations using the results of the SHARC surveys for 2003 through 2006 is problematic, however, because of the limitations of earlier harvest estimates at the statewide level. The subsistence harvest estimates for 2003, 2004, 2005, and 2006 for some of the larger communities, such as Sitka, Petersburg, and Kodiak, which account for the majority of the harvest, are similar to harvest estimates based on household surveys prior to the new regulations. The higher overall harvest estimates for 2006, 2005, and 2004 compared to 2003 may be due to more thorough registration of subsistence fishers, hence better harvest documentation. Additional years of harvest data will be necessary for shedding light on these and other factors that shape the subsistence halibut harvest in Alaska. The report concludes that 1.13 million net pounds is a sound estimate of the Alaska subsistence halibut harvest in The estimate is based upon a scientific sampling of SHARC holders and a relatively high response rate. The total estimated harvest falls below the 1.5 million net pounds estimated for the subsistence harvest when the current regulations were developed by the North Pacific Fishery Management Council (see page 16748). Although the 2006 harvest estimate is about the same as the 2004 and 2005 estimates and somewhat higher than the 2003 estimate, there are no certain trends in the harvest based on these four study years. The report recommends that research be continued for at least one more year, so that at least five years of data under the current set of regulations governing gear, participation requirements, and daily harvest limits can be evaluated. ix
14 x
15 CHAPTER 1: BACKGROUND AND METHODS BACKGROUND The primary goal of this project was to estimate the subsistence harvest of Pacific halibut Hippoglossus stenolepis in Alaska in 2006 through a survey mailed to registered subsistence halibut fishers and supplemented by a limited number of face-to-face interviews in selected communities. This was the fourth year for which the research was conducted. (See Fall et al for the results for 2003, Fall et al for the results for 2004, and Fall et al for the results for 2005.) The Division of Subsistence of the Alaska Department of Fish and Game (ADF&G) administered the project through a grant from the National Marine Fisheries Service (NMFS) (Award NA04NMF ). In Alaska s coastal areas, subsistence halibut fisheries are local, noncommercial, customary and traditional food fisheries, as noted by Wolfe (2002) and described in Environmental Assessment/Regulatory Impact Review/Initial Regulatory Flexibility Analysis for a Regulatory Amendment for Defining a Subsistence Fishery Category (an EA/RIR/IRFA ) by North Pacific Fishery Management Council (NPFMC), ADF&G, International Pacific Commission (IPHC), and NMFS, August 11, 2000 (NMFS 2000; see also NMFS 2003). The EA/RIR/IRFA summarizes information about the subsistence halibut fishery in Alaska. This background information is not repeated here but provided the basis for the NPFMC s recommendation for subsistence halibut fishing regulations in Alaska. Figure 1 illustrates halibut regulatory areas in Alaska. In April 2003, the National Marine Fisheries Service, Alaska Region, published federal regulations implementing a subsistence halibut fishery for qualified individuals in the waters in and off Alaska (68 FR 18145, April 15, 2003) (see In total, residents of 117 rural communities 1 and members of 123 Alaska Native tribes are eligible to participate in the fishery. 2 (See Appendix A for a list of eligible tribes and communities as they appear in the Federal Register.) Subsistence halibut fishers are required to obtain a Subsistence Registration Certificate (SHARC) from the Restricted Access Management Program (RAM) office of NMFS prior to fishing. These federal regulations (50 CFR Part (h)(4)) authorize periodic surveys of holders of SHARCs to estimate annual subsistence harvests and related catch and effort information. The regulation states that, Responding to a subsistence halibut harvest survey will be voluntary. 3 Table 1 provides population estimates for the eligible rural communities for 2000 based on the federal decennial census. The total population of these communities in 2000 was 82,572, of which 38,977 were Alaska Natives. In addition, the nonrural places of Juneau and Ketchikan in 1 In December 2004, the NPFMC adopted a recommendation to the Secretary of Commerce to add Naukati Bay to the list of eligible rural communities. Regulations implementing this change had not been approved as of the preparation of this report. 2 Note that the Northern Pacific Act of 1982, under which the Alaska subsistence halibut fishery regulations are authorized, provides for fair and equitable allocations of halibut among U.S. fishers, but does not establish priorities for those allocations (see page 16747). 3 The subsistence rules were amended in 2005 by regulations published in the Federal Register at 70 FR 16742, April 1, Among other things, this amendment provides for obtaining Community Harvest Permits, Ceremonial Permits, and Educational Permits. 1
16 2000 had Alaska Native populations of 5,084 and 2,689, respectively (U.S. Census Bureau 2001), most of whom were eligible to participate in the subsistence halibut program through their tribal membership. Also, an unknown number of eligible tribal members lived in other nonrural places such as Anchorage and the Kenai Peninsula Borough. As also shown in Table 1, estimates published by the State of Alaska for 2006 report a total population of 80,516 for eligible rural communities. Updated population estimates by ethnicity are not available. PROJECT OBJECTIVES The primary goal of the project was to estimate the subsistence harvest of halibut in Alaska in the calendar year Objectives included: 1. An estimate of the subsistence harvest of halibut in Alaska in 2006 by community, tribe, gear type, and IPHC regulatory area, along with an estimate of the number of individuals who subsistence fished for halibut in An estimate of the harvest of halibut by SHARC holders while sport fishing in An estimate of the number of lingcod Ophiodon elongatus and rockfish Sebastes spp. taken by subsistence fishers while subsistence fishing for halibut in DATA COLLECTION METHODS Public Outreach In mid December 2006, the Division of Subsistence sent a letter to all eligible tribes informing them about the fourth year of the research. This communication also included a copy of the short summary of the findings for (Appendix B is a copy of the letter sent to all eligible tribes.) Each tribe also received a copy of the full final report for In January 2007, announcements were made through the media (local newspapers and radio stations) about the upcoming mailing of halibut survey forms to SHARC holders. Appendix C is a copy of an announcement that ran in the following Alaska newspapers in late January 2007: Kodiak Daily Mirror, Bristol Bay Times (Dillingham), the Dutch Harbor Fisherman, the Tundra Drums (Bethel), the Cordova Times, the Sitka Sentinel, the Ketchikan Daily News, the Petersburg Pilot, the Wrangell Sentinel, the Chilkat Valley News (Haines), the Juneau Empire, and the Capital City Weekly. Information was also available on the NMFS web site for subsistence halibut fishing in Alaska ( Mailed Household Survey As noted, this was the fourth year of a harvest assessment program for the subsistence halibut fishery in Alaska. Because the subsistence halibut regulations only came into effect in 2003, the first several years of collecting harvest data should be viewed as exploratory. Especially in the first study year, in which the new subsistence regulation only came into effect in May, it was expected that harvest estimates for some communities and tribes would be incomplete, based upon relatively low response rates or incomplete registration of halibut fishers with NMFS. Subsequent study years have built upon the lessons learned in the first years of the project and have benefited from outreach efforts to improve response rates. (See recommendations in Chapter 4.) As recommended by Wolfe (2002), the methodology was based upon the registration system for all subsistence halibut fishers, which requires fishers to obtain a SHARC before fishing. Of the 2
17 14,206 individuals who held a valid SHARC for any portion of 2006 as of December 31, 2006, 13,372 were surveyed with a mailed, retrospective recall form covering a 12-month harvest period in calendar year Because an in-season harvest monitoring program took place in St. Paul, no surveys were mailed to residents of that community. Also, SHARC holders who participated in an in-season harvest monitoring project in Kodiak and Sitka were not mailed surveys (see below). Households in Nanwalek and Port Graham were interviewed as part of a rockfish project and no surveys were mailed to residents of these communities. The survey instrument was virtually identical to the form used for the 2003, 2004, and 2005 study years. It is based on recommendations by Wolfe (2002:Appendix A), with slight modifications such as study year and return address. (See Appendix D in this report for a copy of the 2006 survey instrument.) Wolfe (2002:15-18) provided justification for the kinds of data to be collected, which included name and address of the fisher; halibut harvests in numbers and pounds round (whole) weight by gear type in 2006; number of hooks usually set; and harvests of lingcod and rockfish taken while subsistence fishing for halibut. In 2003, a question addressing the water body fished (primary location) while subsistence fishing was added at the recommendation of NMFS staff. This question was retained for 2004, 2005, and 2006, and another was added in 2004 to record the location of sport halibut fishing by SHARC holders. The form was designed to reduce the potential double counting of halibut taken with rod and reel gear in both the subsistence survey and the Statewide Harvest Survey conducted by the Department of Fish and Game, Division of Sport Fish (Wolfe 2002:19) by asking respondents to distinguish between their subsistence and sport harvests with this gear type. A short explanatory letter with instructions on the back for completing the form was included in the mailings (Appendix E). The form was designed so that it could be directly mailed to the Division of Subsistence, postage paid. Presently, under IPHC regulations, Community Development Quota (CDQ) fishers may retain halibut under 32 inches ( shorts ) while commercial CDQ fishing in Areas 4D and 4E only. These regulations require the CDQ organization to report this harvest to the IPHC. To avoid double counting, subsistence fishers were instructed not to include these fish on their subsistence halibut survey forms. During a meeting of the Alaska Native Subsistence Working Group (ANSHWG) on October 9, 2003, before the mail-out survey for the first study year, community representatives expressed concern that not all fishers would know what fish are to be included under the category rockfish for the incidental harvest question on the survey form. This could lead to an overestimation of this harvest if fishers reported fish such as Pacific cod or sculpins in response to this question. The instructions mailed with the survey provided guidance on this question. 5 4 SHARCs issued to non-tribal residents of eligible rural communities are valid for two years. Therefore, SHARCs issued beginning in May 2003 began to expire starting in May 2005 and had to be renewed. Some SHARC holders did not renew and therefore were not eligible to participate in the subsistence halibut fishery for all of See also the section on data analysis, below. 5 The principal investigators for this study are aware that more than 30 species of rockfish inhabit Alaska waters. (See Alaska Administrative Code 5 AAC for definitions of management assemblages of rockfishes.) The goal of this study was to keep the questions about incidental harvests simple. As discussed in the recommendations section (see Chapter 4), if more precise harvest data for various rockfish are needed for particular areas, future research should be designed and funded to address these data needs. 3
18 Table 2 provides a chronology of key activities during the project. Table 3 provides a summary of response rates by mailing, SHARC type, and place of residence. The first mailing to 13,372 SHARC holders occurred on February 16, The second mailing to 8,179 SHARC holders occurred on March 19, The third mailing to 6,666 SHARC holders took place on April 18, The Division of Subsistence set up a dedicated address that recipients of the mailed survey could use if they had questions about how to respond. Also, the RAM Program set up a toll-free number ( ) to provide information about the subsistence halibut program, including the harvest assessment program. Both the address and phone number appeared on the survey form. A set of frequently asked questions and responses was developed by ADF&G and NMFS staff members to guide staff responses to phone calls and e- mail inquiries about how to fill out the survey form (Appendix F). Community Visits Because the response rate to the mailed survey varied by community and tribe in the first three study years, the mailings were again supplemented in selected communities with face-to-face household surveys conducted by Division of Subsistence staff or local research assistants. The latter were hired through subcontracts with tribes or Alaska Native regional organizations. Because of the large number of eligible communities and tribes, it was not possible to conduct face-to-face surveys in most communities. Through a contract with the Alaska Native Harbor Seal Commission (ANHSC), the Division of Subsistence and the ANHSC conduct annual household surveys in approximately 60 communities to collect harbor seal and sea lion harvest data from Alaska Native subsistence hunters. For the 2006 study year, most of these interviews took place in February, March, and April In many of the study communities (especially in Southeast Alaska), only known marine mammal hunters were interviewed, but in others (primarily the smaller communities), the goal was to interview all Alaska Native households. 6 In most communities, local assistants hired to conduct the marine mammal interviews were asked to remind people they were interviewing to return the halibut survey form. In most cases, these individuals had received the mailed forms before these community visits took place. In 2007, Division of Subsistence researchers conducted systematic household interviews in Chenega Bay, Port Graham, Nanwalek, and Sitka to record traditional knowledge and subsistence harvest information about rockfish, through a project funded by the North Pacific Research Board. The subsistence halibut harvest form for 2006 was administered as part of these interviews. Division researcher Davin Holen conducted these interviews in Chenega Bay in March Division researcher Ron Stanek administered the halibut surveys in Nanwalek in mid March 2007, assisted by Nick Tanape Sr. Stanek also administered the surveys in Port Graham in March, assisted by Sabrina Malchoff. Cooperative agreements with the Nanwalek Tribal Council and the Port Graham Tribal Council supported this work. Division of Subsistence researchers who worked on the project in Sitka included Nancy Ratner, Mike Turek, and Mathew Brock (Turek 2007). 6 For a description of this project, including a complete list of study communities and sampling goals, see Wolfe et al
19 A continuing goal of the project was to contact subsistence halibut fishers in person in selected communities with relatively high numbers of SHARC holders for which good response rates were especially important. As in the 2005 study year, this included Toksook Bay, Sitka, Hydaburg, Ketchikan, and Saxman. For 2006, household surveys were also administered in Angoon, as recommended in the final report for Cooperative agreements with Sitka Tribe of Alaska, the Angoon Cooperative Association, and the Hydaburg Cooperative Association supported interviewing in Sitka, Angoon, and Hydaburg, respectively. Through another cooperative agreement, the Southeast Alaska Inter-Tribal Fish and Wildlife Commission conducted outreach and interviews in Ketchikan and Saxman. In each community, the surveys were administered face-to-face or by phone. As noted in the final report for 2003 (Fall et al. 2004:8), in Toksook Bay, the number of SHARCs issued (532 were valid in 2006 [Table 3]) approximates the community s total population. Meetings with community leaders in early 2004 determined that there were at the time about 90 to 100 active halibut fishers in Toksook Bay, but only about a third to one-half fished in a particular year. Therefore, as for 2003, 2004, and 2005, a Division of Subsistence staff member, Sverre Pedersen, visited the community, in April With the assistance of local tribal officials and review of findings for 2005, Pedersen identified and interviewed most of the subsistence halibut fishers in Toksook Bay. He also called SHARC holders in Tununak and Hooper Bay to encourage returns of mailed surveys. In-season Harvest Monitoring in St. Paul In January 2005, principal investigator James Fall met with several representatives of the St. Paul tribal government while attending the annual meeting of the International Pacific Commission in Victoria, British Columbia. These tribal representatives were very concerned about the very low response rate to the 2003 mail-out survey by SHARC holders from St. Paul (17%; see Figure 3 in Fall et al. 2004:61), and supported actions that would improve the response rate and result in a reliable estimate of the subsistence halibut harvest for Subsequently, in March 2005, Fall and division information management coordinator Bridget Easley developed an informal agreement with the Central Bering Sea Fishermen s Association (CBSFA) for outreach and evaluation of the survey results. This informal agreement was renewed for the 2005 study year. In March 2006, staff at the CBSFA reviewed the list of St. Paul SHARC holders. They identified individuals who had left the community. They then divided the remaining names on the list into two groups: those who are active subsistence or commercial halibut fishers, and those who do not actively participate in either fishery (131 SHARC holders for 2005). This list was used during analysis of the survey results for St. Paul. In addition, CBSFA staff posted flyers urging return of the mailed survey, ran an announcement about the survey on the local radio station, and were otherwise available to answer questions about the survey and the subsistence halibut program. Later in 2006, the Division of Subsistence and the CBSFA entered into a formal agreement to conduct a pilot in-season harvest monitoring program for subsistence halibut fishing in St. Paul for The CBSFA developed a list of subsistence halibut fishers and hired a staff person to distribute and collect harvest calendars bi-weekly during June, July, and August An additional form was distributed and collected to record any late season harvests. Most subsistence fishers participated in the project, although collection of in-season harvest data in September was incomplete and had to be supplemented by recall. CBSFA reviewed sample achievement and preliminary results. 5
20 Because of the in-season project, no surveys were mailed to SHARC holders with St. Paul mailing addresses. St. Paul tribal SHARC holders living in other communities were mailed surveys. SHARC holders not identified by CBSFA staff as subsistence fishers were classified as returned surveys (staff administered) that did not fish. In-season Harvest Monitoring in Sitka and Kodiak In October 2005, when the grant award between NMFS and the Division of Subsistence of ADF&G was amended, funding was included to plan and implement a pilot project to collect subsistence halibut harvest data in season in Kodiak and Sitka in In June 2006, random samples of SHARC holders in these two communities were contacted and asked to keep records of their subsistence and sport halibut harvests. In July and August, Division staff contacted project participants biweekly to collect the harvest data. In September, project participants received a calendar to record any harvest that took place through December. These were returned by mail. A separate report, projected to be completed in late 2007 or early 2008, will provide a full discussion of the in-season project methods and findings. In-season project results for participating SHARC holders were incorporated into the harvest estimates for Kodiak and Sitka presented in this report as staff administered surveys. No in-season project participants received the mailed survey. SAMPLE ACHIEVEMENT Table 3 reports sample achievement by tribe, rural community, and community of residence. Overall, 8,426 surveys were returned by 14,206 SHARC holders, a response rate of 59% (Figure 2). For residents of the 117 eligible rural communities who did not register as tribal members, 5,127 of 7,083 surveys were returned (72%). As shown in Figure 3, in 2006 there were 12 communities with more than 100 nontribal SHARC holders, accounting in total for 85% of all nontribal SHARCs issued in rural communities. Return rates were 65% or more in all 12 of these communities, and were 70% or more in nine of them. Of the 7,123 individual tribal members who held SHARCs in 2006, 3,299 (46%) returned surveys. As shown in Figure 3, there were 16 tribes with more than 100 members who obtained SHARCs. Return rates for these 16 tribes varied widely, from 95% in Hydaburg (where a contract between the Division of Subsistence and Hydaburg Cooperative Association [the tribal governing body] facilitated survey returns) to 26% in Toksook Bay. In total, these 16 tribes accounted for 72% of all tribal SHARCs. Figure 4 illustrates survey response rates by place of residence of SHARC holders for the 23 communities with 100 or more SHARC holders in These communities accounted for 83% of all SHARCs and 86% of all returned surveys. Figure 5 shows the survey return rate by response category (see also Table 3). After the first mailing, 4,909 surveys were returned, for a response rate of 35%. Responses to the second mailing added 1,305 surveys, a total response rate of 44% up to that point. Responses to the third and final mailing added 690 surveys, for a total response to the mail-out of 6,904 surveys, 49% of the 14,206 SHARC holders, and 52% of the 13,372 surveys initially mailed. In addition, surveys administered by staff, either ADF&G personnel or representatives of tribal organizations working with ADF&G, added 1,522 surveys. Most of these were in Angoon, Hydaburg, Ketchikan, Sitka, Nanwalek, Port Graham, St. Paul, and Toksook Bay. This brought the total response to 8,426 surveys, 59% of all individuals who held SHARCs in
21 The overall response rate for the survey for 2006 declined slightly compared to 2005, from 60% to 59%. The return rate for 2003, the first year of the survey, was 65%, and the return rate for 2004, the second year of the survey, was 62%. The number of returned surveys increased over the first three years of the project, from 7,593 in 2003, to 8,524 in 2004, and 8,565 in 2005, reflecting the larger number of SHARC holders in 2004 and 2005 and the larger number of staff administered surveys in The total number of surveys dropped slightly in 2006, to 8, The response rate by mail declined from 62% in 2003 to 59% in 2004, 55% in 2005, and 52% in However, the number of surveys returned as undeliverable increased from 208 in 2003 (Fall et al. 2004:45), to 617 in 2004 (Fall et al. 2005:48), 613 in 2005 (Fall et al. 2006), and 1,194 in 2006 (Table 3). Subtracting undeliverables from the mail-out totals gives a response rate by mail of 57% in 2006, compared to 62% in 2004, 63% in 2003, and 57% in More surveys were administered in person or through phoning in 2006 (1,522) compared to 2005 (755 surveys), 2004 (355 surveys), or 2003 (392 surveys). The interviewing in Angoon, Nanwalek, and Port Graham, and the in-season monitoring projects in St. Paul, Sitka, and Kodiak, accounted for most of this increase. DATA ANALYSIS Data Entry All returned survey forms were reviewed for completeness prior to data entry. Responses were coded following standardized codebook conventions used by Division of Subsistence. Staff within the Information Management Section of the division set up database structures within an MS SQL Server at ADF&G in Anchorage to hold the survey data. The database structures included rules, constraints, and referential integrity to insure that data were entered completely and accurately. Data entry screens were available on a secure Internet site. Daily incremental backups of the database occurred, and transaction logs were backed up hourly. Full backups of the database occurred twice weekly. This ensured that no more than one hour of data entry would be lost in the unlikely event of a catastrophic failure. Survey responses were manually entered twice, and survey forms were electronically scanned. All data were compared programmatically for inconsistent data entry. Double data entry ensured a more accurate transfer of information from the coded survey forms into the database, and is a standard practice with data processing for the Division of Subsistence. Data did not pass to the processing phase until inconsistencies between the twice-entered data set were eliminated. The scanned survey forms also facilitated efficient data correction and editing. Information was processed and analyzed using MS SQL programming. Initial processing included the performance of standardized logic checks of the data. Logic checks are often needed in complex data sets where rules, constraints, and referential integrity do not capture all of the possible inconsistencies that may appear. Analysis: Development of Harvest Estimates Analysis included review of raw data frequencies, cross tabulations, table generation, and estimates of population parameters. Missing information was dealt with situationally. The Division of Subsistence has standard practices for dealing with missing information, such as minimal value substitution or use of an average response for similarly characterized households 7 See Table 18 in Chapter 4 for sample sizes and fractions and selected study findings for the four study years. 7
22 or communities. Typically, missing data are an uncommon, randomly occurring phenomenon in household surveys conducted by the division, as was the case in this project. In general, estimates of harvests, levels of participation, and other findings were calculated based upon the application of weighted means (Cochran 1977). These calculations are standard methods for extrapolating sampled data. In this study, each tribe and rural community was a separate stratum for purposes of estimating total harvests. In most cases, the mean for returned SHARC surveys was applied to the total number of SHARCs issued for the tribe or community to calculate the estimated harvest. (See Appendix Table 1 in Appendix G for the reported harvests for each tribe and community.) The formula for standard expansion of community harvests is: H t = H i where H = h W i i i N i and W i = (Harvest weight factor per strata i) n i H t = the total harvest (numbers of fish or pounds), H i = the total harvest for tribe or community i W i = the weight factor for tribe or community i, h i = the total harvest reported in returned surveys for tribe or community, n i = the number of returned surveys in each tribe or community, and S i = the number of SHARCs issued for tribe or community. There were five exceptions. As discussed above, in 2006, 532 SHARCs were held by members of the Native Village of Toksook Bay, most of whom do not fish for halibut. Expanding the reported harvest based on in-person interviews and mailed survey returns (138 returns, or 26% of all SHARCs issued [Table 3]) would result in a large overestimate of the subsistence halibut harvest for the community. Therefore, the reported harvest is the estimated harvest for Toksook Bay. Second, as discussed above, CBSFA staff in St. Paul divided the list of SHARC holders living in that community into two strata: potential subsistence halibut fishers (33 SHARC holders) and others (201 SHARC holders). All SHARC holders in the second category were classified as staff administered surveys, did not fish. Of the potential fisher category, 27 of 33 participated in the in-season harvest monitoring project. Survey results for respondents in this stratum were used to estimate harvests for the six non-participants in this strata. One participant in the inseason project was a member of the Native Village of Atka. There were 12 other St. Paul tribal SHARC holders living outside the community of St. Paul. Attempts were made through the 8
23 mail-out survey to contact these SHARC holders, but none responded and all were treated as potential fishers. Third, 177 SHARCs were held by eligible tribal members living outside of Alaska. Only 31% of the mailed surveys were returned from this group, and only four of these returned surveys indicated any subsistence fishing activity. Rather than assign the mean value for their tribe (which would likely result in an overestimate of the harvest), all non-returned surveys for SHARC holders with out-of-state addresses were coded as did not fish. Fourth, rural community SHARC holders were divided into two categories based upon the expiration date of their SHARC. SHARCs having an expiration date falling within the study period and that were not renewed were treated as separate strata from other SHARCs for the purpose of generating harvest estimates. This was done to account for potential bias and resulting overestimation of harvest for SHARCs that only fished for part of the year. During 2006, 626 rural community SHARCs expired; of those 263 (42%) participated in the survey. Fifth, as in 2005, the response rate for tribal SHARC holders of the Village of Kanatak was very low (1 of 11; 9%). Therefore, an expanded harvest estimate was not calculated for this tribe; the reported harvest by the single respondent serves as the harvest estimate for the Village of Kanatak. The RAM division issued six community harvest permits to tribes in Area 2C that were valid in Holders of these permits reported no subsistence halibut harvests to RAM. No educational or ceremonial permits were issued for If harvests under any of these permits had occurred, the totals would have been added to the estimates for the tribe of the permit holder because they are not reported by individuals in their response to the SHARC mailed survey. It should also be noted that not every individual who obtained a SHARC as a tribal member resided in the community where his or her tribe s headquarters is located. Therefore, the sum of harvest estimates for tribal SHARC holders and rural resident SHARC holders does not necessarily equal the halibut harvest for particular communities. Rather, an additional analysis was necessary to estimate harvests by community of residence that assigned tribal SHARC holders to a community based on their mailing addresses. Appendix Tables 4, 5, and 6 report study results by place of residence of the SHARC holders. The standard deviation (SD) (or Variance [V], which is the SD squared) of the harvest was calculated with the raw, unexpanded data. The Standard Error (SE), or SD of the mean, was also calculated for each community or tribe. This was used to calculate the relative precision of the mean, or the likelihood an unknown value falls within a certain distance from the mean. In this study, the relative precision of the mean is shown in the tables as a confidence interval (CI), expressed as a percent. Once the standard error was calculated, the CI was determined by multiplying the SE by a constant that reflected the level of significance desired, based on a normal distribution. The constant for 95% confidence intervals is Though there are numerous ways to express the formula below, it contains the components of a SD, V, and SE. 9
24 Relative Precision of the Mean (CI%): Where s = t ( x xi ) 1 i= 1 ni s = sample standard deviation n = total sample size N = total population size ni 2 (Sample standard deviation) = tribal or community sample size N i = tribal or community population size tα 2 = Student s t statistic for alpha level (α=.95) with n-1 degrees of freedom. Project staff explored the possibility of non-response bias for returned mail out surveys and its effect on harvest estimates. However, it was determined that responses to the survey, including harvest levels and involvement in the fishery, were not significantly different between any of the response categories (responses to the first mail out, the second mailout, the third mailout, and staff administered surveys) (see Appendix Table 2). As noted above, survey respondents provided harvest estimates in pounds round (whole, live) weight. For ease of comparison with estimates of halibut removals in other fisheries, we have converted these estimates to pounds net (dressed, head off) weight, where (0.75) (round weight) = net weight. 8 Supplemental Mailing and In-Season Study In 2005, the grant agreement between ADF&G and NMFS was amended to add funds to support a supplemental survey mailing to 1,108 SHARC holders in Sitka and Kodiak who had responded to the mailed survey in 2005 and had reported fishing for halibut in The primary goal of the supplemental mailing was to collect additional background information about subsistence halibut fishing that was necessary to design an in-season harvest assessment program for The factor of 0.75 for converting halibut round weight to net weight is the standard used by the International Pacific Commission and the Division of Sport Fish of ADF&G. Division of Subsistence studies, as reported in the Technical Paper Series and the Community Subsistence Information System (ADF&G 2007) (formerly the Community Profile Database [Scott et al. 2001]), generally use a factor of 0.72 for converting halibut round weights to net weights, based on Crapo et al. (1993:7), who report that on average, the weight of a dressed halibut with the head removed is 72% of the round weight, with a range of 68% to 80%. In Division of Subsistence reports, net weight (dressed, head off) is usually referred to as usable weight. 10
25 Respondents were asked to indicate the months in which they fished for halibut in 2004 and their harvests in each month; name the locations at which they landed (brought to shore) halibut in 2004; explain how they distinguished between sport fishing and subsistence fishing for halibut; and evaluate their understanding of the subsistence halibut regulations. Survey findings are reported in Appendix I of Fall et al Chapter 2 includes a short discussion of reasons provided by supplemental survey respondents for distinguishing between subsistence and sportcaught halibut. As noted earlier, the grant agreement between ADF&G and NMFS was also amended to fund an in-season harvest monitoring program for the subsistence halibut fisheries in Sitka and Kodiak in This study was implemented in May Findings will be reported in a separate report to be completed in early Products The public review draft of this final report was completed in November 2007 and circulated for review and comments. The draft report was also posted at the Division of Subsistence web site. A presentation of the study findings and recommendations took place at the December 2007 meetings of the ANSHWG and the NPFMC in Anchorage, Alaska. The final report was revised in consideration of comments and suggestions received from reviewers of the public review draft and those received during the NPFMC and ANSHWG meetings. In addition to the final report, a short findings summary was prepared (Appendix H). The summary was sent to tribal government representatives and other interested individuals and groups. This report and the project summary were posted on the Division of Subsistence web site and the RAM website in PDF format for downloading and printing by the public. 11
26 12
27 CHAPTER 2: FINDINGS SUBSISTENCE HALIBUT HARVESTS IN 2006 Estimated of Subsistence Fishers Of the 14,206 individuals who were holders of SHARCs in 2006 (obtained in 2003, 2004, 2005, or 2006), an estimated 5,909 (42%) participated in the subsistence halibut fishery in 2006 (Table 4, Figure 6). Of the 7,123 individuals who had obtained SHARCs as members of an eligible tribe, an estimated 2,329 participated in the fishery (33%). Of the 7,083 individuals who had obtained SHARCs as residents of qualifying rural communities, an estimated 3,580 (51%) participated in the subsistence fishery for halibut in In 2005, 5,621 of 14,306 SHARC holders fished in the subsistence halibut fishery (39%) including 2,035 of 6,437 tribal SHARC holders (32%) and 3,349 of 7,869 non-tribal rural SHARC holders (43%). In 2004, 5,984 of 13,813 SHARC holders participated in the fishery (43%), including 2,157 of 6,533 tribal SHARC holders (33%) and 3,827 of 7,280 non-tribal rural SHARC holders (53%). In 2003, 4,924 of 11,635 SHARC holders participated in the subsistence fishery (42%), including 1,836 of 5,578 tribal SHARC holders (33%) and 3,106 of 6,057 non-tribal rural SHARC holders (51%) (Figure 6). In 2006, as in 2003 through 2005, demography may account for the difference in the rate of participation in the subsistence halibut fishery between tribal SHARC holders and rural SHARC holders. As shown in Table 5 and illustrated in Figure 7, in 2006, 17% of tribal SHARC holders were younger than 20 years of age, compared to 7% of rural SHARC holders. This may reflect a policy on the part of some eligible tribes to register all or most tribal members, including younger people who were less likely to participate in the subsistence fishery than adults. For example, 532 members of the Native Village of Toksook Bay held SHARCs in 2006; of these, 40% were younger than 20 years of age (Table 5). Excluding Toksook Bay from the statewide tribal SHARC totals does not substantially alter the contrast in the younger age cohorts between tribal and rural resident SHARC holders (Table 5). As illustrated in Figure 8 (see also Table 4), the largest number of Alaska subsistence halibut fishers in 2006 were from tribes and rural communities in Regulatory Area 2C (Southeast Alaska), 3,298 (56%). There were 1,729 subsistence halibut fishers (29%) from tribes and communities in Regulatory Area 3A (Southcentral Alaska), 371 (6%) from Regulatory Area 4E (East Bering Sea Coast) tribes and communities, and 306 (5%) from Area 3B (Alaska Peninsula) tribes and communities. Additionally, there were 205 (3%) halibut fishers who were members of tribes and residents of communities in the four other regulatory areas. As also shown in Figure 8, the distribution of subsistence fishers by regulatory area in 2006 was similar to that of 2003, 2004, and Compared to 2005, the estimated number of halibut fishers from tribes and rural communities in Areas 2C and 3A was about the same in The estimated number of fishers increased by 29% in Area 3B (from 237 to 306), primarily due to increases in participation at Sand Point. The estimated number of subsistence halibut fishers increased by 22% (from 305 to 371) in Area 4E, mostly due to increased participation at Toksook Bay. Alaska Native tribes with the most subsistence halibut fishers in 2006 included the Central Council of Tlingit and Haida Indians (204 subsistence halibut fishers), the Sitka Tribe of Alaska (149), the Ketchikan Indian Corporation (145), the Native Village of Toksook Bay (112), the Shoonaq Tribe of Kodiak (112), the Metlakatla Indian Community (105), the Qagan Tayagungin Tribe of Sand Point Village (96), the Hoonah Indian Association (85), the Native 13
28 Village of Kipnuk (68), the Klawock Cooperative Association (66), the Angoon Community Association (55), and the Hydaburg Cooperative Association (55). Of the SHARC holders who registered as residents of eligible rural communities, the most subsistence fishers lived in Kodiak (824), followed by Sitka (759), Petersburg (370), Cordova (216), Haines (203), Wrangell (188), and Craig (169). Appendix Table 3 provides details for each tribe and community regarding participation in the subsistence fishery and subsistence halibut harvests in As noted above, not every tribal SHARC holder lives in his or her tribe s headquarters community. After assigning tribal members to a community based on their place of residence, an estimate of participation in the subsistence halibut fishery in 2006 by community can be obtained. Appendix Table 4 provides study findings based on place of residence. Communities with 100 or more resident SHARC holders who participated in the subsistence halibut fishery in 2006 were Kodiak (961), Sitka (915), Petersburg (426), Cordova (248), Craig (244), Wrangell (242), Haines (229), Ketchikan (208), Hoonah (139), Klawock (137), Sand Point (133), Metlakatla (118), and Toksook Bay (113). Of the 13 Alaska communities with 100 or more subsistence halibut fishers in 2006, most had about the same or slightly fewer fishers than in Participation by Kodiak residents increased each of the first four years of the fishery. Notable increases in participation from 2005 to 2006 occurred in Toksook Bay (61 subsistence halibut fishers in 2005, 113 in 2006; 85% increase) and Sand Point (100 fishers in 2005, 133 in 2006; 33% increase) (Figure 9). (See Chapter 3 for further discussion of Kodiak, Sand Point, and Toksook Bay as case study communities.) Seven non-alaska resident tribal SHARC holders subsistence-fished for halibut in Alaska in 2006, compared to 0 in 2005, 24 in 2004, and 5 in Estimated Alaska Subsistence Harvests in 2006 by SHARC Type and Regulatory Area Table 4 reports estimated Alaska subsistence halibut harvests for 2006 by SHARC type, regulatory area, and gear type. The total estimated subsistence halibut harvest in Alaska in 2006 was 54,089 fish (+/- 3%) for 1,125,312 pounds (+/- 3%) net weight. 9 As estimated in pounds net weight, 53% of the subsistence halibut harvest (591,786 pounds [+/- 4%]) was taken by fishers registered with tribes or rural communities in Regulatory Area 2C (Fig. 10). (Note that because some SHARC holders may fish in a regulatory area different from the location of their tribal headquarters or rural community of registration, the area totals in Table 4 do not precisely represent harvest locations. See the section on harvests by location, below.) Fishers from Area 3A tribes and rural communities harvested 361,731 pounds (+/- 4%) (32% of the state total). For Regulatory Area 4E, 10 the estimated harvest for tribal and rural SHARC holders was 71,219 pounds (+/- 20%) (6%). Harvests totaled 54,088 pounds (+/- 14%) (5%) for communities and 9 This approximates 1,500,416 pounds round (live or whole) weight. See footnote 7 in Chapter 1 for an explanation of the factor used to convert round weight to net weight (net weight = 75% of round weight). 10 Community Development Quota (CDQ) organizations operating exclusively in Areas 4D and 4E may retain sublegal halibut (less than 32 inches) from their commercial catches for home use. In 2006, a total of 19,710 pounds net weight of halibut was retained by 3 organizations: Coastal Villages Regional Fund (13,467 pounds), Bristol Bay Economic Development Corporation (2,836 pounds), and Norton Sound Economic Development Corporation (3,407 pounds) (Williams 2007). The IPHC includes these fish within the personal use removal category, a category that also includes subsistence harvests (Gilroy 2005:64). See also the section in Chapter 3, Comparisons with Nonsubsistence Harvests. 14
29 tribes of Regulatory Area 3B. For tribal and rural SHARC holders in Area 4A, the estimated harvest was 27,562 pounds (+/- 19%) (2%). Tribes and communities in the remaining three regulatory areas (4B, 4C, and 4D) harvested 18,926 pounds (about 2%). The estimated subsistence harvest of 1,125,312 pounds of halibut in 2006 represents a decrease of 4.5% compared the estimated harvest of 1,178,222 pounds in 2005 (Figure 11). Harvests by tribal SHARC holders increased by 2.8%, from 496,792 pounds in 2005 to 510,740 pounds in Tribal SHARC holders harvested 45% of the Alaska subsistence halibut harvest in 2006, compared to 42% in Subsistence halibut harvests by non-tribal, rural resident SHARC holders decreased by 9.8%, from 681,430 pounds in 2005 to 614,572 pounds in This group accounted for 55% of the statewide subsistence halibut harvests in 2006, compared to 58% in Members of 74 Alaska tribes harvested subsistence halibut in In three others, SHARC holders fished but had no harvest. In 24 others, tribal members obtained SHARCs, but no one fished. No one in the remaining 22 eligible tribes held a valid SHARC in All of these tribes were in Regulatory Area 4E (East Bering Sea Coast). As shown in Figure 12, members of the 13 tribes with harvests of 10,000 pounds or more accounted for 62% of the total subsistence halibut harvest by tribal SHARC holders in These 13 tribes accounted for 58% of the tribal SHARCs (4,119 of 7,123). Members of the other 61 tribes with harvests accounted for about 38% of the total harvest by tribal members. Residents of 58 eligible rural communities harvested subsistence halibut in In four others, SHARC holders fished unsuccessfully. In 20 others, individuals obtained SHARCs but no one fished. No one in the remaining 35 eligible rural communities held a valid SHARC as a non-tribal member in Most of these communities (29) were in Regulatory Area 4E (East Bering Sea Coast). 12 As shown in Figure 13, 12 rural communities with harvests of over 10,000 pounds accounted for 83% of the subsistence halibut harvest by the holders of rural (non-tribal) SHARCs in These communities accounted for 84% of the rural SHARCs. Residents of the other 46 communities with harvests accounted for 17% of the total harvest by rural SHARC holders. As also shown in Figure 13, rural SHARC holders from two communities accounted for 48% the total harvest by this group: Kodiak (28%) and Sitka (20%). Adding Petersburg, the next highest rural community harvest at 8%, the top three rural communities accounted for over half (55%) of the rural community (non-tribal) subsistence halibut harvest in Alaska in Estimated Alaska Subsistence Harvests in 2006 by Harvest Location Survey respondents were asked to report the water body, bay, or sound [that they] usually fished for subsistence halibut in Multiple responses were permitted. In Table 6, estimated subsistence halibut harvests are reported for the eight Alaska halibut regulatory areas and 21 subdivisions within these areas. It should be noted that regulatory area totals in Table 6 differ slightly from those reported in Table 4 because not all SHARC holders fished within the regulatory area in which their tribal headquarters or residence is located. 11 In this tally, Chiniak, listed separately in tables in this report, is counted as part of Kodiak, as it is for eligibility. 12 Note that residents of these communities may have obtained SHARCs as tribal members. 15
30 Subsistence halibut harvests in Regulatory Area 2C (Southeast Alaska) accounted for 52% of the Alaska subsistence halibut harvest in 2006 (580,117 pounds net weight) (Figure 14; Table 6). Also, three of the four geographic subareas with the largest subsistence halibut harvests in 2006 were in Area 2C: southern Southeast Alaska (307,921 pounds net weight; 27% of the state total); the Sitka Local Area Management Plan (LAMP) area (147,526 pounds; 13%), and northern Southeast Alaska other than the Sitka LAMP area (124,670 pounds; 11%), as shown in Figure 15 and Figure Regulatory Area 3A (Southcentral Alaska) ranked second, with 34% of the state s total subsistence halibut harvest (379,258 pounds net weight). Waters bordering the Kodiak Island road system (including Chiniak Bay) ranked third among subareas, with a subsistence halibut harvest of 140,388 pounds (12% of the state total), followed by the remainder of the Kodiak Island area, which ranked fifth (111,752 pounds; 10%). Harvests within Cook Inlet waters of Area 3A accounted for 5% of the state total (59,965 pounds), those within Prince William Sound added 47,965 pounds (4% of the statewide total), and the Yakutat Area added 19,187 pounds (2%). Among regulatory areas, Area 4E (Bering Sea Coast) ranked third with 6% (70,743 pounds). Combined, Bristol Bay and the Yukon/Kuskokwim Delta areas with Area 4E accounted for all of this area s harvest, with no reported harvests from Norton Sound. Area 3B (Alaska Peninsula including the Chignik Area) ranked fourth with 4% of the Alaska total (48,547 pounds). In descending order, subsistence halibut harvests in the other regulatory areas in 2006 were as follows: Area 4A (eastern Aleutian Islands), 27,062 pounds (2%); Area 4C (Pribilof Islands), 8,527 pounds (less than 1%); Area 4D (St. Lawrence Island), 8,297 pounds (less than 1%); and Area 4B the western Aleutian Islands, 2,761 pounds (less than 1%). Figure 17 reports estimated harvests in pounds net weight by location fished at the regulatory area level in 2003, 2004, 2005, and Table 7 compares estimated subsistence halibut harvests by regulatory area and geographic area in 2006 with those estimated for 2005, 2004, and As noted previously, for the state overall, the estimated harvest in pounds decreased by about 4% in 2006 from 2005 (Figure 18). However, the estimated harvest in 2006 was about 8% higher than the estimate for 2003, the first year of the subsistence halibut harvest monitoring program (Figure 19). Estimated subsistence halibut harvests increased in five regulatory areas in 2006 compared to 2005 (Figure 17; Figure 18; Table 7). The largest proportional increase was in Area 4B (Western Aleutian Islands), where estimated harvests increased 104%, from 1,351 pounds in 2005 to 2,761 pounds in The 2006 estimate was also notably higher than the 2004 estimate (916 pounds), but was very similar to the estimate of 2,582 pounds for 2003 (7% higher) (Figure 17; Figure 19; Table 7). Estimated harvests in Area 4C (Pribilof Islands) increased 11%, from 7,716 pounds in 2005 to 8,527 pounds in Estimated subsistence halibut harvests in the Pribilof Islands in 2006 were not markedly different from those of 2004 (9,734 pounds), but were 63% lower than the 22,881 pounds estimated for 2003 (Figure 19). However, as noted in the report for the 2004 study year (Fall et al. 2005:15), an improved response rate to the survey has likely resulted in better harvest estimates for St. Paul, the largest community in Area 4C. In 13 For this study, northern Southeast Alaska includes those waters of Regulatory Area 2C north of Frederick Sound, including waters surrounding Baranof Island and excluding the Sitka LAMP area. For a description of the Sitka LAMP area, see FR , April 15, 2003, (d)(1). The remaining waters of Area 2C are referred to as southern Southeast Alaska in this report. 16
31 retrospect, the harvest estimate for Area 3C for 2003 appears too high, the result of a small sample size with an overrepresentation of active fishers. Estimated subsistence harvests of halibut increased by 42% in Area 4D (Central Bering Sea) (from 5,848 pounds in 2005 to 8,297 pounds in 2006). The 2006 estimate was lower than that for 2004 (10,923 pounds), but 89% higher than 2003 (4,380 pounds). In Area 4E (East Bering Sea Coast), the estimated harvest of 70,743 pounds was a 31% increase over the 54,119 pounds estimated for 2005 (Figure 17; Figure 18; Table 7). The 2005 harvest in this area was notably higher than the estimate for 2004 (28,501 pounds) but approximately the same as the estimate for 2003 (53,775 pounds). More thorough harvest reporting in several western Alaska communities may account for the change in harvest estimates from 2004 to The 2006 estimate was 32% above the 2003 estimate (Figure 17; Figure 19; Table 7). Increased harvest effort in Toksook Bay accounts for much of this increase (see Chapter 3). There was a small increase of 5% in Area 3B (Alaska Peninsula) harvests from 2005 (46,225 pounds) to 2006 (48,547 pounds) (Figure 17; Figure 18; Table 7). In Area 3B, the 2006 estimated harvest was notably higher than that for 2004 (33,519 pounds) and 2003 (27,477 pounds) (Table 7; Figure 17; Figure 19). Improved participation in the SHARC program likely accounts for some of the increase in the estimated harvests in Area 3B (see discussion of Sand Point in Chapter 3). Estimated subsistence halibut harvests in other three regulatory areas were lower in 2006 compared to 2005 (Table 7; Figure 17; Figure 18). Estimated harvests in Area 4A (Eastern Aleutian Islands) dropped by 24% in 2006 (27,062 pounds) from 2005 (35,615 pounds). However, the 2006 estimate was similar to that for 2004 (28,877 pounds) and was 28% above the estimate for 2003 (21,197 pounds) (Table 7; Figure 17; Figure 19). In terms of total pounds, the largest increase in estimated harvests over the first three years of the project took place in Area 3A (Southcentral Alaska), where the 2005 harvest of 429,275 pounds was 6% higher than the estimate for 2004 (403,610 pounds) and 50% higher than the estimate for 2003 (285,500 pounds) (Table 7). The estimated harvest for 2006 (379,258 pounds) declined by 12% compared to 2005, but remained 33% higher than the estimate for 2003 (Figure 17; Figure 18). As a consequence, Area 3A accounted for 34% of the statewide subsistence halibut harvest in 2006, 36% in 2005, and 34% in 2004, compared to 27% in 2003 (Table 7). In Area 3A, subsistence halibut harvests increased in the Kodiak Island road system area (increase of 4%) and the remainder of Kodiak Island (increase of 1%) from 2005 to Decreases in harvests occurred in Cook Inlet (down 24%), Prince William Sound (down 30%), and the Yakutat area (down 48%) (Table 7). As in the first three years of the project, Area 2C (Southeast Alaska) accounted for the most subsistence halibut harvests in 2006 (580,117 pounds), but this harvest represents a decrease of 3% compared to 2005 (Table 7; Figure 17; Figure 18) and 7% compared to 2003 (Figure 19). The percentage of the total statewide subsistence halibut harvest that took place in Area 2C in 2006 was 52%, similar to 2005 (51%), but a decline compared to 57% in 2004 and 60% in Harvests decreased in two subareas within Area 2C in 2006 compared to 2005, with an 8% decrease in northern Southeast Alaska subarea (excluding the Sitka LAMP) and a 6% decrease in the southern southeast subarea. Estimated subsistence halibut harvests in the Sitka LAMP area were 10% higher in 2006 compared to 2005, but 15% lower in 2006 compared to 2003 (Table 7). 17
32 The reasons for these changes in Area 2C are likely complex and beyond the scope of this report. 14 Figure 20 illustrates the average subsistence halibut harvest in pounds net weight for those SHARC holders who subsistence fished in Figure 21 illustrates the average harvest per fisher in number of halibut. For the state overall, the average subsistence halibut fisher harvested 190 pounds net weight or about 9.2 halibut in Average harvests per fisher at the regulatory area level ranged from 170 pounds net weight in Area 3B to 377 pounds per fisher in Area 4D. In 2003, subsistence fishers on average harvested 8.9 halibut (211 pounds) (Fall et al. 2004:12-13): in 2004 the average harvests were 8.8 halibut and 199 pounds (Fall et al. 2005:15); and in 2005, the average harvests were 9.9 halibut and 210 pounds (Fall et al. 2006: 17). Subsistence Harvests by Place of Residence As shown in Figure 22, there were 31 Alaska communities whose residents had combined estimated subsistence halibut harvests of approximately 7,500 pounds or more net weight (over 10,000 pounds round weight) in In this figure, community totals include harvests of all SHARC holders living in the community, regardless of type of SHARC (tribal or rural) or tribal affiliation. 15 Residents of these communities accounted for 87% of the total Alaska subsistence halibut harvest in Residents of Kodiak (Kodiak includes Kodiak city and other portions of the Kodiak Island Borough connected to it by roads) ranked first with 18% of the total Alaska harvest, and Sitka ranked second with about 15%. With 12,003 and 8,833 residents, respectively, these two communities included about 27% of the population of rural communities eligible to participate in the subsistence fishery. There were 66 other Alaska communities with at least one resident who participated in the subsistence halibut fishery in The total harvest for these other communities represented 13% of the state total. For 2006, 177 SHARC holders provided out of state addresses from 123 communities in 29 states and territories. 16 Seattle was the non-alaska community with the most SHARC holders, with 13. Seven non-alaska residents SHARC holders subsistence fished for halibut in 2006, reporting a harvest of 72 fish and 2,436 pounds net weight (0.2% of the state total) (see Appendix Table 4). No non-alaska resident SHARC holders subsistence fished for halibut in In 2004, 24 non-alaska residents reported subsistence fishing for halibut in Alaska, with an estimated total harvest of 169 fish and 4,845 pounds net weight (about 0.4% of state total). In 2003, five non-alaska residents participated in the Alaska subsistence halibut fishery, harvesting five fish. Subsistence Harvests by Gear Type Table 6 and Figure 23 report the estimated subsistence harvests of halibut in Alaska in 2006 by gear type and regulatory area fished. In total, 782,532 pounds (70%) of halibut (net weight) 14 Further discussion of differences between harvest estimates for 2003, 2004, 2005, and 2006 appears in Chapter 3 and Chapter 4. However, more thorough discussion of harvest trends in the Alaska subsistence halibut fishery should await availability of data for 2007, the fifth year of harvests under the new regulations. 15 Note that nonrural places, such as Anchorage, Juneau, Ketchikan, and Valdez, appear in Figure 22 and in Appendix Tables A-4, A-5, and A-6, because members of eligible Alaska Native tribes may participate in the fishery regardless of where they live. 16 Note that members of eligible tribes may obtain SHARCs regardless of their place of residence. 18
33 were harvested using setline (stationary) gear (longlines or skates) and 342,779 pounds (30%) were harvested using handlines or lines attached to a rod or pole (hand-operated gear). There were notable differences between regulatory areas (Table 6, Figure 23). Harvests using setline gear predominated in Area 4D (Central Bering Sea) (93% of the total subsistence harvest), 2C (Southeast Alaska) (83%), 3A (Southcentral Alaska) (65%), and 4B (Western Aleutian Islands) (79%). In contrast, hand-operated gear accounted for most of the subsistence halibut harvests in Area 4E (East Bering Sea Coast) (88%) and 4A (Eastern Aleutian Islands) (72%). Harvests were about equally divided across the two gear types in Area 3B (Alaska Peninsula) (48% setline gear and 52% hand operated gear) and in Area 4C (Pribilof Islands) (48% setline gear, 52% hand operated gear). In 2005 also, 70% of the total Alaska subsistence harvest was taken with setline gear and 30% with hand-operated gear (Fall et al. 2006: 18). In 2004, 74% of the Alaska subsistence halibut harvest was taken with setline gear and 26% with hand operated gear (Fall et al. 2005:16). In 2003, 72% was taken with setline gear and 28% with hand operated gear (Fall et al. 2004:13). of Hooks with Setline Gear Respondents who fished with setline (stationary) gear (longline or skate) were asked to report how many hooks they usually set. The findings by regulatory area are reported in Table 8. For the fishery overall, most setline fishers (38%) used 30 hooks, the maximum number allowed by regulation in Areas 2C, 3A, 3B, 4A, and 4B (there is no hook limit in Areas 4C, 4D, and 4E) (Figure 24). The next most frequently reported number was 20 hooks, usually used by 20% of the fishers who used setline gear. Twenty-five hooks (8%) ranked third, followed by 10 hooks (8%) and 15 hooks (8%). This pattern is similar to that recorded for 2005, when 42% of setline fishers used 30 or more hooks and 20% used 20 hooks (Fall et al. 2006:18-19); 2004, when 44% of setline fishers used 30 hooks and 19% used 20 hooks (Fall et al. 2005:16), and 2003, when 43% of setline fishers used 30 hooks and 20% used 20 hooks (Fall et al. 2004:13). Thirty was the most frequently used number of hooks with setline gear in six of the eight regulatory areas (Table 8): 2C (Southeast Alaska), 38%; 3A (Southcentral Alaska), 40%; 3B (Alaska Peninsula), 43%; 4A (Eastern Aleutian Islands), 55%; Area 4C (Pribilof Islands), 50%; and 4E (East Bering Sea Coast), 33%. In Area 4B (Western Aleutians), 42% of fishers who used set hook gear used one hook and 20% used 20 hooks. In Area 4D (Central Bering Sea), 71% used 20 hooks, followed by 14% using 30 hooks. Sport Harvests of by SHARC Holders Survey respondents were asked to report the number of halibut and pounds of halibut they harvested while sport fishing during They were instructed not to include fish they included as part of their subsistence harvests as sport caught. The goal of this question was to avoid double-counting harvested halibut in this survey and in the statewide survey of sport fishers administered by ADF&G s Division of Sport Fish. Answering this question required respondents to classify their hand-operated gear (hook and line, and rod and reel) harvests as either subsistence or sport; these gear types are legal gear for both sport fishing and subsistence fishing. Fish reported in the survey as sport harvests are not included in the estimated subsistence harvests discussed above. If SHARC holders also received the sport fish survey for 2006, they would be expected to report the same number of halibut as sport-caught as in their response in the SHARC survey and not include any halibut they reported as subsistence harvests, even if taken with rod and reel or handheld line with two or less hooks. Note that the study 19
34 findings do not represent the total recreational halibut harvest by residents of eligible communities and tribes in 2006, because individuals from these tribes and communities who did not obtain SHARCs could have sport fished. As shown in Table 4 and Table 6, the estimated total sport halibut harvest by holders of SHARCs in 2006 was 11,219 fish and 223,639 pounds net weight. Of the total harvest, most was taken by SHARC holders from Area 2C (Southeast Alaska) (112,907 pounds; 50%) and Area 3A (southcentral Alaska) (93,685 pounds; 42%) (Table 4). By area fished, most of the sport halibut harvest by SHARC holders occurred in Area 2C (109,649 pounds; 49%) and Area 3A (99,602 pounds; 45%) (Table 6). In total, an estimated 2,894 SHARC holders (20%) reported that they sport fished for halibut in A very large majority of these fishers fished in either Area 2C (1,731; 60%) or Area 3A (1,025; 35%) (Table 6). (See Appendix Table 7 for estimated sport halibut harvests by tribe and non-tribal rural community SHARC holders.) 17 Estimated Average Net Weights of Subsistence and Sport-Caught Table 9 reports the average net weight of subsistence and sport-caught halibut by SHARC holders in 2006, based upon estimates provided by survey respondents. For the state, the estimated average net weight of subsistence caught halibut was 20.8 pounds and the average net weight of sport-harvested halibut by SHARC holders was 19.9 pounds. For all halibut harvested by SHARC holders in 2006, the average net weight per harvested halibut was 20.7 pounds. Between regulatory areas, there was a range of average weights per halibut. The halibut harvested by the communities of Area 4D (Saint Lawrence Island), averaged 35.7 pounds net weight per fish, almost double the statewide average. In Area 4E, halibut averaged 10.8 pounds net weight, about half of the statewide average. In 2005, the estimated average weight of halibut harvested in the subsistence fishery was 21.1 pounds, the average halibut taken by SHARC holders while sport fishing weighed 20.8 pounds, and the average of all halibut was 21.0 pounds (Fall et al. 2006:20). In 2004, the statewide average for subsistence-harvested halibut was estimated at 22.8 pounds, the average sport-harvested halibut by SHARC holders was 20.0 pounds, and the average for all halibut was 22.2 pounds (Fall et al. 2005:17). In 2003, the statewide average for subsistence-harvested halibut was 23.7 pounds, the average sport-harvested halibut by SHARC holders was 22.8 pounds, and the average for all halibut was 23.5 pounds (Fall et al. 2004:14). 17 The mail-out survey did not investigate the criteria by which survey respondents classified their rod and reel (hook and line attached to a rod or pole) halibut harvests as subsistence or sport. However, a supplemental mailing to 1,098 SHARC holders from Kodiak and Sitka who fished for halibut in 2004 asked respondents to provide reasons for classifying their halibut harvests as sport or subsistence. For a discussion of the findings, see Fall et al. 2006:19-20, In short, the primary factor (for 69% of respondents) was the gear used to harvest the fish: respondents viewed rod and reel as sport gear and setline gear as subsistence gear. Another factor, reported by 12%, concerned the composition of the fishing group. If the SHARC holders had fished with relatives or friends who did not possess a SHARC, they classified their fishing as recreational. Harvest amounts were also a consideration: harvests or one or two halibut with a rod and reel were considered sport by some respondents, but if they harvested more than two fish with rod and reel in one day, they classified the harvest as subsistence. Finally, about 19% of the respondents gave reasons related to the use of the fish or cultural and lifestyle explanations. 20
35 ROCKFISH HARVESTS Survey respondents were asked to estimate the number of rockfish they harvested while subsistence fishing for halibut in Harvest data at the species level were not collected as part of this survey. Note that these survey results do not represent an estimate for the total subsistence rockfish harvest by SHARC holders in 2006 because they might have harvested rockfish while fishing for species other than halibut, and other fishers in the communities who did not obtain SHARCs might have harvested rockfish. The Division of Subsistence Community Subsistence Information System (CSIS) (ADF&G 2006) 18 includes estimates of rockfish harvests for communities in which comprehensive household surveys have been administered. It should also be noted that the label bycatch for these harvests is misleading. 19 Rockfish are used for subsistence purposes in rural communities throughout their range in Alaska (ADF&G 2006). It is highly likely that rockfish harvested incidentally in the subsistence halibut fishery are utilized as a subsistence food. It is highly unlikely that many incidentally caught rockfish are discarded in this subsistence fishery. As shown in Table 10, the statewide estimated rockfish incidental harvest in the subsistence halibut fishery in 2006 was 16,945 fish by 1,529 fishers (11% of all SHARC holders, and 26% of all SHARC holders who subsistence fished for halibut in 2006). This is an average of about 2.9 rockfish per fisher for all subsistence halibut fishers and about 11.1 rockfish per fisher for those who had a rockfish harvest. Most of the subsistence halibut fishers who caught rockfish fished in Area 2C (Southeast Alaska) (1,069 fishers; 70%) and Area 3A (376 fishers; 25%). In Area 2C, about 32% of subsistence halibut fishers incidentally harvested rockfish, as did 21% in Area 3A (Southcentral Alaska). (See Appendix Table 7 for estimated rockfish harvests by tribe and by non-tribal rural community SHARC holders.) As illustrated in Figure 25 and Figure 26, most of the incidental rockfish harvest in 2006 was harvested in Area 2C: 11,486 rockfish, 68% of the statewide total. Area 3A accounted for the second-highest total: 3,977 rockfish, 24% of the total. Harvests were relatively small by SHARC holders fishing in other regulatory areas, who combined harvested 1,482 rockfish, about 9% of the statewide total. Compared to 2005, when 12,395 rockfish were harvested, the incidental rockfish harvest in the subsistence halibut fishery in 2006 was up by 37%. The 2006 estimated rockfish harvest was lower than the estimate for 2004 (19,001 rockfish) but higher than 2003, when 14,870 rockfish were harvested in the subsistence halibut fishery. 18 This was formerly the Community Profile Database (Scott et al. 2001). 19 The Magnuson-Stevens Fishery Conservation and Management Act (Section 3) defines bycatch as fish harvested in a fishery, but which are not sold or kept for personal use, and includes economic discards and regulatory discards. Such term does not include fish released alive under a recreational catch and release fishery management program. Federal regulations (50 CFR 679.2) define bycatch or bycatch species as fish caught and released while targeting another species or caught and released while targeting the same species; under 50 CFR discard means to release or return fish to the sea, whether or not such fish are brought fully on board a fishing vessel. In all cases, bycatch means to discard fish and excludes retaining fish for use. The federal definition of incidental catch or incidental species is fish caught and retained while targeting on some other species, but does not include discard of fish that were returned to the sea (50 CFR 679.2). 21
36 Table 10 also reports the estimated incidental rockfish harvest in 2006 by SHARC holders by location of harvests within geographic subareas. Most of the harvest occurred in southern Southeast Alaska (5,517 fish), the Sitka LAMP area (4,038 rockfish), northern Southeast Alaska (1,927 rockfish), the Kodiak Island Road System (1,826 rockfish), and other Kodiak Island (826 rockfish). Incidental rockfish harvests totaled 719 fish in Prince William Sound and 330 rockfish in Cook Inlet. In Lower Alaska Peninsula waters, there was an incidental harvest of 669 rockfish. LINGCOD HARVESTS Survey respondents were asked to estimate the number of lingcod they harvested while subsistence fishing for halibut in Note that these survey results do not provide an estimate of the total subsistence lingcod harvest by SHARC holders in 2006 because they might have harvested lingcod while fishing for species other than halibut. Also, other fishers in the communities who did not hold SHARCs might have fished for or harvested lingcod, so that these incidental harvests represent only a portion of the total 2006 subsistence harvest. The Division of Subsistence Community Subsistence Information System (ADF&G 2006) includes estimates of lingcod harvests for communities in which comprehensive household surveys have been administered. It should also be noted that the label bycatch for these harvests might be misleading. 20 Lingcod are used for subsistence purposes throughout their range in rural Alaska (ADF&G 2006). It is highly likely that lingcod harvested incidentally in the subsistence halibut fishery are utilized as a subsistence food. It is very unlikely that many lingcod caught in this subsistence fishery are discarded. The statewide estimated incidental lingcod harvest in the subsistence halibut fishery in 2006 was 3,486 fish by 927 fishers (Table 10). This is an average of about 0.6 lingcod per fisher for all subsistence halibut fishers and 3.8 lingcod per fisher for those who had a lingcod harvest. Of all SHARC holders who subsistence fished for halibut in 2006, 16% harvested at least one lingcod while halibut fishing. Most of the subsistence halibut fishers who harvested lingcod fished in Area 2C (Southeast Alaska) (626; 68%) and Area 3A (Southcentral Alaska) (240; 26%). (See Appendix Table 7 for estimated lingcod harvests by tribe and by non-tribal rural community SHARC holders.) As illustrated in Figure 27 and Figure 28, most of the incidental lingcod were harvested in Area 2C: 2,057 lingcod, 59%. Area 3A fishing locations accounted for the second-highest total: 949 lingcod, 27%. In 2005, 2004, and 2003, an estimated 2,355, 4,407 and 3,298 lingcod, respectively, were harvested in the subsistence halibut fishery. The 2006 estimated harvest represents an increase of 48% in the incidental lingcod harvest compared to 2005, a decrease of 21% compared to 2004, and a 6% increase compared to Table 10 also reports the incidental harvest of lingcod in 2006 by SHARC holders while they were subsistence fishing for halibut by geographic subarea. Most of this harvest occurred in Area 2C (southeast Alaska): the Sitka LAMP area (998 lingcod), southern Southeast Alaska (849 lingcod), and the Kodiak Island road system (265 lingcod). Incidental lingcod harvests totaled 229 lingcod in the Yakutat Area, 228 in Cook Inlet, and 210 lingcod in northern Southeast Alaska waters outside the Sitka LAMP. Harvests totaled less than 200 lingcod in each of the other geographic subareas. 20 See footnote 19 for definitions of bycatch and incidental catch. 22
37 CHAPTER 3: DISCUSSION COMPARISONS WITH OTHER HARVEST ESTIMATES As discussed in the report for the first year of the SHARC survey pertaining to fishing in 2003 (Fall et al. 2004:19-22), comparing the statewide harvest estimate for the Alaska subsistence halibut fishery based on the SHARC survey with estimates for previous years is difficult for several reasons. As noted in Chapter One, regulations that allow subsistence halibut fishing in Alaska waters using traditional gear such as longlines with more than two hooks, and that removed the restrictive daily harvest limit of two fish, have only been in place since May Also, 2003 through 2006 were the first four years for which a study was implemented to develop a comprehensive estimate of subsistence halibut harvests in Alaska. Although the Division of Subsistence of ADF&G has conducted systematic household surveys in many of the rural Alaska communities with traditional uses of halibut, these studies pertain to different harvest years. There are many communities, especially in western Alaska, where such surveys have not been conducted. Division of Subsistence studies have attempted to estimate the total halibut harvest for home use in communities, including harvests conducted under sport fishing rules and harvests removed from commercial fisheries for home use. Typically, these studies collected harvests by gear type, such as rod and reel or other gear. Therefore, it is not possible to separate the sport harvest from the subsistence harvest for past harvest years, especially in the larger rural communities with a diverse population. In contrast, the statewide estimates of subsistence halibut harvests for 2003, 2004, 2005, and 2006 based on the SHARC mailout survey include only subsistence harvests by individuals who obtained SHARCs. The estimates do not include total harvests accomplished under sport fishing regulations or halibut removed by commercial fishers for their households use or for noncommercial sharing. Thus they are only partial estimates of the total harvest of halibut for home use by rural Alaska residents and are not directly comparable to previous estimates from Division of Subsistence studies. The report for the first year of this study included a detailed discussion of previous efforts to develop an estimate of subsistence halibut harvests at the regional and statewide level. The report suggested that the 2003 SHARC survey estimates were not markedly different from estimates based on Division of Subsistence household survey data as reported in the Community Subsistence Information System (ADF&G 2006). We will not repeat that full discussion here For example for 2000, the IPHC estimated 439,000 pounds net weight for Alaska personal use (noncommercial, non-recreational) harvests (in Wolfe 2001). The IPHC estimate is based upon a methodology described by Trumble (1999). The IPHC method assumed that 50% of Alaska Native rod and reel halibut harvests as reported in ADF&G household surveys are sport and 50% personal use, and that 75% of the non-native rod and reel harvests are sport and 25% personal use (Trumble 1999:62). No justification for these assumptions is provided, and changing these sport to personal use ratios can result in a very different estimate for the personal use halibut harvest. In a report to the Alaska Board of Fisheries in May 2001, using the same data source as the IPHC, Wolfe (2001) estimated that the subsistence halibut harvest in Alaska probably ranges between 400,000 and 1,000,000 pounds (round weight) annually, based on harvest data in the Division of Subsistence Community Profile Database (Scott et al. 2001). This is an estimated harvest of 300,000 to 750,000 pounds net weight. See Fall et al. 2004: for discussion of Wolfe s methods. In the original analysis for the subsistence halibut 23
38 However the report also concluded that because of the limitations associated with the previous subsistence harvest estimates at the statewide level, until a time series is developed based upon the SHARC survey results, discussion of harvest trends in the subsistence halibut fishery will remain speculative. A brief discussion comparing the study findings for 2006 with those for 2005, 2004, and 2003 appears in Chapter 4. More detailed comparisons of the findings will appear in the report planned for the fifth year of this study. COMMUNITY CASE STUDIES To evaluate the subsistence halibut harvest estimate for 2006, comparisons can be made with previous harvest estimates for particular communities where Division of Subsistence household harvest surveys have been administered. These comparisons are subject to several limitations, including different sampling methods, uncertainty in the separation of subsistence and recreational harvests, and the potential effects of the subsistence regulatory changes beginning in The following communities were selected as case studies to represent communities of similar size and geographic location. In this evaluation, an emphasis is placed on larger communities, since, as discussed in Chapter 2, a small number of large communities accounted for most of the statewide subsistence halibut harvest in 2003, 2004, 2005, and The quality of the harvest estimates for these places largely determines the reliability of the statewide estimate and the performance of the harvest assessment program. Also, as noted in Chapter 1, not all tribal SHARC holders live in the community where their tribal headquarters is located. The following comparisons are based upon place of residence of the SHARC holder to be consistent with earlier division studies. Table 11 reports selected study findings for the case study communities discussed below for 2003, 2004, 2005, and Appendix Tables 4, 5, and 6 report study results for 2006 for all communities based upon residence of SHARC holders. Sitka (Regulatory Area 2C) Sitka had a population of 8,835 people in 2000, 2,178 of whom were Alaska Native (U.S. Census Bureau 2001). In 2006, the estimated population of Sitka was 8,833 (ADLWD 2007). Sitka was the second largest rural community eligible to participate in the subsistence halibut fishery in 2006, and had the most SHARCs issued, 1,895 (Table 11) (about 13% of the Alaska total). Of these, 1,429 were issued to non-tribal residents of Sitka, and 466 to tribal members. Members of the Sitka Tribe of Alaska (STA) obtained 460 SHARCs; some STA members live in communities other than Sitka. Members of other Alaska tribes also live in Sitka. Developing a reliable subsistence halibut harvest estimate for Sitka is essential for the success of the subsistence harvest assessment program. It is important to note that Sitka residents response rates to the survey have been high in the 4 years of the project: 75% in 2003, 72% in 2004, 68% in 2005, and 69% in Based on Division of Subsistence research, there are two estimates of halibut harvests for home use for Sitka prior to the authorization of subsistence halibut fishing by the NPFMC in May 2003 (Table 12). For 1987, the estimated total halibut harvest was 193,335 pounds (+/- 22%) (net weight); or 180,982 pounds if fish removed from commercial harvests are deleted. This noncommercial total only includes harvests reported by surveyed persons as taken with rod and reel; data on any harvests using other methods such as longlines (not then allowed in the program, the NPFMC estimated the Alaska subsistence halibut harvest at 1.5 million pounds net weight (68 FR 18145, April 15, 2003, EA/RIR (NMFS 2003). 24
39 subsistence fishery) were not collected. An estimated 1,252 Sitka households had at least one member who fished for halibut in For 1996, the total estimated harvest was 165,772 pounds net weight (+/- 28%), 149,244 pounds with commercial removals deleted. In 1996, an estimated 943 Sitka households had at least one member who fished for halibut. For 2006, the estimated subsistence harvest of halibut by tribal SHARC holders who live in Sitka (most, but not all, of whom are members of the STA) and other residents of Sitka (1,895 SHARC holders) was 163,372 pounds net weight (6,691 fish). This was the second highest of any community (Kodiak ranked first), and accounted for 15% of the statewide total subsistence halibut harvest. Of Sitka s total subsistence halibut harvest, 145,542 pounds (89%) was taken with setline gear, and 17,830 pounds (11%) was taken with hand-operated gear. Adding sport harvests by Sitka SHARC holders (23,032 pounds) increases the estimate to 186,404 pounds net weight. Nine hundred fifteen SHARC holders from Sitka subsistence fished for halibut in Of these, 809 used setline gear and 297 used hand-operated gear. Also, 395 SHARC holders from Sitka sport-fished for halibut in The total number of SHARC holders living in Sitka who fished for halibut in either the subsistence or recreational fishery in 2006 was 1,036 (Table 11). Estimated subsistence and sport halibut harvests by Sitka SHARC holders in 2006 were similar to estimates for 2003, 2004, and 2005 (Table 11). A total of 1,639 Sitka residents had SHARCs in 2003 and as did 1,871 in 2004 and 1,974 in Subsistence harvests were 174,880 pounds net weight in 2003 compared to 166,474 pounds in 2004 (a decline of 5%), 146,319 pounds in 2005 (a decline of 16%), and 163,372 pounds in 2006 (7% lower than 2003). The change was less in terms of number of halibut harvested: 6,621 in 2003, 6,583 in 2004, 6,062 in 2005, and 6,691 in Adding sport harvests of halibut by SHARC holders to subsistence harvest totals results in similar harvest estimates for Sitka for the four years of the study: 207,288 pounds for 2003, 192,303 pounds in 2004, 202,232 pounds for 2005, and 186,404 pounds in More Sitka residents participated in the subsistence halibut fishery in 2006 (915) compared to 2003 (821 SHARC holders) or 2005 (814 SHARC holders), and about the same number participated in 2004 (904 SHARC holders); 1,036 participated in either subsistence or sport fishing for halibut in 2006 compared to 956 SHARC holders in 2003 and 1,026 SHARC holders in 2004, and 987 SHARC holders in In summary, this comparison of harvest estimates from face-to-face comprehensive household surveys and the SHARC survey, although it has limitations because of the different survey and sampling methods used, suggests that the 2003, 2004, 2005, and 2006 subsistence halibut harvest estimates for Sitka based on the SHARC survey returns appear reasonable. They are generally in line with the anonymous, face-to-face household surveys results from 1987 and Petersburg (Regulatory Area 2C) In 2000, Petersburg had a population of 3,224, including 388 Alaska Natives (U.S. Census Bureau 2001). In 2006, the estimated population had dropped to 3,129 (ADLWD 2007). Before 22 Following a recommendation from the first study year (Fall et al. 2004:31), data from the Division of Sport Fish, ADF&G, Sport Fishing Statewide Harvest Survey (SWHS) about sport halibut harvests by Sitka residents were analyzed for additional background on halibut fishing in the community and discussed in the report for the 2004 study year (Fall et al. 2005:23-24). An updated analysis was not prepared for this report, but will appear in the report planned for the 2007 study year. 25
40 the authorization of subsistence halibut fishing under federal regulations in May 2003, there were two estimates for halibut harvests by Petersburg residents based on household surveys conducted by the Division of Subsistence of ADF&G, pertaining to 1987 and 2000 (Table 13). In the 1987 study, a random sample of 49 of the 1,123 households in Petersburg were interviewed (4%). In that year, Petersburg residents harvested an estimated 119,176 pounds of halibut (net weight) (+/-51%); of this, 11,728 pounds were removed from commercial harvests, giving a noncommercial harvest of 107,448 pounds. As with Sitka, the 1987 study in Petersburg only collected noncommercial harvest data for halibut taken with rod and reel. Of the 1,123 households in Petersburg, 54% had at least one member that fished for halibut noncommercially, for a minimum of 604 halibut fishers in the community in 1987 (Scott et al. 2001). In 2000, Petersburg residents harvested an estimated 55,974 pounds net weight of halibut (+/-39%). Of this, 6,951 pounds were removed from commercial harvests, for a noncommercial harvest of 49,023 pounds, all of which was taken with rod and reel. In 2000, 468 Petersburg households had at least one member who fished for halibut for home use. For 2006, the estimated subsistence harvest of halibut by Petersburg residents with SHARCs (1,082 SHARC holders) was 53,682 pounds net weight (Table 11). In 2005, 1,197 SHARC holders in Petersburg harvested 61,372 pounds of halibut in the subsistence fishery; in 2004, 1,187 SHARC holders harvested 71,784 pounds of halibut in the subsistence fishery; and in 2003, 1,047 Petersburg SHARC holders harvested 55,718 pounds. Of the total 2006 subsistence halibut harvest, 35,608 pounds (66%) was harvested with setline gear and 18,075 pounds (34%) was harvested with hand operated gear. In 2005, 72% of the subsistence halibut harvest by Petersburg SHARC holders was harvested with setline gear and 28% with hand operated gear. In both 2003 and 2004, about 75% of Petersburg s subsistence halibut harvest was taken with setline gear and 25% with hand operated gear. In 2006, Petersburg SHARC holders also harvested 17,351 pounds of halibut they classified as sport harvested. This gives a total halibut harvest by Petersburg SHARC holders of 71,033 pounds in In 2005, the sport harvest of halibut by Petersburg SHARC holders was 23,289 pounds for a total harvest of 84,661 pounds of halibut. In 2004, the sport harvest of halibut by Petersburg SHARC holders was 26,408 pounds for a total harvest of 98,192 pounds of halibut. In 2003, the sport harvest was 19,611 pounds, giving a total halibut harvest of 75,329 pounds (Table 11). In 2006, 426 Petersburg SHARC holders harvested halibut in the subsistence fishery (300 used setline gear and 222 used hand operated gear). This compares to 436 fishers in 2005 (338 used setline gear and 175 used hand operated gear); 482 fishers in 2004 (322 used set line gear, 206 used hand operated gear); and 415 subsistence halibut fishers in 2003 (330 used setline gear, 138 used hand operated gear). In 2006, 246 Petersburg SHARC holders sport fished for halibut, as did 312 in 2005, 351 in 2004, and 268 in A total of 529 Petersburg SHARC holders either subsistence or sport fished for halibut in 2006; the estimated total halibut fishers among Petersburg SHARC holders was 569 in 2005, 617 in 2004, and 523 in 2003 (Table 11). Given that some Petersburg residents without SHARC cards likely sport fished for halibut, the 2003, 2004, 2005, and 2006 estimates of noncommercial halibut harvests in the community based on the SHARC survey appear consistent with the 1987 estimate based on household interviews, but are slightly higher than the estimate for Note that in 2000, when regulations restricted subsistence fishing to handlines or rod and reel using no more than two hooks, no Petersburg households reported taking halibut for home use with any gear other than rod and 26
41 reel, while 330 used setline gear in 2003, 322 did so in 2004, 338 did so in 2005, and 300 did so in 2006 (Table 11, Table 13). Cordova (Regulatory Area 3A) In 2000, Cordova had a population of 2,454 people, including 368 Alaska Natives (U.S. Census Bureau 2001). Cordova s estimated population in 2006 was 2,211 (ADLWD 2007). Before 2003, there were six Division of Subsistence household surveys that estimated home-use halibut harvests for previous years (Table 14). After subtracting fish removed from commercial harvests for home use, estimated noncommercial halibut harvests by Cordova residents ranged from 25,609 pounds (+/-33%) net weight in 1991 to 120,221 pounds (+/- 62%) in 1988, with an average over the six study years of 57,285 pounds. The estimated number of Cordova households with at least one member fishing noncommercially for halibut ranged from 228 in 1985 to 401 in 1992, with a mean of 325 households (ADF&G 2006). Subsistence halibut harvest estimates and participation estimates for Cordova residents for 2003 were lower than might be expected from previous research (Fall et al. 2004:24-25). In 2003, 358 residents of Cordova obtained SHARCs (Table 11). Of these, 102 subsistence-fished (68 with setline gear, 40 with hand operated gear), 144 reported that they sport fished for halibut, and 194 fished for halibut either under the new subsistence provisions or in the sport fishery. The estimated subsistence harvest was 15,498 pounds net weight (7,613 pounds [49%] with setline gear, 7,885 pounds [51%] with hand operated gear), with an additional 11,534 pounds taken by SHARC holders while sport fishing. The total of 27,032 pounds was about 47% of the average for previous study years. Based on these comparisons, the final report for 2003 suggested that the SHARC survey had underestimated the amount of halibut harvested by Cordova residents for home use, perhaps because not all subsistence fishers in Cordova obtained SHARCs in The results of the survey for 2004 supported this conclusion (Fall et al. 2005:25-26). A total of 526 Cordova residents had obtained SHARCs by the end of 2004 (an increase of 47%) (Table 11). An estimated 262 Cordova SHARC holders subsistence fished for halibut in 2004, up 157% from Of these, 174 fished with setline gear (up 156%) and 97 used hand-operated gear. The estimated subsistence halibut harvest by Cordova residents in 2004 was 40,640 pounds net weight, an increase of 163% over Sport harvests by Cordova SHARC holders (174 of whom sport fished for halibut in 2004) added 12,149 pounds to the community harvest for 2004, for a total of 52,789 pounds of halibut by 325 fishers. This total was an increase of 95% over 2003, and was about 92% of the average for the six survey years prior to 2003 (and exceeded the total for three of those six years). Given that some Cordova residents likely obtained halibut for home use exclusively in the sport fishery without obtaining SHARCs, the SHARC survey estimate for 2004 appeared consistent with earlier estimates of subsistence halibut harvests in Cordova. Findings for Cordova for 2005 were much like those for 2004 and supported the conclusions of the 2004 final report. As shown in Table 11, 602 Cordova residents held SHARCs in 2005, continuing the growth that had occurred in 2004, but at a slower pace. Subsistence halibut harvests totaled 47,141 pounds, up about 16% from 40,640 pounds in In 2004, 73% of the total was harvested with setline gear, as was 74% in In 2005, 281 Cordova residents participated in the subsistence halibut fishery, compared to 262 in Cordova SHARC holders harvested 10,519 pounds of halibut while sport fishing in 2005, for a total harvest for 27
42 home use of 57,660 pounds. This total was similar to the estimate for 2004 (a combined total of 52,789 pounds in the subsistence and sport fishery) and approximated the mean harvest of 57,285 pounds estimated in the six harvest survey study years. The estimated subsistence halibut harvest for Cordova in 2006 was 29,027 pounds, a decline from 2004 (40,640 pounds) and 2005 (47,141 pounds) but still about double the 2003 estimated harvest (15,498 pounds) (Table 11). The reason for this decline is uncertain. The estimated sport halibut harvest by Cordova SHARC holders in 2006 was 7,020 pounds, lower than any of the first three years of the harvest monitoring program. In total, Cordova SHARC holders harvested an estimated 36,047 pounds of halibut in This total was substantially lower than the estimates for 2004 (52,789 pounds) and 2005 (57,660) pounds, but was higher than that for 2003 (27,032 pounds) (Table 11). The 2006 estimate was higher than survey estimates for 1985 and 1991, but lower than the average for the six years for which survey data are available (Table 14). About the same number of Cordova residents held SHARCs in 2006 (607) as in 2005 (602). In 2006, fewer Cordova SHARC holders participated in the subsistence halibut fishery (248), the sport halibut fishery (152), or in any noncommercial halibut fishing (301) than in either 2004 or 2005, although estimated participation in the halibut fishery exceeded that for 2003 (Table 11). Port Graham (Regulatory Area 3A) Located in lower Cook Inlet, Port Graham had a population of 171 in 2000, including 151 Alaska Natives (U.S. Census Bureau 2001). Port Graham s population in 2006 was estimated at 136 (ADLWD 2007). It is included here as a case example to represent the small, predominantly Alaska Native communities in Regulatory Areas 3A and 3B that depend heavily on subsistence harvests of fish and wildlife resources. There are estimates of subsistence halibut harvests by Port Graham residents based on household surveys for seven study years (Table 15). Excluding 1989, the year of the Exxon Valdez Oil Spill, Port Graham s halibut harvests ranged from 4,451 pounds (+/-14%) net weight in 1993 to 11,232 pounds (+/-14%) in 1992, with a six-year average of 7,591 pounds (net weight) (Figure 29). Again excluding 1989, an average of 38 Port Graham households had at least one member who subsistence fished for halibut in the study years in the late 1980s and 1990s. At the close of 2006, a total of 50 Port Graham residents held a SHARC. (Recall that this total does not include Port Graham tribal members who do not live in Port Graham.) In 2006, an estimated 30 Port Graham residents subsistence fished for halibut, with nine using setline gear and 24 using hand operated hear. Also, two said they sport-fished for halibut in In 2005, 18 Port Graham SHARC holders subsistence fished for halibut, with eight using setline gear and 18 using hand operated gear. Nine Port Graham SHARC holders sport fished for halibut in In 2004, 42 Port Graham SHARC holders subsistence fished for halibut, with 15 using setline gear and 31 using hand operated gear; 11 said they sport fished for halibut. In 2003, 35 Port Graham SHARC holders subsistence fished for halibut (ten used setline gear, 28 used hand operated gear), and three said they sport fished for halibut (Table 11). The findings for 2003, 2004, and 2006 were consistent with levels of participation in the halibut fishery that could be expected from the previous studies in Port Graham, but the estimated participation level in 2005 was lower. The subsistence halibut harvest estimate for Port Graham in 2006 was 6,194 pounds (Table 11). Of this, 2,397 pounds (39%) were harvested with setline gear and 3,797 pounds (61%) with 28
43 hand-operated gear. In the previous three years of the harvest monitoring program, estimated subsistence halibut harvests were higher in Port Graham than in In 2005, Port Graham SHARC holders harvested an estimated 11,127 pounds of halibut, with 7,938 pounds taken with setline gear and 3,190 pounds with hand operated gear. In 2004, Port Graham s estimated subsistence halibut harvest was 9,181 pounds net weight with 4,425 pounds (48%) harvested with setline gear and 4,755 pounds (52%) with hand-operated gear. In 2003, the estimated halibut harvest was 11,454 pounds net weight, with 4,398 pounds (38%) harvested with setline gear and 7,056 pounds (62%) with hand operated gear. No Port Graham SHARC holders reported sport harvests of halibut for Adding halibut taken while sport fishing gave community total of 11,615 pounds of halibut for Port Graham for 2005, 10,031 pounds for 2004, and 11,610 pounds of halibut harvested in 2003 (Table 11). While halibut harvest estimates for Port Graham for 2003, 2004, and 2005 were similar to the previous highest estimate (11,232 pounds in 1992) (Table 11), they exceeded the average of previous study years of 7,591 pounds. These findings were not unexpected: Port Graham has traditionally used setlines with multiple hooks to harvest halibut as well as hand-operated gear (Stanek 1985:67-69,151). With regulations in place beginning in May 2003 consistent with traditional harvest methods, residents of Port Graham and other communities with similar traditions have fished with setline gear and hand operated gear, and reported subsistence halibut harvests that are probably similar to historic levels. 23 As noted, the estimate for 2006 of 6,194 pounds was lower than those for the previous three years, and was lower than the average of the survey estimates for 1987 through 1997 (Table 15). The reasons for this decline are uncertain, but a drop in the community s population may account in part for the lower harvest in Kodiak City and Road System (Regulatory Area 3A) Kodiak in this report includes the city of Kodiak (population 6,334 in 2000, including 829 Alaska Natives) and those portions of the Kodiak Island Borough connected to Kodiak city by road. This area had a population of 12,973 people in 2000, including 1,697 Alaska Natives (U.S. Census Bureau 2001). The estimated population in 2006 was 12,703 (ADLWD 2007). This is the largest rural community eligible to participate in the Alaska subsistence halibut fishery. Based on Division of Subsistence household surveys, estimates of halibut harvests for home use are available for the entire Kodiak road system population for 1982 and 1991 (ADF&G 2006). Estimates for Kodiak city residents alone are available for 1992 and 1993, but these can be used to develop a projected total for the entire road system population (Table 16). Excluding fish removed from commercial catches for home use, halibut harvests by Kodiak road system residents ranged from 247,283 pounds usable weight (+/-30%) in 1991 to 511,254 pounds (+/- 33%) in The average for the four available study years was 366,682 pounds; of this, 338,476 pounds (92%) was taken with rod and reel, most likely consistent with sport fishing regulations. On average for the four study years, 1,306 Kodiak road system households had at least one member who fished for halibut for home use. 23 A cautionary note for Port Graham for 2005 concerned sample size. Only 16 of 52 SHARC holders responded to the 2005 survey (31%) (Fall et al. 2006:52). Further outreach in this community was necessary to improve the response rate and build confidence in the harvest estimates. As noted in Chapter 1, this outreach occurred in 2007 for the 2006 study year, and a response rate of 66% was achieved. 29
44 Kodiak residents had obtained 1,716 SHARCs by the close of 2006, down slightly from 1,741 SHARCs by the close of 2005, but up from 1,561 SHARCS at the end of 2004 and 1,320 SHARCs at the end of 2003 (Table 11). In 2006, 961 Kodiak SHARC holders subsistence fished for halibut; most (684; 71%) used set line gear. This compares to an estimated 871 subsistence halibut fishers in Kodiak in 2005, 650 of whom (75%) used setline gear; 802 subsistence halibut fishers in Kodiak in 2004, 554 (69%) of whom used setline gear; and 646 subsistence halibut fishers in 2003, 438 of whom (68%) used setline gear. In 2006, 562 Kodiak SHARC holders sport fished for halibut, and 1,092 fished for halibut under either subsistence or sport fishing rules. This compares to 2005 when 669 Kodiak SHARC holders sport fished for halibut and 1,116 were involved in any noncommercial halibut fishing; 2004, when 581 Kodiak SHARC holders sport fished for halibut, and 971 fished for halibut under either subsistence or sport regulations, and 2003, when 498 Kodiak SHARC holders sport fished for halibut, and 858 either subsistence or sport fished for halibut (Table 11). Given the likelihood that many Kodiak residents continued to fish for halibut under sport fishing regulations in 2003, 2004, 2005, and 2006 without obtaining SHARCs, the estimated level of participation in the subsistence fishery based on the SHARC survey appears reasonable when compared to the earlier household survey results. The estimated subsistence harvest of halibut in 2006 for Kodiak road system area residents was 205,822 pounds net weight, very similar to the 210,828 pounds estimated for 2005 and up from 187,214 pounds for 2004 and 153,254 pounds estimated for 2003 (Table 11). In 2006, Kodiak subsistence fishers harvested 142,326 pounds of halibut with setline gear (69%) and 63,496 pounds (29%) with hand operated gear. This compares to 146,781 pounds (70%) harvest with setline gear and 64,047 pounds (30%) with hand operated gear in 2005; 131,719 pounds (70%) harvested with setline gear and 55,605 pounds (30%) with hand operated gear in 2004; and 101,575 pounds taken in 2003 with setline gear (66%) and 51,678 pounds (34%) with handoperated gear. In addition, Kodiak road system SHARC holders harvested an estimated 64,320 pounds net weight of halibut in 2006 they classified as sport-caught, down from 82,455 pounds in 2005, 73,181 pounds in 2004, and 68,170 pounds in In total, Kodiak SHARC holders harvested 270,142 pounds of halibut in 2006, compared to 293,283 pounds in 2005, 260,395 pounds in 2004, and 221,424 pounds net weight in 2003 (Table 11). Not surprisingly, the totals for all four years are lower than those based on household surveys for previous years (except that the 2004, 2005, and 2006 SHARC survey estimates are higher than the household survey estimate for 1991) because, as just noted, many Kodiak road system residents who fish for halibut likely have not obtained SHARCs and continue to harvest halibut under sport fishing rules. Overall, the 2003, 2004, 2005, and 2006 subsistence harvest estimates for Kodiak appear reasonable, but they should be further evaluated using ADF&G Division of Sport Fish Statewide Harvest Survey data and with additional years of subsistence harvest survey data. Sand Point (Regulatory Area 3B) In 2000, the population of Sand Point was 952, with an Alaska Native population of 421 (U.S. Census Bureau 2001). The population estimate for 2006 was 890 (ADLWD 2006). Prior to 2003, there was one estimate of halibut harvests for home use by Sand Point residents based on Division of Subsistence, ADF&G, household surveys, pertaining to 1992 (Fall et al. 1993). The estimated total harvest was 13,981 pounds net weight. Of this, 6,240 pounds were removed from commercial harvests, 6,934 pounds were taken with subsistence methods (setline or jigging with a hand-held line) and 807 pounds were harvested with rod and reel. The total harvest with 30
45 noncommercial methods was 7,741 pounds. Of the 204 permanent households in the community, 122 harvested halibut for home use; 65 used subsistence methods, 16 fished with rod and reel, and the rest only obtained halibut for home use from their commercial harvests. At the end of 2003, 73 residents of Sand Point had obtained SHARCs. The estimated subsistence halibut harvest for 2003 was 4,819 pounds net weight. Of this, 3,409 pounds were harvested with setline gear and 1,410 pounds with hand operated gear. Twenty-one Sand Point residents subsistence fished for halibut in In addition, 11 Sand Point SHARC holders harvested an estimated 410 pounds of halibut while sport fishing, for a total estimated harvest of 5,229 pounds of halibut (Table 11). These are lower harvests and levels of participation then might be expected based on the 1992 survey findings. By December 31, 2004, 351 Sand Point residents had obtained SHARCs, a very substantial increase over The estimated total subsistence halibut harvest was 11,355 pounds net weight. Of this total, 4,360 pounds were harvested with setline gear (38%) and 6,996 pounds (61%) with hand operated gear. In total, an estimated 109 Sand Point SHARC holders subsistence fished for halibut in 2004, about five times the estimate for Also, 50 Sand Point SHARC holders sport-fished for halibut, with an estimated total harvest of 1,384 pounds. In total, 121 Sand Point SHARC holders fished for halibut for home use in 2004 with a total harvest of 12,739 pounds net weight (Table 11). This is more than double the 2003 estimate, and similar to the total community estimate for 1992 (which included halibut removed from commercial harvests). It is likely that the higher estimate for 2004 does not indicate an increased harvest by Sand Point residents over 2003, but rather a more complete estimate due to much larger number of participants in the SHARC program. A total of 321 Sand Point residents held SHARCs in The estimated subsistence harvest of halibut increased to 21,901 pounds, with 12,201 pounds (56%) taken with setline gear and 9,700 pounds (44%) caught with hand operated gear. One hundred Sand Point residents subsistence fished for halibut in In addition, 23 sport-fished for halibut, adding 1,281 pounds to the total halibut harvest for home use of 23,182 pounds (Table 11). The increase in the total halibut harvest and especially in the increase in setline harvests suggested that Sand Point residents were increasingly participating in the opportunities provided by the subsistence halibut fishery. In 2006, the number of Sand Point residents with SHARCs increased to 365. The estimated number of subsistence halibut fishers also increased, to 133 (from 100 in 2005 and 109 in 2004). The estimated number of Sand Point SHARC holders subsistence fishing with setlines increased notably in 2006, to 59, compared to 35 in 2005 and 25 in 2004; the number fishing with hand operated gear rose slightly, to 87 in 2006 from 77 in 2005 and 74 in The estimated subsistence halibut harvest by Sand Point residents in 2006 was 20,214, similar to the estimate for 2005 of 21,901. In 2006, 37% (7,406 pounds) of the subsistence halibut were harvested with setline gear and 63% (12,809 pounds) with hand operated gear. In addition, an estimated 29 Sand Point SHARC holders sport fished for halibut in 2006, with an estimated harvest of 6,300 pounds, up substantially from 1,281 pounds of sport-harvested halibut in 2005 and 1,384 pounds in As a result of the higher estimated sport harvests of halibut by Sand Point SHARC holders in 2006, the total estimated harvest increased to 26,514 pounds, from 23,182 pounds in 2005 and 12,739 pounds in 2004 (Table 11). 31
46 Unalaska/Dutch Harbor (Regulatory Area 4A) The city of Unalaska (which includes Dutch Harbor) had a population of 4,283 in 2000, including 397 Alaska Natives (U.S. Census Bureau 2001). The estimated population in 2006 was 3,940 (ADLWD 2007). The Division of Subsistence conducted a household harvest survey in Unalaska/Dutch Harbor for The estimated total halibut harvest was 97,601 pounds net weight (3,049 fish) (+/-34%), excluding 10,606 pounds (331 fish) removed from commercial catches for home use. Of the 700 households in the community, an estimated 391 (56%) had at least one member who fished for halibut in Most of the noncommercial harvest, 88,142 pounds (90%), was taken with rod and reel (ADF&G 2006). By the close of 2003, only 92 residents of Unalaska and Dutch Harbor had obtained SHARCs (Table 11). Notably, only 14 members of the Qawalangin Tribe of Unalaska registered to subsistence fish for halibut in For the community overall and for the tribe, this was far fewer registrants than might have been predicted from the 1994 survey results. By the end of 2004, 131 Unalaska/Dutch Harbor residents had obtained SHARCs, as had 25 Qawalangin Tribe members. In 2005, 150 community members held SHARCs, as did 31 Qawalangin Tribe members. While a notable increase over 2003, this total continued to appear lower than expected. The total increased to 171 SHARC holders in 2006, including 43 Qawalangin Tribe members. In 2006, 81 Unalaska/Dutch Harbor residents participated in the subsistence halibut fishery and 50 sport-fished; 101 participated in either fishery. In comparison, in 2005, 88 community members participated in the subsistence halibut fishery and 28 sport-fished; 97 participated in either fishery. In 2004, 81 community members subsistence fished for halibut and 34 sportfished; 93 participated in either fishery. In 2003, 50 Unalaska/Dutch Harbor SHARC holders subsistence fished for halibut, 33 sport-fished, and 70 fished in either fishery (Table 11). In 2006, the estimated subsistence halibut harvest in Unalaska/Dutch Harbor was 16,331 pounds. This total was divided between harvests with setline gear (7,526 pounds; 46%) and hand operated gear (8,805; 54%) (Table 11). The estimated sport harvest of halibut by Unalaska SHARC holders in 2006 was 3,768 pounds, giving a total harvest for home use by SHARC holders of 20,100 pounds. In 2005, the estimated subsistence harvest of halibut for Unalaska/Dutch Harbor residents with SHARCs was 18,108 pounds net weight, with most (9,573 pounds; 53%) taken with setline gear and the balance with hand operated gear. In addition, in 2005 Unalaska/Dutch Harbor SHARC holders harvested 2,439 pounds of halibut while sport fishing, for a total halibut harvest of 20,547 pounds. In 2004, the estimated subsistence harvest of halibut for Unalaska/Dutch Harbor residents with SHARCs was 15,530 pounds net weight, with most (9,557 pounds; 62%) taken with setline gear and the balance with hand operated gear. In addition, Unalaska/Dutch Harbor SHARC holders harvested 2,165 pounds of halibut while sport fishing in 2004, for a total halibut harvest of 17,695 pounds. The estimated subsistence harvest for Unalaska and Dutch Harbor residents with SHARCs for 2003 was 10,860 pounds net weight, and these SHARC holders harvested an additional 5,519 pounds of halibut while sport fishing, for a total noncommercial harvest of 16,379 pounds. The 2006 total halibut harvest by Unalaska/Dutch Harbor residents represented just 21% of the harvest estimate for Similarly, the 2005 total halibut harvest was 21% of the harvest estimate for 1994, the 2004 total halibut harvest was 18% of the 1994 harvest estimate, and the 2003 estimate was 17% of the 1994 estimate. There are at least five possible explanations for these differences. One, halibut harvests in Unalaska may have declined since 1994, although an 32
47 actual level of decline of this magnitude appears unlikely. Second, the SHARC survey may have underestimated the subsistence halibut harvest if many fishers have not obtained a SHARC. A third possible explanation is that the 1994 survey might have overestimated the halibut harvest. A fourth potential explanation is that many halibut fishers in Unalaska perhaps prefer to harvest halibut under sport fishing regulations and therefore did not obtain a SHARC. A fifth possibility that may account for a decline in subsistence halibut harvests is stock abundance. The IPHC has noted a decline in abundance in Area 4A since 1994 (Gregg Williams, IPHC, personal communication, 2005). A combination of all five factors could be responsible for the unexpectedly low subsistence halibut harvest estimated for Unalaska from the SHARC surveys in all four study years. Further outreach in Unalaska is clearly appropriate, as well as additional research to better understand patterns of halibut fishing in the community. Toksook Bay (Regulatory Area 4E) As discussed in Chapter Two, 534 Toksook Bay tribal members (and 529 community residents) (population 532 in 2000 and 598 in 2006; U.S. Census Bureau 2001, ADLWD 2007) obtained SHARCs in The number of community members with SHARCs was 533 in The Division of Subsistence has not conducted a household harvest survey in this community. Wolfe (2002) estimated a subsistence halibut harvest of 12,600 pounds net weight (16,800 pounds round weight) for this community for 2000, based upon the per capita estimate for the neighboring community of Tununak from As also discussed in Chapter 1, with the assistance of the tribal government in Toksook Bay, Division of Subsistence staff evaluated the list of SHARC holders in the community, estimated the total number of subsistence halibut fishers, and conducted interviews with likely fishers. Based upon this collaboration with the tribal government, it is highly likely that most community residents who subsistence fished for halibut in 2003, 2004, 2005, and 2006 provided harvest data through the SHARC survey. Therefore, harvest estimates for Toksook Bay represent the harvests reported by respondents to the survey, and are not expanded to the total number of SHARC holders in the community. The estimated harvest for Toksook Bay for 2003 was 24,500 pounds net weight by 54 fishers (Table 11). In the assessment by project staff, this was considered a reliable subsistence harvest estimate for the community. It should be noted that Toksook Bay is a member of the Coastal Villages Regional Fund (CVRF) CDQ organization. The majority of the 5,034 pounds of sublegal halibut retained for home use by members of this CDQ organization in 2003 was landed at Toksook Bay and Mekoryuk (Williams 2004:59-60). For 2004, 56 Toksook Bay SHARC holders reported a harvest of 6,596 pounds of halibut, with most of this (5,737 pounds) harvested with hand operated gear (Table 11). This suggests a substantial decline in subsistence halibut harvests compared to As in 2003, a majority (69% of 7,120 pounds net weight) of the sublegal halibut retained for home use by the CVRF was landed at Toksook Bay and Mekoryuk (Williams 2005), but this cannot account for the decline in subsistence harvests. In 2005, subsistence harvests by Toksook Bay residents rebounded to 14,870 pounds; adding 98 pounds of sport-caught halibut gives a community total of 14,968 pounds (Table 11). Almost all (14,269 pounds; 96%) of the subsistence harvest was taken with hand-operated gear. Sixty-one Toksook Bay residents participated in the subsistence halibut fishery in The estimated subsistence halibut harvest by Toksook Bay residents increased substantially in 2006, to 36,481 pounds, all harvested with subsistence gear and most (34,149 pounds; 94%) 33
48 caught with hand-operated gear (Table 11). In 2006, the estimated number of participants in the subsistence fishery also increased, to 113 SHARC holders; the previous highest estimate was 61 subsistence halibut fishers in During interviews in the community in April 2007, halibut fishers in Toksook Bay reported that subsistence fishing had been very productive in 2006; halibut were abundant and there was a corresponding increase in subsistence fishing effort. This may account for the large increase in the estimated harvest in Also, in 2006, over 67% of the 19,710 pounds of sublegal halibut retained for home use in the CVRF CDQ fishery were landed at Toksook Bay and Mekoryuk (Williams 2007). Division staff conducting interviews with SHARC holders in Toksook Bay reminded respondents to not include CDQ sublegal halibut in their subsistence estimates for the SHARC survey. Tununak (Regulatory Area 4E) Tununak had a population of 325 in 2000, 315 of whom were Alaska Native (U.S. Census Bureau 2001). The population for 2006 was 333 (ADLWD 2006). The Division of Subsistence conducted a comprehensive household harvest survey in Tununak in 1986, which provides the only estimate of subsistence halibut harvests for the community prior to the adoption of the new subsistence regulations. The harvest estimate was 1,532 fish and 30,643 pounds net (dressed) weight, with a 95% confidence limit of +/-26%. The harvest per capita was 93 pounds net weight (ADF&G 2006). No residents of Tununak obtained SHARCs in , and the Traditional Elders Council in Tununak did not approve Division of Subsistence plans to conduct interviews with potential subsistence halibut fishers for Therefore, there was no subsistence halibut harvest estimate for this community for By the close of 2004, however, 70 residents of Tununak had obtained SHARCs (Table 11). Because only nine SHARC holders responded to the mailout survey (13%), harvest estimates for Tununak for 2004 were based on a very low sampling fraction. The estimated total subsistence halibut harvest was 1,954 pounds net weight by 31 fishers, 878 pounds harvested with set line gear and 1,076 pounds with hand operated gear. No Tununak SHARC holders reported any sport fishing activity. As noted in Chapter One, the tribal government supported Division of Subsistence interviewing of subsistence halibut fishers in Tununak for the 2005 study year. Thirty-three of 70 SHARC holders were interviewed (47%). As in Toksook Bay, reported harvests were not expanded for Tununak because most known halibut fishers were interviewed. The total subsistence harvest of halibut was 2,661 pounds by 20 fishers. Most of the harvest (88%) was taken with handoperated gear. There were no sport harvests of halibut in Tununak in In 2006, 70 Tununak residents held SHARCs. No interviewing took place in the community, but SHARC holders were attempted to be contacted by phone. Sample achievement was low (10 of 70 SHARC holders; 14%). Based on this limited sample, the estimated subsistence halibut harvest at Tununak in 2006 was 4,032 pounds by 33 subsistence fishers. Almost all of this harvest (3,808 pounds; 94%) was with hand-operated gear. Compared to the results of the 1986 survey, the harvest estimates for Tununak for 2004 through 2006 appear low. The reasons for this difference are uncertain. Several additional years of 24 One tribal member obtained a SHARC, but this person was not a resident of Tununak. 34
49 harvest data collection plus continuing outreach and community support will be necessary to understand subsistence halibut harvest trends in this community. COMPARISONS WITH NONSUBSISTENCE HARVESTS IN 2006 As reported in Table 17, the preliminary estimated total halibut removal in Alaskan waters in 2006 was 78,622,022 pounds (net weight) based on data compiled the IPHC (Gilroy personal communication 2007, Williams 2007) and this study. In this total, the removal of 19,710 pounds of sublegal halibut for personal use by CDQ organizations in Areas 4D and 4E has been added to the subsistence harvest category. Commercial harvests accounted for 70.1% of halibut removals in Alaska in 2006 (Figure 30). Bycatch of halibut in various other commercial fisheries ranked second, with 14.5% of the statewide removals. Sport harvests ranked third, with 11.7%. Wastage in commercial fisheries added 2.2% to the total halibut removals. Finally, the subsistence fishery accounted for 1.5% of the total removals of halibut in Alaska waters in harvests by fishery in 2006 at the regulatory area level did not differ substantially from the statewide pattern (Table 17, Figure 31). In all regulatory areas, commercial harvests accounted for 53% or more of the total pounds net weight of halibut removals. In Area 2C (Southeast Alaska) and Area 3A (Southcentral Alaska), sport fisheries took 20.6% and 17.0%, respectively, of the halibut harvest in 2006, but sport fisheries were smaller than the subsistence harvests in Area 3B and Area 4. Commercial bycatch accounted for 44.7% of halibut removals in Area 4. As a percentage of the total removal, subsistence halibut harvests were largest in Area 2C at 3.9% of the total (although they were less than a quarter of the sport harvest and about 5.5% of the commercial harvest) and in Area 3A at 1.1%. 35
50 36
51 CHAPTER 4: CONCLUSIONS AND RECOMMENDATIONS SUMMARY AND CONCLUSIONS New federal regulations governing subsistence halibut fishing in Alaska went into effect in May The 2006 calendar year was the fourth for which a program was implemented to estimate the subsistence harvest of halibut under these regulations. By several measures, the program was a success. In 2006, 14,206 members of Alaska Native tribes with traditional uses of halibut and residents of eligible rural communities held subsistence halibut registration cards (SHARCs) from NMFS, an increase of 22% over the number of SHARCs that had been issued by the end of Of all SHARC holders, 8,426 (59%) voluntarily provided information about their subsistence halibut fishing activities in 2006 by responding to the survey. This compares to a response rate of 60% (8,565 respondents of 14,306 SHARC holders) for the 2005 study year; 62% for the 2004 study year (8,524 respondents of 13,813 SHARC holders); and 65% for the 2003 study year (7,593 respondents of 11,625 SHARC holders) (Table 18). Based on these survey returns, an estimated 5,909 individuals participated in the Alaska subsistence halibut fishery in This is an increase of 5% from the estimated 5,621 individuals who subsistence fished for halibut in Alaska in 2005 and is 20% higher than the estimated 4,942 SHARC holders who fished in The estimated subsistence harvest of halibut in Alaska in 2006 is 54,089 fish and 1,125,312 pounds (+/-2.9%) (net weight). In comparison, the 2005 estimated subsistence halibut harvest was 55,875 fish and 1,178,222 pounds (+/-3.0%) (net weight); the 2004 estimated subsistence harvest was 52,412 halibut and 1,193,162 net pounds (+/- 1.5%), and 43,926 halibut for 1,041,330 pounds (+/- 4%) were harvested in the subsistence fishery in As measured in pounds, the 2006 subsistence halibut harvest was about 4% lower than the harvest in 2005 and 8% higher than the 2003 estimated harvest (Table 18). The total estimated harvests for 2003, 2004, 2005, and 2006 all fell below the 1.5 million net pounds estimated for the Alaska subsistence halibut harvest when the current regulations were developed by the North Pacific Fishery Management Council (see page 16748; NMFS 2003). The larger estimated harvest in 2004 compared to 2003 corresponded to the greater number of individuals who held SHARCs through December 2004 and a proportional increase in the number of individuals who subsistence fished for halibut. The leveling off of the harvest in 2006 and 2005 compared to 2004 is consistent with the small increase in individuals who held SHARCs for at least a portion of 2005 and Average harvests per fisher were slightly higher in 2005 (9.9 halibut per fisher for 210 pounds) compared to the first two years of the study: 8.8 halibut per fisher for 199 pounds in 2004 and 8.9 halibut per fisher in for 211 pounds in In 2006, the average subsistence fisher harvested 9.2 halibut and 190 pounds (Table 18). After the first four years of the harvest assessment program, it is not possible to determine if the overall increase in statewide harvest estimates in 2004, 2005, and 2006 compared to 2003 was the result of an actual increase in the subsistence halibut harvest, a reflection of normal year-toyear variations, a consequence of more complete participation of subsistence fishers in the SHARC program, the product of different sample sizes and the nature of the respondent pool, or the result of increasing trust on the part of subsistence fishers in the survey. As the community case studies demonstrate, a number of factors appear to have caused the differences in harvest estimates over the four study years, and these differ by community. Some are methodological 37
52 (St. Paul for example), while other factors are probably linked to more thorough and accurate documentation of harvests (Cordova, Sand Point) rather than a true increase. In 2006, most subsistence halibut were harvested with setline (stationary) gear (70%) and the rest with hand operated gear (30%). Similarly, in 2005, 70% of the subsistence halibut were harvested with setline (stationary) gear; in 2004, 74% of the subsistence halibut were harvested with setline (stationary) gear; and in 2003, setlines accounted for 72% of the harvest. The largest portion of the Alaska subsistence halibut harvest in 2006 occurred in Regulatory Area 2C (Southeast Alaska), 52% (580,117 pounds); followed by Area 3A (Southcentral Alaska), 34% (379,258 pounds); Area 4E (East Bering Sea Coast), 6% (70,743 pounds); Area 3B (Alaska Peninsula), 4% (48,547 pounds); Area 4A (Eastern Aleutian Islands), 2% (27,062 pounds); Area 4C (Pribilof Islands), less than 1% (8,529 pounds); Area 4D (Central Bering Sea), less than 1% (8,297 pounds); and Area 4B (Western Aleutian Islands), less than 1% (2,761 pounds). In 2005, 2004, and 2003 also, Area 2C (Southeast Alaska) and Area 3A (Southcentral Alaska) accounted for most of the subsistence harvests. The proportion of the statewide subsistence halibut harvest occurring in Area 2C (Southeast Alaska) has declined from 60% in 2003 and 57% in 2004 to 51% in 2005 and 52% in Correspondingly, the portion occurring in Area 3A (Southcentral Alaska) increased from 27% in 2003 to 34% in 2004, 36% in 2005, and 34% in Subsistence harvests accounted for 1.5% of the total halibut removals in Alaska waters in 2006, compared to 1.5% in 2005, 1.5 % in 2004, and 1.3% in Subsistence halibut fishers had an estimated incidental harvest of 16,945 rockfish in This is an increase of 37% from the estimate of 12,395 rockfish for 2005, a decline of 11% from the estimated harvest of 19,001 rockfish in 2004, and an increase of 14% from the 14,870 rockfish harvested in the fishery in 2003 (Table 18). There were 1,529 SHARC holders who harvested rockfish while subsistence halibut fishing in 2006, compared to 1,544 in 2005, 1,616 in 2004, and 1,239 in Most of the incidental rockfish harvests in 2006 occurred in Area 2C (68%), as they had in 2005 (63%), 2004 (68%), and 2003 (67%). In 2006, subsistence halibut fishers harvested an estimated 3,486 lingcod in the subsistence halibut fishery. This is an increase of 48% from the estimate of 2,355 lingcod harvested in the subsistence halibut fishery in 2005; a decline of 21% from the estimate of 4,407 lingcod harvested in the subsistence halibut fishery in 2004; and an increase of 6% from the 2003 estimate of 3,298 lingcod. In total, 927 SHARC holders harvested lingcod while subsistence halibut fishing in This is 8% higher than the 862 SHARC holders who had an incidental harvest of lingcod in 2005; 3% lower than the 953 SHARC holders who had an incidental harvest of lingcod in 2004 and 33% higher than the estimate of 699 SHARC holders in 2003 (Table 18). As with rockfish, most of the incidental lingcod harvest took place in Area 2C in 2006 (59%), 2005 (56%), 2004 (56%) and 2003 (51%). As discussed above, comparisons of the 2003, 2004, 2005, and 2006 harvest estimates with those from previous research by the Division of Subsistence are complicated by different research methods, but such comparisons are still instructive. Subsistence harvest estimates for most of the larger communities (combining tribal and rural SHARC holders) such as Sitka, Petersburg, and Kodiak for 2003, 2004, 2005, and 2006 are similar to earlier estimates based on household surveys. This is significant in that these communities account for a very large percentage of the total harvest. We conclude that the first four years of the survey of SHARC holders produced sound estimates of subsistence harvests of halibut in Alaska based on a scientific sample and a 38
53 relatively high response rate. The estimates can be further evaluated in the future as the new subsistence regulations become more completely implemented and additional years of harvest data are collected. Continued documentation of the subsistence harvests is also necessary for any meaningful discussion of trends in the fishery. RECOMMENDATIONS We conclude this report with the following recommendations based on experiences during the first four years of this project. These suggestions are similar to those that were offered at the conclusion of the first, second, and third years reports (Fall et al. 2004:30-31; Fall et al. 2005:34-36; Fall et al. 2006:37-38). 1. The harvest assessment program for the Alaska subsistence halibut fishery should continue for at least one more year to document harvests occurring in 2007, using methods similar to those employed for 2003, 2004, 2005, and This five-year effort will continue the development of a time series for assessment of harvest trends as well as for assessment of the information collected for the first years of the fishery. As discussed above, the methods used for 2003, 2004, 2005, and 2006 (a short, mailed survey with three mailings, supplemented by community outreach, interviewing in selected communities, and partnerships with tribal governments), were successful and should be retained to facilitate comparisons across study years. A recommendation in the final report for the third year of the program was that implementation of a program to collect harvest data in-season in selected communities should be considered on a trial basis to help supplement and evaluate the data collected through the mailed survey (Fall et al. 2006:37). As noted in Chapter 1, the Division of Subsistence conducted an inseason harvest monitoring project for the subsistence halibut fishery in Sitka and Kodiak in 2006 with funding provided by NMFS. Findings will be presented in a separate report to be completed in early Outreach is needed in several communities, including Unalaska/Dutch Harbor, Tununak, and Sand Point, based on relatively low response rates or unexpectedly low numbers of SHARCs issued. Contracts with tribal governments or local hiring in Sitka, Angoon, Hydaburg, Saxman, and Ketchikan should be renewed for the fifth year to build upon the successful work in those communities in the first four years of the program. Collaboration with the Central Bering Sea Fishermen s Association should also continue in order to develop a reliable harvest estimate for St. Paul. 3. Further community outreach should continue in Area 4E (East Bering Sea Coast). There are many communities in this very large geographic area but relatively few SHARCs were issued. For the 2006 study year (as discussed in Chapter One), the focus of this outreach was on those communities that are known to have relatively large traditional harvests of halibut. Harvests in many other communities in this area are likely to be small. Although a major outreach effort including most of these other communities would be expensive and unnecessary, communications with tribal governments could 25 Through award number NA07NMF , the Division of Subsistence, ADF&G received funding in late 2007 from NOAA to conduct a fifth year of surveys to document subsistence harvests that occurred
54 result in more enrollments in the SHARC program and more confidence in the survey results. 4. Regulations were adopted by NMFS in late 2004 creating a community harvester program for subsistence halibut fishing. It is essential to continue to integrate this program into the SHARC harvest assessment program. This may entail further cooperative work with tribal governments. 5. If rockfish or lingcod incidental harvests in the halibut subsistence fishery continue to be of interest to managers in some areas, more specific data collection tools need to be developed to collect harvest data at the species level for rockfish in particular communities. This should only be done in selected areas of concern given the additional costs to data collection and analysis that this will entail (see Wolfe 2002 for more discussion of collection of rockfish harvest data through the SHARC survey). Such research should only occur through partnerships with local communities and tribes, and should include a combination of participant observation, key respondent interviewing, and survey methods Further evaluation of sport fish harvest data, achieved through the mailed Statewide Harvest Survey administered by the Division of Sport Fish of ADF&G, should take place for the larger rural communities participating in the subsistence halibut fishery for at least several years. (Analysis of these data for Sitka was conducted as a pilot effort for See Fall et al. 2005: ) As discussed in Chapter 2 and Chapter 3, many SHARC holders also reported that they sport fished for halibut in 2003, 2004, 2005, and It will be important to try to determine if a shift in harvest from the sport category to the subsistence category is occurring, in order to evaluate trends in the subsistence fishery and the effect of the new subsistence halibut regulations on fishing patterns. Also, as also noted in Chapter 3, comparisons of community harvest estimates from previous research require consideration of sport harvests as well as harvests under the new subsistence regulations. Such comparisons are also important for evaluating the subsistence harvest assessment program and the performance of the new subsistence regulations. 7. Consideration should be given to funding and implementing ethnographic investigations in key halibut fishing communities to evaluate the effects of the new subsistence fishing regulations on fishing patterns. These studies would entail more detailed interviewing of fishers regarding any changes in gear choice, fishing effort, harvest amounts, incidental harvests of rockfish or lingcod, or other fishing activities that have resulted from the regulatory changes. These interviews could also investigate traditional knowledge about local halibut stocks (as well as local stocks of rockfish and lingcod) that might prove useful to management agencies, communities, and tribes for future management of the subsistence, sport, and commercial halibut fisheries in Alaska. 8. Results of the five years of survey data and the in-season project should be evaluated to design a sustainable harvest monitoring program for the Alaska subsistence halibut fishery, to begin with the 2008 harvest year. 26 In 2006, the Division of Subsistence, ADF&G, received funding from the North Pacific Research Board to conduct research on subsistence rockfish fishing in Sitka (southeast Alaska), Chenega Bay (Prince William Sound), and Nanwalek and Port Graham (lower Cook Inlet). Findings of this research will be available in
55 REFERENCES CITED ADF&G (Alaska Department of Fish and Game) Community Subsistence Information System. Division of Subsistence, Juneau. ADLWD (Alaska Department of Labor and Workforce Development) Population estimates for accessed September Cochran, W. G Sampling techniques. third edition. John Wiley & Sons, New York. Crapo, Chuck, Brian Paust, and Jerry Babbitt Recoveries and yields from Pacific fish and shellfish. Alaska Sea Grant College Program, Marine Advisory Bulletin No. 37, Fairbanks. Fall, James A., David B. Andersen, Louis Brown, Michael Coffing, Gretchen Jennings, Craig Mishler, Amy Paige, Charles J. Utermohle, and Vicki Vanek Noncommercial harvests and uses of wild resources in Sand Point, Alaska, Alaska Department of Fish and Game, Division of Subsistence, Technical Paper No. 226, Juneau. Fall, James A., Madel Kerlin, Bridget Easley, and Robert J. Walker Subsistence harvests of Pacific halibut in Alaska, Alaska Department of Fish and Game, Division of Subsistence, Technical Paper No Juneau. Fall, James A., Mykel George, and Bridget Easley Subsistence harvests of Pacific halibut in Alaska, Alaska Department of Fish and Game, Division of Subsistence, Technical Paper No. 304, Juneau. Fall, James A., David Koster, and Brian Davis Subsistence harvests of Pacific halibut in Alaska, Alaska Department of Fish and Game, Division of Subsistence, Technical Paper No. 320, Juneau. Gilroy, Heather The Pacific halibut fishery, International Pacific Commission 2005 Annual Management Bluebook, pages Personal communication regarding Pacific halibut removals in Alaska in International Pacific Commission. NMFS (National Marine Fisheries Service) Environmental assessment/regulatory impact review/initial regulatory flexibility analysis for a regulatory amendment for defining a halibut subsistence fishery category (EA/RIR/RFA). North Pacific Fishery Management Council, Alaska Department of Fish and Game, International Pacific Commission, and National Marine Fisheries Service. Anchorage, August 11, Environmental assessment of a regulatory amendment to define a halibut subsistence fishery category in convention waters. April 2, Scott, Cheryl, Louis A. Brown, Gretchen B. Jennings, and Charles J. Utermohle Community profile database for Access Version Alaska Department of Fish and Game, Division of Subsistence, Juneau. Stanek, Ronald Patterns of wild resource use in English Bay and Port Graham, Alaska. Alaska Department of Fish and Game, Division of Subsistence, Technical Paper No. 104, Juneau. Trumble, Robert J Estimates of personal use halibut. International Pacific Commission. Report of Assessment and Research Activities 1998: Turek, Michael Alaska rockfish (genus Sebastes): subsistence harvests and local knowledge of Alaska Rockfish. Project 645. Semiannual Progress Report to the North Pacific Research Board ( Alaska Department of Fish and Game, Division of Subsistence, Juneau. United States Census Bureau Profiles of general demographic characteristics, 2000 census of population and housing: Alaska. U.S. Department of Commerce. Washington, D.C. Williams, Gregg H Retention of sublegal halibut in the areas 4D/4E CDQ fishery: 2003 harvests. International Pacific Commission. Report of Assessment and Research Activities 2003: pp Retention of sublegal halibut in the areas 4D/4E CDQ fishery: 2004 harvests. International Pacific Commission Report of Assessment and Research Activities 2004:
56 REFERENCES CITED (Continued) Retention of sublegal halibut in the areas 4D/4E CDQ fishery: 2006 harvests. International Pacific Commission. Report of Assessment and Research Activities 2006: pp Wolfe, Robert J Subsistence halibut fishing in Alaska harvest patterns. Presentation to the Alaska Board of Fisheries, May 2001 (RC 8). Alaska Department of Fish and Game, Division of Subsistence Subsistence halibut harvest assessment methodologies. Report prepared for the National Marine Fisheries Service, Sustainable Fisheries Division. Robert J. Wolfe and Associates. San Marcos, CA. Wolfe, Robert, J., James A. Fall, and Ronald T. Stanek The subsistence harvest of harbor seals and sea lions by Alaska Natives in Alaska Department of Fish and Game, Division of Subsistence, Technical Paper No. 303, Juneau. 42
57 REPORT TABLES 43
58 Table 1. Population of rural communities eligible to participate in the Alaska subsistence halibut fishery, 2000 and Regulatory Population: 2000 Population: 2006 Community 1 Area Total Alaska Native ANGOON 2C COFFMAN COVE 2C CRAIG 2C 1, ,105 EDNA BAY 2C ELFIN COVE 2C GUSTAVUS 2C HAINES 2C 1, ,492 HOLLIS 2C HOONAH 2C HYDABURG 2C HYDER 2C KAKE 2C KASAAN 2C KLAWOCK 2C KLUKWAN 2C METLAKATLA 2C 1,375 1,125 1,323 MEYERS CHUCK 2C PELICAN 2C PETERSBURG 2C 3, ,129 POINT BAKER 2C PORT ALEXANDER 2C PORT PROTECTION 2C SAXMAN 2C SITKA 2C 8,835 2,178 8,833 SKAGWAY 2C TENAKEE SPRINGS 2C THORNE BAY 2C WHALE PASS 2C WRANGELL 2C 2, ,911 Regulatory Area 2C Subtotals 5 25,821 8,039 24,040 AKHIOK 3A CHENEGA BAY 3A CORDOVA 3A 2, ,211 KARLUK 3A KODIAK 2 3A 12,973 1,697 12,703 LARSEN BAY 3A NANWALEK 3A OLD HARBOR 3A OUZINKIE 3A PORT GRAHAM 3A PORT LIONS 3A SELDOVIA 3A TATITLEK 3A YAKUTAT 3A Regulatory Area 3A Subtotals 17,871 3,735 17,209 -continued- 44
59 Table 1. Page 2 of 3. Regulatory Population: 2000 Population: 2006 Community 1 Area Total Alaska Native CHIGNIK 3B CHIGNIK LAGOON 3B CHIGNIK LAKE 3B COLD BAY 3B FALSE PASS 3B IVANOF BAY 3B KING COVE 3B NELSON LAGOON 3B PERRYVILLE 3B SAND POINT 3B Regulatory Area 3B Subtotals 2,435 1,311 2,296 AKUTAN 4A NIKOLSKI 4A UNALASKA 4A 4, ,940 Regulatory Area 4A Subtotals 5, ,712 ADAK 4B ATKA 4B Regulatory Area 4B Subtotals ST GEORGE ISLAND 4C ST PAUL ISLAND 4C Regulatory Area 4C Subtotals GAMBELL 4D SAVOONGA 4D DIOMEDE 4D Regulatory Area 4D Subtotals 1,438 1,373 1,465 ALAKANUK 4E ALEKNAGIK 4E BREVIG MISSION 4E BETHEL 4E 5,471 3,719 5,812 CHEFORNAK 4E CHEVAK 4E CLARK'S POINT 4E COUNCIL ANVSA 3 4E 0 0 DILLINGHAM 4E 2,466 1,503 2,397 EEK 4E EGEGIK 4E ELIM 4E EMMONAK 4E GOLOVIN 4E GOODNEWS BAY 4E HOOPER BAY 4E 1, ,157 KING SALMON 4E continued- 45
60 Table 1. Page 3 of 3. Regulatory Population: 2000 Population: 2006 Community 1 Area Total Alaska Native KIPNUK 4E KONGIGANAK 4E KOTLIK 4E KOYUK 4E KWIGILLINGOK 4E LEVELOCK 4E MANOKOTAK 4E MEKORYUK 4E NAKNEK 4E NAPAKIAK 4E NAPASKIAK 4E NEWTOK 4E NIGHTMUTE 4E NOME 4E 3,505 2,057 3,540 OSCARVILLE 4E PILOT POINT 4E PLATINUM 4E PORT HEIDEN 4E QUINHAGAK 4E SCAMMON BAY 4E SAINT MICHAEL 4E SHAKTOOLIK 4E SHELDON POINT 4E SHISHMAREF 4E SOLOMON ANVSA 4E SOUTH NAKNEK 4E STEBBINS 4E TELLER 4E TOGIAK 4E TOKSOOK BAY 4E TUNTUTULIAK 4E TUNUNAK 4E TWIN HILLS 4E UGASHIK 4E UNALAKLEET 4E WALES 4E WHITE MOUNTAIN 4E Regulatory Area 4E Subtotals 28,880 23,176 29,995 Grand Total 82,572 38,977 80,516 Source: U.S. Census Bureau 2001; Alaska Department of Labor and Workforce Development population estimates for 2006 ( on September 18, 2007) 1 Alaska Native Village statistical Area populations were used whenever no city or census designated place (CDP) populations 2 3 were present in the census. Total population for Kodiak Island road system area; includes Kodiak City, Kodiak Station, Chiniak, and other areas on the road system. There is no census table for a Council CDP or municipality. The Council ANVSA table indicated that all 40 housing units were vacant. 4 No Alaska Native Population data are available for Non-tribal residents of Naukati Bay were not eligible for SHARCs in The NPFMC in late 2004 recommended that Naukati Bay be added to the eligible list, but regulatory action had not occurred by late Naukati Bay had a population of 135, including 13 Alaska Natives, in 2000, and a total population of 129 in
61 Table 2. Project chronology, 2006 study year. Date June 2, 2006 December 21, 2006 Mid January 2007 February 16, 2007 Mid March 2007 March 19, 2007 March 26 to 30, 2007 April 16 to April 27, 2007 Throughout April 2007 April through June 2007 April 18, 2007 April 23, 2007 June to August 2007 June to September 2007 October 31, 2007 November 16, 2007 December 4, 2007 December 5, 2007 December 20, 2007 Event/Action Amendment 2 to Award No. NA04NMF finalized between NMFS and ADF&G to support the research for study year 2006 Mailing of letter to tribes concerning mailout of surveys for the second year of the project Running of newspaper ads First mailing of survey forms Survey administration, Nanwalek and Port Graham Second mailing of survey forms Survey administration, Chenega Bay Survey administration in Toksook Bay; Phone calls to SHARC holders in selected western Alaska communities Administration of surveys in Sitka, Hydaburg, Angoon, and Ketchikan Third mailing of survey forms Submission of semi-annual report on project progress to NMFS St. Paul inseason harvest data collection In-season harvest data collection, Sitka and Kodiak Submission of semi-annual report on project progress to NMFS Release of public review draft of final report Presentation of study findings, ANSHWG, Anchorage Presentation of study findings, NPFMC, Anchorage Completion of revised, final report 47
62 Table 3. Sample achievement, Alaska subsistence halibut survey for 2006 by eligible Alaska tribe, eligible Alaska rural community, and place of residence of SHARC holders. 48 Tribal Name Regulatory Areas Surveys Mailed First Mailing Second Mailing Third Mailing Surveys Surveys Undeliverable Surveys Mailed Surveys Surveys Undeliverable Surveys Mailed Surveys Surveys Undeliverable ANGOON COMMUNITY ASSOCIATION 2C % 3 AUKQUAN TRADITIONAL COUNCIL 2C 2 CENTRAL COUNCIL TLINGIT AND HAIDA INDIAN TRIBES 2C % 140 CHILKAT INDIAN VILLAGE 2C % 5 CHILKOOT INDIAN ASSOCIATION 2C % 8 CRAIG COMMUNITY ASSOCIATION 2C % 5 DOUGLAS INDIAN ASSOCIATION 2C % 4 HOONAH INDIAN ASSOCIATION 2C % 17 HYDABURG COOPERATIVE ASSOCIATION 2C % 1 KETCHIKAN INDIAN CORPORATION 2C % 148 KLAWOCK COOPERATIVE ASSOCIATION 2C % 6 METLAKATLA INDIAN COMMUNITY, ANNETTE ISLAND RESERVE 2C % 12 ORGANIZED VILLAGE OF KAKE 2C % 16 ORGANIZED VILLAGE OF KASAAN 2C % 2 ORGANIZED VILLAGE OF SAXMAN 2C % 4 PETERSBURG INDIAN ASSOCIATION 2C % 9 SITKA TRIBE OF ALASKA 2C % 57 SKAGWAY VILLAGE 2C 2 WRANGELL COOPERATIVE ASSOCIATION 2C % 9 2C Totals % 447 KENAITZE INDIAN TRIBE 3A % 5 LESNOI VILLAGE (WOODY ISLAND) 3A % 63 NATIVE VILLAGE OF AFOGNAK 3A % 5 NATIVE VILLAGE OF AKHIOK 3A % 1 NATIVE VILLAGE OF CHENEGA 3A % 2 NATIVE VILLAGE OF EYAK 3A % 6 NATIVE VILLAGE OF KARLUK 3A 5 NATIVE VILLAGE OF LARSEN BAY 3A % 5 NATIVE VILLAGE OF NANWALEK 3A % 0 NATIVE VILLAGE OF OUZINKIE 3A % 8 NATIVE VILLAGE OF PORT GRAHAM 3A % 2 NATIVE VILLAGE OF PORT LIONS 3A % 4 NATIVE VILLAGE OF TATITLEK 3A % 4 NINILCHIK VILLAGE 3A % 4 SELDOVIA VILLAGE TRIBE 3A % 4 SHOONAQ' TRIBE OF KODIAK 3A % 27 VILLAGE OF OLD HARBOR 3A % 2 VILLAGE OF SALAMATOFF 3A % 0 YAKUTAT TLINGIT TRIBE 3A % 4 3A Totals % 147 AGDAAGUX TRIBE OF KING COVE 3B % 1 CHIGNIK LAKE VILLAGE 3B % 1 IVANOFF BAY VILLAGE 3B % 3 NATIVE VILLAGE OF BELKOFSKI 3B 2 NATIVE VILLAGE OF CHIGNIK 3B % 0 NATIVE VILLAGE OF CHIGNIK LAGOON 3B % 3 NATIVE VILLAGE OF FALSE PASS 3B % 3 NATIVE VILLAGE OF NELSON LAGOON 3B 3 NATIVE VILLAGE OF PERRYVILLE 3B % 4 NATIVE VILLAGE OF UNGA 3B % 0 PAULOFF HARBOR VILLAGE 3B % 8 QAGAN TAYAGUNGIN TRIBE OF SAND POINT VILLAGE 3B % 58 VILLAGE OF KANATAK 3B % 4 3B Totals % 86 NATIVE VILLAGE OF AKUTAN 4A % 0 NATIVE VILLAGE OF NIKOLSKI 4A % 0 QAWALANGIN TRIBE OF UNALASKA 4A % 1 4A Totals % 1 NATIVE VILLAGE OF ATKA 4B % 1 4B Totals % 1 PRIBILOF ISLANDS ALEUT COMMUNITY OF ST GEORGE 4C % 0 PRIBILOF ISLANDS ALEUT COMMUNITY OF ST PAUL 4C % 4 4C Totals % 4 NATIVE VILLAGE OF GAMBELL 4D % 0 NATIVE VILLAGE OF SAVOONGA 4D % 0 4D Totals % 0 CHEVAK NATIVE VILLAGE (KASHUNAMIUT) 4E % 1 CHINIK ESKIMO COMMUNITY 4E 1 EGEGIK VILLAGE 4E % 0 KING ISLAND NATIVE COMMUNITY 4E 2 LEVELOCK VILLAGE 4E 1 NAKNEK NATIVE VILLAGE 4E % 0 NATIVE VILLAGE OF ALEKNAGIK 4E 5 NATIVE VILLAGE OF COUNCIL 4E 1 NATIVE VILLAGE OF DILLINGHAM (CURYUNG) 4E % 0 NATIVE VILLAGE OF EEK 4E % 0 NATIVE VILLAGE OF EKUK 4E 3 -continued- SHARCs Issued by Mail through Staff Totals Response Response Rate Undeliverable
63 Table 3.-Page 2 of 5. Tribal Name Regulatory Areas Surveys Mailed First Mailing Second Mailing Third Mailing Surveys Surveys Undeliverable Surveys Mailed Surveys Surveys Undeliverable Surveys Mailed Surveys Surveys Undeliverable NATIVE VILLAGE OF ELIM 4E 1 NATIVE VILLAGE OF GOODNEWS BAY (MUMTRAQ) 4E % 0 NATIVE VILLAGE OF HOOPER BAY 4E % 2 NATIVE VILLAGE OF KANAKANAK 4E 1 NATIVE VILLAGE OF KIPNUK 4E % 1 NATIVE VILLAGE OF KONGIGANAK 4E % 1 NATIVE VILLAGE OF KOYUK 4E 1 NATIVE VILLAGE OF KWIGILLINGOK 4E % 0 NATIVE VILLAGE OF KWINHAGAK 4E % 0 NATIVE VILLAGE OF MEKORYUK 4E % 1 NATIVE VILLAGE OF NAPAKIAK 4E 3 NATIVE VILLAGE OF NIGHTMUTE 4E % 0 NATIVE VILLAGE OF PORT HEIDEN 4E 1 NATIVE VILLAGE OF SCAMMON BAY 4E 5 NATIVE VILLAGE OF SHAKTOOLIK 4E 1 NATIVE VILLAGE OF SHISHMAREF 4E 1 NATIVE VILLAGE OF TOKSOOK BAY (NUNAKAUYAK) 4E % 49 NATIVE VILLAGE OF TUNUNAK 4E % 0 NATIVE VILLAGE OF UNALAKLEET 4E % 0 NATIVE VILLAGE OF WHITE MOUNTAIN 4E 2 NEWTOK VILLAGE 4E 3 NOME ESKIMO COMMUNITY 4E % 1 ORUTSARARMUIT NATIVE VILLAGE 4E % 0 PLATINUM TRADITIONAL VILLAGE 4E 1 SOUTH NAKNEK VILLAGE 4E 2 STEBBINS COMMUNITY ASSOCIATION 4E 4 TRADITIONAL VILLAGE OF TOGIAK 4E % 1 TWIN HILLS VILLAGE 4E 1 UGASHIK VILLAGE 4E 4 VILLAGE OF CHEFORNAK 4E % 0 VILLAGE OF CLARK'S POINT 4E 3 4E Totals % 63 Tribal Name Subtotals 6,731 1, , , ,123 2, , % 749 SHARCs Issued by Mail through Staff Totals Response Response Rate Undeliverable 49 Rural Community Regulatory Areas Surveys Mailed First Mailing Second Mailing Third Mailing Surveys Surveys Undeliverable Surveys Mailed Surveys Surveys Undeliverable Surveys Mailed Surveys Surveys Undeliverable ANGOON 2C % 2 COFFMAN COVE 2C % 3 CRAIG 2C % 25 EDNA BAY 2C % 0 ELFIN COVE 2C % 1 GUSTAVUS 2C % 1 HAINES 2C % 18 HOLLIS 2C % 6 HOONAH 2C % 8 HYDABURG 2C % 0 HYDER 2C % 0 KAKE 2C % 3 KASAAN 2C % 4 KLAWOCK 2C % 10 KLUKWAN 2C 1 METLAKATLA 2C % 6 MEYERS CHUCK 2C % 1 PELICAN 2C % 4 PETERSBURG 2C % 42 PORT ALEXANDER 2C % 1 PORT PROTECTION 2C % 0 PT. BAKER 2C % 1 SAXMAN 2C % 1 SITKA 2C % 96 SKAGWAY 2C % 3 TENAKEE SPRINGS 2C % 2 THORNE BAY 2C % 15 WHALE PASS 2C % 1 WRANGELL 2C % 18 2C Totals % 272 AKHIOK 3A 1 CHENEGA BAY 3A % CORDOVA 3A % KODIAK 3A % LARSEN BAY 3A % NANWALEK 3A 0 OLD HARBOR 3A % OUZINKIE 3A % PORT GRAHAM 3A % -continued- SHARCs Issued by Mail through Staff Totals Response Response Rate Undeliverable
64 Table 3. Page 3 of Rural Community Regulatory Areas Surveys Mailed First Mailing Second Mailing Third Mailing Totals Surveys Surveys Undeliverable Surveys Mailed Surveys Surveys Undeliverable Surveys Mailed Surveys Surveys Undeliverable PORT LIONS 3A % SELDOVIA 3A % TATITLEK 3A % YAKUTAT 3A % 3A Totals % 159 CHIGNIK 3B % CHIGNIK LAGOON 3B % CHIGNIK LAKE 3B 4 COLD BAY 3B % FALSE PASS 3B 3 KING COVE 3B % PERRYVILLE 3B 2 SAND POINT 3B % 3B Totals % 5 AKUTAN 4A 2 NIKOLSKI 4A % UNALASKA 4A % 4A Totals % 6 ADAK 4B % ATKA 4B 4 4B Totals % 0 ST GEORGE ISLAND 4C 1 ST PAUL ISLAND 4C 0 4C Totals % 0 4D Totals N/A 0 ALAKANUK 4E 1 ALEKNAGIK 4E 3 BETHEL 4E 4 CHEFORNAK 4E 1 CHEVAK 4E 3 CLARKS POINT 4E 1 DILLINGHAM 4E % EMMONAK 4E 1 HOOPER BAY 4E 1 KING SALMON 4E 2 KOTLIK 4E 1 KWIGILLINGOK 4E 1 MANOKOTAK 4E 2 MEKORYUK 4E 1 NAKNEK 4E % NIGHTMUTE 4E % NOME 4E % PLATINUM 4E 1 PORT HEIDEN 4E 2 QUINHAGAK 4E 2 SHELDON POINT 4E 1 SOUTH NAKNEK 4E 2 TELLER 4E 3 TOGIAK 4E 3 TOKSOOK BAY 4E 1 4E Totals % 3 SHARCs Issued by Mail through Staff Response Response Rate Undeliverable Rural Community Subtotals 6,641 3, , , ,083 4, , % 445 TRIBAL/RURAL GRAND TOTALS 13,372 4, ,179 1, , ,206 6,904 1,522 8, % 1,194 City of Residence State of Residence Surveys Mailed First Mailing Second Mailing Third Mailing Totals Surveys Surveys Undeliverable Surveys Mailed Surveys Surveys Undeliverable Surveys Mailed Surveys Surveys Undeliverable ADAK AK % 0 AKHIOK AK % 1 AKUTAN AK % 0 ALAKANUK AK 1 ALEKNAGIK AK 4 ANCHOR POINT AK % 1 ANCHORAGE AK % 37 ANGOON AK % 5 ATKA AK 4 AUKE BAY AK 3 BARROW AK 1 BETHEL AK % 0 BIG LAKE AK 2 CHEFORNAK AK % 0 CHENEGA BAY AK % 1 CHEVAK AK % 0 -continued- SHARCs Issued by Mail through Staff Response Response Rate Undeliverable
65 Table 3. Page 4 of City of Residence State of Residence Surveys Mailed First Mailing Second Mailing Third Mailing Surveys Surveys Undeliverable Surveys Mailed Surveys Surveys Undeliverable Surveys Mailed Surveys Surveys Undeliverable CHIGNIK AK % 2 CHIGNIK BAY AK 3 CHIGNIK LAGOON AK % 3 CHIGNIK LAKE AK % 1 CHINIAK AK % 5 CHUGIAK AK % 6 CLARKS POINT AK 4 COFFMAN COVE AK % 3 COLD BAY AK % 2 CORDOVA AK % 34 CRAIG AK % 42 DILLINGHAM AK % 1 DOUGLAS AK % 13 DUTCH HARBOR AK % 6 EAGLE RIVER AK % 0 EDNA BAY AK % 0 EEK AK % 0 ELFIN COVE AK % 1 EXCURSION INLET AK 2 FAIRBANKS AK % 3 FALSE PASS AK % 3 FRITZ CREEK AK 2 GAMBELL AK % 0 GOLOVIN AK 1 GOODNEWS BAY AK % 0 GUSTAVUS AK % 1 HAINES AK % 29 HOLLIS AK 5 HOMER AK % 0 HOONAH AK % 21 HOOPER BAY AK % 2 HYDABURG AK % 1 HYDER AK % 0 JUNEAU AK % 107 KAKE AK % 18 KARLUK AK 1 KASAAN AK % 5 KASILOF AK % 1 KENAI AK % 6 KETCHIKAN AK % 154 KING COVE AK % 1 KING SALMON AK 2 KIPNUK AK % 0 KLAWOCK AK % 19 KODIAK AK % 169 KONGIGANAK AK % 0 KWIGILLINGOK AK % 0 LARSEN BAY AK % 4 MANOKOTAK AK 2 MARSHALL AK 1 MEKORYUK AK % 0 METLAKATLA AK % 14 MEYERS CHUCK AK % 1 NAKNEK AK % 1 NANWALEK AK % 0 NAPAKIAK AK 3 NAUKATI AK % 0 NELSON LAGOON AK 1 NEWTOK AK 3 NIGHTMUTE AK % 0 NIKISKI AK % 0 NIKOLSKI AK % 0 NINILCHIK AK % 2 NOME AK % 1 NORTH POLE AK 3 OLD HARBOR AK % 4 OUZINKIE AK % 4 PALMER AK 5 PELICAN AK % 8 PERRYVILLE AK % 7 PETERSBURG AK % 50 PLATINUM AK 1 POINT BAKER AK % 1 PORT ALEXANDER AK % 0 PORT GRAHAM AK % 0 PORT HEIDEN AK 1 PORT LIONS AK % 0 PORT PROTECTION AK 1 PORT WILLIAM AK 2 QUINHAGAK AK % 0 SHARCs Issued by Mail through Staff Totals Response Response Rate Undeliverable -continued-
66 Table 3. Page 5 of City of Residence State of Residence Surveys Mailed First Mailing Second Mailing Third Mailing Totals Surveys Surveys Undeliverable Surveys Mailed Surveys Surveys Undeliverable Surveys Mailed Surveys Surveys Undeliverable SAND POINT AK % 59 SAVOONGA AK % 0 SAXMAN AK % 0 SCAMMON BAY AK 2 SELDOVIA AK % 3 SEWARD AK % 0 SHISHMAREF AK 1 SITKA AK % 146 SKAGWAY AK % 4 SOLDOTNA AK % 0 SOUTH NAKNEK AK 3 ST GEORGE ISLAND AK % 0 ST PAUL ISLAND AK % 0 STERLING AK 4 SUTTON AK 1 TATITLEK AK % 2 TELLER AK 3 TENAKEE SPRINGS AK % 2 THORNE BAY AK % 14 TOGIAK AK % 0 TOKSOOK BAY AK % 49 TRAPPER CREEK AK 1 TUNUNAK AK % 0 TWIN HILLS AK 2 UNALAKLEET AK 1 UNALASKA AK % 3 VALDEZ AK % 2 WARD COVE AK % 7 WASILLA AK % 6 WHALE PASS AK 2 WHITE MOUNTAIN AK 1 WHITTIER AK 1 WILLOW AK 1 WRANGELL AK % 37 YAKUTAT AK % 5 SHARCs Issued by Mail through Staff Response Response Rate Undeliverable Alaska Resident Subtotal % 1145 Non-Alaska Resident Subtotal % 49 Residence Grand Totals % To protect confidentiality, data for tribes and communities with 5 or fewer SHARCs are not reported in this table. Tribal and community subtotals include all tribes and communities SHARC = Subsistence halibut registration certificate. Note that members of eligible Alaska tribes may obtain SHARCs regardless of place of residence. All non-alaska resident SHARC holders were members of eligible tribes.
67 Table 4. Estimated Alaska subsistence harvests of halibut, sport halibut harvests by SHARC holders, and incidental harvests of lingcod and rockfish by SHARC type and regulatory area of the tribe or rural community of registration by the SHARC holder, SHARC 1 Type Regulatory Area SHARCs Issued Return Rate Subsistence for Percent of SHARCs Issued Estimated Surveys Percent of Fishers Subsistence Harvest Estimated Estimated of of Fish Pounds 3 Sport for Percent Estimated of SHARCs Sport Harvest Estimated of Fish Estimated of Pounds 3 Lingcod Incidental Harvest Estimated of Fishers Estimated of Fish Rockfish Incidental Harvest Estimated of Fishers Estimated of Fish Tribal 2 2C 3,825 1, % 1, % 10, , % 1,830 36, ,068 Tribal 3A 1, % % 5, , % , ,506 Tribal 3B % % 1,945 42, % 255 8, Tribal 4A % % , % Tribal 4B % % 94 1, % Tribal 4C % % 534 8, % Tribal 4D % % 233 8, % Tribal 4E 1, % % 6,376 66, % 85 1, Tribal All 7,123 3, % 2, % 25, , % 2,914 61, , ,874 Rural 2 2C 4,510 3, % 2, % 16, ,210 1, % 4,265 76, , ,561 Rural 3A 2,245 1, % 1, % 10, , % 3,754 79, ,347 Rural 3B % % , % 105 2, Rural 4A % % , % 156 3, Rural 4B % % 32 1, % Rural 4C % 0 0.0% % Rural 4D % 0 0.0% % Rural 4E % % 334 5, % Rural All 7,083 5, % 3, % 28, ,572 2, % 8, , ,806 1,011 9,071 All 3 2C 8,335 5, % 3, % 26, ,786 1, % 6, , ,119 1,077 11,629 All 3A 3,466 2, % 1, % 16, , % 4,430 93, ,853 All 3B % % 2,549 54, % , ,045 All 4A % % 1,212 27, % 222 4, All 4B % % 126 2, % All 4C % % 534 8, % All 4D % % 233 8, % All 4E 1, % % 6,709 71, % 111 1, All All 14,206 8, % 5, % 54,089 1,125,312 2, % 11, , ,486 1,529 16,945 1 SHARC = Subsistence Registration Certificate 2 "Tribal" = individuals who obtained SHARCs as member of an eligible tribe, sorted by location of tribal headquarters. "Rural" = individuals who obtained SHARCs as residents of an eligible rural community. "All" = sum of tribal and rural SHARC holders for a regulatory area based on location of tribal headquarters or rural community. Because some SHARC holders may fish in regulatory areas other than the location of the area of their tribal headquarters or rural residence, area totals in this table differ slightly from those in Table 6, Table 7, and Table 9. 3 Pounds net (dressed) weight, = 75% of round (whole) weight. Source: Alaska Department of Fish and Game, Division of Subsistence SHARC Survey, 2007.
68 Table 5. Age of subsistence halibut registration certificate holders by SHARC type, SHARC Age in Years ( of SHARC Holders) Type totals Tribal , % 3.7% 5.5% 7.3% 7.5% 7.4% 6.9% 9.9% 12.2% 12.3% 10.8% 8.6% 5.6% 4.7% 3.0% 1.6% 0.8% 0.3% 0.2% 0.0% Rural , % 1.2% 2.0% 3.0% 3.2% 5.3% 6.8% 8.7% 10.6% 13.0% 14.1% 11.5% 7.9% 4.8% 2.8% 1.1% 0.7% 0.2% 0.0% 0.0% Grand Totals , % 2.4% 3.7% 5.0% 5.2% 6.3% 6.8% 9.3% 11.4% 12.7% 12.5% 10.1% 6.8% 4.8% 2.9% 1.4% 0.7% 0.2% 0.1% 0.0% Toksook Bay % 10.7% 15.4% 13.5% 8.4% 5.8% 7.7% 9.0% 7.3% 5.1% 3.7% 3.0% 4.1% 2.2% 1.1% 1.1% 0.2% 0.2% 0.2% 0.2% 54 Tribal, w/o Toksook Bay , % 3.1% 4.6% 6.8% 7.4% 7.6% 6.9% 10.0% 12.6% 12.9% 11.4% 9.1% 5.8% 4.9% 3.1% 1.6% 0.8% 0.3% 0.2% 0.0% Source: SHARC database, Restricted Access Management Program, NMFS, Juneau, as of 12/31/2006.
69 Table 6. Estimated Alaska subsistence harvests of halibut by halibut regulatory area, and subarea fished and by gear type, and estimated sport harvests by SHARC holders, Subarea Regulatory Area of SHARCs 3 (any halibut Estimated Estimated Subsistence Harvest by Gear Type 1 Setline (fixed) Gear Hand-Operated Gear All Subsistence Gear Estimated Estimated Estimated Estimated Estimated Estimated Estimated Pounds Pounds Harvested Harvested Harvested 2 Harvested Estimated Pounds Harvested 2 Estimated Sport Harvest Estimated Estimated Harvested Estimated Pounds Harvested 2 Harvested 2 Southern Southeast Alaska 2C 2,156 1,374 10, , ,339 61,173 1,748 13, ,921 1,039 3,615 68,241 Sitka LAMP Area 2C 1, , , ,049 15, , , ,246 21,835 Northern Southeast Alaska 2C , , ,111 21, , , ,058 19,573 Subtotal 2C 3,936 2,721 20, ,494 1,333 5,498 97,623 3,298 25, ,117 1,731 5, ,649 Yakutat Area 3A , , , ,288 Prince William Sound 3A ,693 38, , ,141 47, ,084 Cook Inlet 3A ,088 23, ,106 36, ,194 59, ,156 Kodiak Island Road System 3A ,029 95, ,035 44, , , ,150 48,569 Kodiak Island Other 3A ,015 73, ,712 38, , , ,027 23,505 Subtotal 3A 2,119 1,220 10, ,564 1,003 6, ,694 1,790 17, ,258 1,025 4,723 99,602 Chignik Area 3B , , , ,482 Lower Alaska Peninsula 3B , , ,562 30, ,009 Subtotal 3B ,211 23, ,189 25, ,401 48, ,491 Eastern Aleutians - East 4A , , ,251 25, ,830 Eastern Aleutians - West 4A , Subtotal 4A , , ,290 27, ,830 Western Aleutians - East 4B , , Western Aleutians - Other 4B Subtotal 4B , , St. George Island 4C , , St. Paul Island 4C , , Subtotal 4C , , , St. Lawrence Island 4D , , Area 4D, Other 4D Subtotal 4D , , Bristol Bay 4E , , Yukon/Kuskokwim Delta 4E , ,783 62, ,484 69, Norton Sound 4E Subtotal 4E , ,791 62, ,531 70, Grand totals 1 Alaska 6,899 4,226 33, ,532 3,007 20, ,779 5,909 54,089 1,125,312 2,894 11, ,639 1 Setline = longline or skate. Hand-operated gear = rod and reel or handline. 2 Pounds are net (dressed) weight. Net weight = 75% of round weight. 3 Because fishers might fish in more than one area, subtotals for regulatory areas and the state total might exceed the sum of the subarea values. Includes subsistence and sport fishing. Source: Alaska Department of Fish and Game, Division of Subsistence, SHARC Survey, 2007.
70 Table 7. Alaska subsistence halibut harvests in 2003, 2004, 2005, and 2006 by geographic area fished. Subsistence Harvests, Net Lbs % Change between Years Percentage of State Total to to to to Southern Southeast Alaska 290, , , , % -11.0% -6.3% 6.0% 27.9% 31.0% 27.9% 27.4% Sitka LAMP Area 173, , , , % -9.3% 10.5% -14.9% 16.6% 12.3% 11.3% 13.1% Northern Southeast Alaska 159, , , , % -15.3% -8.2% -22.0% 15.3% 13.4% 11.5% 11.1% Area 2C Subtotal 623, , , , % -11.7% -3.0% -7.0% 59.9% 56.7% 50.8% 51.6% Yakutat Area 11,198 20,153 36,515 19, % 81.2% -47.5% 71.3% 1.1% 1.7% 3.1% 1.7% Prince William Sound 28,409 58,429 68,063 47, % 16.5% -29.5% 68.8% 2.7% 4.9% 5.8% 4.3% Cook Inlet 52,609 83,939 79,024 59, % -5.9% -24.1% 14.0% 5.1% 7.0% 6.7% 5.3% Kodiak Island Road System 114, , , , % 4.4% 4.1% 23.1% 11.0% 10.8% 11.4% 12.5% Kodiak Island Other 79, , , , % -1.0% 0.8% 41.0% 7.6% 9.4% 9.4% 9.9% Area 3A Subtotal 285, , , , % 6.4% -11.7% 32.8% 27.4% 33.8% 36.4% 33.7% Chignik Area 10,500 12,053 14,783 17, % 22.7% 20.3% 69.3% 1.0% 1.0% 1.3% 1.6% Lower Alaska Peninsula 16,977 21,467 31,442 30, % 46.5% -2.1% 81.2% 1.6% 1.8% 2.7% 2.7% Area 3B Subtotal 27,477 33,519 46,225 48, % 37.9% 5.0% 76.7% 2.6% 2.8% 3.9% 4.3% 56 Eastern Aleutians - East 19,345 26,715 33,882 25, % 26.8% -23.3% 34.4% 1.9% 2.2% 2.9% 2.3% Eastern Aleutians - West 1,852 2,162 1,734 1, % -19.8% -38.4% -42.3% 0.2% 0.2% 0.1% 0.1% Area 4A Subtotal 21,197 28,877 35,615 27, % 23.3% -24.0% 27.7% 2.0% 2.4% 3.0% 2.4% Western Aleutians - East 2, ,351 2, % 47.5% 104.4% 6.9% 0.2% 0.1% 0.1% 0.2% Western Aleutians - Other % 0.0% 0.0% 0.0% Area 4B Subtotal 2, ,351 2, % 47.5% 104.4% 6.9% 0.2% 0.1% 0.1% 0.2% St. George Island 2,042 1,823 2,145 3, % 17.7% 60.5% 68.6% 0.2% 0.2% 0.2% 0.3% St. Paul Island 20,839 7,911 5,571 5, % -29.6% -8.7% -75.6% 2.0% 0.7% 0.5% 0.5% Area 4C Subtotal 22,881 9,734 7,716 8, % -20.7% 10.5% -62.7% 2.2% 0.8% 0.7% 0.8% St. Lawrence Island 4,380 10,923 5,848 8, % -46.5% 41.9% 89.4% 0.4% 0.9% 0.5% 0.7% Area 4D, Other % 0.0% 0.0% 0.0% Area 4D Subtotal 4,380 10,923 5,848 8, % -46.5% 41.9% 89.4% 0.4% 0.9% 0.5% 0.7% Bristol Bay ,169 1, % 967.2% -38.4% 207.2% 0.0% 0.0% 0.2% 0.1% YK Delta 53,284 28,298 51,950 69, % 83.6% 33.6% 30.3% 5.1% 2.4% 4.4% 6.2% Norton Sound % % 0.0% 0.0% 0.0% 0.0% Area 4E Subtotal 53,775 28,501 54,119 70, % 89.9% 30.7% 31.6% 5.2% 2.4% 4.6% 6.3% Alaska grand totals 1 1,041,330 1,193,162 1,178,222 1,125, % -1.3% -4.5% 8.1% 100.0% 100.0% 100.0% 100.0% 1 The sum of the harvests by geographic areas for 2003 reported here differs slightly from that reported in Table 8 in Fall et al (2004:50) due to rounding.
71 Table 8. of hooks usually fished, setline (stationary) gear, Alaska subsistence halibut fishery, Regulatory Area SHARC holders of Hooks Missing 2C 8, , , % 0.3% 0.4% 0.8% 0.5% 1.3% 0.2% 0.7% 0.3% 8.3% 0.0% 2.5% 0.0% 0.0% 8.2% 0.3% 0.2% 0.9% 0.1% 21.1% 0.2% 0.3% 0.2% 0.5% 8.0% 0.6% 0.5% 1.7% 0.5% 37.5% 3.8% Grand Total 1 3A 3, , % 0.5% 0.4% 0.8% 1.0% 0.5% 0.8% 0.4% 0.2% 7.0% 0.1% 2.2% 0.5% 0.0% 7.2% 0.4% 0.0% 0.9% 0.0% 19.5% 0.2% 0.0% 0.2% 0.4% 9.4% 0.4% 0.4% 1.2% 0.8% 39.8% 6.0% 3B % 4.9% 0.0% 1.9% 1.0% 1.0% 0.8% 0.0% 0.0% 11.2% 0.0% 0.9% 0.0% 0.0% 8.4% 0.0% 0.0% 0.0% 0.0% 13.4% 0.0% 0.0% 0.0% 0.0% 3.0% 0.0% 0.0% 0.0% 0.0% 43.1% 16.2% 4A % 0.0% 0.0% 0.0% 0.0% 0.0% 0.0% 0.0% 0.0% 9.4% 0.0% 4.2% 0.0% 10.1% 4.2% 3.1% 0.0% 0.0% 0.0% 10.5% 0.0% 0.0% 0.0% 0.0% 3.1% 0.0% 0.0% 0.0% 0.0% 55.3% 0.0% 4B % 0.0% 0.0% 0.0% 0.0% 0.0% 0.0% 0.0% 0.0% 15.8% 0.0% 0.0% 0.0% 0.0% 0.0% 0.0% 0.0% 0.0% 0.0% 21.1% 0.0% 0.0% 0.0% 0.0% 0.0% 0.0% 0.0% 0.0% 0.0% 0.0% 16.7% 4C % 0.0% 0.0% 0.0% 0.0% 0.0% 0.0% 0.0% 0.0% 0.0% 0.0% 0.0% 0.0% 0.0% 0.0% 0.0% 0.0% 0.0% 0.0% 0.0% 0.0% 0.0% 0.0% 0.0% 0.0% 0.0% 0.0% 0.0% 0.0% 50.0% 24.0% 4D % 0.0% 0.0% 0.0% 0.0% 0.0% 0.0% 0.0% 0.0% 0.0% 0.0% 0.0% 0.0% 0.0% 0.0% 0.0% 0.0% 0.0% 0.0% 71.4% 0.0% 0.0% 0.0% 0.0% 0.0% 0.0% 0.0% 0.0% 0.0% 14.3% 17.5% 4E 1, % 10.8% 1.6% 0.0% 0.0% 3.6% 0.0% 0.0% 0.0% 4.9% 0.0% 0.0% 0.0% 0.0% 3.7% 0.0% 0.0% 0.0% 0.0% 4.1% 0.0% 0.0% 0.0% 0.0% 6.5% 0.0% 0.0% 0.0% 0.0% 32.8% 22.0% 57 Alaska 14, , , % 0.7% 0.4% 0.8% 0.7% 1.0% 0.4% 0.5% 0.2% 7.9% 0.0% 2.3% 0.2% 0.1% 7.7% 0.3% 0.1% 0.8% 0.0% 20.2% 0.2% 0.2% 0.2% 0.5% 8.0% 0.5% 0.4% 1.5% 0.6% 38.3% 4.5% 1 of fishers using setline (fixed) gear. Based on location of tribe or rural community of SHARC holder. 2 The column for 30 hooks includes those fishers who reported using more than 30. There is no 30-hook limit in Areas 4C, 4D, or 4E. Source: Alaska Department of Fish and Game, Division of Subsistence, SHARC Survey, 2007.
72 Table 9. Average net weight of subsistence and sport harvested halibut, 2006, by regulatory area fished. Area 2 Subsistence Methods Sport Harvest 1 Total Pounds, Net Weight Average per fish Pounds, Net Weight Average per fish Pounds, Net Weight Average per fish 2C 25, , , , , , A 17, , ,723 99, , , B 2,401 48, , ,762 59, A 1,290 27, , ,503 30, B 122 2, , C 542 8, , D 233 8, , E 6,531 70, ,531 70, Alaska 54,089 1,125, , , ,308 1,348, Sport harvest of halibut by SHARC holders. 2 Area totals are based on the location of the harvest (see also Table 6 and Table 7). Source: Alaska Department of Fish and Game, Division of Subsistence, SHARC Survey,
73 Table 10. Estimated harvests of lingcod and rockfish by SHARC holders while subsistence fishing for halibut, by regulatory area and geographic subarea fish, Subarea Regulatory Area of SHARCs Estimated Lingcod Estimated Harvested Estimated Harvest Estimated Rockfish Estimated Harvested Southern Southeast Alaska 2C 1, ,517 Sitka LAMP Area 2C ,038 Northern Southeast Alaska 2C ,927 Area 2C Subtotal 2C 3, ,057 1,069 11,486 Yakutat Area 3A Prince William Sound 3A Cook Inlet 3A Kodiak Island Road System 3A ,826 Kodiak Island Other 3A Area 3A Subtotal 3A 1, ,977 Chignik Area 3B Lower Alaska Peninsula 3B Area 3B Subtotal 3B ,014 Eastern Aleutians - East 4A Eastern Aleutians - West 4A Area 4A Subtotal 4A Western Aleutians - East 4B Area 4B Subtotal 4B St. George Island 4C St. Paul Island 4C Area 4C Subtotal 4C St. Lawrence Island 4D Area 4D Subtotal 4D Bristol Bay 4E Yukon/Kuskokwim Delta 4E Norton Sound 4E Area 4E Subtotal 4E Alaska Grand Total 1 Alaska 5, ,486 1,529 16,945 1 Because fishers might fish in more than one area, subtotals for regulatory areas and the state total might exceed the sum of the subarea values. Source: Alaska Department of Fish and Game, Division of Subsistence, SHARC Survey,
74 Table 11. Estimated harvests of halibut by gear type and participation in subsistence and sport fisheries, selected Alaska communities, 2003, 2004, 2005, and Subsistence Harvests Setline (fixed) Gear Hand-Operated Gear Total Subsistence Harvest Sport Harvest 4 All Harvests 60 of SHARC Holders 2 Estimated Estimated Pounds Harvested Estimated Estimated Pounds Harvested Estimated Estimated Pounds Harvested Estimated Estimated Pounds Harvested Estimated Estimated Pounds Harvested Community Year Cordova , , , , , , , , , , , , , , , , , , , ,047 Kodiak , , , , , , , , , , , , , , , , ,455 1, , , , , , ,320 1, ,142 Petersburg , , , , , , , , , , , , , , , , , , , , , , , ,033 Port Graham , , , , , , , , , , , , , , , ,194 Sand Point , , , , , , , , , , , , , , , , , , ,514 Sitka , , , , , , , , , , ,829 1, , , , , , , , , , , , ,032 1, ,404 Toksook Bay , , , , , , , , , , , , , ,481 Tununak , , , , , , , , ,032 Unalaska , , , , , , , , , , , , , , , , , , , , For data on all communities for 2005, see Appendix Tables 4, 5, and 6. SHARC = Subsistence halibut registration certificate; includes all SHARC holders living in the community. Includes Dutch Harbor. Sport harvests by SHARC holders only.
75 Table 12. Estimated harvests of halibut for home use, Sitka. Pounds Usable (Net) Weight Year of Fishing Households Removed from Commercial Harvests Rod and Reel Other Methods 1 Total Total w/o Commercial Removal 95% confidence range (+/-%) ,252 12, , , , , ,048 14, , , Annual 1,098 14, ,015 14, , ,113 1 Harvest data not collected for "other methods" in Pertains to estimate of total harvests. Source: Scott et al Table 13. Estimated harvests of halibut for home use, Petersburg. Pounds Usable (Net) Weight Year of Fishing Households Removed from Commercial Harvests Rod and Reel Other Methods 1 Total Total w/o Commercial Removal 95% confidence range (+/-%) , , , , ,951 49, ,974 49, Annual 536 9,339 78, ,575 78,236 1 Harvest data not collected for "other methods" in Pertains to estimate of total harvests. Source: Scott et al. 2001; Division of Subsistence, ADF&G, Household Survey, Table 14. Estimated harvests of halibut for home use, Cordova. Pounds Usable (Net) Weight Year of Fishing Households Removed from Commercial Harvests Rod and Reel Other Methods Total Total w/o Commercial Removal 95% confidence range (+/-%) ,776 31,002 1,752 36,530 32, , , , , ,107 25, ,716 25, ,383 60, ,995 60, ,762 39,556 2,056 45,374 41, ,551 58,647 4,252 66,450 62, Annual ,047 55,864 1,421 68,331 57,285 1 Pertains to estimate of total harvests. Source: Scott et al
76 Table 15. Estimated harvests of halibut for home use, Port Graham. Pounds Usable (Net) Weight Year of Fishing Households Removed from Commercial Harvests Rod and Reel Other Methods Total Total w/o Commercial Removal 95% confidence range (+/-%) ,237 3,809 3,389 8,435 7, ,217 1,482 1,222 5,921 2, ,003 4,106 3,171 10,280 7, ,663 2,332 4,846 8,841 7, ,867 3,365 11,256 11, ,105 1,346 4,537 4, ,881 5,326 8,286 8, Annual average ,015 4,017 3,574 8,606 7,591 1 Excludes 1989, the year of the Exxon Valdez oil spill. 2 Pertains to estimate of total harvests. Source: Scott et al Table 16. Estimated harvests of halibut for home use, Kodiak Road System. Pounds Usable (Net) Weight Year of Fishing Households Removed from Commercial Harvests Rod and Reel Other Methods Total Total w/o Commercial Removal 95% confidence range (+/-%) ,404 NA NA NA 451, , ,178 48, ,692 40, , , ,178 89, ,345 18, , , , , ,391 31, , , Annual average 1,306 93, ,476 30, , ,682 1 Harvest data are available based on random samples drawn from the entire road system population for 1982 and Just Kodiak City was sampled in 1992 and Estimates for the entire road system population were developed for this table based on the known portion of the total road system harvest harvested by city residents in 1982 and Pertains to estimate of total harvests. Source: Scott et al
77 Table 17. removals in Alaska by regulatory area, Pounds Net Weight Area Commercial 1 Sport 2 Subsistence 3 Wastage Bycatch Total 2C 10,492,000 3,033, , , ,000 14,753,117 3A 25,714,000 6,088, , ,000 2,939,000 35,883,258 3B 10,792,000 11,000 48, ,000 1,264,000 12,598, ,149,000 63, , ,000 6,876,000 15,387,100 Alaska 55,147,000 9,195,000 1,145,022 1,715,000 11,420,000 78,622,022 1 Commercial catch includes IPHC research catch and in Area 2C, the Metlakatla fishery catch. 2 Projected harvests. 3 Includes 19,710 pounds of sublegal halibut legally retained by CDQ organizations in areas 4D and 4E for personal use. The subsistence harvest by SHARC holders was 1,128,015 pounds, including 117,405 pounds in Area 4. Sources: Gilroy 2007; Williams 2007; Division of Subsistence, ADF&G, SHARC Survey,
78 Table 18. Comparison of selected SHARC results, 2003, 2004, 2005 and 2006 study years. Response to Survey Study Years % Change Compared to Compared to Compared to Compared to Compared to 2003 of SHARCs Issued 11,635 13,813 14,306 14, % 3.6% 23.0% -0.7% 22.1% of Surveys 7,593 8,524 8,565 8, % 0.5% 12.8% -1.6% 11.0% Response Rate 65.3% 61.7% 59.9% 59.3% -5.4% -3.0% -8.3% -0.9% -9.1% Subsistence Fishing 64 Estimated of Subsistence Fishers 4,942 5,984 5,621 5, % -6.1% 13.7% 5.1% 19.6% Percent of All SHARC Holders Subsistence Fishing 42.5% 43.3% 39.3% 41.6% 2.0% -9.3% -7.5% 5.9% -2.1% Estimated of Subsistence 43,926 52,412 55,875 54, % 6.6% 27.2% -3.2% 23.1% Estimated Net Pounds of Subsistence 1,041,330 1,193,162 1,178,222 1,125, % -1.3% 13.1% -4.5% 8.1% Average Weight of Subsistence-Harvested % -7.3% -11.0% -1.4% -12.2% Average Harvest per Fisher, Fish % 13.5% 11.8% -7.9% 3.0% Average Harvest per Fisher, Net Pounds % 5.1% -0.5% -9.2% -9.6% Sport Fishing by SHARC Holders Estimated of Sport Fishers 2,580 3,107 3,147 2, % 1.3% 22.0% -8.0% 12.2% Percent of All SHARC Holders Sport Fishing 22.2% 22.5% 22.0% 20.4% 1.4% -2.2% -0.8% -7.4% -8.1% Estimated of Sport 10,784 12,530 14,096 11, % 12.5% 30.7% -20.4% 4.0% Estimated Net Pounds of Sport 245, , , , % 16.9% 19.3% -23.8% -9.1% Average Weight of Sport-Harvested % 3.8% -8.8% -4.2% -12.6% Average Harvest per Fisher, Fish % 11.1% 7.2% -13.5% -7.3% Average Harvest per Fisher, Net Pounds % 15.4% -2.2% -17.1% -18.9% Total of Fishers Estimated of Fishers, Subsistence or Sport 5,941 6,980 6,876 6, % -1.5% 15.7% 0.3% 16.1% Percent of Total SHARC Holders who 51.1% 50.5% 48.1% 48.6% -1.0% -4.9% -5.9% 1.0% -4.9% -continued-
79 Table 18. Page 2 of 2. Study Years % Change Compared to Compared to Compared to Compared to Compared to 2003 Incidental Rockfish Harvests of Rockfish Harvesters 1,239 1,616 1,544 1, % -4.5% 24.6% -1.0% 23.4% Percent of all SHARC Holders 10.6% 11.7% 10.8% 10.8% 9.9% -7.7% 1.4% -0.3% 1.1% Percent of all Subsistence Fishers 25.1% 27.0% 27.5% 25.9% 7.7% 1.7% 9.6% -5.8% 3.2% of Rockfish Harvested 14,870 19,001 12,395 16, % -34.8% -16.6% 36.7% 14.0% Average of Rockfish Harvested, All Subsistence Fishers % -30.6% -26.7% 30.0% -4.7% Average of Rockfish Harvested, Subsistence Fishers who Harvested Rockfish % -31.7% -33.1% 38.1% -7.6% 65 Incidental Lingcod Harvests of Lingcod Harvesters % -9.5% 23.3% 7.6% 32.7% Percent of all SHARC Holders 6.0% 6.9% 6.0% 6.5% 14.8% -12.7% 0.3% 8.4% 8.7% Percent of all Subsistence Fishers 14.1% 15.9% 15.3% 15.7% 12.6% -3.7% 8.4% 2.3% 11.0% of Lingcod Harvested 3,298 4,407 2,355 3, % -46.6% -28.6% 48.0% 5.7% Average of Lingcod Harvested, All Subsistence Fishers % -43.1% -37.2% 40.8% -11.6% Average of Lingcod Harvested, Subsistence Fishers who Harvested Lingcod % -40.9% -42.1% 37.6% -20.3% Sources: Fall et al. 2004, 2005, 2006; Alaska Department of Fish and Game, Division of Subsistence, SHARC Survey, 2007.
80 66
81 REPORT FIGURES 67

82 68 Figure 1. Regulatory areas for the Pacific halibut fishery.
83 Figure 2. of surveys returned and return rates for subsistence halibut surveys by SHARC type, Not 15,000 12,000 Return rate = 59% 69 of Surveys/SHARCs 9,000 6,000 Return Rate = 46% Return rate = 72% 3,000 0 Tribal SHARCs Rural SHARCs Total SHARCs
84 Figure 3. Subsistence halibut harvest survey return rates, communities and tribes with more than 100 SHARCs issued, % 95% Rural Communities Tribes 92% 66% 90% 80% 70% 83% 79% 79% 77% 69% 72% 75% 72% 72% 71% 70% 68% 65% 57% 52% 60% 57% 51% 50% 45% 45% 40% 30% 38% 35% 36% 37% 32% 26% 20% 10% 0% Kodiak (1,441) Sitka (1429) Petersburg (925) Cordova (534) Haines (432) Wrangell (367) Craig (323) Thorne Bay (139) Unalaska (120) Hoonah (115) Klawock (114) Seldovia (102) Ketchikan (887) CCTHI (725) Toksook Bay (532) Sitka (460) Metkakatla (403) Sand Point (318) Lesnoi (Kodiak) (259) St. Paul (254) Hoonah (217) Hydaburg (193) Shoonaq' (Kodiak) (184) Klawock (175) Angoon (141) Kake (130) Petersburg (125) Wrangell (113) 70
85 Figure 4. Return rate by place of residence, % 65% 72% 50% 71% 26% 75% 73% 33% 67% 32% 36% 54% 46% 94% 48% 97% 80% 61% 60% 73% 80% 64% Yakutat (113) Seldovia (123) Kake (167) Thorne Bay (135) Unalaska (171) Angoon (173) Hydaburg (194) Anchorage (235) St. Paul (244) Klawock (314) Sand Point (365) Hoonah (331) Craig (475) Metlakatla (419) 100% 90% 80% 70% 60% 50% 40% 30% Percentage of SHARCs Issued 20% 10% 0% Sitka (1895) Kodiak (1716) Petersburg (1082) Ketchikan (1014) Cordova (607) Toksook Bay (533) Haines (529) Wrangell (504) Juneau (485) 71
86 Figure 5. of survey responses by response category, First Mailing Second Mailing Third Mailing Staff Administered 9000 Return rate = 59% 8000 Return rate = 49% 7000 Return rate = 44% 72 of SHARC Surveys Return rate = 35% After First Mailing (2/16/2007) After Second Mailing (3/19/2007) After Third Mailing (4/18/2007) Adding Staff Administered Surveys
87 Figure 6. of SHARCs issued and estimated number of subsistence halibut fishers in Alaska by SHARC type, 2003, 2004, 2005, and ,000 13,813 14,306 14,206 12,000 11,635 10, of SHARCs 8,000 6,000 5,578 6,533 6,437 7,123 6,057 7,280 7,869 7,083 4,942 5,984 5,621 5,909 4,000 3,106 3,827 3,586 3,580 2,000 1,836 2,157 2,035 2,329 0 Tribal SHARCs Issued Est. of Subsistence Fishers Non-tribal Rural SHARCs Issued Est. of Subsistence Fishers Total SHARCs Issued Est. of Subsistence Fishers
88 Figure 7. Age of subsistence halibut registration certificate holders by SHARC Type, % Tribal Rural Grand Totals 12% 10% 74 Percentage of SHARC Holders 8% 6% 4% 2% 0% Age Cohort (Years)
89 Figure 8. Estimated number of subsistence halibut fishers, 2003, 2004, 2005, and 2006 by regulatory area of tribe or rural community. 4, ,500 3,082 3,552 3,219 3,298 3,000 2, ,000 1,650 1,657 1,729 1,500 1,185 1, Area 2C: Southeast Alaska Area 3A: Southcentral Alaska Area 3B: Alaska Peninsula Area 4A: Eastern Aleutians Area 4B: Western Aleutians Area 4C: Pribilof Islands Area 4D: Central Bering Sea Area 4E: East Bering Sea Coast
90 Figure 9. Estimated number of subsistence halibut fishers by place of residence (selected communities), 2003, 2004, 2005, and of Subsistence Fishers Kodiak Sitka Petersburg Cordova Craig Wrangell Haines Ketchikan Hoonah Klawock Sand Point Metlakatla Toksook Bay Juneau Unalaska/Dutch Harbor Seldovia Angoon Kipnuk Kake Yakutat Old Harbor Hydaburg Thorne Bay 76
91 Figure 10. Estimated subsistence harvest of halibut in Alaska, 2006, by regulatory area of tribe and rural community, in pounds net weight ,000 27,965 20,727 2,472 1,865 1,791 2,286 23,756 4,380 37,745 27,421 9,227 9,783 10,923 5,813 50,656 54,088 35,185 27,562 8,343 8,297 54,458 31,328 50,488 71, , , , , , , , , , , , , ,000 Pounds Net Weight 200, ,000 0 Area 2C: Southeast Alaska Area 3A: Southcentral Alaska Area 3B: Alaska Peninsula Area 4A: Eastern Aleutians Area 4B: Western Aleutians Area 4C: Pribilof Islands Area 4D: Central Bering Sea Area 4E: East Bering Sea Coast 77
92 Figure 11. Estimated Alaska subsistence halibut harvests in pounds net weight by SHARC type, 2003, 2004, 2005, and ,200,000 1,193,161 1,178,222 1,125,312 1,041,330 1,000, , Pounds Net Weight 600, , , , , , , , , , ,000 0 Tribal SHARC Holders Rural Resident SHARC Holders All SHARC Holders
93 Figure 12. Percentage of tribal subsistence halibut harvest by tribe, % 40% 35% 30% 25% 20% 15% 10% 5% 9.6% 8.4% 7.1% 6.1% 5.4% 5.2% 4.6% 0% 3.8% 2.5% 2.4% 2.3% 2.1% 2.1% 38.4% Angoon Akutan Sand Point Wrangell Kake All Other Tribes Percentage of Total Pounds Harvested Central Council THI Sitka Toksook Bay Shoonaq' Tribe of Kodiak Ketchikan Hoonah Klawock Hydaburg 79
94 Figure 13. Percentage of rural community subsistence halibut harvest by community, % 27.9% 25% 20% 15% 10% 5% 19.6% 7.7% 5.2% 5.1% 4.2% 3.4% 2.5% 2.0% 1.8% 1.6% 1.6% 0% 17.3% Percentage of Total Pounds Harvested KODIAK SITKA PETERSBURG CRAIG WRANGELL CORDOVA HAINES SELDOVIA KLAWOCK UNALASKA YAKUTAT THORNE BAY All Other Rural Communities 80
95 Figure 14. Percentage of subsistence halibut harvest by regulatory area fished, Area 4C-Pribilofs Area 4B-West 0.8% Aleutians 0.2% Area 4A-East Aleutians 2.4% Area 4D-Central Bering Sea 0.7% Area 4E-East Bering Sea Coast 6.3% Area 3B- AK Peninsula 4.3% Area 3A -Southcentral 33.7% Area 2C -Southeast 51.6% N= million lbs net w eight 81
96 YK Delta Norton Sound St. Lawrence Island Bristol Bay St. Paul Island St. George Island Western Aleutians - Other Figure 15. Alaska subsistence halibut harvests by geographic area, , , , , , ,000 Estimated Pounds Net Weight 50,000 0 Southern Southeast Alaska Northern Southeast Alaska Sitka LAMP Area Yakutat Area Prince William Sound Cook Inlet Kodiak Island Road System Kodiak Island Other Chignik Area Lower Alaska Peninsula Eastern Aleutians - East Eastern Aleutians - West Western Aleutians - East 82
97 Figure 16. Percentage of Alaska subsistence halibut harvest by geographic area, Prince William Sound 4.3% All Other Areas 10.2% Cook Inlet 5.3% Southern Southeast Alaska 27.4% YK Delta & Bristol Bay 6.3% Kodiak Island Other 9.9% Sitka LAMP Area 13.1% Kodiak Island Road System 12.5% Northern Southeast Alaska 11.1% N = 1, 12 5, 3 12 poun ds n et weight 83
98 Figure 17. Estimated subsistence halibut harvests, pounds net weight, by regulatory area fished, 2003, 2004, 2005, and ,000 27,477 21,197 2, ,351 2,761 22,881 4,380 33,519 28,877 9,734 7,716 10,923 5,848 46,225 48,547 35,615 27,062 8,527 8,297 53,775 28,501 54,119 70, , , , , , , , , , , , , ,000 Pounds Net Weight 200, ,000 0 Area 2C: Southeast Alaska Area 3A: Southcentral Alaska Area 3B: Alaska Peninsula Area 4A: Eastern Aleutians Area 4B: Western Aleutians Area 4C: Pribilof Islands Area 4D: Central Bering Sea Area 4E: East Bering Sea Coast 84
99 Figure 18. Change in Alaska subsistence halibut harvests from 2005 to 2006 by regulatory area fished. 130% 110% 104% 85 Change in Harvest (Pounds Net Weight) 90% 70% 50% 30% 10% 5% 11% 42% 31% -10% -3% -12% -4% -30% -24% -50% Area 2C: Southeast Alaska Area 3A: Southcentral Alaska Area 3B: Alaska Peninsula Area 4A: Eastern Aleutians Area 4B: Western Aleutians Area 4C: Area 4D: Pribilof Islands Central Bering Sea Area 4E: East Bering Sea Coast Alaska
100 Figure 19. Change in Alaska subsistence halibut harvests from 2003 to 2006 by regulatory area fished. 110% 90% 77% 89% 86 Change in Harvest (Pounds Net Weight) 70% 50% 30% 10% -10% -30% -7% 33% 28% 7% 32% 8% -50% -70% -63% -90% Area 2C: Southeast Alaska Area 3A: Southcentral Alaska Area 3B: Alaska Peninsula Area 4A: Eastern Aleutians Area 4B: Western Aleutians Area 4C: Pribilof Islands Area 4D: Central Bering Sea Area 4E: East Bering Sea Coast Alaska
101 Figure 20. Average subsistence harvest of halibut per fisher in Alaska, 2006, by regulatory area, in pounds net weight Pounds of, Net Weight, per Fisher Area 2C: Southeast Alaska Area 3A: Southcentral Alaska Area 3B: Alaska Peninsula Area 4A: Eastern Aleutians Area 4B: Western Aleutians Area 4C: Pribilof Islands Area 4D: Central Bering Sea Area 4E: East Bering Sea Coast Alaska
102 Figure 21. Average subsistence harvest of halibut per fisher in Alaska, 2006, by regulatory area, in number of fish of per Fisher Area 2C: Southeast Alaska Area 3A: Southcentral Alaska Area 3B: Alaska Peninsula Area 4A: Eastern Aleutians Area 4B: Western Aleutians Area 4C: Pribilof Islands Area 4D: Central Bering Sea Area 4E: East Bering Sea Coast Alaska
103 Figure 22. Alaska subsistence halibut harvests by place of residence, , , , , , ,000 80,000 60,000 40,000 20,000 0 KODIAK SITKA PETERSBURG CRAIG KETCHIKAN WRANGELL TOKSOOK BAY HOONAH KLAWOCK CORDOVA HAINES HYDABURG SAND POINT YAKUTAT SELDOVIA ANGOON ANCHORAGE KAKE Pounds Net Weight UNALASKA JUNEAU AKUTAN METLAKATLA THORNE BAY OLD HARBOR KIPNUK OUZINKIE PELICAN SAVOONGA CHENEGA BAY KING COVE PORT LIONS Other Alaska Non-Alaska 89
104 Figure 23. Percentage of subsistence halibut harvest by gear type by regulatory area, Setline (Stationary) Gear Hand-Operated Gear 100% 93% 90% 88% 83% 80% 79% 90 Percentage of Subsistence Harvest 70% 60% 50% 40% 30% 20% 17% 65% 35% 48% 52% 28% 72% 21% 48% 52% 70% 30% 12% 10% 7% 0% 2C 3A 3B 4A 4B 4C 4D 4E Alaska Regulatory Area
105 Figure 24. of hooks usually fished, percentage of fishers using setline (stationary) gear, Alaska subsistence halibut fishery, % 40% 38.3% 35% 91 Percentage of Fishers Using Setline Gear 30% 25% 20% 15% 20.2% 10% 7.9% 7.7% 8.0% 5% 0% 2.3% 0.7% 0.7% 0.4% 0.8% 0.7% 1.0% 0.4% 0.5% 0.2% 0.0% 0.2% 0.1% 0.3% 0.1% 0.8% 1.5% 0.0% 0.2% 0.2% 0.2% 0.5% 0.5% 0.4% 0.6% of Hooks Usually
106 Figure 25. Estimated incidental harvest of rockfish in the Alaska subsistence halibut fishery, 2003, 2004, 2005, and 2006 by regulatory area fished ,000 12,845 12,000 11,486 10,000 9, of Rockfish 8,000 6,000 7,764 5,090 4,000 3,548 3,638 3,977 2,000 0 Area 2C: Southeast Alaska Area 3A: Southcentral Alaska ,014 Area 3B: Alaska Peninsula Area 4A: Eastern Aleutians Area 4B: Western Aleutians Area 4C: Pribilof Islands Area 4D: Central Bering Sea Area 4E: East Bering Sea Coast
107 Figure 26. Percentage of incidental harvest of rockfish by regulatory area fished, Area 4A 1.5% Areas 4B,4C,4D,4E 1.3% Area 3B 6.0% 93 Area 3A 23.5% Area 2C 67.8% N = 16,945 rockfish
108 Figure 27. Estimated incidental harvest of lingcod in the Alaska subsistence halibut fishery, 2003, 2004, 2005 and 2006, by regulatory area fished. 3, ,500 2, ,685 1,311 1, ,057 2,000 of Lingcod 1,500 1, Area 2C: Southeast Alaska Area 3A: Southcentral Alaska 221 Area 3B: Alaska Peninsula Area 4A: Eastern Aleutians Area 4B: Western Aleutians Area 4C: Pribilof Islands Area 4D: Central Bering Sea Area 4E: East Bering Sea Coast
109 Figure 28. Percentage of incidental harvest of lingcod by regulatory area fished, Area 4A 1.5% Area 3B 6.3% Area 4B,4C,4D,4E 6.0% 95 Area 3A 27.2% Area 2C 59.0% N = 3,486 lingcod
110 Figure 29. Estimated harvests of halibut for home use, Port Graham. Noncommercial Harvest Removed from Commercial Harvest 14,000 12,000 10, Total Pounds, Net Weight 8,000 6,000 4,000 2,
111 Figure 30. removals, Alaska, Bycatch 14.5% Wastage 2.2% Subsistence 1.5% 97 Sport 11.7% N = million lbs, net weight Commercial 70.1%
112 Figure 31. removals in Alaska by regulatory area and removal category, Commercial Sport Subsistence Wastage Bycatch 100% 98 Percentage of Total Removals, Pounds Net Weight 90% 80% 70% 60% 50% 40% 30% 20% 10% 0% 85.7% 71.1% 71.7% 70.1% 53.0% 44.7% 20.6% 17.0% 14.5% 11.7% 10.0% 8.2% 3.9% 3.8% 2.1% 2.3% 1.1% 2.1% 0.1% 0.4% 0.4% 0.9% 1.1% 1.5% 2.2% 2C 3A 3B 4 Alaska Regulatory Area
113 APPENDIX A: LIST OF ELIGIBLE TRIBES AND RURAL COMMUNITIES (FROM FEDERAL REGISTER) 99

114
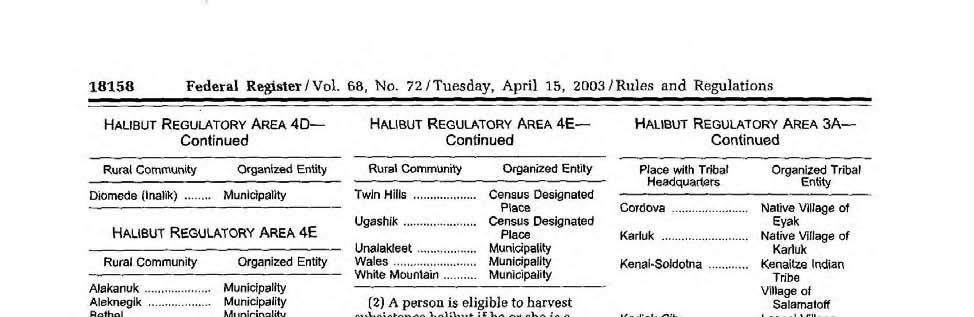

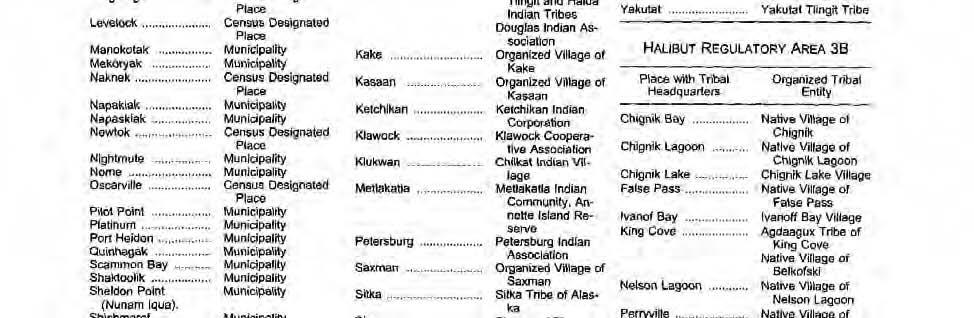
115


116
117 APPENDIX B: LETTER SENT TO TRIBES ABOUT THE PROJECT 103
118 SARAH PALIN, GOVERNOR DEPARTMENT OF FISH AND GAME DIVISION OF SUBSISTENCE 333 Raspberry Road ANCHORAGE, AK PHONE: (907) FAX: (907) December 21, 2006 TO: SUBJECT: Subsistence Fishing and Harvest Survey In December 2005, we informed you about the third year of the project conducted by the Division of Subsistence of ADF&G to estimate the subsistence harvests of halibut in Alaska. As part of a contract with the National Marine Fisheries Service (NMFS), in early 2006 we mailed a short (one-page) questionnaire to every person who obtained a subsistence halibut registration certificate (called a SHARC ) from NMFS. Through the survey, we collected information about participation in the fishery and the number of halibut, rockfish, and lingcod harvested for subsistence use in Participation in the survey was voluntary. Of the 14,306 SHARC holders, 8,565 (60%) completed the survey an excellent response. We have completed the final report for the project as part of our Technical Paper Series (No. 320). A copy will be mailed to you shortly. Enclosed is a short overview of the study findings. You can also obtain the overview and the complete report through the Division of Subsistence website at Please contact us if you have questions. We also wanted to let you know that we will be doing the survey again beginning in late January 2007, to collect information about subsistence halibut harvests in Again, we ll be mailing a short questionnaire to every SHARC holder, and asking them to voluntarily fill it out and send it back to us (we pay the postage). We will again compile the harvest information in a report to NMFS that will be available to tribes and to the public in late In our view, collecting and reporting accurate information about subsistence halibut harvests is important in supporting this fishery. In addition to mailing out the survey forms, Division of Subsistence staff plan to visit some communities in 2007 to provide information about the subsistence halibut fishery program, and to encourage subsistence fishers to obtain registration cards (SHARCs) and
119 return the surveys. We will of course coordinate these visits with tribal governments. We will also coordinate collection of subsistence halibut harvest information with other subsistence projects taking place in some communities, such as the collection of harbor seal and sea lion harvest data in communities of southeast, southcentral, and southwest Alaska. As we noted, an important feature of the subsistence halibut regulations is that eligible people who want to subsistence fish need to obtain a subsistence halibut registration certificate (called a SHARC for short). Applications are available from NMFS at the address below. People can also submit applications on the Internet by logging on to: and following the links to the subsistence halibut program. We encourage you to get the word out about this program to your tribal members who subsistence fish for halibut. More information about the subsistence halibut fishing program is available from NMFS as follows: On the Internet: By RAM.Alaska@noaa.gov By phone: (option #2) By mail: Alaska Region, National Marine Fisheries Service Restricted Access Management (RAM) Program PO Box Juneau, AK We will develop public notices about our subsistence halibut harvest survey within the next month or so, and will be contacting tribes in communities that we would like to visit. Again, the survey form itself will be mailed in late January. In the meantime, if you have questions about our project, please contact me (see below), or contact Jim Simon in our Fairbanks office ( ; james_simon@fishgame.state.ak.us) or Mike Turek in our Juneau office ( ; mike_turek@fishgame.state.ak.us ). Sincerely, James Fall Regional Program Manager jim_fall@fishgame.state.ak.us Enclosures: Subsistence Harvests of Pacific in Alaska, 2005 cc: Jim Simon, Mike Turek, Elizabeth Andrews
120 106
121 APPENDIX C: NEWSPAPER NOTICE 107

 issued regulations allowing the harvest of halibut for subsistence purposes.")


122 Notice to SUBSISTENCE HALIBUT FISHERS regarding MAIL-OUT HARVEST SURVEY All holders of Subsistence Registration Certificates (SHARCs) will receive a 1-page harvest survey in the mail from the Division of Subsistence, Alaska Department of Fish and Game on approximately February 5, You will be asked whether you subsistence fished for halibut in 2006 and how many halibut you harvested. Even if you did not fish, please complete the survey and return it to ADF&G. In April 2003, National Marine Fisheries Service (NMFS) issued regulations allowing the harvest of halibut for subsistence purposes. Residents of 117 rural Alaska communities and 123 Alaska Native tribes with customary and traditional uses of halibut are eligible to participate after they obtain a SHARC from NMFS. Accurate and complete subsistence harvest information is essential for proper management of the fishery and protection of future subsistence fishing opportunities. Please, fill out and return your survey form as soon as it arrives in the mail. Questions? Contact NMFS: by phone: (option #2) on the internet: by mail: Alaska Region, NMFS Restricted Access Management Program PO Box Juneau, Alaska Contact ADF&G, Division of Subsistence: by phone: by subsistence_halibut@fishgame.state.ak.us by mail: Division of Subsistence, ADF&G 333 Raspberry Road Anchorage, AK Thank you for support of this program!
123 APPENDIX D: SURVEY FORM 109
124
125 APPENDIX E: SURVEY INSTRUCTIONS 111
126 Instructions for Subsistence Harvest Survey, 2006 PLEASE COMPLETE AND RETURN THE SURVEY EVEN IF YOUR SHARC HAS EXPIRED Question 1. Mark yes even if you fished but were unsuccessful Questions 2 and 3. Include only those fish harvested by you, the individual fisher (SHARC holder). If you fished with someone else and split the catch, count only your share of the catch. Other household members who harvested halibut should fill out their own forms. Include fish that you harvested and kept for your household s use AND fish you harvested and gave away or traded. DO NOT include fish that you received from someone else. Identify both the number and pounds of halibut harvested; if you cannot provide both, please provide what you are able. Pounds should be ROUND (LIVE) WEIGHT. If you only know the dressed weight of your halibut harvest, record that number and make a note of dressed, head on (equals about 88% of round weight) or dressed, head off (equals about 75% of round weight). of hooks: write in the number that you use most often each time you set a line. That is, the number of hooks you usually have on your longline/skate. Water body, bay, or sound: record the general location where you did most of your subsistence halibut fishing (for example, Chiniak Bay, Sitka Sound ). If you used more than one general area for a significant portion of your catch, please provide the portion of your harvest from each. Question 4. DO NOT include all the lingcod and rockfish you harvested, but just those you harvested while subsistence halibut fishing. Rockfish means all fish of the genus Sebastes. These include fish with common English names such as red snapper, black bass, and sea bass. Rockfish DO NOT include sculpin, greenling, sablefish (black cod), tomcod, or Pacific cod. Please DO NOT include these other fish in your harvest estimates for rockfish. Questions 5 and 6. Sport fishing for halibut requires an Alaska sport fishing license. Sport fishers for halibut must fish with a line attached to a rod or pole. There is a limit of two hooks. The daily bag limit is two halibut and the possession limit is four halibut. Do you still have questions? Call the National Marine Fisheries Service at: (option 2); Or visit Or call ADF&G Division of Subsistence at: ; Or contact the Division of Subsistence via at: subsistence_halibut@fishgame.state.ak.us
127 APPENDIX F: RESPONSES TO FREQUENTLY ASKED QUESTIONS 113
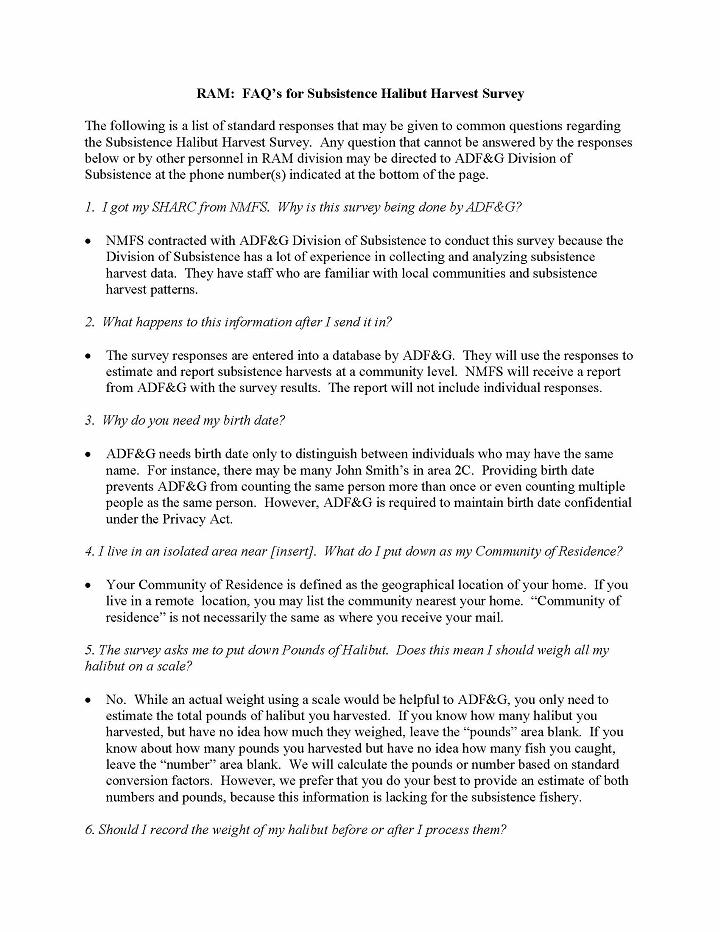
128

129

130
131 APPENDIX G: APPENDIX TABLES 117
132 Appendix Table 1. Results from returned surveys by eligible Alaska Tribe, eligible Alaska rural community, and place of residence, Return Rate Subsistence Subsistence Harvest Sport Sport Harvest Lingcod Bycatch Rockfish Bycatch Tribal Name 1 SHARCs Issued 2 Surveys Percent Respondents Percent Respondents Pounds 3 Respondents Percent Respondents Pounds 3 Respondents Lingcod Respondents Rockfish 118 AGDAAGUX TRIBE OF KING COVE % % % ANGOON COMMUNITY ASSOCIATION % % % AUKQUAN TRADITIONAL COUNCIL 2 CENTRAL COUNCIL TLINGIT AND HAIDA INDIAN TRIBES % % % CHEVAK NATIVE VILLAGE (KASHUNAMIUT) % % % CHIGNIK LAKE VILLAGE % % % CHILKAT INDIAN VILLAGE % % % CHILKOOT INDIAN ASSOCIATION % % % CHINIK ESKIMO COMMUNITY 1 CRAIG COMMUNITY ASSOCIATION % % % DOUGLAS INDIAN ASSOCIATION % % % EGEGIK VILLAGE % % % HOONAH INDIAN ASSOCIATION % % % HYDABURG COOPERATIVE ASSOCIATION % % % IVANOFF BAY VILLAGE % % % KENAITZE INDIAN TRIBE % % % KETCHIKAN INDIAN CORPORATION % % % KING ISLAND NATIVE COMMUNITY 2 KLAWOCK COOPERATIVE ASSOCIATION % % % LESNOI VILLAGE (WOODY ISLAND) % % % LEVELOCK VILLAGE 1 METLAKATLA INDIAN COMMUNITY, ANNETTE ISLAND RESE % % % NAKNEK NATIVE VILLAGE % % % NATIVE VILLAGE OF AFOGNAK % % % NATIVE VILLAGE OF AKHIOK % % % NATIVE VILLAGE OF AKUTAN % % % NATIVE VILLAGE OF ALEKNAGIK 5 NATIVE VILLAGE OF ATKA % % % NATIVE VILLAGE OF BELKOFSKI 2 NATIVE VILLAGE OF CHENEGA % % % NATIVE VILLAGE OF CHIGNIK % % % NATIVE VILLAGE OF CHIGNIK LAGOON % % % NATIVE VILLAGE OF COUNCIL 1 NATIVE VILLAGE OF DILLINGHAM (CURYUNG) % % % NATIVE VILLAGE OF EEK % % % NATIVE VILLAGE OF EKUK 3 NATIVE VILLAGE OF ELIM 1 NATIVE VILLAGE OF EYAK % % % NATIVE VILLAGE OF FALSE PASS % % % NATIVE VILLAGE OF GAMBELL % 0 0.0% % NATIVE VILLAGE OF GOODNEWS BAY (MUMTRAQ) % % % NATIVE VILLAGE OF HOOPER BAY % % % NATIVE VILLAGE OF KANAKANAK 1 NATIVE VILLAGE OF KARLUK 5 NATIVE VILLAGE OF KIPNUK % % % NATIVE VILLAGE OF KONGIGANAK % % % NATIVE VILLAGE OF KOYUK 1 NATIVE VILLAGE OF KWIGILLINGOK % % % NATIVE VILLAGE OF KWINHAGAK % % % NATIVE VILLAGE OF LARSEN BAY % % % NATIVE VILLAGE OF MEKORYUK % % % NATIVE VILLAGE OF NANWALEK % % % NATIVE VILLAGE OF NAPAKIAK 3 NATIVE VILLAGE OF NELSON LAGOON 3 NATIVE VILLAGE OF NIGHTMUTE % % % NATIVE VILLAGE OF NIKOLSKI % % % NATIVE VILLAGE OF OUZINKIE % % % continued-
133 Appendix Table 1. Page 2 of Tribal Name 1 SHARCs Surveys Percent Percent Pounds Percent Pounds Return Rate Subsistence Subsistence Harvest Sport Sport Harvest Lingcod Bycatch Rockfish Bycatch Issued 2 Respondents Respondents 3 Respondents Respondents 3 Respondents Lingcod Respondents Rockfish NATIVE VILLAGE OF PERRYVILLE % % % NATIVE VILLAGE OF PORT GRAHAM % % % NATIVE VILLAGE OF PORT HEIDEN 1 NATIVE VILLAGE OF PORT LIONS % % % NATIVE VILLAGE OF SAVOONGA % % % NATIVE VILLAGE OF SCAMMON BAY 5 NATIVE VILLAGE OF SHAKTOOLIK 1 NATIVE VILLAGE OF SHISHMAREF 1 NATIVE VILLAGE OF TATITLEK % % % NATIVE VILLAGE OF TOKSOOK BAY (NUNAKAUYAK) % % % NATIVE VILLAGE OF TUNUNAK % % % NATIVE VILLAGE OF UNALAKLEET % 0 0.0% % NATIVE VILLAGE OF UNGA % % % NATIVE VILLAGE OF WHITE MOUNTAIN 2 NEWTOK VILLAGE 3 NINILCHIK VILLAGE % % % NOME ESKIMO COMMUNITY % 0 0.0% % ORGANIZED VILLAGE OF KAKE % % % ORGANIZED VILLAGE OF KASAAN % % % ORGANIZED VILLAGE OF SAXMAN % % % ORUTSARARMUIT NATIVE VILLAGE % % % PAULOFF HARBOR VILLAGE % % % PETERSBURG INDIAN ASSOCIATION % % % PLATINUM TRADITIONAL VILLAGE 1 PRIBILOF ISLANDS ALEUT COMMUNITY OF ST GEORGE % % % PRIBILOF ISLANDS ALEUT COMMUNITY OF ST PAUL % % % QAGAN TAYAGUNGIN TRIBE OF SAND POINT VILLAGE % % % QAWALANGIN TRIBE OF UNALASKA % % % SELDOVIA VILLAGE TRIBE % % % SHOONAQ' TRIBE OF KODIAK % % % SITKA TRIBE OF ALASKA % % % SKAGWAY VILLAGE 2 SOUTH NAKNEK VILLAGE 2 STEBBINS COMMUNITY ASSOCIATION 4 TRADITIONAL VILLAGE OF TOGIAK % % % TWIN HILLS VILLAGE 1 UGASHIK VILLAGE 4 VILLAGE OF CHEFORNAK % % % VILLAGE OF CLARK'S POINT 3 VILLAGE OF KANATAK % % % VILLAGE OF OLD HARBOR % % % VILLAGE OF SALAMATOFF % % % WRANGELL COOPERATIVE ASSOCIATION % % % YAKUTAT TLINGIT TRIBE % % % Tribal Name Subtotals % % % Return Rate Subsistence Subsistence Harvest Rural Community 1 SHARCs Surveys Percent Percent Pounds Issued 2 Respondents Respondents 3 Respondents Sport Sport Harvest Lingcod Bycatch Rockfish Bycatch Percent Respondents Pounds 3 Respondents Lingcod Respondents ADAK % % % AKHIOK 1 AKUTAN 2 ALAKANUK 1 ALEKNAGIK 3 ANGOON % % % continued- Rockfish
134 Appendix Table 1. Page 3 of Rural Community 1 SHARCs Surveys Percent Percent Pounds Percent Pounds Return Rate Subsistence Subsistence Harvest Sport Sport Harvest Lingcod Bycatch Rockfish Bycatch Issued 2 Respondents Respondents 3 Respondents Respondents 3 Respondents Lingcod Respondents Rockfish BETHEL 4 CHEFORNAK 1 CHENEGA BAY % % % CHEVAK 3 CHIGNIK % % % CHIGNIK LAGOON % % % CHIGNIK LAKE 4 CLARKS POINT 1 COFFMAN COVE % % % COLD BAY % % % CORDOVA % % % CRAIG % % % DILLINGHAM % 1 2.7% % EDNA BAY % % % ELFIN COVE % % % EMMONAK 1 FALSE PASS 3 GUSTAVUS % % % HAINES % % % HOLLIS % % % HOONAH % % % HOOPER BAY 1 HYDABURG % % % HYDER % % % KAKE % % % KASAAN % % % KING COVE % % % KING SALMON 2 KLAWOCK % % % KLUKWAN 1 KODIAK % % % KOTLIK 1 KWIGILLINGOK 1 LARSEN BAY % % % MANOKOTAK 2 MEKORYUK 1 METLAKATLA % % % MEYERS CHUCK % % % NAKNEK % % % NANWALEK 4 NIGHTMUTE % % % NIKOLSKI % % % NOME % 0 0.0% % OLD HARBOR % % % OUZINKIE % % % PELICAN % % % PERRYVILLE 2 PETERSBURG % % % PLATINUM 1 PORT ALEXANDER % % % PORT GRAHAM % % % PORT HEIDEN 2 PORT LIONS % % % PORT PROTECTION % % % PT. BAKER % % % QUINHAGAK 2 SAND POINT % % % SAXMAN % % % continued-
135 Appendix Table 1. Page 4 of 6. Rural Community 1 SHARCs Surveys Percent Percent Pounds Percent Pounds Return Rate Subsistence Subsistence Harvest Sport Sport Harvest Lingcod Bycatch Rockfish Bycatch Issued 2 Respondents Respondents 3 Respondents Respondents 3 Respondents Lingcod Respondents Rockfish SELDOVIA % % % SHELDON POINT 1 SITKA % % % SKAGWAY % % % SOUTH NAKNEK 2 ST GEORGE ISLAND 1 ST PAUL ISLAND 1 TATITLEK % % % TELLER 3 TENAKEE SPRINGS % % % THORNE BAY % % % TOGIAK 3 TOKSOOK BAY 1 UNALASKA % % % WHALE PASS % % % WRANGELL % % % YAKUTAT % % % Rural Community Subtotals 7,083 5, % 2, % 20, ,516 1, % 6, , , ,622 TRIBAL/RURAL GRAND TOTALS 14,206 8, % 3, % 35, ,811 1, % 7, , , , City of Residence Return Rate Subsistence Subsistence Harvest SHARCs Issued 2 Surveys Percent Respondents Percent Respondents Pounds 3 Respondents Sport Sport Harvest Lingcod Bycatch Rockfish Bycatch Percent Respondents Pounds 3 Respondents Lingcod Respondents ADAK % % % AKHIOK % % % AKUTAN % % % ALAKANUK 1 ALEKNAGIK 4 ANCHOR POINT % 0 0.0% % ANCHORAGE % % % ANGOON % % % ATKA 4 AUKE BAY 3 BARROW 1 BETHEL % % % BIG LAKE 2 CHEFORNAK % % % CHENEGA BAY % % % CHEVAK % % % CHIGNIK % % % CHIGNIK BAY 3 CHIGNIK LAGOON % % % CHIGNIK LAKE % % % CHINIAK % % % CHUGIAK % % % CLARKS POINT 4 COFFMAN COVE % % % COLD BAY % % % CORDOVA % % % CRAIG % % % DILLINGHAM % % % DOUGLAS % % % DUTCH HARBOR % % % EAGLE RIVER % % % Rockfish -continued-
136 Appendix Table 1. Page 5 of City of Residence SHARCs Issued 2 Return Rate Subsistence Subsistence Harvest Sport Sport Harvest Lingcod Bycatch Rockfish Bycatch Surveys Percent Respondents Percent Respondents Pounds 3 Respondents Percent Respondents Pounds 3 Respondents Lingcod Respondents EDNA BAY % % % EEK % % % ELFIN COVE % % % EXCURSION INLET 2 FAIRBANKS % 0 0.0% % FALSE PASS % % % FRITZ CREEK 2 GAMBELL % 0 0.0% % GOLOVIN 1 GOODNEWS BAY % % % GUSTAVUS % % % HAINES % % % HOLLIS 5 HOMER % % % HOONAH % % % HOOPER BAY % % % HYDABURG % % % HYDER % % % JUNEAU % % % KAKE % % % KARLUK 1 KASAAN % % % KASILOF % % % KENAI % % % KETCHIKAN % % % KING COVE % % % KING SALMON 2 KIPNUK % % % KLAWOCK % % % KODIAK % % % KONGIGANAK % % % KWIGILLINGOK % % % LARSEN BAY % % % MANOKOTAK 2 MARSHALL 1 MEKORYUK % % % METLAKATLA % % % MEYERS CHUCK % % % NAKNEK % % % NANWALEK % % % NAPAKIAK 3 NAUKATI % % % NELSON LAGOON 1 NEWTOK 3 NIGHTMUTE % % % NIKISKI % % % NIKOLSKI % % % NINILCHIK % % % NOME % 0 0.0% % NORTH POLE 3 OLD HARBOR % % % OUZINKIE % % % PALMER 5 PELICAN % % % PERRYVILLE % % % PETERSBURG % % % PLATINUM 1 Rockfish -continued-
137 Appendix Table 1. Page 6 of City of Residence SHARCs Issued 2 Return Rate Subsistence Subsistence Harvest Sport Sport Harvest Lingcod Bycatch Rockfish Bycatch Surveys Percent Respondents Percent Respondents Pounds 3 Respondents Percent Respondents Pounds 3 Respondents Lingcod Respondents POINT BAKER % % % PORT ALEXANDER % % % PORT GRAHAM % % % PORT HEIDEN 1 PORT LIONS % % % PORT PROTECTION 1 PORT WILLIAM 2 QUINHAGAK % % % SAND POINT % % % SAVOONGA % % % SAXMAN % % % SCAMMON BAY 2 SELDOVIA % % % SEWARD % % % SHISHMAREF 1 SITKA % % % SKAGWAY % % % SOLDOTNA % % % SOUTH NAKNEK 3 ST GEORGE ISLAND % % % ST PAUL ISLAND % % % STERLING 4 SUTTON 1 TATITLEK % % % TELLER 3 TENAKEE SPRINGS % % % THORNE BAY % % % TOGIAK % % % TOKSOOK BAY % % % TRAPPER CREEK 1 TUNUNAK % % % TWIN HILLS 2 UNALAKLEET 1 UNALASKA % % % VALDEZ % % % WARD COVE % % % WASILLA % % % WHALE PASS 2 WHITE MOUNTAIN 1 WHITTIER 1 WILLOW 1 WRANGELL % % % YAKUTAT % % % Rockfish Alaska Totals % % % Non-Alaska Totals % 4 7.4% % CITY GRAND TOTALS % % % To protect confidentiality, data for tribes and communities with 5 or fewer SHARCs issued are not reported in this table. Tribal and community subtotals included all tribes and communities. 2 SHARC=subsistence halibut registration certificate 3 Pounds round weight, as reported by respondents; converted to pounds net weight in other tables. Net weight=75% of round weight. 4 Note that members of eligible Alaska tribes could obtain SHARCs regardless of their place of residence. All non-alaska resident SHARC holders were members of eligible tribes.
138 Appendix Table 2. Reported harvests of halibut in number of fish by return category, eligible Alaska Tribe, eligible Alaska rural community, and community of residence, Tribal Name 1 Subsistence First Mailing Response of Harvested Mean, All Mean, Those Who Second Mailing Response Subsistence of Harvested Mean, All Mean, Those Who Subsistence Third Mailing Response of Mean, All Harvested Mean, Those Who Subsistence Staff Administered of Mean, All Harvested AGDAAGUX TRIBE OF KING COVE ANGOON COMMUNITY ASSOCIATION AUKQUAN TRADITIONAL COUNCIL CENTRAL COUNCIL TLINGIT AND HAIDA INDIAN TRIBE CHEVAK NATIVE VILLAGE (KASHUNAMIUT) CHIGNIK LAKE VILLAGE CHILKAT INDIAN VILLAGE CHILKOOT INDIAN ASSOCIATION CHINIK ESKIMO COMMUNITY CRAIG COMMUNITY ASSOCIATION DOUGLAS INDIAN ASSOCIATION EGEGIK VILLAGE HOONAH INDIAN ASSOCIATION HYDABURG COOPERATIVE ASSOCIATION IVANOFF BAY VILLAGE KENAITZE INDIAN TRIBE KETCHIKAN INDIAN CORPORATION KING ISLAND NATIVE COMMUNITY KLAWOCK COOPERATIVE ASSOCIATION LESNOI VILLAGE (WOODY ISLAND) LEVELOCK VILLAGE METLAKATLA INDIAN COMMUNITY NAKNEK NATIVE VILLAGE NATIVE VILLAGE OF AFOGNAK NATIVE VILLAGE OF AKHIOK NATIVE VILLAGE OF AKUTAN NATIVE VILLAGE OF ALEKNAGIK NATIVE VILLAGE OF ATKA NATIVE VILLAGE OF BELKOFSKI NATIVE VILLAGE OF CHENEGA NATIVE VILLAGE OF CHIGNIK NATIVE VILLAGE OF CHIGNIK LAGOON NATIVE VILLAGE OF COUNCIL NATIVE VILLAGE OF DILLINGHAM (CURYUNG) NATIVE VILLAGE OF EEK NATIVE VILLAGE OF EKUK NATIVE VILLAGE OF ELIM NATIVE VILLAGE OF EYAK NATIVE VILLAGE OF FALSE PASS NATIVE VILLAGE OF GAMBELL NATIVE VILLAGE OF GOODNEWS BAY (MUMTRAQ) NATIVE VILLAGE OF HOOPER BAY NATIVE VILLAGE OF KANAKANAK NATIVE VILLAGE OF KARLUK NATIVE VILLAGE OF KIPNUK NATIVE VILLAGE OF KONGIGANAK NATIVE VILLAGE OF KOYUK NATIVE VILLAGE OF KWIGILLINGOK NATIVE VILLAGE OF KWINHAGAK NATIVE VILLAGE OF LARSEN BAY NATIVE VILLAGE OF MEKORYUK NATIVE VILLAGE OF NANWALEK NATIVE VILLAGE OF NAPAKIAK NATIVE VILLAGE OF NELSON LAGOON NATIVE VILLAGE OF NIGHTMUTE NATIVE VILLAGE OF NIKOLSKI NATIVE VILLAGE OF OUZINKIE NATIVE VILLAGE OF PERRYVILLE continued- Mean, Those Who
139 Appendix Table 2. Page 2 of Tribal Name 1 Subsistence First Mailing Response of Harvested Mean, All Mean, Those Who Second Mailing Response Subsistence of Harvested Mean, All Mean, Those Who Subsistence Third Mailing Response of Mean, All Harvested Mean, Those Who Subsistence Staff Administered of Mean, All Harvested NATIVE VILLAGE OF PORT GRAHAM NATIVE VILLAGE OF PORT HEIDEN NATIVE VILLAGE OF PORT LIONS NATIVE VILLAGE OF SAVOONGA NATIVE VILLAGE OF SCAMMON BAY NATIVE VILLAGE OF SHAKTOOLIK NATIVE VILLAGE OF SHISHMAREF NATIVE VILLAGE OF TATITLEK NATIVE VILLAGE OF TOKSOOK BAY (NUNAKAUYAK) , NATIVE VILLAGE OF TUNUNAK NATIVE VILLAGE OF UNALAKLEET NATIVE VILLAGE OF UNGA NATIVE VILLAGE OF WHITE MOUNTAIN NEWTOK VILLAGE NINILCHIK VILLAGE NOME ESKIMO COMMUNITY ORGANIZED VILLAGE OF KAKE ORGANIZED VILLAGE OF KASAAN ORGANIZED VILLAGE OF SAXMAN ORUTSARARMUIT NATIVE VILLAGE PAULOFF HARBOR VILLAGE PETERSBURG INDIAN ASSOCIATION PLATINUM TRADITIONAL VILLAGE PRIBILOF ISLANDS ALEUT COMMUNITY OF ST GEORG PRIBILOF ISLANDS ALEUT COMMUNITY OF ST PAUL QAGAN TAYAGUNGIN TRIBE OF SAND POINT VILLAGE QAWALANGIN TRIBE OF UNALASKA SELDOVIA VILLAGE TRIBE SHOONAQ' TRIBE OF KODIAK SITKA TRIBE OF ALASKA SKAGWAY VILLAGE SOUTH NAKNEK VILLAGE STEBBINS COMMUNITY ASSOCIATION TRADITIONAL VILLAGE OF TOGIAK TWIN HILLS VILLAGE UGASHIK VILLAGE VILLAGE OF CHEFORNAK VILLAGE OF CLARK'S POINT VILLAGE OF KANATAK VILLAGE OF OLD HARBOR VILLAGE OF SALAMATOFF WRANGELL COOPERATIVE ASSOCIATION YAKUTAT TLINGIT TRIBE Mean, Those Who Tribal Name Subtotals 1, , , , , Rural Community 1 Subsistence First Mailing Response of Harvested Mean, All Mean, Those Who Second Mailing Response Subsistence of Harvested Mean, All Mean, Those Who Subsistence Third Mailing Response of Mean, All Harvested Mean, Those Who Subsistence Staff Administered of Mean, All Harvested ADAK AKHIOK AKUTAN ALAKANUK ALEKNAGIK -continued- Mean, Those Who
140 Appendix Table 2. Page 3 of Rural Community 1 Subsistence First Mailing Response Second Mailing Response Third Mailing Response of Harvested Mean, All Mean, Those Who Subsistence of Harvested Mean, All Mean, Those Who Subsistence of Harvested Mean, All Mean, Those Who Subsistence Staff Administered of Mean, All Harvested ANGOON ATKA BETHEL CHEFORNAK CHENEGA BAY CHEVAK CHIGNIK CHIGNIK LAGOON CHIGNIK LAKE CLARKS POINT COFFMAN COVE COLD BAY CORDOVA CRAIG DILLINGHAM EDNA BAY ELFIN COVE EMMONAK FALSE PASS GUSTAVUS HAINES HOLLIS HOONAH HOOPER BAY HYDABURG HYDER KAKE KASAAN KING COVE KING SALMON KLAWOCK KLUKWAN KODIAK , KOTLIK KWIGILLINGOK LARSEN BAY MANOKOTAK MEKORYUK METLAKATLA MEYERS CHUCK NAKNEK NANWALEK NIGHTMUTE NIKOLSKI NOME OLD HARBOR OUZINKIE PELICAN PERRYVILLE PETERSBURG , PLATINUM PORT ALEXANDER PORT GRAHAM PORT HEIDEN PORT LIONS PORT PROTECTION PT. BAKER QUINHAGAK -continued- Mean, Those Who
141 Appendix Table 2. Page 4 of 6. Rural Community 1 Subsistence First Mailing Response Second Mailing Response Third Mailing Response Staff Administered of Harvested Mean, All Mean, Those Who Subsistence of Harvested Mean, All Mean, Those Who Subsistence of Mean, All Harvested Mean, Those Who Subsistence of Mean, All Harvested SAND POINT SAXMAN SELDOVIA SHELDON POINT SITKA , SKAGWAY SOUTH NAKNEK ST GEORGE ISLAND ST PAUL ISLAND TATITLEK TELLER TENAKEE SPRINGS THORNE BAY TOGIAK TOKSOOK BAY UNALASKA WHALE PASS WRANGELL , YAKUTAT Mean, Those Who Rural Community Subtotals 3,449 1,862 14, , , , TRIBAL/RURAL GRAND TOTALS 4,909 2,464 20, , , , , , Place of Residence 1 Subsistence First Mailing Response of Harvested Mean, All Mean, Those Who Second Mailing Response Subsistence of Harvested Mean, All Mean, Those Who Subsistence Third Mailing Response of Mean, All Harvested Mean, Those Who Subsistence Staff Administered of Mean, All Harvested ADAK AKHIOK AKUTAN ALAKANUK ALEKNAGIK ANCHOR POINT ANCHORAGE ANGOON ATKA AUKE BAY BARROW BETHEL BIG LAKE CHEFORNAK CHENEGA BAY CHEVAK CHIGNIK CHIGNIK BAY CHIGNIK LAGOON CHIGNIK LAKE CHINIAK CHUGIAK CLARKS POINT COFFMAN COVE COLD BAY CORDOVA CRAIG continued- Mean, Those Who
142 Appendix Table 2. Page 5 of Place of Residence 1 Subsistence First Mailing Response Second Mailing Response Third Mailing Response of Harvested Mean, All Mean, Those Who Subsistence of Harvested Mean, All Mean, Those Who Subsistence of Mean, All Harvested Mean, Those Who Subsistence Staff Administered of Mean, All Harvested DILLINGHAM DOUGLAS DUTCH HARBOR EAGLE RIVER EDNA BAY EEK ELFIN COVE EXCURSION INLET FAIRBANKS FALSE PASS FRITZ CREEK GAMBELL GOLOVIN GOODNEWS BAY GUSTAVUS HAINES HOLLIS HOMER HOONAH HOOPER BAY HYDABURG HYDER JUNEAU KAKE KARLUK KASAAN KASILOF KENAI KETCHIKAN KING COVE KING SALMON KIPNUK KLAWOCK KODIAK KONGIGANAK KWIGILLINGOK LARSEN BAY MANOKOTAK MARSHALL MEKORYUK METLAKATLA MEYERS CHUCK NAKNEK NANWALEK NAPAKIAK NAUKATI NELSON LAGOON NEWTOK NIGHTMUTE NIKISKI NIKOLSKI NINILCHIK NOME NORTH POLE OLD HARBOR OUZINKIE PALMER PELICAN Mean, Those Who -continued-
143 Appendix Table 2. Page 6 of Place of Residence 1 Subsistence First Mailing Response Second Mailing Response Third Mailing Response Staff Administered of Harvested Mean, All Mean, Those Who Subsistence of Harvested Mean, All Mean, Those Who Subsistence of Harvested Mean, All Mean, Those Who Subsistence of Mean, All Harvested PERRYVILLE PETERSBURG PLATINUM POINT BAKER PORT ALEXANDER PORT GRAHAM PORT HEIDEN PORT LIONS PORT PROTECTION PORT WILLIAM QUINHAGAK SAND POINT SAVOONGA SAXMAN SCAMMON BAY SELDOVIA SEWARD SHISHMAREF SITKA SKAGWAY SOLDOTNA SOUTH NAKNEK ST GEORGE ISLAND ST PAUL ISLAND STERLING SUTTON TATITLEK TELLER TENAKEE SPRINGS THORNE BAY TOGIAK TOKSOOK BAY TRAPPER CREEK TUNUNAK TWIN HILLS UNALAKLEET UNALASKA VALDEZ WARD COVE WASILLA WHALE PASS WHITE MOUNTAIN WHITTIER WILLOW WRANGELL YAKUTAT Mean, Those Who Alaska Subtotal Non-Alaska Subtotal PLACE OF RESIDENCE GRAND TOTALS 4,888 2,459 20, , , , , , To protect confidentiality, data for tribes or communities with five or fewer SHARCs issued are not reported in this table. Subtotals and totals include all tribes and communities. 2 Note that members of eligible Alaska tribes could obtain SHARCs regardless of their place of residence. All non-alaska resident SHARC holders were members of eligible tribes. Source: Alaska Department of Fish and Game, Division of Subsistence, SHARC Survey, 2006.
144 Appendix Table 3. Estimated Alaska subsistence harvests of halibut by eligible Alaska Tribe and eligible Alaska Rural community, by gear type and regulatory area in number of fish and pounds net weight, Set Hook Gear Hook & Line or Handline All Gear Tribal Name 1 of Estimated Estimated Estimated Estimated Estimated Estimated Estimated Estimated Confidence Estimated Confidence Regulatory SHARCs Pounds Pounds Interval for Pounds Interval for Area Issued 2 Respondents Harvested Harvested 3 Respondents Harvested Harvested 3 Respondents Harvested of Harvested 3 Pounds of ANGOON COMMUNITY ASSOCIATION 2C , , % 12, % AUKQUAN TRADITIONAL COUNCIL 2C 2 CENTRAL COUNCIL TLINGIT AND HAIDA INDIAN TRIBES 2C ,616 37, , , % 49, % CHILKAT INDIAN VILLAGE 2C % % CHILKOOT INDIAN ASSOCIATION 2C , % 2, % CRAIG COMMUNITY ASSOCIATION 2C , % 4, % DOUGLAS INDIAN ASSOCIATION 2C % % HOONAH INDIAN ASSOCIATION 2C , , , % 26, % HYDABURG COOPERATIVE ASSOCIATION 2C , , % 19, % KETCHIKAN INDIAN CORPORATION 2C ,021 21, , , % 27, % KLAWOCK COOPERATIVE ASSOCIATION 2C , , % 23, % METLAKATLA INDIAN COMMUNITY, ANNETTE ISLAND RESERVE 2C , , % 6, % ORGANIZED VILLAGE OF KAKE 2C , % 10, % ORGANIZED VILLAGE OF KASAAN 2C , % 1, % ORGANIZED VILLAGE OF SAXMAN 2C , % 2, % PETERSBURG INDIAN ASSOCIATION 2C , , % 5, % SITKA TRIBE OF ALASKA 2C ,248 38, , , % 42, % SKAGWAY VILLAGE 2C 2 WRANGELL COOPERATIVE ASSOCIATION 2C , , % 10, % 2C 3, , , ,157 41,413 1,085 10, % 247, % KENAITZE INDIAN TRIBE 3A , % 4, % LESNOI VILLAGE (WOODY ISLAND) 3A , % 4, % NATIVE VILLAGE OF AFOGNAK 3A % 1, % NATIVE VILLAGE OF AKHIOK 3A , % 4, % NATIVE VILLAGE OF CHENEGA 3A , , % 5, % NATIVE VILLAGE OF EYAK 3A , % 3, % NATIVE VILLAGE OF KARLUK 3A 5 NATIVE VILLAGE OF LARSEN BAY 3A , , % 6, % NATIVE VILLAGE OF NANWALEK 3A , % 3, % NATIVE VILLAGE OF OUZINKIE 3A , , % 7, % NATIVE VILLAGE OF PORT GRAHAM 3A , , % 5, % NATIVE VILLAGE OF PORT LIONS 3A , , % 7, % NATIVE VILLAGE OF TATITLEK 3A , % 6, % NINILCHIK VILLAGE 3A , , % 5, % SELDOVIA VILLAGE TRIBE 3A , , % 7, % SHOONAQ' TRIBE OF KODIAK 3A , , , % 31, % VILLAGE OF OLD HARBOR 3A , % 5, % VILLAGE OF SALAMATOFF 3A , % 2, % YAKUTAT TLINGIT TRIBE 3A , % 8, % 3A 1, ,254 76, ,359 46, , % 122, % AGDAAGUX TRIBE OF KING COVE 3B , , % 6, % CHIGNIK LAKE VILLAGE 3B % % IVANOFF BAY VILLAGE 3B % % NATIVE VILLAGE OF BELKOFSKI 3B 2 NATIVE VILLAGE OF CHIGNIK 3B % 1, % NATIVE VILLAGE OF CHIGNIK LAGOON 3B , , % 8, % NATIVE VILLAGE OF FALSE PASS 3B % 0 0.0% NATIVE VILLAGE OF NELSON LAGOON 3B 3 NATIVE VILLAGE OF PERRYVILLE 3B , % 5, % NATIVE VILLAGE OF UNGA 3B , % 1, % PAULOFF HARBOR VILLAGE 3B , % 6, % QAGAN TAYAGUNGIN TRIBE OF SAND POINT VILLAGE 3B , , % 11, % VILLAGE OF KANATAK 3B % % 3B ,105 23, , , % 42, % NATIVE VILLAGE OF AKUTAN 4A , , % 12, % NATIVE VILLAGE OF NIKOLSKI 4A % 0 0.0% QAWALANGIN TRIBE OF UNALASKA 4A , % 1, % 4A , , % 13, % NATIVE VILLAGE OF ATKA 4B , % 1, % 4B , % 1, % -continued-
145 Appendix Table 3. Page 2 of Set Hook Gear Hook & Line or Handline All Gear Tribal Name 1 of Estimated Estimated Estimated Estimated Estimated Estimated Estimated Estimated Confidence Estimated Confidence Regulatory SHARCs Pounds Pounds Interval for Pounds Interval for Area Issued 2 Respondents Harvested Harvested 3 Respondents Harvested Harvested 3 Respondents Harvested of Harvested 3 Pounds of PRIBILOF ISLANDS ALEUT COMMUNITY OF ST GEORGE 4C , % 3, % PRIBILOF ISLANDS ALEUT COMMUNITY OF ST PAUL 4C , % 4, % 4C , , % 8, % NATIVE VILLAGE OF GAMBELL 4D % 0 0.0% NATIVE VILLAGE OF SAVOONGA 4D , % 8, % 4D , % 8, % CHEVAK NATIVE VILLAGE (KASHUNAMIUT) 4E % % CHINIK ESKIMO COMMUNITY 4E 1 EGEGIK VILLAGE 4E % % KING ISLAND NATIVE COMMUNITY 4E 2 LEVELOCK VILLAGE 4E 1 NAKNEK NATIVE VILLAGE 4E % % NATIVE VILLAGE OF ALEKNAGIK 4E 5 NATIVE VILLAGE OF COUNCIL 4E 1 NATIVE VILLAGE OF DILLINGHAM (CURYUNG) 4E % % NATIVE VILLAGE OF EEK 4E , % 1, % NATIVE VILLAGE OF EKUK 4E 3 NATIVE VILLAGE OF ELIM 4E 1 NATIVE VILLAGE OF GOODNEWS BAY (MUMTRAQ) 4E % % NATIVE VILLAGE OF HOOPER BAY 4E % % NATIVE VILLAGE OF KANAKANAK 4E 1 NATIVE VILLAGE OF KIPNUK 4E , % 8, % NATIVE VILLAGE OF KONGIGANAK 4E , % 1, % NATIVE VILLAGE OF KOYUK 4E 1 NATIVE VILLAGE OF KWIGILLINGOK 4E , % 2, % NATIVE VILLAGE OF KWINHAGAK 4E % % NATIVE VILLAGE OF MEKORYUK 4E , % 1, % NATIVE VILLAGE OF NAPAKIAK 4E 3 NATIVE VILLAGE OF NIGHTMUTE 4E % 0 0.0% NATIVE VILLAGE OF PORT HEIDEN 4E 1 NATIVE VILLAGE OF SCAMMON BAY 4E 5 NATIVE VILLAGE OF SHAKTOOLIK 4E 1 NATIVE VILLAGE OF SHISHMAREF 4E 1 NATIVE VILLAGE OF TOKSOOK BAY (NUNAKAUYAK) 4E , ,756 34, , % 36, % NATIVE VILLAGE OF TUNUNAK 4E , % 4, % NATIVE VILLAGE OF UNALAKLEET 4E % 0 0.0% NATIVE VILLAGE OF WHITE MOUNTAIN 4E 2 NEWTOK VILLAGE 4E 3 NOME ESKIMO COMMUNITY 4E % 0 0.0% ORUTSARARMUIT NATIVE VILLAGE 4E , , % 2, % PLATINUM TRADITIONAL VILLAGE 4E 1 SOUTH NAKNEK VILLAGE 4E 2 STEBBINS COMMUNITY ASSOCIATION 4E 4 TRADITIONAL VILLAGE OF TOGIAK 4E % 0 0.0% TWIN HILLS VILLAGE 4E 1 UGASHIK VILLAGE 4E 4 VILLAGE OF CHEFORNAK 4E , % 2, % VILLAGE OF CLARK'S POINT 4E 3 4E 1, , ,664 59, , % 66, % Tribal Name Subtotals All Regulatory Areas 7,123 1,430 13, ,849 1,397 11, ,890 2,329 25, % 510, % Set Hook Gear Hook & Line or Handline All Gear Rural Community 1 of Estimated Estimated Estimated Estimated Estimated Estimated Estimated Estimated Confidence Estimated Confidence Regulatory SHARCs Pounds Pounds Interval for Pounds Interval for Area Issued 2 Respondents Harvested Harvested 3 Respondents Harvested Harvested 3 Respondents Harvested of Harvested 3 Pounds of ANGOON 2C , % 3, % COFFMAN COVE 2C , , % 3, % -continued-
146 Appendix Table 3. Page 3 of Set Hook Gear Hook & Line or Handline All Gear Rural Community 1 of Estimated Estimated Estimated Estimated Estimated Estimated Estimated Estimated Confidence Estimated Confidence Regulatory SHARCs Pounds Pounds Interval for Pounds Interval for Area Issued 2 Respondents Harvested Harvested 3 Respondents Harvested Harvested 3 Respondents Harvested of Harvested 3 Pounds of CRAIG 2C ,423 28, , , % 32, % EDNA BAY 2C , % 4, % ELFIN COVE 2C % % GUSTAVUS 2C , , % 6, % HAINES 2C , , % 20, % HOLLIS 2C , , % 5, % HOONAH 2C , , % 8, % HYDABURG 2C , % 1, % HYDER 2C , % 2, % KAKE 2C , % 5, % KASAAN 2C % % KLAWOCK 2C , , % 11, % KLUKWAN 2C 1 METLAKATLA 2C , % 3, % MEYERS CHUCK 2C % % PELICAN 2C , , % 5, % PETERSBURG 2C ,693 31, , , % 47, % PORT ALEXANDER 2C , % 1, % PORT PROTECTION 2C , % 1, % PT. BAKER 2C , % 2, % SAXMAN 2C % % SITKA 2C 1, , , , , % 120, % SKAGWAY 2C , % 1, % TENAKEE SPRINGS 2C , % 4, % THORNE BAY 2C , , % 10, % WHALE PASS 2C , % 1, % WRANGELL 2C ,138 24, , , % 31, % 2C 4,510 1,873 12, , ,395 59,247 2,213 16, % 344, % AKHIOK 3A 1 CHENEGA BAY 3A , % 3, % CORDOVA 3A , , , % 25, % KODIAK 3A 1, , , ,659 56, , % 171, % LARSEN BAY 3A , , % 2, % NANWALEK 3A 4 OLD HARBOR 3A , , % 2, % OUZINKIE 3A , % 2, % PORT GRAHAM 3A % 1, % PORT LIONS 3A , % 1, % SELDOVIA 3A , , % 15, % TATITLEK 3A , % 1, % YAKUTAT 3A , , % 10, % 3A 2, , , ,012 81,052 1,221 10, % 239, % CHIGNIK 3B % % CHIGNIK LAGOON 3B % % CHIGNIK LAKE 3B 4 COLD BAY 3B , % 3, % FALSE PASS 3B 3 KING COVE 3B , % 2, % PERRYVILLE 3B 2 SAND POINT 3B , % 2, % 3B , , % 11, % AKUTAN 4A 2 NIKOLSKI 4A , % 2, % UNALASKA 4A , , % 11, % 4A , , % 13, % -continued-
147 Appendix Table 3. Page 4 of Set Hook Gear Hook & Line or Handline All Gear Rural Community 1 of Estimated Estimated Estimated Estimated Estimated Estimated Estimated Estimated Confidence Estimated Confidence Regulatory SHARCs Pounds Pounds Interval for Pounds Interval for Area Issued 2 Respondents Harvested Harvested 3 Respondents Harvested Harvested 3 Respondents Harvested of Harvested 3 Pounds of ADAK 4B % 0 0.0% ATKA 4B 4 ST GEORGE ISLAND 4C 1 ST PAUL ISLAND 4C 1 4B % 1, % 4C 2 ALAKANUK 4E 1 ALEKNAGIK 4E 3 BETHEL 4E 4 CHEFORNAK 4E 1 CHEVAK 4E 3 CLARKS POINT 4E 1 DILLINGHAM 4E % 0 0.0% EMMONAK 4E 1 HOOPER BAY 4E 1 KING SALMON 4E 2 KOTLIK 4E 1 KWIGILLINGOK 4E 1 MANOKOTAK 4E 2 MEKORYUK 4E 1 NAKNEK 4E % % NIGHTMUTE 4E , % 4, % NOME 4E % 0 0.0% PLATINUM 4E 1 PORT HEIDEN 4E 2 QUINHAGAK 4E 2 SHELDON POINT 4E 1 SOUTH NAKNEK 4E 2 TELLER 4E 3 TOGIAK 4E 3 TOKSOOK BAY 4E 1 Rural Community Subtotals 4E , , % 5, % All Regulatory Areas 7,083 2,796 20, ,683 1,610 8, ,889 3,580 28, % 614, % Set Hook Gear Hook & Line or Handline All Gear of Regulatory Estimated Estimated Estimated Estimated Estimated Estimated Estimated Estimated Confidence Estimated Confidence SHARCs Area Pounds Pounds Interval for Pounds Interval for Issued 2 Respondents Harvested Harvested 3 Respondents Harvested Harvested 3 Respondents Harvested of Harvested 3 Pounds of Tribal Name Subtotals All 7,123 1,430 13, ,849 1,397 11, ,890 2,329 25, % 510, % Rural Community Subtotals All 7,083 2,796 20, ,683 1,610 8, ,889 3,580 28, % 614, % Grand Totals All 14,206 4,226 33, ,532 3,007 20, ,779 5,909 54, % 1,125, % Set Hook Gear Hook & Line or Handline All Gear of Regulatory Estimated Estimated Estimated Estimated Estimated Estimated Estimated Estimated Confidence Estimated Confidence SHARCs Area Pounds Pounds Interval for Pounds Interval for Issued 2 Respondents Harvested Harvested 3 Respondents Harvested Harvested 3 Respondents Harvested of Harvested 3 Pounds of 2C 8,335 2,726 20, ,126 1,332 5, ,659 3,298 26, % 591, % 3A 3,466 1,186 10, , , ,690 1,729 16, % 361, % 3B ,295 26, ,254 27, , % 54, % 4A , , , % 27, % 4B , % 2, % 4C , , % 8, % 4D , % 8, % 4E 1, , ,824 60, , % 71, % Grand Totals All 14,206 4,226 33, ,532 3,007 20, ,779 5,909 54, % 1,125, % 1 To protect confidentiality, values for tribes and communities with 5 or fewer SHARCs issued are not reported here. Subtotals and totals included all tribes and communities. 2 SHARC = Subsistence Registration Certificate 3 Pounds net weight. Net weight = 75% of round (whole) weight Source: Alaska Department of Fish and Game, Division of Subsistence, SHARC Survey, 2007
148 Appendix Table 4. Estimated subsistence and sport harvests of halibut and harvests of lingcod and rockfish by place of residence, of SHARCs Issued 2 Subsistence Subsistence Harvest Sport Sport Harvest Lingcod Bycatch Rockfish Bycatch Place of Residence 1 Estimated Estimated Estimated Estimated Estimated Estimated Estimated Estimated Estimated Estimated Pounds Pounds Respondents 3 Respondents 3 Respondents Lingcod Respondents Rockfish ADAK AKHIOK AKUTAN ALAKANUK 1 ALEKNAGIK 4 ANCHOR POINT ANCHORAGE ANGOON ATKA 4 AUKE BAY 3 BARROW 1 BETHEL BIG LAKE 2 CHEFORNAK CHENEGA BAY CHEVAK CHIGNIK CHIGNIK BAY 3 CHIGNIK LAGOON CHIGNIK LAKE CHINIAK CHUGIAK CLARKS POINT 4 COFFMAN COVE COLD BAY CORDOVA CRAIG DILLINGHAM DOUGLAS DUTCH HARBOR EAGLE RIVER EDNA BAY EEK ELFIN COVE EXCURSION INLET 2 FAIRBANKS FALSE PASS FRITZ CREEK 2 GAMBELL continued-
149 Appendix Table 4. Page 2 of of SHARCs Issued 2 Subsistence Subsistence Harvest Sport Sport Harvest Lingcod Bycatch Rockfish Bycatch Place of Residence 1 Estimated Estimated Estimated Estimated Estimated Estimated Estimated Estimated Estimated Estimated Pounds Pounds Respondents 3 Respondents 3 Respondents Lingcod Respondents Rockfish GOLOVIN 1 GOODNEWS BAY GUSTAVUS HAINES HOLLIS 5 HOMER HOONAH HOOPER BAY HYDABURG HYDER JUNEAU KAKE KARLUK 1 KASAAN KASILOF KENAI KETCHIKAN KING COVE KING SALMON 2 KIPNUK KLAWOCK KODIAK KONGIGANAK KWIGILLINGOK LARSEN BAY MANOKOTAK 2 MARSHALL 1 MEKORYUK METLAKATLA MEYERS CHUCK NAKNEK NANWALEK NAPAKIAK 3 NAUKATI NELSON LAGOON 1 NEWTOK 3 NIGHTMUTE NIKISKI continued-
150 Appendix Table 4. Page 3 of of SHARCs Issued 2 Subsistence Subsistence Harvest Sport Sport Harvest Lingcod Bycatch Rockfish Bycatch Place of Residence 1 Estimated Estimated Estimated Estimated Estimated Estimated Estimated Estimated Estimated Estimated Pounds Pounds Respondents 3 Respondents 3 Respondents Lingcod Respondents Rockfish NIKOLSKI NINILCHIK NOME NORTH POLE 3 OLD HARBOR OUZINKIE PALMER 5 PELICAN PERRYVILLE PETERSBURG PLATINUM 1 POINT BAKER PORT ALEXANDER PORT GRAHAM PORT HEIDEN 1 PORT LIONS PORT PROTECTION 1 PORT WILLIAM 2 QUINHAGAK SAND POINT SAVOONGA SAXMAN SCAMMON BAY 2 SELDOVIA SEWARD SHISHMAREF 1 SITKA SKAGWAY SOLDOTNA SOUTH NAKNEK 3 ST GEORGE ISLAND ST PAUL ISLAND STERLING 4 SUTTON 1 TATITLEK TELLER 3 TENAKEE SPRINGS THORNE BAY continued-
151 Appendix Table 4. Page 4 of 4. Subsistence Sport Lingcod Bycatch Rockfish Bycatch Estimated Estimated Estimated Estimated Estimated Estimated Estimated Estimated Estimated Estimated Pounds Pounds Respondents 3 Respondents 3 Respondents Lingcod Respondents Rockfish TOGIAK TOKSOOK BAY TRAPPER CREEK 1 TUNUNAK TWIN HILLS 2 UNALAKLEET 1 UNALASKA VALDEZ WARD COVE WASILLA WHALE PASS 2 WHITE MOUNTAIN 1 WHITTIER 1 WILLOW 1 WRANGELL YAKUTAT Place of Residence 1 of SHARCs Issued 2 Subsistence Harvest Sport Harvest 137 Alaska Subtotals Non-Alaska Subtotals GRAND TOTALS To protect confidentiality, data for tribes and communities with 5 or fewer SHARCs issued are not reported in this table. Tribal and community subtotals include all tribes and communities. 2 SHARC = subsistence halibut registration certificate 3 Pounds net weight; converted from reported pounds round weight. Net weight = 75% of round weight. 4 Note that members of eligible Alaska tribes could obtain SHARCs regardless of their place of residence. All non-alaska resident SHARC holders were members of eligible tribes. Source: Alaska Department of Fish and Game, Division of Subsistence SHARC Survey, 2007.
152 Appendix Table 5. Estimated subsistence harvests of halibut by gear type and place of residence, Place of Residence 1 of SHARCs Issued 2 Estimated Harvest by Gear Type Set Hook Gear Hook and Line or Handline All Gear Estimated Estimated Estimated Estimated Estimated Estimated Estimated Estimated Pounds Fish Pounds Fish Respondents Harvested Harvested 3 Respondents Fish Fish Respondents Fish Harvested Harvested 3 Harvested Estimated Pounds Fish Harvested 3 ADAK AKHIOK AKUTAN ALAKANUK 1 ALEKNAGIK 4 ANCHOR POINT ANCHORAGE ANGOON ATKA 4 AUKE BAY 3 BARROW 1 BETHEL BIG LAKE 2 CHEFORNAK CHENEGA BAY CHEVAK CHIGNIK CHIGNIK BAY 3 CHIGNIK LAGOON CHIGNIK LAKE CHINIAK CHUGIAK CLARKS POINT 4 COFFMAN COVE COLD BAY CORDOVA CRAIG DILLINGHAM DOUGLAS DUTCH HARBOR EAGLE RIVER EDNA BAY EEK ELFIN COVE EXCURSION INLET 2 FAIRBANKS FALSE PASS continued-
153 Appendix Table 5. Page 2 of Place of Residence 1 of SHARCs Issued 2 Estimated Harvest by Gear Type Set Hook Gear Hook and Line or Handline All Gear Estimated Estimated Estimated Estimated Estimated Estimated Estimated Estimated Pounds Fish Pounds Fish Respondents Harvested Harvested 3 Respondents Fish Fish Respondents Fish Harvested Harvested 3 Harvested Estimated Pounds Fish Harvested 3 FRITZ CREEK 2 GAMBELL GOLOVIN 1 GOODNEWS BAY GUSTAVUS HAINES HOLLIS 5 HOMER HOONAH HOOPER BAY HYDABURG HYDER JUNEAU KAKE KARLUK 1 KASAAN KASILOF KENAI KETCHIKAN KING COVE KING SALMON 2 KIPNUK KLAWOCK KODIAK KONGIGANAK KWIGILLINGOK LARSEN BAY MANOKOTAK 2 MARSHALL 1 MEKORYUK METLAKATLA MEYERS CHUCK NAKNEK NANWALEK NAPAKIAK 3 NAUKATI NELSON LAGOON 1 -continued-
154 Appendix Table 5. Page 3 of Place of Residence 1 of SHARCs Issued 2 Estimated Harvest by Gear Type Set Hook Gear Hook and Line or Handline All Gear Estimated Estimated Estimated Estimated Estimated Estimated Estimated Estimated Pounds Fish Pounds Fish Respondents Harvested Harvested 3 Respondents Fish Fish Respondents Fish Harvested Harvested 3 Harvested Estimated Pounds Fish Harvested 3 NEWTOK 3 NIGHTMUTE NIKISKI NIKOLSKI NINILCHIK NOME NORTH POLE 3 OLD HARBOR OUZINKIE PALMER 5 PELICAN PERRYVILLE PETERSBURG PLATINUM 1 POINT BAKER PORT ALEXANDER PORT GRAHAM PORT HEIDEN 1 PORT LIONS PORT PROTECTION 1 PORT WILLIAM 2 QUINHAGAK SAND POINT SAVOONGA SAXMAN SCAMMON BAY 2 SELDOVIA SEWARD SHISHMAREF 1 SITKA SKAGWAY SOLDOTNA SOUTH NAKNEK 3 ST GEORGE ISLAND ST PAUL ISLAND STERLING 4 SUTTON 1 -continued-
155 Appendix Table 5. Page 4 of Place of Residence 1 of SHARCs Issued 2 Estimated Harvest by Gear Type Set Hook Gear Hook and Line or Handline All Gear Estimated Estimated Estimated Estimated Estimated Estimated Estimated Estimated Pounds Fish Pounds Fish Respondents Harvested Harvested 3 Respondents Fish Fish Respondents Fish Harvested Harvested 3 Harvested Estimated Pounds Fish Harvested 3 TATITLEK TELLER 3 TENAKEE SPRINGS THORNE BAY TOGIAK TOKSOOK BAY TRAPPER CREEK 1 TUNUNAK TWIN HILLS 2 UNALAKLEET 1 UNALASKA VALDEZ WARD COVE WASILLA WHALE PASS 2 WHITE MOUNTAIN 1 WHITTIER 1 WILLOW 1 WRANGELL YAKUTAT Alaska Subtotal Non-Alaska Subtotal GRAND TOTALS To protect confidentiality, data for tribes and communities with 5 or fewer SHARCs issued are not reported in this table. Tribal and community subtotals include all tribes and communities. 2 SHARC = subsistence halibut registration certificate 3 Pounds net weight; converted from reported pounds round weight. Net weight = 75% of round weight. 4 Note that members of eligible Alaska tribes could obtain SHARCs regardless of their place of residence. All non-alaska resident SHARC holders were members of eligible tribes. Source: Alaska Department of Fish and Game, Division of Subsistence SHARC Survey, 2007.
156 Appendix Table 6. Estimated number of SHARC holders who either subsistence or sport fished for halibut by place of residence, Place of Residence 1 of SHARCs Issued 2 Estimated Subsistence or Sport ADAK 12 2 AKHIOK AKUTAN ALAKANUK 1 ALEKNAGIK 4 ANCHOR POINT 12 7 ANCHORAGE ANGOON ATKA 4 AUKE BAY 3 BARROW 1 BETHEL BIG LAKE 2 CHEFORNAK CHENEGA BAY CHEVAK 11 9 CHIGNIK CHIGNIK BAY 3 CHIGNIK LAGOON CHIGNIK LAKE 7 5 CHINIAK CHUGIAK 9 3 CLARKS POINT 4 COFFMAN COVE COLD BAY CORDOVA CRAIG DILLINGHAM DOUGLAS 26 5 DUTCH HARBOR EAGLE RIVER 9 5 EDNA BAY EEK 20 8 ELFIN COVE 18 7 EXCURSION INLET 2 FAIRBANKS 6 0 FALSE PASS FRITZ CREEK 2 GAMBELL 6 0 GOLOVIN 1 GOODNEWS BAY 15 5 GUSTAVUS HAINES
157 Appendix Table 6. Page 2 of 4. Estimated Place of Residence 1 of SHARCs Issued 2 Subsistence or Sport HOLLIS 5 HOMER HOONAH HOOPER BAY HYDABURG HYDER JUNEAU KAKE KARLUK 1 KASAAN KASILOF 9 2 KENAI KETCHIKAN KING COVE KING SALMON 2 KIPNUK KLAWOCK KODIAK KONGIGANAK 9 10 KWIGILLINGOK LARSEN BAY MANOKOTAK 2 MARSHALL 1 MEKORYUK METLAKATLA MEYERS CHUCK 10 8 NAKNEK 11 7 NANWALEK NAPAKIAK 3 NAUKATI NELSON LAGOON 1 NEWTOK 3 NIGHTMUTE NIKISKI 8 7 NIKOLSKI NINILCHIK NOME 10 0 NORTH POLE 3 OLD HARBOR OUZINKIE PALMER 5 PELICAN PERRYVILLE PETERSBURG PLATINUM 1 143
158 Appendix Table 6. Page 3 of 4. Estimated Place of Residence 1 of SHARCs Issued 2 Subsistence or Sport POINT BAKER PORT ALEXANDER PORT GRAHAM PORT HEIDEN 1 PORT LIONS PORT PROTECTION 1 PORT WILLIAM 2 QUINHAGAK 14 8 SAND POINT SAVOONGA SAXMAN SCAMMON BAY 2 SELDOVIA SEWARD 12 5 SHISHMAREF 1 SITKA SKAGWAY SOLDOTNA SOUTH NAKNEK 3 ST GEORGE ISLAND ST PAUL ISLAND STERLING 4 SUTTON 1 TATITLEK TELLER 3 TENAKEE SPRINGS THORNE BAY TOGIAK 10 2 TOKSOOK BAY TRAPPER CREEK 1 TUNUNAK TWIN HILLS 2 UNALAKLEET 1 UNALASKA VALDEZ WARD COVE 42 6 WASILLA 24 8 WHALE PASS 2 WHITE MOUNTAIN 1 WHITTIER 1 WILLOW 1 WRANGELL YAKUTAT
159 Appendix Table 6. Page 3 of 4. Place of Residence 1 of SHARCs Issued 2 Estimated Subsistence or Sport Alaska Total 14,029 6,886 Non-Alaska Total GRAND TOTALS 14,206 6,899 1 To protect confidentiality, data for communities with 5 or fewer SHARCs issued are not reported in this table. Subtotals include all SHARC holders. 2 SHARC = subsistence halibut registration certificate. 3 Note that members of eligible Alaska tribes could obtain SHARCs regardless of their place of residence. All non-alaska resident SHARC holders were members of eligible tribes. Source: Alaska Department of Fish and Game, Division of Subsistence SHARC Survey,
160 Appendix Table 7. Estimated subsistence harvests of halibut and sport harvests of halibut, pounds net weight, and incidental harvests of lingcod and rockfish by eligible Alaska Tribe and eligible Alaska rural community SHARC holders, Tribal Name 1 Regulatory Area SHARCs Issued 2 Return Rate Subsistence Subsistence Harvest Estimated Estimated Surveys Percent of Estimated Percent SHARCs Fish Respondents Pounds 3 Sport Sport Harvest Lingcod Bycatch Rockfish Bycatch Estimated Estimated Estimated Estimated Estimated Percent of SHARCs Fish Pounds 3 Respondents Fish Respondents Estimated Respondents AGDAAGUX TRIBE OF KING COVE 3B % % % ANGOON COMMUNITY ASSOCIATION 2C % % % AUKQUAN TRADITIONAL COUNCIL 2C 2 CENTRAL COUNCIL TLINGIT AND HAIDA INDIAN TRIBES 2C % % % CHEVAK NATIVE VILLAGE (KASHUNAMIUT) 4E % % % CHIGNIK LAKE VILLAGE 3B % % % CHILKAT INDIAN VILLAGE 2C % % % CHILKOOT INDIAN ASSOCIATION 2C % % % CHINIK ESKIMO COMMUNITY 4E 1 CRAIG COMMUNITY ASSOCIATION 2C % % % DOUGLAS INDIAN ASSOCIATION 2C % % % EGEGIK VILLAGE 4E % % % HOONAH INDIAN ASSOCIATION 2C % % % HYDABURG COOPERATIVE ASSOCIATION 2C % % % IVANOFF BAY VILLAGE 3B % % % KENAITZE INDIAN TRIBE 3A % % % KETCHIKAN INDIAN CORPORATION 2C % % % KING ISLAND NATIVE COMMUNITY 4E 2 KLAWOCK COOPERATIVE ASSOCIATION 2C % % % LESNOI VILLAGE (WOODY ISLAND) 3A % % % LEVELOCK VILLAGE 4E 1 METLAKATLA INDIAN RESERVE 2C % % % NAKNEK NATIVE VILLAGE 4E % % % NATIVE VILLAGE OF AFOGNAK 3A % % % NATIVE VILLAGE OF AKHIOK 3A % % % NATIVE VILLAGE OF AKUTAN 4A % % % NATIVE VILLAGE OF ALEKNAGIK 4E 5 NATIVE VILLAGE OF ATKA 4B % % % NATIVE VILLAGE OF BELKOFSKI 3B 2 NATIVE VILLAGE OF CHENEGA 3A % % % NATIVE VILLAGE OF CHIGNIK 3B % % % NATIVE VILLAGE OF CHIGNIK LAGOON 3B % % % NATIVE VILLAGE OF COUNCIL 4E 1 NATIVE VILLAGE OF DILLINGHAM (CURYUNG) 4E % % % NATIVE VILLAGE OF EEK 4E % % % NATIVE VILLAGE OF EKUK 4E 3 NATIVE VILLAGE OF ELIM 4E 1 NATIVE VILLAGE OF EYAK 3A % % % NATIVE VILLAGE OF FALSE PASS 3B % % % NATIVE VILLAGE OF GAMBELL 4D % 0 0.0% % NATIVE VILLAGE OF GOODNEWS BAY (MUMTRAQ) 4E % % % NATIVE VILLAGE OF HOOPER BAY 4E % % % NATIVE VILLAGE OF KANAKANAK 4E 1 NATIVE VILLAGE OF KARLUK 3A 5 NATIVE VILLAGE OF KIPNUK 4E % % % NATIVE VILLAGE OF KONGIGANAK 4E % % % NATIVE VILLAGE OF KOYUK 4E 1 NATIVE VILLAGE OF KWIGILLINGOK 4E % % % NATIVE VILLAGE OF KWINHAGAK 4E % % % NATIVE VILLAGE OF LARSEN BAY 3A % % % NATIVE VILLAGE OF MEKORYUK 4E % % % NATIVE VILLAGE OF NANWALEK 3A % % % NATIVE VILLAGE OF NAPAKIAK 4E 3 NATIVE VILLAGE OF NELSON LAGOON 3B 3 NATIVE VILLAGE OF NIGHTMUTE 4E % % % NATIVE VILLAGE OF NIKOLSKI 4A % % % NATIVE VILLAGE OF OUZINKIE 3A % % % NATIVE VILLAGE OF PERRYVILLE 3B % % % NATIVE VILLAGE OF PORT GRAHAM 3A % % % NATIVE VILLAGE OF PORT HEIDEN 4E 1 NATIVE VILLAGE OF PORT LIONS 3A % % % NATIVE VILLAGE OF SAVOONGA 4D % % % NATIVE VILLAGE OF SCAMMON BAY 4E 5 NATIVE VILLAGE OF SHAKTOOLIK 4E 1 NATIVE VILLAGE OF SHISHMAREF 4E 1 NATIVE VILLAGE OF TATITLEK 3A % % % NATIVE VILLAGE OF TOKSOOK BAY (NUNAKAUYAK) 4E % % % NATIVE VILLAGE OF TUNUNAK 4E % % % NATIVE VILLAGE OF UNALAKLEET 4E % 0 0.0% % NATIVE VILLAGE OF UNGA 3B % % % NATIVE VILLAGE OF WHITE MOUNTAIN 4E 2 NEWTOK VILLAGE 4E 3 NINILCHIK VILLAGE 3A % % % NOME ESKIMO COMMUNITY 4E % 0 0.0% % ORGANIZED VILLAGE OF KAKE 2C % % % ORGANIZED VILLAGE OF KASAAN 2C % % % continued- Estimated Fish
161 Tribal Name 1 Appendix Table 7. Page 2 of 3. Regulatory Area SHARCs Issued 2 Return Rate Subsistence Subsistence Harvest Sport Sport Harvest Lingcod Bycatch Rockfish Bycatch Estimated Estimated Estimated Estimated Estimated Estimated Estimated Estimated Estimated Surveys Percent of Estimated Percent of Percent SHARCs Fish Respondents Pounds 3 SHARCs Respondents Fish Pounds 3 Respondents Fish Respondents Fish ORGANIZED VILLAGE OF SAXMAN 2C % % % ORUTSARARMUIT NATIVE VILLAGE 4E % % % PAULOFF HARBOR VILLAGE 3B % % % PETERSBURG INDIAN ASSOCIATION 2C % % % PLATINUM TRADITIONAL VILLAGE 4E 1 PRIBILOF ISLANDS ALEUT COMMUNITY OF ST GEORGE 4C % % % PRIBILOF ISLANDS ALEUT COMMUNITY OF ST PAUL 4C % % % QAGAN TAYAGUNGIN TRIBE OF SAND POINT VILLAGE 3B % % % QAWALANGIN TRIBE OF UNALASKA 4A % % % SELDOVIA VILLAGE TRIBE 3A % % % SHOONAQ' TRIBE OF KODIAK 3A % % % SITKA TRIBE OF ALASKA 2C % % % SKAGWAY VILLAGE 2C 2 SOUTH NAKNEK VILLAGE 4E 2 STEBBINS COMMUNITY ASSOCIATION 4E 4 TRADITIONAL VILLAGE OF TOGIAK 4E % % % TWIN HILLS VILLAGE 4E 1 UGASHIK VILLAGE 4E 4 VILLAGE OF CHEFORNAK 4E % % % VILLAGE OF CLARK'S POINT 4E 3 VILLAGE OF KANATAK 3B % 1 9.1% % VILLAGE OF OLD HARBOR 3A % % % VILLAGE OF SALAMATOFF 3A % % % WRANGELL COOPERATIVE ASSOCIATION 2C % % % YAKUTAT TLINGIT TRIBE 3A % % % Tribal Name Subtotals 7,123 3, % 2, % 25, , % 2,914 61, , , Rural Community 1 Regulatory Area SHARCs Issued 2 Return Rate Subsistence Subsistence Harvest Estimated Estimated Surveys Percent of Estimated Percent SHARCs Fish Respondents Pounds 3 Sport Sport Harvest Lingcod Bycatch Rockfish Bycatch Estimated Estimated Estimated Estimated Estimated Percent of SHARCs Fish Pounds 3 Respondents Fish Respondents Estimated Respondents ADAK 4B % % % AKHIOK 3A 1 AKUTAN 4A 2 ALAKANUK 4E 1 ALEKNAGIK 4E 3 ANGOON 2C % % % ATKA 4B 4 BETHEL 4E 4 CHEFORNAK 4E 1 CHENEGA BAY 3A % % % CHEVAK 4E 3 CHIGNIK 3B % % % CHIGNIK LAGOON 3B % % % CHIGNIK LAKE 3B 4 CLARKS POINT 4E 1 COFFMAN COVE 2C % % % COLD BAY 3B % % % CORDOVA 3A % % % CRAIG 2C % % % DILLINGHAM 4E % 1 2.6% % EDNA BAY 2C % % % ELFIN COVE 2C % % % EMMONAK 4E 1 FALSE PASS 3B 3 GUSTAVUS 2C % % % HAINES 2C % % % HOLLIS 2C % % % HOONAH 2C % % % HOOPER BAY 4E 1 HYDABURG 2C % % % HYDER 2C % % % KAKE 2C % % % KASAAN 2C % % % KING COVE 3B % % % KING SALMON 4E 2 KLAWOCK 2C % % % KLUKWAN 2C 1 KODIAK 3A % % % KOTLIK 4E 1 KWIGILLINGOK 4E 1 LARSEN BAY 3A % % % MANOKOTAK 4E 2 MEKORYUK 4E 1 METLAKATLA 2C % % % continued- Estimated Fish
162 Appendix Table 7. Page 3 of Rural Community 1 Regulatory Area SHARCs Issued 2 Return Rate Subsistence Subsistence Harvest Sport Sport Harvest Lingcod Bycatch Rockfish Bycatch Estimated Estimated Estimated Estimated Estimated Estimated Estimated Estimated Estimated Surveys Percent of Estimated Percent of Percent SHARCs Fish Respondents Pounds 3 SHARCs Respondents Fish Pounds 3 Respondents Fish Respondents Fish MEYERS CHUCK 2C % % % NAKNEK 4E % % % NANWALEK 3A 4 NIGHTMUTE 4E % % % NIKOLSKI 4A % % % NOME 4E % 0 0.0% % OLD HARBOR 3A % % % OUZINKIE 3A % % % PELICAN 2C % % % PERRYVILLE 3B 2 PETERSBURG 2C % % % PLATINUM 4E 1 PORT ALEXANDER 2C % % % PORT GRAHAM 3A % % % PORT HEIDEN 4E 2 PORT LIONS 3A % % % PORT PROTECTION 2C % % % PT. BAKER 2C % % % QUINHAGAK 4E 2 SAND POINT 3B % % % SAXMAN 2C % % % SELDOVIA 3A % % % SHELDON POINT 4E 1 SITKA 2C % % % SKAGWAY 2C % % % SOUTH NAKNEK 4E 2 ST GEORGE ISLAND 4C 1 ST PAUL ISLAND 4C 1 TATITLEK 3A % % % TELLER 4E 3 TENAKEE SPRINGS 2C % % % THORNE BAY 2C % % % TOGIAK 4E 3 TOKSOOK BAY 4E 1 UNALASKA 4A % % % WHALE PASS 2C % % % WRANGELL 2C % % % YAKUTAT 3A % % % Rural Community Subtotals 7,083 5, % 3, % 28, ,572 2, % 8, , ,806 1,011 9,071 Totals SHARCs Issued 2 Return Rate Subsistence Subsistence Harvest Estimated Estimated Surveys Percent of Estimated Percent SHARCs Fish Respondents Pounds 3 Sport Sport Harvest Lingcod Bycatch Rockfish Bycatch Estimated Estimated Estimated Estimated Estimated Percent of SHARCs Fish Pounds 3 Respondents Fish Respondents Estimated Respondents Tribal Name Subtotals 7,123 3, % 2, % 25, , % 2,914 61, , ,874 Rural Community Subtotals 7,083 5, % 3, % 28, ,572 2, % 8, , ,806 1,011 9,071 Grand Totals 14,206 8, % 5, % 54,089 1,125,312 2, % 11, , ,486 1,529 16,945 Estimated Fish 1 To protect confidentiality, data for tribes and communities with 5 or fewer SHARCs issued are not reported in this table. Tribal and community subtotals include all tribes and communities. 2 SHARC = subsistence halibut registration certificate 3 Pounds net weight; converted from reported pounds round weight. Net weight = 75% of round weight. Source: Alaska Department of Fish and Game, Division of Subsistence SHARC Survey, 2007.
163 APPENDIX H: PROJECT FINDINGS SUMMARY 149
164 150

165 151 SUBSISTENCE HARVESTS OF PACIFIC HALIBUT IN ALASKA, 2006 Division of Subsistence, Alaska Department of Fish and Game 333 Raspberry Road, Anchorage, AK December 2007 Through a grant from the National Marine Fisheries Service, the Division of Subsistence of the Alaska Department of Fish and Game conducted a study to estimate the subsistence harvests of Pacific halibut in Alaska in The full results of the study appear in Division of Subsistence Technical Paper No. 333, Subsistence Harvests of Pacific in Alaska, 2006 (December 2007). Key points in the report include the following: In May 2003, the NMFS published final federal regulations for a subsistence halibut fishery in Alaska. Residents of 117 rural communities and members of 123 tribes are eligible to participate. Fishers must obtain a subsistence halibut registration certificate (SHARC) from NMFS before fishing ( ) was the fourth year in which subsistence halibut fishing took place under these regulations. Information about subsistence halibut harvests in 2003, 2004, and 2005 is reported in Division of Subsistence Technical Papers 288, 304, and 320, respectively. To estimate the 2006 harvests, a one-page survey form was mailed to SHARC holders in early 2007 or administered in person. After three mailings and the community visits, 8,426 of 14,206 SHARC holders (59%) responded. Participation in the survey was voluntary. An estimated 5,909 individuals subsistence fished for halibut in 2006 (see Figure 8, below). The estimated subsistence harvest was 54,089 halibut for 1,125,312 pounds net weight. Of this total, 70% was harvested with setline (stationary) gear (longline or skate) and 30% was harvested with hand-operated gear (handline or rod and reel). The largest subsistence harvests occurred in southeast Alaska ( Regulatory Area 2C), at 52% of the total, followed by southcentral Alaska (Area 3A) at 34%. Table 6 and Figure 17 from the final report (below) give more details on harvests by gear type and area. Based on place of residence of SHARC holders, communities with the largest subsistence halibut harvests in 2006 were Kodiak and Sitka (the eligible communities with the largest populations) (see Figure 22, below). An estimated 16,945 rockfish were harvested by 1,529 fishers in the subsistence halibut fishery in Most (68%) were harvested in southeast Alaska. An estimated 2,486 lingcod were harvested by 927 fishers in the subsistence halibut fishery in Most (59%) were harvested in southeast Alaska. Based on preliminary data from the International Pacific Commission and this study, the estimated halibut removal in Alaska in 2006 was million pounds, net weight. Subsistence harvests accounted for 1.5% of this total (see Figure 30, below). The report concludes that the project was, overall, a success, with good public outreach, good response rates, and a reliable estimate of subsistence halibut harvests. The report recommends that the subsistence harvest study continue for at least one more year (for a total of five years) in order to evaluate trends in the fishery. For a copy of the full report, go to or call the Division of Subsistence of ADF&G at (Anchorage) or (Juneau).
Subsistence Harvests of Pacific Halibut in Alaska, 2010
 Technical Paper No. 367 Subsistence Harvests of Pacific Halibut in Alaska, 2010 by James A. Fall and David Koster January 2012 Alaska Department of Fish and Game Division of Subsistence Symbols and Abbreviations
Subsistence Harvests of Pacific Halibut in Alaska, 2008
 Technical Paper No. 348 Subsistence Harvests of Pacific Halibut in Alaska, 2008 by James A. Fall and David Koster January 2010 Alaska Department of Fish and Game Division of Subsistence Symbols and Abbreviations
2013 Kotzebue Sound Salmon Fisheries Management Plan
 Regional Information Report 3A13-04 2013 Kotzebue Sound Salmon Fisheries Management Plan by Jim Menard Alaska Department of Fish and Game May 2013 Divisions of Sport Fish and Commercial Fisheries Symbols
DEPARTMENT OF FISH AND GAME
 Sean Parnell, GOVERNOR DEPARTMENT OF FISH AND GAME November 4, 2011 DIVISION OF SPORT FISH 3298 Douglas Place Homer, AA 99603-8027 PHONE: (907) 235-8191 FAX: (907) 235-2448 and Douglas Island Center Bldg
Stock Assessment of Sockeye Salmon from the Buskin River, Kodiak, Alaska, 2000
 Annual Project Report No. FIS 00-032 USFWS Office of Subsistence Management Fishery Information Services Division Stock Assessment of Sockeye Salmon from the Buskin River, Kodiak, Alaska, 2000 by Donn
Fishery Management Report No Fishery Management Plan for the South Alaska Peninsula Area State-Waters Pacific Cod Season, 2013
 Fishery Management Report No. 13-01 Fishery Management Plan for the South Alaska Peninsula Area State-Waters Pacific Cod Season, 2013 by Trent Hartill Alaska Department of Fish and Game January 2013 Divisions
Alaska Peninsula-Aleutian Islands Management Area Food and Bait Herring Fishery Management Plans, 2015
 Fishery Management Report No. 15-26 Alaska Peninsula-Aleutian Islands Management Area Food and Bait Herring Fishery Management Plans, 2015 by Charles W. Russell Alaska Department of Fish and Game May 2015
Special Publication No. BOF
 Special Publication No. BOF 2015-02 Customary and Traditional Use Worksheet and Options for Amounts Reasonably Necessary for Subsistence: Tanner Crab, Dungeness Crab, Shrimp, and Miscellaneous Shellfish,
Methodology for ISER Surveys of Alaska Halibut Fishermen
 Methodology for ISER Surveys of Alaska Halibut Fishermen by Gunnar Knapp Institute of Social and Economic Research University of Alaska Anchorage 3211 Providence Drive Anchorage, Alaska 99508 907-786-7710
The Harvest of Moose, Caribou, Bear, and Gray Wolf in the Lower-Middle Yukon River Communities of Grayling, Anvik, Shageluk, and Holy Cross
 Technical Paper No. 305 The 2004 2005 Harvest of Moose, Caribou, Bear, and Gray Wolf in the Lower-Middle Yukon River Communities of Grayling, Anvik, Shageluk, and Holy Cross by Caroline L. Brown and David
Department of Fish and Game
 MEMORANDUM TO: THRU: Kevin Duffy Deputy Commissioner Juneau Rob Bentz Deputy Director Division of Sport Fish Juneau State Of Alaska Department of Fish and Game DATE: September 21, 21 TELEPHONE NO: 465-6187
Technical Paper No. 310 Household Harvests of Moose, Caribou, Bears, and Wolves in 8 Central Kuskokwim Region Communities, Alaska,
 Technical Paper No. 310 Household Harvests of Moose, Caribou, Bears, and Wolves in 8 Central Kuskokwim Region Communities, Alaska, 2003 2006 by Tracie Krauthoefer Caroline Brown and David Koster June 2015
Port Graham: Holdings of Limited Entry Permits, Sablefish Quota Shares, and Halibut Quota Shares Through 1998 and Data On Fishery Gross Earnings
 Port Graham: Holdings of Limited Entry Permits, Sablefish Quota Shares, and Halibut Quota Shares Through 1998 and Data On Fishery Earnings CFEC Report 99-Port Graham-SN Alaska Commercial Fisheries Entry
Regional Information Report No. 3A Norton Sound Salmon Fisheries Outlook and Management Strategies
 Regional Information Report No. 3A15-02 2015 Norton Sound Salmon Fisheries Outlook and Management Strategies by Jim Menard May 2015 Alaska Department of Fish and Game Division of Commercial Fisheries Symbols
Department of Fish and Game
 Department of Fish and Game DIVISION OF SPORT FISH 3298 Douglas Place Homer, AK 99603 Main: 907-235-8191 Fax: 907-235-2448 P.O. Box 110024 Juneau, AK 99811-0024 Main: 907-465-4270 Fax: 907-465-2034 October
Survey Methodologies and Reported Sex Compositions of Harbor Seal Harvests of Alaska Natives,
 Survey Methodologies and Reported Sex Compositions of Harbor Seal Harvests of Alaska Natives, 19954997 Robert J. Wolfe, Matt Kookesh, Amy W. Paige, Cheryl Scott, Morgen Smith, Michael Turek, and Charles
CFEC Permit Holdings, Harvests, and Estimated Gross Earnings by Resident Type in the Bristol Bay Salmon Gillnet Fisheries
 CFEC Permit Holdings, Harvests, and Estimated Gross Earnings by Resident Type in the Bristol Bay Salmon Gillnet Fisheries Photo courtesy of Lindsey Bloom CFEC Report 09-1N February, 2009 Commercial Fisheries
Alaska Peninsula-Aleutian Islands Management Area Food and Bait Herring Fishery Management Plans, 2013
 Fishery Management Report No. 13-13 The 2013 Dutch Harbor Food and Bait purse seine fishery allocation is corrected in the current publication. Nichols, Nathaniel W., 5/24/13 Alaska Peninsula-Aleutian
SOUTH UNIMAK AND SHUMAGIN ISLANDS JUNE SALMON FISHERY MANAGEMENT PLAN, 2003
 SOUTH UNIMAK AND SHUMAGIN ISLANDS JUNE SALMON FISHERY MANAGEMENT PLAN, 2003 By Arnold R. Shaul Charles Burkey, Jr. and Joseph J. Dinnocenzo Regional Information Report 1 No. 4K03-20 Alaska Department of
Technical Paper No. 418 Kodiak City, Larsen Bay and Old Harbor: An Ethnographic Study of Traditional Subsistence Salmon Harvests and Uses
 Technical Paper No. 418 Kodiak City, Larsen Bay and Old Harbor: An Ethnographic Study of Traditional Subsistence Salmon Harvests and Uses by Meredith A. Marchioni, James A. Fall, Brian Davis and Garrett
A Study of Commercial Fishing Gear Selectivity During the 2012/13 Aleutian Islands Golden King Crab Fishery East of 174 W Longitude
 Fishery Data Series No. 13-41 A Study of Commercial Fishing Gear Selectivity During the 2012/13 Aleutian Islands Golden King Crab Fishery East of 174 W Longitude by Vicki Vanek, Douglas Pengilly, and M.
Stock Assessment of Sockeye and Coho Salmon from Billy s Hole, Prince William Sound, Alaska, 2003
 Annual Project Report No. FIS 03-033 USFWS Office of Subsistence Management Fishery Information Services Division Stock Assessment of Sockeye and Coho Salmon from Billy s Hole, Prince William Sound, Alaska,
2017 PACIFIC HALIBUT CATCH SHARING PLAN FOR AREA 2A
 (a) FRAMEWORK 2017 PACIFIC HALIBUT CATCH SHARING PLAN FOR AREA 2A This Plan constitutes a framework that shall be applied to the annual Area 2A total allowable catch (TAC) approved by the International
City of Ketchikan and Other Places Within the Ketchikan Gateway Borough:
 City of Ketchikan and Other Places Within the Ketchikan Gateway Borough: Holdings of Limited Entry Permits, Sablefish Quota Shares, and Halibut Quota Shares Through 1997 and Data On Fishery CFEC Report
Chignik Area Subsistence Salmon Fisheries Research Report to the Alaska Board of Fisheries, January 2011
 Special Publication No. BOF 2010-06 RC 3 Tab 9 Chignik Area Subsistence Salmon Fisheries Research Report to the Alaska Board of Fisheries, January 2011 by Lisa Hutchinson-Scarbrough, Terri Lemons, James
INFORMATIONAL LEAFLET NO. 2. Length-Width Relationships of Carapace. Measurements of the King Crab
 INFORMATIONAL LEAFLET NO. 2 Length-Width Relationships of Carapace Measurements of the King Crab (Parali thodes camtschatica) Roy Ri ckey-westward Regional Di rector Alaska Department of Fish and Game
Ketchikan and Other Nearby Places:
 Ketchikan and Other Nearby Places: Holdings of Limited Entry Permits, Sablefish Quota Shares, and Halibut Quota Shares Through 1998 and Data On Fishery Earnings CFEC Report 99-Ketchikan area-sn Alaska
ECONOMIC IMPACTS AND CONTRIBUTIONS OF SPORTFISHING IN ALASKA
 ECONOMIC IMPACTS AND CONTRIBUTIONS OF SPORTFISHING IN ALASKA 2 0 0 7 R E P O R T A Message from the Director CHARLIE SWANTON, DIRECTOR ADF&G, DIVISION OF SPORT FISH Alaska supports arguably some of the
2009 commercial shery and regulation changes
 2009 commercial shery and regulation changes Heather L. Gilroy, Lara M. Erikson, and Kirsten A. MacTavish Abstract This section presents the 2009 regulations and the results of the commercial halibut shery.
2016 PACIFIC HALIBUT CATCH SHARING PLAN FOR AREA 2A
 (a) FRAMEWORK 2016 PACIFIC HALIBUT CATCH SHARING PLAN FOR AREA 2A This Plan constitutes a framework that shall be applied to the annual Area 2A total allowable catch (TAC) approved by the International
Alaska Department of Fish and Game. Saltwater Guided Sport Fishing Logbook Reporting Program, 2014
 Regional Operational Plan SF.4A.2014.03 Alaska Department of Fish and Game Statewide Saltwater Guided Sport Fishing Logbook Reporting Program, 2014 by Dora Sigurdsson Alaska Department of Fish and Game
SOUTHEASTERN DISTRICT MAINLAND (ALASKA PENINSULA AREA) SALMON MANAGEMENT PLAN, 1994
 SALMON MANAGEMENT PLAN, 1994") SOUTHEASTERN DISTRICT MAINLAND (ALASKA PENINSULA AREA) SALMON MANAGEMENT PLAN, 1994 James N. McCullough and Rodney D. Campbell Regional Information ~ e~ort' No. 4K94-14 Alaska Department of Fish and Game
SOUTHEASTERN DISTRICT MAINLAND (ALASKA PENINSULA AREA) SALMON MANAGEMENT PLAN, 1994 James N. McCullough and Rodney D. Campbell Regional Information ~ e~ort' No. 4K94-14 Alaska Department of Fish and Game
Fishery Data Series No Distribution and Run Timing of Stocked McDonald Lake Sockeye Salmon,
 Fishery Data Series No. 15-38 Distribution and Run Timing of Stocked McDonald Lake Sockeye Salmon, 2011 2014 by Malika T. Brunette, Andrew W. Piston, and Steven C. Heinl Alaska Department of Fish and Game
FISHERY MANAGEMENT PLAN FOR THE RED KING CRAB COMMERCIAL FISHERY IN BRISTOL BAY REGISTRATION AREA T, Rance Morrison
 FISHERY MANAGEMENT PLAN FOR THE RED KING CRAB COMMERCIAL FISHERY IN BRISTOL BAY REGISTRATION AREA T, 1999 by Rance Morrison Regional Information Report 1 No. 4K00-6 Alaska Department of Fish and Game Division
Proposed Changes to the Catch Sharing Plan
 Agenda Item E.1.a ODFW Report 1 November 2017 OREGON DEPARTMENT OF FISH AND WILDLIFE REPORT ON PROPOSED CHANGES TO THE PACIFIC HALIBUT CATCH SHARING PLAN FOR THE 2018 FISHERY The Oregon Department of Fish
Technical Paper No. 381 Alaska Subsistence and Personal Use Salmon Fisheries 2010 Annual Report
 Technical Paper No. 381 Alaska Subsistence and Personal Use Salmon Fisheries 2010 Annual Report by James A. Fall Benjamin M. Balivet Andrew R. Brenner Sarah S. Evans Davin Holen Lisa Hutchinson-Scarbrough
Discussion Paper: Consideration of a Registration for Self-Guided Halibut Rental Boats
 Discussion Paper: Consideration of a Registration for Self-Guided Halibut Rental Boats December 2017 1 1 Introduction... 1 2 Description of the Problem... 1 2.1 Definition of self-guided halibut rental
Thomas Bay Baseline Investigation
 Regional Information Report No. 1J16-10 Thomas Bay Baseline Investigation by Patrick Fowler and Troy Thynes Alaska Department of Fish and Game November 2016 Divisions of Sport Fish and Commercial Fisheries
Regional Operational Plan SF.4A Alaska Statewide Sport Fish Harvest Survey, 2014
 Regional Operational Plan SF.4A.2013.07 Alaska Statewide Sport Fish Harvest Survey, 2014 by William J. Romberg and Gretchen Jennings Alaska Department of Fish and Game August 2013 Divisions of Sport Fish
North Alaska Peninsula Salmon Management Plan, 2013
 Fishery Management Report No. 13-16 North Alaska Peninsula Salmon Management Plan, 2013 by Robert L. Murphy and Dawn M. Wilburn Alaska Department of Fish and Game April 2013 Divisions of Sport Fish and
Effects of IFQ Management on Fishing Safety: Survey Responses of Alaska Halibut Fishermen
 Effects of IFQ Management on Fishing Safety: Survey Responses of Alaska Halibut Fishermen by Gunnar Knapp Institute of Social and Economic Research University of Alaska Anchorage 3211 Providence Drive
Regional Information Report 5J
 Regional Information Report 5J.2016-06 Does the Queets Exploitation Rate Indicator Stock Represent the Distribution of Fishery Impacts of Washington Coastal Chinook Salmon Stocks in Pacific Salmon Treaty
Fishery Manuscript Series No Hatchery Chum Salmon Contribution to Southern Southeast Alaska Commercial Net Fisheries,
 Fishery Manuscript Series No. 13-1 Hatchery Chum Salmon Contribution to Southern Southeast Alaska Commercial Net Fisheries, 26 21 by Malika T. Brunette Andrew W. Piston Steven C. Heinl and Susan K. Doherty
Kodiak and Alaska Peninsula Commercial Dungeness Crab Fisheries, Report to the Alaska Board of Fisheries. Michael P. Ruccio.
 Kodiak and Alaska Peninsula Commercial Dungeness Crab Fisheries, 1999 Report to the Alaska Board of Fisheries By Michael P. Ruccio and David R. Jackson Regional Information Report 1 No. 4K00-3 Alaska Department
Analysis of Management Options for the Area 2C and 3A Charter Halibut Fisheries for 2019
 Analysis of Management Options for the Area 2C and 3A Charter Halibut Fisheries for 2019 A Report to the North Pacific Fishery Management Council Sarah Webster, Robert Powers Alaska Department of Fish
AD HOC WORKING GROUP ON GROUNDFISH MANAGEMENT, MAY 5 and 6 Overview of ADF&G skate fishery management and data collection, 2003
 Skate fisheries in state waters: AD HOC WORKING GROUP ON GROUNDFISH MANAGEMENT, MAY 5 and Overview of ADF&G skate fishery management and data collection, 003 Alaska Board of Fisheries requires a Commissioner
North Pacific Fishing Crew Demographics and Trends
 North Pacific Fishing Crew Demographics and Trends 1993-2003 Courtney Carothers University of Washington National Marine Fisheries Service Alaska Fisheries Science Center Jennifer Sepez National Marine
OR DUNGENESS CRAB FISHERY:
 E 55 OR DUNGENESS CRAB FISHERY: an economic analysis of productivity and profitability David S. Liao Joe B. Stevens OREGON STATE UNIVERSITY SEA GRANT COLLEGE PROGRAM Publication no. ORESU-T-75-005 AGRICULTURAL
STOCK ASSESSMENT AND FISHERY EVALUATION REPORT FOR THE GROUNDFISH FISHERIES OF THE GULF OF ALASKA AND BERING SEA/ALEUTIAN ISLAND AREA:
 STOCK ASSESSMENT AND FISHERY EVALUATION REPORT FOR THE GROUNDFISH FISHERIES OF THE GULF OF ALASKA AND BERING SEA/ALEUTIAN ISLAND AREA: ECONOMIC STATUS OF THE GROUNDFISH FISHERIES OFF ALASKA, 1998 by Terry
Discussion Paper on BSAI Fixed Gear Parallel Waters Fishery North Pacific Fishery Management Council October 2008
 Discussion Paper on BSAI Fixed Gear Parallel Waters Fishery North Pacific Fishery Management Council October 2008 Item D-2(b) At its April 2008 meeting, the Council initiated a staff discussion paper on
GROUNDFISH MANAGEMENT TEAM REPORT ON CONSIDERATION OF INSEASON ADJUSTMENTS, INCLUDING CARRYOVER. Annual Vessel Limit (15.4%)
") Agenda Item I.3.a Supplemental GMT Report 2 March 2017 GROUNDFISH MANAGEMENT TEAM REPORT ON CONSIDERATION OF INSEASON ADJUSTMENTS, INCLUDING CARRYOVER The Groundfish Management Team (GMT) reviewed the
Agenda Item I.3.a Supplemental GMT Report 2 March 2017 GROUNDFISH MANAGEMENT TEAM REPORT ON CONSIDERATION OF INSEASON ADJUSTMENTS, INCLUDING CARRYOVER The Groundfish Management Team (GMT) reviewed the
Public Meetings to Discuss the Pacific Halibut Catch Sharing Plan for Portland July 31 North Bend August 6 Newport August 7
 Public Meetings to Discuss the Pacific Halibut Catch Sharing Plan for 2013 Portland July 31 North Bend August 6 Newport August 7 1 Meeting Outline Background on overall halibut management 2A Catch Sharing
AGENCY: National Marine Fisheries Service (NMFS), National Oceanic and Atmospheric
, National Oceanic and Atmospheric") This document is scheduled to be published in the Federal Register on 05/30/2013 and available online at http://federalregister.gov/a/2013-12869, and on FDsys.gov BILLING CODE 3510-22-P DEPARTMENT OF COMMERCE
This document is scheduled to be published in the Federal Register on 05/30/2013 and available online at http://federalregister.gov/a/2013-12869, and on FDsys.gov BILLING CODE 3510-22-P DEPARTMENT OF COMMERCE
Kodiak Sockeye Salmon Test Fishery Operational Plan, by Michelle L. Moore
 Kodiak Sockeye Salmon Test Fishery Operational Plan, 2013 by Michelle L. Moore Alaska Department of Fish and Game April 2013 Divisions of Sport Fish and Commercial Fisheries Symbols and Abbreviations The
Bering Sea Salmon Bycatch Update North Pacific Fishery Management Council, July 2017
 Bering Sea Salmon Bycatch Update North Pacific Fishery Management Council, July 2017 Salmon are caught incidentally in the Bering Sea and Aleutian Islands (BSAI) offshore trawl fisheries, especially in
Pacific Halibut Fishery Regulations 2018
 Pacific Halibut Fishery Regulations 2018 INTERNATIONAL PACIFIC HALIBUT COMMISSION 2320 WEST COMMODORE WAY, SUITE 300 SEATTLE, WASHINGTON 98199-1287 PHONE: (206) 634-1838 FAX: (206) 632-2983 WEBSITE: www.iphc.int
Evaluation of Alaska Charter Logbook Data for A Report to the North Pacific Fishery Management Council, October 2009
 Evaluation of Alaska Charter Data for 26-28 A Report to the North Pacific Fishery Management Council, October 29 Scott Meyer, Bob Powers Alaska Department of Fish and Game, Division of Sport Fish, Anchorage
Technical Paper No. 373 Alaska Subsistence Salmon Fisheries 2009 Annual Report
 Technical Paper No. 373 Alaska Subsistence Salmon Fisheries 2009 Annual Report by James A. Fall Nicole Braem Caroline Brown Sarah Evans Davin Holen Theodore Krieg Robbin La Vine Terri Lemons Meredith Marchioni
Northern Cook Inlet Chinook and Coho Salmon Escapement Surveys for
 Regional Operational Plan SF.2A.2013.16 Northern Cook Inlet Chinook and Coho Salmon Escapement Surveys for 2013-2015 by Samantha Oslund Alaska Department of Fish and Game June 2013 Divisions of Sport Fish
REPORT ON THE 2017 PACIFIC HALIBUT FISHERIES IN AREA 2A
 Agenda Item E.1.a NMFS Report 1 November 2017 REPORT ON THE 2017 PACIFIC HALIBUT FISHERIES IN AREA 2A The 2017 Area 2A Pacific halibut (halibut) total allowable catch (TAC) of 1,330,000 pounds (lbs.),
2017 Regulatory Proposals
 2017 Regulatory Proposals Jamie Goen Agenda Item 7 IPHC-2017-AM093-10 Rev_1 IPHC-2017-AM093-PropA-P D. Griffay Regulatory Proposals * Each Fall IPHC solicits regulatory proposals from IPHC staff, agencies,
Salmon bycatch patterns in the Bering Sea pollock fishery
 Salmon bycatch patterns in the Bering Sea pollock fishery James Ianelli Seattle, WA Data from the North Pacific Observer Program (Fisheries Monitoring and Assessment) were analyzed for seasonal, temporal,
Fisheries Off West Coast States; Coastal Pelagic Species Fisheries; Annual. AGENCY: National Marine Fisheries Service (NMFS), National Oceanic and
, National Oceanic and") This document is scheduled to be published in the Federal Register on 06/30/2017 and available online at https://federalregister.gov/d/2017-13685, and on FDsys.gov Billing Code 3510-22-P DEPARTMENT OF
This document is scheduled to be published in the Federal Register on 06/30/2017 and available online at https://federalregister.gov/d/2017-13685, and on FDsys.gov Billing Code 3510-22-P DEPARTMENT OF
Bison Identification Guide and Quiz
 Bison Identification Guide and Quiz Alaska Department of Fish and Game Division of Wildlife Conservation 2009 2 All winter photos by Mike Taras. All summer photos by Steve DuBois. The Alaska Department
Charter Boat Fishing in Lake Michigan: 2015 Illinois Reported Harvest
 Illinois Department of Natural Resources Division of Fisheries Charter Boat Fishing in Lake Michigan: 2015 Illinois Reported Harvest Steven R. Robillard Illinois Department of Natural Resources Lake Michigan
1. A Report to the Attorney General of the State of Alaska I TO THE EXXON VALDEZ OIL SPILL. December 18, 1992 OF RECREATIONAL FISHING LOSSES RELATED
 A PRELIMINARY ECONOMIC ANALYSIS OF RECREATIONAL FISHING LOSSES RELATED TO THE EXXON VALDEZ OIL SPILL Richard T. Carson W. Michael Hanemann December 18, 1992 1. A Report to the Attorney General of the State
REPORT ON THE 2018 PACIFIC HALIBUT FISHERIES IN AREA 2A (10/5/2018)
") Agenda Item F.1.a NMFS Report 1 November 2018 REPORT ON THE 2018 PACIFIC HALIBUT FISHERIES IN AREA 2A (10/5/2018) The 2018 Area 2A Pacific halibut (halibut) total allowable catch (TAC) of 1,190,000 pounds
Agenda Item F.1.a NMFS Report 1 November 2018 REPORT ON THE 2018 PACIFIC HALIBUT FISHERIES IN AREA 2A (10/5/2018) The 2018 Area 2A Pacific halibut (halibut) total allowable catch (TAC) of 1,190,000 pounds
Seafood Industry. The 2012 Juneau and Southeast Alaska Economic Indicators 11/1/12 Page 60
 Seafood Industry In 2011, fishermen in Southeast landed 395,628,268 pounds of fish with an ex vessel value of $391,091,684. This harvest resulted in 272.6 million pounds of product, with a wholesale value
IPHC Regulatory Area 2A Directed Commercial Pacific Halibut Fishery Sample Vessel Fishing Period Limit Options for Longer Fishing Periods
 Agenda Item G.1.a IPHC Report 1 September 2017 IPHC Report September 2017 IPHC Regulatory Area 2A Directed Commercial Pacific Halibut Fishery Sample Vessel Fishing Period Limit Options for Longer Fishing
IPHC regulatory proposals, 2016
 IPHC regulatory proposals, 2016 Heather L. Gilroy and Bruce M. Leaman The International Pacific Halibut Commission (IPHC) requests that IPHC and agency staffs and the industry submit regulation proposals
National Oceanic and Atmospheric Administration. Notice of Intent to Prepare an Environmental Impact
 This document is scheduled to be published in the Federal Register on 08/15/2017 and available online at https://federalregister.gov/d/2017-17173, and on FDsys.gov BILLING CODE 3510-22-P DEPARTMENT OF
Wildlife Ad Awareness & Attitudes Survey 2015
 Wildlife Ad Awareness & Attitudes Survey 2015 Contents Executive Summary 3 Key Findings: 2015 Survey 8 Comparison between 2014 and 2015 Findings 27 Methodology Appendix 41 2 Executive Summary and Key Observations
Atlantic States Marine Fisheries Commission DRAFT ADDENDUM I TO THE BLACK DRUM FISHERY MANAGEMENT PLAN FOR PUBLIC COMMENT
 Atlantic States Marine Fisheries Commission DRAFT ADDENDUM I TO THE BLACK DRUM FISHERY MANAGEMENT PLAN FOR PUBLIC COMMENT Vision: Sustainably Managing Atlantic Coastal Fisheries February 2018 Public Comment
Discussion Paper: Unguided Rental Boat Registration
 Discussion Paper: Unguided Rental Boat Registration April 2018 1 1 Introduction... 1 2 Purpose and Need... 1 3 Description of the Problem... 2 3.1 Definition of guided and unguided anglers... 2 3.2 Unguided
Special Publication No. BOG Customary and Traditional Use Worksheet: Snowy Owl, Game Management Units 17, 18, 22, 23, and 26
 Special Publication No. BOG 2016-05 Customary and Traditional Use Worksheet: Snowy Owl, Game Management Units 17, 18, 22, 23, and 26 Prepared by Alaska Department of Fish and Game, Division of Subsistence
Regional Information Report No. 1J Southeast Alaska Drift Gillnet Fishery Management Plan
 Regional Information Report No. 1J09-08 2009 Southeast Alaska Drift Gillnet Fishery Management Plan by William Davidson Randy Bachman, William Bergmann, Justin Breese, Eric Coonradt, Scott Forbes, David
International Fisheries; Pacific Tuna Fisheries; Revised 2018 Commercial Fishing
 This document is scheduled to be published in the Federal Register on 03/28/2018 and available online at https://federalregister.gov/d/2018-06148, and on FDsys.gov BILLING CODE 3510-22-P DEPARTMENT OF
Technical Paper No. 316 Alaska Subsistence Salmon Fisheries 2003 Annual Report
 Technical Paper No. 316 Alaska Subsistence Salmon Fisheries 2003 Annual Report by Caroline L. Brown, David Caylor, Jesse Dizard, James A. Fall, Susan Georgette, Tracie Krauthoefer, and Michael Turek September
Chum Salmon Stock Status and Escapement Goals in Southeast Alaska
 Special Publication No. 11-21 Chum Salmon Stock Status and Escapement Goals in Southeast Alaska by Andrew W. Piston and Steven C. Heinl Alaska Department of Fish and Game December 2011 Divisions of Sport
Special Publication No Subsistence Harvests of Land Mammals in Bethel, Alaska, 2011
 Special Publication No. 2014-01 Subsistence Harvests of Land Mammals in Bethel, Alaska, 2011 by David M. Runfola, Andrew R. Brenner, and David S. Koster March 2014 Alaska Department of Fish and Game Division
Year End Report of The Fishing Company of Alaska Offshore Rockfish Cooperative
 Year End Report of The Fishing Company of Alaska Offshore Respectively submitted to: Regional Administrator NMFS Alaska P.O. Box 21668 Juneau, Alaska 99802 December 15, 2010 TABLE OF CONTENTS I. INTRODUCTION.
Fishery Data Series No Abundance and Length Composition of Cutthroat Trout in Florence Lake, Southeast Alaska, 2002
 Fishery Data Series No. 16-41 Abundance and Length Composition of Cutthroat Trout in Florence Lake, Southeast Alaska, 2002 by Peter D. Bangs and David C. Love Alaska Department of Fish and Game October
Fishery Data Series No Kodiak Management Area Salmon Escapement and Catch Sampling Results, 2015
 Fishery Data Series No. 16-19 Kodiak Management Area Salmon Escapement and Catch Sampling Results, 2015 by Michelle L. Wattum Alaska Department of Fish and Game April 2016 Divisions of Sport Fish and Commercial
California Department of Fish and Wildlife Report to the International Pacific Halibut Commission on 2017 California Fisheries
 IPHC-2018-AM094-AR08 Received: 22 December 2017 California Department of Fish and Wildlife Report to the International Pacific Halibut Commission on 2017 California Fisheries California Department of Fish
Fisheries of the Caribbean, Gulf of Mexico, and South Atlantic; Reef Fish Fishery of Puerto Rico and the U.S. Virgin Islands;
 This document is scheduled to be published in the Federal Register on 06/11/2018 and available online at https://federalregister.gov/d/2018-12420, and on FDsys.gov BILLING CODE: 3510-22-P DEPARTMENT OF
Charter Boat Fishing in Lake Michigan: 2017 Illinois Reported Harvest
 Illinois Department of Natural Resources Division of Fisheries Charter Boat Fishing in Lake Michigan: 2017 Illinois Reported Harvest Steven R. Robillard Illinois Department of Natural Resources Lake Michigan
North Pacific Fishery Management Council. Community considerations in Federally-managed fisheries. April 2005
 North Pacific Fishery Management Council Community considerations in Federally-managed fisheries April 2005 Why are Fisheries Off Alaska so important to communities? Would rank in the top 10 producing
Magnuson-Stevens Act Provisions; Fisheries Off West Coast States; Tribal Usual and
 This document is scheduled to be published in the Federal Register on 06/08/2016 and available online at http://federalregister.gov/a/2016-13469, and on FDsys.gov Billing Code: 3510-22-P DEPARTMENT OF
Recreational Fisheries in the Prince William Sound Management Area,
 Fishery Management Report No. 14-44 Recreational Fisheries in the Prince William Sound Management Area, 211 213 by Mike Thalhauser Alaska Department of Fish and Game November 214 Divisions of Sport Fish
A.M. The time between 12:00 midnight and 12:00 noon. Houghton Mifflin Co. 1 Grade 4 Unit 5
 A.M. The time between 12:00 midnight and 12:00 noon. Houghton Mifflin Co. 1 Grade 4 Unit 5 bar graph A graph in which information is shown by means of rectangular bars. Favorite Sea Creature Sea Creature
Atlantic States Marine Fisheries Commission
 Atlantic States Marine Fisheries Commission DRAFT ADDENDUM XXIV TO THE SUMMER FLOUNDER, SCUP AND BLACK SEA BASS FISHERY MANAGEMENT PLAN FOR PUBLIC COMMENT Summer Flounder Recreational Management in 2013
NATIONAL MARINE FISHERIES SERVICE REPORT ON PACIFIC HALIBUT CATCH SHARING PLAN CHANGES FOR 2015
 Agenda Item G.1.b Supplemental NMFS Report 1 November 2014 NATIONAL MARINE FISHERIES SERVICE REPORT ON PACIFIC HALIBUT CATCH SHARING PLAN CHANGES FOR 2015 Table of Contents Purpose of the document... 2
The Coast Guard has 145 Years of Arctic Service UNCLASSIFIED
 The Coast Guard has 145 Years of Arctic Service 1 Operational Challenges Maritime Boundary Line Nome Barrow Great Distances Kodiak-Barrow = 825 NM Dutch Harbor - Barrow = 1167 NM Barrow-North Pole= 1,140
Fishery Management Report No Pasagshak River Weir Report, 2015
 Fishery Management Report No.15-37 Pasagshak River Weir Report, 2015 by Mark J. Witteveen Alaska Department of Fish and Game September 2015 Divisions of Sport Fish and Commercial Fisheries Symbols and
ALASKA DEPARTMENT OF FISH AND GAME
 RC 2 ALASKA DEPARTMENT OF FISH AND GAME STAFF COMMENTS COMMERCIAL, PERSONAL USE, SPORT, GUIDED SPORT, AND SUBSISTENCE FINFISH REGULATORY PROPOSALS COMMITTEE OF THE WHOLE GROUPS 1 6 FOR THE UPPER COOK INLET
OPTIONS FOR DISCUSSION ON FISHING IN MULTIPLE IFQ MANAGEMENT AREAS
 OPTIONS FOR DISCUSSION ON FISHING IN MULTIPLE IFQ MANAGEMENT AREAS Agenda Item G.9.a NMFS Report June 2016 This report provides options for discussion on fishing in multiple individual fishing quota (IFQ)
Northern Chatham Strait Sockeye Salmon: Updated Stock Status, Fishery Management, and Subsistence Fisheries
 Regional Information Report No. 1J12-14 Northern Chatham Strait Sockeye Salmon: Updated Stock Status, Fishery Management, and Subsistence Fisheries by Julie Bednarski, David K. Harris, Kevin Monagle, Steven
Susitna-Watana Hydroelectric Project Document ARLIS Uniform Cover Page
 Alaska Resources Library & Information Services Document ARLIS Uniform Cover Page Title: Wildlife harvest analysis study, Study plan Section 10.20 : Final study plan SuWa 200 Author(s) Personal: Author(s)
Early in the century the annual halibut catch
 PAGE 6 THE PACIFIC HALIBUT FISHERY OVER TIME Early in the century the annual halibut catch ranged above 70 million pounds, but by the early 1930s it had dropped below 50 million pounds. After that it began
NORTH PACIFIC FISHERY MANAGEMENT COUNCIL AGENCY REPORT
 NORTH PACIFIC FISHERY MANAGEMENT COUNCIL AGENCY REPORT A. OVERVIEW Many of the North Pacific Council=s actions in 2001 were related to developing supplemental environmental impact assessments (SEIS). A