Wing Damage Effect on Dragonfly's Aerodynamic Performance during Takeoff
|
|
|
- Archibald May
- 6 years ago
- Views:
Transcription

1 Wright State University CORE Scholar Browse all Theses and Dissertations Theses and Dissertations 2013 Wing Damage Effect on Dragonfly's Aerodynamic Performance during Takeoff Kuo Gai Wright State University Follow this and additional works at: Part of the Mechanical Engineering Commons Repository Citation Gai, Kuo, "Wing Damage Effect on Dragonfly's Aerodynamic Performance during Takeoff" (2013). Browse all Theses and Dissertations. Paper 813. This Thesis is brought to you for free and open access by the Theses and Dissertations at CORE Scholar. It has been accepted for inclusion in Browse all Theses and Dissertations by an authorized administrator of CORE Scholar. For more information, please contact
2 Wing Damage Effect on Dragonfly s Aerodynamic Performance during Takeoff A thesis submitted in partial fulfillment of the requirements for the degree of Master of Science in Engineering By Kuo Gai B.S., Dalian Jiaotong University, Wright State University
3 WRIGHT STATE UNIVERSITY GRADUATE SCHOOL June 20,2012 I HEREBY RECOMMEND THAT THE THESIS PREPARED UNDER MY SUPERVISION BY Kuo Gai ENTITLED Wing Damage Effect on Dragonfly s Aerodynamic Performance during Takeoff BE ACCEPTED IN PARTIAL FULFILLMENT OF THE REQUIREMENTS FOR THE DEGREE OF Master of Science in Engineering. Haibo Dong, Ph.D. Thesis Director Committee on Final Examination George Huang, Ph.D., Chair Department of Mechanical and Materials Engineering College of Engineering and Computer Science Haibo Dong, Ph.D. Zifeng Yang, Ph.D. Hui Wan, Ph.D. Andrew Hsu, Ph.D. Dean, School of Graduate Studies
4 ABSTRACT Gai,Kuo. M.S. Egr., Department of Mechanical and Material Engineering, Wright State University, Wing Damage Effect on Dragonfly s Aerodynamic Performance during Takeoff. Insect wing damage resulted from living environment or predation commonly happens in nature. This usually results in deterioration of insect s flight performance and as a consequence, the insect needs adjustment of flapping wings to compensate the effect from the wing loss. In this study, a dragonfly (Erythemis simpliciolis) with and without wing loss is chosen to study the change of aerodynamic performance of flapping wings. Three cases including flight with intact wings (IW), flight with one-sided forewing damage (OFD), and flight with double-side forewing damage (DFD) are determined. An integrated study using high-speed photogrammetry, three-dimensional surface reconstruction, and direct numerical simulation (DNS) are used to quantify wing kinematics and aerodynamics performance. Results have shown that in general, during downstroke of forewings, forewing area loss could reduce insect s lift production; The lift force generated by the outer wings is larger than or equal to that produced by the inner wings during downstroke, but the outer wings lift production becomes smaller than the inner wings during upstroke; Span-wise forewing area removal reduces forewing tip vorticity, and it leads to the detachment of the tip vortex ring during upstroke. iii
5 TABLE OF CONTENTS Page I. INTRODUCTION... 1 II. METHODS : Experiment Setup : 3D High speed photogrammetry system : 3D Surface Reconstruction technology--autodesk MAYA : Design of Wing-Damage Experiment : Species of Dragonfly and Environment in laboratory : Implementation of Experiment : Coordinate Transformation : Direct Numerical Simulation method (DNS) III. RESUTLS AND DISCUSSIONS : Morphological parameters : Mean Wing beat frequency : Displacement of the dragonfly's body : Lift performance : Resultant Lift : Lift on individual wings : Left hindwing kinematics : Flow features IV. CONCLUSIONS V. FUTURE WORK REFERENCES iv
6 LIST OF FIGURES Figure Page 1. 3D High speed photgrammetry system. Camera Reconstructed model built by Autodesk MAYA Three dimensional surface reconstruction One studied dragonfly with artificial markers and the damaged area on the forewings Motion in different time of the three cases filmed by 3D High speed photogrammetry system Global Cartesian coordinate in reconstruction system Local coordinate system when investigating wing kinematics Validation case Time history of displacement in three directions Instantaneous lift generated by the individual's four wings during 0.08s Lift for four wings versus time in one completed stroke Trajectory of mid chord of the left hindwing and the corresponding instantaneous pitching angle in the IW and OFD cases Flow Feature shed from the intact wings during 0.08s (the IW case). Iso-surface of vorticity λ 2 is Flow Feature shed from the dragonfly's wings including 40% loss of left forewing area during 0.08s (the OFD case). Iso-surface of vorticity λ 2 is v
7 15. Flow Feature shed from the dragonfly's wings including 40% loss of wing area on the two forewings during 0.08s YZ view (side view) of the three cases Flow feature of the intact wings in the IW case Flow feature of four wings including damaged left forewing in the OFD case Flow feature of the four wings in the DFD case Comparison of the vorticity slice of the inner forewing at the end of downstroke vi
8 LIST OF TABLES Table Page 1. Flying motion of the dragonfly in the three cases Morphological parameters of the individual Mean wing beating frequencies of four wings in the three cases Mean lift on the four wings and the percentage of the mean lift on each wing for the downstroke and upstroke in the IW case Mean lift on the four wings and the percentage of the mean lift on each wing for the downstroke and upstroke in the OFD case Mean lift on the four wings and the percentage of the mean lift on each wing for the downstroke and upstroke in the DFD case Mean lift on the four wings and the percentage of the mean lift on each wing for the following downstroke of the one stroke studied in the IW, OFD, and DFD cases Mean lift, average vertical acceleration computed from Newton s second law, a, and average vertical acceleration computed from displacement and velocity, a k, in one stroke vii
9 ACKNOWLEDGEMENTS First of all, I want to thank Dr. Haibo Dong for all of his help, time, and funding support spending on my research work. Without these, I cannot finish my thesis. I am very luck to join his team and work under his direction. He used a lot of time to teach and guide me to do research. Whenever or whatever I needed his help on my study work and research work, he was always there and helped me. His encouragement and suggestion gave me a lot of confidence to let me finish my work. He helped me to open a new interesting field I never touched it before. Under his influence, I know how to study, and how to be a researcher. I really appreciate and I can bring all these skills into my future work and life. I also like to thank Dr. Hui Wan, post doctor in Dr. Dong s group. Thanks for his time and patient. He taught me a lot of skills when I met trouble in work, and also introduced a lot of useful books and papers to help my research work. Without his help, I cannot finish the work so fast and so nice. Last but not least I would like to thank my family and all the members in Flow Simulation Research Group. Thanks for their time, help, and encouragement during my work. Especially, I like to thank Yan Ren for teaching me how to use Maya, how to use our in-house code. I really appreciate his time and help. At last, I would also like to thank Zhe Ning for his encouragement, understanding, and cooking. He gave me a lot of hints over last one year. Sometimes, these hits can help me save several day times. I do not think I can finish this work without him. viii
10 I. INTRODUCTION Dragonflies are ancient and excellent flyers with paired wings. They have fast and flexible maneuverability to capture their prey, adapt to harsh environment, and mate with each other. All of these are implemented by the clap and beating of two paired wings. Thus, the study on dragonflies' wing kinematics and aerodynamics has always been a popular research topic, especially because this could help in the improvement and accomplishment of bio-inspired micro air vehicle (MAV) design. In addition, during the life cycle of dragonflies, the wing damage resulting from living environment or predation commonly happens in nature, and this loss of wing area would absolutely influence their flying motion. Studying the effect of this phenomenon will give better understanding on dragonflies' flight and will also provide significant data for improving MAV design. To investigate the aerodynamic performance of insects, many approaches were introduced to measure mean force or instantaneous force generated by insects' wings. A very common method is called quasi-steady method which can obtain mean lift and mean drag on insects' wings by quasi-steady assumption. However, Sane and Dickinson (2001) claim that this method can only perform better at translational predictions at high stroke amplitude rather than at lower stroke amplitude, and wing rotation would influence the estimation of force. Also, although the mean lift coefficient can be estimated accurately, the mean drag coefficient is underestimated. The reason of this underestimation is that the quasi-steady prediction cannot involve the effect from wing rotation. 1
11 A variety of methods were invented and utilized, but it was hard to obtain accurate solutions. Therefore, indirect measurement on aerodynamics was considered. A very popular approach using computational fluid dynamics (CFD) computes the flow field around insects by solving Navier-Stokes Equation to obtain forces produced by insects' wings. An accurate CFD solver used in this field is developed by Mittal and Dong (2008), et al. They use a sharp interface immersed boundary method and ghost-cell methodology to handle complicated three-dimensional stationary and moving body surfaces which are composed of unstructured tri-angular elements. Also, this solver uses non-uniform Cartesian girds and can simulate incompressible viscous flow when the region of Reynolds number is from ( ) to ( ). In addition, Mittal and Dong, et al. tested and verified the accuracy of the solver using several canonical two- and threedimensional flows and accelerated objects. However, even if many accurate methods and solvers are provided to analyze aerodynamics performance and to estimate mean and instantaneous force on insects' bodies, it is still very complicated to study and analyze the relationship between wing kinematics and aerodynamics. The reason is that insects' flying motion including pitching, rolling, and yawing is random and complex, and wing motion and deformation including twisting, bending, and camber are also hard to be investigated separately. Thus, a rigid wing model was introduced in this field to study such fundamental phenomenon. Dickinson and Göze (1993) measured lift and drag and visualized flow based on a twodimensional model wing, which moves from repose to a constant velocity after giving a sharp acceleration at a fixed angle of attack. They also claimed that the study tried to fill the lack of the data about time-dependent unsteady aerodynamic forces produced by 2
12 insects' wings when Reynolds number is from 10 to Also, Sane and Dickinson (2001) examined the relationship between wing kinematics and unsteady aerodynamic forces using a dynamically scaled mechanical model of fruit fly. They found that the magnitude of stroke deviation would influence the aerodynamic performance negatively, yet it might help insects transform forces amongst the wings to produce corresponding moments during maneuvering. While two-dimensional wing models have been used to analyze and solve wing kinematics and aerodynamic performance, investigating aerodynamics of real insects' flight was in process simultaneously by Ellington et al. (Ellington, 1984a; Ellington, 1984b; Ellington, 1984c; Ellington, 1984d). Wakeling and Ellington (1997) examined mean lift coefficient, maximum muscle mass-specific power, which is approximately equivalent to the aerodynamic power, and heat production for the free flight of a dragonfly (Sympetrum sanguineum) and a damselfly (Calopteryx splendens). The results showed that owing to the characteristic of wings, the damselfly has bigger mean lift coefficient and higher muscle mass-specific power than the dragonfly when the velocity and the thrust were fixed, but the mechanical efficiency which is directly resulted from heat production performed in an opposite way for the two species. In addition, many other species of insects were studied such as hawkmoth, locust, and bumblebees, etc. For example, Aono, Liang and Liu (2007) presented the study of vorticity, lift and drag, and torques on hovering flight of a fruit fly Drosophila melanogaster. They used a biology-inspired, dynamic flight simulator based on computational fluid dynamics to handle the realistic reconstructed model. The results involved the variation of vortices around the wings, the mean force, the instantaneous lift 3
13 and drag, time history of inertial torques and powers during one stroke. They finally concluded that according to the analysis of vortices, 62% of total lift generated in one stroke was produced in the upstroke, where the corresponding downwash was grossly stronger. Nowadays, although there is much unknown knowledge on insects in free flight, the existing research and study provide better understanding about their motion. With the ongoing research on development of micro air vehicle design, the effect of damaged wings on aerodynamics becomes the focus. Combes and Mukherjee (2010) investigated the effect of hindwing area loss on dragonfly flight by linking laboratory and greenhouse experiments. They declared that the dragonflies with 30 percent loss of hindwing area resulted in an approximate 30 percent drop on vertical acceleration; when the loss of hindwing area was increased to 50 percent, the vertical acceleration decreased by nearly 50 percent. In addition, the maximum acceleration, the time-averaged velocity, and the escape velocity of dragonflies would be reduced with the increase of hindwing area loss. For example, when the hindwing area was removed 30 percent, the escape velocity dropped by 21 percent; while the loss of wing was increased to 50 percent, the velocity decreased by 24.8 percent. However, there is less insight into the influence of wing damage on aerodynamic performance. Most literature on insect wing damage and wing wear is concentrated in the effect on predation, which is usually reported by biologists (Cartar, 1992; Dukas et al., 2011; Foster et al., 2011). 4
14 In this thesis, in order to investigate the effect of wing damage on aerodynamics, three cases from one dragonfly were studied, including flight with intact wings (IW), with one-sided forewing damage (OFD), and with double-side forewing damage (DFD). The flying motion in all these three cases are non-interference takeoff maneuvers. The three-dimensional realistic reconstructed model and in-house solver, PiCar3D using a sharp interface immersed boundary method and a multi-dimensional ghost-cell methodology, were utilized to compute aerodynamics performance including vortices and lift forces. Morphological parameters including mass, wing chord and span length were measured during these experiments. Also, the frequencies of the dragonfly s wings were examined individually before and after the wing area removal. The results involved the time-averaged lift over a half stroke, time history of lift during one stroke, resultant lift during takeoff motion, and the comparison of vortices around the wings. However, we need to measure wing kinematics and examine the relation between wing kinematics and aerodynamic performance on dragonflies takeoff maneuver. 5

15 II. METHODS 1: Experiment Setup 1.1: 3D High speed photogrammetry system The photogrammetry system used in collecting the images of insects' free flight in our laboratory is shown in Figure 1. It includes three synchronized Photron FASTCAM SA3 60K high-speed cameras with pixel resolution. In order to obtain exact three-dimensional data of insects' motion, the three cameras are placed orthogonal to each other. They are operated at 1000 Hz and have a 1/20000 sec. shutter speed, so the timestep size is 0.001s. All the three cameras are controlled by a delayed controller that can make the memory in cameras store previous two seconds images Figure 1 3D High speed photgrammetry system. Camera No.1 films the sideview images, Camera No.2 films the front-view images, and Camera No.3 films the top-view images. 6
16 Also, the filming domain is illuminated by 2 optic lamps (OSRAM, 54428) to supply enough light for the fast shutter speed mentioned above. Each camera is set at a distance of 85cm from the initial position of insects to ensure filming of the completed takeoff motion of dragonflies. The images filmed by the three cameras are shown in Figure : 3D Surface Reconstruction technology--autodesk MAYA The foundation required to analyze free flight of a dragonfly is the acquisition of the displacement of every single point on dragonfly s body and the wings. The information of displacement is supposed to be with respect to global Cartesian coordinate system. One goal to get more detailed and accurate information of body and wings is to create a model which has as many points as possible on their surfaces within the valid region of computation. Then using this data of the displacement measured we can calculate the related kinematics and aerodynamics. In order to achieve the goal mentioned above to build a 3D model based on the photographs filmed by the photogrammetry system in Figure 1, Autodesk MAYA software is selected. The model created using this software is shown in Figure 2. The model of a dragonfly's body is built by Catmull-Clark subdivision surfaces corresponding to two pictures of real dragonfly in side and top view. The exact profile of body is generated by modifying the position of control points on the model surface. Since dragonfly's wings are treated as membrane which does not have thickness, NURBS surfaces are chosen, and the control points on the surfaces should track the corresponding marker on real wings, as shown in Figure 2 a). The reason why only the points on edges 7

17 of wings are tracked is to simplify the deformation of a dragonfly s wings by assuming the wings are rigid. However, if the deformation during flight is considered important in future work, it is easy to add one more line in the mid span of each wing to track the corresponding markers then generate the camber of wings. a) b) Figure 2 Reconstructed model built by Autodesk MAYA. a) Initial model by tracking markers on wings. b) Fine meshed model to create more points. Since the whole motion of takeoff maneuver in a video is to be studied, we may take advantage of the key points on the NURBS surfaces to animate the position of markers on the wings in every frame until a significant motion is reconstructed as an animation. Then we mesh the wing models finely to produce enough points for all the information about real wings' surfaces. Triangulating the original rectangular surface grids is used to compute the data from reconstruction directly onto the in-house solver (introduced in the section on DNS). The model containing the resultant fine meshes is shown as Figure 2 b). One example of using reconstructed model into a frame of images 8

 Front view which coordinate is with respect to X and Y axes. b) Side view with respect to Y and Z axes. c) Top view with respect to X and Z axes. 2: Design of Wing-Damage Experiment 2.")

18 shot by photogrammetry system is displayed in Figure 3, where the reconstructed model is fully matched with the image. In addition, the dragonfly's body is assumed to be rigid and is not important compared to the contribution by its wings. During reconstruction, the wings' deformation during clap involves twist but not camber. a) b) c) Figure 3 Three dimensional surface reconstruction. a) Front view which coordinate is with respect to X and Y axes. b) Side view with respect to Y and Z axes. c) Top view with respect to X and Z axes. 2: Design of Wing-Damage Experiment 2.1: Species of Dragonfly and Environment in laboratory In the experiment of wing damage, 15 dragonflies which are the Eastern Pondhawk (Erythemis simpliciolis) are filmed in high-speed photogrammetry laboratory to study free flight takeoff maneuver. Those dragonflies were caught between 10 July and 31 August 2011 near the pond of Nutter Center in Wright State University. They were stored temporarily in a big plastic container during capture and then were moved into indoor laboratory maintained at a temperature of 20 C. To film the flying motion of 9
19 dragonflies without any interference, the door and the air conditioner were closed to reduce the effect of air flow. Also, the temperature was increased to approximate 26 C to keep the dragonflies active. However, owing to the rapid shutter speed, a large amount of light is required during image shooting. This light adds more and more heat as time goes by, and the temperature of the shooting area is affected and increased obviously. The high temperature could reduce the activity of dragonflies. Also, the bright light and the reflection from the white background (shown in Figure 1) make dragonflies get wrong information about environment, and so sometimes the dragonflies during filming crash to the white board. Thus, controlling the indoor temperature and the light impact is very important for dragonflies free flight. In addition, all the dragonflies were tested within 5 hours of capture to ensure their activeness. 2.2: Implementation of Experiment For every single dragonfly, its wings have to be marked by a set of dots before filming so that it is possible to track wing clap motion during flight by using reconstruction technology (explained in reconstruction part). The weight from the ink of those dots could be neglected since a fine permanent marker is selected. To track more accurately and conveniently in the reconstruction procedure, while also ensuring negligible mass of ink added, the amount of marker points must be limited and should also be able to fully describe the shape and the deformation of dragonflies' forewings and hindwings. Therefore, the distribution of markers adopted is shown as Figure 4 a). The profile of wings could be fully described by the dots on their edges, and the dots on the 10

20 middle span aid in tracking of the deformation during free flight. Also, the markers are distributed evenly both on the span-wise and chord-wise directions. After a dragonfly is marked, it will be filmed at least three times so that the motion is general and convenient to compare. The images could be seen as the normal flight of the individual with intact wings. Then the individual s single wing is damaged, and the flying motion should be filmed at least three times; finally, the symmetric wing is supposed to be cut, and similarly the flight of the individual with damage on double wings should be shot three times. a) b) Figure 4 One studied dragonfly with artificial markers and the damaged area on the forewings. a) Markers on the four wings. b) Damaged area on the forewings. The hatched parts I and II are the loss area. The main purposes of designing wing-damage experiments are to know the role of forewing in dragonfly maneuverability and the effect of wing area loss on performance of free flight. Based on the characteristic of dragonfly wings in flight and the purposes of 11
21 the experiment mentioned above, the damaged area is determined along the span of wings, and the damaged area is 40% of an entire forewing, as shown as Figure 4 b). The red hatched part is supposed to be cut off, and the damaged area should be symmetric if both wings need to be cut. That is, for example, after the flight of a dragonfly with left forewing damage (Area I in Figure 4 b)) is filmed, the right forewing is supposed to be cut, and the cutoff area should be coincident with that of the left forewing (Area II in Figure 4 b)). After the experiments were finished, three sets of images from one of 15 dragonflies are selected to investigate since they have similar free flying motion but with different damaged situations. Table 1 shows the free flying motion in the three cases (IW, OFD, and DFD). Flying motion Intact Wings (IW) Takeoff with left turn (90 ) One-sided Forewing Damage (OFD) Double-side Forewing Damage (DFD) Takeoff with left turn (90 ) Takeoff with right turn (180 ) Table 1 Flying motion of the dragonfly in the three cases As shown in Table 1, the motion in each case is takeoff maneuver. In the IW case, the dragonfly that had intact wings turned to left almost 90 when it took off, and there was a slight rise in vertical direction within 0.223s. Then the left forewing was cut off 40% along span in the OFD case, and that dragonfly went through 180 in the similar direction 12


22 as the IW case when it took off. However, it flew down in vertical direction during turning. After the turning motion was finished, it kept climbing up and flew through a very long distance in vertical direction within 0.290s. The DFD case presented that the same dragonfly as IW and OFD, where both forewings were damaged, made takeoff with 180 right turning, but the vertical traveling distance was negative if a rise is defined as positive direction. All the cases mentioned above are shown in Figure 5, the pictures are randomly chosen to illustrate the entire flying motion. a) b) c) 13

23 Figure 5 Motion in different time of the three cases filmed by 3D High speed photogrammetry system. a) IW, b) OFD, c) DFD. 3: Coordinate Transformation In this thesis, the basic data of dragonflies' free flight which are obtained from Autodesk MAYA consists of the displacement of nodes on the model's body and wings and is based on the coordinate shown in Figure 6. To get the instantaneous displacement related with the original position of dragonflies, the origin O of the coordinate could be simply transformed to the center of dragonflies body mass. The displacement obtained is the position with respect to the starting location where dragonflies fly. Figure 6 Global Cartesian coordinate in reconstruction system. The origin O is coincident with the intersection point of XZ, XY, and YZ plane. XZ plane is corresponding to the top-view images from Camera 3. XY plane is with respect to the front-view images from Camera 2, and YZ plane is corresponding to the 14

24 side-view images from Camera 1. The position of three cameras mimics the highspeed photogrammetry system in laboratory. In order to compute wing kinematics, the global coordinate above should be transformed on dragonflies bodies by using Euler transformation. The transformed coordinate with respect to body is called local coordinate system and is shown in Figure 7. Since the dragonflies wings do asymmetric motion when they are turning, different wings should have different stroke planes. Also, the trajectory of one wing in different strokes is different, so the mean stroke plane is supposed to be changed when the wing moves to the next stroke. Owing to the complexity of wing motion, the mean stroke plane is defined as a least square plane with respect to the tip path within one stroke. For example, Figure 7 shows the left forewing s mean stroke plane in one stroke. Figure 7 Local coordinate system when investigating wing kinematics. The origin O' is on the wing root. X' axis is parallel to the dragonfly s body axis which points from tail to head. Y' axis is normal to the body axis and points from body s bottom to top. Z' axis is perpendicular to X' and Y' axis and points to right of the dragonfly s body. Body plane is perpendicular to the Plane X'Y'. The blue 15
25 plane which passes through the left forewing (LF) is the mean stroke plane of LF in terms of one stroke itself. Yellow line is the tip path within the one stroke. θ is the pitching angle of wings, and β is stroke plane angle with respect to the body plane. 4: Direct Numerical Simulation method (DNS) The aerodynamic performance including lift and vortex generation is solved by a validated in-house CFD solver (Dong, 2006; Mittal et al., 2008). This solver that is also called PiCar 3D solver uses non-uniform Cartesian girds and can simulate incompressible viscous flow when the region of Reynolds number is from ( ) to ( ) which is suitable for insects flight. Also, ghost-cell methodology and a sharp interface immersed boundary method are introduced to deal with complicated three-dimensional body surfaces which are composed of unstructured tri-angular elements. Figure 8 shows the validation for the solver. The case for validation is set as three dimensional flows over a semi-circle plate with aspect-ratio, angle of attack α=30, and Re=300 (Taira et al., 2009). a) b) 16
 and b) show the comparison of lift and drag coefficient from PiCar 3D solver and Taria")
 and f) presents wake structure behind the plate at t=5.0.")
26 c) d) e) f) Figure 8 Validation case. a) and b) show the comparison of lift and drag coefficient from PiCar 3D solver and Taria c) and d) present wake vorticity behind the plate at t=1.5. e) and f) presents wake structure behind the plate at t=5.0. c) and e) are the results from Taria 2009, and d) and f) are computed by PiCar 3D solver used in this thesis. 17
27 III. RESUTLS AND DISCUSSIONS 1: Morphological parameters The dragonfly s morphological parameters including mass, mid-chord length of forewings and hindwings, and mid-span length of forewings and hindwings were measured before the experiments, as shown in Table 2. The left wings and right wings are assumed to be symmetric and identical to each other. Forewing (mm) Hind Wing (mm) Data Mass (g) Span Length 30.2 Chord Length 8.4 Span Length 29.4 Chord Length 8.9 Table 2 Morphological parameters of the individual The dragonfly's mass in the OFD and DFD cases was measured respectively. Results showed that the mass of wing area removal is less than 1% of the body mass for the two cases, so the mass of cut-off wing area could be neglected and will not influence the following results. In addition, note that this dragonfly is the lightest of the 15 dragonflies used, but the size of the body and the magnitude of wings are similar to the other dragonflies captured, so the result should be general. 18
28 2: Mean Wing beat frequency For all the cases selected above, we recorded the whole flight from the takeoff position until the dragonfly moved out of the filming domain. However, generally the takeoff maneuver could be finished within two or three wing strokes. Thus, a window of 0.08s was chosen in each of the cases for analysis. The frequency of different wings in different cases is obtained by both measurement and computation. Since free flight of takeoff maneuver is complicated, even two forewings of a dragonfly have different frequencies. After dealing with raw data directly output from MAYA, we observed that 2 complete strokes for all four wings are involved in the IW and OFD case; 2 strokes for forewings and 2.5 strokes for hindwings are contained in the DFD cases. Table 3 lists the average frequency of the four wings respectively. Case Left Forewing (Hz) Left Hindwing (Hz) Right Forewing (Hz) Right Hindwing (Hz) IW OFD DFD Table 3 Mean wing beating frequencies of four wings in the three cases 3: Displacement of the dragonfly's body The variation of the displacement during the whole flight is a basic parameter to understand free flying process of takeoff maneuver. The qualitative data of the displacement for every single point on the body can be output from MAYA file, which is 19
29 based on the global Cartesian coordinate system (shown in Figure 6) and is the raw data for the subsequent analysis. a) b) c) Figure 9 Time history of displacement in three directions. a) IW. b) OFD. c) DFD. The red line with square symbols stands for x-direction displacement, the blue line with delta symbols stands for y-direction displacement, and the black line with circle symbols stands for z-direction displacement. Figure 9 displays the instantaneous displacement of center of mass in the three cases. a) illustrates the displacement in the IW case. The x-direction displacement decreases, that is, the dragonfly is flying close to the YZ plane shown in Figure 9; the increasing displacements in y- and z-direction shows that the individual is rising and flying away from the XY plane. Figure 9 b) displays that the dragonfly in the case OFD is flying away from the XY and YZ plane but flying down slightly since the y-direction displacement is decreasing. 9 c) shows that in the case of DFD the dragonfly flies twice distance in x and z direction but has more decrease on vertical direction compared to a) and b). Consequently, comparing all the three cases, only the IW case performs the 20


30 increase on vertical displacement, while the other cases illustrate drops in the y direction when the dragonfly is doing a takeoff with turning motion. 4: Lift performance 4.1: Resultant Lift In terms of the three cases, the lift performance has to be different due to the difference of wing area loss and the difference of turning directions. From this section onwards, the left wings and the right wings are defined as inner wings and outer wings respectively if the dragonfly flies to left. Correspondingly, if the dragonfly turns to right, its left wings and right wings are defined as outer wings and inner wings respectively. Figure 10 shows the lift forces generated by four wings during 0.08s, which includes more than two complete strokes of forewings and hindwings for the IW, OFD, and DFD cases. a) b) c) 21
, b), c)iw, d), e), f) OFD, g), h), i) DFD.")
, e), and h) illustrate the lift generated by left wings, and c), f), and i) display the lift generated by")


, f), and h) presents the lift generated by the outer wings.")
31 d) e) f) g) h) i) Figure 10 Instantaneous lift generated by the individual's four wings during 0.08s. a), b), c)iw, d), e), f) OFD, g), h), i) DFD. a), d), and g) in the first column show the resultant lift generated by four wings. b), e), and h) illustrate the lift generated by left wings, and c), f), and i) display the lift generated by right wings. In figures at the second and last column the red line stands for the instantaneous lift generated by forewings, the blue line stands for the lift generated by hindwings, and the black line stands for the resultant lift of forewing and hindwing on the same side. Up and Down represent upstrokes and downstrokes. Due to the turning direction of the three cases, b), e) and i) presents the lift generated by the inner wings, c), f), and h) presents the lift generated by the outer wings. Figure 10 a) shows that, most of the time the instantaneous resultant lift is greater than the dragonfly s weight, and it keeps increasing. At the end of the studied period the resultant lift reaches to N. It is an accelerated takeoff motion. However, in d), 22
32 the resultant lift appears to have a sharp drop and rise due to the left forewing damage. The maximum value at the two biggest peaks only can approach N. The minimum resultant lift is still larger than zero, but most of the time, the lift is less than the force due to gravity. g) illustrates that the resultant lift in the DFD case appears to have a periodic decline and rise, and the trend of the resultant lift keeps decreasing during the studied period due to the effect of 40% wing area loss on each forewing; The maxima in each period of this oscillation drops from N to N, and then to N. In more than 30% of the total period, the resultant lift is negative, that is, the resultant plays a resistant role in takeoff motion. The minimum value reaches to even N. In Figure 10 b) and c), both inner wings and outer wings generate large lift during the whole period of the dragonfly left turn. The lift forces produced by the forewing and hindwing at the same side complement each other well since the lift forces produced by forewings is increased when the lift produced by hindwings is decreased. However, in e) and f) the lift generated by the inner wings fluctuates a lot compared to the outer wings in the OFD case, and the maximum lift is obtained from the left hindwing. In addition, comparing c) and f), we see that f) has a smaller magnitude of lift forces on the outer wings. For the DFD case (Figure 10 h) and i)), the inner wings generate more lift than the outer wings, which is similar to the case of OFD. However, the lift on the right hindwing in the DFD case shows a sharp drop in the following downstroke of the selected stroke. The two damaged forewings are able to generate a lift around zero (especially the outer forewing). In conclusion, the lift distribution on the inner and outer wings in the IW case is similar; whereas, after a forewing is damaged, the lift generation on the inner and outer wings will be changed based on its turning direction. For example, even if the left 23
33 forewing is cut off 40% in the OFD case, most of the time the lift generated by left wings (inner wings) is bigger than right wings (right wings) since the dragonfly is turning left. The DFD case also illustrates the same characteristics. 4.2: Lift on individual wings In order to examine detailed variation of lift forces on each wing, one stroke of the right forewing (starting from downstroke to upstroke) is chosen in each case. The stroke of hindwings is not considered since their frequencies change after the two forewings lose 40% of wing area (in Table 3). The time regions for the three cases are depicted as the yellow hatched domain in Figure 10. In order to study the difference of distribution of lift performance between the IW case and wing damage cases (OFD and DFD), the mean lift force on each wing and its percentage of mean total lift could be utilized for a comparison. Table 4, Table 5, and Table 6 display the mean value of total lift force, and lift force on each wing in the selected stroke in the three cases respectively. In addition, Table 7 shows the mean lift information in the following downstroke for the three cases. Mean Lift (N 10-3 ) Downstroke Percentage (%) Mean Lift (N 10-3 ) Upstroke Percentage (%) Total Lift Left Forewing Left Hindwing Right Forewing
34 Right Hindwing Table 4 Mean lift on the four wings and the percentage of the mean lift on each wing for the downstroke and upstroke in the IW case. Mean Lift (N 10-3 ) Downstroke Percentage (%) Mean Lift (N 10-3 ) Upstroke Percentage (%) Total Lift Left Forewing Left Hindwing Right Forewing Right Hindwing Table 5 Mean lift on the four wings and the percentage of the mean lift on each wing for the downstroke and upstroke in the OFD case. Mean Lift (N 10-3 ) Downstroke Percentage (%) Mean Lift (N 10-3 ) Upstroke Percentage (%) Total Lift Left Forewing Left Hindwing Right Forewing Right Hindwing
35 Table 6 Mean lift on the four wings and the percentage of the mean lift on each wing for the downstroke and upstroke in the DFD case. Mean Lift (N 10-3 ) IW OFD DFD Percentage (%) Mean Lift (N 10-3 ) Percentage (%) Mean Lift (N 10-3 ) Percentage (%) Total Lift Left Forewing Left Hindwing Right Forewing Right Hindwing Table 7 Mean lift on the four wings and the percentage of the mean lift on each wing for the following downstroke of the one stroke studied in the IW, OFD, and DFD cases. Firstly, the effect of forewing damage on lift performance could be seen from the variation of mean total lift forces. In the IW case, the mean value of total lift during the three half strokes keeps increasing and is always greater than the dragonfly s weight (0.6g). In contrast, the mean total lift in the case of OFD and DFD in the downstrokes (Table 5, Table 6 and Table 7) is much less than the IW case. In the DFD case the total lift force in the downstroke is negative. In the upstroke the total lift of the two damaged wing cases is close to the IW case. Consequently, the dragonfly with damaged forewings cannot produce lift efficiently, that is, wing area removal on forewings will mainly impact the lift performance during downstroke. Also, the flight of takeoff motion with two-sided forewing damage will become unstable. 26
36 In addition, during the motion of takeoff maneuver, the lift generation no longer satisfies the normal force generation pattern in which one observes that the lift is always produced more in the downstroke than the upstroke. For example, in Table 4 the total lift in the upstroke is larger than the downstroke since the dragonfly has to keep increasing lift to finish a fast takeoff motion (The following downstroke produces more lift force than the upstroke shown in Table 7). However, in the OFD and DFD cases, the lift in the downstroke cannot be maintained as in the IW case anymore, and the upstroke has to be dominant to produce lift forces in takeoff motion. Secondly, since the number of the forewings damaged in each case is different, the lift performance on each wing is also different. Compared to the IW case, the OFD case (shown in Table 5) shows that in the downstroke, mean lift generated by the inner wings is not reduced although 40% of left forewing area is lost. But the outer wings produce less lift. Also, the percentage of the lift generated by each wings in downstroke is recorded. Comparing the third column in Table 4 and Table 5, although the left forewing generated the same vertical force after cutting as when intact, its contribution to the total lift is more important since the percentage of total lift increases from 14% to 25%. Also, the left hindwing becomes more important for providing lift in the downstroke after the left forewing is damaged, and its value reaches to about 25% of total lift. Conversely, the vertical forces from the right forewing and the right hindwing drop by 18% and 4% respectively due to effect of the left forewing damage. On the other hand, in the DFD case, the mean lift produced by the left and right hindwings is approximately zero. The two damaged forewings provide negative lift forces which have an opposite direction to the lift, especially the right forewing generates a large resistant force when it 27
37 was damaged. This may be the reason why the flight of the dragonfly in the case DFD is unstable. Finally, although the mean lift force generated by the four wings is not influenced by the damage during upstroke, there is a redistribution of lift on the four wings. Comparing the vertical forces separately in the upstroke for the IW and OFD cases, the lift force from the inner wings totally drops by nearly 50% after the left forewing is damaged, while the mean lift produced by the outer wings is increased especially by the right forewing. Consequently, all the loss of total lift in the OFD case comes from the left forewing since the total lift drops by N, while the lift from left forewing decreases by N. Also, according to the values of percentage shown in the last column of Table 4 and Table 5, even if the lift produced by the inner wings decrease due to wing damage, the left forewing still plays the most important role in producing lift (as in the case of IW). In contrast, the right hindwing (the outer wing) provides the least vertical force during upstroke in both the IW and OFD cases. The magnitude of lift produced by the right forewing in the OFD case is twice the magnitude of the IW case. In the DFD case, the mean lift performance on each wing is the same as the IW case during upstroke. 50% of total lift comes from the damaged right forewing (the inner wing), and the right hindwing also generates a large amount of lift force. The outer wings only provide 25% of total lift force, which are less than the right forewing. On the other hand, the instantaneous lift and the resultant lift of the inner wings and outer wings in one stroke for the three cases are examined, as shown in Figure 11. First of all, Figure 11 a) shows the variation of the vertical force on the inner wings in the case of IW. The lift from the left forewing is nearly close to zero at the beginning of the 28
38 downstroke, and after five small peaks approaches a value of N, and the maximum value, N, displays at 0.034s at the end of the upstroke. However, the maximum value of resultant lift, N, for the inner wings is at 0.027s. The lift from left hindwing starts from N and ends at N. The maximum value N appears in the supination. During the whole stroke, the trend of resultant lift of the inner wings follows that of left forewing, that is, the left forewing during downstroke is dominant for generating lift forces. Figure 11 b) shows the lift variation of the outer wings in the IW case. The force from the right forewing starts at nearly zero and goes through three peaks then ends at zero. The maximum value N happens at 0.015s. The lift produced by the right hindwing begins at N and has a largest value at the beginning of the downstroke ( N). The second peak is in the supination of the right forewing, and its magnitude is N. At the end of the upstroke, there is a sharp rise on the lift produced by the right hindwing, and the value is changed to N at the end of the whole stroke. The trend of resultant lift of the outer wings also follows the corresponding forewing, and one obvious peak with a value of N happens in the downstroke. The maximum value of the lift produced by the right wings is less than the left wings. However, the maximum lift generated by the inner wings happens in the upstroke, while the maximum value of the outer wings appears in the downstroke. 29
39 a) b) c) d) e) f) Figure 11 Lift for four wings versus time in one completed stroke. a) and b) IW. a) Lift for the inner wings, b) Lift for the outer wings. c) and d) OFD. c) Lift for the inner wings, d) Lift for the outer wings. e) and f) DFD. e) Lift for the outer wings, f) Lift for the inner wings. The red line with cycle symbols stands for 30
40 forewings; the blue line with delta symbols stands for hindwings; the black line with square symbols stands for resultant of the inner wings or outer wings. Figure 11c) and Figure 11d) show the time history of the lift forces on individual wings in the OFD case. In Figure 11 c), the lift generated by the left forewing is changing steadily due to the 40% loss of the wing area, but the blue line which presents the vertical force on the left hindwing varies erratically. There are three peaks on the blue line within the selected domain which are larger than the red line. The values are N, N, and N respectively. Also, the lift on the left hindwing starts from zero and ends at N. The minimum value N appears at the end of the upstroke when the left forewing provides the maximum value of lift, N. The trend of the resultant force of the inner wings follows the left hindwing, so the left hindwing is dominant to produce lift force which is different from the IW case. In Figure 11 d), the lift produced by the outer wings varies slightly. The vertical lift on the right forewing has a maximum value N at 0.029s, but the resultant force does not reach the largest magnitude at that time. The minimum of the right forewing's lift is close to zero. For the lift generated by the right hindwing, the maximum value N appears at the beginning of the upstroke of the right forewing, and the minimum, N, is shown at the end of the upstroke. The resultant force has the minimum N at 0.005s and the maximum N at 0.009s. Both of these values are present in the downstroke. In the upstroke, the second peak happens in 0.028s with a value of N. In the whole stroke, the individual lift produced by the right forewing and right hindwing varies within a limited range. 31
41 The lift force on each wing in the DFD case is displayed in Figure 11 e) and f). Firstly, for the left forewing (the outer wing) which has lost 40% of the wing area in Figure 11 e), the lift generated starts from N and end at N; it has the minimum value of N in the downstroke and has a maximum value of N in the upstroke; it performs as resistance during downstroke, where it is always negative, but helps rising during upstroke in which all instantaneous values are above zero. Secondly, the lift on the left hindwing (the outer wing) starts and ends at values below zero respectively; after two small peaks it approaches the maximum, N, at the beginning of the upstroke of the right forewing; the minimum value is N. The trend of the resultant force from the outer wings follows the variation of the left hindwing, that is, the left hindwing performs most lift to help the dragonfly turn right. The maximum value of the resultant force on the outer wings is N in which the left hindwing accounts for 87%. The second obvious peak appeared at 0.028s is N, and 53% is from the left hindwing. Thirdly, Figure 11 f) shows the time history of lift generated by the inner wings. The lift on the right forewing changes slightly, begins to increase at the end of the downstroke, and reaches to N in the middle of the upstroke, then decreases sharply to zero. The lift produced by the right hindwing displays a peak value, N, at 0.007s, and then it drops suddenly to N. After that it increases again and reaches to N at the reverse of the right forewing, the maximum value during the whole stroke, and the minimum is N at the end of the upstroke. The resultant force on the inner wings reaches N at 0.022s after a few fluctuations; the minimum value N is seen at the same time as the 32
42 minimum value of the right hindwing, and the lift on the right hindwing accounts for 95% of the resultant. In conclusion, the maximum value of lift is always displayed on the left forewing in the IW case (Figure 11 a)) compared to the left hindwing, while the left hindwing in the OFD case (Figure 11 c)) always generates larger lift than the left forewing. In the other words, when the left forewing loses 40% of wing area, the lift produced will be affected immediately. Therefore, the left hindwing becomes more important on supplying lift. For b) and d), the resultant force of the outer wings in the IW case during downstroke is larger than the upstroke. However, due to the effect of the left forewing damage, the outer wings provide less lift in the whole stroke in d). Also, comparing Figure 11 c) and f) which stand for the instantaneous lift generated by the inner wings, the similarity is that the resultant lift is dependent on the hindwing. The difference is that the lift on the hindwing in the DFD case has a smaller peak value but a larger minimum value than the OFD case. Figure 11 d) and e) shows a similar trend on the lift performance of the outer wings. The left hindwing in the DFD case gives a very large value during upstroke comparing with the OFD case. The lift validations for the three cases in the time region are displayed in Table 8. As shown in Table 1, the dragonfly s mass is 0.062g (mg= N). The total lift production in the stroke could be validated by comparing the acceleration from kinematics and from aerodynamics. In Table 8, a k is obtained by. is the velocity difference within, which is the time of the selected stroke. In the IW case, within 0.036s; In the OFD case, in s; In the DFD case, in 0.034s. 33
43 IW OFD DFD Mean Lift (N 10-3 ) a (m/s 2 ) a k (m/s 2 ) Table 8 Mean lift, average vertical acceleration computed from Newton s second law, a, and average vertical acceleration computed from displacement and velocity, a k, in one stroke. As shown in Table 8, the magnitude of a in the three cases is always larger than a k. a k is 88%, 88% and 82% of a in the three cases respectively. This verifies the reasonable accuracy of the lift results and the displacement results. 5: Left hindwing kinematics According to the results above, when a forewing is damaged, the corresponding hindwing will become more important for generating lift forces. In this part, left hindwing kinematics in the IW and OFD cases are compared. Since the lift forces of the left hindwing in the OFD case appears to have two peak values during the upstroke (Figure 11 e)), that is, the left hindwing mainly generates lift forces in the upstroke, so the kinematics in the upstroke is examined. Figure 12 shows the trajectory of mid chord of the left hindwing and the variation of the pitching angle in the IW and OFD cases. Figure 12 a) shows that the mean stroke plane angle of the upstroke in the IW case is 34
44 larger than the OFD case, and b) displays that the wing pitching angle in the IW case changes from 81 to 110, but the range of angles in the OFD case is from 45 to 118. The maximum value of wing pitching angle is the same for the two cases. a) b) Figure 12 Trajectory of mid chord of the left hindwing and the corresponding instantaneous pitching angle in the IW and OFD cases. a) presents the projection of trajectory of mid chord on X'Y' plane in the left hindwing s upstroke. The circle stands for the leading edge, and the segment stands for mid-chord length project to the X'Y' plane. b) presents the wing pitch angle with respect to the stroke plane for the two cases, and the regions between two solid lines and between two dashed lines are the upstrokes of the left hindwing in the IW and OFD cases respectively. On the other hand, according to the frequency shown in Table 3, in the IW case, the left wings and the right forewing have similar frequencies in the two complete strokes, but only the right hindwing displays a lower frequency. The dragonfly in the OFD case 35

45 shows similar frequencies on the left wings and the right forewing, while the right hindwing's frequency has an obvious increase from 25.8Hz to 28.2Hz. After 40% of wing area of the two forewings is cut off separately, the frequencies of the two forewings are not changed, but the frequencies of hindwings increase slightly especially in the OFD case. 6: Flow features The flow generated by the dragonfly's four wings can show how the lift is being produced. Figure 13, Figure 14, and Figure 15 illustrate the variation of the flow features during the 0.08s for the three cases in different perspective view, respectively. Figure 16 shows the position of the three cases in the side view. a) b) 36


46 c) d) e) f) g) h) Figure 13 Flow Feature shed from the intact wings during 0.08s (the IW case). Iso-surface of vorticity λ 2 is 3. 37
 e) f)")
47 a) b) c) d) e) f) 38
. Iso-surface of vorticity λ 2 is 3.")
48 g) h) Figure 14 Flow Feature shed from the dragonfly's wings including 40% loss of left forewing area during 0.08s (the OFD case). Iso-surface of vorticity λ 2 is 3. a) b) c) d) 39

.")
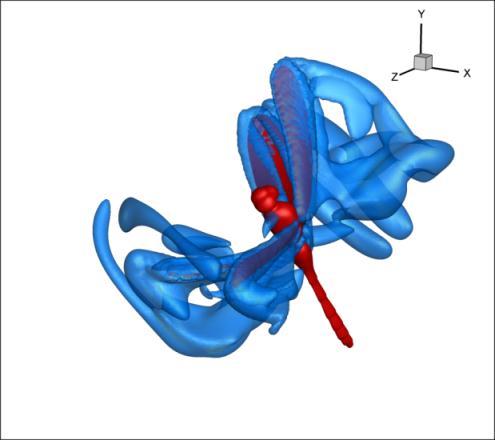
49 e) f) g) h) Figure 15 Flow Feature shed from the dragonfly's wings including 40% loss of wing area on the two forewings during 0.08s (the DFD case). Iso-surface of vorticity λ 2 is 3. 40
 merged with the wing tip vortex (TV) from forewings and hindwings, while the")


50 a) b) c) Figure 16 YZ view (side view) of the three cases. a) IW, b) OFD, c) DFD. Isosurface of vorticity λ 2 is 3. Comparing Figure 13, Figure 14 and Figure 15, the results show that the intact wings always shed a vortex ring (VR) merged with the wing tip vortex (TV) from forewings and hindwings, while the damaged forewing and the intact hindwings could not form VRs especially when the forewings are in the end of upstroke, and the hindwings are in the beginning of downstroke. Also, when the dragonfly is turning right in the DFD case, the interaction between the inner wings is increased. The way that the dragonfly improves the interaction between a forewing and a hindwing is to reduce the distance between them. However, in the OFD case, where the dragonfly is turning left, the interaction between the inner wings is not improved greatly. Figure 17, Figure 18, and Figure 19 illustrate several specific moments, when the lift forces on the inner wings is the maximum or the minimum, during one stroke to analyze wake structure and its relation with the lift production. Figure 17 shows the flow features generated by the intact wings in the IW case. The reason of discussing lift performance and vortices together is that the variation of lift could be examined by the vortices. For instance, in Figure 17 a), the inner wings produce prominent VRs, VR1 and 41

 both the inner wings and the outer wings are producing VRs, especially the VR1 and VR2 on the inner wings are formed by the TV of the left forewing and the TEV detached from the")
51 VR2, formed by the TV and the starting vortex (the detached trailing-edge vortex) of them respectively. Compared to the Figure 11 a), the vortices at this moment increase the lift forces considerably. At the same time, the lift on the left hindwing also has a small peak. Similarly, since a VR is formed by the TV to trailing-edge vortex (TEV) of the right forewing, it performs an increase of lift force at this period. In Figure 17 b) both the inner wings and the outer wings are producing VRs, especially the VR1 and VR2 on the inner wings are formed by the TV of the left forewing and the TEV detached from the trailing edge of the left hindwing. The VR1 and VR2 help the left hindwing generate lift force. According to the Figure 11 a) the lift force on the left hindwing achieves the maximum at this time, and the lift on the left forewing is also going up slightly. In addition, since the right forewing is experiencing a reversal, the TV is mainly used to help the right hindwing. Simultaneously, the vortices produced by the right hindwing are forming, so the lift from the right hindwing is rising. However, the vertical force on the right forewing keeps decreasing. a) b) 42
 presents the flow when the right forewing is in the supination, where the left hindwing perfoms a big lift at 0.018s in Figure 11 a). c) presents the vortices at 0.")
.")
52 c) d) Figure 17 Flow feature of the intact wings in the IW case. a) presents the flow at the big peak of the lift on the left forewing at 0.012s in the downstroke shown in Figure 11 a). b) presents the flow when the right forewing is in the supination, where the left hindwing perfoms a big lift at 0.018s in Figure 11 a). c) presents the vortices at 0.027s in the upstroke in Figure 11 a) when the left forewing generates the first peak. d) presents the vorticity at 0.034s when the left forewing produces the second peak value in the upstroke in Figure 11 a). The vortices generated by the four wings during upstroke are shown in Figure 17 c) and d) where the corresponding lift appears the first and second peak value of the left forewing in upstroke in Figure 11 a) respectively. In Figure 17 c), the TV detached from the left hindwing joins the TV and a stopping vortex from the left forewing and forms the VR1 and VR2. Thus, the flow behind the left forewing and the left hindwing is enhanced, and the lift forces on the inner wings are increased which causes the resultant lift to reach a maximum value. Also, if we observe the flow coming from the outer wings, little efficient vortices are shed from the right hindwing since the right hindwing is at reversal. However, some vortices shed from the right hindwing are utilized by the right forewing 43
53 so that the vortices around the right forewing keep increasing. The lift generated by the right forewing in Figure 11 b) has an increaseing trend. In Figure 17 d), the inner wings and the outer wings have similar flow structure (VR1 and VR2) formed by the TV and the TEV (stopping vortex) of the forewings and the TV of the hindwings. However, since there may be the effect of the wing pitching angle and the phase difference, the lift performance on the different wings are different: the left forewing produces the maximum, while the lift on the right forewing passed the maximum and began to decrease. The hindwings produce increased lift, and the magnitude of lift from both hindwings in the moment of Figure 17 d) is the same ( N). In conclusion, the VR formed by the TV and the TEV of the forewings and the TV of the hindwings could influence the lift performance of the forewings and the hindwings. Also, a stopping vortex shed from the trailing edge of the forewings may help the paired hindwings to generate lift forces. Finally, even if the wake structure is similar, the lift performance could be significantly different since the wing pitching angles and the phase difference may also affect the lift performance. Figure 18 shows the vorticity when the left hindwing produces the maximum or the minimum lift force in the OFD case. Figure 18 a) presents the moment when the left hindwing produces the biggest lift in the downstroke shown in Figure 11 c). The left hindwing generates a large leading-edge vortex (LEV), and then this vortex sheds from the wing tip and joins the starting vortex to forms the VR2 which can help increase lift. At this time, the left forewing generates the VR1 using the same strategy, and these VRs are very similar to the structure shown in Figure 17 a). However, the lift generated by the left forewing in the OFD is not increased as in the IW case. Figure 18 b) illustrates the 44

 is decomposed, where the right forewing is in supination.")
54 flow structure when the resultant lift of the inner wings is maximum in Figure 11 c). The TV shed from the left forewing is merged with the TV of the left hindwing to form the VR1, which increases the lift performance of the left hindwing. Also, since the VR1 is growing, the lift on the left forewing is also increasing. However, the vorticity of the outer wings in Figure 18 b) is decomposed, where the right forewing is in supination. Therefore less LEV on the right forewing is produced, and the lift generated by the outer wings drops. a) b) c) Figure 18 Flow feature of four wings including damaged left forewing in the OFD case. a) presents the flow feature when the lift generated by the left hindwing is the maximum at 0.014s in the downstroke in Figure 11 c). b) 45
55 presents the flow feature when the maximum lift is generated by the left hindwing at 0.023s in the upstroke in Figure 11 c). c) presents the vorticity when the minimum lift is generated by the left hindwing at 0.033s in the upstroke in Figure 11 c). Figure 18 c) shows that the TV shed from the left hindwing cannot join the detached vorticity from the damaged left forewing since the vortex shed from the left forewing is less than that of an intact forewing. That is, the 40% loss of wing area does impact the formation of wings' VR negatively. Since the vorticity from the damaged left forewing cannot be utilized to enhance the vortices from the left hindwing in the downstroke of the forewing, the lift drops evidently. The VR2 formed by the TV and the TEV of the left hindwing is maintained. However, the left forewing is not affected since the VR is nearly parallel to the horizontal surface which can prominently increase the lift performance. On the other hand, the vortices shed from the outer wings merge together. The vertical force generated by the right hindwing increases slightly, while the force from the right forewing decreases. In conclusion, after the left forewing is cut, the vortices are reduced, and the interaction of the vorticity between the left forewing and left hindwing is decreased compared the IW and OFD cases. Figure 19 shows the vorticity in the DFD case in terms of the maximum or minimum lift force generated by the inner wings. Figure 19 a) displays that only the right hindwing produces a VR (VR2) formed by the TV and the TEV (starting vortex), and hence only the lift on the right hindwing has a peak value (in Figure 11 e) and f)). Figure 19 b) shows that the TV and the TEV (stopping vortex) of the right forewing join the TV 46


56 detached from the right hindwing and form the VR1. The outer wings also generate the same VR. However, the TEV shed from the right forewing is stronger than the left forewing because the TEV of the left forewing has been detached and shed while the right forewing is maintaining the TEV. Owing to this distribution of the wake structure, the right hindwing is producing the largest lift value, while the force porduced by the left hindwing reduces. The lift generated by the forewings is increasing. Also, at this moment, the vortices generated by the inner wings are stronger than the outer wings, and TEV shed from the right forewing is trying to merge with the right hindwing. a) b) c) d) 47
57 Figure 19 Flow feature of the four wings in the DFD case. a) presents the vorticity in terms of the first peak value of the lift generated by the right hindwing at 0.008s in the downstroke shown in Figure 11 f). b) presents the vortices in terms of the biggest lift generated by the right hindwing at 0.023s in the upstroke shown in Figure 11 f). c) presents the flow when the lift generated by the right forewing is the maximum in the upstroke at 0.027s in Figure 11 f). d) presents the vorticity when the lift generated by the right hindwing is minimum in the upstroke at 0.034s in Figure 11 f). Figure 19 c) illustrates that the TV shed from the right forewing cannot connect to either the TEV of the right forewing, or the TV detached from the right hindwing. However, the TEV of the right forewing joins the TV of the right hindwing and forms the VR1. The TVs of the outer wings are connected, and the TEV (stopping vortex) of the left forewing enhances the VR. In contrast, the TEV of the left hindwing is not utilized. The vorticity from the inner and the outer wings shows that the resultant lift on the right side is bigger than the left side, which exactly matches the quantitative lift shown in Figure 11 e) and f). Figure 19 d) shows the flow structure at the end of the upstroke of the right forewing when the hindwings are starting downstroke. There is no VR from the two paired wings at this time. The right hindwing does not produce any efficient vortex, so the lift drops to a minimum and becomes resistive. The TEV and the TV shed from the right forewing are stronger than the left forewing, so the lift from the former is starting to increase while the lift generated by the latter keeps decreasing. Also, because of the damaged forewings, the wake structure at this moment is not effective in producing lift. 48


 presents the vortex around the left forewing in the IW case. b) presents the vortex near the damaged left forewing in the OFD case, and the vortex at the left side is produced by the left hindwing.")
58 Also, the forewings and hindwings do not have as much interaction as the intact forewings and hindwings. Comparing Figure 17, 18 and 19, the VR1 which stands for the combination of the TV shed from the wings at the same side always exists in the IW case. However, after the left forewing or double forewings are damaged, the VR1 in the upstroke of the forewing could not be formed anymore. In order to study this phenomenon, the vortex around 75% of the inner forewing s leading edge from the wing root is studied. Figure 20 shows the sliced vorticity on the inner forewing at the end of the downstroke. a) b) c) Figure 20 Comparison of the vorticity slice of the inner forewing at the end of downstroke. a) presents the vortex around the left forewing in the IW case. b) presents the vortex near the damaged left forewing in the OFD case, and the vortex at the left side is produced by the left hindwing. For the vortex generated by the left forewing in a) and b), the blue area stands for the LEV, and the red and yellow area stands for the TEV. c) presents the vortex generated by the damaged right forewing in the DFD case. The red area stands for the LEV, and the blue area stands for the TEV since the motion of the dragonfly with two-sided forewing damage is right turn different from the IW and OFD cases. 49
INVESTIGATION OF AIRFOIL FOR AN INSECT-SIZED FLAPPING WING
 INVESTIGATION OF AIRFOI FOR AN INSECT-SIZED FAING WING Hiroto Nagai*, Koji Isogai*, Nobuhide Uda*, Kosei Ono* *Kyushu University Keywords: Flapping Wing, Insect Airfoil, Morphing Airfoil, CFD, Corrugation
Influence of rounding corners on unsteady flow and heat transfer around a square cylinder
 Influence of rounding corners on unsteady flow and heat transfer around a square cylinder S. K. Singh Deptt. of Mech. Engg., M. B. M. Engg. College / J. N. V. University, Jodhpur, Rajasthan, India Abstract
Quantification of the Effects of Turbulence in Wind on the Flutter Stability of Suspension Bridges
 Quantification of the Effects of Turbulence in Wind on the Flutter Stability of Suspension Bridges T. Abbas 1 and G. Morgenthal 2 1 PhD candidate, Graduate College 1462, Department of Civil Engineering,
Development of a Four-Fin Bio-Inspired UUV: CFD Studies
 Naval Research Laboratory Washington, DC 20375-5320 NRL/MR/6040--12-9426 Development of a Four-Fin Bio-Inspired UUV: CFD Studies Ravi Ramamurti Jason Geder Laboratory for Propulsion, Energetic, and Dynamic
Unsteady airfoil experiments
 Unsteady airfoil experiments M.F. Platzer & K.D. Jones AeroHydro Research & Technology Associates, Pebble Beach, CA, USA. Abstract This paper describes experiments that elucidate the dynamic stall phenomenon
Signature redacted Signature of Author:... Department of Mechanical Engineering
 Review of Flapping Foil Actuation and Testing of Impulsive Motions for Large, Transient Lift and Thrust Profiles by Miranda Kotidis Submitted to the Department of Mechanical Engineering in Partial Fulfillment
Fish Biorobotics. Fishes as model systems for understanding aquatic propulsion. George V. Lauder Harvard University
 Fish Biorobotics Fishes as model systems for understanding aquatic propulsion 28,000 species of fishes Half of all vertebrates are fishes Fishes are 550 million years old Tremendous opportunity for selection
Walking with coffee: when and why coffee spills
 Walking with coffee: when and why coffee spills Hans C. Mayer and Rouslan Krechetnikov Department of Mechanical Engineering University of California at Santa Barbara February 20-24, 2012 Page 1/25 Motivation
Aerodynamics and Vortex Structures of a Flapping Airfoil in Forward Flight in Proximity of Ground
 Washington University in St. Louis Washington University Open Scholarship Engineering and Applied Science Theses & Dissertations Engineering and Applied Science Spring 5-19-2017 Aerodynamics and Vortex
Experimental Study on Flapping Wings at Low Reynolds Numbers
 Experimental Study on Flapping Wings at Low Reynolds Numbers S. Kishore Kumar, M.Tech Department of Aeronautical Engineering CMR Technical Campus, Hyderabad, Andhra Pradesh, India K. Vijayachandar, Ms
The Study on the Influence of Gust Wind on Vehicle Stability Chen Wang a, Haibo Huang b*, Shaofang Xu c
 Applied Mechanics and Materials Submitted: 214-6-4 ISSN: 1662-7482, Vol. 598, pp 198-21 Accepted: 214-6-4 doi:1.428/www.scientific.net/amm.598.198 Online: 214-7-16 214 Trans Tech Publications, Switzerland
It should be noted that the symmetrical airfoil at zero lift has no pitching moment about the aerodynamic center because the upper and
 NAVWEPS -81-8 and high power, the dynamic pressure in the shaded area can be much greater than the free stream and this causes considerably greater lift than at zero thrust. At high power conditions the
AERODYNAMIC CHARACTERISTICS OF NACA 0012 AIRFOIL SECTION AT DIFFERENT ANGLES OF ATTACK
 AERODYNAMIC CHARACTERISTICS OF NACA 0012 AIRFOIL SECTION AT DIFFERENT ANGLES OF ATTACK SUPREETH NARASIMHAMURTHY GRADUATE STUDENT 1327291 Table of Contents 1) Introduction...1 2) Methodology.3 3) Results...5
AERODYNAMIC CHARACTERISTICS OF SPIN PHENOMENON FOR DELTA WING
 ICAS 2002 CONGRESS AERODYNAMIC CHARACTERISTICS OF SPIN PHENOMENON FOR DELTA WING Yoshiaki NAKAMURA (nakamura@nuae.nagoya-u.ac.jp) Takafumi YAMADA (yamada@nuae.nagoya-u.ac.jp) Department of Aerospace Engineering,
Relationship of roll and pitch oscillations in a fin flapping at transitional to high Reynolds numbers
 Supplementary Information: Relationship of roll and pitch oscillations in a fin flapping at transitional to high Reynolds numbers Authors: Promode R. Bandyopadhyay, David N. Beal, J. Dana Hrubes, and Arun
Keywords: dynamic stall, free stream turbulence, pitching airfoil
 Applied Mechanics and Materials Vol. 225 (2012) pp 103-108 Online available since 2012/Nov/29 at www.scientific.net (2012) Trans Tech Publications, Switzerland doi:10.4028/www.scientific.net/amm.225.103
Wind Flow Model of Area Surrounding the Case Western Reserve University Wind Turbine
 Wind Flow Model of Area Surrounding the Case Western Reserve University Wind Turbine Matheus C. Fernandes 1, David H. Matthiesen PhD *2 1 Case Western Reserve University Dept. of Mechanical Engineering,
Aerodynamic Terms. Angle of attack is the angle between the relative wind and the wing chord line. [Figure 2-2] Leading edge. Upper camber.
![Aerodynamic Terms. Angle of attack is the angle between the relative wind and the wing chord line. [Figure 2-2] Leading edge. Upper camber.](/thumbs/82/86661300.jpg "Aerodynamic Terms. Angle of attack is the angle between the relative wind and the wing chord line. [Figure 2-2] Leading edge. Upper camber.") Chapters 2 and 3 of the Pilot s Handbook of Aeronautical Knowledge (FAA-H-8083-25) apply to powered parachutes and are a prerequisite to reading this book. This chapter will focus on the aerodynamic fundamentals
Chapters 2 and 3 of the Pilot s Handbook of Aeronautical Knowledge (FAA-H-8083-25) apply to powered parachutes and are a prerequisite to reading this book. This chapter will focus on the aerodynamic fundamentals
Figure 1 Figure 1 shows the involved forces that must be taken into consideration for rudder design. Among the most widely known profiles, the most su
 THE RUDDER starting from the requirements supplied by the customer, the designer must obtain the rudder's characteristics that satisfy such requirements. Subsequently, from such characteristics he must
Investigation on 3-D Wing of commercial Aeroplane with Aerofoil NACA 2415 Using CFD Fluent
 Investigation on 3-D of commercial Aeroplane with Aerofoil NACA 2415 Using CFD Fluent Rohit Jain 1, Mr. Sandeep Jain 2, Mr. Lokesh Bajpai 3 1PG Student, 2 Associate Professor, 3 Professor & Head 1 2 3
ANALYSIS OF AERODYNAMIC CHARACTERISTICS OF A SUPERCRITICAL AIRFOIL FOR LOW SPEED AIRCRAFT
 ANALYSIS OF AERODYNAMIC CHARACTERISTICS OF A SUPERCRITICAL AIRFOIL FOR LOW SPEED AIRCRAFT P.Sethunathan 1, M.Niventhran 2, V.Siva 2, R.Sadhan Kumar 2 1 Asst.Professor, Department of Aeronautical Engineering,
Aerodynamic Performance of Trains with Different Longitudinal Section Lines under Crosswind
 2017 2nd International Conference on Industrial Aerodynamics (ICIA 2017) ISBN: 978-1-60595-481-3 Aerodynamic Performance of Trains with Different Longitudinal Section Lines under Crosswind Taizhong Xie
Analysis of stroke technique using acceleration sensor IC in freestyle swimming
 Analysis of stroke technique using acceleration sensor IC in freestyle swimming Y. Ohgi, M. Yasumura Faculty of Environmental Information, Keio Univ., Japan H. Ichikawa Doctoral Prog. of Health and Sport
Stability and Flight Controls
 Stability and Flight Controls Three Axes of Flight Longitudinal (green) Nose to tail Lateral (blue) Wing tip to Wing tip Vertical (red) Top to bottom Arm Moment Force Controls The Flight Controls Pitch
The effect of back spin on a table tennis ball moving in a viscous fluid.
 How can planes fly? The phenomenon of lift can be produced in an ideal (non-viscous) fluid by the addition of a free vortex (circulation) around a cylinder in a rectilinear flow stream. This is known as
The Usage of Propeller Tunnels For Higher Efficiency and Lower Vibration. M. Burak Şamşul
 The Usage of Propeller Tunnels For Higher Efficiency and Lower Vibration M. Burak Şamşul ITU AYOC 2014 - Milper Pervane Teknolojileri Company Profile MILPER is established in 2011 as a Research and Development
Aerodynamic Analysis of a Symmetric Aerofoil
 214 IJEDR Volume 2, Issue 4 ISSN: 2321-9939 Aerodynamic Analysis of a Symmetric Aerofoil Narayan U Rathod Department of Mechanical Engineering, BMS college of Engineering, Bangalore, India Abstract - The
SEMI-SPAN TESTING IN WIND TUNNELS
 25 TH INTERNATIONAL CONGRESS OF THE AERONAUTICAL SCIENCES SEMI-SPAN TESTING IN WIND TUNNELS S. Eder, K. Hufnagel, C. Tropea Chair of Fluid Mechanics and Aerodynamics, Darmstadt University of Technology
Aerodynamic Shape Design of the Bow Network Monitoring Equipment of High-speed Train
 2017 2nd International Conference on Industrial Aerodynamics (ICIA 2017) ISBN: 978-1-60595-481-3 Aerodynamic Shape Design of the Bow Network Monitoring Equipment of High-speed Train Wang Zhe and Ji Peng
Research on Small Wind Power System Based on H-type Vertical Wind Turbine Rong-Qiang GUAN a, Jing YU b
 06 International Conference on Mechanics Design, Manufacturing and Automation (MDM 06) ISBN: 978--60595-354-0 Research on Small Wind Power System Based on H-type Vertical Wind Turbine Rong-Qiang GUAN a,
Aerodynamic Analysis of Blended Winglet for Low Speed Aircraft
 , July 1-3, 2015, London, U.K. Aerodynamic Analysis of Blended Winglet for Low Speed Aircraft Pooja Pragati, Sudarsan Baskar Abstract This paper provides a practical design of a new concept of massive
Anna University Regional office Tirunelveli
 Effect of Tubercle Leading Edge Control Surface on the Performance of the Double Delta Wing Fighter Aircraft P Sharmila 1, S Rajakumar 2 1 P.G. Scholar, 2 Assistant Professor, Mechanical Department Anna
Ermenek Dam and HEPP: Spillway Test & 3D Numeric-Hydraulic Analysis of Jet Collision
 Ermenek Dam and HEPP: Spillway Test & 3D Numeric-Hydraulic Analysis of Jet Collision J.Linortner & R.Faber Pöyry Energy GmbH, Turkey-Austria E.Üzücek & T.Dinçergök General Directorate of State Hydraulic
Preliminary design of a high-altitude kite. A flexible membrane kite section at various wind speeds
 Preliminary design of a high-altitude kite A flexible membrane kite section at various wind speeds This is the third paper in a series that began with one titled A flexible membrane kite section at high
POWERED FLIGHT HOVERING FLIGHT
 Once a helicopter leaves the ground, it is acted upon by the four aerodynamic forces. In this chapter, we will examine these forces as they relate to flight maneuvers. POWERED FLIGHT In powered flight
DYAMIC BEHAVIOR OF VORTEX SHEDDING FROM AN OSCILLATING THREE-DIMENSIONAL AIRFOIL
 27 TH INTERNATIONAL CONGRESS OF THE AERONAUTICAL SCIENCES DYAMIC BEHAVIOR OF VORTEX SHEDDING FROM AN OSCILLATING THREE-DIMENSIONAL AIRFOIL Hiroaki Hasegawa*, Kennichi Nakagawa** *Department of Mechanical
Aerodynamic Performance of 160km Box Car
 Aerodynamic Performance of 16km Box Car *Tianyun Dong 1) and Xifeng Liang 2) 1), 2) Key Laboratory of Traffic Safety on Track of Ministry of Education, School of Traffic & Transportation Engineering, Central
Effect of Different Design Parameters On Lift, Thrust and Drag of an Ornithopter
 Proceedings of the World Congress on Engineering 2010 Vol II Effect of Different Design Parameters On Lift, Thrust and Drag of an Ornithopter M Afzaal Malik 1, Farooq Ahmad 2 Abstract Research in the field
Lecture # 08: Boundary Layer Flows and Controls
 AerE 344 Lecture Notes Lecture # 8: Boundary Layer Flows and Controls Dr. Hui Hu Department of Aerospace Engineering Iowa State University Ames, Iowa 511, U.S.A Flow Separation on an Airfoil Quantification
CFD AND EXPERIMENTAL STUDY OF AERODYNAMIC DEGRADATION OF ICED AIRFOILS
 Colloquium FLUID DYNAMICS 2008 Institute of Thermomechanics AS CR, v.v.i., Prague, October 22-24, 2008 p.1 CFD AND EXPERIMENTAL STUDY OF AERODYNAMIC DEGRADATION OF ICED AIRFOILS Vladimír Horák 1, Dalibor
THE BRIDGE COLLAPSED IN NOVEMBER 1940 AFTER 4 MONTHS OF ITS OPENING TO TRAFFIC!
 OUTLINE TACOMA NARROWS BRIDGE FLOW REGIME PAST A CYLINDER VORTEX SHEDDING MODES OF VORTEX SHEDDING PARALLEL & OBLIQUE FLOW PAST A SPHERE AND A CUBE SUMMARY TACOMA NARROWS BRIDGE, USA THE BRIDGE COLLAPSED
A STUDY OF THE LOSSES AND INTERACTIONS BETWEEN ONE OR MORE BOW THRUSTERS AND A CATAMARAN HULL
 A STUDY OF THE LOSSES AND INTERACTIONS BETWEEN ONE OR MORE BOW THRUSTERS AND A CATAMARAN HULL L Boddy and T Clarke, Austal Ships, Australia SUMMARY CFD analysis has been conducted on a 100m catamaran hull
The Aerodynamic Improvement of a Flexible Flapping Wing
 The Aerodynamic Improvement of a Flexible Flapping Wing Tadateru ISHIDE 1, Kazuya NAGANUMA 1, Ryo FUJII 1 and Kazuo MAENO 1 1 Department of Mechanical Engineering, National Institute of Technology, Kisarazu
Aerodynamic investigation of Winglets on Wind Turbine Blades using CFD
 Risø-R-1543(EN) Aerodynamic investigation of Winglets on Wind Turbine Blades using CFD Jeppe Johansen and Niels N. Sørensen Risø National Laboratory Roskilde Denmark February 26 Author: Jeppe Johansen
KINEMATIC ANALYSIS OF SHOT PUT IN ELITE ATHLETES A CASE STUDY
 KINEMATIC ANALYSIS OF SHOT PUT IN ELITE ATHLETES A CASE STUDY Weimin Liu and Mingxuan Wang Jiangsu Research Institute of Sports Science, Nanjing, People's Republic of China This paper presented the application
8d. Aquatic & Aerial Locomotion. Zoology 430: Animal Physiology
 8d. Aquatic & Aerial Locomotion 1 Newton s Laws of Motion First Law of Motion The law of inertia: a body retains its state of rest or motion unless acted on by an external force. Second Law of Motion F
COMPUTATIONAL FLUID DYNAMIC ANALYSIS OF AIRFOIL NACA0015
 International Journal of Mechanical Engineering and Technology (IJMET) Volume 8, Issue 2, February 2017, pp. 210 219 Article ID: IJMET_08_02_026 Available online at http://www.iaeme.com/ijmet/issues.asp?jtype=ijmet&vtype=8&itype=2
NUMERICAL INVESTIGATION OF THE FLOW BEHAVIOUR IN A MODERN TRAFFIC TUNNEL IN CASE OF FIRE INCIDENT
 - 277 - NUMERICAL INVESTIGATION OF THE FLOW BEHAVIOUR IN A MODERN TRAFFIC TUNNEL IN CASE OF FIRE INCIDENT Iseler J., Heiser W. EAS GmbH, Karlsruhe, Germany ABSTRACT A numerical study of the flow behaviour
EXPERIMENTAL STUDY OF WIND PRESSURES ON IRREGULAR- PLAN SHAPE BUILDINGS
 BBAA VI International Colloquium on: Bluff Bodies Aerodynamics & Applications Milano, Italy, July, 2-24 8 EXPERIMENTAL STUDY OF WIND PRESSURES ON IRREGULAR- PLAN SHAPE BUILDINGS J. A. Amin and A. K. Ahuja
Numerical and Experimental Investigation of the Possibility of Forming the Wake Flow of Large Ships by Using the Vortex Generators
 Second International Symposium on Marine Propulsors smp 11, Hamburg, Germany, June 2011 Numerical and Experimental Investigation of the Possibility of Forming the Wake Flow of Large Ships by Using the
Investigation of Suction Process of Scroll Compressors
 Purdue University Purdue e-pubs International Compressor Engineering Conference School of Mechanical Engineering 2006 Investigation of Suction Process of Scroll Compressors Michael M. Cui Trane Jack Sauls
Comparison of Wind Turbines Regarding their Energy Generation.
 Comparison of Wind Turbines Regarding their Energy Generation. P. Mutschler, Member, EEE, R. Hoffmann Department of Power Electronics and Control of Drives Darmstadt University of Technology Landgraf-Georg-Str.
Aero Club. Introduction to Flight
 Aero Club Presents Introduction to RC Modeling Module 1 Introduction to Flight Centre For Innovation IIT Madras Page2 Table of Contents Introduction:... 3 How planes fly How is lift generated?... 3 Forces
THEORETICAL EVALUATION OF FLOW THROUGH CENTRIFUGAL COMPRESSOR STAGE
 THEORETICAL EVALUATION OF FLOW THROUGH CENTRIFUGAL COMPRESSOR STAGE S.Ramamurthy 1, R.Rajendran 1, R. S. Dileep Kumar 2 1 Scientist, Propulsion Division, National Aerospace Laboratories, Bangalore-560017,ramamurthy_srm@yahoo.com
Dillon Thorse Flow Visualization MCEN 4047 Team Poject 1 March 14th, 2013
 Dillon Thorse Flow Visualization MCEN 4047 Team Poject 1 March 14 th, 2013 1 Introduction I have always been entranced by flight. Recently I have been taking flying lessons, and I have been learning the
CFD ANALYSIS OF FLOW AROUND AEROFOIL FOR DIFFERENT ANGLE OF ATTACKS
 www.mechieprojects.com CFD ANALYSIS OF FLOW AROUND AEROFOIL FOR DIFFERENT ANGLE OF ATTACKS PRESENTATION OUTLINE AIM INTRODUCTION LITERATURE SURVEY CFD ANALYSIS OF AEROFOIL RESULTS CONCLUSIONS www.mechieprojects.com
Forest Winds in Complex Terrain
 Forest Winds in Complex Terrain Ilda Albuquerque 1 Contents Project Description Motivation Forest Complex Terrain Forested Complex Terrain 2 Project Description WAUDIT (Wind Resource Assessment Audit and
Ball impact dynamics of knuckling shot in soccer
 Available online at www.sciencedirect.com Procedia Engineering 34 (2012 ) 200 205 9 th Conference of the International Sports Engineering Association (ISEA) Ball impact dynamics of knuckling shot in soccer
Measurement and simulation of the flow field around a triangular lattice meteorological mast
 Measurement and simulation of the flow field around a triangular lattice meteorological mast Matthew Stickland 1, Thomas Scanlon 1, Sylvie Fabre 1, Andrew Oldroyd 2 and Detlef Kindler 3 1. Department of
Aerodynamics Principles
 Aerodynamics Principles Stage 1 Ground Lesson 3 Chapter 3 / Pages 2-18 3:00 Hrs Harold E. Calderon AGI, CFI, CFII, and MEI Lesson Objectives Become familiar with the four forces of flight, aerodynamic
A COMPUTATIONAL STUDY ON THE DESIGN OF AIRFOILS FOR A FIXED WING MAV AND THE AERODYNAMIC CHARACTERISTIC OF THE VEHICLE
 28 TH INTERNATIONAL CONGRESS OF THE AERONAUTICAL SCIENCES A COMPUTATIONAL STUDY ON THE DESIGN OF AIRFOILS FOR A FIXED WING MAV AND THE AERODYNAMIC CHARACTERISTIC OF THE VEHICLE Jung-Hyun Kim*, Kyu-Hong
Unsteady Aerodynamic Forces: Experiments, Simulations, and Models. Steve Brunton & Clancy Rowley FAA/JUP Quarterly Meeting April 6, 2011
 Unsteady Aerodynamic Forces: Experiments, Simulations, and Models Steve Brunton & Clancy Rowley FAA/JUP Quarterly Meeting April 6, Wednesday, March 8, Motivation Applications of Unsteady Models Conventional
Low Speed Wind Tunnel Wing Performance
 Low Speed Wind Tunnel Wing Performance ARO 101L Introduction to Aeronautics Section 01 Group 13 20 November 2015 Aerospace Engineering Department California Polytechnic University, Pomona Team Leader:
Aerodynamic study of a cyclist s moving legs using an innovative approach
 Aerodynamic study of a cyclist s moving legs using an innovative approach Francesco Pozzetti 30 September 2017 Abstract During a period of four weeks in September, I completed a research project in fluid
ISOLATION OF NON-HYDROSTATIC REGIONS WITHIN A BASIN
 ISOLATION OF NON-HYDROSTATIC REGIONS WITHIN A BASIN Bridget M. Wadzuk 1 (Member, ASCE) and Ben R. Hodges 2 (Member, ASCE) ABSTRACT Modeling of dynamic pressure appears necessary to achieve a more robust
High Swept-back Delta Wing Flow
 Advanced Materials Research Submitted: 2014-06-25 ISSN: 1662-8985, Vol. 1016, pp 377-382 Accepted: 2014-06-25 doi:10.4028/www.scientific.net/amr.1016.377 Online: 2014-08-28 2014 Trans Tech Publications,
COMPUTER-AIDED DESIGN AND PERFORMANCE ANALYSIS OF HAWT BLADES
 5 th International Advanced Technologies Symposium (IATS 09), May 13-15, 2009, Karabuk, Turkey COMPUTER-AIDED DESIGN AND PERFORMANCE ANALYSIS OF HAWT BLADES Emrah KULUNK a, * and Nadir YILMAZ b a, * New
DUE TO EXTERNAL FORCES
 17B.6 DNS ON GROWTH OF A VERTICAL VORTEX IN CONVECTION DUE TO EXTERNAL FORCES Ryota Iijima* and Tetsuro Tamura Tokyo Institute of Technology, Yokohama, Japan 1. INTRODUCTION Various types of vertical vortices,
Numerical Investigation of Multi Airfoil Effect on Performance Increase of Wind Turbine
 International Journal of Engineering & Applied Sciences (IJEAS) International Journal of Engineering Applied Sciences (IJEAS) Vol.9, Issue 3 (2017) 75-86 Vol.x, Issue x(201x)x-xx http://dx.doi.org/10.24107/ijeas.332075
INTERFERENCE EFFECT AND FLOW PATTERN OF FOUR BIPLANE CONFIGURATIONS USING NACA 0024 PROFILE
 Proceedings of the International Conference on Mechanical Engineering 211 (ICME211) 18-2 December 211, Dhaka, Bangladesh ICME11-FL-1 INTERFERENCE EFFECT AND FLOW PATTERN OF FOUR BIPLANE CONFIGURATIONS
High fidelity gust simulations around a transonic airfoil
 High fidelity gust simulations around a transonic airfoil AEROGUST Workshop 27 th - 28 th April 2017, University of Liverpool Presented by B. Tartinville (Numeca) Outline of the presentation 1Objectives
Power efficiency and aerodynamic forces measurements on the Dettwiler-wind turbine
 Institut für Fluiddynamik ETH Zentrum, ML H 33 CH-8092 Zürich P rof. Dr. Thomas Rösgen Sonneggstrasse 3 Telefon +41-44-632 2646 Fax +41-44-632 1147 roesgen@ifd.mavt.ethz.ch www.ifd.mavt.ethz.ch Power efficiency
AE Dept., KFUPM. Dr. Abdullah M. Al-Garni. Fuel Economy. Emissions Maximum Speed Acceleration Directional Stability Stability.
 Aerodynamics: Introduction Aerodynamics deals with the motion of objects in air. These objects can be airplanes, missiles or road vehicles. The Table below summarizes the aspects of vehicle performance
Flight Corridor. The speed-altitude band where flight sustained by aerodynamic forces is technically possible is called the flight corridor.
 Flight Corridor The speed-altitude band where flight sustained by aerodynamic forces is technically possible is called the flight corridor. The subsonic Boeing 747 and supersonic Concorde have flight corridors
CFD ANALYSIS AND COMPARISON USING ANSYS AND STAR-CCM+ OF MODEL AEROFOIL SELIG 1223
 International Journal of Mechanical Engineering and Technology (IJMET) Volume 8, Issue 11, November 2017, pp. 312 318, Article ID: IJMET_08_11_034 Available online at http://www.iaeme.com/ijmet/issues.asp?jtype=ijmet&vtype=8&itype=11
2-D Computational Analysis of a Vertical Axis Wind Turbine Airfoil
 2-D Computational Analysis of a Vertical Axis Wind Turbine Airfoil Akshay Basavaraj1 Student, Department of Aerospace Engineering, Amrita School of Engineering, Coimbatore 641 112, India1 Abstract: This
Effect of Inlet Clearance Gap on the Performance of an Industrial Centrifugal Blower with Parallel Wall Volute
 International Journal of Fluid Machinery and Systems DOI: http://dx.doi.org/10.5293/ijfms.2013.6.3.113 Vol. 6, No. 3, July-September 2013 ISSN (Online): 1882-9554 Original Paper (Invited) Effect of Inlet
Wind tunnel tests of a non-typical stadium roof
 Wind tunnel tests of a non-typical stadium roof G. Bosak 1, A. Flaga 1, R. Kłaput 1 and Ł. Flaga 1 1 Wind Engineering Laboratory, Cracow University of Technology, 31-864 Cracow, Poland. liwpk@windlab.pl
1. A cannon shoots a clown directly upward with a speed of 20 m/s. What height will the clown reach?
 Physics R Date: 1. A cannon shoots a clown directly upward with a speed of 20 m/s. What height will the clown reach? How much time will the clown spend in the air? Projectile Motion 1:Horizontally Launched
Pressure coefficient on flat roofs of rectangular buildings
 Pressure coefficient on flat roofs of rectangular buildings T. Lipecki 1 1 Faculty of Civil Engineering and Architecture, Lublin University of Technology, Poland. t.lipecki@pollub.pl Abstract The paper
A comparison of NACA 0012 and NACA 0021 self-noise at low Reynolds number
 A comparison of NACA 12 and NACA 21 self-noise at low Reynolds number A. Laratro, M. Arjomandi, B. Cazzolato, R. Kelso Abstract The self-noise of NACA 12 and NACA 21 airfoils are recorded at a Reynolds
WESEP 594 Research Seminar
 WESEP 594 Research Seminar Aaron J Rosenberg Department of Aerospace Engineering Iowa State University Major: WESEP Co-major: Aerospace Engineering Motivation Increase Wind Energy Capture Betz limit: 59.3%
Numerical and Experimental Investigations of Lift and Drag Performances of NACA 0015 Wind Turbine Airfoil
 International Journal of Materials, Mechanics and Manufacturing, Vol. 3, No., February 2 Numerical and Experimental Investigations of Lift and Drag Performances of NACA Wind Turbine Airfoil İzzet Şahin
A COMPARATIVE STUDY OF MIX FLOW PUMP IMPELLER CFD ANALYSIS AND EXPERIMENTAL DATA OF SUBMERSIBLE PUMP
 IMPACT: International Journal of Research in Engineering & Technology (IMPACT: IJRET) ISSN 2321-8843 Vol. 1, Issue 3, Aug 2013, 57-64 Impact Journals A COMPARATIVE STUDY OF MIX FLOW PUMP IMPELLER CFD ANALYSIS
CRITERIA OF BOW-DIVING PHENOMENA FOR PLANING CRAFT
 531 CRITERIA OF BOW-DIVING PHENOMENA FOR PLANING CRAFT Toru KATAYAMA, Graduate School of Engineering, Osaka Prefecture University (Japan) Kentarou TAMURA, Universal Shipbuilding Corporation (Japan) Yoshiho
Numerical simulation and analysis of aerodynamic drag on a subsonic train in evacuated tube transportation
 Journal of Modern Transportation Volume 20, Number 1, March 2012, Page 44-48 Journal homepage: jmt.swjtu.edu.cn DOI: 10.1007/BF03325776 1 Numerical simulation and analysis of aerodynamic drag on a subsonic
WIND-INDUCED LOADS OVER DOUBLE CANTILEVER BRIDGES UNDER CONSTRUCTION
 WIND-INDUCED LOADS OVER DOUBLE CANTILEVER BRIDGES UNDER CONSTRUCTION S. Pindado, J. Meseguer, J. M. Perales, A. Sanz-Andres and A. Martinez Key words: Wind loads, bridge construction, yawing moment. Abstract.
 Kochi University of Technology Aca Study on Dynamic Analysis and Wea Title stem for Golf Swing Author(s) LI, Zhiwei Citation 高知工科大学, 博士論文. Date of 2015-03 issue URL http://hdl.handle.net/10173/1281 Rights
COMPUTATIONAL FLOW MODEL OF WESTFALL'S LEADING TAB FLOW CONDITIONER AGM-09-R-08 Rev. B. By Kimbal A. Hall, PE
 COMPUTATIONAL FLOW MODEL OF WESTFALL'S LEADING TAB FLOW CONDITIONER AGM-09-R-08 Rev. B By Kimbal A. Hall, PE Submitted to: WESTFALL MANUFACTURING COMPANY September 2009 ALDEN RESEARCH LABORATORY, INC.
Computational Investigation of Airfoils with Miniature Trailing Edge Control Surfaces
 AIAA-24-5 Computational Investigation of Airfoils with Miniature Trailing Edge Control Surfaces Hak-Tae Lee, Ilan M. Kroo Stanford University, Stanford, CA 9435 Abstract Miniature trailing edge effectors
INTERACTION BETWEEN WIND-DRIVEN AND BUOYANCY-DRIVEN NATURAL VENTILATION Bo Wang, Foster and Partners, London, UK
 INTERACTION BETWEEN WIND-DRIVEN AND BUOYANCY-DRIVEN NATURAL VENTILATION Bo Wang, Foster and Partners, London, UK ABSTRACT Ventilation stacks are becoming increasingly common in the design of naturally
ZIN Technologies PHi Engineering Support. PHi-RPT CFD Analysis of Large Bubble Mixing. June 26, 2006
 ZIN Technologies PHi Engineering Support PHi-RPT-0002 CFD Analysis of Large Bubble Mixing Proprietary ZIN Technologies, Inc. For nearly five decades, ZIN Technologies has provided integrated products and
Wind tunnel effects on wingtip vortices
 48th AIAA Aerospace Sciences Meeting Including the New Horizons Forum and Aerospace Exposition 4-7 January 2010, Orlando, Florida AIAA 2010-325 Wind tunnel effects on wingtip vortices Xin Huang 1, Hirofumi
CFD ANALYSIS OF AIRFOIL SECTIONS
 CFD ANALYSIS OF AIRFOIL SECTIONS Vinayak Chumbre 1, T. Rushikesh 2, Sagar Umatar 3, Shirish M. Kerur 4 1,2,3 Student, Jain College of Engineering, Belagavi, Karnataka, INDIA 4Professor, Dept. of Mechanical
NUMERICAL SIMULATION OF STATIC INTERFERENCE EFFECTS FOR SINGLE BUILDINGS GROUP
 NUMERICAL SIMULATION OF STATIC INTERFERENCE EFFECTS FOR SINGLE BUILDINGS GROUP Xing-qian Peng, Chun-hui Zhang 2 and Chang-gui Qiao 2 Professor, College of Civil Engineering, Huaqiao University, Quanzhou,
Aerodynamic Measures for the Vortex-induced Vibration of π-shape Composite Girder in Cable-stayed Bridge
 Aerodynamic Measures for the Vortex-induced Vibration of π-shape Composite Girder in Cable-stayed Bridge *Feng Wang 1), Jialing Song 2), Tuo Wu 3), and Muxiong Wei 4) 1), 2, 3), 4) Highway School, Chang
Experimental and Theoretical Investigation for the Improvement of the Aerodynamic Characteristic of NACA 0012 airfoil
 International Journal of Mining, Metallurgy & Mechanical Engineering (IJMMME) Volume 2, Issue 1 (214) ISSN 232 46 (Online) Experimental and Theoretical Investigation for the Improvement of the Aerodynamic
Influence of wing span on the aerodynamics of wings in ground effect
 Influence of wing span on the aerodynamics of wings in ground effect Sammy Diasinos 1, Tracie J Barber 2 and Graham Doig 2 Abstract A computational fluid dynamics study of the influence of wing span has
Numerical Simulation And Aerodynamic Performance Comparison Between Seagull Aerofoil and NACA 4412 Aerofoil under Low-Reynolds 1
 Advances in Natural Science Vol. 3, No. 2, 2010, pp. 244-20 www.cscanada.net ISSN 171-7862 [PRINT] ISSN 171-7870 [ONLINE] www.cscanada.org *The 3rd International Conference of Bionic Engineering* Numerical
DEFINITIONS. Aerofoil
 Aerofoil DEFINITIONS An aerofoil is a device designed to produce more lift (or thrust) than drag when air flows over it. Angle of Attack This is the angle between the chord line of the aerofoil and the