HELICOPTER BLADE TIP VORTEX MODIFICATIONS IN HOVER USING PIEZOELECTRICALLY MODULATED BLOWING
|
|
|
- Crystal Carr
- 6 years ago
- Views:
Transcription
1 HELICOPTER BLADE TIP VORTEX MODIFICATIONS IN HOVER USING PIEZOELECTRICALLY MODULATED BLOWING A Thesis Presented to The Academic Faculty by Roxana Vasilescu In Partial Fulfillment of the Requirements for the Degree Doctor of Philosophy in Aerospace Engineering Georgia Institute of Technology November 2004
2 HELICOPTER BLADE TIP VORTEX MODIFICATIONS IN HOVER USING PIEZOELECTRICALLY MODULATED BLOWING Approved by: Dr. D. Stefan Dancila, Chairman Dr. Lakshmi N. Sankar Dr. Massimo Ruzzene Dr. Marilyn Smith Dr. Yung H. Yu Date Approved: November 17, 2004
3 Pangloss sometimes said to Candide: All events are interconnected in this best of all possible worlds, for if you hadn t been driven from a beautiful castle with hard kicks in the behind because of your love for Lady Cunegonde, if you hadn t been seized by the Inquisition, if you hadn t thrust your sword through the baron, and if you hadn t lost all your sheep from the land of Eldorado, you wouldn t be here eating candied citrons and pistachio nuts. Well said, replied Candide, but we must cultivate our garden. (Candide or Optimism-Voltaire, translated by Lowell Bair)
4 To my parents, Anisoara and Aurelian, to my sister, Cristina, and to John
5 ACKNOWLEDGEMENT I would like to thank my advisor, Dr.Stefan Dancila, for giving me the chance to find in him an inspired and creative academic advisor and, especially, a friend. I would like to thank Dr. Lakshmi Sankar, Dr. Massimo Ruzzene, Dr. Marilyn Smith and Dr. Yung Yu who, through their input and questions as Committee Members, added significant value and quality to this thesis. I would like to thank my dear lab mates: Yuan, Samer, Serkan, Kwantae, Sandeep and Renfu. Their generous hearts and open minds made our lab a warm and creative place to work. Moreover, an important artisan of this beautiful atmosphere is Dr.Erian Armanios to whom I would like to express my sincere appreciation. I would like to thank my Romanian fellows from the School of Aerospace Engineering, Ionut, Tudor and Radu with whom I shared many black coffees in our wanderings here, far away from home. My thoughts are going now toward my family, to whom I would like to express my thanks for their acceptance and unconditional love. I am lucky to have their support and belief in me wherever I have gone, as well as my father's satirical rhymes. I would like to recognize John Milner, who was the behind-the-curtain editor of this thesis. No page escaped his red pencil. My last thoughts are dedicated to my grandparents, my former professors and my dear friends, who cannot any more be near me, but whose shadows of love encouraged me in my moments of doubt. So many times, memories of them inspired my steps forward. With all of these, I am sharing now the precious pages of this thesis. v
6 TABLE OF CONTENTS ACKNOWLEDGEMENT. TABLE OF CONTENTS... LIST OF TABLES..... LIST OF FIGURES... LIST OF SYMBOLS SUMMARY.... CHAPTER I INTRODUCTION Background Objectives CHAPTER II LITERATURE SURVEY Passive Control of Tip Flow using Slotted Blade Tip Active Control of Flow Boundary Conditions using Blowing Jets Tip Air Mass Injection (TAMI) Blade Discrete Blade Tip Jets Spanwise Blowing Zero-Net-Mass Jets Active Flow Control Using Piezoelectric Actuation Piezoelectrically Modulated/Vectored Blowing Concept. CHAPTER III ROTOR SYSTEM CONFIGURATION AND MODELING APPROACH Rotor Configuration Methodology Description. 3.3 CFD Simulations for Rotor Configurations... v vi ix xi xvii xx vi
7 CHAPTER IV ELECTROMECHANICAL MODELING OF A PIEZOELECTRICALLY CONTROLLED CYLINDRICAL VALVE Piezoelectric Bender Coupled with a Cylindrical Valve Static Model Dynamic Model Coupling Assumptions Numerical Results.. CHAPTER V METHODOLOGY VALIDATION Two Dimensional Elliptical Airfoil with Modulated Blowing Grid Generation Solver description Boundary Conditions Numerical Tests Parameters Baseline Case Combined Electromechanical/CFD Results Parametric Study. 5.2 Rounded Wing Tip with Modulated Tangential Blowing Numerical Results CHAPTER VI STUDIES OF TIP VORTEX FORMATION FOR A TWO- BLADED ROTOR IN HOVER Introduction General Aspect of Rotor Wake Vortex Formation and Near Wake Evolution for a Rounded Blade Tip Vortex Formation Roll-up Process Tip Vortex Core Structure Vortex Formation and Near Wake Evolution for a Square Blade Tip Comparison between Experimental and CFD Data Far Wake Vortex Evolution Potential of BVI Noise Reduction vii
8 6.8 Summary of Observations CHAPTER VII STUDIES OF TIP VORTEX ALTERATION VIA STEADY BLOWING Introduction Blowing Cost Rounded Tip Rotor Blade with Tangential Blowing Vortex Formation Vortex Evolution Vortex Core Parameters Comparison between the Steady Blowing and Baseline Cases at the same Thrust Tip Vortex Evolution Potential of BVI Noise Reduction Rounded Tip Rotor Blade with Lateral Blowing... CHAPTER VIII STUDIES OF TIP VORTEX ALTERATION VIA MODULATED BLOWING Introduction Vortex Formation Vortex Evolution Vortex Core Parameters CHAPTER IX CONCLUSIONS AND RECOMMENDATIONS Introduction Conclusions Recommendations APPENDIX A..... APPENDIX A..... REFERENCES... VITA viii
9 LIST OF TABLES Table 4.1 Table 4.2 Table 6.1 Table 7.1 Table 7.2 Table 7.3 Table 7.4 Table 7.5 Table 7.6 Table 7.7 Table 8.1 Table 8.2 Table 8.3 Table 8.4 Table 8.5 Table 8.6 Piezoelectric material properties and geometrical characteristics First three natural frequencies for the free piezoelectric bender and for the coupled piezoelectric bender cylindrical valve system... Variation of vortex core parameters for baseline case.... Variation of vortex core parameters for steady blowing case.. Variation of vortex core parameters for steady blowing case.. Variation of vortex core parameters for steady blowing case with the same thrust coefficient as the baseline case. Variation of vortex core parameters for steady mid-plane blowing. Variation of vortex core parameters for steady mid-plane blowing with anhedral jet angle. Comparison of vortex core parameters between steady mid-plane blowing case and no blowing- baseline case.... Comparison of vortex core parameters between steady mid-plane blowing with anhedral jet angle case and no blowing- baseline case.. Variation of vortex core parameters at 7 deg wake age... Comparison of vortex core parameters between modulated blowing case and baseline case at 7 deg wake age.... Variation of vortex core parameters at 10 deg wake age..... Comparison of vortex core parameters between modulated blowing case and baseline case at 10 deg wake age... Variation of vortex core parameters at 20 deg wake age..... Comparison of vortex core parameters between modulated blowing case and baseline case at 20 deg wake age ix
10 Table 8.7 Table 8.8 Variation of vortex core parameters at 30 deg wake age..... Comparison of vortex core parameters between modulated blowing case and baseline case at 30 deg wake age x
11 LIST OF FIGURES Figure 2.1 Figure 2.2 Figure 2.3 Figure 2.4 Figure 2.5 Figure 3.1 Figure 3.2 Figure 3.3 Figure 3.4 Figure 4.1 Figure 4.2 Figure 4.3 Figure 4.4 Figure 5.1 Figure 5.2 Figure 5.3 Figure 5.4 Figure 5.5 Schematic view of the internal channel at the blade tip.... Schematic representation of the slotted tip blade.. Close-up of tip vortex cores with the measured core sizes (---) at 60 deg wake age for both blade tips..... Piezoelectrically actuated cylindrical valve wing section... Active wing section implementing jet flap vectoring smoke tunnel testing.. Tangential blowing over rounded blade tip... Tangential blowing cycle... Mid-plane blowing configurations Schematic representation of the actuation system. Cylindrical valve - Schematic representation of the misaligned slots Magnitude and phase angle of the frequency response. Numerical results for 2 different frequencies of input signal: f=1hz (left) and f=20hz (right).... Numerical results for 2 different frequencies of input signal: f=25hz (left) and f=30hz (right)... Computational O-grid.... Vortex shedding pattern for baseline case: streak-lines representation. Applied voltage signal, f=10hz... Piezoelectric bender tip displacement and cylindrical valve rotation angle. Blowing jet angle and jet slot height ratio xi
12 Figure 5.6 Figure 5.7 Figure 5.8 Figure 5.9 Figure 5.10 Figure 5.11 Figure 5.12 Figure 5.13 Figure 6.1 Figure 6.2 Figure 6.3 Figure 6.4 Figure 6.5 Figure 6.6 Figure 6.7 Figure 6.8 Figure 6.9 Figure 6.10 Figure 6.11 Figure 6.12 Figure 6.13 Time variation and limit cycle response of lift coefficient f=10hz.. Time variation of jet momentum coefficient, f=10hz.. Time variation of blowing angle and lift coefficient f=10hz, 15Hz, 20Hz.... C-H Grid: General view and a X-plane view section.... Variation of lift coefficient with number of iterations Limit cycle type response of lift coefficient.. Baseline test- no blowing. Comparative representations of velocity flow patterns..... Computational 3D streamlines starting near the blade tip. Rotor plane (a) and radial plane (b) projections of the rotor wake Cross-flow velocity patterns during the vortex formation for a rounded blade tip... Cross-flow streamlines represented for 60%, 70% and 90% of chord. Pressure iso-contours near the blade tip Schematic diagram of vortex sheet rollup..... Two-dimensional flow patterns for vorticity lines.... Flow pattern in the radial plane corresponding to 7.1 o vortex age Flow pattern in the radial plane corresponding to 10 o vortex age. Flow pattern in the radial plane corresponding to 20 o vortex age. Flow pattern in the radial plane corresponding to 30 o vortex age. Sullivan s vortex model. Occurrence of stable limit cycle in the streamlines pattern xii
13 Figure 6.14 Figure 6.15 Figure 6.16 Figure 6.17 Figure 6.18 Figure 6.19 Figure 6.20 Figure 6.21 Figure 6.22 Figure 6.23 Figure 6.24 Figure 6.25 Figure 6.26 Figure 6.27 Figure 6.28 Figure 6.29 Figure 6.30 Figure 6.31 Cross-flow velocity patterns during the vortex formation for a square blade tip..... Cross-flow streamlines represented for 40%, 70% and 90% of chord..... Pressure iso-contours near the square tip blade. Two-dimensional flow patterns for vorticity lines for a square blade tip..... Flow pattern in the radial plan corresponding to 7.1 o vortex age for a square blade tip..... Flow pattern in the radial plan corresponding to 10 o vortex age for a square blade tip. Flow pattern in the radial plan corresponding to 20 o vortex age for a square blade tip..... Flow pattern in the radial plan corresponding to 30 o vortex age for a square blade tip..... Comparative evolution of the elliptical vortex core between the rounded and square blade tips... Experimental data for one blade and two blades configurations... Comparison between numerical and experimental data Experimental data obtained by Wong (2001) for a two-bladed rotor Comparison of the flow patterns obtained from experimental data and numerical data Reference grid blade plane view..... Modified grid blade plane view.. Reference grid detail of C-grid section view... Modified grid detail of C-grid section view.... Grid resolution for capturing the second vortex passage 275x125x111 grid size xiii
14 Figure 6.32 Figure 6.33 Figure 6.34 Figure 6.35 Figure 6.36 Figure 7.1 Figure 7.2 Figure 7.3 Figure 7.4 Figure 7.5 Figure 7.6 Figure 7.7 Figure 7.8 Figure 7.9 Figure 7.10 Figure 7.11 Tip vortex trajectory estimated computational using reference grid (top) and the refined grid compared with analytical Landgrebe s wake model... Variations of tip vortex core parameters with the wake age estimated using reference grid (top) and the refined grid.. Tip vortex evolution for a square blade tip.... Tip vortex evolution for a rounded blade tip. First passage of the tip vortex miss distance representation square blade vs. rounded blade tip. Cross-flow velocity patterns during vortex formation for tangential steady blowing.. Cross-flow streamlines represented for 50%, 70% and 90% of chord for tangential steady blowing Pressure iso-contours near the tip blade for tangential steady blowing.. Two-dimensional flow patterns for vorticity lines for tangential steady blowing.. Flow pattern in the radial plane corresponding to 7.1 vortex age for tangential steady blowing... Flow pattern in the radial plane corresponding to 10 vortex age for tangential steady blowing.... Flow pattern in the radial plane corresponding to 20 vortex age for tangential steady blowing.... Flow pattern in the radial plane corresponding to 30 vortex age for tangential steady blowing... Evolution of velocity profiles for different wake ages for tangential steady blowing..... Evolution of velocity profiles for 7.1 o and 30 o wake ages for tangential steady blowing with same thrust as baseline Comparison of tip vortex evolutions between steady blowing case and baseline (no blowing) case for 7.1 o and 30 o wake ages xiv
15 Figure 7.12 Figure 7.13 Figure 7.14 Figure 7.15 Figure 7.16 Figure 7.17 Figure 8 1 Figure 8.2 Figure 8.3 Figure 8.4 Figure 8.5 Figure 8.6 Figure 8.7 Figure 8.8 Figure 8.9 Figure 8.10 Comparison of tip vortex evolutions between steady blowing case and baseline (no blowing) case for 60o and 80o wake ages. Comparison of tip vortex evolutions between steady blowing case and baseline (no blowing) case for 135 o and 170 o wake ages.. Comparison of prescribed Landgrebe's wake model for rounded blade tip with no blowing and tangential steady blowing. First passage of the tip vortex miss distance representation steady blowing vs. baseline (no blowing). Flow patterns for spanwise steady blowing from a slot located at the mid-plane..... Flow patterns for spanwise steady blowing with 30 deg anhedral jet angle from a slot located at the mid-plane Variation of slot cells during blowing cycle..... Variation of performance coefficients vs. blowing coefficient. Cross-flow velocity patterns during the vortex formation for modulated blowing for 30% and 40% chord sections. Cross-flow velocity patterns during the vortex formation for modulated blowing for 50% and 60% chord sections. Cross-flow velocity patterns during the vortex formation for modulated blowing for 70% and 80% chord sections. Cross-flow velocity patterns during the vortex formation for modulated blowing for 90% chord and trailing edge sections. Cross-flow streamlines represented for 50%, 70% and 90% chord sections for 0/4 period blowing phase Cross-flow streamlines represented for 50%, 70% and 90% chord sections for 1/4 period blowing phase.. Cross-flow streamlines represented for 50%, 70% and 90% chord sections for 2/4 period blowing phase.. Cross-flow streamlines represented for 50%, 70% and 90% chord sections for 3/4 period blowing phase xv
16 Figure 8.11 Figure 8.12 Figure 8.13 Figure 8.14 Figure 8.15 Figure 8.16 Figure 8.17 Figure 8.18 Two-dimensional flow patterns for cross-flow vorticity lines represented for 7.1 o and 10 o wake age planes... Two-dimensional flow patterns for cross-flow vorticity lines represented for 20 o and 30 o wake age planes.... Flow pattern in the radial planes corresponding to the vortex ages of 7.1 o and 10 o... Flow pattern in the radial planes corresponding to the vortex ages of 20 o and 30 o.... Comparison of velocity distributions at 7 o vortex age for the rotor without blowing (baseline) and the rotor with steady and unsteady blowing.. Comparison of velocity distributions at 10 o vortex age for the rotor without blowing (baseline) and the rotor with steady and unsteady blowing.. Comparison of velocity distributions at 20 o vortex age for the rotor without blowing (baseline) and the rotor with steady and unsteady blowing.... Comparison of velocity distributions at 30 o vortex age for the rotor without blowing (baseline) and the rotor with steady and unsteady blowing xvi
17 LIST OF SYMBOLS a b 1 c C d C l C Q C T C µ d 31 E 3 E 11 f i f v g h slot h e slot k 1 I 1 J c L 1 m 1 Freestream speed of sound Piezoelectric bender width Wing/ Rotor blade section chord Wing section drag coefficient Wing section lift coefficient Rotor torque coefficient Rotor thrust coefficient Blowing momentum coefficient Piezoelectric strain constant Electric field Piezoelectric material Young s modulus Applied voltage input signal frequency Vortex shedding frequency Airfoil thickness Slot height Height of the jet at the exit section Bending curvature Area moment of inertia of the bender Mass moment of inertia of the cylinder Piezoelectric bender length Piezoelectric bender mass xvii
18 m c Inner cylinder mass m& jet Jet blowing mass flow rate M b M BL p p * r 0e r 0i r 1e r 1i R Re Ri St t 1 T * T jet T V V V jet V TIP V a Blocked bending moment Reference blowing jet Mach number Freestream static pressure Stagnation pressure in plenum Outer radius of the fixed cylinder Inner radius of the fixed cylinder Outer radius of the inner cylinder Inner radius of the inner cylinder Radial coordinate Reynolds number Richardson number Strouhal number Piezoelectric bender thickness Stagnation temperature in plenum Temperature at the jet slot exit Freestream temperature Applied control voltage Freestream velocity Blowing jet velocity Rotor tip velocity Axial (streamwise) velocity xviii
19 V r V t X,Y,Z W α β γ ρ ρ jet ω r,θ Γ Ψ Radial velocity Tangential (swirl) velocity Cylindrical coordinates related to rotor system Piezoelectric bender tip displacement Inner cylinder rotation angle Blowing jet angle Specific heat ratio (adiabatic constant for air) Freestream density Blowing jet density Vorticity vector Polar coordinates Circulation Blade azimuth angle xix
20 SUMMARY Aeroacoustic investigations regarding different types of helicopter noise have indicated that the most annoying noise is caused by impulsive blade surface pressure changes in descent or forward flight conditions. Blade Vortex Interaction (BVI) is one of the main phenomena producing significant impulsive noise by the unsteady fluctuation in blade loading due to the rapid change of induced velocity field during interaction with vortices shed from previous blades. The tip vortex core structure and the blade vortex miss distance were identified as having a primary influence on BVI. In this thesis, piezoelectrically modulated and/or vectored blowing at the rotor blade tip is theoretically investigated as an active technique for modifying the structure of the tip vortex core as well as for increasing blade vortex miss distance. The mechanisms of formation and convection of rotor blade tip vortices up to and beyond 360 degrees wake age are described based on the CFD results for the baseline cases of a hovering rotor with rounded and square tips. A methodology combining electromechanical and CFD modeling is developed and applied to the study of a piezoelectrically modulated and vectored blowing two-dimensional wing section. The thesis is focused on the CFD analysis of rotor flow with modulated tangential blowing over a rounded blade tip, and with steady mid-plane blade tip blowing, respectively. Computational results obtained for steady tangential blowing indicate that the miss distance can be doubled compared to the baseline case, which may lead to a significant reduction in BVI noise level if this trend shown in hover can be replicated in low speed forward flight. Results also show that through modulated blowing a higher dissipation of vorticity can be obtained. xx
21 CHAPTER I INTRODUCTION 1.1. Background Over the past twenty years, the use of helicopters has increased substantially in both the military and the commercial sectors, providing motivation for extensive research to more accurately predict blade airloads, to further improve helicopter performance and to reduce helicopter noise. The need for helicopter noise reduction represents, in fact, one of the strongest current motivations for research programs targeted at an increased understanding of rotor flow physics. The complexity of rotor flow, directly influenced by the structure, intensity, and trajectories of its blade tip vortices, represents a challenge for state-of- the-art helicopter design. It has been recognized that all complex aerodynamic, structural dynamics and aeroacoustic rotorcraft phenomena are related to these concentrated tip vortices generated at the blade tip and trailed into the rotor wake. Unlike the wing case, the rotor wake remains near the rotor, inducing a strong three-dimensional velocity field. Through this induced velocity field, the rotor wake causes modifications of the aerodynamic loads on the blade. Additionally, the presence of the rotor wake close to the rotor blade causes the Blade Vortex Interaction (BVI) phenomenon. BVI is an unsteady fluctuation in blade loading due to the rapid change of induced velocity field during interaction with vortices 1
22 shed from previous blade passages. It determines an impulsive change in pressure, translated into a significant source of noise known as BVI noise. In general, BVI noise occurs during slow-speed descent operations and has strong radiation directivity below and ahead of the rotor. Therefore, this can be a troublesome noise source to the surrounding community as well as to the pilot and/or passengers. These conditions explain the strong research interest in the reduction of BVI noise. Another incentive for rotor wake studies is its influence on rotor performance, structural vibration, aeroelastic stability, blade airloads, and blade control loads. In spite of consistent progress, an advanced design for maximized rotorcraft performance is still obstructed by the difficulty of accurately predicting the rotor wake structure and trajectory. The capability to modify the wake structure is constrained by the level of understanding of the phenomena of rotor wake formation and evolution. Unfortunately, the physics behind these phenomena of formation and evolution is still incompletely understood. The variations with vortex age of vortex core parameters, such as radius and swirl velocity, as well as the vortex trajectory are significant factors in an accurate modeling of the tip vortex. The difficulties raised by the uncertain identification of the main features of the vortex core lead, in the opinion of Spalart (1998), to an exaggerated emphasis on vortex core parameters, defined by using the simplistic Rankine s vortex model. In fact, an analytical tip vortex model that would be widely accepted is still desired. A mechanism able to explain the persistence of tip vortices for a few rotor revolutions is still lacking as well. Significant progress was achieved, nevertheless, in both the theoretical and the experimental areas. Experiments (Tangler, 1978; Hoad, 1980; Smith and Sigl, 1995; 2
23 Coyne et al., 1997; Martin and Leishman, 2002) showed that the blade tip geometry influences the vortex growth rate and the vortex persistence. As well, Wong (2001), experimentally studying the tip vortex mechanisms of formation and evolution in forward flight at a 0.1 advance ratio, observed that the blade surface roughness influences strongly the vortex characteristics. These observed dependencies indicate that the mechanism of flow separation, which determines the tip vortex formation, plays a significant role in the subsequent evolution and diffusion of the vortex. Recently, more attention has been paid to investigate the effect of streamwise (axial) velocity upon the tip vortex. For a long time the influence of this axial velocity was ignored. The usual characteristic parameter for the tip vortex was the circumferential (swirl) velocity. Furthermore, the vortex flow used to be considered axisymmetric. The reason for this lack of three-dimensional representation is the debate in the research community regarding the significance of the core axial velocity in relationship to swirl velocity values (Mahalingam, 1999). The investigations regarding airplane trailing vortices (Spalart, 1998) revealed that the velocity profile relative to the atmosphere can be found to be directed in some circumstances towards the wing ( wake-like profile) while in other circumstances away from it ( jet-like profile), raising further uncertainties regarding the axial velocity effect. However, for the helicopter case, measurements by McAlister (1996) for a two-bladed rotor in hover showed a strong wake-like axial velocity distribution. This behavior was consistently confirmed by recent experimental results in hover (Coyne et al., 1997; Martin and Leishman, 2002) and in low-speed forward flight (Mahalingam and Komerath, 1998; Mahalingam, 1999). 3
24 Another debate subject concerns the role played by turbulence in the mechanism of formation, growth and decay of tip vortices (e.g. Spalart, 1998). A frequent opinion is that the flow pattern representations obtained experimentally suggest that the growth rate and the persistence of the tip vortices for several rotor revolutions can be explained by a laminar process rather than by a turbulent one. An explanation for this behavior can be provided by noticing that the centrifugal force due to swirling motion in the vortex core can have a stabilizing effect (Schlichting, 1955), impeding the transport of turbulent energy from small scale eddies towards the vortex core. Thus, the vortex core is characterized by an inner solid-body like rotation region in which the flow is mainly laminar, with diffusion occurring only at the molecular level. However, the complex influence of the three-dimensional flow as well as the significance and sources of turbulence are still subjects of fundamental research for both fixed and rotary wings. The currently limited understanding of the physics behind the tip vortex formation and dynamics is also reflected in the development of the numerical research. The complexity of the unsteady rotor flow represents a technical challenge for current state-of the-art CFD, especially when applied to wake capturing. The limitation in grid resolution and the embedded numerical viscosity of the schemes generate a non-physical dissipation of the rotor wake, which reduces the prediction accuracy of the tip vortex characteristics for large tip vortex age. Beyond these recognized confined CFD capabilities, the uncertainties of the experimental results make it difficult to surpass the shortcomings of the turbulence models or to impose more accurately the boundary conditions in the flow solver (Dacles-Mariani et al., 1999). Therefore, the accuracy and reliability of the numerical results are difficult to establish without comparative experimental data. A key 4
25 element in validating the numerical results is the data processing technique. One advantage of a CFD analysis, in contrast to an experimental investigation, is its capability of capturing the data in the entire surrounding flow. Consequently, flow patterns can be visualized in any chosen flow region, providing a more continuous perspective regarding the dynamic evolution of the tip vortex. The interpretation of data based on already established theoretical concepts can help enrich the understanding of the physics behind this complex rotor flow. Therefore, emphasis must not only be placed upon the reliable generation of numerical results but also on data post-processing and interpretation in terms of phenomenological flow behavior. A better understanding of the physics regarding tip vortex formation and evolution can lead to more pertinent technical solutions for improved helicopter performance or reduced effects of BVI. A conclusion of experimental and theoretical studies (Hardin and Lamkin, 1987; Yu, 2000; McAlister et al., 2001) found that the parameters most influential in BVI noise generation are: (1) blade-vortex miss distance, r, defined as the separation distance of the vortex from the airfoil blade; and (2) vortex intensity and vortex core size. Many concepts proposed and investigated with respect to their potential for achieving noise reduction are attempting to modify the core structure of tip vortices as well as to alter their trajectories. In an attempt to modify the tip vortex structure for BVI noise reduction, many blade tips (ogee, BERP, vane, etc.) or special devices (spoilers, sub-wings, end plates, etc.), designed to diffuse the blade tip vortex structure have been shown to not be successful without a severe penalty in performance (Yu, 2000; McAlister et al., 2001). 5
26 An alternate active technique proposed to modify the characteristics of concentrated tip vortices is to use positive mass blowing jets near the blade tip. At the end of the 1970s, White investigated the benefits of a Tip Air Mass Injection (TAMI) system for rotor noise reduction (White et al., 1975). The TAMI concept is based on the idea of injecting a high-pressure jet in the chordwise or spanwise direction. When the air jet is injected into the tip vortex core, an intensified dissipation of the vorticity is created as a result of the higher level of turbulence induced by the jet stream. Experimental and theoretical investigations, including that performed by White and his collaborators, were focused on the possibility of modifying the near field structure of the tip vortex. White s results (1980) suggest that, using a spanwise TAMI system, a decrease in the drag induced by the tip vortex can be obtained. Additionally, the vortex structure is changed as it forms along the airfoil chord and the vortex is moved farther outboard of the tip. Following the same approach, discrete blade tip jets can be used to destabilize the tip vortex structure. An experimental investigation (Gowanlock and Matthewson, 1999) showed that the core of the tip vortex is less concentrated and that the coherence of the vortex strength and core near the blade tip is reduced. A very recent experimental study performed by Han and Leishman (2003, 2004) investigates the modification of the tip vortex core using a slotted blade tip, which incorporates four channels from the leading edge upper surface to the tip side edge. The results showed for the tip vortex a reduction of swirl velocity s peak value of up to 60% relative to baseline value. Additionally, the corresponding core radii for different wake ages were found to be two to three times larger than the similar values measured for the baseline blade. The explanation provided to interpret these results is related to the 6
27 differences observed between the vorticity diffusion mechanisms for the two cases. It is suggested that the tip vortex diffusion of the slotted blade is more rapid because of enhanced flow mixing in the inner core, which at the same time prevents the laminar region from being sustained Objectives The main objective of this work is an investigation of modifications to helicopter blade tip vortices obtained through: 1. Geometrical changes of the blade tip shape As mentioned in the previous section, there is experimental evidence suggesting that the blade tip shape can have a significant influence on the vortex core growth and diffusion rate. Moreover, these experimental data clearly indicate that the tip vortex formation and early roll-up are affected by tip geometry changes. The current investigation is aimed at revealing and understanding the effects caused by modifications of the tip geometry. The mechanism of formation and convection of tip vortices for two configurations - square tip and rounded tip - are studied. The analysis for the rounded tip is of particular interest for further study of tangential blowing. 2. Active jet blowing. As discussed in the previous section, the available experimental tests indicated that steady blowing is effective in reducing the swirl velocity by enhancing the vorticity diffusion. Based on these experimental observations, the concept of utilizing spanwise blowing to actively control the early stages of the 7
28 formation and the location of the tip vortices is numerically investigated in this thesis. Two blowing configurations are investigated: (1) tangential blowing over a rounded blade tip and (2) midplane blade tip blowing. In both configurations, the emerging jets aimed to perturb the flow around the tip and to modify significantly the location and structure of the tip vortices as well as their further evolution. The primary focus of this investigation is upon the unsteady tangential blowing obtained through the piezoelectrical modulation of the jet slot, which is theoretically analyzed as an active technique for modifying the structure and the trajectory of tip vortex. The potential for BVI noise reduction and the estimation of the energy requirements for blowing are analyzed in order to determine the benefits and penalties of this concept. To fulfill this primary objective, the following specific objectives were established: 1. Development of an electromechanical model for the piezoelectric actuation system, coupled with a computational fluid dynamics (CFD) analysis, utilized to study the effectiveness of the piezoelectrically modulated and/or vectored blowing concept proposed by Dancila and Armanios (2000); 2. Development of a CFD capability to improve the grid resolution necessary to reliably capture the blade tip flowfield and to accurately predict the trajectory and blade tip vortex core parameters up to at least 360 deg wake age in a Navier Stokes analysis; and 3. Development of a CFD flow field post-processing data procedure to analyze and interpret the results in order to improve the physical understanding of the rotor blade tip vortex formation, roll-up, and near and far-wake evolutions due to changes in the blade tip geometry and active blowing. 8
29 CHAPTER II LITERATURE SURVEY Motivated by the noise reduction goal, numerous constructive concepts targeting the diffusion of the tip vortex were proposed during the last twenty years. These concepts can be categorized as active or passive based upon the need, or the lack thereof, for using additional energy sources. As an example of a passive technique, the blade shape design proved to play a key role in facilitating the potential reduction of high-speed impulsive noise. Furthermore, the influence of the slight modifications of the blade tip shape (such as the replacement of the square tip with a rounded tip) upon the tip vortex formation and roll-up was observed and studied experimentally (McAllister and Takahashi, 1991; Coyne et al., 1997). For a fixed wing, McAllister and Takahashi (1991) showed that the rounded blade tip has an effect on the tip vortex roll-up. However, in far wake downstream the effect on the tip vortex seems to diminish. Conducting a similar investigation for a rotor case, Coyne, Bhagwat and Leishman (1997) suggested that, while the tip shape may influence the tip vortex convection in near wake, the rolled-up vortices are essentially identical after a short wake age. This observation is at variance with the observations made by Wong (2001) for a rotor in forward flight with a 0.1 advance ratio. Wong observed that the blade surface roughness and the slight blade defects influence the evolution of the vortex core parameters as well as the vortex trajectory. 9
30 In the same noise reduction research context, special blade tip concepts targeted to modify the rotor wake structure by diffusing the tip vortex were proposed as passive means for alleviate the blade-vortex interaction. Special tip shapes the ogee tip, the BERP tip, and the vane tip - showed modest vortex diffusion gains (McAlister et al, 2001). Devices such as spoilers, sub-wings or end plates are more effective in diffusing the trailing vortex but the associated increase in drag led to a reduction of helicopter performance. Recent experimental and computational studies proposed the slotted blade tip configurations as passive solutions to enhance significantly the tip vortex diffusion (Dancila, 2002; Han and Leishman, 2003, 2004). This concept is based on the idea of capturing a near-the-blade-tip leading edge ram air and bypassing it through internal channels to mid-plane tip slots. Through these slots, the incident flow is ejected in the spanwise direction. In the following literature survey, these technical solutions are described in more details. The active category consists of concepts related to either active blade geometry modification or active flow control. Two directions of development of active concepts regarding blade geometry control can be identified: active control of certain lifting surfaces, such as trailing edge flaps or blade tips (i.e. active blade tips) and active blade twist concepts. Among the active flow control techniques proposed for modifying the flow boundary conditions, the blowing concepts (such as the TAMI system, and spanwise blade tip blowing using discrete jets) will be analyzed in more detail as a primary background information for this thesis. 10

 A recent experimental study performed by Han and Leishman (2003, 2004) investigates a similar concept.")
31 2.1 Passive Control of Tip Flow Using Slotted Blade Tip The idea of using a leading edge incident flow to provide a source for spanwise blowing at the side edge of the tip was proposed by Dancila in The schematic representations of the proposed configuration are shown in Figure 2.1. Figure 2.1 Schematic view of the internal channel at the blade tip (Dancila and Segurini, 2002) A recent experimental study performed by Han and Leishman (2003, 2004) investigates a similar concept. The slotted blade tip, illustrated in Figure 2.2, is a square tip with four embedded channels from the leading edge upper surface to the tip side edge. The pressure gradient created between the entrance and exit slots generates a flow flux captured at the leading edge and ejected in the spanwise direction at the side edge exit. A comparison with the results obtained for a baseline rectangular blade tip showed that the slotted blade reduces the swirl velocity peak by up to 60% relative to the baseline value. Additionally, the corresponding core radii for different wake ages were found to be two 11
32 to three times larger than the similar values measured for the baseline blade (Figure 2.3). The explanation provided to interpret physically these results is related to the differences observed between the vorticity diffusion mechanisms for the two cases. It is suggested that the tip vortex diffusion of the slotted blade is more rapid because of enhanced flow mixing in the inner core, which at the same time prevents the laminar region from being sustained. Meanwhile, in the baseline case, the laminar inner core region dominates the tip vortex at all ages and consequently the diffusion of vorticity is a relatively slow process due only to molecular diffusion. Based on these experimental results obtained by Han and Leishman s, a CFD study was performed by Duraisamy and Baeder (2004). Their study confirms numerically that an increased diffusion of vorticity was obtained by using streamwise and spanwise blowing. In both blowing cases, the results indicated a significant reduction of the swirl velocity and an increment of the core radius, without a significant alteration of the performance coefficients. 12

 at 60 deg wake")
33 Figure 2.2 Schematic representation of the slotted tip blade (Han and Leishman, 2004) a- baseline tip b-slotted tip Figure 2.3 Close-up of tip vortex cores with the measured core sizes (---) at 60 deg wake age for both blade tips (Han and Leishman, 2004) 13
34 2.2 Active Control of Flow Boundary Conditions Using Blowing Jets Tip Air Mass Injection (TAMI) Blade At the beginning of the 1980s, White investigated one of the active concepts for noise reduction using the blowing of a positive mass jet. By injection of a high pressure jet of air along the axis of the tip vortex core, a rapid redistribution of vorticity, as well as a dissipation of the vorticity due to the higher level of turbulence induced by the jet stream are obtained. The experimental and theoretical investigation performed by White and his collaborators analyzed two configurations of TAMI system blade tip air injection - chordwise injection and spanwise injection. The results showed that a properly designed TAMI system could restructure the near field structure of the concentrated tip vortex. Due to the mixing between the jet air mass and the vortex flow, the vortex decay is intensified. Analyzing each of the proposed configurations, White concluded that the chordwise blowing causes the tip vortex to be spread. Using a spanwise blowing the vortex structure is changed by moving the vortex further outboard of the tip. Another investigation, also conducted by White, analyzed the potential of the TAMI system to reduce the BVI noise in descending low speed flight. This study concluded that the BVI noise can be reduced by 4 to 6 db with an equivalent power expenditure of approximately 14 percent of installed power (White et al, 1975; White, 1980). 14
35 2.2.2 Discrete Blade Tip Jets Following the same idea of tip air mass injection, another active concept experimentally investigated the potential of the discrete blade tip jets to destabilize the tip vortex structure. The experiments performed at the University of Tennessee Space Institute (Gowanlock and Matthewson, 1999) showed that in the near field wake a reduction of the maximum effective velocity was obtained, from Vtip, in the case of the baseline rotor to 0.25 Vtip, in the case of steady blowing. The smoke flow visualization showed that the core of the tip vortex is less concentrated for the blowing tip configuration than for the one formed in the baseline case. This study concluded that the discrete jets reduce the coherence of the vortex strength and core near the blade tip Spanwise Blowing For rotor configurations, the idea of using spanwise blowing is motivated by the desire to increase the miss distance between the tip vortex and the blades as well as increasing the vortex dissipation. Meanwhile, for the wing case, blowing was primarily used as a circulation control application (e.g. Englar et al., 1994; Englar, 2000) with the goal of increasing lift while decreasing drag. In this context, the main effect of blowing was explained as a virtual increase of wingspan, which has as consequence a drag diminution. Tavella and his collaborators (Tavella et al., 1988) proposed and experimentally investigated the concept of lateral blowing for a low aspect ratio wing at the end of the 1980s. This concept consists in utilizing thin jets of air, which are ejected in the 15
36 spanwise direction or at a small angle with the spanwise direction, from slots at the wing tips. Flow visualizations showed that the lateral tip blowing in the mid-plane of the wing has the effect of displacing the trailing vortices outboard and upward. Moreover, at high spanwise wing-tip blowing intensities, secondary trailing vortices are created. The locations of primary and secondary tip vortices vary with the tip blowing configurations used. Another effect of the increased 'wing-span' due to the spanwise tip blowing is the lift augmentation on the wing. A comprehensive experimental and numerical study was conducted by Mineck (1992, 1994) to assess the potential aerodynamic benefits from spanwise blowing at the tip of a moderate-aspect-ratio swept wing. His analysis indicated that blowing from jets with a short chord had little effect on lift or drag. However, blowing from jets with a longer chord increased lift near the tip and reduced drag at low Mach numbers. The CFD analysis performed suggests that lift and drag increase with increasing jet momentum coefficient. One observation of Mineck s study was that spanwise blowing at the wingtip does not appear to be a practical means of improving the aerodynamic efficiency of moderate-aspect ratio swept wings at high subsonic Mach numbers. A new configuration of tangential spanwise blowing over a rounded wing tip was numerically investigated by Liu (2003). This study indicates that by using steady blowing over a rounded wing tip from an upper surface slot, the tip vortex moves outboard and downward as a function of the blowing moment coefficient. 16
37 2.2.4 Zero-Net-Mass Jets The previously discussed concepts are based on the use of the steady blowing. One of the concepts, which involves the unsteady blowing consists of zero-net-mass jets (synthetic jets). This concept is used in active control applications. A numerical investigation regarding the effects of surface blowing and/or suction on the aerodynamics of the five-bladed MD-900 rotor in low speed descent flight was performed by Hassan, Straub and Charles (1996). The results obtained in that study indicated that surface blowing is efficient in alleviating the temporally impulsive leading edge surface pressures associated with BVI. Meanwhile, the effects of suction proved to be detrimental for BVI. Additionally, Liu et al. (2000) performed a preliminary numerical investigation concerning the flow modification for a hovering rotor due the oscillatory blowing on the upper blade surface. 2.3 Active Flow Control Using Piezoelectric Actuation In recent years, active flow control using piezoelectric actuators attracted researchers interest due to the rapid response of piezoelectric materials and due to the convenient electrical power input requirement (Joslin et al., 1999). However, the recognized disadvantage of using piezoelectric materials, caused by the limitation of small induced strains, motivated extensive research efforts devoted to the development of efficient and effective piezoelectric actuation systems for active flow control applications. 17
38 Traditionally, one method of accomplishing flow control was focused on modifying the lifting surface geometry. The flow control is achieved by introducing servoelastic forces to deflect different control lifting surfaces, such as flaps, spoilers or blade tips, using piezoelectrically actuated mechanisms. Applying the same principle of structural geometric modification, active wings or active twist rotor blades were built, using embedded actuators to cause an overall deformation of the structure. Unfortunately, these methods result in reduced effectiveness due to the requirement of deforming a stiff structure by using weak actuators and due to increased weight penalty. Another method for using piezoelectric actuation to accomplish a significant change in airloads is to modify the flow boundary condition through blowing and/or suction. Synthetic (zero-net mass, blowing /suction) jets driven by piezoelectric devices represent one example of an implementation method for this approach. Because the energy for the blowing/suction process needs to be transmitted by the actuator, the effectiveness of this method is limited by the maximum values of the instantaneous mass flow rates that can be achieved. A concept proposed by Dancila and Armanios and patented in 2000 uses a piezoelectric actuator system to modulate the direction and/or intensity of a jet with positive mass flow rate. The compressor represents the main actuation power source and the piezoelectric actuator is only operating a servovalve. Therefore, large positive mass flow rates and modulation patterns are possible, increasing the authority and effectiveness in flowfield modifications. Additionally, the associated weight penalty is reduced. 18
39 In the context of unsteady circulation control, a number of experimental and numerical investigations were performed which consider the concept of periodic variation of blowing jet momentum by controlling the plenum pressure conditions. The experimental studies performed by Ghee and Leishman (1992), and by Zandieh and Leishman (1993), concerned unsteady blowing for a circulation-controlled cylinder. Their results showed a significant lift augmentation ratio, above the static values, as an effect of modulated blowing. At the same time, a significant lift hysteresis was observed, connected with the increase of blowing frequency. One difficulty concerning sinusoidal modulation was reported by Leishman and his co-workers, who experimentally investigated the unsteady blowing generated through a modulation of cylinder plenum pressure. 2.4 Piezoelectrically Modulated/Vectored Blowing Concept For the concept proposed and patented by Dancila and Armanios, the unsteady blowing is obtained by modulation of a cylindrical valve slot size. Constructively, this piezoelectric blowing modulation device operates at constant plenum pressure, providing the capacity of modulation following an arbitrary signal. A detailed description of the development of a piezoelectrically modulated and vectored blowing concept and its implementation in elliptical wing sections used for proof-of-concept testing in a low speed smoke tunnel is presented by Dancila and Vasilescu (2002, 2003). The piezoelectric blowing modulation device theoretically 19
40 modeled in this work consists of a cylindrical valve controlled by a piezoelectric bender. The bender configuration was selected due to the benefits of simplicity and due to the fact that the actuator displacement output is sufficiently large. The cylindrical valve is formed by two thin cylinders, which have an equal length thin slot along their generators. In the reference position, the two slots are aligned. The relative rotation of the cylinders, obtained by applying the cantilevered piezoelectric bimorph actuation, determines a misalignment of the slots. This slots misalignment causes the emerging jet sheet to skew and, at the same time, causes a reduction in the blowing mass flow rate. Therefore, under the effect of piezoelectric actuation, the emerging jet sheet can be vectored and modulated in intensity. An implementation of this actuator device into an elliptical airfoil wing with the cylindrical valve located at the trailing edge was tested in a low speed smoke tunnel for a qualitative proof of concept. The images of the piezoelectrically actuated cylindrical valve and of the wing section installed in the low speed smoke tunnel are shown in Figures


41 Figure 2.4 Piezoelectrically actuated cylindrical valve wing section Figure 2.5 Active wing section implementing jet flap vectoring smoke tunnel testing 21
42 CHAPTER III ROTOR SYSTEM CONFIGURATIONS AND MODELING APPROACH 3.1 Rotor Configurations The baseline rotor configuration considered in this study is similar to the one investigated experimentally by McAlister (1996) and McAlister et al. (2001). The rotor consists of two blades characterized by rectangular planform, zero twist, a chord of 7.5 in (19.05mm) and a radius of 45 in.(1.14 m). The rotor blade section is NACA0012 and the tip is rounded. The solidity of the rotor is The flow parameters considered for this theoretical study are similar to the experimental test conditions used by McAlister et al. (2001). In that work the rotor was tested in hover at a constant rotor speed of 870 rpm, corresponding to a tip speed of 104.1m/s. The ambient test conditions consisted of an average temperature of 65 o F (291.5K) and a barometric pressure of 760mm Hg. The corresponding Reynolds number based on the chord dimension was The collective pitch angle was 8 degrees and the tip Mach number was 0.3. A piezoelectric blowing modulation device is assumed to be implemented at the blade tip. Two configurations are investigated. 22
. The maximum slot height is 0.")
43 The first configuration consists of tangential blowing in the spanwise direction over the rounded blade tip. The jet slot is located on the upper wing surface above the rounded tip edge and spans over 35% of chord starting at 40% of chord from the leading edge (Figure 3.1). The maximum slot height is of chord. The unsteady blowing is assumed to be obtained by variation of slot size at a constant plenum pressure. In Figure 3.2, the fully open and half open slot positions are represented. The detailed design of the valve system is not the subject of the current work. Instead, the analysis and modeling of the piezoelectric blowing modulation device proposed by Dancila and Armanios (1998, 2000) is used to establish relevant blowing cycle forms to be assumed for the CFD component of the work. The schedule for blowing is considered to start from the fully open slot position (maximum blowing). The slot height reduces in the first half of the cycle, up to the fully closed slot position (no blowing) and it increases in the second part of the cycle. Figure 3.1 Tangential blowing over rounded blade tip 23
.")
44 Section view totally open slot configuration Section view half open slot configuration Figure 3.2 Tangential blowing cycle The second configuration consists of spanwise blowing from a slot located in the mid-plane of the edge side of the blade tip. Two cases were selected (Figure 3.3). In the first case, the jet blowing is in the mid plane of the blade directed spanwise, while in the second case the jet is also directed spanwise but deflected downward at an anhedral angle of 30 degrees. For these two configurations, the CFD simulations have been performed only for steady blowing. Figure 3.3 Midplane blowing configurations 24
45 3.2 Methodology Description The analysis used in this study for modeling piezoelectrically modulated/vectored blowing at the tip of a rotor blade consists of three components. The first component is the response model to applied input voltage of a piezoelectrically controlled valve actuation system. The actuation system consists of a piezoelectric bender coupled with a fork and cylindrical valve mechanism (Figure 3.4). Use of this model allows a determination of cylindrical valve inner cylinder rotation, α, as a function of applied voltage. The bender tip displacement, W, and the rotation angle, α, are related only by a kinematical relationship. In the dynamic analysis, the introduction of inertial effects is necessary and the resulting nonlinear dynamic system model can be solved numerically. A FORTRAN code was developed to determine the nonlinear dynamic response for an arbitrarily applied voltage signal. A second component of this analysis concerns the identification of the jet blowing direction and thickness (correlated with the slot height) and ultimately the establishment of the flow parameters at the blowing slot section. Further, these parameters are used as input data for CFD simulations. Figure 3.4 Schematic representation of the actuation system 25
46 While a more comprehensive CFD analysis would have to include a study of the internal flow between the plenum and the exit slot in conjunction with the outer flow around the wing section, in the present study the assumption that the internal subsonic flow is an isentropic expansion between plenum and the exit slot section was considered. The direction of the blowing jet was established from the geometry of the cylindrical valve slots misalignment. Due to the consideration of subsonic jet blowing, the theoretical assumption of internal isentropic flow is not sufficient to solve the problem of determining the boundary conditions at the exit slot section as functions only of the plenum thermodynamic parameters, stagnation pressure, p *, and stagnation temperature, T *. The additional information required to be provided from the external flow (for which the exit slot section constitutes an inlet), determines a coupling between the blowing thermodynamic variables and the external flow. Therefore, the blowing parameters cannot be determined independently without CFD evaluations for the external flow. To establish the boundary conditions at the slot exit section, the required information from the external flow is given by assuming that the jet is subsonic and underexpanded (Shrewsbury, 1990). Therefore, the minimum jet flow area will be located at the jet slot exit. Consequently, the static pressure has to be continuous at the exit section and the pressure gradient normal to the jet exit surface has to be zero, p n SLOT = 0 (3.1) The local pressure, p J,1 at each grid point located on the jet slot exit surface and denoted by subscript J, is estimated by extrapolation of the pressure values of the downwind points in close proximity to the slot. Equation (3.1) is evaluated using three- 26
47 points forward-difference approximation to the first derivative. For an equidistant grid spacing near the slot, the expression of the local pressure in a J-point, p J,1, is given as: p J,1 4 3 pj,2 pj, = (3.2) 3 area as: The static pressure at the jet slot exit, p jet is estimated by the average over the slot p jet = Nslot p J,1 Nslot A A J J (3.3) This value of the static pressure is used further in the estimation of the boundary conditions at the jet slot exit. For numerical convergence, the distribution of pressure and consequently of velocity and density was assumed uniform over the slot exit area. For estimating the others flow field variables, a reference Mach number of the blowing jet, M BL, was chosen. Associated with the freestream static conditions, static pressure, p, and static temperature, T, corresponding plenum conditions p *, T * were selected. The assumption that the jet is isentropically expanded from the stagnation state (p *, T * ) to state (p, T, M BL ), leads to the following expressions: T * ( γ 1) 2 = T + M 2 1 BL (3.4) γ γ * 1 ( ) 1 * T γ γ 1 2 γ p = p = p 1+ M BL T 2 (3.5) 27
48 After the reference blowing jet Mach number is chosen, the resulting plenum conditions are assumed to be constant during the entire blowing cycle. Analyzing the expressions (3.4) and (3.5), the stagnation pressure is observed to have a much higher sensitivity to Mach number. Therefore, the stagnation pressure represents the dominating parameter, which dictates the blowing velocity and implicitly the blowing jet momentum. For the rotor flow configurations investigated, a reference blowing Mach number of 0.6 was used to estimate the plenum conditions as T * 1.07 T, respectively p * 1.28 p. These two plenum parameters were included as input data for the CFD analyses. The assumption related to a reference blowing Mach number considered in this theoretical study is based on the observation that the blowing momentum is more sensitive to the stagnation pressure than to the stagnation temperature. Thus, in order to match a certain blowing coefficient, only one parameter is sufficient. The local Mach number at the jet slot exit associated with the static pressure, p jet,, is computed as: γ 1 * 2 γ p M jet = 1 ( 1) (3.6) γ p jet * The temperature at the jet slot exit is given as: T jet ( γ 1) * 2 = T 1 + M jet 2 1 (3.7) 28
49 The corresponding density and velocity at the jet slot exit result as: p jet ρ jet = (3.8) RT jet V jet = M γrt (3.9) jet jet In summary, the equations ( ) which are evaluated at each integration time step during the CFD simulation, completely determine the boundary conditions at the jet slot exit. For the purposes of the current study, the time dependent coupling parameters between the electromechanical model and the CFD analysis are the blowing jet direction and the opening slots size, which were determined from the geometry of the cylindrical valve. The last component of this analysis involves the Navier-Stokes computational fluid dynamics (CFD) simulations. The objective of this analysis is to compute numerically the flow field and ultimately to analyze the flow modifications due to modulated blowing. Computational fluid dynamics simulations were performed using: (1) NAV3D -an unsteady compressible Navier Stokes solver developed by Sankar at Georgia Tech (Liu, 2003) - to analyze 2D elliptical wing section configurations; and (2) TURNS, - Transonic Unsteady Rotor Navier-Stokes solver developed by Baeder and Srinivasan (1992) - to simulate the flow around a rotor blade. NAV3D solver can model the flow field for an isolated wing configuration and was extensively used for circulation control wing applications (Liu et al. 2001, Liu 2003). 29
50 The solver based on Reynolds Average Navier Stokes (RANS) equations has implemented the zero-equation Baldwin Lomax turbulence model. The NAV3D solver is implicit, using the ADI method with the inviscid fluxes obtained from Roe s fluxdifference-splitting approach. The viscous flux term is computed explicitly, using a central difference type formulation. The scheme is first order time accurate. Originally, the solver was designed for a C-grid configuration. To appropriately accommodate the elliptical wing section geometry, the NAV3D was adapted to perform the computation for an O-grid configuration. 3.3 CFD Simulations for Rotor Configurations The final component in the study of piezoelectrically modulated blowing effects consists of computational fluid dynamics simulations to analyze quantitatively and qualitatively the flow pattern modifications for the rotor configuration described in the first section. The complexity of the unsteady flow of the rotor represents a technical challenge for current, state-of-the-art CFD, especially when applied to wake capturing. The limitation in grid resolution and the embedded numerical viscosity of the schemes generate a non-physical dissipation of the rotor wake and, as a consequence, a lack of reliability in wake capturing. In the current investigation, the numerical simulations of the unsteady rotor flow were performed using TURNS, which was designed to calculate the aerodynamic performance of a helicopter rotor in hover and forward flight. TURNS uses Roe s 30
51 approximate Riemann solver with a third order Monotone Upstream Centered Scheme for Conservation Law (MUSCL) type scheme. The viscous term is considered explicitly and the Baldwin Lomax algebraic turbulence model is used to model the eddy viscosity. The wake is essentially generated using an Eulerian approach. By improving the local grid resolution in the far wake region, the vortex characteristics were captured beyond one revolution wake age for the baseline cases. Details related to validation of TURNS can be found in the articles published by Srinivasan et al. (1992), Srinivasan and Baeder (1993), Wake and Baeder (1994), Tung and Lee (1994), McCluer et al. (1995), etc. Usta implemented high orders schemes in TURNS performing also a detailed code validation ( Usta et al., 2001; Usta, 2002). The hyperbolic grid generator was modified to adapt to the geometry of the round tip configuration as well as to the slot geometry for both blowing configurations previously described. Additionally, the grid generator was also modified to increase the local grid resolution in the wake region by redistributing the grid points in radial and vertical directions. The suggestion regarding the improvement in wake capturing obtained through an equidistant grid points redistribution in the radial direction was provided to the author by Mr. Jingshu Wu (personal communication). Rotor flow CFD simulations are performed for the following three cases: 1. Baseline rotors with rounded tip and square tip blades studied in hover; 2. Tangential steady and modulated blowing in the spanwise direction over a rounded blade tip for a hovering rotor with the same configuration as the baseline rotor; 3. Spanwise steady blowing from the edge side of a rounded blade tip for the same baseline hovering rotor. 31
52 CHAPTER IV ELECTROMECHANICAL MODELING OF A PIEZOELECTRICALLY CONTROLLED CYLINDRICAL VALVE 4.1. Piezoelectric Bender Coupled with a Cylindrical Valve An electromechanical model of the piezoelectrically actuated cylindrical valve implemented in an elliptical wing section is developed in this chapter. This step is useful for a better understanding of the feasible blowing cycle characteristics generated through modulated blowing. The actuation system described in Sections 2.4 and schematically represented in Figure 3.4 consists of a piezoelectric bender coupled through a fork with a cylindrical valve. The piezoelectric bender actuator with a length, L 1, is supported in a cantilevered configuration and connected to the inner cylinder of the cylindrical valve through an arm of length, L 2. By applying voltage, the bending deformation of the piezoelectric bender causes a rotation, α, of the inner valve cylinder and consequently the misalignment of the slots. A simple quasi-static analysis provided a kinematical model. In this analysis the bender tip displacement, W, and the rotation angle, α, are related only by a kinematical relationship. In the dynamic analysis, the introduction of inertial effects determines a 32
53 fundamental change of the model, requiring a numerical solution in order to solve the nonlinear dynamic system with the coupled degrees of freedom, W and α. The objective of the present modeling is to determine the jet blowing direction and intensity as a function of a time-dependent applied voltage. For the purpose of this analysis, it is assumed that the mechanism described is frictionless and any loading upon the mechanism caused by the emerging jet sheet is neglected Static Model The structural model consists of a cantilevered beam subjected to pure bending under piezoelectric actuation. The Euler Bernoulli beam theory was used to establish the tip displacement of the piezoelectric bender. Assuming that the applied voltage, V, generates a uniform through-the-thickness control electric field, is given as: E = 3 V t 1, the bending curvature induced by piezoelectric actuation 3d 31 3 k = (4.1) t 1 E and the corresponding blocked bending moment is expressed as: M b 11 = E I k (4.2) 33
54 By integration of equation (4.1), the static tip displacement of the piezoelectric bender is proportional to the applied voltage: 3d 31L1 = V (4.3) 2t W In the limiting case of input signal frequency approaching zero, this analytical result is subsequently used to validate the numerical results of a FORTRAN code, developed to solve the nonlinear governing differential equations for the dynamic analysis. 4.3 Dynamic Model as: The governing equation used to model the piezoelectric bender vibrations is given 2 4 w w m + E11I = 0 (4.4) 2 4 t x where the piezoelectric material properties and the geometric characteristics of the bender are shown in Table
55 Table 4.1 Piezoelectric material properties and geometrical characteristics ρ 7800kg/m 3 t µm E N/m 2 b mm d m/v L mm E d V/m L mm A nonlinear coupling constraint was introduced to represent the relationship between the tip displacement of the piezoelectric bender, W(t)=w(L 1,t), and the rotation angle, α, of the inner cylinder, which is described as : () ( ) W t α t = arctan (4.5) L 2 The non-homogeneous and nonlinear boundary conditions, including the rotational inertial effect of the inner cylinder can be expressed as: M b 3d 31 w ( L1, t) = = V () t (4.6) 2 E I t J c d α w ( L1, t) = (4.7) 2 E I L dt
56 At the cantilevered end, typical homogeneous boundary conditions of zero displacement, ( 0, t) = 0 w (4.8) and zero slope, ( 0, t) 0 w ' = (4.9) were considered. The mathematical model involves solving the linear partial differential equation (Equation 4.4) with non-homogeneous and nonlinear boundary conditions (Equations ). Two approaches were followed in order to characterize the dynamic behavior of the piezoelectric structural system. In the first approach a linear model was developed by assuming small tip displacement, W(t), and small rotation angle, α, such that W α t () () t L 2. The analytical solution regarding the steady state response established for the linearized model can be found in Appendix A. A second approach consists in the development of a numerical capability to simulate the time response of the nonlinear-coupled system. By spatial discretization, the continuous system was reduced to the integration of an ordinary differential-algebraic system. The numerical difficulty in solving this ODE system is caused by the stiffness of differential equations therefore leading to the solution of a linear system with bad conditioning. A FORTRAN code was written, based on the RADAU5 solver developed by Hairer and Wanner (1996). This solver is an implicit Runge-Kutta method of order five for stiff differential equations systems. The code has the capability to simulate the 36
57 time response for an arbitrary input signal. For this work, however, only sinusoidal input signals were considered Coupling Assumptions Based upon a first order approximation, the direction of the blowing jet was determined from the geometric misalignment of the cylindrical valve slots. In Figure 4.1, a simplified representation of the misaligned slots is shown. The defined points, A-D, will be referenced for defining the blowing jet angle, β, and the jet slot height, h slot. The coordinates (x, z) of mobile points, A and C are found by rotating the system (x 0, z 0 ) defined for initially aligned slots. It is assumed that the jet boundaries are defined by the lines, AB and CD. For a rotation angle of the inner cylinder, α, the jet angle, β, and the jet slot height, h slot, are defined from the geometry of misaligned slots. The method of evaluation of these parameters is described in Appendix B. Figure 4.1 Cylindrical valve - schematic representation of the misaligned slots 37
58 4. 5 Numerical Results Linear Analysis The results obtained using the linear model proved appropriate for an applied voltage signal with amplitude in the range of 0V-100V and a frequency far from the resonant (natural) frequencies of the system. For the coupled system, the first resonant frequency was found to be 26.4 Hz. The magnitude of the steady state harmonic response and the corresponding phase angle are represented in Figure 4.2. In Table 4.2 the first three natural frequency values of the coupled system and the natural frequencies for the piezoelectric bender are given. The results show lower natural frequencies for the coupled system compared to the free piezoelectric bender. Table 4.2 First three natural frequencies for the free piezoelectric bender and for the coupled piezoelectric bender cylindrical valve system Piezoelectric Bender [Hz] Coupled System [Hz]
59 Nonlinear Analysis The time variation of the piezoelectric tip displacement, the time variation of the blowing jet angle and the slot height ratio in response to a sinusoidal applied voltage signal with amplitude in the range of 10V to 200V and frequencies from 1Hz to 30Hz are shown in Figures 4.3 and 4.4. By increasing the frequency to the resonant frequency, the rotation angle, α, increases, such that the slot area becomes obturated during the blowing cycle. In addition, the influence of the nonlinear coupling becomes significant, and a beats phenomenon occurs. Therefore, the control of the piezoelectric actuator at this voltage amplitude, with a frequency close to the resonant frequency is inefficient for blowing and, additionally, introduces a higher degree of complexity due to beats. However, when the amplitude of the voltage signal is decreased, an effective blowing can be obtained even for frequencies close to the resonant frequency. 39
60 Figure 4.2 Magnitude and phase angle of the frequency response 40

![time[s] time[s] Jet](/docs-images/79/79672908/images/61-1.jpg "blowing angle [deg]")

![time[s] Figure 4.](/docs-images/79/79672908/images/61-3.jpg "3 Numerical results for")

; voltage")
61 Piezoelectric bender tip displacement [mm] time[s] time[s] Jet blowing angle [deg] time[s] time[s] Jet slot height ratio variation time[s] time[s] Figure 4.3 Numerical results for two different frequencies of input signal: f=1hz (left) and f=20hz(right); voltage amplitude: 10V; 50V; 100V; 200V. 41

![time[s] time[s] Jet](/docs-images/79/79672908/images/62-1.jpg "blowing angle [deg]")


")

62 Piezoelectric bender tip displacement [mm] time[s] time[s] Jet blowing angle [deg] time[s] time[s] Jet slot height ratio time[s] time[s] Figure 4.4 Numerical results for two different frequencies of input signal: f=25hz (left) and f=30hz(right) voltage amplitude: 10V; 50V; 100V; 200V. 42
63 CHAPTER V METHODOLOGY VERIFICATION 5.1. Two Dimensional Elliptical Airfoil with Modulated Blowing Using the electromechanical model, a CFD study was performed to investigate the effectiveness of modulated/vectored blowing in modifying the flow around an elliptical wing section. The numerical simulation was performed with the NAV3D solver for a 2D elliptical airfoil of 12% relative thickness with unsteady trailing edge blowing. The investigated configuration is similar to the wing model used for the proof-of-concept test in a low speed smoke tunnel. The unsteady blowing was obtained by variation of the slot size synchronized with the jet direction modification. The boundary conditions at the jet exit section were established as a function of the actuator dynamic response to a periodic sinusoidal input. Furthermore, an external law provided through electromechanical analysis controlled the size of the jet exit section. Therefore, the grid generation had to accommodate the real geometry of the slot. Special attention was paid to the correspondence between the physical time of the controlled flow and the dimensionless computational time. 43

64 5.1.1 Grid Generation The first specific characteristic of the hyperbolic O-grid used in this study is the modification of the radial position of the internal cut on which the periodicity conditions are imposed. The grid generator was modified to allow for an arbitrarily selected radial position of the internal cut in order to reduce the numerical sensitivity at the periodic boundaries. An example where the cut line location was chosen at the mid-chord of the computational grid is shown in Figure 5.1. A second characteristic of the grid is the discretization at the blowing edge, such that the number of cells subject to the blowing boundary condition is correlated with the commanded variation of slot size as a function of applied voltage. Moreover, the grid was generated by considering the ratio between the real dimension of the slot and the wing chord section in order to represent a scaling of the real configuration. Figure 5.1 Computational O-grid 44
65 5.1.2 Solver Description NAV3D solver is an unsteady compressible Navier Stokes solver developed by Sankar at Georgia Tech and used for circulation control wing applications (Liu et al. 2001, Liu 2003). The solver was designed for a C-grid configuration and was adapted here to perform the computation for an O-grid configuration. The NAV3D solver is implicit, using the ADI method with the inviscid fluxes obtained from Roe s fluxdifference-splitting approach. The viscous flux term is computed explicitly, using a central difference type formulation. The scheme is first order time accurate. The solver had implemented the zero-equation Baldwin Lomax turbulence model. At this stage, the empirical constants used in this algebraic model are the standard ones used to model wall boundary layers (Tannehill et al., 1997). Future work would require a deeper study, involving a turbulence model, through which the modification in the mixing length of the free jet emerging in the external flow around the airfoil could be considered Boundary Conditions The method of generating the unsteady blowing jet requires a time variable slot dimension. Consequently, the number of grid cells where the exit jet boundary conditions were imposed varies at each time-step. The controlled variation of the slot height determines the variation of the jet mass flow rate, m& = ρ V S (5.1) jet jet slot as well as the variation of the jet momentum coefficient defined by : 45
66 C µ () t = m& V jet 1 2 ρ V 2 S (5.2) The blowing conditions were determined by two plenum parameters: the stagnation temperature, T *, and the stagnation pressure, p *. For this numerical study, the plenum parameters were adjusted by considering a reference Mach number of 0.4, such that the resulting jet momentum coefficient is in the range [ ]. This range is typical for circulation control and jet flap control. Prescribing the parameters p * and T * (plenum conditions), and introducing as input functions the blowing jet direction and slot height determined by the dynamic response of the piezoelectric actuation system, the boundary conditions at the jet exit section are defined using the methodology described in Chapter Numerical Tests Parameters CFD tests were performed using the solver to model the flow over the 2D elliptical airfoil with the 0.2m chord and 12% relative thickness at 0 degree angle of attack. Standard sea level atmospheric conditions and a free stream Mach number of 0.1 were used. The corresponding Reynolds number to these conditions is Baseline Case To provide a reference baseline for the CFD study, a preliminary analysis was performed for the case of no blowing. Special consideration was given to finding the vortex shedding frequency behind the elliptical airfoil. The Strouhal number characterizing this frequency is defined as a function of airfoil thickness, g: 46
67 f g St =. (5.3) V In this computational test, the Strouhal number for the baseline case using Baldwin-Lomax turbulent model was found to be This corresponds to a frequency of Hz for a configuration characterized by 0.2m chord and 34 m/s free stream velocity. The vortex-shedding pattern is represented using streak lines in Figure Combined Electromechanical/CFD Results To illustrate how the combined electromechanical /CFD model is functioning, step-by-step results corresponding to an input signal of 10Hz and amplitude of 100V are described in the Figures The numerical simulation of the actuator system dynamic response to the Figure 5.2. Vortex shedding pattern for the baseline case-streak lines representation Computational vorticity range [-0.5;+0.5] 47
68 sinusoidal applied voltage (Figure 5.3) was performed as the first step. The resulting piezoelectric tip displacement and the rotation angle of the valve inner cylinder are shown in Figure 5.4, respectively. Noticing that for this specific input signal, the maximal value of the rotation angle, α, is still small, (less than 10 deg), the numerical integration can be simplified by linearizing the kinematical relationship given in Chapter 4. From these results, one can conclude that, at least for the frequencies lower than 10Hz and voltage amplitude smaller than 100V, a linear analysis to establish the dynamic response of the system is sufficient. As the second step, based upon the prescribed rotation angle, α, the corresponding blowing jet angle, β, and the slot height ratio, h e slot/ h 0 slot, are computed and shown in Figure 5.5. These parameters represent the input data in prescribing boundary conditions for the CFD simulation. In Figure 5.6, the lift coefficient variation in time and its limit cycle response are represented. The occurrence of a limit cycle response for the lift means that the lift variation is dictated by the frequency of the control signal. This proves the effectiveness of the analyzed system for active flow control. 48
69 Figure 5.3 Applied voltage signal, f=10hz Figure 5.4 Piezoelectric bender tip displacement and cylindrical valve rotation angle Figure 5.5. Blowing jet angle and jet slot height ratio 49
70 The jet momentum coefficient, C µ, and the drag coefficient, C d, are represented in Figure 5.7. To exclude transitory effects, the first blowing cycle was excluded from the representation of drag coefficient. For this test case, the number of iterations per blowing cycle was 50,000. It is significant to notice that while the frequency of lift variation is the same as the frequency of the blowing cycle, the main frequency for drag is two times higher since it is controlled by the frequency of the jet momentum Parametric Study The principal parameter considered is the applied voltage input signal frequency. Therefore, three comparative CFD tests were performed, by maintaining the same plenum condition and the same amplitude of 100V of the voltage signal for the frequencies f=10hz, 15Hz and 20Hz. In Figure 5.8, the variation of blowing jet angle and lift coefficient were represented. When the excitation frequency is getting close to the first natural frequency, higher blowing angles are obtained but the mass flow rate decreases. Therefore, the efficiency of the actuation decreases and significant turbulent effects occur. Moreover, significant aerodynamic hysteresis can be observed in this case. 50
![Lift Coefficient 0.8 0.6 0.4 0.2 0-0.2-0.4-0.6-0.8 0 0.05 0.1 0.15 0.2 Time [s] Figure 5.](/docs-images/79/79672908/images/71-4.jpg "6 Time variation and limit cycle response of the lift coefficient, f=10hz Figure 5.7 Time variation of the jet momentum coefficient, f=10hz Figure 5.")
71 Lift Coefficient Time [s] Figure 5.6 Time variation and limit cycle response of the lift coefficient, f=10hz Figure 5.7 Time variation of the jet momentum coefficient, f=10hz Figure 5.8 Time variation of blowing angle and the lift, f=10hz, 15Hz, 20Hz 51
72 5.2 Rounded-Tip Wing with Modulated Tangential Blowing As previously mentioned, one of the objectives of this thesis is to understand and evaluate the effects of spanwise blowing in changing the tip vortex structure for a rotor blade. The lack of experimental or theoretical studies regarding this concept requires a step-by-step approach. A CFD simulation for a rounded tip wing with NACA 0012 airfoil with similar characteristics as the rotor blade configuration was performed in order to have a better understanding of the solver capability in comparison with previous results found in literature. The wing has a rectangular planform with zero twist and the aspect ratio of six. A CFD study performed by Liu (2003) for the case of steady tangential blowing over a rounded wing tip showed that the tip vortex moves outboard and downward as a function of the blowing momentum coefficient. In the present study, steady and unsteady tangential blowing cases were investigated using TURNS. The flow configuration, characterized by a free stream Mach number of 0.1 and an angle of attack of 8 degrees, is similar to the one studied numerically by Liu (2003). However, because the geometrical configuration of the wing is different than the one used by Liu, the results will be compared only qualitatively. The grid used is a hyperbolic curvilinear grid with C-H topology. The wing section is generated as a C-grid while an H grid is used in the spanwise direction. The grid generator developed by Baeder and Barth was modified to adapt the geometry of the round tip configuration as well as the slot geometry. In Figure 5.9, details of the grid for the rounded tip wing are represented. For the round tip, an O-topology instead of the H- topology in the spanwise direction could be more beneficial. However, the change of 52


73 Figure 5.9 C-H grid: general view and a X-plane view section grid topology would impose changes to the TURNS solver, requiring a code validation, which is beyond the scope of this work. The solver was adapted to compute the rounded tip configuration. At the same time, the solver was modified to include the blowing option by prescribing the boundary conditions described in Chapter Numerical Results Actual numerical results are computed for three cases. The first one is the baseline (no blowing configuration). In the second case, a steady blowing corresponding to the case that the slot is fully open was considered. The last case corresponds to unsteady blowing. The unsteady blowing is obtained by variation of the slot size following a half sinusoidal time variation. The blowing cycle varies from a fully open slot (maximum blowing) to a closed slot corresponding to no blowing, similar to the one used in the 2D 53
74 analysis. For a sinusoidal variation, the average blowing momentum can be evaluated as C aver 2 = 1 Cmax 0. 36C π max, representing about 36% of the maximum blowing obtained when the slot is totally open. To analyze the effect of the blowing frequency on the tip vortex structure and position, two tests with same blowing cycle but different frequencies were performed. In Figure 5.10, the convergence of the lift coefficient with the number of iterations was represented for all three cases. In the case of modulated blowing, a limit cycle response for the lift coefficient was obtained (Figure 5.11). Similar to the 2D case, a higher hysteresis is observed for the higher frequency. For the baseline case, the evolution of tip vortex location is shown in Figure 5.12 by representations of the velocity flow field at different sections. Because the principal objective is related to vortex tip modification in the near field of the structure, the main streamwise section was chosen near the trailing edge. A comparative illustration of the velocity field patterns associated with the regions of high vorticity is shown in Figure The cases of no blowing and steady blowing are compared with results obtained in the case of modulated blowing, for which two blowing phases are shown, one at the half period of blowing (C µ =0) and the other one after a period corresponding to maximum C µ. 54
75 Figure 5.10.Variation of lift coefficient with number of iterations Lift coefficient Blowing Cycles Blowing Cycle : f=0.04 Blowing Cycle : f= Blowing coefficient Figure Limit cycle type response of lift coefficient. 55
76 Figure 5.12 Baseline test- no blowing 56
77 The results obtained for the steady blowing case (Figure 5.13) confirm that at the trailing edge section, the tip vortex is moved outboard by about 20% of chord compared to the no blowing case position and moved downward by about 10% of chord. The results obtained for the case of modulated blowing, show that the time evolution of the tip vortex structure during a blowing cycle period is significantly influenced by the frequency of the blowing cycle. Comparative representations (Figure 5.13) of the flow patterns at the same phase of the blowing cycle for two different frequencies indicates that the position of tip vortex core varies by about 20% of the chord outboard for the low frequency. Meanwhile, for the higher frequency, the tip vortex has an approximately constant position outboard at about 10% chord. Significant downward displacement is not observed for either of the two cases, but this can be explained by the low blowing momentum coefficient, which has an average value of At the same time, the tip vortex structure appears to be significantly modified when the blowing cycle has a low frequency. A systematic parametric study could extend the understanding of the influence of blowing cycle frequency as well as of the blowing intensity in modifying the tip vortex structure. However, one of the objectives of this thesis is the analysis of rotor configurations. Therefore, the analysis of the wing case represented only an intermediary step, which helped in validating that the solver modifications to account for blowing are reliable. 57
78 No Blow Steady Blowing Cµ=0.041 Half Period: Cµ=0.0 Full Period :Cµ=0.041 Modulated blowing frequency f=0.04 Half Period: Cµ=0.0 Full Period :Cµ=0.041 Modulated blowing frequency f=0.2 Figure 5.13 Comparative representations of velocity flow patterns 58
79 CHAPTER VI STUDIES OF TIP VORTEX FORMATION FOR A TWO-BLADED ROTOR IN HOVER 6.1 Introduction As discussed in previous chapters, rotor performance, blade airloads and aeroacoustic phenomena are greatly influenced by the structure and trajectory of the rotor wake. Therefore, an accurate prediction requires an understanding of the formation and evolution of the wake structure. The capture and modeling of the wake structure is very complex and represents an open problem in experimental, theoretical and numerical studies. Theoretical models for wake capture and modeling are based on experimental proof that the trailed wake sheet from a rotor blade is unstable and rolls-up into a dominant vortex trailing from the blade tip. The experimental attempts at accurate measurement of the evolution of tip vortex structures are confined by the capabilities and limitations of the LDV and PIV techniques (Martin et al, 2000). On the other hand, CFD results are questionable with regard to their capability to capture the tip vortex due to the numerical diffusion and the lack of grid resolution. The currently limited understanding of the physics of formation, growth and decay of the tip vortex makes it more difficult to establish how reliable the numerical results can be. Additionally, the manner of flow field data processing is limited by the difficulty of establishing pertinent criteria to distinguish certain physical features. 59
80 However, one advantage of CFD analysis is its capability of capturing the data in the entire surrounding flow. The processing and interpretation of data based on the already established theoretical concepts can help enrich the understanding of the physics underlying this complex rotor flow. Therefore, for a thorough analysis, the emphasis must not only be on the generation of reliable computational results, but also on result postprocessing and interpretation in terms of phenomenological flow behavior. This chapter presents several data analysis techniques used for result postprocessing. In the first section of this chapter, the focus will be on the analysis the flow around a rounded blade tip. The following results will attempt to illustrate the formation and rollup of the tip vortex, as well as to highlight some physical aspects of these phenomena. The second section of this chapter is dedicated to a comparative study between the baseline case of a rectangular blade with a rounded tip and the same rectangular blade with a square tip. This comparison was suggested by the experimental work performed at Georgia Tech by Wong (2001) and Mahalingam (1999). Their results indicate that the modifications of the blade tip can have significant influence on vortex formation and evolution. The CFD analyses of this section provide an independent numerical confirmation of their observations. In the last section of this chapter, the influence of grid resolution in capturing the far wake is investigated. The grid generator was adapted to allow a redistribution of grid points in the vertical and spanwise directions in the wake region. Moreover, the grid generator was modified to improve the smoothness of the grid in clustering regions, especially in the blade tip region. The results regarding the far wake vortex evolution obtained with the adapted grid are compared with similar results obtained using the 60
81 reference grid. Additionally, the numerical results representing the local velocity profiles are compared with published experimental data (McAlister, 1996). For the baseline case, TURNS was used to simulate the hover condition for a twobladed rotor with solidity 0.106, characterized by a collective pitch of 8 deg and a tip Mach number of 0.3. The rotor blade has an aspect ratio of 6 and it is characterized by rectangular planform with zero twist. The rotor blade section is NACA0012. The full description of flow parameters as well as rotor geometry was presented in Chapter 3. A first test run was performed for the first two revolutions so that numerical transients resulting from nonphysical zero initial condition can be overcome. The resulting data sets are used as initial conditions for further tests. All these restart run tests use the time accuracy option and consider 3600 iterations per revolution. The aerodynamic performance coefficients for rounded blade rotor, estimated as an average after the rotor s fourth revolution are C T = , respectively C Q = Similar coefficients for the square blade configuration are C T = and C Q = The reference data obtained experimentally by McAlister (1996) for a square blade are C T =0.005 and C Q = The numerically predicted performance coefficients show a close correlation with the experimental data. The grid used for the presented results is characterized by 165x125x50 points, where 165 represents the number of points in the wrap-around-airfoil direction, the number of points in radial direction and 50 - the number of points in normal direction. For the far wake capturing, a denser grid (with 275x125x111 points) was generated using the modified grid generator version. To reduce the computational effort, an intermediary grid (with 255x125x91 points) was used. A FORTRAN code was 61
82 developed to interpolate the data fields, which are used as a restart, from a coarser to a more refined grid. As expected, using a more refined grid the results show a significant improvement in capturing the wake characteristics beyond one rotation. The grid resolution influence, studied in the last part of the chapter, shows that the higher resolution in the vertical direction is a key point in improving the wake capturing capability as the vortex ages. The correlation of velocity profiles at 30 deg wake age with experimental results obtained by McAlister in 1996, showed that the reference grid resolution is good enough in capturing near wake effects, presented in the next section. All the executions were run on a PC with Intel Pentium 4 processor operating at 2.2 GHz, 512MB RAM and under the Windows XP operating system. The reference grid with 165x125x50 size required about 9.4 sec computational time effort per iteration. For comparison, the adapted grid with 255x125x91 size requires about 35.6 sec CPU per iteration, while the 275x125x111 grid size requires about 57 sec CPU per iteration. All numerical flow patterns were visualized using the commercially available FIELDVIEW software. 6.2 General Aspects of the Rotor Wake From an aerodynamics perspective, the flow field around a helicopter blade has much more complexity than the flow field around a fixed wing. Due to the rotational motion, the velocity varies linearly along the blade span, achieving the maximum at the tip. Therefore, the flow is characterized by strong pressure gradients near the blade tip 62
83 and by the formation of the strong vortices trailing from the blade tips. These tip vortices represent generally the most important aspect of the rotor wake. Unlike the fixed wing, the trajectory of these tip vortices is close to the rotor blades and a complex threedimensional velocity field is induced. In Figure 6.1, a 3D illustration of the rotor wake is displayed, based on the representation of the streamlines starting near the blade tip in a reference system related to the rotor blade. The length of these streamlines is restricted by the time corresponding to two rotor rotations. The projections of this image in the rotor and radial planes shown in Figure 6.2 indicate the contraction and descent behavior of the rotor tip vortex during the two full rotations. The flow over the blade tip is three-dimensional and is primarily characterized by the airflow generated by rotational movement of the blade and by the spanwise flow around the tip from the lower to the upper sides of the blade. To characterize this spanwise flow, the velocity field is two-dimensionally represented in a radial plane for different azimuth angles. These representations characterize the 2D vortex core properties, which are defined from extracting information about the swirl velocity profiles from the 2D cross-flow patterns. Most of the following representations of flow field patterns were performed in cylindrical coordinates, except for the 2D representations showing the flow around the tip in the chordwise cut sections of the blade. The cylindrical coordinates system is shown in Figure 6.2 (a) and (b). The radial plane generated by the Y-Z axes represents the cross-flow plane, while the X-direction defines the streamwise direction. 63

 (b) 2")
")
84 Figure 6.1 Computational 3D streamlines starting near the blade tip (a) (b) Figure 6.2 Rotor plane (a) and radial plane (b) projections of the rotor wake 64
85 To characterize the rotor tip vortex core properties, the velocity component in the streamwise direction is defined as positive in the opposite X-direction, and is referred in term of the axial deficit of the rotor wake. Except for Figures 6.1 and 6.2, which are flow representations in the reference system related to the rotor blade, all the other flow pattern illustrations are shown in the inertial reference system (ambient air at rest). The inertial system in which the blade is rotating while the surrounding air is at rest has the advantage of being the system in which the experimental data are processed. On the other hand, from the flow visualization viewpoint, the representation of streamlines in the reference system related to the rotor, as in Figures , helps to suggest the particles trajectories with respect to the blade. 6.3 Vortex Formation and Near Wake Evolution for a Rounded Blade Tip In this section, the vortex formation process is distinctively analyzed in two stages. The first stage consists of the creation of the tip vortex on the upper side of the blade as a consequence of separation of the cross-flow around the blade tip. The second stage is represented by the vortex core growth during the rollup process. As the fluid flows around the blade, there are two mechanisms through which the viscosity of the flow generates vorticity. The first mechanism is due to the separation that occurs for the flow over the blade section airfoil in a streamwise direction. The vorticity created in the consequent reverse flow region is transported further than the 65
86 trailing edge, in a free shear layer that defines the inboard vortex sheet. The second mechanism of vorticity generation is due to the separation of the cross-flow around the blade tip. This is the basic mechanism that leads to the tip vortex formation Vortex Formation To understand how the vortex is developed near the blade, the patterns of the cross-flow velocity near the blade tip were represented in Figure 6.3 for the cut sections in the spanwise direction, starting with a section at 30% of chord from the leading edge to the section at the trailing edge of the blade. The colored area contours correspond to the values of the X-direction (streamwise) component of velocity represented in the inertial reference system. The positive sign is taken in the opposite direction of the X-axis. Figure 6.4 shows the streamlines characterizing the two- dimensional cross-flow velocity field. Additionally, the pressure contours near the blade tip are represented in Figure 6.5 for different azimuthal sections to illustrate the direction of the pressure gradient. The formation of the tip vortex occurs on the suction side (upper side) of the blade surface. Due to the pressure difference (Figure 6.5) between the upper and lower sides of the blade, in the boundary layer region, the fluid moves around the tip of the blade. As shown in Figure 6.3, for the section at 30% of chord, the cross-flow around the tip remains attached to the curved wall due to the balance between the pressure gradient normal to the surface and the centrifugal force, which is caused by the streamline curvature. This phenomenon is known as the Coanda effect. Advancing downstream in a chordwise direction, the adverse pressure gradient in a streamwise direction causes an increase in the boundary layer thickness on the upper side of the blade. Also, the 66


87 Figure 6.3 Cross-flow velocity patterns during the vortex formation for rounded blade tip 67

88 Figure 6.4. Cross-flow streamlines represented for 60%, 70% and 90% of chord Figure 6.5 Pressure iso-contours near the blade tip 68
89 negative pressure gradient directed toward the blade tip increases, causing the particles near the tip to flow radially inwards to the boundary layer. At 50% of chord section, the flow detaches near the mid-plane of the tip, becoming reattached on the upper side of the blade. The region of separation and reverse flow grows, thereby achieving a vortical structure as the flow moves downstream. At 70% of chord, a vortex core becomes identifiable with a radius defined as the distance between the point of minimum crossflow velocity in the core center and the point of maximum cross-flow velocity. The location of the vortex center is gliding up on the upside tip surface and detaches from the blade surface. At the trailing edge section, the vortex is already detached, being characterized by an elliptical shape of the core. In the Figure 6.5, the illustration of the pressure in the cross sections characterized by 2 o azimuth (corresponding to about 46% of chord) indicates that near the mid-plane of the rounded tip there is a pressure gradient toward the blade, which causes the attachment of the flow to the curved wall. This pressure gradient becomes adverse to the cross-flow on the upper side of the blade, causing the flow detachment. As the vortex forms, a distinct low-pressure region can be identified by the closed contours, on the upper side of the blade surface in the radial plane with 7 o azimuth (about 98% of chord). The tip vortex can be identified further downstream (in the 9 o radial plane), by the closed region of low-pressure. In same Figure 6.5, the streamwise pressure gradient toward the blade indicates the fluid entrainment to follow the blade caused by the upper surface blade suction. Therefore, the streamwise velocity profile indicates a deficit in the vortex region which is also illustrated in the Figure
90 6.3.2 Roll-up Process A second stage in the tip vortex evolution corresponds to the core growth, which is primarily explained by a mechanism of free shear layer rollup into the tip vortex. After leaving the blade, the viscous flow characterizing the boundary layer of the inboard sections develops into a free shear layer. Through this free shear layer, the vorticity created on the blade boundary layer is convected downstream. The vortex sheet structure characterizing the free shear layer is unstable. The pressure gradient on the lower side tends to make the fluid flow outwards towards the tip while, on the upper side, the fluid tends to flow inboard. Therefore, under these circumstances, the vortex sheet deforms and rolls up into the tip vortex. Historically, the mathematical theory regarding the roll-up of the vortex sheet for a finite span wing was developed at the beginning of 20th century by Lancaster and Prandtl. Their theory was based on the concept of inviscid flow with discontinuities in surfaces. Later, Betz developed the theory of vortex sheet roll-up for a finite wing, relating circulation in an axisymmetric trailing vortex to bound circulation generated by the wing. Also, Betz s theory was based on the assumption that the roll-up process is completely inviscid and that there is a singular vorticity at the outboard edge of the initial vortex sheet. A schematic diagram of the vortex sheet roll-up process as developed through Betz s theory is presented in Figure 6.6. Overall, the mechanism for the roll-up is not well understood for either the fixed or the rotary wing. However, consistent progress was made in recent years. As an example, Rule and Bliss (1998) proposed an analytical roll-up model including viscous effects to predict the structure of a fully developed trailing vortex for a fixed wing. Their 70
91 model extends the original 2D inviscid Betz theory to 3D and takes into account the viscous effects in the vortex core region by assuming a turbulent mixing process in the core during formation. In general, the models developed to explain the roll-up phenomenon are based mainly on inviscid considerations, using lifting line or panel methods, which can lead to an overestimation of core growth rate. Studies concerning the evolution process and decay mechanism of trailing vortices revealed the difficulties and uncertainties in the description of wake behavior. A general 1998 review by Spalart regarding airplane trailing vortices pointed out how far away the current state of the art is from the physical understanding of the main phenomena. Among the many subjects touched upon in Spalart s review, the strong interconnection between the rotational and axial velocity fields as well the poor representation of the dynamics of the vortex cores based only upon the core radius associated with peak velocity are mentioned for their significance. Another significant issue is the effect of the turbulence in vortex evolution. In the following analysis, the results will try to investigate the three-dimensional effect in the tip vortex development. The roll-up mechanism is graphically illustrated in Figure 6.7, based on the representation of the axial velocity deficit correlated with crossflow vorticity lines and cross-flow streamlines. The cross-flow vorticity lines are defined as the integral curves of the two dimensional y-z vorticity vector field. This vorticity vector has the radial component ω r and tangential component ω t, ( rv ) 1 Vx ω r = r θ x Vr Vx ω = t x r 71 t (6.1)
92 expressed in a cylindrical coordinates with x-axis as axial direction. This reference system is used to characterize the vortex core parameters, r and θ, which are the polar coordinates represented in the azimuthal plane of the rotor where the system s origin is located at the vortex center. The x-coordinate is considered to be in the same direction as the x-coordinate of the global reference rotor system. Further, V t represents the tangential velocity of the core or swirl velocity, V r is the radial velocity and V x is the axial velocity. From a mathematical point of view, the convergent spiral shape of the cross-flow vorticity lines indicates a critical point of the 2D vorticity vector field. Following definition (6.1), in the regions where the intensity of this vorticity field is primarily dictated by the derivatives in radial and vertical direction of the streamwise velocity, these focal nodes (critical points) indicate the local maximum axial deficit regions. These regions are identified in Figure 6.7 with letter D. For the flow pattern represented at the tip trailing edge, a near blade region (shown in the same figure by letter C), in which the axial deficit decreases, can be identified by the closed vorticity lines. In the same Figure 6.7, the cross-flow streamlines calculated using the two dimensional velocity field are represented to suggest the projected local trajectories of the particles in the vortex core region. The streamwise velocity deficit illustrated in Figure 6.7 can be explained by the following mechanism. Behind the blade, in the free shear layer, the particles, which initially were at rest, are entrained to follow the blade motion by the suction created on the upper blade surface. This phenomenon, viewed from the blade reference system perspective, shows that the particles are decelerated and that the streamwise velocity has a wake-like profile, which defines the axial velocity deficiency. This wake- like streamwise velocity profile has been consistently observed in 72
93 experimental investigations (McAllister et al, 1996 and 2001; Leishman et al, 1995). To explain the direction cross-flow vorticity vector characterizing the inboard vortex sheet, one can observe that for a certain inboard radial section, the boundary layer separation on the upper airfoil surface leads to vortices with the axis orientated parallel with y-axis and oriented in positive y-axis. On the lower side, the vorticity generated in the shear layer is in the opposite direction. As a result, detached from the inner sections of the blade, the free shear layer is formed by the mixing region between upper and lower boundary layers on the blade and is characterized by these counter-rotating vortices, which define the inner vortex sheet. During the roll-up process, these vortices found in the blade tip vicinity are emerging into the tip vortex. As the roll-up process matures, the tip vortex grows and the inboard vortex sheet diffuses, loosing the intensity. The induced downwash velocity field in the inboard vortex sheet by the tip vortex determines a downward displacement identifiable in Figure 6.7. The flow patterns evolution represented in Figure 6.7 suggest that the center for the tip vortex and the peak axial deficit velocity do not coincide during the roll-up process. As the process evolves the distance between the swirl center and maximum axial deficit decreases and at age 30 deg, where roll-up is almost ended, these points approximately coincide. The evolution of the cross-flow patterns is illustrated in Figures , where the cross-flow velocity and the azimuthal vorticity contours are represented. The azimuthal vorticity is defined as function of swirl velocity V t and radial velocity V r, ω x = 1 r ( rv ) r t 73 Vr θ (6.2)
94 The magnitude of this vorticity component is a meaningful parameter in characterizing the tip vortex strength. Applying Stokes theorem, by integration of the azimuthal vorticity field over the vortex core surface, the vortex circulation is obtained. However, due to the difficulty of estimating the tip vortex area, the vortex circulation is usually estimated by assuming the axisymmetry of core flow, Γ = 2πrVt. The cross-flow velocity field and the azimuthal vorticity contours from Figures show that the swirl center for the tip vortex is found in the region of high vorticity. The vortex core shape, visually suggested by the cross-flow streamlines passing through the points of maximum velocity, is influenced by the geometry of the blade tip. As it is detaching from the blade, the tip vortex core geometry is dictated by the thickness of the boundary layer, by the width of the correspondent reversed flow region and implicitly by the location of the initial flow separation. Consequently, near the blade the vortex core has two different characteristic lengths, being more appropriate to approximate the cross section vortex shape with an ellipse than with a circle. This elliptic shape of the tip vortex core changes during the roll-up process, the core becoming more circular while the intensity of roll-up decreases. Additionally, in the flow pattern representations from Figures , a phenomenon of rotation of this elliptical tip vortex core with wake age can be observed. As the vortex core progressively evolves towards an axisymmetric shape with wake age, this rotation of the vortex core can no longer be identified. 74
95 Figure 6.6 Schematic diagram of vortex sheet roll-up (Rule and Bliss, 1998) 75

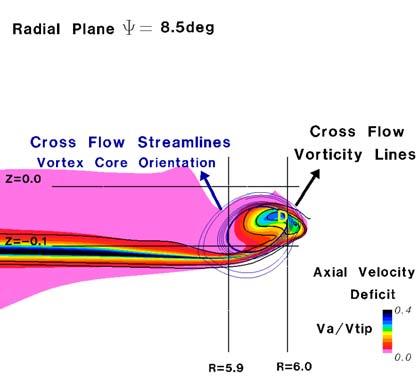

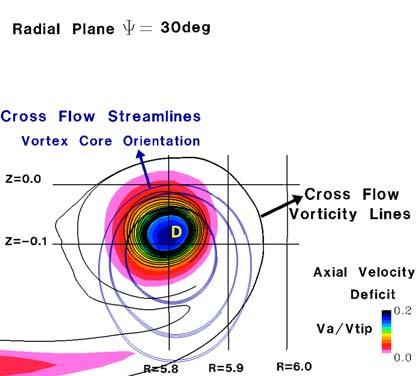
96 Figure 6.7 Two-dimensional flow patterns for vorticity lines for rounded blade tip 76
97 0.5 Vertical velocity Vz/V_tip Axial velocity deficiency Va/V_tip Radial velocity Vr/V_tip Axial velocity deficiency Va/V_tip Vz /Vtip Va /Vtip Vr /Vtip Va /Vtip R/c Z/c 0.05 Figure 6.8 Flow pattern in the radial plane corresponding to 7.1 o vortex age 0.5 Vertical velocity Vz/V_tip Axial velocity deficiency Va/V_tip Radial velocity Vr/V_tip Axial velocity deficiency Va/V_tip Vz /Vtip Va /Vtip Vr /Vtip Va /Vtip R/c Z/c 0.05 Figure 6.9 Flow pattern in the radial plane corresponding to 10 o vortex age 77
98 0.25 Vertical velocity Vz/V_tip Axial velocity deficiency Va/V_tip Radial velocity Vr/V_tip Axial velocity deficiency Va/V_tip Vz /Vtip Va /Vtip Vr /Vtip Va /Vtip R/c Z/c 0.05 Figure 6.10 Flow pattern in the radial plane corresponding to 20 o vortex age Vertical velocity Vz/V_tip Axial velocity deficiency Va/V_tip Radial velocity Vr/V_tip Axial velocity deficiency Va/V_tip Vz /Vtip Va /Vtip Vr /Vtip Va /Vtip R/c Z/c 0.05 Figure 6.11 Flow pattern in the radial plane corresponding to 30 o vortex age 78
99 Tip Vortex Core Structure One of the key points in a meaningful description of the tip vortex is the identification of the vortex core regions from numerical data. The modeling of the vortex core, as well as the understanding of the viscous phenomena inside the core, is still an open subject in the literature. Experimental and theoretical studies suggest that the vortex core is characterized by different regions where the viscous-laminar and turbulent mixing effects have different predominance. In addition, the development of analytical vortex models that capture some significant features of the vortex flow and improve the estimation of significant parameters (such as, core size, vortex strength), is still a subject of on-going research. Vortex Models The simplest representation of the tip vortex is the Thomson-Rankine vortex model (inviscid vortex model), which represents a singular solution of the Euler equations describing an axisymmetric uniform vortex filament. A region of constant vorticity, the forced vortex region, is confined inside a circular core and is characterized by a linear variation of the tangential velocity with the radius and a parabolic variation of the vortex circulation. Outside of this region, there is the free- vortex region where the fluid motion is considered irrotational. This means that the tangential velocity variation is inversely proportional to the distance from the vortex center while the circulation remains constant. At the boundary of these two regions, there is a vortex jump, i.e. a discontinuous distribution of the vorticity. 79
100 The Thomson-Rankine s vortex has a core radius defined by the half-distance between the swirl velocity peaks. While a poor approximation for real vortices (Spalart,1998), this inviscid vortex model can provide the basis for the development of more realistic flows vortex models. A generalization of the Thomson-Rankine inviscid vortex is the Lamb-Oseen vortex (Saffman, 1992), which can be considered as the desingularization of the vorticity distribution by inclusion of viscosity effects. This viscous vortex model is defined as a time-dependent solution of the Navier-Stokes equation for the initial condition of the Dirac-delta function singular distribution for vorticity. The Lamb-Oseen vortex characterizes a two-dimensional flow with circular symmetry in which the streamlines are circles around the axis. A generalization to three-dimensional steady flow of the Lamb-Oseen vortex model is the one-cell vortex model of Burgers. This vortex model is given by an exact solution of the Navier-Stokes equation for a threedimensional flow with a constant axial velocity. Assuming that the radial velocity distribution depends on the radius only, the axial velocity is required to be linearly dependent on the x-coordinate in order to fulfill the continuity equation. Assuming that the axial velocity does not vary with the radius, r, the solution leads to a linear distribution of radial velocity and a tangential velocity profile similar to the one corresponding to the Lamb-Oseen s vortex. The tangential velocity distribution into the vortex core depends on the local Reynolds number, which can be defined by including the turbulence effect modeled by the kinematic eddy viscosity. The streamlines characterizing the cross-flow are no longer circles, as in the case of the Lamb-Oseen or Rankine vortex models, but spirals toward the central axis. A more advanced vortex 80
101 model (Ogawa, 1993) was developed by Sullivan by deriving a class of closed solutions for the Navier-Stokes equations. The radial and tangential velocities are still only functions of radius, r, describing an axisymmetric flow. The three-dimensional flow effect is represented by the radial distribution of the axial velocity multiplied by x. The vortex is said to have two cells, which means that the spiral flow has an inner region of reverse flow near the central axis characterized by outward-spiraled streamlines and an outer region characterized by inward-spiraled streamlines (Figure 6.12). As an example, the representations in Figure 6.13 of the cross-flow streamlines in the azimuthal plane at 10 degrees wake age exhibit such a streamline structure. Vortex Core Visualization Based on the Cross-Flow Streamlines The numerical results obtained with TURNS are representing the solution of the Reynolds averaged equations, where the turbulent effects are taken into account by considering an apparent eddy viscosity, as defined by the Baldwin-Lomax model. Therefore, in the representation of the flow pattern only the mean flow characteristics can be visualized. The visualization of the cross-flow velocity field is used to define all the vortex core parameters. In the Figures , the shape of the vortex core was suggested using the cross-flow streamlines. For clarity, the streamlines are limited in time and they are originating from only a few points in the plane. The three-dimensional effect due to axial velocity changes the topology of the flow. The streamlines in the radial plane become spirals instead of concentric closed curves. 81


102 a. Cross-flow streamline b. Axial flow streamline Figure 6.12 Sullivan s vortex model (Ogawa, 1993) Figure 6.13 Occurrence of stable limit cycle in the streamlines pattern 82
103 In order to satisfy the continuity equation, by neglecting the non-axisymmetry or compressibility effect, the radial distribution of the axial velocity gradient primarily influences the radial distribution of the radial velocity. As a function of the radial velocity sign, the cross-flow streamlines are divergent or convergent spirals with respect to the vortex center. Depending upon the axial velocity profile as well as the change of the radial velocity sign, a limit cycle solution can be identified in the cross-flow streamlines representation. As an example, for the vortex age of 10 deg shown in Figure 6.13, the streamlines passing through 6 points seeded in the vortex core region are represented using the convention that the blue streamlines originate from these points whereas the red streamlines end in these points. In the region of the monotonically positive (or negative) radial velocity, an alternation between red-blue contours can be observed. This shows that two neighboring points are evolving in the same direction, diverging from (respectively, converging to) the vortex center. When this alternation is broken (i.e. two same-color lines are adjacent), a limit cycle solution exists. In the case where the adjacent same-color curves are forward streamlines, the limit cycle is stable, attracting the streamlines from its vicinity. For an analytical investigation regarding this type of flow pattern, the two-cell vortex model of Sullivan can be a suitable model because the axial velocity profile indicates a deficit region in the mid-core followed by an excess region outside. Additionally, the experimental studies of Leishman indicate that the swirl velocity profiles are essentially self-similar, indicating that a Sullivan vortex type solution can be determined by evaluating the velocities parameters through curve fitting. 83
104 For the case of rotor flow analyzed here, the analogy with this analytical model is suggested as recommended future work concerning identification of the vortex core in light of three-dimensional vortex models instead of two-dimensional models only. Additionally, the explanation of this behavior is not trivial and requires further investigations, which are not within the scope of this thesis. For this reason, it is recommended as a future work to deepen the study of viscous core behavior in analogy with different classes of analytical vortex models and to insist on the two-cells vortex solutions class and not only on the usual Lamb-Oseen solution class. Vortex Core Parameters Based upon two-dimensional representations of the flow pattern, the vortex core radius is estimated as the half-distance between the peaks in the swirl velocity profile. However, this definition is not sufficient to characterize the vortex core. Considering the radial distribution of the swirl velocity in the vortex cross section, four distinct flow regions can be identified (Tung et al., 1983; Rule and Bliss, 1998). The first region of the viscous vortex core is the inner region, which is characterized by a solid-body like rotation near the vortex center. In this region, the swirl velocity increases linearly with the radius defined from the vortex center. A secondary region corresponds to a turbulent mixing region where the turbulent diffusion and viscous effect are suggested by a smearing of the velocity profile. This secondary region is surrounded by a tertiary transition region from the turbulent region to the outer inviscid region and by a fourth, inviscid region, which is characterized by the free vortex velocity profile, 1/r. 84
105 Solid-body Rotation Core Recent experimental studies conducted by Martin and Leishman (2002) and Han and Leishman (2004) indicated that the inner vortex core is laminar. An explanation for this behavior can be given by investigating the effect of the centrifugal forces due to swirling motion over the stability of the flow in the vortex core. The transition from laminar to turbulent is affected by inertial forces induced into the vortex core. The motion into the vortex core near the vortex axis can be analyzed by examining the analogy with the flow in the annulus between two rotating concentric cylinders where the inner cylinder rotates with lower velocity than the outer cylinder. It was suggested that the Richardson number could represent a criterion in establishing the laminar core region. The local Richardson number is defined based on the analogy between rotation and stratification, as: 2V Ri = r t 2 ( V r) ( V / r) 2 t r r t r (6.3.) Originally, Cotel and Bridenthal (1999) and Cotel (2002), in their study of fixed wing tip vortices suggest that a relaminarization process occurs inside the core due to stratification produced by the high rotational flow. Their assumption was that the attainment of a critical Richardson number would prevent the formation of turbulent eddies and would relaminarize any entrained eddies. Consequently, the only diffusion process which can take place in this laminar region is molecular diffusion. Thus, the persistence of the vortex and the low growth rate of the core are explained by the fact that molecular diffusion is a very slow process. 85
106 The relaminarization criterion is based on the critical Richardson number, which is defined as : 1/ 4 Ri cr = Re V (6.4) where the vortex Reynolds number Re V = Γ ν. Therefore, the region where the local Richardson number is larger than the critical Richardson number defines the laminar core. Peak-to-peak Velocities Core Surrounding the inner core is a turbulent region, in which shear stresses and turbulent mixing effects are predominant. In this region the radial diffusion of vorticity is faster, causing the vortex core to grow much more rapidly with vortex age. By analogy to the boundary layer theory, this region can be identified with the logarithm region that is defined in the mixing length theory of Prandtl. According to the viscous core model described by Rule and Bliss (1998), in this transitional region the geometric locus of the maximum swirl velocity can be identified. According to the same model, outside of this logarithm region the flow is nearly inviscid. This outer region can be identified with the classical free vortex region, 1/r, which is defined in the Rankine vortex model. The listing of the vortex parameters, which characterize the solid-body rotation core and the peak-to-peak velocities core, is given in Table 6.1. The listed data indicate a trend of the laminar core to increase (as a percentage) suggesting a relaminarization towards the outer region. 86
107 Table 6.1. Variation of vortex core parameters for baseline case Wake age ~ R = Estimated vortex center location R c ~ Z = Z c Radius ~ r = r c Estimated peak-to peak core Swirl Slope velocity w ~ Ω = w ~ ~ r = w/ V Tip Γ= 2π ~ r w ~ 7.1 o o o o Wake Estimated solid-body rotation core Solid-body rotation core vs. age peak-to peak core Radius Swirl velocity ~ r S = r c w ~ Slope ~ = S w/ V Tip Ω = w ~ ~ r S~ w~ S r r w~ 7.1 o % 83.2% 10 o % 82.9% 20 o % 87.6% 30 o % 95.7% Wake age Peak-to peak core parameters Radius growth ~ r ~ r TE Velocity reduction w ~ ~ w TE Diffusion Ω rate Ω TE Solid-body rotation core parameters Radius Velocity Diffusion growth ~ reduction rs w ~ Ω S S ΩS _ TE r~ w~ S _ TE S _ TE 7.1 o 100% 100% 100% 100% 100% 100% 10 o 115% 69% 60% 97% 68% 71% 20 o 167% 44% 26% 208% 46% 22% 30 o 244% 36% 15% 315% 42% 13% 87
108 This trend is suggested also by the cross-flow pattern at 30 deg wake age showing concentric circular streamlines, which indicate a reduced radial diffusion. The criterion for differentiating the laminar region within the turbulent one is extremely important in describing the vorticity diffusion mechanism as well as in estimating the rate of vortex core growth. In the following chapter, this criterion will be used to explain the effects of modulated blowing to enlarge the turbulent core region and reduce the laminar inner core, leading to a higher diffusion of vorticity. 6.4 Vortex Formation and Near Wake Evolution for a Square Blade Tip This section of the chapter is dedicated to a comparative study between the baseline case of a rectangular blade with a rounded tip and the case of the same rectangular blade with a square tip. For ease of comparison, the visualization parameters used for the flow around the square blade tip, shown in Figures , are the same as the ones used for the rounded blade tip. The vortex formation mechanism is explained by identifying the separation and reverse flow regions in the cross-flow and streamwise velocity contours that are illustrated in Figure 6.14 for different sections in the chordwise direction. The streamlines characterizing the two-dimensional cross-flow velocity field for chord sections located at 40%, 70% and 90% of chord from the leading edge are shown in Figure The pressure contours near the blade tip are represented in Figure 6.16 for different azimuthal sections. 88
109 The roll-up mechanism is graphically illustrated, as in the rounded blade tip case, in Figure 6.17 and is based on the representations of streamwise velocity (axial deficit) magnitude and of the cross-flow vorticity lines. In Figures , the evolution of cross-flow with wake age is illustrated by representing the cross-flow velocity and the azimuthal vorticity contours. Additionally, in the same figures the shape of the vortex core was suggested by using cross-flow streamlines. As in the case of the rounded blade tip, the formation of the tip vortex occurs on the upper side of the blade surface. However, for this type of tip geometry, the vortex begins to form immediately after the chord section corresponding to the airfoil maximum thickness. Unlike the rounded blade tip, the cross-flow around the tip separates very early. The square geometry of the blade tip is favorable to the detachment of the fluid along the upper edge of the end section since the fluid is strongly decelerated by the 90 deg turns at the corners. An intuitive analogy, which helps explain the differences in the mechanism of separation of the spanwise flow around the rounded tip and square tip is provided by examining the flow around a circle and the flow around a flat plate at 90 deg incidence. In the streamwise direction, the separation occurs after the maximal velocity point, where the streamwise flow decelerates as being subjected to an adverse gradient pressure. Consequently, at the section of 30% of chord downstream from the leading edge (Figure 6.14), the initial boundary layer separation region can be identified on the upper side edge of the square blade tip. Further, downstream, the boundary layer thickness increases near the upper tip corner, leading to a spread reversed flow region that is detached from the upper side of the blade. The resultant vortex has an elongated shape, with the center displaced slightly up and inboard. At the trailing edge section 89
110 (Figure 6.16), two regions of local minimum pressure can be identified: the primary lowpressure region at the tip where the flow detaches from the corner, and a second region with less intense pressure gradients. This second region is probably generated by the early-detached vortical flow, which moved inboard as it was convected downstream. Furthermore, as the shear layer starts to roll-up after leaving the blade, two regions of local maximum axial deficit can be identified by the convergent spiral shapes of the cross-flow vorticity lines (Figure 6.17). At early wake ages, the vortex center is not found in the regions of the local high axial deficit. As the vortex age increases, the region of high axial deficit velocity becomes more compact, as shown by the merging of the same orientation spirals representing cross-flow vorticity lines. Beyond 20 deg wake age, only one peak axial deficit center can be recognized. As the roll-up process matures, the distance between the swirl center and the maximum axial deficit decreases. At age 30 deg, where roll-up is almost complete, these points tend to collocate. As in the case of the rounded blade tip, the representations of the cross-flow velocity field in the same figures with the azimuthal vorticity contours (Figures ) show that the vortex center for the tip vortex is found in the region of high vorticity. Compared to the tip vortex shape formed in the case of the rounded blade tip, the tip vortex for the square tip has a more elongated shape and the approximate elliptical crosssection is characterized by a higher value of eccentricity. A similar phenomenon of the rotation (twisting) of the tip vortex elliptical section as wake age increases can be observed in the evolution of the core shape as represented in the Figures Similar to 90
111 the rounded blade tip case, the core becomes more circular while the intensity of roll-up decreases. Comparing the estimated elliptical vortex cores for both blade tips in Figure 6.22, the elliptical section area is larger, with higher major axis, for the square tip that for the rounded blade tip. Therefore, the vortex cross-section twisting is more obvious for the square blade tip. The numerical results represented for the rounded blade tip and for the square blade tip in Figures and Figures , respectively, show that close to the trailing edge, at 10 deg wake age, the vorticity magnitude is higher for the rounded blade tip vortex than for the square blade tip. As the wake ages, the tip vortex diffuses more rapidly for the rounded blade tip than for the square tip. At 30 deg wake age, the vorticity magnitude is slightly lower for the rounded tip case than for the square tip. Meanwhile, the axial deficit peak is higher for the rounded blade tip than for the square blade tip. A possible explanation for the higher diffusion of vorticity for the tip vortex generated by the rounded blade tip than for the vortex generated by the square blade tip, is that a higher axial deficit persists in the core vortex for the rounded blade tip case. The axial velocity in the core may sustain small scale eddies turbulence (Spalart, 1998) by intensifying the radial fluid flux toward the inner vortex core which leads to a higher diffusion of the core. 91


112 Figure 6.14 Cross-flow velocity patterns during the vortex formation for square blade tip 92


113 Figure 6.15 Cross-flow streamlines represented for 40%, 70% and 90% of chord Figure 6.16 Pressure iso-contours near the square tip blade 93


114 Figure 6.17 Two-dimensional flow patterns for vorticity lines for square blade tip 94
115 0.5 Vertical velocity Vz/V_tip Axial velocity deficiency Va/V_tip Radial velocity Vr/V_tip Axial velocity deficiency Va/V_tip Vz /Vtip Va /Vtip 0 Vr /Vtip Va /Vtip R/c Z/c 0.05 Figure 6.18 Flow pattern in the radial plan corresponding to 7.1 o vortex age for square blade tip 0.5 Vertical velocity Vz/V_tip Axial velocity deficiency Va/V_tip Radial velocity Vr/V_tip Axial velocity deficiency Va/V_tip Vz /Vtip R/c Va /Vtip Z/c 0.05 Figure 6.19 Flow pattern in the radial plan corresponding to 10 o vortex age for square blade tip 95 Vr /Vtip Va /Vtip

116 0.25 Vertical velocity Vz/V_tip Axial velocity deficiency Va/V_tip Radial velocity Vr/V_tip Axial velocity deficiency Va/V_tip Vz /Vtip Va /Vtip Vr /Vtip Va /Vtip R/c Z/c 0.05 Figure 6.20 Flow pattern in the radial plan corresponding to 20 o vortex age for square blade tip 0.25 Vertical velocity Vz/V_tip Axial velocity deficiency Va/V_tip Radial velocity Vr/V_tip Axial velocity deficiency Va/V_tip Vz /Vtip Va /Vtip Vr /Vtip Va /Vtip R/c Z/c 0.05 Figure 6.21 Flow pattern in the radial plan corresponding to 30 o vortex age for square blade tip 96
117 0.1 Evolution of aproximative elliptical vortex core Rounded Blade Tip Vertical position [Z/c] Wake Age 7.1 deg Wake Age 8.5 deg Wake Age 10 deg Wake Age 12 deg Wake Age 15 deg Wake Age 20 deg -0.3 Wake Age 30 deg Vortex Center Radial position [R/c] 0.1 Evolution of aproximative elliptical vortex core Straight Blade Tip Vertical position [Z/c] Wake Age 7.1 deg Wake Age 8.5 deg Wake Age 10 deg Wake Age 12 deg Wake Age 15 deg Wake Age 20 deg -0.3 Wake Age 30 deg Vortex Center Radial position [R/c] Figure 6.22 Comparative evolution of the elliptical vortex core between the rounded and square blade tips 97
118 6.5 Comparison between Experimental and CFD Data In this section, the numerical results for the square blade tip case are compared with the available published experimental data obtained by McAlister in 1996 (McAlister, 1996). Similar coefficients for square blade configuration are C T = and C Q = The reference data obtained experimentally by McAlister (1996) for a square blade are C T =0.005 and C Q = The experimental data obtained by McAlister for the vertical velocity near wake indicate that the peak velocity attains about 31% of the rotor-tip speed. The numerical results for the square tip indicate that, at the trailing edge, the vertical velocity peak reaches 34% of the rotor tip velocity while the peak axial velocity is about 12% of the rotor tip velocity. The experimental data for a one-bladed rotor with the same blade configuration as the two-bladed rotor configuration previously described are largely described in the NASA report of McAlister, Tung and Heineck (2001). A comparison between the PIV experimental data for a one-bladed rotor configuration obtained in 2001 with the LV experimental data for a two-bladed rotor obtained by McAlister in 1996 is represented in Figure Unlike the coordinates system used in the presentation of numerical data, the reference system used by McAlister has the coordinates origin the blade trailing edge. The experimental data for a one-blade rotor showed that, at 10deg wake age (defined from the trailing edge), the peak core radius estimated from the vertical velocity distribution for horizontal line cuts is r y =11.2mm (0.06c). The peak core radius estimated from the radial velocity distribution for vertical line cuts is r z =17.2mm (0.09c). At 30 deg wake age, the horizontal peak radius is r y =17.1mm (0.09c) while the 98
119 vertical peak core radius is r z =14.6mm (0.077c). These two characteristic radii of the tip vortex core indicate that this vortex core has an elliptical shape. The change with the wake age of these two radii also indicates a twisting of the elliptical core, which is a phenomenon previously indicated by the numerical data. Additionally, the trend for the core to change from elliptical to a more circular shape as the vortex age increases is also observed in the experimental data. The two-bladed rotor experimental data (McAlister, 1996) represented for 0.5 chord and 3 chords downstream from the trailing edge indicate that the profile of vertical velocity does not significantly change. In Figure 6.24-(a), vertical velocity profiles are represented for experimental data at three chords behind the blade trailing edge compared to the numerical data obtained at 30 deg wake age (about 2.8 chords behind the trailing edge) with respect to the reference grid (with 165x125x50 points) and to the refined and adapted grid (with 255x125x111 points). The axial velocity profile changes significantly with wake age. The experimental observations indicate that, near the blade, the peak axial deficit and the swirl center are different. As the vortex develops downstream, these two points tend to collocate. These observations were confirmed by the numerical data previously presented. In Figure 6.24-(b), the axial velocity profile is represented for experimental data at three chords behind the blade trailing edge compared to the numerical data obtained at 30 deg wake age. Both representations of axial velocity and vertical velocity suggest that, near the blade, the numerical results are in agreement with the experimental data. The asymmetry of the tip vortex core during the formation process and in the early stages of the roll-up was also observed in experimental investigations by Wong 99
120 (2001). Wong s study focused on the mechanisms of formation and evolution of the tip vortices trailed by a two-bladed rotor in low speed forward flight (0.1 advance ratio). The rotor blade had an untwisted rectangular planform (the aspect ratio of 5.3), ending with a square tip. The tests were performed for a Mach tip number of 0.28 and a collective pitch of 10 deg. These tests are in the same low subsonic regime as those performed by McAlister as well as the numerical tests presented in this thesis. In Figure 6.24, the flow patterns obtained experimentally by Wong (2001) are represented in two x- planes located before and after the blade trailing edge. Shadowed ellipses are used to indicate the approximate shape of the vortex core. A similar phenomenon of the rotation of these elliptical vortex cores, which was previously illustrated in the numerical results, is also revealed by the experimental data and therefore confirming qualitatively the numerical capture of the tip vortex formation physics. Another physical aspect captured experimentally by Wong (2001) and confirmed numerically in the current work is the existence of two different regions of local maximum axial deficit velocity. This indicates the occurrence of two distinct local lowpressure areas near the tip trailing edge. A comparison of the velocity patterns behind the trailing edge is illustrated in Figure The numerical data are represented in a manner similar to the Wong s experimental data in order to facilitate the comparison. Both representations indicate a similarity of the axial velocity distribution in the vortex core behind the trailing edge. These comparisons with the experimental results obtained by Wong, in spite of the fact the tests conditions are different, suggest that essential aspects of the flow around the tip during tip vortex formation and roll-up were well captured by the numerical results. 100
121 Figure 6.23 Experimental data for one blade and two blades configurations (McAlister et.al.,2001) Comparison of Vertical Velocity Component with Experiment Comparison of Axial Velocity Component with Experiment Experimental data 0.25 Computational data 30deg Vz/Vtip 0 Va/Vtip Experimental data Computational data 30deg-reference grid 165x50 Computational data 30deg -refined grid 275x r[mm] r[mm] a b Figure 6.24 Comparison between numerical and experimental data 101


122 Figure 6.25 Experimental data obtained by Wong (2001) for a two-bladed rotor (courtesy of Komerath and Wong) 102

 and numerical data")
123 Axial Deficit Regions Figure 6.26 Comparison of the flow patterns obtained from experimental data (top photo-wong, 2001) and numerical data (low photo) 103
124 6.6 Far Wake Vortex Evolution As mentioned previously, the capability and accuracy of capturing the tip vortex are limited by the resolution of the grid in the vortex region. To improve the accuracy of the wake capturing while the computational effort remains the same, the grid generator was modified to allow an equidistant radial distribution in the wake regions upstream and downstream. As shown in Figures 6.27 and 6.28., the grid generator was modified in upstream and downstream regions and in the tip cluster region in order to enhance grid smoothness. Additionally, the grid was adapted to take into account wake contraction, maintaining a constant cell radial dimension into the wake region. To maintain the good radial resolution near the blade for capturing tip geometry modifications, the grid was not modified in the area close to the blade. The refinement in the wake region was extended over 20% of blade in such a way as to not induce perturbation effects in the wake capturing due to grid stretching. A significant improvement in the wake capturing for higher wake ages was obtained by modifying the spacing in the normal direction to the internal C-cut as shown in Figures 6.29 and The points distribution in the normal direction was parametrically controlled in the wake region in order to increase the grid resolution in the vertical direction for at least the second vortex passage (Figure 6.31). The improvements in the capturing the far wake are illustrated by the comparison of the estimated vortex trajectory numerically obtained for the square blade tip, using the reference grid (165x125x50), the refined grid (275x125x111) and the predicted vortex trajectory using the analytical Landgrebe s model (Figure 6.32). 104
125 The variation of the tip vortex core parameters for the square blade tip configuration, using the reference grid and the refined grid, is illustrated in Figure As shown in Figures 6.32 and 6.33, for the reference grid the wake is not well captured after 60 deg wake age while using the refined grid the wake characteristics are well estimated about one rotation and a half ( 540 deg wake age). The evolution of the tip vortex structure with the wake age for a square blade tip is shown by the representations of vorticity magnitude contours for different radial planes in Figure This figure shows that the deformed vorticity contours characterizing the tip vortex were captured until 640 deg wake age. Similar representations of the vorticity contours are illustrated in Figure 6.35 for the round tip configuration. The numerical results show that the vortex intensity is less for the round tip configuration than for the square tip as the vortex ages. Therefore, the deformed contours of the tip vortices are captured only for about 570 deg wake. The last four figures demonstrate that the capturing of the far wake beyond one revolution is affected significantly by the vertical size of the cell grids. A different impediment to an accurate capture of the tip vortex is the numerical dissipation associated with the solver itself. The previously presented results are obtained with the TURNS version, which uses Roe s approximate Riemann solver with a third order Monotone Upstream Centered Scheme for Conservation Law (MUSCL) type scheme. A TURNS version incorporating high order symmetric total variation diminishing (STVD) schemes was developed by Usta (2002) at GeorgiaTech. The comparative results relative to the original version showed significant improvement of the tip vortex capturing (Usta, 2002). However, the benefits of using high-order schemes are limited by the smoothness and the stretching ratios of the grid. Another issue 105
126 regarding the code performance is related to the turbulence model. For the presented results, the algebraic Baldwin-Lomax turbulence model was included. In summary, the results indicate that the capturing of the tip vortex is significantly influenced by the grid resolution in the vortex region. 106


127 Figure 6.27 Reference grid blade plane view Figure 6.28 Modified grid blade plane view 107


128 Figure 6.29 Reference grid detail of C-grid section view Figure 6.30 Modified grid detail of C-grid section view 108

129 Figure 6.31 Grid resolution for capturing the second vortex passage 275x125x111 grid size 109
130 Comparison of prescribed Landgrebe's wake model with computational data - Grid 155x50x Radial contraction r/r r/r -computational data r/r - Landgrebe's wake model z/r-computational data z/r - Landgrebe's wake modell Vertical displacement, z/r Wake age [deg] Comparison of prescribed Landgrebe's wake model with computational data -Grid 275x111x Radial contraction r/r r/r -computational data Vertical displacement, z/r 0.6 r/r - Landgrebe's wake model -0.2 z/r-computational data -0.1 z/r - Landgrebe's wake modell Wake age [deg] Figure 6.32 Tip vortex trajectory estimated computational using reference grid (top) and the refined grid compared with analytical Landgrebe s wake model 110
131 Vortex Core Parameters - Grid 155x50x125 Estimated tip vortex core radiu Core radius r/c Swirl velocity peak w/vtip Swirl velocity peak Wake age [deg] Vortex Core Parameters - Grid 275x111x Estimated tip vortex core radiu Core radius r/c Swirl velocity peak w/vtip Swirl velocity peak Wake age [deg] Figure 6.33 Variations of tip vortex core parameters with the wake age estimated using reference grid (top) and the refined grid 111
132 Figure 6.34 Tip vortex evolution for a square blade tip 112
133 Figure 6.34 Tip vortex evolution for a square blade tip (continued) 113
134 Figure 6.35 Tip vortex evolution for a rounded blade tip 114
135 Figure 6.35 Tip vortex evolution for a rounded blade tip (continued) 115
136 6.7 Potential for BVI Noise Reduction In spite of the fact that current numerical results concern the hover flight condition, the comparative results between the square blade tip and the rounded tip cases can be useful as indicators of eventual benefit for BVI noise reduction. In general, the highest number of potential blade-vortex interactions occurs in low speed forward flight (Leishman, 2000). The experimental study for forward flight with low advance ratio conducted by Wong and used as a reference here, was performed in these flight conditions. As shown in Section 6.5, the comparison between Wong s experimental results and the current numerical results for hover flight indicate that there is a similarity between the main characteristics of both flow patterns, at least during the formation process. Therefore, it may be reasonable to assume that a similar influence of the blade tip shape over the rotor wake structure and trajectory predicted for hover may also be expected for low speed forward flight. As stated in Chapter 1, the BVI noise is generated by the impulsive change in pressure caused by the interaction with the vortices shed from previous blades. One of the essential parameter to be controlled for BVI noise reduction is the miss distance. The miss distance, r, is defined as the separation distance of the vortex from the blade airfoil. Using a simplified two-dimensional parallel blade vortex interaction, Hardin and Lamkin (1987) derived that the acoustic pressure time history produced by BVI varies quadratically with the inverse of miss distance. They concluded that a doubling of the miss distance would lead to a 12dB reduction of the noise level. For a simple evaluation of the comparative sound levels caused by the BVI, this study assumes that the miss 116
137 distance is characterized by the distance between the blade and the tip vortex generated by the other blade. This represents the tip vortex passage and characterizes 180 deg wake age. The representations of the tip vortex positions relative to the blade are shown for square tip and rounded tip configurations in Figure The estimated normal distance between the tip vortex and the blade in the 0/180 deg radial plane is 44% of chord for the square tip configuration and 54% of chord for the rounded tip configuration. Consequently, the miss distance ratio between the two cases is: r r SQUARE ROUND 0.8 (6.5) By definition, the sound pressure level (SPL) is a relative quantity expressed by the ratio between the actual sound pressure and a fixed reference pressure. Because the square of the sound pressure is proportional to sound intensity, SPL is measured in decibels and is expressed as: 2 p = p SPL = 10 log 10 20log 10 (6.6) 2 pre f pre f Based on the study of Hardin and Lamkin (1987), the sound pressure is assumed to vary inversely proportional to the second power of the miss distance. Consequently, the difference of the BVI noise levels between the square blade tip case and the rounded blade tip case is estimated to be 3.6dB. This result indicates that that the level of noise may be noticeable higher for the square tip case due to the closer location of the vortex to the blade. However, this estimation, which is based upon a simplified analytical analysis 117
138 (Hardin and Lamkin, 1987), may not be realistic. Consequently, a numerical aeroacoustic investigation would be appropriate for an accurate prediction of the miss distance influence upon the noise level. The accuracy of the assumption concerning the relationship between the miss distance and the acoustic pressure is determinant for noise level estimation. As an example, by assuming a linear dependence between the sound pressure and the miss distance, a potential noise reduction of 1.8dB is estimated for the rounded blade tip compared to the squire tip. Another parameter, which may significantly influence the BVI, is the strength of the tip vortex. Hardin and Lamkin (1987) deduced that the sound pressure is directly proportional to the tip vortex circulation. The estimated vortex circulations (dimensionalized at chord and tip velocity) are for the square tip case and for the rounded tip case. The difference in the sound levels due to the vortex circulation variation between the two cases is estimated to be about 1.1dB The analysis of the influences of the miss distance and the tip vortex strength upon the noise level suggests that the increased miss distance in the case of rounded blade tip is a more significant factor for noise reduction than the vortex strength decrease. Overall, this first order estimation of the effects of modification of rotor wake trajectory and intensity caused by the blade tip shape suggests that the rounded tip may be more beneficial for BVI noise reduction than the square tip. 118
139 Square blade tip Rounded blade tip Figure 6.36 First passage of the tip vortex miss distance representation square blade vs. rounded blade tip 119
140 6.8 Summary of Observations CFD results provide sufficient evidence to characterize the fundamental aerodynamic aspects of tip vortex formation, roll-up and far wake tip vortex evolution for both square blade and rounded blade tips. In summary, the CFD results indicate: Ellipticity of the core in the early ages of formation and roll up, confirming the experimental observations - (McAllister,1996; Mahalingham, 1999; Wong, 2001) Twisting of the elliptical core during roll up, which was also observed experimentally (Wong, 2001) Displacement of the peak axial deficit from the vorticity center at early vortex ages, confirming also the experimental observations (McAllister,1996, Wong, 2001 ) Tendency of collocation of the vortex center and the axial deficit center as the roll-up matures Qualitative differences in the formation process of the tip vortex between the square blade tip and rounded blade tip Slight reduction of vortex strength in far wake for the rounded blade tip Higher miss distance, correlated with a lower tip vortex circulation obtained for the rounded blade tip configuration. This indicates that the rounded blade tip may be more beneficial for BVI noise reduction compared to the square blade tip. 120
141 CHAPTER VII STUDIES OF TIP VORTEX ALTERATION VIA STEADY BLOWING 7.1. Introduction Recent experimental studies regarding discrete blade tip jets (Gowanlock and Matthewson, 1999) and the slotted blade tip (Han and Leishman, 2003, 2004) indicated that emerging jets in the spanwise direction intensify the mechanism of diffusion of the vortex core and, therefore, lead to a significant reduction in the peak values of the core swirl velocity. In both studies, the experiments were conducted for hovering rotors and the steady jets emerged from slot exits located in the mid-plane of the tip. In this chapter, two steady rotor blade tip blowing configurations are numerically analyzed for hover condition. The first case corresponds to tangential blowing over the rounded tip configuration described in Chapter 3. Numerical tests are performed for a hovering rotor characterized by the same tip Mach number of 0.3 as the baseline case. The rotor consists of two blades characterized by rectangular planform, zero twist, with the aspect ratio of 6. The rotor blade section is NACA0012 and the tip is rounded. The solidity of the rotor is The second case corresponds to mid-plane steady blowing configurations with the two jet orientations also described in Chapter
142 7.2 Blowing Cost The typical indicator used to estimate the supplementary amount of energy required for blowing is the blowing momentum coefficient. This coefficient is conveniently used as a measure of the strength of the emerging jet. The definition of the blowing momentum coefficient is based on the jet momentum evaluated at the exit slot section. For a jet of arbitrary cross-section, the momentum transport in the integral form is: H jet = ρ u u ds (7.1) n S jet where u n is the jet velocity normal to the slot exit surface. By definition, the blowing momentum coefficient is: H C µ () t (7.2) S jet = 1 2 ρvref 2 ref where the dynamic pressure, 1 2 ρ 2 V ref, is usually provided by the freestream conditions. Assuming that the jet velocity profile at the slot exit section is uniform, the Equation (7.2) leads to the blowing momentum coefficient defined by Equation (5.2) and used in the 2D and 3D wing flow applications studied in Chapter 5. For the rotor applications, the reference velocity is the tip velocity and the reference surface is the rotor disc area, following the same approach used to define the performance coefficients. 122
143 Therefore, the expression of blowing momentum coefficient becomes: C µ nblades H jet = (7.3) ρv R 2 Tip π A second indicator, which can be used to estimate the necessary power for an efficient blowing is provided by the rate of transport of kinetic energy by the jet (Tritton, 1977): u E& jet = ρun ds (7.4) 2 S jet 2 This quantity characterizes the power requirement to be carried by the compressor and has the same dimensional meaning as the rotor power. Therefore, a jet energy coefficient can be defined as: C ε = n blades E& jet ρv R 2 Tip π (7.5) This coefficient can be compared with the rotor power coefficient (equal with the torque coefficient for the hover tests) in order to provide an estimation of the blowing cost. 123
144 7.3 Rounded Tip Rotor Blade with Tangential Blowing The blowing configuration investigated in this section consists of flow over a rounded tip rotor blade with spanwise tangential jet blowing emerging from the upper tip surface. Two kinds of tests were performed for evaluating the benefits and drawbacks of using the tangential steady blowing compared with baseline (no blowing) and with unsteady blowing obtained through slot modulation. The first test was designed to give an understanding of the differences and similarities in the tip vortices formation and roll-up between the baseline and the tangential blowing case in the hypothesis that the blowing is a switch on/off alternative during the rotor flight. In this approach, the test was performed for the baseline s flow conditions: 0.3- Mach tip number and 8 o collective pitch angle. The test was performed for steady blowing and corresponded to the fully open slot position. The maximum slot height is of chord and the slot is located above the rounded blade tip edge. In the chordwise direction, the slot spans from 40% to 74% of chord measured from the leading edge. The aerodynamic performance coefficients for this steady blowing configuration are C T =0.0055and C Q = , respectively. Relative increases of 14% in thrust and 12% in power versus the baseline case are obtained. The estimated jet blowing momentum coefficient is , which corresponds to plenum conditions of T * 1.07 T and p * 1.28 p. The coefficient of kinematical energy rate required for jet emergence is and represents about 37% of the computed aerodynamic power coefficient estimated for this blowing configuration. Therefore, the power penalties are due to 124
145 estimated rotor power increment but significantly due to compressor power requirement for blowing. The second test was performed by maintaining invariant the thrust coefficient resultant in the baseline test. In order to match this thrust coefficient, the collective pitch angle was reduced to 7.4 o. The results were compared with the baseline case to assert the potential benefits and the costs of using the blowing while there is no drawback regarding the thrust. In the previously described slot configuration, the indices for compressor power requirements were high. For this reason, the comparative test with the baseline was performed considering half of the blowing momentum coefficient corresponding to the first case investigated. In order to achieve this blowing momentum coefficient (C µ = ), the slot height was reduced at half while the slot was still spanning from 40% to 74% of chord. The estimated aerodynamic power coefficient is , 5% higher than the power coefficient obtained for the baseline case. The jet energy coefficient for this blowing configuration is , which represents about 20% of the aerodynamic power requirement Vortex Formation The mechanism of tip vortex formation for the case of steady tangential blowing is substantially different in comparison to the mechanism for the baseline case. The baseline study revealed that the separation of the cross-flow around the tip occurs between 40% and 50% of chord. Also, it was observed that during the development of the tip vortex after separation, the vortical flow region remains attached to the blade surface until approximately 80% chord. For the last 20% of chord (up to the trailing 125
146 edge) the region of zero cross velocity characterizing the vortex core center can be clearly identified as detached from the blade tip. Consistent with these observations and with the computational grid distribution, the slot was selected to span between 40% and 74% of chord from the leading edge. In this region, the boundary layer is separated but the vortical flow region remains close to the blade. Analogous to the flow visualizations presented for the baseline case, the patterns of the cross-flow velocity and streamwise velocity contours are represented in Figure 7.1 for several cross sections in the chord direction. The streamlines characterizing the twodimensional cross-flow velocity field for three different chord sections are shown in Figure 7.2. The pressure contours near the blade tip are represented in Figure 7.3 for several azimuthal planes. The tangential jet blowing emerges in the spanwise direction from the slot located on the upper side of the rounded tip and flows towards the lower surface. The jet flow direction is opposite to the cross-flow around the tip, from the lower surface to the upper surface. Beyond the exit section, the jet is attached to the curved wall due to the balance between the surface normal pressure gradient and centrifugal force generated by the wall curvature. This is known as Coanda effect. Under the adverse pressure gradient, which forces the surrounding flow from lower to upper tip surfaces, the jet is detached. Analyzing the flow patterns for different chordwise sections (Figure 7.1), one can observe that the vortex starts to form at the 40% of chord section, where the blowing starts. The vortex is formed on the outer side of the jet at the fluid frontier with the surrounding air, in a mixing region characterized by strong shear stress. Moving downstream, the cross-section area of the blade tip reduces as the thickness of the airfoil 126
147 decreases and the region where the jet is attached to the wall enlarges. Between 40% of chord and 60% of chord, the vortex is more developed and is moved downward and radially outboard. As a three-dimensional effect, the jet presence induces a streamwise velocity deficit in the jet region as well as in the mixing region. This mixing layer wraps around the existent vortex core, thereby increasing the vortex region. From 70% of chord, the core vortex can be identified in the streamwise velocity deficit region characterizing the mixing zone. The vortex center position remains nearly constant while the vortex core starts to diffuse due to viscous and turbulent shearing stresses. Additionally, a low-pressure region occurs on the lower blade tip side due to the strong intensity of the jet. At 90% of chord, a secondary vortex in the opposite direction from the primary vortex can be identified Vortex Evolution To illustrate the evolution of the vortex, flow patterns are represented in Figures for several radial planes starting with the wake age Ψ= 7.1,until the wake age Ψ= 30. The colored contours of the streamwise velocity combined with the cross-flow vorticity lines are represented in Figure 7.4. Similarly to the baseline case, the cross-flow velocity vector field and the azimuthal vorticity contours are illustrated in Figures Also, the cross-flow streamlines are used to suggest the shape of the vortex core section (Figures ). As the vortex leaves the blade, the flow representations for the azimuthal planes of Ψ= 7.1 (trailing edge section) and Ψ= 10 (0.3c behind trailing edge) show the downstream convection of two regions with opposite vorticity. The tip vortex region is more intense while the secondary vortex region formed near the trailing 127
148 edge is less intense. This secondary vortex induces an upward velocity into the main tip vortex core. As the wake age increases and the roll-up of the shear layer develops, a rotation of the relative locations of these two counter-rotating vortices can be identified (Figures ). Unlike the baseline case where a significant change of the flow patterns behind the trailing edge, was due to free shear layer roll-up, the qualitative change in the vortex shape for blowing is caused more by the mutual influences of the two vortices. As the wake develops downstream, the secondary vortex diffuses rapidly. Another significant impact of blowing on the flow is the higher axial deficit level in the vortex core,-almost three times higher than for the baseline case. The representations of the cross-flow velocity and the streamwise velocity show that the swirl center is located in the region of local maximum deficit. As a consequence of this high axial deficit and of the higher pressure gradients in the core, the cross-flow streamlines seem to be converging spirals toward the vortex center, indicating a strong radial diffusion. A comparison between the azimuthal vorticity magnitude for the baseline case and the steady blowing case indicates an overall reduction of the vorticity and a significantly larger vortex core for the blowing case. Additionally, the vorticity contours for 10 wake for the baseline case (Figure 6.9) and for the steady blowing case (Figure 7.6) indicate a thinner and less intense free shear layer for blowing. 128
149 Figure 7.1 Cross-flow velocity patterns during vortex formation for tangential steady blowing 129


150 Figure 7.2 Cross-flow streamlines represented for 50%, 70% and 90% of chord for tangential steady blowing Figure 7.3 Pressure iso-contours near the tip blade for tangential steady blowing 130
151 R=5.9 R=6.0 R=5.9 R=6.0 R=5.9 R=6.0 R=5.9 R=6.0 R=5.8 R=5.9 R=6.0 R=5.8 R=5.9 R=6.0 Figure 7.4 Two-dimensional flow patterns for vorticity lines for tangential steady blowing from a slot extending between 40% and 74% chord 131
152 Figure 7.5 Flow pattern in the radial plane corresponding to 7.1 o vortex age for tangential steady blowing Figure 7.6 Flow pattern in the radial plane corresponding to 10 o vortex age for tangential steady blowing 132
153 Figure 7.7 Flow pattern in the radial plane corresponding to 20 o vortex age for tangential steady blowing Figure 7.8 Flow pattern in the radial plane corresponding to 30 o vortex age for tangential steady blowing 133
154 7.3.3 Vortex Core Parameters The evolution of the vortex core is determined by estimating the vortex core parameters for different wake ages. This estimation of the vortex core parameters is based on the swirl velocity profiles for the wake ages Ψ= 7.1, 10, 20 and 30. The viscous core and the solid-body rotation core parameters, estimated in the same manner as for the baseline case, are listed in Tables 7.1 and 7.2. For a graphical illustration of the diffusion process as the wake age increases, the representations of the swirl velocity profiles for different wake ages is shown in Figure 7.9. The results listed in Table 7.1 for 30 wake age indicate that the peak-to-peak velocity core is about 2.8 times larger than the corresponding one for the reference baseline case. The comparison of the peak swirl velocities for the baseline and the steady blowing cases shows a reduction of peak swirl velocity for the blowing case. The ratio between the values for steady blowing and baseline is In conclusion, the listed values of the swirl velocity linear slope and, consequently, of the local vorticity indicate a 30% reduction of the reference value obtained for baseline case. A secondary effect of the spanwise blowing is the outboard displacement of the vortex. For the current blowing configuration, the location of vortex center is moved outboard by about 12% of the chord in comparison with the baseline case. 134
155 Table 7.1 Variation of vortex core parameters for steady blowing case Wake age ~ R = Estimated vortex center location R c Z ~ = Z c Radius ~ r = r c Estimated peak-to peak core Swirl velocity Slope w ~ = w/ Ω = w ~ ~ r V Tip 7.1 o o o o Wake age Estimated solid-body rotation core Radius ~ r S = r c Swirl velocity Slope ~ r S~ w ~ = w/ Ω = w ~ ~ r r S V Tip Solid-body rotation core vs peak-to peak core w~ S w~ 7.1 o % 70.9% 10 o % 58.2% 20 o % 41.4% 30 o % 59.4% 135
156 Table 7.2 Variation of vortex core parameters for steady blowing case Wake age Peak-to peak core parameters Radius ~ r growth ~ r TE Swirl velocity w ~ reduction ~ w TE Solid-body rotation core parameters Radius ~ rs growth r~ S _ TE Swirl velocity w ~ S reduction w~ S _ TE 7.1 o 100% 100% 100% 100% 10 o 107% 76% 57% 62% 20 o 140% 58% 282% 34% 30 o 303% 41% 278% 34% Wake age 7.1 deg Wake age 10 deg Wake age 20 deg Wake age 30 deg Vz/Vtip R/c Figure 7.9 Evolution of velocity profiles for different wake ages for tangential steady blowing 136
157 7.3.4 Comparison between the Steady Blowing and Baseline Cases at the Same Thrust Tip Vortex Evolution In this section, the numerical test was performed by maintaining invariant the thrust coefficient resultant in the baseline test. In order to match this thrust coefficient, the collective pitch angle was reduced to 7.4 o. The results are compared with the baseline case to assert the potential benefits of blowing while there is no drawback regarding the thrust. The plenum conditions of T * 1.07 T and p * 1.28 p are the same as in the previously investigated cases. The slot spans from 40% to 74% of chord and the resultant blowing momentum coefficient is The comparison between the baseline case and the current case is performed by analyzing the vortex core parameters as well as by illustrating the tip vortex evolution in the far wake. For a more accurate capturing of the far wake in the steady blowing configuration case, a refined grid with 275x125x111 points, as presented in the previous chapter, is used. Efforts were made to ensure that the grid generation process produces the desired spanwise spacing in the slot region. The characterization of the tip vortex evolution starts with the estimation of the vortex core parameters based on the swirl velocity profiles for the wake ages Ψ= 7.1, 10, 20 and 30. The vortex core parameters defined by peak-to-peak swirl velocity are listed in Table 7.3. For a graphical comparison between the current steady blowing case and the baseline case, the swirl velocity profiles are represented Figure 7.10 for the radial plane located at the tip trailing edge and for the radial plane characterized by 30 o wake 137
158 age. This comparison of the peak swirl velocities cases shows a reduction of peak swirl velocity for the blowing case (with about 24% near the tip trailing edge) as well as the outboard displacement of the center vortex (with about 5% of chord). The comparison of the far wake evolution of the tip vortices for the blowing and baseline cases is substantiated by the analysis of the vorticity magnitude contours for different radial planes in Figures These figures show that the deformed vorticity contours characterizing the tip vortex were captured for up to about one revolution (360 deg) wake age. The comparison of wake descent and contraction rates for steady blowing and baseline configurations with the theoretical prediction of the wake trajectory given by Landgrebe s model is shown in Figure The numerical results show that for the blowing case, as the vortex ages, the vorticity diffusion is higher than that for the reference case. Additionally the wake descent rate is higher for the blowing configuration and therefore, the miss distance between the tip vortex and blade tip at the first passage is larger. This increment of the miss distance could prove to be beneficial for reducing the BVI noise in forward flight, which is one of the motivations of the present work as it was explained in first chapter. As a conclusion, these results indicate that an increased miss distance with about half of chord was obtained using steady blowing. 138
159 Table 7.3 Variation of vortex core parameters for steady blowing case with the same thrust coefficient as the baseline case Wake age Estimated vortex center location ~ R = R c ~ Z = Z c Radius ~ r = Estimated peak-to peak core r Comparison with baseline c Swirl velocity Slope w ~ = w/ Ω = w ~ ~ r V Tip 7.1 o o o o Wake age 30 deg-baseline Wake age 30 deg-blowing Vz/Vtip Vz/Vtip Wake age 7.1 deg-baseline -0.5 Wake age 7.1 deg-blowing R/c -0.3 R/c Figure 7.10 Evolution of velocity profiles for 7.1 o and 30 o wake ages for tangential steady blowing with same thrust as baseline 139
160 Steady blowing Baseline Figure 7.11 Comparison of tip vortex evolutions between steady blowing case and baseline (no blowing) case for 7.1 o and 30 o wake ages 140
161 Steady blowing Baseline Figure 7.12 Comparison of tip vortex evolutions between steady blowing case and baseline (no blowing) case for 60 o and 80 o wake ages 141
162 Steady blowing Baseline Figure 7.13 Comparison of tip vortex evolutions between steady blowing case and baseline (no blowing) case for 135 o and 170 o wake ages 142
163 Wake descent z/r Comparison of prescribed Landgrebe's wake model for rounded blade tip : steady blowing and no blowing cases with same thrust coefficient z/r - steady blowing case z/r - no blowing case z/r - Landgrebe's wake Wake age [deg] 1 Comparison of prescribed Landgrebe's wake model for rounded blade tip : steady blowing and no blowing cases with same thrust coefficient Wake contraction r/r r/r - steady blowing case r/r - no blowing case r/r - Landgrebe's wake Wake age [deg] Figure 7.14 Comparison of prescribed Landgrebe's wake model for rounded blade tip with no blowing and tangential steady blowing 143
164 Potential for BVI Noise Reduction In order to understand the benefits of using blowing as an active technique to reduce rotor noise, the influence of two essential parameters on the eventual BVI noise level was considered as it was explained in Section 6.7. These two parameters are the miss distance and the tip vortex circulation. The hypotheses, in which the comparative sound levels for the steady blowing and baseline tests were evaluated, are the same as those described in Section 6.7. An estimative indicator for the miss distance is assumed to be the normal distance (represented in the 0/180 deg radial plane) between the blade and the tip vortex that is generated by the other blade with half-rotation age. The representations of the tip vortex position relative to the blade are shown for the blowing and baseline (no blowing) cases in Figures This estimative distance is about 98% of chord for the steady blowing test while, for the baseline case is 54% of chord. Consequently, the miss distance ratio between the two cases is: r r BLOWING BASELINE 1.8 (7.6) Based on the hypothesis asserted in the study by Hardin and Lamkin (1987) that the sound pressure is inversely proportional to the second power of the miss distance, a reduction of about 10.4dB in the noise level may be obtained through blowing compared to the baseline noise level. In comparison, even if it is assumed that the sound pressure is inversely proportional to the miss distance, a significant noise reduction of 5.2dB may still be expected. However, this noise level estimation is based upon a simplified analytical analysis (Hardin and Lamkin, 1987) concerning a two-dimensional BVI model. 144
165 Therefore, a more developed aeroacoustic investigation is required for an accurate evaluation of sensitivity of the noise level to the miss distance variation. The second significant parameter for BVI is the strength of the tip vortex expressed by its circulation. For the blowing case, the estimated vortex circulation (dimensionalized at chord and tip velocity) is while, for the baseline case, it is As in Section 6.7, assuming that the sound pressure varies directly proportional with the tip vortex circulation (Hardin and Lamkin, 1987), the reduction in sound level due to the dissipation of vorticity obtained through blowing is about 2.8dB compared to the baseline case. In conclusion, this estimative analysis indicates that the BVI noise level is more sensitive to the miss distance increase than to the vortex strength reduction. The modification of the miss distance through blowing, corroborated by the intensification of vorticity dissipation, may lead to a significant BVI noise level reduction in order of 8-13dB depending of the miss distance influence on the sound pressure (which it was theoretically estimated, based on the Hardin and Lamkin (1987) analysis). 145
166 Steady blowing Baseline Figure 7.15 First passage of the tip vortex miss distance representation Steady blowing vs. baseline (no blowing) 146
167 7.4. Rounded Tip Rotor Blade with Lateral Blowing The last configuration investigated in this study is a two-bladed rotor, which has a slot located in the mid-plane of the rounded blade tip. CFD tests were performed to investigate the effect of steady blowing for two different orientations of the blowing jet. In the first case, the jet emerges in the spanwise direction from the mid-plane of the blade tip, while in the second case the jet is also directed in the spanwise but is deflected downward at an anhedral angle of 30 degrees. Both configurations are described in Chapter 3, in Figure 3.3. The velocity patterns for both configurations are represented in Figures 7.16 respectively In both cases, the blowing jet momentum coefficients are very high. The choice of blowing conditions was based upon the work of Tavella et al. (1988) regarding lateral blowing applied to a wing. In that experimental study, the measurements showed the occurrence of a secondary vortex oriented counter to the primary vortex. These observations indicate the conclusion that the high blowing momentum may generate secondary tip vortices also for a rotor case. The difference between the tangential blowing case studied in the previous section and the blowing cases presented in the current section is the changed geometry and location of the exit jet slot. However, the mechanism of tip vortex formation is basically the same and can be explained by the jet roll-up phenomenon. In the previously described blowing configuration, the jet emerges on the upper side of the rounded tip and attaches to the curved wall (Coanda effect). Consequently, the vortex is formed on the outer (upward) side of the jet in the mixing region. For the 147
168 lateral blowing configurations, the jet emerges with strong intensity from a slot located at the mid-plane and is, in fact, a free jet. Due to the strong blowing momentum, the pressure gradients between the jet and the surrounding air lead to generation of the vortices in the mixing region on both sides of the jet sheet. This explains the occurrence of the secondary tip vortex, counter-rotating to the primary vortex, shown in Figures 7.16 and Furthermore, the flow patterns represented in Figures 7.16 and 7.17 indicate that the positions and the trajectories of both tip vortices depend on the orientation of the jet. To understand the influence of the jet orientation and blowing configuration, respectively, the locations of concentrated vortices and corresponding core parameters are listed in Tables for different wake ages. For the case of lateral blowing, the primary tip vortex is moved outboard and upward. The secondary vortex is located at a larger radial distance than the primary vortex. For the case where the jet is deflected downward, the primary vortex is moved significantly more outboard as well as downward. The secondary vortex is located radially in proximity to the primary vortex but is closer to the blade. The results listed in Table 7.4 for the lateral case indicate that the primary vortex core size does not change significantly between 10 and 30 wake ages, while the peak velocity value decreases by more than 40 percent. However, compared with the baseline (reference) case, the relative ratio of the peak swirl velocities, estimated for different wake ages, is about 1 or slightly less than 1. Additionally, the secondary vortex is more concentrated for the early wake ages ( i.e. 10 wake age), the local velocity slope being about 1.7 times larger than the correspondent slope for the primary vortex. As the vortex 148
169 age increases, this ratio of the local slopes decreases. For example, at 30 wake age, the secondary vortex slope is only 70% of the slope value characterizing the primary vortex. By comparison, downward deflected blowing proved to be more efficient in moving outboard the tip vortices, as well as in diffusing the vorticity. The results listed in Table 7.5 show that while near the trailing edge the intensities of the primary and secondary vortices are quite the same. Moving downstream the secondary vortex diffuses faster. In conclusion, this comparative study indicates that the blowing configuration plays a key role in changing the vortex trajectory as well as changing its structure and intensity. 149

170 Figure 7.16 Flow patterns for spanwise steady blowing from a slot located at the midplane 150
171 Figure 7.17 Flow patterns for spanwise steady blowing with 30 deg anhedral jet angle from a slot located at the midplane 151
172 Table 7.4 Variation of vortex core parameters for steady midplane blowing case Primary vortex Vortex center location Estimated peak-to peak core Wake age ~ R = R c ~ Z = Z c Radius ~ r = r c Swirl velocity Slope w ~ = w/ Ω = w ~ ~ r V Tip 7.1 o o o o Secondary vortex Vortex center location Estimated peak-to peak core Wake age ~ R = R c ~ Z = Z c Radius ~ r = r c Swirl velocity Slope w ~ = w/ Ω = w ~ ~ r V Tip 7.1 o o o o
173 Table 7.5 Variation of vortex core parameters for steady midplane blowing with anhedral jet angle Primary vortex Vortex center location Estimated peak-to peak core Wake age ~ R = R c ~ Z = Z c Radius ~ r = r c Swirl velocity Slope w ~ = w/ Ω = w ~ ~ r V Tip 7.1 o o o o Secondary vortex Vortex center location Estimated peak-to peak core Wake age ~ R = R c ~ Z = Z c Radius ~ r = r c Swirl velocity Slope w ~ = w/ Ω = w ~ ~ r V Tip 7.1 o o o o
174 Table 7.6 Comparison of vortex core parameters between steady midplane blowing case and no blowing- baseline case Primary vortex Secondary vortex Wake age Vortex displacement vs. baseline R c Z c Vorticity ratio Ω Ω baseline Vortex displacement vs. baseline R c Z c Vorticity ratio Ω Ω baseline 7.1 o o o o Table 7.7 Comparison of vortex core parameters between steady midplane blowing with anhedral jet angle case and no blowing- baseline case Primary vortex Secondary vortex Wake age Vortex displacement vs. baseline R c Z c Vorticity ratio Ω Ω baseline Vortex displacement vs. baseline R c Z c Vorticity ratio Ω Ω baseline 7.1 o o o o
175 CHAPTER VIII STUDIES OF TIP VORTEX ALTERATION VIA MODULATED BLOWING 8.1. Introduction The last case analyzed in this work corresponds to unsteady tangential blowing over the rounded tip configuration described in Chapter 3. The rotor geometry is the same as for the baseline case, consisting of two blades characterized by rectangular planform, zero twist and the aspect ratio of 6. The rotor blade section is NACA0012 and the tip is rounded. The solidity of the rotor is Numerical tests are performed for a hovering rotor with 0.3 tip Mach number and a collective pitch of 8 deg, which are similar parameters to the baseline case. The unsteady blowing is obtained by modulation of the slot size, while the plenum conditions are kept constant. The blowing cycle is determined by periodic variations of the slot size. The initial position of the slot is fully open. In this configuration, for a sinusoidal half- cycle, the average blowing momentum represents approximately 36% of the maximum blowing obtained when the slot is fully open. Following the methodology described in Chapter 3, the plenum conditions are the same as for the steady case, T * 1.07 T and p * 1.28 p. The resultant maximum jet blowing momentum coefficient is about The correspondent maximum jet energy coefficient, evaluated as described in Section 7.2 is 155
176 , while the average estimated over one period is The maximum slot height is about of chord and the slot spans from 40% to 74% of chord. For this unsteady blowing test, the frequency was defined in terms of rotor revolution. The numerical test is performed for a blowing frequency of 4 cycles per revolution. The blowing cycle is formed by a finite number of distinct slot sizes, each of these slot sizes being correlated with a certain number of grid cells. The variation in the number of cells for which blowing conditions are imposed is shown in Figure 8.1. Averaged coefficients for each slot size are used to show variations of thrust and torque with blowing jet momentum. The time response of thrust is periodic, with the same frequency as the blowing cycle. The thrust and the torque coefficients exhibit limit cycle responses as shown in Figure 8.2. As previously stated, one of the goals of this study is to analyze the effects of modulated blowing on the tip vortex structure. The focus is on understanding and describing the characteristics of vortex formation and the roll-up process. To compare the modifications caused by modulated blowing with the baseline case, representations of the flow patterns similar to those described in Chapter 6 were illustrated for four different phases of the blowing cycle. Phase 0 corresponds to a fully open slot with C µ = ; phase 1 corresponds to a quarter of a blowing cycle characterized by an average C µ = ; phase 2 corresponds to a closed slot (no blowing); and phase 3 corresponds to third quarters of the blowing cycle with the same blowing configuration as phase 1. Since the blowing cycle is periodic, the last phase of the cycle corresponds to phase 0 of a new cycle. 156
177 15 12 No. of slot cells 9 6 No blowing 3 Blowing Blowing Azimuth Angle [deg] Figure 8 1. Variation of slot cells during blowing cycle Thrust coefficien Torque coefficien No blowing Steady blowing 4 cycles/rev No blowing Steady blowing 4 cycles/rev Blowing momentum coefficient Blowing momentum coefficient Figure 8.2.Variation of performance coefficients vs. blowing coefficient 157
178 8.2. Vortex Formation In the previous chapter, the study of tangential steady blowing revealed that for the investigated blowing intensity range, the jet acts as a flap jet. The vortex formation mechanism for a blowing is different from the baseline (no blowing) case. For the no blowing case, the formation of the tip vortex is a consequence of flow separation occurring on the upper blade surface. For the blowing case, the emerging of the jet generates vorticity in the mixing layer between the jet and surrounding air due to the strong shear stresses caused by fluid viscosity and turbulence. The steady tangential blowing case results show that an incipient vortex is formed from the starting section (upstream slot location) of the blowing. The development of the vortex is caused mainly by the roll-up of the jet. As an effect of this jet roll-up, the characteristic size of the vortex is dictated by the jet spreading distance into the surrounding air, which ultimately depends on the blowing jet width and intensity. Based on these observations, the objective of the following analysis is to identify the benefits that can be obtained by using unsteady blowing in the vortex formation process. The cross-flow patterns near the blade tip were represented in Figures for the cut sections in chord directions, starting with a section at 30% of the chord from the leading edge to the section at the trailing edge of the blade. To illustrate the vortex evolution in the near wake, the cross-flow streamlines are shown in Figures As expected, the flow patterns near the blade show that, the vortex shape and size significantly change as the blowing phase changes. At phase 0, when the slot is fully open, the vortex starts to form at x=40% of chord (upstream slot location) outside the jet 158
179 and on the upper side of the blade tip. The jet is attached on the wall (due to the Coanda effect) for a very short distance, being detached and reversed by a strong local pressure gradient. This local pressure gradient is the result of the basic pressure gradient from the lower to the upper surface of the blade tip and of the difference in pressure between the jet pressure and the lower pressure of the surrounding air. As the jet mass reduces at the next blowing phase, the jet is more quickly detached and reversed upward. At the same time, the vortical flow region decreases as the distance where the jet is attached decreases. When the slot is closed, the boundary layer around the tip becomes again attached. Due to blowing, in the region of incipient vortex the pressure drops. Consequently, the pressure gradient from the lower to upper surfaces increases, stabilizing the boundary layer around the tip. This explains also the appearance of the attached cross-flow and the quick spreading of the low intensity jet for the flow pattern corresponding to phase 3. As it moves downstream, similar behavior of the flow pattern change with the blowing is observed. At the x=0.5 chord section, the vortex at phase 0 becomes more concentrated on the upper blade side. In the next blowing phase, the lower blowing momentum reduces the pressure gradient between the jet boundary and surrounding air, and the jet becomes more attached, enriching the boundary layer. The reverse flow region extends along the curved wall and, the vortex is spreading due to the longer distance for the jet to roll up. At phase 2, as the jet decreases the intensity, the vortex is more dissipated and the reverse flow region is reduced. The cross-flow stabilizes in phase 3, when the reverse flow region is the most reduced. Advancing downstream, the jet becomes attached on the wall for a longer distance and the jet roll-up distance increases. As the vortex grows, the distance between the vortex center and the 159
180 blade surface increases. At 80% of the chord section, the results show that the vortex can be well identified during all phases of the blowing cycle. As the jet roll-up process ends, the flow patterns show that the vortex center is located in the maximum axial deficit region. At the 90% chord section as well as at the trailing edge section, the vortex shape showed to be more deformed for the no-blowing phase than for the other phases. Also, a very weak secondary vortical flow region can be identified downward of the vortex. This vortical flow is caused by the adverse pressure gradient between the lower side of the jet and the fluid layer attached to the blade lower side. As a consequence, the boundary layer on the blade lower side detaches near the mid-plane of the tip edge. However, this secondary flow has a comparatively low intensity and it is rapidly diffused downstream. Summarizing, the results show a significant change of the flow pattern as the blowing configuration changes. As previously noted, phases 1 and 3 have the same blowing configuration. However, phase 1 corresponds to the first half-cycle in which the slot height decreases, while, in phase 3, the height half-cycle. Therefore, the jet rate mass decreases during phase 1 and increases during phase 3. The differences between the flow patterns corresponding to the same blowing slot height are also illustrated by the variation of the aerodynamic performance coefficient during a blowing cycle. The flow patterns for the different chord sections indicate that, in phase 3, the vortex is less intense and the axial deficit is lower. This trend may be explained by the delay in the flow response as the blowing configuration changes. This delay is expressed by the hysteresis behavior of the aerodynamic coefficient variation. 160
181 8.3. Vortex Evolution To illustrate the evolution of the vortex as it ages, the flow patterns are represented for wake ages corresponding to azimuth angles: Ψ= 7.1 ( trailing edge section), 10 (0.3c behind trailing edge), 20 (1.3c behind trailing edge) and 30 (2.75c behind trailing edge). In Figures , the contours of the streamwise velocity and of the cross-flow vorticity lines are represented. The presentation of the flow patterns is completed with Figures , where the cross-flow velocity and the azimuthal vorticity contours are represented. As explained in Chapter 6 for the baseline case, the cross-flow streamlines are used to suggest the shape of the vortex core section in Figures The convergent or divergent orientation of these spiraled streamlines, as well as the size of their wrapping regions, could suggest different flux intensities towards the mid core or outward of the vortex core, respectively. One conclusion of the baseline flow analysis is that the tip vortex core shape changes significantly during the roll-up process. Moreover, the process of core identification shows that the tip vortex has an elliptical core, which rotates as the roll-up advances. Another significant characteristic highlighted by the baseline case study is the offset between that the swirl center for the tip vortex and the location of peak axial velocity. It was also observed that, as the roll-up matures, this offset distance between the swirl center and the maximum axial deficit decreases. At age 30 where the roll-up is almost ended, these points approximately coincide. In contrast to the baseline case, the swirl center and the point of maximum axial deficit tend to collocate even from the 161
182 trailing edge when blowing is applied. Also, the peak axial deficit inside the vortex core is much higher for the blowing case than for the baseline case. Another difference between the baseline case and the modulated blowing case concerns the change in the vortex core cross section as the vortex develops downstream. For the baseline case, the roll-up of the free shear layer leads to the assimilation of small scale eddies in the vortex core region, causing the growth of the tip vortex. Consequently, a significant change of the cross section occurs during the roll-up. This is also indicated by the elongated shape of the vortex core. By comparison, the cross-flow streamlines for the modulated blowing case present more concentrical shapes without a notable orientation change of the vortex core between 10 and 30 wake ages. When the vortex leaves the blade, the core was already fed by the jet-mixing layer during the jet roll-up process and consequently the influence of the free shear roll-up is more reduced. At the early formation stage, the vortex core shape varies significantly during the blowing cycle since it is dependent on the blowing jet characteristics. These observations lead to the conclusion that the jet roll-up is the primary mechanism, which determines the formation and the further evolution of the tip vortex in the tangential blowing case. As previously mentioned, the influence of the blowing cycle is significant for the early vortex ages. These can be observed in the flow representations for the different blade chord sections in Figures , as well as for the flow patterns represented in Figure 8.13 for 7.1 and 10 vortex ages. Advancing downstream, this influence diminishes and at 30 wake age (about 2.8 c behind trailing edge), the flow patterns (Figure 8.14) during the blowing cycle are almost the same. A comparative analysis between the azimuthal vorticity variations for the baseline case illustrated in Figures
183 6.11 and the similar representations for the modulated blowing test shows a significantly lower magnitude of the vorticity and, implicitly, of the vortex strength in the case of modulated blowing. The considerable diffusion of vorticity observed in the blowing case at the trailing edge (Ψ=7.1 ), as well as close behind the trailing edge (Ψ=10 ), indicates that the vorticity diffusion begins during the jet layer roll-up. The results suggest that the tip vortex core trailing behind the blade is more diffused due to the strong shear stresses characterizing the jet-mixing layer. The reduced level of vorticity as well as the larger core size is confirmed also by the following investigation of the vortex core parameters. 8.4 Vortex Core Parameters The characterization of the vortex core for different wake ages is based on the representations of the swirl velocity profiles in four radial planes corresponding to the wake ages Ψ= 7.1, 10, 20 and 30. These velocity profiles are determined by the variation of the vertical velocity for different radial lines characterized by their vertical z- coordinate. As described in Chapter 6, the estimation of the viscous vortex core radius is given by the peak-to peak swirl velocity distance. Meanwhile, the linear part of the velocity profile (corroborated with the indicative values given by the Richardson criterion) is used to identify the solid-body rotation region. This core region is characterized mainly by a laminar behavior. In Table , the viscous core and the solid-body rotation core parameters are listed and compared with the similar parameters 163
184 estimated for the baseline (no blowing) and steady blowing cases. For a comparison of the swirl velocity profiles for baseline and steady blowing case with the profiles obtained for the modulated blowing case are graphically displayed in Figures The results listed in Table for 30 wake age indicate that the linear slope of the swirl velocity and, consequently, of the local vorticity, decreases by almost 40%. Since the distance of the linear variation of velocity (characterizing the solid-body rotation core) is almost constant, the viscous core increases almost three times. The location of the vortex center is moved outboard by about 3% of the chord in comparison with the baseline case. Unlike the baseline case, where the results indicate an increasing trend of the ratio between the laminar core and the viscous core, which suggests the occurrence of a relaminarization phenomenon, the data obtained for the modulated blowing indicates a decreasing trend of this ratio. As an example, at 30 wake age, the ratio between the solid-body rotation radius and the peak-to-peak velocity distance for the baseline case is about 80%, while for the unsteady blowing case it is about 30%. This trend of reduced laminar core ratio, as well as higher vorticity diffusion for the modulated blowing case, may indicate that the turbulent mixing inside the vortex core is more intense than for the no blowing case. The significant role played by turbulence when the tip vortex structure is modified by spanwise blowing was stated and experimentally investigated in the recent work of Han and Leishman (2004). However, numerically, due to the uncertainties of the turbulence model, as well as the inherent numerical viscosity, a quantitative conclusion regarding the turbulence influence in the vortex growth rate cannot be realistically stated in this study. 164

185 0 /4 Period 1 /4 Period 2 /4 Period 3 /4 Period Figure 8.3 Cross-flow velocity patterns during the vortex formation for modulated blowing for 30% and 40% chord sections 165
186 0 /4 Period 1 /4 Period 2 /4 Period 3 /4 Period Figure 8.4 Cross-flow velocity patterns during the vortex formation for modulated blowing for 50% and 60% chord sections 166
187 0 /4 Period 1 /4 Period 2 /4 Period 3 /4 Period Figure 8.5 Cross-flow velocity patterns during the vortex formation for modulated blowing for 70% and 80% chord sections 167

188 0 /4 Period 1 /4 Period 2 /4 Period 3 /4 Period Figure 8.6 Cross-flow velocity patterns during the vortex formation for modulated blowing for 90% chord and trailing edge sections 168

189 Figure 8.7 Cross-flow streamlines represented for 50%, 70% and 90% chord sections for 0/4 period blowing phase Figure 8.8 Cross-flow streamlines represented for 50%, 70% and 90% chord sections for 1/4 period blowing phase 169

190 Figure 8.9 Cross-flow streamlines represented for 50%, 70% and 90% chord sections for 2/4 period blowing phase Figure 8.10 Cross-flow streamlines represented for 50%, 70% and 90% chord sections for 3/4 period blowing phase 170

191 0 /4 Period 1 /4 Period 2 /4 Period 3 /4 Period Figure 8.11 Two-dimensional flow patterns for cross flow vorticity lines represented for 7.1 o and 10 o wake age planes 171


192 0 /4 Period 1 /4 Period 2 /4 Period 3 /4 Period Figure 8.12 Two-dimensional flow patterns for cross flow vorticity lines represented for 20 o and 30 o wake age planes 172

193 0 /4 Period 1 /4 Period 2 /4 Period 3 /4 Period Figure 8.13 Flow pattern in the radial planes corresponding to the vortex ages of 7.1 o and 10 o 173
GEOMETRY TIP CAP EFFECTS ON FORMATION AND NEAR WAKE EVOLUTION OF THE ROTOR TIP VORTICES
 36th AIAA Fluid Dynamics Conference and Exhibit 5-8 June 2006, San Francisco, California AIAA 2006-3376 GEOMETRY TIP CAP EFFECTS ON FORMATION AND NEAR WAKE EVOLUTION OF THE ROTOR TIP VORTICES Roxana Vasilescu
Aerodynamic Analysis of Blended Winglet for Low Speed Aircraft
 , July 1-3, 2015, London, U.K. Aerodynamic Analysis of Blended Winglet for Low Speed Aircraft Pooja Pragati, Sudarsan Baskar Abstract This paper provides a practical design of a new concept of massive
Wind tunnel effects on wingtip vortices
 48th AIAA Aerospace Sciences Meeting Including the New Horizons Forum and Aerospace Exposition 4-7 January 2010, Orlando, Florida AIAA 2010-325 Wind tunnel effects on wingtip vortices Xin Huang 1, Hirofumi
Helicopters / Vortex theory. Filipe Szolnoky Cunha
 Vortex Theory Slide 1 Vortex Theory Slide 2 Vortex Theory µ=0.2 Slide 3 Vortex Theory µ=0.4 Slide 4 Vortex Theory Slide 5 Tip Vortex Trajectories Top view Slide 6 Definition Wake Age Slide 7 Assumptions:
AE Dept., KFUPM. Dr. Abdullah M. Al-Garni. Fuel Economy. Emissions Maximum Speed Acceleration Directional Stability Stability.
 Aerodynamics: Introduction Aerodynamics deals with the motion of objects in air. These objects can be airplanes, missiles or road vehicles. The Table below summarizes the aspects of vehicle performance
Effect of Co-Flow Jet over an Airfoil: Numerical Approach
 Contemporary Engineering Sciences, Vol. 7, 2014, no. 17, 845-851 HIKARI Ltd, www.m-hikari.com http://dx.doi.org/10.12988/ces.2014.4655 Effect of Co-Flow Jet over an Airfoil: Numerical Approach Md. Riajun
Quantification of the Effects of Turbulence in Wind on the Flutter Stability of Suspension Bridges
 Quantification of the Effects of Turbulence in Wind on the Flutter Stability of Suspension Bridges T. Abbas 1 and G. Morgenthal 2 1 PhD candidate, Graduate College 1462, Department of Civil Engineering,
Citation Journal of Thermal Science, 18(4),
,") NAOSITE: Nagasaki University's Ac Title Author(s) Noise characteristics of centrifuga diffuser (Noise reduction by means leading tip) Murakami, Tengen; Ishida, Masahiro; Citation Journal of Thermal Science,
NAOSITE: Nagasaki University's Ac Title Author(s) Noise characteristics of centrifuga diffuser (Noise reduction by means leading tip) Murakami, Tengen; Ishida, Masahiro; Citation Journal of Thermal Science,
THE BRIDGE COLLAPSED IN NOVEMBER 1940 AFTER 4 MONTHS OF ITS OPENING TO TRAFFIC!
 OUTLINE TACOMA NARROWS BRIDGE FLOW REGIME PAST A CYLINDER VORTEX SHEDDING MODES OF VORTEX SHEDDING PARALLEL & OBLIQUE FLOW PAST A SPHERE AND A CUBE SUMMARY TACOMA NARROWS BRIDGE, USA THE BRIDGE COLLAPSED
Inlet Swirl on Turbocharger Compressor Performance
 Inlet Swirl on Turbocharger Compressor Performance Lei Huang, Ying Liu, Hua Chen* National laboratory of Engine Turbocharging Technology, Tianjin, China *corresponding author: Tel.:+86-22-5870-7069; fax:
WESEP 594 Research Seminar
 WESEP 594 Research Seminar Aaron J Rosenberg Department of Aerospace Engineering Iowa State University Major: WESEP Co-major: Aerospace Engineering Motivation Increase Wind Energy Capture Betz limit: 59.3%
Investigation on 3-D Wing of commercial Aeroplane with Aerofoil NACA 2415 Using CFD Fluent
 Investigation on 3-D of commercial Aeroplane with Aerofoil NACA 2415 Using CFD Fluent Rohit Jain 1, Mr. Sandeep Jain 2, Mr. Lokesh Bajpai 3 1PG Student, 2 Associate Professor, 3 Professor & Head 1 2 3
An Impeller Blade Analysis of Centrifugal Gas Compressor Using CFD
 An Impeller Blade Analysis of Centrifugal Gas Compressor Using CFD Vivek V. Kulkarni Department of Mechanical Engineering KLS Gogte Institute of Technology, Belagavi, Karnataka Dr. Anil T.R. Department
NAWEA 2015 SYMPOSIUM
 Aerodynamics and Aeroacoustics of Spanwise Wavy Trailing Edge Flatback Airfoils: Design Improvement Seung Joon Yang James D. Baeder Alfred Gessow Rotorcraft Center Department of Aerospace Engineering,
The effect of back spin on a table tennis ball moving in a viscous fluid.
 How can planes fly? The phenomenon of lift can be produced in an ideal (non-viscous) fluid by the addition of a free vortex (circulation) around a cylinder in a rectilinear flow stream. This is known as
COMPUTATIONAL FLOW MODEL OF WESTFALL'S LEADING TAB FLOW CONDITIONER AGM-09-R-08 Rev. B. By Kimbal A. Hall, PE
 COMPUTATIONAL FLOW MODEL OF WESTFALL'S LEADING TAB FLOW CONDITIONER AGM-09-R-08 Rev. B By Kimbal A. Hall, PE Submitted to: WESTFALL MANUFACTURING COMPANY September 2009 ALDEN RESEARCH LABORATORY, INC.
Numerical Analysis of Wings for UAV based on High-Lift Airfoils
 Numerical Analysis of Wings for UAV based on High-Lift Airfoils Sachin Srivastava Department of Aeronautical Engineering Malla Reddy College of Engineering & Technology, Hyderabad, Telangana, India Swetha
THEORETICAL EVALUATION OF FLOW THROUGH CENTRIFUGAL COMPRESSOR STAGE
 THEORETICAL EVALUATION OF FLOW THROUGH CENTRIFUGAL COMPRESSOR STAGE S.Ramamurthy 1, R.Rajendran 1, R. S. Dileep Kumar 2 1 Scientist, Propulsion Division, National Aerospace Laboratories, Bangalore-560017,ramamurthy_srm@yahoo.com
CIRCULATION CONTROLLED AIRFOIL ANALYSIS THROUGH 360 DEGREES ANGLE OF ATTACK
 Proceedings of the ASME 2009 3rd International Conference of Proceedings Energy Sustainability of ES2009 Energy Sustainability ES2009 July July 19-23, 2009, 2009, San San Francisco, California, USA ES2009-90341
EFFECT OF GURNEY FLAPS AND WINGLETS ON THE PERFORMANCE OF THE HAWT
 Chapter-6 EFFECT OF GURNEY FLAPS AND WINGLETS ON THE PERFORMANCE OF THE HAWT 6.1 Introduction The gurney flap (wicker bill) was a small flat tab projecting from the trailing edge of a wing. Typically it
ANALYSIS OF AERODYNAMIC CHARACTERISTICS OF A SUPERCRITICAL AIRFOIL FOR LOW SPEED AIRCRAFT
 ANALYSIS OF AERODYNAMIC CHARACTERISTICS OF A SUPERCRITICAL AIRFOIL FOR LOW SPEED AIRCRAFT P.Sethunathan 1, M.Niventhran 2, V.Siva 2, R.Sadhan Kumar 2 1 Asst.Professor, Department of Aeronautical Engineering,
High fidelity gust simulations around a transonic airfoil
 High fidelity gust simulations around a transonic airfoil AEROGUST Workshop 27 th - 28 th April 2017, University of Liverpool Presented by B. Tartinville (Numeca) Outline of the presentation 1Objectives
Computational Investigation of Airfoils with Miniature Trailing Edge Control Surfaces
 AIAA-24-5 Computational Investigation of Airfoils with Miniature Trailing Edge Control Surfaces Hak-Tae Lee, Ilan M. Kroo Stanford University, Stanford, CA 9435 Abstract Miniature trailing edge effectors
NUMERICAL INVESTIGATION OF THE FLOW BEHAVIOUR IN A MODERN TRAFFIC TUNNEL IN CASE OF FIRE INCIDENT
 - 277 - NUMERICAL INVESTIGATION OF THE FLOW BEHAVIOUR IN A MODERN TRAFFIC TUNNEL IN CASE OF FIRE INCIDENT Iseler J., Heiser W. EAS GmbH, Karlsruhe, Germany ABSTRACT A numerical study of the flow behaviour
Lift for a Finite Wing. all real wings are finite in span (airfoils are considered as infinite in the span)
") Lift for a Finite Wing all real wings are finite in span (airfoils are considered as infinite in the span) The lift coefficient differs from that of an airfoil because there are strong vortices produced
Lift for a Finite Wing all real wings are finite in span (airfoils are considered as infinite in the span) The lift coefficient differs from that of an airfoil because there are strong vortices produced
AIRFLOW GENERATION IN A TUNNEL USING A SACCARDO VENTILATION SYSTEM AGAINST THE BUOYANCY EFFECT PRODUCED BY A FIRE
 - 247 - AIRFLOW GENERATION IN A TUNNEL USING A SACCARDO VENTILATION SYSTEM AGAINST THE BUOYANCY EFFECT PRODUCED BY A FIRE J D Castro a, C W Pope a and R D Matthews b a Mott MacDonald Ltd, St Anne House,
PRESSURE DISTRIBUTION OF SMALL WIND TURBINE BLADE WITH WINGLETS ON ROTATING CONDITION USING WIND TUNNEL
 International Journal of Mechanical and Production Engineering Research and Development (IJMPERD ) ISSN 2249-6890 Vol.2, Issue 2 June 2012 1-10 TJPRC Pvt. Ltd., PRESSURE DISTRIBUTION OF SMALL WIND TURBINE
Influence of rounding corners on unsteady flow and heat transfer around a square cylinder
 Influence of rounding corners on unsteady flow and heat transfer around a square cylinder S. K. Singh Deptt. of Mech. Engg., M. B. M. Engg. College / J. N. V. University, Jodhpur, Rajasthan, India Abstract
Reduction of Skin Friction Drag in Wings by Employing Riblets
 Reduction of Skin Friction Drag in Wings by Employing Riblets Kousik Kumaar. R 1 Assistant Professor Department of Aeronautical Engineering Nehru Institute of Engineering and Technology Coimbatore, India
Návrh vratného kanálu u dvoustupňového kompresoru Return channel design of the two stage compressor
 Návrh vratného kanálu u dvoustupňového kompresoru Return channel design of the two stage compressor J. Hrabovský, J. Vacula, M. Komárek L. K. Engineering, s.r.o C. Drápela, M. Vacek, J. Klíma PBS Turbo
Numerical and Experimental Investigation of the Possibility of Forming the Wake Flow of Large Ships by Using the Vortex Generators
 Second International Symposium on Marine Propulsors smp 11, Hamburg, Germany, June 2011 Numerical and Experimental Investigation of the Possibility of Forming the Wake Flow of Large Ships by Using the
Characterization of the Near Wake of a Helicopter Rotor *
 Characterization of the Near Wake of a Helicopter Rotor * Raghav Mahalingam and Narayanan Komerath School of Aerospace Engineering Georgia Institute of Technology, Atlanta, GA-30332 AIAA-982909 Abstract
Aerodynamic Performance Optimization Of Wind Turbine Blade By Using High Lifting Device
 Aerodynamic Performance Optimization Of Wind Turbine Blade By Using High Lifting Device Razeen Ridhwan, Mohamed Alshaleeh, Arunvinthan S Abstract: In the Aerodynamic performance of wind turbine blade by
Low Speed Wind Tunnel Wing Performance
 Low Speed Wind Tunnel Wing Performance ARO 101L Introduction to Aeronautics Section 01 Group 13 20 November 2015 Aerospace Engineering Department California Polytechnic University, Pomona Team Leader:
COMPUTER-AIDED DESIGN AND PERFORMANCE ANALYSIS OF HAWT BLADES
 5 th International Advanced Technologies Symposium (IATS 09), May 13-15, 2009, Karabuk, Turkey COMPUTER-AIDED DESIGN AND PERFORMANCE ANALYSIS OF HAWT BLADES Emrah KULUNK a, * and Nadir YILMAZ b a, * New
University of Bristol - Explore Bristol Research. Publisher's PDF, also known as Version of record
 Liu, X., Azarpeyvand, M., & Joseph, P. (2015). On the acoustic and aerodynamic performance of serrated airfoils. Paper presented at The 22nd International Congress on Sound and Vibration, Florence, France.
Forest Winds in Complex Terrain
 Forest Winds in Complex Terrain Ilda Albuquerque 1 Contents Project Description Motivation Forest Complex Terrain Forested Complex Terrain 2 Project Description WAUDIT (Wind Resource Assessment Audit and
 et al. [25], Noack et al. [26] for circular cylinder flows, Van Oudheusden [27] for square cylinder and Durgesh [28] for a flat plate model. The first two modes appear as phase-shifted versions of each
Pressure distribution of rotating small wind turbine blades with winglet using wind tunnel
 Journal of Scientific SARAVANAN & Industrial et al: Research PRESSURE DISTRIBUTION OF SMALL WIND TURBINE BLADES WITH WINGLET Vol. 71, June 01, pp. 45-49 45 Pressure distribution of rotating small wind
Aerodynamic investigation of Winglets on Wind Turbine Blades using CFD
 Risø-R-1543(EN) Aerodynamic investigation of Winglets on Wind Turbine Blades using CFD Jeppe Johansen and Niels N. Sørensen Risø National Laboratory Roskilde Denmark February 26 Author: Jeppe Johansen
FLOW CONSIDERATIONS IN INDUSTRIAL SILENCER DESIGN
 FLOW CONSIDERATIONS IN INDUSTRIAL SILENCER DESIGN George Feng, Kinetics Noise Control, Inc., 3570 Nashua Drive, Mississauga, Ontario Vadim Akishin, Kinetics Noise Control, Inc., 3570 Nashua Drive, Mississauga,
ROAD MAP... D-1: Aerodynamics of 3-D Wings D-2: Boundary Layer and Viscous Effects D-3: XFLR (Aerodynamics Analysis Tool)
") Unit D-1: Aerodynamics of 3-D Wings Page 1 of 5 AE301 Aerodynamics I UNIT D: Applied Aerodynamics ROAD MAP... D-1: Aerodynamics of 3-D Wings D-: Boundary Layer and Viscous Effects D-3: XFLR (Aerodynamics
Unit D-1: Aerodynamics of 3-D Wings Page 1 of 5 AE301 Aerodynamics I UNIT D: Applied Aerodynamics ROAD MAP... D-1: Aerodynamics of 3-D Wings D-: Boundary Layer and Viscous Effects D-3: XFLR (Aerodynamics
AERODYNAMICS I LECTURE 7 SELECTED TOPICS IN THE LOW-SPEED AERODYNAMICS
 LECTURE 7 SELECTED TOPICS IN THE LOW-SPEED AERODYNAMICS The sources of a graphical material used in this lecture are: [UA] D. McLean, Understanding Aerodynamics. Arguing from the Real Physics. Wiley, 2013.
NUMERICAL INVESTIGATION OF AERODYNAMIC CHARACTERISTICS OF NACA AIRFOIL WITH A GURNEY FLAP
 Int. J. Mech. Eng. & Rob. Res. 2012 MasoudJahanmorad Nouri et al., 2012 Research Paper ISSN 2278 0149 www.ijmerr.com Vol. 1, No. 3, October 2012 2012 IJMERR. All Rights Reserved NUMERICAL INVESTIGATION
SIMULATION OF TIP LEAKAGE FLOW AROUND PARTIAL SQUEALER RIMS IN AXIAL TURBINES
 SIMULATION OF TIP LEAKAGE FLOW AROUND PARTIAL SQUEALER RIMS IN AXIAL TURBINES Levent Kavurmacioglu 1, Debashis Dey 2 & Cengiz Camci 3 Department of Aerospace Engineering Turbomachinery Heat Transfer Laboratory
Anna University Regional office Tirunelveli
 Effect of Tubercle Leading Edge Control Surface on the Performance of the Double Delta Wing Fighter Aircraft P Sharmila 1, S Rajakumar 2 1 P.G. Scholar, 2 Assistant Professor, Mechanical Department Anna
EXPERIMENTAL ANALYSIS OF FLOW OVER SYMMETRICAL AEROFOIL Mayank Pawar 1, Zankhan Sonara 2 1,2
 EXPERIMENTAL ANALYSIS OF FLOW OVER SYMMETRICAL AEROFOIL Mayank Pawar 1, Zankhan Sonara 2 1,2 Assistant Professor,Chandubhai S. Patel Institute of Technology, CHARUSAT, Changa, Gujarat, India Abstract The
Unsteady airfoil experiments
 Unsteady airfoil experiments M.F. Platzer & K.D. Jones AeroHydro Research & Technology Associates, Pebble Beach, CA, USA. Abstract This paper describes experiments that elucidate the dynamic stall phenomenon
Aerodynamic Analyses of Horizontal Axis Wind Turbine By Different Blade Airfoil Using Computer Program
 ISSN : 2250-3021 Aerodynamic Analyses of Horizontal Axis Wind Turbine By Different Blade Airfoil Using Computer Program ARVIND SINGH RATHORE 1, SIRAJ AHMED 2 1 (Department of Mechanical Engineering Maulana
AN EXPERIMENTAL STUDY OF THE EFFECTS OF SWEPT ANGLE ON THE BOUNDARY LAYER OF THE 2D WING
 AN EXPERIMENTAL STUDY OF THE EFFECTS OF SWEPT ANGLE ON THE BOUNDARY LAYER OF THE 2D WING A. Davari *, M.R. Soltani, A.Tabrizian, M.Masdari * Assistant Professor, Department of mechanics and Aerospace Engineering,
AN EXPERIMENTAL AND COMPUTATIONAL STUDY OF THE AERODYNAMIC CHARACTERISTICS AN OSCILLATORY PITCHING NACA0012 AEROFOIL
 AN EXPERIMENTAL AND COMPUTATIONAL STUDY OF THE AERODYNAMIC CHARACTERISTICS AN OSCILLATORY PITCHING NACA0012 AEROFOIL Ashim Yadav, Simon Prince & Jenny Holt School of Aerospace, Transport and Manufacturing,
Applied Fluid Mechanics
 Applied Fluid Mechanics 1. The Nature of Fluid and the Study of Fluid Mechanics 2. Viscosity of Fluid 3. Pressure Measurement 4. Forces Due to Static Fluid 5. Buoyancy and Stability 6. Flow of Fluid and
Keywords: dynamic stall, free stream turbulence, pitching airfoil
 Applied Mechanics and Materials Vol. 225 (2012) pp 103-108 Online available since 2012/Nov/29 at www.scientific.net (2012) Trans Tech Publications, Switzerland doi:10.4028/www.scientific.net/amm.225.103
EXPERIMENTAL ANALYSIS OF THE CONFLUENT BOUNDARY LAYER BETWEEN A FLAP AND A MAIN ELEMENT WITH SAW-TOOTHED TRAILING EDGE
 24 TH INTERNATIONAL CONGRESS OF THE AERONAUTICAL SCIENCES EXPERIMENTAL ANALYSIS OF THE CONFLUENT BOUNDARY LAYER BETWEEN A FLAP AND A MAIN ELEMENT WITH SAW-TOOTHED TRAILING EDGE Lemes, Rodrigo Cristian,
EXPERIMENTAL AND NUMERICAL STUDY OF A TWO- ELEMENT WING WITH GURNEY FLAP
 25 TH INTERNATIONAL CONGRESS OF THE AERONAUTICAL SCIENCES EXPERIMENTAL AND NUMERICAL STUDY OF A TWO- ELEMENT WING WITH GURNEY FLAP F.M. Catalano PhD.( catalano@sc.usp.br ) *, G. L. Brand * * Aerodynamic
JOURNAL PUBLICATIONS
 1 JOURNAL PUBLICATIONS 71. Lee, T., Mageed, A., Siddiqui, B. and Ko, L.S., (2016) Impact of ground proximity on aerodynamic properties of an unsteady NACA 0012 airfoil, submitted to Journal of Aerospace
AERODYNAMIC CHARACTERISTICS OF NACA 0012 AIRFOIL SECTION AT DIFFERENT ANGLES OF ATTACK
 AERODYNAMIC CHARACTERISTICS OF NACA 0012 AIRFOIL SECTION AT DIFFERENT ANGLES OF ATTACK SUPREETH NARASIMHAMURTHY GRADUATE STUDENT 1327291 Table of Contents 1) Introduction...1 2) Methodology.3 3) Results...5
STUDIES ON THE OPTIMUM PERFORMANCE OF TAPERED VORTEX FLAPS
 ICAS 2000 CONGRESS STUDIES ON THE OPTIMUM PERFORMANCE OF TAPERED VORTEX FLAPS Kenichi RINOIE Department of Aeronautics and Astronautics, University of Tokyo, Tokyo, 113-8656, JAPAN Keywords: vortex flap,
Computational fluid dynamics analysis of a mixed flow pump impeller
 MultiCraft International Journal of Engineering, Science and Technology Vol. 2, No. 6, 2010, pp. 200-206 INTERNATIONAL JOURNAL OF ENGINEERING, SCIENCE AND TECHNOLOGY www.ijest-ng.com 2010 MultiCraft Limited.
Aerodynamic Terms. Angle of attack is the angle between the relative wind and the wing chord line. [Figure 2-2] Leading edge. Upper camber.
![Aerodynamic Terms. Angle of attack is the angle between the relative wind and the wing chord line. [Figure 2-2] Leading edge. Upper camber.](/thumbs/82/86661300.jpg "Aerodynamic Terms. Angle of attack is the angle between the relative wind and the wing chord line. [Figure 2-2] Leading edge. Upper camber.") Chapters 2 and 3 of the Pilot s Handbook of Aeronautical Knowledge (FAA-H-8083-25) apply to powered parachutes and are a prerequisite to reading this book. This chapter will focus on the aerodynamic fundamentals
Chapters 2 and 3 of the Pilot s Handbook of Aeronautical Knowledge (FAA-H-8083-25) apply to powered parachutes and are a prerequisite to reading this book. This chapter will focus on the aerodynamic fundamentals
CFD AND EXPERIMENTAL STUDY OF AERODYNAMIC DEGRADATION OF ICED AIRFOILS
 Colloquium FLUID DYNAMICS 2008 Institute of Thermomechanics AS CR, v.v.i., Prague, October 22-24, 2008 p.1 CFD AND EXPERIMENTAL STUDY OF AERODYNAMIC DEGRADATION OF ICED AIRFOILS Vladimír Horák 1, Dalibor
Volume 2, Issue 5, May- 2015, Impact Factor: Structural Analysis of Formula One Racing Car
 Structural Analysis of Formula One Racing Car Triya Nanalal Vadgama 1, Mr. Arpit Patel 2, Dr. Dipali Thakkar 3, Mr. Jignesh Vala 4 Department of Aeronautical Engineering, Sardar Vallabhbhai Patel Institute
NUMERICAL SIMULATION OF ACTIVE FLOW CONTROL BASED ON STREAMWISE VORTICES FOR A BLUNT TRAILING EDGE AIRFOIL
 BBAA VI International Colloquium on: Bluff Bodies Aerodynamics & Applications Milano, Italy, July, 20-24 2008 NUMERICAL SIMULATION OF ACTIVE FLOW CONTROL BASED ON STREAMWISE VORTICES FOR A BLUNT TRAILING
Experimental Investigation of the Aerodynamics of a Modeled Dragonfly Wing Section
 Region I-MA Student Conference AIAA - 2005 April 8-9, 2005 / Charlottesville, Virginia Experimental Investigation of the Aerodynamics of a Modeled Dragonfly Wing Section Michelle Kwok * and Rajat Mittal
Air Craft Winglet Design and Performance: Cant Angle Effect
 Journal of Robotics and Mechanical Engineering Research Air Craft Winglet Design and Performance: Cant Angle Effect Eslam Said Abdelghany 1, Essam E Khalil 2*, Osama E Abdellatif 3 and Gamal elhariry 4
Experimental Investigation Of Flow Past A Rough Surfaced Cylinder
 (AET- 29th March 214) RESEARCH ARTICLE OPEN ACCESS Experimental Investigation Of Flow Past A Rough Surfaced Cylinder Monalisa Mallick 1, A. Kumar 2 1 (Department of Civil Engineering, National Institute
Influence of wing span on the aerodynamics of wings in ground effect
 Influence of wing span on the aerodynamics of wings in ground effect Sammy Diasinos 1, Tracie J Barber 2 and Graham Doig 2 Abstract A computational fluid dynamics study of the influence of wing span has
Tim Lee s journal publications
 Tim Lee s journal publications 82. Lee, T., and Tremblay-Dionne, V., (2018) Impact of wavelength and amplitude of a wavy ground on a static NACA 0012 airfoil submitted to Journal of Aircraft (paper in
SUBPART C - STRUCTURE
 SUBPART C - STRUCTURE GENERAL CS 23.301 Loads (a) Strength requirements are specified in terms of limit loads (the maximum loads to be expected in service) and ultimate loads (limit loads multiplied by
DOUBLE-DUCTED FAN CROSS-RELATED APPLICATIONS
 DOUBLE-DUCTED FAN CROSS-RELATED APPLICATIONS [0001] This application claims the benefit of U.S. Provisional Application No. 61/311,672 filed on March 8, 2010, which is incorporated herein by reference
Measurement and simulation of the flow field around a triangular lattice meteorological mast
 Measurement and simulation of the flow field around a triangular lattice meteorological mast Matthew Stickland 1, Thomas Scanlon 1, Sylvie Fabre 1, Andrew Oldroyd 2 and Detlef Kindler 3 1. Department of
Welcome to Aerospace Engineering
 Welcome to Aerospace Engineering DESIGN-CENTERED INTRODUCTION TO AEROSPACE ENGINEERING Notes 4 Topics 1. Course Organization 2. Today's Dreams in Various Speed Ranges 3. Designing a Flight Vehicle: Route
Results and Discussion for Steady Measurements
 Chapter 5 Results and Discussion for Steady Measurements 5.1 Steady Skin-Friction Measurements 5.1.1 Data Acquisition and Reduction A Labview software program was developed for the acquisition of the steady
Numerical Investigation of Multi Airfoil Effect on Performance Increase of Wind Turbine
 International Journal of Engineering & Applied Sciences (IJEAS) International Journal of Engineering Applied Sciences (IJEAS) Vol.9, Issue 3 (2017) 75-86 Vol.x, Issue x(201x)x-xx http://dx.doi.org/10.24107/ijeas.332075
INTERACTION BETWEEN WIND-DRIVEN AND BUOYANCY-DRIVEN NATURAL VENTILATION Bo Wang, Foster and Partners, London, UK
 INTERACTION BETWEEN WIND-DRIVEN AND BUOYANCY-DRIVEN NATURAL VENTILATION Bo Wang, Foster and Partners, London, UK ABSTRACT Ventilation stacks are becoming increasingly common in the design of naturally
A COMPARATIVE STUDY OF MIX FLOW PUMP IMPELLER CFD ANALYSIS AND EXPERIMENTAL DATA OF SUBMERSIBLE PUMP
 IMPACT: International Journal of Research in Engineering & Technology (IMPACT: IJRET) ISSN 2321-8843 Vol. 1, Issue 3, Aug 2013, 57-64 Impact Journals A COMPARATIVE STUDY OF MIX FLOW PUMP IMPELLER CFD ANALYSIS
Unsteady Aerodynamics of Tandem Airfoils Pitching in Phase
 Unsteady Aerodynamics of Tandem Airfoils Pitching in Phase Ravindra A Shirsath and Rinku Mukherjee Abstract This paper presents the results of a numerical simulation of unsteady, incompressible and viscous
Study of Secondary Flow Modifications at Impeller Exit of a Centrifugal Compressor
 Open Journal of Fluid Dynamics, 2012, 2, 248-256 http://dx.doi.org/10.4236/ojfd.2012.24a029 Published Online December 2012 (http://www.scirp.org/journal/ojfd) ABSTRACT Study of Secondary Flow Modifications
CFD DESIGN STUDY OF A CIRCULATION CONTROL INLET GUIDE VANE OF AN AEROFOIL
 Int. J. Mech. Eng. & Rob. Res. 2012 Manjunath Ichchangi and Manjunath H, 2012 Research Paper ISSN 2278 0149 www.ijmerr.com Vol. 1, No. 3, October 2012 2012 IJMERR. All Rights Reserved CFD DESIGN STUDY
Computational Analysis of the S Airfoil Aerodynamic Performance
 Computational Analysis of the 245-3S Airfoil Aerodynamic Performance Luis Velazquez-Araque and Jiří Nožička 2 Department of Mechanical Engineering National University of Táchira, San Cristóbal 5, Venezuela
CFD SIMULATION STUDY OF AIR FLOW AROUND THE AIRFOIL USING THE MAGNUS EFFECT
 Magnus effect, simulation, air flow Patryk SOKOŁOWSKI *, Jacek CZARNIGOWSKI **, Paweł MAGRYTA *** CFD SIMULATION STUDY OF AIR FLOW AROUND THE AIRFOIL USING THE MAGNUS EFFECT Abstract The article presents
Computational Analysis of Cavity Effect over Aircraft Wing
 World Engineering & Applied Sciences Journal 8 (): 104-110, 017 ISSN 079-04 IDOSI Publications, 017 DOI: 10.589/idosi.weasj.017.104.110 Computational Analysis of Cavity Effect over Aircraft Wing 1 P. Booma
CFD Analysis ofwind Turbine Airfoil at Various Angles of Attack
 IOSR Journal of Mechanical and Civil Engineering (IOSR-JMCE) e-issn: 2278-1684,p-ISSN: 2320-334X, Volume 13, Issue 4 Ver. II (Jul. - Aug. 2016), PP 18-24 www.iosrjournals.org CFD Analysis ofwind Turbine
ZIN Technologies PHi Engineering Support. PHi-RPT CFD Analysis of Large Bubble Mixing. June 26, 2006
 ZIN Technologies PHi Engineering Support PHi-RPT-0002 CFD Analysis of Large Bubble Mixing Proprietary ZIN Technologies, Inc. For nearly five decades, ZIN Technologies has provided integrated products and
The Usage of Propeller Tunnels For Higher Efficiency and Lower Vibration. M. Burak Şamşul
 The Usage of Propeller Tunnels For Higher Efficiency and Lower Vibration M. Burak Şamşul ITU AYOC 2014 - Milper Pervane Teknolojileri Company Profile MILPER is established in 2011 as a Research and Development
Experimental and Theoretical Investigation for the Improvement of the Aerodynamic Characteristic of NACA 0012 airfoil
 International Journal of Mining, Metallurgy & Mechanical Engineering (IJMMME) Volume 2, Issue 1 (214) ISSN 232 46 (Online) Experimental and Theoretical Investigation for the Improvement of the Aerodynamic
AE2610 Introduction to Experimental Methods in Aerospace AERODYNAMIC FORCES ON A WING IN A SUBSONIC WIND TUNNEL
 AE2610 Introduction to Experimental Methods in Aerospace AERODYNAMIC FORCES ON A WING IN A SUBSONIC WIND TUNNEL Objectives The primary objective of this experiment is to familiarize the student with measurement
A COMPUTATIONAL STUDY ON THE DESIGN OF AIRFOILS FOR A FIXED WING MAV AND THE AERODYNAMIC CHARACTERISTIC OF THE VEHICLE
 28 TH INTERNATIONAL CONGRESS OF THE AERONAUTICAL SCIENCES A COMPUTATIONAL STUDY ON THE DESIGN OF AIRFOILS FOR A FIXED WING MAV AND THE AERODYNAMIC CHARACTERISTIC OF THE VEHICLE Jung-Hyun Kim*, Kyu-Hong
AIRFOIL PROFILE OPTIMIZATION OF AN AIR SUCTION EQUIPMENT WITH AN AIR DUCT
 THERMAL SCIENCE, Year 2015, Vol. 19, No. 4, pp. 1217-1222 1217 AIRFOIL PROFILE OPTIMIZATION OF AN AIR SUCTION EQUIPMENT WITH AN AIR DUCT by Li QIU a,b, Rui WANG a,*, Xiao-Dong CHEN b, and De-Peng WANG
Computational Analysis of Blunt Trailing Edge NACA 0012 Airfoil
 Computational Analysis of Blunt Trailing Edge NACA 2 Airfoil Anusha K Department of Aerospace Engineering Madras Institute of Technology, India anusugan7@gmail.com Abstract Blunt trailing edge airfoil
2-D Computational Analysis of a Vertical Axis Wind Turbine Airfoil
 2-D Computational Analysis of a Vertical Axis Wind Turbine Airfoil Akshay Basavaraj1 Student, Department of Aerospace Engineering, Amrita School of Engineering, Coimbatore 641 112, India1 Abstract: This
CFD development for wind energy aerodynamics
 CFD development for wind energy aerodynamics Hamid Rahimi, Bastian Dose, Bernhard Stoevesandt Fraunhofer IWES, Germany IEA Task 40 Kick-off Meeting 12.11.2017 Tokyo Agenda BEM vs. CFD for wind turbine
Aerodynamics of Winglet: A Computational Fluid Dynamics Study Using Fluent
 Aerodynamics of : A Computational Fluid Dynamics Study Using Fluent Rohit Jain 1, Mr. Sandeep Jain, Mr. Lokesh Bajpai 1PG Student, Associate Professor, Professor & Head 1 Mechanical Engineering Department
AERODYNAMIC CHARACTERISTICS OF SPIN PHENOMENON FOR DELTA WING
 ICAS 2002 CONGRESS AERODYNAMIC CHARACTERISTICS OF SPIN PHENOMENON FOR DELTA WING Yoshiaki NAKAMURA (nakamura@nuae.nagoya-u.ac.jp) Takafumi YAMADA (yamada@nuae.nagoya-u.ac.jp) Department of Aerospace Engineering,
FLOW CONTROL ON HELICOPTER-ROTOR BLADES VIA ACTIVE GURNEY FLAP Wienczyslaw Stalewski* *Institute of Aviation, Poland
 FLOW CONTROL ON HELICOPTER-ROTOR BLADES VIA ACTIVE GURNEY FLAP Wienczyslaw Stalewski* *Institute of Aviation, Poland Keywords: helicopter rotor blades, flow control, Active Gurney Flap, rotorcraft performance
ANALYSIS OF HEAT TRANSFER THROUGH EXTERNAL FINS USING CFD TOOL
 ANALYSIS OF HEAT TRANSFER THROUGH EXTERNAL FINS USING CFD TOOL B. Usha Rani 1 and M.E Thermal 2 1,2 Asst.Professor, Dadi Institute of Engineering and Technology, India Abstract-The rate of heat transfer
OPTIMIZATION OF SINGLE STAGE AXIAL FLOW COMPRESSOR FOR DIFFERENT ROTATIONAL SPEED USING CFD
 http:// OPTIMIZATION OF SINGLE STAGE AXIAL FLOW COMPRESSOR FOR DIFFERENT ROTATIONAL SPEED USING CFD Anand Kumar S malipatil 1, Anantharaja M.H 2 1,2 Department of Thermal Power Engineering, VTU-RO Gulbarga,
Application of Sweep to Low Pressure Turbine Cascade Blade for Tip Flow Containment
 Application of Sweep to Low Pressure Turbine Cascade Blade for Tip Flow Containment Rachel F. Trehan 1 and Bhaskar Roy 2 Indian Institute of Technology-Bombay, Mumbai, 400076, India A numerical investigation
Basic Fluid Mechanics
 Basic Fluid Mechanics Chapter 7B: Forces on Submerged Bodies 7/26/2018 C7B: Forces on Submerged Bodies 1 Forces on Submerged Bodies Lift and Drag are forces exerted on an immersed body by the surrounding
Wind Flow Model of Area Surrounding the Case Western Reserve University Wind Turbine
 Wind Flow Model of Area Surrounding the Case Western Reserve University Wind Turbine Matheus C. Fernandes 1, David H. Matthiesen PhD *2 1 Case Western Reserve University Dept. of Mechanical Engineering,