Unsteady Aerodynamics of Pitching and Perching Wings. Joshua Webb
|
|
|
- Juliet Goodman
- 5 years ago
- Views:
Transcription
1 Unsteady Aerodynamics of Pitching and Perching Wings By Joshua Webb Thesis Submitted to the Faculty of the Graduate School of Vanderbilt University in partial fulfillment of the requirements for the degree of Master of Science in Mechanical Engineering December, 2016 Nashville, Tennessee Approved: Haoxiang Luo, Ph.D. Robert W. Pitz, Ph.D. Amrutur Anilkumar, Ph.D.
2 ACKNOWLEDGEMENTS Writing a thesis is like learning how to ride a bike, there will be setbacks along the journey but with persistence and help from great people, one is certain to be successful. First and foremost, I would like to gratefully and sincerely thank my thesis advisor, Dr. Haoxiang Luo, who not only gave me invaluable advice and direction, but more importantly, was caring, compassionate and above all else, patient throughout my educational journey. I would also like to acknowledge my defense committee members, Professors Dr. Robert Pitz, and Dr. Armrutur Anilkumar for their time, effort and expert advice that I am gratefully indebted to. I would like to thank my friends and lab mates, particularly, Cole Brubaker, Siyuan Chang, Ye Chen, Jialei Song, Darrin Tinker, Dexter Watkins, and Scott Williams for being like a second family to me. Each person provided their love, support and help throughout my journey. Finally, and most importantly, without the support, encouragement, patience and unwavering love of my wife Ally, I would never have succeeded. I truly appreciate and I feel blessed to have all of these wonderful people in my life. ii
3 TABLE OF CONTENTS Page ACKNOWLEDGEMENTS... ii LIST OF FIGURES...v NOMENCLATURE... vii Chapter I. Introduction... 1 I.1 Aerodynamics of bird wings and applications in UAVs... 1 I.2 A brief literature survey... 1 I.3 The specific objectives of this study... 3 II. Model description and validation... 5 II.1 Description of the wing model and simulation setup... 5 II.2 Validation study: case II.3 Results from validation case II.4 Validation study: case II.5 Results from validation case III. Unsteady aerodynamics of a pitching airfoil III.1 Force production III.2 Flow field for pitch rate at K = ½ III.3 Flow field for pitch rate at K = ¼ III.4 Flow field for pitch rate at K = 1/ III.5 Flow field for pitch rate at K = 1/ III.6 Discussion and conclusions IV. Unsteady aerodynamics of a perching airfoil IV.1 Force production IV.2 Flow field for pitch rate at K = ½ IV.3 Flow field for pitch rate at K = ¼ IV.4 Flow field for pitch rate at K = 1/ IV.5 Flow field for pitch rate at K = 1/ iii
4 IV.6 Discussions and conclusions V. Concluding remarks REFFERENCES iv
5 Figure LIST OF FIGURES 1. Visualization of perching maneuver by Carruthers et al (Carruthers et al., 2007) Illustration of the complete computational domain with boundary conditions Mesh used in the simulation, where the inner region and outer region were meshed separately Lift and drag coefficients for three pitch rates. Solid lines represent the current study, and dashed lines are the results from Polet et al (Polet et al., 2015) Vorticity field of perching motion with K =1/4 at α = 17, 73, 87, 90. Upper panel: results from Polet et al (2015); lower panel: present study Vorticity field of perching motion with K =1/2 at α = 17, 73, 87, 90. Upper panel: results from Polet et al (2015); lower panel: present study Comparison of lift and drag coefficients of a pitching wing at k=0.2 and k= Flow field of pitching motion for k=0.2 at α = 15, 53, 90. The results in the middle and right columns are from Wang and Eldredge (2012) Flow field of pitching motion for k=0.7 at α = 33 and 90. Top: present study; bottom: results from Wang and Eldredge (2012) Force production comparison for k=0.2 and 0.7 for perching cases Flow field of perching motion for k=0.2 at α = 15, 53 and 90. Left: present study; right: results from Wang and Eldredge (2012) Flow field of perching motion for k=0.7 at α = 33 and 90. Top: present study; bottom: results from Wang and Eldredge (2012) Lift (top) and drag (bottom) coeffcients as a function of angle of attack,α, for K = 1/2, 1/4, 1/8 and 1/ Specified angular velocity as a function of angle of attack for K = 1/2, 1/4, 1/8 and 1/ Lift over drag ratio as a function of α Pressure contour plot with velocity vectors for K= 1/2 at α= 25 (top left), 36 (top right), 54 (bottom left), and 77 (bottom right) deg Vorticity contour plot with velocity vectors for K= 1/2 at α= 25 (top left), 36(top right), 54 (bottom left), and 77 (bottom right) deg Pressure contour plot superimposed with velocity vectors for K= 1/4 at α= 25 (top left), 41 (top right), 50 (bottom left), and 77 (bottom right) deg Vorticity contour plot superimposed with velocity vectors for K= 1/4 at α= 25 (top left), 41 (top right), 50 (bottom left), and 77 (bottom right) deg Page v
6 20. Pressure contour plot with velocity vector for K= 1/8 at α= 25 (top left), 36 (top right), 43 (bottom left), and 70 (bottom right) deg Vorticity contour plot with velocity vectors for K= 1/8 at α= 25 (top left), 36 (top right), 43 (bottom left), and 70 (bottom right) deg Pressure contour plot with velocity vector for K= 1/64 at α= 15 (top left), 20 (top right), 42 (bottom left), and 71 (bottom right) deg Vorticity contour plot with velocity vectors for K= 1/64 at α= 15 (top left), 20 (top right), 42 (bottom left), and 71 (bottom right) deg Lift (top) and drag (bottom) coeffcients as a function of angle of attack for K = 1/2, 1/4, 1/8 and 1/ Prescribed angular velocity as a function of angle of attack for K = 1/2, 1/4, 1/8 and 1/ Lift over drag ratio as a function of angle of attack Pressure contour plot superimposed with velocity vectors for K= 1/2 at α= 16 (top left), 28 (top right), 54 (bottom left), and 77 (bottom right) deg Vorticity surface plot with velocity vectors for K=1/2 at α= 16 (top left), 28 (top right), 54(bottom left), and 77 (bottom right) deg Pressure surface plot with velocity vectors for K=1/4 at α= 18 (top left), 30 (top right), 50 (bottom left), and 77 (bottom right) deg Vorticity surface plot with velocity vectors for K=1/4 at α= 18 (top left), 30 (top right), 50 (bottom left), and 77 (bottom right) deg Pressure surface plot with velocity vectors for K=1/8 at α= 25 (top left), 34 (top right), 43(bottom left), and 70 (bottom right) deg Vorticity surface plot with velocity vectors for K=1/8 at α= 25 (top left), 34 (top right), 43(bottom left), and 70 (bottom right) deg Pressure surface plot with velocity vectors for K=1/64 at α= 15 (top left), 20 (top right), 42 (bottom left), and 71 (bottom right) deg Vorticity surface plot with velocity vectors for K=1/64 at α= 15 (top left), 20 (top right), 42 (bottom left), and 71 (bottom right) deg vi
7 NOMENCLATURE U(t) U 0 t t T α(t) ω (t) Re ρ μ k SC a s t 1 t 2 a 0 α 0 c Time dependent freestream velocity Initial freestream velocity Non-dimensional time Actual time Total time period to complete pitch-up maneuver Angle of attack as a function of time Angular velocity as a function of time Reynolds number Density Viscosity Pitch rate Pitch rate Smoothing parameter Start of pitch-up maneuver End of pitch-up maneuver Maximum angle of pitch-up maneuver Nominal pitch rate Chord length vii
8 Chapter I Introduction I.1 Aerodynamics of bird wings and applications in UAVs Birds are very graceful creatures that fly effortless through the air. Mankind has always been fascinated with mimicking this skill; tracing all the way back to 1505 when Leonardo da Vinci was intrigued with human mechanical flight, to the present day s growing interest in micro air vehicles (MAVs). Defense Advanced Research Projects Agency (DARPA) defines MAVs as robotic flyers that have a wingspan under 15 cm. MAVs are a class of miniature unmanned aerial vehicles (UAVs) that have recently taken inspiration from flying insects and birds to achieve unprecedented flight capabilities when comparing against the traditional fixed wing design. This study will treat the terms UAVs and MAVs interchangeably. There are two common types of UAVs (or better known as drones) that is popular among both consumer commercial markets as well as military applications. With recent advances in microelectronics and wireless communication devices on board, UAVs and/or MAVs have numerous markets and applications which include hobbyist, aerial photography, surveying land, aerial inspections for technical installations that may be difficult, dangerous and costly to access (e.g., bridges, dams, towers, wind mills, etc.), military intelligence, surveillance and reconnaissance missions. The first common type of UAVs is a fixed wing model; these are compact, lightweight units that are capable of fast and efficient forward flights. The second style is a rotary blade based system that can hover and can fly both vertically and horizontally. A third, less common type of UAV is bio-inspired flapping-wing that mimics the natural flight of animals. As their biological counterpart, the flapping-wing UAVs can potentially vary several kinematic parameters that describe the 3D wing motion and thus the aerodynamic forces on each wing. The resultant forces and torques are high relative to the body inertia and may allow the UAVs to perform many kinds of maneuvers in a very short time, e.g., taking off, precision landing, and turning. When both steady flight and unsteady maneuvers are considered, the flapping-wing UAVs are potentially more efficient flight than either of the two aforementioned UAV types in small scale. Pesavento and Wang (2009) documented the first piece of evidence in which unsteady aerodynamics makes a flapping motion less costly than the optimal steady wing motion. More specifically, Pesavento and Wang (2009) found at the scale of insects, a 2-D flapping flight can be more aerodynamically efficient than the optimal fixed wing flight by taking advantage of the interaction of the wing with its wake near wing reversal. That is, the leading-edge vortex generated by the previous stroke had the most significant influence on the succeeding unsteady aerodynamic force. Since the fixed wings and flapping wings have their distinct advantages and are most suitable for different flight modes (i.e., cruise and unsteady maneuvers, respectively), it is conceivable that that in the future, these two propulsion approaches could be combined into one hybrid system for complex missions. I.2 A brief literature survey There are generally two research directions in the study of aerodynamics of flapping wings. The first is the direct study of animal s wings by incorporating the animal-specific wing kinematics. 1
9 Many experimental and computational studies have been conducted in this direction. Only a few representative cases are listed here for brevity. Experimentally, Dickinson et al (1999) validated that conventional theory on insect flight based solely on translation mechanisms (i.e., delayed stall) could not explain the transient forces generated by hoverfly kinematics. Dickinson et al (1999) stated that there are three distinct mechanisms for insect flight: delayed stall, rotational circulation, and wake capture. Rotational circulation and wake capture both depend on the pronation and supination of the wing during the stroke reversal and are necessary in understanding the rotational mechanisms for unsteady aerodynamics in insect flight. Spedding (2003) investigated the wake structure of a thrust nightingale over a range of natural flight speeds and found that wake structures had enough momentum to provide weight support over the wingbeat. Tobalske et al (2007) found that hummingbirds alter specific wing kinematics (e.g., chord angle, angle of attack, wing beat amplitude, etc.) during forward flight from slow to fast speeds. Hedenstrom and Johansson (2015) documented that bats use a leading-edge vortex and an inverted wing during the upstroke to aid in weight support during hovering and slow speeds. Dudley and Ellington (1990a) determined several kinematic parameters for bumblebees in forward flight (body angle, stroke plane angle, geometrical angle of attack, etc.) varied consistently with airspeed. Dudley and Ellington (1990b) showed that quasi-steady aerodynamic mechanisms were insufficient to explain the fast forward flight of bumblebees. Ortega-Jimenez et al (2013) experimentally determined the kinematic effects of moths flying into vortices. In computational study, 3D computational fluid dynamics (CFD) has allowed researchers to study the unsteady flow and force production associated with animal wings. For example, Sun and Tang (2002) modeled a fruit fly wing in a flapping motion and found when the wing rotation occurs at the end of a stroke, the mean lift coefficient can be two times greater than the quasi-steady value. Liu and Kawachi (1998) numerically modeled a hawkmoths wing during hovering flight and compared the numerical results with smoke-visualized flows around a manmade flapper. Some of these computational studies have incorporated realistic wing motion obtained through measurement of high-speed videography and have involved multi-disciplinary collaborations between fluid dynamists who seek to understand the phenomenon involved in flapping wings and biologists who seek to understand how it relates to live animal flight. For example, Song et al (2014) developed a CFD model for hovering flight of the hummingbird and studied detailed force production of downstroke and upstroke; later, the authors (Song et al, 2016) used a similar approach to study forward flight of the hummingbird and compared its aerodynamics with that of insects and large birds. The second direction of study is investigation of basic fluid dynamics involved in flapping wings. Wang (2005) provides a thorough literature review in insect flight and discusses the unsteady mechanisms for uniform and accelerated motions. For this purpose, very simple wing shape and kinematics could be adopted in the study, for example, an airfoil performing sinusoidal pitching and/or heaving motions. Sometimes even 2D models are very useful, and the effects of linear acceleration and pitching on vortex formation, flow separation, and unsteady forces are usually main foci of this type of studies. For example, Wang et al (2004) compared 2D computations with 3D experiments and found in all cases, the computed drag compared well with the experimental 2
10 drag and the computed lift agreed with the experimental lift when the sinusoidal changes in angle of attack were symmetrical. Of course, only simple wing geometry and kinematics were used for comparison. In addition to rigid wing models, there have been studies to incorporate elasticity of flapping wings that investigate the effect of fluid-structure interaction and aeroelasticity on aerodynamic performance of the wings. Yin & Luo (2010) found that both inertia-induced deformation and flow-induced deformation can both enhance lift of an elastic wing. Similarly, Dai et al (2012) demonstrated that deformation not only enhances lift but also improves the lift efficiency even with an unfavorable camber. Eldredge et al (2010) discovered that a flexible wing consistently demonstrated better performance than a rigid wing due to how the leading-edge vortex shed into the wake during the return stroke, this led to less interaction with the previously shed trailing-edge vortices. From these and several other studies, it is clear that proper structural elasticity would significantly improve aerodynamic performance of flapping wings. Other than steady flight, bio-inspired transient aerodynamic maneuver studies are a growing subject of interest as UAVs are becoming as popular as ever. In this area, again both animal studies and simplifying model studies were carried out. For example, Carruthers et al (2007) observed that a steppe eagle performing a perching maneuver gained altitude quickly during the landing phase, implying that large lift was required at high angles of attack. Specifically, the perching aerodynamic maneuver provides the ability for a UAV to land precisely on a narrow platform without the requirement to decelerate on the ground like typical fixed-wing UAVs. Even with Cory and Tedrake (2008) recent advances that demonstrated the ability for current MAVs to land on a perch, these MAVs still fall short in achieving the stability and control, speed, and overall elegance of the natural flyers that we seek to emulate. Polet et al (2015) investigated a simple pitch-up maneuver that linearly deaccelerates and further validated that a perching bird can maintain high lift and drag while slowing to a controlled stop despite the large angles of attack and decreasing flow velocity. Using particle image velocimetry (PIV) and simulations, Polet et al (2015) studied the differences in forces and vorticity fields as the pitch rate increased and found that the lift and drag forces increase super-linearly with the pitch rate (or shape change number). Reduced-order aerodynamic models that can faithfully capture the unsteady flow are a key area of research for successful engineering applications of flapping wings. Many parallel efforts are ongoing with various levels of success. For example, Wang and Eldredge (2012) created a loworder model to predict the dynamics of the leading edge vortex (LEV) during both pitching and perching maneuvers. Wang and Eldredge (2012) low-order (e.g., less than ten degrees of freedom) impulse matching approach enabled more accurate force predictions on 2-D pitching and perching maneuvers than the Brown-Michael model when compared with both experiments and highfidelity simulations. I.3 The specific objectives of this study In general, acceleration and deceleration of the wing, as well as rotation around the wing axis, are critical features of flapping wings, but the fundamental fluid dynamics is not yet well understood. Basically, there is a lack of simple models that can accurately describe force production in relation 3
11 with the wing velocity, acceleration, rotational velocity, and rotational acceleration. This thesis aims to better understand how the wing-pitching affects the force production, boundary layer detachment, and vortex formation in the flow. For this purpose, extremely simplified cases are considered, i.e., the pitching-only and perching wings, and this study numerically simulates the flow to obtain the unsteady velocity field, pressure distribution, and total lift and drag. Their dependence on the wing motion will be studied. To be more specific, in this thesis I aim to investigate the viscous, unsteady flow over a NACA 0012 airfoil that pitches to a high angle of attack (α) by using a 2D laminar flow and timedependent study. For the perching maneuver, the airfoil is also assumed to go through a deceleration process while pitching. Since flow separation and vortex generation are going to be dominant features of the flow, the effect of viscosity has to be included in the computational model to accurately predict these unsteady flow behaviors. For this investigation, a rigid wing is assumed in order to simplify the problem. To validate the simulation, I will first compare the results in this study with the results of Polet et al (2015) and Wang and Eldredge (2012). After model validation, I will then move on to study details of flow in two separate scenarios: (1) a controlled pitch-up maneuver and (2) a perching maneuver where the wing experiences simultaneous deceleration and pitching motion. 4
12 II.1 Chapter II Model description and validation Description of the wing model and simulation setup To investigate the fundamental unsteady fluid dynamics and force production of flapping wings, highly simplified situations where wings only perform combined linear translational and pitching motion were considered. In addition, three-dimensional (3D) effects were ignored and this study concentrated only on two-dimensional (2D) models. (Carruthers et al., 2007) Consider a NACA0012 airfoil that is immersed in a uniform fluid traveling at a time-varying velocity, U(t). The airfoil is initially at an angle of attack α=0 and is made to rapidly pitch up to α=90 at an angular velocity ω(t). Two distinct classes of translational motion are considered, first pitching where U(t)= U 0, a constant velocity, and then perching which Granlund et al (2010) defines as the airfoil linearly decelerates from the initial velocity U 0 to rest during the pitch-up maneuver. A perching maneuver performed by a Steppe Eagle Aquila nipalenis is shown in Figure 1. 5

13 Figure 1: Visualization of perching maneuver by Carruthers et al (Carruthers et al., 2007) 6
14 Commercial package COMSOL Multiphysics 4.4 was chosen to model this problem using its Rotating Machinery module. COMSOL Multiphysics is a finite-element modeling, simulation, and visualization software package that has a friendly user interface and a much more forgiving learning curve than some in-house packages, e.g., a boundary data immersion method (BDIM) that Zhao et al (2011) use or the viscous vortex particle method (VVPM) used by Peskin and Dora (2002) while still providing impressive accuracy results. The NACA0012 airfoil profile was imported into COMSOL Multiphysics using 140 data points to ensure that enough resolution could be achieved around the airfoil. The computational domain is a square box shown in Figure 2. The following boundary conditions were applied: the left side of the square is designated as the inlet, the right side is the outlet, and both the top and bottom are open flow boundaries. The inside of the circle enclosing the airfoil is set as a rotating domain, for which the rotational velocity and rotational axis are specified. The rotating wall node in COMSOL is a boundary condition that is applied to the airfoil, which essentially represents the no-slip condition for the fluid at the airfoil surface. Fluid continuity is specified along the perimeter of the circle and is suitable for pairs where the boundaries match; it prescribes that the flow field is continuous across the pair. The freestream flow speed at the inlet is U(t); thus the airfoil does not have to translate in the domain. To account for the non-zero inertial effect that results from the deceleration of the airfoil in the actual situation, a uniform volumetric force is included for the perching case to decelerate the flow correspondingly. The uniform volumetric force is given by Eq. (1) below, ρ U(t) t (1) 7
 than domain 2 (outside of the circle); this was")
15 Figure 2: Illustration of the complete computational domain with boundary conditions The mesh discretization is shown in Figure 3. It can be seen that the flow field immediately surrounding the airfoil has a much finer mesh in the area of interest (domain 1 is inside the cycle) than domain 2 (outside of the circle); this was done to resolve the vortices around the airfoil while minimizing the overall computational cost. Note that the two domains are meshed separately but share the same mesh nodes along the domain interface (the circle); this ensures that mesh continuity across the two domains. The mesh was created using a two part mesh in COMSOL. The first part uses COMSOL s pre-defined fine setting for the outside domain (outside of the circle) while the inner domain (inside the circle) uses a user-controlled custom mesh. Adjusting the size parameters from the extremely fine default settings within the circle domain; the maximum element size limits how large each individual mesh element can be, which is set to be times the chord length (c); while the maximum element growth rate limits the size ratio between two adjacent mesh elements and is set to be 1.02c; therefore, lowering both of these parameters created a much finer mesh for the inner domain. The predefined fine mesh setting was utilized on the outer domain, the maximum element size was 1.34c and the maximum element growth rate was 1.13c. The inner domain, outer domain and total combined mesh consisted of 154,640, 2,154, and 156,784 elements respectively and can be seen in the zoomed in view shown in Figure 3. 8

 (2) α(t) = π 2 [t sin (2πt ) ] 2π (3) Here t is the non-dimensional time (0 t 1) and is defined as t = t/t, where t is the actual time, and T the total time period for the")
16 Figure 3: Mesh used in the simulation, where the inner region and outer region were meshed separately II.2 Validation study: case 1 Two validation cases were carried out to verify the current model setup and assess the accuracy of COMOSL simulation. In the first validation study, the perching maneuver kinematics as specified in Polet et al (2015) were used, where the time-dependent inlet velocity and angle of attack are given as functions of time as: U = U 0 (1 - t ) (2) α(t) = π 2 [t sin (2πt ) ] 2π (3) Here t is the non-dimensional time (0 t 1) and is defined as t = t/t, where t is the actual time, and T the total time period for the airfoil to complete the perching maneuver. Eq. (3) is incorporated into the COMSOL model by specifying the angular velocity located in the rotating 9
17 domain section; this requires taking the time derivative of Eq. (3), which produces the following angular velocity equation, ω(t) = π [ 1 cos (2πt ) ] (4) 2 T T In order to compare the results with those in Polet et al (2015), the flow conditions were nondimensionalized. The current study was limited to low Reynolds number aerodynamics, where both the boundary layer and the bulk fluid are laminar. Consider the viscous, incompressible unsteady flow over a NACA 0012 airfoil that has a chord length c=1.0 m, under the following conditions: initial velocity U 0 =1 m/s, fluid density ρ =1.0 kg/m3, and dynamic viscosity μ = Pa s. The Reynolds number can be thus calculated according to the following equation: Re = ρu 0c μ (5) This Reynolds number of 2,000 matches the Reynolds number in Polet et al (2015). In that reference, the shape change number (SC) is used to parametrize the ratio between the translational speed and the rotational speed, or rate of the shape change of the system (as viewed by the flow). Here the shape change number and pitch rate, K, are used interchangeably which is defined as: SC = K = The center of pitch rotation was located c/6 from the leading edge. c T U 0 (6) II.3 Results from validation case 1 Three simulations were conducted keeping other parameters constant except the value of pitching time, which is T= 2, 4 and 8 seconds. These aforementioned values of T lead to three distinct pitch rates, from fastest to slowest, K= 1 2, 1 4 and 1 8. The forces the airfoil experiences for the three different pitch rates are shown in Figure 4 along with the reference results. The lift and drag coefficients, Cl and Cd, are defined using the chord length c, fluid density ρ, and velocity U 0. Looking at the lift and drag coefficients as functions of the non-dimensionalized time, it can be seen that in all three cases lift reaches the maximum value at approximately t*=0.44 and drag reaches the maximum around t*=0.51. Note that there is a general trend for both lift and drag: as the pitch rate increases, so does the magnitudes of the forces. Most importantly, the results shown here are in very good agreement with the results in Polet et al (2015). To visualize the flow field in this study, we plot the vorticity and pressure contours, both of which are normalized properly. Unless specified otherwise, the vorticity is normalized by U 0 /c, and the pressure is normalized by ρu
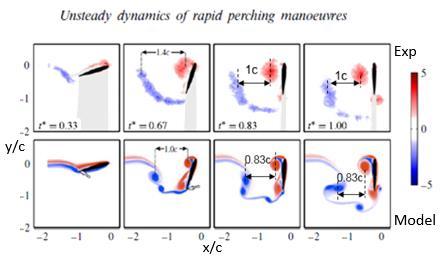
18 Figure 4: Lift and drag coefficients for three pitch rates. Solid lines represent the current study, and dashed lines are the results from Polet et al (Polet et al., 2015) The vorticity fields are shown Figure 5 and Figure 6 that result from the perching maneuver for pitch rates ¼ and ½, which represent moderate and fast pitching, respectively. The top panel of the figure is the results from Polet et al (2015), where the first row of plots is for experimental results and the second row is for the numerical simulations. It can be seen from these two figures that the current simulation results are in good agreement with those in the reference, including both numerical and experimental data. In particular, the vortex structures in the current simulations, such as the leading edge and trailing edge vortices, have similar patterns as those simulated by Polet et al (2015), which are in turn consistent with experiment observation. The experiment was carried in a water tunnel and particle imaging velocimetry (PIV) was used to measure the flow field and derive vorticity. In addition to vortex patterns, the formation time and convection of the vortices from the airfoil, as measured by the distance between the vortices and the airfoil, are consistent between our results and those in the reference. It is also worth noting that for both pitch rates, the horizontal distance between the leading edge and trailing edge vortices is decreasing as the airfoil is increasing its angle of attack. 11

19 12
; lower panel: present study.")

20 Figure 5: Vorticity field of perching motion with K =1/4 at α = 17, 73, 87, 90. Upper panel: results from Polet et al (2015); lower panel: present study. Figure 6: Vorticity field of perching motion with K =1/2 at α = 17, 73, 87, 90. Upper panel: results from Polet et al (2015); lower panel: present study. 13
21 II.4 Validation study: case 2 A second validation case was considered, where the airfoil performs either pitching or perching motion, and the case was numerically studied by Wang and Eldredge (2012) using a highly accurate viscous vortex particle method. In this case study, the time-dependent angle of attack is given by: α(t) = α o log[ cosh (a su0 (t t 1 ) c ) cosh ( a su0 (t t 2 ) ]-a s U 0 (t 1 t 2 ) ) c 2a s U 0 (t 2 t 1 )/c (5) Where the smoothing parameter a s controls the speed of the transitions between kinematic intervals, t1 and t2 are the start and stop instances for the pitch-up maneuver, and α o is the maximum angle and is set to be π/2. The Reynolds number, defined in the same way as before, is set at Re=1,000 for comparison purposes. Wang and Eldredge (2012) defines the nominal pitch rate, α o, by setting the value of a dimensionless pitch rate, k: k = α o C 2U 0 (5) Two different types of translational motion were considered; the first is pitching where U(t)= U 0 (i.e., constant speed) and the second case is perching which is defined by Granlund et al (2010), where the wing starts at an initial speed U 0 and decelerates linearly until rest during the pitch-up maneuver. For the both cases, the pitch axis is located at the leading edge. II.5 Results from validation case 2 The lift and drag forces produced during the pitching maneuver are first compared and are shown in Figure 7. Two pitch rates are considered here, k=0.2 (slower pitching) and k=0.7 (faster pitching). As shown in the figure, the present results are overall consistent with those in the Wang and Eldredge (2012). For the slower pitch rate case, k=0.2, the matching is better as compared with that for the faster pitch rate, k=0.7. However, neither case agrees as strongly as in validation case study 1. This is likely because in case study 1, both our simulation and the reference study used the same NACA airfoil, while in the current case study, Wang and Eldredge (2012) used a flat plat with rounded leading and trailing edges and the plate thickness is 0.023c. Such difference in the geometry of the airfoil likely have caused the discrepancy seen in the validation. 14
22 Figure 7: Comparison of lift and drag coefficients of a pitching wing at k=0.2 and k=0.7 The vorticity fields at three distinct angles of attack, or time moments, during the pitching maneuver at k=0.2 are shown in Figure 8 By comparing the results obtained during this investigation (left column) with the results described in Want and Eldredge (2012), both experimentally and numerically (middle and right column), it can be seen that the flow fields of all three studies are very similar. A starting vortex at the trailing edge, or trailing-edge vortex (TEV) is generated first, and the leading-edge vortex (LEV) forms at a later time during the pitchup maneuver. The LEV remains close to low pressure side of the airfoil, while initial TEV is significantly further downstream. The distance between the LEV and TEV is measured for angle of attack at 53 and 90 deg., and the result appears to be in good agreement with that in the reference. 15

23 Figure 8: Flow field of pitching motion for k=0.2 at α = 15, 53, 90. The results in the middle and right columns are from Wang and Eldredge (2012) The flow field for the pitch rate of k=0.7 at angles of attack 33 and 90 deg are shown in Figure 9. It can be easily seen that the flow fields are very similar for this case as well. Looking at α = 90 deg, the flow separation on the suction side near the trailing edge is present in both studies, and both studies have a similar distance between the leading-edge and trailing-edge vortices. The main discrepancy between the two studies appears to be at α = 33 deg, where the LEV from the present simulation is not completely formed or as distinct as it is in Wang and Eldredge (2012). This difference is again likely due to the rounded edges and smaller thickness of the plate used in Wang et al. 16
")
24 Figure 9: Flow field of pitching motion for k=0.7 at α = 33 and 90. Top: present study; bottom: results from Wang and Eldredge (2012) 17
25 Figure 10: Force production comparison for k=0.2 and 0.7 for perching cases Next the perching maneuver study is examined. The lift and drag coefficients are shown in Figure 10 for k=0.2 and 0.7. As in the pitching maneuver study, the agreement between our results and those from Wang and Eldredge (2012) is better for the slower pitch rate (k=0.2) than for the faster pitch rate (k=0.7). Nevertheless, the agreement is generally acceptable. Due to differences in the airfoil geometry, result matching is not as strong as that in the validation case study 1. The flow field for these two cases is shown in Figure 11 and Figure 12. In Figure 11 where k=0.2, the LEV remains close to the suction side, while the TEV is convected further downstream. The LEV travels slightly further downstream between 53 and 90 deg; this corresponds to the drop in lift that is produced when pitched at such extreme angles of attack. The LEV and TEV appear to be in good agreement for the current simulation and Wang and Eldredge (2012), particularly so when α = 53 deg. Again, the agreement at k=0.7 between our study and Wang and Eldredge (2012) can be seen in Figure 12. It can be seen that the LEV is significantly closer to the suction side of the airfoil for k=0.7 as compared to when k=0.2 in the previous figure. This LEV proximity even at high angles of attack is what provides the necessary lift for the perching maneuver. The distance between the LEV and TEV is significantly smaller for this faster pitch rate. 18

26 Figure 11: Flow field of perching motion for k=0.2 at α = 15, 53 and 90. Left: present study; right: results from Wang and Eldredge (2012) 19
 To summarize this chapter, I have performed two validation studies for the present flapping wing model against previous numerical and")
27 Figure 12: Flow field of perching motion for k=0.7 at α = 33 and 90. Top: present study; bottom: results from Wang and Eldredge (2012) To summarize this chapter, I have performed two validation studies for the present flapping wing model against previous numerical and experimental studies and have carefully examined the force production and flow field of both pitching maneuver and perching maneuver. The agreement with previous data is overall satisfactory. These successful validations show that my COMSOL model setup (including the use of the rotating framework and a non-inertial coordinate system), assumptions, and mesh design are all correct or appropriate. Next, I will move forward to study details of unsteady fluid dynamics involved in pitching and perching maneuvers. 20

28 Chapter III Unsteady aerodynamics of a pitching airfoil In this chapter, I will describe the results for an airfoil immersed in a uniform flow while performing the prescribed pitching motion. I will discuss the force production, pressure distribution, vorticity field, and their dependence on the pitch rate. The model assumptions and simulation setup have been described in Chapter II. For the current pitching airfoil, the freestream velocity is set to be constant. Simulation for a stationary airfoil at zero deg angle of attack was run first to achieve the steady state of the flow; then the airfoil performs the pitching motion as prescribed by the sinusoidal function in Eq. (3) at time t=0. The pitch rate is set to be 1/2 (fastest), 1/4, 1/8, and 1/64 (slowest). III.1 Force production The lift and drag generated by the NACA 0012 airfoil are shown below in Figure 13. It can be seen that as the pitch rate (K) increases, so do the peak lift and drag that are produced. Except for the case of slowest pitching at K=1/64, in the other cases, lift and drag generally first increase and then decrease. Note that neither the lift or drag peak at consistent times or angles across the different pitch rates, even though the angular velocity always has a maximum at 45 deg. The angular velocity as a function of angle of attack is shown in Figure 14. Looking at fastest pitching at K=1/2, the lift peaks at approximately α = 38 deg while the drag doesn t peak until α = 60 deg. For K=1/4 and 1/8, the lift peak is slightly delayed to a great angle of attack; however, the drag peak is not consistently varying. Specifically, the peak drag for K=1/4 is Cd = 5.11 at α = 66 deg, and for K=1/8 is Cd = 3.61 at α = 56 deg. The detailed statistics are tabulated in Table 1 for easy comparison. For K=1/64, lift and drag become highly oscillatory when α is greater than 20 deg., which indicates that vortex shedding is happening, as in the case of a stationary airfoil at stall state. Comparing the different pitch rates, the Cl/Cd remains favorable until α = 52, 50, 47 and 41 deg for pitch rates k= ½, ¼, 1/8 and 1/64, respectively. That is, the pitch motion clearly has delayed stall and provided enhancement to the airfoil performance. 21
29 Figure 13: Lift (top) and drag (bottom) coeffcients as a function of angle of attack,α, for K = 1/2, 1/4, 1/8 and 1/64 Figure 14: Specified angular velocity as a function of angle of attack for K = 1/2, 1/4, 1/8 and 1/64. 22
30 K Max Cl at α Max Cd at α Max Cl/Cd at α Avg Cl Avg Cd Avg Cl/Cd 1/ / / / Table 1: Detailed lift and drag statistics for the pitching airfoil (note that the spike in the drag history for the case of K=1/8 was ignored) The lift over drag ratio that was generated by the NACA 0012 airfoil is shown in Figure 15. It can be seen that as the pitch rate K increases, so do the peak lift over drag ratios that are produced. As the pitch rate increases, the lift over drag peaks at a smaller α. Looking at fastest pitching at K=1/2, the lift over drag peaks at a Cl/Cd=10.01 at approximately α = 2 deg. For K=1/4, 1/8, and 1/64, the lift over drag peaks are slightly delayed to larger angles of attack; the lift over drag ratios peak approximately 2 deg later between the pitch rates. Specifically, the peak lift over drag for K=1/4 is Cl/Cd = 6.94 at α = 4 deg, for K=1/8 is Cl/Cd = 5.44 at α = 6 deg, and for K=1/64 is Cl/Cd = 3.91 at α = 8 deg. As the angle of attack increases, the different pitch rates converge and are nearly identical as early as 40 deg; the only exception to this is for the oscillatory behavior due to the vortex shedding that is present for K=1/64. Figure 15: Lift over drag ratio as a function of α 23
31 III.2 Flow field for pitch rate at K = 1/2 Now I examine the details of the flow field for each pitch rate, by plotting the pressure, velocity vector, and vorticity fields. The case with K=1/2, i.e., the fastest pitch rate case, is discussed first. At this pitch rate, the airfoil would travel through a distance of two times chord length when it rotates from zero to 90 deg. It can be seen in Figure 16, that the pitch motion, or increasing the angle of attack, creates large velocity and pressure gradients around the airfoil. Looking at the pressure contour plots superimposed with velocity vectors, the figure shows that as the angle of attack increases, the stagnation point is located on the lower side of the airfoil and initially closer to the leading edge. Then, the stagnation point moves further away from the leading edge toward the trailing edge. This occurs due to the angle of attack exposing more of the lower surface to the freestream flow, creating effectively a larger cross-sectional area. Additionally, as the angle of attack increases, the difference in flow speed between the upper (or dorsal) and lower (ventral) surfaces increases significantly. This difference in the flow speed leads to pressure difference and lift generation. Alternatively, it can be seen in Figure 16 that as the angle of attack increases, the pressure on the upper surface drops drastically while the pressure on the lower surface decreases (at a slower rate). Also, it should be noticed that the region of lowest pressure on the upper surface occurs near the leading edge, which will cause more lift to be produced by the leading half of the airfoil than the trailing half. At α=54 and 77 deg., the low pressure zone above the airfoil is clearly more contracting toward the leading edge. On the other hand, separated low pressure regions have been developed in the wake away from the trailing edge. As shown later, such isolated low pressure zones correspond to vortices in the wake. Another observation is that the trailing edge stagnation point is not exactly located at the trailing edge for all four angles of attack shown, thus violating the steady Kutta condition that is in attached flow assumed by traditional aerodynamic theory. This Kutta condition break is consistent with what has been discussed previously by Polet (2015). 24

32 Figure 16: Pressure contour plot with velocity vectors for K= 1/2 at α= 25 (top left), 36 (top right), 54 (bottom left), and 77 (bottom right) deg. The surface plots of the vorticity field around the airfoil are shown in Figure 17. The vorticity plot shows that initially the anticlockwise (red or positive) vorticity is along the entire ventral side as a shear layer and as the angle of attack increases, the anticlockwise shear layer moves further from the trailing edge and extends out further away from the airfoil. On the dorsal side, a negative (blue) shear layer is developed and is initially stably attached to the wing surface. Note that maximum lift occurs at α= 38 deg. At approximately 54 deg, separation of the shear layer on the dorsal side becomes visible and a clockwise leading vortex starts to be formed. As the angle of attack further increases, both the leading and trailing edge vortices grow in size while the leading edge vortex remains closer to the airfoil and has a larger velocity gradient than the trailing edge anticlockwise vortex. Flow separation is considered to be minimal for this rapid pitch-up maneuver. 25

33 Figure 17: Vorticity contour plot with velocity vectors for K= 1/2 at α= 25 (top left), 36(top right), 54 (bottom left), and 77 (bottom right) deg. III.3 Flow field for pitch rate at K = 1/4 The pressure field arising for a pitch-up maneuver at a rate K= 1/4 is shown in Figure 18. At this pitch rate, the airfoil would travel through a distance of four times chord length when it rotates from zero to 90 deg. When comparing with the previous case of K=1/2, it can be seen that K=1/4 has similar pressure behavior in general, that is, a large low pressure zone on the dorsal side and a large high pressure zone on the ventral side. In addition, the low pressure zone corresponds to the leading-edge vortex being formed above the airfoil, and its shape evolves as the angle of attack increases. However, the difference between K=1/4 and K=1/2 cases is also evident. In particular, K=1/4 has more flow separation along the dorsal side of the airfoil at the same time moment. K=1/4 also produces less pressure difference between the dorsal and ventral sides; therefore, K=1/4 produces less lift than the previous case. Maximum lift occurs approximately at α=41 deg. and has much more flow separation at this maximum lift moment than that of K=1/2 in Figure 16 at its corresponding maximum lift. 26

34 Figure 18: Pressure contour plot superimposed with velocity vectors for K= 1/4 at α= 25 (top left), 41 (top right), 50 (bottom left), and 77 (bottom right) deg. When comparing the vorticity field of K=1/4 shown in Figure 19 with that of K=1/2 in Figure 17, the leading-edge vortex that forms with K=1/4 is larger in size, has less of a velocity gradient surrounding it, and is located further away from the airfoil. The trailing-edge vortex never seems to form as distinctly as it does for the faster pitch rate. Flow separation, as indicated by the vorticity, has increased and is easily visible at α=50 deg. 27

35 Figure 19: Vorticity contour plot superimposed with velocity vectors for K= 1/4 at α= 25 (top left), 41 (top right), 50 (bottom left), and 77 (bottom right) deg. III.4 Flow field for pitch rate at K = 1/8 At this pitch rate, the airfoil would travel through a distance of eight times chord length when it rotates from zero to 90 deg. The pressure contour plots are illustrated in Figure 20. It can be seen that pressure difference between the two sides is again less than both of the previous pitch rates. Flow separation as indicated by the velocity field is actually visible as early as α=25 deg., and maximum lift occurs at α=43 deg. with significant flow separation along the leading edge of the airfoil. When comparing the vorticity plot in Figure 21 with the previous two cases, a few noteworthy differences can be seen. Maximum lift occurs at 43 deg; two clockwise roll-up vortices are shown on the dorsal side, one near the leading edge and the other closer to the trailing edge; yet there isn t a clearly defined anticlockwise vortex until α=70 deg. At 70 deg., one large clockwise vortex is shown just behind the leading edge, and two to three much smaller anticlockwise vortices are downstream of the trailing edge. 28

, and 70 (bottom right)")
36 Figure 20: Pressure contour plot with velocity vector for K= 1/8 at α= 25 (top left), 36 (top right), 43 (bottom left), and 70 (bottom right) deg. 29

37 Figure 21: Vorticity contour plot with velocity vectors for K= 1/8 at α= 25 (top left), 36 (top right), 43 (bottom left), and 70 (bottom right) deg. III.5 Flow field for pitch rate at K = 1/64 At this pitch rate, the airfoil would travel through a distance of 64 times of the chord length when it rotates from zero to 90 deg. The pressure field for this slowest pitch rate is shown below in Figure 22. Since the pitch rate is K=1/64, this should not be considered as a rapid pitch-up mauever and thefore will have significantly less rotational effects. As one might expect given the trend in the three previous pitch rates, flow separation is significantly worse than any of the previous cases, and the pressure difference between the two sides of the airfoil is even less. It s interesting to note that this was the only pressure field that resulted in two large low pressure zones downstream of the airfoil. In comparison, the previous pitch rates have only one large low pressure area. Figure 22: Pressure contour plot with velocity vector for K= 1/64 at α= 15 (top left), 20 (top right), 42 (bottom left), and 71 (bottom right) deg. As mentioned earlier, the pitch rate is significantly slower than the previous cases and will have much lower inertial effects (in terms of flow attachment). Figure 23 shows that flow starts to separate from the dorsal surface as early as α=15 deg. Furthermore, this figure uniquely shows that the clockwise vortex that initially forms is located closer to the trailing edge than the leading edge. As the angle of attack increases, the clockwise vortex moves closer towards the leading edge of the airfoil. A single large anticlockwise vortex initially forms close to the tailing edge, but as the angle of attack increases, this positive vortex moves further downstream and pinches off from the trailing edge of the airfoil. Overall, the flow behaves like the unsteady flow would in the case of a stationary airfoil at the same angle of attack. 30

38 Figure 23: Vorticity contour plot with velocity vectors for K= 1/64 at α= 15 (top left), 20 (top right), 42 (bottom left), and 71 (bottom right) deg. III.6 Discussion and conclusions The study of the pitching wing has led to the following observations and conclusions. First, the pitching rotation has very high impact on the temporary force production of the wing. From the four cases presented in this chapter, the peak lift increases by nearly four times as the pitch rate increases from K=1/64 to 1/2. Meanwhile, drag increase is also great (more than twice) when K increases from 1/64 to 1/2. These force spikes would be very useful for birds to perform highly controlled maneuvers. In particular, the high lift would allow a bird to maintain lift without significant stall while slowing down, and the high drag would help the bird to reduce its speed to come to stop. Second, the pitching rotation enhances the force production of the wing by delaying boundary layer separation to a much higher angle of attack. From the present study, it is clear the faster the wings pitch, the more likely the boundary layer stays attached to the dorsal surface of the wing. Thus, the rapid pitching motion leads to an inertial effect of boundary layer stability and flow attachment. Leading edge vortex could be formed during the pitching process and also tends to remain attached to the wing if the pitch rate is fast enough. Third, the leading-edge vortex formation corresponds to reattachment of the boundary layer, and the reattachment point moves toward the leading edge as the LEV evolves. 31
39 Fourth, the boundary layer separation, LEV formation, reattachment, and force production all seem to be nonlinear function of the pitch rate and instantaneous angle of attack and do not appear to be straightforward to describe using simple quantitative relationships. 32
40 Chapter IV Unsteady aerodynamics of a perching airfoil In this chapter, I will describe the results for an airfoil immersed in a uniform flow while performing the prescribed perching motion. That is, while it performs the pitch-up rotation, the wing also comes to stop with respect to the ambient air. I will discuss the force production, pressure distribution, vorticity field, and their dependence on pitch rate. The model setup, including the prescribed pitch rotation and linear translational velocity, computational domain, and mesh design, has been described in detail in Chapter II. The wing kinematics is the same as that in the validation case 1. In the present chapter, I use pitch rates at K=1/2, 1/4, 1/8, and 1/64 to perform a systematic study. IV.1 Force production The lift and drag forces are normalized in the same way as in previous chapters; that is, the initial translational velocity is used to define the lift and drag coefficients, despite that the airfoil translation is time-dependent in the perch maneuver. Before the perch maneuver starts, simulation has been performed to establish the initial flow field for the stationary airfoil at zero angle of attack. The lift and drag forces generated by the NACA 0012 airfoil are shown below in Figure 24, it can be seen that as the pitch rate increases, so does the lift and drag that is produced. Comparing lift production with that in the previous chapter for pitching-only cases, the lift and drag forces are much lower for the present perching cases. This effect is understandable, as the freestream velocity, or the equivalent flight speed of the wing, is being reduced linearly as the angle of attack increases from zero to 90 deg. Nevertheless, despite the rapid flight speed drop, the force increase due to the pitching rotation is still quite impressive. As seen from this figure, the maximum lift at the fastest pitching, K=1/2, is nearly 10 times of that at the slowest pitching, K=1/64. Meanwhile, the maximum drag is also increased by 6 times, from Cd=0.5 to Cd=3.3. For a detailed comparison of these cases, I have tabulated the statistical data in Table 2. In all cases, lift and drag have a similar trend: first increase and then decrease. However, the detailed force history has significant differences among these cases. Looking at the case of K=1/2, the lift peaks at approximately α=28 deg., while the drag doesn t peak until α=45 deg. As the pitch rate is decreased, maximum lift is delayed to a larger angle of attack, while maximum drag is slightly brought forward to a smaller angle of attack. Comparing the different pitch rates, the Cl/Cd remains favorable until α= 53, 54, 51 and 47 deg. for pitch rates k= 1/2, 1/4, 1/8 and1/64, respectively. It is worth noting that like the pitching-only cases, neither the lift or drag peak at consistent times or angles across the different pitch rates, even though the prescribed angular velocity always has a maximum at α=45 deg. Figure 25 shows the angular velocity as a function of angle of attack. 33
41 Figure 24: Lift (top) and drag (bottom) coeffcients as a function of angle of attack for K = 1/2, 1/4, 1/8 and 1/64. 34
42 Figure 25: Prescribed angular velocity as a function of angle of attack for K = 1/2, 1/4, 1/8 and 1/64. K Max Cl at α Max Cd at α Max Cl/Cd at α Avg Cl Avg Cd Avg Cl/Cd 1/ / / / Table 2: Detailed lift and drag statistics for the perching airfoil The lift over drag ratio that was generated by the NACA 0012 airfoil is shown in Figure 26. As with pitching, the perching can be seen that as the pitch rate K increases, so do the peak lift over drag ratios that are produced at low angles of attack. As the pitch rate increases, the lift over drag peaks at a smaller α. Looking at fastest pitching at K=1/2, the lift over drag peaks at a Cl/Cd=17.46 at approximately α = 1 deg. For K=1/4, 1/8, and 1/64, the lift over drag peaks are slightly delayed to larger angles of attack. Specifically, the peak lift over drag for K=1/4 is Cl/Cd = 8.25 at α = 3 deg, for K=1/8 is Cl/Cd = 5.44 at α = 6 deg, and for K=1/64 is Cl/Cd = 3.71 at α = 8 deg. As the angle of attack increases, the different pitch rates converge and are nearly identical as early as 40 deg. Note that when finding the maximum Cl/Cd and discussing the trends, the oscillations at large angles of attack, α>75 deg, were ignored. At those angles of attack, the airfoil becomes nearly vertical. However, as it is slowing down, the fluid tracing the airfoil tends to maintain its momentum and thus pushes the airfoil from the dorsal side, leading to near zero or even negative drag seen in Figure 24. Corresponding, Cl/Cd could become very high, which is not very meaningful. 35
43 Figure 26: Lift over drag ratio as a function of angle of attack IV.2 Flow field for pitch rate at K = 1/2 First, the fastest perching case with K=1/2 is examined. It can be seen in Figure 27 that increasing the angle of attack creates large velocity and pressure gradients around the airfoil. Looking at the pressure contour plots with velocity arrows, the figure shows that as the angle of attack increases, the stagnation point is initially located on the ventral side of the airfoil closer to the leading edge, and then the stagnation point moves toward to the trailing edge of the airfoil. This occurs due to the angle of attack exposing more of the ventral surface to the freestream flow and creating a larger cross-sectional area. Additionally, as the angle of attack increases the difference in flow speed between the distal and proximal surfaces increases significantly, this difference in velocity is what generates lift. Alternatively, Figure 27 shows that as the angle of attack increases, the pressure on the upper surface drops drastically while the pressure on the lower surface decreases (at a slower rate). The region of lowest pressure on the upper surface occurs near the leading edge, which will cause more lift to be produced by the leading half of the airfoil than the trailing half. At α=54 and 77 deg, low pressure vorticities are clearly present at the leading edge distal side. Note that the trailing edge stagnation point is not located at the trailing edge for all four angles of attack shown, thus violating the steady Kutta condition. This Kutta condition break is consistent with what has been discussed in Polet (2015). Comparing this perching rate with the corresponding pitching rate in Figure 16, it can be seen that the primary distinction between the two figures is that the pitching 36

44 case experienced a greater pressure differential between the dorsal and ventral sides of the airfoil and therefore the pitching case exhibits a stronger velocity gradient. The trailing edge vortex on the perching case remains closer to the airfoil at similar α s when compared with the pitching case. Figure 27: Pressure contour plot superimposed with velocity vectors for K= 1/2 at α= 16 (top left), 28 (top right), 54 (bottom left), and 77 (bottom right) deg. The surface plots of the vorticity field around the airfoil is shown in Figure 28. The vorticity plot shows that initially the anticlockwise (red or positive) vorticity is along the entire ventral side as a shear layer and as the angle of attack increases, the anticlockwise shear layer moves further from the trailing edge and extends out further away from the airfoil. On the dorsal side, a clockwise (blue or negative) shear layer is developed and is initially stably attached to the wing surface. The maximum lift occurs at 28 deg. At approximately 54 deg separation of the shear layer on the dorsal side becomes visible and the clockwise leading vortex begins to take shape. As the angle of attack increases, both the leading and trailing edge vortices grow in size while the leading edge clockwise vortex remains closer to the airfoil and has a larger velocity gradient than the trailing edge anticlockwise vortex. Flow separation is considered to be minimal for this rapid perching maneuver. Comparing similar α s with the pitching case in Figure 17, the perching case not only shows a difference in the trailing edge vortex location but it shows a distinct difference in the shear layer on the dorsal side. For the perching case, the shear layer becomes detached midway along the airfoil where the shear layer remained along the airfoil for the pitching case for the entire pitch up maneuver. 37

45 Figure 28: Vorticity surface plot with velocity vectors for K=1/2 at α= 16 (top left), 28 (top right), 54(bottom left), and 77 (bottom right) deg IV.3 Flow field for pitch rate at K = 1/4 The pressure field arising from a perching maneuver at a rate K=1/4 is shown in Figure 29. When comparing with the previous perching case of K=1/2, it can be seen that K=1/4 has similar pressure behavior in general, that is, a large low pressure zone on the dorsal side and a large high pressure zone on the ventral side. In addition, the low pressure zone corresponds to the leading-edge vortex being formed above the airfoil, and its shape evolves as the angle of attack increases. However, the difference between K=1/4 and K=1/2 cases is also evident. In particular, K=1/4 has more flow separation along the dorsal side of the airfoil at the same time moment. K=1/4 also produces less pressure difference between the dorsal and ventral sides; therefore, K=1/4 produces less lift than the previous case. Maximum lift occurs approximately at α=30 deg. and has much more flow separation at this maximum lift moment than that of K=1/2 in Figure 27 at its corresponding maximum lift. Another observation is that the trailing edge stagnation point is not exactly located at the trailing edge for all four angles of attack shown, thus violating the steady Kutta condition that is in attached flow assumed by traditional aerodynamic theory. Comparing this perching rate of K=1/4 with the corresponding pitching rate in Figure 18, it can be seen that the primary distinction between the two figures is that the pitching case experienced a significantly larger pressure differential between the dorsal and ventral sides of the airfoil and therefore the pitching case exhibits a corresponding stronger velocity gradient. 38

46 Figure 29: Pressure surface plot with velocity vectors for K=1/4 at α= 18 (top left), 30 (top right), 50 (bottom left), and 77 (bottom right) deg When comparing the vorticity field in Figure 30 with Figure 28, the leading edge vortex that forms is larger in size, has less of a velocity gradient surrounding it and is located further away from the distal side of the airfoil. For this case, the trailing edge vortex has several smaller components compared to the faster pitch rate that produced one large vortex. Flow separation has increased and is easily visible at 50 deg. Comparing similar α s with the pitching case in Figure 19, several distinct differences can be observed. First, in the perching case, the shear layer on the dorsal side starts to detach from the airfoil surface at a lower angle of attack, and its leading edge vortex has slower development than in the pitching case. In addition, the trailing edge vortex tends to break up in the perching case, rather than forming a continuous sheet in the pitching case. These vortex behaviors appear to be related to the freestream flow speed that is slowing down in the perching case. This result suggests that in the perching case, the boundary layer has less inertia and is more prone to separation than in the pitching case. 39

47 Figure 30: Vorticity surface plot with velocity vectors for K=1/4 at α= 18 (top left), 30 (top right), 50 (bottom left), and 77 (bottom right) deg IV.4 Flow field for pitch rate at K = 1/8 The pressure field resulting from a perching maneuver at a rate K=1/8 is shown in Figure 31. When comparing with the previous faster perching cases (K=1/2 and 1/4), it can be seen that K=1/8 has similar pressure behavior in general, that is, a large low pressure zone on the dorsal side and a large high pressure zone on the ventral side. In addition, the low pressure zone corresponds to the leading-edge vortex being formed above the airfoil, and its shape evolves as the angle of attack increases. However, the key difference between K=1/8 and the faster perching cases is that K=1/8 has more flow separation along the dorsal side of the airfoil at the same time moment. Another observation is that the leading edge stagnation point is not exactly located at the leading edge for all four angles of attack shown, thus violating the steady Kutta condition that is in attached flow assumed by traditional aerodynamic theory. K=1/8 also produces less pressure difference between the dorsal and ventral sides; therefore, K=1/8 produces less lift than the previous cases. Maximum lift occurs approximately at α=34 deg. and has much more flow separation at this maximum lift moment than the faster perching cases at its corresponding maximum lift. Comparing this perching rate of K=1/8 with the corresponding pitching rate in Figure 20, it can be seen that the primary distinction between the two figures is that the pitching case experienced a significantly larger pressure differential between the dorsal and ventral sides of the airfoil and therefore the pitching case exhibits a corresponding stronger velocity gradient. 40

48 Figure 31: Pressure surface plot with velocity vectors for K=1/8 at α= 25 (top left), 34 (top right), 43(bottom left), and 70 (bottom right) deg When comparing the vorticity field in Figure 32 with Figure 28 and Figure 30, the leading edge vortex that forms is larger in size, has less of a velocity gradient surrounding it and is located further away from the distal side of the airfoil. For this case, the trailing edge vortex has several smaller components compared to the faster pitch rates. Flow separation has increased and is easily visible at 43 deg. At 70 deg, one large clockwise vortex is shown just behind the leading edge and three smaller anticlockwise vortices are located farther downstream of the trailing edge. Comparing similar α s with the pitching case in Figure 21, several distinct differences can be observed. Again, the boundary layer in the perching case tends to separate earlier than in the pitching case, and the leading edge vortex has much less development at similar angle of attack. The corresponding pitching case shows two clearly identifiable clockwise vortices present at 43 deg, a single clockwise vortex is located at each of the two ends of the airfoil. The perching case shows this similar second clockwise vortex but it isn t as cleanly defined. In addition, the trailing edge vortex has shorter extension and is less stable in the perching case. 41

49 Figure 32: Vorticity surface plot with velocity vectors for K=1/8 at α= 25 (top left), 34 (top right), 43(bottom left), and 70 (bottom right) deg IV.5 Flow field for pitch rate at K = 1/64 The pressure field for the slowest perching maneuver is shown in Figure 33. A perching maneuver at a rate K=1/64 shouldn t be considered a rapid pitch-up maneuver and therefore will have significantly less inertial effects. As one might expect, the dorsal side flow separation is significantly worse than any of the previous cases examined and occurs at a smaller α. The pressure differential between the dorsal and ventral sides of the airfoil is less than any of the other cases examined which results in the least amount of lift generated. A low pressure region is located near the trailing edge of the airfoil as early as 20 deg. Maximum lift occurs approximately at α=42 deg. When comparing this with the corresponding pitching case in Figure 22, the perching case again shows less of a pressure differential that was present during the pitching case. 42

50 Figure 33: Pressure surface plot with velocity vectors for K=1/64 at α= 15 (top left), 20 (top right), 42 (bottom left), and 71 (bottom right) deg As mentioned earlier, the pitch rate is significantly slower than the previous cases and will have much lower inertial effects. Figure 34 shows that the clockwise vortex that initially forms is located closer to the trailing edge; whereas the previous perching cases showed the clockwise vortex forming at the leading edge. As α increases, the clockwise vortex moves closer towards the leading edge of the airfoil. A single large anticlockwise vortex initially forms close to the tailing edge, but as α increases the vortex moves further downstream away from the trailing edge of the airfoil. The shear layer detaches closer to the leading edge of the airfoil when compared with the previous perching cases. Comparing these results with the pitching case in Figure 23, both the leading shear layer and the trailing edge shear layer are much weaker in the perching case, so are the vortices in the wake. 43

51 Figure 34: Vorticity surface plot with velocity vectors for K=1/64 at α= 15 (top left), 20 (top right), 42 (bottom left), and 71 (bottom right) deg IV.6 Discussions and conclusions The study of the perching wing has led to the following observations and conclusions. First, like in the pitching maneuver, the pitch-up rotation in the perching maneuver also has very high impact on the temporary force production of the wing. The force enhancement by fast perching is very impressive, even though the overall force production of wing is much lower as compared with pitching maneuver where the flight speed remains constant. From the four cases presented in this chapter, the peak lift increases by nearly eight times as the pitch rate increases from K=1/64 to 1/2. Meanwhile, drag increase is also great (more than five times) when K increases from 1/64 to 1/2. Therefore, the force enhancement from slow perching to fast perching is even greater than in the corresponding cases in pitching maneuver. These force spikes would be very useful for birds to perform highly controlled maneuvers and in fact might be critical for birds during perching maneuver where the slow flight speed alone is likely not sufficient to provide enough lift or drag. The present study thus confirms the significant role of pitch rotation in aerodynamics of perching maneuver. Second, like in the pitching maneuver, the pitch-up rotation enhances force production of the wing by delaying boundary layer separation to a much higher angle of attack. From the present study, it is clear the faster the wings pitch, the more likely the boundary layer stays attached to the dorsal surface of the wing. Thus, the rapid pitching motion also leads to an inertial effect of boundary layer stability and flow attachment in the current situation, where the relative speed of air with respect to the wing drops quickly. Like the pitching wing, a leading edge vortex could be formed 44
The effect of back spin on a table tennis ball moving in a viscous fluid.
 How can planes fly? The phenomenon of lift can be produced in an ideal (non-viscous) fluid by the addition of a free vortex (circulation) around a cylinder in a rectilinear flow stream. This is known as
Unsteady airfoil experiments
 Unsteady airfoil experiments M.F. Platzer & K.D. Jones AeroHydro Research & Technology Associates, Pebble Beach, CA, USA. Abstract This paper describes experiments that elucidate the dynamic stall phenomenon
AE Dept., KFUPM. Dr. Abdullah M. Al-Garni. Fuel Economy. Emissions Maximum Speed Acceleration Directional Stability Stability.
 Aerodynamics: Introduction Aerodynamics deals with the motion of objects in air. These objects can be airplanes, missiles or road vehicles. The Table below summarizes the aspects of vehicle performance
Aerodynamic Analysis of a Symmetric Aerofoil
 214 IJEDR Volume 2, Issue 4 ISSN: 2321-9939 Aerodynamic Analysis of a Symmetric Aerofoil Narayan U Rathod Department of Mechanical Engineering, BMS college of Engineering, Bangalore, India Abstract - The
AERODYNAMIC CHARACTERISTICS OF NACA 0012 AIRFOIL SECTION AT DIFFERENT ANGLES OF ATTACK
 AERODYNAMIC CHARACTERISTICS OF NACA 0012 AIRFOIL SECTION AT DIFFERENT ANGLES OF ATTACK SUPREETH NARASIMHAMURTHY GRADUATE STUDENT 1327291 Table of Contents 1) Introduction...1 2) Methodology.3 3) Results...5
Incompressible Potential Flow. Panel Methods (3)
") Incompressible Potential Flow Panel Methods (3) Outline Some Potential Theory Derivation of the Integral Equation for the Potential Classic Panel Method Program PANEL Subsonic Airfoil Aerodynamics Issues
Incompressible Potential Flow Panel Methods (3) Outline Some Potential Theory Derivation of the Integral Equation for the Potential Classic Panel Method Program PANEL Subsonic Airfoil Aerodynamics Issues
Influence of rounding corners on unsteady flow and heat transfer around a square cylinder
 Influence of rounding corners on unsteady flow and heat transfer around a square cylinder S. K. Singh Deptt. of Mech. Engg., M. B. M. Engg. College / J. N. V. University, Jodhpur, Rajasthan, India Abstract
Computational Analysis of the S Airfoil Aerodynamic Performance
 Computational Analysis of the 245-3S Airfoil Aerodynamic Performance Luis Velazquez-Araque and Jiří Nožička 2 Department of Mechanical Engineering National University of Táchira, San Cristóbal 5, Venezuela
AERODYNAMICS I LECTURE 7 SELECTED TOPICS IN THE LOW-SPEED AERODYNAMICS
 LECTURE 7 SELECTED TOPICS IN THE LOW-SPEED AERODYNAMICS The sources of a graphical material used in this lecture are: [UA] D. McLean, Understanding Aerodynamics. Arguing from the Real Physics. Wiley, 2013.
Incompressible Flow over Airfoils
 Road map for Chap. 4 Incompressible Flow over Airfoils Aerodynamics 2015 fall - 1 - < 4.1 Introduction > Incompressible Flow over Airfoils Incompressible flow over airfoils Prandtl (20C 초 ) Airfoil (2D)
Wind Flow Model of Area Surrounding the Case Western Reserve University Wind Turbine
 Wind Flow Model of Area Surrounding the Case Western Reserve University Wind Turbine Matheus C. Fernandes 1, David H. Matthiesen PhD *2 1 Case Western Reserve University Dept. of Mechanical Engineering,
Aerodynamics and Vortex Structures of a Flapping Airfoil in Forward Flight in Proximity of Ground
 Washington University in St. Louis Washington University Open Scholarship Engineering and Applied Science Theses & Dissertations Engineering and Applied Science Spring 5-19-2017 Aerodynamics and Vortex
2-D Computational Analysis of a Vertical Axis Wind Turbine Airfoil
 2-D Computational Analysis of a Vertical Axis Wind Turbine Airfoil Akshay Basavaraj1 Student, Department of Aerospace Engineering, Amrita School of Engineering, Coimbatore 641 112, India1 Abstract: This
C-1: Aerodynamics of Airfoils 1 C-2: Aerodynamics of Airfoils 2 C-3: Panel Methods C-4: Thin Airfoil Theory
 ROAD MAP... AE301 Aerodynamics I UNIT C: 2-D Airfoils C-1: Aerodynamics of Airfoils 1 C-2: Aerodynamics of Airfoils 2 C-3: Panel Methods C-4: Thin Airfoil Theory AE301 Aerodynamics I : List of Subjects
Numerical Investigation of Multi Airfoil Effect on Performance Increase of Wind Turbine
 International Journal of Engineering & Applied Sciences (IJEAS) International Journal of Engineering Applied Sciences (IJEAS) Vol.9, Issue 3 (2017) 75-86 Vol.x, Issue x(201x)x-xx http://dx.doi.org/10.24107/ijeas.332075
Computational Investigation of Airfoils with Miniature Trailing Edge Control Surfaces
 AIAA-24-5 Computational Investigation of Airfoils with Miniature Trailing Edge Control Surfaces Hak-Tae Lee, Ilan M. Kroo Stanford University, Stanford, CA 9435 Abstract Miniature trailing edge effectors
Unsteady Aerodynamics of Tandem Airfoils Pitching in Phase
 Unsteady Aerodynamics of Tandem Airfoils Pitching in Phase Ravindra A Shirsath and Rinku Mukherjee Abstract This paper presents the results of a numerical simulation of unsteady, incompressible and viscous
Experimental Study on Flapping Wings at Low Reynolds Numbers
 Experimental Study on Flapping Wings at Low Reynolds Numbers S. Kishore Kumar, M.Tech Department of Aeronautical Engineering CMR Technical Campus, Hyderabad, Andhra Pradesh, India K. Vijayachandar, Ms
Wind tunnel effects on wingtip vortices
 48th AIAA Aerospace Sciences Meeting Including the New Horizons Forum and Aerospace Exposition 4-7 January 2010, Orlando, Florida AIAA 2010-325 Wind tunnel effects on wingtip vortices Xin Huang 1, Hirofumi
Keywords: dynamic stall, free stream turbulence, pitching airfoil
 Applied Mechanics and Materials Vol. 225 (2012) pp 103-108 Online available since 2012/Nov/29 at www.scientific.net (2012) Trans Tech Publications, Switzerland doi:10.4028/www.scientific.net/amm.225.103
Flight Corridor. The speed-altitude band where flight sustained by aerodynamic forces is technically possible is called the flight corridor.
 Flight Corridor The speed-altitude band where flight sustained by aerodynamic forces is technically possible is called the flight corridor. The subsonic Boeing 747 and supersonic Concorde have flight corridors
Investigation on 3-D Wing of commercial Aeroplane with Aerofoil NACA 2415 Using CFD Fluent
 Investigation on 3-D of commercial Aeroplane with Aerofoil NACA 2415 Using CFD Fluent Rohit Jain 1, Mr. Sandeep Jain 2, Mr. Lokesh Bajpai 3 1PG Student, 2 Associate Professor, 3 Professor & Head 1 2 3
CFD AND EXPERIMENTAL STUDY OF AERODYNAMIC DEGRADATION OF ICED AIRFOILS
 Colloquium FLUID DYNAMICS 2008 Institute of Thermomechanics AS CR, v.v.i., Prague, October 22-24, 2008 p.1 CFD AND EXPERIMENTAL STUDY OF AERODYNAMIC DEGRADATION OF ICED AIRFOILS Vladimír Horák 1, Dalibor
ROAD MAP... D-1: Aerodynamics of 3-D Wings D-2: Boundary Layer and Viscous Effects D-3: XFLR (Aerodynamics Analysis Tool)
") Unit D-1: Aerodynamics of 3-D Wings Page 1 of 5 AE301 Aerodynamics I UNIT D: Applied Aerodynamics ROAD MAP... D-1: Aerodynamics of 3-D Wings D-: Boundary Layer and Viscous Effects D-3: XFLR (Aerodynamics
Unit D-1: Aerodynamics of 3-D Wings Page 1 of 5 AE301 Aerodynamics I UNIT D: Applied Aerodynamics ROAD MAP... D-1: Aerodynamics of 3-D Wings D-: Boundary Layer and Viscous Effects D-3: XFLR (Aerodynamics
Low Speed Wind Tunnel Wing Performance
 Low Speed Wind Tunnel Wing Performance ARO 101L Introduction to Aeronautics Section 01 Group 13 20 November 2015 Aerospace Engineering Department California Polytechnic University, Pomona Team Leader:
Design and Development of Micro Aerial Vehicle
 Advances in Aerospace Science and Applications. ISSN 2277-3223 Volume 4, Number 1 (2014), pp. 91-98 Research India Publications http://www.ripublication.com/aasa.htm Design and Development of Micro Aerial
DYAMIC BEHAVIOR OF VORTEX SHEDDING FROM AN OSCILLATING THREE-DIMENSIONAL AIRFOIL
 27 TH INTERNATIONAL CONGRESS OF THE AERONAUTICAL SCIENCES DYAMIC BEHAVIOR OF VORTEX SHEDDING FROM AN OSCILLATING THREE-DIMENSIONAL AIRFOIL Hiroaki Hasegawa*, Kennichi Nakagawa** *Department of Mechanical
8d. Aquatic & Aerial Locomotion. Zoology 430: Animal Physiology
 8d. Aquatic & Aerial Locomotion 1 Newton s Laws of Motion First Law of Motion The law of inertia: a body retains its state of rest or motion unless acted on by an external force. Second Law of Motion F
Numerical Simulations of a Train of Air Bubbles Rising Through Stagnant Water
 Numerical Simulations of a Train of Air Bubbles Rising Through Stagnant Water Hong Xu, Chokri Guetari ANSYS INC. Abstract Transient numerical simulations of the rise of a train of gas bubbles in a liquid
Development of Technology to Estimate the Flow Field around Ship Hull Considering Wave Making and Propeller Rotating Effects
 Development of Technology to Estimate the Flow Field around Ship Hull Considering Wave Making and Propeller Rotating Effects 53 MAKOTO KAWABUCHI *1 MASAYA KUBOTA *1 SATORU ISHIKAWA *2 As can be seen from
Unsteady Aerodynamic Forces: Experiments, Simulations, and Models. Steve Brunton & Clancy Rowley FAA/JUP Quarterly Meeting April 6, 2011
 Unsteady Aerodynamic Forces: Experiments, Simulations, and Models Steve Brunton & Clancy Rowley FAA/JUP Quarterly Meeting April 6, Wednesday, March 8, Motivation Applications of Unsteady Models Conventional
J. Szantyr Lecture No. 21 Aerodynamics of the lifting foils Lifting foils are important parts of many products of contemporary technology.
 J. Szantyr Lecture No. 21 Aerodynamics of the lifting foils Lifting foils are important parts of many products of contemporary technology. < Helicopters Aircraft Gliders Sails > < Keels and rudders Hydrofoils
Numerical Analysis of Wings for UAV based on High-Lift Airfoils
 Numerical Analysis of Wings for UAV based on High-Lift Airfoils Sachin Srivastava Department of Aeronautical Engineering Malla Reddy College of Engineering & Technology, Hyderabad, Telangana, India Swetha
Basic Fluid Mechanics
 Basic Fluid Mechanics Chapter 7B: Forces on Submerged Bodies 7/26/2018 C7B: Forces on Submerged Bodies 1 Forces on Submerged Bodies Lift and Drag are forces exerted on an immersed body by the surrounding
Ermenek Dam and HEPP: Spillway Test & 3D Numeric-Hydraulic Analysis of Jet Collision
 Ermenek Dam and HEPP: Spillway Test & 3D Numeric-Hydraulic Analysis of Jet Collision J.Linortner & R.Faber Pöyry Energy GmbH, Turkey-Austria E.Üzücek & T.Dinçergök General Directorate of State Hydraulic
It should be noted that the symmetrical airfoil at zero lift has no pitching moment about the aerodynamic center because the upper and
 NAVWEPS -81-8 and high power, the dynamic pressure in the shaded area can be much greater than the free stream and this causes considerably greater lift than at zero thrust. At high power conditions the
CFD ANALYSIS OF FLOW AROUND AEROFOIL FOR DIFFERENT ANGLE OF ATTACKS
 www.mechieprojects.com CFD ANALYSIS OF FLOW AROUND AEROFOIL FOR DIFFERENT ANGLE OF ATTACKS PRESENTATION OUTLINE AIM INTRODUCTION LITERATURE SURVEY CFD ANALYSIS OF AEROFOIL RESULTS CONCLUSIONS www.mechieprojects.com
Quantification of the Effects of Turbulence in Wind on the Flutter Stability of Suspension Bridges
 Quantification of the Effects of Turbulence in Wind on the Flutter Stability of Suspension Bridges T. Abbas 1 and G. Morgenthal 2 1 PhD candidate, Graduate College 1462, Department of Civil Engineering,
Numerical and Experimental Investigations of Lift and Drag Performances of NACA 0015 Wind Turbine Airfoil
 International Journal of Materials, Mechanics and Manufacturing, Vol. 3, No., February 2 Numerical and Experimental Investigations of Lift and Drag Performances of NACA Wind Turbine Airfoil İzzet Şahin
Static Extended Trailing Edge for Lift Enhancement: Experimental and Computational Studies
 Static Extended Trailing Edge for Lift Enhancement: Experimental and Computational Studies T. Liu, J. Montefort, W. Liou Western Michigan University Kalamazoo, MI 49008 and Q. Shams NASA Langley Research
Welcome to Aerospace Engineering
 Welcome to Aerospace Engineering DESIGN-CENTERED INTRODUCTION TO AEROSPACE ENGINEERING Notes 4 Topics 1. Course Organization 2. Today's Dreams in Various Speed Ranges 3. Designing a Flight Vehicle: Route
Experimental investigation on the aft-element flapping of a two-element airfoil at high attack angle
 Experimental investigation on the aft-element flapping of a two-element airfoil at high attack angle Tan Guang-kun *, Shen Gong-xin, Su Wen-han Beijing University of Aeronautics and Astronautics (BUAA),
Flow and Mixing in the Liquid between Bubbles
 Excerpt from the Proceedings of the COMSOL Conference 2009 Boston Flow and Mixing in the Liquid between Bubbles Bruce A. Finlayson, Professor Emeritus of Chemical Engineering Department of Chemical Engineering,
Reduction of Skin Friction Drag in Wings by Employing Riblets
 Reduction of Skin Friction Drag in Wings by Employing Riblets Kousik Kumaar. R 1 Assistant Professor Department of Aeronautical Engineering Nehru Institute of Engineering and Technology Coimbatore, India
The Usage of Propeller Tunnels For Higher Efficiency and Lower Vibration. M. Burak Şamşul
 The Usage of Propeller Tunnels For Higher Efficiency and Lower Vibration M. Burak Şamşul ITU AYOC 2014 - Milper Pervane Teknolojileri Company Profile MILPER is established in 2011 as a Research and Development
ANALYSIS OF AERODYNAMIC CHARACTERISTICS OF A SUPERCRITICAL AIRFOIL FOR LOW SPEED AIRCRAFT
 ANALYSIS OF AERODYNAMIC CHARACTERISTICS OF A SUPERCRITICAL AIRFOIL FOR LOW SPEED AIRCRAFT P.Sethunathan 1, M.Niventhran 2, V.Siva 2, R.Sadhan Kumar 2 1 Asst.Professor, Department of Aeronautical Engineering,
EFFECT OF GURNEY FLAPS AND WINGLETS ON THE PERFORMANCE OF THE HAWT
 Chapter-6 EFFECT OF GURNEY FLAPS AND WINGLETS ON THE PERFORMANCE OF THE HAWT 6.1 Introduction The gurney flap (wicker bill) was a small flat tab projecting from the trailing edge of a wing. Typically it
A STUDY OF THE LOSSES AND INTERACTIONS BETWEEN ONE OR MORE BOW THRUSTERS AND A CATAMARAN HULL
 A STUDY OF THE LOSSES AND INTERACTIONS BETWEEN ONE OR MORE BOW THRUSTERS AND A CATAMARAN HULL L Boddy and T Clarke, Austal Ships, Australia SUMMARY CFD analysis has been conducted on a 100m catamaran hull
Flow Over Bodies: Drag and Lift
 Fluid Mechanics (0905241) Flow Over Bodies: Drag and Lift Dr.-Eng. Zayed dal-hamamre 1 Content Overview Drag and Lift Flow Past Objects Boundary Layers Laminar Boundary Layers Transitional and Turbulent
Computational Analysis of Cavity Effect over Aircraft Wing
 World Engineering & Applied Sciences Journal 8 (): 104-110, 017 ISSN 079-04 IDOSI Publications, 017 DOI: 10.589/idosi.weasj.017.104.110 Computational Analysis of Cavity Effect over Aircraft Wing 1 P. Booma
A COMPUTATIONAL STUDY ON THE DESIGN OF AIRFOILS FOR A FIXED WING MAV AND THE AERODYNAMIC CHARACTERISTIC OF THE VEHICLE
 28 TH INTERNATIONAL CONGRESS OF THE AERONAUTICAL SCIENCES A COMPUTATIONAL STUDY ON THE DESIGN OF AIRFOILS FOR A FIXED WING MAV AND THE AERODYNAMIC CHARACTERISTIC OF THE VEHICLE Jung-Hyun Kim*, Kyu-Hong
Lecture # 08: Boundary Layer Flows and Drag
 AerE 311L & AerE343L Lecture Notes Lecture # 8: Boundary Layer Flows and Drag Dr. Hui H Hu Department of Aerospace Engineering Iowa State University Ames, Iowa 511, U.S.A y AerE343L #4: Hot wire measurements
CFD SIMULATION STUDY OF AIR FLOW AROUND THE AIRFOIL USING THE MAGNUS EFFECT
 Magnus effect, simulation, air flow Patryk SOKOŁOWSKI *, Jacek CZARNIGOWSKI **, Paweł MAGRYTA *** CFD SIMULATION STUDY OF AIR FLOW AROUND THE AIRFOIL USING THE MAGNUS EFFECT Abstract The article presents
Lecture # 08: Boundary Layer Flows and Controls
 AerE 344 Lecture Notes Lecture # 8: Boundary Layer Flows and Controls Dr. Hui Hu Department of Aerospace Engineering Iowa State University Ames, Iowa 511, U.S.A Flow Separation on an Airfoil Quantification
CFD Analysis of Effect of Variation in Angle of Attack over NACA 2412 Airfoil through the Shear Stress Transport Turbulence Model
 IJSRD - International Journal for Scientific Research & Development Vol. 5, Issue 02, 2017 ISSN (online): 2321-0613 CFD Analysis of Effect of Variation in Angle of Attack over NACA 2412 Airfoil through
Aerodynamic Analysis of Blended Winglet for Low Speed Aircraft
 , July 1-3, 2015, London, U.K. Aerodynamic Analysis of Blended Winglet for Low Speed Aircraft Pooja Pragati, Sudarsan Baskar Abstract This paper provides a practical design of a new concept of massive
Influence of wing span on the aerodynamics of wings in ground effect
 Influence of wing span on the aerodynamics of wings in ground effect Sammy Diasinos 1, Tracie J Barber 2 and Graham Doig 2 Abstract A computational fluid dynamics study of the influence of wing span has
Signature redacted Signature of Author:... Department of Mechanical Engineering
 Review of Flapping Foil Actuation and Testing of Impulsive Motions for Large, Transient Lift and Thrust Profiles by Miranda Kotidis Submitted to the Department of Mechanical Engineering in Partial Fulfillment
Investigation of the flow around uncambered airfoils at 1000 Reynolds number using computational fluid dynamics for micro air vehicles
 Investigation of the flow around uncambered airfoils at 1000 Reynolds number using computational fluid dynamics for micro air vehicles Emad Uddin 1), Muhammad Adil Naseem 2), Saif Ullah Khalid 3), Aamir
COMPUTATIONAL FLUID DYNAMIC ANALYSIS OF AIRFOIL NACA0015
 International Journal of Mechanical Engineering and Technology (IJMET) Volume 8, Issue 2, February 2017, pp. 210 219 Article ID: IJMET_08_02_026 Available online at http://www.iaeme.com/ijmet/issues.asp?jtype=ijmet&vtype=8&itype=2
THEORY OF WINGS AND WIND TUNNEL TESTING OF A NACA 2415 AIRFOIL. By Mehrdad Ghods
 THEORY OF WINGS AND WIND TUNNEL TESTING OF A NACA 2415 AIRFOIL By Mehrdad Ghods Technical Communication for Engineers The University of British Columbia July 23, 2001 ABSTRACT Theory of Wings and Wind
Fish Biorobotics. Fishes as model systems for understanding aquatic propulsion. George V. Lauder Harvard University
 Fish Biorobotics Fishes as model systems for understanding aquatic propulsion 28,000 species of fishes Half of all vertebrates are fishes Fishes are 550 million years old Tremendous opportunity for selection
Parasite Drag. by David F. Rogers Copyright c 2005 David F. Rogers. All rights reserved.
 Parasite Drag by David F. Rogers http://www.nar-associates.com Copyright c 2005 David F. Rogers. All rights reserved. How many of you still have a Grimes rotating beacon on both the top and bottom of the
CFD Analysis ofwind Turbine Airfoil at Various Angles of Attack
 IOSR Journal of Mechanical and Civil Engineering (IOSR-JMCE) e-issn: 2278-1684,p-ISSN: 2320-334X, Volume 13, Issue 4 Ver. II (Jul. - Aug. 2016), PP 18-24 www.iosrjournals.org CFD Analysis ofwind Turbine
Jet Propulsion. Lecture-17. Ujjwal K Saha, Ph. D. Department of Mechanical Engineering Indian Institute of Technology Guwahati
 Lecture-17 Prepared under QIP-CD Cell Project Jet Propulsion Ujjwal K Saha, Ph. D. Department of Mechanical Engineering Indian Institute of Technology Guwahati 1 Lift: is used to support the weight of
Numerical and Experimental Investigation of the Possibility of Forming the Wake Flow of Large Ships by Using the Vortex Generators
 Second International Symposium on Marine Propulsors smp 11, Hamburg, Germany, June 2011 Numerical and Experimental Investigation of the Possibility of Forming the Wake Flow of Large Ships by Using the
Investigation of Suction Process of Scroll Compressors
 Purdue University Purdue e-pubs International Compressor Engineering Conference School of Mechanical Engineering 2006 Investigation of Suction Process of Scroll Compressors Michael M. Cui Trane Jack Sauls
Experimental and Theoretical Investigation for the Improvement of the Aerodynamic Characteristic of NACA 0012 airfoil
 International Journal of Mining, Metallurgy & Mechanical Engineering (IJMMME) Volume 2, Issue 1 (214) ISSN 232 46 (Online) Experimental and Theoretical Investigation for the Improvement of the Aerodynamic
Numerical Simulation And Aerodynamic Performance Comparison Between Seagull Aerofoil and NACA 4412 Aerofoil under Low-Reynolds 1
 Advances in Natural Science Vol. 3, No. 2, 2010, pp. 244-20 www.cscanada.net ISSN 171-7862 [PRINT] ISSN 171-7870 [ONLINE] www.cscanada.org *The 3rd International Conference of Bionic Engineering* Numerical
NUMERICAL INVESTIGATION OF THE FLOW BEHAVIOUR IN A MODERN TRAFFIC TUNNEL IN CASE OF FIRE INCIDENT
 - 277 - NUMERICAL INVESTIGATION OF THE FLOW BEHAVIOUR IN A MODERN TRAFFIC TUNNEL IN CASE OF FIRE INCIDENT Iseler J., Heiser W. EAS GmbH, Karlsruhe, Germany ABSTRACT A numerical study of the flow behaviour
CIRCULATION PRODUCTION AND SHEDDING FROM VERTICAL AXIS WIND TURBINE BLADES UNDERGOING DYNAMIC STALL
 June 3 - July 3, 5 Melbourne, Australia 9 7D-3 CIRCULATION PRODUCTION AND SHEDDING FROM VERTICAL AXIS WIND TURBINE BLADES UNDERGOING DYNAMIC STALL Abel-John Buchner,,, Julio Soria,3, Alexander J. Smits,
COMPUTATIONAL FLOW MODEL OF WESTFALL'S LEADING TAB FLOW CONDITIONER AGM-09-R-08 Rev. B. By Kimbal A. Hall, PE
 COMPUTATIONAL FLOW MODEL OF WESTFALL'S LEADING TAB FLOW CONDITIONER AGM-09-R-08 Rev. B By Kimbal A. Hall, PE Submitted to: WESTFALL MANUFACTURING COMPANY September 2009 ALDEN RESEARCH LABORATORY, INC.
A comparison of NACA 0012 and NACA 0021 self-noise at low Reynolds number
 A comparison of NACA 12 and NACA 21 self-noise at low Reynolds number A. Laratro, M. Arjomandi, B. Cazzolato, R. Kelso Abstract The self-noise of NACA 12 and NACA 21 airfoils are recorded at a Reynolds
INVESTIGATION OF AIRFOIL FOR AN INSECT-SIZED FLAPPING WING
 INVESTIGATION OF AIRFOI FOR AN INSECT-SIZED FAING WING Hiroto Nagai*, Koji Isogai*, Nobuhide Uda*, Kosei Ono* *Kyushu University Keywords: Flapping Wing, Insect Airfoil, Morphing Airfoil, CFD, Corrugation
Improved Aerodynamic Characteristics of Aerofoil Shaped Fuselage than that of the Conventional Cylindrical Shaped Fuselage
 International Journal of Scientific & Engineering Research Volume 4, Issue 1, January-213 1 Improved Aerodynamic Characteristics of Aerofoil Shaped Fuselage than that of the Conventional Cylindrical Shaped
AIRFLOW GENERATION IN A TUNNEL USING A SACCARDO VENTILATION SYSTEM AGAINST THE BUOYANCY EFFECT PRODUCED BY A FIRE
 - 247 - AIRFLOW GENERATION IN A TUNNEL USING A SACCARDO VENTILATION SYSTEM AGAINST THE BUOYANCY EFFECT PRODUCED BY A FIRE J D Castro a, C W Pope a and R D Matthews b a Mott MacDonald Ltd, St Anne House,
CFD Analysis of Giromill Type Vertical Axis Wind Turbine
 242 CFD Analysis Giromill Type Vertical Axis Wind Turbine K. Sainath 1, T. Ravi 2, Suresh Akella 3, P. Madhu Sudhan 4 1 Associate Pressor, Department Mechanical Engineering, Sreyas Inst. Engg. & Tech.,
INVESTIGATION OF PRESSURE CONTOURS AND VELOCITY VECTORS OF NACA 0015IN COMPARISON WITH OPTIMIZED NACA 0015 USING GURNEY FLAP
 INVESTIGATION OF PRESSURE CONTOURS AND VELOCITY VECTORS OF NACA 0015IN COMPARISON WITH OPTIMIZED NACA 0015 USING GURNEY FLAP 1 ANANTH S SHARMA, 2 SUDHAKAR S, 3 SWATHIJAYAKUMAR, 4 B S ANIL KUMAR 1,2,3,4
Effect of Co-Flow Jet over an Airfoil: Numerical Approach
 Contemporary Engineering Sciences, Vol. 7, 2014, no. 17, 845-851 HIKARI Ltd, www.m-hikari.com http://dx.doi.org/10.12988/ces.2014.4655 Effect of Co-Flow Jet over an Airfoil: Numerical Approach Md. Riajun
 et al. [25], Noack et al. [26] for circular cylinder flows, Van Oudheusden [27] for square cylinder and Durgesh [28] for a flat plate model. The first two modes appear as phase-shifted versions of each
Measurement and simulation of the flow field around a triangular lattice meteorological mast
 Measurement and simulation of the flow field around a triangular lattice meteorological mast Matthew Stickland 1, Thomas Scanlon 1, Sylvie Fabre 1, Andrew Oldroyd 2 and Detlef Kindler 3 1. Department of
Development of a Four-Fin Bio-Inspired UUV: CFD Studies
 Naval Research Laboratory Washington, DC 20375-5320 NRL/MR/6040--12-9426 Development of a Four-Fin Bio-Inspired UUV: CFD Studies Ravi Ramamurti Jason Geder Laboratory for Propulsion, Energetic, and Dynamic
Preliminary Design Review (PDR) Aerodynamics #2 AAE-451 Aircraft Design
 Aerodynamics #2 AAE-451 Aircraft Design") Preliminary Design Review (PDR) Aerodynamics #2 AAE-451 Aircraft Design Aircraft Geometry (highlight any significant revisions since Aerodynamics PDR #1) Airfoil section for wing, vertical and horizontal
Preliminary Design Review (PDR) Aerodynamics #2 AAE-451 Aircraft Design Aircraft Geometry (highlight any significant revisions since Aerodynamics PDR #1) Airfoil section for wing, vertical and horizontal
Effect of Diameter on the Aerodynamics of Sepaktakraw Balls, A Computational Study
 ISSN 1750-9823 (print) International Journal of Sports Science and Engineering Vol. 03 (2009) No. 01, pp. 017-021 Effect of Diameter on the Aerodynamics of Sepaktakraw Balls, A Computational Study Zahari
Aerodynamic Analyses of Horizontal Axis Wind Turbine By Different Blade Airfoil Using Computer Program
 ISSN : 2250-3021 Aerodynamic Analyses of Horizontal Axis Wind Turbine By Different Blade Airfoil Using Computer Program ARVIND SINGH RATHORE 1, SIRAJ AHMED 2 1 (Department of Mechanical Engineering Maulana
A Study on the Effects of Wind on the Drift Loss of a Cooling Tower
 A Study on the Effects of Wind on the Drift Loss of a Cooling Tower Wanchai Asvapoositkul 1* 1 Department of Mechanical Engineering, Faculty of Engineering, King Mongkut s University of Technology Thonburi
External Tank- Drag Reduction Methods and Flow Analysis
 External Tank- Drag Reduction Methods and Flow Analysis Shaik Mohammed Anis M.Tech Student, MLR Institute of Technology, Hyderabad, India. G. Parthasarathy Associate Professor, MLR Institute of Technology,
AIRFOIL PROFILE OPTIMIZATION OF AN AIR SUCTION EQUIPMENT WITH AN AIR DUCT
 THERMAL SCIENCE, Year 2015, Vol. 19, No. 4, pp. 1217-1222 1217 AIRFOIL PROFILE OPTIMIZATION OF AN AIR SUCTION EQUIPMENT WITH AN AIR DUCT by Li QIU a,b, Rui WANG a,*, Xiao-Dong CHEN b, and De-Peng WANG
ScienceDirect. Investigation of the aerodynamic characteristics of an aerofoil shaped fuselage UAV model
 Available online at www.sciencedirect.com ScienceDirect Procedia Engineering 90 (2014 ) 225 231 10th International Conference on Mechanical Engineering, ICME 2013 Investigation of the aerodynamic characteristics
CFD ANALYSIS OF AIRFOIL SECTIONS
 CFD ANALYSIS OF AIRFOIL SECTIONS Vinayak Chumbre 1, T. Rushikesh 2, Sagar Umatar 3, Shirish M. Kerur 4 1,2,3 Student, Jain College of Engineering, Belagavi, Karnataka, INDIA 4Professor, Dept. of Mechanical
Aircraft Design Prof. A.K Ghosh Department of Aerospace Engineering Indian Institute of Technology, Kanpur
 Aircraft Design Prof. A.K Ghosh Department of Aerospace Engineering Indian Institute of Technology, Kanpur Lecture - 12 Design Considerations: Aerofoil Selection Good morning friends. The last lecture
Experimental Investigation Of Flow Past A Rough Surfaced Cylinder
 (AET- 29th March 214) RESEARCH ARTICLE OPEN ACCESS Experimental Investigation Of Flow Past A Rough Surfaced Cylinder Monalisa Mallick 1, A. Kumar 2 1 (Department of Civil Engineering, National Institute
Dynamic Stall For A Vertical Axis Wind Turbine In A Two-Dimensional Study
 Abstracts of Conference Papers: TSBE EngD Conference, TSBE Centre, University of Reading, Whiteknights, RG6 Dynamic Stall For A Vertical Axis Wind Turbine In A Two-Dimensional Study R. Nobile 1,*, Dr M.
Lift for a Finite Wing. all real wings are finite in span (airfoils are considered as infinite in the span)
") Lift for a Finite Wing all real wings are finite in span (airfoils are considered as infinite in the span) The lift coefficient differs from that of an airfoil because there are strong vortices produced
Lift for a Finite Wing all real wings are finite in span (airfoils are considered as infinite in the span) The lift coefficient differs from that of an airfoil because there are strong vortices produced
Centre for Offshore Renewable Energy Engineering, School of Energy, Environment and Agrifood, Cranfield University, Cranfield, MK43 0AL, UK 2
 Fluid Structure Interaction Modelling of A Novel 10MW Vertical-Axis Wind Turbine Rotor Based on Computational Fluid Dynamics and Finite Element Analysis Lin Wang 1*, Athanasios Kolios 1, Pierre-Luc Delafin
Volume 2, Issue 5, May- 2015, Impact Factor: Structural Analysis of Formula One Racing Car
 Structural Analysis of Formula One Racing Car Triya Nanalal Vadgama 1, Mr. Arpit Patel 2, Dr. Dipali Thakkar 3, Mr. Jignesh Vala 4 Department of Aeronautical Engineering, Sardar Vallabhbhai Patel Institute
POWERED FLIGHT HOVERING FLIGHT
 Once a helicopter leaves the ground, it is acted upon by the four aerodynamic forces. In this chapter, we will examine these forces as they relate to flight maneuvers. POWERED FLIGHT In powered flight
JOURNAL PUBLICATIONS
 1 JOURNAL PUBLICATIONS 71. Lee, T., Mageed, A., Siddiqui, B. and Ko, L.S., (2016) Impact of ground proximity on aerodynamic properties of an unsteady NACA 0012 airfoil, submitted to Journal of Aerospace
Aerodynamic Terms. Angle of attack is the angle between the relative wind and the wing chord line. [Figure 2-2] Leading edge. Upper camber.
![Aerodynamic Terms. Angle of attack is the angle between the relative wind and the wing chord line. [Figure 2-2] Leading edge. Upper camber.](/thumbs/82/86661300.jpg "Aerodynamic Terms. Angle of attack is the angle between the relative wind and the wing chord line. [Figure 2-2] Leading edge. Upper camber.") Chapters 2 and 3 of the Pilot s Handbook of Aeronautical Knowledge (FAA-H-8083-25) apply to powered parachutes and are a prerequisite to reading this book. This chapter will focus on the aerodynamic fundamentals
Chapters 2 and 3 of the Pilot s Handbook of Aeronautical Knowledge (FAA-H-8083-25) apply to powered parachutes and are a prerequisite to reading this book. This chapter will focus on the aerodynamic fundamentals
CFD ANALYSIS OF EFFECT OF FLOW OVER NACA 2412 AIRFOIL THROUGH THE SHEAR STRESS TRANSPORT TURBULENCE MODEL
 CFD ANALYSIS OF EFFECT OF FLOW OVER NACA 2412 AIRFOIL THROUGH THE SHEAR STRESS TRANSPORT TURBULENCE MODEL 1 SHIVANANDA SARKAR, 2SHAHEEN BEG MUGHAL 1,2 Department of Mechanical Engineering, ITM University,