BRS 2008 Preliminary Report 6 October 2008
|
|
|
- Garey Potter
- 5 years ago
- Views:
Transcription
1 BRS 2008 Preliminary Report 6 October 2008 Abstract 1. A behavioral response study took place in the Tongue of the Ocean between 18 August and 5 October The general objective was to conduct playbacks of MFA sonar sounds on odontocete whales, to measure received levels of sound and to use control sounds. There was an emphasis on conducting playbacks on beaked whales. 2. A total of 6 playbacks were conducted on 4 species of odontocete cetacean. This adds to 3 playbacks conducted during In addition, observations were made of odonticetes vocalizations at a group/population level using the AUTEC hydrophone array during playbacks. Underlying habitat mapping also provided an insight in to beaked whales distributions at AUTEC that may be independent of anthropogenic acoustic activity. As in integrated data set, this provides a significant advance in our understanding of the responses of odonticetes, and beaked whales in particular, to MFA. 3. The operations were highly constrained mainly by a succession of tropical storms and hurricanes that threatened the region during the time of the study. This meant that the number of playback achieved was lower than had been expected if weather conditions had been the average for the time of year. 4. The extensive data sets emerging from this study will require to be analyzed in detail. Integrating across the results from both BRS-07 and BRS-08 as well as analyses of likely beaked whale responses to simulated sonar at the group/population level, the emerging pattern of response is as follows: (i) Based upon multi-year photo-identification and habitat mapping, Blainvilles beaked whales are a resident species within the study area and individuals forage within the study area over multiple years. They appear to be able to survive, breed and forage successfully within this habitat in spite of considerable military acoustic sources, including on occasions MFA used at full power. Beaked whale distributions are generally congruent with apparent food availability within the water column. (ii) Beaked whales are sensitive to noise, even at levels well below expected TTS (~160 db re 1 µpa). This sensitivity is manifest by an adaptive movement away from a sound source. BRS observed this response irrespective of the signal transmitted within the band width of mid-frequency active sonars. This suggests that beaked whales may not respond to the specific sound signatures. Rather they may be sensitive to any pulsed sound from a point source in this frequency range. The response to such stimuli appears to involve maximizing the distance from the sound source. 1
2 (iii) The observations from the focal animal studies carried out on beaked whales during BRS are aligned with observations made during BRS of population-level movements of beaked whales that may have occurred in response to BRS activities (but require further analysis), as well as observation carried out by NUWC during sonar exercises in which full power MFA is being used. Overall, it appears that beaked whales move out of the region in which MFA is being used. (iv) Other species appear to be less sensitive to MFA and control sounds than beaked whales. Although reactions to sonar sounds and control sounds were observed in some cases, there was little consistency in the responses and none of these responses suggested a reaction that was hazardous to these species. 5. Scenarios for stranding that could be derived from these results mainly involve situations in which there is inadvertent pursuit of cetaceans because of the movement of vessels operating MFA. Such pursuit could occur as a result of specific bathymetric or oceanographic conditions and could result in magnification of the adaptive reactions observed in BRS. Beaked whales, and to a lesser extent other species, could suffer trauma including many of the pathologies observed in stranded specimens under this scenario. This suggests the most effective mitigation could be to (a) ensure there is an appropriate period of ramp up (possibly over several days) in a region in advance of any use of MFA and (b) to avoid the kind of regions and habitats in which pursuit is possible. 6. An extensive list of recommendations is provided about the conduct of playback experiments on odontocete whales. Experiments on beaked whales require flat-calm conditions but also require the presence of a substantial sound source that needs to be carried by a large vessel. The combination of the inevitable long times spent waiting for appropriate working conditions and the high costs of having a vessel on standby to carry the sound source mean that these experiments are very difficult to conduct. 7. The following report is a preliminary depiction of the results from BRS-08. Its contents need to be considered alongside those of BRS-07. All outputs described here may be subject to modification in due course. 1.0 Introduction This short report describes the preliminary results of a Behavioral Response Study of deep-diving cetaceans carried out in 2008 (BRS-08). The rationale for this study comes from a hypothesis that some types of sonar signals can affect the behavior of some deepdiving odontocete cetaceans, especially beaked whales, and may lead to strandings on some occasions. The study was designed to examine the response of cetaceans to sonar sounds and control sounds. BRS-08 was sponsored by US Navy NAVSEA PEO IWS 5, US Navy Office of Naval Research (ONR), US Navy Environmental Readiness Division, US National Oceanic and 2
3 Atmospheric Administration (National Marine Fisheries Service), and the US Department of Defense Strategic Environmental Research and Development Program (SERDP). The research was conducted under a permit issued by the Bahamian Department of Marine Resources. 1.1 Objectives and achievements The BRS-08 research objectives against achievements are: Pri mary objectives Achievements Increase the sample size of MFA playbacks and controls achieved in 2007 The sample size was increased but not as much as had been hoped Measure the received levels of sonar sound that Achieved produce this response Investigate variation in responses in relation to Achieved: 4 species context and species Include at least one more killer whale playback to examine whether the response of beaked whales might be explained by confusion between sonar signals and killer whale calls Compare responses to MFA sonar signals vs more spread spectrum signal with similar overall bandwidth, duration, and timing Aspiration al objectives Characterize whether and how responses differ between different age/sex/ stages in life cycle/behavioral contexts, and also between different types of sound Begin to build a population-level dose:response relationship that could be used to help predict the probability of inducing a behavioral response that could lead to stranding Examine whether the responses in beaked whales are also present in other species were investigated Not achieved Achieved in some species Not achieved Not achieved Achieved to some extent 2.0 Results 2.1 Nassau port call - 14 September
4 During the visit to Nassau on 14 September, guests from the Bahamian Ministry of Fisheries and the Ministry of Agriculture and Marine Resources, The Bahamian Environment, Science & Technology Commission, The Bahamas National Trust and several other organizations were entertained on Revelle. Representatives of the US Embassy were also present. Conducted tours were provided of the ship for a total of 48 visitors 2.2 Waveform and source transmission summary Summary of operations: The Acoustic source performed all requested transmissions upon request, no exceptions. Deployment of the source was to approximately 25 and 65 meters depending on species and water conditions. Source level output has met target output levels. Recordings of the source hydrophone, amplifier drive voltage and current are stored in BRS 08 data archives Transmitted waveforms Two waveforms were transmitted, a mid-frequency sonar signal, BRS_MFA-1 and BRS_PRN-1, a signal of the same time and bandwidth as MFA-1 that contained random noise. Both waveforms were 1.4 seconds in duration and were repeated every 25 seconds. The BRS_MFA1 waveform was also transmitted in BRS Summary of playback events There have been 9 playbacks on animals in total, 5 of BRS_PRN1 and 4 of BRS_MFA1. For each sequence of transmissions, a full ramp up sequence was performed starting at 160 db through maximum target source level of 211 db, increasing 3 db every 25 seconds and continuing transmissions for approximately 5 minutes at full power for a shallow source depth. When source was deployed deep, transmissions were ceased when chief scientist called for stop transmission. Table 2.1 summarizes each event and species. Data sheets showing the transmission time and source location and depth are in appendix B. Date Waveform Sequence Tagged Species Rampup # xmn Max SL #xmn Source depth (m) 22-Sep PRN 1 Short finned pilot whale MFA 1 Short finned pilot whale Comments 1 transmission missed duing ramp up, lost tag lost tag (same animal as above) 4
5 26-Sep PRN 1 False killer whale MFA 1 False killer whale Sep PRN 1 Blaineville's beaked whale Sep MFA 1 False killer whale PRN 1 False killer whale Sep PRN 1 Short finned pilot whale MFA 1 Short finned pilot whale Melon headed whale Stopped playback when M3R notified that whale stopped clicking Source was towed at 0.5kts during transmission 2nd tagged whale, same playback Table 2.1 Summary of BRS 08 playbacks 2.3 Playback events This section summarizes visual observations, Dtag recordings and track/focal follow geometries for each playback event. For those events when a tag was on and no playback occurred (tag fell off too soon), the summary of the tag data is found in appendix C Short finned pilot whale - 22 September (playback/tag not retrieved) Visual Observer notes September 22, 2008: Playback on group of Short-finned Pilot Whales, Globicephala macrorhynchus. Premitigation started at 20:58 GMT. Behavior of pilot whales consisted of slow travel to the southeast. Two cow/calf pairs were observed as well as at least 2 adult males. D-tag was placed on dorsal fin of an adult male. The group was scattered over a large area of several hundred square meters and exhibited typical pilot whale behavior, consisting of slow travel, periods of logging at the surface, and making shallow dives. No other species of cetaceans were observed in the immediate area of the pilot whales. Playback began at 21:31 and lasted till 21:43. Sound put into the water was PRN-1. At the beginning of the playback whales were split into two groups, one 1,365 meters from the Roger Revelle and the other 591 meters. The adult male with the D-tag was in the group 1,365 meters from the vessel. During the duration of the playback no obvious reaction to the source playback was observed by the visual team for either group of pilot whales. It was noted that the group increased their rate of travel slightly. Whether this was a result of the playback or not is debatable. 5
6 A second playback from the source was conducted at 21:48 using MFA-1. The closest group of whales 949 meters from the vessel immediately began to increase their rate of travel to the southeast towards the other group of pilot whales 1,855 meters from the Roger Revelle and ceased making shallow dives. Transmission of second playback ended at 21:59. Whales continued their travel to the southeast and a steady speed of 3-4 knots. Other than increased rate of travel, no obvious reactions to the source were observed the visual team using 25x bigeye binoculars. During both playbacks the average Beaufort was 5 with reasonable viewing conditions for pilot whales. Post mitigation began at 21:59 and ended at 22:59. The two groups of pilot whales came together and continued on a southeast direction into the southern part of the range. As the groups came together, the signal from the D-tag became faint, possibly due to the tag slipping lower on the body of the whale or perhaps because the tag was damaged by another whale. This tag was not recovered. No other species of cetaceans were observed during the two playback experiments and post mitigation No Dtag data were analyzed as the tag was not retrieved Figure 2.3 shows the track geometry for the Revelle & RHIB, sighting data and source deployment locations for 22 September. 6
7 Figure 2.3 7
8 2.3.2 False killer whale - 26 September Visual Observer notes September 26, 2008: Playback on group of 12 false killer whales, Pseudorca crassidens. Premitigation on this group of false killer whales began at 14:08 GMT even though the Revelle and zodiac had been conducting at focal follow on the group since 11:38. Group consisted of 2 cow/calf pairs and at least one adult male as well as many animals of undetermined age and sex. Group was scattered with animals separated by several hundred meters and steadily moving in a southerly direction at a speed of 3 knots. The group s greatest distance from the vessel was 1,800 meters and closest distance was 680 meters. Playback began at 15:07 and was a PRN-1. Whales were 1,495 meters from the vessel and scattered over several hundred meters. As soon as sound was placed into the water, the whales made a shallow dive and grouped together and began to increase their rate of travel to greater than 3-4 knots. First playback ceased at 15: 20. Whales continued moving in a southerly direction at 4 plus knots. No other species of cetaceans were observed in the immediate area during the playback. Post mitigation started at 15:20. Whales slowed their speed somewhat but remained grouped together. No other species of cetaceans were observed in the area. A second playback began at 16:53 using MFA-1. Whales were grouped together at 1,010 meters from the Revelle. Whales slowed their rate of travel. Source was at full power at 17:00. At that time, whales had obviously increased their rate of travel. Zodiac in the water near the whales reported swimming speeds at greater than 8 knots. Playback ended at 17:05 with the whales 1,242 meters from the vessel. No other species were observed in the immediate area. Post mitigation of the second playback began at 17:05 and ended at 18:05. The false killer whales continued swimming at speed away from the Revelle. Due to increased rate of travel from the whales, the D-tag came off the animal at 17:19. It was determined from the zodiac (Diane s team) and the visual observers that the pseudorcas had an obvious reaction to the playback. No other species of cetaceans were observed during the post mitigation time frame. Throughout the entire day, average Beaufort was 3 and viewing conditions were good Pc08_270a Quick Look Analysis (Pseudorca crassidens, MFA and PRN playback on 26 September 2008) Complete summary is contained in appendix C2 8
9 DIVE PROFILE Notes: the deepest dive (to about 50 m) happened while the animals were very close to the Revelle and the Revelle was operating her bow thrusters. The tagged animal was silent during the dive and non-focal whistles and clicks were not noted either. Figure 2.4 9
10 Figure 2.5 Figure 2.6 DIVE PROFILES WITH RECEIVED LEVELS 10
11 Notes: for the color-line plot, the RL of each emission is plotted on the dive profile from the time the sound was received until the beginning of the next received sound. (If the RL color is plotted only for the 1.4 second duration of the sound, it is very hard to see on the figure). Zooming in on the PRN exposure: Figure
12 Zooming in on the MFA exposure: Figure 2.8 Figure
13 Figure2.10 shows the track geometry for the Revelle & RHIB, sighting data and source deployment locations for 26 September. Figure
14 2.3.3 Blainesville s beaked whale - 27 September Visual Observer notes September 27, 2008-Playback on 3 dense beaked whales, Mesoplodon densirostris Premitigation began at 17:53 GMT. Viewing conditions were excellent with Beaufort 1 conditions. Whales were exhibiting typical beaked whale behavior with an average of 3 shallow dives followed by a deep dive. Whales showed no change in behavior at the surface. Playback began at 18:42 with whales 692 meters from the Revelle. Playback commenced while the whales were doing a deep dive. The sound placed in water was PRN-1. Playback ended at 19:01. Post mitigation began at 19:02 for one hour. It was noted during playback sequence that 2 sport fishing vessels were within a half mile of the diving beaked whales. Tag came off beaked whale at 19:37. No visuals were made of the whales upon returning from their terminal dive. At 19:42 we sighted a group of two beaked whales that may have been the same animals as during the playback experiment 2,375 meters from the Revelle. Animals showed typical beaked whale behavior at the surface with shallow dives, slow travel, and steady direction of travel. During the events throughout the day, no others species of cetaceans were observed in immediate area Md08_271a Quick Look Analysis 14
15 DIVE PROFILE Figure 2.11 PRN Exposure Received Levels Notes: All RLs were calculated after application of a bandpass filter between 2-5 khz 2. Level determination was as follows: Peak level highest sound pressure level during the analyzed portion of the PRN sound Envelope peak level highest level observed in the complex envelope of the signal was calculated, after envelope was filtered with a low-pass filter 3. This is a non-conventional level measurement. It was calculated to give some idea of the peak level of the PRN signal NOT including spikes that sometimes occur in the waveform. 2 4 th order Butterworth filter (applied back and forward in matlab with the filtfilt command for effective 8 th order) 3 2nd order (but applied back and forward with the matlab command filtfilt for effective 4th order) Chebyshev type 1 filter, lowpass, 200Hz cutoff frequency, 0.5 db ripple in pass band 15
16 RMS level root of the mean squared sound pressure level in the analysis window The analysis window began and ended at the start and end of the first arrival of the PRN signal where possible. Where the PRN signal overlapped with beaked whale clicks, a shorter window (as long as possible without including any whale clicks) was used. Figure 2.12 DIVE PROFILES WITH RECEIVED LEVELS Notes: for the color-line plot, the RL of each emission is plotted on the dive profile from the time the sound was received until the beginning of the next received sound. (If the RL color is plotted only for the 1.4-second duration of the sound, it is very hard to see on the figure). Zooming in: 16
17 Figure 2.13 Figure
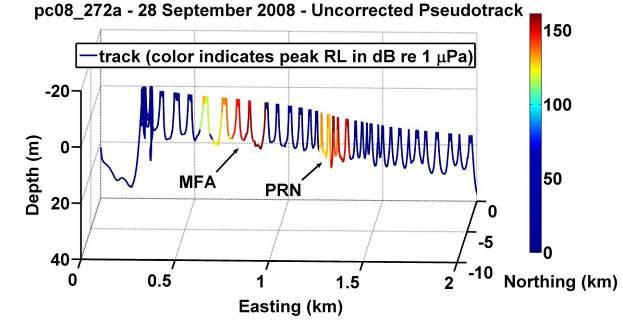
18 Figure 2.15 shows the track geometry for the Revelle & RHIB, sighting data and source deployment locations for 27 September. Figure False killer whale 28 September Visual Observer notes September 28, 2008-Playback on group of 12 false killer whales, Pseudorca crassidens Official premitigation began at 20:27 GMT with the same group of false killer whales from September 26. During this time whales were 482 meters from the vessel and traveling at a steady rate of speed. Some came over to bowride the Revelle. Playback began at 21:30 with MFA-1. At this time whales were 1,254 meters scattered into two small sub-groups. Group seemed to speed up, but reaction did not appear as strong as Sept. 26. Playback ended at 21:44 with the whales 2,452 meters from the vessel. 18
19 A second playback using PRN-1 was conducted at 21:59 with the whales 3,679 meters from the vessel. Whales again increased their swimming and moving in a direction away from the Revelle. Playback ended at 22:11 with the whales 4,682 meters from the vessel. Post mitigation started at 22:11 and ended at 23:10. Whales continued on their original course at the same speed. During the entire mitigation and playback periods, no other species were observed in the immediate area despite good viewing conditions of Beaufort Pc08_272a Quick Look Analysis False killer whale Pseudorca crassidens, tagged September 28, 2008 Complete summary is contained in appendix C4 DIVE PROFILE Figure
20 MFA & PRN Exposure Received Levels Notes: All RLs were calculated after application of a bandpass filter between 2-5 khz 4. Level determination was as follows: Peak level highest sound pressure level during the analyzed portion of the PRN sound Envelope peak level highest level observed in the complex envelope of the signal was calculated, after envelope was filtered with a low-pass filter 5. This is a non-conventional level measurement. It was calculated to give some idea of the peak level of the PRN signal NOT including spikes that sometimes occur in the waveform. RMS level root of the mean squared sound pressure level in the analysis window RMS noise level root of the mean squared sound pressure level in a one-second window slightly before the exposure. Window selected to have background noise approximately like that in the analysis window, and to exclude loud animal sounds. This measurement is given to indicate the signal-to-noise ratio of the received transmission (some are barely audible over background noise). The analysis window began and ended at the start and end of the first arrival of the PRN/MFA signal where possible. Where the PRN/MFA signal overlapped with highamplitude sounds, a shorter window (as long as possible without including any whale sounds or splashes) was used. 4 4 th order Butterworth filter (applied back and forward in matlab with the filtfilt command for effective 8 th order) 5 2nd order (but applied back and forward with the matlab command filtfilt for effective 4th order) Chebyshev type 1 filter, lowpass, 200Hz cutoff frequency, 0.5 db ripple in pass band 20

21 Figure 2.17 Figure
22 DIVE PROFILES WITH RECEIVED LEVELS Notes: for the color-line plot, the RL of each transmission is plotted on the dive profile from the time the sound was received until the beginning of the next received sound. (If the RL color is plotted only for the 1.4-second duration of the sound, it is very hard to see on the figure). Zooming in: Figure
23 Figure 2.20 ACOUSTIC DATA OBSERVATIONS The animal (and/or others in its group) may have vocalized in response to, or in imitation of, the MFA sound. Vocalizations began during the second half of the MFA sound on >50% of occasions (about 16 of the 30 exposures), and the vocalizations often seem to mimic the frequency modulation of the MFA sound in some way. There was no indication that the same apparent responses happened during the PRN exposure, but this needs to be checked systematically. The spectrograms below show two examples. The animals were whistling frequently throughout the exposure, so the overlap of animal whistles with the MFA sound may be just coincidence, but the possibility that the animals are responding vocally to the sonar sound should be investigated further. 23

24 MFA sound MFA sound Figure Figure shows the track geometry for the Revelle & RHIB, sighting data and source deployment locations for 28 September. 24
25 Figure
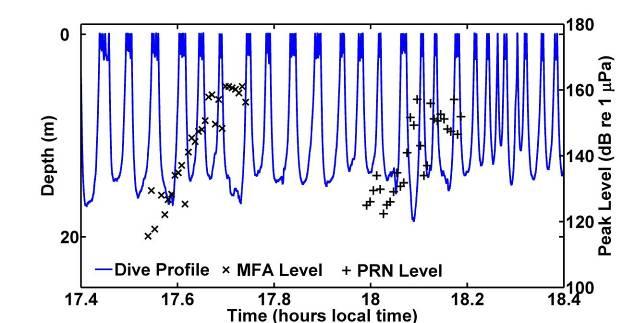
26 2.3.5 Short finned pilot whale - 29 September Visual Observer notes September 29, 2008-Playback on group of 12 short-finned pilot whales, Globicephala macrorhynhus and 100 melon-headed whales, Peponocephala electra. Pre-mitigation for a group of loosely scattered pilot whales began at 14:22 GMT when tag was placed on an adult male pilot whale. Whales were dispersed and moving to the northwest at a steady rate of 3 knots at around 1,495 meters from the vessel. At 15:37 visual team detected a group of 100+ melon headed whales 2,100 meters from the Reville, well south (greater than 2 miles) of the group of pilot whales. The melon headed whales were traveling at speed towards the east making numerous leaps and spyhops. Decision was made to proceed with playback experiment with both pilot whales and melon headed whales in sight. Playback began at 15:43 with the PRN-1. Melon-headed whales were located 1,800 meters from the Reville while the pilot whales were located 1,655 meters from the Reville. Playback ended at 15:50. No strong reaction was observed with the pilot whales but a pretty strong reaction was observed for the melon headed whales. At the beginning of the playback sequence the melon headed whales were traveling fast thru the water on an easterly course and several individuals began to breach. As playback continued the group of melon headed whales slowed their speed through the water and became more tightly packed. During the peak in the first playback, the whales switched their direction of travel by 180 degrees and came to a complete stop in the water column logging at the surface very close together. Playback ended at 15:50. Viewing conditions during the playback were good with an average Beaufort 3 to 4 seas. Post mitigation began at 15:50 and continued for over one hour. The pilot whales were far away from the Reville and viewing of the whales behavior were made by Diane s group on the zodiac near the whales. The melon headed whales continued to travel slow and exhibited social behavior at the surface such as lobtailing and spyhopping. A second playback was conducted at 17:38 GMT with MFA-1. The melon-headed whales were 2,822 meters from the vessel. The zodiac was with the pilot whales and the visual observers could not see the pilot whales from Reville s position. The playback ended at 17:50. Unfortunately, both the pilot whales and melon headed whales were too far from the vessel to determine any behavior change. Post mitigation began at 17:50 and continued for one hour ending at 18:50. Melon headed whales were relocated. Whales were slow traveling and being very social at the surface with lots of breaches, spyhops, and tail lobbing. The pilot whales were not seen again by the visual team though they were being followed by the zodiac until the tag came off. No other species of cetaceans were observed during mitigation or playback. 26
 Complete summary is contained in appendix C6. DIVE PROFILE. Figure 2.23 27")
27 Gm08_273b Quick Look Analysis Pilot whale 273a analysis is contained in appendix C5. There was no playback as the tag remained on for only a short time. (Pilot whale Globicephala macrorhynchus, MFA and PRN playback on 29 September 2008) Complete summary is contained in appendix C6. DIVE PROFILE. Figure
28 PRN and MFA Sonar Exposure Received Levels Notes: The tagged whale was at the surface a lot, and so surface splashing sometimes interfered with the sound exposure. In those cases the background noise level on the tag was very high and the reported exposure level numbers probably do not mean very much (splashing was making as much noise as the exposure, if not more). All RLs were calculated after application of a bandpass filter between 2-5 khz 6. Level determination was as follows: Peak level highest sound pressure level during the analyzed portion of the PRN sound Envelope peak level highest level observed in the complex envelope of the signal was calculated, after envelope was filtered with a low-pass filter 7. This is a non-conventional level measurement. It was calculated to give some idea of the peak level of the PRN signal NOT including spikes that sometimes occur in the waveform. RMS level root of the mean squared sound pressure level in the analysis window RMS noise level root of the mean squared sound pressure level in a one-second window slightly before the exposure. Window selected to have background noise approximately like that in the analysis window, and to exclude loud animal sounds. This measurement is given to indicate the signal-to-noise ratio of the received transmission (some are barely audible over background noise). The analysis window began and ended at the start and end of the first arrival of the PRN/MFA signal where possible. Where the PRN/MFA signal overlapped with highamplitude sounds, a shorter window (as long as possible without including any whale sounds or splashes) was used. 6 4 th order Butterworth filter (applied back and forward in matlab with the filtfilt command for effective 8 th order) 7 2nd order (but applied back and forward with the matlab command filtfilt for effective 4th order) Chebyshev type 1 filter, lowpass, 200Hz cutoff frequency, 0.5 db ripple in pass band 28

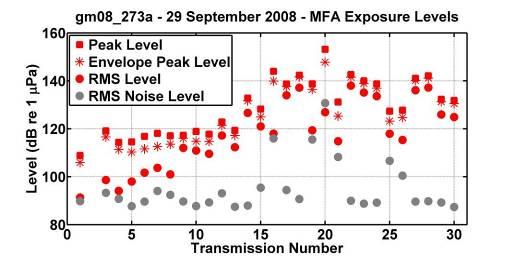
29 Figure 2.24 Figure
. Zooming in on the PRN exposure: Figure 2.")
30 Dive Profiles with Received Levels Notes: for the color-line plot, the RL of each emission was plotted on the dive profile from the time the sound was received until the beginning of the next received sound. (If the RL color was plotted only for the 1.4-second duration of the sound, it was very hard to see on the figure). Zooming in on the PRN exposure: Figure
31 Zooming in on the MFA exposure: Figure

32 Figure Figure 2.29 shows the track geometry for the Revelle & RHIB, sighting data and source deployment locations for 29 September. 32
33 Figure Melon headed whale - 29 September 33
34 See section above Pe08_273a tag was only on for about 15 minutes. There was no playback during this time. Complete summary is contained in appendix C Pe08_273b Quick Look Analysis Complete summary is contained in appendix C7. (Melon-headed whale Peponcephala electra, MFA playback on 29 September 2008) DIVE PROFILE Figure
35 PRN and MFA Sonar Exposure Received Levels Notes: All RLs were calculated after application of a bandpass filter between 2-5 khz 8. Level determination was as follows: Peak level highest sound pressure level during the analyzed portion of the PRN sound Envelope peak level highest level observed in the complex envelope of the signal was calculated, after envelope was filtered with a low-pass filter 9. This is a non-conventional level measurement. It was calculated to give some idea of the peak level of the PRN signal NOT including spikes that sometimes occur in the waveform. RMS level root of the mean squared sound pressure level in the analysis window RMS noise level root of the mean squared sound pressure level in a one-second window slightly before the exposure. Window selected to have background noise approximately like that in the analysis window, and to exclude loud animal sounds. This measurement is given to indicate the signal-to-noise ratio of the received transmission (some are barely audible over background noise). The analysis window began and ended at the start and end of the first arrival of the PRN/MFA signal where possible. Where the PRN/MFA signal overlapped with highamplitude sounds, a shorter window (as long as possible without including any whale sounds or splashes) was used. 8 4 th order Butterworth filter (applied back and forward in matlab with the filtfilt command for effective 8 th order) 9 2nd order (but applied back and forward with the matlab command filtfilt for effective 4th order) Chebyshev type 1 filter, lowpass, 200Hz cutoff frequency, 0.5 db ripple in pass band 35

36 Figure 2.31 DIVE PROFILES WITH RECEIVED LEVELS Notes: for the color-line plot, the RL of each emission is plotted on the dive profile from the time the sound was received until the beginning of the next received sound. (If the RL color is plotted only for the 1.4 -second duration of the sound, it is very hard to see on the figure). Zooming in: Figure

37 Figure The track geometry for this event can be found in Figure 2.34 above.. 37
38 2.4 Preliminary Report on Photo-Identification during BRS-08 Blainville s beaked whales (Mesoplodon densirostris) Photographic data was collected during 13 encounters with M. densirostris during BRS- 08. A total of 27 individuals were identified, including 10 resightings from previous years. The rate of discovery graph (Figure 1) shows that new animals continue to be sighted as field efforts continue No. of "new" whales identified Total no. whales identified Figure Rate of discovery graph for M. densirostris in Tongue of the Ocean. Although the majority of animals have only been seen in one year, some individuals have demonstrated long-term site fidelity (Figure 2). It should be noted that these figures represent data from the entire basin and not just on Weapons Ranges North and South. 60 No. of whales No. of years Figure The number of years that individual M. densirostris have been sighted in Tongue of the Ocean. 38
39 One of the re-sightings was Md540 which was the focal animal for the playback during BRS-07, demonstrating that this animal has remained in the area post-playback. The playback whale this year was a sub-adult male, and had not been previously sighted. Other species Photographic data was collected for five additional species during BRS-08 and has provided some preliminary insight into their short-term residency patterns on the Weapons Ranges. Four different groups of short-finned pilot whales (Globicephala macrorhynchus) were found, and one group was re-sighted 4 days after the initial sighting. Fortunately, this group included the animal that was tagged and the tag not retrieved, and during the second sighting we were able to find this individual and confirm that the tag was no longer attached to the whale. Further analysis is needed to compare groups photographed during BRS-08 with previous years to assess longer term residency to TOTO. Individual photo-identifications taken of a group of false killer whales (Pseudorca crassidens) allowed us to confirm that this group of 13 animals remained on the Weapons Ranges for at least 3 days. Notably, this represents the first record of occurrence for this species in TOTO (the only other record for the Bahamas is of an emaciated animal seen on Little Bahama Bank). Other species that were photographed but only seen once during BRS-08 include pantropical spotted dolphins (Stenella attenuata), sperm whales (Physeter macrocephalus), and melon-headed whales (Peponocephala electra). Individual identifications will be compared with the photographic catalogue compiled by the BMMRO for TOTO and elsewhere in the Bahamas. 39

40 2.5 Total track lines covered by the RV Roger Revelle during BRS 08 Figure 2.36 Total track covered by the Roger Revelle during BRS 08 40

41 Figure 2.37 Total track covered by the Roger Revelle in AUTEC during BRS 08 41

42 2.6 Environmental summary XBT/CTD data Figure 2.38 below shows the locations of the XBT/CTD data collected from the Revelle while at AUTEC. 42
43 Figure 2.38 Location of XBT (green) and CTD (orange) stations during BRS Sound Velocity Profiles R/V Revelle Depth (m) Sep-08 XBT 16-Sep-08 XBT 17-Sep-08 CTD 19-Sep-08 CTD 20-Sep-08 CTD 21-Sep-08 CTD 22-Sep-08 XBT 23-Sep-08 XBT 24-Sep-08 CTD 26-Sep-08 XBT 27-Sep-08 XBT 28-Sep-08 XBT 28-Sep-08 CTD 29-Sep-08 XBT 30-Sep-08 XBT Sound Velocity (m/s) Figure 2.39 Calculated sound velocity for all the stations shown in figure
44 2.6.2 Wind data The wind measured at AUTEC site 1 is shown below for the duration of the cruise. AUTEC Site 1 Wind wind 25 Wind Speed (knots) Aug 25-Aug 28-Aug 31-Aug 3-Sep 6-Sep 9-Sep 12-Sep 15-Sep 18-Sep 21-Sep 24-Sep 27-Sep 30-Sep Date/Time (GMT) Figure 2.40 AUTEC wind at site 1 during BRS 08 44
45 A comparison of the wind speeds at AUTEC site 1 for the August-September time frame 2007 and 2008 is shown below, with trend lines. AUTEC Site 1 Wind wind 2008 wind Poly. (2008 wind) Poly. (2007 wind) 25 Wind Speed (knots) Aug 11-Aug 21-Aug 31-Aug 10-Sep 20-Sep 30-Sep Date/Time (GMT) Figure 2.41 Comparison of August/September wind at AUTEC site 1 for 2007 and

46 Figure 2.42 Hurricane tracks during BRS 08 46

47 2.7 Lost tag from 22 September pilot whale tag Both ship and aerial surveys were conducted to find the tag that was deployed on 22 September. Shown in figure 2.14 below are the tracks and area covered. It was estimated that the area covered by the radio tracker is about +/- 10nm around the track line. Figure 2.43 Ship and aerial surveys for tag lost on 22 September. 47

48 2.8 Data archiving file structure 48
49 2.9 Synopsis of M3R-DryLab activities, 19 August 2 October 2008 The M3R-DryLab acoustic team consisted of a core of five to six people; four acoustic analysts manning three bioacoustics workstations and two acoustic engineerprogrammers operating the acoustic data acquisition systems. For all daytime periods of BRS08 operations, there were two acoustics analysts and one acoustic engineerprogrammer on watch. Two workstations operated the MMAMMAL software to provide continuous, real-time binary spectrograms designed to highlight the occurrence of beaked whales. The third workstation operated the Raven software and provided a way to observe (as a full bandwidth spectrogram etc.), listen to and record any channel of realtime M3R data. The primary functions of this acoustic team working out of the M3R-DryLab were to: 1. Use and maintain Alesis drives operating in the In-water room in the Command and Control Building (CCB) to collect real-time, continuous acoustic waveform data coming in from the network of M3R hydrophones (n = 93, and we refer to the area covered by this network of hydrophones as the range ). 2. Use the bioacoustics workstations and software tools operating in the Drylab (in a building next to the CCB) to monitor the bioacoustics workstations and analyze in-coming M3R acoustic data for marine mammals, with a particular focus on Baird s beaked whale. 3. Identify, locate and track the occurrences, movements and distributions of marine mammals throughout the range. 4. Report the information on marine mammals to the Chief Scientist on the R/V Revelle in as concise and timely a manner as possible. 5. Annotate and record marine mammal occurrences, movements and distributions into daily logs. 6. Collect representative samples of marine mammal sounds. 7. Make full copies of Alesis data collected in the In-water room for later postprocessing. 8. Assist in the collection and evaluation of acoustic data during tests and playback operations of the sound source. The acoustic team successfully accomplished all these tasks. The DryLab was set up on Tuesday 19 August 2008 and was operating by 21 August in anticipation of the shakedown. The full Drylab effort was terminated at 21:10Z (17:10L) on 1 October, but Alesis tape back-up continued through 4 October (Saturday) after completion of the field effort. 49
50 The acoustic team quickly became efficient and accomplished at using the M3R data and analytical tools to identify, locate and track the occurrences, movements and distributions of marine mammals throughout the range, and at communicating the necessary information to the visual observers working on the Revelle and RHIB. This effort was significantly enhanced by gaining feedback from the superb visual observers working on the Revelle and RHIB. The following is a brief overview, some specifics and some examples of the M3R- DryLab acoustic team s observations and accomplishments. Daily acoustic watch started at 09:00Z (05:00L) and typically ended after sunset, around 22:00Z (18:00L), but post-daily-ops work would continue for several more hours. Despite the often horrendous weather conditions we collected annotated data for many hundred of beaked whale dives. An example of some M3R dive date are shown in Figure Figure Daily average duration of Baird s beaked acoustics during foraging dives, 21 September through 1 October 2008 as collected by M3R-DryLab acoustic team. This is the period in which four playbacks were conducted on four consecutive days to five tagged whales (pilot, false killer, melon-headed and Baird s beaked whales). 50


51 Figure Example of single PRN transmission on M3R hydrophone H49 during 27 September playback to Blaibville s beaked whale. Notice the tonal line just above 3 khz and below PRN signal. Figure Sequence of 20 PRN transmissions as received on M3R hydrophone H49 during playback to Baird s beaked whale on 27 September Notice the tonal line of acoustic energy around 3.1 khz and below PRN signal. 51
52 Figure Relative received levels of the 20 PRN transmissions as received on M3R hydrophone 49 (H49) during playback to Baird s beaked on 27 September Received levels of PRN signal are corrected for ambient noise in the signal s frequency band. Note that the excellent match in incremental steps in the measured received level (3.1 db per step) to the expected incremental step of 3.0 db. 52

53 2.10 Prey mapping summary Figures 2.48 and 2.49 show the tracks that were used during the prey mapping activity. In Figure 2.48 the acoustic biomass is shown on its own and in 2.49 the acoustic biomass measurements are overlain with the diffusivity measurements. Figure

54 Figure
55 3.0 Lessons learned Summary BRS set out to tag and carry out multiple playbacks on beaked whales and other toothed whales. This objective was only partly achieved. There are many reasons why the BRS project did not meet all its targets in These include (1) unrealistic expectations during the planning phase that was based upon a flawed approach to risk evaluation; (2) severe weather that resulted in evacuation of the science group from the operating region and that affected about one-third of the time available; (3) chronic high wind speeds that were well above the expected mean for the time of year and (4) incompatibility of BRS activities with those of the AUTEC Weapons Range. All these factors accumulated to constrain BRS from achieving its goals, some of which had been set unrealistically high from the start. Factors that did not significantly constrain the achievements included (1) the operational capability of the R/V Revelle; (2) the logistic support provided by AUTEC; (3) the operations of the various BRS teams including M3R, tagging, visual observation, sound source and the search and focal follow RHIB. All these operated sufficiently well that they were individually not an obstacle to progress. GENERAL OPERATIONAL PROCEDURES Overall, the general operational procedures involving multiple platforms worked well. Many of the recommendations given below have to be tempered against the absolute need for calm weather conditions for BRS to operate successfully. None of these recommendations take precedence over finding appropriate weather conditions to tag beaked whales. A few (especially those involving Range access) will help to increase opportunities but most are of secondary or tertiary importance compared with the necessity of achieving this objective. No opportunities for tagging beaked whales were lost during BRS-08 because of operational non-readiness. All loss of opportunity was caused by weather, Range access or a combination of these two factors. Issues that arose and need to be considered in future planning include: (i) A plan for the day was produced at around 20.00L in advance of commencing daily operations and this was circulated to all parts of the operation including AUTEC, M3R, Ship s Master, Bridge and it was also posted on the science deck. It was also usually backed up with a team leader meeting on R/V Revelle and a radio call with M3R. The plan took account of the daily waterspace assignment. Missing from this mix was a daily scheduled discussion with AUTEC. Although the CS was available for this, from the beginning it was often difficult to raise AUTEC support to ensure this happened. Recommendation: The Chief Scientist needs to have a daily briefing with AUTEC 55
56 (ii) The daily plan was activated and modified based upon a briefing carried out at that considered current and forecast weather as well as any other constraints. However, in almost no case was the agreed daily plan carried through in the manner agreed at This was because circumstances always changed in unpredicted ways (e.g. weather calmed down). Some post-hoc recommendations suggest that it may be sensible to develop an operational analysis decision matrix. Unfortunately, the short-term nature of the changes in circumstances would have made any such matrix non-functional. In the event, no opportunities for tagging were lost because of loss of operational readiness beyond those imposed by weather and Range access. Recommendation: Maximum flexibility needs to be maintained throughout in order to ensure all opportunities for tagging can be exploited. (iii) Since BRS bring together many groups who have non-standard training, procedures for referencing distance and bearing need to be standardised as much as possible. Recommendation: Future BRS should provide early training in standardised procedures for referencing range and bearing. (iv) When track whales under the guidance of M3R the R/V/ Revelle and the RHIB used a maximum likelihood search pattern given the constraints of visibility dictated by weather, angle of sun and estimated probability of whale locations. A creeping box search pattern was used that moved in the expected direction of movement and this was maintained until other operational constraints (e.g. nightfall, weather deterioration) meant that the optimal solution was to move elsewhere, abandon searching for the day or to employ the ship time to undertake other essential actions, including personnel transfer or RHIB re-fuel. M3R was operating within a closed room with no feel for the operational environment. Sometimes the underlying process and thinking for operational decisions was not transmitted to M3R and more could have been done to share the operational environment with M3R. Recommendation: The Chief Scientist needs to make a greater effort to keep M3R operations informed about why decisions are being made. R/V ROGER REVELLE The philosophy behind using R/V Revelle was to try and ensure that BRS consolidated its operations on a single, movable platform to take full advantage of short periods of clement weather that could be used for observing and tagging whales. The ship used in BRS performed well. The crew and the vessel were well-suited to the task and there was a high level of commitment to the cruise from the crew. Accommodation was generally very good but there was a significant issue with some of the for ard accommodation because of high noise levels from the bow thrusters. The Research Technicians and the crew were helpful and sympathetic when dealing with the few technical issues that did arise and were open to finding solutions which were usually successful. Regulations did not permit R/V Revelle to carry sufficient fuel to support small boat operations at the scale used in this study. A disadvantage of using a ship like R/V Revelle is that the high 56
57 running costs and long down-time meaning that there was significant pressure to sweat the asset. Recommendation: If a ship like R/V Roger Revelle is to be used in future on BRS or similar studies that are highly constrained by weather, it would be an advantage to include several additional research projects that could be pursued during the long time periods when the ship could not be directed on to its primary mission. AUTEC Liaison between BRS and AUTEC was through two Test Coordinators who provided continuous support throughout the duration of the study. In general, these individuals were very supportive and did what they could to help BRS through logistic support via Site 1 at AUTEC (transfer of personnel, mail deliveries, fuel supply for the RHIB etc). Accommodation for shore-based activities was appropriate and fit-for purpose. However, there was an inconsistent approach taken by the two coordinators to communications; waterspace allocations often only arrived with a few hours advanced notice and no consideration was given to BRS requests for waterspace access, e.g. if the weather forecast was particularly good. Until week 4, there was no apparent BRS input to AUTEC waterspace planning meetings. After this time, a BRS representative was able to attend these meetings to provide planning support. Recommendation: BRS needs to be fully represented as a Range Participant at the AUTEC waterspace planning meetings. RANGE ACCESS The greatest problem experienced when working with in the Tongue of the Ocean concerned the waterspace assignments for BRS. The whole of the Tongue of the Ocean is divided up in to 21 areas and these are used by AUTEC to manage the assets using different parts of the Range. BRS could normally only be fully operational in those regions that coincided with the underwater hydrophone array (see M3R below), which comprises only 4½ of the 21 areas within the Range. There was clearly a misunderstanding on both sides about how BRS could, and could not, operate over the Range. (i) For significant periods of time AUTEC allocated water space to BRS that was outside the region of the Range hydrophones or that gave very limited spatial access to the hydrophone array. These allocations were, in effect, useless. (ii) Waterspace was often allocated with restrictions on the ability to tag whales and use equipment. This also amounted to shutting down BRS. (iii) On the occasions when BRS chose to leave the Range in an effort to reduce conflicts, this presented difficulties for AUTEC and there were times when BRS could not re-access the range to use the waterspace allocated because it did not have permission to transit through areas to reach its allocated waterspace. (iv) On some occasions the decisions about allocation of waterspace, especially for transit on a non-interference basis were nonsensical. For example, the R/V Revelle was 57
58 unable to navigate in ways that other commercial shipping was able to do. There also appeared to be inconsistencies in decisions made in the past with respect to the use of some of the BRS assets. In conclusion, BRS had expectations about what the AUTEC Range could provide in terms of access to its capabilities that were unrealistically high and AUTEC s rigid system of waterspace allocation led to loss of opportunity. In the early stages, it was apparent that BRS was given a low priority status and was fitted in between other Range participants. Some participants had booked the whole of the Range, even though it was apparent that they probably did not need to do this. BRS had never been given an opportunity to book time on the Range. Recommendation: BRS needs to have pre-arranged access to the Range. This needs to be sufficiently flexible to allow BRS to operate on the range during the few days when weather conditions are appropriate. Some additional detailed recommendations are: (i) Any future behavioral response studies conducted on navy ranges should have dedicated range time. (ii) Range personnel to use EMATT (Expendable Mobile Acoustic Training Target) when ever possible for fleet training sessions when BRS personnel and equipment are sharing the range with fleet assets. (iii) If a Target MK 30 must be used instead of an EMATT, propagation data shall be monitored to immediately determine the realistic potential classification of any data recorded by tagged whales. (iv) Periods of acoustic restrictions will likely exist during any future BRS surveys. The BRS test plan should have alternative testing and monitoring that con be accomplished during these specific periods. (v) Fleet training sessions will have built-in flexibility to modify their schedule should a period of excellent weather develop that optimizes beaked whale tagging. D-TAGS The D-tags, supplied by Woods Hole Institution of Oceanography (WHOI), are excellent instruments that operate with a high degree of reliability. They provide a substantial amount of the information sought by BRS. Unfortunately one D-tag was lost after a playback to pilot whales. This reduced greatly the amount of data available from that playback and it incurred substantial additional costs during the post-deployment search for the tag. The team on board Revelle was highly experienced in radio tracking and all reasonable and safe actions were taken to recover the tag. Some outside advice was misdirected and unhelpful and it put unreasonable pressure on some individual members of the field team. Recommendation: It would be advisable to ensure that all operational advice should be channelled through the Chief Scientist. 58
59 SOUND SOURCE The source performed well on all live playbacks and much credits needs to go to the sound source team for the work they put in to ensure the source was operational. Specific problems with the sound source related to the ergonomics of deployment, early uncertainty about its capacity to perform to specification at full power and the lack of capacity to tow the source at slow speeds. This last problem (towing capacity) was not just inconvenient, it was a hazard. Recommendations: The source needs to be more thoroughly tested in advance of field operations. It is also essential that the source should be deployable to 75 metres in 5-10 minutes, and recoverable in the same time. The best that could be achieved with the source used in BRS-08 was 35 minutes for deployment and recovery. The source should be capable of being towed at speeds of a few knots. VISUAL OBSERVATIONS The visual observations were carried out from R/V Revelle. The visual observer team performed well and provided excellent coverage in very difficult conditions. The visual observations were reduced in their effectiveness by the loss of one set of Bigeye binoculars from the outset. They had been ship in an inappropriate box and were unaligned. Recommendation: In future, BRS should invest in 2 sets of bigeye binoculars and ensure that any binoculars that are shipped are appropriately packed. The Bigeye binoculars shipped from SE Fisheries. RHIB A 21 ft RHIB was operated from the R/V Roger Revelle to track whales, provide photoidentification, act as a tender and, on occasions, act as a tagging platform. The RHIB operated well in all these roles although the lack of shade for those on board over long hours was challenging. Perhaps the most significant operational constraint for the RHIB was its fuel supply. The R/V Revelle did not have the capacity to store sufficient fuel for the RHIB and this meant the RHIB had to fuel at AUTEC every few days. Recommendation: Alternative scenarios for provision of fuel should be considered. This is essential in situations where BRS might be operating in regions that cannot support external fuel supplies as was available for AUTEC. TRACKING AND DATA LOGGING SOFTWARE Basic data logging software operated well and the database operated well. Links between the Kiam system supplied by NURC and the ship-based systems were intermittent and the system supplied for the RHIB did not operate satisfactorily. Some of this was down to operator training and experience, but the Kiam system cannot be seen as more than a beta test system. 59
60 PAMGUARD was used to monitor the towed hydrophones. Its data outputs were compatible with the ship-based data management system and, in general, after appropriate operator training it performed satisfactorily. But, like Kiam, it is a beta test software product. Overall there was good correspondence between PAMGUARD and the AUTEC hydrophones but PAMGUARD did report some detections that were not encountered on the AUTEC system. These may have been false positives but there is a need for further investigation especially since the hydrophones were in the surface layer and the AUTEC hydrophones were at depth. Tracking systems for the RHIB worked intermittently, especially at longer range. Realtime plotting of the RHIB position was also intermittent and difficult to operate without expert support. Transmission of data from the R/V Revelle to shore through modems was unreliable. Modems needing to be re-booted regularly and problems with the data received on the R/V Revelle from shore were never resolved. Although it is believed that no essential data were lost as a result of software problems, the software and communications system was composed of too many incompatible parts some of which worked only intermittently. Recommendation: Considerably more testing of software is required in advance of any future study and software engineers who have experience of the software need to be available to iron out difficulties during the test phase. TOWED HYDROPHONES Towed hydrophone presence on the R/V Revelle exacerbated acoustic security concerns on the range. However, this concern, and the extent to which it potentially constrained BRS operations was never transmitted to the Chief Scientist. Recommendations: The specifics of any towed array that is to be used during future behavioral studies on Navy ranges will be disclosed early in the planning process. If, at any stage, the Range personnel consider that hydrophones in the water are creating operational restrictions then the Chief Scientist must be informed. M3R Having the time to meet secondary objectives in M3R was a luxury and rarity. The primary objective of M3R was the effective monitoring of the AUTEC hydrophones by detecting, localizing and tracking beaked whales and pilot whales. Personnel also conducted data logging and archived acoustic data to be used in follow-on analysis. Personnel covered overlapping seven hour watches that ran from 0500L to 1830L. The hours spent on monitoring the supplied binary grams quickly developed personnel into effective analysts. Occasional personnel changes occurred but for the most part, the 60
61 analysts spent considerable time in the job and quickly developed much needed analysis instincts. M3R made daily plans for two early morning radio conversations with Revelle, one at 0500L and one following the 0630L team leader meeting on the ship s bridge. Making adequate preparation to advise Revelle on where beaked whales were active and where M3R thought it best to start out the day s activity meant being on deck in the lab just after 0400L. Collecting the data to generate thoughts and notes on the day for the following day often took until 2130L. M3R analysts collected data on beaked whale activity for 13.5 hours each day but the night activity is unknown. Were there as many night dives as day dives? Did the quieter night conditions generate more tracker positions because more sensors detected the clicking activity? Recommendations: (i) The cost of having two additional personnel and running a 24 hour watch in M3R should be weighed against the value of additional nocturnal knowledge to be gained about beaked whales. (ii) Analysis of Alesis recordings should be conducted to review the nocturnal click patterns of beaked whales. The click counter introduced to M3R personnel by NUWC engineer-programmers in the last part of the survey was a very valuable and effective tool. The ability to have a computer assisted start and stop time for click sequences was very helpful. With so much happening at once it was possible to miss the stop or start of a click sequence on 30 second displays. The click counter was a great backup and was also used on a few occasions to estimate the night clicking activity in a small area. With a few modifications the click counter could become an even more effective operational tool. Recommendations: (i) Should the decision be made to conduct the next behavioral response study at AUTEC, NUWC, Cornell and MAI personnel will meet early and coordinate software changes that will provide additional information during the survey. (ii) M3R operators should have access to archived, 2-bit data and be able to replay that data in a fast forward mode. The tracker did not provide adequate positional data in M3R. Despite having up to six or seven hydrophones holding a click sequence, it was far more common that the tracker provided no positions at all. It provided too many false alarm positions on military activity and surface vessel accelerations. When the tracker did provide a position on a beaked whale and did so with a starburst of confidence, the position was always sensible and reliable. Recommendations: (i) Review the false alarm rate of the tracker. 61
62 (ii) Consider an operator assisted mode where click sequences from several hydrophones are selected by the operator for tracker output. (iii) Consider the addition of a Doppler calculator that provides the click frequency difference between hydrophones. Even though the beaked whales are traveling slowly, a 24 KHz pulse will have 8-16 Hz of frequency difference at the hydrophone depending on the whale s aspect. 62
63 BRS 2008 Quick Look Report APPENDICES 3 October 2008 List of Appendices A BRS 08 Status Summary B - Source transmission summary for playback events C Dtag summaries 63

64 64
65 65
66 Appendix B Waveform and source transmission summary for playback events Waveform definition Pulse type Duration Frequency (Hz)/start Frequency (Hz)/stop Remarks Repetition rate Ramp up Starting SL BRS_MFA1 LFM 500ms Hz upsweep 25sec 3dB CW 500ms no xmn 100ms n/a n/a CW 300ms total = 1.4 sec BRS_PRN1 PRN 1000ms sec 3dB 160 no xmn 100ms n/a n/a PRN 300ms total = 1.4 sec Waveforms transmitted during playback 22 September 2008 Location time Action Source Depth Latitude (N) Longitude (W) GMT deploy 77 ' / 23.4m retrieve Note: Transmisson time is taken from beginning of file represents transmission start time 22-Sep Species: Globicephala macrorhynchus short finned pilot whale (lost tag) 66
67 Time (GMT) Signal Target Amplitude Duration Comments 21:30:36 PRN filename: A 21:31:01 PRN :31:26 PRN PRN missed 21:31:51 PRN :32:16 PRN :32:41 PRN :33:06 PRN :33:31 PRN :33:57 PRN :34:22 PRN :34:47 PRN :35:12 PRN :35:37 PRN :36:02 PRN :36:27 PRN :36:52 PRN :37:18 PRN Maximum 21:37:43 PRN :38:08 PRN :38:33 PRN :38:58 PRN :39:23 PRN :39:48 PRN :40:13 PRN :40:38 PRN :41:03 PRN :41:28 PRN :41:53 PRN :42:18 PRN minutes 21:42:43 PRN last 22-Sep S pecies Globicephala macrorhynchus short finned pilot whale 67
68 (lost tag) Time (GMT) Signal Target Amplitude Duration Comments 21:46:20 MFA filename: B 21:46:45 MFA :47:10 MFA :47:35 MFA :48:00 MFA :48:25 MFA :48:51 MFA :49:16 MFA :49:41 MFA :50:06 MFA :50:31 MFA :50:56 MFA :51:22 MFA :51:47 MFA :52:12 MFA :52:37 MFA :53:02 MFA :53:27 MFA maximum 21:53:52 MFA :54:18 MFA :54:42 MFA :55:08 MFA :55:33 MFA :55:58 MFA :56:23 MFA :56:48 MFA :57:13 MFA :57:38 MFA :58:03 MFA :58:28 MFA minutes 21:58:53 MFA last 26 September
69 Location t ime Action Source Depth Latitude (N) Longitude (W) GMT deploy 83 ft (25.6m) retrieve deploy 83 ft (25.6m) retrieve Note: Times were recorded at the end of the ping, to obtain transmission time, subtract signal length 26-Sep S pecies Pseudorca crassidens False killer whale Time (GMT) Signal Target amplitude Duration Comm 15:08:45 PRN fil ename: A 15:09:06 PRN :09:29 PRN :09:54 PRN :10:19 PRN :10:44 PRN :11:09 PRN :11:34 PRN :11:59 PRN :12:24 PRN :12:49 PRN :13:14 PRN :13:40 PRN :14:05 PRN :14:30 PRN :14:55 PRN :15:20 PRN :15:45 PRN maximum 15:16:10 PRN :16:35 PRN :17:00 PRN :17:25 PRN ents 69
70 15:17:50 PRN :18:15 PRN :18:40 PRN :19:06 PRN :19:31 PRN :19:56 PRN :19:20 PRN :20:46 PRN minutes 26-Sep S pecies Pseudorca crassidens False killer whale Time (GMT) Signal Target amplitude Duration Comm 16:54:22 MFA filename: B 16:54:46 MFA :55:12 MFA :55:37 MFA :56:02 MFA :56:28 MFA :56:52 MFA :57:17 MFA :57:43 MFA :58:08 MFA :58:33 MFA :58:58 MFA :59:23 MFA :59:48 MFA :00:13 MFA :00:38 MFA :01:03 MFA :01:28 MFA maximum 17:01:53 MFA :02:18 MFA :02:44 MFA :03:09 MFA :03:34 MFA ents 70
71 17:03:59 MFA :04:24 MFA :04:49 MFA :05:14 MFA :05:39 MFA :06:04 MFA :06:29 MFA minutes 17:06:54 MFA last 27 September Location Latitude (N) Longitude (W) time Action Source Depth GMT deploy 217' / 66m retrieve Note: Times were recorded at the end of the ping, to obtain transmission time, subtract signal length 71
72 27-Sep Species: Mesoplodon densirostris Time (GMT) Signal Target Amplitude Duration Comment 18:53:18 PRN fil ename A 18:53:44 PRN :54:09 PRN :54:34 PRN :54:59 PRN :55:24 PRN :55:49 PRN :56:14 PRN :56:39 PRN :57:04 PRN :57:30 PRN :57:54 PRN :58:19 PRN :58:44 PRN :59:09 PRN :59:35 PRN :00:03 PRN :00:25 PRN maximum 19:00:50 PRN :01:15 PRN CS terminated 28 September M3R/whale not clicking s Location tim e Action Source Depth Latitude (N) Longitude (W) GMT deploy 84' (25.6m) retrieve Note: Times were recorded at the end of the ping, to obtain transmssion time, subtract signal length 72
73 28-Sep S pecies Pseudorca crassidens False killer whale Time (GMT) Signal Target Duration Comments Amplitude 21:32:26 MFA fi lename A 21:32:50 MFA :33:15 MFA :33:40 MFA :34:05 MFA :34:30 MFA :34:55 MFA :35:20 MFA :35:45 MFA :36:10 MFA :36:35 MFA :37:00 MFA :37:25 MFA :37:50 MFA :38:15 MFA :38:40 MFA :39:06 MFA :39:31 MFA maximum 21:39:56 MFA :40:21 MFA :40:46 MFA :41:10 MFA :41:36 MFA :42:01 MFA :42:26 MFA :42:51 MFA :43:16 MFA :43:41 MFA :44:06 MFA :44:32 MFA minutes 73
74 29 September Location t ime Action Source Depth Latitude (N) Longitude (W) GMT deploy 84' (25.6m) retreive deploy 84' (25.6m) retrieve deploy 84' (25.6m) retrieve Note: Times were recorded at the end of the ping, to obtain transmssion time, subtract signal length 29-Sep S pecies Globicephala macrorhynchus short finned pilot whale (tag on) Time (GMT) Signal Target Amplitude Duration Comments 15:40:37 PRN fi lename: A 15:41:02 PRN :41:27 PRN :41:52 PRN :42:17 PRN :42:42 PRN :43:07 PRN :43:32 PRN :43:57 PRN :44:22 PRN :44:47 PRN :45:12 PRN :45:37 PRN :46:02 PRN :46:28 PRN :46:53 PRN :47:18 PRN :47:43 PRN maximum 15:48:08 PRN :48:33 PRN
75 15:48:58 PRN :49:23 PRN :49:48 PRN :50:13 PRN :50:38 PRN :51:03 PRN :51:28 PRN :51:53 PRN :52:18 PRN :52:44 PRN minutes 29-Sep Species Globicephala macrorhynchus short finned pilot whale (tag on) Peponocephala electra melon-headed whale (tag on) Time (GMT) Signal Target Amplitude Duration Comments 17:38:44 MFA filename: B 17:39:09 MFA :39:34 MFA :39:59 MFA :40:24 MFA :40:50 MFA :41:15 MFA :41:40 MFA :42:05 MFA :42:30 MFA :42:55 MFA :43:20 MFA :43:45 MFA :44:10 MFA :44:35 MFA :45:01 MFA :45:26 MFA :45:51 MFA maximum 17:46:16 MFA :46:41 MFA
76 17:47:06 MFA :47:31 MFA :47:56 MFA :48:21 MFA :48:46 MFA :49:11 MFA :49:36 MFA :50:02 MFA :50:27 MFA :50:52 MFA minutes 76
77 Appendix C D-Tag summaries prepared by S. DeRuiter (WHOI) APPENDIX C-1 GM08_266A QUICK LOOK ANALYSIS (Globicephala macrorhynchus, no playback, tagged on 22 September 2008) DIVE PROFILE Notes: N/A 77
78 2D PSEUDOTRACK Notes: Interpret all ptracks with care they have not been geo-referenced at all or corrected for currents, etc. 78
79 3D PSEUDOTRACK Notes: Color indicates animal depth. 79

80 Appendix C-2 PC08_270A QUICK LOOK ANALYSIS (Pseudorca crassidens, MFA and PRN playback on 26 September 2008) DIVE PROFILE Notes: the deepest dive (to about 50 m) happened while the animals were very close to the Revelle and the Revelle was operating her bow thrusters. The tagged animal was silent during the dive and nonfocal whistles and clicks were not noted either. 2D PSEUDOTRACK Notes: Interpret all ptracks with care they have not been geo-referenced at all or corrected for currents, etc. 80
81 81

82 3D PSEUDOTRACK Notes: Color indicates animal depth. PRN AND MFA SONAR EXPOSURE RECEIVED LEVELS All RLs were calculated after application of a bandpass filter between 2-5 khz 10. Level determination was as follows: Peak level highest sound pressure level during the analyzed portion of the PRN sound Envelope peak level highest level observed in the complex envelope of the signal was calculated, after envelope was filtered with a low-pass filter 11. This is a non-conventional level measurement. It was calculated to give some idea of the peak level of the PRN signal NOT including spikes that sometimes occur in the waveform. RMS level root of the mean squared sound pressure level in the analysis window 10 4 th order Butterworth filter (applied back and forward in matlab with the filtfilt command for effective 8 th order) 11 2nd order (but applied back and forward with the matlab command filtfilt for effective 4th order) Chebyshev type 1 filter, lowpass, 200Hz cutoff frequency, 0.5 db ripple in pass band 82

83 RMS noise level HAS NOT YET BEEN CALCULATED FOR THIS WHALE. The analysis window began and ended at the start and end of the first arrival of the PRN/MFA signal where possible. Where the PRN/MFA signal overlapped with highamplitude sounds, a shorter window (as long as possible without including any whale sounds or splashes) was used. 83
. Zooming in on the PRN exposure: Zooming in on the MFA exposure: 84")
84 DIVE PROFILES WITH RECEIVED LEVELS Notes: for the color-line plot, the RL of each PRN emission is plotted on the dive profile from the time the sound was received until the beginning of the next received sound. (If the RL color is plotted only for the 1-second duration of the sound, it is very hard to see on the figure). Zooming in on the PRN exposure: Zooming in on the MFA exposure: 84

85 85
86 Zooming in on the PRN exposure: Zooming in on the MFA exposure: 86

87 2D & 3D PSEUDOTRACKS WITH RECEIVED LEVELS Notes: see notes for dive profile with RLs and 2D ptrack. 87
88 Appendix C-3 MD08_271A QUICK LOOK ANALYSIS Blainville s beaked whale Mesoplodon densirostris, tagged and exposed to PRN sound on 27 September 2008 DIVE PROFILE 88
89 2D PSEUDOTRACK Notes: the PRH file for this deployment is probably not fully optimized. The tag was placed relatively far back on the animal, and may have moved quite a bit with each fluke stroke; in addition, it also moved on the animal at least once and may have been partly detached during some or all of the tag-out (flapping around). So interpret all ptracks for this animal with care unless/until the PRH file is corrected or examined more carefully. The depth profile seems relatively accurate, but the position data is probably not. 3D PSEUDOTRACK Notes: Color indicates animal depth. This plot may be quite inaccurate (see 2D ptrack notes above). 89
90 PRN EXPOSURE RECEIVED LEVELS Notes: All RLs were calculated after application of a bandpass filter between 2-5 khz 12. Level determination was as follows: Peak level highest sound pressure level during the analyzed portion of the PRN sound Envelope peak level highest level observed in the complex envelope of the signal was calculated, after envelope was filtered with a low-pass filter 13. This is a non-conventional level measurement. It was calculated to give some idea of the peak level of the PRN signal NOT including spikes that sometimes occur in the waveform. RMS level root of the mean squared sound pressure level in the analysis window RMS noise level root of the mean squared sound pressure level in a representative window around the time of the exposure. The window was selected to have background noise approximately like that in the analysis window, and to exclude loud animal sounds. It was one second long if possible, but was shorter if there was no one-second period available that was free of animal clicks. This noise measurement is given to indicate the signal-to-noise ratio of the received transmission (some are barely audible over background noise). The PRN sound analysis window began and ended at the start and end of the first arrival of the PRN signal where possible. Where the PRN signal overlapped with highamplitude sounds, a shorter window (as long as possible without including any whale sounds or splashes) was used th order Butterworth filter (applied back and forward in matlab with the filtfilt command for effective 8 th order) 13 2nd order (but applied back and forward with the matlab command filtfilt for effective 4th order) Chebyshev type 1 filter, lowpass, 200Hz cutoff frequency, 0.5 db ripple in pass band 90
91 91
92 DIVE PROFILES WITH RECEIVED LEVELS Notes: for the color-line plot, the RL of each PRN emission is plotted on the dive profile from the time the sound was received until the beginning of the next received sound. (If the RL color is plotted only for the ~1.4 second duration of the sound, it is very hard to see on the figure). Zooming in: 92
93 2D PSEUDOTRACK WITH RECEIVED LEVELS Notes: see notes for dive profile with RLs and 2D ptrack. 93
94 Zooming in: 3D PSEUDOTRACK WITH RECEIVED LEVELS Notes: see notes for dive profile with RLs and 2D ptrack 94
95 Appendix C-4 PC08_272A QUICK LOOK ANALYSIS False killer whale Pseudorca crassidens, tagged September 28, 2008 DIVE PROFILE 2D PSEUDOTRACK 95
96 Notes: This track is not geo-referenced and has not been corrected for currents, etc. Interpret all pseudotracks for this animal with care. 96

97 3D PSEUDOTRACK Notes: Color indicates animal depth. This plot may be quite inaccurate (see 2D ptrack notes above). MFA & PRN EXPOSURE RECEIVED LEVELS Notes: All RLs were calculated after application of a bandpass filter between 2-5 khz 14. Level determination was as follows: Peak level highest sound pressure level during the analyzed portion of the PRN sound Envelope peak level highest level observed in the complex envelope of the signal was calculated, after envelope was filtered with a low-pass filter 15. This is a non-conventional level measurement. It was calculated to give some idea of the peak level of the PRN signal NOT including spikes that sometimes occur in the waveform. RMS level root of the mean squared sound pressure level in the analysis window 14 4 th order Butterworth filter (applied back and forward in matlab with the filtfilt command for effective 8 th order) 15 2nd order (but applied back and forward with the matlab command filtfilt for effective 4th order) Chebyshev type 1 filter, lowpass, 200Hz cutoff frequency, 0.5 db ripple in pass band 97
98 RMS noise level root of the mean squared sound pressure level in a onesecond window slightly before the exposure. Window selected to have background noise approximately like that in the analysis window, and to exclude loud animal sounds. This measurement is given to indicate the signal-to-noise ratio of the received transmission (some are barely audible over background noise). The analysis window began and ended at the start and end of the first arrival of the PRN/MFA signal where possible. Where the PRN/MFA signal overlapped with highamplitude sounds, a shorter window (as long as possible without including any whale sounds or splashes) was used. 98
99 99


100 DIVE PROFILES WITH RECEIVED LEVELS Notes: for the color-line plot, the RL of each transmission is plotted on the dive profile from the time the sound was received until the beginning of the next received sound. (If the RL color is plotted only for the 1-second duration of the sound, it is very hard to see on the figure). Zooming in: 100

101 Zooming in: 101
102 2D PSEUDOTRACK WITH RECEIVED LEVELS Notes: see notes for dive profile with RLs and 2D ptrack. Zooming in: 102

103 3D PSEUDOTRACK WITH RECEIVED LEVELS 103
, and the whistles often seem to mimic the frequency modulation of the MFA sound in some")
104 ACOUSTIC DATA OBSERVATIONS The animal (and/or others in its group) might be whistling in response to, or in imitation of, the MFA sound. Animal whistles began during the second half of the MFA sound over half the time (about 16 of the 30 exposures), and the whistles often seem to mimic the frequency modulation of the MFA sound in some way. I did not notice the same thing happening during the PRN exposure, but have not checked systematically. The spectrograms below show two separate examples. The animals were whistling frequently throughout the exposure, so the overlap of animal whistles with the MFA sound may be just coincidence, but the possibility that the animals are responding vocally to the sonar sound should be investigated further. MFA sound MFA sound 104
105 Appendix C-5 GM08_273A QUICK LOOK ANALYSIS (Pilot whale Globicephala macrorhynchus, MFA and PRN playback on 29 September 2008) DIVE PROFILE 2D PSEUDOTRACK Notes: Interpret all ptracks with care they have not been geo-referenced at all or corrected for currents, etc. 105
106 106
107 3D PSEUDOTRACK Notes: Color indicates animal depth. PRN AND MFA SONAR EXPOSURE RECEIVED LEVELS Notes: The tagged whale was at the surface a lot, and so surface splashing sometimes interfered with the sound exposure. In those cases the background noise level on the tag was very high and the reported exposure level numbers probably do not mean very much (splashing was making as much noise as the exposure, if not more). All RLs were calculated after application of a bandpass filter between 2-5 khz 16. Level determination was as follows: Peak level highest sound pressure level during the analyzed portion of the PRN sound Envelope peak level highest level observed in the complex envelope of the signal was calculated, after envelope was filtered with a low-pass filter 17. This is a non-conventional level measurement. It was calculated to give some idea of 16 4 th order Butterworth filter (applied back and forward in matlab with the filtfilt command for effective 8 th order) 17 2nd order (but applied back and forward with the matlab command filtfilt for effective 4th order) Chebyshev type 1 filter, lowpass, 200Hz cutoff frequency, 0.5 db ripple in pass band 107
108 the peak level of the PRN signal NOT including spikes that sometimes occur in the waveform. RMS level root of the mean squared sound pressure level in the analysis window RMS noise level root of the mean squared sound pressure level in a onesecond window slightly before the exposure. Window selected to have background noise approximately like that in the analysis window, and to exclude loud animal sounds. This measurement is given to indicate the signal-to-noise ratio of the received transmission (some are barely audible over background noise). The analysis window began and ended at the start and end of the first arrival of the PRN/MFA signal where possible. Where the PRN/MFA signal overlapped with highamplitude sounds, a shorter window (as long as possible without including any whale sounds or splashes) was used. 108
109 109
.")
110 DIVE PROFILES WITH RECEIVED LEVELS Notes: for the color-line plot, the RL of each emission is plotted on the dive profile from the time the sound was received until the beginning of the next received sound. (If the RL color is plotted only for the ~1.4 second duration of the sound, it is very hard to see on the figure). Zooming in on the PRN exposure: Zooming in on the MFA exposure: 110

111 Zooming in on the PRN exposure: 111
112 Zooming in on the MFA exposure: 112
113 2D PSEUDOTRACK WITH RECEIVED LEVELS Notes: see notes for dive profile with RLs and 2D ptrack. The colors on the tracks indicate peak RL in db re 1 upa. Zooming in: 113
114 3D PSEUDOTRACK WITH RECEIVED LEVELS Notes: see notes for previous pseudotracks 114
115 Appendix C-6 PE08_273A QUICK LOOK ANALYSIS (Melon-headed whale Peponcephala electra, tagged 29 September 2008) NOTE: Tag was only on for about 15 minutes. DIVE PROFILE 2D PSEUDOTRACK Notes: Interpret all ptracks with care they have not been geo-referenced at all or corrected for currents, etc. 115
116 116
117 3D PSEUDOTRACK Notes: Color indicates animal depth. Appendix C-7 PE08_273B QUICK LOOK ANALYSIS (Melon-headed whale Peponocephala electra, MFA playback on 29 September 2008) DIVE PROFILE 117
118 2D PSEUDOTRACK Notes: Interpret all ptracks with care they have not been geo-referenced at all or corrected for currents, etc. 118

119 3D PSEUDOTRACK Notes: Color indicates animal depth. PRN AND MFA SONAR EXPOSURE RECEIVED LEVELS Notes: All RLs were calculated after application of a bandpass filter between 2-5 khz 18. Level determination was as follows: Peak level highest sound pressure level during the analyzed portion of the PRN sound Envelope peak level highest level observed in the complex envelope of the signal was calculated, after envelope was filtered with a low-pass filter 19. This is a non-conventional level measurement. It was calculated to give some idea of the peak level of the PRN signal NOT including spikes that sometimes occur in the waveform. RMS level root of the mean squared sound pressure level in the analysis window 18 4 th order Butterworth filter (applied back and forward in matlab with the filtfilt command for effective 8 th order) 19 2nd order (but applied back and forward with the matlab command filtfilt for effective 4th order) Chebyshev type 1 filter, lowpass, 200Hz cutoff frequency, 0.5 db ripple in pass band 119

120 RMS noise level root of the mean squared sound pressure level in a onesecond window slightly before the exposure. Window selected to have background noise approximately like that in the analysis window, and to exclude loud animal sounds. This measurement is given to indicate the signal-to-noise ratio of the received transmission (some are barely audible over background noise). The analysis window began and ended at the start and end of the first arrival of the PRN/MFA signal where possible. Where the PRN/MFA signal overlapped with highamplitude sounds, a shorter window (as long as possible without including any whale sounds or splashes) was used. 120
.")
121 DIVE PROFILES WITH RECEIVED LEVELS Notes: for the color-line plot, the RL of each MFA emission is plotted on the dive profile from the time the sound was received until the beginning of the next received sound. (If the RL color is plotted only for the ~1.4 second duration of the sound, it is very hard to see on the figure). Zooming in on the MFA exposure: 121
122 Zooming in on the MFA exposure: 122

123 2D PSEUDOTRACK WITH RECEIVED LEVELS Notes: see notes for dive profile with RLs and 2D ptrack. Zooming in: 123


124 3D PSEUDOTRACK WITH RECEIVED LEVELS Notes: see notes for previous pseudotracks Zooming in: 124
~ A Behavioral Response Study in 2007 &2008 (BRS 07/08) was conducted in the Bahamas to
 was conducted in the Bahamas to") Biological and Behavioral Response Studies in the Bahamas in 27 28 (BRS 7/8) ~ Project Summary ~ ~ A Behavioral Response Study in 27 &28 (BRS 7/8) was conducted in the Bahamas to study diving behavior
Biological and Behavioral Response Studies in the Bahamas in 27 28 (BRS 7/8) ~ Project Summary ~ ~ A Behavioral Response Study in 27 &28 (BRS 7/8) was conducted in the Bahamas to study diving behavior
Pacific Missile Range Facility (PMRF) Species Verification and Satellite Tagging Test: January Post-Test Report
 Species Verification and Satellite Tagging Test: January Post-Test Report") Pacific Missile Range Facility (PMRF) Species Verification and Satellite Tagging Test: January 2012 Post-Test Report POC: David J. Moretti Naval Undersea Warfare Center Division Newport: Marine Mammal
Pacific Missile Range Facility (PMRF) Species Verification and Satellite Tagging Test: January 2012 Post-Test Report POC: David J. Moretti Naval Undersea Warfare Center Division Newport: Marine Mammal
Providing Field Support for the Behavior Response Study (BRS-08)
") Providing Field Support for the Behavior Response Study (BRS-08) Diane Elaine Claridge Bahamas Marine Mammal Research Organisation P.O. Box AB-20714, Marsh Harbour Abaco, Bahamas phone: (242) 366-4155
Providing Field Support for the Behavior Response Study (BRS-08) Diane Elaine Claridge Bahamas Marine Mammal Research Organisation P.O. Box AB-20714, Marsh Harbour Abaco, Bahamas phone: (242) 366-4155
Biological & Behavioral Response Studies of. Marine Mammals in Southern California, BRS.org. Photos taken under NMFS permit #
 Biological & Behavioral Response Studies of Marine Mammals in Southern California, 2015 ( SOCAL- 15) www.socal- BRS.org Photos taken under NMFS permit #14534-2 1 SOCAL- 15 OVERVIEW SOCAL- 15 continues
Providing Field Support for the Behavior Response Study (BRS-07)
") Providing Field Support for the Behavior Response Study (BRS-07) Diane Claridge Bahamas Marine Mammal Research Organization P.O. Box AB-20714, Marsh Harbour Abaco, Bahamas phone: (242) 366-4155 fax: (242)
Providing Field Support for the Behavior Response Study (BRS-07) Diane Claridge Bahamas Marine Mammal Research Organization P.O. Box AB-20714, Marsh Harbour Abaco, Bahamas phone: (242) 366-4155 fax: (242)
Acoustic and Visual Survey of Cetaceans at Palmyra Atoll
 Acoustic and Visual Survey of Cetaceans at Palmyra Atoll Trip report 08/2010 Palmyra, August 18 September 9, 2010 Jason P Larese Mark Deakos Contact: sbaumann@ucsd.edu, jhildebrand@ucsd.edu Scripps Institution
Marine Mammal Acoustic Tracking from Adapting HARP Technologies
 DISTRIBUTION STATEMENT A: Approved for public release; distribution is unlimited. Marine Mammal Acoustic Tracking from Adapting HARP Technologies Sean M. Wiggins and John A. Hildebrand Marine Physical
Tagging and Playback Studies to Toothed Whales
 DISTRIBUTION STATEMENT A. Approved for public release; distribution is unlimited Tagging and Playback Studies to Toothed Whales Peter L. Tyack Biology Department Woods Hole Oceanographic Institution Woods
Anthropogenic Noise and the Marine Environment
 Anthropogenic Noise and the Marine Environment R. Hillson and H.-J. Shyu Information Technology Division Introduction: The impact of anthropogenic noise on the marine environment is a subject of increasing
Habitat Use and Behavioral Monitoring of Hawaiian Monk Seals in Proximity to the Navy Hawaii Range Complex
 Project Annual Report Habitat Use and Behavioral Monitoring of Hawaiian Monk Seals in Proximity to the Navy Hawaii Range Complex Report Period: July 2011 June 2012 Submitted by: Kenady Wilson, Scientist
Baseline Behavior of Pilot Whales and their Responses to Playback of Anthropogenic and Natural Sounds
 DISTRIBUTION STATEMENT A. Approved for public release; distribution is unlimited. Baseline Behavior of Pilot Whales and their Responses to Playback of Anthropogenic and Natural Sounds Peter Tyack Woods
Beaked Whale Group Deep Dive Behavior from Passive Acoustic Monitoring
 DISTRIBUTION STATEMENT A. Approved for public release; distribution is unlimited. Beaked Whale Group Deep Dive Behavior from Passive Acoustic Monitoring Len Thomas, Tiago Marques Centre for Research into
Fine-scale Focal DTAG Behavioral Study in the Gulf of Maine
 DISTRIBUTION STATEMENT A: Approved for public release; distribution is unlimited. Fine-scale Focal DTAG Behavioral Study in the Gulf of Maine Alessandro Bocconcelli Woods Hole Oceanographic Institution
Measured broadband reverberation characteristics in Deep Ocean. [E.Mail: ]
![Measured broadband reverberation characteristics in Deep Ocean. [E.Mail: ]](/thumbs/90/101823179.jpg "Measured broadband reverberation characteristics in Deep Ocean. [E.Mail: ]") Measured broadband reverberation characteristics in Deep Ocean Baiju M Nair, M Padmanabham and M P Ajaikumar Naval Physical and Oceanographic Laboratory, Kochi-682 021, India [E.Mail: ] Received ; revised
Measured broadband reverberation characteristics in Deep Ocean Baiju M Nair, M Padmanabham and M P Ajaikumar Naval Physical and Oceanographic Laboratory, Kochi-682 021, India [E.Mail: ] Received ; revised
Final Report Alaska Department of Fish and Game State Wildlife Grant T July 1, 2003 June 30, 2006:
 Final Report Alaska Department of Fish and Game State Wildlife Grant T-1-6-4 July 1, 2003 June 30, 2006: Acoustic Monitoring for Killer Whales in the Bering Sea John Hildebrand and Erin Oleson Marine Physical
Does Depth Matter? Examining Factors that could Influence the Acoustic Identification of Odontocete Species on Bottom-Moored Recorders
 DISTRIBUTION STATEMENT A. Approved for public release; distribution is unlimited. Does Depth Matter? Examining Factors that could Influence the Acoustic Identification of Odontocete Species on Bottom-Moored
Fine Scale Baleen Whale Behavior Observed Via Tagging Over Daily Time Scales
 DISTRIBUTION STATEMENT A. Approved for public release; distribution is unlimited. Fine Scale Baleen Whale Behavior Observed Via Tagging Over Daily Time Scales Mark Baumgartner Woods Hole Oceanographic
Sound production in mysticetes. Background. Cetacean vocal frequency ranges Dolphins
 Sound production in mysticetes Fish 475 - May 4 2007 Background Cetaceans produce sound in the widest range of frequencies for any Class of animal Subsonic to supersonic and everywhere in between Sound
Fine-scale Focal Dtag Behavioral Study of Diel Trends in Activity Budgets and Sound Production of Endangered Baleen Whales in the Gulf of Maine
 Fine-scale Focal Dtag Behavioral Study of Diel Trends in Activity Budgets and Sound Production of Endangered Baleen Whales in the Gulf of Maine Susan E. Parks The Pennsylvania State University, Applied
Right Whale Diving and Foraging Behavior in the Southwestern Gulf of Maine
 DISTRIBUTION STATEMENT A. Approved for public release; distribution is unlimited. Right Whale Diving and Foraging Behavior in the Southwestern Gulf of Maine Mark Baumgartner Woods Hole Oceanographic Institution
Acoustic Float for Marine Mammal Monitoring
 DISTRIBUTION STATEMENT A: Approved for public release; distribution is unlimited. Acoustic Float for Marine Mammal Monitoring Christopher Jones Applied Physics Laboratory University of Washington 1013
Underwater noise and offshore windfarms
 Underwater noise and offshore windfarms Dr Jeremy Nedwell, Mr John Langworthy and Mr Daren Howell BWEA Conference 4/3/04 Subacoustech reference: 544R0503, COWRIE Copyright. Aim of study To evaluate the
Acoustic Seaglider for Beaked Whale Detection
 DISTRIBUTION STATEMENT A: Approved for public release; distribution is unlimited. Acoustic Seaglider for Beaked Whale ion Neil M. Bogue and Jim Luby Applied Physics Laboratory University of Washington
Caltrans compendium of underwater sound data from pile driving 2014 update
 Caltrans compendium of underwater sound data from pile driving 2014 update Richard RODKIN 1 ; Keith POMMERENCK 2 1 Illingworth & Rodkin, Inc., United States 2 Illingworth & Rodkin, Inc., United States
THE CHALLENGES OF A LARGE-AREA BATHYMETRIC SURVEY
 THE CHALLENGES OF A LARGE-AREA BATHYMETRIC SURVEY Agenda: - Introduction - Tender - Project Planning - Survey - Processing - Delivery - Conclusion 2 Introduction We know less of the oceans at our feet,
Examples of Carter Corrected DBDB-V Applied to Acoustic Propagation Modeling
 Naval Research Laboratory Stennis Space Center, MS 39529-5004 NRL/MR/7182--08-9100 Examples of Carter Corrected DBDB-V Applied to Acoustic Propagation Modeling J. Paquin Fabre Acoustic Simulation, Measurements,
Currents measurements in the coast of Montevideo, Uruguay
 Currents measurements in the coast of Montevideo, Uruguay M. Fossati, D. Bellón, E. Lorenzo & I. Piedra-Cueva Fluid Mechanics and Environmental Engineering Institute (IMFIA), School of Engineering, Research
FINAL REPORT. Using Digital Acoustic Recording Tags to Detect Marine Mammals on Navy Ranges and Study their Responses to Naval Sonar
 FINAL REPORT Using Digital Acoustic Recording Tags to Detect Marine Mammals on Navy Ranges and Study their Responses to Naval Sonar SERDP Project RC-1539 Contract # W912HQ-06-C-0054 Peter L. Tyack Woods
Final Report: Measurements of Pile Driving Noise from Control Piles and Noise-Reduced Piles at the Vashon Island Ferry Dock
 Final Report: Measurements of Pile Driving Noise from Control Piles and Noise-Reduced Piles at the Vashon Island Ferry Dock By Peter H. Dahl, Jim Laughlin, and David R. Dall Osto Executive Summary Underwater
Remote Monitoring of Dolphins and Whales in the High Naval Activity Areas in Hawaiian Waters
 DISTRIBUTION STATEMENT A: Approved for public release; distribution is unlimited. Remote Monitoring of Dolphins and Whales in the High Naval Activity Areas in Hawaiian Waters Whitlow W. L. Au and Marc
Final Report. August 2013 Through February Prepared for: Commander, U.S. Pacific Fleet
 Final Report Prepared for: Commander, U.S. Pacific Fleet Submitted to: Naval Facilities Engineering Command Pacific under HDR Environmental, Operations and Construction, Inc. Contract No. N62470-10-D-3011,
Near-Field Sturgeon Monitoring for the New NY Bridge at Tappan Zee. Quarterly Report July 1 September 30, 2014
 Near-Field Sturgeon Monitoring for the New NY Bridge at Tappan Zee Quarterly Report July 1 September 30, 2014 Prepared by AKRF, Inc. 7250 Parkway Drive, Suite 210 Hanover, MD 21076 for New York State Thruway
Fine-Scale Survey of Right and Humpback Whale Prey Abundance and Distribution
 DISTRIBUTION STATEMENT A. Approved for public release; distribution is unlimited. Fine-Scale Survey of Right and Humpback Whale Prey Abundance and Distribution Joseph D. Warren School of Marine and Atmospheric
Final Cruise Report Marine Mammal Observer UNDET Monitoring Hawaii Range Complex, April, 2011
 213 APPENDIX I. Cruise Report, Marine Mammal Observer UNDET Monitoring Hawaii Range Complex, August 12, 2011 Final Cruise Report Marine Mammal Observer UNDET Monitoring Hawaii Range Complex, 26-27 April,
Advanced PMA Capabilities for MCM
 Advanced PMA Capabilities for MCM Shorten the sensor-to-shooter timeline New sensor technology deployed on off-board underwater systems provides navies with improved imagery and data for the purposes of
Waves, Bubbles, Noise, and Underwater Communications
 Waves, Bubbles, Noise, and Underwater Communications Grant B. Deane Marine Physical Laboratory, Scripps Institution of Oceanography UCSD, La Jolla, CA 92093-0238 phone: (858) 534-0536 fax: (858) 534-7641
Waves, Bubbles, Noise, and Underwater Communications
 Waves, Bubbles, Noise, and Underwater Communications Grant B. Deane Marine Physical Laboratory, Scripps Institution of Oceanography UCSD, La Jolla, CA 92093-0238 phone: (858) 534-0536 fax: (858) 534-7641
NATIONAL MARINE RESEARCH VESSELS
 NATIONAL MARINE RESEARCH VESSELS VESSEL CHARTER GUIDELINES 2018-2019 1. INTRODUCTION The Marine Institute operates the national marine research fleet (RV Celtic Explorer and RV Celtic Voyager) on behalf
I. Monitoring and Adaptive Management Approach. Potential Effects, Monitoring Studies & Mitigation
 I. Monitoring and Adaptive Management Approach Define the problem or management objective. Determine potential effects of the project on indicator species. Emphasis on examining potentially negative, rather
GOLFER. The Golf Putting Robot
 GOLFER The Golf Putting Robot Written By Wing Pan Yuen For EEL 5666 Intelligent Machines Design Laboratory December 05, 1999 Table of Contents Abstract Introduction Executive Summary Integrated System
ATLANTIC- BRS: 2018 Experimental Plan May 2018
 ATLANTIC- BRS: 2018 Experimental Plan May 2018 Overview The Atlantic-BRS project was conceived, designed, initiated through a collaboration of researchers at several partnering organizations to study the
COSTA RICA DOME BLUE WHALE CRUISE REPORT Todd Chandler and John Calambokidis Cascadia Research Collective November 2004
 COSTA RICA DOME BLUE WHALE CRUISE REPORT Todd Chandler and John Calambokidis Cascadia Research Collective November 2004 Vessels: 50 (15m) Sailing vessel Russamee 14 (4.3m) Inflatable launch Cruise Dates:
Minimal influence of wind and tidal height on underwater noise in Haro Strait
 Minimal influence of wind and tidal height on underwater noise in Haro Strait Introduction Scott Veirs, Beam Reach Val Veirs, Colorado College December 2, 2007 Assessing the effect of wind and currents
Evidence of Anton van Helden in the matter of the applications by Trans Tasman Resources Limited for marine and discharge consents to recover iron
 Evidence of Anton van Helden in the matter of the applications by Trans Tasman Resources Limited for marine and discharge consents to recover iron sand in the South Taranaki Bight Qualifications of Anton
Sentry de-brief summaries 2011/2012
 Three cruises*: 1 Sentry/TowCam 1 Sentry/TowMag 1 Sentry/Jason *All cruises were post-refit 1 Pre-Cruise Planning: For two cruises everything was fine and went well For 1 cruise - planning began just one
~Donna S. Printed on Recycled Paper AUG
 UNITED STATES DEPARTMENT OF COMMERCE National Oceanic and Atmospheric Administration NATIONAL MARINE FISHERIES SERVICE Silver Spring, MO 2091 O AUG 2 1 2017 Commander, 86th Fighter Weapons Squadron 1001
Tracking Juvenile Summer Flounder
 Tracking Juvenile Summer Flounder East Coast MARE Materials For the leader: Whiteboard Markers (different colors) For each group: Copies of student group packets Copies of student worksheet Overview Scientists
CORRELATION BETWEEN SONAR ECHOES AND SEA BOTTOM TOPOGRAPHY
 CORRELATION BETWEEN SONAR ECHOES AND SEA BOTTOM TOPOGRAPHY JON WEGGE Norwegian Defence Research Establishment (FFI), PO Box 115, NO-3191 Horten, Norway E-mail: jon.wegge@ffi.no False alarms resulting from
Using DTAGs to understand sound use, behavior, and vessel and associated noise effects in Southern Resident killer whales
 Western Washington University Western CEDAR Salish Sea Ecosystem Conference 2018 Salish Sea Ecosystem Conference (Seattle, Wash.) Apr 6th, 9:15 AM - 9:30 AM Using DTAGs to understand sound use, behavior,
Understanding the Foraging Ecology of Beaked and Short-Finned Pilot Whales in Hawaiian Waters
 DISTRIBUTION STATEMENT A. Approved for public release; distribution is unlimited. Understanding the Foraging Ecology of Beaked and Short-Finned Pilot Whales in Hawaiian Waters PI: Whitlow W. L. Au 1 CoPI:
High Frequency Acoustical Propagation and Scattering in Coastal Waters
 High Frequency Acoustical Propagation and Scattering in Coastal Waters David M. Farmer Graduate School of Oceanography (educational) University of Rhode Island Narragansett, RI 02882 phone: (401) 874-6222
BEFORE THE ENVIRONMENTAL PROTECTION AUTHORITY JOINT STATEMENT OF EXPERTS IN THE FIELD OF MARINE MAMMALS
 BEFORE THE ENVIRONMENTAL PROTECTION AUTHORITY IN THE MATTER of the Exclusive Economic Zone and Continental Shelf (Environmental Effects) Act 2012 AND IN THE MATTER of an Application for Marine D u m p
From Clicks to Counts
 From Clicks to Counts Tina M. Yack 1*, Shannon Coates 1, Danielle Harris 2, Len Thomas 2, Thomas Norris 1, Elizabeth Ferguson 1, and Brenda K. Rone 3 1. Bio-Waves, Inc. 364 2 nd Street, Suite #3, Encinitas,
1.0 PURPOSE AND NEED
 1.0 PURPOSE AND NEED 1.0 PURPOSE OF AND NEED FOR THE PROPOSED ACTION 1.1 INTRODUCTION The National Environmental Policy Act (NEPA) of 1969, as amended (42 United States Code Section 4321 et seq.); the
Wind Flow Validation Summary
 IBHS Research Center Validation of Wind Capabilities The Insurance Institute for Business & Home Safety (IBHS) Research Center full-scale test facility provides opportunities to simulate natural wind conditions
Acoustic Focusing in Shallow Water and Bubble Radiation Effects
 Acoustic Focusing in Shallow Water and Bubble Radiation Effects Grant B. Deane Marine Physical Laboratory, Scripps Institution of Oceanography UCSD, La Jolla, CA 92093-0238 Phone: (858) 534-0536 fax: (858)
Acoustic Seaglider for Beaked Whale Detection
 DISTRIBUTION STATEMENT A: Approved for public release; distribution is unlimited. Acoustic Seaglider for Beaked Whale ion Neil M. Bogue and Jim Luby Applied Physics Laboratory University of Washington
High Frequency Acoustical Propagation and Scattering in Coastal Waters
 High Frequency Acoustical Propagation and Scattering in Coastal Waters David M. Farmer Graduate School of Oceanography (educational) University of Rhode Island Narragansett, RI 02882 Phone: (401) 874-6222
Admiralty Inlet Pilot Tidal Project FERC No Appendix C. Derelict Gear Monitoring Plan
 Appendix C Derelict Gear Monitoring Plan ADMIRALTY INLET PILOT TIDAL PROJECT FERC PROJECT NO. 12690 DERELICT GEAR MONITORING PLAN (submitted with the Final Application for a New Pilot Project License)
Use of a low power, airgun sound source to accurately determine sound. Transmission Loss characteristics at the proposed Robin Rigg. Windfarm site.
 Submitted to: Submitted by: The Scottish Executive On behalf of: Mr M J Swanwick Mr S J Parvin EON-UK Subacoustech Ltd Westwood Way Chase Mill Westwood Business Park Winchester Road Coventry Bishop s Waltham
Using an Adaptive Thresholding Algorithm to Detect CA1 Hippocampal Sharp Wave Ripples. Jay Patel. Michigan State University
 Using an Adaptive Thresholding Algorithm to Detect CA1 Hippocampal Sharp Wave Ripples Jay Patel Michigan State University Department of Physics and Astronomy, University of California, Los Angeles 2013
United States Lifesaving Association RECOMMENDED MINIMUM GUIDELINES FOR OPEN WATER SWIMMING EVENT SAFETY
 United States Lifesaving Association RECOMMENDED MINIMUM GUIDELINES FOR OPEN WATER SWIMMING EVENT SAFETY STATEMENT ON Approved by the United States Lifesaving Association Board of Directors: [Date] BACKGROUND
Characterizing The Surf Zone With Ambient Noise Measurements
 Characterizing The Surf Zone With Ambient Noise Measurements LONG-TERM GOAL Grant Deane Marine Physical Laboratory Scripps Institution of Oceanography La Jolla, CA 93093-0213 phone: (619) 534-0536 fax:
Issues Affecting the Southern Resident Orcas
 Reading Practice A Issues Affecting the Southern Resident Orcas Orcas, also known as killer whales, are opportunistic feeders, which means they will take a variety of different prey species. J, K, and
DISTRIBUTION STATEMENT A. Approved for public release; distribution is unlimited.
 DISTRIBUTION STATEMENT A. Approved for public release; distribution is unlimited. The Effects of Behavioral Change in Response to Acoustic Disturbance on the Health of the Population of Blainville s Beaked
Benefit of ESTCP/SERDP Research Program on Underwater Explosive Safety
 Benefit of ESTCP/SERDP Research Program on Underwater Explosive Safety Timothy W. Shelton, PE Supervisory Research Hydraulic Engineer ERDC CHL Oct 2017 DoD has very few options for disposing UXO recovered
BAJA BLUE WHALE RESEARCH 2011
 BAJA BLUE WHALE RESEARCH 2011 Summary of research conducted by Cascadia Research as a part of an Oceanic Society Research Expedition with volunteers from Road Scholar Expedition Dates: ch 26 il 2, 2011
The Impact on Great South Bay of the Breach at Old Inlet Charles N. Flagg School of Marine and Atmospheric Sciences, Stony Brook University
 The Impact on Great South Bay of the Breach at Old Inlet Charles N. Flagg School of Marine and Atmospheric Sciences, Stony Brook University The previous report provided a detailed look at the conditions
Trip Report, Marine Mammal Monitoring Mine Neutralization Exercise Events, September 2012 VACAPES Range Complex
 February 2013 Trip Report, Marine Mammal Monitoring Mine Neutralization Exercise Events, September 2012 VACAPES Range Complex Prepared for: Commander, United States Fleet Forces Command Prepared by: Naval
Final Report. August Prepared for: Commander, U.S. Pacific Fleet
 Final Report Prepared for: Commander, U.S. Pacific Fleet Submitted to: Naval Facilities Engineering Command Pacific under HDR Environmental, Operations and Construction, Inc. Contract No. N62470-10-D-3011,
Model-based Adaptive Acoustic Sensing and Communication in the Deep Ocean with MOOS-IvP
 Model-based Adaptive Acoustic Sensing and Communication in the Deep Ocean with MOOS-IvP Henrik Schmidt & Toby Schneider Laboratory for Autonomous Marine Sensing Systems Massachusetts Institute of technology
FINAL REPORT LATTE Linking Acoustic Tests and Tagging using statistical Estimation
 DISTRIBUTION STATEMENT A. Approved for public release; distribution is unlimited. FINAL REPORT LATTE Linking Acoustic Tests and Tagging using statistical Estimation Len Thomas & John Harwood Centre for
Recommendations for the Risk Assessment of Buffer Stops and End Impact Walls
 Recommendations for the Risk Assessment of Buffer Stops and End Synopsis This document gives details of a recommended method which, if followed, would meet the requirements of section 11, Buffer Stops
A-7 End of Survey Environmental Report Marine Seismic Survey
 A-7 End of Survey Environmental Report Marine Seismic Survey Table of Contents 1. INTRODUCTION... 3 1.1 Purpose... 3 2. ACTIVITY SUMMARY... 3 3. THAZIN MSS MFO MITIGATION SUMMARY... 4 3.1 Summary information...
STOPPING THE UNDERWATER DIVER THREAT
 STOPPING THE UNDERWATER DIVER THREAT Dr. Robert F. De La Croix and Mr. Juergen G. Keil A non-lethal, scalable deterrent solution Updated from original article published in Maritime Technology Reporter,
METHODOLOGY. Signalized Intersection Average Control Delay (sec/veh)
") Chapter 5 Traffic Analysis 5.1 SUMMARY US /West 6 th Street assumes a unique role in the Lawrence Douglas County transportation system. This principal arterial street currently conveys commuter traffic
Chapter 5 Traffic Analysis 5.1 SUMMARY US /West 6 th Street assumes a unique role in the Lawrence Douglas County transportation system. This principal arterial street currently conveys commuter traffic
Figure 4, Photo mosaic taken on February 14 about an hour before sunset near low tide.
 The Impact on Great South Bay of the Breach at Old Inlet Charles N. Flagg and Roger Flood School of Marine and Atmospheric Sciences, Stony Brook University Since the last report was issued on January 31
Marine Mammal Mitigation Systems
 Marine Mammal Mitigation Systems Seiche Measurements Limited (Seiche) designs and manufactures underwater sound measurement and marine mammal monitoring equipment for the oil and gas and renewables sectors.
LATTE Linking Acoustic Tests and Tagging Using Statistical Estimation
 DISTRIBUTION STATEMENT A. Approved for public release; distribution is unlimited. LATTE Linking Acoustic Tests and Tagging Using Statistical Estimation Len Thomas & John Harwood Centre for Research into
WildCat RF unit (0.5W), full 32-byte transmissions with built-in checksum
, full 32-byte transmissions with built-in checksum") Overview of SMRU series 9000 SRDL satellite tags Basic tag construction and function Housing: Standard sensors: Optional sensor: normal solid epoxy body rated to 500m, reinforced 2000m pressure (resolution
Overview of SMRU series 9000 SRDL satellite tags Basic tag construction and function Housing: Standard sensors: Optional sensor: normal solid epoxy body rated to 500m, reinforced 2000m pressure (resolution
Submitted in support of the 2012 Annual Marine Species Monitoring report for the U.S. Navy's Hawaii Range Complex
 Summary Estimated acoustic exposures on marine mammals sighted during a US Naval training event in February 2011 report date July 16, 2012 Stephen W. Martin and Roanne A. Manzano-Roth SPAWAR Systems Center
OVERARCHING PRINCIPLES AND BEST PRACTICE GUIDELINES FOR MARINE MAMMAL WATCHING IN THE WIDER CARIBBEAN REGION (WCR)
") OVERARCHING PRINCIPLES AND BEST PRACTICE GUIDELINES FOR MARINE MAMMAL WATCHING IN THE WIDER CARIBBEAN REGION (WCR) OVERARCHING PRINCIPLES AND BEST PRACTICE GUIDELINES FOR MARINE MAMMAL WATCHING IN THE
OVERARCHING PRINCIPLES AND BEST PRACTICE GUIDELINES FOR MARINE MAMMAL WATCHING IN THE WIDER CARIBBEAN REGION (WCR) OVERARCHING PRINCIPLES AND BEST PRACTICE GUIDELINES FOR MARINE MAMMAL WATCHING IN THE
The Evolution of an Autonomous Unmanned Surface Vessel and Software for Hydrographic Survey
 The Evolution of an Autonomous Unmanned Surface Vessel and Software for Hydrographic Survey Paul Donaldson In 2017, Leidos, Inc. participated in both the Gulf of Mexico Unmanned Systems Operational Demonstration
Bainbridge Island School District Life Science UNIT 2 - Southern Resident Orcas Grade 4
 Bainbridge Island School District Life Science UNIT 2 - Southern Resident Orcas Grade 4 Unit created by Laurie Spickard, curriculum specialist Essential question for the unit Why are the Southern Resident
Can we be as clever as a sperm whale?
 Can we be as clever as a sperm whale? { Efficacy of Counter-Measures to Reduce Sperm Whale Depredation on Demersal Longlines in the Gulf of Alaska Wild, Straley, Thode, Liddle, Mathias, O Connell, Behnken,
Description of Underwater Noise Attenuation System Design Unit 2. New NY Bridge Project
 New NY Bridge Project Description of Underwater Noise Attenuation System (NAS) Design Unit 2 Description of Underwater Noise Attenuation System Design Unit 2 for the New NY Bridge Project Revision 1 May
BEFORE YOU OPEN ANY FILES:
 Dive Analysis Lab * Make sure to download all the data files for the lab onto your computer. * Bring your computer to lab. * Bring a blank disk or memory stick to class to save your work and files. The
LATTE Linking Acoustic Tests and Tagging Using Statistical Estimation
 DISTRIBUTION STATEMENT A. Approved for public release; distribution is unlimited. LATTE Linking Acoustic Tests and Tagging Using Statistical Estimation Len Thomas and John Harwood Centre for Research into
Behavioral Response of Dolphins to Signals Simulating Mid-Frequency Sonar
 DISTRIBUTION STATEMENT A: Approved for public release; distribution is unlimited. Behavioral Response of Dolphins to Signals Simulating Mid-Frequency Sonar Dorian S. Houser Biomimetica 7951 Shantung Drive
2016 West Coast Entanglement Summary
 March 2017 2016 West Coast Entanglement Summary Overview of Entanglement Data west coast region MMHSRP Permit #18786 In 2016, 71 separate cases of entangled whales were reported off the coasts of Washington,
Baseline Behavior of Pilot Whales and their Responses to Playback of Anthropogenic and Natural Sounds
 DISTRIBUTION STATEMENT A. Approved for public release; distribution is unlimited. Baseline Behavior of Pilot Whales and their Responses to Playback of Anthropogenic and Natural Sounds Peter Tyack, Senior
Observing the behavioral response of herring exposed to mid-frequency sonar signals
 Observing the behavioral response of herring exposed to mid-frequency sonar signals Handegard 1, Nils Olav and Doksaeter 1, Lise and Godoe 1, Olav Rune and Kvadsheim 2, Petter H. 1 Institute of Marine
Sustainable Whale Watching Checklist
 Sustainable Whale Watching Checklist Description of the Organization to be audited This document has to be filled in only by the auditor of the selected certification body for the given audit. The document
Cruise Report Marine Mammal and Sea Turtle Observer UNDET Monitoring Hawaii Range Complex: 3 April 2014
 January 15, 2015 Cruise Report Marine Mammal and Sea Turtle Observer UNDET Monitoring Hawaii Range Complex: 3 April 2014 Prepared for: Commander, U.S. Pacific Fleet Prepared by: Naval Facilities Engineering
Beaked whale foraging behavior before, during, and after sonar exposure on a Navy test range
 Beaked whale foraging behavior before, during, and after sonar exposure on a Navy test range Stephanie Watwood, Elena McCarthy, Nancy DiMarzio, Ron Morrissey, Susan Jarvis, and David Moretti Marine Mammal
JIMAR PFRP ANNUAL REPORT FOR FY 2006
 JIMAR PFRP ANNUAL REPORT FOR FY 2006 P.I./Sponsor Name: Michael P. Seki and Jeffrey J. Polovina Project Proposal Title: Oceanographic Characterization of the American Samoa Longline Fishing Grounds for
ATTACHMENT CA fisherman Jim Anderson, CA Working Group
 ATTACHMENT 5 What are some of the things being done on the west coast? Included in this attachment: 5.1 Jim Anderson: CA working group fisherman 5.2 Dan Ayers: WDFW gear retrieval 5.3 Amanda Gladics OR
7 th International Conference on Wind Turbine Noise Rotterdam 2 nd to 5 th May 2017
 7 th International Conference on Wind Turbine Noise Rotterdam 2 nd to 5 th May 2017 Sound power level measurements 3.0 ir. L.M. Eilders, Peutz bv: l.eilders@peutz.nl ing. E.H.A. de Beer, Peutz bv: e.debeer@peutz.nl
Lab 4: Pressure Gradients over a Wing
 2009 Lab 4: Pressure Gradients over a Wing Innovative Scientific Solutions Inc. 2766 Indian Ripple Road Dayton, OH 45440 (937)-429-4980 Lab 4: Pressure Gradients over a Wing Introduction: Like the previous
Observations of Near-Bottom Currents with Low-Cost SeaHorse Tilt Current Meters
 DISTRIBUTION STATEMENT A. Approved for public release; distribution is unlimited. Observations of Near-Bottom Currents with Low-Cost SeaHorse Tilt Current Meters Vitalii A. Sheremet, Principal Investigator