ULTRADEEP WATER BLOWOUTS: COMASIM DYNAMIC KILL SIMULATOR VALIDATION AND BEST PRACTICES RECOMMENDATIONS
|
|
|
- Charlotte Nelson
- 6 years ago
- Views:
Transcription
1 1 ULTRADEEP WATER BLOWOUTS: COMASIM DYNAMIC KILL SIMULATOR VALIDATION AND BEST PRACTICES RECOMMENDATIONS A Thesis by SAMUEL F. NOYNAERT Submitted to the Office of Graduate Studies of Texas A&M University in partial fulfillment of the requirements for the degree of MASTER OF SCIENCE December 2004 Major Subject: Petroleum Engineering
2 2 ULTRADEEP WATER BLOWOUTS: COMASIM DYNAMIC KILL SIMULATOR VALIDATION AND BEST PRACTICES RECOMMENDATIONS A Thesis by SAMUEL F. NOYNAERT Submitted to Texas A&M University in partial fulfillment of the requirements for the degree of MASTER OF SCIENCE Approved as to style and content by: Jerome J. Schubert (Chair of Committee) Hans C. Juvkam-Wold (Member) Ann Kenimer (Member) Stephen A. Holditch (Head of Department) December 2004 Major Subject: Petroleum Engineering
3 iii ABSTRACT Ultradeep Water Blowouts: COMASim Dynamic Kill Simulator Validation and Best Practices Recommendations. (December 2004) Samuel F. Noynaert, B.S., Texas A&M University Chair of Advisory Committee: Dr. Jerome J. Schubert The petroleum industry is in a constant state of change. Few industries have advanced as far technologically as the petroleum industry has in its relatively brief existence. The produced products in the oil and gas industry are finite. As such, the easier to find and produce hydrocarbons are exploited first. This forces the industry to enter new areas and environments to continue supplying the world s hydrocarbons. Many of these new frontiers are in what is considered ultradeep waters, 5000 feet or more of water. While all areas of the oil and gas industry have advanced their ultradeep water technology, one area has had to remain at the forefront: drilling. Unfortunately, while drilling as a whole may be advancing to keep up with these environments, some segments lag behind. Blowout control is one of these areas developed as an afterthought. This lax attitude towards blowouts does not mean they are not a major concern. A blowout can mean injury or loss of life for rig personnel, as well as large economic losses, environmental damage and damage to the oil or gas reservoir itself. Obviously, up-to-date technology and techniques for the prevention and control of ultradeep water blowouts would be an invaluable part of any oil and gas company s exploration planning and technology suite. To further the development of blowout prevention and control, COMASim (Cherokee Offshore, MMS, Texas A&M Simulator) was developed. COMASim
4 iv simulates the planning and execution of a dynamic kill delivered to a blowout. Through a series of over 800 simulation runs, we were able to find several key trends in both the initial conditions as well as the kill requirements. The final phase of this study included a brief review of current industry deepwater well control best practices and how the COMASim results fit in with them. Overall, this study resulted in a better understanding of ultradeep water blowouts and what takes to control them dynamically. In addition to this understanding of blowouts, COMASim s strengths and weaknesses have now been exposed in order to further develop this simulator for industry use.
5 v DEDICATION I would like to dedicate this thesis to my family: my wife Courtney who was the best wife, cheerleader and overall best support team I could ask for and who has been waiting for this moment for three long years. Her love and dedication was all that kept me going at times. To my study partners: Daisy, Shiner, Phoebe and Socks who stayed up every night with me making sure the work got done. I also dedicate this work to my parents for imparting a love of knowledge to me at an early age. Particularly my mother who has demonstrated the fact that education is a lifelong process and doesn t have to limited by number of degrees or time.
6 vi ACKNOWLEDGEMENTS I would like to acknowledge the following for the priceless help, advice and support I received during this endeavor: I would first like to acknowledge my committee of Dr. Jerome J. Schubert, Dr. Hans Juvkam-Wold, and Dr. Ann Kenimer for helping this work be accurate and something that I can be proud of. I would also like to acknowledge Dr. Stephen A. Holditch and Dr. Tom Blasingame for your advice and help concerning my decision on whether or not to even enter this department and industry. In addition, I would like to acknowledge Curtis Weddle and Steve Walls for providing their time to give us an industry view of this study and tell us where the theory broke down. I would be remiss if I did not acknowledge RPSEA (Research Partnership to Secure Energy for America) for funding this study. And last but not least, I would like to acknowledge Dr. Ray T. Oskarsen for his tireless help with this project even after he finished his part and went out into the real world. Without Ray s help, this project would still be floundering towards a finish. To all: Thank you for your help, Gig em and God Bless
7 vii TABLE OF CONTENTS Page ABSTRACT... DEDICATION... ACKNOWLEDGEMENTS... iii v vi TABLE OF CONTENTS... vii LIST OF FIGURES... x LIST OF TABLES... xiii CHAPTER I INTRODUCTION Blowouts Blowouts Historically Blowouts Statistically Blowout Control Measures Kill Method Selection II RESEARCH BACKGROUND Proposal Background and Objectives Thesis Objectives COMASim Background Simulator Calculations III COMASIM RESULTS AND ANALYSIS COMASim Simulation Input Values COMASim Simulation Procedure Validation of COMASim COMASim Initial Condition Analyses Effect of Size and Drillstring Presence on Initial Conditions... 49
8 viii CHAPTER Page 3.6 Effect of Drillstring Length Kill with Drillstring Initial Conditions Dynamic Kill Requirements for Relief Well Necessary Situations Dynamic Kill Requirement for Kill with the Drillstring Situation IV ULTRA-DEEP WATER BLOWOUT PREVENTION AND CONTROL Ultra-deepwater Drilling Equipment Ultra-deepwater Blowout Control Equipment Ultra-deepwater Kicks and Well Control Ultra-deepwater Well Control Dynamic Kill Blowout Control V CONCLUSIONS AND RECOMMENDED FUTURE RESEARCH Ultradeep Water Blowout Control Conclusions Simple COMASim User Tasks and Extended Analysis Capability Multilateral Capability Fluid Fallback Underground Blowout Capability Linking to Dr. Jongguen Choe s Simulator Simulator Validation Combination Vertical Intervention and Relief Well Dynamic Kill Operations NOMENCLATURE REFERENCES APPENDIX A: SIMULATION RUN MATRIX APPENDIX B: RELIEF WELL INITIAL CONDITION RUNS APPENDIX C: RELIEF WELL KILL REQUIREMENTS APPENDIX D: KILL WITH DRILLSTRING INITIAL CONDITIONS
9 ix Page APPENDIX E: KILL WITH DRILLSTRING KILL REQUIREMENTS VITA
10 x FIGURE LIST OF FIGURES Page 1.1 Tripping in during bit change Well blows out in seconds Crew evacuation after blowout The well is abandoned and out of control Derrick collapses Spindletop s first well (Lucas well) was a blowout Frequency of blowouts per 100 wells in the Outer Continental Shelf (OCS) did not show improvement from Frequency of blowouts per 100 wells in onshore Texas increased from Frequency of blowouts per 10 6 feet drilled in onshore Texas is erratic and shows no improvement from 1960 to Number of blowouts per phase in progress shows most blowouts occur in unfamiliar drilling situations Percentage of OCS blowouts having a certain fluid composition indicates majority of blowouts were gas Relative majority of OCS blowouts controlled by bridging Typical capping stacks Momentum kill theory Blowout control through flooding is a lengthy process Depletion kill or waterflood relief well bottomhole location Relief intersection point allows maximum use of frictional pressure Control of large blowout completed using dynamic kill in approximately 12 minutes a Example kill method selection flowchart I b Example kill method selection flowchart II... 27
11 xi FIGURE Page 1.19c Example kill method selection flowchart III d Example kill method selection flowchart IV Screen shot of COMASim interface shows simplicity of operation Graphical example of general nodal analysis calculation Example of use of nodal analysis to find required dynamic kill rate No drillstring in wild well Drillstring dropped Drillstring hanging from BOP Drillstring used to kill well Typical psi fracturing vessel Comparison of solution types shows zero-derivative curve grossly over calculates the dynamic kill solution Numerical output of COMASim is limited to 10 equally spaced points Numerical output for a hanging drillstring at ft TVD, ft drillstring, 5000 ft of water, 10 ¾ casing Close-up of graph from Fig. 3.3, a hanging drillstring at ft TVD, ft drillstring, 5000 ft of water, 10 ¾ inch casing Hanging drillstring situations shows typical behavior for pressure profile Dropped drillstring data matches hanging drillstring pressure profile No drillstring in hole reduces pressure value and variation Effect of drillstring length on hanging drillstring, ft TVD, 5000 ft water depth, 10 ¾ inch casing Effect of drillstring length on dropped drillstring, ft. TVD, 5000 ft water depth, 10 ¾ inch casing Difference between 3250 ft. of drillstring in ft TVD in 5000 ft of water with 10 ¾ inch casing... 56
12 xii FIGURE Page ft TVD, 5000 ft water depth, 10 ¾ inch casing, drillstring is 75% of TVD Kill with drillstring, ft TVD, 5000 ft water depth, 10 ¾ inch casing shows decreasing bottom-hole pressures as drillstring length decreases Kill with drillstring, ft TVD, 5000 ft water depth, drillstring length is 75% of TVD Relief well flow path Dynamic kill rates differ widely among drillstring statuses as drillstring length decreases Increasing casing size in with no drillstring present increases number of relief wells required Kill rates increase for larger casing sizes Example of drillship Example of semi-submersible ABB Vetco Gray composite material riser increases water depth capability of floaters Acoustic control system on lower marine riser package Example of offshore dynamic kill pumping plant Increasing kill fluid weight reduces the kill rate a Onshore gradients b Offshore gradients Comparison of casing shoe pressures between Drillers method and Wait and Weight Method shows Drillers method causes lost circulation Decision process for dynamic kill path Data from Adams et al. shows minimal loss of buoyancy from blowout plume Data from Adams et al. shows wide plume at surface for blowout in feet of water... 91
13 xiii TABLE LIST OF TABLES Page 1.1 SINTEF database concurs with Skalle et al. database findings on blowout causes Distribution of most frequent operation phase failures (Louisiana, Texas, OCS; ) shows majority of blowout causes are human error Gulf of Mexico (GoM) development wells drilled twice as fast as Norwegian development wells Input options for COMASim Blowout information for COMASim validation problem Hanging and dropped drillstrings allow almost identical flow rates Blowing wellbores with no drillstring have higher Q g,surface Kill with drillstring configuration yields higher Q g,surface Kill with drillstring, ft TVD, 5000 ft water depth, 10 ¾ inch casing shows flow rate increases as drillstring length decreases ft TVD, 5000 ft water depth, kill rate increases with increasing casing size Increasing relief well MD/TVD ratio increases relief well parameters Kill with drillstring kill rates similar to dropped drillstring Decreasing drillstring length increases kill requirements Hang-off, shut-in, and flow-check procedure Drillers method procedure for killing well Wait and Weight method for killing well... 85
14 1 CHAPTER I INTRODUCTION 1.1 Blowouts The petroleum industry constantly undergoes radical changes and progress. Few industries have advanced as far or as fast technologically as the petroleum industry has in the past century. This advancement has been caused by the lucrative nature of the oilfield business as well as the procurement of the product itself. Obviously as more money is put into an industry, technological advancement becomes easier and often a necessary part of competition. However, in the petroleum industry the technological advancement has actually been a forced issue. The products we as an industry are trying to produce, oil and natural gas, are a finite resource. As the easier to find and produce hydrocarbons are used up, the industry must move into new areas to continue supplying the world with hydrocarbons. Many of these areas are in what is considered ultradeep waters, 5000 feet or more of water. This is a unique environment that requires many new techniques and technologies to explore and produce. As the various areas of the oil and gas industry advance their ultradeep water technology, one area has had to remain at the forefront: drilling. For example, geological exploration can be done with multibillion dollar seismic projects or by using the map as a dartboard. Either way, drilling must be done to confirm and develop the discovery. Without drilling, there simply is no petroleum industry. However, much of the drilling done is on unknown frontiers for hydrocarbon exploration. Often these frontiers are harsh environments either downhole, on the surface or both. Ultradeep water is a great example of a dangerous and unknown drilling environment. It is on these frontiers however that the advancement of technology is often disjointed. While drilling as whole may be advancing to keep up with these This thesis follows the style of SPE Drilling and Completion.
15 2 environments, some parts lag behind. An example of this is the running of casing offshore. Until very recently, casing was run in the same manner, and often using the same tools, as a casing job done twenty to thirty years ago. It has only been in the past few years that the use of technology like automatic pipe handling equipment has become widespread. This change brought on by pure safety concerns. Another area that is seen the same stagnation and recent call for change has been blowout control in deep and ultradeep waters. Blowout control is an area often put aside until the last minute for the industry. A blowout means that the drilling contractor and crew have failed in some way, and as is often the case in business, failure is not an option. However, in the case of drilling a well, failure in the form a blowout can mean injury or loss of life for rig personnel, large economic losses, environmental damage and damage to the oil or gas reservoir itself. Obviously, a contingency plan for the prevention and control of ultradeep water blowouts would be a valuable part of any oil and gas company s planning for the drilling of a well. The following sequence of photographs (Fig ) show the rapidity and unexpectedness of blowouts as well as some of the dangers. In Fig. 1.1, the derrick is shown prior to the blowout. In this picture, the drill collars are racked back in the derrick and the derrick man is on the monkeyboard. Fig. 1.2 occurs during a film change by the photographer immediately after taking Fig This shows how quickly the situation gets out of control. Once the blowout occurred, the crew began evacuation as shown in Fig In Fig. 1.3, the derrick man is seen just getting off of the geronimo line. In the same figure, a worker is shown narrowly avoiding falling drillpipe. As the crew left the location, the drill collars were ejected in Fig. 1.4 and the blowout continues. Finally, Fig. 1.5 shows the rig collapsing due to the weight of the racked-back drill collars. This is a dramatic series of pictures showing the potential dangers of a blowout. Fortunately no one was injured in this particular instance.


16 3 Fig. 1.1-Tripping in during bit change. 1 Fig. 1.2 Well blows out in seconds. 1 Fig. 1.3 Crew evacuation after blowout. 1 Fig. 1.4 The well is abandoned and out of control. 1

 in the oil and gas industry is of the first Spindletop gusher.")
17 4 Fig. 1.5 Derrick collapses Blowouts Historically Blowouts have been a problem for this industry since its inception. A famous picture (Fig. 1.6) in the oil and gas industry is of the first Spindletop gusher. The drillers of the original Fig Spindletop s first well (Lucas well) was a blowout. 2
18 5 Spindletop well, along with others in that era knew they had a good find when a blowout occurred. This was a dangerous situation which was eventually remedied with the invention of the BOP (Blowout preventer) in 1922 by the founders of Cooper Cameron. 3 However, in spite of the development of many safety measures such as the aforementioned BOPs, as well as numerous types of equipment and drilling procedures, blowouts still occur. In fact, since 1960 blowouts have occurred at a fairly stable rate 4. This rate has not changed even though blowout prevention equipment and procedures have drastically changed (Fig ) Wells in Thousands Frequency, BO/100 wells Year Fig. 1.7-Frequency of blowouts per 100 wells in the Outer Continental Shelf (OCS) did not show improvement from
19 * Wells in Thousands Frequency, BO/100 wells Year Fig. 1.8 Frequency of blowouts per 100 wells in onshore Texas increased from Fig. 1.9-Frequency of blowouts per 10 6 feet drilled in onshore Texas is erratic and shows no improvement from 1960 to
20 7 As evidenced by Figs the number of blowouts per feet drilled stayed relatively constant from 1960 to This was true for both the Outer Continental Shelf of the Gulf of Mexico (OCS) (Fig. 1.7) as well as for onshore Texas (Fig. 1.8). Further investigation shows that onshore Texas actually had several years in the mid s in which drilled footage went up and blowout frequency went down (Fig. 1.9). This is a strange phenomenon, considering that in boom times the industry tends to hire inexperienced personnel and rush to explore or produce hydrocarbons. However, the data shows a contrarian trend that shows blowouts being reduced in the mid-1980 s in spite of the boom occurring at the time. This is unexplainable based on the published data from the Skalle, et. al database. 4 Unfortunately, according to Fig. 1.9, this unique trend did not last. The drilled footage went down dramatically and the blowout frequency continued its steady climb. All of these numbers point to an irrefutable conclusion: blowouts will always happen no matter how far technology and training advance. 1.3 Blowouts Statistically Since we can reasonably expect blowouts to always occur in spite of technical advances, we must complete two tasks. First, we must conduct a quick study of why blowouts occur. Next, we must find ways to first prevent blowouts and in a worst case scenario, kill them. In the case of deepwater drilling, no studies have been undertaken. This is mostly due to lack of data. Therefore, this report uses data from onshore Texas and OCS wells to briefly discuss the causes of blowouts.
21 Tx OCS Drlg.expl Drlg.devlp Drlg.other Completion Work over Wire line Production Fig Number of blowouts per phase in progress shows most blowouts occur in unfamiliar drilling situations. 4 Table 1.1 SINTEF database concurs with Skalle et al. database findings on blowout causes 5,6. AREA Develop. Drilling Expl. Drilling unknown Drilling Completion Workover Production External cause* No ext. cause* Wireline Unknown Total North Sea (UK & Norway) 15.9% 50.0% 6.8% 6.8% 11.4% 2.3% 2.3% 2.3% 2.3% 100.0% US GoM OCS % 30.9% 0.0% 8.1% 18.4% 3.7% 5.1% 2.2% 1.5% 100.0% Total % 35.6% 1.7% 7.8% 16.7% 3.3% 4.4% 2.2% 1.7% 100.0% * External causes are typical; storm, military activity, ship collision, fire and earthquake. Fig clearly shows the most blowouts occur during the initial drilling of the wells, the exploration and development phase with the single most incidents during the
22 9 exploration phase. Table 1.1 is derived from the Foundation for Scientific and Industrial Research at the Norwegian Institute of Technology (SINTEF) blowout database. The SINTEF Group is a Norwegian R&D foundation which was hired by an industry group to study offshore blowouts. The resulting database is a proprietary database with limited results published. This database seems to be kept relatively up-to-date with the total number of offshore blowouts recorded at Table 1.1 confirms the Skalle, et al. database findings. OCS blowouts had the highest rate of occurrence for development and exploration drilling followed by workover operations. Table Distribution of most frequent operation phase failures (Louisiana, Texas, OCS; ) shows majority of blowout causes are human error. 4 Blowouts Distribution of specific failed barrier Primary Cause TX OC S Swabbing Drilling break Formation break down Trapped/expanding gas Gas cut mud Too low mud weight Wellhead failure x-mas tree failure While cement sets Secondary Cause Failure to close BOP BOP failed after closure BOP not in place Fracture at casing shoe Failed to stab string valve leakage Table 1.2 breaks down Fig into the causes of the blowouts within each operation phase. Concentrating on primary causes, several conclusions can be drawn. Overall, the majority of blowouts resulted from swabbed-in kicks. However, analyzing the results based on the type of operation in progress yields several interesting insights on causes other than swabbing. First, exploration drilling blowouts were more likely to be caused by unexpected obstacles and incomplete geological data than poor or sloppy
23 10 drilling practices. Drilling breaks, formation breakdown and gas cut mud problems were significantly higher in the exploration phase than in any other phase. All of these problems are ones that, when unexpected, can cause confusion on the drilling floor and lead to well control problems. Gas cut mud is a good example. When a drilling crew is expecting gas, they can increase mud logging frequency as well as put more emphasis on indicators such as slight pit gains which might otherwise be ignored. In development drilling, Table 1.2 shows that swabbing in kicks and having insufficient of mud weight were problems which occurred at rates higher than in other operation phases. Both problems are indicative of operators trying to speed up the drilling process. The operators are more likely to attempt to save time on development wells were they assume they know more about the potential challenges, than attempt to speed up the drilling of an exploration well through unknown challenges. Lowering mud weights increases the rate of penetration. Time taken to trip pipe out of the hole comprises a large amount of the time taken to drill a well. Therefore, operators try to reduce this time by pulling the pipe more quickly. Unfortunately, this causes a reduction in the pressure at the bottom of the wellbore and invites a kick. The most interesting finding in the available SINTEF data, the disparity between the North Sea and OCS in development well blowouts, touches on this problem. The North Sea had a much lower incidence rate of development well blowouts as highlighted in Table 1.1. Table 1.3 Gulf of Mexico (GoM) development wells drilled twice as fast as Norwegian development wells. 6 Development Drilling Exploration Drilling US GoM OCS Norway Wells With Wells With All Wells Duration <200 days All Wells Duration <200 days (days) (days) (days) (days)
24 11 It is evident why the North Sea development well blowout rate was much less when taking into account Table 1.3. Development wells in the Norwegian sector of the North Sea took twice as long as development well in the Gulf of Mexico. The reasons behind this would easily supply the fodder for years of future research. However, suffice it to say that the rapid drilling of development wells obviously adversely affects the blowout rates in said wells. Workover operations had the third highest number of blowouts. The cause which stands out in workover blowouts is trapped/expanding gas. This is most likely due to poor circulation techniques stemming from not enough complete circulations to rid the wellbore of gas after influxes, as well as poor handling of kicks, which allows unplanned expansion of gas. It is important to remember that the data in Fig the data is from onshore US and relatively shallow OCS wells. Ultradeep water wells will have similar well control issues but in an exaggerated manner. The increased pressures will cause influxes and blowouts to behave in different ways. Indicators and measurements of influxes such as pit gain and pressure values will be often deceptively benign until the situation has escalated to the point that control of problem will become a very complicated and dangerous task. The chief causes of blowouts shown in Table 1.2 will probably not change statistically. Therefore a reasonable assumption would be that by concentrating on these principal causes and taking into account the exaggerated effects caused by the ultradeep water environment, a suitable suite of best practices may be compiled for ultradeep water drilling. The compositions of the blowouts are not uniform. In fact, in the most comprehensive public database to date which was developed by Skalle, et al. 4, 7 there are eleven categories for blowing fluid composition: gas, gas & oil, gas & water, gas & condensate, gas & oil & water, condensate, oil, oil & water, water, mud, and no data.
25 12 7% 2% 4% 5% 2%1% 3% Gas Gas & Oil Gas & Water Condensate Oil Water Mud Missing Data 76% Fig Percentage of OCS blowouts having a certain fluid composition indicates majority of blowouts were gas. 7 Of the eleven possible fluid compositions, eight were observed in OCS blowouts from 1960 to Fig shows the 74 percent of blowouts had gas as the blowing fluid. In the Skalle, et al. database, kill methods were also studied. Eight primary kill methods were identified: collapse of open hole wellbore (bridging), closing BOP (BOP), pumping cement slurry (cement), capping, depletion of reservoir (depletion), installing equipment, pumping mud (mud), and drilling relief wells. Mud 19% Relief well 5% missing 3% Bridging 39% Install equipment 5% Depletion 9% cement 11% BOP 9% Fig Relative majority of OCS blowouts controlled by bridging. 7 Of these, seven were found to have been used to control OCS blowouts. Conspicuous in its absence was the technique of capping to actually stop the flow of
26 13 hydrocarbons. Of course, the majority of blowing wells will be capped once they are brought under control and decisions concerning the well s future are made. However, using capping as an initial control technique was not used in the OCS. This was most likely due to limited location size and the difficulty of maneuvering capping equipment around on the open water or on the seafloor. Fig reveals 48 percent of OCS blowouts were controlled by simply letting the blowout go. Thus bridging (39%) or depletion of the reservoir (9 %) occurred. The remaining kill methods employed were evenly distributed with pumping mud or bullheading being the next highest at 19 percent. 1.4 Blowout Control Measures There are many different ways to control a blowout. Since each blowing well is a unique situation, new techniques are often made up on the spot. An example of this on-the-fly engineering was seen in Kuwait with the Hungarian MIG jet-engines or Big Wind machine which controlled the blowout s fire with a blast of jet-wash. However, there are several more conventional and accepted forms of blowout control which are divided into surface intervention methods and subsurface intervention or relief well methods. 8 The most common methods in these two classifications are: Wellhead equipment installation/operation Capping Wellhead equipment installation/operation Cement/Gunk plug Bridging Depletion/flooding of reservoir Momentum kill/bullheading Dynamic kill

27 14 Capping operations occur when the blowout is controlled at the surface. Capping operations can be divided into three separate phases 9 : Extinguishing the fire Capping the well Killing the well If the well is on fire, then the first phase of capping will be to extinguish it. Exceptions to this case occur if there is any chance of danger to the personnel on location from the blowing fluids. The best example of this is the presence of H 2 S or hydrogen sulfide. H 2 S is extremely toxic and is therefore flared to avoid problems. Extinguishing the fire may be done with any number of methods ranging from large amounts of water to dynamite. Fig Typical capping stacks. 8
28 15 Once the flare has been extinguished, the actual capping of the well is started. A capping stack is attached to the wellbore. The typical capping stack will consist of a bell nipple, several rams, a diverter spool and possibly a ball valve (Fig. 1.13). 8 Normally a flange of some type will still be on the wellbore. If there is no available flange for attachment, a flow cross-over prepared from an inverted pipe ram and a slip ram will be used to attach to bare pipe. 8,9 The capping stack is then maneuvered onto this flange or bare pipe. Once the capping stack is secured, flow will be diverted in a safe manner, either in a single vertical plume or through a diverter line. In situations where flow rates are high enough, the diverter line may be an emergency sale line. 8 This would reduce the economic loss caused by the blowout. After the capping stack is successfully installed, the flow is diverted to a location some distance away from the wellhead using the rams and diverter spool in the capping stack. 10 The diversion of flow allows the well control operations to take place safely around the wellhead. The well control operations typically consist of pumping a heavy mud down the wellbore in an attempt to regain hydrostatic control of the well. 9 Capping is not applicable for use in ultra-deepwater situations because the blowing fluid must be coming to the surface. As will be discussed later in this report, the marine riser in ultradeepwater situations has a good chance of failure in this event thus rendering capping useless. Wellhead equipment installation and operation is a simple method that is usually employed in response to a very poorly handled blowout. To control a blowout through this method, blowout specialists will reenter the location or platform and operate or install the equipment necessary to shut-in the well safely. There are several instances in OCS files where rig personnel abandoned the rig before being able to operate the BOP. In these cases, the blowout was controlled by simply closing the BOP. 11 In cases of equipment failure, the blowout specialists need to remove the malfunctioning equipment and install new equipment. Once this is accomplished, the new equipment will be used to kill the blowout.
29 16 Fast-acting cement and gunk plugs are the least desirable of the blowout control alternatives. They are used in the event of an underground blowout to stem the flow of blowing fluids into the formation. Either compound is introduced into the wild wellbore from the wellhead, capping stack or, if necessary, from a relief well. Fast-acting cement is a cement compound mixed with an accelerant. 12 The hoped-for result is that the cement will set in the wild wellbore before exiting the said wellbore into the formation. This will stop the flow to the thief zone and allow the well to be effectively killed from the surface. Gunk and invert-gunk are used with the same goal in mind. Gunk is mixture of cement, bentonite and diesel fuel. The mixture is stable until mixed with any type of water-based mud. Upon mixing with water, Gunk forms a thick gelatin plug. 12 Salt Gunk has guar and lost circulation material and reacts in the same way with saltwater. 12 Invert-Gunk is made with amine clay and water and reacts with oil-based muds. All of the Gunk products have a bread-like texture that is very drillable. However, long Gunk plugs are capable of handling large differential pressures. 12 The problem with Gunk and cement is an obvious one: they are permanent. If the plug is placed wrong, whether in the drillstring or above the thief zone, the damage is considered irreparable. A poorly spotted plug usually results in loss of the blowing wellbore and necessitates a relief well. Even a properly spotted plug can cause disastrous results. If the pressure behind the plug builds up high enough, a new thief zone may be created. However, because the plug is fairly permanent, wellbore or vertical intervention is not an option after a plug has been pumped. Thus, the more expensive and time-consuming option of a relief well must be used. Bridging and depletion of the blowout are not active methods for blowout control. However, since they do account for the majority of kills, a mention is needed. Some studies have shown that blowouts likely to bridge will do so in 24 hours. 13 Once the 24 hours mark is reached, bridging will not occur unless triggered by another intervention method through active bridging. 13 The bridging will occur due to factors including nearwellbore pressure draw down, erosion of wellhead equipment, and formation failure due to high flow rates. The first simulator to be developed in the study this report is part of
30 17 deals exclusively with bridging and will cover this in much greater detail. Passive bridging is an always hoped-for solution because it does not require any work, and the only resulting economic losses are from the blowout itself. This being said, most blowout contingency plans require a planning and observation period after evacuation of the rig. During this period, the well is monitored for bridging. This negates a need to allow more time in a contingency plan for the wellbore to bridge. Bullheading and momentum kills are very similar in process. Bullheading attempts to pump into the wellbore, push the blowing fluids back into the reservoir and finish with a wellbore full of kill-weight fluid. 8 Bullheading is the most common method of containing onshore blowouts, and ranks third in OCS blowouts. 7 The reason behind this statistic is the simplicity of the method and the ready availability of the necessary equipment on any drilling rig. The only problem with bullheading is the formation typically fractures during the process. If the mud thief zone is too shallow, not enough hydrostatic pressure will exist to control the blowout. Therefore, this method is best suited to deeper cased holes or blowouts with short open-hole intervals. 8 In ultradeepwater situations, some leniency concerning the thief zone depth is given due to the hydrostatic pressures exerted by the seawater. This hydrostatic pressure may also save a bullheading operation that fractures a shallow formation.
31 18 Fig Momentum kill theory. 8 Momentum kills are a compromise between dynamic kills and bullheading. In fact, many dynamic kill attempts mentioned in literature are actually momentum kills. Momentum kills are reserved for blowouts where the weight of a fluid alone can not force the fluid down the blowing wellbore. The purpose of the momentum kill is to force the kill fluid down the wellbore by creating a momentum overbalance. Using higher pumping rates in conjunction with high mud weights, the momentum of the blowing fluid can be overcome. 8 Of course, once the blowing fluid has been forced back into the reservoir, adequate hydrostatic head must be maintained to keep the blowing formation in check. Momentum kills can be difficult to model, as some simulators do not recognize that, even though the theoretical hydrostatic pressure of a column of kill mud may kill a well, the mud is unable to make it down the blowing wellbore based on weight alone. This report will not cover momentum kills for ultra-deepwater due the simulator s inability to model them and because the setup and planning for a momentum kill is essentially the same as a dynamic kill. Relief wells can be drilled with several objectives in mind. The first objective is that they never be used. This is simply due to the time and cost involved in a relief well. Usually relief wells are spudded early on in a blowout when the possibility they might be
 is reached, the relief well will often be drilled and completed as a producing well.")
32 19 needed arises. While relief wells are being drilled, surface intervention techniques are still being attempted. If the surface intervention succeeds before the relief well total depth (TD) is reached, the relief well will often be drilled and completed as a producing well. 14 If the relief well is used to control the blowout, waterflooding, depletion, momentum kills, and dynamic kills are the methods used to kill the blowout. If the relief well reaches TD it may be used for several purposes. All relief wells drilled before the late 1970 s and some of the relief wells drilled after deal with the reservoir in two ways: flooding and depletion. Fig Blowout control through flooding is a lengthy process. 8 Killing a blowout through flooding is a lengthy process. This was first accomplished in 1933 and was the standard use of relief wells until the 1970 s. 15 The basic concept is to pump a volume of water into the reservoir that is significant enough to severely reduce the relative permeability of hydrocarbons to water. 8 Fig shows the waterflood does not take as long as a normal waterflood to reach the blowing well. This phenomenon is due the high flow rate of the blowing well causing the waterflood to favor a flow path towards the blowing well. 8 This reduces the time needed to achieve

33 20 breakthrough. The waterflood needs to achieve breakthrough before the blowout can be killed. The bottomhole locations of the blowing wellbore and relief well are shown in Fig Three problems exist with implementing a waterflood kill. The first is obtaining an accurate reservoir model, which may not be possible with blowouts on exploration wells. The second concern is that the reservoir permeability must be high enough that the waterflood occurs in a reasonable amount of time and with a reasonable volume of water reaching breakthrough. Finally, the third problem is with pressures. If the fracture pressure is exceeded and a fracture begins to propagate, the waterflood will not be drawn towards the blowing well, but away from it along the fracture. On the other hand, the waterflood pressure must be high enough to overcome the static reservoir pressure in order to drive the waterflood. 8 Fig Depletion kill or waterflood relief well bottomhole location.
34 21 A depletion kill is a simple process entailing exactly what the name implies. For a depletion kill relief well, the relief well bottomhole locations are placed as close to possible to the blowing well open-hole section as seen in Fig The relief well is then turned into a producing well, with production rates as high as flaring or emergency sale lines can handle. The idea behind these actions is that the relief well production will deplete the reservoir around the blowing well and cause the blowout flow to subside or stop. 8 Surface intervention methods would then be applied to permanently kill the blowing well. In 1978, Mobil Oil had a 400 MMscfd gas blowout of a well in Indonesia s Arun field. Instead of taking the expected one year or more to kill, the blowout was controlled in 89 days. 16 A new technique invented by Mobil Oil engineers was the reason for the quick kill: dynamic kill. The dynamic kill method is applied through a relief well which has intersected and entered the blowing wellbore as close as possible to the flowing zone as seen in Fig The dynamic kill method uses a kill fluid, typically salt water if offshore, which by itself does not have sufficient hydrostatic head to control the influx. However, when the kill fluid is pumped through the relief well and up the annulus of the blowing well, high pump rates create additional frictional pressure. This frictional pressure supplements the hydrostatic pressure of the kill fluid creating a pressure overbalance which stops the influx. 8

35 Fig Relief intersection point allows maximum use of frictional pressure

36 Fig Control of large blowout completed using dynamic kill in approximately 12 minutes Fig illustrates the dramatic kill sequence of blowout in Syria killed dynamically. The series of pictures in Fig occurred over the span of twelve to fifteen minutes and shows graphically how several months of drilling a relief well culminates in a brief period of pumping kill fluid at high rates. Once control of a blowout has been gained with the light kill-fluid, a heavier mud is then pumped into the relief well. This mud should be capable of statically controlling the well with its hydrostatic pressure. Dynamic kills are ideal for several situations. The first type of situation is one like the 1978 Arun field blowout. The key indicator for the suitability of a dynamic kill
37 24 was the high flowing rate. Some blowouts have even required multiple relief wells 19, 18 pumping simultaneously due to extreme blowout flow rates. In these wells, it is not possible to get the equipment in position for other kill methods such as bullheading, much less attempt to enact these other techniques. The dynamic kill method theoretically allows for multiple wells to control an infinitely large blowout. While in reality this is not practical due to pumping and other equipment requirements, the fact remains that the dynamic kill technique is often the best choice in high-flow rate or hard to access blowouts. For other cases, the fracture gradient may be relatively low. Methods such as bullheading and momentum kills as well as surface intervention methods may raise wellbore pressures above the fracture pressure. This could lead to an underground blowout and complicate the blowout kill process. The dynamic kill method uses pump rates as the final push to overcome the wild well bottomhole pressure. Thus, the pump rates can be manipulated to stay within narrow pore pressure and fracture pressure differentials. 8 In fact, the dynamic kill itself typically causes minimal downhole damage. The subsequent static control method can be tailored to keep the wild well in production condition. In this manner, the operator can restart production either through the relief well or the wild well in a relatively short period of time. The path for the flow of the kill fluid is down through the annulus of the relief well and out and up the wellbore of the wild well. Another possible path, particularly in deepwater is down a drillstring in the wild well, and back up the wild well annulus. This is because the dispersal of the blowing fluids is sufficient to allow well control vessel operation directly above the blowing well. 20 is evidence fluid fallback occurs. 21,22 These paths are theoretical paths, as there This is discussed further in the Future Research section of this thesis. However, the assumption that no fluid fallback occurs is a proven, valid assumption that merely overestimates the kill-rates required. 21,22
38 Kill Method Selection Fighting blowouts is best left to specialists with years of experience. These specialists make decisions based not only on the parameters of the situation, but also on their personal experience. That being said, although there is an art to choosing a blowout method, there is a definite decision making process in selecting a blowout control method. Figs (a-d) show a kill method selection flowchart from Adams and Kuhlman 9 which shows the decision making process. Certainly the process is an exhaustive one which requires a lot of experience and knowledge.
39 Fig (a) Example kill method selection flowchart I. 9 26
40 Fig (b) Example kill method selection flowchart II. 9 27
41 Fig (c) Example kill method selection flowchart III. 9 28
42 Fig (d) Example kill method selection flowchart IV. 9 29
43 30 CHAPTER II RESEARCH BACKGROUND 2.1 Proposal Background and Objectives This study is part of a larger overall study originally submitted to the United States Minerals Management Service (MMS) 23 and later to the Research Partnership to Secure Energy for America 24 (RPSEA). The intent of the study was to develop up-todate blowout prevention and control procedures for ultra-deepwater through modeling. The last major works in this area were publications such as DEA-63: Floating Vessel Blowout Control published by Neal Adams Firefighters in These studies concentrated on water depths from 300 to 1500 feet with some slight consideration given to water depths greater than 1500 feet. At the time they were written, wells in water depths over 5000 feet were considered one-off wells that required years of planning and design. Publications covering this topic put forth the idea that a relief well for one of these one-off wells might not be realistic due to planning required and technology at the time of publishing. 13 However, in the past 13 years many advances in the deepwater drilling industry have been made and the limiting assumptions used in these studies are no longer valid. Since 1992, 1583 wells have been drilled in water depths exceeding 1500 feet and 328 wells were drilled in water depths greater than 5000 feet. 25 On January 7 th, 2004, Chevron U.S.A., Inc. reached total depth on a Gulf of Mexico Well in 10,011 feet of water, a new world record. 25 Studies done in the early 1990 s also were not in a position to account for the many new drilling technology developments which have taken place over the last 13 years such as dual gradient drilling In short, studies to date are comprehensive concerning floating vessel blowout control and are still valid for the majority of offshore drilling and blowout situations. However, they do not cover all of the drilling and potential blowout scenarios possible today. Therefore, the purpose of this study was not to supplant these studies, but to supplement them and other industry blowout prevention and control best practices to cover the new drilling environments and technologies which exist today.
44 31 The proposed overall study was to begin the development of two simulators. The first simulator is concerned with the bridging tendencies of ultra-deepwater blowing wells. Deepwater Gulf of Mexico sediments are widely known to be unconsolidated. The prevailing theory is that the majority of blowouts in ultra-deepwater would therefore bridge and surface or subsurface intervention methods would not be necessary. 24 The next simulator, COMASim, models the initial blowout conditions and the subsequent dynamic kill necessary to kill the wild well. The simulator is capable of modeling either a drillstring kill or relief wells to kill the blowout. A key feature of the simulator is that it is written in Java code which allows it to be easily accessed from the internet. The initial version of the simulator and a report were described by Oskarsen in The final portion of the study is to develop a series of best practices for ultradeepwater drilling and blowouts. The initial intent was to develop the simulator first, then develop the best practices. However, due to longer than expected simulator development times as well as other time constraints, this part of the study began despite the simulators not being fully completed and debugged. The new intent of this project was to assist in the final development and debugging process of COMASim by running case histories and theoretical base cases as best practices were developed. 2.2 Thesis Objectives The objectives of this study were as follows: Validate the dynamic kill simulator through test cases and case histories Run test cases through dynamic kill simulator (COMASim) Using simulator results develop best practices recommendations for ultradeepwater blowout prevention and control. The validation of the simulator took place using two methods. The first involved running several case histories through the simulator. Attempts were made to match the simulator output with the real-life data. In the likely event the simulator output did not match the case history, differences were pinpointed. Then, the reasons for these
45 32 differences were identified. When using case histories, there always exists the distinct possibility that real-life data was recorded erroneously. When controlling a blowout, minimization of risk and loss is of utmost importance, while gathering data for future research is secondary. Therefore, if no case histories results were able to be matched using the dynamic kill simulator, the study moved on to the next option for validation. This step involved using largely theoretical cases results as comparison material. Although invented, these theoretical cases were realistic in wellbore and drillstring sizing and reservoir properties. However, some type of validation needed to occur, whether theoretical or case-history based in order for us to have any confidence in the later results. The next steps in this portion of the study, running base cases, were a simple yet time consuming process. Base cases were chosen using a range of total vertical depth (TVD), water depth, wellbore size and drillstring size values. These base cases were then input into the dynamic kill simulator first to establish pressure profiles for the initial blowing conditions. Once the initial conditions had been established, the next step was to find a dynamic kill rate in COMASim based on several relief well or drillstring values. The last step in this phase of the study was to develop a set of ultra-deepwater best practices. These were conceptual best practices. This was because COMASim is a simple simulator with a relatively quick run time. The best practices dealt with new technologies such as dual-gradient drilling as well as new environments, specifically water depths from 5000 feet to feet deep. Wherever possible, the best practices were developed in such a way that the end-user could seamlessly integrate the new best practices with those already in place throughout the industry. 2.3 COMASim Background COMASim is a Java code based program simulating blowout initial conditions and dynamic kill requirements. The Java programming language was selected due to its versatility. Java is a language with platform independence. This gives potential COMASim users the capability to run COMASim from various platforms and operating

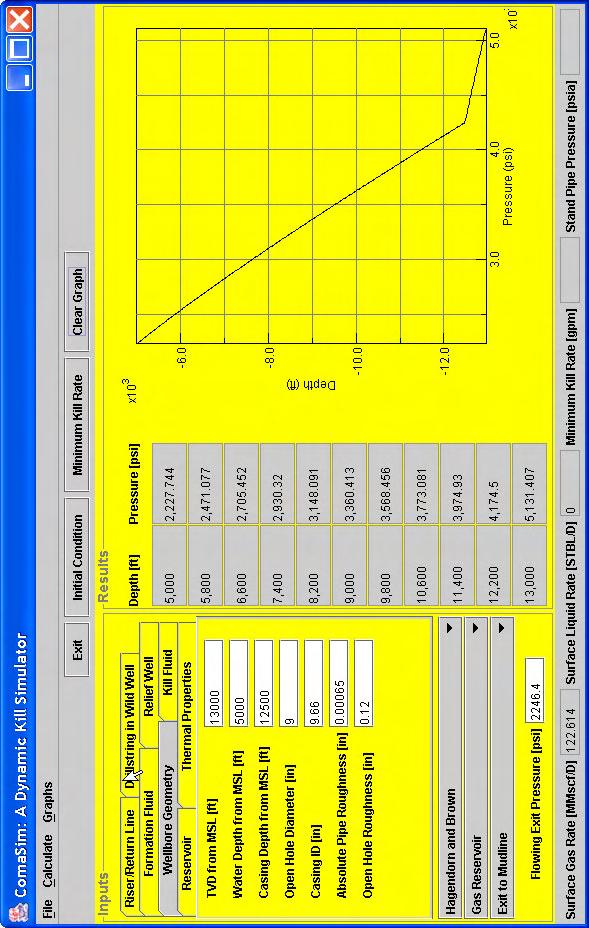
46 33 systems. Of particular interest to potential users is the fact that COMASim is capable of being run from a web-based application. 29 Fig. 2.1 Screen shot of COMASim interface shows simplicity of operation. COMASim s interface is designed for simple operation that would require a minimum of page refreshes during web operation. 29 Fig. 2.1 illustrates the single page interface with both the input and output on the same page. 2.4 Simulator Calculations COMASim calculates the initial conditions, then calculates the required flow rate of kill fluid for a dynamic kill. The initial conditions are based on multiphase calculations and use the concept of system or nodal analysis which is illustrated in Fig Once the IPR curve has been determined for a blowing wellbore, the kill rate can be determined. Successive iterations of a system curve encompassing the blowing wellbore
47 34 during the kill operation will converge to a final solution. This is shown graphically in Fig The initial inflow performance relationship curve or IPR curve is calculated using a multiphase model. Fig. 2.2 Graphical example of general nodal analysis calculation. 29 Fig. 2.3 Example of use of nodal analysis to find required dynamic kill rate. 29


48 35 There are three possibilities for multiphase models, one of which is selected by the user: Hagendorn and Brown Beggs and Brill Duns and Ros Fig. 2.4 No drillstring in wild well. 29 Fig. 2.5 Drillstring dropped. 29 Fig. 2.6 Drillstring hanging from BOP. 29 Fig. 2.7 Drillstring used to kill well. 29
49 36 In addition to the multiphase model selection, the user also chooses between liquid or gas reservoir and the exit point, either to the mudline or to the surface. Drillstring options for the wild well cover all possibilities: No drillstring (Fig. 2.4) Drillstring fallen to bottom (any length possible) (Fig. 2.5) Drillstring hanging from BOP (any length possible) (Fig. 2.6) Drillstring snubbed in to attempt dynamic kill (any length possible) (Fig. 2.7) Table 2.1 Input options for COMASim. Marine Riser Riser OD Riser ID Heat transfer coefficient Surface roughness Riser Buoyancy Material Wild Well Drillstring Material OD Drillpipe OD Depth of Material Drillpipe ID Heat transfer coefficient Drillpipe length Drillpipe roughness Drill collar ID Drill collar OD Drill collar length Wild Well Drillstring Options No drillstring Drillstring hanging from BOP Drillstring dropped to bottom Kill with drillstring Wild Wellbore Geometry Total vertical depth depth from MSL Water depth from MSL Open hole ID Open hole roughness ID roughness Formation Fluid Options Gas and oil gravities Bubble point pressure H2S, C02, N2 concentrations Water gravity and salinity Specific heat of formation liquid Reservoir Properties Average reservoir pressure Exit pressure Permeability Drainage area Height of reservoir Gas Oil ratio Water cut Flowing time of blowout Thermal Properties Thermal gradient Exit temperature of fluid Constant volume and pressure specific heats Formation thermal conductivity Formation thermal diffusivity Heat transfer coefficient Joule- Thompson coefficient Straightline or Newtonian fluid Kill Fluid Mud weight Yield point Plastic viscosity Salinity Surface temperature of kill fluid
50 37 The term simple has been applied to COMASim in this section several times. It can certainly be seen from Table 2.1 that this is a relative term. COMASim s available inputs are more than adequate to handle the large majority of case histories and test cases available. In fact, as with most simulators, using COMASim will require users to assume values for many parameters. A further investigation into the programming and theory behind COMASim are available in Oskarsen s 2004 report. 29
51 38 CHAPTER III COMASIM RESULTS AND ANALYSIS 3.1 COMASim Simulation Input Values The input values for COMASim were chosen after careful consideration. First, I chose a gas blowout as the default. As will be shown later on, COMASim was calibrated with a pseudo case history from Watson, et al. 8 Since I was unable to obtain a verification of COMASim from any other sources, I based the simulation run inputs on the Watson case that verified the simulator. This case was a gas blowout which allowed me to use the gas reservoir option. Since the ultimate goal of this study is to consider deepwater blowouts, I chose the exit to mudline rather than the exit to atmosphere exit point. In a deepwater blowout situation, the drillship will disconnect the riser and evacuate the area to avoid danger to equipment and personnel. The ratings and locations of BOPs and risers are the main reasons that drillships will move off the location in the event of a blowout. BOPE (blowout preventer equipment) is normally located on the seafloor for floating drilling. This reduces the weight of drillstring requiring support as well as reducing the drillship s weight. Risers are also not rated for high pressures. This allows the riser assembly to be lightweight, increasing the capacity of the drillship to store longer lengths of riser material. I chose the formation fluid to be a pure gas with no H 2 S, CO 2, or N 2 content and having a specific gas gravity of 0.6. These values were again chosen to coincide with the matching case history. In the Watson, et. al. 8 example, the pore pressure gradient is psi/ft. I decided to round this gradient off to 0.6 psi/ft and use it for all of my cases. Thus, I have a constant pore pressure gradient regardless of the TVD or water depth. To match the initial blowing conditions of the Watson case history, I manipulated the permeability, drainage area and pay zone thickness and arrived at values of 10 md, 10,000 acres and 100 ft respectively. These are not typical values for Gulf of Mexico ultra-deep water reservoirs. A typical reservoir might have values of 100 md and only a
52 39 thousand acre drainage area. However, this was the only way to get the simulator to match up with the Watson example. Therefore I decided to keep the values the same as the only validating example I currently had. I kept the same values for the COMASim simulation runs with the exception of the reservoir height. The high cost of developing deepwater reservoirs currently means that only the larger reservoirs are being developed. I changed the reservoir height to 100 ft to more accurately depict a typical deepwater situation. The blowing wellbore was setup to simulate drilling ahead after setting casing. During the drilling process, casing is often set before abnormally pressured zones are entered to protect other normally pressured zones. I assumed that a blowout while drilling ahead would be encountered in one of these abnormally pressured zones. I used a casing shoe depth of 500 feet less than the TVD to simulate this situation. I simulated three different casing sizes to account for different times in the drilling process. The first size I used was 8 5/8 inch OD, 44 lb/ft P-110 grade casing. 30 This size represents the production tubing in deepwater producing well. This casing size is slightly larger than is typically associated with production tubing, however deepwater wells will have multilateral construction and fairly high flow rates necessitating the larger casing sizes. The second size I used was 10 ¾ in OD, 60.7 lb/ft, P-110 grade casing. 30 This size would represent the liner or last string of intermediate casing in a large deepwater well. With an ID of 9.66 inches, bits and completion tools for multilateral construction could pass through leaving a small drift margin. The last casing size I used was 12 ¾ inch OD, 53 lb/ft. casing. 31 This is a non-typical size of casing, however I used it to keep the size difference fairly constant between the three casing sizes. This casing is a lighter weight casing suitable for lower pressured formations and could be used as surface casing in deeper holes due to its light overall weight. This light overall weight would guard against the parting of the casing string as it was lowered into the hole. The hole sizes were calculated from the Schlumberger Field Data Handbook to be inches, 9 inches and 11 inches respectively. 31 The drillstring in this wellbore varied in length at 100%, 50%, and 25% of the TVD. I chose a 5 ½ inch OD, 24.7 lb/ft drillpipe. The
53 40 slightly heavier 5 ½ in. drillpipe was chosen to account for increased downhole pressures as well as being able to support long drillstring lengths without parting. The surface temperature was assumed to be 70 o F as stated in the Watson example. The geothermal gradient was 1.5 o F/100 ft. with an exit temperature of the flowing fluid of 120 o F. The kill fluid weight was assumed to 8.5 lb/gal. The kill fluid was assumed to be brackish water. Pure Gulf of Mexico seawater hydrostatic can be considered to be slightly higher in the area of 8.6 lb/gal. However, I chose a slightly lower weight to build a safety factor into my results. The higher weight of seawater would result in a lower kill rate. The characteristics of the relief well needed to deliver this fluid depended on the TVD of the blowing well. I assumed that the relief well always intersected at the TVD of the blowing well. From there, I used ratios of 1, 1.5 and 2 for the Measured Depth/TVD of the relief well. For each of these ratios, I calculated kill rates for Annular ID/ drill pipe (DP) relief well OD ratios of 2 and 1.5. I assumed a constant drillpipe OD of 5 inches, meaning the annular ID was either 10 inches or 7.5 inches. The 10 inch annular ID scenario is much more likely in a real life situation. The planning of the relief well would include attempting to get the largest possible casing size at the intersection of the relief well and blowing well. This would maximize the flow capability of the relief well and minimize the standpipe pressure on the relief well. However, I included the 7.5 inch annular ID because unforeseen problems in the drilling of the relief well might necessitate the use of an additional casing string, thus lowering the annular clearance in the relief well. After investigation, I decided against the use of a drillpipe flow path in the relief well. 32,33 The drillpipe flow path is typically only used when snubbing into the blowing wellbore and attempting a dynamic kill without the drilling of a relief well. The reduction in available flow caused by using a drillpipe flow path would make many relief wells insufficient to control the blowouts. After completing several hundred simulations, I realized there was a need to allow multiple relief wells. After working with Oskarsen to improve COMASim, it was made capable of calculating kill parameters for multiple relief wells from 1 to 99. I
54 41 initially ran each simulation for a single relief well. If the standpipe pressure exceeded psi, then I continued adding relief wells until the psi threshold was met. After 10 relief wells, I stopped the simulations due to the high improbability that 10 or more relief wells would ever be drilled. I used the straight line temperature model and Hagedorn and Brown multiphase flow model because these models gave the most consistent results over a broad range of situations COMASim Simulation Procedure The simulation runs were completed using a Dell laptop running Windows XP. The COMASim initial condition simulations were completed according to Appendix A. The runs were first split into 190 series. These series were based on drillstring status, wild well TVD, water depth, casing size and casing length. The data gathered in these 190 series included flowing rates and a pressure profile for each set of parameters. The results are shown in Appendix B and Appendix D. Once the initial condition runs were completed, 777 different blowout and relief well scenarios were run through COMASim. These scenarios were based on the original 190 initial conditions. Each of the series blowouts were killed with various types of relief wells. The relief well Annular ID to drillpipe OD ratio and measured depth to intersection point ratio were varied. The minimum kill rate, stand pipe pressure and horsepower were recorded in Appendix C and Appendix E.

55 42 Fig. 3.1 Typical psi fracturing vessel. 45 In the event that the stand pipe pressure exceeded psia, further simulations were run to determine the number of relief wells needed to bring the stand pipe pressure down to psia or less. If 10 relief wells or more were needed, the simulations were stopped. The psi threshold was determined after a search for large offshore pumping units. All of the major supplies of offshore fracturing equipment have vessels similar to Fig. 3.1 which are listed at a maximum of psi working pressure Validation of COMASim An extensive blowout data collection effort was undertaken at the beginning of this study. Sources of data were MMS incident and investigation reports, Matthew Daniels blowout data, Larry Flak of Boots and Coots and the Skalle, et al. database courtesy of Dr. A.L. Podio. Unfortunately, in all the available blowout case histories, either COMASim was unable to match the results or the case histories were so lacking in data that no attempt at matching was possible. While this was a setback, it was not unexpected. For example, the case histories courtesy of Larry Flak were of extremely high blowout rates from unusually productive reservoirs. 36 COMASim was programmed initially based on theory. So, since no simultaneous validation and programming solutions work has been attempted, the unusual case histories that are available are not able to be simulated. Future validation efforts should be focused on blowout case histories instead of theoretical validation.
56 43 COMASim has been validated theoretically. The initial condition curves validated by replicating the Beggs and Brill pressure profiles in Production Optimization Using NODAL tm Analysis. 29 The initial condition flow rates and kill rates were validated using examples from Advanced Well Control: SPE Textbook Series Vol The blowout data given is Table 3.1. Table 3.1 Blowout information for COMASim validation problem. 8 Wellbore Configuration Vertical depth Perforation midpoint depth 1770 ft ft 7 in., 29.0 lbm/ft, P in bbl/ft 50 X 0.45 in description nominal ID capacity Perforation quantity and number Blowout Data Formation fluid Single-Phase Gas Specific gravity 0.6 Specific heat ratio 1.27 Gas temperature at exit point Static pore pressure Other Known or Assumed Information Fracture initiation gradient at perfs Fraction propagation gradient Geothermal wellbore temperature Standard Measurement Conditions Pressure Temperature 120 o F 12 ppg equivalent 0.82 psi/ft 0.73 psi/ft 70 o F o F/100 ft psia 60 o F Example 10.3 in Advanced Well Control: SPE Textbook Series Vol. 10 calculates the critical flow rate of gas be 23.6 MMscf/D. COMASim gives flow rate of MMscf/Day when run with the data in Table 3.1. Example 10.6 deals with relief well pumping requirements. Advanced Well Control: SPE Textbook Series Vol. 10 deals in hand calculations throughout all of its examples and Example 10.6 is no exception. The method used in the text is a simple hand calculation known with the final answer
57 44 obtained with a zero-derivative solution. 8 This type of calculation significantly over calculates the dynamic kill rate as shown in Fig A detailed discussion of this topic is available in Oskarsen (2004). 29 Fig. 3.2 Comparison of solution types shows zero-derivative curve grossly over calculates the dynamic kill solution. 29 COMASim calculated a dynamic kill rate of 78.5 bbl/min using a multiphase solution. Although Watson, et al. did not provide a multiphase solution to Example 10.6, the answer fits with the relationship between the zero-derivative answer provided and the multiphase solution COMASim calculated. Example 10.7 in Advanced Well Control: SPE Textbook Series Vol. 10 provides a perfect match in with dynamic kill rates. The problem statement in Example 10.7 uses data in Table 3.1 with several exceptions concerning the relief well. The measured depth (MD) of the relief well is changed to 11,950 feet and the annular ID and drill pipe OD are inches and 3.5 inches respectively. Since Example 10.7 deals with simple hand pressure calculations, a kill
58 45 rate of 100 bbl/min is given in the problem statement as well. Apparently Watson, et al. used a multiphase model to make the problem more realistic. When COMASim ran the given data, it too came out with a dynamic kill rate of exactly 100 bbl/min. The agreement in values with Examples 10.3, 10.6 and 10.7 from Advanced Well Control: SPE Textbook Series Vol. 10 indicates COMASim is theoretically sound. Therefore, the COMASim results discussed in this report can be viewed with a high degree of confidence. 3.4 COMASim Initial Condition Analyses COMASim was used to simulate 190 separate blowout situations. Each simulation resulted in a flowing rate and a pressure profile which are recorded in Appendix B. From these simulations several distinct trends were extracted. These trends can be predicted by anyone with a working knowledge of wellbores. By taking into account the frictional pressure losses and imposed pressures, the effect on a wellbore pressure profile can be predicted. However, while these trends are not groundbreaking, they do indicate COMASim is calculating the initial conditions of the blowout correctly. COMASim s data output presented a significant problem during data collection. The graphing function for COMASim graphs a curve based on a large number of data points creating a smooth curve.
59 46
60 47 However, the table output to the left of the graph (Fig. 3.3) is limited to ten equally spaced data points. COMASim was not programmed to recognize important changes in the pressure profile or any other graphs. Therefore, when a significant change occurs, it most likely will not be recorded in the table unless it happens to occur exactly at one the ten depth values. For this simulation, this error meant that the change in pressure at the casing shoe was not output correctly in the table for the majority of the simulation runs Pressure, psi Depth, ft /open hole transition erroneously shown as ft Fig. 3.4 Numerical output for a hanging drillstring at ft TVD, ft drillstring, 5000 ft of water, casing.

61 48 Fig. 3.5 Close-up of graph from Fig. 3.3, a hanging drillstring at ft TVD, ft drillstring, 5000 ft of water, inch casing. This can be seen by comparing Fig. 3.5 and Fig In Fig. 3.4 the casing shoe/open hole effect on the pressure profile is shown at 12,200 feet as opposed to the actual point at 12,500 feet shown in Fig. 3.5 which is a close-up of the graph in Fig This deficiency in the simulator limits analysis to a trend based analysis as opposed to a numerical analysis or comparison concerning the pressure profile.
62 Effect of Size and Drillstring Presence on Initial Conditions Fig illustrate typical initial condition or flowing pressure profiles for hanging drillstring, dropped drillstring and no drillstring situations. In Fig the drillstring length is 100% of TVD. This explains the similarity between a dropped drillstring and a hanging drillstring pressure profiles. Hanging Drillstring, ft TVD, 5000 ft Water TVD Pressure, psi Depth, ft / Fig. 3.6 Hanging drillstring situations shows typical behavior for pressure profile.
63 Fig. 3.7 Dropped drillstring data matches hanging drillstring pressure profile. 50
64 51 No Drillstring, ft TVD, 5000 ft Water Depth Pressure, psi Depth, ft /8 10 3/4 12 3/ Fig. 3.8 No drillstring in hole reduces pressure value and variation. The values do differ slightly as evidenced by Table 3.2, however the difference is minute enough to ignore. Table 3.2 Hanging and dropped drillstrings allow almost identical flow rates. Size OD, inches Drillstring Status Q g MMscf/d Hanging Hanging Hanging Dropped Dropped Dropped
65 52 While Table 3.2 does illustrate that hanging and dropped full length drillstrings are essentially equal in flow rate values, the dropped drillstring flow rates were lower than the corresponding hanging drillstring flow rates in all three cases. Fig show a sharp increase in pressure loss in the bottom 500 feet of the wellbore. The pressure loss is highlighted in Fig This increase is due to the coefficient of roughness,, being almost 18,500 times larger for an open wellbore as opposed to a cased wellbore. The open hole is 0.12 inches and the cased hole is inches. This high results in the dramatic increase in pressure loss experienced in the wellbore. The decreasing absolute value of the slope in the pressure profile as the casing size decreases is related to a casing size s ability to accommodate blowout flow. As seen in Table 3.2, increasing sizes of casing causes a large increase in surface flow rate, Q g,surface. Larger sizes of casing do not impose as much frictional pressure loss as smaller diameters of casing. dp dl f = 2 f ' ρv g d c 2... Eq. 3.1 Eq. 3.1 shows why the frictional pressure loss increases as diameter decreases. The decreasing diameter also results in a higher velocity, exacerbating the pressure loss due to friction. For example, the pressure differential from liquid entry to liquid exit in the wellbore for the case shown in Fig. 3.6 is 4856 psi for 8 5/8 inch casing and 1221 psi for 12 ¾ inch casing. Since the exit pressure is kept constant for both casing sizes, this results in a smaller slope on the pressure profile graph for the 8 5/8 inch casing. This also results in an increase in Q g,surface for the 12 ¾ inch casing due to a lower bottom hole pressure. The lower bottom hole pressure creates a larger negative pressure differential with respect the reservoir pressure causing an increased Q g,surface. The difference between the pressure profile shown in Fig. 3.8 and Fig is also frictional pressure loss related. As previously discussed, smaller flow areas, i.e. the 8 5/8 inch casing, have larger differential pressures due to increased frictional pressure
66 53 loss. Continuing this concept to Fig. 3.8 shows why its pressure drops are less than that of Fig With no drillstring in the wellbore, the frictional pressure drop is much less than that of wellbores with the added obstruction of a drillstring. The pressure differential for an 8 5/8 inch cased wellbore with no drillstring is psi compared to a pressure differential of 4856 psi for an 8 5/8 inch cased wellbore with the drillstring present. Table 3.3 Blowing wellbores with no drillstring have higher Q g,surface. Size OD, inches Drillstring Status Q g MMscf/d Hanging Hanging Hanging Dropped Dropped Dropped No Drillstring No Drillstring No Drillstring This low pressure loss in the drillstring-less wellbore also results in a much higher surface flow rate as shown in Table 3.3. Notice however, that as the pressure losses decrease, the increase in flow caused by larger casing sizes is less. This effect is most likely due to flow becoming primarily dependent on the pressure differential between the exit point and the pore pressure as opposed to being regulated by the frictional pressure drop. In the no drillstring case, frictional pressure losses do not affect the surface flow rate in the same manner as cases when a drillstring is present. 3.6 Effect of Drillstring Length The previous discussion shows the effect of the presence of a drillstring that is 100 percent of the TVD. However, the majority of kicks, and resulting blowouts occur
67 54 during tripping operations. 8 Thus, the drillstring will not be on bottom. To simulate these conditions in COMASim, I varied the drillstring length for the various scenarios. Fig. 3.9 Effect of drillstring length on hanging drillstring, ft TVD, 5000 ft water depth, inch casing.
68 55 Pressure, psi Depth, ft Top of DS Shoe DS is 100% of TVD DS is 50% of TVD DS is 25% of TVD Fig Effect of drillstring length on dropped drillstring, ft. TVD, 5000 ft water depth, inch casing. Fig are typical of the trends that occurred when drillstring length was varied. Again, due to predetermined data points, the curves are not exactly correct. The points where the pressure profiles experience severe breaks may be off by several hundred feet. The drillstring increases the frictional pressure drop calculated in eq. 3.1 by decreasing the effective diameter and increasing the velocity of the fluid. As previously discussed, the drillstring causes the pressure profile to flatten out due to increased pressure drop. When hanging from a subsea BOP as shown in Fig. 2.6, the typical pressure profile resembles Fig As indicated on Fig. 3.9 the drillstring caused increased pressure losses along its length. An interesting phenomenon was shown in Fig. 3.9 as well. The curves for drillstring lengths of 25 percent and 50 percent of TVD show no increased pressure loss due to the open hole. Since there is no drillstring to increase
69 56 velocity in that section, the roughness increase due to an open wellbore does not have a significant effect. Only in situations such Fig. 3.7 or Fig where drillstring is located in the open hole section does the increase in roughness make a noticeable difference in the pressure profile. Fig displays a typical pressure profile for a dropped drillstring. From the bottom of the wellbore, the first break in the pressure profile is the casing shoe. This is the transition from the large roughness factor of the open hole to the small roughness factor of the casing. The second break is at the top of the dropped drillstring. Once the drillstring top is cleared, frictional pressure losses drop significantly. 0 Pressure, psi Depth, ft Hanging Drillstring Dropped Drillstring Fig Difference between 3250 ft. of drillstring in ft TVD in 5000 ft of water with inch casing.
70 57 Fig is a graphical representation of the difference in pressure profiles for a hanging and dropped drillstring. Of particular interest in well control and blowout control are the ending points of both pressure profiles. According to Fig. 3.11, if the deepest formation was considered to be a weak formation, then hanging the drillstring off of the BOPs would be an advisable precaution in order to avoid the large bottomhole pressures exerted by a dropped drillstring. A dropped drillstring in the wrong conditions could cause the formation to fracture resulting in an underground blowout. The increased pressure loss occurs due to the constriction between the wellbore and drillpipe. Eq. 3.1 shows that while the diameter becomes smaller due to the drillpipe s presence, the resulting increasing velocity is the main cause of frictional pressure loss. Since both a smaller diameter and a larger velocity both increase the frictional pressure, there is an extreme difference between the frictional pressure loss in an empty wellbore and a wellbore with drillpipe present. 3.7 Kill with Drillstring Initial Conditions The discussion covering initial conditions for the Kill With Drillstring drillstring position options is separated out from the other three options due to two main differences. First, the Kill With Drillstring option is the only one which takes into account frictional pressure drop in the marine riser. A comparison of Fig. 2.6 and Fig. 2.7 yields a visual picture of the difference. Second, blowouts with the other three drillstring options selected require a separate relief well or wells to kill the blowout.
71 58 Pressure, psi TVD, ft Kill w/ Drillstring Hanging Drillstring Fig ft TVD, 5000 ft water depth, inch casing, drillstring is 75% of TVD. A kill with drillstring pressure profile is similar to a hanging drillstring pressure profile. The main difference is the drillstring effect is felt throughout the entire wellbore. Thus, a drillstring that is 75 percent of the TVD has less of an effect on the formation in a hanging drillstring situation. Fig illustrates the difference between the two. The data composing Fig as well as all of the other kill with drillstring initial condition runs can be found in Appendix D. The kill with drillstring curve shows a break at 75 percent of the total depth. Meanwhile, the break or bottom of the drillstring is at water depth plus 75 percent of total depth for the hanging drillstring. The kill with drillstring option exhibits a much steeper pressure profile but an overall lower pressure loss.
72 59 Table 3.4 Kill with drillstring configuration yields higher Q g,surface. Drillstring Status DS Length Q g, surface % of TVD MMscf/d Hanging Hanging Hanging Kill w/ DS Kill w/ DS Kill w/ DS This steeper pressure profile yields a higher surface flow rate as shown in Table 3.4. The previous discussion on flow rates covering Table 3.2 and Table 3.3 applies in this instance as well. The lower pressure loss exhibited in the kill with the drillstring configuration is the root cause of the higher flow rates. TVD, ft Pressure, psi DS is 50% of TVD DS is 75% of TVD DS is 100% of TVD Fig Kill with drillstring, ft TVD, 5000 ft water depth, inch casing shows decreasing bottom-hole pressures as drillstring length decreases.
73 60 Drillstring length also causes differences in pressure profile and bottom-hole pressure. Fig and Table 3.5 show the effect of drillstring length on pressure profiles in a kill with drillstring setup. The shorter drillstring lengths result in a steeper pressure profile with less pressure loss in the wellbore. The lower pressure loss in the wellbore results in a higher flow rate. This effect is similar to that of varying the casing size. Table 3.5 Kill with drillstring, ft TVD, 5000 ft water depth, inch casing shows flow rate increases as drillstring length decreases. DS Length Q g,surface % of TVD MMscf/d
74 61 Pressure, psi TVD, ft /4 10 3/4 8 5/ Fig Kill with drillstring, ft TVD, 5000 ft water depth, drillstring length is 75% of TVD. Fig shows the effect of varying the casing size in a kill with the drillstring situation is similar to that of any other drillstring option. The smaller casing decreases the flow area and increases the velocity. This in turn causes the frictional pressures to go up. The 8 5/8 inch casing curve depicted in Fig shows a much larger pressure drop compared to the 12 ¾ inch casing due to smaller flow area. 3.8 Dynamic Kill Requirements for Relief Well Necessary Situations Of the four COMASim drillstring options, the hanging drillstring, dropped drillstring and no drillstring all require relief wells to control the blowout. The kill with the drillstring option does not require a relief well as the name indicates. Therefore the latter option will be treated separately.

75 62 Fig Relief well flow path. For the remaining three drillstring options, the flow path for the kill fluid is shown in Fig For the three drillstring options requiring a relief well to quell the blowout, the dynamic kill parameters of standpipe pressure, number of relief wells, hydraulic horsepower and dynamic kill rate follow the same trends.
76 63 Table ft TVD, 5000 ft water depth, kill rate increases with increasing casing size. Drillstring Status Size Kill Rate OD, inches gal/min Hanging DS 8 5/ Hanging DS 10 3/ Hanging DS 12 3/ Dropped DS 8 5/ Dropped DS 10 3/ Dropped DS 12 3/ No DS 8 5/ No DS 10 3/ No DS 12 3/ The first parameter taken into consideration is the dynamic kill rate. The dynamic kill rate is the rate at which the kill fluid must be pumped to create sufficient bottomhole pressure to control the blowout. COMASim does not account for fluid fallback, therefore these kill rates are slightly conservative. Fluid fallback is when the kill fluid flows against the blowout flow. For a blowout with a given rate, the kill fluid might overcome the momentum of the blowout fluid and begin to fall back down the wellbore in small quantities with the majority of it continuing up the wellbore. The fluid fallback creates an additional back pressure on the formation and begins to limit the blowout flow. This is a circular process that eventually leads to control of the blowout flow or a zero net liquid flow situation with regards to the kill fluid. Either way, fluid fallback helps reduce the necessary dynamic kill rate. Thus, ignoring fluid fallback simply builds in a safety factor to COMASim s calculations. Table 3.6 shows a typical set of kill rates for a wellbore configuration. The dynamic kill rate increases as casing size increases for all of the drillstring positions. The increase in required kill rate is due to the increased flow rate and reduced wild well bore constriction. When Table 3.6 is compared with Table 3.3, this trend is more apparent.
77 64 Hanging Drillstring Dropped Drillstring Fig Dynamic kill rates differ widely among drillstring statuses as drillstring length decreases. The drillstring length was kept constant at 100% of the TVD in Table 3.6. However if the drillstring length is varied as in Fig. 3.16, the dynamic kill rate begins to vary widely as shown. The dropped drillstring dynamic kill rate does not change as much. Since the drillstring is always on the bottom, and the relief well/blowing well intersection is also on the bottom, the drillstring always creates a high frictional pressure drop. Due to the high frictional pressure drop with all drillstring lengths, the dynamic kill rate will not vary as widely. For the hanging drillstring, the shortening of the drillstring pulls the bottom of the drillstring away from the relief well/blowing hole intersection thus opening up the wellbore and creating a no drillstring situation in a portion of the wellbore. Table 3.6 shows that a no drillstring situation increases the dynamic kill rates. For that reason, the hanging drillstring dynamic kill rates begin to
78 65 increase dramatically as the drillstring length is reduced. Fig shows a increase of over 1000 gal/min for the hanging drillstring length of 25 % of TVD. The hanging drillstring and dropped drillstring have nearly identical flow rates and therefore nearly identical dynamic kill rates. When there is no drillstring in the hole, the flow rates and therefore the dynamic kill rates increase. The reason for the increase in flow rates was previously discussed and shown to be a result of decreasing frictional pressure losses. Table 3.7 Increasing relief well MD/TVD ratio increases relief well parameters. Size SPP for single # of Relief Pump hp per Relief well SPP/well MD/TVD ratio Relief Well Wells Relief Well OD, inches psi psi hp 8 5/ / / / / / / / / Relief well parameters besides the dynamic kill rate also increase as the wild well casing size increases. The standpipe pressure for the relief well increases due to the increased kill rates. The number of relief wells was dependent of the psi standpipe pressure threshold discussed earlier. Table 3.7, taken from the hanging drillstring blowout shown in Table 3.6, shows the 12 ¾ inch casing needed a much higher dynamic kill rate, therefore two relief wells would be needed to accommodate the higher standpipe pressures. Even when the flow rate is split between two relief wells, the standpipe pressure per well is still higher for the 12 ¾ inch casing than for the 8 5 / 8 inch or 10 ¾ inch casing. The pump hydraulic horsepower exhibits the same trend as the
79 66 standpipe pressure. The values vary over a very wide range of measured depth to total vertical depth ratios or MD/TVD ratios, but the larger relief well MD/TVD ratios will not likely occur in practice. Thus for each casing size, the lower value for relief well parameters are the most realistic. This allows a dynamic kill to be considered in more situations due to increases capability and availability of drilling and pumping equipment. The reasons behind this are laid out in the best practices section of this thesis. The hanging drillstring and dropped drillstring in the example case used throughout the thesis require two relief wells at most. However, when there is no drillstring in the blowing wellbore, the dynamic kill requirements increase significantly. The end result of the increased dynamic kill requirements is an increased number of relief wells No. of Relief Wells /8 10 3/4 12 3/ MD/TVD ratio for RW /4 8 5/8 12 3/4 Fig Increasing casing size in with no drillstring present increases number of relief wells required.
80 67 Using the psi standpipe pressure threshold, Fig shows the sharp increase in the number of relief wells as the casing size increases. This factor is likely to be reduced in as slimhole drilling, casing drilling and dual gradient drilling become more common. These technologies reduce the size and number of casing used during various portions of the drilling program, thus reducing the flow rates of potential blowouts. Fig also reinforces the need to keep the relief well MD/TVD ratio down, to reduce the number of relief wells required. 3.9 Dynamic Kill Requirement for Kill with the Drillstring Situation Controlling a blowout with a drillstring in the blowing wellbore is an entirely different proposition from using a relief well. As will be discussed later in the best practices section the two methods may even be attempted concurrently. Therefore, the discussions of the two types of kill paths are separate. The results for the kill with the drillstring simulations are shown in Appendix E. Table 3.8 Kill with drillstring kill rates similar to dropped drillstring. Drillstring Status Size Kill Rate OD, inches gal/min Kill w/ DS 8 5/8 216 Kill w/ DS 10 3/ Kill w/ DS 12 3/ Hanging DS 8 5/ Hanging DS 10 3/ Hanging DS 12 3/ Dropped DS 8 5/ Dropped DS 10 3/ Dropped DS 12 3/ No DS 8 5/ No DS 10 3/ No DS 12 3/
81 68 Controlling the blowout with the drillstring requires similar flow rates to the dropped drillstring and hanging drillstring situations as indicated in Table 3.8. The reasons for the kill rates being lower than that of a no drillstring situation are the same as previously discussed for the hanging and dropped drillstring. Table 3.9 Decreasing drillstring length increases kill requirements. Size DS Length Kill Rate SPP Horsepower OD, inches % of TVD gal/min psi hp FRICTION FACTOR FAILED FRICTION FACTOR FAILED FRICTION FACTOR FAILED If the drillstring length is decreased in a kill with the drillstring scenario, the relief well requirements rise significantly as indicated in Table 3.9. This increase in requirements is due to reduced wellbore constriction as the drillstring length shortens. The kill rate must increase to impart the same frictional pressure drop over a shorter length of constriction. The other kill requirements obviously follow the kill rate increase. During the simulations, COMASim crashed as drillstring lengths approached 25 percent of TVD. Error message stated that the friction factor failed. This failure was most likely due to the inability of the short wellbore constriction to provide enough frictional pressure loss to control the bottomhole pressure. However, this is only conjecture and I can not be sure of the reason. Whether or not the friction factor failure means it is
82 69 physically impossible to dynamically kill the well is unknown. Also, of interest are the large standpipe pressures starting with the 50 percent drillstring length in 10 ¾ inch casing. Because these pressures are above the psi working pressure threshold, a dynamic kill would not be possible through the drillstring DS Length, % of TVD /8 10 3/4 12 3/ Dynamic Kill Rate, gal/min Fig Kill rates increase for larger casing sizes. The kill rate also increases as the blowing wellbore casing size increases. Fig indicates a large difference in the required kill rates between 8 5/8 inch casing and 12 ¾ inch casing. This difference is due to the reduced constriction in the wellbore in the larger casing sizes. This reduced constriction requires a higher flow rate to kill the well. The 8 5/8 inch casing dynamic kill requirements do not vary nearly as much as those for the 12 ¾ inch casing. This also is due to the increased constriction imparted by the 8 5/8 inch casing.

83 70 CHAPTER IV ULTRA-DEEP WATER BLOWOUT PREVENTION AND CONTROL 4.1 Ultra-deepwater Drilling Equipment Ultra-deepwater drilling equipment and methods are selected due to a variety of reasons. The scope of this study does not include delving into a full set of ultradeepwater equipment selection criteria. However, I will briefly explain how to select ultra-deepwater equipment with safety in mind. The first piece of drilling equipment is the drilling rig itself. For ultra-deep water this will consist of a floater drilling rig. Fig. 4.1 Example of drillship. 37 Floaters are either drillships (Fig. 4.1) or semi-submersibles (Fig. 4.2). These ships do not need to be touching the seafloor to drill as their name implies. However, they have a large problem in their storage capability. Since they need to be selfcontained and do not have moored support vessels, storage space is limited. Therefore during the selection and outfitting of the floater, particular significance must put on a floater s ability to not only store well control equipment but also its ability to put that equipment into action.

84 71 Fig. 4.2 Example of semi-submersible. 37 As the deepwater frontier is exploited more and more each year, this problem is decreasing. Many of the leading drilling contractors now have significant numbers of the latest floaters in their fleets. For example, Transocean now has 12 operational fifth generation floaters in their fleet. 37 These fifth generation floaters are designed with water depths of up to 10,000 feet in mind, and thus have sufficient space for the storing and using of deepwater specific safety equipment. The drillstrings used are typical drillstrings seen on any offshore drilling platform. The only design and safety consideration that changes is the drillstring s ability to support a long length. In ultra-deepwater, the drilled portion of the wellbore below the mudline could be just as deep as any land well. When this depth is coupled with the added length of drillstring to get down to the seafloor, the drillstring becomes heavy. Heavier walled pipe will be necessary toward the top of many ultra-deepwater drillstrings. Of more concern during ultra-deepwater operations is the drilling riser. The drilling or marine riser consists of a large diameter pipe with two smaller lines, the choke and kill lines, attached to it. In ultra-deepwater the riser would have buoyancy material attached to it to reduce the load on the floater. The marine riser is the connection between the floater and the equipment on the seafloor. It is not rated for high pressures as casing and drillpipe are. Risers are normally only designed to handle the

85 72 difference in pressure between the maximum weight drilling fluid and seawater. The riser will have issues with strength if it is unloaded and filled with gas. In this case, the riser will be subjected to high collapse pressures and would likely fail in ultra-deepwater situations. Problems such as this highlight the necessity of keeping the influx size to a minimum and reacting quickly to keep the influx out of the riser. Alternative riser technologies are becoming commonplace in the deepwater drilling industry. Alternative materials such as the carbon fibers used in ABB Vetco Gray s Composite Marine Riser allow for increased riser storage and hanging capacity on floaters as shown in Fig Fig. 4.3 ABB Vetco Gray composite material riser increases water depth capability of floaters. 38
86 73 Another new technology is riser fill valves. 39 Ultra-deepwater risers do not have to be completely unloaded to fail. Since they are rated only on the pressure differential between the drilling fluid and seawater, any amount of unloading begins to unduly stress the riser. In a typical emergency disconnect situation, drilling fluid will fall out of the riser and not be replaced with seawater until the riser is first completely evacuated of drilling fluid and filled with air. Consequently, the riser will fail before it can be filled with seawater to balance the internal and external pressures. To battle this, riser fill valves are now standard on newer riser strings. Riser fill valves are activated at the same time the emergency disconnect command is given. They close and prevent the riser from losing drilling fluid and collapsing. 39 Riser fill valves are also capable of preventing influxes into the riser. 39 This makes them another barrier to influxes broaching the deck of a floater. Other equipment such as the lower marine riser package, wellhead, and BOPE should be rated for the extreme water depths and resulting pressure in ultra-deepwater drilling. The BOPE would ideally have several modifications for ultra-deepwater drilling. The first would be a large number of accumulator bottles. The deeper the accumulator bottles are situated, the lower the usable fluid volume is per accumulator bottle. 8 The only current solutions to reducing number of bottles is to replace them with larger bottles or accumulator bottles rated at higher pressures. 8 In addition to operator or regulatory guidelines on accumulator volume for safe well control an additional amount should be added. As will be shown later, shearing or dropping the drillstring may be necessary after control has been lost. In the event the BOP stack is still operational, enough accumulator volume must be available to complete this operation. In deepwater accumulator bottles could become prohibitory due to increased expense and floater capability to handle such large lower marine riser packages. An alternative method of operating the BOPE is placing the accumulators on the surface and delivering the power fluid down a steel line attached to the riser. This method is viable, but has one chief problem; the riser must be connected to the BOPE in order for the BOPE to operate. If a steel hydraulic fluid line is used, sufficient accumulator bottles must be placed on the
87 74 seafloor to close at least a blind ram and a shear ram in the event an emergency disconnect of the riser occurs. If accumulator bottles are used, communication must be established with the lower marine riser package control pod which controls the accumulator bottles. The standard course is to use a small diameter line filled with hydraulic fluid to actuate the BOPE. The reaction time for a 3/16 control line in water follows a power law relationship. At 400 feet the reaction time is 1 second. In depths of 3000 feet, the reaction time is up to 10 seconds. 8 Thus, in ultra-deepwaters, the reaction time from the command to completion of the task for the BOPE may be disastrously slow. Three commercial alternatives exist to solve this problem. The first is the installation of a biased hydraulic control line. A biased line would be precharged to within several hundred psi of the activation pressure for the BOPE. Then, when a BOPE command is given, effects such as ballooning and compressibility would be reduced and the reaction time decreased. 8 Unfortunately, on long risers this could become expensive and prone to failure. The second method is an electrohydraulic system. As the name implies, an electronic signal activates the BOPE through a single line capable of coded transmissions or a multiplex system. The signal time is nearly instantaneous but the signal itself may be prone to electronic noise generated by the riser. 8 Another type of multiplex system is fiber optics. Fiber optics are not as common as electrohydraulic systems but are less susceptible to interference. 8 The preceding communication techniques depend on the riser maintaining a connection to the BOPE. In an emergency disconnect or drive-off situation, the connection may be severed prior to the completion of the signal. In this event, two options for initiating BOPE operation exist, a remote operation vehicle (ROV) operated hotline system and an acoustic control system (Fig. 4.4). 40 These two systems will greatly assist in blowout control operations if necessary.

88 75 Fig. 4.4 Acoustic control system on lower marine riser package Ultra-deepwater Blowout Control Equipment Once control of the well has been lost, blowout control equipment should begin to be staged. After the initial plans for control have been finalized among blowout personnel, the blowout control equipment should be deployed to the well site. For a dynamic kill, three areas of equipment are the most important. Bringing together the blowout control equipment should be easy for an operator. The MMS does not currently require relief well contingency plans but should in the face of growing ultra-deepwater exploration. An example is Norway which requires an operator to have a full relief contingency plan including spud locations, location of available kill equipment, and preliminary relief well plans. 42 Forcing operators to have relief well contingency plans in place results not only quicker drilling times, but a higher likelihood of success. The first of the necessary equipment is the drilling rig or rigs used to kill the blowing well. In an ultra-deepwater situation, the original floating drilling rig would have likely completed an emergency disconnect and still be available for well control procedures. The original rig will most likely be involved in the vertical intervention

89 76 portion of blowout control. At least one other rig and possibly more need to be mobilized to the blowout location to begin drilling relief wells. Fig. 4.5 Example of offshore dynamic kill pumping plant. 43 The pumping plant should be the next step for relief well planners. Running simulations on a model such as COMASim will give the planning team pumping requirements for a variety of scenarios in a brief time. The pumping plant then needs to be assembled. For ultra-deepwater this involves either the marshalling of multiple frac boats such as the one shown in Fig. 3.1 or the building of a pumping plant on a floater
W I L D W E L L C O N T R O L PRESSURE BASICS AND CONCEPTS
 PRESSURE BASICS AND CONCEPTS Pressure Basics and Concepts Learning Objectives You will be familiarized with the following basic pressure concepts: Defining pressure Hydrostatic pressure Pressure gradient
Well Control Modeling Software Comparisons with Single Bubble Techniques in a Vertical Well
 Well Control Modeling Software Comparisons with Single Bubble Techniques in a Vertical Well Jace R. Larrison, P.E. Blowout Engineers, LLC Recent advances in well control modeling simulators have incorporated
DEVELOPMENT AND ASSESSMENT OF ELECTRONIC MANUAL FOR WELL CONTROL AND BLOWOUT CONTAINMENT
 DEVELOPMENT AND ASSESSMENT OF ELECTRONIC MANUAL FOR WELL CONTROL AND BLOWOUT CONTAINMENT A Thesis by ODD EIRIK GRØTTHEIM Submitted to the Office of Graduate Studies of Texas A&M University in partial fulfillment
SPE Forum: Source Control for Wells in Shallow Water. Lars Herbst, Gulf of Mexico Regional Director
 SPE Forum: Source Control for Wells in Shallow Water Lars Herbst, Gulf of Mexico Regional Director Agenda Introduction and Background Historical Well Control Events Scope of Discussion Scenario Driven
Worked Questions and Answers
 Worked Questions and Answers A Learning Document for prospective Candidates For the Rotary Drilling Well Control Test Programme Copyright, IWCF June 2000 Revision No.1, November 2000 IWCF 2000 page 1 of
Blowout during Workover Operation A case study Narration by: Tarsem Singh & Arvind Jain, OISD
 1. Introduction An incident of gas leakage from a well took place during workover operations. Subsequently, the gas caught fire on the fourth day in which twelve persons were injured. Two contract workers,
W I L D W E L L C O N T R O L FLUIDS
 FLUIDS Fluids Learning Objectives You will learn about different fluids that can be used in well control. You will become familiar with the characteristics and limitations of fluids. You will learn general
Chapter 4 Key Findings. 4 Key Findings
 Chapter 4 Key Findings 211 4 Key Findings 212 Chapter 4 Key Findings This summarizes the key findings of the investigation team based on its extensive review of available information concerning the Macondo
Offshore Managed Pressure Drilling Experiences in Asia Pacific. SPE paper
 Offshore Managed Pressure Drilling Experiences in Asia Pacific SPE paper 119875 Authors: Steve Nas, Shaun Toralde, Chad Wuest, SPE, Weatherford Solutions Sdn Bhd, SPE, Weatherford Indonesia SPE, Weatherford
Practice Exam IADC WellSharp Driller and Supervisor
 Workover & Completion Day 4 1. In a workover operation of a shut in well a Lubricator is being used together with a Wireline BOP / Wireline Valve. Which Barrier is classified as the Primary Barrier? A.
APPENDIX A1 - Drilling and completion work programme
 APPENDIX A1 - Drilling and completion work programme Information about the well and drilling To the extent possible, the international system of units (SI) should be adhered to, and the drilling programme
Casing Design. Casing Design. By Dr. Khaled El-shreef
 Casing Design By Dr. Khaled El-shreef 1 Casing Design CONTENTS Function of Casing Casing Types & Tools Strength Properties Casing Specification Casing Design 2 1 RUNNING AND CEMENTING CASING Reasons for
Drilling Efficiency Utilizing Coriolis Flow Technology
 Session 12: Drilling Efficiency Utilizing Coriolis Flow Technology Clement Cabanayan Emerson Process Management Abstract Continuous, accurate and reliable measurement of drilling fluid volumes and densities
Why Do Not Disturb Is a Safety Message for Well Integrity
 Why Do Not Disturb Is a Safety Message for Well Integrity Presented at the Practical Well Integrity Conference 9-10 December, 2014 in Houston By Ron Sweatman, Principal Advisor, Reservoir Development Services,
DAY ONE. 2. Referring to the last question, what mud weight would be required to BALANCE normal formation pressure?
 DAY ONE 1. Normal formation pressure gradient is generally assumed to be: A..496 psi/ft B..564 psi/ft C..376 psi/ft D..465 psi/ft 2. Referring to the last question, what mud weight would be required to
A New and Simplified Method for Determination of Conductor Surface Casing Setting Depths in Shallow Marine Sediments (SMS)
") AADE-07-NTCE-41 A New and Simplified Method for Determination of Conductor Surface Casing Setting Depths in Shallow Marine Sediments (SMS) Paknejad, A., Texas A&M University; Schubert, J., Texas A&M University
AADE-07-NTCE-41 A New and Simplified Method for Determination of Conductor Surface Casing Setting Depths in Shallow Marine Sediments (SMS) Paknejad, A., Texas A&M University; Schubert, J., Texas A&M University
Hard or Soft Shut-in : Which is the Best Approach?
 HARD - SOFT shut-in? Hard or Soft Shut-in : Which is the Best Approach? March '93 INTRODUCTION There is now reasonable acceptance through-out the industry for the use of a hard shut-in procedure following
SUPPLEMENT Well Control for Drilling Operations Workover & Completion for Drillers Core Curriculum and Related Learning Objectives
 SUPPLEMENT Well Control for Drilling Operations Workover & Completion for Drillers Core Curriculum and Related Learning Objectives Form WSP-02-DO-SU-WOC-D Revision 0 13 February 2015 DC 2015 COPYRGHT PROTECTED
August 21, Deepwater MPD / PMCD
 August 21, 2011 Deepwater MPD / PMCD Managed Pressure Drilling (MPD) Pressure held on top of riser while drilling. Drill in overbalance condition Pressurized Mud Cap Drilling (PMCD) Pressure of mud column
RPSEA UDW Forum June 22 & 23, Secure Energy for America
 RPSEA UDW Forum June 22 & 23, 2010 Secure Energy for America PROJECT TEAM RPSEA Operator Advisory Committee Anadarko Chevron Shell ConocoPhillips Subcontractors IntecSea NOV CTES General Marine Contractors
Understanding pressure and pressure
 CHAPTER 1 1-1 PRESSURE BASICS Remember to think downhole. The concepts provided in this section cover the foundations for good well control. Understanding pressure and pressure relationships is important
Evaluation of deepwater kicks and future countermeasures
 WELLS AND WELL INTERVENTION Evaluation of deepwater kicks and future countermeasures Paal Skalle, Per Holand 2 and Sigbjørn Sangesland Norwegian University of Science and Technology and 2 SINTEF/ExproSoft
NOT TO COPY -- NO DISSEMINATE WITHOUT WRITTEN AGREEMENT. Presentation JB AG JCN JR 1
 Presentation JB AG JCN JR 1 Kicks & blowouts A kick is an unexpected influx into a well of a formation fluid. Should this influx be uncontrolled... -- during its way from the bottom of the hole up in the
SUPPLEMENT Well Control for Drilling Operations Workover & Completion for Supervisors Core Curriculum and Related Learning Objectives
 SUPPLEMENT Well Control for Drilling Operations Workover & Completion for Supervisors Core Curriculum and Related Learning Objectives Form WSP-02-DO-SU-WOC-S Revision 0 13 February 2015 DC 2015 COPYRGHT
1. The well has been shut in on a kick and the kill operation has not started.
 Well Control Methods Day 2 1. The well has been shut in on a kick and the kill operation has not started. Shut in drill pipe pressure Shut in casing pressure 500 psi 700 psi After stabilization, both pressures
Study Guide IADC WellSharp Driller and Supervisor
 Times to Flow Check: Before pulling out of the hole Before pulling BHA into the BOP When bit is pulled into the casing Increase in cuttings at shakers with same ROP On connections Upon abnormal trip tank
Wednesday, March 6, 2013 Houston, TX. 2:30 4:00 p.m. CLOSING SESSION BLOWOUT! A NIGHTMARE IN THE OIL PATCH
 Wednesday, March 6, 2013 Houston, TX 2:30 4:00 p.m. CLOSING SESSION BLOWOUT! A NIGHTMARE IN THE OIL PATCH Presented by Bill Mahler Executive Vice President and General Manager Wild Well Control What could
COGCC OPERATOR GUIDANCE MECHANICAL INTEGRITY TEST GUIDANCE: PRACTICES AND PROCEDURES
 COGCC OPERATOR GUIDANCE MECHANICAL INTEGRITY TEST GUIDANCE: PRACTICES AND PROCEDURES DOCUMENT CONTROL: Created Date: May 06, 2013 Last Updated Date: September 15, 2015 Last Updated By: Stuart Ellsworth
The SPE Foundation through member donations and a contribution from Offshore Europe
 Primary funding is provided by The SPE Foundation through member donations and a contribution from Offshore Europe The Society is grateful to those companies that allow their professionals to serve as
Along-string pressure, temperature measurements hold revolutionary promise for downhole management
 Along-string pressure, temperature measurements hold revolutionary promise for downhole management IT S WIDELY KNOWN that the majority of stuck pipe incidents occur while pulling out of hole. If we can
EVALUATION OF LIQUID LIFT APPROACH TO DUAL GRADIENT DRILLING
 EVALUATION OF LIQUID LIFT APPROACH TO DUAL GRADIENT DRILLING A Thesis by UGOCHUKWU NNAMDI OKAFOR Submitted to the Office of Graduate Studies of Texas A&M University in partial fulfillment of the requirements
7/27/2011. How Things Can Go Wrong In The Drilling Of Oil / Gas Wells
 How Things Can Go Wrong In The Drilling Of Oil / Gas Wells Provide a general background of the various risks inherent in the drilling of oil / gas wells. The participants will have a better knowledge and
Dilution-Based Dual Gradient Well Control. Presented at the 2011 IADC Dual Gradient Workshop, 5 May 2011 by Paul Boudreau, Dual Gradient Systems LLC
 Dilution-Based Dual Gradient Well Control Presented at the 2011 IADC Dual Gradient Workshop, 5 May 2011 by Paul Boudreau, Dual Gradient Systems LLC In this very short presentation, we will Review Dilution-based
W I L D W E L L C O N T R O L SHUT-IN PROCEDURES
 SHUT-IN PROCEDURES Shut-in Procedures Learning Objectives You will learn general shut-in procedures: For surface BOPs. For subsea BOPs. You will learn to interpret shut-in pressures and be able to perform
Development of a Subsurface Mudline Packer to Reduce Risk of Flow after Cementing and Sustained Casing Pressure, While Providing a Platform for P&A.
 Development of a Subsurface Mudline Packer to Reduce Risk of Flow after Cementing and Sustained Casing Pressure, While Providing a Platform for P&A. Sean Yakeley, Ed Wood and Yang Xu (Baker Hughes Inc)
New generation of solid expandable liners help give operators a jump on trouble zones
 New generation of solid expandable liners help give operators a jump on trouble zones By Pat York, Weatherford SINCE SOLID EXPANDABLE technology has gained credibility as an effective contingency option,
DEVELOPMENT OF DIRECTIONAL CAPABILITIES TO AN ULTRADEEP WATER DYNAMIC KILL SIMULATOR AND SIMULATION RUNS
 DEVELOPMENT OF DIRECTIONAL CAPABILITIES TO AN ULTRADEEP WATER DYNAMIC KILL SIMULATOR AND SIMULATION RUNS A Thesis by HECTOR ULYSSES MEIER Submitted to the Office of Graduate Studies of Texas A&M University
OIL POLLUTION IN THE ARCTIC - RISKS AND MITIGATING MEASURES
 Proceedings of the ASME 2011 30th International Conference on Ocean, Offshore and Arctic Engineering OMAE2011 June 19-24, 2011, Rotterdam, The Netherlands OMAE2011-49157 OIL POLLUTION IN THE ARCTIC - RISKS
Deepwater Horizon Incident Internal Investigation
 Not all Information has been verified or corroborated. Subject to review based on additional information or analysis. Deepwater Horizon Incident Internal Investigation 1 Areas of Discussion Investigation
Chapter 5 HORIZONTAL DRILLING
 Chapter 5 HORIZONTAL DRILLING Chapter 5 How much money am I about to put on the table for a horizontal well? Did I do sufficient planning? Keys to Successful Horizontal Wells Multi-disciplined teams working
Rig Math. Page 1.
 Page 1 The Calculator and Main Keyboard Display Numerical 10-key pad used for entering numerical values Trigonometric Functions These keys will be used where wellbore angle is an issue These are the keys
PTRT 1471: Exploration and Production I. Chapter 6: Drilling and Well Completion
 PTRT 1471: Exploration and Production I Chapter 6: Drilling and Well Completion Well Planning Drilling is a major investment (over $100m for offshore) Planning is aimed at maximizing investment Wells are
IWCF Equipment Sample Questions (Combination of Surface and Subsea Stack)
") IWCF Equipment Sample Questions (Combination of Surface and Subsea Stack) 1. Given the volumes below, how much hydraulic fluid will be required to carry out the following operations (no safety margin)?
IWCF Equipment Sample Questions (Combination of Surface and Subsea Stack) 1. Given the volumes below, how much hydraulic fluid will be required to carry out the following operations (no safety margin)?
Safety and Risk Analysis of Deepwater Drilling using Managed Pressure Drilling Technology
 Safety and Risk Analysis of Deepwater Drilling using Managed Pressure Drilling Technology Jyoti Bhandari 1, Faisal Khan* 1, and Vikram Garaniya 1 1.Offshore Safety and Risk Management Group, Australian
Abstract Objective Scope of Study Introduction Procedures
 AADE-05-NTCE-71 A Practical Solution to Control Gas Migration Ned Shiflet, Forest Oil Corporation; Michael O. Dion, TAM International; and David P. Flores, TAM International This paper was prepared for
WellCAP IADC WELL CONTROL ACCREDITATION PROGRAM
 WellCAP IADC WELL CONTROL ACCREDITATION PROGRAM WELL SERVICING OPERATIONS (WIRELINE, COILED TUBING & SNUBBING) CORE CURRICULUM AND RELATED FORM WCT-2WSI INTRODUCTORY LEVEL For information on how an course
EXAMINER S REPORT AND RECOMMENDATION STATEMENT OF THE CASE
 OIL AND GAS DO0KET NO. 01-0249550 THE APPLICATION OF REGENCY FS LP UNDER RULE 36 AND RULE 46 TO DISPOSE OF OIL AND WASTE CONTAINING HYDROGEN SULFIDE GAS INTO ITS TILDEN GPI WELL NO. 1, TILDEN, S. (WILCOX
Well Control Drill Guide Example Only. Drill Guide is the list of drills, questions and attributes that are in DrillPad.
 Well Control Drill Guide Example Only Drill Guide is the list of drills, questions and attributes that are in DrillPad. This Well Control Drill Guide will be used in conjunction with the rig-specific well
Investigation of Loss of Well Control Eugene Island Block 277 OCS-G Well A-2 Off the Louisiana Coast July 6, 2001
 OCS Report MMS 2002-040 Investigation of Loss of Well Control Eugene Island Block 277 OCS-G 10744 Well A-2 Off the Louisiana Coast July 6, 2001 U.S. Department of the Interior Minerals Management Service
Solid Expandable Tubular Technology: The Value of Planned Installation vs. Contingency
 Solid Expandable Tubular Technology: The Value of Planned Installation vs. Contingency Chris Carstens Unocal Corporation 14141 Southwest Freeway Sugar Land, Texas 77478 Mike Breaux Unocal Corporation 14141
INTERPRETATION NOTE ISSUED UNDER THE PETROLEUM DRILLING REGULATIONS (CNR 1150/96)
") BOP CLASSIFICATION SYSTEM FOR ONSHORE NEWFOUNDLAND AND LABRADOR INTERPRETATION NOTE ISSUED UNDER THE PETROLEUM DRILLING REGULATIONS (CNR 1150/96) PREPARED BY THE PETROLEUM RESOURCE DEVELOPMENT DIVISION
BOP CLASSIFICATION SYSTEM FOR ONSHORE NEWFOUNDLAND AND LABRADOR INTERPRETATION NOTE ISSUED UNDER THE PETROLEUM DRILLING REGULATIONS (CNR 1150/96) PREPARED BY THE PETROLEUM RESOURCE DEVELOPMENT DIVISION
ANALYSIS OF ALTERNATIVE WELL CONTROL METHODS FOR DUAL DENSITY DEEPWATER DRILLING
 ANALYSIS OF ALTERNATIVE WELL CONTROL METHODS FOR DUAL DENSITY DEEPWATER DRILLING A Thesis Submitted to the Graduate Faculty of the Louisiana State University and Agricultural and Mechanical College in
RIH intermediate section casing in Bazian-1 exploration oil well
 Energy and Sustainability V 559 RIH intermediate section casing in Bazian-1 exploration oil well A. K. Darwesh Petroleum Engineering Department, Engineering Faculty, Koya University, Kurdistan Abstract
Step-Rate Formation Integrity Test Method for Geothermal Wells
 GRC Transactions, Vol. 41, 2017 Step-Rate Formation Integrity Test Method for Geothermal Wells William M. Rickard, Ozgur Balamir and Ernesto Rivas Geothermal Resource Group, Inc. services@geothermalresourcegroup.com
RULES OF THE OIL AND GAS PROGRAM DIVISION OF WATER RESOURCES CHAPTER DRILLING WELLS TABLE OF CONTENTS
 RULES OF THE OIL AND GAS PROGRAM DIVISION OF WATER RESOURCES CHAPTER 0400-52-06 DRILLING WELLS TABLE OF CONTENTS 0400-52-06-.01 Drilling Equipment 0400-52-06-.03 Casingheads 0400-52-06-.02 Blowout Prevention
OPTIMUM SELECTION OF WELL CONTROL METHODS
 OPTIMUM SELECTION OF WELL CONTROL METHODS Md AHAMMAD SHARIF Assistant professor, Department of Petroleum Engineering, GIET College of Engineering, Rajahmundry. Dr. S. SRIGOWRI REDDY Professor, GIET College
Learn more at
 IBP1833_06 COST EFFICIENT ARTIFICIAL BUOYANT SEABED DRILLING SOLUTION Dan Moutrey 1, Frank Lim 2 Copyright 2006, Instituto Brasileiro de Petróleo e Gás - IBP This Technical Paper was prepared for presentation
Marine Technology Society
 Marine Technology Society Dynamic Positioning Conference 21-22 October, 1997 Session I Review of DP Applications, Consequences and Cost of Failures Drilling Fundamentals-DP Operations-Drilling with Riser
SUBSEA KILL SHEET EXERCISE No. 5
 Subsea Kill Sheet Exercise No. 5 SUBSEA KILL SHEET EXERCISE No. 5 Name: Date: Complete the Subsea vertical kill sheet provided on pages 2 and 3. Then answer questions 1 to 12. Please round calculations
KICK CIRCULATION ANALYSIS FOR EXTENDED-REACH AND HORIZONTAL WELLS. A Thesis MAXIMILIAN M. LONG
 KICK CIRCULATION ANALYSIS FOR EXTENDED-REACH AND HORIZONTAL WELLS A Thesis by MAXIMILIAN M. LONG Submitted to the Office of Graduate Studies of Texas A&M University in partial fulfillment of the requirements
The Alberta Energy Regulator (AER) has approved this directive on January 31, Introduction Purpose of This Directive...
 has approved this directive on January 31, Introduction Purpose of This Directive...") Directive 008 Release date: January 31, 2018 Effective date: January 31, 2018 Replaces previous edition issued February 29, 2016 Surface Casing Depth Requirements The Alberta Energy Regulator (AER) has
Directive 008 Release date: January 31, 2018 Effective date: January 31, 2018 Replaces previous edition issued February 29, 2016 Surface Casing Depth Requirements The Alberta Energy Regulator (AER) has
Elgin G4 Leak. 25 March 16 May 2012
 Elgin G4 Leak 25 March 16 May 2012 Elgin: key facts & figures Operated by Total for 8 x JV partners Production Utilities Quarters (PUQ) & wellhead platforms linked by 90m bridge On stream since 2001 6
Texas Administrative Code
 TITLE 16 PART 1 CHAPTER 3 RULE 3.13 Texas Administrative Code ECONOMIC REGULATION RAILROAD COMMISSION OF TEXAS OIL AND GAS DIVISION Casing, Cementing, Drilling, Well Control, and Completion Requirements
Restoring Fluid Flow in Tubing Strings
 Restoring Fluid Flow in Tubing Strings Andrew Roth, Product Manager Fike Corporation Fike Hydraulic Tubing Drains (HTD) for use with deep hole drilling tools, downhole devices and other oil and off shore
WILD WELL CONTROL WARNING SIGNS OF KICKS
 WARNING SIGNS OF KICKS Warning Signs of Kicks Learning Objectives You will learn the warning signs that indicate the well may be kicking: Warning signs of kicks False kick indicators You will also learn
Talk 2 Tree & Wellhead Valve Testing Leak Rate Acceptance. Talk 3 DHSV Control Line hydrocarbon Ingress measurement & acceptability
 Talisman energy COIN Virtual Meeting # 17 26 th January 2011 Darren Bewick Graeme Douglas Martin Forbes David McGuckien Matt Morrison Martin Mosley Talisman Energy UK Ltd (TLMUK), Aberdeen 1 Presentations
SEMS II: BSEE should focus on eliminating human error
 SEMS II: BSEE should focus on eliminating human error How US companies can prevent accidents on start-ups and shut-downs by using valve interlocks The proposed changes to BSEE s SEMS (Safety and Environmental
ECD Reduction Tool. R. K. Bansal, Brian Grayson, Jim Stanley Control Pressure Drilling & Testing
 ECD Reduction Tool R. K. Bansal, Brian Grayson, Jim Stanley Control Pressure Drilling & Testing Drilling Engineering Association, Fourth Quarter Meeting November 20, 2008 1 Presentation outline Description
1. UPDATE 12/12/2014: What wells are regulated under the MIA Program? Must they be drilled, stimulated, and completed? Must they be in production?
 PLEASE NOTE THAT ALL USES OF THE WORD OPERATOR IN THIS DOCUMENT REFER TO THE ACT 13 DEFINITION OF WELL OPERATOR AND THUS, REFERENCE THE PERMIT HOLDER (PERMITEE) FOR THE WELL. ANY ENFORCEMENT ACTIONS UNDER
DIRECTIONAL DRILLING
 DIRECTIONAL DRILLING 1. General. Installation of pipelines through the levee embankment using directional drilling technology is prohibited. Installation of pipelines through a flood control project foundation
Chapter 8: Reservoir Mechanics
 PTRT 1472: Petroleum Data Management II Chapter 8: Reservoir Mechanics - Reservoir drives Types of Natural Gas Reservoir Fluids Natural gas is petroleum in a gaseous state, so it is always accompanied
Subsea Safety Systems
 Subsea Safety Systems The ELSA-HP has been developed to service the high pressure horizontal tree completion and intervention market. With systems designed and qualified up to 15,000 psi, 250 degf and
WellCAP IADC WELL CONTROL ACCREDITATION PROGRAM
 WellCAP IADC WELL CONTROL ACCREDITATION PROGRAM WIRELINE OPERATIONS CORE CURRICULUM AND RELATED FORM WCT-2WLF FUNDAMENTAL LEVEL The purpose of the core curriculum is to identify a body of knowledge and
Frequently Asked Questions (FAQ s)
") NTL No. 2015-N01 Information Requirements for Exploration Plans, Development and Production Plans, and Development Operations Coordination Documents on the OCS for Worst Case Discharge and Blowout Scenarios
NTL No. 2015-N01 Information Requirements for Exploration Plans, Development and Production Plans, and Development Operations Coordination Documents on the OCS for Worst Case Discharge and Blowout Scenarios
Engineered solutions for complex pressure situations
 SPECIAL SERVICES Engineered solutions for complex pressure situations Cudd Energy Services (CES) delivers custom engineered solutions to resolve complex pressure situations resulting from equipment failure
Tibor Szabó DRILLING THROUGH SHALLOW GAS ZONES IN HUNGARY
 Tibor Szabó Petroleum Engineering Department University of Miskolc, Hungary DRILLING THROUGH SHALLOW GAS ZONES IN HUNGARY The prospecting activity for CH is more than 60 years old in Hungary. During this
DRILLSCENE PROACTIVE DRILLING DECISIONS
 DRILLSCENE PROACTIVE DRILLING DECISIONS RISE TO THE CHALLENGE OF REAL-TIME DRILLING CONTROL Today s oil and gas drilling operations present significant technical challenges in remote locations and increasingly
DEPARTMENT OF ENVIRONMENTAL PROTECTION Office of Oil and Gas Management
 DEPARTMENT OF ENVIRONMENTAL PROTECTION Office of Oil and Gas Management DOCUMENT NUMBER: 800-0810-003 TITLE: EFFECTIVE DATE: AUTHORITY: POLICY: PURPOSE: APPLICABILITY: DISCLAIMER: Guidelines for Development
SURFACE CASING SELECTION FOR COLLAPSE, BURST AND AXIAL DESIGN FACTOR LOADS EXERCISE
 SURFACE CASING SELECTION FOR COLLAPSE, BURST AND AXIAL DESIGN FACTOR LOADS EXERCISE Instructions Use the example well data from this document or the powerpoint notes handout to complete the following graphs.
International Well Control Forum. IWCF Drilling Well Control Syllabus Level 3 and 4 March 2017 Version 7.0
 International Well Control Forum IWCF Drilling Well Control Syllabus and 4 March 2017 Version 7.0 IWCF Drilling Well Control Syllabus and 4 Contents Guidance Notes... 5 1.1. Introduction... 5 1.2. Who
Transient Analyses In Relief Systems
 Transient Analyses In Relief Systems Dirk Deboer, Brady Haneman and Quoc-Khanh Tran Kaiser Engineers Pty Ltd ABSTRACT Analyses of pressure relief systems are concerned with transient process disturbances
The key to connectivity
 The key to connectivity Kerry Daly, Global BD Manager, Tubing Conveyed Perforating (TCP) First published by Oilfield Technology, November 2015 Connecting oil or gas-bearing formations with the wellbore
MASTER S THESIS. A Discussion of Well Control Methods. Faculty of Science and Technology. Study program/ Specialization: Spring semester, 2013
 Faculty of Science and Technology MASTER S THESIS Study program/ Specialization: Petroleum Engineering Spring semester, 2013 Open Writer: Øystein Røssland (Writer s signature) Faculty supervisor: Professor
Extended leak off testing
 Extended leak off testing Rev: 1.0 03/01/01 Purpose To ensure minimal operational time and risk exposure to personnel, process, production and equipment. The following extended leak off test procedures
Simulation study evaluating alternative initial responses to formation fluid influx during managed pressure drilling
 Louisiana State University LSU Digital Commons LSU Master's Theses Graduate School 2007 Simulation study evaluating alternative initial responses to formation fluid influx during managed pressure drilling
GEOTHERMAL WELL COMPLETION TESTS
 GEOTHERMAL WELL COMPLETION TESTS Hagen Hole Geothermal Consultants NZ Ltd., Birkenhead, Auckland, New Zealand. ABSTRACT This paper reviews the measurements that are typically made in a well immediately
Case studies from classes led by Dr. Ron Fulbright, University of South Carolina Upstate. IMPROVED BLOWOUT PREVENTER
 INNOVATIVE ANALYSIS IMPROVED BLOWOUT PREVENTER 1. BRIEF DESCRIPTION OF THE SITUATION The blowout preventer (BOP) is a valve assembly usually mounted on the sea floor at the mouth of an oil well to control
VOLUMETRIC METHODS and STRIPPING OPERATIONS
 VOLUMETRIC METHODS and STRIPPING OPERATIONS WELL CONTROL SCHOOL Muscat, Oman Training Center VOLUMETRIC METHODS and STRIPPING OPERATIONS The material contained here, is based on the best sources available
Gas Gathering System Modeling The Pipeline Pressure Loss Match
 PETROLEUM SOCIETY CANADIAN INSTITUTE OF MINING, METALLURGY & PETROLEUM PAPER 2005-230 Gas Gathering System Modeling The Pipeline Pressure Loss Match R.G. MCNEIL, P.ENG. Fekete Associates Inc. D.R. LILLICO,
AADE 2009NTCE-04-04: PRACTICAL ASPECTS AND VALUE OF AUTOMATED MPD IN HPHT WELLS
 sudden appearance of permeable sequences abnormally pressured to higher than anticipated levels in an already narrow margin. 2009 NATIONAL TECHNICAL CONFERENCE & EXHIBITION, NEW ORLEANS, LOUISIANA AADE
IWCF Equipment Sample Questions (Surface Stack)
") IWCF Equipment Sample Questions (Surface Stack) 1. During a well control operation 4000 psi was shut in below the middle pipe rams. Ram type BOP data: Model: Cameron U type Rated Working Pressure: 15000
IWCF Equipment Sample Questions (Surface Stack) 1. During a well control operation 4000 psi was shut in below the middle pipe rams. Ram type BOP data: Model: Cameron U type Rated Working Pressure: 15000
Recommended minimum functional specifications and standards for geothermal wells in the Netherlands v.5
 Recommended minimum functional specifications and standards for geothermal wells in the Netherlands v.5 1. Introduction... 1 2. Rationale... 2 3. Minimum functional specifications... 5 4. Minimum standards
R.K. Bansal, Weatherford; P.A. Bern, BP Exploration; Rick Todd, Weatherford; R.V. Baker, BP America; Tom Bailey, Weatherford
 AADE-07-NTCE-69 A Downhole Tool for Reducing ECD R.K. Bansal, Weatherford; P.A. Bern, BP Exploration; Rick Todd, Weatherford; R.V. Baker, BP America; Tom Bailey, Weatherford Copyright 2007, AADE This paper
Success Paths: A Risk Informed Approach to Oil & Gas Well Control
 API Winter E&P Standards Conference, Austin January 18, 2017 Success Paths: A Risk Informed Approach to Oil & Gas Well Control Dr. Dan Fraser Director, Strategic Alliances for Global Energy Solutions,
SIMULATION OF A RE-ENTRY WITH CASING DRILLING UNDER HPHT CONDITIONS Gabriella Federer-Kovacs 1. Introduction
 Simulation of a re-entry with casing drilling under HPHT conditions SIMULATION OF A RE-ENTRY WITH CASING DRILLING UNDER HPHT CONDITIONS Gabriella Federer-Kovacs 1. Introduction Due to the ongoing depletion
SPE The paper gives a brief description and the experience gained with WRIPS applied to water injection wells. The main
 SPE 102831 Online Water-Injection Optimization and Prevention of Reservoir Damage Bjørn Øyvind Bringedal, Svein Arne Morud, Nicolas Alexander Hall, ABB; Gary Huseman, Shell Copyright 2006, Society of Petroleum
International Journal of Petroleum and Geoscience Engineering Volume 03, Issue 02, Pages , 2015
 International Journal of Petroleum and Geoscience Engineering Volume 03, Issue 02, Pages 116- ISSN: 2289-4713 Improving Reservoir Recovery Factor Using Enhanced Electrical Submersible Pump Design; a Case
SPE MS Well Collision Avoidance Management and Principles
 SPE 184730-MS Well Collision Avoidance Management and Principles S.J. Sawaryn, Consultant On behalf of the SPE Wellbore Positioning Technical Section (WPTS) Collision Avoidance Sub-Committee also referred
NORSOK Standard D-010 Rev 4. August 2012
 NORSOK Standard D-010 Rev 4. August 2012 Changes to the section: The content of the section is by and large the same as the rev. 3 version, but we have improved the text, made some new statements and removed
Coiled Tubing string Fatigue Management in High Pressure Milling Operation- Case Study
 Coiled Tubing string Fatigue Management in High Pressure Milling Operation- Case Study Abstract: Paper Presenter: Ebrahim Rabbani 1 e.rabbani@mehranservices.com Ebrahim Rabbani, Danial Davoodi 2, Fatemeh