Validation of a heat stress index and hydration of workers in tropical Australia
|
|
|
- Abner Powell
- 5 years ago
- Views:
Transcription
1 School of Public Health Validation of a heat stress index and hydration of workers in tropical Australia Veronica Susan Miller This thesis is presented for the degree of Master of Science (Public Health) of Curtin University of Technology July 2007
2 DECLARATION To the best of my knowledge and belief this thesis contains no material previously published by any other person except where due acknowledgment has been made. This thesis contains no material which has been accepted for the award of any other degree or diploma in any university. Page 2
3 ABSTRACT In many parts of Australia the climate is such that people are working long hours in the heat. Consequences of excessive environmental heat stress range from reduction in safety due to impairment of concentration, to heat illness, which in extreme cases can be fatal. A critical factor in tolerance of workers to environmental heat stress is their level of hydration. Maximising productivity without compromising the health and safety of the work force requires quantification of the degree of stress posed by the thermal environment. For this purpose a number of heat stress indices have been developed. A recently introduced index is the Thermal Work Limit (TWL), which has been widely adopted and implemented in the underground mining industry in Australia. The field use of TWL and protocols in the mining industry with resultant reduction in heat illness and lost production is a practical endorsement of the index, and its validity under controlled conditions has been confirmed by a preliminary study. The further work needed to complete this validation forms part of this thesis. TWL was found to reliably predict the limiting workload in the controlled environment, reinforcing the validity of the algorithm and its application in the workplace. To date TWL has largely been used in the underground environment, however as the algorithm is equally applicable to the aboveground environment where radiant heat forms a significant component of the thermal load, field studies were carried out at mining installations in the Pilbara region of Western Australia to evaluate this application of the index. The current industry standard index of heat stress is the Wet bulb Globe Temperature (WBGT). The shortcomings of this index are widely acknowledged and in practice it is frequently ignored as it is seen to be unnecessarily conservative in many situations. The sensitivity of TWL to the cooling effect of air movement implied that TWL would be more relevant than WBGT as a predictor of the impact of environmental heat stress in outdoor work environments and this was supported by the results. On the strength of this, recommended management protocols linked to TWL similar to those already in Page 3
4 place in many underground workplaces, were developed for the management of thermal risk in outdoor work environments. Maintaining adequate hydration is the single most important strategy to counteract the effects of thermal stress. No heat stress index can protect workers from the combined effects of dehydration and thermal stress. To document the hydration status of the outdoor workforce in the Pilbara, the hydration level of groups of workers was assessed from the specific gravity of their urine. To further evaluate whether the fluid replacement behaviour of the workers is adequate to replace fluids lost in sweat, a fluid balance study was carried out to quantify average fluid intakes and sweat fluid losses. The majority of workers were found to be inadequately hydrated at the start of the shift and their fluid intakes were in general well below the requirements to replace sweat losses - let alone improve hydration. Recommendations for fluid intakes based on documented rates of sweat loss are included in the thesis. Based on the findings of this study workable management strategies have been recommended to minimise the risk to outdoor workers in thermally stressful environments. Page 4
5 ACKNOWLEDGEMENTS I am grateful for the support and expertise of my supervisor, Dr Graham Bates, whose persistence and encouragement have contributed enormously to the completion of this thesis. My appreciation goes to the subjects in both parts of the study, without whom there would have been no data and I acknowledge the contribution of Rio Tinto Iron Ore who provided access to worksites and met the expenses of conducting the field study. Page 5
6 CONTENTS 1 CHAPTER 1: INTRODUCTION AND LITERATURE REVIEW General Introduction Background and literature review Heat Balance Thermoregulation in the heat Heat stress and heat strain Performance decrements in the heat Cognitive impairment Physical performance decrement Heat Illness Indices of Heat Stress and Strain Aims of the study Published papers CHAPTER 2: METHODS Validation of the Thermal Work Limit Laboratory Validation Study design Protocol Field evaluation Study design Protocol Documentation of fluid balance and hydration status Hydration status Fluid Balance CHAPTER 3: RESULTS TWL validation Laboratory study Field study Environmental Physiological Hydration and fluid balance studies CHAPTER 4: DISCUSSION Page 6
7 4.1 Part A: TWL Experimental validation Field evaluation Conclusions from TWL study Part B : Hydration Hydration status and fluid balance Conclusions from the hydration study CHAPTER 5: GENERAL CONCLUSIONS APPENDICES Appendix 1: Recommendations to Rio Tinto Iron Ore Appendix 2: Environmental data (heat chamber study) Appendix 3: Environmental data (outdoor locations - second summer) Appendix 4: Physiological data (hydration and fluid balance study - second summer) Appendix 5: Environment datalogs (Field study second summer) REFERENCES PUBLISHED PAPERS Page 7
8 TABLES Table 1. Anthropometric and physiological data for the subjects in the controlled environment study Table 2. Conditions during the eleven controlled environment sessions Table 3. Numerical scale for rating perceived fatigue level Table 4. Maximum core temp reached and limiting external workloads for each of the two work trials completed by each subject in the controlled environment study Table 5. Fluid balance data for subjects in the controlled environment study Table 6. Summary of environmental data for the TWL field study Table 7. Indicators of physiological strain: summary of data from the TWL field study Table 8 a&b. Summary of urine specific gravity data collected pre-, mid and post-shift from all sites Table 9. Fluid balance data (second summer) Table 10. Range of environmental conditions recorded over the shift (first summer) Table 11. Outdoor environmental conditions over shift (second summer) Table 12. Recommended management protocols for the implementation of TWL in the aboveground workplace Page 8
9 FIGURES Figure 1. Heart rate and core temperature records of a subject in the controlled environment trial showing a limiting external workload at 50W (~130 W.m -2 ). 39 Figure 2. This subject s temperature exceeded 38.2 o C in the third work period. He was then unable to stabilise at a subsequent lower workload Figure 3. Heart rate record from subject at site 2 performing continuous manual labour Figure 4. Heart rate record from subject at site 3 performing varied tasks Figure 5a&b. Distribution of specific gravities of all urine samples collected from all sites for first (a) and second (b) summers of the study Figure 6a&b. Environmental parameters and heat stress indices at 15 minute intervals over a five hour period during one of the study days Page 9
10 1 Chapter 1: Introduction and literature review 1.1 General Introduction Occupational heat stress is an aspect of occupational health that in the past has not been adequately addressed. Heat stress occurs in many industrial situations, and can often be ameliorated by manipulating the working environment, this is not always possible however and this is particularly the case when work is done in outdoor environments where workers may be exposed to a combination of high ambient temperatures, high radiant heat load and commonly, high humidity. There are many parts of the world in which large numbers of workers in the construction, agriculture and resources industries work long hours in thermally stressful environments, Since it is now widely accepted that global warming is a reality this will inevitably increase the number and the range of people working in the heat, and the severity of the conditions in which they work. In Australia outdoor workers in northern and inland regions are already exposed to a thermal environment that is among the world s harshest. As much primary production industry, such as mining, is situated in remote locations, workers are often flown in for a period during which they may work as many as twenty-one consecutive days of up to twelve-hour shifts in a hot and often humid environment. Working in conditions of thermal stress has associated risks and consequences for both the worker and the employer. Impairment of mental function and increased fatigue have implications for workplace safety, whilst reduced physical performance has an impact on productivity. Heat related illnesses range from merely irritating conditions such as prickly heat to the serious and potentially fatal condition of heat stroke. A critical factor in the tolerance of workers to environmental heat stress is their level of hydration. Under Australian legislation employers have a duty of care to protect workers, however the guidelines to ensure this protection in hot environments are inadequate, inconsistent and often inappropriate for Australian conditions. Maximising production without compromising the health and safety of the workforce requires the implementation of a Page 10
11 comprehensive thermal management protocol incorporating the use of a reliable, meaningful heat index and education of the workforce in the importance of maintaining an adequate level of hydration. Heat indices currently in use are either difficult to apply or poorly applicable in many situations leaving many industries without an effective heat management strategy. Previous studies in underground mine workers in Australia have found that many workers are inadequately hydrated for the conditions and the situation was expected to be similar for outdoor workers. One part of this thesis presents evidence obtained from laboratory and field studies validating the use of the Thermal Work Limit as an index to quantify the degree of stress posed by the thermal environment. The second part reports the collection of data evaluating the hydration status and fluid replacement behaviour of outdoor workers in the northwest of Australia. Based on these studies recommendations are provided for the management of thermal risk in hot outdoor environments. 1.2 Background and literature review It has been said (Sawka, Wenger & Pandolf 1996) that humans are tropical animals being physiologically better adapted to maintain thermal balance in warm conditions than in the cold. In hot parts of the world these physiological mechanisms have traditionally been supplemented by behaviours limiting the amount of work done during the hotter parts of the day, in the modern world these behaviours often conflict with the demands of industry. In Australia much primary industry is either sited in areas where the harshness of the climate has in the past precluded all but a very simple lifestyle, or for example in the case of underground mining, requires large numbers of people to work in a created environment of high heat and humidity. In these situations physiological mechanisms may be overloaded exposing workers to the risk of heat accumulation. Page 11
12 1.2.1 Heat Balance Maintenance of a stable body temperature requires a balance between heat gain and heat loss. When heat gain exceeds heat loss storage of heat occurs and hyperthermia results, producing functional impairment and potentially heat illness. Heat is produced endogenously as a by-product of metabolism, mainly in the muscles. Most types of muscular activity are at most about 20% efficient in terms of energy conversion so during any form of physical activity at least four times as much energy appears as heat as is used to do work. During strenuous physical activity the metabolic rate and hence heat production may be increased ten-fold or more, challenging the body s ability to remain in heat balance. Heat is lost from the body primarily though the surface of the skin, although some is also lost from the lungs. Heat is transported to the surface of the body mainly by the blood; hence regulation of cutaneous blood flow is an important mechanism for regulating heat loss. Heat exchange with the environment occurs by processes of conduction, convection, radiation (dry heat exchange), and evaporation. The rate and direction of conductive transfer depends on skin temperature relative to the air and is enhanced by convective transfer, which increases with air movement. In situations where the air is at a higher temperature than the skin surface (i.e. >35 o C ambient) conduction and convection actually transfer heat to the skin contributing to heat gain. A high skin temperature favours radiative heat loss, but exposure to sources of radiant heat such as the sun, hot machinery, or industrial processes such as foundries may result in a net gain of heat by this mechanism. The high latent heat of vaporisation makes the evaporation of water a very effective way of cooling the body. Most evaporative heat loss takes place through the evaporation of sweat from the surface of the body although, particularly in dry air, a significant amount of heat may be lost by evaporation from the respiratory passages and lungs, and this contribution to heat loss will be increased during activity as respiration increases. In conditions of high ambient temperatures evaporation is the only mechanism for dissipating heat, and must occur at a rate that is adequate to not only dissipate endogenous heat but also to reject heat gained from the environment. Hence in hot conditions we may be conscious of sweating even at rest. Fortunately the saturation vapour pressure for water increases with air temperature, allowing more water to Page 12
13 evaporate at higher ambient temperatures and provided that the water vapour content of the air (humidity) is not already high, it is possible to continue to lose heat and to remain in heat balance in conditions of high ambient temperature. However the need to reject heat gained from the environment will correspondingly reduce the amount of endogenous heat that can be dissipated and therefore the amount of physical activity that can be carried out whilst remaining in heat balance. In mild conditions the heat loss mechanisms are usually adequate to remove the endogenous heat and heat balance can be maintained even at high levels of physical activity. As the ambient temperature increases evaporation becomes increasingly the dominant mechanism of heat loss and humidity becomes a critical factor in heat balance. With increasing humidity sweating becomes less effective as a cooling mechanism, thermal discomfort increases and the level of sustainable physical activity is progressively limited. In humid environments air movement over the skin is extremely important as this enhances both convective and evaporative heat loss. Increasing the air movement is one of the simplest and most cost effective methods of improving thermal comfort and increasing productivity in hot workplaces. Clothing factors can influence heat loss mechanisms both positively and negatively. The heavy protective clothing required in some workplaces restricts heat transfer compounding the thermal challenge of a hot environment, however in other situations appropriate clothing may permit conductive and convective heat loss whilst protecting against heat gain from radiant sources and by convection where the air temperature is high. Clothing with high vapour permeation permits evaporation and fabric with good wicking properties can enhance heat loss by this mechanism Thermoregulation in the heat When the net heat gain processes exceed the capacity of the heat loss mechanisms heat storage occurs and hyperthermia results. Even without heat storage, hot and particularly humid environmental conditions stress the physiological mechanisms of heat dissipation and, particularly if combined with an increased metabolic heat load from exercise or work, place the individual at risk of heat illness. Page 13
14 Heat generated within the metabolically active muscles is transported to the skin surface in the blood. The high specific heat of water allows the transport of large amounts of heat for only a modest rise in temperature. The opening of capillary beds near the surface raises the skin temperature facilitating heat loss to the environment (or in fact heat gain if the environmental temperature exceeds the skin temperature.) This increase in cutaneous circulation must be supported by an increased cardiac output unless blood can be diverted from elsewhere. During physical activity the active muscles demand a substantial increase in blood flow and the thermoregulatory requirement is in addition to this. The ability of the cardiovascular system to service these competing demands is one of the factors influencing tolerance to working and exercising in the heat. A number of authors (Cadarette et al. 1984; Cheung & McLellan 1998; Selkirk & McLellan 2001; Otani et al. 2006) report an association between aerobic fitness (as measured by cardiovascular response to exercise) and enhanced tolerance to exercise in the heat, with the fitter individuals having both a cardiovascular advantage (lower working heart rate) and a thermoregulatory (lower core temperature) advantage over the less fit. Acclimatisation to hot climates or heat acclimation (adaptation induced by exposing the individual to a hot environment) likewise increases tolerance to working in heat. Sawka and colleagues (Sawka et al. 2000) have reviewed evidence that whilst both aerobic training and heat acclimation increase plasma volume, potentially enhancing the ability to transport heat to the surface, plasma volume expansion in unacclimated subjects failed to deliver a thermoregulatory benefit, implying that the adaptive changes involve more than simple plasma volume expansion. Erythrocyte volume expansion however, such as occurs with aerobic training but not with heat acclimation, did confer a thermoregulatory advantage and may contribute to the enhanced heat tolerance in fit individuals. Conversely hypohydration or reduction in body water content has been repeatedly shown to reduce stroke volume (Gonzalez-Alonso, Mora-Rodriguez & Coyle 2000), cardiac output (Montain et al. 1998; Sawka et al. 2000) and exercise tolerance in heat (Otani et al. 2006; Cheung & McLellan 1998; Buskirk, Iampetro & Bass 2000; Cheuvront et al. 2005; Marino, Kay & Serwach 2004) and to negate the thermoregulatory benefits of acclimation (Cadarette et al. 1984; Sawka & Montain Page 14
15 2000). Hypohydration reduces the effectiveness of both dry and evaporative avenues of heat loss. Both cutaneous blood flow and the sweating response are adversely affected, compromising heat loss with a resulting increase in core body temperature. The increase in evaporative heat loss required in hot environments when metabolic heat output is increased places workers at particular risk of dehydration. Sweat rates of over one litre per hour are not uncommon (Brake & Bates 2003; Miller & Bates 2007) and if this fluid loss is not replaced adequately and appropriately progressive dehydration results. As sweat is hypotonic to plasma the volume loss is accompanied by a progressive increase in the osmolality of the extracellular fluid (ECF) leading to a fluid shift from the intracellular to the extracellular compartment protecting the plasma volume. In acclimatised individuals the onset of sweating is advanced and the magnitude of the response is increased enhancing the evaporative route of heat loss, however the increased sweating means that the risk of dehydration is actually greater. The adverse effects of the fluid loss are offset by a higher starting plasma volume and the production of more hypotonic sweat (Bates, Gazey & Cena 1996) resulting in a greater increase in plasma osmolality and enhancing the shift of fluid from the intracellular compartment, however replacement of both lost fluids and electrolytes is essential to maintain hydration and preserve the thermoregulatory advantage Heat stress and heat strain The extent to which the thermal environment challenges the body s thermoregulatory mechanisms is referred to as the environmental heat stress or thermal stress. Heat strain or thermal strain refers to the physiological response to the thermal environment. If an individual experiences significant heat strain as a result of thermal stress, performance is likely to be impaired and they are at risk of developing heat illness Performance decrements in the heat Environments that challenge the maintenance of heat balance adversely affect physical and cognitive performance affecting both the safety and productivity of workers. Functional impairment in the heat may be a result of an increase in body temperature, Page 15
16 but it may also be due to dehydration with the associated rise in osmolality and the cellular dehydration resulting from fluid shift. Any or all of these mechanisms may contribute to the observed changes, and many studies have attempted to characterise the nature of the performance decrements, their physiological basis, and the thresholds at which the impairment becomes significant Cognitive impairment In an early study Gopinathan, Pichan and Sharma (1988) investigated the role of dehydration in the deterioration in mental function induced by exercise in the heat and concluded that impairment became significant at 2% or more loss of body weight. Amos et al. (2000) found that soldiers who maintained their hydration levels displayed no evidence of cognitive deterioration. However adequate hydration is critical to thermoregulation, with subjects who are dehydrated likely to experience a rise in temperature. Following a detailed evaluation of a number of studies Hancock and Vasmatzidis (2003) concluded that the rate of increase of deep body temperature is the critical factor influencing the onset of cognitive performance deficit whereas McMorris et al (2006) argue that heat stress implies some dehydration and that both contribute to the decline in cognition, with reduction in blood flow to cognitive brain areas also likely to be involved. A consequence of dehydration is some degree of cellular dehydration to which brain cells are particularly vulnerable and which could be expected to impair cognition. From a rigorous meta-analysis of 22 original studies Pilcher, Nadler & Busch (2002) concluded that both hot and cold temperatures impacted negatively on a wide range of cognitive tasks, whilst an Australian study (Hocking et al. 2001) using functional brain imaging showed differences in the electrical activity during performance of a range of tasks when subjects were thermally stressed compared with the unstressed state. Different types of cognitive task are not impaired to the same degree, with evidence suggesting (Hancock & Vasmatzidis 2003) that simple tasks are less vulnerable to heat stress than more complex tasks, and that vigilance and monitoring performance is the most sensitive type of performance to the adverse effects of heat stress and that performance is most compromised by a high humidity component to the thermal Page 16
17 environment. Pilcher s analysis (Pilcher, Nadler & Busch 2002) found the greatest decrement in attention/perceptual tasks. Other authors have concluded that central executive tasks are inhibited by heat stress (McMorris et al. 2006). These findings provide a probable basis for the negative effect of heat stress on safe work behaviour documented by Ramsey s group, who noted a U-shaped relationship between the incidence of unsafe work behaviour and an index of thermal conditions (Ramsey et al. 1983) Physical performance decrement Exposure to heat has been shown both to impair physical work capacity, reducing productivity, and to accelerate fatigue. Studies have shown a relationship between the internal body temperature and the development of fatigue in humans (Gonzalez-Alonso et al. 1999; Walters et al. 2000) and rats (Gonzalez-Alonso et al. 1999; Walters et al. 2000) with evidence linking attainment of a critical limiting temperature to a state of physical exhaustion. Hence the time to exhaustion correlates with the rate of rise in internal temperature, which in turn is influenced by the thermal environment and the physiology of the individual. As discussed above, acclimatisation and aerobic fitness confer a thermoregulatory advantage by enhancing heat dispersal and tolerance to elevated core temperature. High body fatness, on the other hand, was found (Selkirk & McLellan 2001) to negate the effect of aerobic fitness presumably because of the lower heat capacity of adipose tissue. Hydration status is a crucial determinant of the ability to tolerate thermal stress. The water content of the body determines its heat storage capacity whilst failure to maintain an adequate plasma volume compromises heat loss. Numerous studies (Marino, Kay & Serwach 2004; Cheuvront et al. 2005; Yoshida et al. 2002; Cheung & McLellan 1998; Otani et al. 2006; Sawka 1992; Sawka & Pandolf 1990) link hypohydration, whether induced by heat exposure, exercise, fluid restriction, or diuresis, with impaired physical performance and accelerated fatigue in hot conditions. Studies reviewed by Sawka and Pandolf (1990) found that body water deficits from sweating of a mere 1-2% of body weight resulted in a 6-7% reduction in physical work capacity in a moderate environment. Water deficits of 3-4% in the same environment resulted in a 22% Page 17
18 reduction in physical work capacity. Body water losses of 4% in a hot environment, where thermoregulatory demands on the circulation are greater, resulted in a physical work capacity reduction of approximately 50%. These effects are more cardiovascular than neuromuscular, aerobic capacity is predominantly affected with anaerobic capacity and muscle strength (Ftaiti et al. 2000) relatively unaffected by moderate fluid deficits. Endurance capacity is likewise adversely affected by hypohydration, Marino, Kay & Serwach (2004) found that with exercise times longer than 40 minutes the time to fatigue was reduced by fluid restriction, correlating with an accelerated rate of increase in rectal temperature. Body water deficits of as little as 2% (Otani et al. 2006) reduce exercise tolerance time in the heat and result in significant impairment regardless of fitness or heat acclimation status (Cheung & McLellan 1998). A Japanese study (Yoshida et al. 2002) likewise concluded that the critical level of water deficit for aerobic performance impairment is of the order of 2%; below this level plasma volume is adequately defended by fluid shift from the interstitial space. These authors also showed a reduction in anaerobic power at higher levels of dehydration (3-4%), which they speculated could be induced by electrolyte abnormalities, metabolic changes, or increases in muscle temperature. Chinese researchers (Lu & Zhu 2006), in a study investigating physiological limits to heat exposure, determined that regardless of conditions or work intensity, the exposure limit was reached when the difference between oral and skin temperature was less than about 1 o C. At this point there is virtually no temperature gradient permitting heat transfer from the body core to the surface. They also found that some of their subjects reached this exposure limit at as little as 1% dehydration, regardless of workload or exposure time, with only 10% being able to continue working with a fluid loss of greater than 3%. They therefore proposed a limit of 1% hypohydration for safe heat exposure Heat Illness Disorders associated with working in hot conditions range from the mildly irritating condition of prickly heat, a skin irritation resulting from copious sweating, to the serious but rare condition of heat stroke with a mortality rate of around 80%. Page 18
19 From an audit of 80 patients with heat related illness Day and Grimshaw (2005) proposed classification into four categories based on a combination of clinical findings and haematological and biochemical investigations of fluid and electrolyte status. Different categories were characterised by varying degrees of water and salt loss with reduction of extracellular fluid volume being a common central mechanism. In the fourth and most serious category the biochemical derangements were accompanied by a loss of normal thermoregulation characterised by high core temperature and paradoxical cessation of sweating. Clinically four dominant heat disorders are usually described (Kamijo & Nose 2006): Heat cramps Heat syncope Heat exhaustion Heat stroke although criteria for distinguishing these are not always consistent. Heat cramps are painful involuntary contractions of the muscles associated with working in hot conditions (Donoghue, Sinclair & Bates 2000a). However the term heat cramp may be misleading. Increased body temperature is not responsible and Noakes (1998) remarks that exercise induced cramps may occur in susceptible individuals whether or not high environmental heat is a factor with evidence suggesting that a spinal neural mechanism may be responsible. On the other hand, Donoghue, Sinclair and Bates (2000a) found that heat cramps are associated with dehydration (though not hyponatraemia) and Stofan et al. (2005) in reporting an observational study of football players prone to cramping, concluded that sweat sodium losses and fluid deficits incurred may be comparatively larger in cramping than non-cramping players. Unpublished studies in this laboratory corroborate this. These observations support a conclusion that fluid/electrolyte imbalance is involved. As sweat losses are greater in the heat, susceptible individuals would logically be at increased risk of cramping when working or exercising in thermally stressful conditions. Page 19
20 Heat syncope and heat exhaustion result from the inability of the circulation to meet both thermoregulatory and circulatory demands (Schutte & Zenz 1994). Heat syncope (fainting) occurs when reduced venous return to the heart as a result of excessive pooling in the peripheral vasculature (with or without hypovolaemia) compromises cardiac output and blood pressure cannot be maintained. Heat exhaustion results from severe fluid and salt loss and may manifest with elevated core body temperature (but < 40 o C) and signs of cerebral ischaemia. From a one year prospective study of 106 cases of heat exhaustion Donoghue (Donoghue, Sinclair & Bates 2000a; Donoghue 2003) has reported that in addition to dehydration the condition is characterised by a clear cut biochemical and haematological profile suggestive of a considerable stress response and impaired tissue perfusion. Heat stroke is a severe condition resulting from breakdown of the thermoregulatory mechanisms resulting in a severe (>40 o C) or prolonged rise in body temperature and consequent tissue injury. Organ damage is widespread and results from both hypoxia and hyperpyrexia (Yan et al. 2006). Acute injury to the heart, kidneys, and liver may be permanent as indicated by a recent study which found that prior hospitalisation for severe heat illness was accompanied by a 40% increase in all cause mortality (Wallace et al. 2007). An exacerbating factor is the systemic inflammatory response with the release of pyrogenic cytokines potentially contributing to the temperature elevation by increasing the hypothalamic thermoregulatory set-point (i.e. producing fever). In this regard parallels have been suggested with the potentially fatal condition of malignant hyperthermia (MH), Muldoon et al. (2004) present evidence suggesting a genetic link between the majority of MH susceptible cases and a subset of exertional heat stroke cases. Studies reviewed by Lambert (2004) indicate that reduced splanchnic blood flow during exercise, particularly if accompanied by dehydration, may compromise the barrier function of the gastrointestinal epithelium permitting the uptake of endotoxin, a lipopolysaccharide component of gram negative bacteria, which amongst other actions, promotes vasodilation by increasing production of nitric oxide (NO) within the vascular system, reducing blood pressure and precipitating circulatory collapse. Endotoxin is also a potent stimulator for the release of proinflammatory cytokines having both tissue Page 20
21 damaging and pyrogenic effects. The observation that most humans with exertional heatstroke do continue to sweat suggests that resetting of the hypothalamic thermostat by endogenous pyrogens does not usually contribute to the hyperpyrexia, however in those serious cases where the elevated temperature is accompanied by cessation of sweating this may well be a factor. Complication by endotoxaemia undoubtedly contributes to the widespread organ damage of heatstroke increasing the severity of the condition and reducing chances of survival (Lambert 2004; Kamijo & Nose 2006; Yan et al. 2006). The risk of all forms of heat illness is greatly exacerbated by poor hydration. When ambient temperatures are extreme or when high temperatures are combined with high humidity the fluid losses in sweat may exceed 1 litre per hour (Brake & Bates 2003; Miller & Bates 2007), predisposing to progressive dehydration during prolonged work in the heat. As sweat is hypotonic to plasma the volume loss is accompanied by a progressive increase in the osmolality of the extracellular fluid (ECF), so that the reduction in ECF volume is buffered by a fluid shift from the intracellular compartment (Kamijo & Nose 2006). Continued sweating and failure to adequately replace lost fluid and electrolytes eventually leads to manifestations of heat illness. The biochemical changes (Donoghue, Sinclair & Bates 2000a; Donoghue 2003) accompanying cellular dehydration and impaired tissue perfusion contribute to headache, fatigue and other signs of heat exhaustion, whilst reduction in plasma volume (Jimenez et al. 1999) may result in lightheadedness or syncope. Ultimately the inability to maintain cutaneous circulation and an adequate sweat rate permits core temperature to rise and the individual succumbs to heat stroke. Clearly adequate hydration is a critical factor in prevention of heat illness, as is acclimatisation, which enhances thermoregulation by increasing plasma volume and sweat response. However even when heat loss mechanisms are optimised there is an upper limit to the heat load that can be dissipated. In many situations workers will selfpace, adjusting either the work rate or the duration of work intervals to maintain thermal Page 21
22 balance. The danger is that when the work is externally paced (e.g. by machinery factors, quotas, peer pressure etc), or the sustainable level of work is perceived as being unacceptably low, workers will push themselves beyond the safe limit and be at risk of developing heat illness. At most risk are those who are poorly hydrated, unacclimatised overweight or physically unfit Indices of Heat Stress and Strain Protection of workers in hot environments requires a means of identifying conditions where excessive thermal stress places their health at risk. A large number of indices have been developed for this purpose, some of which are industry specific. Indices are broadly either empirical or rational. Empirical indices are based on field observations and generally expressed in terms of a single or a combination of environmental parameters. Rational indices are derived from physiological considerations and either predict thermal strain based on environmental conditions or monitor physiological indicators of heat strain. A comparison of a range of both empirical and rational indices carried out by Brake (Brake & Bates 2002c) identified major differences between heat stress indices in current use as well as internal inconsistencies within some indices. International Standard ISO 7933:2004 (ISO 2004) uses the Predicted Heat Strain (PHS) index (Malchaire et al. 2001; Malchaire 2006). This index, which predicts sweat rate and rectal temperature for an average subject and calculates duration limits for exposure, was developed as a revision of the earlier Required Sweat Rate index in a concerted project involving a number of European laboratories and has been validated through lab and field experiments. Despite its being the international standard this index has failed to achieve widespread acceptance in the field as its implementation requires a level of expertise not always available. In commoner use is the Wet Bulb Globe Temperature (WBGT), and the American Conference of Governmental Industrial Hygienists (ACGIH) set the TLV (Threshold Limit Value) in terms of this (ACGIH 2007). The shortcomings of WBGT are widely recognised (Taylor 2006; Brake & Bates 2002b) and include its relative insensitivity to the cooling effects of air movement. Both WBGT and ISO 7933 require an estimation of metabolic rate, which is notoriously inaccurate, and which may vary considerably over a work period. In practice the WBGT is often seen to Page 22
23 be excessively conservative and is largely ignored in many situations where its rigorous implementation would lead to unacceptable and unnecessary losses in productivity. Reactive as opposed to predictive indices monitor physiological parameters as indicators of thermal strain and can be linked to interventions at predetermined levels of strain. One such index is the Physiological Strain Index (PSI), developed from a database of heart rate and rectal temperature measurements obtained from 100 young male subjects exercising in hot conditions (Moran 2000; Moran, Shitzer & Pandolf 1998) and subsequently applied to rats (Moran et al. 1999) and evaluated against a number of databases (Moran 2000). The authors state that the PSI has potential for wide acceptance and universal service, however as monitoring of the PSI requires the continuous measurement of rectal temperature and heart rate its application in the workplace is likely to be limited. The ideal heat stress index is one that is simple to determine, is reliable and unambiguous in its output, and does not require specialist knowledge for its interpretation. One of the simplest to implement is the Thermal Work Limit or TWL (Brake & Bates 2002b; Brake & Bates 2002c). TWL is a rational index derived from the heat balance relationships discussed above. The premise is that for any combination of environmental and clothing parameters there is a maximum rate at which heat can be dissipated from the body and hence a limiting metabolic rate. TWL uses five environmental parameters (dry bulb, wet bulb and globe temperatures, wind speed and atmospheric pressure) and accommodates for clothing factors to arrive at a prediction of a safe maximum continuously sustainable metabolic rate (W.m -2 ) for the conditions, i.e. the thermal work limit (TWL). At high values of TWL the thermal conditions impose no limits on work. At moderate values adequately hydrated self-paced workers will be able to accommodate to the thermal stress by adjusting their work rate. At low TWL values heat storage is likely to occur and TWL can be used to predict safe work restcycling schedules, whilst at very low values no useful work rate may be sustained. A thermal environment can therefore be classified on the basis of TWL. No estimation of metabolic rate is required; the index is calculated using proprietary software from environmental parameters that require little expertise to determine using readily Page 23
24 available instrumentation. Unambiguous interventions can be specified at different values of TWL Aims of the study Recommended management protocols based on TWL (Brake, Donoghue & Bates 1998) have been widely adopted and implemented in the underground mining industry in Australia; the resultant reduction in heat illness and lost production (Brake & Bates 2000) is an endorsement of the index and its validity has been tested under controlled conditions in a small study (Bates & Miller 2002). To date TWL has largely been used in the underground environment, however the algorithm is equally applicable to the outdoor environment where radiant heat forms a significant component of the thermal load. The research reported in this thesis was undertaken to confirm the ability of the TWL algorithm to predict limiting work rates under controlled conditions and to compare its appropriateness under field conditions in hot outdoor work environments with WBGT, the current industry standard in Australia. As an outcome of this work it was anticipated that guidelines would be generated for the implementation of TWL in outdoor workplaces similar to those already in use underground. As discussed above, poorly hydrated workers are at increased risk of heat strain or heat illness as lack of hydration compromises thermoregulation. Any comprehensive heat management strategy must therefore address the issue of hydration. A further aim was to document the level of hydration of outdoor workers at mining industry worksites in northwest Australia and to determine actual sweat rates as a basis for fluid intake recommendations. Page 24
25 1.2.8 Published papers Two papers have been written and published from this study. manuscripts are included at the end of this thesis. The published Miller, V. & Bates, G. 2007, 'Hydration of outdoor workers in northwest Australia', The Journal of Occupational Health and Safety - Australia and New Zealand, vol. 23, no. 1, pp Miller, V. & Bates, G. 2007, 'The Thermal Work Limit is a simple reliable heat index for the protection of workers in thermally stressful environments', Annals of Occupational Hygiene, vol. 51, no. 6, pp Page 25
26 2 Chapter 2: Methods 2.1 Validation of the Thermal Work Limit Validation studies consisted of a laboratory study carried out in a climate-controlled environmental chamber, and a field study carried out at various industrial locations in northwest Australia Laboratory Validation Study design The aim of the laboratory study was to determine whether the TWL index has the ability to reliably predict the level of work that an individual may safely perform in a given thermal environment. The subjects were exercised at graded workloads in a controlled environment, and monitored throughout for signs of physiological strain attributable to the thermal conditions, with the aim of determining their limiting workload. These experimentally determined limiting workloads were then compared with the predictions of the TWL index Protocol The subjects for the controlled environment study were twelve healthy young men accustomed to physical exercise. These were recruited from amongst the student body and by advertising in local health clubs. Prior to the study the subjects completed a health check and aerobic fitness assessment (Table1). Anthropometric data including body composition were collected. Pulmonary function was assessed from percent of forced vital capacity expired in one second (FEV1/FVC%), all values fell within the normal range. Maximal oxygen uptake (VO2max) as an index of aerobic capacity was predicted by the method of Åstrand and Rodahl (1986), values for all subjects showed moderate to very high fitness levels. The trials were carried out in late summer to ensure that the subjects were at least partially acclimatised to hot conditions, however it was not considered that any would be fully acclimatised for extended work under the conditions of the study. Page 26
27 Table 1. Anthropometric and physiological data for the subjects in the controlled environment study Subject Age height (cm) weight (Kg) S.A. (m 2 ) BMI WHR Fat (%) BP (mm Hg) RHR (BPM) FEV1/ FVC% VO2max (ml/kg/min) A / B / C / D / E /70 75 b b F / G /90 a H / I / J / K / L /70 54 mean S.D a Subject aware of having high blood pressure, otherwise healthy b Subject had jogged 5 Km prior to the medical, accounting for the relatively high RHR and possibly affecting estimation of VO 2max S.A. = surface area (from nomogram of Boothby and Sandiford (Boothby & Sandiford 1921)), BMI = Body mass index, WHR = waist hip ratio, RHR = resting heart rate Testing of each subject, which followed a protocol established in an earlier study (Bates & Miller 2002), was carried out over two consecutive days in a climate controlled chamber set to maintain a dry bulb temperature of o C and a wet bulb temperature of approximately 28 o C (45% relative humidity). Similar conditions are commonly encountered in outdoor work environments in tropical Australia. Air movement within the chamber was negligible. Environmental conditions were monitored every five minutes using a Heat Stress Monitor (HSM), a portable climate centre (Calor Environmental Instruments) set to display environmental parameters in real time. In this mode the instrument also computes and displays WBGT. These conditions and the computed WBGT and TWL indices for each testing day are summarised in Table 2. TWL was calculated from the mean environmental data for each session using Page 27
28 HotWork heat stress modelling and comparison software supplied by Mine Ventilation Australia. A clothing insulation value of 0.12clo was used for the calculation on the basis that the subjects were wearing only light, short shorts, which quickly became saturated with sweat, and sneakers. Dry short shorts have an insulation of approximately 0.1clo (Dr Rick Brake, personal communication) and sneakers with low cut socks were estimated to add about 0.05clo. As wet clothing has a lower insulation than dry, (eg a reduction from 0.55 to 0.35clo for a standard summer work uniform (MVA 2005), insulation of the sweat soaked shorts was estimated as 0.07clo giving a total insulation of approximately 0.12clo. For each trial the subjects remained in the chamber for up to three hours of alternating periods of work (30 minutes) and rest (10 minutes). External work was performed using Monark cycle ergometers at workloads of 40, 50 and 60W, well within the aerobic capabilities of healthy young men. These workloads were chosen to generate levels of metabolic heat in the range predicted by the TWL index to be limiting in the conditions. The ability of the subjects to maintain heat balance without strain during each work period was assessed by monitoring their core temperature and heart rate. A continuous rise in core temperature is indicative of heat storage, whilst failure of the heart rate to stabilise at these workloads shows cardiovascular strain imposed by the demands of thermoregulation. The formulation of TWL allows for an upper limit to core body temperature of 38.2 o C, a level which is in practice regularly exceeded by workers in hot conditions (Brake & Bates 2002a). Subjects who exceeded this temperature were deemed to be working above their thermal work limit and were required to stop and cool down. The protocol required that a subject stop working for the day if the core temperature exceeded 39 o C, however none of the subjects actually reached this temperature. Core temperature was monitored using pill-sized temperature transponders (HTI technologies Inc) which were ingested an hour before entering the chamber (the time taken for the device to pass through the stomach and become insensitive to the effect of fluid ingestion). These transponders remain in the gut for up to 48 hours and transmit radio signals corresponding to temperature, once voided the pills are not recovered. Page 28
29 This telemetric method of core temperature monitoring has been used for an extended study of body core temperatures in underground workers (Brake & Bates 2002a) and has been shown to correlate well with rectal temperatures during exercise-induced heat stress (Easton, Fudge & Pitsiladis). Prior to ingestion the transponders were activated and the signal was logged every 30 seconds for later analysis and displayed in real time by a monitor worn by the subject. Heart rates for each subject were also logged throughout each trial using a heart rate monitor of the type used by athletes as a training aid (Polar Instruments Sport Tester model). Both heart rates and core temperatures were also noted and recorded manually every five minutes with these values being used to make decisions about the conduct of the trial. Table 2. Conditions during the eleven controlled environment sessions. Trial day Dry Bulb ( o C) Wet Bulb ( o C) Wind speed (m/sec) WBGT ( o C) TWL (W.m -2 ) ± ± ± ± ± ± ± ± ± ± ± ± ± ± ± ± ± ± ± ± ± ± ± ± ± ± ± ± ± ± ± ± ± ± ± ± ± ± ± ± ± ± ± ± Data are means and standard deviations for readings recorded approximately every five minutes throughout each session. WBGT was calculated by the HSM at each sampling time. TWL values were computed from the mean environmental data for the session using a clothing insulation value of 0.12clo. Page 29
30 To ensure that hydration status would not be a limiting factor to the dissipation of heat the hydration level of the subjects was monitored before, during, and after each trial by measurement of urine specific gravity (hand-held urine specific refractometer: Atago Instruments). A number of studies have examined the validity of Usg as an index of hydration status. These have generally concluded that Usg correlates well with urine osmolality (Uosm) and that both are more sensitive to mild (eg. between days) variation in hydration than haematologic indices (Armstrong et al. 1998; Armstrong et al. 1994; Davies, Romer & Ramsay 2000) which may be buffered by compartmental shifts. Urine specific gravity is therefore a convenient and reliable field measure for monitoring hydration status (Davies, Romer & Ramsay 2000). Urinary measures may lag behind changes in plasma osmolality (Posm) during periods of rapid fluid turnover such as acute dehydration and post exercise rehydration (Armstrong et al. 1998; Armstrong et al. 1994; Kovacs, Senden & Brouns 1999; Oppliger et al. 2005; Popowski et al. 2001), however during a normal work shift such fluctuations are not likely except under extreme conditions. Subjects were advised to drink two large glasses of water on the morning of the trial and to refrain from drinking any caffeinated or alcoholic beverages or eating salty food. Any subject failing to produce a urine specimen with a specific gravity of less than on arrival on the morning of the trial was required to drink 500mL of water before entering the chamber. In the chamber the subjects were required to maintain hydration by drinking water on schedule at an adequate rate to compensate for the maximum sweat rate predicted by the TWL algorithm (approximately 1 litre per hour). The subjects were weighed nude before entering the chamber and then changed into exercise clothing (light shorts and sneakers). At the end of the trial the subjects again voided their bladders, showered (without wetting the hair) and towelled as dry as possible before again being weighed nude. All fluid ingested was measured and recorded. Any urine voided was collected, and the volume and specific gravity were measured. Actual average sweat rates for each subject were calculated from nude weights before and after each trial session accounting for all fluids consumed and urine voided. Any faecal voiding was accounted for by before and after weighing. Page 30
31 2.1.2 Field evaluation Locations selected were mining and mine-related sites in the northwest of Australia where environmental conditions in the summer months typically produce WBGT values in excess of the recommended guidelines. Rigorous implementation of the WBGT index would therefore severely restrict operations at these sites for a considerable part of the year. Since this industry standard has been shown by experience to be frequently irrelevant in this environment, it is largely ignored and management and safety officers are without reliable tools to quantify and manage thermal risk. The purpose of this field study was to evaluate the appropriateness of the TWL as an index of thermal stress in hot outdoor work environments Study design Participants were monitored for signs of physiological strain over three days whilst continuing with normal work. Environmental conditions were monitored at each site and both WBGT and TWL indices were computed. The level of actual physiological strain experienced by the workers was compared with that predicted by each of these indices Protocol Participants for the study were recruited through onsite Occupational Health and Safety officers. Participation was entirely voluntary and the subjects were told that they could withdraw at any time, they were asked not to modify their work behaviour in any way during the study. Field evaluation of physiological strain from heart rate is a well-established methodology (Dey, Amalendu & Saha 2007) with workers whose average working heart rates exceed 30% of their cardiac reserve considered likely to fatigue (Eastman Kodak Company 1986). Sustained or progressive increases in heart rate disproportionate to the level of physical work can be an indication of thermal strain as the body strives to maintain thermoregulation. At the beginning of each shift each subject was fitted with a Polar S720i heart rate monitor set to datalog at one-minute intervals throughout the shift; at the end of the shift Page 31
32 the information was retrieved by downloading these files. Tympanic temperatures were recorded using an over-the-counter instrument (Braun) at the beginning middle (lunch break) and end of the shift as an indication of changes in core body temperature. At the same times subjects were asked to rate their perceived level of fatigue on a simple numerical scale (Table 3) ranging from 1 (feeling really good) to 13 (completely exhausted). Urine samples were also obtained at each time for measurement of specific gravity as part of the concurrent study (reported in this thesis) documenting hydration status. Table 3. Numerical scale for rating perceived fatigue level Relative Perceived Fatigue (RPF) scale 1 feeling really good 2 3 not at all fatigued 4 5 OK 6 7 somewhat fatigued 8 9 fatigued very fatigued completely exhausted Two protocols were used to monitor the environmental conditions. To obtain a record of conditions throughout a shift an HSM was used in datalog mode to record environmental parameters and compute TWL every 15 minutes. As no environment monitoring instrument will function accurately if left too long in full sun (due to absorption of radiant heat), it was placed in shade in areas otherwise representative of the working conditions. At least once during the shift this instrument was taken out into the sun a few minutes before a sampling point was due in order to obtain data on conditions in full Page 32
33 sun. At other times an HSM was used in heat strain mode in which environmental data is averaged over 120 seconds and used to derive values for both WBGT and TWL. The instrument was used in this mode to sample work conditions at a variety of locations at each site, including full sun measurements where appropriate. The heat strain mode also incorporates a model developed by the US Army Research Institute for Environmental Medicine (USARIEM) to predict the water losses incurred through working in a given thermal environment. 2.2 Documentation of fluid balance and hydration status This study was conducted over two summers in the Pilbara region of Western Australia with the object of assessing the hydration status of representative groups of outdoor workers. During the second summer this was carried out concurrently with the TWL field evaluation using the same subjects. At the same time fluid balance studies were conducted in subgroups of these subjects in order to establish appropriate recommendations for fluid replacement under the conditions. Most subjects were sampled over two or three consecutive working days. Both coastal and inland locations were included in the study Hydration status The hydration status of all participants was assessed at the beginning, middle and end of the shift by measurement of urine specific gravity (Usg) using a hand-held refractometer (Atago). U sg has been widely adopted within the Australian underground mining industry as a convenient and reasonably reliable index of hydration status. Workers can be taught to monitor their own hydration level by observing the colour of their urine, which correlates well with the Usg (Armstrong et al. 1994; Armstrong et al. 1998). Limits used to classify hydration status by Usg vary, with Popowski and colleagues (Popowski et al. 2001) assigning euhydration status to Usg values between and 1.020, and Davies paper proposing limits of for euhydration (Davies, Romer & Ramsay 2000). In the work environment it is better to err on the side of caution, so in this thesis the classification used by Donoghue, Sinclair and Bates has been used (Donoghue, Sinclair & Bates 2000b). According to these authors a urine specific gravity of less than indicates that a subject is optimally or euhydrated; Page 33
34 values above this indicate varying degrees of hypohydration, with a value above representing a clinical state of severe dehydration Fluid Balance Fluid intake was assessed by recording the contents of each subject s drink container at the beginning and end of shift. Subjects were asked to note the number and nature of any refills and any other beverages consumed during the shift. Fluid loss was assessed by weight difference. The subjects were asked to bring a light change of clothing ( weighing clothes ). Before starting work they were weighed (± 50g) in this clothing on an electronic balance (AND model UC-300), they then changed into their work clothing. At the end of the shift they were again weighed in their weighing clothes. All fluid intakes during the day were recorded and food intake was weighed. Urinary fluid loss was determined by collecting and measuring all urine voided between weighings. Any faecal losses were determined by before and after weighing (without changing clothing). From this information average hourly fluid loss, which includes both sweat loss and evaporative loss from respiration, was determined. The fluid balance study was carried out over three consecutive days for each subject with the average hourly rates of fluid intake and loss being calculated for each day. Page 34
35 3 Chapter 3: Results 3.1 TWL validation Laboratory study Table 4 shows the maximum core temperatures reached by the chamber study subjects in each of their two work trials. In common with other heat stress indices the TWL algorithm allows for core temperature to reach a maximum of 38.2 o C. In six out of the 24 subject sessions the maximum core temperature exceeded this value indicating that the subjects metabolic heat load exceeded their TWL, however one of these could be attributed to the subject wearing unsuitably heavy pants thus increasing his clothing insulation (clo) factor and reducing his effective TWL. When the pants were removed he completed the session with a temperature comfortably below this limit. Two subjects had to be stopped and allowed to cool down during their first session in the chamber because of rapidly climbing core temperatures and evidence of discomfort. Both returned to the chamber to complete the remaining work periods and in both cases the temperature again exceeded 38.2 o C. Most of the chamber sessions were structured with the first 30-minute work period being performed at 40W followed by a period at 50W. The majority of subjects went on to work at 50W for the third period and then dropped back to 40W for the fourth. Depending on temperatures and heart rates over the first four periods the final work period was conducted at 40, 50 or 60W. By examination of the core temperature and heart rate records for each individual in each trial session a limiting workload was estimated, this being the workload which it was judged that the subject would not be able to sustain for an extended time under the conditions because either their core temperature had exceeded 38.2 o C or was likely to if they continued working, or their heart rate had failed to stabilise and had exceeded 115 beats per minute over the final 10 minutes of the work period. Figure 1 shows one of the subject records for a complete session in the chamber showing a clear limiting external workload at 50W. As discussed above, assessment of heat strain from heart rate and core temperature has a sound physiological basis and has been quantified on a scale of 1-10 in the Physiological Page 35
36 Strain Index (PSI) (Moran, Montain & Pandolf 1998). According to this index (assuming equivalence of the pill temperature and rectal temperature (Easton, Fudge & Pitsiladis)), the subject in Figure 1 had a PSI of 3 (dimensionless) at the completion of the third work period (40W) and 3.3 at the completion of period 4 (40W), both indicating a low level of strain. After working at 50W in period 5 the PSI had risen to 4.6 (moderate), a clear increase in the level of strain at the higher workload. From the heart rate record it is apparent that if the subject had continued to work at 50W the heart rate and PSI would have continued to increase. The limiting workloads for all subjects in each of their trial sessions are shown in table 4. For seven of the subjects the limiting workload increased on the second day in the chamber; for some this may have been attributable to arriving in a more hydrated state than on the first day. There was also a slight (but not significant) overall increase in sweat rate on the second day suggesting the beginning of acclimation following the first day s exposure, which may have contributed to the increase in limiting workload, though correlation between sweat rate and limiting workload was weak (0.497). Hydration and fluid balance data for the study are shown in table 5. As was found in the earlier study, the core temperature never exceeded 38.2 o C in the first hour in the chamber, typically this occurred in the third work period. Reducing the workload in subsequent work periods allowed the temperature to stabilise in some, but not all cases (Figure 2). Page 36
37 Table 4. Maximum core temp reached and limiting external workloads for each of the two work trials completed by each subject in the controlled environment study. Day Subject Limiting W/L trial 1 (watts) Limiting W/L trial 2 (watts) A B >60 C D 38.4 a E F G >60 >60 H 38.4 b I 38.3 b J K L >50 >60 a b Had heavy pants on, OK after removed Core temp climbing, exercise stopped Shaded cells are those trials in which core temp exceeded 38.2 o C Limiting W/L = Limiting workload i.e. minimum external workload at which core temperature and/or heart rate failed to stabilise at 38.2 o C/ 115beats per minute Page 37
38 Table 5. Fluid balance data for subjects in the controlled environment study Subject /session Initial nude wt water consumed urine voided final nude wt % weight loss Ave sweat rate (L/Hr) U sg pretrial U sg posttrial Comments A/ Achieved euhydration A/ Hydration level declined B/ Dehydrated throughout B/ Hydration level declined C/ Moderate hydration level C/ D/ D/ U sg shows euhydration E/ E/ Hydration level declined F/ F/ G/ U sg shows euhydration G/ U sg shows euhydration H/ H/ I/ I/ J/ J/ K/ U sg shows euhydration K/ L/ Hydration level declined L/ Remained poorly hydrated Shaded squares are evidence of hypohydration as indicated by a weight loss of > 0.5% or Usg > Negative values for weight loss indicate overall weight gain Page 38
39 Figure 1. Heart rate and core temperature records of a subject in the controlled environment trial showing a limiting external workload at 50W (~130 W.m -2 ) W Rest 40W Rest 40W Rest 40W Rest 50W Heart rate, bpm Deep body core temperature, o C :15 10:45 11:15 11:45 12:15 12:45 13:15 13:45 Time Heart Rate Core Temp Figure 2. This subject s temperature exceeded 38.2 o C in the third work period. He was then unable to stabilise at a subsequent lower workload Subject removed from chamber to 40W Rest 50W Rest 50W cool down 40W Exercise stopped, trial terminated 38.5 Heart rate, bpm Deep core body temperature, o C :15 10:45 11:15 11:45 12:15 12:45 Time 36 Heart Rate Core Temp Page 39
40 3.1.2 Field study Environmental Table 6 summarises the environmental data from the TWL field study. At sites 1 and 3 the subjects were performing light manual work such as machine operation and were able to be in the shade part of the time. Site 2 was a construction site and the subjects were a crew engaged in laying and tying reinforcing steel, a moderately high level of physical activity, and were exposed to the sun throughout Physiological Physiological data from the subjects is summarised in table 7. There was no significant change in any of the parameters monitored over the course of the shift. The slight increases in tympanic temperature in all groups were consistent with diurnal rhythm. The perceived level of fatigue reported by the subjects was no greater on average at the end than at the beginning of the shift. The subject groups also maintained a constant (though not necessarily optimal) level of hydration over the work period (part two of this thesis). The average heart rate, although differing between groups reflecting differences in the type and intensity of work being performed, was well below levels that would indicate physiological strain, and showed no tendency to increase over the shift. Figure 3 shows the heart rate from one of the construction crew at site 2. Rest periods are clearly reflected in the heart rate, which otherwise remains consistently elevated. Heart rates from the other subject groups were much more variable and rest breaks are not clearly evident (Figure 4). Recordings of dry and wet bulb temperatures logged from mid morning to mid afternoon at the same sites on the same days are superimposed on both figures. The records show no consistent influence of these environmental parameters on heart rate and the same is true for all of the other subject records. Page 40
41 Table 6. Summary of environmental data for the TWL field study Site 1 Site 2 (Coastal) (Coastal) n Site 3 (Inland) Dry Bulb 35.0 ± ± ± 3.0 ( o C) RH 58.9 ± ± ± 7.5 (%) Globe Temp 38.7 ± ± ± 5.2 ( o C) WS 4.1 ± ± ± 1.2 (m/sec) WBGT 30.6 ± ± ± 2.3 ( o C) TWL ± ± ± 37.3 (W.m -2 ) Data are means ± SD of values recorded at representative locations for each site over 3 or 4 consecutive days. RH = relative humidity, WS = wind speed, n = number of data collections included for each site Table 7. Indicators of physiological strain: summary of data from the TWL field study Tympanic temperature (start) Tympanic temperature (mid) Tympanic temperature (end) RPF (start) Site 1 (Coastal) 36.5 ± 0.2 (n=15) 36.7 ± 0.2 (n=11) 36.8 ± 0.2 (n=15) 3.0 ± 2.1 (n=15) Site 2 (Coastal) 36.6 ± 0.3 (n=24) 37.2 ± 0.3 (n=24) 37.2 ± 0.3 (n=24) 3.7 ± 2.1 (n=23) Site 3 (Inland) 36.7 ± 0.4 (n=23) 37.0 ± 0.4 (n=21) 37.0 ± 0.3 (n=23) 4.7 ± 2.2 (n=23) RPF (mid) 2.6 ± 1.0 (n=14) 4.6 ± 2.2 (n=24) 5.2 ± 1.7 (n=21) RPF (end) 3.7 ± 1.8 (n=15) 4.5 ± 2.7 (n=24) 5.7 ± 1.7 (n=22) HR (ave) 87.9 ± 6.6 (n=9) ± 11.7 (n=24) 89.8 ± 10.3 (n=21) Data are means ± S.D. n = number of values in each data set. Tympanic temperature and Relative Perceived Fatigue (RPF) data were collected at the start middle and end of the shift. Page 41

42 Figure 3. Heart rate record from subject at site 2 performing continuous manual labour. Figure 4. Heart rate record from subject at site 3 performing varied tasks Heart rate, bpm Bulb tem[peratures, o C :30 7:30 8:30 9:30 10:30 11:30 12:30 13:30 14:30 15:30 16:30 Time 0 Heart Rate Dry Bulb Wet Bulb Page 42
43 3.2 Hydration and fluid balance studies Urine specific gravities (Usg) recorded pre-, mid and post-shift over the two collection periods are summarised in Tables 8a&b. Values are mean and standard deviation with n = the number of samples included in each set. The distribution of Usg for each study period is presented graphically in figure 5. The following categories can be used to classify hydration status based on Usg (Miller & Bates 2007): Usg Hydration status optimal level of hydration (euhydrated) marginally adequate hydration hypohydrated severely hypohydrated, at increased risk of heat illness and impaired performance. Should not work in hot conditions. >1.030 a clinically dehydrated state based on the criterion used by the Australian Pathology Association On this basis over 70% of the urine samples measured in this study showed inadequate hydration levels with nearly 50% indicating that the subjects could be considered insufficiently hydrated for working in hot conditions, including a significant proportion in the clinically dehydrated category. Page 43
44 Table 8 a&b. Summary of urine specific gravity data collected pre-, mid and postshift from all sites. (a) First summer Group Site Pre-shift Mid-shift Post-shift Overall A ± (n=22) ± (n=18) ± (n=21) ± (n=61) B ± (n=9) ± (n=7) ± (n=10) ± (n=26) C ± (n=37) ± (n=24) = (n=14) ± (n=75 D ± (n=14) E ± (n=52) ± (n=28) ± (n=44) ± (n=124) F ± (n=23) ± (n=17) ± (n=22) ± (n=62) (b) Second summer Group Site Pre-shift Mid-shift Post-shift Overall G 2 (wharf) ± (n=15) ± (n=12) ± (n=13) ± (n=40) H 2 (construction) ± (n=24) ± (n=24) ± (n=24) ± (n=72) I ± (n=23) ± (n=23) ± (n=23) ± (n=70) Data for both tables are mean and standard deviation with n = number of urine samples Each value contains data on samples collected from a number of subjects over 2 or 3 days. Overall is the mean for all samples at that site. Page 44
45 Figure 5a&b. Distribution of specific gravities of all urine samples collected from all sites for first (a) and second (b) summers of the study. (a) Number of readings in range (n=382) % 7.7% 27.9% > Urine specific gravity 35.1% 16% (b) Number of readings in range (n=182) % 24.7% 18.7% 17.6% 9.3% > Urine specific gravity n = the total number of data points for the study period. Page 45
46 Table 9 presents the fluid balance data for three groups of workers. Fluid intakes were estimated for all subjects participating in the study, weight change and urine output were measured only for those participating in the sweat loss study. Sweat rates (rate of fluid loss) are the mean and standard deviation of the average hourly rates calculated for individual subjects each day. The predicted water loss was obtained from the recordings of environmental data over the same days as the collection of fluid balance, data using the USARIEM model incorporated into the HSM heat strain mode. Mean average fluid losses for groups G and I are similar (~ L.Hr) and are within the range predicted by the USARIEM model, however mean average losses for the construction workers in group H (1.03 L/Hr) considerably exceeded the prediction of the model possibly reflecting an underestimation of their level of work. Despite these high sweat losses this group was collectively the best hydrated. Table 9. Fluid balance data (second summer). Fluid intake over shift (L) (all subjects in group) Urine output over shift (L) Group G (machinery operators 3.1 ± 1.4 (n=14) 0.54 ± 0.22 (n=11) Group H (manual workers construction) 8.9 ± 3.8 (n=24) 1.68 ± 1.50 (n=12) Group I (various occupations) 3.0 ± 1.9 (n=25) 0.41 ± 0.26 (n=10) Fluid intake (L/Hr) 0.25 ± 0.07 (n=11) 1.04 ± 0.46 (n=12) 0.29 ± 0.11 (n=10) Sweat Rate (L/Hr) ± (n=11) ± (n=12) ± (n=10) Weight change (%) ± 0.59 (n=11) ± 1.55 (n=12) ±0.67 (n=10) Predicted water loss (USARIEM) (L/Hr) 0.5 ± ± ± 0.2 Fluid intake over shift includes data from all subjects in each group. Remaining data are from subgroups carrying out sweat loss study. Hourly fluid intake and sweat loss are averaged over the shift. All data are mean ± SD for all person-days included in the group. Page 46
47 Tables 10&11 present environmental data gathered over the two study periods. Six sites were visited in the first year; sites 2 and 5 were revisited in the second summer. Table 10 shows minimum and maximum values from data collected at representative locations in the work area pre-, mid and post-shift (first summer). Table 11 shows average values (second summer) from data logged every 15 minutes from about am to 4.00 pm each day. Due to the sensitivity of the instrument to prolonged exposure to radiant heat, datalogging took place largely in the shade. Outdoor workers in unshaded conditions were exposed to higher levels of radiant heat than indicated by the globe temperatures in table 11, however as this was often offset by greater air movement TWL values did not differ greatly between sun and shade. Table 10. Range of environmental conditions recorded over the shift (first summer). Site Dry bulb temperature C Wet Bulb Globe Temp (WBGT) o C Thermal Work Limit (TWL) W.m -2 Min Max Min Max Min Max 1 - coastal coastal* 3 - inland inland** inland inland * No outdoor readings taken during first summer **Only one reading taken at this site. Data are minima and maxima from readings taken at the beginning, middle and end of shift Page 47
48 Table 11. Outdoor environmental conditions over shift (second summer). DB o C RH % WB o C WS m/sec Globe o C WBGT o C TWL W.m -2 Site 2 (coastal) wharf Day Day Day Site 2 (coastal) construction site Day Day Day Site 5 (inland) Day Day Day Values were averaged from readings datalogged every 15 minutes. DB = dry bulb temperature, RH = relative humidity, WB = wet bulb temperature, WS = wind speed, Globe = globe temperature (averaged from data logged every 15 minutes) WBGT = wet bulb globe temperature (calculated from average values for environmental parameters) TWL = thermal work limit (average of values calculated for each logged data point) Figures 6a&b show the environmental data logged at the construction site from 11:00am to 4:00pm on day five at site two. The average values for WBGT and TWL computed from the data are respectively the maximum and minimum daily averages over the entire study indicating the highest level of thermal stress. All three measured temperature parameters (wet bulb, dry bulb and globe) and the computed WBGT varied little throughout the day, with WBGT remaining consistently above 31 o C. TWL on the other hand varied considerably, being most clearly affected by changes in windspeed (Figure 6b). The marked data point represents data gathered by moving the instrument into the sun. The effect on TWL of the increase in windspeed at the more exposed location is offset by the increase in globe temperature (Figure 6a). Page 48
49 Figure 6a&b. Environmental parameters and heat stress indices at 15 minute intervals over a five hour period during one of the study days (a) Relationship between environmental temperatures, TWL, and WBGT Temperature ( o C) TWL (W.m -2 ) :00 12:12 13:24 14:36 15:48 Time of day 0 Dry Bulb Wet Bulb Globe WBGT TWL (b) Relationship between windspeed and TWL over the same time period as in (a) Windspeed (m.sec -1 ) TWL (W.m -2 ) :00 12:12 13:24 14:36 15:48 Time of day 0 Wind Speed TWL The instrument was moved out into full sun for the collection of the data point marked Page 49
50 4 Chapter 4: Discussion 4.1 Part A: TWL Experimental validation Results from the controlled environment study reinforce the conclusion from earlier work (Bates & Miller 2002) that TWL does have the ability to predict the limiting work rate for a thermal environment. Under milder environmental conditions the work rates chosen would be well within the capabilities of the subjects, whose predicted VO2 max (Table 1) averaged 51mL.(Kg.min) -1 placing them in the average to high category (Åstrand & Rodahl 1986), so simple fatigue due to work is unlikely to have affected performance in the chamber. In the previous study the resting metabolic rates of a similar group of subjects were determined from measurements of oxygen consumption to average 54.70W.m -2 with a standard deviation of 7.29W.m -2, agreeing well with accepted values for young men. Work efficiency during cycling was determined by measuring oxygen consumption at a known workload; the values obtained (25.41% ± 1.02) were also in agreement with a figure of approximately 25% for maximum work efficiency (Sherwood 2007). It was assumed that the subjects in this study would be comparable, therefore a resting metabolic rate of 55W.m -2 and work efficiency of 25% and the average surface area of 2 m 2 (Table 1) were used to calculate the total metabolic heat load at each external workload as follows. A work efficiency of 25% implies that 75% of the energy required to perform the work is lost as heat, in other words the additional heat load is three times the external work rate. Heat load from resting metabolism (RMR) = 55 W.m -2 Heat load from external work (HEW) = external workload (W) x 3 Total metabolic heat load in W.m -2 = RMR + HEW 2m 2 Page 50
51 The calculation yields total metabolic heat loads for the 40, 50, and 60W workloads of approximately 115, 130, and 145W.m -2 respectively. Since according to the manual supplied with the Monark cycle ergometers the actual applied workload is approximately 9% higher than the nominal workload as calculated from braking force and distance moved (a discrepancy common to many mechanical ergometers, the difference being due to friction in the transmission) the true metabolic heat loads at these levels are closer to 120, 135 and 155W.m -2. For the purposes of this discussion the external workloads referred to will be the nominal workloads unless otherwise indicated, however the corrected values for metabolic heat loads will be used. Leaving aside day 5, when difficulty was experienced maintaining an adequate humidity level in the chamber (the chamber does not humidify well and on this day only one subject was in the chamber assisting humidification by sweating), the TWL computed from the environmental data for fully acclimatised subjects averaged 161W.m -2 (table2). Empirical evidence suggests (Brake & Bates 2002b; Donoghue, Sinclair & Bates 2000a), that for completely unacclimatised subjects the limiting metabolic load would be expected to reduce by up to 20-25% to a value of approximately W.m -2. As our subjects were regarded as partially but not fully acclimatised, their metabolic limits were therefore predicted to be in the range W.m -2, corresponding to external work rates in the region of 50-70W (roughly 45 65W nominal work rate on the ergometer), with individual values being influenced by personal factors including degree of acclimatisation, body composition and fitness. The limiting workloads shown in table 4 are the minimum external workload at which each subject s core temperature and/or heart rate failed to stabilise indicating either heat storage or a degree of physiological strain disproportionate to the workload, reflecting the thermoregulatory demand on the circulation. In other words if the subject were required to continue working at this or a higher level, heat exhaustion would be expected to result. Based on these criteria, on the first day in the chamber all but one subject exhibited a limiting workload at or below 60W with the remaining subject (G) being stable at 60W. On their second day in the chamber nine of the twelve subjects were judged to have reached their limiting workload at 60W with three subjects, including subject G, being stable at 60W. On day one five Page 51
52 subjects (CDEH&I) were unable to stabilise at 40W, however on day two only subjects C&H were still unable to do so. As noted in chapter 3 the overall improved performance on day two may for some subjects (eg B&C) have been due to arriving in a more hydrated state (Table 5) however there was a slight overall increase in sweat rate from day one to day two suggesting that the exposure on day one had initiated the acclimation process. The two subjects who still failed to stabilise at the 40W workload may have been less acclimatised than assumed, or in the case of subject H the highest BMI and body fat in the group may have contributed. In a self-paced work situation these two would have voluntarily reduced their work rate to a level where they could cope. Subject G who coped comfortably with 60W on both days was probably better acclimatised than predicted. Overall, of the twelve subjects, 75% were found to have a limiting workload within the predicted range on at least one of the days, and only two (17%) reached their limit at a lower workload than predicted. Considering the imprecision of the estimate of acclimatisation status this is interpreted as a clear reinforcement of the ability of the TWL algorithm to predict the limiting metabolic rate in a given thermal environment. It should be noted that these subjects were externally paced by the experimental protocol. In practice the application of TWL assumes that workers are able to and will self-pace, thus keeping their metabolic heat generation below the level where heat storage will occur. Implementation of TWL in the workplace allows for the lower work limit of unacclimatised workers by restricting them from working in conditions of high thermal stress (low TWL) until they have had time to acclimatise (Table 12) Field evaluation Conditions for the outdoor study were generally less thermally challenging than for the chamber study as shown by higher TWL values, although WBGT values were similar (Table 6). One reason for this is that TWL reflects wind speed to a far greater degree than WBGT. Although conditions at each site varied from day to day, and to a lesser extent throughout the day, TWL seldom went below 150W.m -2 indicating that this index predicted no limitation to work of a light to moderate intensity, despite the fact that on the majority of days WBGT values of >30 o C were consistently recorded. Adherence to Page 52
53 the recommended WBGT limits would have closed down the workplaces on all of the days surveyed. The physiological data support the implications of the TWL index, in that little indication was found of physiological strain attributable to thermal stress in any of the workers at any of the sites. The sole exception was one of the construction crew (site 2), whose average heart rates were the highest recorded on each of the three days over which his group was studied. He was the only subject whose average heart rate exceeded 115bpm on each of the days and the only one to report a high degree of fatigue (see below). It is quite possible that this subject was not entirely well during the study, however it is also relevant that his Usgs indicated that he was one of the least well hydrated in his group, emphasising the role of hydration in protecting against heat strain. Implicit in the application of TWL is the assumption that workers are adequately hydrated. Mean average heart rates for the construction crew were higher than for the other groups (Table 7) reflecting both a higher work intensity and more consistent exposure to the higher environmental heat load, however even in this group, with the exception noted above, there was little evidence of physiological strain, individual heart rates remained relatively steady during work periods with clear reductions during rest periods (Figure 3). There was no noticeable influence on the heart rates of changes in any measured or computed environmental parameter throughout the shift. Periods of heart rate elevation occurred which were presumably activity related however in none of the records was there a progressive elevation of heart rate such as was seen in the environmental chamber in subjects who were unable to remain in heat balance. These subjects were self-pacing and their heart rate records reinforce the conclusion of (Brake & Bates 2002a) that educated workers, if able to do so, will avoid excessive fatigue and maintain heat balance by adjusting their work rate, and will not voluntarily sustain an average heart rate much greater than 115bpm for prolonged periods of time. Other parameters as summarised in Table 7 also showed little evidence of strain. The highest recorded tympanic temperature was 37.6 o C with means generally around 37 o C. The trend to a slight increase over the shift is easily accounted for by diurnal variation. Mean values for RPF were generally around 5 (feeling OK ); on an individual level the highest reported value was 11, recorded at the end of the shift on the most thermally severe day of the study by the poorly hydrated man referred to above. None of the other Page 53
54 subjects reported a RPF of greater than 9 at any stage. The trend of a slight increase over the shift is to be expected and is not significant. Given the number of outside factors that influence the perceived level of fatigue the variability in the reporting of this factor is not surprising, and no conclusions can be drawn from it other than that there is no indication that working in conditions exceeding permitted WBGT levels resulted in an excessive level of fatigue. WBGT values at the three sites ranged from 27.1 to 34.7 o C with values over 30 o C being consistently recorded, particularly at site 2. The recommended WBGT limits for acclimatised workers wearing long sleeved summer work uniform are 29.5, 27.5 and 26.0 o C, for light, moderate and heavy work respectively (ACGIH 2006). For much of the time therefore, the WBGT exceeded the acceptable limit for acclimatised persons to perform even light work without work/rest cycling, let alone the manual labour carried out by the construction workers at site 2. These observations confirm the shortcomings of WBGT and that TWL is a more appropriate, realistic, and reliable index than the WBGT in this environment. In an aboveground environment where the convective and evaporative effect of air movement contributes significantly to cooling, the WBGT is an excessively conservative index of environmental heat stress. For this reason, although WBGT is the nominal standard for many industries, it is often not used, particularly in industries where heat stress is a significant issue, as its implementation would lead to too much lost production. The need is for an index which does reliably quantify the environmental heat stress in a meaningful way and which can be used to manage work in hot environments. The results of this study support the use of TWL for this purpose Conclusions from TWL study Individuals who are able to self-pace will adjust their work rate to the conditions and thereby avoid physiological strain (Brake & Bates 2002a). Observations from this and other studies suggest that self-paced workers will seldom maintain a work rate that elevates their average heart rate above bpm. In the chamber study, where the subjects were required to maintain a set workload, those subjects whose heart rates were not stabilised below this level were deemed to have reached their limiting workload. For well-hydrated individuals who are able to self-pace, work may safely continue provided Page 54
55 that the environmental conditions permit an adequate workload to maintain productivity. TWL is an index of this maximum safe work rate. A TWL of >140W.m -2 indicates that self-pacing, acclimatised, hydrated individuals may safely perform light to moderate work. Higher TWL values correspond to higher levels of work with a TWL of >220W.m -2 corresponding to unrestricted work at any level regardless of acclimatisation status. In the field study, on even the hottest days the air movement was sufficient to keep the TWL above 140W.m -2 and for the most part above 200W.m -2. The TWLs recorded in the vicinity of the construction workers at site 2 were generally the lowest, and even these workers were able to perform continuous manual labour whilst fully exposed to the sun without any indication of heat strain. WBGT values computed for the same locations would, if the standard were adhered to, impose severe and unnecessary limitations on their work. Based on these studies a comprehensive strategy for the implementation of TWL in outdoor workplaces was recommended to the sponsoring company, the full recommendations are included in the appendices. Table 12 summarises the TWL limits and linked interventions which have been developed for general aboveground use (Miller & Bates, accepted). The interventions are somewhat less stringent than those adopted by many underground mines, where circumstances warrant a more conservative approach, and are applicable for work in both indoor and outdoor aboveground environments. A TWL of 140W.m -2 is recommended as the lower limit for unrestricted work on the understanding that workers are acclimatised, hydrated, and self-pacing. At this level a moderate level of work can safely be achieved, few workplaces require unremitting work at a higher intensity and workers will pace their productivity at a level that can be sustained without strain. Workers known to be unacclimatised or whose acclimatisation status is questionable are restricted from working unaccompanied at a TWL between 140 and 220W.m -2. Education of the workforce in the importance of maintaining and monitoring hydration is an essential component of the implementation of a heat management strategy. Page 55
56 Table 12. Recommended management protocols for the implementation of TWL in the aboveground workplace. TWL limit (W.m -2 ) Interventions Restricted Access TWL<115 Work limited to essential maintenance or rescue operations No person to work alone No unacclimatised person to work a Job description to specify requirement to work in hostile thermal conditions Specific induction required emphasising hydration and identifying signs of heat strain TWL prescribes work/rest cycling and fluid intakes appropriate for type of work and conditions Regular dehydration testing at end of shift Personal water bottle (4 litre capacity) must be on the job at all times Buffer TWL = 115 to 140 Buffer zone exists to identify situations in which environmental conditions may be limiting Any practicable intervention to reduce heat stress should be implemented e.g. provide shade, improve ventilation etc. Working alone to be avoided if possible Unacclimatised a workers not to work in this zone Acclimatisation TWL = Workers with uncertain acclimatisation status should not work alone in this zone Unrestricted TWL>220 No limits on self-paced work for educated, hydrated workers. a Note: unacclimatised workers are defined as new workers or those who have been off work for more than 14 days due to illness or leave (outside the tropics) Page 56
57 4.2 Part B : Hydration Hydration status and fluid balance This part of the project aimed to evaluate the current hydration status of a representative outdoor workforce and to quantify actual rates of fluid loss enabling recommendation of appropriate fluid guidelines for the conditions. Although there is considerable individual variation, the urine specific gravities generally indicate poor to marginal levels of hydration. Few individuals are consistently reporting for work in a state of optimum hydration (Usg 1.015), many have Usgs which indicate that they are hypohydrated (> 1.020), whilst some are clinically dehydrated ( 1.030) (Figure 5a&b). A striking feature of the data is the similarity across most groups of the average Usg and the stability of this parameter throughout the shift (Table 8). Very similar findings were reported by (Brake & Bates 2003) for underground miners. The lower average Usgs for groups C and H are a reflection of the presence in each group of a number of very well hydrated individuals, however the hydration level of others in these groups was comparable with other groups. Little data was obtained at site 4, but the indication is that the workers at this site were on average in a state of clinical dehydration (Usg > 1.030). As the environmental conditions here were some of the most severe recorded, this finding is of concern. The relative constancy of Usgs across most of the data suggests that this level may correspond to a physiological set point which may reflect the hydration level that is maintained by thirst-driven drinking in the absence of a conscious or learned modification of drinking behaviour. The fact that some individuals consistently maintain a higher level of hydration than most suggests that it may be possible to modify this set point if the individual becomes physiologically accustomed to a higher level of hydration and that fluid intake will then be automatically adjusted to protect this level. The fact that these well-hydrated individuals were confined to two of the subject groups implies that the creation of a culture of hydration-consciousness within a group, such as was observed to be present in the construction crew (group H), is an important element in an overall heat stress management strategy. Page 57
58 Sweat rates varied considerably between the groups included in the fluid balance study (Table 9). The highest sweat rates were observed in the construction crew (group H) reflecting a generally higher level of work intensity and more consistent exposure to environmental heat load than the other two groups. This group was generally well informed and conscious of the need to maintain adequate hydration and was the only group for which the average fluid intake matched the average sweat rate. Failure to adequately replace fluid losses was reflected in an average net weight loss for the other two groups, suggesting that there was in fact a general decline in hydration level over the course of the shift which was not reflected in the Usg. It could be argued that the weight loss reflects fuel oxidation rather than loss of body water, hence the lack of change in the Usg. Maughan and Shirreffs (2004) have calculated that a marathon runner may potentially lose as much as 1.8 Kg (~3%) of body mass over the course of the event without loss of body water (assuming that metabolically produced water and water associated with mobilised glycogen stores is all made available). The metabolic rates of the workers in this study were well below those of a marathon runner and the fuel being oxidised would have been mainly derived from the meals ingested before and during the shift rather than from stores. The fact that the lowest mean weight loss was seen in the hardest working group implies that fuel oxidation is unlikely to account for much of the lost weight and supports the view that there was some reduction in hydration level over the shift for most workers. The diuretic effect of caffeinated beverages consumed before and during the shift may be not only contributing to this reduction in hydration level in some cases, but also masking it when assessed by Usg. Changes in Usg with hypohydration may also be minimised by fluid shift from the intracellular compartment. This insidious decline in hydration level underlines the fact that under these circumstances thirst is not an adequate indicator of the need to drink, and emphasises the importance of strategies to improve the fluid replacement behaviour of all workers subjected to thermal stress. Recommended fluid intakes based on the losses predicted by the USARIEM model appear to be adequate to balance actual losses where the level of work is not high, but indications are that the model may underestimate losses for some people at higher work Page 58
59 loads (or else workloads may be underestimated). The fluid intakes for different levels of activity recommended below (4.2.2) are based on the measured sweat losses in different groups. It is clear that, particularly where sweat rates are high, it is difficult to actually improve hydration status during the course of the day, and individuals who start hypohydrated at the beginning of the day tend to remain so throughout the shift. Improvement of hydration status requires a conscious effort to drink fluids at a faster rate than they are being lost through sweating and other means, and this is difficult where mean sweat rates are over 1 litre/hour (group H). The ability to increase hydration level in this situation may be limited by the maximum rate of fluid absorption (~ 1.5 L/Hr) and under these circumstances a rehydration fluid formulated for rapid absorption and fluid retention may play a useful role. Such a fluid needs to be formulated for industrial rather than sporting use and suitable for consumption in quantity over prolonged periods. Individuals starting work in a well-hydrated state appear to protect this status with Usgs remaining low throughout the shift. As hypohydration places individuals at increased risk of developing heat related illnesses, particularly if work rate increases (increasing heat production) or environmental conditions become more severe (impairing heat loss), education needs to be directed not only towards replacing fluid lost during the shift with appropriate beverages, but also to improving the level of hydration at the start of the shift Conclusions from the hydration study Environmental conditions were similar over the two study periods with coastal dry bulb temperatures in the mid to high 30s with 50-60% humidity. Inland conditions were hotter but humidity was lower. WBGT readings in excess of 30 o C were common in all locations precluding work in all of these situations if this industry standard were applied rigorously. Part one of this thesis has shown the WBGT to be an excessively conservative index, with the TWL index providing a more reliable indication of thermal stress. A TWL of over 220W.m -2 predicts no thermal limitation to work, values between 140 and 220 indicate that hydrated, acclimatised individuals may safely perform Page 59
60 unrestricted light to moderate work. Even on the hottest days the wind speed (air movement) at all sites was sufficient to keep the TWL above 140 W.m -2 and for the most part above 200 W.m -2, however this is not always the case and in many work situations in many parts of Australia high ambient and or radiant temperatures are combined with a lack of air movement and or a high level of humidity to create conditions of high thermal stress, where the ability to dissipate body heat efficiently is critical to the ability of workers to function safely. In this context the finding that the majority of workers in these hot outdoor environments are inadequately hydrated to work in hot environments is of concern, as poor hydration erodes their margin of safety. Declining levels of hydration over the course of a shift undoubtedly contribute to fatigue and the risk of accidents as well as the possibility of heat illness. The pattern of fluid intake is to a large extent habitual, and therefore is susceptible to modification. The creation of a culture of hydration awareness amongst the workforce is an important component of a risk management strategy for workers exposed to a thermally stressful environment. The following recommendations are made for work in hot conditions: Educate workers on the importance of adequate hydration and suitable beverages for fluid replacement. This advice should be reinforced prior to the onset of hot weather. Teach workers to monitor their own hydration status, either by using urine test strips for specific gravity (which should be made available) or from urine colour and volume. Implement periodic monitoring of hydration status (Usg measurement) by Health and Safety Department Ensure availability of cool, palatable water or electrolyte replacement drink close to the workplace in adequate quantities. Recommended fluid consumptions: Manual workers Approximately 1 litre per hour of either plain water supplemented by frequent meal Page 60
61 breaks, or industrial rehydration fluid containing electrolytes and some carbohydrate. (Sport drinks and non-diet cordials are not suitable for consumption in large volumes.) Workers in particularly harsh conditions will require more as sweat rates can exceed 1 L/Hr. Machinery operators etc. 600 ml/hr of water in addition to food and any other beverages consumed. Sedentary workers 400 ml/hr of water in addition to food and any other beverages consumed. Consumption of food at meal breaks is essential to replace electrolytes and maintain energy. Consumption of caffeinated beverages before and during the work shift should be discouraged (possibly by limiting availability on site). If possible modify the environment e.g. by providing shade or increased ventilation. Page 61
62 5 Chapter 5: General conclusions On the basis of this study TWL has been shown to perform better than WBGT as a predictor of the impact of environmental heat stress in outdoor work environments. The introduction of TWL and associated protocols (Table 12) provides management with clear-cut, unambiguous strategies for minimising the risk to workers posed by environmental heat stress. Retention of WBGT as the standard heat index in thermally stressful workplaces is not warranted on either economic, health or safety grounds. If WBGT limits were to be strictly applied then unacceptable production losses would result in many industries. Inadequacies in the index, particularly where air movement is significant, have led to it being essentially ignored in many situations where experience has shown that work may safely be carried out in conditions exceeding the recommended limits. In these situations therefore, rather than being safer than a less conservative index, adherence to WBGT as the standard means that workers are not being protected by the use of any heat index at all. The adoption of TWL as the industry standard in all workplaces is supported by the findings of this study. TWL has been shown empirically to predict with a high degree of reliability the limiting workload in a given thermal environment. Observations in the field have confirmed that TWL is a better predictor of occupational heat strain than WBGT. Incorporation of five environmental parameters including windspeed into the TWL algorithm gives an index of greater versatility than WBGT. The introduction of instruments capable of measuring all five parameters, and even of calculating TWL means that it can be introduced and implemented with relatively little training. The single figure output and clear-cut guidelines for its application eliminates the interpretation required by more complex indices. A critical factor in the protection of workers from the effects of heat stress is the maintenance of adequate hydration. TWL applies only to well-hydrated workers, so its Page 62
63 adoption requires education of the workforce to improve hydration levels. The data presented in this study has confirmed that a high proportion of outdoor mining workers in northwest Australia do not drink enough to maintain a safe hydration level in the heat. A comprehensive heat management strategy for hot workplaces includes initial and ongoing education in the importance of hydration, and a program of hydration monitoring incorporating routine testing of urine specific gravity. Provision of adequate and appropriate fluid replacement beverages is also essential. Page 63
64 Appendices Appendix 1: Recommendations to Rio Tinto Iron Ore The following recommendations were made to Rio Tinto Iron Ore, sponsors of the fieldwork, based on the findings of the studies. 1. A program to improve the hydration status of the workforce should be put in place before next summer. This program should include: Showing of the video Working in Heat (Bates) to all personnel. This should in future form part of the induction process for all new workers. Routine regular testing of urine specific gravity (Usg) at start and end of the shift. Workers found to be hypohydrated need counselling to increase fluid intake before and during the shift. Education to inform workers on appropriate choice of fluids for consumption before and during work. Discouraging the consumption of high quantities of caffeinated beverages. The sale of coke on site should be limited and caffeinated stimulant drinks (e.g. Red Bull ) should not be available. Consideration should be given to the provision of a suitable fluid and electrolyte replacement beverage, particularly for those whose work rate and/or work environment leads to high rates of sweat loss. The product chosen should be one that is formulated for prolonged consumption and rapid uptake such as Aqualyte solution. 2. TWL should be adopted and implemented as the index used to quantify and manage risk from environmental thermal stress. The data collected in this study support the use of similar TWL-linked management protocols to those used in underground mining operations. Recommended protocols for aboveground use are included as (Table 12 of this thesis) Page 64
65 Adoption and implementation of TWL will require: Training of appropriate personnel The provision of an instrument capable of recording the necessary parameters. It must be emphasised that TWL applies only to well-hydrated workers so its adoption requires the education of the workforce to improve hydration levels as recommended above. The HSM can be used to predict sweat losses and therefore required fluid intakes for specific environments. 3. Heat stress management in the Power Station (and tugboats) The Heat Stress Meter (HSM) can be used not only to measure TWL, but also to generate guidelines for work/rest cycling where low TWL limits continuous work. This latter situation exists in some parts of the power station (data were appended to report) (and also reputedly in the tugboats) where proximity to heavy machinery raises the environmental heat load. Power station workers are currently using a form of work/rest cycling by exercising their own judgement as to how long they should remain in the hot environment. TWL and the HSM should be used to provide clear guidelines for safe work practice in this situation; these guidelines should be implemented and enforced. Implementation of the TWL protocols prohibits anyone from working alone in environments where TWL is below 115 W.m -2, which applies in a number of locations within the power station. As previously recommended any measures to improve airflow in these areas will significantly improve the thermal environment, raising the TWL. Page 65
66 Appendix 2: Environmental data (heat chamber study) Day 1: subjects A,B & C Day 2: Subjects A,B &C Day 3: Subjects D,E & F Day 4: Subjects D,E & F wk period DB WB WS TWL WBGT wk period DB WB WS TWL WBGT wk period DB WB WS TWL WBGT wk period DB WB WS TWL WBGT Page 66
67 n mean st.dev Semi nude TWL (0.12 clo) = Page 67
68 n mean st.dev n Semi nude TWL (0.12 clo) = mean st.dev n mean Semi nude TWL (0.12 clo) = 160 st.dev Semi nude TWL (0.12 clo) = Page 68
69 Day 5; Subject G Day 6: Subjects G & H Day 7: Subject: H wk period DB WB WS TWL WBGT wk period DB WB WS TWL WBGT wk period DB WB WS TWL WBGT Page 69
70 Page 70
71 n n mean mean st.dev st.dev Semi nude TWL (0.12 clo) = 172 n Semi nude TWL (0.12 clo) = 159 mean st.dev Semi nude TWL (012 clo) = Page 71
72 Day 8: Subjects I & J Day 9: Subjects I & J Day 10; Subjects K & L Day 12; Subjects K & L wk period DB WB WS TWL WBGT wk period DB WB WS TWL WBGT wk period DB WB WS TWL WBGT wk period DB WB WS TWL WBGT Page 72
73 n mean n st.dev mean st.dev Semi nude TWL (0.12 clo) 156 Page 73
74 Semi nude TWL (0.12 clo) = n mean st.dev Semi nude TWL (0.12 clo )= n mean st.dev Semi nude TWL (0.12 clo) = Page 74
75 Appendix 3: Environmental data (outdoor locations - second summer) Site 2 - Coastal (Group G) DAY LOCATION CONDITIONS TIME WATER WBGT TWL WS DB RH G WB P MRT m / sec % kpa outside office full sun outside office full sun Mon outside office full sun Feb outside office full sun Lab full sun Lab - bulk handling shed undercover outside office full sun outside office overcast Tues outside office full sun Feb outside office full sun outside office full sun Wed outside office Feb outside office mean SD Page 75
76 Site 2 - Coastal (Group H) DAY LOCATION CONDITIONS TIME WATER WBGT TWL WS DB RH G WB P MRT m / sec % kpa Thur 17-Feb Fri 18-Feb Construction site - outside work area Construction site - outside crib Construction site - outside work area Construction site - outside work area Construction site - inside work area full sun full sun full sun full sun full sun Sat 19-Feb Construction site - outside work area Construction site - inside work area Construction site - outside work area full sun full sun full sun mean SD Page 76
77 Site 5 - Inland (Group I) DAY LOCATION CONDITIONS TIME WATER WBGT TWL WS DB RH G WB P MRT m / sec % kpa Mon Central Pit 3 full sun Feb Central Pit 3 full sun Central Pit 3 full sun Tues Central Pit 3 full sun Feb ROM full sun Central Pit 3 overcast Wed Central Pit 3 full sun Feb Central Pit 3 full sun Thur 24-Feb Outside Admin full sun Outside ROM some cloud cover Infield Drill Site some cloud cover Plant - Primary Crusher Plant - besides conveyor belt full sun full sun Outside of Plant full sun Plant - Besides screens Plant - underneath screens full sun undercover Infield Drill Site full sun mean SD Page 77
78 Appendix 4: Physiological data (hydration and fluid balance study - second summer) Group Subject Date G S.G. (start) RPF Temp S.G. (mid) RPF Temp S.G. (end) RPF Temp Weight change (%) Urine Fluid output (L) intake (L) HR (ave) 1 14-Feb Feb Feb ** Feb Feb Feb ** ** 3 14-Feb Feb Feb ** Feb Feb Feb ** Feb Feb Feb ** 76 Sweat rate(ave) L/Hr Page 78
79 Group Subject Date H S.G. (start) RPF Temp S.G. (mid) RPF Temp S.G. (end) RPF Temp Weight change (%) Urine Fluid output (L) intake (L) HR (ave) Feb Feb Feb Feb Feb Feb Feb Feb Feb Feb Feb Feb Feb Feb Feb ** Feb Feb Feb Feb Feb ** 19-Feb Feb Feb Feb Mean S.D ** Data unavailable Sweat rate(ave) L/Hr Page 79
80 Group Subject Date I S.G. (start) RPF Temp S.G. (mid) RPF Temp S.G. (end) RPF Temp Weight change (%) Urine Fluid output (L) intake (L) HR (ave) Feb ** (survey) 22-Feb Feb data collection terminated - subject unwell Feb ** ** 23-Feb Sweat rate(ave) L/Hr (blast crew) 24-Feb Feb ** 0.34 (blast crew) 23-Feb ** Feb ** Feb (blast crew) 23-Feb Feb Feb (maintenance) 22-Feb Feb Feb Feb (maintenance) 22-Feb Feb Feb (plant) 22-Feb Feb Feb (plant) 22-Feb Feb (expl) 24-Feb ** Mean S.D ** Data unavailable Page 80
81 Appendix 5: Environment datalogs (Field study second summer) Timestamp Dry Bulb Humi dity Wet Bulb Wind Speed Globe MRT Atm. Pressure TWL Work /Hr Wate r /Hr Max Work FEB 14, 09:15am FEB 14, 09:30am FEB 14, 09:45am FEB 14, 10:00am FEB 14, 10:15am FEB 14, 10:30am FEB 14, 10:45am FEB 14, 11:00am FEB 14, 11:15am FEB 14, 11:30am FEB 14, 11:45am FEB 14, 12:00pm FEB 14, 12:15pm FEB 14, 12:30pm FEB 14, 12:45pm FEB 14, 01:00pm FEB 14, 01:15pm FEB 14, 01:30pm FEB 14, 01:45pm FEB 14, 02:00pm FEB 14, 02:15pm FEB 14, 02:30pm FEB 14, 02:45pm FEB 14, 03:00pm FEB 14, 03:15pm Page 81
82 Timestamp Dry Bulb Humi dity Wet Bulb Wind Speed Globe MRT Atm. Pressure TWL Work /Hr Water/ Hr Max Work FEB 15, 08:30am FEB 15, 08:45am FEB 15, 09:00am FEB 15, 09:15am FEB 15, 09:30am FEB 15, 09:45am FEB 15, 10:00am FEB 15, 10:15am FEB 15, 10:30am FEB 15, 10:45am FEB 15, 11:00am FEB 15, 11:15am FEB 15, 11:30am FEB 15, 11:45am FEB 15, 12:00pm FEB 15, 12:15pm FEB 15, 12:30pm FEB 15, 12:45pm FEB 15, 01:00pm FEB 15, 01:15pm FEB 15, 01:30pm FEB 15, 01:45pm FEB 15, 02:00pm FEB 15, 02:15pm FEB 15, 02:30pm Page 82
83 Timestamp Dry Bulb Humi dity Wet Bulb Wind Speed Globe MRT Atm. Pressure TWL Work /Hr Water /Hr Max Work FEB 16, 09:45am FEB 16, 10:00am FEB 16, 10:15am FEB 16, 10:30am FEB 16, 10:45am FEB 16, 11:00am FEB 16, 11:15am FEB 16, 11:30am FEB 16, 11:45am FEB 16, 12:00pm FEB 16, 12:15pm FEB 16, 12:30pm FEB 16, 12:45pm FEB 16, 01:00pm FEB 16, 01:15pm FEB 16, 01:30pm FEB 16, 01:45pm FEB 16, 02:00pm FEB 16, 02:15pm FEB 16, 02:30pm FEB 16, 02:45pm FEB 16, 03:00pm FEB 16, 03:15pm FEB 16, 03:30pm FEB 16, 03:45pm FEB 16, 04:00pm FEB 16, 04:15pm Page 83
84 Environment Data Dry Bulb Wet Bulb Degrees Celcius FEB 16, 09:45am FEB 16, 10:15am FEB 16, 10:45am FEB 16, 11:15am FEB 16, 11:45am FEB 16, 12:15pm FEB 16, 12:45pm FEB 16, 01:15pm FEB 16, 01:45pm FEB 16, 02:15pm FEB 16, 02:45pm FEB 16, 03:15pm FEB 16, 03:45pm FEB 16, 04:15pm TWL TWL FEB 16, 09:45am FEB 16, 10:00am FEB 16, 10:15am FEB 16, 10:30am FEB 16, 10:45am FEB 16, 11:00am FEB 16, 11:15am FEB 16, 11:30am FEB 16, 11:45am FEB 16, 12:00pm FEB 16, 12:15pm FEB 16, 12:30pm FEB 16, 12:45pm FEB 16, 01:00pm FEB 16, 01:15pm FEB 16, 01:30pm FEB 16, 01:45pm FEB 16, 02:00pm FEB 16, 02:15pm FEB 16, 02:30pm FEB 16, 02:45pm FEB 16, 03:00pm FEB 16, 03:15pm FEB 16, 03:30pm FEB 16, 03:45pm FEB 16, 04:00pm FEB 16, 04:15pm Page 84
85 Timestamp Dry Humi Wet Bulb dity Bulb Wind Speed Globe MRT Atm. Pressure TWL Work /Hr Wate /Hr Max Work FEB 17, 10:45am FEB 17, 11:00am FEB 17, 11:15am FEB 17, 11:30am FEB 17, 11:45am FEB 17, 12:00pm FEB 17, 12:15pm FEB 17, 12:30pm FEB 17, 12:45pm FEB 17, 01:00pm FEB 17, 01:15pm FEB 17, 01:30pm FEB 17, 01:45pm FEB 17, 02:00pm FEB 17, 02:15pm FEB 17, 02:30pm FEB 17, 02:45pm FEB 17, 03:00pm FEB 17, 03:15pm FEB 17, 03:30pm FEB 17, 03:45pm Page 85
86 Environment Data Dry Bulb Wet Bulb Degrees celcius FEB 17, 10:45am FEB 17, 11:00am FEB 17, 11:15am FEB 17, 11:30am FEB 17, 11:45am FEB 17, 12:00pm FEB 17, 12:15pm FEB 17, 12:30pm FEB 17, 12:45pm FEB 17, 01:00pm FEB 17, 01:15pm FEB 17, 01:30pm Thermal Work Limit FEB 17, 01:45pm FEB 17, 02:00pm FEB 17, 02:15pm FEB 17, 02:30pm FEB 17, 02:45pm FEB 17, 03:00pm FEB 17, 03:15pm FEB 17, 03:30pm FEB 17, 03:45pm TWL FEB 17, 10:45am FEB 17, 11:00am FEB 17, 11:15am FEB 17, 11:30am FEB 17, 11:45am FEB 17, 12:00pm FEB 17, 12:15pm FEB 17, 12:30pm FEB 17, 12:45pm FEB 17, 01:00pm FEB 17, 01:15pm FEB 17, 01:30pm FEB 17, 01:45pm FEB 17, 02:00pm FEB 17, 02:15pm FEB 17, 02:30pm FEB 17, 02:45pm FEB 17, 03:00pm FEB 17, 03:15pm FEB 17, 03:30pm FEB 17, 03:45pm Page 86
87 Timestamp Dry Bulb Humi dity Wet Bulb Wind Speed Globe MRT Atm. Pressur e TWL Work /Hr Water/ Hr Max Work FEB 18, 11:00am FEB 18, 11:15am FEB 18, 11:30am FEB 18, 11:45am FEB 18, 12:00pm FEB 18, 12:15pm FEB 18, 12:30pm FEB 18, 12:45pm FEB 18, 01:00pm FEB 18, 01:15pm FEB 18, 01:30pm FEB 18, 01:45pm FEB 18, 02:00pm FEB 18, 02:15pm FEB 18, 02:30pm FEB 18, 02:45pm FEB 18, 03:00pm FEB 18, 03:15pm FEB 18, 03:30pm FEB 18, 03:45pm FEB 18, 04:00pm Page 87
88 Environment Data Dry Bulb Wet Bulb Degrees Celcius FEB 18, 11:00am FEB 18, 11:15am FEB 18, 11:30am FEB 18, 11:45am 250 FEB 18, 12:00pm FEB 18, 12:15pm FEB 18, 12:30pm FEB 18, 12:45pm FEB 18, 01:00pm FEB 18, 01:15pm FEB 18, 01:30pm Thermal w ork Limit FEB 18, 01:45pm FEB 18, 02:00pm FEB 18, 02:15pm FEB 18, 02:30pm FEB 18, 02:45pm FEB 18, 03:00pm FEB 18, 03:15pm FEB 18, 03:30pm FEB 18, 03:45pm FEB 18, 04:00pm 200 TWL FEB 18, 11:00am FEB 18, 11:15am FEB 18, 11:30am FEB 18, 11:45am FEB 18, 12:00pm FEB 18, 12:15pm FEB 18, 12:30pm FEB 18, 12:45pm FEB 18, 01:00pm FEB 18, 01:15pm FEB 18, 01:30pm FEB 18, 01:45pm FEB 18, 02:00pm FEB 18, 02:15pm FEB 18, 02:30pm FEB 18, 02:45pm FEB 18, 03:00pm FEB 18, 03:15pm FEB 18, 03:30pm FEB 18, 03:45pm FEB 18, 04:00pm Page 88
89 Dry Bulb Humi dity Wet Bulb Wind Speed Globe MRT Atm. Pressure TWL Work /Hr Water /Hr Max Work Timestamp FEB 19, 10:45am FEB 19, 11:00am FEB 19, 11:15am FEB 19, 11:30am FEB 19, 11:45am FEB 19, 12:00pm FEB 19, 12:15pm FEB 19, 12:30pm FEB 19, 12:45pm FEB 19, 01:00pm FEB 19, 01:15pm FEB 19, 01:30pm FEB 19, 01:45pm FEB 19, 02:00pm FEB 19, 02:15pm FEB 19, 02:30pm FEB 19, 02:45pm FEB 19, 03:00pm FEB 19, 03:15pm FEB 19, 03:30pm FEB 19, 03:45pm FEB 19, 04:00pm Page 89
90 Environment Data Dry Bulb Wet Bulb Degrees celcius FEB 19, 10:45am FEB 19, 11:00am FEB 19, 11:15am FEB 19, 11:30am 300 FEB 19, 11:45am FEB 19, 12:00pm FEB 19, 12:15pm FEB 19, 12:30pm FEB 19, 12:45pm FEB 19, 01:00pm FEB 19, 01:15pm Thermal Work Limit FEB 19, 01:30pm FEB 19, 01:45pm FEB 19, 02:00pm FEB 19, 02:15pm FEB 19, 02:30pm FEB 19, 02:45pm FEB 19, 03:00pm FEB 19, 03:15pm FEB 19, 03:30pm FEB 19, 03:45pm FEB 19, 04:00pm 250 TWL FEB 19, 10:45am FEB 19, 11:00am FEB 19, 11:15am FEB 19, 11:30am FEB 19, 11:45am FEB 19, 12:00pm FEB 19, 12:15pm FEB 19, 12:30pm FEB 19, 12:45pm FEB 19, 01:00pm FEB 19, 01:15pm FEB 19, 01:30pm FEB 19, 01:45pm FEB 19, 02:00pm FEB 19, 02:15pm FEB 19, 02:30pm FEB 19, 02:45pm FEB 19, 03:00pm FEB 19, 03:15pm FEB 19, 03:30pm FEB 19, 03:45pm FEB 19, 04:00pm Page 90
91 Dry Bulb Humi Wet dity Bulb Wind Speed Globe MRT Atm. Pressure TWL Work /Hr Water Max /Hr Work Timestamp FEB 21, 12:15pm FEB 21, 12:30pm FEB 21, 12:45pm FEB 21, 01:00pm FEB 21, 01:15pm FEB 21, 01:30pm FEB 21, 01:45pm FEB 21, 02:00pm FEB 21, 02:15pm FEB 21, 02:30pm FEB 21, 02:45pm FEB 21, 03:00pm FEB 21, 03:15pm FEB 21, 03:30pm FEB 21, 03:45pm FEB 21, 04:00pm FEB 21, 04:15pm FEB 21, 04:30pm FEB 21, 04:45pm FEB 21, 05:00pm FEB 21, 05:15pm FEB 21, 05:30pm FEB 21, 05:45pm Page 91
92 Dry Bulb Humi dity Wet Bulb Wind Atm. Speed Globe MRT Pressure TWL Work /Hr Water /Hr Max Work Timestamp FEB 22, 10:30am FEB 22, 10:45am FEB 22, 11:00am FEB 22, 11:15am FEB 22, 11:30am FEB 22, 11:45am FEB 22, 12:00pm FEB 22, 12:15pm FEB 22, 12:30pm FEB 22, 12:45pm FEB 22, 01:00pm FEB 22, 01:15pm FEB 22, 01:30pm FEB 22, 01:45pm FEB 22, 02:00pm FEB 22, 02:15pm FEB 22, 02:30pm FEB 22, 02:45pm FEB 22, 03:00pm FEB 22, 03:15pm FEB 22, 03:30pm FEB 22, 03:45pm FEB 22, 04:00pm FEB 22, 04:15pm FEB 22, 04:30pm Page 92
93 Environment Data Dry Bulb Wet Bulb Degrees celcius FEB 22, 10:30am FEB 22, 11:00am FEB 22, 11:30am FEB 22, 12:00pm FEB 22, 12:30pm FEB 22, 01:00pm FEB 22, 01:30pm FEB 22, 02:00pm FEB 22, 02:30pm FEB 22, 03:00pm FEB 22, 03:30pm FEB 22, 04:00pm FEB 22, 04:30pm Thermal Work Limit TWL FEB 22, 10:30am FEB 22, 11:00am FEB 22, 11:30am FEB 22, 12:00pm FEB 22, 12:30pm FEB 22, 01:00pm FEB 22, 01:30pm FEB 22, 02:00pm FEB 22, 02:30pm FEB 22, 03:00pm FEB 22, 03:30pm FEB 22, 04:00pm FEB 22, 04:30pm Page 93
94 Dry Bulb Hum idity Wet Bulb Wind Speed Globe Atm. Pressure TWL Work Wate Max /Hr r/hr Work Timestamp MRT FEB 24, 10:30am FEB 24, 10:45am FEB 24, 11:00am FEB 24, 11:15am FEB 24, 11:30am FEB 24, 11:45am FEB 24, 12:00pm FEB 24, 12:15pm FEB 24, 12:30pm FEB 24, 12:45pm FEB 24, 01:00pm FEB 24, 01:15pm FEB 24, 01:30pm FEB 24, 01:45pm FEB 24, 02:00pm FEB 24, 02:15pm FEB 24, 02:30pm FEB 24, 02:45pm FEB 24, 03:00pm FEB 24, 03:15pm FEB 24, 03:30pm FEB 24, 03:45pm FEB 24, 04:00pm FEB 24, 04:15pm FEB 24, 04:30pm Page 94
95 References ACGIH 2006, 'Heat Stress', in TLVs and BEIs: Threshold Limit Values for Chemical Substances and Chemical Agents, ACGIH, Cincinnati. ACGIH 2007, 'Heat Stress', in TLVs and BEIs: Threshold Limit Values for Chemical Substances and Chemical Agents, ACGIH, Cincinnati. Amos, D., Hansen, R., Lau, W. M. & Michalski, J. T. 2000, 'Physiological and cognitive performance of soldiers conducting routine patrol and reconnaissance operations in the tropics', Military Medicine, vol. 165, no. 12, pp Armstrong, L., Soto, J., Hacker, F. J., Casa, D., Kavouras, S. & Maresh, C. 1998, 'Urinary indices during dehydration, exercise and rehydration', Int J Sport Nutr, vol. 8, no. 4, pp Armstrong, L. E., Maresh, C. M., Castellani, J. W., Bergeron, M. F., Kenefick, R. W., LaGasse, K. E. & Riebe, D. 1994, 'Urinary indices of hydration status', Int J Sport Nutr, vol. 4, no. 3, pp Astrand, P.-O. & Rodahl, K. 1986, Textbook of Work Physiology, 3rd edn, McGraw Hill, New York. Åstrand, P.-O. & Rodahl, K. 1986, Textbook of Work Physiology, 3rd edn, McGraw Hill, New York. Bates, G., Working in Heat, (Video Production). Page 95
96 Bates, G., Gazey, C. & Cena, K. 1996, 'Factors affecting heat illness when working in conditions of thermal stress', J Hum Ergol (Tokyo), vol. 25, no. 1, pp Bates, G. & Miller, V. 2002, 'Empirical validation of a new heat stress index', The Journal of Occupational Health and Safety -Australia and New Zealand, vol. 18, no. 2, pp Boothby, W. M. & Sandiford, R. B. 1921, 'Nomographic charts for the calculation of the metabolic rate by the gasometer method', Boston Med Surg J, vol. 185, pp Brake, D. & Bates, G. 2000, 'Occupational heat illness: an interventional study', in International Conference on Physiological and Cognitive Performance in Extreme Environments, ed. W. Lau, Canberra, Australia. Brake, D., Donoghue, M. & Bates, G. 1998, 'A new generation of health and safety protocols for working in heat', in Queensland Mining Industry Occupational Health and Safety Conference, Qld Mining Council, Brisbane, Yeppoon. Brake, D. J. & Bates, G. P. 2002a, 'Deep body core temperatures in industrial workers under thermal stress', J Occup Environ Med, vol. 44, no. 2, pp Brake, D. J. & Bates, G. P. 2002b, 'Limiting metabolic rate (thermal work limit) as an index of thermal stress', Appl Occup Environ Hyg, vol. 17, no. 3, pp Brake, D. J. & Bates, G. P. 2003, 'Fluid losses and hydration status of industrial workers under thermal stress working extended shifts', Occup Environ Med, vol. 60, no. 2, pp Page 96
97 Brake, R. & Bates, G. 2002c, 'A valid method for comparing rational and empirical heat stress indices', Ann Occup Hyg, vol. 46, no. 2, pp Buskirk, E., Iampetro, P. & Bass, D. 2000, 'Work performance after dehydration: effects of physical conditioning and heat acclimatization.1958', Wilderness Environ Med, vol. 11, no. 3, pp Cadarette, B. S., Sawka, M. N., Toner, M. M. & Pandolf, K. B. 1984, 'Aerobic fitness and the hypohydration response to exercise-heat stress', Aviat Space Environ Med, vol. 55, no. 6, pp Cheung, S. S. & McLellan, T. M. 1998, 'Heat acclimation, aerobic fitness, and hydration effects on tolerance during uncompensable heat stress', J Appl Physiol, vol. 84, no. 5, pp Cheuvront, S. N., Carter, R., Castellani, J. W. & Sawka, M. N. 2005, 'Hypohydration impairs endurance exercise performance in temperate but not cold air', J Appl Physiol. Davies, P., Romer, L. & Ramsay, R. 2000, 'Assessment of urine concentration in athletes: an evaluation of four field methods', in European College of Sports Medicine 5th Annual Congress, Jyvaskla, Finland. Day, T. K. & Grimshaw, D. 2005, 'An observational study on the spectrum of heatrelated illness, with a proposal on classification', J R Army Med Corps, vol. 151, no. 1, pp Dey, N. C., Amalendu, S. & Saha, R. 2007, 'Assessment of cardiac strain amongst underground coal carriers--a case study in India', International Journal of Industrial Ergonomics, vol. 37, no. 6, pp Page 97
98 Donoghue, A. 2003, 'Type A lactic acidosis in occupational heat exhaustion', Occup Med, vol. 53, pp Donoghue, A., Sinclair, M. & Bates, G. 2000a, 'Heat exhaustion in a deep underground metalliferous mine', Occup Environ Med, vol. 57, pp Donoghue, A. M., Sinclair, M. J. & Bates, G. P. 2000b, 'Heat exhaustion in a deep underground metalliferous mine', Occup Environ Med, vol. 57, no. 3, pp Eastman Kodak Company 1986, 'Heart rate interpretation and methodology', in Ergonomic Design for People at Work, vol. 2, John Wiley and Sons. Easton, C., Fudge, B. W. & Pitsiladis, Y. P., 'Rectal, telemetry pill and tympanic membrane thermometry during exercise heat stress', Journal of Thermal Biology, vol. In Press, Accepted Manuscript. Ftaiti, F., Grelot, L., Coudreuse, J. M. & Nicol, C. 2000, 'Combined effect of heat stress, dehydration and exercise on neuromuscular function in humans', Eur J Appl Physiol, vol. 84, no Gonzalez-Alonso, J., Mora-Rodriguez, R. & Coyle, E. F. 2000, 'Stroke volume during exercise: Interaction of environment and hydration', American Journal of Physiology - Heart and Circulatory Physiology, vol. 278, no Gonzalez-Alonso, J., Teller, C., Andersen, S. L., Jensen, F. B., Hyldig, T. & Nielsen, B. 1999, 'Influence of body temperature on the development of fatigue during prolonged exercise in the heat', J Appl Physiol, vol. 86, no. 3, pp Page 98
99 Gopinathan, P. M., Pichan, G. & Sharma, V. M. 1988, 'Role of dehydration in heat stress-induced variations in mental performance', Arch Environ Health, vol. 43, no. 1, pp Hancock, P. A. & Vasmatzidis, I. 2003, 'Effects of heat stress on cognitive performance: the current state of knowledge', Int J Hyperthermia, vol. 19, no. 3, pp Hocking, C., Silberstein, R. B., Lau, W. M., Stough, C. & Roberts, W. 2001, 'Evaluation of cognitive performance in the heat by functional brain imaging and psychometric testing', Comparative Biochem Physiol Part A, vol. 128, pp ISO 2004, ISO 7933:2004 Ergonomics of the thermal environment - Analytical determination and interpretation of heat stress using calculation of the predicted heat strain, International Standards Organisation, Geneva. Jimenez, C., Melin, B., Koulmann, N., Allevard, A., Launay, J. & Savourey, G. 1999, 'Plasma volume changes during and after acute variations of body hydration level in humans', Eur J Physiol Occup Physiol, vol. 80, no. 1, pp Kamijo, Y.-i. & Nose, H. 2006, 'Heat illness during working and preventive considerations from body fluid homeostasis', Industrial Health, vol. 44, no. 3, pp Kovacs, E., Senden, J. & Brouns, F. 1999, 'Urine color, osmolality and specific electrical conductance are not accurate measures of hydration status during post- exercise rehydration', J Sports Med Phys Fitness, vol. 39, no. 1, pp Lambert, G. P. 2004, 'Role of gastrointestinal permeability in exertional heatstroke', Exerc Sport Sci Rev, vol. 32, no. 4, pp Page 99
100 Lu, S. & Zhu, N. 2006, 'Experimental research on physiological index at the heat tolerance limits in China', Building and Environment, vol. In Press, Corrected Proof. Malchaire, J., Piette, A., Kampmann, B., Mehnerts, P., Gebhardt, H., Havenith, G., Den Hartog, E., Holmer, I., Parsons, K., Alfano, G. & Griefahn, B. 2001, 'Development and Validation of the Predicted Heat Strain Model', Ann Occup Hyg, vol. 45, no. 2, pp Malchaire, J. B. M. 2006, 'Occupational heat stress assessment by the Predicted Heat Strain model', Industrial Health, vol. 44, no. 3, pp Marino, F. E., Kay, D. & Serwach, N. 2004, 'Exercise time to fatigue and the critical limiting temperature: effect of hydration', Journal of Thermal Biology, vol. 29, no. 1, pp Maughan, R. & Shirreffs, S. 2004, 'Exercise in the heat: challenges and opportunities', Journal Of Sports Sciences, vol. 22, no. 10, pp McMorris, T., Swain, J., Smith, M., Corbett, J., Delves, S., Sale, C., Harris, R. C. & Potter, J. 2006, 'Heat stress, plasma concentrations of adrenaline, noradrenaline, 5-hydroxytryptamine and cortisol, mood state and cognitive performance', International Journal of Psychophysiology, vol. 61, no. 2, pp Miller, V. & Bates, G. 2007, 'The Thermal Work Limit is a simple reliable heat index for the protection of workers in thermally stressful environments', Ann Occup Hyg, vol.51, no. 6, pp Miller, V. & Bates, G. 2007, 'Hydration of outdoor workers in northwest Australia', The Journal of Occupational Health and Safety - Australia and New Zealand, vol. 23, no. 1, pp Page 100
101 Montain, S., Sawka, M., WA, L. & CR, V. 1998, 'Thermal and cardiovascular strain from hypohydration: influence of exercise intensity', Int J Sports Med, vol. 19, no. 2, pp Moran, D. S. 2000, 'Stress evaluation by the physiological strain index (PSI)', Journal of Basic and Clinical Physiology and Pharmacology, vol. 11, no. 4, pp Moran, D. S., Horowitz, M., Meiri, U., Laor, A. & Pandolf, K. B. 1999, 'The physiological strain index applied to heat-stressed rats', J Appl Physiol, vol. 86, no. 3, pp Moran, D. S., Montain, S. J. & Pandolf, K. B. 1998, 'Evaluation of different levels of hydration using a new physiological strain index', Am J Physiol, vol. 275, no. 3 Pt 2, pp. R Moran, D. S., Shitzer, A. & Pandolf, K. B. 1998, 'A physiological strain index to evaluate heat stress', Am J Physiol Regul Integr Comp Physiol, vol. 275, no. 1, pp. R Muldoon, S., Deuster, P., Brandom, B. & Bunger, R. 2004, 'Is there a link between malignant hyperthermia and exertional heat illness?' Exerc Sport Sci Rev, vol. 32, no. 4, pp MVA 2005, 'HotWork', Copyright Mine Ventilation Australia. Noakes, T. D. 1998, 'Fluid and electrolyte disturbances in heat illness', Int J Sports Med, vol. 19 Suppl 2, pp. S Page 101
102 Oppliger, R. A., Magnes, S. A., Popowski, L. A. & Gisolfi, C. V. 2005, 'Accuracy of urine specific gravity and osmolality as indicators of hydration status', Int J Sport Nutr Exerc Metab, vol. 15, no. 3, pp Otani, H., Kaya, M., Tsujita, J., Hori, K. & Hori, S. 2006, 'Low levels of hypohydration and endurance capacity during heavy exercise in untrained individuals', Journal of Thermal Biology: Second International Meeting on Physiology and Pharmacology of Temperature Regulation, vol. 31, no. 1-2, pp Pilcher, J. J., Nadler, E. & Busch, C. 2002, 'Effects of hot and cold temperature exposure on performance: a meta-analytic review', Ergonomics, vol. 45, no. 10, pp Popowski, L. A., Oppliger, R. A., Patrick Lambert, G., Johnson, R. F., Kim Johnson, A. & Gisolf, C. V. 2001, 'Blood and urinary measures of hydration status during progressive acute dehydration', Med Sci Sports Exerc, vol. 33, no. 5, pp Ramsey, J. D., Burford, C. L., Beshir, M. Y. & Jensen, R. C. 1983, 'Effects of workplace thermal conditions on safe work behavior', Journal of Safety Research, vol. 14, no. 3, pp Sawka, M. N. 1992, 'Physiological consequences of hypohydration: exercise performance and thermoregulation', Med Sci Sports Exerc, vol. 24, no. 6, pp Sawka, M. N., Convertino, V. A., Eichner, E. R., Schnieder, S. M. & Young, A. J. 2000, 'Blood volume: Importance and adaptations to exercise training, environmental stresses, and trauma/sickness', Medicine and Science in Sports and Exercise, vol. 32, no. 2, pp Page 102
103 Sawka, M. N. & Montain, S. J. 2000, 'Fluid and electrolyte supplementation for exercise heat stress', The American Journal Of Clinical Nutrition, vol. 72, no. 2, pp. 564S- 572S. Sawka, M. N. & Pandolf, K. B. 1990, 'Effects of Body Water Loss on Physiological Function and Exercise Performance', in C. Gisolfi & D. Lamb, (eds.), Perspectives in Exercise Science and Sports Medicine: vol 3, Fluid Homeostasis During Exercise, Cooper Publishing Group, Carmel, pp Sawka, M. N., Wenger, C. & Pandolf, K. B. 1996, 'Thermoregulatory responses to acute exercise-heat stress and heat acclimation', in M. Fregley & C. Blatteis, (eds.), Handbook of Physiology Section 4 Environmental Physiology, vol. 1, Oxford University Press, New York/Oxford, p Schutte, P. & Zenz, C. 1994, 'Physical Work and Heat Stress', in C. Zenz, O. Dickerson & E. Horvath, (eds.), Occupational Medicine, 3rd edn, Mosby, St Louis, p Selkirk, G. A. & McLellan, T. M. 2001, 'Influence of aerobic fitness and body fatness on tolerance to uncompensable heat stress', J Appl Physiol, vol. 91, no. 5, pp Sherwood, L. 2007, Human Physiology: From Cells to Systems, 6th edn, Thomson Brooks/Cole. Stofan, J. R., Zachwieja, J. J., Horswill, C. A., Murray, R., Anderson, S. A. & Eichner, E. R. 2005, 'Sweat and sodium losses in NCAA football players: a precursor to heat cramps?' International Journal Of Sport Nutrition And Exercise Metabolism, vol. 15, no. 6, pp Taylor, N. A. S. 2006, 'Challenges to temperature regulation when working in hot environments', Industrial Health, vol. 44, no. 3, pp Page 103
104 Wallace, R. F., Kriebel, D., Punnett, L., Wegman, D. H. & Amoroso, P. J. 2007, 'Prior heat illness hospitalization and risk of early death', Environmental Research, vol. In Press, Corrected Proof. Walters, T. J., Ryan, K. L., Tate, L. M. & Mason, P. A. 2000, 'Exercise in the heat is limited by a critical internal temperature', Journal Of Applied Physiology (Bethesda, Md.: 1985), vol. 89, no. 2, pp Yan, Y.-E., Zhao, Y.-Q., Wang, H. & Fan, M. 2006, 'Pathophysiological factors underlying heatstroke', Medical Hypotheses, vol. 67, no. 3, pp Yoshida, T., Takanashi, T., Nakai, S., Yorimoto, A. & Morimoto, T. 2002, 'The critical level of water deficit causing a decrease in human exercise performance: a practical field study', Eur J Appl Physiol, vol. 87, pp Every reasonable effort has been made to acknowledge the owners of copyright material. I would be pleased to hear from any copyright owner who has been omitted or incorrectly acknowledged. Page 104


105 Published papers This article was first published in CCH s Journal of Occupational Health and Safety and has been reproduced with permission. Page 105

106 Page 106

107 Page 107

108 Page 108

109 Page 109

110 Page 110
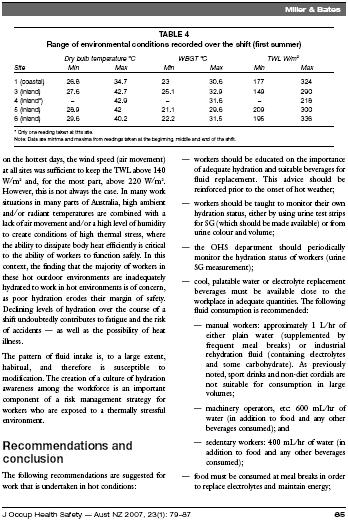
111 Page 111

112 Page 112
113 Page 113
114 This is a pre-copy-editing, author-produced PDF of an article accepted for publication in Annals of Occupational Hygiene following peer review. The definitive publisherauthenticated version The Thermal Work Limit Is a Simple Reliable Heat Index for the Protection of Workers in Thermally Stressful Environments VERONICA S. MILLER; GRAHAM P. BATES Annals of Occupational Hygiene : is available online at f Title The Thermal Work Limit is a simple reliable heat index for the protection of workers in thermally stressful environments Authors Keywords V.S.Miller, G.P.Bates School of Public Health, Curtin University of Technology, Western Australia Thermal Work Limit, heat stress index, heat illness, thermal environment, industry, core temperature Page 114
115 Abstract Background Objectives Methods Results Conclusions Workers in many industries are exposed to thermally stressful work environments. Protection of the health of workers without unnecessarily compromising productivity requires the adoption of a heat index that is both reliable and easy to use. To evaluate the Thermal Work Limit (TWL), in a controlled environment and under field conditions, against these criteria Volunteers performed graded work in a controlled thermal environment to determine the limiting workload for the conditions. Core temperature and heart rate were monitored as indicators of thermoregulation. In the field study outdoor workers were monitored for signs of physiological strain in thermal environments which were characterised using both the traditional Wet Bulb Globe Temperature (WBGT) and the TWL. Abilities of each of these indices to accurately reflect the thermal stress on workers were evaluated. In the controlled environment the TWL was found to reliably predict the limiting workload. In the field study TWL was a more appropriate and realistic index than WBGT, which was found to be excessively conservative. The results confirm previously published studies evaluating TWL in underground environments, which have led to its widespread adoption in the Australian mining industry. The study extends the applicability of TWL to outdoor environments and generates management guidelines for its implementation. Page 115
116 Introduction In many parts of the world large numbers of workers in the construction, agriculture and resources industries work long hours in thermally stressful environments, a situation which will be exacerbated by predicted climate change. Working under conditions of thermal stress has associated risks and consequences. Impairment of mental function and increased fatigue have implications for workplace safety. Heat-related illness ranges from heat cramps and heat exhaustion to the fortunately rare but often fatal condition of heat stroke. Maximising production without compromising the health and safety of workers requires occupational hygienists and safety officers to be equipped with a simple, robust and reliable index to quantify the degree of stress posed by the thermal environment, and unambiguous guidelines for its implementation. Heat stress indices currently in use are either difficult to apply or poorly applicable in many situations, leaving many industries without an effective heat management strategy. Where the ambient temperature exceeds 35 o C the lack of thermal gradient between the skin and surrounds means effectively that the only avenue for heat loss is the evaporation of water, chiefly from the skin (sweating). At ambient temperatures above 35 o C, or where the radiant load is high, the skin is in fact an avenue of heat gain. Under such conditions, or where the effectiveness of sweating is reduced by high ambient humidity, it may not be possible to dissipate metabolic heat; heat storage will occur leading to an increase in core temperature and the risk of heat illness. As the principal factor driving metabolic heat production is muscular activity those working in hot conditions are at greatest risk. For any set of environmental conditions there is a maximum rate at which an individual can dissipate heat i.e. a limiting metabolic rate, and therefore a maximum rate at which they can safely work. The risk of heat illness is greatly exacerbated by poor hydration. When ambient temperatures are extreme or when high temperatures are combined with high humidity the fluid losses in sweat may exceed 1 litre per hour (Miller and Bates, 2007), predisposing to progressive dehydration. As sweat is hypotonic to plasma the volume loss is accompanied by a progressive increase in the osmolality of the extracellular fluid (ECF), so that the reduction in ECF volume is buffered by a fluid shift from the intracellular compartment (Kamijo and Nose, 2006). Continued sweating and failure to adequately replace lost fluid and electrolytes eventually leads to manifestations of heat illness. The biochemical changes (Donoghue, 2003, Donoghue, et al., 2000) accompanying cellular dehydration and impaired tissue perfusion contribute to headache, fatigue and other signs of heat exhaustion, whilst reduction in plasma volume (Jimenez, et al., 1999) may result in light-headedness or syncope. Ultimately the inability to maintain cutaneous circulation and an adequate sweat rate permits core temperature to rise and the individual succumbs to heat stroke. Clearly adequate hydration is a critical factor in prevention of heat illness, as is acclimatisation, which enhances thermoregulation by increasing plasma volume and sweat response. However even when heat loss mechanisms are optimised there is an upper limit to the heat load that can be dissipated. In many situation workers will selfpace, adjusting either the work rate or the duration of work intervals to maintain thermal balance. The danger is that when the work is externally paced (e.g. by machinery Page 116
117 factors, quotas, peer pressure etc), or the sustainable level of work is perceived as being unacceptably low, workers will push themselves beyond the safe limit and be at risk of developing heat illness. At most risk are those who are poorly hydrated, unacclimatised or physically unfit. Protection of workers in hot environments requires a means of identifying conditions where excessive thermal stress places their health at risk. International Standard ISO 7933:2004 (ISO, 2004) uses the predicted heat strain index, but the complexity of this index discourages its use. In commoner use is the Wet Bulb Globe Temperature (WBGT), and the ACGIH TLV is in terms of this (ACGIH, 2007). The shortcomings of WBGT are widely recognised (Brake and Bates, 2002b, Taylor, 2006) and include the need to estimate metabolic rates and its relative insensitivity to the cooling effect of air movement. In practice the WBGT is often seen to be excessively conservative and is largely ignored in many situations where its rigorous implementation would lead to unacceptable and unnecessary losses in productivity. Advances in instrumentation have led to the publication of a new generation of heat stress indices that address inadequacies in the WBGT. One of the simplest to implement is the Thermal Work Limit or TWL (Brake and Bates, 2002b, Brake and Bates, 2002c). TWL uses five environmental parameters (dry bulb, wet bulb and globe temperatures, wind speed and atmospheric pressure) and accommodates for clothing factors to arrive at a prediction of a safe maximum continuously sustainable metabolic rate (W.m -2 ) for the conditions, i.e. the thermal work limit (TWL). At high values of TWL the thermal conditions impose no limits on work. At moderate values adequately hydrated selfpaced workers will be able to accommodate to the thermal stress by adjusting their work rate. At low TWL values heat storage is likely to occur and TWL can be used to predict safe work rest-cycling schedules, whilst at very low values no useful work rate may be sustained. A thermal environment can therefore be classified on the basis of TWL. Recommended management protocols based on TWL (Brake, et al., 1998) have been widely adopted and implemented in the underground mining industry in Australia; the resultant reduction in heat illness and lost production (Brake and Bates, 2000) is an endorsement of the index and its validity has been tested under controlled conditions in a small study (Bates and Miller, 2002). To date TWL has largely been used in the underground environment, however the algorithm is equally applicable to the outdoor environment where radiant heat forms a significant component of the thermal load. This paper reports studies reinforcing the ability of the TWL algorithm to accurately predict limiting work rates under controlled conditions and a trial comparing the appropriateness of TWL and WBGT under field conditions in hot outdoor work environments. Management guidelines for the implementation of TWL in outdoor workplaces are provided. Methods The subjects for the controlled environment study were twelve healthy young men accustomed to physical exercise. Prior to the study the subjects completed a health check and fitness assessment (table1). The trials were carried out in late summer to ensure that the subjects were at least partially acclimatised to hot conditions. Page 117
118 Testing of each subject, which followed a similar protocol to the earlier study (Bates and Miller, 2002), was carried out over two consecutive days in a climate controlled chamber at dry bulb temperature o C and wet bulb temperature approximately 28 o C (45% relative humidity). For each trial the subjects remained in the chamber for approximately three hours of alternating periods of work (30 minutes) and rest (10 minutes). Conditions were monitored with a Heat Stress Monitor (HSM) (Calor Environmental Instruments, Western Australia) and are summarised in table 2 together with the computed WBGT and TWL indices for each testing day. TWL predicts the limiting metabolic heat load for fully acclimatised subjects; empirical evidence suggests that lack of acclimatisation may reduce this by up to 25% (Brake and Bates, 2002b, Donoghue, et al., 2000). As our subjects were considered partially acclimatised it was predicted that their metabolic limit under these conditions (actual thermal work limit) would fall within the range W.m -2, equivalent to a limiting external work rate of 50-70W, assuming a resting metabolic rate of 55W.m -2 and a work efficiency of 25% (as previously found) and an average surface area (Boothby and Sandiford, 1921) of 2m 2 (table 1). 1 Table 1. Anthropometric and physiological data for the subjects Subject Age height (cm) weight (Kg) S.A. (m 2 ) BMI WHR Fat (%) BP (mm Hg) RHR (BPM) FEV1/ FVC% VO2max (ml/kg/min) A / B / C / D / E /70 75 b b F / G /90 a H / I / J / K / L /70 54 mean S.D S.A. = surface area (estimated using the nomogram of Boothby and Sandiford (1921)), BMI = Body mass index, WHR = waist hip ratio a Subject aware of having high blood pressure, otherwise healthy. b Subject had jogged 5 Km prior to the medical accounting for the relatively high RHR and possibly affecting estimation of VO 2max 1 Equivalence was calculated as follows: A work efficiency of 25% implies that 75% of the energy required to perform the work is lost as heat, in other words the additional heat load is three times the external work rate. Heat load from resting metabolism (RMR) = 55 W.m -2 Heat load from external work (HEW) = external workload (W) x 3 2m 2 Total metabolic heat load in W.m -2 = RMR + HEW The calculation yields total metabolic heat loads for the 40, 50, and 60 W workloads of approximately 115, 130, and 145 W.m -2 respectively. Page 118
119 Table 2. Conditions during the eleven controlled environment sessions. Data are means and standard deviations for readings recorded approximately every five minutes throughout each session. WBGT was automatically calculated at each sampling time. TWL values were computed from the mean environmental data for the session using a clothing insulation value of 0.12 clo (sweat-saturated minimal attire). Trial day Dry Bulb ( o C) Wet Bulb ( o C) Wind speed (m/sec) WBGT ( o C) TWL (watts/m 2 ) ± ± ± ± ± ± ± ± ± ± ± ± ± ± ± ± ± ± ± ± ± ± ± ± ± ± ± ± ± ± ± ± ± ± ± ± ± ± ± ± ± ± ± ± To verify this, external work was performed using Monark cycle ergometers at workloads of 40, 50, and 60W and the ability of the subjects to maintain heat balance without strain during each work period was assessed by monitoring their core temperature and heart rate. Inability to stabilise these indicates that the subject s limiting metabolic load is exceeded. Core temperature was recorded using ingested miniature transponders (HTI technologies Inc) which transmit a radio signal corresponding to temperature. Each subject wore a Polar Sport Tester heart rate monitor. To ensure that hydration status would not be a limiting factor to the dissipation of heat the hydration level of the subjects was monitored throughout each trial by measurement of urine specific gravity (Usg). Subjects could not enter the chamber unless adequately hydrated (Usg 1.015). In the chamber the subjects maintained hydration by drinking water on schedule at an adequate rate to compensate for the sweat rate predicted by the TWL algorithm (approximately 1 litre per hour). Locations selected for the outdoor study were mining and mine-related sites in the northwest of Australia where environmental conditions in the summer months typically Page 119
120 produce WBGT values in excess of the recommended guidelines (ACGIH, 2007). Environmental parameters and TWL were logged from mid-morning to mid-afternoon for each shift and recorded manually from representative work locations. Participants in the field study were monitored for signs of physiological strain over three days whilst continuing with normal work. At the beginning of each shift each subject was fitted with a Polar S720i heart rate monitor. Tympanic temperatures were recorded at the beginning, middle (lunch break), and end of the shift as an indication of core body temperature. At the same times subjects were asked to rate their perceived level of fatigue (RPF) on a numerical scale ranging from 1 (feeling really good) to 13 (completely exhausted). Urine samples were also obtained at each time to assess hydration status (Miller and Bates, 2007). All protocols were approved by the Curtin University Human Research Ethics Committee. Results Table 3 shows the maximum core temperatures reached by the chamber study subjects in each of their two work trials. In common with other heat stress indices the TWL algorithm allows for core temperature to reach a maximum of 38.2 o C. In eighteen out of the twenty-four subject sessions core temperature remained below this level. In the remaining six sessions the subject s core temperature did exceed 38.2 o C indicating that the metabolic heat load exceeded the subject s safe limit under the conditions, however one of these could be attributed to the subject wearing unsuitably heavy pants thus increasing his clothing insulation (clo) factor and reducing his effective metabolic limit. When the pants were removed he completed the session without excessive core temperature. Two subjects had to be stopped and allowed to cool down during their first session in the chamber because of rapidly climbing core temperatures. Both returned to the chamber to complete the remaining work periods and in both cases the temperature again exceeded 38.2 o C The chamber sessions were structured with the first 30-minute work period being performed at 40W followed by a period at 50W. Most subjects went on to work at 50W for the third period and then dropped back to 40W for the fourth. Depending on temperatures and heart rates over the first four periods the final work period was conducted at 40, 50 or 60W. By inspection of the core temperature and heart rate records for each trial session a limiting workload was estimated, this being the external workload which it was judged that the subject would not be able to sustain for an extended time under the conditions because either their core temperature had exceeded 38.2 o C or was likely to if they continued working, or their heart rate had failed to stabilise and had exceeded 115 beats per minute over the final 10 minutes of the work period (Figure 1). Where the core temperature did exceed 38.2 o C, reducing the workload in subsequent work periods allowed the temperature to stabilise in some but not all cases (Figure 2). The limiting external workloads (W/L) for each subject on each day are shown in table 3. Page 120
121 Table 3. Maximum core temp reached and limiting workloads for each of the two work trials completed by each subject in the controlled environment study Day Subject Limiting W/L trial 1 (watts) Limiting W/L trial 2 (watts) A B >60 C D 38.4 a E F G >60 >60 H 38.4 b I 38.3 b J K L >50 >60 a Had heavy pants on, OK after removed b Core temp climbing, exercise stopped Shaded cells are those trials in which core temp exceeded 38.2 o C Limiting W/L = Limiting workload i.e. minimum external workload at which core temperature and/or heart rate failed to stabilise at 38.2 o C/ 115beats per minute Assessment of heat strain from heart rate and rectal (core) temperature has a sound physiological basis and has been quantified on a scale of 1-10 in the Physiological Strain Index (PSI) (Moran, et al., 1998). According to this index the subject in Figure 1 had a PSI of 3 at the completion of the third work period (40W) and 3.3 at the completion of period 4 (40W) both indicating a low level of strain. After working at 50W in period 5 the PSI had risen to 4.6 (moderate) a clear increase in the level of strain at the higher workload. From the heart rate record it is apparent that if the subject had continued to work at 50W the heart rate and PSI would have continued to increase. Page 121

 of approximately 130 W.m -2. Figure 2. The subject s temperature exceeded 38.")
122 Figure 1. Heart rate and core temperature records of a subject in the controlled environment trial showing inability to stabilise at 50 watts (limiting workload) corresponding to a limiting metabolic heat load (TWL) of approximately 130 W.m -2. Figure 2. The subject s temperature exceeded 38.2 o C in the third work period. He was unable to stabilise at a subsequent lower workload. Page 122
123 Table 4. Summary of environmental data from the field study Site 1 (Coastal) Site 2 (Coastal) Site 3 (Inland) n Dry 35.0 ± ± ± 3.0 Bulb ( o C) RH 58.9 ± ± ± 7.5 (%) Globe 38.7 ± ± ± 5.2 Temp ( o C) WS 4.1 ± ± ± 1.2 (m/sec) WBGT 30.6 ± ± ± 2.3 ( o C) TWL (w/m 2 ) ± ± ± 37.3 Data are means ± SD of values recorded at various times at representative locations for each site over 3 or 4 consecutive days. RH = relative humidity, WS = wind speed, n = number of data collections included for each site Table 5. Indicators of Physiological strain: summary of data from the field study. Tympanic temperature (start) Tympanic temperature (mid) Tympanic temperature (end) RPF (start) RPF (mid) Site 1 (Coastal) 36.5 ± 0.2 (n=15) 36.7 ± 0.2 (n=11) 36.8 ± 0.2 (n=15) 3.0 ± 2.1 (n=15) 2.6 ± 1.0 (n=14) Site 2 (Coastal) 36.6 ± 0.3 (n=24) 37.2 ± 0.3 (n=24) 37.2 ± 0.3 (n=24) 3.7 ± 2.1 (n=23) 4.6 ± 2.2 (n=24) Site 3 (Inland) 36.7 ± 0.4 (n=23) 37.0 ± 0.4 (n=21) 37.0 ± 0.3 (n=23) 4.7 ± 2.2 (n=23) 5.2 ± 1.7 (n=21) RPF (end) 3.7 ± 1.8 (n=15) 4.5 ± 2.7 (n=24) 5.7 ± 1.7 (n=22) HR (ave) 87.9 ± 6.6 (n=9) ± 11.7 (n=24) 89.8 ± 10.3 (n=21) Data are means ± S.D. n = number of values in each data set. Tympanic temperature and Relative Perceived Fatigue (RPF) data were collected at the start middle and end of the shift. Page 123
124 Table 4 summarises the environmental data from the field study. At sites 1 and 3 the subjects were performing light manual work such as machine operation and were able to be in the shade part of the time. Site 2 was a construction site where the subjects were a crew engaged in laying and tying reinforcing steel, a moderately high level of physical activity, and were exposed to the sun throughout. Physiological data from the subjects is summarised in table 5. There was no significant change in any of the parameters monitored over the course of the shift. The slight increases in tympanic temperature in all groups were consistent with diurnal rhythm. Subjects also maintained a constant (though not necessarily optimal) level of hydration over the work period (Miller and Bates, 2007). The average heart rate, although differing between groups reflecting differences in the type and intensity of work being performed, was well below levels that would indicate physiological strain and showed no tendency to increase over the shift. Figure 3 shows the heart rate from one of the construction crew, scheduled rest periods are clearly reflected in the heart rate, which otherwise remains consistently elevated. Heart rates from the other subject groups were much more variable and rest breaks are not clearly evident (Figure 4). Discussion Results from the controlled environment study reinforce the conclusion from earlier work (Bates and Miller, 2002) that TWL does have the ability to predict the limiting work rate for a thermal environment. Under milder environmental conditions the work rates chosen would be well within the capabilities of the subjects, whose predicted VO2 max averaged 51mL/Kg/min, so simple fatigue is unlikely to have affected performance in the chamber. The limiting workloads (W/L) shown in table 3 are the minimum external workload at which the subject s core temperature and/or heart rate failed to stabilise. In other words if the subject were required to continue working at this or a higher level, heat exhaustion or fatigue would be expected to result. On their second day in the chamber eight of the twelve subjects were able to complete the work periods at 50W or more without evidence of heat storage or physiological strain. A further two were able to stabilise at 40W but not at 50W, in other words ten out of the twelve subjects had limiting workloads in the range predicted by the algorithm. The remaining two showed heat storage at all workloads on both days probably reflecting lack of acclimatisation (or in one case the highest BMI and body fat % of the group). In a selfpaced work situation these two would have voluntarily reduced their work rate to a level where they could cope. Conditions for the outdoor study were generally less thermally challenging than for the chamber study as shown by higher TWL values (Mean TWL across the three outdoor sites 200W.m -2 vs. approximately 160 W.m -2 in the chamber), although WBGT values were similar (mean WBGT ranged from o C at outdoor sites and (excluding day 5) from o C in the chamber). One reason for this is that TWL reflects wind speed to a far greater degree than WBGT. Although conditions at each site varied from day to day, and to a lesser extent throughout the day, TWL seldom went below 150W.m -2 indicating that the index predicted no limitation to work of a light to moderate intensity (<150 W.m -2 represents light work (MVA, 2005)). The physiological data support this, despite the fact that on the majority of days WBGT values of >30 o C were consistently recorded, a level at which this index predicts an Page 124


125 increased risk of thermal strain. Until 2006, the ACGIH TLV for acclimatised workers wearing long sleeved summer work Figure 3. Heart rate record from subject at site 2 performing continuous manual labour. Dry and wet bulb temperature and TWL records superimposed. Figure 4. Heart rate recording from subject at site 3 performing varied tasks. Dry and wet bulb temperature and TWL records superimposed Heart rate, bpm TWL, W.m Bulb tem[peratures, o C :30 7:30 8:30 9:30 10:30 11:30 12:30 13:30 14:30 15:30 16:30 0 Time Heart Rate TWL Dry Bulb Wet Bulb Page 125
The Thermal Work Limit Is a Simple Reliable Heat Index for the Protection of Workers in Thermally Stressful Environments
 Ann. Occup. Hyg., Vol. 51, No. 6, pp. 553 561, 2007 Ó The Author 2007. Published by Oxford University Press on behalf of the British Occupational Hygiene Society doi:10.1093/annhyg/mem035 The Thermal Work
Heat Stress Policy UFEHS-SAFE-04/04/01 Environmental Health and Safety Finance and Administration University of Florida
 Heat Stress Policy UFEHS-SAFE-04/04/01 Environmental Health and Safety Finance and Administration University of Florida OBJECTIVE The objective of this policy is to reduce the risk of illness, injury or
ACTU GUIDELINES FOR WORKING IN SEASONAL HEAT
 ACTU GUIDELINES FOR WORKING IN SEASONAL HEAT December 1998 1. INTRODUCTION Working in seasonal heat presents particular health and safety hazards, which may be influenced by a number of risk factors. Over
19. HEAT STRESS ON THE FARM
 19. HEAT STRESS ON THE FARM THE HAZARD Every farmer and farm workers must be familiar with and learn how to deal with the condition of heat stress. However, heat stress is generally not desirable, and
Managers and supervisors. 28/06/2016 Version number: v0
 Managers and supervisors Introduction The Ministry of Labour (MOL) in UAE issues a Decree every year concerning the mid-day break during the summer months for those working under the sun: 15 June-15 September
BP OIL -- TOLEDO REFINERY
 BP OIL -- TOLEDO REFINERY Document Type: Reference Effective Date: September 29, 2017 Owner: Matthew T. Grimes Refinery Wide Heat Stress Management Guideline Auth. By: Robert Myak (Signiture on file) Reference
Doc. No. SP-14 Rev. No. 1 Date: 07/17/2012 Page 1 of 08
 Date: 07/17/2012 Page 1 of 08 Approved: Ahmed Boomrod, CEO/President Approved: Michael G. Cadotte, Vice President Safety, Quality and Administration Change Record Rev.: Date: Responsible Person: Description
HEAT, COLD, SOLAR ULTRAVIOLET & INCLEMENT WEATHER
 CONTRACTOR WHS HAZARD STANDARD HEAT, COLD, SOLAR ULTRAVIOLET & INCLEMENT WEATHER EXTERNAL USE ONLY Principles in the Optus Contractor WHS management process CONTRACTOR MANAGEMENT STAGES PRINCIPLES THIS
Module 1 - Situation: Body Ambient Bondgraph Model Using Heat Flux. Transducer
 OpenStax-CNX module: m16245 1 Module 1 - Situation: Body Ambient Bondgraph Model Using Heat Flux * Transducer Robert Neddermeyer This work is produced by OpenStax-CNX and licensed under the Creative Commons
THERMAL COMFORT GUIDELINES
 UOW SAFE@WORK THERMAL COMFORT GUIDELINES HRD-WHS-GUI-244.6 Thermal Comfort Guidelines 2016 July Page 1 of 8 Contents 1 Introduction... 3 2 Responsibilities... 3 2.1 Managers... 3 2.2 Supervisors... 3 2.3
Heat Stress Prevention Program
 Heat Stress Prevention Program Training for Supervisors and Employees Environmental Health and Safety Training Program Objectives Protect employees from outdoor heat hazards by: Identifying, evaluating
Heat Illness Prevention Plan. California State University, Chico
 Heat Illness Prevention Plan California State University, Chico Department of Environmental Health and Safety April 2017 TABLE OF CONTENTS Section Page 1.0 Purpose... 1 2.0 Heat Illness Overview... 2 2.1
Session 6 OPTIMISING PERFORMANCE IN A CHALLENGING CLIMATE
 Session 6 OPTIMISING PERFORMANCE IN A CHALLENGING CLIMATE MANAGEMENT OF HORSES IN HOT WEATHER Dr David Marlin & Dr Martha Misheff March 2018 BACKGROUND Hot or hot and humid environmental conditions are
Heat Stress. Physical Agent Data Sheet (PADS) Description. Health Effects Heat Disorders
 Description. Health Effects Heat Disorders") Physical Agent Data Sheet (PADS) Description Heat Stress Heat stress is caused by working in hot environments like laundries, bakeries, or around boilers or incinerators. Four environmental factors affect
Physical Agent Data Sheet (PADS) Description Heat Stress Heat stress is caused by working in hot environments like laundries, bakeries, or around boilers or incinerators. Four environmental factors affect
RESPIRATORY REGULATION DURING EXERCISE
 RESPIRATORY REGULATION DURING EXERCISE Respiration Respiration delivery of oxygen to and removal of carbon dioxide from the tissue External respiration ventilation and exchange of gases in the lung Internal
HEAT ILLNESS PREVENTION PLAN
 www.westhillscollege.com HEAT ILLNESS PREVENTION PLAN October, 2008 Status: Last Revised July, 2008 Approved WHCCD Risk Management Committee 10/10/08 WHCCD Board of Trustees approval 12/16/08 HEAT ILLNESS
SWIMMING SCIENCE BULLETIN
 The Mechanisms of Ultra-short Training 1 SWIMMING SCIENCE BULLETIN Number 45g Produced, edited, and copyrighted by Professor Emeritus Brent S. Rushall, San Diego State University THE MECHANISMS OF ULTRA-SHORT
HEAT ILLNESS PREVENTION
 HEAT ILLNESS PREVENTION Risk Assessment and Planning BY JEROME E. SPEAR, CSP, CIH The Statistical Abstracts of the United States, 105th edition, estimates that 5 to 10 million workers are exposed to heat
Guidelines on Working in Cold Conditions Re-endorsed by Annual Conference 2017
 Guidelines on Working in Cold Conditions Re-endorsed by Annual Conference 2017 What is cold? Cold is experienced when the body is in circumstances that deplete the body s heat and potentially reduce its
Evaluating mining self-rescuers in a hot and humid environment
 Evaluating mining self-rescuers in a hot and humid environment A study carried out by Mines Rescue Service Ltd for the UK Health and Safety Executive Tony Forster MSc CEng FIMMM Her Majesty s Inspector
Cold Weather Safety Program
 Title: Cold Weather Safety program Effective Date: 12/6/2014 Control Number: THG_0052 Revision Number: 1 Date: 10/23/2015 Annual Review Completed: 5/13/2015 Cold Weather Safety Program CONTENTS I. INTRODUCTION
The case for a legally enforceable maximum temperature.
 The case for a legally enforceable maximum temperature. Introduction Although high Temperatures are accepted as a health risk, with the exception of extreme temperatures, there is little recognition of
GUIDE. Feeling the Heat
 GUIDE Feeling the Heat Hot work, either outdoors or indoors, can certainly lead to an increase in accidents and injuries. Some, unenlightened employers, see this as just a seasonal irritation over which
HEAT MANAGEMENT PROCEDURE
 TABLE OF CONTENTS 1. OBJECTIVE... 2 2. SCOPE... 2 3. DEFINITIONS... 2 4. RESPONSIBILITIES... 2 5. HAZARD AND RISK ASSESSMENT... 2 5.1 HEAT RELATED ILLNESS... 3 5.1.1 Risk Factors... 3 5.1.2 Controls...
GUIDELINES ON WORKING IN COLD CONDITIONS
 GUIDELINES ON WORKING IN COLD CONDITIONS Re-Endorsed by Annual Conference 2017 NSW Nurses and Midwives' Association 50 O Dea Avenue Waterloo NSW 2017 P 02 8595 1234 (metro) 1300 367 962 (regional) www.nswnma.asn.au
Heat Stress. Dangers. Prevention. Treatment MiCAH Safety Solutions, LLC
 Heat Stress Dangers Prevention Treatment Employee Training- OSHA Review heat-related illness signs and symptoms and site-specific precautions during daily meetings and toolbox talks. Make sure everyone
Lung Volumes and Capacities
 Lung Volumes and Capacities Normally the volume of air entering the lungs during a single inspiration is approximately equal to the volume leaving on the subsequent expiration and is called the tidal volume.
MAKING AN IRONMAN RACE DAY
 1 MAKING AN IRONMAN - IRONMAN TRAINING by Hector L Torres, USA Triathlon Elite Coach, USA Cycling Pr Coach, USA Track and Field, USA Swimming and Strength Conditioning Specialist 2 MAKING AN IRONMAN A
James E. Thompson, Inc. dba JTS Construction
 HEAT ILLNESS PREVENTION PROGRAM: Pgs. 8-11 Complete the written procedures for water provision. DISCARD THESE INSTRUCTIONS WHEN COMPLETE HEAT ILLNESS PREVENTION 1-800-734-3574 www.eeap.net 2010 EEAP All
Dietary supplements and nutrition in sports and exercices performance
 Dietary supplements and nutrition in sports and exercices performance Nutrition for endurance sports The most likely contributors to fatigue during an endurance exercise are dehydration and carbohydrates
PICU Resident Self-Study Tutorial The Basic Physics of Oxygen Transport. I was told that there would be no math!
 Physiology of Oxygen Transport PICU Resident Self-Study Tutorial I was told that there would be no math! INTRODUCTION Christopher Carroll, MD Although cells rely on oxygen for aerobic metabolism and viability,
California State University Bakersfield Heat Illness Prevention Policy. Revised November 2017
 California State University Bakersfield Heat Illness Prevention Policy Revised November 2017 THIS PAGE INTENTIONALLY LEFT BLANK 1 Contents 1.0 Policy... 3 2.0 Authority... 3 3.0 Scope... 3 4.0 Definitions...
HARNESS RACING HEAT POLICY
 Policy: 622.2 Effective: 1 December 2011 Revised: October 2011 Subject: Reference: Harness Animal Welfare Committee Meeting - 12 February 2009 Regulatory Review Panel 9 February 2011 HRNSW Board Meeting
Heat Stress & Illness Prevention
 Heat Stress & Illness Prevention Overview Employees who work in outdoor places of employment or who work in other locations where environmental risk factors for heat illness are present are at risk for
CWA Occupational Safety and Health Fact Sheet #18. Temperature Extremes & the Workplace
 CWA Occupational Safety and Health Fact Sheet #18 Temperature Extremes & the Workplace CWA members are employed in environments, both inside and outside, which may involve exposure to cold and hot temperatures.
EXTREME HEAT GUIDELINES August 2008
 EXTREME HEAT GUIDELINES August 2008 Cricket Victoria ( CV ) has formulated these extreme heat guidelines ( Guidelines ) to minimise the risk of injury, illness and possible death in Victorian Cricket Pathway
Heat Stress Prevention
 Heat Stress Prevention University Facilities Internal Procedure: July 1, 2013 Effective date: July 1, 2013 Last Modified: April 2013 Approved by: Bob Wells 1.0 Program Objective UF has implemented this
A comprehensive effort to prevent heat stress will improve worker safety and boost productivity.
 June 1st, 2006 Vol. 57 No. 11 Recognizing and preventing heat stress A comprehensive effort to prevent heat stress will improve worker safety and boost productivity. By Karen Lewis & Helen Murphy Hot summer
60bbm and less 60-50bbm 50-30bbm 30-20bbm 20-10bbm (incorporates a significant aerobic component)
") TRAINING SPECIFICS IN RELATION TO AEROBIC & ANAEROBIC CONDITIONING OF SWIMMERS By Leigh Nugent, National Youth Coach Training specificity is a term mentioned often in the literature published on the physiological
TRAINING SPECIFICS IN RELATION TO AEROBIC & ANAEROBIC CONDITIONING OF SWIMMERS By Leigh Nugent, National Youth Coach Training specificity is a term mentioned often in the literature published on the physiological
Subject: Heat Stress Date: 2/8/18 Revision: 02 Page: 1 of 5
 Subject: Heat Stress Date: 2/8/18 Revision: 02 Page: 1 of 5 SUMMARY: Work operations involving high air temperatures, radiant heat sources, high humidity, direct physical contact with hot objects, or strenuous
DRIVER FATIGUE MANAGEMENT PLAN
 DRIVER FATIGUE MANAGEMENT PLAN Basic principles to include in a driver fatigue management plan A number of basic principles apply when developing a Driver Fatigue Management Plan. The following are detailed
The physiological functions of respiration and circulation. Mechanics. exercise 7. Respiratory Volumes. Objectives
 exercise 7 Respiratory System Mechanics Objectives 1. To explain how the respiratory and circulatory systems work together to enable gas exchange among the lungs, blood, and body tissues 2. To define respiration,
Tioga ISD Athletic Department Heat Policy
 Tioga ISD Athletic Department Heat Policy Practice of competition in hot and humid environmental conditions poses special problems for student-athletes. Heat stress and resulting heat illness is a primary
Heat Stress Training & Prevention
 Diocese of San Jose R I S K & I N S U R A N C E M A N A G E M E N T Heat Stress Training & Prevention The following information has been collected from the National Institute for Occupational Safety an
Fatigue Determines Endurance Performance: The Training Application
 Fatigue Determines Endurance Performance: The Training Application USTFCCCA Endurance Symposium 2015 Don t let fatigue make a coward out of you. Steve Prefontaine Runner Outline Of San Antonio Fatigue
Heat stress. Prepared by: Workplace Safety Consultation unit Minnesota Department of Labor and Industry June 2005
 Heat stress Prepared by: Workplace Safety Consultation unit Minnesota Department of Labor and Industry June 2005 Heat stress The net heat load to which a worker may be exposed from the combined contributions
UKA Medical Advice. Hot Weather
 UKA Medical Advice Hot Weather Author: Dr Natasha Beach, UKA Medical Advisor (runbritain) June 2018 Warm or Hot Weather While the United Kingdom and Ireland are not famed for their seasonally high temperatures,
Cold Weather Emergencies
 Cold Weather Emergencies Introduction Medical emergencies can result from exposure to heat or cold. Certain populations are at higher risk for heat and cold emergencies. Children Older people People with
Chapter I examines the anthropometric and physiological factors that. determine success in sport. More specifically it discusses the somatotype
 CHAPTER 1 INTRODUCTION Chapter I examines the anthropometric and physiological factors that determine success in sport. More specifically it discusses the somatotype ratings, VO 2 max and running economy
Control of Vibration at Work
 Control of Vibration at Work 1) POLICY University of Glasgow will put in place measures to protect employees from the risks of Hand Arm Vibration Syndrome (HAVS) and Whole Body Vibration. These measures
Hot Weather Guidelines
 Hot Weather Guidelines Updated: December 017 SOFTBALL AUSTRALIA LIMITED ACN 09 11 31 Suite 1, Level I 73 Wellington Street I Collingwood Vic 30 I Australia T: +1 3 917 00 I F: +1 3 917 3399 I E: info@softball.org.au
Assessment of an International Breaststroke Swimmer Using a Race Readiness Test
 International Journal of Sports Physiology and Performance, 2009, 4, 139-143 2009 Human Kinetics, Inc. Assessment of an International Breaststroke Swimmer Using a Race Readiness Test Kevin G. Thompson
CHAPTER 3: The cardio-respiratory system
 : The cardio-respiratory system Exam style questions - text book pages 44-45 1) Describe the structures involved in gaseous exchange in the lungs and explain how gaseous exchange occurs within this tissue.
Reduction of Speed Limit at Approaches to Railway Level Crossings in WA. Main Roads WA. Presenter - Brian Kidd
 Australasian College of Road Safety Conference A Safe System: Making it Happen! Melbourne 1-2 September 2011 Reduction of Speed Limit at Approaches to Railway Level Crossings in WA Radalj T 1, Kidd B 1
Creatine. Travis Harvey, PhD, CSCS
 Creatine Travis Harvey, PhD, CSCS Overview This is not exhaustive it s applicable Disclaimer BLUF Myths Legends Protective effects Move, Shoot, Communicate Bottom Line Collectively, results from these
HEAT ILLNESS PREVENTION TRAINING. Presented by: Du-All 2018
 HEAT ILLNESS PREVENTION TRAINING Presented by: Du-All 2018 TRAINING GOALS Increase awareness and commitment to safety and health at the work site Review the regulatory language and heat illness preventive
Cold and Heat Emergencies Video Cold & Heat Emergencies
 CHAPTER 20 Cold and Heat Emergencies Video Cold & Heat Emergencies Lesson Objectives 1. Describe the different types of cold and heat emergencies and what you can do to prevent them. 2. Explain factors
API Canada. Table of Contents
 API Canada Doc. Type: Language: Total Pages: Function responsible: Security Level: Derived from: Replaces: WIA EN 1 of 10 Environment Health & Safety 2 Prepared by: Checked by: Approved by: Sunday Sobkiw
Wildland Fire School. Heat Illness Prevention Program
 Monterey County Fire Training Officers Association www.mcftoa.org Heat Illness Prevention Program I. Purpose: The purpose of this program is to provide a safe training environment for attendees and participants
Monitoring of performance an training in rowers
 Monitoring of performance an training in rowers Jaak Jürimäe Demands of the Sport High maximal oxygen consumption (VO 2max ); Ability to perform at a high percentage of VO 2max for the duration of event;
Workplace Heat Illness Prevention
 Workplace Heat Illness Prevention RIT-59 Revision A 08/28/2013 Outline Heat illness Risk factors How the body handles heat Types of heat illness Prevention of heat illness Emergency response procedures
Heat Illness Prevention Program
 Heat Illness Prevention Program Development Services Department City of Turlock January 2011 Scope: California Code of Regulations Title 8, Section 3395 requires employers to comply with the Heat Illness
Fun Run Training Program
 Fun Run Training Program 21km Half Marathon The programs outlined below will highlight the key weekly sessions that need to be completed during your half marathon preparation. Your weekly program structure
Extension is almost done building a new website! Please take a sneak peek or read about our redesign process.
 Extension is almost done building a new website! Please take a sneak peek or read about our redesign process. Horse Extension Managing horses during hot weather Krishona Martinson, PhD Marcia Hathaway,
ADMINISTRATIVE SERVICES MANUAL
 Policies and s Purpose The purpose of this program is to provide guidance for protecting employees from hazards of high heat conditions and to provide information on engineering, administrative and personal
HEAT STRESS Prevention Program
 HEAT STRESS Prevention Program FACTS Although heat-related illness and death are readily preventable, the CDC reports an annual average of 600 Heat related deaths and over 7,000 Heat related illnesses
Working in low oxygen-controlled atmospheres. Risks and Prevention Measures Dr Michel Falcy, INRS FRANCE
 Working in low oxygen-controlled atmospheres Risks and Prevention Measures Dr Michel Falcy, INRS FRANCE Use of low O 2 -controlled atmospheres Nitrogenrefrigerated lorries Cryogenic facilities (sperm banks)
Effective Management Practices to Reduce the Incidence of Ascites in Broilers
 Effective Management Practices to Reduce the Incidence of Ascites in Broilers December 2009 Summary Introduction Ascites is a multi-factorial syndrome caused by interactions between physiological, environmental
Environmental Considerations
 Environmental Considerations I. Hyperthermia a. Heat stress i. Take extreme caution in hot, humid weather ii. Every year athletes die from heat related causes iii. Body temperature must be obtained by
City of Turlock Heat Illness Prevention Procedures for Outdoor Work In accordance with Title 8 CCR Section 3395
 City of Turlock Heat Illness Prevention Procedures for Outdoor Work In accordance with Title 8 CCR Section 3395 ADMINISTRATION Introduction The City of Turlock Safety Committee created the City of Turlock
Muscular Factors Muscular Factors
 2014 IDEA World Fitness Convention Running Secrets to Success: Skills and Drills for Trainers Jason Karp, Ph.D. Run-Fit.com 2011 IDEA Personal Trainer of the Year Cardiovascular Factors Cardiac output
Tailgate Safety Training for Landscaping and Horticultural Services
 Center on Education and raining for Employment & Agricultural Safety Program Ohio State University Columbus, OH 2005 ailgate Safety raining for Landscaping and Horticultural Services Self- Heat Stress
Biology 212: Anatomy and Physiology II Lab #7: Exercise Physiology in Health and Disease
 Biology 212: Anatomy and Physiology II Lab #7: Exercise Physiology in Health and Disease References: Saladin, KS: Anatomy and Physiology, The Unity of Form and Function 7 th (2015) Be sure you have read
Biltmore Challenge 2011 Final Report Draft 1
 Biltmore Challenge 2011 Final Report Draft 1 Michael I. Lindinger, PhD, Dept. of Human Health and Nutritional Sciences, University of Guelph, Guelph, ON, Canada N1G 2W1 Email: mlinding@uoguelph.ca The
The Effect of a Seven Week Exercise Program on Golf Swing Performance and Musculoskeletal Screening Scores
 The Effect of a Seven Week Exercise Program on Golf Swing Performance and Musculoskeletal Screening Scores 2017 Mico Hannes Olivier Bachelor of Sport Science Faculty of Health Sciences and Medicine Bond
Heat Illness Prevention
 Heat Illness Prevention EGUSD Risk Management (916) 686-7775 The why s and wherefores CCR, Title 8, Subchapter 7. General Safety Orders Group 2. Safe Practices and Personal Protection Article 10. Personal
Heat Stress Prevention Written Program Laredo ISD Safety/Risk/Emergency Management Department
 Heat Stress Prevention Written Program Laredo ISD Safety/Risk/Emergency Management Department HEAT STRESSS PROGRAM 2016 LJP/ 1 1.0 Purpose This Heat Stress Prevention Program has been developed to provide
CHAPTER 42 TEMPERATURE EXTREMES: HEAT
 CHAPTER 42 TEMPERATURE EXTREMES: HEAT A. INTRODUCTION... 1 B. CHAPTER-SPECIFIC ROLES AND RESPONSIBILITIES... 1 1. Safety Coordinator... 1 2. Supervisors... 1 3. Employees... 2 4. The Office of Safety,
Marathon Runner Challenge
 Marathon Runner Challenge LT: I can analyze data in order to explain what is causing marathon runners to collapse. 4.1.2d Challenge: A marathon is a 26.2-mile race. People often train for months leading
Accidents and accident prevention
 Accidents and accident prevention What is an accident? 1. Oxford Dictionary An unforeseeable event often resulting in injury. 2. British Safety Council A management error; the result of errors or omissions
Safety Management System. Initial Revision Date: Version Revision No. 02 GENERAL SAFETY HEALTH PROVISION
 Revision Preparation: Safety Mgr Authority: President Issuing Dept: Safety Page: Page 1 of 5 Purpose This program is written to be in compliance with local regulatory requirements and provide directives
Exploring the relationship between Heart Rate (HR) and Ventilation Rate (R) in humans.
 and Ventilation Rate (R) in humans.") Exploring the relationship between Heart Rate (HR) and Ventilation Rate (R) in humans. The Research Question In this investigation I will be considering the following general research question: Does increased
Exploring the relationship between Heart Rate (HR) and Ventilation Rate (R) in humans. The Research Question In this investigation I will be considering the following general research question: Does increased
GENETIC INFLUENCE ON FACTORS OF OXYGEN TRANSPORT
 GENETIC INFLUENCE ON FACTORS OF OXYGEN TRANSPORT Claudio Marconi IBFM-Sect. of Muscle Physiology and Proteome National Research Council Milano, Italy 100 90 80 % s.l. VO 2 max. 70 60 50 40 30 20 10 0 2
A COMPARATIVE STUDY ON RESPIRATORY PARAMETERS BETWEEN SHORT DISTANCE AND LONG DISTANCE SWIMMERS
 A COMPARATIVE STUDY ON RESPIRATORY PARAMETERS BETWEEN SHORT DISTANCE AND LONG DISTANCE SWIMMERS Baghel Priya PhD scholar, LNIPE, Gwalior, M.P., India ABSTRACT The purpose of the study was to find out the
#10 Work Physiology. By : Dewi Hardiningtyas, ST., MT., MBA. Industrial Engineering Dept. University of Brawijaya
 #10 Work Physiology By : Dewi Hardiningtyas, ST., MT., MBA. Industrial Engineering Dept. University of Brawijaya This topic is a discussion of the energy side of using muscles rather than the mechanics/force
Doc #: 1000-AD Revision: - HEAT/COLD STRESS AWARENESS POLICY. Author(s): Tammie Lavoie, John Dunlop
: Tammie Lavoie, John Dunlop") Doc #: 1000-AD-015-0018 Revision: - HEAT/COLD STRESS AWARENESS POLICY Author(s): Tammie Lavoie, John Dunlop TABLE OF CONTENTS REVISION HISTORY... 3 1.0 INTRODUCTION... 4 2.0 PROGRAM FOCUS... 4 3.0 HAZARDS
Doc #: 1000-AD-015-0018 Revision: - HEAT/COLD STRESS AWARENESS POLICY Author(s): Tammie Lavoie, John Dunlop TABLE OF CONTENTS REVISION HISTORY... 3 1.0 INTRODUCTION... 4 2.0 PROGRAM FOCUS... 4 3.0 HAZARDS
Understanding Hatchery Ventilation
 Understanding Hatchery Ventilation By Steve Tweed: Hatchery Specialist, Cobb World Technical Support Team. The importance of good ventilation is taken for granted on the farm but it doesn t always attract
Author of: The Six-Pack Diet Plan: The Secrets to Getting Lean Abs and a Rock-Hard Body Permanently
 Interview with Rehan Jalali, President, Supplement Research Foundation Author of: The Six-Pack Diet Plan: The Secrets to Getting Lean Abs and a Rock-Hard Body Permanently Background Information: According
HEAT INJURIES. MANSCEN Safety Office
 HEAT INJURIES MANSCEN Safety Office OBJECTIVES 1. Know Individual risk factors. 2. Proper Acclimatization. 3. Know types of heat injuries, and first aid. 4. Be able to read and obtain WBGT index. A. INDIVIDUAL
E. Emergency Incident Rehabilitation
 E. Emergency Incident Rehabilitation Review of Injury/Illness: DHS/EMS personnel may be assigned to assist with disasters, exercises, and other emergency operations throughout the United States. This protocol
Clinton County Fire Chief s Association
 Clinton County Fire Chief s Association Emergency Incident Rehabilitation Procedure Adopted: November 2010 INDEX 1. Scope/Purpose 2. Responsibilities 3. Rehabilitation Area Characteristics 4. Rehabilitation
University of Canberra. This thesis is available in print format from the University of Canberra Library.
 University of Canberra This thesis is available in print format from the University of Canberra Library. If you are the author of this thesis and wish to have the whole thesis loaded here, please contact
Changes in a Top-Level Soccer Referee s Training, Match Activities, and Physiology Over an 8-Year Period: A Case Study
 Case Study International Journal of Sports Physiology and Performance, 2011, 6, 281-286 2011 Human Kinetics, Inc. Changes in a Top-Level Soccer Referee s Training, Match Activities, and Physiology Over
ISAF OFFSHORE SPECIAL REGULATIONS Appendix E
 Formatted Page - 72 - APPENDIX E Hypothermia WHAT IS IT? A condition in which exposure to cold air and/or water lowers body core temperature. Death can result from too low a brain and heart temperature.
GEORGIA DEPARTMENT OF CORRECTIONS Standard Operating Procedures IVN Authority: Effective Date: Page 1 of WETHERINGTON/HODGE 4/01/02 8
 GEORGIA DEPARTMENT OF CORRECTIONS Standard Operating Procedures Functional Area: SUPPORT SERVICES/FIRE SERVICES Subject: OCCUPATIONAL SAFETY & HEALTH/REHABILITATION Revises Previous Authority: Page 1 of
LIFETIME FITNESS HEALTHY NUTRITION. UNIT 2 Lesson 14 FLEXIBILITY LEAN BODY COMPOSITION
 LIFETIME FITNESS HEALTHY NUTRITION MUSCULAR STRENGTH AEROBIC ENDURANCE UNIT 2 Lesson 14 FLEXIBILITY LEAN BODY COMPOSITION MUSCULAR ENDURANCE Created by Derek G. Becher B.P.E., B. Ed., AFLCA Resistance
HEAT ILLNESS PREVENTION POLICY
 HEAT ILLNESS PREVENTION POLICY 1 Contents 1 PURPOSE... 3 2 SCOPE... 3 3 ROLES AND RESPONSIBLITIES... 3 4 PROVISION OF WATER... 3 5 ACCESS TO SHADE... 4 6 SITE-SPECIFIC HEAT ILLNESS PREVENTION PROCEDURE...
Effect of airflow direction on human perception of draught
 Effect of airflow direction on human perception of draught J. Toftum, G. Zhou, A. Melikov Laboratory of Indoor Environment and Energy Department of Energy Engineering Technical University of Denmark Abstract
HEAT ILLNESS PREVENTION PROGRAM. Cal/OSHA Web Reference:
 HEAT ILLNESS PREVENTION PROGRAM The California Occupational Safety and Health Act (Cal/Osha) adopted regulation CCR, Title 8, Section 3395 entitled Heat Illness Prevention requiring all employers to take
Best Practice RBI Technology Process by SVT-PP SIMTECH
 Best Practice RBI Technology Process by SVT-PP SIMTECH We define the best practice in RBI as a proactive technology process which is used to formally and reliably optimise the inspection efforts for each