Evaluation of Alternative Life Assessment Approaches Using P-3 SLAP Test Results
|
|
|
- Edgar Hensley
- 5 years ago
- Views:
Transcription

1 Evaluation of Alternative Life Assessment Approaches Using P-3 SLAP Test Results David Mongru, Phil Jackson, Kai Maxfield and Chris Wallbrink Air Vehicles Division Defence Science and Technology Organisation DSTO-TR-2418 ABSTRACT The effect of selecting different airworthiness standards and lifing methodologies on in-service structural life assessments is examined by using the full scale test results from the P-3 Service Life Assessment Program (P-3 SLAP). The effect on structural inspection thresholds and intervals is determined by applying the methods advanced by major international military and civilian airworthiness standards. Different life prediction models are also compared against the P-3 SLAP results and against results from DSTO coupon tests. RELEASE LIMITATION Approved for public release
2 Published by Air Vehicles Division DSTO Defence Science and Technology Organisation 506 Lorimer St Fishermans Bend, Victoria 3207 Australia Telephone: (03) Fax: (03) Commonwealth of Australia 2010 AR June 2010 APPROVED FOR PUBLIC RELEASE
3 Evaluation of Alternative Life Assessment Approaches Using P-3 SLAP Test Results Executive Summary The P-3 Service Life Assessment Program (P-3 SLAP) was an international program conducted between 1999 and Led by the United States Navy (USN), the program consisted of a series of full scale fatigue tests and analyses of the P-3 aircraft in order to determine the remaining structural life of the aircraft. Three other countries participated; Australia, Canada and The Netherlands. DSTO conducted the majority of the Australian technical activities including flight test loads measurement, wing teardown and an empennage full scale fatigue test. As well as these activities DSTO also conducted an interpretation of all the full scale test conducted under the SLAP and produced a Structural Management Plan consisting of the necessary inspections and component life limits for implementation by the RAAF. The DSTO test interpretation process was developed to meet the requirements of FAR , the airworthiness standard selected for the in-service structural management of the RAAF P-3 fleet. The life assessment tools selected by DSTO were common to the other SLAP partners but the processes used to develop inspection intervals, life limits and Individual Aircraft Tracking algorithms were unique to DSTO, in part due to the airworthiness standard selected. During the conduct of the DSTO empennage test an opportunity was taken, by applying an augmented loads sequence, to push the test as far as possible and gather failure data that would not otherwise be possible. At the same time it was known that this test loads augmentation would allow the test results to be used in a Safe S-N analysis as advocated by the UK MoD Def Stan , providing an opportunity for assessing an alternative approach to the airworthiness clearance of the empennage. This report takes the idea of using the P-3 SLAP test results to evaluate alternative airworthiness standards further by also examining USN and USAF methodologies. The aim of this report is to make comparisons of the outcomes derived from the different approaches and comment on any differences and similarities. The comparisons, presented in terms of structural inspection thresholds and intervals for selected critical areas are of interest for both their differences and their similarities. The comparisons can help the RAAF Airworthiness Authority select the most appropriate methodologies for future life assessment tasks. In the final sections of the report results from the life assessments tools used by DSTO in the SLAP test interpretation work are compared to results obtained from alternative models and to the results from a contemporary coupon test program.
4 Authors David Mongru Air Vehicles Division Mr Mongru graduated from RMIT in 1990 with a Bachelor of Aerospace Engineering (Honours). He commenced work at DSTO in 1994 working on loads development and fatigue interpretation for the PC9 fatigue test. He joined the IFOSTP in 1996 performing fatigue analysis of critical components on the aft fuselage of the F/A-18. In 2001 he commenced work on the P-3 SLAP. His primary functions included fatigue test interpretation and provision of technical support to the P-3 empennage test. He is currently working in the airworthiness standards and fatigue mechanisms group. Phil Jackson Air Vehicles Division Philip Jackson graduated from the Royal Melbourne Institute of Technology in 1981 with a Bachelor of Aeronautical Engineering (with Distinction). He spent the next 15 years as an engineering officer with the Royal Australian Air Force in both squadron and staff engineering posts specialising in aircraft structural integrity and fatigue management. In 1988 he completed a Masters of Science in Aerospace Vehicle Design at Cranfield Institute of Technology, UK and from was attached to the Canadian National Research Council, Ottawa, Canada as part of the F/A-18 International Follow- On Structural Test Project. He joined DSTO in 1997 and has been the technical and program lead for the DSTO contributions to the international P-3 Service Life Assessment Program (SLAP). He is currently Head, Helicopter and Transport Aircraft Structural Integrity in the Aircraft Structures Branch of Air Vehicles Division as well as leading the divisional research effort on airworthiness and aircraft design standards.
5 Kai Maxfield Air Vehicles Division Mr Maxfield graduated from RMIT in 2004 with a Bachelor of Aerospace Engineering (Honours). In August 2005 he commenced work with AeroStructures Technologies at DSTO. During this time he had been providing engineering support to the Air Vehicles Division of DSTO, primarily on the RAAF P-3 SLAP. In January 2007, Mr Maxfield joined the Air Vehicles Division, working on Airworthiness Standards and the P-3 SLAP. Since this time, he has also worked as test engineer for the F/A-18 FINAL testing. Mr Maxfield is currently the Australian Technical Representative for the RAF/RAAF C-130J-30 Full Scale Fatigue Test Programme at Marshall Aerospace, UK. Chris Wallbrink Air Vehicles Division Chris Wallbrink graduated in 2005 with a PhD from Monash University in the department of Mechanical Engineering. He then held the position of research fellow at Monash University until the end of 2006 where his research interests included, modelling of fatigue crack growth, infrared NDT technologies and fibre optic corrosion detection devices. He joined DSTO in 2007 in the Air Vehicles Division and is currently conducting research into methods of fatigue crack growth modelling and airworthiness standards.
6 Contents ABBREVIATIONS 1. INTRODUCTION DSTO Test Interpretation The Potential for a Comparison of Different Standards Airworthiness Standards Examined in this Comparison Probabilistic Analysis Comparison of Lifing Methods Post-Test Interpretation Coupon Tests BACKGROUND TO DSTO P-3 SLAP TEST INTERPRETATION Wing and Fuselage Fatigue Test Empennage Testing Scope of DSTO Test Interpretation Work Selection and Calibration of Lifing Tools Follow-up Coupon Testing P-3 CASE STUDIES CRITICAL LOCATIONS AND SPECTRA Critical Locations Wing Spectra Empennage Spectra Spectra Properties TEST INTERPRETATION LIFE CALCULATIONS USING FAR FAR 25 Safe Life and Damage Tolerance Overview Inspection Threshold and Safe Life Economic Threshold Inspection Interval Results FCA301-WEB FCA351-CDN FCA352-PDN FCA375-PSS FCA811-1 and FCA LIFE CALCULATIONS USING DEF STAN Fatigue Evaluation Requirements Safe Life Calculation using Safe S-N Inspection Threshold Inspection Interval Results... 26
7 6. LIFE CALCULATIONS USING JSSG JSSG Durability and Damage Tolerance Overview USAF Approach Inspection Thresholds and Intervals Results USN Approach LIFE CALCULATIONS USING PROBABILITY ANALYSIS Probability Analysis Overview Fatigue Life Variability Variations in Simplicity and the Addition of Crack Growth Results FCA301-WEB FCA351-CDN FCA352-PDN FCA375-PSS LIFE CALCULATIONS USING THE EFFECTIVE BLOCK APPROACH Overview of EBA EBA Life Predictions from P-3 Coupon Test Data EBA Life Prediction from a P-3 FSFT Wing Test Crack P-3 COUPON TEST RESULTS AND LIFE COMPARISON Coupon Test Program Test Purpose Coupon Test Description Test Results Comparison of P-3 SLAP TI Predictions to Coupon Results FCA FCA Evaluation of Coupon and Analytical Results Comparison against Test Interpretation Results for FCA DISCUSSION Comparison of Standards: Safe Life and Inspection Thresholds Scatter Factors Comparison against Fleet Demonstration Comparison of Standards: Inspection Intervals Comparison of Methods: Total Life Comparison of Methods: Crack Growth Life CONCLUSION & APPLICABILITY Conclusion Statement of Applicability REFERENCES... 71
8 APPENDIX A: P-3 CASE STUDIES CRITICAL LOCATIONS A.1. FCA301-WEB A.2. FCA351-CDN A.3. FCA352-PDN A.4. FCA375-PSS A.5. FCA A.6. FCA A.7. FCA APPENDIX B: DCPD CALIBRATION OF P-3 COUPONS APPENDIX C: STRESS INTENSITY SOLUTION FOR KTG = 5 DOUBLE EAR COUPON APPENDIX D: COUPON TEST PROGRAM SPECIMEN DESIGN... 93
9 Abbreviations AC a crit AEB a init /a i a NDI AFGS AFH/AFHRS BL BuNo CA CAR CG CGR CI Config DBI/SST DCPD Def Stan Dia. DLL DoD DNH DSTO DTA EBA FAMS FAR FCA FEM FMS Freq FSFT FS HSS IAT IAW Id in Init Advisory Circular Critical Crack Length Age Exploration Bulletin Initial Crack Length Detectable Crack Length by Non Destructive Inspection Air Force Guide Specification Airframe Hours Butt Line Bureau Number Constant Amplitude Civil Air Regulations Crack Growth Crack Growth Rates Crack Initiation Configuration Data-Base Interface/Spectra Sequencing Tool Direct Current Potential Drop Defence Standard Diameter Design Limit Load Department of Defence Dome Nut Hole Defence Science and Technology Organisation Damage Tolerance Analysis Effective Block Approach Fatigue Analysis of Metallic Structures Federal Aviation Regulation Fatigue Critical Area Finite Element Method Foreign Military Sales Frequency Full-Scale Fatigue Test Fuselage Station Horizontal Stabiliser Station Individual Aircraft Tracking In Accordance With Identity Inches Initial
10 JSSG K N K N-TD ksi K t LH LLTJ L-M Max Mil-Spec MPa NLR No. QF RAAF RH SFH/SFHRS SLAP SLR SMP S-N SRP TI TL UK USA USAF USN V-Stab WS Joint Service Specification Guide Neuber Notch Factor Test Demonstrated Notch Factor 1000 pounds per square inch Stress Concentration Factor Left Hand Low-Load Transfer Joint Lockheed-Martin Maximum Military Specification Mega-pascal National Aerospace Laboratory Number Quantitative Fractography Royal Australian Air Force Right Hand Simulated Flight Hours Service Life Assessment Program Stress-to-Load Ratio Structural Management Plan Stress-Life Sustained Readiness Program Test Interpretation Total Life United Kingdom United States of America United States Air Force United States Navy Vertical Stabiliser Wing Station
11 1. Introduction The Royal Australian Air Force (RAAF) has operated the Lockheed-Martin (L-M) designed P-3 Orion maritime patrol aircraft for many years and in the 1990s, at the time of the formulation of the avionics update program for the aircraft that became Project AIR 5276, concern was expressed about the structural safe life limit then applied to the aircraft and the potential for life extension. In 1999 the Australian Department of Defence along with their counterparts in Canada and the Netherlands joined with the United States Navy (USN) to conduct the P-3 Service Life Assessment Program or P-3 SLAP. The program consisted of a number of full scale fatigue tests (FSFT) and accompanying analyses that would provide an updated fatigue assessment of the aircraft. The P-3 SLAP included full scale tests of the wing, fuselage and empennage at L-M in Marietta, Georgia, USA, a test of the main undercarriage at Vought, USA, and a full scale test of the empennage conducted at the Defence Science and Technology Organisation, (DSTO) in Melbourne, Australia. The two empennage tests resulted from the desire to test both a retired in-service article in its as-manufactured state as well as a recently-refurbished and modified structure. Test Interpretation (TI) was undertaken separately by the individual SLAP partners. The RAAF tasked DSTO to lead the Australian involvement in the P-3 SLAP and to undertake interpretation of the results of all the full scale tests in the program. 1.1 DSTO Test Interpretation The P-3 aircraft was an evolution of the Lockheed Electra which had been designed and certified against Civil Air Regulations (CAR) 4b (the predecessor of Federal Aviation Regulation [FAR] 25). The structure was designed to a fail-safe philosophy, with some components such as the landing gear designed to safe life. As part of the P-3 SLAP, the RAAF elected to update the CAR 4b requirements for in-service management of the RAAF P-3 fleet with FAR Amendment which specified the conduct of a damage tolerance assessment. DSTO conducted the test interpretation in accordance with the FAR requirements and the guidance material from the accompanying Advisory Circular AC C. The TI methodology and results are given in [1]. The TI calculations were then used to develop inservice structural management instructions for the RAAF P-3 fleet consisting of inspection instructions and component life limits. The TI predictions were augmented by a probabilistic analysis of USN fleet data that had just become available as a result of inspections triggered by FSFT failures. The resulting structural management instructions were combined into a document called the Structural Management Plan (SMP) [3]. 1.2 The Potential for a Comparison of Different Standards During the preparation for the DSTO empennage test it was realised that augmented loading would be required in order to exercise the structure sufficiently to produce failures. It was also realised that the generation of any FSFT failure data would then also allow the empennage to be interpreted using the Defence Standard (Def Stan) Safe S-N approach. Subsequent to the DSTO P-3 SLAP FAR based TI work interest existed in the DSTO Airworthiness Standards and Fatigue Methods Task in conducting research to compare the 1
12 timing of the eventual fleet actions such as inspection thresholds and intervals resulting from the application of other international airworthiness standards and their associated lifing methodologies. As a result, a number of critical locations from the P-3 SLAP wing and empennage tests were selected for the calculation and comparison of different airworthiness standards such as Def Stan and the Joint Service Specification Guide JSSG This report presents those results. The aim of this report is to make comparisons of the outcomes derived from the different approaches and comment on any differences and similarities. 1.3 Airworthiness Standards Examined in this Comparison The following airworthiness standards were selected and used in the comparison work. (a) Def Stan This UK Defence Design and Airworthiness Standard requires the calculation of a safe life for all fatigue critical locations and advocates the use of the Safe S-N methodology. Originally selected for a trial on the empennage, it was also able to be applied to the critical wing locations. The standard also gives guidance on how to calculate inspection intervals for inspectable locations post safe life. (b) JSSG This US Department of Defence specification guide provides guidance on both the requirements for, and evaluation of, durability and damage tolerance. It includes both the United States Air Force (USAF) crack growth based approach that originated from the Air Force Guide Specification AFGS and Military Specification (Mil-Spec) 83444, as well as the USN Safe Life assessment approach. The USN approach had been broadly used by L-M in their P-3 SLAP TI work for the USN. Both approaches were selected for study in this report. 1.4 Probabilistic Analysis Concurrent with DSTO s TI work, L-M also conducted interpretation of the P-3 SLAP results for their customer, the USN. As the USN had large numbers of high-life aircraft, their TI findings were very quickly converted into fleet wide inspections of the FSFT identified critical locations. Fleet findings (both cracked and uncracked aircraft) became available and this data was used subsequent to the initial DSTO TI analysis to corroborate or sometimes modify the original calculations of inspection threshold. The differences between predictions and fleet results reflect not only the assumptions and accuracy of the test and test interpretation programs in the areas of loads estimation, spectral content and crack growth tool predictions, but also the accuracy of some of the underlying assumptions of the methodology such as fatigue scatter. 1.5 Comparison of Lifing Methods The life prediction method used in the P-3 SLAP TI work represents a combined approach to crack growth life prediction, ie the total crack growth life is a combination of a crack initiation and a crack growth life. Traditional strain-life and crack growth tools were used as will be explained in Section 2.4. The comparison against the Def Stan advocated Safe S- 2
13 N approach presents an opportunity to compare the P-3 SLAP tools against this stress-life approach. Additionally, the experimental results from the P-3 SLAP tests also offered an opportunity to trial the recently developed DSTO Equivalent Block Approach (EBA) for P-3 type spectra. This is done in Section Post-Test Interpretation Coupon Tests The P-3 SLAP TI process had also envisaged a post-interpretation set of coupon tests using the latest version of the fatigue spectra that were available. This was because the TI had proceeded using life and crack growth prediction tools that had been calibrated using early versions of both the FSFT and RAAF spectra. In some areas the load spectra had changed significantly and it was felt that the TI predictions needed to be confirmed by results from the latest spectra used in the analysis. This report also includes the results from that series of coupon tests run using the spectra from the TI. The experimental results are compared with the previously conducted (truly blind ) predictions for RAAF usage. 3

14 2. Background to DSTO P-3 SLAP Test Interpretation The P-3 SLAP consisted of a number of full scale tests conducted between 2001 and Test running was preceded by loads development, spectra development and test build up activities. All tests suffered failures from fatigue that resulted in TI work, fleet inspections and the development of new wing components with life improvements. 2.1 Wing and Fuselage Fatigue Test The wing and fuselage FSFT, shown in Figure 1, was conducted by L-M at their facility in Marietta, Georgia using a USN 85th percentile spectrum. The FSFT article was a retired USN aircraft which had accrued 10,988 hours of nominally 85th percentile USN usage. Under the USN s fleet Sustained Readiness Program (SRP), numerous components on the left hand (LH) outer wing of the test article were replaced including most of the lower skin panels, front and rear spar webs and lower spar caps. The fuselage and the centre and right hand (RH) outer wings were left unmodified to represent the build state of the RAAF, Canadian and Dutch fleets. A total of 38,000 test hours was applied to the test article. A residual strength test was then conducted and the wing failed at an undiscovered fatigue crack in the centre wing area emanating from a fuel weep hole in a lower wing plank stringer (subsequently referred to as Fatigue Critical Area [FCA] 163). Figure 1: Wing/Fuselage Fatigue Test at L-M 4
15 2.2 Empennage Testing L-M also conducted a test of the empennage using the component from the same aircraft and applying the SRP modification to the tailplane (essentially replacing all tailplane skin structure). A total of hours of testing to the USN 85th percentile spectrum was applied to the test article, however due to schedule constraints certain abrupt manoeuvre loads known to be very conservative in their calculation remained in the spectrum. The structure tested by DSTO consisted of a retired USN empennage that had accumulated 13,289 actual flight hours and 13,112 landings and was of similar age and usage as aircraft in the RAAF fleet. The test article consisted of the aft fuselage behind the rear pressure bulkhead from fuselage station (FS) 1117 to FS 1259, the horizontal stabiliser (including the leading edges and elevators), the vertical stabiliser (including the leading edge) and the dorsal fin aft of FS The control surfaces were considered transition structure and the aft fuselage was attached to a section of the fuselage forward of the FS 1117 production splice that acted as a transition structure between the test article and the test rig. The empennage test rig at DSTO is shown in Figure 2. Very early in the DSTO test program it was recognised that the stress levels in the empennage principal structural elements would mean that the test time needed to generate representative failures would be long. Increasing the spectrum load levels would reduce testing time and also allow exploration of the UK Def Stan Safe S-N concept of variable scatter factor associated with different structural features. The test subsequently applied an aircraft usage based load spectrum for two lifetimes in order to expose any early failures resulting from design flaws, followed by the same load spectrum significantly augmented in load level but with the peak loads clipped to avoid unrepresentative yielding at critical locations. See [2]. The baseline testing phase consisted of 30,000 Simulated Flight Hours (SFH) of fatigue cycling, utilising a load spectrum that was representative of USN 85 th percentile usage, designated as A041B. This spectrum was developed by L-M for their empennage test and was subsequently transformed for use on the Australian test rig with some additional modification of the abrupt manoeuvre loads in order to better match measured flight loads. For the fin, the loading was essentially identical in both tests. During this first phase of testing, the article exhibited a number of failures from poorly designed local details that had also been observed in service aircraft. Whilst this evidence gave comfort that the test was representative of in-service loading, no failures or crack growth was observed in the primary structural elements. The first extended testing phase was then conducted, consisting of 15,000 SFH of testing under the augmented load designated as A041D. For the fin, the level of load increase or augmentation was 1.6 whilst the peak loads were clipped at 1.1 times the peak loads in the original A041B spectrum. At the conclusion of this phase of testing, there was still minimal fatigue damage observed in the primary structural elements. 5

16 Figure 2: DSTO Empennage Fatigue Test A second phase of extended testing designated as damage tolerance testing was then undertaken also using the augmented A041D spectrum. Before cycling commenced artificial damage in the form of saw cuts was inserted into various primary structure elements aimed at gathering crack growth information to supplement the data that had already been obtained from the test. Almost immediately into the damage tolerance testing phase a natural fatigue failure occurred in hidden structure at the base of the RH Vertical Stabiliser (V-Stab) front spar cap and its associated doubler. This failure location was designated FCA811 and the subsequent test article teardown revealed that two cracks existed at this location. The crack that severed the front spar cap originated at a flange runout feature and was designated FCA811-2, whilst a second crack a few inches away, and itself almost at the point of failure originated at a fastener hole common to the spar cap and doubler and was designated as FCA Incidentally, FCA811-1 had been the original, analytically-predicted fatigue critical location for the fin front spar. The above failure resulted in the cessation of V-Stab, rudder and dorsal fin loading; however, cycling of the horizontal stabilisers and aft fuselage continued up until the end of the damage tolerance testing phase of 15,000 SFH. 6
17 Residual strength testing to design limit load (DLL) (which demonstrated the fail safe capacity of the degraded fin structure) and a full teardown and examination of the test article structure completed the test program. A summary of the defects detected throughout the fatigue test and during post-test teardown is in [2]. Apart from the fin front spar, significant failures were generated in the spars and stringers of the horizontal stabiliser, some of which were replicated in the L-M test. 2.3 Scope of DSTO Test Interpretation Work Spectra applied to the SLAP tests were equivalent to USN 85th percentile severe usage. RAAF usage was determined to be broadly similar to average USN usage, but significantly different to the 85th percentile spectrum developed for the tests. The differences were also highlighted by changes (generally refinements and improvements) in the aircraft external loads system throughout the P-3 program. As a result, the TI had to convert test results under the USN 85th percentile spectrum to RAAF average usage. RAAF average usage was also observed to differ between P-3C flying and AP-3C flying (the conversion involved an avionics update to the aircraft during the period ) with the AP-3C usage calculated to be less severe. To maintain commonality with the efforts of L-M and the other SLAP partners, data from L-M on the analysis of the wing/fuselage fatigue test (for which L-M had the lead) such as crack fractography, finite element method (FEM) based stress levels and stress intensity factors were used in the DSTO TI. For the DSTO empennage test, stress intensity values and strain/load relationships were calculated by DSTO. 2.4 Selection and Calibration of Lifing Tools The tools used by all partners for their TI were also a product of early L-M testing and P-3 SLAP community consensus. The FAMS strain-life program [20] was selected for crack initiation calculations and FASTRAN 3.8 (with some modifications by L-M) was used for crack growth analysis. Coupon tests undertaken by DSTO and others during the P-3 SLAP for tools calibration and verification included: (a) Crack growth and fatigue life coupons run by L-M to investigate the effect on life of spectra clipping and truncation. (b) Centre crack coupons run in Canada for L-M to support FASTRAN calibration. (c) Crack growth and fatigue life coupons run by The Netherlands National Aerospace Laboratory (NLR) on behalf of all the P-3 SLAP FMS customers to investigate spectra differences. (d) Coupons run at DSTO to augment the NLR coupons tests for additional FCA locations and other RAAF spectra. (e) Coupons run at DSTO using constant amplitude loading to provide alternative material data to support FAMS calibration investigations. The results of the NLR coupons tests are in [17] whilst the DSTO coupon tests are recorded in [21]. 7
18 2.5 Follow-up Coupon Testing Between the time that the FAMS and FASTRAN tools were initially calibrated and the DSTO TI was completed, the P-3 external loads system, the loads-to-stress relationships at FCAs and the content of the RAAF spectra had all undergone refinements within the P-3 SLAP. As a result, the original DSTO TI plan also envisaged an additional set of coupon tests run using the final TI loads spectra that would provide a post-ti check on the life predictions that were then being used in the SMP to make recommendations for the RAAF fleet management actions. This activity was called a close the circle verification process and, after some delay, this test program was eventually carried out in 2008 and the results are given in Section 9. 8
19 3. P-3 Case Studies Critical Locations and Spectra 3.1 Critical Locations DSTO-TR-2418 The P-3 case studies will be conducted at a selected number of critical structural locations identified during the P-3 SLAP. The lower outer wing FCAs listed below were identified as significant as a result of cracks detected on the P-3 FSFT. Consequently, analysis of these locations was performed within the wing-fuselage TI report [1] and they will also be examined in this report. FCA301-WEB-4 FCA351-CDN-2 FCA352-PDN-1 FCA375-PSS-2 Several empennage FCAs, listed below, were also selected for comparison. These locations were identified in the DSTO empennage TI report [2] as a result of significant cracking on the FSFT. FCA811-1 FCA811-2 FCA886 The location of each of these FCAs and the relevant full scale fatigue test results are presented in Appendix A. Significant amounts of fleet inspection data have been generated by the USN and other P-3 operators and are also included in the Appendix A. More information regarding the inspection programs that were (and continue to be) undertaken is included in [3]. The fleet inspection information was correct as of the time of the publication of [3] which was December Wing Spectra The sequence applied to the P-3 SLAP wing/fuselage test article is referred to as the FSFT spectrum in this report. This spectrum is representative of USN 85 th percentile usage and was applied to the FSFT article for 38,000 SFHRS. RAAF spectra were generated for both P-3C and AP-3C usage. Both RAAF spectra represent average usage, with the P-3C spectrum representing RAAF flying between 1991 and 1999, and the AP-3C spectrum representing flying post the AIR 5276 Project avionics upgrade in circa The wing stress sequences utilised in this report were created by different processes which are summarised below. (a) All FSFT stress sequences at each wing FCA in Sections 4 to 9 were generated by L-M load sequence development software from USN 85th percentile mission criteria and using Phase IIB FEM-based stress-to-load ratios (SLRs). These FSFT sequences were also used in the DSTO wing/fuselage TI. 9
20 (b) The RAAF P-3C and AP-3C wing stress sequences in Sections 4 to 7 were generated using the P-3 SLAP Database Interface and Spectra Sequencing Tool (DBI/SST) [18], using RAAF mission criteria, the Phase IIC loads system and Phase IIB FEM SLRs. This is the case for all spectra except for the sequences used in the FAMS analysis at FCA301 where the Phase IIC loads system with revised touch-and-go criteria was utilised. The revised touch-and-go criteria were found to affect the FAMS analysis for FCAs inboard of WS 140 only. Crack growth analysis was not significantly affected. These RAAF spectra were used in the DSTO wing/fuselage TI and for the coupon tests of Section 9. (c) The RAAF sequence used in Section 8.2 for both the coupon tests and the analysis work was created by L-M sequence development software and initial RAAF P-3C usage criteria using the Phase IIB loads system and Phase II FEM SLRs. Further details regarding stress sequence generation may be found in [1], [17], [18] and [19]. 3.3 Empennage Spectra A number of empennage spectra were developed as part of the P-3 SLAP. The FSFT empennage stress sequences used in the TI and this report were created by factoring bending moments (generated from command actuator loads) by stress-to-load-ratios (SLRs) (generated from measured strain gauge data). Conversely, the RAAF P-3C and AP-3C empennage stress sequences used in the TI and this report were created using the P-3 SLAP Phase IIC loads system, Phase IIB FEM SLRs and the DBI/SST. Further details may be found in [2], [18] and [19]. 3.4 Spectra Properties Basic properties of the FSFT and RAAF spectra described above are presented in Table 1 (from [1] and [2]). Note the difference in landings between the P-3C and AP-3C spectra which reflects the more benign AP-3C spectra. Table 1: Basic Spectra Properties Spectrum Hours No. of Missions Total No. of Landings No. of Touch & Go s No. of Full Stop Landings No. of Pressure Cycles FSFT* 15,000 4,401 23,660 14,767 8,893 7,165 RAAF P-3C 15,292 3,096 11,234 7,214 4,020 4,469 RAAF AP-3C 15,370 2,603 5,808 2,677 3,131 3,495 * Properties apply to wing and empennage FSFT spectra Table 2 provides the properties of the FSFT and RAAF stress sequences for each FCA. Figure 3 to Figure 10 provide stress exceedence plots for each FCA. The sequence properties and the exceedence plots were taken from the TI reports of [1] and [2]. 10
21 Table 2: Stress Sequence Properties for each FCA DSTO-TR-2418 FCA Spectrum Maximum (psi) Minimum (psi) No. of Lines Clipping Levels (psi) FSFT 31,160-5, , RAAF - P-3C 23,928-14,613 2,280,432 - RAAF - AP-3C 25,142-14,788 1,893,782 - FSFT 25,587-12, , RAAF - P-3C 20,102-20,000 2,624,882-20,000 RAAF - AP-3C 19,991-20,000 2,210,278-20,000 FSFT 26,511-11, , RAAF - P-3C 20,749-18,000 2,657,862-18,000 RAAF - AP-3C 20,492-18,000 2,242,944-18,000 FSFT 24,106-14, , * RAAF - P-3C 19,098-20,000 2,599,194-20,000 RAAF - AP-3C 19,174-20,000 2,192,770-20,000 FSFT 25,702-8, , RAAF - P-3C 19,190-17,000 2,416,026-17,000 RAAF - AP-3C 20,415-17,000 2,033,240-17,000 FSFT - U041 25,453-23, ,980 - FSFT - A041B 25,295-23, , FSFT - A041D 27,828-25, , ,828-25,756 RAAF - P-3C 21,411-19, ,260 - RAAF - AP-3C 21,304-19, ,372 - FSFT - U041 22,931-21, ,980 - FSFT - A041B 22,788-21, , FSFT - A041D 25,070-23, , ,070-23,204 RAAF - P-3C 19,289-17, ,260 - RAAF - AP-3C 19,193-17, ,372 - FSFT - U041 10,232-5, ,210 - FSFT - A041B 10,232-5, , FSFT - A041D 15,351-9, , ,351 RAAF - P-3C 8,257-2,826 3,414,144 - RAAF - AP-3C 8,235-3,531 2,417,548 - * Sequences for this FCA used in the EBA and coupon tests sections only 11
22 FCA301: Outer Wing Lower Front Spar at WS 65 FSFT RAAF AP-3C RAAF P-3C 10,000,000 1,000,000 Exceedances/15000hrs 100,000 10,000 1, ,000-10,000-5, ,000 10,000 15,000 20,000 25,000 30,000 35,000 Stress (psi) Figure 3: Exceedance Curves for FCA301 10,000,000 FCA351: Outer Wing Front Spar, Lower Spar Cap and Web FSFT RAAF AP-3C RAAF P-3C 1,000,000 Exceedances/15000hrs 100,000 10,000 1, ,000-15,000-5,000 5,000 15,000 25,000 35,000 Stress (psi) Figure 4: Exceedance Curves for FCA351 12
23 FCA352: Inboard Engine Nacelle, Wing Lower WS156 FSFT RAAF AP-3C RAAF P-3C 10,000,000 1,000,000 Exceedances/15000hrs 100,000 10,000 1, ,000-15,000-10,000-5, ,000 10,000 15,000 20,000 25,000 30,000 Stress (psi) Figure 5: Exceedance Curves for FCA352 10,000,000 FCA361: Outer Wing Lower Front Spar Cap and Panels at WS 209 FSFT RAAF AP-3C RAAF P-3C 1,000,000 Exceedances/15000hrs 100,000 10,000 1, ,000-20,000-15,000-10,000-5, ,000 10,000 15,000 20,000 25,000 Stress (psi) Figure 6: Exceedance Curves for FCA361 13
24 FCA375: Outer Wing Lower Panel 3 - Panel 2/3 Splice at WS 281 FSFT RAAF AP-3C RAAF P-3C 10,000,000 1,000,000 Exceedances/15000hrs 100,000 10,000 1, ,000-15,000-10,000-5, ,000 10,000 15,000 20,000 25,000 30,000 Stress (psi) Figure 7: Exceedance Curves for FCA375 FCA811-1 Spectra Exceedance Plots FASTRAN input including stress factor (1.11) 1,000,000 A041B A041D AP-3C P-3C U ,000 /BM = (+ve BM) or (-ve BM) [E1150R1 data from dat] 10,000 Counts 1, ,000-20,000-10, ,000 20,000 30,000 Stress (psi) Figure 8: Exceedance Curves for FCA
25 FCA811-2 Spectra Exceedance Plots FASTRAN input A041B A041D AP-3C P-3C U041 1,000, ,000 /BM = (+ve BM) or (-ve BM) [E1150R1 data from dat] 10,000 Counts 1, ,000-20,000-10, ,000 20,000 30,000 Stress (psi) Figure 9: Exceedance Curves for FCA811-2 FCA886 Spectra Exceedance Plot FASTRAN input including stress factor (1.21) 10,000,000 A041B A041D AP-3C P-3C U041 1,000, ,000 Counts 10,000 1, ,000-10,000-8,000-6,000-4,000-2, ,000 4,000 6,000 8,000 10,000 12,000 14,000 16,000 18,000 Stress (psi) Figure 10: Exceedance Curves for FCA886 15
26 FCA163-2 FASTRAN Analysis DSTO FASTRAN USN Fracto CGAP Total Flying Hours DSTO-TR Test Interpretation Life Calculations Using FAR FAR 25 Safe Life and Damage Tolerance Overview The RAAF chose FAR [7], the successor of CAR 4b, as the airworthiness standard against which to interpret the P-3 SLAP test results and conduct the durability and damage tolerance evaluation of the structure from which a program containing the necessary structural inspection and modifications and/or replacements could be determined. Guidance on conducting the fatigue and damage tolerance analysis (DTA) was taken by DSTO from the applicable advisory circular, AC C [8]. The advisory circular provides options for the determination of inspection threshold (either by crack growth from a small initial size or the application of a factor, generally of about three, on demonstrated test life) as well as requirements for the treatment of fail-safe and non fail-safe structure. The method chosen for the DSTO analysis used the factored test demonstrated life approach and combined both fatigue life modelling (strain-life based crack initiation to a nominal crack size of inches (1.27mm)) and crack growth analysis (classical linear elastic fracture mechanics) in a total life analysis method. Estimation of inspection intervals used the calculated crack growth period from detectable size to the maximum permissible size under the residual strength criterion divided by a suitable factor. The factor is not specified in [8] but a value of two was chosen in order to be consistent with equivalent US military standards. The method of conducting the durability and damage tolerance analysis and interpreting the test results is shown in Figure 11 and Figure 12. Crack initiation life H thres for multiple load path structure = Total Life / 3 Total Life Crack growth life Crack growth calibration Half-Crack Length (in) H thresh for single load path structure = (H a crit H init )/2 crit Crack length a a NDI H threshold Crack detection on fatigue test Peg to test result H init H NDI Inspection interval = (H crit H NDI )/2 H crit Hours (test + pre-test) Figure 11: Calculation of Inspection Intervals and Thresholds (from [1]) 16
27 FCA - xxx Time to Crack Initiation Kn TD RAAF Average H init FSFT H init RAAF average FSFT Hours Crack length a or 2a a crit a NDI Recurring Inspection Interval RAAF Inspection interval x 2 Hours Figure 12: Conversion of FSFT Test Lives to Lives under RAAF Spectra (from [1]) Inspection Threshold and Safe Life For the calculation of inspection threshold for multiple load path fail safe structure the test demonstrated life option from AC C (paragraph k.(1)(1)) was used with a factor of 3. For single load path or non-fail safe structure the AC C requires an inspection threshold based on crack growth from an initial flaw of maximum probable size. Only one FCA was defined as non-fail safe structure in the DSTO TI. This location was FCA163 from which the wing test finally failed catastrophically under the residual strength load. In the DSTO TI process, the FAR 25-based calculated inspection threshold was called the Safe Life. The safe life was also used as the modification or replacement point for the component or structure in the subsequent SMP if inspection was not deemed viable Economic Threshold As well as the inspection threshold determined from the AC C guidelines, the DSTO TI process also calculated an economic threshold. The economic inspection threshold is defined as the time to an inspectable crack size (hours to both 0.05 and 0.12 were calculated) divided by a factor of 2. This crack initiation life was calculated using the FAMS program [5] and the factor of 2 represents an approximate 1/40 probability (assuming a standard deviation of 0.11). This threshold provided a value in airframe hours in which no more than one wing in the RAAF fleet of 20 aircraft could be expected to have a crack larger than 0.05 or 0.12 and provided the RAAF an opportunity to set an inspection threshold that avoided large and difficult to repair cracks being found. In the development of the SMP this threshold 17
28 option was not taken up by the RAAF. However it is included here in order to provide a comparison with the AC C safe life approach Inspection Interval The inspection interval was defined as the time from the inspectable crack size a NDI to component failure (at a crit ) divided by 2 to allow two opportunities of finding a crack prior to failure. This crack growth life was calculated utilising the FASTRAN program [5]. Two values of a NDI were used, and 0.12, representing bolt hole eddy current and surface scan eddy current techniques respectively. 4.2 Results A summary of the life calculations from the DSTO wing/fuselage and empennage TI reports [1,2] for the selected locations are provided in this section in Tables 3 to10. The results are presented exactly as they are presented in [1,2] and these references should be consulted for further explanation. As per Section 4.1, the total life (TL) can be re-calculated by adding the time to initiation H init (also labled t init )at a=0.05 to the crack growth life from a NDI = (labled as t CG ). The structural configuration of the RAAF fleet and the various fatigue tests were identical at the part number level of all critical locations, however for one empennage location, FCA 886, manufacturing tolerances produced a different radius at the critical detail for the DSTO empennage test and the L-M empennage test and so different test results eventuated FCA301-WEB-4 Table 3: Summary of lives for FCA301-WEB-4 Factored AFHRS Spectrum Economic Threshold Inspection Intervals H init /2 CG Life/2 Total Life Safe Life (AFHRS) (AFHRS) t init +t CG TL/3 (AFHRS) (AFHRS) a = 0.05 a = 0.12 a NDI = 0.05 a NDI = 0.12 FSFT 4,948 6,148 13,430 12,230 36,756 12,252 RAAF AP-3C 5,450 6,800 4,672 2,868 20,245 6,748 RAAF P-3C 4,050 4,650 3,992 2,967 16,084 5,361 18
29 4.2.2 FCA351-CDN-2 Table 4: Summary of lives for FCA351-CDN-2 Spectrum Economic Threshold H init /2 (AFHRS) Factored AFHRS Inspection Intervals CG Life/2 (AFHRS) a = 0.05 a = 0.12 a NDI = 0.05 a NDI = 0.12 Total Life t init +t CG (AFHRS) Safe Life TL/3 (AFHRS) FSFT 9,678 10,968 3,395 2,291 26,147 8,716 RAAF AP-3C 14,500 16,000 5,722 3,593 40,443 13,481 RAAF P-3C 10,000 11,000 4,120 2,437 28,241 9, FCA352-PDN-1 Table 5: Summary of lives for FCA352-PDN-1 Spectrum Economic Threshold H init /2 (AFHRS) Factored AFHRS Inspection Intervals CG Life/2 (AFHRS) a = 0.05 a = 0.12 a NDI = 0.05 a NDI = 0.12 Total Life t init +t CG (AFHRS) Safe Life TL/3 (AFHRS) FSFT 7,531 8,344 1, ,529 6,176 RAAF AP-3C 12,500 13,750 2,806 1,617 30,612 10,204 RAAF P-3C 9,000 9,500 1,978 1,042 21,956 7, FCA375-PSS-2 Table 6: Summary of lives for FCA375-PSS-2 Spectrum Economic Threshold H init /2 (AFHRS) Factored AFHRS Inspection Intervals CG Life/2 (AFHRS) a = 0.05 a = 0.12 a NDI = 0.05 a NDI = 0.12 Total Life t init +t CG (AFHRS) Safe Life TL/3 (AFHRS) FSFT 7,241 11,612 25,780 21,409 66,042 22,014 RAAF AP-3C 9,800 14,900 7,708 5,107 35,016 11,672 RAAF P-3C 7,500 10,300 5,980 4,222 26,959 8, FCA811-1 and -2 The calculation of inspection intervals and thresholds for the empennage locations was not as straight forward as for the wing locations. DSTO needed to develop crack growth stress intensity factors with the help of detailed FEMs (Figure 13 is an example) and the translation between spectra was complicated by the various augmented loads sequences. See Figure 14 for the effect on crack growth and Figure 15 for the determination of test demonstrated K N for FCA811-2 as examples. 19
 0.80 0.70 0.60 0.50 0.40 0.30 a i = 0.005\" a crit (DLL) = 0.")
 FSFT - A041B 97,958 FSFT - A041D 6,251 FSFT - U041 95,537 RAAF P-3C 201,066 0.20 A041D A041B a crit = 0.")
30 Figure 13: Finite Element Model of FCA811-2 at Front Spar Cap Radius Runout 0.90 FCA811-2 Crack Growth Analysis A041D A041B P-3C Crack length, a (in) a i = 0.005" a crit (DLL) = 0.12" Unfactored Flight Hours Spectrum CG Life 0.05 to a crit (DLL) FSFT - A041B 97,958 FSFT - A041D 6,251 FSFT - U041 95,537 RAAF P-3C 201, A041D A041B a crit = 0.12" RAAF P-3C , , , ,000 1,000,000 1,200,000 1,400,000 Flight hours (SFH) Figure 14: Crack Growth Curves for DSTO Empennage Spectra 20
31 FCA811-2 Crack Initiation Life curves (a init = 0.050") 4.5 A041B A041D P-3C 4 Step 1: Converting effective initiation time from hours under A041D test spectrum to A041B Kn K n = 3.05 Step 3: Determine test test demonstrated value for K n Step 4: Determine equivalent initiation time under RAAF P-3C load t 2 Step 2: Add 30,000 SFH for testing using A041B load spectrum 1.5 1,000 10, ,000 1,000,000 Flight Hours (SFH) Figure 15: Crack Initiation Plot for DSTO Empennage Spectra (FCA811-2 example) The results for FCA811-1 are in table 7. For FCA811-2, see table 8, the critical crack size under design limit load was 0.12 and so inspection intervals for a NDI =0.12 are not calculated. Table 7: FCA811-1 Summary of TI analysis results in factored flight hours Factored AFHRS Spectrum Economic Threshold Inspection Intervals H init /2 CG Life/2 Total Life Safe Life (AFHRS) (AFHRS) t init +t CG TL/3 (AFHRS) (AFHRS) a init = 0.05 a init = 0.12 a NDI = 0.05 a NDI = 0.12 FSFT - A041B 15,000 40, ,027 49, ,053 98,684 FSFT - A041D 2,800 8,600 8,096 2,824 21,792 7,264 FSFT - U041 14,600 39, ,579 47, ,357 95,452 RAAF P-3C 39, , , , , ,023 RAAF AP-3C 46, , , , , ,216 21
32 Table 8: FCA811-2 Summary of TI analysis results in factored flight hours Spectrum Economic Threshold H init /2 (AFHRS) Factored AFHRS Inspection Intervals CG Life/2 (AFHRS) a init = 0.05 a init = 0.12 a NDI = 0.05 a NDI = 0.12 Total Life t init +t CG (AFHRS) Safe Life TL/3 (AFHRS) FSFT - A041B 32,500 45,818 48, ,958 54,319 FSFT - A041D 7,000 9,870 3, ,251 6,750 FSFT - U041 32,000 44,850 47, ,537 53,179 RAAF P-3C 81, , , , ,022 RAAF AP-3C 97, , , , , FCA886 The results for FCA 886, for the L-M and DSTO test configurations are given in tables 9 and 10 respectively. Table 9: FCA886 Summary of analysis results in factored flight hours, L-M test configuration Factored AFHRS Spectrum Economic Threshold Inspection Intervals H init /2 CG Life/2 Total Life Safe Life (AFHRS) (AFHRS) t init +t CG TL/3 (AFHRS) (AFHRS) a init = 0.05 a init = 0.12 a NDI = 0.05 a NDI = 0.12 FSFT - A041B 12,000 16,500 12,755 9,675 49,510 16,503 FSFT - A041D 2,750 4,100 2,770 2,013 11,040 3,680 FSFT - U041 5,500 6,865 5,461 4,096 21,921 7,307 RAAF P-3C 13,000 22,500 13,957 10,261 53,913 17,971 RAAF AP-3C 20,000 35,000 23,047 16,759 86,093 28,698 Table 10: FCA886 Summary of analysis results in factored flight hours, DSTO test configuration Factored AFHRS Spectrum Economic Threshold Inspection Intervals H init /2 CG Life/2 Total Life Safe Life (AFHRS) (AFHRS) t init +t CG TL/3 (AFHRS) (AFHRS) a init = 0.05 a init = 0.12 a NDI = 0.05 a NDI = 0.12 FSFT - A041B 103,000-12,755 9, ,510 77,170 FSFT - A041D 16,750-2,770 2,013 39,040 13,013 FSFT - U041 57,500-5,461 4, ,921 41,974 RAAF P-3C 240,000-13,957 10, , ,304 RAAF AP-3C 380,000-23,047 16, , ,698 22
33 5. Life Calculations Using Def Stan Fatigue Evaluation Requirements Def Stan [9] was developed primarily for, and draws experience from, single load path, compact, generally uninspectable structures that are typical of fighter type aircraft. The primary tenet of the standard for fatigue evaluation is that a safe life is firstly calculated for all features deemed susceptible to fatigue. For new aircraft the standard requires that the safe life normally at least equal the specified life (i.e. planned in-service life). Materials selected shall have a good tolerance to damage, and damage tolerance evaluations need to be carried out if a component is vulnerable to damage during service. Inspectable components may remain in service beyond their safe life if; (a) the presence of cracks can be identified with confidence (i.e. the component is inspectable for the types of cracking that are of concern) and (b) inspection intervals are set to provide three chances of inspection prior to residual strength limits being breached. Residual strength limit is normally 1.2 DLL but can be reduced to 1.0 DLL for particular examples where DLL is an extreme case. Leaflet 35 of Volume 1 of [9] states that safe life scatter factors are a minimum of 3.33 on life. Other factors related to test spectrum representivity and loads monitoring are also described. For features with relatively high variability, tests must be underpinned by additional evidence such as analysis and inspections. Construction and use of safe S-N curves is central to the assessment of compliance Safe Life Calculation using Safe S-N Def Stan Leaflet 35 describes the safe S-N approach that may be used to calculate safe lives. The safe S-N method makes allowance for the increase in scatter that occurs with increasing life by factoring a mean S-N curve by life and stress factors and then combining the two resulting curves into a safe S-N curve which is then used as the working curve for fatigue design and evaluation. The safe curve must take the same shape as the mean curve. It must begin at the safe static yield strength, retain the life factor as long as possible, and then transition to the stress factored curve by approximately cycles. The leaflet describes a qualitative approach to producing the safe curve but numerical approaches may also be used. Further guidance on the safe S-N method including the selection of appropriate life and stress factors may be found in Leaflet 35. The mean S-N curves should be generated from representative element tests under constant amplitude loading to represent each of the features where failure may occur. The factors of 2.8 on (geometric) life and 1.49 on stress (mean fatigue limit) are commonly used in order to provide an equivalent to the fixed factor of 3.3 used for 1/1000 probability of failure. However, other factors may be used for different probabilities if desired, see for example Figure
34 Figure 1 Safe S-N and "Factor 2 Equivalent" (95% S-N) Curves for Pinned Lug of Def Stan AMPLITUDE (MPa, net) Safe S-N Curve of Def Stan constructed with factors of 2.8 on life and 1.49 on stress (for 1 in 1000 probability of failure) gives factor of 3 1/3 under typical severity of wingbending loading. 95% S-N Curve constructed with factors of 1.8 on life and 1.25 on stress (for 1 in 20 probability of failure) gives factor of 2.00 under same severity of wing-bending loading E+04 1E+05 1E+06 1E+07 1E+08 ENDURANCE (CYCLES) Mean Life Safe Life 95% S-N Life Figure 16: Example Mean, Safe and Factor 2 Equivalent Curves DSTO has developed a template with an underlying numerical procedure for the creation of safe S-N curves from mean S-N curves which will be described in [4] when published. This report also outlines the procedure for performing a safe S-N analysis which initially involves selecting an appropriate mean S-N curve that is representative of the critical location of interest. The relevant stress sequence is then scaled iteratively until its damage (using Miner s Rule with the mean S-N curve) is equivalent to a (for example) test demonstrated failure time. The safe S-N curve may then be used with the scaled sequence to determine the safe life. In the safe life results which follow, the FSFT total lives provided in Section 4.2 were used as the failure times to which the FSFT sequences were scaled. Once the scaling factors were determined, mean and safe lives were calculated for the FSFT and RAAF P-3C sequences at each FCA. Mean and safe S-N curves have been generated for 7075-T6 aluminium sheet notched coupons with stress concentration factors of 2 and 4 (from [9]). Curves were also developed for a lowload transfer joint specimen made from 7010-T7651 aluminium. These mean and safe S-N curves are shown in Figure
35 Stress Amplitude (ksi) Comparison of Weibull Mean/Safe SN Curves for R= T6 Kt=2 (Mean) 7075-T6 Kt=2 (Safe) 7075-T6 Kt=4 (Mean) 7075-T6 Kt=4 (Safe) Low Load Transfer Joint (Mean) Low Load Transfer Joint (Safe) E+01 1E+02 1E+03 1E+04 1E+05 1E+06 1E+07 1E+08 Number of Cycles (N) Figure 17: Mean and Safe S-N Curves for Different K t Features Inspection Threshold According to Leaflet 36 of [9], the time to first inspection or inspection threshold is normally equivalent to the safe life. Therefore, the calculation of Safe Life using the Safe S-N approach in this section will be used as the inspection threshold under the Def Stan approach Inspection Interval Again according to Leaflet 36, the inspectable life is the time of crack growth from a detectable crack size to a maximum acceptable size. The inspection interval is then the inspectable life divided by a factor of three (assuming monitored structure). Figure 18, taken from [9] shows this concept in graphical form. For this work in this report the detectable crack size is taken from the P-3 SLAP TI definition of 0.05 based on the performance of a bolt-hole eddy current inspection. The selection of maximum acceptable crack size under Def Stan must take into account the considerations listed in Paragraph 5.3 of Leaflet 36, including onset of rapid crack growth, the maximum acceptable repair size or the loss of pressure or leakage. These considerations are satisfactorily covered by the obvious partial failure under limit load criteria from AC C used in the P-3 SLAP TI work and so the maximum acceptable crack size used with the Def Stan based methodology is equivalent to the critical crack size calculated in the P-3 SLAP TI reports. Note that the critical crack sizes were calculated at 1.0 x DLL but remain acceptable under Def Stan in this case as DLL is an extreme event for the P-3. Therefore, based on these considerations, the inspection intervals may be calculated from the P-3 SLAP TI crack growth lives provided in Section 4.2, (ie the P-3 SLAP TI results obtained from using FASTRAN and the full scale test results) divided by three. 25
36 Figure 18: Def Stan Inspection Intervals (from [9]) 5.2 Results For the wing and empennage FCAs Table 11 and Table 12 respectively provide the mean and safe lives for the FSFT and RAAF P-3C sequences based on the TI calculated total lives derived from the FSFT. The safe lives are also equivalent to the inspection thresholds for inspectable structure. For each FCA the calculations of safe life used two alternate safe curves in order to compare the results from two S-N curves that could be considered representative of the feature. The safe curve that requires the smallest scaling on stress would be considered the most applicable; however of interest is that the safe life results produced from the different stress-life curves produced quite similar lives, the biggest difference being 25% for FCA301. Note that the empennage FCAs used the A041B FSFT sequence to determine the scaling factor. Also note that the FSFT mean hours shown in the tables below may not exactly equal the total lives of Section 4.2 because of a lack of precision in the scaling factor. The inspectable lives and resulting inspection intervals are shown in Table 13 and Table 14 for each FCA and sequence. Table 11: Mean and Safe Lives based on Total Lives Wing FCAs FCA Kt Scaling FSFT Lives (Hrs) RAAF P-3C Lives (Hrs) Config. Factor Mean Safe Mean Safe 301-WEB ,756 5,638 78,300 12, WEB-4 LLTJ ,756 7,546 84,746 15, CDN ,147 6,379 90,629 19, CDN ,147 5,899 97,020 18, PDN ,530 4,065 72,720 15, PDN ,530 4,142 78,241 15, PSS ,041 12, ,302 47, PSS-2 LLTJ ,043 14, ,160 45,884 26
37 Table 12: Mean and Safe Lives based on Total Lives Empennage FCAs Kt Scaling A041B Lives (Hrs) A041D Lives (Hrs) RAAF P-3C Lives FCA Config. Factor (Hrs) Mean Safe Mean Safe Mean Safe ,048 41,581 16,162 3,208 1,463, , LLTJ ,167 45,634 24,662 6,195 1,510, , ,957 23,614 9,644 1, , , ,955 24,568 9,461 2, , , US ,510 8,171 1, ,738 34, Aus ,512 30,476 8,381 1,693 1,692, ,475 Table 13: Inspectable Lives and Inspection Intervals - Wing FCAs FCA FSFT (Hours) RAAF P-3C (Hours) Insp. Life Interval Insp. Life Interval 301-WEB-4 26,860 8,953 7,984 2, CDN-2 6,790 2,263 8,240 2, PDN-1 3,466 1,155 3,956 1, PSS-2 51,560 17,187 11,960 3,987 Table 14: Inspectable Lives and Inspection Intervals - Empennage FCAs FCA A041B (Hours) A041D (Hours) RAAF P-3C (Hours) Insp. Life Interval Insp. Life Interval Insp. Life Interval ,054 88,685 16,192 5, , , ,958 32,653 6,250 2, ,066 67, US 25,510 8,503 5,540 1,847 27,914 9, Aus 25,510 8,503 5,540 1,847 27,914 9,305 27
38 6. Life Calculations Using JSSG JSSG Durability and Damage Tolerance Overview The United States DoD Joint Service Specification Guide JSSG 2006 [10] covers all aspects of military aircraft structures including structural strength and durability. This specification guide replaces the USAF Guide Specification AFGS-87221A and the USN MIL-S-8000 series of requirements for fatigue design and evaluation. The result is that both the USAF-originated damage tolerance approach and the USN safe life approach are included in the Guide. The flexibility in JSSG 2006 seems to be such that it allows USAF and US Navy to continue to take their preferred but different approaches. Airframe lifing under JSSG 2006 follows a durability and damage tolerance approach. The guide specification provides a mixture of both design requirements and in-service management (inspection thresholds and intervals) requirements. Ideally all primary and secondary structure should possess sufficient durability to meet the design service life of the aircraft. Durable structure does not preclude cracking, but it must resist fatigue cracking throughout its service life to prevent adverse safety, economic, operational and maintenance costs. A durability limit may be determined through fatigue life analysis with a scatter factor, or via fracture mechanics where a typical initial flaw (i.e ), should not grow to a crack length which would result in functional impairment in two lifetimes. A complete airframe durability test should be performed to demonstrate the structure meets the required service life. Durability testing should occur for two lifetimes under a severe spectrum followed by inspections of critical structure. If structural anomalies occur within two lifetimes of testing, then the deficient structure should either be modified or managed under a safety by inspection program. The durability limit is not utilised to set the in-service inspection requirements. A damage tolerance analysis (DTA) should be undertaken for all safety of flight structure as USAF experience has shown that designing a durable structure is not sufficient to ensure safety of flight [10]. The damage tolerance capability of the airframe should be sufficient for the life of the aircraft and the structure should also possess adequate residual strength in the presence of flaws for specified periods of service usage. All safety of flight structure should be classified as either slow crack growth or fail-safe. Single load path structure without crack arrest features is classed as slow growth structure. Structure with multiple load paths and crack arrest features may be classed as either slow crack growth or fail-safe. Inspection intervals are normally half the minimum period of safe unrepaired service usage depending on the inspectability of the structure. The calculation of inspection intervals for slow growth structure is different to fail-safe structure for which the additional growth in the adjacent element may also be included. One lifetime of damage tolerance testing using a baseline spectrum should be performed to verify crack growth rate predictions and a structural teardown and inspection should occur at the end of such testing. 6.2 USAF Approach The USAF typically derive their in-service management actions from the crack growth-only approach set out under JSSG 2006 Section A3.12 Damage Tolerance. 28
39 6.2.1 Inspection Thresholds and Intervals The P-3 critical areas examined in this report are categorised as multiple load path with crack arrest features and so could be designated as slow crack growth structure or fail-safe structure. Fail safe structure allows the calculation of crack growth time from initial flaw to the crack growth limit to include a period of crack growth in an adjacent member after failure of the primary member. Just how much time is allowed for growth in the secondary member depends upon whether the structure is classified under JSSG rules as multiple load path dependent structure, multiple load path independent structure or crack arrest structure and is a result of different flaw size requirements and allowable degrees of inspectability. Figure 19 provides a diagram showing the calculation of crack growth for fail-safe multiple load path dependent structure. Crack Size Figure 19: Inspection Threshold and Crack Growth for Fail-Safe Multiple Load Path Dependent Structure, from JSSG 2006 [10]. For the P-3 wing, the evidence from the P-3 SLAP TI supporting work was that any growth time post the failure of the primary element was insignificant compared to the total crack growth time. So for the same reasons used in the TI, i.e. avoiding unnecessary complication, and avoiding the possibility of large multi-element cracks, the damage growth limits in this analysis are again restricted to the failure of the primary element. Consequently, under JSSG 2006 the inspection intervals were calculated using a slow crack growth approach. The initial flaws sizes are taken from Table XXX Initial Flaw Assumptions of JSSG 2006 to be a 0.05 corner flaw from a hole for all FCAs except FCA811-2 and FCA886, where a semicircular surface flaw with a depth of 0.12 was assumed (an approximation as JSSG actually calls for a deep flaw). The crack growth intervals (again taken from Section 4.2 and originating from the DSTO P-3 SLAP TI and using FASTRAN) from a init to a crit were divided by 2 and the results are presented in Table 15 for each FCA. 29
40 In the standard USAF approach, the inspection interval for slow growth structure is also the time of the first inspection; see A c and A of [10]. For FCA811-2 there are no inspection intervals in Table 15 as a crit = 0.12, ie the starting crack size in Figure 14 is the same size as the critical crack size. If a DTA had been conducted as part of the aircraft design it could have been expected to lead to a re-design of the part. For in-service structural integrity, this location therefore cannot be managed via a standard USAF DTA approach unless an a ndi less than 0.12 could be justified. In this example, the location is in fact difficult to inspect but might be amenable to eddy current inspection with a smaller a ndi Results The resulting inspection thresholds and recurring intervals using the USAF approach in JSSG 2006 are given in Table 15. Table 15: JSSG 2006 (USAF Approach) Inspection Thresholds and Intervals FCA 301-WEB CDN PDN PSS USN 886 Aus Sequence Crack Growth a init to a crit (AFHRS) Inspection Threshold (AFHRS) Inspection Interval (AFHRS) FSFT 26,860 13,430 13,430 RAAF AP-3C 9,344 4,672 4,672 RAAF P-3C 7,984 3,992 3,992 FSFT 6,790 3,395 3,395 RAAF AP-3C 11,444 5,722 5,722 RAAF P-3C 8,240 4,120 4,120 FSFT 3,466 1,733 1,733 RAAF AP-3C 5,612 2,806 2,806 RAAF P-3C 3,956 1,978 1,978 FSFT 51,560 25,780 25,780 RAAF AP-3C 15,416 7,708 7,708 RAAF P-3C 11,960 5,980 5,980 FSFT A041B 266, , ,027 FSFT A041D 16,192 8,096 8,096 RAAF AP-3C 634, , ,074 RAAF P-3C 665, , ,785 FSFT A041B FSFT A041D RAAF AP-3C RAAF P-3C FSFT A041B 19,350 9,675 9,675 FSFT A041D 4,026 2,013 2,013 RAAF AP-3C 33,518 16,759 16,759 RAAF P-3C 20,522 10,261 10,261 FSFT A041B 19,350 9,675 9,675 FSFT A041D 4,026 2,013 2,013 RAAF AP-3C 33,518 16,759 16,759 RAAF P-3C 20,522 10,261 10,261 30
41 6.3 USN Approach The USN approach traditionally determines life based on the time to initiate a crack. This crack initiation time is then factored by two to derive the safe life. This approach was used by L-M for their test interpretation work for the USN. The safe life is then given a value of 1 or 100% of a Fatigue Life Index in an Individual Aircraft Tracking (IAT) system. For the P-3 SLAP the USN subsequently departed from their traditional IAT approach by adopting a TLI or Total Life Index approach using FASTRAN as the life calculation tool. In this section, safe lives are calculated for the P-3 wing FCAs only. The determination of the crack initiation life at follows the same process as employed in the wing/fuselage TI report [1] to calculate the 0.05 crack initiation life. Table 16 summarises the crack initiation lives and associated K N values at each FCA for the FSFT spectrum. Note that the FSFT defect information in Table 16 are from Appendix A, the FASTRAN lives were obtained from crack growth curves provided in [1], while the K N values were determined from FAMS fatigue life curves also provided in [1]. The RAAF crack initiation lives (determined from the FAMS fatigue life curves of [1] at the appropriate K N value) and resulting safe lives are provided in Table 17. The inspection intervals determined under the USN approach are consistent with the method used by the USAF, see Table 15 and therefore will not be separately listed. Table 16: Determination of the Test Demonstrated K N (K N-TD ) for 0.010" FSFT FASTRAN FSFT FCA SFHRS Defect Found (t test ) Crack Size when found t a=test t a=0.010 Δt FASTRAN =Δt test (t a=test -t a=0.010 ) t a = (t test - Δt test ) K N-TD 301-WEB-4 38, ,127 9,813 31,314 6, CDN-2 22, ,245 15,217 7,028 15, PDN-2 16, ,656 1,227 4,429 12, PSS-2 48, ,157 6,101 43,056 5, Table 17: JSSG 2006 (USN Approach) Inspection Thresholds (Safe Life) FCA 301-WEB CDN PDN PSS-2 Sequence Life at 0.01 (AFHRS) Safe Life (AFHRS) FSFT 6,686 3,343 RAAF AP-3C 7,850 3,925 RAAF P-3C 5,900 2,950 FSFT 15,585 7,793 RAAF AP-3C 23,700 11,850 RAAF P-3C 16,600 8,300 FSFT 12,356 6,178 RAAF AP-3C 20,500 10,250 RAAF P-3C 15,300 7,650 FSFT 5,932 2,966 RAAF AP-3C 9,450 4,725 RAAF P-3C 7,850 3,925 31
42 7. Life Calculations Using Probability Analysis 7.1 Probability Analysis Overview Many of the initial inspection thresholds calculated in the DSTO P-3 wing/fuselage TI report [1] were considered overly conservative. This assessment was based on known conservatism built into the TI process (i.e. the use of the most severe failure on either the left hand or right hand wing as a peg for the subsequent average life analysis) and the smaller number of cracks than expected that were subsequently found in fleet aircraft which had over-flown the calculated thresholds. An opportunity was therefore identified to extend the inspection thresholds in the P-3 SMP [3] and give relief to the RAAF P-3 fleet. Given the considerable amount of P-3 fleet inspection data available, a probabilistic approach described in [14] was deemed a suitable method for threshold extension. The probabilistic approach was simplistic in its methodology as it assumed the fleet inspection findings (in terms of AFHRS) are log-normally distributed, and that the aircraft inspected are a representative sample of the fleet. From this information it was then possible to determine the probability of cracking in the fleet. Furthermore, if the relative severity between two fleets, fleet A and fleet B, is known, then it is possible to calculate the probability of cracking versus AFHRS for fleet B from the data from fleet A. Care must be taken in this method to ensure that aircraft whose usage is significantly different to the fleet average are not allowed to skew the analysis. Isolated aircraft that have flown an overly severe mission mix (i.e. test flight aircraft) or benign mission mix (i.e. solely VIP flying) should be (and were) excluded from the analysis. From the fleet inspection data the percentage of aircraft with cracks and the average AFHRS of the aircraft with cracks may be calculated for a given FCA. With this data point and the application of an appropriate standard deviation, a plot of cumulative probability versus log AFHRS may be created. This plot will then allow the determination of the AFHRS associated with a given probability such as 1/1000. Alternatively, the probability of cracking may be determined for a selected number of AFHRS. Application of a relative severity factor between two fleets allows the calculation of probabilities versus AFHRS for the second fleet. In the case of the analysis conducted in [3], the USN fleet results had to be converted to results under RAAF severity Fatigue Life Variability Scatter in fatigue is represented by the value of standard deviation of the assumed normal population. Sufficient data was available from a number of FCA locations that had been inspected in the USN fleet to determine their individual standard deviations. Each individual aircraft could be plotted and the slope of the line on the probability graph could be determined. This was done in Reference 26 of the SMP [3], with the majority of the resulting standard deviation values falling between 0.15 and A couple of FCA locations outside this range produced higher and lower values of standard deviation however this was judged to be the result of limited amounts of data. For the majority of the FCA locations examined in [3] the conservative end of the range was used in the subsequent probabilistic based 32
43 calculations of safe life. For locations where a large amount of data was available, and the dome nut holes of FCA352 were an example, the standard deviation value obtained for that particular FCA was used (0.15 in the case of FCA352). Note that these values of standard deviation represent scatter in cracking in a fleet of aircraft. This scatter is made up of two elements, the underlying scatter in material performance, and the scatter in usage severity of the individual aircraft about the fleet mean Variations in Simplicity and the Addition of Crack Growth The most simplified version of the method assumes all cracks are of the same size. This limitation could be overcome with the provision of a suitable crack growth curve. Cracks could then be regressed back to a selected baseline crack length and the associated AFHRS determined. If it is not possible to regress the cracks back to a baseline length, it is conservative to assume that all cracks are equal to the largest crack. From this approach graphs showing Probability of Cracking versus Flight Hours can be produced. The probability of component failure can also be determined. This is done by the addition of the crack growth time from a baseline crack length to the a crit value (calculated using the FASTRAN crack growth curves for the FCA). This then allows Probability of Failure versus AFHRS to be plotted. The probabilistic method and its assumptions are explained in more detail in [6]. Guidance for using the template developed for this analysis may also be found in this reference. The results taken from [3] for the probability analyses for the four lower wing locations (FCA301-WEB-4, FCA351-CDN-2, FCA352-PDN-1 and FCA375-PSS-2) are included below. Analysis was not possible for the empennage locations as fleet inspections programs have not been performed for these locations at this time. Probability analysis was only performed for the RAAF P-3C sequence. As the fleet failure data came from the USN, a value of relative severity between the USN average usage sequence and the RAAF P-3C sequence was generated for each FCA. These calculations were done using FAMS, as the cracks found in the fleet were generally small. 7.2 Results The results for the four wing locations taken from [1] are given in this Section, including probability of cracking (equivalent to the size found in the USN fleet which was generally small) and the probability of failure which included the period of calculated permissible crack growth to a crit. Although the AFHRS to different values of probability of cracking can be derived from the plots (two are shown), only the AFHRS to probability of failure of 1/1000 have been carried forward to the comparison table in Section
44 7.2.1 FCA301-WEB-4 Aircraft Inspected 62 * Inspected Aircraft Log Average AFHRS 15,823 Aircraft with cracks 11 * Largest detected crack 1.5 (regressed to 0.13 ) *USN BuNo was also inspected and found to be cracked in this location. However this is a test aircraft and the flight spectrum is not representative of fleet flying, and therefore was not considered in the analysis. AFHRS where 1/40 probability of cracking occurs 13,602 AFHRS where 1/1000 probability of failure occurs 14,215 Figure 20: FCA301-WEB-4 Probability of Cracking Plot 34

45 Figure 21: FCA301-WEB-4 Probability of Failure Plot 35
46 7.2.2 FCA351-CDN-2 Aircraft Inspected 68 Inspected Aircraft Log Average AFHRS Aircraft with cracks 6 Largest detected crack AFHRS where 1/40 probability of cracking occurs 19,615 AFHRS where 1/1000 probability of failure occurs 15,979 Figure 22: FCA351-CDN-2 Probability of Cracking Plot 36

47 Figure 23: FCA351-CDN-2 Probability of Failure Plot 37
48 7.2.3 FCA352-PDN-1 Aircraft Inspected 101 * Inspected Aircraft Log Average AFHRS 17,241 Aircraft with cracks 45 * Largest detected crack 0.25 (regressed to 0.13 ) *USN BuNo was also inspected and found to be cracked in this location. However this is a test aircraft and the flight spectrum is not representative of fleet flying, and therefore was not considered in the analysis. AFHRS where 1/40 probability of cracking occurs 13,265 AFHRS where 1/1000 probability of failure occurs 12,078 Figure 24: FCA352-PDN-1 Probability of Cracking Plot 38

49 Figure 25: FCA352-PDN-1 Probability of Failure Plot 39
50 7.2.4 FCA375-PSS-2 Aircraft Inspected 12 Inspected Aircraft Log Average AFHRS 18,199 Aircraft with cracks 4 Largest detected crack 0.03 AFHRS where 1/40 probability of cracking occurs 12,780 AFHRS where 1/1000 probability of failure occurs 22,300 Figure 26: FCA375-PSS-2 Probability of Cracking Plot 40

51 Figure 27: FCA375-PSS-2 Probability of Failure Plot (Note: the probability of failure at the defined AFHRS of 13,500 is not calculated) 41
52 8. Life Calculations Using the Effective Block Approach 8.1 Overview of EBA The so-called effective block approach (EBA) has been proposed recently within DSTO to address the experimentally observed growth rates of fatigue cracks at critical locations on F/A-18 airframes, [15] and [16]. It was claimed that the growth of these cracks in structures made of 7050 aluminium alloy could not be adequately predicted using classical models such as Paris law or the plasticity-induced crack closure models based on constant amplitude (CA) crack growth rates (CGR). The EBA approach treats each program block of spectrum load as a single cycle of equivalent crack growth. In essence, this approach replaces the complexity of calculating cycle-by-cycle load sequence effects with a single cycle that incorporates the combined result. The assumption is that the sequence effect will be consistent from block-toblock as the crack grows. The CGR is expressed in a similar equation to that of the Paris law, with two model parameters; the crack growth coefficient (C) and the Paris-like exponent (m) determined by fitting the crack growth rate data obtained from spectrum loading experiments. However, since each individual spectra is equivalent to a unique cycle, these model parameters are expected to be dependent on the particular spectrum and the stress level as well as the geometry and the material through which the crack passes. A procedure was then devised to allow the use of the EBA model parameters obtained under one load spectrum (the tested spectrum) to predict the crack growth under a different load spectrum (the untested spectrum). This procedure relies on the relative severity of these two spectra being determined using an independent third-party model or tool such as FASTRAN. An initial crack size a 0 either needs to be assumed initially, or derived by back projection from the tested spectrum and assumed to be the same for the untested spectrum. The EBA has been shown to produce crack growth curves that correlate well with the experimental results for the F/A-18 cases studied [16]. A full explanation of the EBA may be found in [11]. EBA based predictions using P-3 coupon test data and for a natural crack that developed on the P-3 SLAP wing/fuselage test article are provided in the following sections. 8.2 EBA Life Predictions from P-3 Coupon Test Data NLR conducted a coupon test program [17] to assist with the interpretation of the P-3 SLAP wing/fuselage FSFT for the SLAP customers with average fleet usage different to the USN 85th percentile severe spectra used on the full scale tests (this included Australia). This same coupon data, see Figure 28, was also able to be used to evaluate the effectiveness of the EBA in predicting the total and crack growth lives of the RAAF P-3C FCA361 sequence. FCA361 is very similar in terms of spectra and structural configuration to FCA351, essentially representing the chordwise row of dome nut holes just outboard of the inboard nacelle that mirror the row inboard of the inboard nacelle covered by FCA351 and FCA352. The determination of RAAF EBA lives may be found in [11]. These calculations are repeated in this report, and the predictions are shown graphically in Figure 29 and in Table 18 and Table 19 which contain the total lives and crack growth lives respectively. RAAF P-3C FCA361 lives are provided for averaged coupon data, and for the EBA using three different methods to determine the Paris-like exponent m. The initial crack size of 1.52E-5 m ( ) was obtained using exponential extrapolation of the data obtained under the FSFT spectrum, see Figure
53 The final crack length, a f = 10 mm (0.394 ), was chosen based on the typical final crack length observed from the coupons. 1.0E E E E-04 a (m) 1.0E E E E E-09 RAAF-fca361-a RAAF-fca361-b RAAF-fca361-c RAAF-fca361-d FSFT-fca361-a FSFT-fca361-b FSFT-fca361-c Expon. (RAAF-fca361-b) Expon. (RAAF-fca361-c) Expon. (RAAF-fca361-a) Expon. (RAAF-fca361-d) Expon. (FSFT-fca361-a) Expon. (FSFT-fca361-b) Expon. (FSFT-fca361-c) Simulated Flight Hours Figure 28: Exponential Extrapolation to Evaluate a a (m) RAAF-FCA361-a (167.9MPa) RAAF-FCA361-b (167.9MPa) RAAF-FCA361-c (167.9MPa) RAAF-FCA361-d (167.9MPa) Variable m- m m = mm1,e m = 2 Least Squares Simulated Flight Hours Figure 29: EBA Predictions for RAAF P-3C FCA361 Spectrum using NLR Coupon Data 43
54 Table 18: Comparison of RAAF P-3C FCA361 Total Lives Total life ( a = 10 mm(0.394 )) f (SFH) Difference between the prediction and the RAAF coupon average (%) RAAF Coupon average EBA - Method 1: m % EBA - Method 2: m m1,e % EBA - Method 3: Variable - m % For the inspection interval calculations, an a NDI value of 1.27 mm (0.05 ) is consistent with the value used in the P-3 TI report and represents an effective NDI value for a bolt hole eddy current inspection. Table 19: Comparison of RAAF P-3C FCA361 Crack Growth Lives (Inspection Intervals) Life (1.27 mm 10 mm ( )) (SFH) RAAF Coupon average 7444 EBA - Method 1: 2 Difference between the prediction and the RAAF coupon average (%) m % EBA - Method 2: m m1,e % EBA - Method 3: Variable - m % 8.3 EBA Life Prediction from a P-3 FSFT Wing Test Crack The EBA method was also trialled using a natural crack result from an aircraft structure. On the P-3 SLAP wing/fuselage FSFT article, a crack was found in the outer wing lower panel/cap splice location at WS 220 after 16,785 hours of cycling. This location is designated FCA361-PSS-4. An EBA analysis of this FSFT crack is described in detail in [11] including how the 15,000 hour P-3 FSFT load sequence was split into a number of smaller sub-blocks. A summary of the resulting predictions is shown graphically in Figure 30 and in Table 20 and Table 21 which contain the total lives and crack growth lives (i.e. inspection intervals) respectively. FSFT FCA361-PSS-4 lives are provided for the FSFT, FASTRAN and for the EBA using three different methods of calculating the Paris-life exponent m. Note that the FASTRAN prediction is pegged to the test life and is thus used only as a comparison in the calculation of inspection intervals. 44
55 100 Crack Length, a (mm) c DSTO FSFT QF EBA prediction with m=1.75 EBA prediction with m=2.0 EBA prediction with C & m from coupon data FSFT (FASTRAN Prediction) Expon. (DSTO FSFT QF) 0 5,000 10,000 15,000 20,000 Simulated Flight Hours Figure 30: EBA Predictions of a Crack discovered at FCA361-PSS-4 on the P-3 FSFT Article Table 20: P-3 FSFT FCA361-PSS-4 EBA based total life predictions against fractographic data. Total life (SFH a f = 17 mm) Difference between the FSFT article and EBA predictions (%) FSFT article EBA prediction with m = % EBA prediction with m = % EBA prediction with C and m evaluated from the coupon test data FASTRAN % Pegged to final life Table 21: P-3 FSFT FCA361-PSS-4 crack growth predictions against fractographic data Life (5.7mm 17mm) (SFH) Difference between the FSFT article and EBA predictions (%) FSFT article 2905 EBA prediction with m = % EBA prediction with m = % EBA prediction with C and m evaluated from the coupon test data % FASTRAN % 45
56 9. P-3 Coupon Test Results and Life Comparison 9.1 Coupon Test Program Test Purpose A coupon test program was performed subsequent to the DSTO TI work to provide experimental data against which the analytical results determined in the P-3 TI could be compared. Coupon and analytical results were compared for crack initiation (CI), crack growth and total lives. The coupon testing used the same spectra as the TI. The final versions of the various spectra had not previously undergone coupon testing. The aim of the comparison was to evaluate the accuracy of the TI tools FAMS and FASTRAN and the calibration process performed as part of the TI using early versions of the FSFT and RAAF spectra Coupon Test Description Notched coupons with a K t gross of 5.0 were used in the test program as illustrated in Appendix D. These double ear coupons were made from 7075-T6 aluminium bare sheet. Note that, whilst the coupon drawing specifies a coupon thickness of mm (0.125 ), due to availability of material the coupons were manufactured from sheet with thickness of mm (0.12 ). The coupons were manufactured by Boeing Australia. Coupon testing utilised FSFT and RAAF P-3C and AP-3C sequences representative of stresses at FCA301 and FCA361. These two FCAs are located on the wing front spar lower cap of the P-3, with FCA301 at the root and FCA361 at the outer side of the inboard engine nacelle (see Figure 31). The typical critical features were pin-loaded fastener holes in the spar cap and adjacent spar web or lower panel skin. FCA361 FCA301 Figure 31: Location of FCA301 and FCA361 A test matrix of the coupons is provided in Table 22. The gross stress levels applied to each of the coupons are also included. The Direct Current Potential Drop (DCPD) system [12] was used to monitor crack growth during testing. 46
57 Table 22: FCA Location Coupon Test Matrix Spectrum Spectrum Max Gross Area Stress Cycles ksi MPa Test Freq Hz No. of Coupons FSFT 439, RAAF P-3C 1,102, RAAF AP-3C 935, FSFT 422, RAAF P-3C 1,299, RAAF AP-3C 1,096, Test Results Figure 32 and Figure 34 provide the DCPD measured crack growth data for each of the coupons tested under the FCA301 and FCA361 spectra respectively. These DCPD results were also plotted on a log-linear scale in Figure 33 and Figure 35. The DCPD noise arising from the electrical system has been omitted from the log-linear crack growth plots in order to show only that part of the data that was monotonically increasing. The DCPD system applies a current through the coupon and measures changes in voltage that can be related to the loss of cross-sectional area as the crack grows under cyclic loading. A new multi-part polynomial which converts DCPD voltages to crack lengths was determined as part of the test program and this is described in Appendix B. Note that the crack lengths provided in Figure 32 to Figure 35 represent growth from one side of the notch edge for a double edge crack. Symmetric crack growth was typically observed. A summary of the CI, total and crack growth lives are presented in Table 23 and Table 24 for FCA301 and FCA361 respectively. The coupon test analysis was conducted using the metric system, however to provide consistency with the first part of this report the crack length units have been converted to imperial dimensions. The initiation lives were calculated at crack lengths of 0.05 and 0.12 which are compatible with the a NDI limits used in the TI process. CI lives were not calculated at a crack length of 0.01 as the DCPD system was unable to reliably measure cracks this small. The total lives represent the time to coupon failure or the time to a given crack length. For the FCA301 coupons, total lives were determined for a crack length of 0.12 (3.048 mm) while for FCA361 a crack length of (5 mm) was used. These crack limits were selected so that a common critical crack length could be used for comparison with analytical calculations in the next section which use a constant a crit. The FCA301 crack length is smaller than the FCA361 length because the FCA301 AP-3C coupons contain limited DCPD crack growth data. Crack growth lives are also presented for growth from an initial crack of 0.05 or 0.12 to coupon failure or a given crack size (i.e or ). Once again, the crack lengths in Table 23 and Table 24 represent growth from one side of the notch edge for a double edge crack. 47
58 Crack Length (mm) DCPD Coupon Crack Growth for P-3C FCA301 Spectra P-3C-09 FSFT P-3C-10 FSFT P-3C-11 FSFT P-3C-05 RAAF P-3C P-3C-06 RAAF P-3C P-3C-07 RAAF P-3C P-3C-08 RAAF P-3C P-3C-12 RAAF AP-3C P-3C-14 RAAF AP-3C P-3C-15 RAAF AP-3C a Hours Figure 32: DCPD Based Recorded Coupon Crack Growth for FCA301 Crack Length (mm) DCPD Coupon Crack Growth for P-3C FCA301 Spectra P-3C-09 FSFT P-3C-10 FSFT P-3C-11 FSFT P-3C-05 RAAF P-3C P-3C-06 RAAF P-3C P-3C-07 RAAF P-3C P-3C-08 RAAF P-3C P-3C-12 RAAF AP-3C P-3C-14 RAAF AP-3C P-3C-15 RAAF AP-3C a Hours Figure 33: DCPD Coupon Crack Growth for FCA301 (Log-Linear axes and with noise removed) 48
59 Crack Length (mm) DCPD Coupon Crack Growth for P-3C FCA361 Spectra P-3C-16 FSFT P-3C-17 FSFT P-3C-18 FSFT P-3C-19 RAAF P-3C P-3C-20 RAAF P-3C P-3C-21 RAAF P-3C P-3C-22 RAAF AP-3C P-3C-23 RAAF AP-3C P-3C-24 RAAF AP-3C a Hours Figure 34: DCPD Based Recorded Coupon Crack Growth for FCA361 Crack Length (mm) DCPD Coupon Crack Growth for P-3C FCA361 Spectra P-3C-16 FSFT P-3C-17 FSFT P-3C-18 FSFT P-3C-19 RAAF P-3C P-3C-20 RAAF P-3C P-3C-21 RAAF P-3C P-3C-22 RAAF AP-3C P-3C-23 RAAF AP-3C P-3C-24 RAAF AP-3C a Hours Figure 35: DCPD Coupon Crack Growth for FCA361 (Log-Linear axes with noise removed) 49
60 Table 23: Coupon Crack Initiation, Total and Crack Growth Lives for FCA301 Sequences FCA301 Spectrum FSFT RAAF P- 3C RAAF AP- 3C CI Lives (Hours) Total Lives (Hours) Crack Growth Lives (Hours) Coupon Id 0.05 to 0.12 to Failure 0.05 to 0.12 Failure Failure P-3C-09 92, , , ,547 8,722 14,027 5,304 P-3C , , , ,547 9,590 14,873 5,284 P-3C , , , ,142 9,442 16,699 7,258 Log Ave 106, , , ,781 9,243 15,160 5,881 P-3C , , , ,242 2,350 4,777 2,427 P-3C-06 77,773 80,811 80,811 83,183 3,038 5,410 2,372 P-3C-07 81,094 83,401 83,401 85,823 2,307 4,729 2,421 P-3C-08 56,819 58,860 58,860 60,586 2,042 3,767 1,726 Log Ave 77,653 80,109 80,109 82,333 2,408 4,632 2,215 P-3C , ,167 3,567* 5,404 - P-3C , ,539 5,542* 8,397 - P-3C , , , ,786 5,764 8,677 2,913 Log Ave 160, , , ,828 4,957 7,329 2,913 * Generated as equivalent % of P-3C-15 results due to DCPD failure 50
61 Table 24: Coupon Crack Initiation, Total and Crack Growth Lives for FCA361 Sequences FCA361 Spectrum FSFT RAAF P- 3C RAAF AP- 3C Coupon Id CI Lives (Hours) Total Lives (Hours) Crack Growth Lives (Hours) 0.05 to 0.05 to 0.12 to Failure Failure to Failure P-3C-16 21,628 26,443 28,487 30,841 6,858 9,213 2,043 4,398 P-3C-17 28,435 34,609 37,633 39,820 9,199 11,385 3,025 5,211 P-3C-18 37,664 40,372 42,180 44,700 4,516 7,035 1,818 4,327 Log Ave 28,506 33,306 35,626 38,005 6,580 9,037 2,235 4,629 P-3C-19 36,510 39,863 41,954 42,848 5,444 6,338 2,091 2,985 P-3C-20 42,395 44,674 45,693 47,019 3,299 4,625 1,019 2,345 P-3C-21 42,918 45,224 46,309 47,576 3,391 4,658 1,085 2,352 Log Ave 40,500 43,185 44,610 47,765 3,934 5,150 1,322 2,544 P-3C-22 47,468 51,873 53,863 55,309 6,396 7,841 1,991 3,436 P-3C-23 43,818 47,781 49,532 50,689 5,714 6,871 1,750 2,908 P-3C-24 45,119 49,510 52,504 53,719 7,385 8,600 2,994 4,209 Log Ave 45,443 49,693 51,935 53,204 6,462 7,738 2,185 3,477 51
62 9.2 Comparison of P-3 SLAP TI Predictions to Coupon Results The following sub-sections firstly apply the P-3 wing/fuselage TI process using the P-3 coupons results just described. The crack initiation (CI) and total lives from this analysis will then be compared to those from the coupons to evaluate the effectiveness and robustness of the FAMS and FASTRAN tools used in the original TI process. Analyses will be performed at FCA301 and FCA361. CI lives were calculated in the TI process using the FAMS software and DSTO-developed strain-life data for 7075-T651. DSTO developed two versions of the 7075-T651 strain-life data (dated 6-Jan-05 and 19-Jan-05). Whilst both versions were used in the original TI this inconsistency has been corrected for the current study and the later version of the 7075-T651 strain-life data has been used for all spectra. The possible difference to 7075-T6 is acknowledged but judged insignificant for relative life comparisons FCA361 FASTRAN analyses of the FCA361 FSFT and RAAF spectra are provided in Figure 36 which also includes the DCPD coupon crack growth data. Note that the DCPD crack growth data has again been clipped at a threshold where the DCPD system was deemed to be affected by noise and no longer be measuring crack lengths accurately. The coupon stress intensity solution used in the FASTRAN run is provided in Appendix C. An initial crack length of mm ( ) was determined by pegging the FASTRAN predicted crack growth curve to the average coupon life for the FSFT spectra, while the crack limit (i.e. a crit ) was set to 5 mm (0.197 ). The same initial crack size was then used for all FCA 361 spectra. Table 25 summarises the unfactored crack growth times from the FASTRAN analysis. Table 26 and Table 27 in conjunction with Figure 37 provide the K N-TD as well as the time to crack initiation for a 0.05 and 0.12 flaw respectively. Table 28 and Table 29 provide the unfactored and factored inspection thresholds and intervals for FCA361 respectively. 52
63 Crack Growth for Double Ear Coupon for P-3C FCA361 Spectra Crack Length (mm) P-3C-16 FSFT P-3C-17 FSFT P-3C-18 FSFT P-3C-19 RAAF P-3C P-3C-20 RAAF P-3C P-3C-21 RAAF P-3C P-3C-22 RAAF AP-3C P-3C-23 RAAF AP-3C P-3C-24 RAAF AP-3C FASTRAN FSFT FASTRAN P-3C FASTRAN AP-3C a Hours Figure 36: FASTRAN only analysis v coupon results at FCA361, a i = mm ( ) Table 25: Crack Growth Results for FCA361 a i = a crit = Stress Factor = 1.0 Unfactored Flight Hours Spectrum CG Life CG Life a i to 0.05 a i to 0.12 a i to a crit 0.05 to a crit 0.12 to a crit FSFT 31,093 35,690 38,356 7,263 2,666 RAAF AP-3C 61,186 65,025 66,745 5,559 1,720 RAAF P-3C 42,019 44,900 46,311 4,292 1,411 Table 26: Determination of the Test-Demonstrated K N (K N-TD ) for 0.05" FSFT FASTRAN FSFT K N-TD SFHRS Defect Found (t test ) Crack Size when found t a=test t a=0.050 Δt FASTRAN =Δt test (t a=test -t a=0.050 ) t a = (t test - Δt test ) , ,093 31, ,506 Table 27: Determination of the Test-Demonstrated K N (K N-TD ) for 0.12" FSFT FASTRAN FSFT K N-TD SFHRS Defect Found (t test ) Crack Size when found t a=test t a=0.120 Δt FASTRAN =Δt test (t a=test -t a=0.120 ) t a = (t test - Δt test ) , ,093 35,690-4,597 33,103 53
64 6.5 FCA361 Double Ear Coupon FSFT RAAF AP-3C RAAF P-3C 6 Stress Factor = K n 4.5 K N-TD(0.05) = K N-TD(0.12) = ,000 10, ,000 1,000,000 SFHRS Figure 37: FAMS Fatigue Life Curves for FCA361 Table 28: Summary of the Unfactored Results for FCA361 Spectrum Δa to 0.05 Δa to 0.12 Unfactored Flight Hours CG Life Δa = 0.05 to a crit CG Life Δa = 0.12 to a crit 0.05" Crack Initiation (H init-0.05 ) 0.12" Crack Initiation (H init-0.12 ) FSFT 9,487 14,084 7,263 2,666 28,506 33,103 RAAF AP-3C 15,769 19,608 5,559 1,720 54,500 69,200 RAAF P-3C 12,311 15,192 4,292 1,411 36,500 47,100 Table 29: Summary of Economic and Safety Thresholds for FCA361 Factored AFHRS Spectrum Economic Threshold Inspection Intervals H init /2 CG Life/2 Total Life Safe Life (AFHRS) (AFHRS) t init +t CG TL/3 (AFHRS) (AFHRS) a = 0.05 a = 0.12 a NDI = 0.05 a NDI = 0.12 FSFT 14,253 16,552 3,632 1,333 35,769 11,923 RAAF AP-3C 27,250 34,600 2, ,059 20,020 RAAF P-3C 18,250 23,550 2, ,792 13,597 In Figure 38 the crack initiation results from the coupon tests are compared to the FAMS predictions for the FCA361 spectra. Coupon results are provided for a 0.05 crack determined via DCPD measurements. The coupon data is plotted at the K N determined from Figure 37 for a crack of
65 4.25 K N-TD(0.05) = FCA361 Double Ear Coupon FSFT RAAF AP-3C RAAF P-3C FSFT Coupon AP-3C Coupon P-3C Coupon Stress Factor = K n , ,000 1,000,000 SFHRS Figure 38: Comparison Plot of Coupon Data and FAMS Results for FCA361 Figure 39 and Figure 40 compare the crack growth from the coupon data and FASTRAN for FCA361 for the RAAF P-3C and AP-3C spectra respectively, facilitating a comparison of coupon crack growth versus FASTRAN prediction. In each case the FASTRAN curve has been shifted on the x axis to align with the coupon failure time to allow better comparison of the shape of the FASTRAN curve with the coupon data. The comparison shows a good match between experiment and prediction down to about 1 mm (0.040 ) 8 Crack Growth for Double Ear Coupon for FCA361 P-3C Spectrum 7 P-3C-19 RAAF P-3C P-3C-20 RAAF P-3C a 6 P-3C-21 RAAF P-3C FASTRAN P-3C Crack Length (mm) Hours Figure 39: Comparison Plot of Coupon Data and FASTRAN Results for RAAF P-3C at FCA361 55
66 Crack Growth for Double Ear Coupon for FCA361 AP-3C Spectrum 8 7 P-3C-22 RAAF AP-3C P-3C-23 RAAF AP-3C a 6 P-3C-24 RAAF AP-3C FASTRAN AP-3C Crack Length (mm) Hours Figure 40: Comparison Plot of Coupon Data and FASTRAN Results for RAAF AP-3C at FCA361 Figure 41 compares the crack growth results from the FCA 361 coupon tests with the total life prediction from the combined FAMS and FASTRAN tools thus replicating the P-3 SLAP TI methodology. FASTRAN crack growth is plotted from 0.05 to failure commencing at the FAMS initiation lives for a 0.05 crack provided in Table 28. Crack Growth for Double Ear Coupon for P-3C FCA361 Spectra P-3C-16 FSFT P-3C-17 FSFT P-3C-18 FSFT P-3C-19 RAAF P-3C P-3C-20 RAAF P-3C P-3C-21 RAAF P-3C a Crack Length (mm) P-3C-22 RAAF AP-3C P-3C-23 RAAF AP-3C P-3C-24 RAAF AP-3C FASTRAN FSFT FASTRAN P-3C FASTRAN AP-3C mm (0.05") Hours Figure 41: Comparison of combined FAMS & FASTRAN total life predictions to the coupon crack growth for FCA361 56
67 9.2.2 FCA301 FASTRAN analysis of the FCA301 FSFT and RAAF spectra is provided in Figure 42 which also includes the DCPD coupon crack growth data. Note that the DCPD crack growth data has again been clipped at a threshold where the DCPD system was deemed to no longer be measuring crack lengths accurately. The coupon stress intensity solution used in the FASTRAN run is provided in Appendix C. An initial crack length of ( mm) was determined by pegging the FASTRAN prediction to the results for the FSFT spectra and then using the same a i for each of the other spectra. The crack limit (i.e. a crit ) was set at 0.12 (3.048 mm). 8 DCPD Coupon Crack Growth for P-3C FCA301 Spectra P-3C-09 FSFT Crack Length (mm) P-3C-10 FSFT P-3C-11 FSFT P-3C-05 RAAF P-3C P-3C-06 RAAF P-3C P-3C-07 RAAF P-3C P-3C-08 RAAF P-3C P-3C-12 RAAF AP-3C P-3C-14 RAAF AP-3C P-3C-15 RAAF AP-3C FASTRAN FSFT FASTRAN P-3C FASTRAN AP-3C a Hours Figure 42: Coupon FASTRAN Analysis at FCA301 Table 30 summarises the unfactored crack growth times from the FASTRAN analysis. Table 31 in conjunction with Figure 43 provides the K N-TD as well as the time to crack initiation for a 0.05 flaw. Table 32 and Table 33 provide the unfactored and factored inspection thresholds and intervals for FCA301 respectively. Table 30: Crack Growth Results for FCA301 a i = a crit = 0.12 Stress Factor = 1.0 Unfactored Flight Hours Spectrum CG Life CG Life a i to 0.05 a i to 0.12 a i to a crit 0.05 to a crit 0.12 to a crit FSFT 109, ,238 5,421 - RAAF AP-3C 607, ,489 3,395 - RAAF P-3C 215, ,828 2,355-57
68 Table 31: Determination of the Test-Demonstrated K N (K N-TD ) for 0.05" FSFT FASTRAN FSFT K N-TD SFHRS Defect Found (t test ) Crack Size when found t a=test t a=0.050 Δt FASTRAN =Δt test (t a=test -t a=0.050 ) t a = (t test - Δt test ) , , , , FCA301 Double Ear Coupon FSFT RAAF AP-3C RAAF P-3C 5 Stress Factor = K n 3 KN-TD(0.05) = , ,000 1,000,000 10,000,000 SFHRS Figure 43: FAMS Fatigue Life Curves for FCA301 Table 32: Summary of the Unfactored Results for FCA301 Spectrum Δa to 0.05 Δa to 0.12 Unfactored Flight Hours CG Life Δa = 0.05 to a crit CG Life Δa = 0.12 to a crit 0.05" Crack Initiation (H init-0.05 ) 0.12" Crack Initiation (H init-0.12 ) FSFT 7,537 12,958 5, ,546 - RAAF AP-3C 10,229 13,624 3, ,000 - RAAF P-3C 6,884 9,239 2, ,000 - Table 33: Summary of Economic and Safety Thresholds for FCA301 Factored AFHRS Spectrum Economic Threshold Inspection Intervals H init /2 CG Life/2 Total Life Safe Life (AFHRS) (AFHRS) t init +t CG TL/3 (AFHRS) (AFHRS) a = 0.05 a = 0.12 a NDI = 0.05 a NDI = 0.12 FSFT 53,273-2, ,967 37,322 RAAF AP-3C 147,000-1, ,395 99,132 RAAF P-3C 91,500-1, ,355 61,785 58
69 Figure 44 compares the crack initiation results from the coupon tests and the FAMS predictions for FCA301. Coupon results are provided for a 0.05 crack. In each plot the coupon data K N is determined by pegging the log average FSFT coupon result (for a 0.05 crack) to the FAMS FSFT curve. 3 FCA301 Double Ear Coupon FSFT RAAF AP-3C RAAF P-3C 2.75 FSFT Coupon AP-3C Coupon P-3C Coupon 2.5 K N-TD(0.05) = 2.31 Stress Factor = K n , ,000 1,000,000 10,000,000 SFHRS Figure 44: Comparison Plot of Coupon Data and FAMS Results for FCA301 Figure 45 compares the crack growth results from the FCA 301 coupon tests with the total life prediction from the combined FAMS and FASTRAN predictions as conducted by the P-3 SLAP TI methodology. FASTRAN crack growth is plotted from 0.05 to failure commencing at the FAMS initiation lives for a 0.05 crack provided in Table
70 Crack Length (mm) a DCPD Coupon Crack Growth for P-3C FCA301 Spectra P-3C-09 FSFT P-3C-10 FSFT P-3C-11 FSFT P-3C-05 RAAF P-3C P-3C-06 RAAF P-3C P-3C-07 RAAF P-3C P-3C-08 RAAF P-3C P-3C-12 RAAF AP-3C P-3C-14 RAAF AP-3C P-3C-15 RAAF AP-3C FASTRAN FSFT FASTRAN P-3C FASTRAN AP-3C mm (0.05") Hours Figure 45: Comparison of combined FAMS & FASTRAN total life predictions to the coupon crack growth for FCA Evaluation of Coupon and Analytical Results The FAMS, FASTRAN and combined FAMS and FASTRAN approaches to the prediction of the experiments under the FCA 361 spectra appear to be satisfactory. The same can be said for the FASTRAN predictions of the established crack growth for the FCA 301 spectra; however there appears to be a significant discrepancy between the FAMS prediction for the FSFT spectra at FCA 301 and the coupon experiment. Whilst the relative lives between the P-3C spectra and the AP-3C spectra appear consistent, there is a significant inconsistency between these results and the results for the FSFT spectra. Essentially the relative severity or order of failure between the FSFT spectra and the other two spectra is not correct. As a consequence the results from the FASTRAN-only life predictions and the combined FAMS and FASTRAN total life predictions are significantly different to the experiments. So what went wrong with the FAMS prediction for FCA301? This issue needs further study. Initial exploration regarding alternate equivalent strain equations and strain-life material curves has not provided a magic bullet solution and so more in-depth investigations are necessary. It is noted that the difference between the first RAAF spectra used early on in the TI process to verify the FAMS calibration and the later versions used to generate the final results was greater for FCA301 than FCA361. It is also noted that the difference between the FSFT spectra and the RAAF spectra is more marked for FCA 301 than for FCA 361, particularly in mean stress. To assist with the future investigations further coupon tests were run at a higher stress level. The stress augmentation chosen was a factor of 1.3, equivalent to the level used in the original P-3 SLAP coupon tests for FCA 301. Figure 46 shows this data and in this figure the coupon results are now pegged to the FSFT FAMS predictions at the higher stress level, with the coupon test results for the lower stress level placed a factor of 1.3 lower on the K n 60
71 scale. The coupon tests confirm that the FAMS prediction of a cross-over in severity between the FSFT spectra and the RAAF P-3C spectra does not occur at the stress levels tested. Recent coupon results from the current P-3 Group could fill in more of the picture but so far only the FSFT spectra has been tested. 5.5 FCA301 Double Ear Coupon experiment v FAMS predictions FSFT K N-TD(0.05) = 4.93 RAAF AP-3C (Ph2C) RAAF P-3C (Ph2C) FSFT Coupon AP-3C Coupon (Ph2C) P-3C Coupon (Ph2C) FSFT Coupon - scaled up 30% K n 3 K N-TD(0.05) = 3.79 P-3C Coupon (Ph2C) - scaled up 30% ,000 10, ,000 1,000,000 10,000,000 SFHRS Figure 46: Coupon tests at two stress levels with data pegged to FSFT predictions at upper stress level Comparison against Test Interpretation Results for FCA301 The change in RAAF spectra between the early loads system used at the time of the FAMS and FASTRAN tool calibration work and the loads system used to generate the final TI sequences reflected L-M efforts to correct and adjust the ground loads in particular to better match flight test data. At FCA301 the changes were significant enough to suggest that many of the in-service spectra were now more severe than the spectra that had been applied to the FSFT in the centre wing area. This is obvious if one compares the relative severity (relative crack initiation lives) between the FSFT and early RAAF P-3 spectra for FCA301 from [20] (relative severity = 1:1.5) with the FSFT and later RAF spectra from the TI for FCA301-CSS-1 (relative severity = 1:0.71) As well as pointing to the fact that the FSFT article was probably being under-tested relative to fleet damage accrual, this significant change in severity of the RAAF sequences from that used for FAMS verification to that used in the final TI results reaffirmed the need to check that FAMS could in fact predict that change. If one considers the lower batch of coupon results plotted in Figure 46, these coupons were run at the same stress levels and spectra used in the TI analysis. Plotting the coupon results at a K n value of 3.79 is in fact broadly consistent with K n values used in the various critical features in the centre wing area and consistent with the K n-td value derived from the FCA361 61
72 coupons of Additionally, the theoretical value of K n for the coupon design is between 3.84 and 3.57 depending upon the formula used, see [22]. Comparing the relative spectra severity (as represented by CI life) for a typical TI analysis feature at FCA301 against the recent coupon results, we can see that in fact the relative lives are in very good agreement, see Table 34. Table 34: Relative lives for TI FAMS predictions and coupons under FCA301 spectra Spectrum Crack Initiation for FCA301-CSS-1 Kn = 3.75 FAMS Relative life prediction Coupon test results Crack initiation Relative life FSFT ,546 1 RAAF P-3C , RAAF AP-3C 60, , These results therefore suggest that the FAMS predictions made in the TI regarding the relative crack initiation lives are now supported by experiment. What remains, therefore, is the confusion that can occur during the life pegging process when the coupon lives cause the resulting K n-td value to depart significantly from the anticipated theoretical value. This can been seen for the coupon results for FCA301 were the coupon lives were between times longer than the lives being experienced on the FSFT for the same spectra and stress level. Whilst this difference in life can be explained by different manufacturing processes on an equivalent configuration hole, the resulting shift of K n from an anticipated value of about 3.75 to a value of 2.31, compounded by the cross-over of FAMS predicted spectrum severity has played havoc with the pegged total life process. 62
73 10. Discussion 10.1 Comparison of Standards: Safe Life and Inspection Thresholds Table 35 presents the safe lives or inspection thresholds for the RAAF P-3C spectrum derived from the different airworthiness standards and their associated life prediction methodologies examined in this report. Table 35: RAAF P-3C Inspection Thresholds/Safe Lives FCA FAR 25 Total life/3 as per SLAP TI DSTO Economic Fatigue life to /2 Def Stan $ Life using Safe S-N process JSSG 2006 USAF Crack growth from / 2 JSSG 2006 USN Fatigue life to / 2 Probability Analysis 1/1000 probability from Fleet failure data 301-WEB-4 5,361 4,050 12,026 3,992 2,950 14, CDN2 9,414 10,000 18,599 4,120 8,300 15, PDN-1 7,319 9,000 15,021 1,978 7,650 12, PSS-2 8,986 7,500 47,201 5,980 3,925 22, ,023 39, , , ,022 81, , USN 17,971 13,000 34,306 10, Aus 169, , ,475 10, $ Safe lives provided for material configuration which produced lowest stress scaling factor For the wing FCAs, the first thing to notice is that the FAR 25 based thresholds are not very different to the DSTO economic threshold, implying a ratio of crack initiation (0.050 ) to total life of about two thirds. The Def Stan based safe lives are on the whole higher, with the calculation for FCA375 considerably higher. The USN calculations of safe life, based on crack initiation to 0.010, are comparable to the FAR based values in two out of the four FCAs but considerably shorter for the other two FCAs. The USAF preferred method of calculating inspection thresholds via crack growth from produced significantly shorter values than those from the FAR approach used in the DSTO P-3 SLAP TI. For the empennage locations, the Def Stan and FAR based calculations are comparable for the RAAF spectra. The JSSG 2006 crack growth-based calculations are significantly different Scatter Factors In its Section 7, FAR C lays out a methodology for determining the appropriate scatter factor for a safe life evaluation. With all normal issues accounted for, the minimum scatter factor would be expected to be 3. This value was used in the P-3 SLAP TI. 63
74 From the Def Stan analysis in this report we can see in Table 11 and Table 12 that the safe S-N analysis produced ratios of safe life to mean life of about 5 and 6 for the wing locations and between 6.5 and 12 for the empennage locations. To generate scatter factors of these magnitudes from the standard Def Stan approach and using the same probability of 1 in 1000 requires the following values of implied standard deviation, σ, backed out from the Bullen equation; Log SF = -t.σ (1+ 1/n) 0.5 using n=2 for one test result, t= (probability of 1/2000 equating to 1/1000 for two components per aircraft) and SF = 6, then the standard deviation σ= This value can be compared to the values of standard deviation of between 0.15 and 0.18 obtained from the in-service fleet inspection data used in the probability approach of Section 8. Given that the values of standard deviation from the probabilistic data include a component of individual aircraft variability about the fleet mean, this suggests that the implied standard deviation resulting from the application of the safe S-N method to the wing FCAs is appropriately conservative but possibly overly high Comparison against Fleet Demonstration Being based on measured fleet cracking data, the probability analysis reflects the true loading and spectrum environment of the P-3 fleet as well as the effects of aircraft build quality, maintenance and material performance. All approaches to the determination of safe lives using the DSTO TI process and the results of the FSFT are approximations of that environment. These processes included one or more of the approximations (sometimes deliberately conservative) outlined below; (a) Deliberate conservatism in some elements of the FSFT load spectrum such as flight gust criteria, and aircraft landing response. (b) The use of the earliest crack from either left or right wing rather than perhaps the log mean of the results from two wings. (c) The uncertainties in the predictive abilities of tools such as FAMS and FASTRAN. (d) The conservative performance of FASTRAN under RAAF spectra estimated to be between 0% and 25% based on DSTO P-3 SLAP coupon test results. Whilst the probabilistic analysis itself carries some conservatism in the calculation of safe lives as a result of generally defaulting to the conservative end of the range of standard deviations derived from the fleet data (a value of 0.18 was typically used), the above conservative elements of the TI process still result in fleet data-based values of safe life that are higher than all the prediction approaches. In normal circumstances, fleet-sourced data of cracking beyond a designated safe life point is not usually available, particularly of course for single load path uninspectable structure that exists on fighter type aircraft where such data only arrives from 64
75 the dangerous situation of a complete overestimation of the true safe life 1. Ordinarily, therefore, the amount of conservatism included in the fatigue life estimation for a particular aircraft type is simply not known. In the case of the P-3 SLAP the existence of fleet inspection data is thus a bonus, and in the first case gives comfort that the whole P-3 SLAP testing and analysis process had not led to unconservative life estimation. In the P-3 SLAP TI and SMP processes, the conservatism in the original calculations of inspection threshold in the TI were seen by the operator and regulator as materially and unnecessarily increasing the cost of the maintenance burden. The fleet data was thus used to allow the thresholds to be extended, with the analysis and justification contained in the subsequent DSTO developed structural maintenance plan. An increase in the threshold of about 30% was seen as worthwhile pursuing from a fleet cost of ownership basis. The probabilistics-based extension of calculated inspection thresholds used in the P-3 SLAP SMP would be similarly valid for predictions based on the Def STAN , JSSG (USN) approaches. An inspection extension for the USAF crack growth based approach would not be consistent with its damage tolerance philosophy as that approach links the initial inspection to crack growth from a set Of interest, the Def Stan values are at first glance the closest to the probability analysis results from the fleet failure data, despite the generous scatter factors imbedded in the analysis. A prediction of twice the fleet based safe life value for FCA375 could not be regarded as a safe prediction however Comparison of Standards: Inspection Intervals The following table provides the inspection intervals under the RAAF P-3C spectrum. Table 36: RAAF P-3C Inspection Intervals from 0.05 except for * where a NDI = 0.12 FCA FAR 25 Def Stan 00- JSSG 2006 JSSG USAF USN 301-WEB-4 3,992 2,661 3,992 3, CDN2 4,120 2,747 4,120 4, PDN-1 1,978 1,319 1,978 1, PSS-2 5,980 3,987 5,980 5, , , , , ,533 67, USN 13,957 9,305 10,261* 10,261* 886 Aus 13,957 9,305 10,261* 10,261* The major point of difference is the use of a factor of three in the Def Stan process versus the factor of two used within all the other processes. For FCA 811-2, the JSSG 2006 based approach is affected by the a crit = a NDI issue identified in Section For FCA 866, the different intervals are the result of using different a NDI values. An a NDI of 0.12 is mandated in JSSG 2006 for the FCA 886 surface feature. 1 Another possibility is the removal and continued cycling under test of retired components. 65
76 10.3 Comparison of Methods: Total Life A number of different methods were examined in this report for the prediction of total life; EBA, crack growth from an initial flaw via FASTRAN, and the total life method used in the DSTO P-3 SLAP TI which combined FAMS and FASTRAN predictions. The method of calculating total life followed the TI process, i.e. calibration of tools, pegging to coupon or FSFT results under USN 85th percentile spectra and then prediction of life under RAAF spectra. The predictions for each method can be compared using the recent coupon results and in one case, a crack from the wing/fuselage FSFT. The comparisons are shown in Table 37. Table 37: Comparison of Experimental and Predicted Lives from various methods for FCA361 Experiment Spectra Prediction Method Report Section Experiment Life Analytical Life % diff of anal to Exp. NLR K t =5 FCA361 EBA (m=2) % Coupons RAAF FSFT wing spar cap USN 85% EBA (m=2) % DSTO K t =5 Coupons FCA361 P-3C FCA361 AP-3C FAMS + FASTRAN FASTRAN Only FAMS + FASTRAN FASTRAN only 9.1 and % % % % The comparison of total life to model predictions at FCA361 shows that the EBA performed poorly both for the coupon trial and for the FSFT crack. Difficulties in using the EBA for the P-3C spectra have been noted and reported before in [11] and is a result of the stress level and spectral content of the P-3 load spectra which often results in a period of initiation or slower initial crack growth that is not proportional to the subsequent rate of established crack growth. The simplified crack growth rate equation used by EBA of; da C m B B B K eff where C B and d m B are spectrum-specific material constants in which the block-by-block crack growth life prediction is dependent on a single constant and a single exponent to represent the full genesis and growth history of the crack cannot thus model all types of crack growth seen on the P-3. The necessity of dividing the P-3 15,000 hour spectra into sub-blocks does not prevent an EBA type analysis but does add to the uncertainty associated with the derived rate parameters. One can also conclude from the coupon results shown in Figure 28 that the model derived value of initial crack size is not independent of spectra, a situation contrary to the necessary assumption in the EBA process that initial crack size is spectra and stress level independent. Figure 30 also demonstrates a potentially difficult issue with fractography of cracks in transport aircraft; the significant time period between zero hours and the first reliable fractographic readings. The crack examined here was in fact an early failure under the severe FSFT spectrum. Even so, its analysis necessitated a back 66
77 projection significantly longer than was needed, for example, in the original F/A-18 EBA work, giving rise to questions about the robustness of the a 0 values that are derived as a result. The above observations are valid for one wing location and for FSFT and coupon results for no more than two spectra. Different material and transport aircraft spectra may or may give better fractographic results, but equally, other P-3 wing spectra such as FCA301 also show delayed initiation. The FAMS and FASTRAN predictions in the TI for the final sequences for FCA361 and FCA301 are true blind predictions of the DSTO coupon results that were obtained three years later. The results for FCA361 give confidence in the DSTO TI methodology of a combined FAMS and FASTRAN life prediction for these previously un-tested spectra used in the TI. The FASTRAN-only predictions also show promise, with perhaps the prediction for AP-3C a little outside a desirable 10-20% maximum error band. As the derivation of initial crack size is crucial to the FASTRAN prediction, confidence in the robustness of the FASTRAN-only total life predictions will rest on building confidence in the selection of an appropriate a 0 and the consistent performance of FASTRAN at the very lowest crack growth rates. The results for FCA301 are not included in Table 37 due to the unresolved issues related to the FAMS predictions as discussed in Section 9.3. Whilst that analysis concludes that the latest coupon results verify that the FAMS-derived relative spectrum severities used in the TI are reasonable, the results also expose a significant issue with K n-td pegging and so further work needs to be done to explore the issue Comparison of Methods: Crack Growth Life A comparison of experimental and predicted crack growth lives is provided in Table 38. For the prediction of a crack growth interval, the EBA method performed well for the coupons but less well for the FSFT crack. The method would need to be further examined to see if the result could be improved for this particular situation. The FASTRAN predictions for the P-3C spectra were also good, but for the AP-3C spectra the results suggest an undesirable conservatism consistent with the original concerns regarding the DSTO TI results. The results suggest effort to reduce the conservatism would provide pay-off to the RAAF P-3 fleet. Table 38: Comparison of Experimental and Predicted Crack Growth Lives from various methods Experiment Spectra Prediction Method NLR K t =5 FCA361 EBA (var. Coupons RAAF methods) FSFT USN 85% EBA (var. methods) Report Section Experiment CG Life Analytical CG Life % diff of anal to Exp % % DSTO K t =5 Coupons FCA361 P-3C FCA361 AP- 3C FCA301 P-3C FCA301 AP-3C FASTRAN 9.1 and % FASTRAN % FASTRAN 9.1 and % FASTRAN % 67
78 11. Conclusion & Applicability 11.1 Conclusion The experimental and analytical results available from the P-3 SLAP provided an opportunity to examine the effects of applying different airworthiness standards and their associated different lifing methodologies on in-service structural management actions. The comparison of safe life and inspection threshold calculations showed, perhaps unsurprisingly, considerable variation between approaches. For the wing locations no approach could be regarded as unsafe when compared against fleet data, although the Def Stan result for FCA375 needs further examination and perhaps refinement. The USAF damage tolerance approach based on crack growth from generally provided the shortest inspection thresholds, being less than a third of the FAR 25 values in one case. Given the historical performance of the P-3 and other similar aircraft such as C130, where the structural design is typically multi-load path and the materials used are conventional, early failure from large flaws has not been exposed as an issue for these aircraft and it is hard to see justification for adopting this conservative (and therefore expensive) approach. This is not at odds with the emerging consensus in the structural integrity community that the adoption of damage tolerance has been most successful in controlling aspects of the design of new aircraft such as stress levels and inspectability, but its usefulness as a means of managing legacy conventional multi-load path structures is more limited. For the empennage locations, the application of the augmented load sequence to the test article was successful in that it generated the test failures that were necessary to fully evaluate the life of structure and allow the application of the Def Stan advocated safe S-N approach without the need for supplementary evidence to clear the structure. From the analysis of the empennage failures, the Def Stan and FAR 25 based approaches produced comparable values of Safe Life/inspection threshold and it is likely that if the test was not extended to reveal these failures the resulting inspection burden would have been more extensive in order to cover the otherwise uncertainty in failure location. The major point of difference between the various airworthiness standards with regard to the calculation of inspection intervals is the use by Def Stan of a factor of 3 verses a factor of 2 for the other approaches. The underlying justification for the larger factor in Def Stan could be pursued further with the UK MoD. Certainly the coupon results in the P-3 program suggest that established crack growth has lower scatter than the period of crack initiation. The comparison of the latest coupon results to the earlier predictions of total life for FCA361 confirms that the FAMS and FASTRAN results can be used with confidence in the P-3 SLAP TI for this location. FASTRAN can also be used with confidence for the inspection interval calculations; however the predictions for the AP-3C sequence showed the same 15-30% conservatism that was also seen in some of the original coupon verification work as part of the TI. Improvements to the FASTRAN model and the associated material data would be of help in any program seeking to remove unnecessary in-service maintenance costs. 68
79 The FAMS predictions in the TI for FCA 301 were consistent with experimental results in terms of relative crack initiation life. This is an important result given the significant change in RAAF spectrum severity between the spectra used for initial tool verification and the final spectra used in the TI. However, the K n-td pegging process required significant adjustment in the K n from the anticipated theoretical value in order to accommodate the longer coupon lives and this shift was confounded by the cross-over of the FAMS life prediction curves for the FSFT and RAAF P-3C spectra. Inaccurate total life predictions for the coupons were produced as a result. Initial exploration of the problems has not identified a solution and further investigations are now warranted. The use of FASTRAN as a total life predictor also showed promise but these results need to be balanced against other results provided in [21] which were less consistent. Nevertheless, with improvements to the performance of the model and in the underlying material data at very small crack sizes, it might be possible for FASTRAN to produce reliable total life predictions. The EBA results for total life prediction show that this more simple method is not likely to be suited to the types of stress levels and spectra associated with transport aircraft, although calculations of inspection intervals are more likely to be reliable Statement of Applicability This report provides results of analyses of outputs from the application of a number of lifing standards that have used data relating to P-3 aircraft with a combination of spectra, critical features and stress levels typical for a transport type aircraft. This report demonstrates that alternative approaches (both standards and methods), when applied, have the potential to yield a range of outcomes. Unsurprisingly, these alternative approaches will likely be more conservative, or less conservative, than the baseline result obtained by the original design standard. The level of safety attained by application of any particular combination of standard and method is notional at best; however real cost of ownership and availability benefits or penalties can result from the choice of standard. Selective use of particular features from different standards is not recommended however; as standards have generally been developed, applied, and proven over time as complete packages. Changing or mixing methods from different standards should always be undertaken with the utmost care. While the end result of this comparison is demonstrated differences in hours for Safe or Total Life, Inspection Threshold and Inspection Frequency, there is no attempt to normalise or specifically select input variables to achieve a particular outcome. The demonstrated variation in outputs, when using each standard and method described in this Report, results from an as is interpretation of a standard. Specifically, there is no attempt to achieve a common probability of failure despite DEF STAN and the Probabilistic fleet analysis targeting a notional 1/1000 probability of failure. Nor have the assumptions or judgements permitted by some of the standards, that result in setting of safety factors (etc.), been aligned between the standards (even if this were possible). Consequently, this comparison, at best, demonstrates that there is a potential for differences when using different standards. The results, which are manifested as differences in flight hours to inspection threshold, total life, etc. are by no means absolute; whether they could be considered as indicating differing levels 69
80 of safety relative to each other requires further exploitation of the methods within each standard to assess inherent conservatisms (or non-conservatisms) and their limitations in application. This report does not advocate the use of one airworthiness standard over another for the inservice fatigue life management of military transport aircraft. Equally none of the current tools can be considered best for all situations. Additionally, it should not be presumed that any tool will automatically be satisfactory for any new situation. Assessment in accordance with the methodology of this current work may provide a limited, but useful, comparison with the results from the original design standard and lifing methodology. As more data are collected on platforms it may indeed prove possible to use the methodology of this work more regularly to assess lifing across a number of standards - whence a degree of consistency may provide greater confidence in lifing predictions. Generally, the use of a standard and methodologies compatible with that invoked during design and then adopted as the Certification Structural Design Standard (i.e. in subsequent ADF certification) will be the most appropriate 70
81 12. References 1. P-3C Service Life Assessment Program Australian Test Interpretation Report for the USN Wing/Fuselage/Landing Gear Test Articles, B. Teunisse, M. Phillips, D. Mongru, P. Jackson, E. Matricciani and D. Hartley, DSTO-TR-1929, October P-3C Service Life Assessment Program Australian Test Interpretation Report for the Empennage Test Articles, D. Hartley, P. Jackson, E. Matricciani, B. Teunisse and M. Phillips, DSTO-TR-1856, August Australian P-3 Structural Management Plan, D. Mongru, K. Maxfield, B. Murtagh, E. Matricciani, L. Meadows and P. Jackson, DSTO-TR-1947, December User Guide to the Safe S-N Analysis Chart Template, K. Maxfield and B. Murtagh, DSTO- TR-XXXX, To be published 5. P-3C Service Life Assessment Program User s Guide to using FAMS and FASTRAN, M. Phillips, DSTO-DP-1062, User Guide to the Aircraft Cumulative Probability Chart Template, B. Murtagh and K. Maxfield, DSTO-TR-2332, Federal Aviation Regulations Part 25 - Airworthiness Standards: Transport Category Airplanes, October 1994, Federal Aviation Administration 8. Advisory Circular Damage Tolerance and Fatigue Evaluation of Structure, AC No C, 29 April 1998, Federal Aviation Administration 9. Defence Standard , Design and Airworthiness Requirements for Service Aircraft, Issue 5, 31 January 2007, UK Ministry of Defence 10. Joint Service Specification Guide Aircraft Structures, JSSG-2006, 30 October 1998, US Department of Defense 11. An Evaluation of the Effective Block Approach Using P-3C and F-111 Crack Growth Data, C. Wallbrink, R. Amaratunga, W. Hu, P. Jackson and D. Mongru, DSTO-TR-2195, September Direct Current Potential Drop System Evaluation for 7075-T6 Notched and Centre Crack Growth Coupons, D. Mongru, DSTO-DP-1110, January Metallic Materials Properties Development and Standardization (MMPDS), R. Rice, J. Jackson, J. Bakuckas and S. Thompson, DOT/FAA/AR-MMPDS-01, US Department of Transportation Federal Aviation Administration, January Forecasting the Risk of Fleetwide Fatigue Cracking in Aircraft Structure, E.K. Walker, Workshop Notes for RAAF and AMRL, May
82 15. Fatigue Assessment of the F/A-18 Horizontal Stabilator Spindle, M. McDonald and L. Molent, DSTO-TR-1620, Assessment of Fatigue Crack Growth Prediction Models for F/A-18 Representative Spectra and Material, M. McDonald, L. Molent and A.J. Green, DSTO-RR-0312, Results of the FMS Spectra Coupon Test Program Performed within the framework of the P-3C Service Life Assessment Program, R.P.G. Veul and L.C. Ubels, NLR-CR , December P-3C SLAP Load DataBase and Spectra Sequencing Tool (DBI/SST) DSTO Validation, E. Matricciani and P. Jackson, DSTO-TR-1720, June Development of the RAAF P-3C Fatigue Sequences for the P-3 Service Life Assessment Program (SLAP) Test Interpretation Part 1 and 2, E. Matricciani and P. Jackson, DSTO- TR-1704, May Computer Programs and Methodology used for DSTO P-3C SLAP Test Interpretation, B. Teunisse, M. Phillips, P. Jackson, E. Matricciani, W. Hu, R. Amaratunga, D. Hartley and D. Mongru, DSTO-TR-1834, March DSTO Coupon Testing Documentation in Support of the P-3 SLAP, M Phillips, D. Hartley, R. Amaratunga, DSTO-TR-1765, July Lockheed-Martin Corporation, Fatigue Analysis of Metallic Structure (FAMS) Stress Ratio Effects LG05ER0145, N D-005 CDRL A007, P-3 T/M/S FLMP,
83 Appendix A: P-3 Case Studies Critical Locations A.1. FCA301-WEB-4 DSTO-TR-2418 FCA301-WEB-4 is located on the lower outer wing spar web, and is related to cracking in fastener holes common to the front spar cap, just outboard of the centre wing/outer wing splice. This location is shown in Figure A- 1. FCA301-WEB-4 Up Otbd A A Figure A- 1: Location of FCA301-WEB-4 This location was found cracked on both the LH and RH wings of the FSFT article at wing station (WS) 72. Cracking was detected at the same time (33,298 test hours), however, the RH wing had been subjected to an additional 10,988 AFHRS of pre-test usage. Cracking on the LH wing was more significant with a single edge crack. A summary of the FSFT cracks found at this FCA is provided in Table A-1. Table A-1: FCA301-WEB-4 FSFT Results Finding No. FS WS Hole Dia. (inch) Crack Length (inch) Hours L , R ,988 73
84 Fleet inspections have been undertaken by the USN on 63 aircraft in this region. A very significant crack, measuring 1.5 was found in the lower hole of the web at WS 72. A summary of the fleet cracks found at this FCA (from WS 65 to WS 83) is provided in Table A-2. Table A-2: FCA301-WEB-4 Fleet Inspection Results Fleet Findings (Nov 2005) within FCA301-WEB-4 Aircraft Aircraft Length Source with Inspect. (inch) Cracks Number of Cracks Station Time (AFHRS) USN (20) WS 83 4, WS ,300 19, WS ,409 17, WS 72 17,839 A.2. FCA351-CDN-2 FCA351-CDN-2 is concerned with cracking of the front lower spar cap at the inboard nacelle fillet fairing Dome Nut Hole (DNH) common to the fillet fairing, lower wing panel 1 and the lower spar cap at WS 156. A diagram of this location, illustrating the cracking, is included as Figure A- 2. Front Lower Spar Cap Panel 1 Figure A- 2: Location of FCA351-CDN-2 There was only one crack discovered on the FSFT in this location. This crack was detected during inspections on the RH wing after 22,601 SFHRS (includes 10,988 hours of in-service usage). The test continued without modification, and the crack was monitored and allowed to 74
85 grow. The crack progressed from a 0.15 single edge crack to a 0.72 double edge crack by 27,773 SFHRS when the lower front spar between WS 134 and WS 249 was cut from the structure and a replacement splice was inserted. No cracking was detected on this replacement structure, or the LH wing (38,000 SFHRS). A summary of the crack findings is included in Table A-3. Table A-3: FCA351-CDN-2 FSFT Results Finding No. FS WS Hole Dia. (inch) Crack Length (inch) Hours R ,601 1 Single edge crack continued to grow to a 0.72 double edge crack by the time the RH outer wing front spar lower cap between WS 134 & WS 249 was replaced at 27,773 SFHRS. Fleet inspections at this location have been undertaken by the USN and the RAAF with a total of six aircraft having cracks. These findings are summarised in Table A-4. Table A-4: FCA351-CDN-2 Fleet Inspection Results Fleet Findings (Nov 2005) within FCA351-CDN-2 Aircraft Aircraft Length Source with Inspect. (inch) Cracks Number of Cracks Station Time (AFHRS) USN (3) WS ,854 20,587 USN AEB (3) 41 3 Small 2 WS 155 Unknown Large 1 WS 155 Unknown RAAF S76 (0)

86 A.3. FCA352-PDN-1 FCA352-PDN-1 pertains to the lower wing inboard fillet fairing DNHs on the inboard nacelle located at WS 160. This FCA does not include the first DNH which is common to the front spar cap, as this is covered by FCA351-CDN-2. The location of this FCA is shown in Figure A- 3. Figure A- 3: Location of FCA352-PDN-1 Extensive cracking in this region was discovered on the FSFT after 16,785 hours of testing. Cracking was discovered in both the LH and RH wings, with the RH wing having undergone 10,988 hours of pre-test usage, while the LH structure was new at the start of testing. A summary of the cracks detected is provided in Table A-5. 76
87 Table A-5: FCA352-PDN-1 FSFT Results Finding No. FS WS Hole Dia. (inch) Crack Length (inch) Hours L , L , R , R , R , R , R , R ,773 At this point in time, several of the larger DNH cracks on the RH wing were cut from the structure, and doubler/tripler repairs applied to the entire region of the inboard nacelle inboard fillet fairing. Force-tec retainers were installed in the RH DNHs and the satellite holes were split sleave cold worked. The cracks on the LH wing were stop-drilled, and repair doublers/triplers applied to the entire region. No further cracking was found during testing or teardown, however due to the extensive repairs applied, the loading on these fasteners was no longer representative of in-service structure. Fleet inspections at the inboard nacelle DNHs have been undertaken by the USN and the RAAF. Significant findings of fatigue cracking have been recorded, and the results are summarised in Table A-6. Table A-6: FCA352-PDN-1 Fleet Inspection Results Fleet Findings (Nov 2005) within FCA352-PDN-1 Aircraft Inspection Aircraft Length with program Inspect. (inch) Cracks Number of Cracks Station Time (AFHRS) USN (55) WS , WS ,550 20, WS ,409 19, WS ,518 19,290 USN AEB (94) Large 12 WS 156 Unknown Small 77 WS 156 Unknown X Small 5 WS 156 Unknown RAAF S76 (0)

88 A.4. FCA375-PSS-2 FCA375-PSS-2 is concerned with cracking in lower wing panel 3 of the panel 2/3 splice between the inboard and outboard engine nacelles. Only cracks between WS 239 to 311 were considered. This location is shown in Figure A- 4. WS WS WS WS WS WS WS WS WS WS WS WS Right Wing Cracking Figure A- 4: Location of FCA375-PSS-2 No cracks were discovered at this location during testing. On teardown, extensive cracking was found in the RH wing with a total of 31 cracks, ranging from to No cracks were discovered in the LH wing, which was not subjected to in-service usage. A summary of the FSFT cracks is included in Table A-7. 78
89 Table A-7: FCA375-PSS-2 FSFT Results Finding Hole Dia. Crack Length FS WS No. (inch) (inch) Hours R , R , R , R , R , R , R , R , R , R , R , R , R , R , R , R , R , R , R , R , R , R , R , R , R , R , R , R , R , R , R ,988 A total of 12 USN aircraft have had the panel 2/3 splice inspected in this region as part of teardown or replaced part inspections. Four of these aircraft had cracks reported. However, all of these cracks were minor crack indications measuring 0.03 or less. A summary of the cracking reported is in Table A-8. Table A-8: FCA375-PSS-2 Fleet Inspection Results Fleet Findings (Nov 2005) within FCA375-PSS-2 Aircraft Aircraft Length Source with Inspect. (inch) Cracks Number of Cracks Station Time (AFHRS) USN (19) WS ,905 20,224 1 Note that one aircraft only had one wing inspected and another aircraft was only inspected up to WS
90 A.5. FCA811-1 FCA811-1 is a structural detail, including fastener holes, in the vertical stabiliser front spar cap at the root, see Figure A- 5 and Figure A- 6. Vertical Stabiliser Figure A- 5: Location of FCA811-1 There was no cracking detected on the USN test article in this region. Cracking was detected on the Australian test article, and the details are presented in Table A-9. Table A-9: FCA811-1 FSFT Results Defect No. FS BL Hole Dia. (inch) Crack Length (inch) Hours R n/a , R n/a ,000 1 Crack was 1.65 after 46,478 hours of testing. There have been no reported inspections of this location for fatigue cracks by any of the P-3 SLAP partners. 80


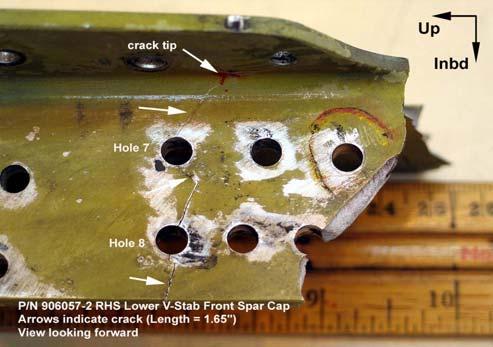
91 FCA811 Figure A- 6: Photographs of the cracking discovered at FCA811 (both and -2) 81
92 A.6. FCA811-2 FCA811-2 details the vertical stabiliser front spar cap at the aft flange runout radius, see Figure A- 7. Figure A- 7: Location of FCA811-2 There was no cracking detected on the USN FSFT article at this location. Two cracks were found on the Australian test article with the details presented in Table A-10. Table A-10: FCA811-2 FSFT Results Defect No. FS BL Hole Dia. (inch) Crack Length (inch) Hours R n/a 3.5 (severed) 46, L n/a ,000 There have been no reported inspections of this location for fatigue cracks by any of the P-3 SLAP partners. 82
93 A.7. FCA886 FCA886 is located at the root of the RH horizontal stabiliser upper rear spar cap. FCA885 is located at the same point, but on the LH side. Due to the different loading, these locations were identified separately. This location is shown in Figure A- 8. Drag Angle Ref. View Looking Down on RHS Upper Rear Spar Forward Outboard. HSS 32 Aft Upper Panel Rear Spar Cap FS R 1.9 inch Crack in Fillet Radius; LH & RH RHS Crack TE Skin 6.6 Wide T Edge T4 Figure A- 8: Location of FCA886 No cracks were detected at this location during cycling of the USN and Australian empennage FSFTs. However, during the RST of the USN FSFT article, a failure occurred at this FCA. The details of this crack are provided in Table A-11. No cracking was found at this location on the Australian FSFT, even though it was tested to 60,000 SFHRS with an augmented spectrum. 83

94 Table A-11: FCA886 FSFT Results Finding No. FS HSS Hole Dia. (inch) Crack Length (inch) Hours R n/a ,000 An examination of the upper rear spar caps of the USN and Australian test articles revealed a significant structural configuration difference at the failure location. As can clearly be seen in Figure A- 9, the Australian spar cap has a blended runout radius, while the USN spar cap has a sharp runout radius. Both configurations are within the tolerances on the drawing. Investigations as part of the DSTO TI have shown this has a significant effect on the localised stresses at this detail which in turn has a significant effect on the life of the component. Figure A- 9: Difference between the Australian (left) and USN (right) Upper Rear Spar Caps There have been no reported inspections of this location for fatigue cracks by any of the P-3 SLAP partners. 84
PC-21 A Damage Tolerant Aircraft. Paper presented at the ICAF 2009 Symposium by Lukas Schmid
 PC-21 A Damage Tolerant Aircraft Paper presented at the ICAF 2009 Symposium by Lukas Schmid PC-21 A Damage Tolerant Aircraft 12.05.2009 2 Acknowledgment Markus Gottier, Gottier Engineering Dave Boorman,
Presented to the Israel Annual Conference on Aerospace Sciences, 2009 RISK-ANALYSIS A SUPPLEMENT TO DAMAGE-TOLERANCE ANALYSIS
 RISK-ANALYSIS A SUPPLEMENT TO DAMAGE-TOLERANCE ANALYSIS Abraham Brot Engineering Division Israel Aerospace Industries Ben-Gurion Airport, Israel abrot@iai.co.il ABSTRACT Risk-analysis, based on probabilistic
Damage Tolerance Inspection Methodology for Slow Crack Growth Metallic Structure
 Structures Bulletin ASC/EN Bldg 28, 2145 Monahan Way WPAFB, OH 45433-7101 Phone 937-656-9956 Number: EN-SB-12-003 Date: 19 July 2012 Subject: Damage Tolerance Inspection Methodology for Slow Crack Growth
FATIGUE, FAIL-SAFE, AND DAMAGE TOLERANCE EVALUATION OF METALLIC STRUCTURE FOR NORMAL, UTILITY, ACROBATIC, AND COMMUTER CATEGORY AIRPLANES
 AC 23-13A FATIGUE, FAIL-SAFE, AND DAMAGE TOLERANCE EVALUATION OF METALLIC STRUCTURE FOR NORMAL, UTILITY, ACROBATIC, AND COMMUTER CATEGORY AIRPLANES September 29, 2005 For sale by the Superintendent of
ASSESSING THE RELIABILITY OF FAIL-SAFE STRUCTURES INTRODUCTION
 ASSESSING THE RELIABILITY OF FAIL-SAFE STRUCTURES Abraham Brot * Abstract: A computer simulation method is described, that can be used to assess the reliability of a dual-path fail-safe design. The method
DAMAGE-TOLERANCE SUBSTANTIATION OF THE GALAXY EXECUTIVE JET
 Presented to the ICAF 1999 Conference, Seattle, WA, 1999 DAMAGE-TOLERANCE SUBSTANTIATION OF THE GALAXY EXECUTIVE JET Abraham Brot, Shmaryahu Afnaim and Zvi Granot * SYNOPSIS This paper describes the fatigue
1 General. 1.1 Introduction
 1 General 1.1 Introduction The contents of this book will focus on the anatomy of the aeroplane and the various systems that enable it to operate both on the ground and in the air. Flight controls Landing
Risk-Based Condition Assessment and Maintenance Engineering for Aging Aircraft Structure Components
 Risk-Based Condition Assessment and Maintenance Engineering for Aging Aircraft Structure Components Dr. Dan M. Ghiocel* and Dr. Letian Wang Ghiocel Predictive Technologies Inc. 6 South Main St., 2 nd Floor,
NASA AEROSPACE PRESSURE VESSEL SAFETY STANDARD
 NSS/HP-1740.1 This Standard was CANCELLED on Jul 30 2002 22 FEBRUARY 1974 NASA AEROSPACE PRESSURE VESSEL SAFETY STANDARD OFFICE OF SAFETY AND RELIABILITY AND QUALITY ASSURANCE NATIONAL AERONAUTICS AND
Subject: Structural Certification Criteria Date: 10/11/18 Policy No: PS-AIR for Antennas, Radomes, and Other External Modifications
 Policy Statement Subject: Structural Certification Criteria Date: 10/11/18 Policy No: PS-AIR-25-17 for Antennas, Radomes, and Other External Modifications Initiated By: AIR-675 Summary This policy statement
SEMAE3327 Maintaining fuselage, nacelles and pylons on aircraft
 Overview This standard identifies the competences you need to carry out maintenance activities on aircraft fuselage, nacelles and pylons, in accordance with the approved aircraft maintenance manual, structural
Advisory Circular (AC)
") Advisory Circular (AC) Certification of Large Aeroplanes in the Restricted Category, Used for Special Purpose Operations File No. 5009-6-525 AC No. 525-012 RDIMS No. 1140123-V1 Issue No. 02 Issuing Branch
Advisory Circular (AC) Certification of Large Aeroplanes in the Restricted Category, Used for Special Purpose Operations File No. 5009-6-525 AC No. 525-012 RDIMS No. 1140123-V1 Issue No. 02 Issuing Branch
Safety Standards Acknowledgement and Consent (SSAC) CAP 1395
 CAP 1395") Safety Standards Acknowledgement and Consent (SSAC) CAP 1395 Contents Published by the Civil Aviation Authority, 2015 Civil Aviation Authority, Aviation House, Gatwick Airport South, West Sussex, RH6 0YR.
Safety Standards Acknowledgement and Consent (SSAC) CAP 1395 Contents Published by the Civil Aviation Authority, 2015 Civil Aviation Authority, Aviation House, Gatwick Airport South, West Sussex, RH6 0YR.
A method for evaluation of in-service fatigue cracks
 Engineering Failure Analysis 12 (2005) 13 24 www.elsevier.com/locate/engfailanal A method for evaluation of in-service fatigue cracks L. Molent a, *, R. Singh b, J. Woolsey c a Air Vehicles Division, Defence
DEPARTMENT OF THE NAVY NAVAL AIR SYSTEMS COMMAND RADM WILLIAM A. MOFFEIT BUILDING BUSE ROAD, BLDG 2272 PATUXENT RIVER, MARYLAND,
 - DEPARTMENT OF THE NAVY NAVAL AIR SYSTEMS COMMAND RADM WILLIAM A. MOFFEIT BUILDING 47123 BUSE ROAD, BLDG 2272 PATUXENT RIVER, MARYLAND, 20670-1547 NAVAIRINST 4790.20C AIR-6.0 NA VAIR INSTRUCTION 4790.20C
AUTOMATED ULTRASONIC INSPECTION FOR CRACK DETECTION AT F-111 LOWER WING SKIN FASTENER HOLES
 12 th A-PCNDT 2006 Asia-Pacific Conference on NDT, 5 th 10 th Nov 2006, Auckland, New Zealand AUTOMATED ULTRASONIC INSPECTION FOR CRACK DETECTION AT F-111 LOWER WING SKIN FASTENER HOLES Cayt Harding, Geoffrey
(DD/MMM/YYYY): 10/01/2013 IP
: 10/01/2013 IP") Title: Submitter: CPCP for Safe Life Items EASA, MRB Section Applies To: Vol 1: Vol 2: Both: X Issue: Problem: A Corrosion Prevention and Control Programme (CPCP) is required for all primary aircraft structure
Title: Submitter: CPCP for Safe Life Items EASA, MRB Section Applies To: Vol 1: Vol 2: Both: X Issue: Problem: A Corrosion Prevention and Control Programme (CPCP) is required for all primary aircraft structure
z Interim Report for May 2004 to October 2005 Aircrew Performance and Protection Branch Wright-Patterson AFB, OH AFRL-HE-WP-TP
 AFRL-HE-WP-TP-26-89 Neck Muscle Fatigue with Helmet-Mounted Systems Edward S. Eveland Joseph A. Pellettiere Air Force Research Laboratory LL September 26 z Interim Report for May 24 to October 25 (n 261124
BASIC AIRCRAFT STRUCTURES
 Slide 1 BASIC AIRCRAFT STRUCTURES The basic aircraft structure serves multiple purposes. Such as aircraft aerodynamics; which indicates how smooth the aircraft flies thru the air (The Skelton of the aircraft
Advisory Circular AC 120-CPCP DEVELOPMENT AND IMPLEMENTATION OF CORROSION PREVENTION AND CONTROL PROGRAM (CPCP)
") LAMPIRAN KEPUTUSAN DIREKTUR JENDERAL PERHUBUNGAN UDARA NOMOR : SKEP/85/IV/2008 TANGGAL : 21 April 2008 Advisory Circular AC 120-CPCP DEVELOPMENT AND IMPLEMENTATION OF CORROSION PREVENTION AND CONTROL PROGRAM
LAMPIRAN KEPUTUSAN DIREKTUR JENDERAL PERHUBUNGAN UDARA NOMOR : SKEP/85/IV/2008 TANGGAL : 21 April 2008 Advisory Circular AC 120-CPCP DEVELOPMENT AND IMPLEMENTATION OF CORROSION PREVENTION AND CONTROL PROGRAM
Policy for Evaluation of Certification Maintenance Requirements
 Circular No. 1-319 Policy for Evaluation of Certification Maintenance Requirements April 11, 2013 First Issue Airworthiness Division, Aviation Safety and Security Department Japan Civil Aviation Bureau
Application of pipeline risk assessment to proposed developments in the vicinity of high pressure Natural Gas pipelines
 Communication 1737 Application of pipeline risk assessment to proposed developments in the vicinity of high pressure Natural Gas pipelines Founded 1863 Royal Charter 1929 Patron: Her Majesty the Queen
SAMPLE MAT Proceedings of the 10th International Conference on Stability of Ships
 and Ocean Vehicles 1 Application of Dynamic V-Lines to Naval Vessels Matthew Heywood, BMT Defence Services Ltd, mheywood@bm tdsl.co.uk David Smith, UK Ministry of Defence, DESSESea-ShipStab1@mod.uk ABSTRACT
Analysis of Operating Loads on an Aircraft s Vertical Stabilizer on the Basis of Recorded Data
 A publication of CHEMICAL ENGINEERING TRANSACTIONS VOL. 33, 2013 Guest Editors: Enrico Zio, Piero Baraldi Copyright 2013, AIDIC Servizi S.r.l., ISBN 978-88-95608-24-2; ISSN 1974-9791 The Italian Association
Fuselage, Wings and Stabilising Surfaces
 Fuselage, Wings and Stabilising Surfaces Chapter 1 DESIGN PHILOSOPHIES The aircraft manufacturer will attempt to design an aircraft to take into account all the loads that it may experience in flight.
IGEM/TD/2 Edition 2 with amendments July 2015 Communication 1779 Assessing the risks from high pressure Natural Gas pipelines
 Communication 1779 Assessing the risks from high pressure Natural Gas pipelines Founded 1863 Royal Charter 1929 Patron: Her Majesty the Queen Communication 1779 Assessing the risks from high pressure Natural
EMERGENCY AIRWORTHINESS DIRECTIVE
 EASA EMERGENCY AIRWORTHINESS DIRECTIVE AD No.: 2007 0108 -E Date: 18 April 2007 No person may operate an aircraft to which an Airworthiness Directive applies, except in accordance with the requirements
FATIGUE LIFE EVALUATION OF CRITICAL LOCATIONS IN AIRCRAFT STRUCTURES USING VIRTUAL FATIGUE TEST
 ICAS2002 CONGRESS FATIGUE LIFE EVALUATION OF CRITICAL LOCATIONS IN AIRCRAFT STRUCTURES USING VIRTUAL FATIGUE TEST Jarkko Tikka Patria Keywords: fatigue life, finite element method, operational loads measurement
Fatigue Test Results and Analysis 42 Piston Provost Wings
 t"- O'3 R. & M. No. 3474 Z MINISTRY OF TECHNOLOGY AERONAUTICAL RESEARCH COUNCIL Fatigue Test Results and Analysis 42 Piston Provost Wings of by H. E. PARISH, A.F.R.Ae.S. LONDON: HER MAJESTY'S STATIONERY
IGEM/TD/1. Background, Development, Changes J V Haswell
 IGEM/TD/1 Background, Development, Changes J V Haswell TD/1 Background Development, Changes Technical and Safety Philosophy History of Development Key Code Requirements:- Rou?ng, BPDs Design parameters
TECHNICAL NOTE THROUGH KERBSIDE LANE UTILISATION AT SIGNALISED INTERSECTIONS
 TECHNICAL NOTE THROUGH KERBSIDE LANE UTILISATION AT SIGNALISED INTERSECTIONS Authors: Randhir Karma NDip: Eng (Civil) B. Tech Eng (Civil) M Eng (Hons) (Transportation) Auckland Traffic Service Group Manager
SUPPORTING NOTES FOR THE EVALUATION OF UNBOUND ROAD BASE AND SUB-BASE AGGREGATES
 SUPPORTING NOTES FOR THE EVALUATION OF UNBOUND ROAD BASE AND SUB-BASE AGGREGATES (These notes are guidelines only and must not be included in the Contract Documents). 1. SCOPE These Notes are guidelines
UKOPA Dent Management Strategy
 UKOPA Dent Management Strategy 1 Background Pipelines are thin shell structures which are susceptible to geometric distortions and dents during handling, construction, and operation. These dents and distortions,
Advisory Circular (AC)
") Advisory Circular (AC) Stall, Compliance File No. 5009-6-525 AC No. 525-020 RDIMS No. 528401-V3 Issue No. 01 Issuing Branch Aircraft Certification Effective Date 2004-12-01 1.0 INTRODUCTION... 2 1.1 Purpose...
Advisory Circular (AC) Stall, Compliance File No. 5009-6-525 AC No. 525-020 RDIMS No. 528401-V3 Issue No. 01 Issuing Branch Aircraft Certification Effective Date 2004-12-01 1.0 INTRODUCTION... 2 1.1 Purpose...
BAM - 3.2: Section Pressure Equipment Pressure Receptacles; Fuel Gas Storage Systems 26 th September 2014
 BAM - 3.2: Section Pressure Equipment Pressure Receptacles; Fuel Gas Storage Systems 26 th September 2014 Technical Annex Slow Burst Test (SBT): of the Concept Additional Tests (CAT): Test Procedure Slow
for Naval Aircraft Operations
 Seakeeping Assessment of Large Seakeeping Assessment of Large Trimaran Trimaran for Naval Aircraft Operations for Naval Aircraft Operations Presented by Mr. Boyden Williams, Mr. Lars Henriksen (Viking
Conservation Limits and Management Targets
 Conservation Limits and Management Targets Setting conservation limits The use of conservation limits (CLs) in England and Wales (E&W) has developed in line with the requirement of ICES and NASCO to set
CONVECTION SECTION FAILURE ANALYSIS AND FITNESS-FOR-SERVICE ASSESSMENT
 ASSET INTEGRITY INTELLIGENCE CONVECTION SECTION FAILURE ANALYSIS AND FITNESS-FOR-SERVICE ASSESSMENT JAMES R. WIDRIG, Manager Advanced Engineering at Quest Integrity Group VOLUME 23, ISSUE 6 NOVEMBER DECEMBER
Mandatory Bulletin BO
 Zakład Szybowcowy Jeżów EASA No. AP 4 MANDATORY BULLETIN BO-78-0-0 Page: Pages: Mandatory Bulletin BO-78-0-0 Aircraft Type / Model: PW-6U Glider Serial Numbers: 78.0.08 78.0.0, 78.04.0 78.04.09, as well
Advisory Circular. Runway Guard Light Installation Criteria. Aviation Safety Regulatory Framework Document No.: AC A P/A Issue No.
 Advisory Circular Subject: Runway Guard Light Installation Criteria Issuing Office: PAA Sub Activity Area: Classification File No.: Standards Aviation Safety Regulatory Framework Document No.: AC 302-005
Lifecycle Performance of Escape Systems
 Lifecycle Performance of Escape Systems A look at laboratory vs field conditioning of aramid fiber based escape systems. By James Hunter, Cedric Smith, Ole Kils and Tyler Mayer for ITRS 2018 1.1 Introduction
SEMAE3064 Installing aircraft visual display units and computer systems
 Installing aircraft visual display units and computer systems Overview This standard identifies the competences you need to install aircraft visual display units and computer systems, in accordance with
Fatigue Life Evaluation of Cross Tubes of Helicopter Skid Landing Gear System
 IJSRD - International Journal for Scientific Research & Development Vol. 3, Issue 04, 2015 ISSN (online): 2321-0613 Fatigue Life Evaluation of Cross Tubes of Helicopter Skid Landing Gear System Madhu S
Annex 1 to Decision 2009/007/R
 Annex 1 to Decision 2009/007/R AMC to Part 145 A new AMC 145.A.45(e) is added: AMC 145.A.45(e) Maintenance data The maintenance organisation should transcribe accurately the maintenance data onto such
Simulation Analysis of Intersection Treatments for Cycle Tracks
 Abstract Simulation Analysis of Intersection Treatments for Cycle Tracks The increased use of cycle tracks also known as protected bike lanes has led to investigations of how to accommodate them at intersections.
SECTION 2 ACCEPTABLE MEANS OF COMPLIANCE AND INTERPRETATIONS ACJ
 SECTION 2 JAR-23 SECTION 2 ACCEPTABLE MEANS OF COMPLIANCE AND INTERPRETATIONS ACJ 1. GENERAL 1.1 This Section contains Flight Test Guide, Acceptable Means of Compliance and Interpretative Material that
2 FUSION FITTINGS FOR USE WITH POLYETHYLENE PRESSURE PIPES DESIGN FOR DYNAMIC STRESSES
 Industry Guidelines Part 2 FUSION FITTINGS FOR USE WITH POLYETHYLENE PRESSURE PIPES DESIGN FOR DYNAMIC STRESSES ISSUE 5.1 Ref: POP10B 15 MAR 2010 Disclaimer In formulating this guideline PIPA has relied
Presented to the International Technical Rescue Symposium, November Abstract
 Presented to the International Technical Rescue Symposium, November 21 Presented by: Chuck Weber, PMI Quality Manager Abstract This paper presents the results of 162 individual drop tests performed at
Introduction to Roundabout Analysis Using ARCADY
 Introduction to Roundabout Analysis Using ARCADY Toronto SimCap User Group Technical Event and ITE Toronto Section Social Event July 22, 2014 Phil Weber, P.Eng. GHD Inc. (The Home of Ourston Roundabout
Tightening Evaluation of New 400A Size Metal Gasket
 Proceedings of the 8th International Conference on Innovation & Management 307 Tightening Evaluation of New 400A Size Metal Gasket Moch. Agus Choiron 1, Shigeyuki Haruyama 2, Ken Kaminishi 3 1 Doctoral
3. Real-time operation and review of complex circuits, allowing the weighing of alternative design actions.
 PREFERRED RELIABILITY PAGE 1 OF 5 PRACTICES VOLTAGE & TEMPERATURE MARGIN TESTING Practice: Voltage and Temperature Margin Testing (VTMT) is the practice of exceeding the expected flight limits of voltage,
NOTE. 1. SUBJECT: Inspection of Tailcone Skins, Flanges, and Longerons
 NOTE SERVICE DIRECTIVE BULLETIN NO. T-033 Page 1 of 8 of SDB T-033 allows for dents on the tailcone as specified and offers a field kit for installing zee-channels to reinforce the tailcone structure.
ABS TECHNICAL PAPERS 2005
 OTC 17535 Structural Reliability Applications in Risk-Based Inspection Plans and Their Sensitivities to Different Environmental Conditions A. P. Ku and R. E. Spong, Energo Engineering; C. Serratella, ABS
Inspection Credit for PWSCC Mitigation via Peening Surface Stress Improvement
 Inspection Credit for PWSCC Mitigation via Peening Surface Stress Improvement Glenn A. White, Kyle P. Schmitt, Kevin J. Fuhr, Markus Burkardt, and Jeffrey A. Gorman Dominion Engineering, Inc. Paul Crooker
SELECTED ASPECTS RELATED TO THE APPLIED LOADS CONTROL DURING FATIGUE TESTS OF A METALLIC AIRFRAME
 Fatigue of Aircraft Structures Vol. 1 (2014) 102-106 10.1515/fas-2014-0010 SELECTED ASPECTS RELATED TO THE APPLIED LOADS CONTROL DURING FATIGUE TESTS OF A METALLIC AIRFRAME Józef Brzęczek Jerzy Chodur
Second Generation Bicycle Charging Station. Engineering Analysis
 Second Generation Bicycle Charging Station By Jonathan Jerome, Michael Klinefelter, Connor Kroneberger, Kori Molever, and Robert Rosenberg Team 22B Engineering Analysis Document Submitted towards partial
INTEGRITY MANAGEMENT OF STRESS CORROSION CRACKING IN GAS PIPELINE HIGH CONSEQUENCE AREAS
 Designator: Meta Bold 24/26 Revision Note: Meta Black 14/16 INTEGRITY MANAGEMENT OF STRESS CORROSION CRACKING IN GAS PIPELINE HIGH CONSEQUENCE AREAS Date of Issuance: October 31, 2008 This report was prepared
A FINITE ELEMENT PROCEDURE TO MODEL THE EFFECT OF HYDROSTATIC TESTING ON SUBSEQUENT FATIGUE CRACK GROWTH
 Proceedings of the International Pipeline Conference & Exposition IPC216 September 26-3, 216, Calgary, Alberta, Canada IPC216-64563 A FINITE ELEMENT PROCEDURE TO MODEL THE EFFECT OF HYDROSTATIC TESTING
MAE 322 Machine Design Lecture 5 Fatigue - 2. Dr. Hodge Jenkins Mercer University
 MAE 322 Machine Design Lecture 5 Fatigue - 2 Dr. Hodge Jenkins Mercer University Returning to Stress-Life Fatigue Modeling Fatigue Stress-Life: S f -N Diagram for steels Stress levels below S e (Endurance
DGZfP-Proceedings BB 90-CD Lecture 4 EWGAE 2004
 ACOUSTIC EMISSION EXPERIENCE WITH AE MONITORING OF NEW VESSELS DURING INITIAL PROOF TEST Phillip, Cole, Physical Acoustics Limited, Cambridge, U.K; Stephen, Gautrey, Physical Acoustics Limited, Cambridge,
Fig. 1. Test in pool.
 1 Lecture #13(14A). Experimental estimation of service life Plan: 1. Methods of fatigue tests 2. Program composition of tests 3. Estimation of the directive stresses 1. Methods of fatigue tests The fullest
METHODOLOGY. Signalized Intersection Average Control Delay (sec/veh)
") Chapter 5 Traffic Analysis 5.1 SUMMARY US /West 6 th Street assumes a unique role in the Lawrence Douglas County transportation system. This principal arterial street currently conveys commuter traffic
Chapter 5 Traffic Analysis 5.1 SUMMARY US /West 6 th Street assumes a unique role in the Lawrence Douglas County transportation system. This principal arterial street currently conveys commuter traffic
APPENDIX J REQUIRED NAVIGATION PERFORMANCE IMPACTS EVALUATION REPORT
 APPENDIX J REQUIRED NAVIGATION PERFORMANCE IMPACTS EVALUATION REPORT February 01, 2007 Naverus, Inc. Seattle, WA This document contains commercially sensitive information and must be treated as Naverus,
Flexible hoses - Non-metallic materials
 CLASS PROGRAMME Type approval DNVGL-CP-0183 Edition December 2015 The electronic pdf version of this document, available free of charge from http://www.dnvgl.com, is the officially binding version. FOREWORD
Justification of Risk Reduction through In-Service Inspection / REDUCE
 NUGENIA+ WP6.12 Justification of Risk Reduction through In-Service Inspection / REDUCE Jens Gunnars Inspecta Technology AB jens.gunnars@inspecta.com WP6.12 Task Leader NUGENIA+ Final Seminar, Helsinki
An Analysis of Reducing Pedestrian-Walking-Speed Impacts on Intersection Traffic MOEs
 An Analysis of Reducing Pedestrian-Walking-Speed Impacts on Intersection Traffic MOEs A Thesis Proposal By XIAOHAN LI Submitted to the Office of Graduate Studies of Texas A&M University In partial fulfillment
BEECH 18 INSPECTION PROCEDURES
 BEECH 18 INSPECTION PROCEDURES This document applies to all Beech 18 series airplanes including military counterparts and other counterparts approved by Supplemental Type Certificates (STC s), regardless
IJSRD - International Journal for Scientific Research & Development Vol. 3, Issue 02, 2015 ISSN (online):
:") IJSRD - International Journal for Scientific Research & Development Vol. 3, Issue 02, 2015 ISSN (online): 2321-0613 Stress Analysis of a Critical Splice Joint in the Fuselage Structure of an Airframe and
IJSRD - International Journal for Scientific Research & Development Vol. 3, Issue 02, 2015 ISSN (online): 2321-0613 Stress Analysis of a Critical Splice Joint in the Fuselage Structure of an Airframe and
MINE SAFETY TARGETED ASSESSMENT PROGRAM. Ground or strata failure NSW metalliferous mines. April
 MINE SAFETY TARGETED ASSESSMENT PROGRAM Ground or strata failure NSW metalliferous mines April 2017 www.resourcesandenergy.nsw.gov.au Document control Publication title: Ground or strata failure NSW metalliferous
2003 WJTA American Waterjet Conference August 17-19, 2003 Houston, Texas Paper PIPE THREADS-WHAT IS THE LIMIT?
 23 WJTA American Waterjet Conference August 17-19, 23 Houston, Texas Paper PIPE THREADS-WHAT IS THE LIMIT? D. Wright, J. Wolgamott, G. Zink StoneAge, Inc. Durango, Colorado, U.S.A. ABSTRACT At present
Safe management of industrial steam and hot water boilers A guide for owners, managers and supervisors of boilers, boiler houses and boiler plant
 Health and Safety Executive Safe management of industrial steam and hot water boilers A guide for owners, managers and supervisors of boilers, boiler houses and boiler plant Background Accidents involving
Enbridge Pipelines Inc. PIPELINE INTEGRITY AXIAL CRACK THREAT ASSESSMENT
 Enbridge Pipelines Inc. Line 9B Reversal and Line 9 Capacity Expansion Project Appendix A to Updated Pipeline Engineering Assessment PIPELINE INTEGRITY AXIAL CRACK THREAT ASSESSMENT Table of Contents 1.
Post impact trajectory of vehicles at rural intersections
 Post impact trajectory of vehicles at rural intersections Doecke SD., Woolley JE. and Mackenzie JR. Centre for Automotive Safety Research Abstract This report describes the path of vehicles after a collision
ANNUAL DYNAMIC POSITIONING TRIALS FOR DYNAMICALLY POSITIONED VESSELS
 Author s Name Name of the Paper Session DYNAMIC POSITIONING CONFERENCE October 11-12, 2011 OPERATIONS SESSION ANNUAL DYNAMIC POSITIONING TRIALS FOR DYNAMICALLY POSITIONED VESSELS By Ian Giddings The International
Avoiding Short Term Overheat Failures of Recovery Boiler Superheater Tubes
 Avoiding Short Term Overheat Failures of Recovery Boiler Superheater Tubes Dr. Andrew K. Jones International Paper Tim Carlier Integrated Test and Measurement 2017 International Chemical Recovery Conference
Life Cycle Testing of 3x19 Wire Rope
 Life Cycle Testing of 3x19 Wire Rope Shipboard Scientific Support Equipment: Oceanographic Cable NSF Grant No. 0555000 Presented by Rick Trask (WHOI) Topics Results of Bending Fatigue Tests conducted on
PUBLISHED PROJECT REPORT PPR850. Optimisation of water flow depth for SCRIM. S Brittain, P Sanders and H Viner
 PUBLISHED PROJECT REPORT PPR850 Optimisation of water flow depth for SCRIM S Brittain, P Sanders and H Viner Report details Report prepared for: Project/customer reference: Copyright: Highways England,
Accreditation for In-Service Inspection of Transportable Pressure Receptacles (TPRs)
") RG 3 Edition 4 December 2018 Accreditation for In-Service Inspection of Transportable Pressure Receptacles (TPRs) RG 3 / Edition: 4 Page 1 of 8 Contents 1. Introduction 2 2. Scope - Inspection Services
RG 3 Edition 4 December 2018 Accreditation for In-Service Inspection of Transportable Pressure Receptacles (TPRs) RG 3 / Edition: 4 Page 1 of 8 Contents 1. Introduction 2 2. Scope - Inspection Services
Investigating the effects of interchanging components used to perform ripple assessments on calibrated vector network analysers
 Abstract Investigating the effects of interchanging components used to perform ripple assessments on calibrated vector network analysers Andrew G Morgan and Nick M Ridler Centre for Electromagnetic and
PORTS AUSTRALIA. PRINCIPLES FOR GATHERING AND PROCESSING HYDROGRAPHIC INFORMATION IN AUSTRALIAN PORTS (Version 1.5 November 2012)
") PORTS AUSTRALIA PRINCIPLES FOR GATHERING AND PROCESSING HYDROGRAPHIC INFORMATION IN AUSTRALIAN PORTS (Version 1.5 November 2012) PREFACE These Principles have been prepared by the Hydrographic Surveyors
PORTS AUSTRALIA PRINCIPLES FOR GATHERING AND PROCESSING HYDROGRAPHIC INFORMATION IN AUSTRALIAN PORTS (Version 1.5 November 2012) PREFACE These Principles have been prepared by the Hydrographic Surveyors
OCTOBER 2017 ISSUE Page 1 of 7
 Field testing is performed on fully assembled pipelines for the purpose of determining pipeline acceptability. Following visual acceptance of joints and pipeline components, pressure pipelines in their
At each type of conflict location, the risk is affected by certain parameters:
 TN001 April 2016 The separated cycleway options tool (SCOT) was developed to partially address some of the gaps identified in Stage 1 of the Cycling Network Guidance project relating to separated cycleways.
Recommendations for the Risk Assessment of Buffer Stops and End Impact Walls
 Recommendations for the Risk Assessment of Buffer Stops and End Synopsis This document gives details of a recommended method which, if followed, would meet the requirements of section 11, Buffer Stops
Systems of Accounting for and Control of Nuclear Material
 Systems of Accounting for and Control of Nuclear Material STATES' OBLIGATIONS TO ESTABLISH AN ACCOUNTING AND CONTROL SYSTEM The implementation of safeguards agreements has always involved governmental
Kiefner & Associates, Inc.
 Kiefner & Associates, Inc. KAPA FAQs What does KAPA stand for? KAPA is an acronym for Kiefner & Associates Pipe Assessment. What does KAPA do? KAPA calculates an estimated failure pressure of a pipe affected
ROUNDABOUT CAPACITY: THE UK EMPIRICAL METHODOLOGY
 ROUNDABOUT CAPACITY: THE UK EMPIRICAL METHODOLOGY 1 Introduction Roundabouts have been used as an effective means of traffic control for many years. This article is intended to outline the substantial
Purpose. Scope. Process flow OPERATING PROCEDURE 07: HAZARD LOG MANAGEMENT
 SYDNEY TRAINS SAFETY MANAGEMENT SYSTEM OPERATING PROCEDURE 07: HAZARD LOG MANAGEMENT Purpose Scope Process flow This operating procedure supports SMS-07-SP-3067 Manage Safety Change and establishes the
TRIP GENERATION RATES FOR SOUTH AFRICAN GOLF CLUBS AND ESTATES
 TRIP GENERATION RATES FOR SOUTH AFRICAN GOLF CLUBS AND ESTATES M M Withers and C J Bester Department of Civil Engineering University of Stellenbosch, Private Bag X1, Matieland, 7602 ABSTRACT There has
Other Si min/max. Cr min/max. 0.4/ / / / Bal.
 178.46 Specification 3AL seamless aluminum cylinders. (a) Size and service pressure. A DOT 3AL cylinder is a seamless aluminum cylinder with a imum water capacity of 1000 pounds and minimum service pressure
MICROPHONE WIND SPEED LIMITS DURING WIND FARM NOISE MEASUREMENTS
 MICROPHONE WIND SPEED LIMITS DURING WIND FARM NOISE MEASUREMENTS Abstract Jon Cooper 1 and Tom Evans 2 1 Resonate Acoustics, Level 1/23 Peel St, Adelaide SA 5000, Australia Email: jon.cooper@resonateacoustics.com
STRIDE PROJECT Steel Risers in Deepwater Environments Achievements
 STRIDE PROJECT Steel Risers in Deepwater Environments Achievements 1999-21 Neil Willis Principal Engineer 2H Offshore Engineering 6 th Annual Deepwater Technologies and Developments Conference 21 The presentation
One of the most important gauges on the panel is
 stick & rudder flight advisor Is Your Airspeed Indicator Honest? An accuracy how-to H.C. SKIP SMITH One of the most important gauges on the panel is the airspeed indicator. This is particularly true if
COSCAP-South Asia ADVISORY CIRCULAR FOR AIR OPERATORS
 Cooperative Development of Operational Safety and Continuing Airworthiness Under ICAO Technical Co-operation Programme COSCAP-South Asia ADVISORY CIRCULAR FOR AIR OPERATORS Subject: GUIDANCE FOR OPERATORS
Helicopter Safety Recommendation Summary for Small Operators
 Helicopter Safety Recommendation Summary for Small Operators Prepared by the International Helicopter Safety Team September 2009 Introduction This document is intended to provide a summary of the initial
Rules for the Installation, Inspection and Testing of Air Reservoirs (Other than on Locomotives)
") Rules for the Installation, Inspection and Testing of Air Reservoirs (Other than on Locomotives) December 5, 1994 TM Rules for the Installation, Inspection and Testing of Air Reservoirs (Other than on
Rules for the Installation, Inspection and Testing of Air Reservoirs (Other than on Locomotives) December 5, 1994 TM Rules for the Installation, Inspection and Testing of Air Reservoirs (Other than on
Pegasus Additional buoyancy for offshore helicopters
 EASA Briefing Paper Document Number R0 EASA Project Number 0010046421 ATL Certification Programme CP-13195-00001 Pegasus Additional buoyancy for offshore helicopters IP & Design Rights One Atmosphere Pty
Calibration Requirements for Direct Reading Confined Space Gas Detectors
 : Calibration Requirements for Direct Reading Confined Space Gas Detectors However, the definition of bump test has always been a little slippery. Some manufacturers differentiate between a bump test that
Best Practice RBI Technology Process by SVT-PP SIMTECH
 Best Practice RBI Technology Process by SVT-PP SIMTECH We define the best practice in RBI as a proactive technology process which is used to formally and reliably optimise the inspection efforts for each
Determination of the Design Load for Structural Safety Assessment against Gas Explosion in Offshore Topside
 Determination of the Design Load for Structural Safety Assessment against Gas Explosion in Offshore Topside Migyeong Kim a, Gyusung Kim a, *, Jongjin Jung a and Wooseung Sim a a Advanced Technology Institute,
The Corporation of the City of Sarnia. School Crossing Guard Warrant Policy
 The Corporation of the City of Sarnia School Crossing Guard Warrant Policy Table of Contents Overview And Description... 2 Role of the School Crossing Guard... 2 Definition of a Designated School Crossing...