1 Introduction Model description SBM-2DH Video Interpretation Model Model applications SBM-2DH...10
|
|
|
- Cornelia McLaughlin
- 5 years ago
- Views:
Transcription


1


2
3
4 Z336 November, 23 Contents 1 Introduction Model description SBM-2DH Approach Video Interpretation Model Bathymetry Assessment Model Running SBM-2DH Model applications SBM-2DH Synthetic test case RIPEX experiment California Combined nourishment Egmond Recommendations...2 Conclusions...21 i
5 Z336 November, 23 1 Introduction Beaches are very dynamic systems that change from day to day. One day, they may have long and straight bars, another they may have pronounced rip currents that are dangerous for swimmers. The safety of a dune system depends in part on the beach in front of it, so also here the state of the beach is important from a management point of view. Beach and nearshore nourishments are applied frequently; these adapt to the longer-term profile shape in a matter of weeks to months, through phases that may be unexpected and could pose temporary problems. Standard observation methods such as JARKUS in the Netherlands only give beach information at every 2 m, once per year, which is not enough to give information at this level of detail. Information of sufficient detail can be derived from high-resolution video observations of the nearshore zone. The ARGUS system directly gives an indication of the location of the main morphological features, but what we aim for here is the quantitative estimation of the by interpretation of the remotely sensed information. In this study, we present a method to derive two-dimensional (2D) sub-tidal beach from time-averaged video observations of wave breaking. Aarninkhof (23) presents a one-dimensional, time-dependent model to quantify subtidal beach along cross-shore arrays, on the basis of a time series of Argus video observations of wave energy breaking. The model named SBM ( Subtidal Beach Mapper ) determines surf zone through assimilation of video-observed and modelpredicted patterns of wave dissipation. Validation of SBM along two cross-shore Egmond transects approximately 14 m apart has shown that the model is able to reproduce the dominant morphological changes during the first year after a shoreface nourishment, including the shoreward migration of the outer bar and the net accretion of sand in the nearshore part of the surf zone. The rms error of the vertical deviations along the entire beach profile typically amounts to 4 cm for both arrays. Marginal deviations in the order of 1 to 2 cm are found at the seaward face of the bars, which increase up to 2 to 4 cm near the bar crest. Maximum deviations up to 8 cm are found in the trough region, owing to lack of wave dissipation information. The accretion of sediment in the shallow surf zone is underestimated. The Aarninkhof (23) version of SBM only operates along cross-shore arrays that are located within the field of view of a single video camera. For the Egmond station Jan van Speijk, this implies that SBM can only be applied to the far-field regions of cameras c1 and c and the central region of camera c3, as the cross-shore array has to extend from the seaward end of the surf zone (typically at 8 m offshore) to the shoreline. This limitation considerably hampers model applicability in support of coastal management. The goal of the present study is to extend the existing 1D model SBM for use in 2DH mode and to demonstrate the capability of the extended model, named SBM-2DH, at Egmond. To that end, this note discusses the background of SBM-2DH (particularly the quantitative interpretation of merged, plan view image intensities and the coupling of SBM-2DH and Delft3D), it presents three model applications (synthetic data, RIPEX experiment California 1
6 Z336 November, 23 and monitoring of a combined beach and shoreface nourishment Egmond), and it investigates the compatibility with high-resolution, video-derived data on intertidal beach. This study is a pilot project, which aims at demonstrating the capabilities of video imagery for the quantification of 2DH surf zone, rather than at developing a robust, automated and well-tested code. As a result, the present model involves a few manual steps (like the selection of good quality video data), which may be automated in future research projects. The work presented here has been performed as part of project 6 of the Voortschrijdend Onderzoeks Programma (VOP) of Rijkswaterstaat and, in the framework of assignment RKZ It received co-funding from the research project Data-Model-Integration and Delft University of Technology. The results also contribute to the outcome of the EU-funded CoastView project under contract number EVK3-CT
7 Z336 November, 23 2 Model description SBM-2DH This chapter discusses the background of SBM-2DH, with a focus on the modifications that were necessary to enable application of the SBM model in 2DH mode, particularly regarding the quantitative interpretation of plan view image intensities derived from multiple cameras, and the coupling of Argus video imagery and the Delft3D modelling system. 2.1 Approach The approach used by SBM-2DH to quantify subtidal from time-averaged image intensities is identical to that used by SBM (see Aarninkhof, 23). First, goodquality images with sufficient wave dissipation (i.e. considerable wave breaking occurring over at least one sand bar) are selected (hand-picked at this moment) and corrected for the effect of spatially and temporally varying background illuminations. Then the corrected image intensities are scaled such that they are a quantitative measure of wave dissipation. This video-derived dissipation pattern is compared to a dissipation pattern obtained from running an advanced 2DH wave transformation model across a recent nearshore which is either surveyed or determined from a previous image. Updating of the is achieved by raising the bottom elevation in areas where the video-measured dissipation exceeds the model-computed dissipation and vice versa. Since the SBM-2DH model can include video data with high resolution in time, it allows for nearly continuous monitoring of surf zone. Time series of video images Video image Argus metainformation Tide & wave information Initial Video Interpretation Model Measured wave dissipation Bathymetry Assessment Model Sub-model 1 Sub-model 2 Video-based Sub-tidal Beach Mapper (SBM-2DH) Evolution of sub-tidal Fig. 2.1: General layout of the 2DH Subtidal Beach Mapper SBM-2DH The general model layout (Fig. 2.1) reflects the operation of SBM-2DH. The Video Interpretation Model samples time-averaged video intensities, corrects them for the effect of background illuminations and variable contrast levels between cameras, and generates a video-based wave dissipation map. The Bathymetry Assessment Model adopts the latter to update surf zone through assimilation of video-derived and model-predicted 3

8 Z336 November, 23 measures of wave dissipation. Both sub-models will be discussed in the next two subsections. 2.2 Video Interpretation Model The Video Interpretation Model has to produce a wave dissipation map from a merged, plan view, time-exposure video image (obtained by an Argus station). A merged plan view image (Fig. 2.2), derived from multiple cameras, tends to show the outlines of the constituent images, because individual Argus images collected within a single hour come with variable intensity characteristics. Of particular interest are the overall image contrast and the crossimage variation (left to right) in overall intensity level. These differences are caused by different camera orientations with respect to the position of the sun and the nonsimultaneous collection of video data (SGI-based Argus-II video stations can only operate two cameras at the same time). Fig. 2.2: Merged, plan view image of Egmond station Jan van Speijk dd. 13/12/1999 at GMT 1: hr. The bright band at 7 m offshore shows the shoreface nourishment. A wave dissipation map for use with the Bathymetry Assessment Model is obtained from a merged plan view video image in a three-step approach. First we need to remove some background intensity level, because an area with no wave breaking should map to no wave dissipation, hence the video intensity should be set to zero there. To obtain smooth wave dissipation maps covering multiple cameras, we need to take into account differences in background intensity level between constituent images as well as the cross-image variation in overall intensity level in each constituent image. Secondly, we need to correct for variable image contrast levels between cameras, because an area represented by a low contrast image will result in unrealistically low wave dissipation levels in that area. Thirdly, we need to scale the corrected image intensities to a quantitatively correct measure of wave dissipation. Removal of spatially varying background intensity level Careful investigation of a series of Argus images has learned that oblique images often show a cross-image intensity trend. Merging multiple images then implies that the dark side of the first image is linked to the bright side of the second and so on, which yields clear transitions between cameras as shown in Fig To remove this cross-image intensity trend, a new method was developed which removes the background illumination level for each vertical image line U in the oblique image, i.e. prior to merging and plan view mapping. (NB: it is 4
9 Z336 November, 23 an image convention to denote image pixels in U,V space, (analogously to an x-y coordinate system), where vertical image lines are denoted U, horizontal image lines are denoted V, with the origin in the top left corner of the image). Starting at the left hand side of the image, the background illumination level µ dw is estimated for each vertical image line U, by taking the mean value of pixel intensities sampled along U between two shore-parallel lines outside the region of wave breaking. For the Egmond case the two shore-parallel lines were set at 8 m and 18 m offshore (Fig. 2.3a). To remove background illuminations along U, the mean intensity level µ dw observed at deep water is subtracted from all pixel intensities along U. Any negative pixel intensities thus obtained are set to zero. This approach yields smooth patterns of breaking-induced image intensities for each constituent image (i.e. per camera), but not necessarily for the full, merged plan view image. Fig. 2.3: Visualization of the deep water region used for the cross-camera removal of background illuminations (a) and the surf zone region used for the determination of image contrast (b). Correction for variable image contrast Breaking-induced image intensity maps resulting from the above correction procedure alone, showed that an individual low-contrast image (i.e. the contribution to the merged plan view from one particular camera) resulted in unrealistically low wave dissipation levels in that area. Thus, to obtain smooth wave dissipation maps covering multiple cameras, we need to correct for variable image contrast levels between cameras. This has been achieved by adopting the standard deviation σ sz of surf zone pixel intensities as an indicator for image contrast. An image-specific σ sz is determined from pixel intensities sampled from a nearshore region enclosed by shore-parallel lines at 1 m and 1 m offshore (Fig. 2.3b). Breaking-induced image intensities collected from different cameras are corrected according to I ci, σ sz,min = I i σ sz, i (Eq. 2.1) where σ sz,i is the standard deviation of surf zone pixel intensities of camera i, σ sz,min is the minimum σ sz of all cameras involved and I i is the breaking-induced image intensity map of camera i (after correction for background illuminations) and I c,i is the breaking-induced image intensity map after correction for variable image contrast. The ratio σ sz,min /σ sz,i
10 Z336 November, 23 typically varies between. and 1. Merging the corrected breaking-induced image intensity maps I c,i sampled from constituent cameras yields a more balanced wave dissipation map I v covering coastal stretches up to a few kilometers (Fig. 2.4). Fig. 2.4: Breaking-induced image intensity map I v of Egmond station Jan van Speijk after correction for variable camera contrast levels. The northward-oriented camera 1 (poiting towards the negative alongshore co-ordinate) shows improved contrast as compared to the original video data (Fig. 2.2). Scaling to a quantitatively correct measure of wave dissipation Following Aarninkhof (23), SBM-2DH relates breaking-induced image intensity patterns I v (Fig. 2.4) to hydrodynamic model-computed dissipation of roller energy (see Section 2.3). Consequently, the Video Interpretation Model normalizes I v such that Idxdy v = 1 and scales the normalized intensity map with the incoming wave energy flux to obtain a videoderived measure of wave dissipation D o that quantitatively matches the model-computed roller dissipation: x y Iv ( xy, ) Do( xy, ) = Ecg cos( θ ) dy y Idxdy v x y (Eq. 2.2) In Eq 2.2, E is the wave energy at the seaward end of the surf zone according to 1 2 E = ρ gh rms, c g is the wave group velocity and Θ is the wave angle of incidence with 8 respect to shorenormal. Wave conditions measured at deeper water are transformed to the seaward end of the surf zone with the help of a standard parametric wave model (Battjes and Janssen, 1978) including bottom friction, to account for the modification of wave height and direction due to wave refraction and bottom friction along the deeper part of the coastal profile. 6
11 Z336 November, 23 The present version of the Video Interpretation Model does not apply any correction to the image intensity signal to remove the effect of persistent foam drifting at the sea surface. This correction would involve the application of a 2DH version of the Breaker Intensity Model described by Aarninkhof (23), which is not operational yet. 2.3 Bathymetry Assessment Model The Bathymetry Assessment Model BAM updates the surf zone based on differences between the video derived D o (x,y) and the computed rate of roller dissipation D c (x,y) for the latest model (which may be either surveyed, or calculated by the model). For the updating process we use an analogy with morphodynamic modelling for fine sediment, as such an approach often leads to a sensible equilibrium. Instead of the bed shear stress that governs the stirring up or deposition of sediment, we introduce stirring and deposition terms based on the mismatch between D o (x,y) and D c (x,y). The sediment stirred or deposited leads to bottom changes, and these in turn lead to changes in D c (x,y); this decreases the mismatch, so that the model tends towards an equilibrium. BAM aims for a partial update of the bottom elevation on the basis of each single image, without achieving a perfect match between D o (x,y) and D c (x,y). A perfect match would imply an over-fit on noisy intensity characteristics of a particular image. The embedding of BAM in the framework of the overall time dependent model SBM-2DH enables the model to resolve the evolution of nearshore from a sequence of video images with clear wave dissipation patterns. z x z tide (t) Erosion h buf C s (x,y) z b (x,y) Accretion Fig. 2.: Definition sketch of the Bathymetry Assessment Model (BAM) BAM adopts a two-layer approach (Fig. 2.), consisting of the sea bed with elevation z b (x,y) and a sediment buffer layer with sediment availability C s (x,y), representing a sediment volume per unit area [m 3 /m 2 ]. A positive difference D c -D o drives an upward directed erosional sediment flux S E from the sea bed to the buffer layer, causing local erosion of the sea bed and a local increase of C s. A negative D c -D o results in the opposite effect, driving a downward direct accretional sediment flux S A which yields accretion of the sea bed and a decrease of C s in the buffer layer. Alongshore and cross-shore gradients of C s (x,y) drive the horizontal redistribution of sediment within the buffer layer from areas of large C s (sediment surplus in the buffer layer due to sea bed erosion) to regions of small C s (sediment shortage in the buffer layer due to sea bed accretion). The sediment buffer layer was included to guarantee conservation of mass within the overall system. Notice that C s is not related to any physical process like wave breaking induced turbulence. It only provides a sediment buffer to enable erosion and accretion of the sea bed, while facilitating the redistribution of 7
12 Z336 November, 23 sediments within the coastal system. Further details on the BAM model formulations can be found in Aarninkhof (23). Development of the Bathymetry Assessment Model in 2DH mode demands (1) the use of an advanced 2D wave transformation model to accurately describe the shoreward propagation of waves, (2) the inclusion of a 2D roller model to generate roller dissipation maps and (3) the incorporation of a 2D diffusion model to describe the redistribution of C s in the upper layer. The first demand requires the use of a directional wave model like SWAN (Ris, 1997) or HISWA (Holthuijsen et al., 1989), which determines the evolution of the wave direction from a spectral approach. Adopting a simpler approach by determining wave refraction from Snell s law would probably do well in the region of the outer bar, but certainly not in the inner surf zone. Solving the balance equations for wave and roller energy along these directions requires a 2D roller model (second demand) such as recently implemented in Delft3D-FLOW. The third demand requires the implementation of a robust, implicit 2D diffusion code, to solve for the distribution of C s in the upper layer. Considering these functional demands in relation to the functionality readily provided by the Delft3D modelling system, it was decided to implement BAM in the existing Delft3D environment rather than re-programming an advanced wave model plus diffusion code in a Matlab environment. Initial Observed dissipation map(s) Delft3D-FLOW Wave & Roller energy balance, flow field Computed dissipation ASSIM Source / sink terms sediment Advectiondiffusion model Update Delft3D-WAVE HISWA / SWAN Wave direction Fig. 2.6: Flow scheme BAM In Figure 2.6 the overall flow scheme of BAM is shown; the changes to the Delft3D code are limited to a routine ASSIM that reads the observed dissipation maps and interpolates them to the Delft3D grid (which may or may not be the same as the ARGUS grid) and to a section in the existing sediment source/sink routine. The implementation in Delft3D is such that the assimilation with ARGUS data can in principle be combined with a regular morphological run. Note that the embedding BAM in the operational Delft3D environment carries the additional benefit of providing improved opportunities for Data-Model Integration. Being highly 8
13 Z336 November, 23 complementary, there is a mutual benefit in integrating the two information sources. Video observations provide detailed information on the configuration of breaker bars, which can enhance the predictive capability of process-based morphological models through application of advanced data assimilation techniques and improvement of the process formulations in the model. Video observations, however, provide little information in areas outside the regions of actual wave breaking, which hampers the quantification of subtidal from video. These blank regions can be filled in with information on flow velocities or sediment transport rates, computed from morphological models. The key observation is that we are dealing with two complementary information sources, both with their own inaccuracies, whose combination provides added value in view of the development of a real-time coastal monitoring system. The embedding of BAM in the Delft3D environment is a crucial first step towards the realization of such an operational monitoring system. 2.4 Running SBM-2DH Setting up the Bathymetry Assessment Model in its present implementation comprises the following steps: 1. Create a model grid on the same domain as the ARGUS data; 2. Create an initial bathmetry, from data or using a uniform profile; 3. Set up a Delft3D-WAVE model using this grid as bottom grid, and a larger computational grid to avoid boundary disturbances; 4. Set up a Delft3D-FLOW model including sediment of type 'argus', using wave input from the WAVE model, and activating the roller model option;. Set up control module that alternately calls FLOW and WAVE. Water level and are passed from FLOW to WAVE, wave direction and period are passed from WAVE to FLOW. (The roller model computes wave energy, roller energy and dissipation) 6. Test that the model produces stable results on the given ; 7. Specify the number of images used, for how long each image is valid, filenames of dissipation images and their times. The model can be run for a single image or for a time-series of images. When available images are far apart in time, it is most convenient to split up the assimilation process into a number of separate runs, where the resulting for an image is passed on to the (short) simulation for the next image. Nonetheless, the model also allows for continuous simulations. 9
, (ii) the RIPEX experiment in Monterey, CA and (iii) a combined beach and shoreface nourishment in Egmond.")
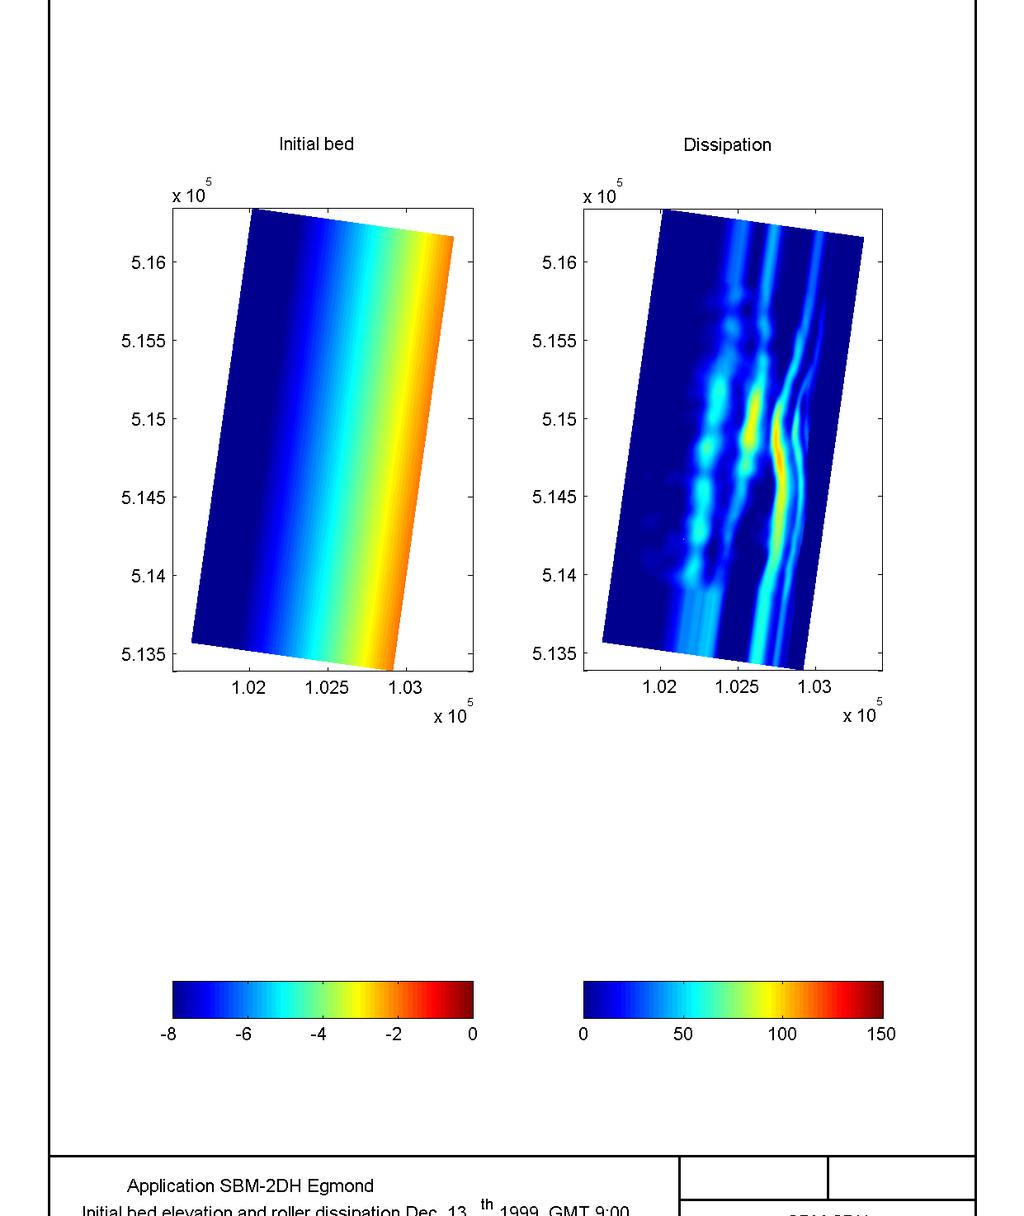
14 Z336 November, 23 3 Model applications SBM-2DH In the framework of this study, the behaviour and potential of SBM-2DH have been evaluated on the basis of three different test cases, namely (i) a synthetic data test (involving the use of artificially generated wave dissipation maps), (ii) the RIPEX experiment in Monterey, CA and (iii) a combined beach and shoreface nourishment in Egmond. The outcome of the three test cases is described in this chapter. 3.1 Synthetic test case In this section, we investigate the behaviour of SBM-2DH on the basis of a synthetic data set. Such a synthetic analysis involves the application of SBM-2DH on the basis of an artificial time series of beach bathymetries and hydrodynamic conditions. First, the Delft3D wave model is used to compute a data set of roller dissipation patterns, based on the known and hydrodynamic conditions. Next, the computed dissipation patterns are interpreted as the measured wave dissipation D o (i.e., as if they were measured from video). Starting from an arbitrary initial (for instance a uniform beach) and the artificially generated set of D o, the Bathymetry Assessment Model of SBM-2DH can be used to re-create the original beach from an ideal data set of wave dissipation patterns plus the actual hydrodynamic conditions. Such a synthetic analysis enables us to verify correct implementation of the BAM model formulations and to gain insight in BAM behaviour for different model parameter settings. Fig. 3.1: Initial for the synthetic test case (backward run) and the superimposed Gaussian hump to be re-constructed. 1
15 Z336 November, 23 The synthetic test case considered here involves the modelling of a shoreface nourishment, superimposed on a uniform with a 1:1 beach slope and a 2 m water depth at the seaward boundary (Fig. 3.1). The nourishment is described as a Gaussian-shaped hump of 3 m height and with a standard deviation of 3 m, located at m water depth in the central part of the model. The computational domain measures 2 m cross-shore by 2 m alongshore, with a relatively course grid spacing of 4 m and 1 m, respectively. The model is forced by waves with a constant wave height H sig = 2 m, peak period T peak = 7 s and wave angle Θ = 3 deg. with respect to shorenormal. During the experiment, the water level is linearly lowered from z = m to z = -2.4 m. The latter is done to obtain a wave dissipation signal along a larger portion of the beach profile, as wave dissipation patterns migrate seaward with a decreasing water levels (e.g. Van Enckevort and Ruessink, 21). The forward simulation to generate synthetic roller dissipation maps is run over a nourished beach topography with a time step of.1 minute. The total simulation period is 2 hours. To initialize the model, the water level is set a constant level z = m throughout the first hour. During the second hour, the water level is linearly lowered from z = m to z = -2.4 m and wave dissipation maps are written to file every 1 minutes. This yields a data set of 7 wave dissipation maps, which provide the input for the backward simulation. The backward simulation is also run with a time step of.1 minute, but starts from a uniform beach (Fig. 3.1, left panel). Like the forward run, the backward simulation covers a total simulation period of 2 hours, the first hour again being used for model initialization. After 1 hour, SBM-2DH picks up the first artificially generated wave dissipation map and starts re-creating the nourished beach. Every 1 minutes, the measured dissipation pattern is updated on the basis of the dissipation maps that were written to file during the forward simulation. The final result after 2 hours is shown in Fig. 3.2 by means of the measured roller dissipation (or target dissipation, left panel), the final (middle panel) and the cumulative bottom changes (right panel). Notice that the color bar of the plot ranges from -8 m to m in stead of -2 m to m, to highlight the contours the shoreface nourishment. 11

16 Z336 November, 23 D r (N/m/s) z b (m) z b (m) Fig. 3.2: Reconstruction of a Gaussian-shaped shoreface nourishment from synthetic roller dissipation maps. Final result after 2 hours. The right panel of Fig. 3.2 shows that SBM-2DH successfully reconstructs a shoreface nourishment of approximately 3 m height. Bathymetrical changes are virtually zero outside the region of the nourishment. The evolution of bathymetrical changes over time is presented in Appendix A. The models initially predicts erosion of sediment at the lee side of the nourishment, which can be attributed to the initial absence of the nourishment in the backward simulation which induces an overestimate of roller dissipation rates near the shoreline (hence erosion). With ongoing accretion in the nourished area, the nourishment increasingly attracks wave dissipation, which causes a decrease of roller dissipation rates near the shoreline. The latter induces the accretion of sediment, thus revealing a favorable self-correcting mechanism. Although it would be appropriate to extend the synthetic analysis to explore model behaviour over a wider range beach configurations, hydrodynamic conditions and parameter settings, we presently conclude that the synthetic test case considered here suggests that the model formulations are correctly implemented and that SBM-2DH allows for morphodynamic computations at realistic spatial scales. 3.2 RIPEX experiment California A preliminary first field test case was carried out using data from the RIP current Experiment (RIPEX), Reniers et al., 22). This experiment took place in Monterey Bay in the spring of 21. Available data used here are offshore wave parameters, measured at May, 21 and one observed video image on May 6, 21 at 21: hrs, provided by Nathaniel Plant at NRL in Stennis. Waves measured at deep water had wave height Hrms =.7 m, Tp = 1.7 s, direction almost completely shore-normal. 12

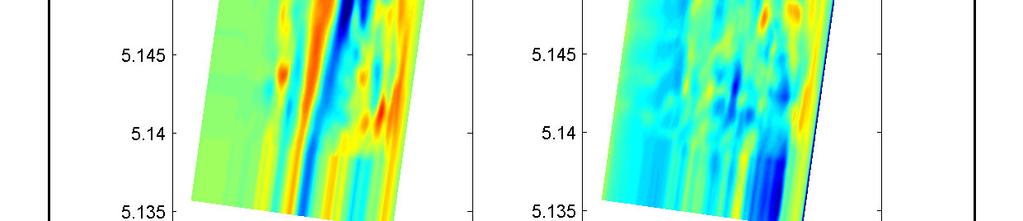
17 Z336 November, 23 The video image consisted of one camera view only; the original image is shown in Figure 3.3. This image was extended in alongshore direction in order to obtain a rectangular area; the dry part was set to. Image intensities were corrected for background intensity levels and scaled to quantitatively match computed roller dissipation rates with the help of the methodology introduced in Section 2.2. Fig. 3.3: Video image RIPEX experiment The measured profile at Y= m was used to produce an initial that was uniform in alongshore direction. The computational grid has a grid size approx. 2.3 m by m, which is 1x1 times as coarse as the (very high-resolution) video data. The flow+roller model was run with a time step of 1.2 s; the wave directions were updated every 3 flow time steps by running HISWA over a larger domain. The result after spinning up the roller model on the initial is shown in Figure 3.4. The lower two panels show the dissipation measured from video (or target dissipation ) and the measured, the top panels the initial state of the model. The measured shows very well developed rip channels, which are clearly reflected in the video image. Morphological updating started after minutes of initialisation time, mainly needed to spin up the roller model. Figure 3. shows the updated and dissipation map after another 7 minutes (21 steps, 7 HISWA updates). The pattern of dissipation matches the target pattern very well, except in the very nearhore. The adjusted shows rip channels at roughly the same locations as in the measured. 13
18 Z336 November, 23 In Figure 3.6 shows some cross-sections at m spacing, roughly coinciding with rip channels and bar crests. The area seaward of X=1 m, with a depth between 1 and 4 m, shows a remarkably good match, with deviations in the order of dm s. In the very shallow area the agreement is not good. Results for an alongshore transect are shown in Figure 3.7. The locations of bar crests and troughs in the middle part agree within 1-2 m, and the depths at the shallowest parts within a couple of dm s; discrepancies in the rip channel depths are larger as could be expected. Despite the large deviations at shallow water depths of less than 1 m, we conclude that the results are promising, particularly given the fact that only one image was used up till now. Fig. 3.4: Initial state of model, RIPEX experiment Monterey Bay 14

19 Z336 November, 23 Fig. 3.: Final state of model after 12 minutes of simulation time Fig. 3.6: Comparison of initial, computed and observed cross-shore profiles 1
20 Z336 November, 23 Fig. 3.7: Comparison of computed and observed longshore profiles of depth (left) and intensity (right) 3.3 Combined nourishment Egmond To assess the capability of SBM-2DH for a Dutch coastal site, the model is applied to quantify the evolution of subtidal along a 2 km coastal stretch at Egmond, over a 18 month period starting December During this period, the WESP was used to survey nearshore twice per year, typically along cross-shore profiles with 1 m spacing alongshore. The measured depth is estimated to have an error of less than 1 cm. The survey data were interpolated to a rectangular grid with a cross-shore and alongshore spacing of 1 m, yielding good-quality bathymetrical maps of September 1999, May 2, September 2 and April 21. Offshore wave conditions (H rms, T p and Θ) were measured with a directional wave buoy at IJmuiden, located approximately 1 km to the south of the nourished site. Approximately % of the missing data, which occurred during 1% of time, could be replaced by values from an identical buoy approximately 7 km to the north. Offshore tidal levels are found from interpolation in water level data collected at tidal stations located 1 km north and south of Egmond. Video data were collected hourly with an Argus video station, installed at 43 m above sea level on top of the Egmond lighthouse Jan van Speyk for the purpose of monitoring the morphological evolution of the nourished area. For the purpose of this study, time-averaged video intensity data were sampled from all five cameras, covering the central part of the 16
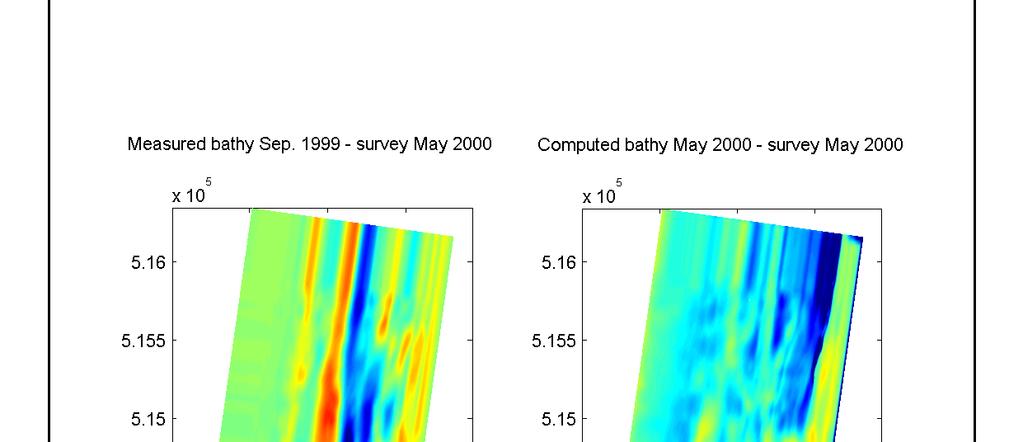
21 Z336 November, 23 nourished area up to 1 km north and south of the video station. SBM-2DH computations are performed on the basis of 13 hand-picked, merged images of good-quality and sufficient wave breaking, which are indicated in Fig Fig. 3.8: Characterization of the Egmond data set. Evolution of wave height during the study period (solid line) and times of good-quality video images (circles) The results of the SBM-2DH application at Egmond are shown in Appendix B. The computed bathymetries at 17//2, 28/9/2 and 19/3/21 are compared to the surveyed batyhmetries of May 2, September 2 and April 21 (Fig. B.2a B.2c). Figures B.3a B.3c present the vertical model deviations in the months listed above (right panel), as well as the morphological changes measured in the field between September 1999 and the month of interest. Including the latter provides the opportunity to assess the added value of SBM-2DH as compared to the situation where you would assume no morphological changes at all (i.e. the situation where the most recent bathymetrical survey is the best estimate of present ). To facilitate the interpretation of results, Figures B.4a B.4g provide the morphological evolution along 7 cross-shore beach profiles spacing 3 m alongshore, located within 9 m on each side of the video station. Finally, as a measure of overall model accuracy, Fig. B. shows the cross-shore variation of the root mean square vertical error determined along shore-parallel lines covering the entire grid in alongshore sense. In the remainder of this section, we present a preliminary analysis of SBM-2DH behaviour based on a very concise analysis of the data available. Along the upper part of the beach profile (i.e. landward of the subtidal bars), the results show a continuous lowering of the bed elevation (Fig. B4.a-B4.g). This is induced by the type of landward boundary condition presently applied, which may be reconsidered for future applications. In the central part of the study area, fair results are found in the inner surf zone during the first few months, showing some underestimation of water depth. This turns into an overestimation of water depth during the second part of the study period. More detailed investigation of the results learn that this increase in water depth is initiated by the inclusion of video data sampled at July 12, 2, which apparently cannot be corrected afterwards. This observation confirms the potentially negative effect of including noisy video data, in combination with relatively large bathymetrical updates per image. An overestimate of the water depth at shallow water is also observed in the northern and southern part of the model, indicating that video-derived roller dissipation patterns underestimate the actual dissipation rates. This may be induced by relatively poor image contrast for the far-field regions in the outer cameras. 17


22 Z336 November, 23 At deep water (i.e. seaward of the breaker bars), the model results show a continuous overestimate of the water depth from the first image onwards, which increases with time. This suggests the accumulation of small errors over time, caused by an underestimate of video-derived dissipation rates. To improve model performance at this point, we need to reconsider the procedure for the correction of background illuminations, which presently sets wave dissipation rates to zero at deeper water. As a result, any model-predicted wave dissipation in the region will induce a lowering of the bed elevation. Besides, calibration of the wave model (for instance, an increase of the dissipation parameter γ) will also have a positive effect. In the bar zone, the application of SBM-2DH yields moderately good results. The outer bar and trough region initially show fair results, which suddenly turns into a large overestimation of the trough depth. The background of this non-favorable shift needs further investigation. The middle bar and trough region generally show an overestimation of the water depth at both the bar crest and the trough, albeit that the relative difference between both (or bar height ) is remarkably correct. Owing to the considerable morphodynamic activity in the inner surf zone at the time scale of days to weeks, an absolute interpretation of model accuracy in this shallow region is hampered by the time offset between the dates of the field survey and the model computation. Rip current (?) Fig. 3.9: Plan-view Argus video image and SBM-2DH computed flow field at Egmond dd. June 22, 2. The Argus image shows the central part of the nourished area, covering cross-shore and alongshore distances of (approximately) 3 m and 6 m. The coordinates along the computed flow field are referenced against the RD-coordinate system, which has its origin in Paris and a positive x (y) axis pointing towards the east (north). The model deviations qualitatively reported above are confirmed in Fig. B., which shows that rms profile deviations are initially in the order of tens of centimeters. Profile deviations are found to increase over time, which suggests the accumulation of small errors. Unrealistically large rms deviations are found in the trough regions and near the shoreline, 18
23 Z336 November, 23 both regions that need further consideration. However, it should be noted that no attention has been paid so-far to the calibration of SBM-2DH (nor the wave model, nor the Bathymetry Assessment Model). Furthermore, the model manages to preserve the characteristic bar-trough configuration throughout the entire 1. year study. Promising model performance is further revealed from the realistic flow field computed in June 2 (Fig. 3.9), showing a strong rip current crossing the inner bar. The corresponding plan-view video image of June 22 vagely reveals a depression in the wave dissipation pattern at the same location, which may also reflect the presence of a rip current. The latter observation clearly highlights the potential of the combination of sophisiticated models and highresolution video. 19
24 Z336 November, 23 4 Recommendations On the basis of the concise analysis of SBM-2DH behaviour performed so-far, we recommended the following research activities to improve model performance: Inclusion of video-derived intertidal beach bathymetries as a shoreward boundary condition of SBM-2DH. As the performance of wave models generally decreases at shallow water owing to the non-linearity of the wave field, the inclusion of highlyaccurate IBM results would certainly contribute to SBM-2DH performance in this area. The potential for this extension is illustrated with the help of Figures B.4a - B.4g, which show estimates near the shoreline obtained from Caljouw (2) and Nipius (22), generated with the Intertidal Beach Mapper (Aarninkhof, 23). Improvement of the Video Interpretation Model. Although the new approach for the quantitative interpretation of 2DH merged images yields surprisingly smooth wave dissipation maps covering multiple cameras, video-derived dissipation maps still appear to underestimate wave dissipation rates in the far-field of the outer cameras. Furthermore, no correction for the effect of persistent foam drifting at the water surface (cf. Aarninkhof, 23) has been applied yet. As the inclusion of poor quality video data was found to strongly affect the performance of SBM-2DH, further testing and improvement of the Video Interpretation is of crucial importance. Incorporation of large numbers of images. The present Egmond application was based on a limited number of video images, hence relatively large morphological updates per image. As a result, individual, poor-quality images strongly affect the model outcome. To reduce the negative contribution of individual, poor quality images, it is necessary to incorporate many more video images to arrive at a gradual update of surf zone. Improvement and calibration of the Bathymetry Assessment Model. So-far, no attention has been paid to the calibration of the erosion and sedimentation parameters of the Bathymetry Assessment model. Earlier work (Aarninkhof, 23) has shown that these parameter strongly govern model performance. In addition, we could consider the development of a threshold criterion on wave dissipation levels, to avoid the accumulation of small errors over time due to the inclusion of noisy video data. Calibration of the Delft3D wave model. Proper calibration of the wave model (particularly the wave dissipation parameter γ) may yield improved estimates of the roller dissipation, that better match the video-derived dissipation rates. Besides, the use of an alternative wave dissipation formulation (e.g. Baldock, 1998) may positively affect SBM-2DH performance. Inclusion of model-derived process information. The inclusion of model-derived process information, like flow velocities or sediment transport rates, allows for the improvement of SBM-2DH performance in areas without any wave dissipation (like the trough regions and at deeper water). This extension demands the use of Delft3D in fully mophological mode. 2
25 Z336 November, 23 Conclusions The goal of this pilot study was to extend an existing 1D model for the quantification of subtidal water depth from video observations of wave breaking for use in 2DH mode, and to demonstrate its capabilities on the basis of three different test cases. With respect to model development and implementation, the major findings of this study are: The newly developed Video Interpretation Model yields surprisingly smooth wave dissipation maps covering multiple cameras, which however still appear to underestimate wave dissipation rates in the far-field of the outer cameras (causing an underestimate of the bottom elevation in those regions). The methodology for the update of subtidal beach through assimilation of video-derived and model-predicted patterns of wave dissipation has successfully been integrated in the Delft3D modelling environment, so that it benefits from existing functionality offered by the operational Delft3D model. The practical potential of the newly developed model named SBM-2DH has been investigated through application to three different test cases. The main findings of this application phase are: For a synthetic test case (involving the use of artificially generated wave dissipation patterns), the model successfully re-creates a shoreface nourishment. Although it would be appropriate to extend the synthetic analysis to explore model behaviour over a wider range beach configurations, hydrodynamic conditions and parameter settings, the single test considered here suggests that the model formulations are correctly implemented and that SBM-2DH allows for morphodynamic computations at realistic spatial scales At Monterey Bay (California), the model realistically reveals a rip current system from a single video image. With vertical deviations in the order of tens of centimeters, model results are remarkably good at water depths in exceedance of 1 m. In more shallow areas, the agreement is not good. At Egmond, SBM-2DH bed level deviations initially are in the order of tens of centimeters and increase over time. Except for the central part of the nourished area during the first part of the study period, the model shows a persistent overestimation of the water depth. Model performance in the bar regions is relatively good as compared to the neighbouring trough regions. Still, the model manages to preserve the bar-trough geometry, which is an important and favorable model characteristic. Overall, the model was found to robustly converge within tens of seconds, which makes our approach towards the quantification of two-dimensional entirely feasible. The integration of high-resolution video observations and the sophisticated Delft3D modelling environment as achieved in the framework of this study opens the door towards the development of an operational monitoring system for the real-time prediction of hydrodynamic processes and morphological changes in the nearshore zone 21
26 Z336 November, 23 References Aarninkhof, S.G.J. (23). Nearshore Bathymetry derived from video imagery. PhD. thesis, Delft University of Technology, 17 pp. Baldock, T.E., Holmes, P. Bunker, S. and Van Weert, P. (1998). Cross-shore hydrodynamics within an unsaturated surf zone. Coastal Engineering 34, pp Caljouw, M. (2). Video-based monitoring of beach- and shoreface nourishments. MSc. thesis, Delft University of Technology. MacMahan, J., Reniers, A.J.H.M., Thornton, E.B., Stanton, T. and Dean, R.G. (22). RIPEX: Rip current pulsation measurements. Proc. of the 28 th International Conference on Coastal Engineering, Cardiff (Wales), pp Nipius, L. (22). Evaluation of nourishments at Egmond with Argus video monitoring and Delft3D-MOR. MSc. thesis, Delft University of Technology. Reniers, A.J.H.M., MacMahan, J., Thornton, E.B. and Stanton, T. (22). RIPEX: Ripcurrent pulsation modelling. Proc. of the 28 th International Conference on Coastal Engineering, Cardiff (Wales), pp Ris, R.C. (1997). Spectral modelling of wind waves in coastal areas. PhD. thesis, Delft University of Technology, 162 pp. Van Enckevort, I.M.J. and Ruessink, B.G. (21). Effects of hydrodynamics and on video estimates of nearshore sandbar position. Journal of Geophysical Research, 16, pp
27 Z336 November, 23 Appendix A 23
28 Time t = 61 mn. Time t = 81 mn Time t = 11 mn. Time t = 121 mn SBM 2DH Application synthetic data WL DELFT HYDRAULICS SBM 2DH Z336 Fig. A.1
29 Z336 November, 23 Appendix B 24
30
31
32
33
34
35
36
37 Bottom elevation [m] 1 Measured May 2 Measured Sep Computed SBM 2DH May 2 IBM May x 1 Bottom elevation [m] 1 Measured Sep. 2 Measured Sep Computed SBM 2DH Sep. 2 IBM Sep x 1 Bottom elevation [m] 1 1 Measured Apr. 21 Measured Sep Computed SBM 2DH Apr. 21 IBM Apr x 1 Profile evolution transect Y= 9m (approx. RD Y=167) Egmond station Jan van Speijk WL DELFT HYDRAULICS Z336 SBM 2DH Fig. B.4a
38 Bottom elevation [m] 1 Measured May 2 Measured Sep Computed SBM 2DH May 2 IBM May x 1 Bottom elevation [m] 1 Measured Sep. 2 Measured Sep Computed SBM 2DH Sep. 2 IBM Sep x 1 Bottom elevation [m] 1 1 Measured Apr. 21 Measured Sep Computed SBM 2DH Apr. 21 IBM Apr x 1 Profile evolution transect Y= 6m (approx. RD Y=138) Egmond station Jan van Speijk WL DELFT HYDRAULICS Z336 SBM 2DH Fig. B.4b
39 Bottom elevation [m] 1 Measured May 2 Measured Sep Computed SBM 2DH May 2 IBM May x 1 Bottom elevation [m] 1 Measured Sep. 2 Measured Sep Computed SBM 2DH Sep. 2 IBM Sep x 1 Bottom elevation [m] 1 1 Measured Apr. 21 Measured Sep Computed SBM 2DH Apr. 21 IBM Apr x 1 Profile evolution transect Y= 3m (approx. RD Y=18) Egmond station Jan van Speijk WL DELFT HYDRAULICS Z336 SBM 2DH Fig. B.4c
40 Bottom elevation [m] 1 Measured May 2 Measured Sep Computed SBM 2DH May 2 IBM May x 1 Bottom elevation [m] 1 Measured Sep. 2 Measured Sep Computed SBM 2DH Sep. 2 IBM Sep x 1 Bottom elevation [m] 1 1 Measured Apr. 21 Measured Sep Computed SBM 2DH Apr. 21 IBM Apr x 1 Profile evolution transect Y= m (approx. RD Y=1478) Egmond station Jan van Speijk WL DELFT HYDRAULICS Z336 SBM 2DH Fig. B.4d
41 Bottom elevation [m] 1 Measured May 2 Measured Sep Computed SBM 2DH May 2 IBM May x 1 Bottom elevation [m] 1 Measured Sep. 2 Measured Sep Computed SBM 2DH Sep. 2 IBM Sep x 1 Bottom elevation [m] 1 1 Measured Apr. 21 Measured Sep Computed SBM 2DH Apr. 21 IBM Apr x 1 Profile evolution transect Y= 3m (approx. RD Y=1448) Egmond station Jan van Speijk WL DELFT HYDRAULICS Z336 SBM 2DH Fig. B.4e
42 Bottom elevation [m] 1 Measured May 2 Measured Sep Computed SBM 2DH May 2 IBM May x 1 Bottom elevation [m] 1 Measured Sep. 2 Measured Sep Computed SBM 2DH Sep. 2 IBM Sep x 1 Bottom elevation [m] 1 1 Measured Apr. 21 Measured Sep Computed SBM 2DH Apr. 21 IBM Apr x 1 Profile evolution transect Y= 6m (approx. RD Y=1419) Egmond station Jan van Speijk SBM 2DH WL DELFT HYDRAULICS Z336 Fig. B.4f
43 Bottom elevation [m] 1 Measured May 2 Measured Sep Computed SBM 2DH May 2 IBM May x 1 Bottom elevation [m] 1 1 Measured Sep. 2 Measured Sep Computed SBM 2DH Sep. 2 IBM Sep x 1 Bottom elevation [m] 1 1 Measured Apr. 21 Measured Sep Computed SBM 2DH Apr. 21 IBM Apr x 1 Profile evolution transect Y= 9m (approx. RD Y=1389) Egmond station Jan van Speijk WL DELFT HYDRAULICS Z336 SBM 2DH Fig. B.4g
44 RMS error May 2 4 RMS error [m] x 1 RMS error Sep. 2 4 RMS error [m] x 1 RMS error Apr RMS error [m] x 1 Cross shore evolution of RMS error in bed elevations Egmond station Jan van Speijk WL DELFT HYDRAULICS SBM 2DH Z336 Fig. B.

45
Beach Wizard: Development of an Operational Nowcast, Short-Term Forecast System for Nearshore Hydrodynamics and Bathymetric Evolution
 Beach Wizard: Development of an Operational Nowcast, Short-Term Forecast System for Nearshore Hydrodynamics and Bathymetric Evolution Ad Reniers Civil Engineering and Geosciences, Delft University of Technology
HYDRODYNAMICS AND MORPHODYNAMICS IN THE SURF ZONE OF A DISSIPATIVE BEACH
 HYDRODYNAMICS AND MORPHODYNAMICS IN THE SURF ZONE OF A DISSIPATIVE BEACH Leo C. van Rijn, Dirk Jan R. Walstra, Bart T. Grasmeijer and Kees Kleinhout Abstract: Two profile models have been compared with
Undertow - Zonation of Flow in Broken Wave Bores
 Nearshore Circulation Undertow and Rip Cells Undertow - Zonation of Flow in Broken Wave Bores In the wave breaking process, the landward transfer of water, associated with bore and surface roller decay
Undertow - Zonation of Flow in Broken Wave Bores
 Lecture 22 Nearshore Circulation Undertow - Zonation of Flow in Broken Wave Bores In the wave breaking process, the landward transfer of water, associated with bore and surface roller decay within the
Prediction of Nearshore Waves and Currents: Model Sensitivity, Confidence and Assimilation
 Prediction of Nearshore Waves and Currents: Model Sensitivity, Confidence and Assimilation H. Tuba Özkan-Haller College of Oceanic and Atmospheric Sciences Oregon State University, 104 Ocean Admin Bldg
Morphodynamic Modelling of a Shoreface Nourishment at Egmond-aan-Zee, The Netherlands
 Morphodynamic Modelling of a Shoreface Nourishment at Egmond-aan-Zee, The Netherlands Christophe BRIERE 1, Maarten van ORMONDT 1, Dirk-Jan WALSTRA 1,2 1 Deltares WL Delft Hydraulics, PO Box 177, 2600 MH
Cross-shore sediment transports on a cut profile for large scale land reclamations
 Cross-shore sediment transports on a cut profile for large scale land reclamations Martijn Onderwater 1 Dano Roelvink Jan van de Graaff 3 Abstract When building a large scale land reclamation, the safest
Appendix E Cat Island Borrow Area Analysis
 Appendix E Cat Island Borrow Area Analysis ERDC/CHL Letter Report 1 Cat Island Borrow Area Analysis Multiple borrow area configurations were considered for Cat Island restoration. Borrow area CI1 is located
5. MODELLING OF NEARSHORE PROFILE DEVELOPMENT 5.1. INTRODUCTION
 5. MODELLING OF NEARSHORE PROFILE DEVELOPMENT 5.. INTRODUCTION Morphodynamic coastal profile models are commonly used for hind- and forecasting studies of nearshore bathymetry, often in response to human
CROSS-SHORE SEDIMENT PROCESSES
 The University of the West Indies Organization of American States PROFESSIONAL DEVELOPMENT PROGRAMME: COASTAL INFRASTRUCTURE DESIGN, CONSTRUCTION AND MAINTENANCE A COURSE IN COASTAL DEFENSE SYSTEMS I CHAPTER
IMAGE-BASED FIELD OBSERVATION OF INFRAGRAVITY WAVES ALONG THE SWASH ZONE. Yoshimitsu Tajima 1
 IMAGE-BASED FIELD OBSERVATION OF INFRAGRAVITY WAVES ALONG THE SWASH ZONE Yoshimitsu Tajima 1 This study develops an image-based monitoring techniques for observations of surf zone hydrodynamics especially
Volume and Shoreline Changes along Pinellas County Beaches during Tropical Storm Debby
 Volume and Shoreline Changes along Pinellas County Beaches during Tropical Storm Debby Ping Wang and Tiffany M. Roberts Coastal Research Laboratory University of South Florida July 24, 2012 Introduction
SURF ZONE HYDRODYNAMICS COMPARISON OF MODELLING AND FIELD DATA
 SURF ZONE HYDRODYNAMICS COMPARISON OF MODELLING AND FIELD DATA Nicholas Grunnet 1, Kévin Martins 2, Rolf Deigaard 3 and Nils Drønen 4 Field data from the NOURTEC project is used for comparison with simulation
Unsteady Wave-Driven Circulation Cells Relevant to Rip Currents and Coastal Engineering
 Unsteady Wave-Driven Circulation Cells Relevant to Rip Currents and Coastal Engineering Andrew Kennedy Dept of Civil and Coastal Engineering 365 Weil Hall University of Florida Gainesville, FL 32611 phone:
Nearshore Morphodynamics. Bars and Nearshore Bathymetry. Sediment packages parallel to shore, that store beach sediment
 Nearshore Morphodynamics http://coastal.er.usgs.gov/bier/images/chandeleur-xbeach-lg.jpg Bars and Nearshore Bathymetry Sediment packages parallel to shore, that store beach sediment Can be up to 50 km
IMAGE-BASED STUDY OF BREAKING AND BROKEN WAVE CHARACTERISTICS IN FRONT OF THE SEAWALL
 IMAGE-BASED STUDY OF BREAKING AND BROKEN WAVE CHARACTERISTICS IN FRONT OF THE SEAWALL Weijie Liu 1 and Yoshimitsu Tajima 1 This study aims to study the breaking and broken wave characteristics in front
Use of video imagery to test model predictions of surf heights
 Coastal Processes 39 Use of video imagery to test model predictions of surf heights D. Huntley 1, A. Saulter 2, K. Kingston 1 & R. Holman 3 1 Marine Institute and School of Earth, Ocean and Environmental
IMPACTS OF COASTAL PROTECTION STRATEGIES ON THE COASTS OF CRETE: NUMERICAL EXPERIMENTS
 IMPACTS OF COASTAL PROTECTION STRATEGIES ON THE COASTS OF CRETE: NUMERICAL EXPERIMENTS Tsanis, I.K., Saied, U.M., Valavanis V. Department of Environmental Engineering, Technical University of Crete, Chania,
DUXBURY WAVE MODELING STUDY
 DUXBURY WAVE MODELING STUDY 2008 Status Report Duncan M. FitzGerald Peter S. Rosen Boston University Northeaster University Boston, MA 02215 Boston, MA 02115 Submitted to: DUXBURY BEACH RESERVATION November
THE WAVE CLIMATE IN THE BELGIAN COASTAL ZONE
 THE WAVE CLIMATE IN THE BELGIAN COASTAL ZONE Toon Verwaest, Flanders Hydraulics Research, toon.verwaest@mow.vlaanderen.be Sarah Doorme, IMDC, sarah.doorme@imdc.be Kristof Verelst, Flanders Hydraulics Research,
Inlet Management Study for Pass-A-Grille and Bunces Pass, Pinellas County, Florida
 Inlet Management Study for Pass-A-Grille and Bunces Pass, Pinellas County, Florida Final Report Submitted By Ping Wang, Ph.D., Jun Cheng Ph.D., Zachary Westfall, and Mathieu Vallee Coastal Research Laboratory
Wave Breaking, Infragravity Waves, And Sediment Transport In The Nearshore
 Wave Breaking, Infragravity Waves, And Sediment Transport In The Nearshore Dr. Thomas C. Lippmann Center for Coastal Studies Scripps Institution of Oceanography University of California, San Diego La Jolla,
WAVE BREAKING AND DISSIPATION IN THE NEARSHORE
 WAVE BREAKING AND DISSIPATION IN THE NEARSHORE LONG-TERM GOALS Dr. Thomas C. Lippmann Center for Coastal Studies Scripps Institution of Oceanography University of California, San Diego 9500 Gilman Dr.
Pathways Interns: Annika O Dea, Ian Conery, Andrea Albright
 1 REMOTE SENSING OF COASTAL MORPHODYNAMICS 237 237 237 217 217 217 2 2 2 8 119 27 252 174.59 255 255 255 163 163 163 131 132 122 239 65 53 11 135 12 112 92 56 62 12 13 12 56 48 13 12 111 Kate Brodie Brittany
Development and Implementation of a Relocatable Coastal and Nearshore Modeling System
 Development and Implementation of a Relocatable Coastal and Nearshore Modeling System James M. Kaihatu Zachry Department of Civil Engineering, Texas A&M University 3136 TAMU College Station, TX 77843-3136
HURRICANE SANDY LIMITED REEVALUATION REPORT UNION BEACH, NEW JERSEY DRAFT ENGINEERING APPENDIX SUB APPENDIX D SBEACH MODELING
 HURRICANE SANDY LIMITED REEVALUATION REPORT UNION BEACH, NEW JERSEY DRAFT ENGINEERING APPENDIX SUB APPENDIX D SBEACH MODELING Rev. 18 Feb 2015 1 SBEACH Modeling 1.0 Introduction Following the methodology
RESPONSE OF A SHORELINE SAND WAVE TO BEACH NOURISHMENT
 RESPONSE OF A SHORELINE SAND WAVE TO BEACH NOURISHMENT Kathelijne M. Wijnberg 1, Stefan G.J. Aarninkhof 2 and Ruud Spanhoff 3 On Egmond beach, The Netherlands, the trough of a shoreline sand wave was filled
Rip Currents Onshore Submarine Canyons: NCEX Analysis
 Rip Currents Onshore Submarine Canyons: NCEX Analysis Dr. Thomas C. Lippmann Civil and Environmental Engineering & Geodetic Science, Byrd Polar Research Center, 1090 Carmack Rd., Ohio State University,
EVOLUTION OF ALONGSHORE BATHYMETRIC VARIABILITY AROUND A MEGA-SCALE BEACH NOURISHMENT. Abstract
 EVOLUTION OF ALONGSHORE BATHYMETRIC VARIABILITY AROUND A MEGA-SCALE BEACH NOURISHMENT Max Radermacher 1,2, Wessel Geerlof 1, Matthieu de Schipper 1,3, Bas Huisman 1,4, Stefan Aarninkhof 1 and Ad Reniers
Analyses of Amelander Nourishments. Sander van Rooij
 Analyses of Amelander Nourishments Sander van Rooij Deltares, 2008 Prepared for: Kustlijnzorg Analyses of Amelander Nourishments Sander van Rooij Report December 2008 Z4582.12 Client Kustlijnzorg Title
RCEX: Rip Current Experiment
 RCEX: Rip Current Experiment Jamie MacMahan Oceanography Department, Spanagel 327c, Building 232 Naval Postgraduate School, Monterey, CA 93943 Phone: (831) 656-2379 Fax: (831) 656-2712 Email: jhmacmah@nps.edu
Marijn Celeste Boll ( ) MSc Thesis Physical Geography Track: Coastal Dynamics. Supervisor: Prof. Dr. B.G. Ruessink
 MSc Thesis Physical Geography Track: Coastal Dynamics. Supervisor: Prof. Dr. B.G. Ruessink") Marijn Celeste Boll (328696) MSc Thesis Physical Geography Track: Coastal Dynamics Supervisor: Prof. Dr. B.G. Ruessink Department of Physical Geography Faculty of Geosciences Utrecht University The Netherlands
Marijn Celeste Boll (328696) MSc Thesis Physical Geography Track: Coastal Dynamics Supervisor: Prof. Dr. B.G. Ruessink Department of Physical Geography Faculty of Geosciences Utrecht University The Netherlands
STORM RESPONSE SIMULATION
 APPENDIX V STORM RESPONSE SIMULATION Final Environmental Impact Statement Village of Bald Head Island Shoreline Protection Project Brunswick County, North Carolina Delft3D Storm Response Simulations With
MIAMI BEACH 32ND STREET HOT SPOT: NUMERICAL MODELING AND DESIGN OPTIMIZATION. Adam Shah - Coastal Engineer Harvey Sasso P.E.
 ABSTRACT MIAMI BEACH 32ND STREET HOT SPOT: NUMERICAL MODELING AND DESIGN OPTIMIZATION Adam Shah - Coastal Engineer Harvey Sasso P.E. - Principal Coastal Systems International, Inc. 464 South Dixie Highway
Nearshore Placed Mound Physical Model Experiment
 Nearshore Placed Mound Physical Model Experiment PURPOSE: This technical note describes the migration and dispersion of a nearshore mound subjected to waves in a physical model. The summary includes recommendations
Using UNIBEST and Delft3D
 5 th Delft3D-OSS webinar Large scale long-term coastline modelling Using UNIBEST and Delft3D 14 March 2012 Aims Basic information on CL-models Model setup Trigger discussion > Delft3D = open source > UNIBEST
Appendix D: SWAN Wave Modelling
 Appendix D: SWAN Wave Modelling D.1 Preamble The Eurobodalla Shire Council area is subject to extreme waves originating from offshore storms. When swell waves approach the coast, they are modified by the
SORTING AND SELECTIVE MOVEMENT OF SEDIMENT ON COAST WITH STEEP SLOPE- MASUREMENTS AND PREDICTION
 SORTING AND SELECTIVE MOVEMENT OF SEDIMENT ON COAST WITH STEEP SLOPE- MASUREMENTS AND PREDICTION Toshiro San-nami 1, Takaaki Uda 2, Masumi Serizawa 1 and Toshinori Ishikawa 2 Conveyer belts carrying gravel
Directional Wave Spectra from Video Images Data and SWAN Model. Keywords: Directional wave spectra; SWAN; video images; pixels
 Jurnal Teknologi Full paper Directional Wave Spectra from Video Images Data and SWAN Model Muhammad Zikra a*, Noriaki Hashimoto b, Masaru Yamashiro b, Kojiro Suzuki c a Department of Ocean Engineering,
Wave behaviour in the inner surf zone
 Wave behaviour in the inner surf zone Hannah POWER 1 and Michael HUGHES 2 Abstract: The inner surf zone is a critical component of models that are used to predict nearshore wave behaviour and beach morphodynamics.
An integrated three-dimensional model of wave-induced pore pressure and effective stresses in a porous seabed: II. Breaking waves
 An integrated three-dimensional model of wave-induced pore pressure and effective stresses in a porous seabed: II. Breaking waves Author Jeng, D., Zhang, Hong Published 2005 Journal Title Ocean Engineering
COASTAL PROTECTION AGAINST WIND-WAVE INDUCED EROSION USING SOFT AND POROUS STRUCTURES: A CASE STUDY AT LAKE BIEL, SWITZERLAND
 COASTAL PROTECTION AGAINST WIND-WAVE INDUCED EROSION USING SOFT AND POROUS STRUCTURES: A CASE STUDY AT LAKE BIEL, SWITZERLAND Selim M. Sayah 1 and Stephan Mai 2 1. Swiss Federal Institute of Technology
SELECTION OF THE PREFERRED MANAGEMENT OPTION FOR STOCKTON BEACH APPLICATION OF 2D COASTAL PROCESSES MODELLING
 SELECTION OF THE PREFERRED MANAGEMENT OPTION FOR STOCKTON BEACH APPLICATION OF 2D COASTAL PROCESSES MODELLING C Allery 1 1 DHI Water and Environment, Sydney, NSW Abstract This paper presents an approach
CHAPTER 134 INTRODUCTION
 CHAPTER 134 NEW JETTIES FOR TUNG-KANG FISHING HARBOR, TAIWAN Chi-Fu Su Manager Engineering Department Taiwan Fisheries Consultants, Inc. Taipei, Taiwan INTRODUCTION Tung-Kang Fishing Harbor, which is about
Southern California Beach Processes Study
 Southern California Beach Processes Study Torrey Pines Field Site 5th Quarterly Report 31 May 22 to California Resources Agency and California Department of Boating and Waterways R.T. Guza 1, W.C. O Reilly
SEDIMENT BUDGET OF LIDO OF PELLESTRINA (VENICE) Written by Marcello Di Risio Under the supervision of Giorgio Bellotti and Leopoldo Franco
 Written by Marcello Di Risio Under the supervision of Giorgio Bellotti and Leopoldo Franco") SEDIMENT BUDGET OF LIDO OF PELLESTRINA (VENICE) Written by Marcello Di Risio Under the supervision of Giorgio Bellotti and Leopoldo Franco Table of contents: 1. Introduction...3 2. Protection structures
SEDIMENT BUDGET OF LIDO OF PELLESTRINA (VENICE) Written by Marcello Di Risio Under the supervision of Giorgio Bellotti and Leopoldo Franco Table of contents: 1. Introduction...3 2. Protection structures
High-Resolution Measurement-Based Phase-Resolved Prediction of Ocean Wavefields
 DISTRIBUTION STATEMENT A. Approved for public release; distribution is unlimited. High-Resolution Measurement-Based Phase-Resolved Prediction of Ocean Wavefields Dick K.P. Yue Center for Ocean Engineering
Comparison of data and model predictions of current, wave and radar cross-section modulation by seabed sand waves
 Comparison of data and model predictions of current, wave and radar cross-section modulation by seabed sand waves Cees de Valk, ARGOSS Summary SAR Imaging of seabed features Seabed Sand waves Objectives
Low-crested offshore breakwaters: a functional tool for beach management
 Environmental Problems in Coastal Regions VI 237 Low-crested offshore breakwaters: a functional tool for beach management K. Spyropoulos & E. Andrianis TRITON Consulting Engineers, Greece Abstract Beach
Shoreline Evolution Due to Oblique Waves in Presence of Submerged Breakwaters. Nima Zakeri (Corresponding Author), Mojtaba Tajziehchi
, Mojtaba Tajziehchi") Shoreline Evolution Due to Oblique Waves in Presence of Submerged Breakwaters Nima Zakeri (Corresponding Author), Mojtaba Tajziehchi Department of Civil Engineering, Faculty of Engineering, University
Shoreline Evolution Due to Oblique Waves in Presence of Submerged Breakwaters Nima Zakeri (Corresponding Author), Mojtaba Tajziehchi Department of Civil Engineering, Faculty of Engineering, University
Available online at ScienceDirect. Procedia Engineering 116 (2015 )
") Available online at www.sciencedirect.com ScienceDirect Procedia Engineering 116 (2015 ) 320 325 8th International Conference on Asian and Pacific Coasts (APAC 2015) Department of Ocean Engineering, IIT
Available online at www.sciencedirect.com ScienceDirect Procedia Engineering 116 (2015 ) 320 325 8th International Conference on Asian and Pacific Coasts (APAC 2015) Department of Ocean Engineering, IIT
Near Shore Wave Processes
 Near Shore Wave Processes Edward B. Thornton Oceanography Department Naval Postgraduate School Monterey, CA 93943-5000 phone: (831) 656-2847 fax: (831) 656-2712 email: thornton@nps.navy.mil Timothy P.
Study of Passing Ship Effects along a Bank by Delft3D-FLOW and XBeach1
 Study of Passing Ship Effects along a Bank by Delft3D-FLOW and XBeach1 Minggui Zhou 1, Dano Roelvink 2,4, Henk Verheij 3,4 and Han Ligteringen 2,3 1 School of Naval Architecture, Ocean and Civil Engineering,
Kelly Legault, Ph.D., P.E. USACE SAJ
 Kelly Legault, Ph.D., P.E. USACE SAJ Report Documentation Page Form Approved OMB No. 0704-0188 Public reporting burden for the collection of information is estimated to average 1 hour per response, including
RIP CURRENTS. Award # N
 RIP CURRENTS Graham Symonds School of Geography and Oceanography University College, University of New South Wales, Australian Defence Force Academy, Canberra, 2600 AUSTRALIA Phone: 61-6-2688289 Fax: 61-6-2688313
Reply of Guyana Annex R2
 Summary of Findings: Analysis of Recent Shoreline Revisions to the This report assesses recent shoreline changes made to the 2005 edition of Dutch nautical chart NL 2218. This new edition is credited jointly
Rip Currents Onshore Submarine Canyons: NCEX Analysis
 Rip Currents Onshore Submarine Canyons: NCEX Analysis Dr. Thomas C. Lippmann Civil and Environmental Engineering & Geodetic Science, Byrd Polar Research Center, 1090 Carmack Rd., Ohio State University,
Wind Blow-out Hollow Generated in Fukiage Dune Field, Kagoshima Prefecture, Japan
 R. Nishi Wind Blow-out Hollow Generated in Fukiage Dune Field, Kagoshima Prefecture, Japan Ryuichiro Nishi, Li Elikson and Myokhin PREFACE A sand dune is vulnerable to severe waves and wind. Therefore,
OECS Regional Engineering Workshop September 29 October 3, 2014
 B E A C H E S. M A R I N A S. D E S I G N. C O N S T R U C T I O N. OECS Regional Engineering Workshop September 29 October 3, 2014 Coastal Erosion and Sea Defense: Introduction to Coastal Dynamics David
APPLICATION OF A NEW SAND TRANSPORT FORMULA WITHIN THE CROSS-SHORE MORPHODYNAMIC MODEL UNIBEST-TC
 APPLICATION OF A NEW SAND TRANSPORT FORMULA WITHIN THE CROSS-SHORE MORPHODYNAMIC MODEL UNIBEST-TC Jebbe van der Werf 1,3, Harm Nomden 2, Jan Ribberink 3, Dirk-Jan Walstra 1, Wouter Kranenburg 3 In this
Assessment of Depth of Closure on a Nourished Beach: Terschelling, The Netherlands. S. W. Marsh, R. J. Nicholls, A. Kroon and P.
 Assessment of Depth of Closure on a Nourished Beach: Terschelling, The Netherlands S. W. Marsh, R. J. Nicholls, A. Kroon and P. Hoekstra" Abstract Depth of closure is studied on a nourished beach in the
WAVE ENERGY DISSIPATION BY INTERTIDAL SAND WAVES ON A MIXED-SEDIMENT BEACH
 Published in: Proceeding of the 5th International Conference on Coastal Dynamics 2005, Barcelona, Spain, April 2005 WAVE ENERGY DISSIPATION BY INTERTIDAL SAND WAVES ON A MIXED-SEDIMENT BEACH Peter Adams
Wave-Driven Longshore Currents in the Surf Zone Hydrodynamic validation of Delft3D
 Wave-Driven Longshore Currents in the Surf Zone Hydrodynamic validation of Delft3D Roald Treffers Deltares, 2008 Prepared for: Deltares Wave-Driven Longshore Currents in the Surf Zone Hydrodynamic validation
Morphological Evolution Near an Inlet
 DISTRIBUTION STATEMENT A. Approved for public release; distribution is unlimited. Morphological Evolution Near an Inlet Steve Elgar Woods Hole Oceanographic Institution, MS11 Woods Hole, MA 02543 phone:
A Review of the Bed Roughness Variable in MIKE 21 FLOW MODEL FM, Hydrodynamic (HD) and Sediment Transport (ST) modules
 and Sediment Transport (ST) modules") A Review of the Bed Roughness Variable in MIKE 1 FLOW MODEL FM, Hydrodynamic (HD) and Sediment Transport (ST) modules by David Lambkin, University of Southampton, UK 1 Bed roughness is considered a primary
A Review of the Bed Roughness Variable in MIKE 1 FLOW MODEL FM, Hydrodynamic (HD) and Sediment Transport (ST) modules by David Lambkin, University of Southampton, UK 1 Bed roughness is considered a primary
Super-parameterization of boundary layer roll vortices in tropical cyclone models
 DISTRIBUTION STATEMENT A. Approved for public release; distribution is unlimited. Super-parameterization of boundary layer roll vortices in tropical cyclone models PI Isaac Ginis Graduate School of Oceanography
Morphological modelling of Keta Lagoon case
 CHAPTER 232 Morphological modelling of Keta Lagoon case J.A. Roelvink 1 ' 2, D.J.R. Walstra 1 and Z. Chen 1 'DELFT HYDRAULICS p.o. box 152, 8300 AD Emmeloord, The Netherlands. Netherlands Centre for Coastal
SWASH MODELLING OF A COASTAL PROTECTION SCHEME
 SWASH MODELLING OF A COASTAL PROTECTION SCHEME Mark Klein 1, Andrew Symonds 2, Marcel Zijlema 3, Dan Messiter 4 and Michael Dufour 5 The Beresford shoreline, Australia, is subject to a complex interaction
Impact of beach scraping on near shore sediment transport and bar migration
 Impact of beach scraping on near shore sediment transport and bar migration Tom E. Baldock and Jose Alsina 2 School of Civil Engineering, University of Queensland, St Lucia, AUSTRALIA. email: t.baldock@uq.edu.au
ISOLATION OF NON-HYDROSTATIC REGIONS WITHIN A BASIN
 ISOLATION OF NON-HYDROSTATIC REGIONS WITHIN A BASIN Bridget M. Wadzuk 1 (Member, ASCE) and Ben R. Hodges 2 (Member, ASCE) ABSTRACT Modeling of dynamic pressure appears necessary to achieve a more robust
Coastal Engineering 56 (2009) Contents lists available at ScienceDirect. Coastal Engineering
 Contents lists available at ScienceDirect. Coastal Engineering") Coastal Engineering 56 (2009) 484 493 Contents lists available at ScienceDirect Coastal Engineering journal homepage: www.elsevier.com/locate/coastaleng The effect of bathymetric filtering on nearshore
Coastal Engineering 56 (2009) 484 493 Contents lists available at ScienceDirect Coastal Engineering journal homepage: www.elsevier.com/locate/coastaleng The effect of bathymetric filtering on nearshore
Coastal Wave Energy Dissipation: Observations and Modeling
 Coastal Wave Energy Dissipation: Observations and Modeling Jeffrey L Hanson US Army Corps of Engineers Field Research Facility USACE Field Research Facility Kent K. Hathaway US Army Corps of Engineers
Currents measurements in the coast of Montevideo, Uruguay
 Currents measurements in the coast of Montevideo, Uruguay M. Fossati, D. Bellón, E. Lorenzo & I. Piedra-Cueva Fluid Mechanics and Environmental Engineering Institute (IMFIA), School of Engineering, Research
MODELING OF CLIMATE CHANGE IMPACTS ON COASTAL STRUCTURES - CONTRIBUTION TO THEIR RE-DESIGN
 Proceedings of the 14 th International Conference on Environmental Science and Technology Rhodes, Greece, 3-5 September 2015 MODELING OF CLIMATE CHANGE IMPACTS ON COASTAL STRUCTURES - CONTRIBUTION TO THEIR
Evaluation of Delft3D Performance in Nearshore Flows
 Naval Research Laboratory Stennis Space Center, MS 39529-5004 NRL/MR/7320--06-8984 Evaluation of Delft3D Performance in Nearshore Flows Y. Larry Hsu James D. Dykes Richard A. Allard Ocean Dynamics and
page - Laboratory Exercise #5 Shoreline Processes
 page - Laboratory Exercise #5 Shoreline Processes Section A Shoreline Processes: Overview of Waves The ocean s surface is influenced by three types of motion (waves, tides and surface currents). Shorelines
BREAKER BAR FORMATION AND MIGRATION Bart T. Grasmeijer 1 and Leo C. van Rijn 1 ' 2
 Abstract BREAKER BAR FORMATION AND MIGRATION Bart T. Grasmeijer 1 and Leo C. van Rijn 1 ' 2 The formulation of Isobe and Horikawa (1982) is modified and adapted for use in a probabilistic cross-shore transport
TRANSPORT OF NEARSHORE DREDGE MATERIAL BERMS
 Proceedings of the 6 th International Conference on the Application of Physical Modelling in Coastal and Port Engineering and Science (Coastlab16) Ottawa, Canada, May 10-13, 2016 Copyright : Creative Commons
Coastal Engineering 55 (2008) Contents lists available at ScienceDirect. Coastal Engineering
 Contents lists available at ScienceDirect. Coastal Engineering") Coastal Engineering 55 (008) 1016 107 Contents lists available at ScienceDirect Coastal Engineering journal homepage: www.elsevier.com/locate/coastaleng Beach Wizard: Nearshore bathymetry estimation through
Coastal Engineering 55 (008) 1016 107 Contents lists available at ScienceDirect Coastal Engineering journal homepage: www.elsevier.com/locate/coastaleng Beach Wizard: Nearshore bathymetry estimation through
Aalborg Universitet. Published in: Proceedings of Offshore Wind 2007 Conference & Exhibition. Publication date: 2007
 Aalborg Universitet Design Loads on Platforms on Offshore wind Turbine Foundations with Respect to Vertical Wave Run-up Damsgaard, Mathilde L.; Gravesen, Helge; Andersen, Thomas Lykke Published in: Proceedings
Wave Generation. Chapter Wave Generation
 Chapter 5 Wave Generation 5.1 Wave Generation When a gentle breeze blows over water, the turbulent eddies in the wind field will periodically touch down on the water, causing local disturbances of the
IMPACT OF BEACH STATES ON ALONGSHORE TRANSPORT. Abstract
 IMPACT OF BEACH STATES ON ALONGSHORE TRANSPORT B.J.A. Huisman 1,2, A. Vargas Solis 1, M.A. de Schipper 1, M. Radermacher 1, R. Ranasinghe 3 Abstract Impact of spatial variability in the nearshore bathymetry
CHAPTER 8 ASSESSMENT OF COASTAL VULNERABILITY INDEX
 124 CHAPTER 8 ASSESSMENT OF COASTAL VULNERABILITY INDEX 8.1 INTRODUCTION In order to assess the vulnerability of the shoreline considered under this study against the changing environmental conditions,
Three dimensional modelling of wave set-up and longshore currents. The effect of turbulence closure models
 Three dimensional modelling of wave set-up and longshore currents The effect of turbulence closure models D. Rodrigues 1 Abstract The purpose of this study is to analyse wave-current interactions, specially
SEDIMENT- AND MORPHODYNAMICS OF SHOREFACE NOURISHMENTS ALONG THE NORTH-HOLLAND COAST. Ben de Sonneville 1 and Ad van der Spek 1
 SEDIMENT- AND MORPHODYNAMICS OF SHOREFACE NOURISHMENTS ALONG THE NORTH-HOLLAND COAST Ben de Sonneville 1 and Ad van der Spek 1 The Dutch coastal maintenance policy which was implemented in 1990 aims at
Sandy Beach Morphodynamics. Relationship between sediment size and beach slope
 Sandy Beach Morphodynamics Relationship between sediment size and beach slope 1 Longshore Sorting - Willard Bascom Beach Slope, Grain Size, and Wave Energy Beach at Sandwich Bay, Kent, UK near the Straights
Wave Breaking. Wave Breaking
 Wave Breaking The release of energy derived from the wind, along a narrow coastal zone - geomorphic work done by wind, really, translated through medium of water. Wave Breaking Wave breaking is responsible
An experimental study of internal wave generation through evanescent regions
 An experimental study of internal wave generation through evanescent regions Allison Lee, Julie Crockett Department of Mechanical Engineering Brigham Young University Abstract Internal waves are a complex
AIRFLOW GENERATION IN A TUNNEL USING A SACCARDO VENTILATION SYSTEM AGAINST THE BUOYANCY EFFECT PRODUCED BY A FIRE
 - 247 - AIRFLOW GENERATION IN A TUNNEL USING A SACCARDO VENTILATION SYSTEM AGAINST THE BUOYANCY EFFECT PRODUCED BY A FIRE J D Castro a, C W Pope a and R D Matthews b a Mott MacDonald Ltd, St Anne House,
Julebæk Strand. Effect full beach nourishment
 Julebæk Strand Effect full beach nourishment Aim of Study This study is a part of the COADAPT funding and the aim of the study is to analyze the effect of beach nourishment. In order to investigate the
Determination of Nearshore Wave Conditions and Bathymetry from X-Band Radar Systems
 Determination of Nearshore Wave Conditions and Bathymetry from X-Band Radar Systems Okey G. Nwogu Dept. of Naval Architecture and Marine Engineering University of Michigan Ann Arbor, MI 48109 Phone: (734)
Wave energy converter effects on wave and sediment circulation
 Wave energy converter effects on wave and sediment circulation Grace Chang and Craig Jones Integral Consulting Inc. cjones@integral-corp.com; gchang@integral-corp.com Jesse Roberts, Kelley Ruehl, and Chris
CHAPTER 21 VARIABLE DISPERSION AND ITS EFFECTS ON THE MOVEMENTS OF TRACERS ON BEACHES
 CHAPTER 21 VARIABLE DISPERSION AND ITS EFFECTS ON THE MOVEMENTS OF TRACERS ON BEACHES W. A. Price, Senior Principal Scientific Officer Hydraulics Research Station, Wallmgford, Great Britain SUMMARY To
/50. Physical Geology Shorelines
 Physical Geology Shorelines Multiple Guess: (You know the drill 2 points each) 1. The path of movement of a water particle in a wave at sea is 1. circular 2. horizontal 3. vertical 4. elliptical 5. none
Reading Material. Inshore oceanography, Anikouchine and Sternberg The World Ocean, Prentice-Hall
 Reading Material Inshore oceanography, Anikouchine and Sternberg The World Ocean, Prentice-Hall BEACH PROCESSES AND COASTAL ENVIRONMENTS COASTAL FEATURES Cross section Map view Terminology for Coastal
INTRODUCTION TO COASTAL ENGINEERING
 The University of the West Indies Organization of American States PROFESSIONAL DEVELOPMENT PROGRAMME: COASTAL INFRASTRUCTURE DESIGN, CONSTRUCTION AND MAINTENANCE A COURSE IN COASTAL DEFENSE SYSTEMS I CHAPTER
PhD student, January 2010-December 2013
 Numerical modeling of wave current interactions ata a local scaleand and studyof turbulence closuremodel effects MARIA JOÃO TELES PhD student, January 2010-December 2013 Supervisor: António Pires-Silva,
Analysis of Wave Predictions from the Coastal Model Test Bed using cbathy
 Analysis of Wave Predictions from the Coastal Model Test Bed using cbathy Spicer Bak, Ty Hesser, Jane Smith U.S. Army Engineer Research & Development Center Duck, NC Coastal Model Test Bed Purpose: Automated
Request Number IR1-12: Flow Passage. Information Request
 Request Number IR1-12: Flow Passage Information Request Provide additional information about the 100 metre flow passage channel scenario between the Westshore Terminals and the proposed Project terminal
Long Beach Island Holgate Spit Little Egg Inlet Historical Evolution Introduction Longshore Transport Map, Survey and Photo Historic Sequence
 Appendix B Long Beach Island Holgate Spit Little Egg Inlet Historical Evolution Introduction The undeveloped southern end of Long Beach Island (LBI) is referred to as the Holgate spit as it adjoins the