Long Beach Island Holgate Spit Little Egg Inlet Historical Evolution Introduction Longshore Transport Map, Survey and Photo Historic Sequence
|
|
|
- Erick Bruce
- 5 years ago
- Views:
Transcription
1 Appendix B
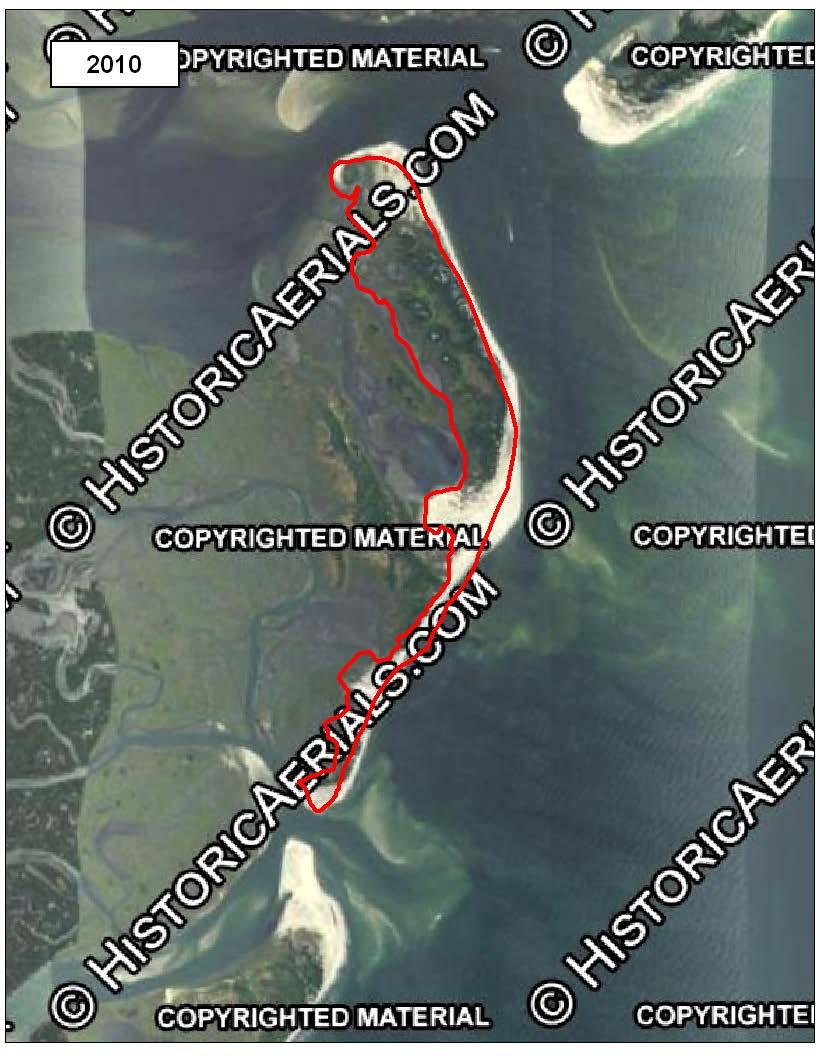
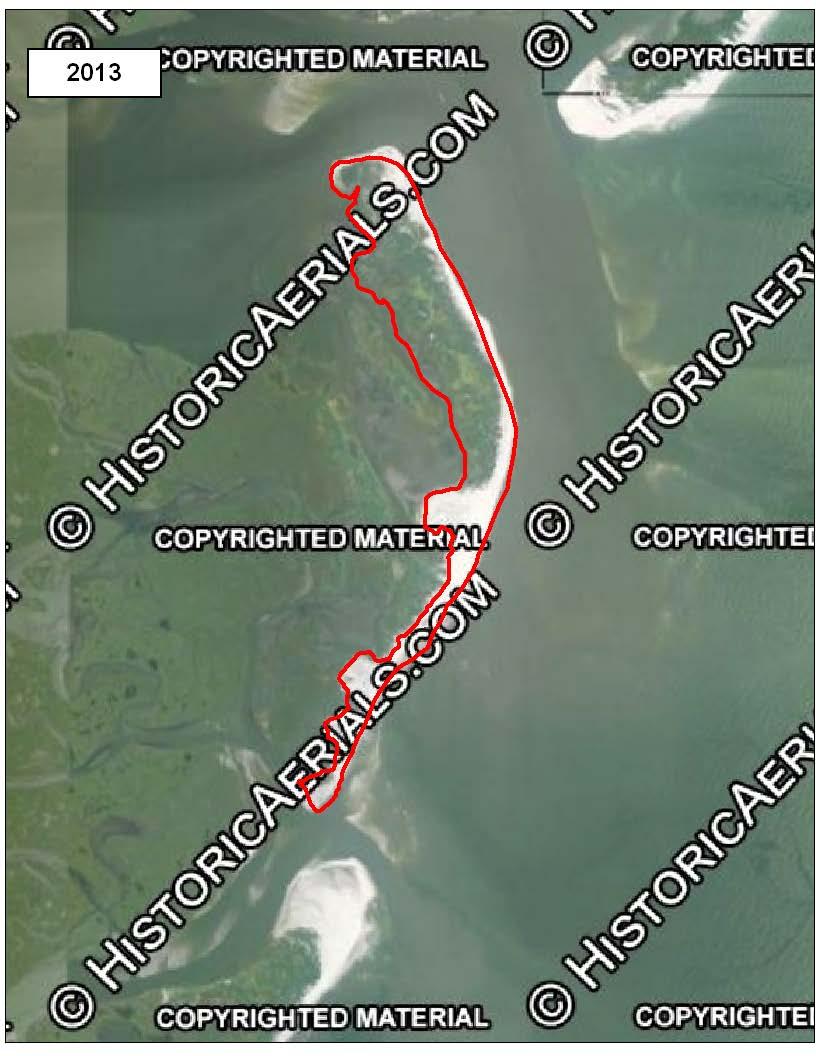
2 Long Beach Island Holgate Spit Little Egg Inlet Historical Evolution Introduction The undeveloped southern end of Long Beach Island (LBI) is referred to as the Holgate spit as it adjoins the southernmost developed LBI community of Holgate, which is part of the municipality of Long Beach Township. The Holgate spit, including Little Egg Inlet (LEI) to the southwest, has a well-documented history of maps, nautical charts, and aerial photography that extends back at least to The present configuration of the Holgate spit and LEI is shown on Figure 1 with other relevant geographic features noted. The length of the spit in 2015, measured from the terminal groin in Holgate to its southwest end, is 16,600 feet. The present axis of LEI is shown by the straight red line, and the present shoreline of Holgate spit is outlined in red. This summary presents an overview of the historic evolution of the Holgate spit and LEI from 1874 until present (2015). Longshore Transport The dominant longshore transport direction along LBI, including the Holgate spit and LEI, is toward the southwest (SW). Although the dominant SW transport has been documented by a number of investigations over the past several decades, there is little consensus over the magnitude of the net transport. Regardless of the potential variability of the net SW transport rate over time, all evidence qualitatively points to the dominant long-term transport direction as toward the SW. This transport has manifested itself in the progressive growth of the Holgate spit in the SW direction. Map, Survey and Photo Historic Sequence Figures 2 through 6 present a time series of images showing the Holgate spit LEI configuration beginning with the 1874 nautical chart. Each of the images has been georeferenced in ArcMap to display the identical area registered on the LBI-LEI base map (Figure 1). For comparison with existing conditions, each image also includes the straight red line representing the present axis of LEI and the red outline of the present Holgate spit shoreline US Coast Survey, Figure 2. The Holgate spit is attached to the SW end of LBI, but in a position seaward of the present spit shown by the red outline. Although only a single opening exists between the adjacent barrier islands of LBI and Little Beach Island, the chart names two inlets within the present extent of LEI. These features are named Tuckers Cove Inlet and Little Egg Harbor Inlet with the former trending to the E and closer to the Holgate spit, and the latter closer to Little Beach Island and trending SSE. Although not legible at the presentation scale of Figure 2, the 1874 survey includes the notation Old Inlet shown at the green arrow east of the Holgate spit. It is inferred that at some point prior to 1874 an additional inlet (a breach of Holgate spit) was present that closed by
3 1894 USGS quad sheets, Figure 3. The USGS quad sheets indicate growth of the Holgate spit toward the SW by about 4,000 feet since 1874, as the tip of the spit is closer to the present axis of LEI (red line). This survey refers to the Holgate spit as Tuckers Beach and refers to the present LEI as New Inlet Aerial Photograph, Figure 4. The B&W photo shows further elongation of Holgate spit to the SW, with its SW tip crossing the axis of the present LEI (red line). The photo also shows the existence of a breach (green arrow) that occurred as a result of a February 1920 coastal storm, approximately at the location of the (closed) new inlet shown on the 1874 survey. The 1920 breach was named Beach Haven Inlet USCGS Nautical Chart, Figure 5. This chart indicate the widening of the 1920 breach (Beach Haven Inlet) in both the NE and SW directions such that its width was about 8,000 feet. The widening of Beach Haven Inlet to the SW encroached on the remainder of the Holgate spit, which was reduced to an island, shown as Tuckers Island, about 6,000 feet long. Note that in 1940 there were two distinct inlets (Beach Haven and Little Egg) within the present footprint of the Holgate spit LEI complex Aerial Photograph, Figure 6. By 1956 there were no longer two distinct inlets. The SW growth of the new Holgate spit attached to the SW end of LBI had effectively merged Beach Haven and Little Egg Inlets into a single opening approximately 13,000 feet wide, effectively eliminating the 1940 Tuckers Island in the process to present. Nautical charts since 1956 have continued to include the names Beach Haven Inlet and Little Egg Inlet where there is in fact a single opening between the adjacent islands (LBI and Little Beach Island). However, from the standpoint of geomorphic and coastal engineering conventions, in as at present - there is a single inlet. The SW growth of the Holgate spit has continued since 1956, with the SW tip of the spit presently about 6,600 feet farther SW than it was in For the 1956-to-2015 period this represents a long-term average southwestward growth of the spit by ~100 feet per year, although the rate of growth has varied over time. Summary. This abbreviated history of the evolution of the Holgate spit and Little Egg Inlet supports the following principal conclusions: (1) Spit growth and breaching. The dominant longshore transport direction along this portion of the NJ coast is to the southwest. The SW transport moves sand along the shoreline of LBI, past the developed community of Holgate, and toward the Holgate spit. The spit elongates in the SW direction over time until a breach of the spit occurs. Breaches of the Holgate spit are evident on the 1874 survey, which includes the 2
4 notation old inlet indicating a breach that opened and subsequently closed by 1874, and again on the 1920 aerial photograph. (2) Multiple inlets where there is only one inlet at present. At the time the Holgate spit is beached, there are in fact two inlets, where inlet is defined here using the convention of an opening between adjacent barrier islands. The breaches of the Holgate spit (pre-1874 and 1920) severed the connection of the spit to LBI, transforming the spit into an island with inlets at either end. Most recently these inlets have been named Beach Haven Inlet and Little Egg Inlet, as illustrated in the sequence from 1920 through (3) Spit growth and merging of inlets. Over a period of years to several decades, the net SW transport along LBI begins to grow the Holgate spit. As longshore transport extends the SW end of the spit, the two inlets (Beach Haven and Little Egg) eventually merge into a single, larger inlet as evident on Figure 6 from It is plausible that the present configuration of Holgate spit will be transformed in the future by a breach that creates a new inlet. Hurricane Sandy in October 2012 breached the spit in several locations, but none was sufficiently large to evolve into a new inlet. Hence at present Holgate spit extends continuously about 16,600 feet from the terminal groin in Holgate to its SW terminus adjacent to LEI. (4) Dynamic system. The text and figures of this presentation document the dynamic nature of the system comprised of Long Beach Island, the Holgate spit and its adjacent inlet, which is referred to herein as Little Egg Inlet. The system is controlled by the more-or-less continuous input of littoral sediment toward the SW, from LBI and Holgate onto the Holgate spit. Over time the spit grows longer until such time as it is breached, converting the spit into an island bordered by two inlets. This dynamic system is indicative of the large quantities of sand that are transported alongshore, and indicates that a configuration that exists at any given time is subject to the type of transformations documented herein, and is subject to large potential changes over periods of years to decades. 3

5 Figure 1. Holgate spit - LEI location map 4

6 Figure US Coast Survey 5

7 Figure USGS 6

8 Figure Aerial photo (B&W inset) 7

9 Figure Nautical chart 8

10 Figure Aerial Photo (B&W inset) 9
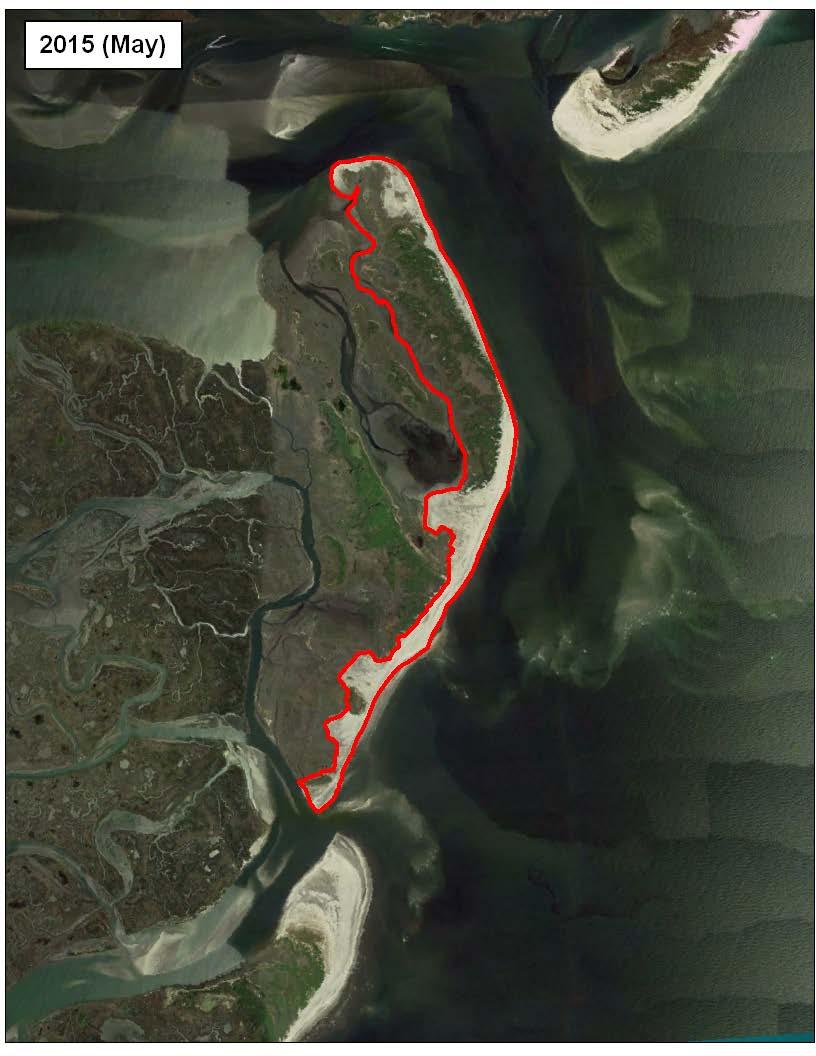
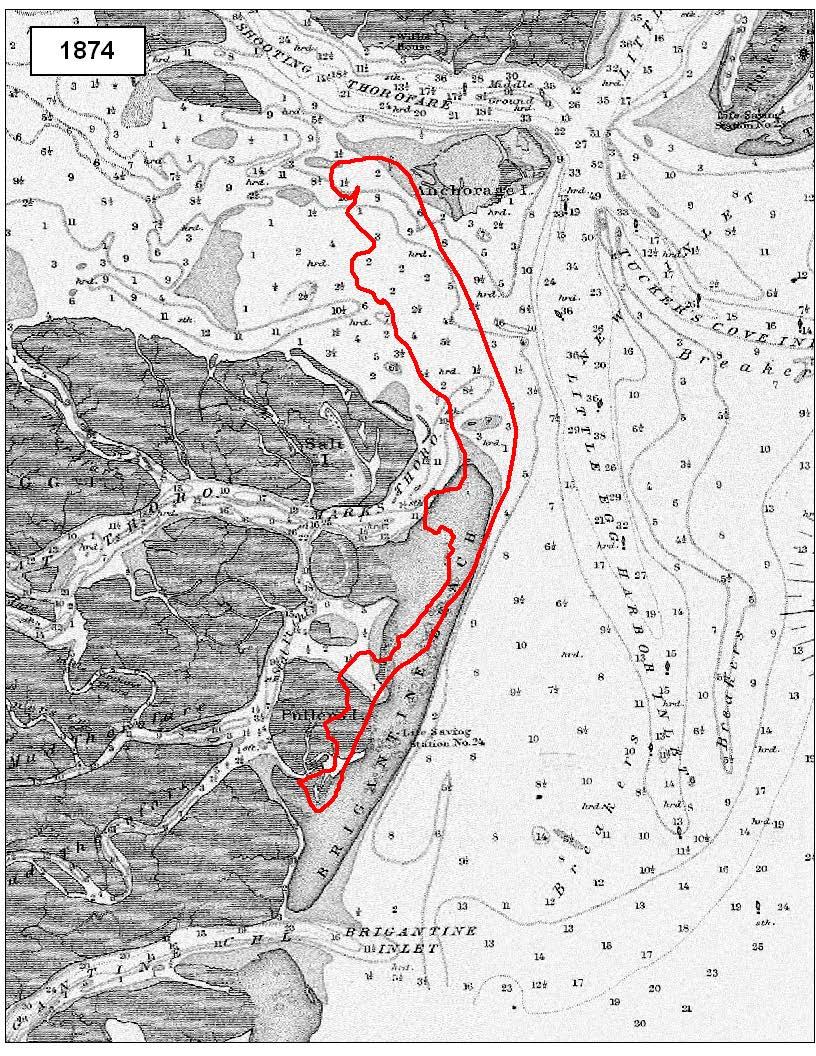
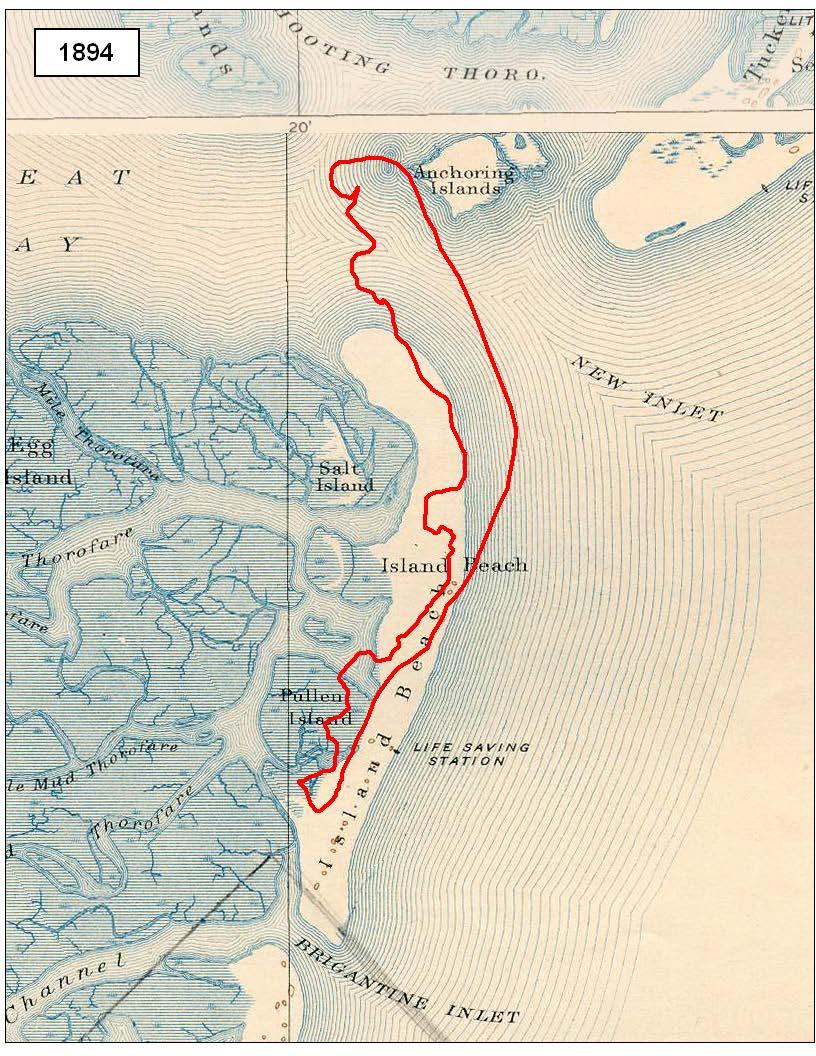
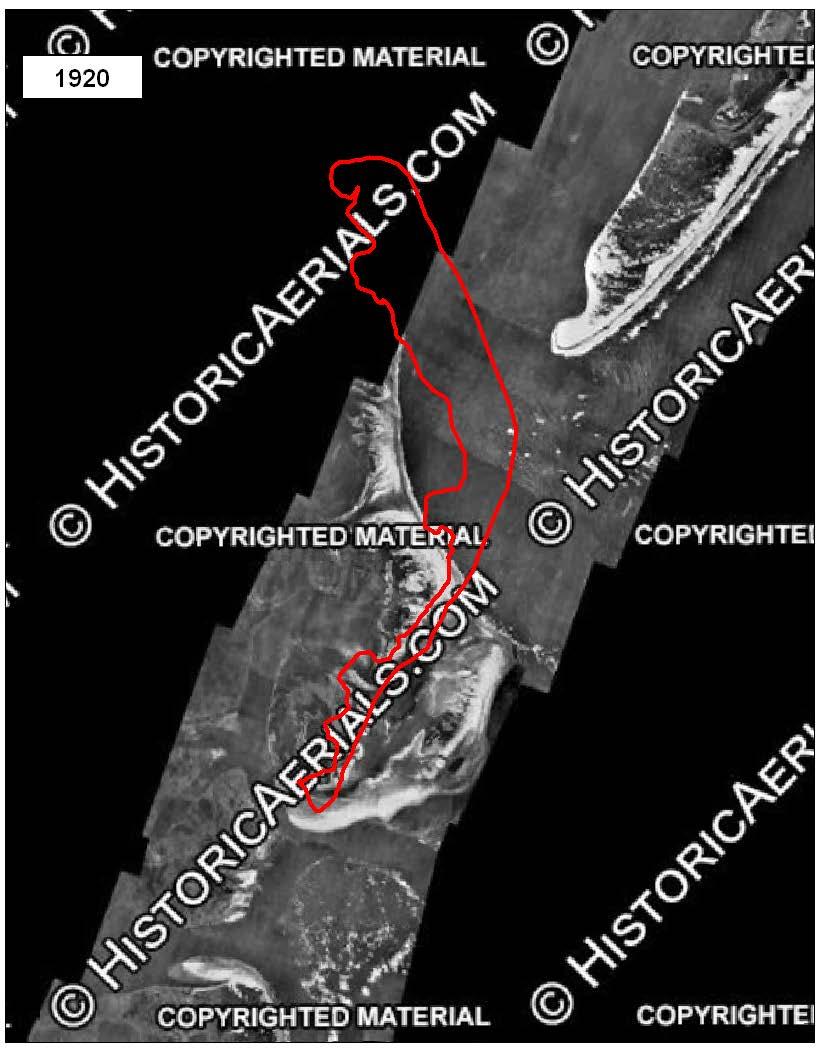
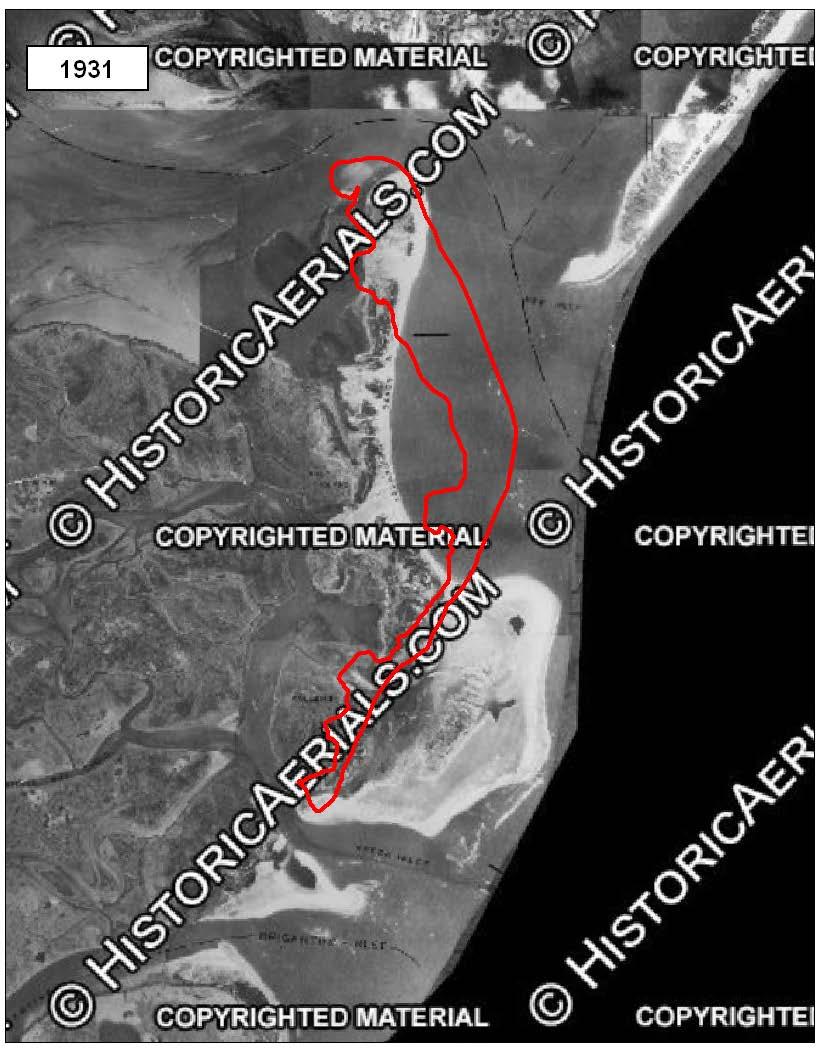
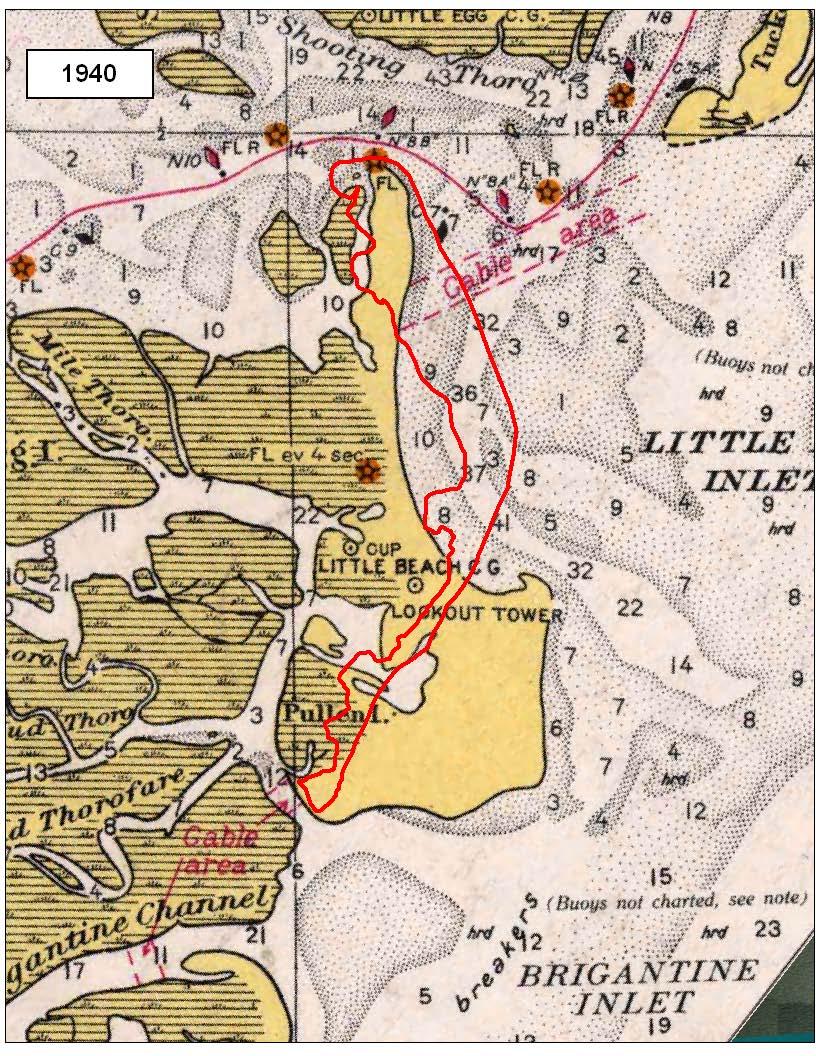
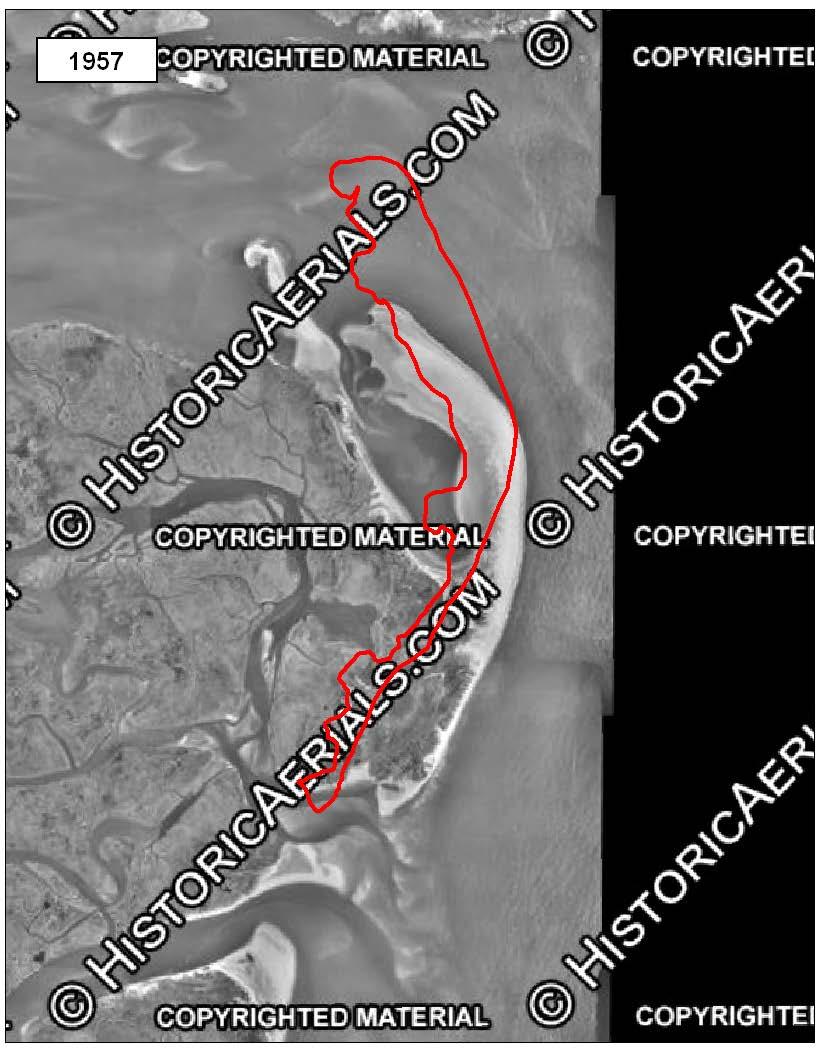
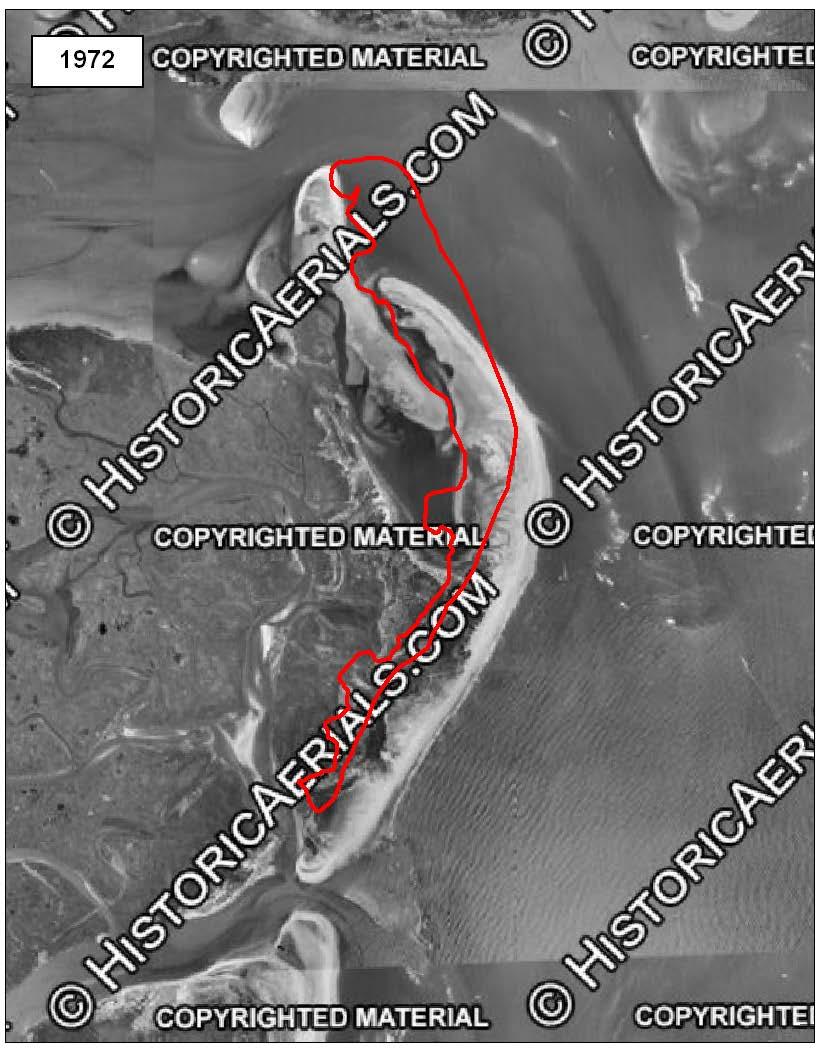
11 Little Beach Island Historical Evolution Introduction Little Beach Island is located between Little Egg Inlet to the north and Brigantine Inlet to the south, and is one of the few remaining undeveloped barrier islands on the Atlantic coast of New Jersey. Little Beach Island presently has about 4 miles of sandy shoreline facing the Atlantic Ocean and Little Egg Inlet. Landward (west) of Little Beach Island there are extensive saltmarshes. These lands are part of the Edwin B. Forsythe National Wildlife Refuge. Like the Holgate spit located north of Little Egg Inlet, historical changes of Little Beach Island are well-documented by a maps, nautical charts, and aerial photography that extend back at least to The historic changes in location and configuration of Little Beach Island between 1874 and 2015 are illustrated below. Map, Survey and Photo Historic Sequence All images (maps, charts, and aerial photos) were assembled in ArcMap and registered to a common horizontal reference. The first Figure is the most recent (May 2015) configuration of Little Beach Island. Images from 1874 through 2015 are presented in sequence. The red outline in each image shows the configuration of Little Beach Island in 2015, so that each of the historic images can be compared to most current conditions at Little Beach US Coast Survey. The 1874 chart shows Brigantine Beach, approximately 8,000 feet southeast of Little Beach s current location. More than half of Little Beach s sandy beach facing the inlet was not present at this time USGS Quad Sheet. Twenty years later, Little Beach Island is referred to as Island Beach. The northeast end of the island migrated northward about 4,000 feet between 1874 and 1894, but is situated more landward and approximately half the length of the present day inlet beach Aerial Photograph. The 1920 aerial photo shows significant retreat and erosion of the northeast end of Little Beach Island with several breaches, likely due to a major coastal storm in February The southern portion of Little Beach Island is located landward of its 1894 location, and also displays several breaches and overwashed areas Aerial Photograph. The photo shows significant accretion seaward of the southern portion of the island compared to 1920 conditions. The northeast portion of the barrier beach is still more landward than its present location but it has accumulated sand since the 1920 photograph. Previous breaches and overwash areas have filled in but are still evident USCGS Nautical Chart. This chart indicates a similar configuration of Little Beach Island compared to the 1931 aerial photograph Aerial Photograph. This aerial photo indicates northward growth of Little Beach Island as a spit that recurves westward into Little Egg Inlet, while the southern portion of the island retreated to its approximate alignment in Large ocean-facing sand deposits that were evident in 1931 and 1940 are no longer present.
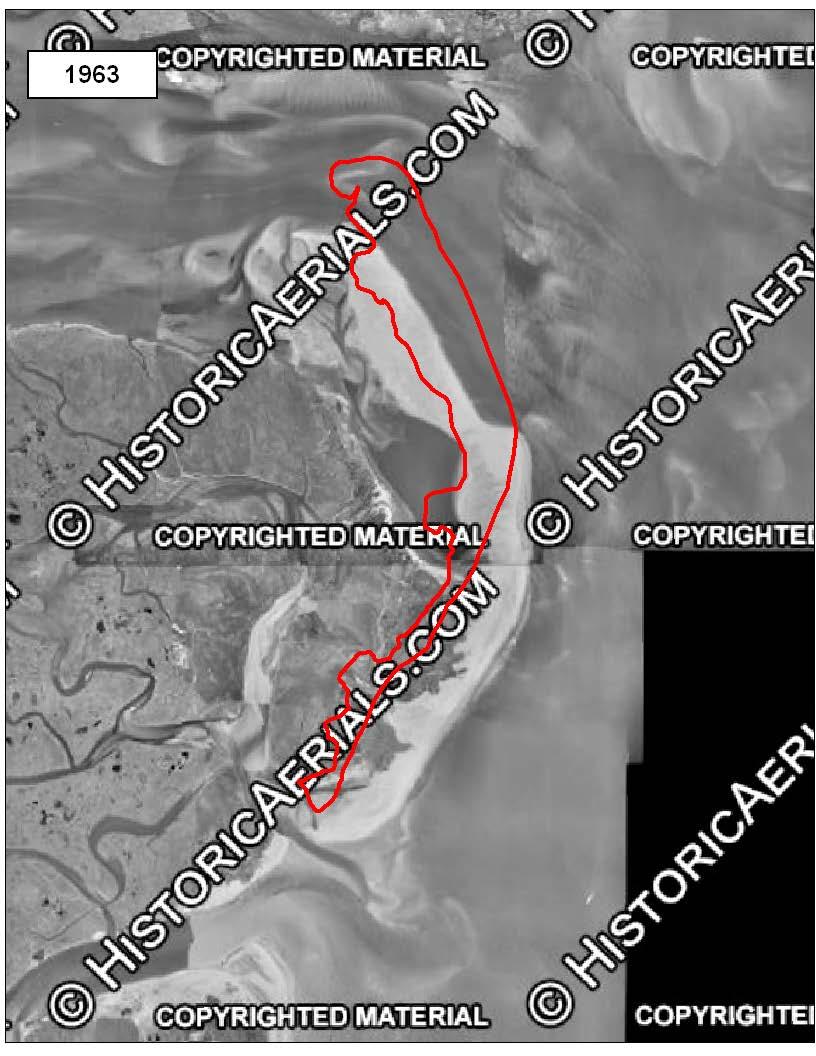
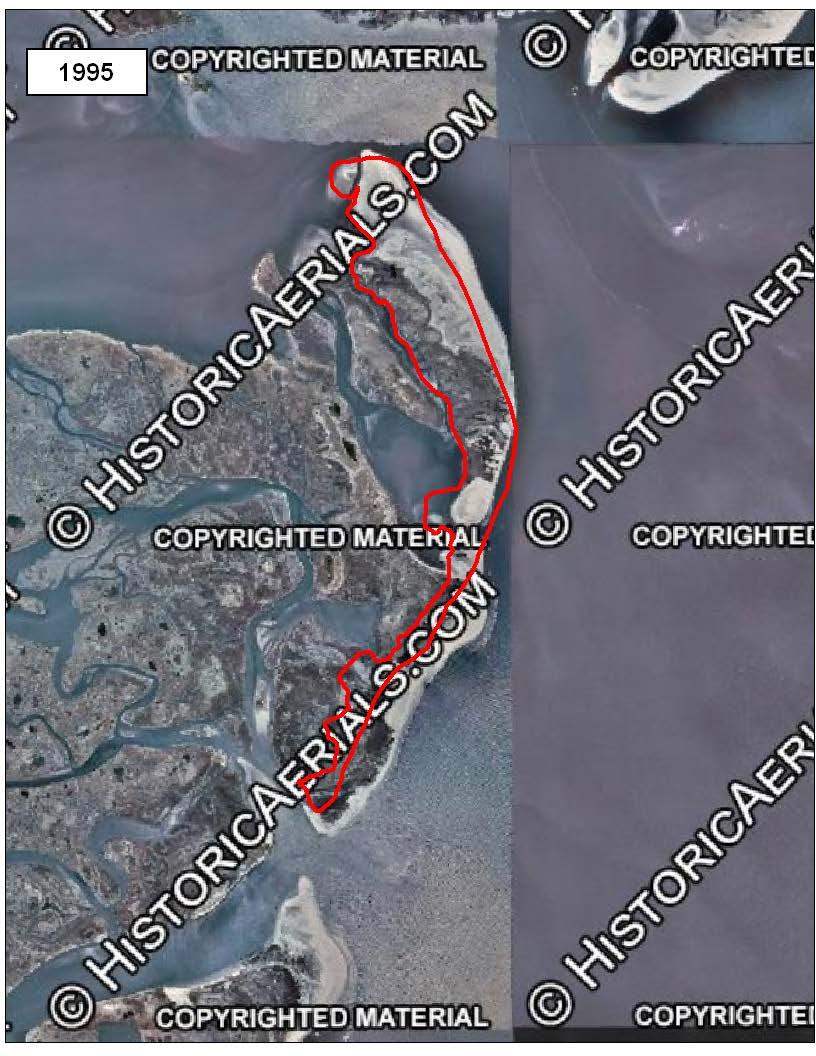
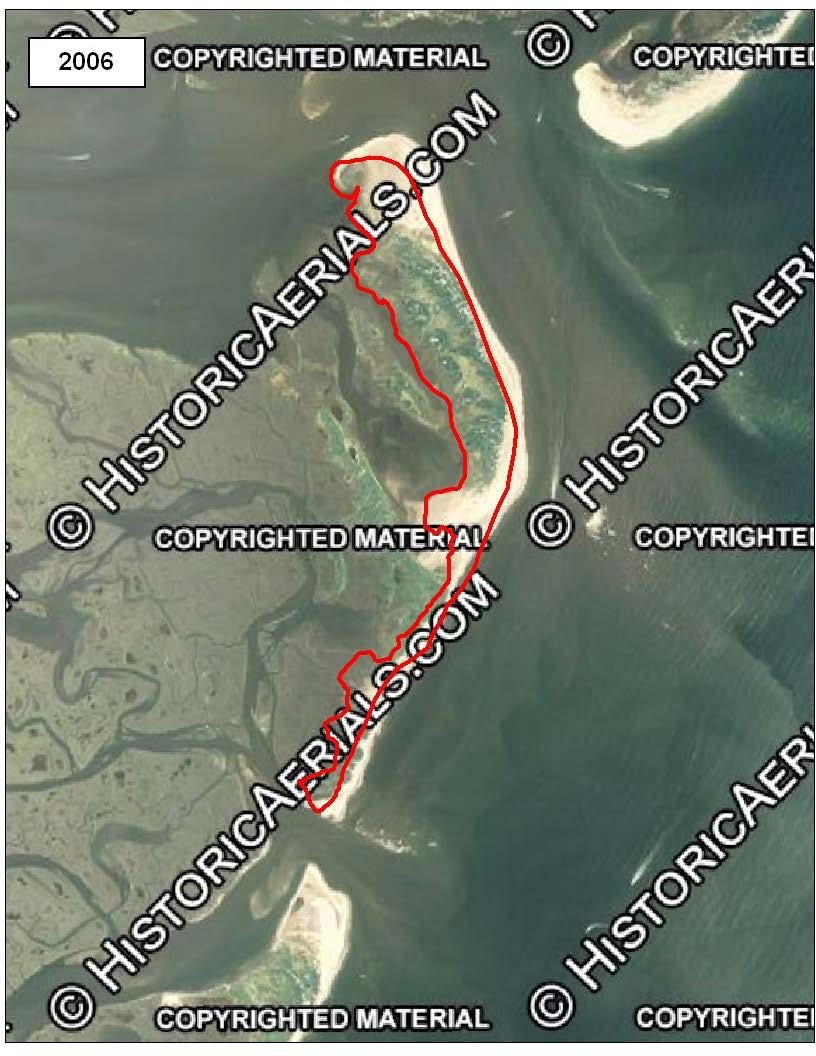
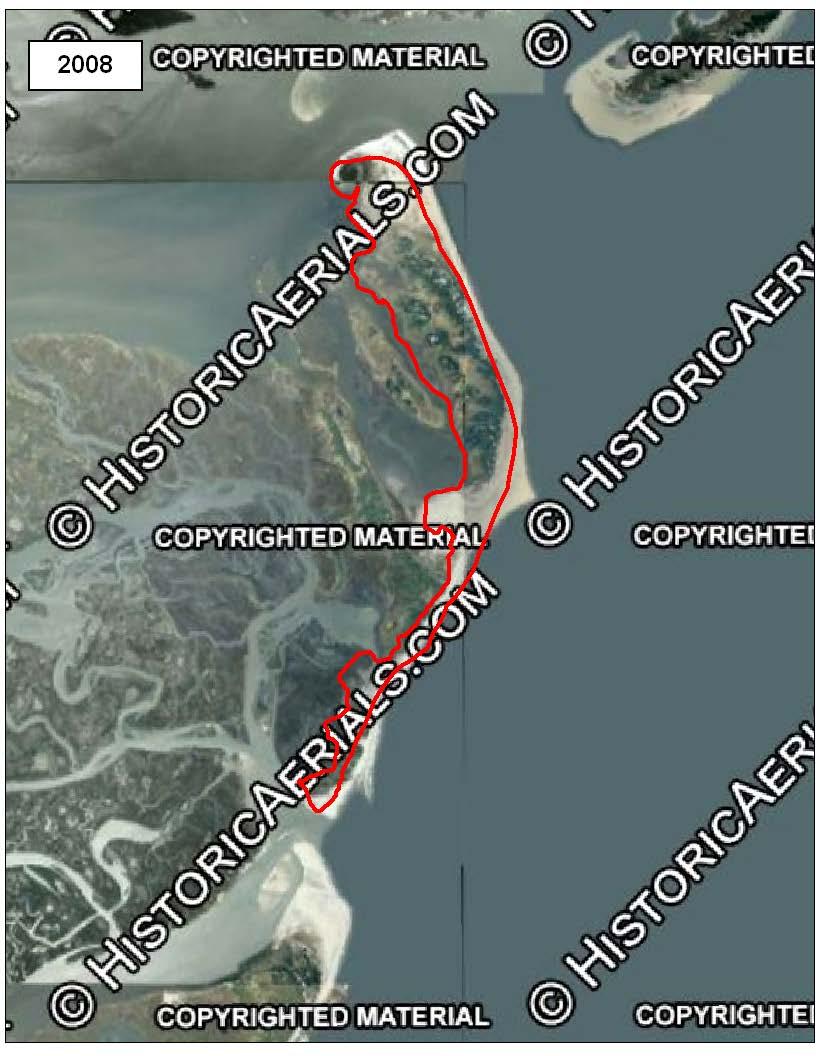
12 1963 Aerial Photograph. The 1963 aerial photograph (one year after the March 1962 Five High nor easter) indicates additional growth of the northern spit of Little Beach into Little Egg Inlet, and also southward spit growth along the south end of the island. The 1963 shoreline along the southern half of Little Beach Island is about 2,000 feet farther seaward than the 2015 shoreline Aerial Photograph. Between 1963 and 1972, the seaward-facing beach retreated landward, while the spits at the north and south ends of the island continued their growth toward Little Egg and Brigantine Inlets, respectively Aerial Photograph. The 1995 photograph indicates a breach in Little Beach Island, about midway along the length of the island. However, by 1995 the overall configuration of the island has evolved to resemble its present (2015) configuration. The principal exception is the southern half of the island, which retreated landward between 600 and 1,000 feet from 1995 to Aerial Photographs. The sequence of aerial photos from 2006 through 2015 indicate gradual but progressive retreat of the southern portion of Little Beach Island, and minor adjustments of shore alignment along the northern half of the island extending into Little Egg Inlet. Summary. This abbreviated history of the evolution of Little Beach Island supports the following principal conclusion: The dominant longshore transport direction along this portion of the NJ coast is to the southwest. Little Beach Island was historically positioned more southwest when the inlet was much wider. Little Beach has migrated northeast over the observed 141 year period. The text and figures of this presentation document the dynamic nature of the system comprised of Long Beach Island, the Holgate spit, Little Egg Inlet and Little Beach. The system is controlled by the more-or-less continuous input of littoral sediment toward the SW, from LBI and Holgate onto the Holgate spit as well as by erosional processes within the vicinity of the inlet entrance shifting sands along the southwest (ocean) side. This dynamic system is indicative of the large quantities of sand that are transported alongshore, and indicates that a configuration that exists at any given time is subject to the type of transformations documented herein, and is subject to large potential changes over periods of years to decades or in the case of severe storms: days. Sand has shifted continuously and Little Beach has alternatively built up and eroded and repositioned. These represent typical morphological changes of an inlet/ocean interface where weather and currents play dominant roles in shaping the coastline.
13
14
15
16
17
18
19
20
21
22
23
24
25
26
27
Figure79. Location map for the 10 NJBPN profile sites in Atlantic County, NJ 155
 154 Figure79. Location map for the 10 NJBPN profile sites in Atlantic County, NJ 155 ATLANTIC COUNTY SPRING 2009 to FALL 2010 The Atlantic County coastline consists of three barrier islands. Between Little
New Jersey Coastal Zone Overview. The New Jersey Beach Profile Network (NJBPN) 3 Dimensional Assessments. Quantifying Shoreline Migration
 3 Dimensional Assessments. Quantifying Shoreline Migration") New Jersey Coastal Zone Overview The New Jersey Beach Profile Network (NJBPN) Objectives Profile Locations Data Collection Analyzing NJBPN Data Examples 3 Dimensional Assessments Methodology Examples Quantifying
New Jersey Coastal Zone Overview The New Jersey Beach Profile Network (NJBPN) Objectives Profile Locations Data Collection Analyzing NJBPN Data Examples 3 Dimensional Assessments Methodology Examples Quantifying
23- Year Sand Volume Changes at Site 132, 15th Street, Brigantine
 149 Figure75. Location map for the 9 NJBPN profile sites in Atlantic County, NJ ATLANTIC COUNTY SPRING 2008 to FALL 2009 150 The Atlantic County oceanfront shoreline consists of three barrier islands.
Figure 38. Locations of the 28 NJBPN profile stations in Ocean County, NJ.
 55 Figure 38. Locations of the 28 NJBPN profile stations in Ocean County, NJ. 56 Individual Site Descriptions: Northern Ocean County recovered its beaches approaching pre-hurricane Sandy elevation or width,
New Jersey Beach Profile Network Atlantic County Profile Site Locations
 215 RICHARD STOCKTON COLLEGE OF NEW JERSEY New Jersey Beach Profile Network Atlantic County Profile Site Locations COASTAL RESEARCH CENTER Figure 128 There are nine NJBPN survey sites on the Atlantic County
Figure 262. Location map for the 10 NJBPN profile sites in Atlantic County, NJ 279
 278 Figure 262. Location map for the 10 NJBPN profile sites in Atlantic County, NJ 279 ATLANTIC COUNTY SUMMARY The Atlantic County coastline consists of three barrier islands. The island of Little Beach
UPPER BEACH REPLENISHMENT PROJECT RELATED
 ASSESSMENT OF SAND VOLUME LOSS at the TOWNSHIP of UPPER BEACH REPLENISHMENT PROJECT RELATED to the LANDFALL OF HURRICANE SANDY - PURSUANT TO NJ-DR 4086 This assessment is in response to Hurricane Sandy
Beach, dune and development in the Borough of Mantoloking as of January Prepared for The Borough of Mantoloking: April 2, 2008
 Summary of 20-years of Shoreline Monitoring Between Maryland Avenue, Point Pleasant Beach, Bay Head, Mantoloking, Brick Township, to 1 st Avenue in Normandy Beach, Ocean County, New Jersey & an Evaluation
Inlet Management Study for Pass-A-Grille and Bunces Pass, Pinellas County, Florida
 Inlet Management Study for Pass-A-Grille and Bunces Pass, Pinellas County, Florida Final Report Submitted By Ping Wang, Ph.D., Jun Cheng Ph.D., Zachary Westfall, and Mathieu Vallee Coastal Research Laboratory
Figure 41. Locations of the 28 NJBPN profile stations in Ocean County, NJ.
 57 Figure 41. Locations of the 28 NJBPN profile stations in Ocean County, NJ. 58 Hurricane Sandy s Impact on the Ocean County Shoreline; In general terms, all forms of damage to beaches, dunes and public
Beach Dune Performance Assessment of. New Jersey Beach Profile Network (NJBPN) Sites at. Long Beach Island, New Jersey. After Hurricane Sandy
 Sites at. Long Beach Island, New Jersey. After Hurricane Sandy") Beach Dune Performance Assessment of New Jersey Beach Profile Network (NJBPN) Sites at Long Beach Island, New Jersey After Hurricane Sandy November 13, 2012 The Richard Stockton College of NJ Coastal Research
Beach Dune Performance Assessment of New Jersey Beach Profile Network (NJBPN) Sites at Long Beach Island, New Jersey After Hurricane Sandy November 13, 2012 The Richard Stockton College of NJ Coastal Research
EVALUATION OF BEACH EROSION UP-DRIFT OF TIDAL INLETS IN SOUTHWEST AND CENTRAL FLORIDA, USA. Mohamed A. Dabees 1 and Brett D.
 EVALUATION OF BEACH EROSION UP-DRIFT OF TIDAL INLETS IN SOUTHWEST AND CENTRAL FLORIDA, USA Mohamed A. Dabees 1 and Brett D. Moore 1 The paper discusses the analysis of up-drift beach erosion near selected
ATLANTIC COUNTY 2006 to 2008
 ATLANTIC COUNTY 2006 to 2008 The Atlantic County oceanfront shoreline consists of three barrier islands where the northern one, Little Beach Island and a third of the second, Brigantine Island, are undeveloped
Volume and Shoreline Changes along Pinellas County Beaches during Tropical Storm Debby
 Volume and Shoreline Changes along Pinellas County Beaches during Tropical Storm Debby Ping Wang and Tiffany M. Roberts Coastal Research Laboratory University of South Florida July 24, 2012 Introduction
New Jersey Beach Profile Network Ocean County Profile Site Locations
 125 RICHARD STOCKTON COLLEGE OF NEW JERSEY COASTAL RESEARCH CENTER New Jersey Beach Profile Network Ocean County Profile Site Locations Figure 73 156 155 154 153 152 151 15 149 The Ocean County shoreline
Figure 106. Locations of the 28 NJBPN profile stations in Ocean County, NJ.
 130 Figure 106. Locations of the 28 NJBPN profile stations in Ocean County, NJ. 131 2016-2017 Beach Fills in Ocean County: The federal/state/local storm damage reduction project (beachfill) between Manasquan
Dune Monitoring Data Update Summary: 2013
 Dune Monitoring Data Update Summary: 13 Shoreline Studies Program Virginia Institute of Marine Science College of William & Mary Gloucester Point, Virginia September 13 Dune Monitoring Data Update Summary:
A REVIEW OF THE CONDITION OF THE MUNICIPAL BEACHES AS A RESULT OF HURRICANE SANDY IN THE BOROUGH OF STONE HARBOR, CAPE MAY COUNTY, NEW JERSEY
 A REVIEW OF THE CONDITION OF THE MUNICIPAL BEACHES AS A RESULT OF HURRICANE SANDY IN THE BOROUGH OF STONE HARBOR, CAPE MAY COUNTY, NEW JERSEY View along the dune scarp from 103 rd Street on October 31,
Figure 38. Locations of the 28 NJBPN profile stations in Ocean County, NJ.
 52 Figure 38. Locations of the 28 NJBPN profile stations in Ocean County, NJ. 53 Individual Site Descriptions: Beaches in Northern Ocean County continued to recover slowly as sand transported offshore
Figure 1, Chart showing the location of the Breach at Old Inlet and sensors deployed in Great South Bay.
 The Impact on Great South Bay of the Breach at Old Inlet Charles N. Flagg and Roger Flood School of Marine and Atmospheric Sciences, Stony Brook University The Great South Bay project (http://po.msrc.sunysb.edu/gsb/)
ST. JOSEPH PENINSULA, GULF COUNTY, FLORIDA Beach Re-Nourishment and Environmental Enhancement Project RECOMMENDATIONS
 ST. JOSEPH PENINSULA, GULF COUNTY, FLORIDA Beach Re-Nourishment and Environmental Enhancement Project RECOMMENDATIONS January 23, 2018 543 Harbor Boulevard, Suite 204 Destin, Florida 32541 850.654.1555
SPECIAL SPRING 2018 STORM REPORT ON THE CONDITION OF THE MUNICIPAL BEACHES FOR THE BOROUGH OF STONE HARBOR, CAPE MAY COUNTY, NEW JERSEY
 SPECIAL SPRING 2018 STORM REPORT ON THE CONDITION OF THE MUNICIPAL BEACHES FOR THE BOROUGH OF STONE HARBOR, CAPE MAY COUNTY, NEW JERSEY Aerial photograph taken April 21, 2018 showing the view up the beach
Beach profile surveys and morphological change, Otago Harbour entrance to Karitane May 2014 to June 2015
 Beach profile surveys and morphological change, Otago Harbour entrance to Karitane May 2014 to June 2015 Prepared for Port Otago Ltd Martin Single September 2015 Shore Processes and Management Ltd Contact
Figure 46. Locations of the 28 NJBPN profile stations in Ocean County, NJ. A new site was added in the Borough of Seaside Heights (#248).
.") 90 Figure 46. Locations of the 28 NJBPN profile stations in Ocean County, NJ. A new site was added in the Borough of Seaside Heights (#248). 91 OCEAN COUNTY SPRING 2008 to FALL 2009 The Ocean County shoreline
90 Figure 46. Locations of the 28 NJBPN profile stations in Ocean County, NJ. A new site was added in the Borough of Seaside Heights (#248). 91 OCEAN COUNTY SPRING 2008 to FALL 2009 The Ocean County shoreline
The Stockton University Coastal
 Hurricane Sandy: Beach-dune recovery at New Jersey Beach Profile Network (NJBPN) sites By Kimberly K. McKenna 1, Stewart C. Farrell 1, and Jeffrey A. Gebert 2 1 Stockton University Coastal Research Center
Table 4. Volumetric Change Rates Pre-Project and Post-Project for the Town of Duck
 V. VOLUMETRIC CHANGES General Volumetric changes measured over the entire monitoring area for various time periods are provided in Table 4. The volume changes are given in terms of cubic yards/foot of
DUNE STABILIZATION AND BEACH EROSION
 DUNE STABILIZATION AND BEACH EROSION CAPE HATTERAS NATIONAL SEASHORE NORTH CAROLINA ROBERT DOLAN PAUL GODFREY U. S. DEPARTMENT OF INTERIOR NATIONAL PARK SERVICE OFFICE OF NATURAL SCIENCE WASHINGTON, D.
An Update of Coastal Erosion in Puerto Rico
 Jack Morelock and Maritza Barreto An Update of Coastal Erosion in Puerto Rico Department of Marine Sciences, University of Puerto Rico at Mayagüez and Geography Department, University of Puerto Rico at
LAB: WHERE S THE BEACH
 Name: LAB: WHERE S THE BEACH Introduction When you build a sandcastle on the beach, you don't expect it to last forever. You spread out your towel to sunbathe, but you know you can't stay in the same spot
DUXBURY WAVE MODELING STUDY
 DUXBURY WAVE MODELING STUDY 2008 Status Report Duncan M. FitzGerald Peter S. Rosen Boston University Northeaster University Boston, MA 02215 Boston, MA 02115 Submitted to: DUXBURY BEACH RESERVATION November
OCEAN COUNTY 2006 to 2008
 OCEAN COUNTY 2006 to 2008 Ocean County finally started to benefit from long-awaited startup of Federal beach nourishment projects when sand was pumped onto Surf City, Long Beach Island in late 2006. This
2014 ANNUAL REPORT - TO THE CITY OF NORTH WILDWOOD ON THE CONDITION OF THE CITY BEACHES
 2014 ANNUAL REPORT - TO THE CITY OF NORTH WILDWOOD ON THE CONDITION OF THE CITY BEACHES View on September 25, 2014 looking northwest into Hereford Inlet. Considerable southerly expansion of the tip of
Performance of Upham Beach T-Groin Project and Its Impact to the Downdrift Beach
 Performance of Upham Beach T-Groin Project and Its Impact to the Downdrift Beach Progress Report for the Period of October 2008 to April 2009 Submitted by Ping Wang, Ph.D., and Tiffany M. Roberts Department
2015 ANNUAL REPORT - TO THE CITY OF NORTH WILDWOOD ON THE CONDITION OF THE CITY BEACHES
 2015 ANNUAL REPORT - TO THE CITY OF NORTH WILDWOOD ON THE CONDITION OF THE CITY BEACHES Ariel view of North Wildwood looking south from the Hereford Inlet perspective on June 24, 2015. The main channel
Barrier Progradation Related to Inlet Spacing and Migration Patterns L.E. Budde and W.J. Cleary
 Journal of Coastal Research SI 39 117-121 ICS 2004 (Proceedings) Brazil ISSN 0749-0208 Barrier Progradation Related to Inlet Spacing and Migration Patterns L.E. Budde and W.J. Cleary MS Candidate, Center
Salt Ponds Shore Zone Modeling for Breakwater Placement: Summary Report
 Salt Ponds Shore Zone Modeling for Breakwater Placement: Summary Report Virginia Institute of Marine Science May 2014 Salt Ponds Shore Zone Modeling for Breakwater Placement: Summary Report For Waterway
FINAL REPORT FOR 2013 ON THE CONDITION OF THE MUNICIPAL BEACHES IN THE TOWNSHIP OF UPPER, CAPE MAY COUNTY, NEW JERSEY
 FINAL REPORT FOR 2013 ON THE CONDITION OF THE MUNICIPAL BEACHES IN THE TOWNSHIP OF UPPER, CAPE MAY COUNTY, NEW JERSEY Aerial photograph at Corson s Inlet showing conditions on December 1, 2013 of the north
STORM RESPONSE SIMULATION
 APPENDIX V STORM RESPONSE SIMULATION Final Environmental Impact Statement Village of Bald Head Island Shoreline Protection Project Brunswick County, North Carolina Delft3D Storm Response Simulations With
MAR 110 LECTURE #15 Wave Hazards
 1 MAR 110 LECTURE #15 Wave Hazards Rogue Wave Hazard Rogue waves are very large open ocean waves of sometimes can range in height from 60 ft (20m) to120 feet (40m) and thus a significant hazard to large
HARBOUR SEDIMENTATION - COMPARISON WITH MODEL
 HARBOUR SEDIMENTATION - COMPARISON WITH MODEL ABSTRACT A mobile-bed model study of Pointe Sapin Harbour, in the Gulf of St. Lawrence, resulted in construction of a detached breakwater and sand trap to
The Continuing Evolution of the New Inlet
 The Continuing Evolution of the New Inlet Charles N. Flagg, Roger Flood and Robert Wilson School of Marine and Atmospheric Sciences, Stony Brook University It is now a year plus since super storm Sandy
The Impact on Great South Bay of the Breach at Old Inlet Charles N. Flagg School of Marine and Atmospheric Sciences, Stony Brook University
 The Impact on Great South Bay of the Breach at Old Inlet Charles N. Flagg School of Marine and Atmospheric Sciences, Stony Brook University This is the sixth in a series of reports describing the evolution
Figure 4, Photo mosaic taken on February 14 about an hour before sunset near low tide.
 The Impact on Great South Bay of the Breach at Old Inlet Charles N. Flagg and Roger Flood School of Marine and Atmospheric Sciences, Stony Brook University Since the last report was issued on January 31
RE: Hurricane Matthew Beach Damage Assessment and Recommendations [CSE 2416]
![RE: Hurricane Matthew Beach Damage Assessment and Recommendations [CSE 2416]](/thumbs/83/87675702.jpg "RE: Hurricane Matthew Beach Damage Assessment and Recommendations [CSE 2416]") October 25, 2016 Iris Hill Town Administrator Town of Edisto Beach 2414 Murray St Edisto Beach SC 29438 RE: Hurricane Matthew Beach Damage Assessment and Recommendations [CSE 2416] Dear Iris, Hurricane
October 25, 2016 Iris Hill Town Administrator Town of Edisto Beach 2414 Murray St Edisto Beach SC 29438 RE: Hurricane Matthew Beach Damage Assessment and Recommendations [CSE 2416] Dear Iris, Hurricane
Town of Duck, North Carolina
 Tracking No. 00.00.2010 Erosion Mitigation And Shoreline Management Feasibility Study Town of Duck, North Carolina Coastal Planning & Engineering of North Carolina August 15, 2012 Tom Jarrett Robert Neal
Overview. Beach Features. Coastal Regions. Other Beach Profile Features. CHAPTER 10 The Coast: Beaches and Shoreline Processes.
 Overview CHAPTER 10 The Coast: Beaches and Shoreline Processes Coastal regions constantly change. The beach is a dominant coastal feature. Wave activity continually modifies the beach and coastal areas.
USE OF SEGMENTED OFFSHORE BREAKWATERS FOR BEACH EROSION CONTROL
 .. CETN-III-22 4/84 PURPOSE: USE OF SEGMENTED OFFSHORE BREAKWATERS FOR BEACH EROSION CONTROL To provide information on the functional application of and general design considerations for using offshore
FINAL REPORT FOR 2013 ON THE CONDITION OF THE MUNICIPAL OCEANFRONT BEACHES THE BOROUGH OF AVALON, CAPE MAY COUNTY, NEW JERSEY
 FINAL REPORT FOR 2013 ON THE CONDITION OF THE MUNICIPAL OCEANFRONT BEACHES THE BOROUGH OF AVALON, CAPE MAY COUNTY, NEW JERSEY View from 12 th Street to the south taken February 28, 2013, following completion
Chapter 15 SEASONAL CHANGES IN BEACHES OP THE NORTH ATLANTIC COAST OF THE UNITED STATES
 Chapter 15 SEASONAL CHANGES IN BEACHES OP THE NORTH ATLANTIC COAST OF THE UNITED STATES By John M. Darling Hydraulic Engineer, Research Division U. S. Army Coastal Engineering Research Center Corps of
CHAPTER 56 SOFT DESIGNS FOR COASTAL PROTECTION AT SEABROOK ISLAND, S.C. ABSTRACT
 CHAPTER 56 SOFT DESIGNS FOR COASTAL PROTECTION AT SEABROOK ISLAND, S.C. Miles 0. Hayes 1, Timothy W. Kana 2 and John H. Barwis 3 ABSTRACT To gain a better understanding of the cycles of shoreline changes
2013 ANNUAL REPORT - TO THE CITY OF NORTH WILDWOOD ON THE CONDITION OF THE CITY BEACHES
 2013 ANNUAL REPORT - TO THE CITY OF NORTH WILDWOOD ON THE CONDITION OF THE CITY BEACHES View on June 18, 2013 from the 2 nd Avenue jetty looking south while the 2013 beach nourishment project was under
Reading Material. Inshore oceanography, Anikouchine and Sternberg The World Ocean, Prentice-Hall
 Reading Material Inshore oceanography, Anikouchine and Sternberg The World Ocean, Prentice-Hall BEACH PROCESSES AND COASTAL ENVIRONMENTS COASTAL FEATURES Cross section Map view Terminology for Coastal
HURRICANE SANDY LIMITED REEVALUATION REPORT UNION BEACH, NEW JERSEY DRAFT ENGINEERING APPENDIX SUB APPENDIX D SBEACH MODELING
 HURRICANE SANDY LIMITED REEVALUATION REPORT UNION BEACH, NEW JERSEY DRAFT ENGINEERING APPENDIX SUB APPENDIX D SBEACH MODELING Rev. 18 Feb 2015 1 SBEACH Modeling 1.0 Introduction Following the methodology
CHAPTER 179. Performance of a Submerged Breakwater for Shore Protection
 CHAPTER 179 Abstract Performance of a Submerged Breakwater for Shore Protection Albert E. Browder',A. Member, ASCE; Robert G. Dean 2, Member, ASCE; and Renjie Chen 3 A summary is presented of the results
Chapter 10 Field Survey and Sediment Analysis for the Candidate Site
 Chapter 1 Field Survey and Sediment Analysis for the Candidate Site 1.1 Overview Several kinds of field surveys have been carried out to obtain the necessary information for sediment analysis, planning,
Oceans and Coasts. Chapter 18
 Oceans and Coasts Chapter 18 Exploring the oceans The ocean floor Sediments thicken and the age of the seafloor increases from ridge to shore The continental shelf off the northeast United States Constituent
Chapter. The Dynamic Ocean
 Chapter The Dynamic Ocean An ocean current is the mass of ocean water that flows from one place to another. 16.1 The Composition of Seawater Surface Circulation Surface Currents Surface currents are movements
Lecture Outlines PowerPoint. Chapter 15 Earth Science, 12e Tarbuck/Lutgens
 Lecture Outlines PowerPoint Chapter 15 Earth Science, 12e Tarbuck/Lutgens 2009 Pearson Prentice Hall This work is protected by United States copyright laws and is provided solely for the use of instructors
FINAL ENVIRONMENTAL IMPACT STATEMENT ON BROWARD COUNTY SHORE PROTECTION PROJECT SEGMENTS II AND III BROWARD COUNTY, FLORIDA
 FINAL ENVIRONMENTAL IMPACT STATEMENT ON BROWARD COUNTY SHORE PROTECTION PROJECT SEGMENTS II AND III BROWARD COUNTY, FLORIDA 1. PROJECT PURPOSE AND NEED 1.1. PROJECT AUTHORITY. 1.1.1. INITIAL AUTHORIZATION.
CHAPTER 281 INFLUENCE OF NEARSHORE HARDBOTTOM ON REGIONAL SEDIMENT TRANSPORT
 CHAPTER 281 INFLUENCE OF NEARSHORE HARDBOTTOM ON REGIONAL SEDIMENT TRANSPORT Paul C.-P. Lin, Ph.D., P.E. 1 and R. Harvey Sasso, P.E. 2 ABSTRACT The influence of nearshore hardbottom on longshore and cross-shore
Technical Article No. 2.3
 Technical Article No. 2.3 INTRODUCTION Estuary, stream and river entrances can experience significant natural shoreline changes, typically much larger than experienced on other areas of the same coast.
/50. Physical Geology Shorelines
 Physical Geology Shorelines Multiple Guess: (You know the drill 2 points each) 1. The path of movement of a water particle in a wave at sea is 1. circular 2. horizontal 3. vertical 4. elliptical 5. none
4/20/17. #30 - Coastlines - General Principles Coastlines - Overview
 Writing Assignment Due one week from today by 11:59 pm See main class web pages for detailed instructions Essays will be submitted in Illinois Compass (instructions later) Pick one: Earthquakes, tsunamis,
Delaware Chapter Surfrider Foundation - Indian River Inlet Monitoring
 Delaware Chapter Surfrider Foundation - Indian River Inlet Monitoring In 2012, the Delaware Surfrider Foundation Chapter formed the Surf Quality and Access Committee to focus on issues such as surf spot
Q1. What are the primary causes/contributors to coastal erosion at Westshore and the concept of longshore / littoral drift.
 Q1. What are the primary causes/contributors to coastal erosion at Westshore and the concept of longshore / littoral drift. In order of (timing related) contribution to present problem 1. Beach is too
The evolution of beachrock morphology and its influence on beach morphodynamics
 The evolution of beachrock morphology and its influence on beach morphodynamics Robert J. Turner Division of Natural Sciences, Southampton College, 239 Montauk Highway, Southampton, NY 11968, U.S.A. email:
Techniques for Measuring and Analyzing Inlet Ebb-Shoal Evolution
 US Army Corps of Engineers Coastal Engineering Technical Note IV-13 Techniques for Measuring and Analyzing Inlet Ebb-Shoal Evolution by Donald K. Stauble PURPOSE: The Coastal Engineering Technical Note
Sediment Transport Analysis Village of Asharoken, New York
 Sediment Transport Analysis Village of Asharoken, New York NORTH SHORE OF LONG ISLAND, NEW YORK COMBINED EROSION CONTROL AND STORM DAMAGE PROTECTION FEASIBILITY STUDY FINAL REPORT August 2004 Cell 0 Asharoken
FINAL REPORT FOR 2012 ON THE CHANGES SEEN ON THE OCEANFRONT BEACHES
 FINAL REPORT FOR 2012 ON THE CHANGES SEEN ON THE OCEANFRONT BEACHES IN THE BOROUGH OF MANTOLOKING, OCEAN COUNTY, NEW JERSEY FOCUSED ON THE IMPACTS OF HURRICANE SANDY View looking north on Route 5 on October
NC TERMINAL GROIN STUDY FINAL REPORT
 II. Physical Assessment This section addresses the geological framework, physical processes, and human-induced changes that influence erosional-depositional sedimentation patterns at tidal inlets and along
North Carolina s Terminal Groins at Oregon Inlet and Fort Macon Descriptions and Discussions
 Attachment 2 North Carolina s Terminal Groins at Oregon Inlet and Fort Macon Descriptions and Discussions Oregon Inlet Terminal Groin Introduction/Background Oregon Inlet was created by a hurricane on
April 7, Prepared for: The Caribbean Disaster Emergency Response Agency Prepared by: CEAC Solutions Co. Ltd.
 April 7, 2006 Prepared for: The Caribbean Disaster Emergency Response Agency Prepared by: Introduction CEAC Solutions Co. Ltd was commissioned in May 2005 to prepare coastal beach erosion hazard maps for
Essentials of Oceanography Eleventh Edition
 Chapter Chapter 1 10 Clickers Lecture Essentials of Oceanography Eleventh Edition The Coast: Beaches and Shoreline Processes Alan P. Trujillo Harold V. Thurman Chapter Overview Coastal regions have distinct
1.5 How do ocean waves and currents change the face of coastal areas? (Chapter 3)
") 1.5 How do ocean waves and currents change the face of coastal areas? (Chapter 3) 1. Hydraulic Action/Pressure - air being forced into crack in rocks. 2. Corrosion (Solution) Minerals such as calcium carbonate
1.5 How do ocean waves and currents change the face of coastal areas? (Chapter 3) 1. Hydraulic Action/Pressure - air being forced into crack in rocks. 2. Corrosion (Solution) Minerals such as calcium carbonate
Shoreline changes and reef strengthening at Kavaratti island in Lakshadweep Archipelago - A case study
 Indian Journal of Geo-Marine Sciences Vol. 43(7), July 2014, pp. 1140-1144 Shoreline changes and reef strengthening at Kavaratti island in Lakshadweep Archipelago - A case study T.N.Prakash*, L.Sheela
Shorelines Earth - Chapter 20 Stan Hatfield Southwestern Illinois College
 Shorelines Earth - Chapter 20 Stan Hatfield Southwestern Illinois College The Shoreline A Dynamic Interface The shoreline is a dynamic interface (common boundary) among air, land, and the ocean. The shoreline
page - Laboratory Exercise #5 Shoreline Processes
 page - Laboratory Exercise #5 Shoreline Processes Section A Shoreline Processes: Overview of Waves The ocean s surface is influenced by three types of motion (waves, tides and surface currents). Shorelines
Jimmy s beach preliminary results
 Jimmy s beach preliminary results LP 668979 Jimmy s Beach Restoration Society 1 Outline 1. Long term: GIS analyses. Aerial photos, charts Shoreline analyses Storm data from MHL/DECC 2. Medium term: morphologic
Assateague Island National Seashore North End Restoration Project Timeline
 Assateague Island National Seashore North End Restoration Project Timeline Date Event Some information provided in the Project Introduction document. Detailed events are available in a timeline compiled
SHOREHAM BEACH LOCAL NATURE RESERVE
 SHOREHAM BEACH LOCAL NATURE RESERVE Coastal Geography Education Programme 2014-15 S. Savage 2014 COASTAL GEOGRAPHY OPPORTUNITIES Shoreham Beach Shoreham Beach is a shingle spit formed over many centuries
Chapter 10 Lecture Outline. The Restless Oceans
 Chapter 10 Lecture Outline The Restless Oceans Focus Question 10.1 How does the Coriolis effect influence ocean currents? The Ocean s Surface Circulation Ocean currents Masses of water that flow from one
Basic Dune Physical Characteristics
 Basic Dune Physical Characteristics New Jersey s Beach and Dune Characteristics Dunes in New Jersey are mainly confined to a narrow strip of land between the beach berm and upland development. While there
Absecon Island Shore Protection The planning behind the project
 Absecon Island Shore Protection The planning behind the project Most residents of Atlantic City, Ventnor, Margate and Longport are now aware of upcoming plans to protect their common coastline with a beachfill
BEACH PROCESSES AND COASTAL ENVIRONMENTS
 BEACH PROCESSES AND COASTAL ENVIRONMENTS COASTAL FEATURES Cross section Map view TOPICS: Terminology Waves Beach Morphology Barriers Coastal Migration Tides Tidal Flats and Marshes Sediment Budgets Human
IMPACTS OF COASTAL PROTECTION STRATEGIES ON THE COASTS OF CRETE: NUMERICAL EXPERIMENTS
 IMPACTS OF COASTAL PROTECTION STRATEGIES ON THE COASTS OF CRETE: NUMERICAL EXPERIMENTS Tsanis, I.K., Saied, U.M., Valavanis V. Department of Environmental Engineering, Technical University of Crete, Chania,
Figure 1 Example feature overview.
 1. Introduction This case focuses on the northeastern region of Onslow Bay, NC, and includes an initial shoreline, regional contour, wave gauges, inlets, dredging, and beach fills. Most of the features
Reply of Guyana Annex R2
 Summary of Findings: Analysis of Recent Shoreline Revisions to the This report assesses recent shoreline changes made to the 2005 edition of Dutch nautical chart NL 2218. This new edition is credited jointly
Natural Mechanisms of Sediment Bypassing at Tidal Inlets
 Natural Mechanisms of Sediment Bypassing at Tidal Inlets by D. M. FitzGerald, N. C. Kraus, and E. B. Hands PURPOSE: The Coastal and Hydraulics Engineering Technical Note (CHETN) described herein describes
CHAPTER 134 INTRODUCTION
 CHAPTER 134 NEW JETTIES FOR TUNG-KANG FISHING HARBOR, TAIWAN Chi-Fu Su Manager Engineering Department Taiwan Fisheries Consultants, Inc. Taipei, Taiwan INTRODUCTION Tung-Kang Fishing Harbor, which is about
2018 Annual Beach Monitoring Report
 May 1, 218 Town of Hilton Head Island, SC 218 Annual Beach Monitoring Report Submitted to: Town of Hilton Head Island, SC November 15, 217 Prepared by: Olsen Associates, Inc. 2618 Herschel Street Jacksonville,
Southwest Washington Littoral Drift Restoration Project: Design, Construction, and Monitoring
 Southwest Washington Littoral Drift Restoration Project: Design, Construction, and Monitoring J Jessica i St Stokke kk USACE Portland District October 28, 2010 WEDA Pacific Meeting Monterey, CA US Army
The Impact on Great South Bay of the Breach at Old Inlet Charles N. Flagg School of Marine and Atmospheric Sciences, Stony Brook University
 The Impact on Great South Bay of the Breach at Old Inlet Charles N. Flagg School of Marine and Atmospheric Sciences, Stony Brook University The previous report provided a detailed look at the conditions
BALD HEAD ISLAND, NC SAND SHARING SYSTEM OVERVIEW AND ASSESSMENT. Erik J. Olsen, P.E. olsen associates, inc.
 BALD HEAD ISLAND, NC SAND SHARING SYSTEM OVERVIEW AND ASSESSMENT Erik J. Olsen, P.E. Olsen Associates, Inc. BACKGROUND Both the Village of Bald Head Island (VBHI) and the Bald Head Island Limited, LLC.
Appendix E Cat Island Borrow Area Analysis
 Appendix E Cat Island Borrow Area Analysis ERDC/CHL Letter Report 1 Cat Island Borrow Area Analysis Multiple borrow area configurations were considered for Cat Island restoration. Borrow area CI1 is located
FINAL REPORT FOR 2011 ON THE CONDITION OF THE MUNICIPAL BEACHES IN THE CITY OF BRIGANTINE BEACH, ATLANTIC COUNTY, NEW JERSEY
 FINAL REPORT FOR 2011 ON THE CONDITION OF THE MUNICIPAL BEACHES IN THE CITY OF BRIGANTINE BEACH, ATLANTIC COUNTY, NEW JERSEY Photograph was taken October 10, 2011 from 10 th Street North looking south
PREPARED FOR: THE BOROUGH OF AVALON 3100 DUNE DRIVE AVALON, NJ 08202
 FINAL REPORT FOR 2012 ON THE CONDITION OF THE MUNICIPAL OCEANFRONT BEACHES FOLLOWING HURRICANE SANDY IN THE BOROUGH OF AVALON, CAPE MAY COUNTY, NEW JERSEY View from 78 th Street to the north immediately
Monterey Peninsula College
 Introduction to Google Earth Name Goals 1. To become proficient at using the basic features of Google Earth. 2. To recognize differences in coastal features between the east and west coast of North America.
Building Coastal Resiliency at Plymouth Long Beach
 Building Coastal Resiliency at Plymouth Long Beach Department of Marine and Environmental Affairs March 30, 2017 Introducing Green Infrastructure for Coastal Resiliency Plymouth Long Beach & Warren s Cove
Chapter 20 Lecture. Earth: An Introduction to Physical Geology. Eleventh Edition. Shorelines. Tarbuck and Lutgens Pearson Education, Inc.
 Chapter 20 Lecture Earth: An Introduction to Physical Geology Eleventh Edition Shorelines Tarbuck and Lutgens The Shoreline: A Dynamic Interface The Coastal Zone The shoreline is constantly modified by
Improving predictions of nearshore processes and shoreline dynamics for beaches along Australia s rocky and coral reef coasts
 Improving predictions of nearshore processes and shoreline dynamics for beaches along Australia s rocky and coral reef coasts Ryan Lowe Jeff Hansen, Graham Symonds, Mark Buckley, Andrew Pomeroy, Gundula