Chapter 10 Field Survey and Sediment Analysis for the Candidate Site
|
|
|
- Theodora Cross
- 5 years ago
- Views:
Transcription
1 Chapter 1 Field Survey and Sediment Analysis for the Candidate Site 1.1 Overview Several kinds of field surveys have been carried out to obtain the necessary information for sediment analysis, planning, and design. Finally, the comprehensive analysis based on the obtained data and survey results has been conducted to grasp the mechanism of littoral drift and resulting beach change. Table shows an overview of Chapter 1. Table Overview of Chapter 1 Ref. No Item Objective Obtained Result Applied to 1.1 Tide Measurement at Southwest and East Coast -To check the difference of tide change between southwest and east coast -To confirm the design tide condition Same tide condition can be employed between southwest and east coast (Candidasa) in the design design & construction method 1.2 Sounding (Bathymetric and Topographic Survey) -To understand the bathymetric features as part of the formulation of a coastal conservation plan -To know the sediment process at southwest coast -Geographical information could be obtained - The sediment process at Kuta offshore was identified design, sediment analysis & construction method Beach Profile Survey and Sand Sampling Diving Survey for Potential Area of Sand Borrow -To know the process of beach erosion and mechanism of littoral drift -To know the relation between beach slope and grain size - To identify the potential area of sand borrow for nourishment at offshore of surrounding project area - At Candidasa, significant change of profile was not observed since 26 - Nourished sand are maintained the stable condition at Kuta north. - Change of profile was observed at Legian, Seminyak area, but not so significant - Beach slope and grain size was identified - There is a sand potential area at offshore of Candidasa, but obtaining of sand with good specification is some difficulty. -There is a sand potential area at out of Kuta reef. design & sediment analysis construction method & cost estimate 1.5 Comprehensive Analysis for Sediment Transport at Candidasa -To know the comprehensive mechanism for littoral drift at Candidasa -Westward littoral drift exists for whole area of Candidasa. - Possibility to increase the organic sand is not expected planning & design 1.6 Comprehensive Analysis for Sediment Transport at Southwest Coast -To know the comprehensive mechanism for littoral drift at Southwest coast -Obvious littoral drift doesn t exist from north Kuta, Legian to Seminyak area planning & design 1-1
2 1.2 Tide Measurements along the Southwest and East Coast Measurement of sea water level was carried out to check the difference in tidal change between the southwest and east coast, which will be considered in the design study. Each self-recorded pressure sensor type tide gage was simultaneously installed in both Kuta and Candidasa, and continuous measurement of sea water level was carried out from November 22-December 22, 211. The measured data were compared with the tide prediction for Benoa Port. Findings based on the comparison are as follows: Similar tendency of tidal change was observed between the measurements (from bathymetric and topographic surveys) in Kuta, and prediction in Benoa. On the other hand, tidal change in Candidasa was different from that in Kuta. The difference might be caused mainly by the effect on the existence of coral reef in Candidasa. Significant difference in maximum sea water levels (HWL) was not observed. This means that the same tide condition can be employed for both the southwest coast and east coast (Candidasa) in the design study Sea Water Level (cm) Candidasa Kuta Benoa 5 11/22 11/24 11/26 11/28 11/3 12/2 12/4 12/6 Date 3 25 Sea Water Level (cm) CANDIDASA 5 KUTA BENOA 12/9 12/11 12/13 12/15 12/17 12/19 12/21 12/23 Date Figure Result of Sea Water Level Measurements in Candidasa and Kuta 1-2
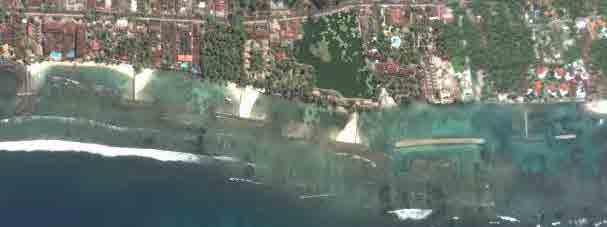
3 1.3 Sounding (Bathymetric and Topographic Survey) (1) Outline Bathymetric survey was carried out Candidasa and from North Kuta to part of Canggu to understand the bathymetric features as part of the formulation of a coastal conservation plan for the candidate sites (Figure 1.3.1). The range and intervals of the bathymetric survey are shown in Table Figure Bathymetric Survey Areas Table Range and Intervals of Bathymetric Survey Location (Survey Date) Length of Coastline (km) Line Spacing Interval of Sounded Point Coverage Area from Shoreline (m) Candidasa (December 1, 211) 5 km (from peninsula to the west) 25 m at inner reef area 1 m at outer reef area 25 m (max.) Approx. 1.2 km, or reached maximum depth North Kuta to Petitenget (November 24-25, December 2, 211) 6 km (from Kartika Plaza to Petitenget Temple) 1 m from Kuta Art Market to end; 25 m from Kartika Plaza to Kuta Art Market 25 m (max.) Approx. 1.5 km, or reached a depth more than 25 m 1-3


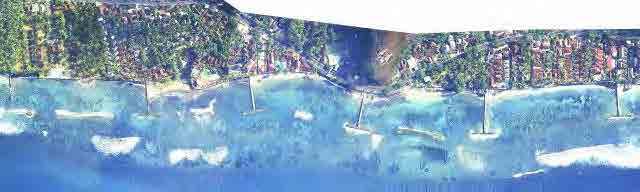
4 (2) Sounding Results a) East Coast (Candidasa) In Candidasa, the coral reef in the eastern edge located in front of Puri Bagus Hotel is developing continuously across the coastline from eastern edge, with a 3 m width from coast to reef edge. The width of coral reef is decreasing gradually in a westward direction, and the reef ends in front of Puri Bagus Hotel. The coastal water depth at eastern edge and western edge of Candidasa is shallow with about 1 m in the vicinity of 4 m from the coast. The coastal water depth of the central part, in front of Sub Ocean Hotel, is relatively deep with about 2 m in the vicinity of 4 m from the coast (Figure 1.3.2). Figure Bathymetric Chart for Candidasa b) Southwest Coast (from North Kuta to Part of Canggu) In Kuta, the coral reef developing around the coastal area of runway is decreasing drastically northward and finally disappears as it reaches the front of the Bali Garden Hotel. The coastal water depth is shallow from the southern edge to Bali Garden Hotel, and from Bali Holiday Resort Hotel northwards. Said depth is about 5 m in the vicinity of 4 m from the coast. The coastal water depth from Bali Garden Hotel to Bali Holiday Resort Hotel is relatively deep with about 5 m in the vicinity of 2 m from the coast (Figure 1.3.3). 1-4
 Comparison of Cross Section Chart a) East Coast (Candidasa) The results of bathymetric survey in Candidasa were used")
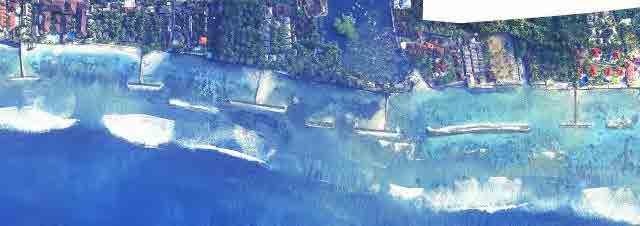
5 Figure Bathymetric Chart for the South East Coast from North Kuta to Part of Canggu (3) Comparison of Cross Section Chart a) East Coast (Candidasa) The results of bathymetric survey in Candidasa were used to investigate the sediment (littoral drift sand) transport and beach change. The representative survey lines to evaluate the bathymetric features are shown in Figure L1 L9 L8 L7 L6 L5 L4 L3 L2 L1 Figure Location of Representative Survey Lines in Candidasa 1-5
6 The cross section charts of representative survey lines, based on the results of bathymetric survey carried out in Candidasa last December 211, are shown in Figure The sea-bottoms at shallower water depth than 1 m have gentle slope of 1/2 to1/5. In contrast, as for the sea-bottoms at deeper water depth than 1 m have, L1 at eastern edge is a gentle slope of 1/3 and other lines are sharp slope of 1/1 to 1/15. It was assumed that it may not be possible for the littoral drift sand to return to the beach once the sand has been transported offshore considering that the sea bottom slope in the coastal area of Candidasa is steep when water depth is deeper than 1 m Year Cross Section Line Line L1 Line L2 Line L3 Line L4 Line L Year Cross Section Line Line L6 Line L7 Line L8 Line L9 Line L1 Elevation (m) -2-4 Elevation (m) Distance (m) Distance (m) Figure Cross Section Charts of Representative Survey Lines in Candidasa b) Southwest Coast (North Kuta to part of Canggu) The sediment (littoral drift sand) transport and beach change from North Kuta to part of Canggu were investigated, based on the results of bathymetric survey carried out in Kuta last 26, 28, and 211. The representative survey lines considered for evaluating the bathymetric features are shown in Figure Among the representative survey lines, C1 to C5 belonged to the nourishment sites implemented under the Phase-1 Project, while C6 to C1 belonged to sites not implemented under the Phase-1 Project. Figure Locations of Representative Survey Lines in Kuta 1-6
7 The comparison results of cross section chart for each representative survey line, based on the results of bathymetric survey, are shown in Figure and Figure The results of coastal accretion and erosion conditions at each survey line are summarized in Table Both C4 and C5, located in the north edge of the nourishment implemented in the Phase-1 Project, have an accretion trend when the sea bottom is deeper than 8 m. This was likely due to some of the nourishment sand, which were transported offshore and accumulated on the sea bottom at C4 and C5. C6 to C1 located at the sites which have not been nourished in the Phase-1 Project do not exhibit clear trend of erosion and accretion. It appears that the nourishment sand in the Phase-1 Project has not been transported northward from C6. Table Results of Coastal Accretion and Erosion Conditions at Each Survey Line Survey Line C1-C2 C3 C4 C5 C6-C1 Accretion and Erosion Conditions Sea bottoms (at water levels deeper than 5 m) more than 4 m from the reference point showed different trends between 26 to 28 and 28 to 211, and exhibited no clear tendency of erosion or accretion. Sea bottoms (coast side) within 1 m from the reference point showed same accretion trends between 26 to 28, and 28 to 211. Sea bottoms (offshore side) more than 1 m from the reference point showed different trends between 26 to 28, and 28 to 211, and exhibited no clear tendency of erosion or accretion. Sea-bottoms at coast side (with higher elevation than m) and offshore side showed same accretion trends between 26 to 28, and 28 to 211. Sea bottoms at coast side (with elevations higher than m) and offshore side showed same accretion trends between 26 to 28, and 28 to 211. Sea bottoms showed different trends between 26 to 28, and 28 to 211, and exhibited no clear tendency of erosion or accretion. 1-7
8 8 8 4 Cross Section Line C1 26Year 28Year 211Year 4 Cross Section Line C2 26Year 28Year 211Year Elevation (m) -4 Elevation (m) Distance (m) Distance (m) Cross Section Line C3 26Year 28Year 211Year 4 Cross Section Line C4 26Year 28Year 211Year Elevation (m) -4 Elevation (m) Distance (m) Distance (m) Cross Section Line C5 26Year 28Year 211Year 4 Cross Section Line C6 26Year 28Year 211Year Elevation (m) -4 Elevation (m) Distance (m) Distance (m) Figure Comparison on the Results of Cross Section Charts for the Southwest Coast 1-8
9 8 8 4 Cross Section Line C7 26Year 28Year 211Year 4 Cross Section Line C8 26Year 28Year 211Year Elevation (m) -4 Elevation (m) Distance (m) Distance (m) Cross Section Line C9 26Year 28Year 211Year 4 Cross Section Line C1 26Year 28Year 211Year Elevation (m) -4-8 Elevation (m) Distance (m) Distance (m) Figure Comparison on the Results of Cross Section Charts for the Southwest Coast 1.4 Beach Profile Survey and Sand Sampling on the Beach (1) Outline of Survey Beach profile survey and sand sampling on the beach were carried out at two candidate sites namely, Candidasa and from North Kuta to part of Canggu for the study on the mechanisms of littoral drift. Location maps for the beach profile survey and sand sampling on the beach are shown in Figure and Figure

10 Figure Location of Beach Profile Survey and Sand Sampling at Candidasa Figure Location of Beach Profile Survey and Sand Sampling at the South East Coast from North Kuta to Part of Canggu 1-1
11 The outline of sand sampling on the beach is shown in Table Basically, sand samples were taken from three different positions (berm top, sloping part, and flat part) in one cross line as shown in Figure The sand taken from the berm top is possibly influenced by sorting effect of blowing wind. To avoid this effect and obtain the same condition as that after nourishment as baseline condition, it was considered to take the sand sample at berm top 3 cm below the surface as shown in Figure By comparing the difference in grain size taken from berm top and sloping part on certain lines in areas of coastal retreat, the grain size with no contribution to form the beach can be roughly evaluated. Location and Date of Survey Candidasa December 211 North Kuta to Petitenget November 211 Table Outline of Sand Sampling on the Beach Survey Sampling Point Sites 34 3 points per 1line (berm, slope, and flat parts) 26 3 points per 1line (berm, slope, and flat parts) Analytical Parameters Sieve analysis (grain sieve distribution and specific gravity) Analysis of component materials (coral, volcanic, shell, foraminifera) Sieve analysis (grain sieve distribution and specific gravity) Analysis of component materials (coral, volcanic, shell, foraminifera) Slope Berm Flat Figure Position of Sand Sampling in a Cross Section Line (2) Results of the Beach Profile Survey a) East Coast (Candidasa) The beach profile survey in Candidasa has been carried out from east side peninsula to Alilla Manggis Hotel, which is located 5 km west side from the peninsula. The total number of survey lines taken was 24 as shown in Figure Some profile lines can be compared using the previous survey data. Figure shows the typical results of beach profile for comparison with the previous condition. Here, three profile data which were taken in August 25, February 26, and December 211(in this study) were compared. Most parts of the beach area have already been divided into sections by the existing T-shape groins and offshore breakwaters constructed from 1989 to 1998 by the Indonesian government. Sandy beach has almost disappeared as of date, and the remaining small amount of sand at each section on the beach is trapped by groins. Due to this, no significant difference in each section was not observed from 26 to present. 1-11
12 b) Southwest Coast (North Kuta to Part of Canggu) The beach profile survey has been carried out from the north part of coral reef area in Kuta (north side of last offshore breakwater, BWN3, which was constructed during the Phase-1 Project until Petitengat Temple located in the north of Seminyak area, which is roughly 6 km alongshore. The total number of survey lines taken is 12 as shown in Figure Some profile lines can be compared using the previous survey data. Figures and show the typical results of beach profile for comparison with the previous condition. Here, four profile data which were taken in November 2, December 28 (just after the nourishment during the Phase-1 Project), June 211, and December 211 (in this study), were compared as follows: In the north of coral reef area from line K1 to K8, most of the nourished sand has flown out, restoring the condition to that before the nourishment as shown in Figure (K6). From line K9 to K2, the beach became significantly wider due to the nourishment during the Phase-1 Project compared to the previous condition. Moreover, the beach condition did not seem to change significantly after the nourishment. Some of the profile indicates accumulation of beach as shown in Figure (K18). From line K22 to K32, the beach width evidently increased than that just after the nourishment as shown in Figure (K28). Line K38 shown in Figure is located at the end of nourishment area in the Phase-1 Project, which has normal constant width. The beach width that forms part of nourishment was gradually reduced from said line to the north (up to line K45), which is approximately 3 m in distance as transition area. The beach condition was almost the same just after the nourishment. Line K45 shown in Figure is the end point of the nourishment. A slight increase of the shoreline was observed. From line K46 to K64, the beach slightly accumulated compared to just before the nourishment (see Figure showing K6) There was no significant change of beach condition in Seminyak area (from line K7 to K9) in the last ten years. 1-12
13 Height (m) L4 Distance (m) August-5 February-6 December-11 Height (m) Distance (m) August-5 February-6 December-11 L12 Height (m) Distance (m) August-5 February-6 December-11 L23 Height (m) Distance (m) August-5 February-6 December-11 L33 Figure Comparison on the Beach Profile Taken at Typical Survey Lines in Candidasa 1-13
14 6. 5. K6 (in front of Discovery Moll) HEIGHT (M) DISTANCE (M) Nov. 2 Dec. 28 Jun. 211 Dec K18 (Near the Hard Rock Cafe Hotel) 4. HEIGHT (M) DISTANCE (M) Nov. 2 December-8 Dec. 28 (BF) Jun Dec K28 (South of Bragd Istana Rama Hotel) HEIGHT (M) DISTANCE (M) Nov. 2 Dec. 28 Jun. 211 Dec K38 ( End of nourishment area with normal width) HEIGHT (M) DISTANCE (M) Nov. 2 Dec. 28 Jun. 211 Dec. 211 Figure Comparison on the Beach Profile Taken at Typical Survey Lines from North Kuta to Seminyak 1-14
15 6. 5. K45 (End of nourishment area) 4. HEIGHT (M) DISTANCE (M) Nov. 2 Dec. 28 Jun. 211 Dec K6 (North side of Padma Hotel) HEIGHT (M) DISTANCE (M) Nov. 2 Dec. 28 Dec K76 (South side of Dubble Six) 4. HEIGHT (M) DISTANCE (M) Nov. 2 Dec. 28 Dec. 211 K86 (Gado-gado Restaurant) 4. HEIGHT (M) DISTANCE (M) Nov. 2 Dec. 28 Dec. 211 Figure Comparison on the Beach Profile Taken at Typical Survey Lines from North Kuta to Seminyak 1-15
16 (3) Results of the Sand Sampling on the Beach a) East Coast (Candidasa) i) Grain Size Distribution of Seabed Material (Figure 1.4.7) The medium grain size and fine sand content of seabed on the beach in Candidasa are shown in Figure Except for the area surrounding Sunrise Hotel (CD14-CD17) where the beach was nourished with mountain sand and has now become a gravel beach due to sand erosion, the grain size distribution has a high percentage of fine sand (grain size: mm). Furthermore, the grain size distributions obtained from three different positions (berm top, sloping part, and flat part) exhibited the same tendency wherein the percentage of fine sand is increasing in a westward direction. Meanwhile those obtained from the flat part have a particularly distinct tendency. ii) Slope of Seabed (Figure 1.4.7) The slope of seabed on the beach in Candidasa is shown in Figure The range of slope is from 9 to 16, and the average is about 12. iii) Composition of Seabed Materials (Figure 1.4.8) The composition of seabed materials on the beach in Candidasa is shown Figure They are composed of a high percentage of volcanic matter from land in the eastern and central parts of Candidasa. Other parts have a high percentage of biogenic matter such as shell and foraminifera. b) Southwest Coast (North Kuta~Part of Canggu) i) Grain Size Distribution of Seabed Materials (Figure 1.4.9) The medium grain size and fine sand content of seabed material on the beach in the southwest coast are shown in Figure The overall grain size distribution has a high percentage of fine sand (grain size: mm). Seabed materials obtained from flat areas appeared to have a higher percentage of sand with large grain size than those obtained from the other areas (berm and sloping part). The distribution of grain size along the coastline showed a wavelike pattern with the peak of fine sand at Location No.1 and No.13. ii) Slope of Seabed (Figure 1.4.9) The slope of seabed on the beach in the southwest coast is shown in Figure The range of slope was from 8 to 14 and the average was about 1. iii) Composition of Seabed Materials (Figure 1.3.1) The composition of seabed materials on the beach in the southwest coast is shown in Figure Seabed materials are composed of a high percentage of biogenic matter in the eastern part, and appeared that the percentage of volcanic matter from land is increasing towards the north. 1-16
17 Grain Size D5 (mm) D5 (mm) Sample Name B S F Content of Fine Sand (%) CONTENT OF FINE SAND Sample Name B S F Slope ( 1 : n ) FORESHORE SLOPE Sample Name Figure Alongshore Distribution of Medium Grain Size (D5), Contents of Fine Sand and Average Slope in Candidasa 1-17
18 1 8 6 Foraminifera Coral Shell Volcanic Content of Material Obtained from Berm of Beach at Candi Dasa Foraminifera Coral Shell Volcanic Content of Material Obtained from Slope of Beach at Candi Dasa Foraminifera Coral Shell Volcanic Content of Material Obtained from Flat of Beach at Candi Dasa Figure Seabed Material Composition in Candidasa 1-18
19 Grain Size (mm ) D 5 (mm) of Kuta Sand Sample Sample Name B S F Content of Fine Sand (%) CONTENT OF FINE SAND Sample Name B S F Slope ( 1 : n ) Sample Name Figure Alongshore Distribution of Medium Grain Size (D5), Contents of Fine Sand, and Average Slope in the Southwest Coast from North Kuta to Part of Canggu 1-19
20 1 8 Foraminifera Coral Shell Volcanic Content of Material Obtained from Berm of Beach at Kuta 1 8 Foraminifera Coral Shell Volcanic Content of Material Obtained from Slope of Beach at Kuta 1 8 Foraminifera Coral Shell Volcanic Content of Material Obtained from Flat of Beach at Kuta Figure Seabed Material Composition in the Southwest Coast from North Kuta to Part of Canggu 1-2
21 1.5 Diving Survey for Potential Area of Sand Borrow (1) Location of the Survey In order to understand the potential areas of sand borrow, a diving survey was carried out in the offshore area of southeast and southwest coast in November and December 211. The outline of diving survey is shown in Table while the locations are shown in Figure and Table Outline of Diving Survey Location (Survey Date) Candidasa (December 211) North Kuta to Part of Canggu (November 211) Survey Sampling Point Site 43 Outer reef: 34 points 26 points with laboratory test 11 points without laboratory test Inner reef: 9 points 9 points with laboratory test 32 Offshore: 26 points 26 points with laboratory test Nearshore: 6 points 6 points with laboratory test Field Survey Items/ Laboratory Analysis Filed survey items: elevation, thickness of sand layer, sand color, main contents of sand materials (coral, volcanic, shell, foraminifera) Laboratory analysis: grain sieve distribution, specific gravity Filed survey items: elevation, thickness of sand layer, sand color, main contents of sand materials (coral, volcanic, shell, foraminifera) Laboratory analysis: grain sieve distribution, specific gravity Figure Diving Survey Area in Candidasa 1-21
22 Figure (2) Results Diving Survey Area in the Southwest Coast from Kuta to Part of Canggu a) Candidasa The results of diving survey of seabed materials in Candidasa is shown in Table The seabed materials contained more volcanic materials of land origin as indicated by a grey color. In contrast, the seabed materials contained more biogenic materials such as foraminifera, coral, and shell shown as brown color. As for the color of seabed material on the outer side of the reef in Candidasa, about 6% of the total was grey. On the inside face of the reef, about 8% was biogenic material with brown color. As for the grain size, the seabed materials contained more volcanic materials with higher percentage of fine sand and smaller percentage of medium size. In contrast, the seabed materials contained more biogenic materials that have lower percentage of fine sand content and bigger percentage of medium grain size. b) Southwest Coast from Kuta to Part of Canggu The seabed in the southwest coast from Kuta to part of Canggu was characterized with significant variation. of yellow sand, foraminifera sand, grey sand, fine sand, and mud. Also, the seabed was occasionally rocky. The results of diving survey of seabed materials in the southwest coast is shown in Table As for the color of seabed material on the offshore and nearshore areas in Kuta, about 7% of the total was grey in color. As for the grain size,, the seabed materials contained more volcanic materials with higher percentage of fine sand content and smaller percentage of medium grain size. In contrast, the seabed materials contained more biogenic materials with lower percentage of fine sand content and bigger percentage of medium grain size. 1-22
23 Table Results of the Diving Survey of Seabed Materials in Candidasa Location: No. EL. (m) CANDIDASA Thickness (cm) Surface or Below Color Description (Main contents) Result of sieve analysis Contents of Fine Sand 5% 1% % D5 (mm) Gs (kg/cm3) C SURFACE Light Brown Shell 55% BELOW Light Brown Shell 55% C SURFACE Dark Grey Volcanic 5% BELOW Dark Grey Volcanic 5% C SURFACE Light Brown Shell 6% BELOW Light Brown Shell 6% C SURFACE Dark Grey Shell 5% 91% BELOW Dark Grey Coral & Shell 45% 75% C SURFACE Grey Volcanic 45% BELOW Grey Volcanic 45% C SURFACE Grey Volcanic 7% BELOW Light Grey Coral 5% C SURFACE Grey Coral 5% 73% BELOW Light Grey Coral 9% 4% C SURFACE Light Brown Coral 6% 48% BELOW Light Brown Coral 9% 28% C SURFACE Light Brown Shell 7% BELOW Light Brown Shell 7% C SURFACE Grey Shell 55% 7% C SURFACE Grey Coral 5% 56% C SURFACE Grey Coral 6% 45% C SURFACE Grey Shell 45% 82% BELOW Grey Shell 55% 61% C SURFACE Grey Volcanic 9% BELOW Grey Volcanic 65% C SURFACE Brown Coral 9% 46% BELOW Brown Coral 9% 15% C SURFACE Light Brown Coral 9% 18% BELOW Light Brown Coral 85% 8% C SURFACE Light Brown Coral 8% 15% BELOW Light Brown Coral 9% 9% C SURFACE Brown Coral 9% BELOW Brown Coral 9% C SURFACE Brown Coral 9% 21% BELOW Brown Coral 9% 6% C SURFACE Grey Volcanic 55% 88% BELOW Grey Shell 55% 87% C SURFACE Dark Grey Volcanic 95% BELOW Dark Grey Volcanic 95% C > 12 SURFACE Grey Coral 85% 4% BELOW Grey Coral 85% 36% C SURFACE Grey Volcanic 8% BELOW Grey Volcanic 9% C SURFACE Grey Shell 65% 9% BELOW Light Grey Coral 8% 62% C SURFACE Light Grey Shell 75% 86% BELOW Light Brown Coral 5% 25% C SURFACE Grey Volcanic 8% BELOW Grey Volcanic 6% C SURFACE Light Grey Shell 55% 79% BELOW Light Grey Shell 5% 53% C SURFACE Light Brown Shell 55% 36% BELOW Light Brown Coral 5% 29% C SURFACE Light Grey Volc & Shell 45% 92% 2.89 BELOW Light Grey Volcanic 5% 75% 2.91 C SURFACE Light Grey Shell 5% 91% BELOW Light Grey Shell 75% 61% C SURFACE Light Brown Coral 6% 62% C SURFACE Grey Volcanic 6% 87% BELOW Grey Volcanic 5% 75% C > 12 SURFACE Dark Grey Volcanic 55% 92% BELOW Dark Grey Volc & Shell 5% 91% C SURFACE Light Brown Coral 8% 22% BELOW Light Brown Coral 8% 15% CR SURFACE Light Brown Foraminifera 7% 16% CR SURFACE Light Grey Shell 4% 67% CR SURFACE Light Brown Foraminifera 65% 8% CR SURFACE Light Brown Coral 4% 56% CR SURFACE Light Grey Coral 7% 36% CR SURFACE Light Brown Coral 6% 22% CR SURFACE Light Brown Coral 4% 95% CR SURFACE Light Brown Shell 55% 57% CR SURFACE Light Brown Shell 65% 81%
24 Table Results of the Diving Survey of Seabed Materials from Kuta to Canggu Location: KUTA No. Result of sieve analysis EL. Thickness Surface or Description Color Contents of Fine Sand D5 Gs (m) (cm) Below (Main contents) 5% 1% (%) (mm) (kg/cm3) K Surface Light Brown Shell 7% 14% K Surface Brown 77% K Surface Light Brown Shell 6% 11% K Surface Light Brown Shell 5% 4% K Surface Light Grey Shell 8% 82% K Surface Brown Shell 8% 14% K Surface Brown Shell 6% 59% K Surface Light Brown Shell 6% 66% K Surface Grey Volcanic 9% 89% K Surface Light Grey Shell 9% 96% K Surface Dark Grey Volcanic 8% 94% K Surface Dark Grey Volcanic 8% 98% K Surface Grey 97% K > 12 Surface Dark Grey Volcanic 9% 94% K Surface Light Grey Shell 7% 6% K > 12 Surface Grey Volcanic 9% 96% K Surface Light Grey Shell 5% 29% K Surface Light Grey Shell 7% 91% K Surface Grey Volcanic 95% 83% K2-2. > 12 Surface Grey Volcanic 7% 99% K Surface Grey Coral 65% 16% K > 12 Surface Grey Volcanic 8% 99% K23-3. > 12 Surface Light Grey Shell 5% 2% K Surface Grey Volcanic 9% 97% K Surface Grey Volcanic 7% 95% K > 12 Surface Grey Volcanic 9% 93% KS Surface Light Brown Shell 9% 73% KS Surface Brown Shell 7% 19% KS Surface Light Grey Volcanic 1% 93% KS Surface Light Grey Volcanic 9% 99% KS Surface Grey Volcanic 8% 96% KS Surface Grey Volcanic 8% 99%

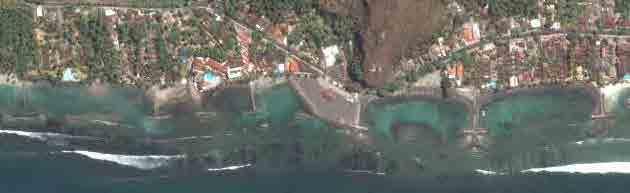
25 1.6 Comprehensive Analysis for Sediment Transport in Candidasa The comprehensive analysis on sediment transport based on several collected data is very important to achieve collective understanding of sediment transport data, prior to examination of the planning and design of beach conservation measures. The following data and information were applied for the comprehensive analysis of sediment transport in two candidate areas: Site investigation data; Results of shoreline change and topography analysis based on aerial and satellite photos; Sounding data (bathymetric and topographic data); Shoreline monitoring data; Sand sampling and sieve analysis results; and Numerical analysis results (computation for waves and longshore sediment transport). (1) Beach Condition Obtained from Site Investigation and Shape of Shoreline based on Satellite Photos The sediment cell in Candidasa was identified from Tanjung Iti to the peninsula westside from Amankila Hotel, which was approximately 6 km longshore distance. To present the current beach condition, this area was divided into three subareas namely, West Area, Central Area, and East Area as shown in Figure Figure Candidasa Area a) West Area The west area has roughly 2 km alongshore distance, with an existing coral reef of 3 m width in maximum. The position of each photo taken in November 211 at west area (during low tide) is shown in Figure The representative beach conditions are discussed as follows, and shown in Photos and 1.6.2: Predominant wave direction in Candidasa was from S to SSE based on the numerical computation for wave field. Due to this, the westward littoral sand drift occured in the whole area. However, the strength of littoral sand drift depends on the angle of shoreline to the incident waves, and width of coral reef. 1-25
26 The angle of shoreline in the westside was almost perpendicular to the predicted incident wave direction. Consequently, a stable black sandy beach was formed (Positions 1 and 2). However, the angle of shoreline on the other area moved to induce the westward littoral drift. Significant beach and land erosion were observed from Position 3 located at the downdrift side from small peninsula, which was covered by concrete seawalls (Position 4). Significant beach erosion was also observed from Positions 5, 7, and 8, and all beaches were covered with vertical concrete seawall. Between these eroded areas, small sandy beach partially existed (Position 6). This was probably influenced by the existence of the shoal on reef flat. The angle of shoreline changed from Positions 8 to 1 with almost the same angle as that of Position 1. Moreover, the sandy beach was maintained at this limited area even though the width of the beach is narrow. 1-26


 Position 1")

")
27 Figure Location Map Showing Where Photos were Taken in the West Area of Candidasa (November 211) Position 1 Position 2 Position 3 Position 4 Photo Beach Condition in the West Area of Candidasa (November 211) 1-27

 From these results, it was")


28 Position 5 Position 6 Position 7 Position 8 Position 9 Position 1 Photo Beach Condition in the West Area of Candidasa (November 211) From these results, it was concluded that it is difficult to maintain the sand without costal structures such as groin and headland to interrupt the westward littoral drift. However, the strength of littoral drift is different in each area depending on the angle of shoreline and width of coral reef. Thus, a detailed analysis, taking this view into account, will be required for the finalization of layout of coastal structures and predicted beach shape. 1-28


29 b) Central Area The west area has roughly 1 km alongshore distance. The width of its coral reef is narrower by more or less 1 m compared to that of the west and east area. The positions where each photo was taken in November 212 are shown in Figure The representative beach conditions shown in Photos and are discussed subsequently. Figure Location Map Showing Where Photos were Taken in the Central Area of Candidasa (November 211) Position 1 Position 2 Position 3 Position 4 Photo Beach Condition in the Central Area of Candidasa (November 211) 1-29
 of each structure is lower than HWL (+2.")
.")
, which is 27 m long, in its east end. The position where each photo was taken in November 212 in the east area is shown in Figure 1.6.4.")

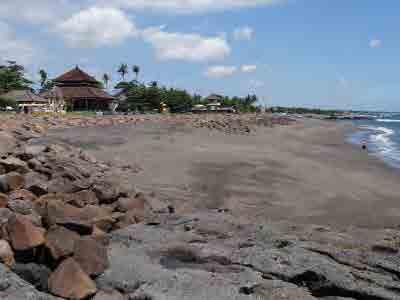
30 Position 5 Position 6 Position 7 Position 8 Photo Beach Condition in the Central Area of Candidasa (November 211) No sandy beach due to erosion was observed in almost the whole area (Positions 1 and 2). Fifteen T-shape groins and 15 offshore breakwaters existed in Candidasa. However, the crown height (+2.2 m) of each structure is lower than HWL (+2.6 m), and their function to interrupt the westward sand drift is very low. If the geographical shape of shoreline was checked in detail, it can confirm that sandy beach with caved shoreline shape exists in the area (Position 4). c) East Area The west area has roughly 3 km alongshore distance, and the width of its coral reef is wider than that of the central area by 25 m maximum. There exists a peninsula (Tanjung Nti), which is 27 m long, in its east end. The position where each photo was taken in November 212 in the east area is shown in Figure The representative beach conditions discussed below are shown in Photos and Most of the westward volcanic littoral sand from eastside of the peninsula are interrupted by said peninsula. However, according to the result of sand sampling along the beach, the contents of sand nearby the peninsula were not coral but volcanic. From the result, some parts of the volcanic sand might be due to inflow occurrence through the peninsula. Local government executed beach nourishment with the improvement of existing T-shape groins. However, most of the filled sand (black sand) has flown out and only pebble 1-3


 Sand has")
.")

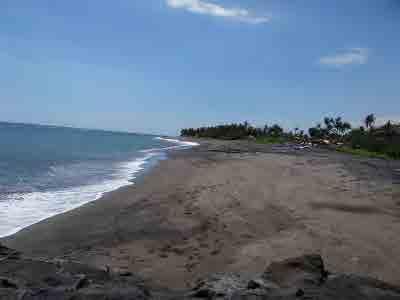
31 stones have remained. Beach landscaping and utilization of the beach have deteriorated due to this improvement. (Positions 1 to 3). Figure Location Map Showing Where Photos were Taken in the East Area of Candidasa (November 211) Position 1 Position 2 Position 3 Position 4 Photo Beach Condition in the East Area of Candidasa (November 211) Sand has almost disappeared in most areas despite the existing T-shape groins and offshore breakwaters (Positions 6, 7, and 9). However, sandy beach partially remained in a limited area, especially at locations surrounding the T-shape groins. The beach condition nearby the peninsula is better than other west side areas, with volcanic sandy beach of certain width that was maintained (Position 1). This condition 1-31


32 might have been maintained by inflow of volcanic sand through the peninsula, and the shadow effect of the waves due to existence of the peninsula. Position 5 Position 6 Position 7 Position 8 Position 9 Position 1 Photo Beach Condition in the East Area of Candidasa (November 211) 1-32
33 (2) Distribution of Sand Composition on the Beach in Alongshore Direction The distribution of sand composition on the beach in alongshore direction has been investigated in the study (Section 1.3). The obtained result on the foreshore slope is shown in Figure From the result, the following were observed: 1 Organic contents (foraminifera, coral and shell) dominated the beach sand materials. This means that the main sand source is the coral reef. However, volcanic content was also dominant in two limited areas (Line Nos. 1 to 7, and Nos.14 to 22). The former is located from the peninsula (Tanjung Nti) to the west end of Puri Bagus Hotel, while the latter is in an area where beach nourishment using volcanic black sand was carried out by the local government. The contents of volcanic sand gradually decreased to the westward. From the result, occurrence of westward littoral drift was recognized. Further, the sand inflow from east side through the peninsula was also expected to exist. 8 6 Foraminif Coral Shell Volcanic Figure Seabed Material Composition on Foreshore Slope at Candidasa (3) Comparison of Beach Condition Based on Aerial and Satellite Photos Taken between 24 and 211 Figures to show the comparison of beach condition based on aerial and satellite photos taken between 24 and 211. Based on these, the following were observed: It seems that no significant difference in sand existence area was observed between 24 and 211, even though the tidal conditions shown in the two photos were unknown. Especially, there was no change in the white coral sand area. On the other hand, the volcanic black sand in the west end of Puri Bagus Hotel (Figure 1.6.6) seems to have increased than before. From the result, the productivity of organic sand, which was produced on the reef flat, has not changed and still unexpected to increase in quantity for at least a short period. On the other hand, the volcanic sand, which was due to inflow occurrence through the peninsula, seems to have slightly increased. However, this is still insufficient to contribute in forming the sandy beach. Above findings indicated that it is difficult to recover the sandy beach in certain years without artificial filling of sand. 1-33


34 Figure Comparison on the Beach Condition between 24 and


35 Figure Comparison on the Beach Condition between 24 and
36 (4) Understanding the Beach Condition Based on Numerical Analysis Figure shows the relation between the offshore wave direction and the incident wave direction in Candidasa, obtained from the numerical computation for offshore waves shown in Figures and From this, it appeared that the incident wave directions in Candidasa are more likely from SSE to S. Incident Wave Direction (SE) (SSE) (S) (SSW) (SW) (SE) (SSE) (S) (SSW) (SW) Offshore Wave Direction Figure Relation between Offshore and Incident Wave Direction in Candidasa H/H East Coast Area Candidasa.4.2. Nusa Dua SSW S SSE Sanur Unda River Line No East Coast Area Candidasa Direction Nusa Dua SSW S SSE Sanur Line No. Unda River Figure Distribution of the Rate of Wave Heights and Directions along the East Coast Area Figure shows the distribution of the rate of wave heights and directions along the east coast area, which was obtained from the result of numerical computation for offshore waves. The definition of wave direction is shown in Figure
37 Figure Definition of Wave Direction The incident wave height in Candidasa significantly decreased as compared to that in Sanur and Nusa Dua, due to the shadow effect of the existing Nusa Peneeda Island. The shadow effect in case of SSW direction was the most significant where the wave height was the lowest. The incident wave direction in Candidasa always inclines from east to west. This wave direction induces westward littoral drift of sand. Figure shows the calculated littoral sand transport along the shore of Candidasa. Further detailed study is required to evaluate the quantity of littoral sand transport; thus, the non-dimensional ratio of littoral sand transport was presented instead. The westward littoral drift in the whole area of Candidasa was determined from the numerical computation. However, the strength of the littoral drift changed due to the varying shoreline geometry Shore Line Longshore Littoral Transport Rate Q/Qmax Distance from Peninsula (m) Figure Calculated Longshore Sediment Transport Rate in Candidasa (5) Summary of Sediment Transport Characteristics in Candidasa The characteristics of sediment transport in Candidasa were summarized as follows: Westward littoral drift due to S to SSE incident wave direction occurred over the whole area of Candidasa. The strength of the littoral drift was influenced by the change of geometry of shoreline and by the difference in wave action mainly due to the changing width of coral reef flat. 1-37

38 The sand source in Candidasa was mainly from organic origin, which was produced on the coral reef flat. However, the volcanic origin sand was also included in the westside nearby the peninsula. This means that some portions of volcanic sand were due to inflow occurrence through the peninsula. Possibility to increase the organic sand was not expected. 1.7 Comprehensive Analysis for Sediment Transport in the Southwest Coast A comprehensive analysis on sediment transport in the southwest coast (from north Kuta to Canggu) was carried out by applying the same approach as that of Candidasa. There are no remarkable coastal structures and obstacles to identify the dominant littoral sand transport. Thus, careful analysis based on several data and information is required to determine the characteristics of sediment transport in this area. (1) Beach Condition Obtained From Site Investigation and Shape of Shoreline Based on Satellite Photos This area was divided into two areas with different characteristics of beach evaluation. One is the area in the north boundary of coral reef, and the other is a continuous sandy beach area located in the north side of Kuta Beach. To present the current beach condition, this area was divided into three sub-areas, namely, North Kuta Area, Legian-Seminyak Area, and Canggu Area as shown in Figure a) North Kuta Area Figure Southwest Coast Area The North Kuta area belonged to the Phase-1 Project area, which has roughly 2 km alongshore distance. The south part of this area is located at the edge of coral reef, and the alignment of the beach is in the southwest-northeast direction. The dominant direction for incident wave in this area is SW to SSW based on the result of numerical analysis. Due to this geometry of the beach and incident wave direction, the northward littoral drift is significant in the south part of this area. However, the alignment of the beach suddenly changes to southeast-northwest in the south side of Hard Rock Café Hotel. This location is outside the coral reef area, with the sandy beach continuing up to Canggu. The position of each photo taken in September 211 in the west area (during low tide) is shown in Figure The representative beach conditions are shown in Photos and Photos from Position 5 show two different tide conditions: low tide condition (LWL) taken in September 211, and high tide condition (HWL) taken in March
39 Positions 1 and 2 show the beach condition in the south and center of Kartika Plaza Hotel. The width of coral reef has suddenly decreased, which eventually disappeared. Position 2 is the end boundary of the coral reef. As presented in the previous chapter, sand filled from the Phase-1 Project has been washed away, and the revetment has been completely exposed. Sand was mainly transported to the north side due to the oblique incident waves. Position 3 is located in the north side of Kartika Plaza Hotel, which is just outside the coral reef area. The alignment of the beach starts to change from southwest-northeast direction to south-north direction. The revetment is covered again by gradual filling of sand. Position 4 shows the concave shape of shoreline. Wider beach can be maintained in this area. According to the monitoring result shown in Figure 5.15 of Chapter 5, it was realized that the stable beach was maintained from this area up to the north side. At said location, there are no coastal artificial structures, and the continuous sandy beach exists up to Canggu. 1-39


40 Figure Location Map of North Kuta Showing Positions Where Photos were Taken Position 1 Position 2 Position 3 Position 4 Photo Beach Condition of North Kuta (September 211) 1-4
 and left side photo shows the condition during HWL (approximately +2.5 m).")
 Legian Seminyak Area The positions where each photo was taken to observe LWL (September 211) and HWL (March 212) conditions are shown in Figure 1.7.3.")
41 (During LWL) Position 5 (During HWL) Photo Beach Condition of North Kuta (September 211) Position 5 is located on the beach nourishment area without coastal structures. Right side photo shows the condition during LWL (approximately +1. m) and left side photo shows the condition during HWL (approximately +2.5 m). A wider sandy beach can be secured despite the high tide condition. b) Legian Seminyak Area The positions where each photo was taken to observe LWL (September 211) and HWL (March 212) conditions are shown in Figure The representative beach conditions, as discussed below, are shown in Photos and 1.7.4: From the site investigation alone, it is difficult to identify possible occurrence of littoral drift in this area since there are no coastal structures or obstacles to identify the sand drift. However, the alignment of the beach in this area is perpendicular to the dominant incident wave direction. Furthermore, even though some contents of yellow colored sand were observed on the beach in the south part of this area, the color gradually changes to gray or dark gray northwards. From the result, this area is expected to be a balanced area on littoral sand drift. Position 1 is the north side from the boundary of beach nourishment in the Phase-1 Project. Beach width was narrower than that in North Kuta. Positions 2 to 5 show beach condition of this area. The beach space was very limited during the high tide condition. According to the mapping analysis using the old aerial and recent satellite photos, the beach retreat of 5 to 15 m was observed during the past 3 years (from1981 to 21). 1-41


")
 (During LWL)")

42 Figure Location Map of Legian-Seminyak Showing Positions Where Photos were Taken (During LWL) Position 1 (During HWL) (During LWL) (During HWL) Position 2 Photo Beach Condition of Legian-Seminyak 1-42
 (During LWL)")
")


43 (During LWL) Position 3 (During HWL) (During LWL) Position 4 (During HWL) c) Canggu Area (During LWL) Position 5 (During HWL) Photo Beach Condition of Legian-Seminyak Canggu area is from the Brawa River mouth to north. Basically, sandy beach still continues in this area; however, beach rock and sea cliff appeared at several locations. Several small river 1-43
44 mouths were also observed in this area. It is useful to check the beach condition around these obstacles in order to know the behavior of littoral drift. The positions where each photo were taken are shown in Figure 1.7.4, and the representative beach conditions, discussed as follows, are shown in Photos and Photos for Positions 1 and 2 were taken at both sides of the Barawa River mouth. A beach scarp was observed in the south side of the river mouth, and the sand in the north side seems to have been accumulated. Based on this, the sand is expected to move southward for this moment. However, it is necessary to check the seasonal change of the beach to ensure the net sand transportation. The photo for Position 3 was taken at the next river mouth located in the north side of the Barawa River mouth. The same tendency as that for said river mouth (north side is accumulated while south side is retreat) was observed. New land development in the area up to the beach riparian area was observed from Position 4. According to the regulation on beach riparian area, such development is illegal. The photos for Positions 5 to 7 were taken in Echo Beach (Batu Mejan Temple). Position 5 shows the south side of the beach, Position 6 shows the center, and Position 7 shows the north side. A significant difference in beach change between both sides was not observed. Some parts of the revetment were damaged due to wave overtopping. The photos for Positions 8 to 1 show the beach condition on both sides of the small sea cliff located 3 km away from Echo Beach. Since the beach in the south side has been eroded, protection by filling of armor stones was provided. On the other hand, the beach condition in the north side seems stable. The satellite photos show the gradually changing alignment of the beach in Canggu area, which is more in the counterclockwise direction, as compared to that of Legian Seminak. This beach angle will induced the southward littoral drift based on the presumed incident wave direction (SE-SSE). The result of beach change at Positions 8 to 1 might prove this phenomenon. d) Summary The north part of North Kuta is located in the south edge of the coral reef. Due to the relation of the angle between the beach alignment and dominant incident wave direction, significant northward littoral drift occurs. The main reason for the sand outflow after the beach nourishment is due to this sand movement. However, this sand transported northward did not contribute as sand inflow to the north beach area (Legian-Seminyak) based on the site investigation and result of shoreline monitoring. The existence of coral reef gap might have been influenced by the dynamic sand transportation in this area. The stable sandy beach with certain width could be well maintained in the south part of North Kuta (from Hard Rock Café Hotel to Alam Kul Kul Hotel) due to the beach nourishment in the Phase-1 Project, despite the absence of artificial coastal structures. The littoral sand movement in Legian-Seminyak area was expected to be balanced based on the site investigation and relation of the angle between the beach alignment and dominant incident wave direction in this area. However, the beach space becomes narrow especially during tidal conditions. This condition is disturbing the activities of tourists in the beach, which is a frequently visited resort in Bali. 1-44


45 The sandy beach continues up to Canggu area. However, beach rocks, sea cliffs, and several small river mouths exist. Occurrence of southward littoral drift is expected in the north part of Canggu based on the site investigation. Figure Location Map of Canggu Showing Positions Where Photos were Taken Position 1 Position 2 Position 3 Position 4 Photo Beach Condition of Canggu 1-45


46 Position 5 Position 6 Position 7 Position 8 Position 9 Position 1 Photo Beach Condition of Canggu 1-46
47 (2) Short- and Long-term Shoreline Changes a) Short-term Shoreline Change The short-term shoreline change was examined by applying the monitoring results after the completion of the Phase-1 Project, and the results of beach profile survey carried out in this study. Obtained understandings are as follows: According to the shoreline monitoring result, the beach retreat rate in North Kuta (from Hard Rock Café Hotel to Alam Kul Kul Hotel, with 1.3 km alongshore) was observed to be roughly 1 m/year for ten years, prior to the Phase-1 Project. After the beach nourishment in the Phase-1 Project, there was no observed significant change in shoreline although small scale seasonal changes were observed. On the other hand, most of the filled sand has been already washed away from the north of coral reef area in Kuta (offshore breakwater BWN2 to BWN3), with a volume of 5, to 6, m 3. According to the bathymetric survey result, significant sand deposition was observed on the outer area in the north edge of coral reef. From the results of sand sampling and sieve analysis, the color, grain size, and contents of sand on this deposition area were similar to the nourished sand taken from Kuta Beach. Furthermore, a westward strong offshore current through the reef gap in the north edge of the coral reef was observed during the investigation carried out in the detailed design stage of the Phase-1 Project. From the result, there is high possibility that the sand on north of coral reef area was transported mainly to the outer reef area trough the reef gap. In the north end of the nourishment area near Alam Kul Kul Hotel, sand filling was conducted to reduce the beach width gradually from 1 m to m, within a 3-m distance. According to the monitoring result, it did not significantly change the shape at this area. At least, evidence of outflow to the north was not observed. b) Long-term Shoreline Change According to the mapping analysis using old aerial and satellite photos, long-term beach retreat in Legian and Seminyak area (from Alam Kul Kul Hotel to Sofitel Hotel, with 2.3 km distance) was observed at roughly 5 m south side to 15 m north side in 3 years. The most significant beach retreat was observed in the north area from river mouth of Petitenget Temple to the Brawa River mouth, which is 1.6 km alongshore. The beach shore in this area changed from 15 m to 2 m in 3 years. However, there was no significant beach retreat further north of the area (Canggu area). (3) Sand Composition and Relation between Grain Size and Beach Slope Sand sampling on the beach was conducted as shown in Figure Alongshore distribution of sand composition obtained from the sloping part of the beach is presented in Figure Alongshore distribution of grain size (D5) and beach slope are also shown in Figure Corresponding findings based on the sand sampling are as follows: Coral contents appeared only from Line Nos. 1 to 1 (until the north boundary of nourishment in the Phase-1 Project), and were not observed in the north area. From this, coral sand produced from the coral reef in Kuta is not transported to the north area. The contents of volcanic sand gradually increased toward the north side. However, volcanic contents were also observed in the sand samples taken from the south area. Such volcanic sand might have been transported from the north area. Based on this, southward littoral drift is expected to occur. 1-47
48 According to the alongshore distribution of grain size (D5) and beach slope as shown in Figure 1.7.6, grain size (D5) in Legian Seminyak area (Line Nos. 9 to 14, which is from north end of nourishment in the Phase-1 Project to Petitenget Temple) was approximately.3 mm, and the beach slope was 1:1 to 1:12. On the other hand in Canggu area (Line No.15 to the north, which is from the Petitenget River mouth to the north), D5 was roughly.4 mm, and the beach was steeper with 1:8 to 1:9 slope. In the North Kuta area (Line Nos. 2 to 8), D5 was.3 to.4 mm, and the beach slope was 1:8. From the result, Legian Seminyak area seems to be the transition between the south and north areas. As a result of bathymetric survey, a shallow water area existed in the nearshore zone (-5 m to -1 m) of Legian Seminyak area. It is suggested that the fine contents of volcanic sand might have been deposit around this area. 1-48
49 1 Figure Sand Sampling Points in the Southwest Cost Foraminifera Coral Shell Volcanic Figure Alongshore Distribution of Sand Composition in the Southwest Coast Figure Alongshore Distribution of D5 and Beach Slope 1-49
50 (4) Checking of the River Mouth and Beach Change due to Obstacles It is useful to check the beach change due to obstacles such as sea cliff and bending of river mouth in order to know the dominant direction of littoral drift. Table shows the result of checking of the river mouth and beach change due to obstacles from Seminyak area to North Tanah Lot, based on several old aerial and satellite photos. The following show the result of checking. Table Result of Checking of the River Mouth and Beach Change due to Obstacles Area Check Point Oct-9 Oct-2 Jul-2 Small river mouth at Double Six Straight?? Seminyak Small river mouth at south side of Sofitel Hotel Straight Straight? Small river mouth at Oberoi Hotel Straight? to south River mouth at Petitenget to south?? River mouth at Brawa Beach to south to south blockade River mouth at Batu Bolong Beach to south to south blockade Small river mouth at south of Echo Beach Straight blockade Small river mouth at north of Echo Beach Straight to north? Small river mouth (No.9) to north? Canggu Small river mouth (No.1)? to north Small river mouth (No.11) Straight Straight Small river mouth (No.12) Straight Straight Obstacle (Rock 1) to south to south Obstacle (Pura Gede Luhur Batungaus) to south to south River mouth (No.13) to south to south Tanah Lot Small river mouth (No.14) Straight Straight Small river mouth (No.15) Straight Obstacle (Rock 2) to north to north Small river mouth (No.16) Straight Obstacle (Jetty) to north North of River mouth (No.17)? Tanah Lot River mouth (No.18) Straight to north River mouth (No.19) to north River mouth (No.2) to north River mouth (No.21) to north Obstacle (sea cliff) to north to north Significant direction of littoral drift was not observed in Seminyak area. The occurrence of southward littoral drift in Canggu area was recognized. From Tanah Lot to north area, the occurrence of northward littoral drift was recognized. (5) Understanding of Results Based on Numerical Analysis The numerical analysis was also conducted to verify the above mentioned results related to littoral sand drift obtained from field investigation and collected data. A numerical computation for wave field and longshore transport rate along the shore based on the shoreline change model was conducted. Figure shows the result of the wave field for representative two offshore wave directions, S and SSW. The image of incident wave direction for each area, which was obtained from the result of numerical computation for waves, is shown in Figure


51 Figure Distribution of Wave Height and Direction Figure Image of Dominant Incident Wave Direction Obtained from Numerical Computation 1-51
52 Figure Calculated Longshore Sediment Transport Rate in the Southwest Coast In case the offshore waves incident from S-direction, the diffraction area due to the shadow effect for the existence of Bukit Badung is covered up to the north of Tanah Lot. On the other hand, when the offshore waves incident from SSW-direction, the diffraction area becomes small up to nearly Canggu (shown in Figure 1.7.8). In the diffraction area, the wave direction turns clockwise, which induce the southward littoral drift in north Canggu. The incident wave direction in Legian Seminyak area is almost perpendicular to the shoreline. From this, no significant littoral drift was formed. The incident wave direction in Kuta area is shown in Figure Due to this oblique wave direction, northward littoral drift becomes significant. Figure shows the calculated longshore sand transport in the southwest coast for two cases of SSW and S (T=16s). In Kuta area, significant northward littoral drift was identified based on the numerical result. This northward littoral drift suddenly decreased from North Kuta to Legian and Seminyak. Slight northward littoral drift was identified in Canggu area. Obvious southward littoral drift was identified from North Canggu to Tanah Lot. These tendencies obtained from the numerical analysis was quite similar to the result obtained from several collected data and site investigation. 1-52
53 (6) Summary for Sediment Transport in the Southwest Coast The characteristics of sediment transport in the southwest coast are summarized as follows: It is evident that northward littoral drift occurs in Kuta s reef area. Moreover, most of the transported sand in the north has probably flown out to offshore through the reef gap in the north edge of the coral reef. A part of the sand from the south area flows to the north Kuta area; however the quantity of such inflow is limited. It is obvious that littoral drift does not occur from North Kuta, Legian to Seminyak area due to change of alignment of the beach perpendicular to the dominant incident wave direction. The slight southward littoral drift was expected in the North Canggu area, especially the north part. The northward littoral drift was observed again from Tanah Lot to the north direction. 1-53
54 in the Republic of Indonesia Chapter 11 Planning and Design for Beach Conservation Measures 11.1 Overview The overview of this chapter is presented as shown in Table Table Overview for Planning and Design for Beach Conservation Measures Ref. No. Title Outline of Contents 11.2 Validity of the Project -Validity of Phase-2 Project was summarized based on 1)Development policy, 2) Contribution of Phase-1 Project, 3)Needs for Phase-2, 4) Necessity for improvement of Kuta and 5) Necessity of Japanese technology and experience on beach conservation project - Necessity for improvement of Kuta (Phase-1 Project Area) was mentioned 11.3 Objective of the Project Facing problems and objective of the project for each site as Phase-2 Project was summarized based on the results of Chapters 6, 9 and Scope of the Project Scope of the project for each site was presented Study for Suitable Beach Conservation Measures Basic Layout and Design at Candidasa Comparison study was conducted to determine the suitable beach conservation measures. For the improvement of Kuta, the technical study for the design of L-shape groin based on the numerical analysis was presented. Basic design at Candidasa was carried out and present the typical layout and cross section 11.7 Basic Layout and Design at North Kuta ~ Legian ~ Seminyak Basic design at North Kuta ~ Legian ~ Seminyak was carried out and present the typical layout and cross section Basic Layout and Design for Improvement at Kuta Principle for Planning of Beach Control at other Southeast Coast Area Basic design for the improvement of Kuta was carried out and present the typical layout and cross section Principle for the planning of beach control at southeast coast, which is out of candidate area for Phase-2 Project, was presented Validity of the Project (1) Validity from the Indonesian Development Policy The validity of Phase-2 Project was examined by checking the Indonesian development policy and plan. 11-1
55 in the Republic of Indonesia a) National Medium-Development Plan (RPJMN), In the National Medium-Development Plan (RPJMN), , which was issued by BAPPENAS in 21, the necessity and importance for the conservation and utilization of the natural environment was mentioned in order to support sustainable economic growth and to increase the welfare of the people. Further, the necessity for the development of infrastructure to protect the land against the impact of climate change was mentioned. As the funding source for the national development, it was recommended to utilize the public-private partnership (PPP) scheme, corporate social responsibility (CSR) and donation to accelerate the infrastructure development. Conservation of Tourism Multi-Function Conservation of coastal environment Conservation of Balinese Culture & Society Conservation of Property Coastal Protection Figure Multifunction of Beach Conservation Project The beach conservation project has multifunction as shown in Figure These functions are consistent with the abovementioned development policy. b) Bali Province Medium Development Plan, (Bali Province Regulation No. 9/29) The proposed Phase-2 Project is valid to the Bali Province Medium Development Plan One of the objectives of the Bali Province at tourism sector is to expand the coverage of tourism object which at present still concentrates at south Bali. To reach the goal, the infrastructure development policy is directed to improve the tourism infrastructure, to protect sustainability of environment condition to keep the quality of Bali tourism, and to improve the quality of natural, cleanliness, safety, and preservation of tourism object. These mean that the proposed Phase-2 Project which is a beach conservation work is in accordance with the Bali Province Development Plan. c) Spatial Plan in Bali Province (Bali Province Regulation No. 16/29) The validity of Phase-2 Project views from Bali Province Spatial Plan , is in accordance with the spatial plan. Almost all of the shoreline at Bali is designated as tourism area. The recommendation of the development policy on water resources is to protect the shoreline from erosion and abrasion. The proposed Phase-2 Project aims to conserve and protect the eroded beach from further damage. Moreover, the Phase-2 Project will restore the beach s potential to become a world-class tourism destination. d) Strategic Plan of the Ministry of Public Works (MoPW), (MoPW Regulation No. 2/PRT/M/21) The policy of the MoPW strategic plan at the coastal sector is to protect the shoreline from erosion and abrasion by constructing coastal protection works, or rehabilitating and maintaining the coastal structure. For the current period, the concentration on coastal protection works mostly made to protect the outer limit of the Indonesian territory line, the small islands, and the economic growth area. 11-2

 Validity from the Contribution of the Phase-1 Project Bali is the world famous tourism area in the Southeast Asian area, and the beach is the main tourism resource.")
56 in the Republic of Indonesia The proposed Phase-2 Project area was indicated as high economic growth area for Bali Province. The Legian-Seminyak area at present is the top tourism destination at south Bali, and Candidasa at east Bali has high economic growth potential if the sustainable beach condition can be maintained. From these conditions, the proposed Phase-2 Project is valid to MoPW Strategic Plan (2) Validity from the Contribution of the Phase-1 Project Bali is the world famous tourism area in the Southeast Asian area, and the beach is the main tourism resource. Based on the real condition of the Phase-1 Project that was conducted at Sanur, Nusa Dua, and Kuta beaches, the beach conservation project to recover the sandy beach from beach erosion had a great contribution to the tourism development in Indonesia. The number of foreign tourists who visited Bali increased from 1.4 million in 24 (just completed Sanur and Nusa Dua projects) to 2.5 million in 21 (1.8 times increase). The number of domestic tourists further increased from 2. million in 24 to 4.7 million in 21 (2.3 times increase). Furthermore, the active renovation and development of new hotels, restaurant, and shops along the coastal area were observed at the project area. These induced the multiplier effect to the development of tourism. The contribution of the beach conservation project was not only on tourism, but also on the welfare of the residents to conserve the culture, religion, and their lives. A lot of local people came to the recovered sandy beach, and they make use of the beach area for religious ceremonies and recreation as shown in Photo This change in the beach area also contributed to the significant increase of income of the communities through parking fees. From the abovementioned points of view, the beach conservation project has great potential to contribute to the economic welfare of residents. Photo Contribution for Welfare of Residents (3) Needs for Phase-2 Project The Phase-2 Project sites were selected mainly taking into account two points, such as contribution to the economy and condition of beach erosion and utilization as world beach resort area as presented in Chapter 9. The following two sites were selected as the result of the evaluation with several criteria: East Coast: Candidasa and Southwest Coast: North Kuta ~ Legian ~ Seminyak As presented in Chapter 9, the necessity of the new project for the two candidate sites is summarized as follows: 11-3
57 in the Republic of Indonesia The international tourism area at east coast area is only Candidasa, and it is one of the major beach resort areas in Bali Island; On the other hand, beach erosion has occurred since the 197s, owing it to the tourism development even though the beach conservation project was undertaken by the Indonesian government in the 199s; The sandy beach has almost disappeared and the coastal line at Candidasa is covered by artificial concrete type seawall. This has disturbed the desirable beach utilization as an international resort area and caused a negative impact to tourism; Some development plan of infrastructure, which are conducted at east coast area in order to deviate the concentration of tourism at the south coast, are great potential for further tourism development at Candidasa; The North Kuta ~ Legian ~ Seminyak area is currently the top tourism area in Bali Island, and it is necessary to maintain the present multifunction on beach utilization, such as sunbathing, walking, surfing and body boding, and sunset site seeing; and The retreat of the shoreline for long term was observed, even though the degree of the retreat was not significant as compared to that of east coast area. It has been causing the narrowness of beach space and obstacle in the utilization of the beach during high tide. (4) Necessity for Improvement at Kuta Kuta is one of the Phase-1 Project beaches and the beach nourishment was undertaken from runway at the south end to Alam Kul-kul Hotel at the north end with 4.2 km alongshore distance. However, as presented in Chapter 6, the significant sand outflow after undertaking the beach nourishment has been observed at the south reef area of Kuta. The chronology of Kuta project is as follows: a) Originally, the beach nourishment with three headlands and one groin system was proposed in the detailed design which was carried out in 1998 as shown in Figure (1); b) Before the commencement of implementation, a strong objection on the construction of a headland system was suddenly blown up by the communities and related NGO group. This movement against the project caused the disruption for undertaking the project; c) To find the solution and proceed with the project, the socialization between communities and project side was conducted more than 1 times. This process took almost three years; d) Finally, it was concluded that the communities agreed to carry out the project employing beach nourishment with three offshore breakwaters with their proposed crown height as shown in Figure (2). Even though the effectiveness to maintain the nourished sand became low, the project side should agree with their recommendation in order to proceed with the project; e) Significant outflow of sand has been anticipated due to the change of design from headland system at that time. Thus, the consultant carried out further analysis to predict the outflow of sand, and proposed to prepare the sand stockpile; and f) Based on the monitoring result which continued to carry out since completion of the nourishment, significant outflow of sand was observed at the south part of nourishment area which is located at Kuta reef area. According to the monitoring result, the total amount of sand loss during the last three years since 28 to 211 was estimated at 11-4
 (see Figure 11.2.")
58 in the Republic of Indonesia roughly 8, m 3 (2% of the total quantity of nourishment). This quantity of sand loss was significantly higher than that in Sanur and Kuta (1% for eight years) (see Figure ). (1) Planned (2) Actual Figure Planned and Actual Layout at Kuta Project (Phase-1 Project) Sand Remaining (%) 11% 1% 9% 8% 7% 6% 5% Sand Remaining at Sanur & Nusa Dua Sand Remaining at Kuta (South & North Part) 11% 13% 1% 1% 97.81% 96% 1% 97% 97% 1% 93.43% 91% 1% 97.7% 91.5% 91% 9.71% 91% 94% 9% 94% 91.21% 88% 88.18% 88% 87.98% 88% 8% 83% 81% 7% Sanur Beach Nusa Dua Beach 6% Kuta South Kuta North 5% Y 1Y 2Y 3Y 4Y 5Y 6Y 7Y 8Y Y 1 Y 2 Y 3 Y Years After construction (1) Sanur and Nusa Dua (2) Kuta Sand Remaining (%) Figure Remaining Sand after the Nourishment in Phase-1 Project Local people and communities, who have strong objection in the Phase-1 Project, have already realized the insufficiency of the present structures to control the sand movement after they identified the difference in maintaining the nourished sand between Kuta and Sanur, Nusa Dua. Thus, it is expected that there will be no further social problems to undertake the improvement. Now, the improvement to reduce the sand outflow at Kuta is one of important issues of the Indonesian government. Based on the abovementioned chronology and resulting current situation at the beach, it is recommended to conduct the improvement measures at Kuta to mitigate the further outflow of sand, even though Kuta belongs to the Phase-1 Project and it is out of the study area. (5) Necessity of Japanese Technology and Experience on Beach Conservation Project The leading western countries for coastal and beach conservation have already realized that the previous protection method using only artificial coastal facilities such as seawall, groin, etc., could not solve the problem of beach erosion. The only effective method for beach conservation is beach nourishment. Japan is the only country that have many experiences on this process of beach conservation including not only successful but also unsuccessful experiences in Asian countries. Japan has been the leading country in Asia to have lessons learned on beach conservation in both 11-5
59 in the Republic of Indonesia management and technical points of view such as planning, design, and implementation after the project. Indonesia s recent economic growth is significant. On the other hand, several adverse impacts to the ecosystem have been exposed. The beach erosion problem and its control based on the required technology and management system is one of the urgent issues to be solved. Only Japan can support in this field of beach conservation among Asian developing countries for both technical and management field Objectives of the Project (1) Candidasa a) Facing Problems Candidasa is one of the international beach resort areas in Bali Island, even though the tourism contribution is lower than that of south resort area due to its remote place from the south of Bali area. However, Bali Province has an active development strategy at the east coast area to decentralize the tourism area from the crowded south area. The extension of the highway road and newly opened international cruise port nearby Candidasa was following this strategy plan. Candidasa has great potential to contribute to the tourism at the east coast area. On the other hand, due to the serious beach erosion and unsuccessful beach protection measures which has not been carried out until now, Candidasa is facing the following problems in approximately 5 km alongshore area. Protection (Photos and ) Loss of land due to the beach erosion; and Damage to facilities and vegetation due to wave overtopping and decrease of life cycle of facilities (hotel facilities and houses) due to splash water. Beach Utilization (Photos and ) Disturbance of free walking across the beach due to existence of seawalls, groins, and brick walls. Disturbance of easy access to the beach due to the absence of suitable access road and the existence of brick walls. No space for beach activities for tourists such as sunbathing, swimming, etc. No space for religious events for residents; and Insufficient boat parking area. Environment and Landscaping (Photo ) Deterioration of natural view as an international beach resort due to the existence of seawall and a lot of groins; and Disturbance of open view due to the existence of brick walls. 11-6


60 in the Republic of Indonesia Photo Beach and Land Erosion Photo Wave Overtopping Photo Disturbance of Walking Across Beaches Photo No Space at the Beach Photo Deterioration of Natural View Photo Good Water Quality Photo Corals on the Reef 11-7
61 in the Republic of Indonesia b) Requirement on Environment The sea water at Candidasa maintains the good quality with high transparency as compared to that of the south resort areas such as Sanur, Nusa Dua, and Kuta as shown in Photo This sea water condition is one of the advantages at Candidasa, therefore it is required to maintain this condition. Furthermore, Candidasa is one of the famous snorkeling and diving spots in Bali Island, and there are a lot of live corals and fish habitat at the coral reef area. There are also existing corals on the reef flat, especially near the peninsula located at the east side of the site as shown in Photo Thus, these marine environmental conditions should be given attention. c) Objectives of the Project The objectives of the project at Candidasa are as follows: To prevent further beach and land erosion and to minimize the damage of facilities due to wave overtopping and splash water. To achieve easy access to the beach and free walking along the beach. To recover the beach space to be utilized for marine activities of tourists as international beach resort, and for religious events for residents. To recover the natural landscape as international beach resort. To maintain the present coastal environment such as good sea water quality and coral habitat. To achieve the abovementioned objectives, it is aimed to increase the tourism contribution at Candidasa as world famous beach resort by collaborating with other infrastructure developments near Candidasa, which are the extension of highway road at the east coast area and the new international cruise port. The area to be rehabilitated is approximately 5 km in total from the east end of peninsula (Tanjung Nti) to Alilla Mangis Resort Hotel. (2) North Kuta Legian Seminyak a) Facing Problems North Kuta Legian Seminyak at the southwest coast is the most attractive and high tourism contributing area in Bali Island. This beach area is maintaining the continuous natural sandy beach without artificial coastal structures. Due to this advantage, both foreign and local tourists come to this beach for many beach activities, such as sunbathing, surfing, body boarding, walking, jogging, and sunset viewing, etc. The tourism development is now further expanded to Canggu which is located at the north side of these area. Development of big hotels, apartments, and private villas are actively on-going in this area. 11-8

 Photo 11.3.")
 Photo 11.")


62 in the Republic of Indonesia Photo Wave Runup to Property (Seminyak) Photo Narrowness of Beach Space (Legian) Photo Narrowness of Beach Space (Seminyak) Photo Damaged Facility (Canggu) Photo Illegal Development (Canggu) Photo Breaking Waves (Legian) 11-9
63 in the Republic of Indonesia The problems on current beach condition at southwest coast are as follows. Urgent problems on beach erosion are not exposed and the foreshore area still remains. However, the wave run-up sometimes intrudes into the properties of hotels and restaurants during high tide, and it disturbs their operation (Photo ). During the high tide, beach space at this area becomes significantly narrow. According to the long term shoreline change based on aerial and satellite photos, the beach recession was estimated at 5 m to 15 m in Legian, Seminak area. The narrowness of the beach space disturbs the activities of tourists on the beach (Photos and ). Some public facilities were damaged by wave action at Canggu area (Photo ). According to the regulation of Badung Regency, 1 m width from Highest High Water Level (HHWL) was defined as the beach riparian zone and no construction of facility is permitted at this area. However, illegal constructions and developments at foreshore area of the beach were observed at several points (Photo ). b) Requirement on Environment This area is formed by common sandy beach and no corals exist. Therefore, basically, high consideration on marine environment might be unnecessary. However, some of the offshore area are utilized for fishing activities. This area is one of the world s famous surfing spots due to the long crested wave breaking condition as shown in Photo , therefore, it is very important to maintain this wave breaking condition. c) Objectives of the Project The objectives of the project at the southwest coast are as follows: In order to maintain the beach activities at this area as the most attractive beach resort area in Bali Island, the sufficient beach space shall be secured. The target area for recovering the beach is from Alam Kul Kul Hotel at north Kuta (end of beach nourishment area in the Phase-1 Project) up to Kudeta at Seminyak with 2.9 km alongshore distance. The target of recovering beach width was assumed as the same level as that of 3 years ago, which is 15 m to 2 m increase of the width compared to the present condition; and As the principle of requirements on beach utilization and landscaping, 1) the natural viewing, which is the most advantageous point, shall be maintained, 2) present wave breaking condition shall be maintained as the world s famous surfing spot. (3) Improvement at Kuta (the Phase-1 Project Area) a) Facing Problems The sand outflow after the beach nourishment was continued at the south part of nourishment area. The quantity for the outflow of sand at this part was estimated roughly at 8, m 3 for three years, which is 2% of the total quantity of nourishment sand. On the other hand, the sand outflow at Sanur and Nusa Dua is indicated as 1% for eight years as shown in Figure The quantity of outflow at the south part of Kuta is significant compared to that of Sanur and Nusa Dua, and it is required to reduce the outflow of sand at this area. b) Objective of the Project The objective of the improvement at Kuta is to reduce the sand outflow than its present condition, especially at the area between the south end of sand stopper and 1st Offshore 11-1
64 in the Republic of Indonesia Breakwater (BWN1), and between 2nd Breakwater (BWN2) and last Breakwater (BWN3). However, the difficulty was realized at surrounding BWN3 area due to the particular condition on geographical and littoral sand dynamics. Thus, the aim of the countermeasure surrounding BWN3 is not to recover the sandy beach, but to maintain certain thickness of sand layer at the toe part of revetment to avoid damage of the revetment Scope of the Project (1) Candidasa The scope of the project at Candidasa is as follows: a) Modification of Existing Seawall to Permeable Slope-type Revetment The existing vertical seawall was constructed by each property owner individually. Due to lack of unity for alignment, tourists cannot walk along the beach. Furthermore, the sandy beach is hard to maintain in front of the existing seawall due to acceleration of scouring. Thus, it is recommended to modify the existing revetment to permeable slope-type revetment as the same type as that of the Phase-1 Project. The alignment of the revetment is recommended to have set-back at a certain distance to enhance and maintain the sand. b) Modification of Existing T-shape Groins The crown height of the existing T-shape groin was set at +2.2 m (.5 m below HWL) and the function to interrupt the westward littoral drift was absolutely insufficient. Furthermore, the crown part was very slippery due to seaweed clinging on the surface, and the tourists cannot utilize the crown part. Thus, it is recommended to modify the exiting T-groins to function effectively and interrupt the littoral drift sand and enhance the effective utilization of the crown part. Some of the existing groins will be removed or changed the position based on the result of future conducted detailed design. c) Beach Nourishment The possibility to increase the sand source on the coral reef is not expected based on the comparison of beach conditions by aerial and satellite photos. Therefore, it is definitely required to fill the sand in recovering the sandy beach. On the other hand, the reef width at Candidasa is not wider than that of Sanur and Nusa Dua. Thus, it may be difficult to secure the sandy beach as the same image as Sanur and Nusa Dua. To minimize the sand outflow after the nourishment, it is necessary to consider the appropriate width of the beach not to be wide. d) Walkway The crown part of the revetment is recommended to be used as walkway. The purpose of the walkway is not only to enhance the beach utilization to be able to walk continuously along the beach, but also to identify the boundary between private and public areas after the nourishment. e) Public Facilities Public facilities such as toilet, lamp, dust box, chair, gazebo, etc., are recommended to enhance the convenience of beach utilization for both tourists and residents
65 in the Republic of Indonesia (2) North Kuta Legian Seminyak The scope of the project at the southwest coast is as follows: a) Beach Nourishment The purpose of beach conservation at the southwest coast is to maintain the beach utilization for a long period of time with the same condition as present. From this point of view, beach nourishment without artificial structures is recommended. The area for the beach nourishment will be determined taking into account the present use of the beach and the degree of beach retreat for long term. b) Walkway (partially) The purpose of the walkway is to support easy walking along the beach and to identify the boundary between private and public (beach) areas. From the former point of view, it seems it is not required taking into account the present beach use. Furthermore, the walkway or sidewalk exist in some areas at Legian, Seminyak. On the other hand, the illegal developments intruding into the beach riparian area are sometimes observed at Seminak and Canggu areas. To avoid this, it is required to identify the boundary between private and public properties. The construction of walkway becomes one identification. Thus, construction of the walkway is recommended partially. c) Public Facilities Public facilities such as toilet, lamp, dust box, chair, gazebo, etc., are recommended to enhance the convenience of beach utilization for both tourists and residents. (3) Improvement at Kuta (the Phase-1 Project Area) The scope of the improvement at Kuta is as follows: a) Modification of Existing Offshore Breakwaters Originally, the beach conservation measures at Kuta were planned to undertake the beach nourishment with the construction of three headlands and one groin. On the other hand, the final layout plan for the coastal structures which was accepted by all stakeholders during the Phase-1 Project was to construct three offshore breakwaters and the crown height was lower than that of the original plan. Usually, the tombolo is formed behind the offshore breakwater due to diffraction effects of offshore breakwater. The littoral sand movement is interrupted by the formation of tombolo as long as the tombolo is surely stable. On the other hand, from the monitoring result after the nourishment, it was observed that the tombolo behind BWN3 has almost disappeared. Further, the area exposing the revetment surrounding BWN3 is still expanded slightly for both sides and it was concerned to affect the stable condition of the tombolo behind BWN2. One of the reasons why the tombolo was not maintained in stable condition this may be due to the insufficient interruption effect of the northward littoral drift. Taking into account the present condition, it is recommended to modify the exiting offshore breakwaters to add the groin part in order to enhance the interruption effect. b) Construction of Additional L-shape Groin with Refilling of Sand at BWN3 As presented before, it is difficult to maintain the sandy beach with certain width nearby BWN3. The requirement to improve the present condition is to avoid the further retreat of the 11-12
66 in the Republic of Indonesia beach and to secure the revetment. The additional study to improve the present condition was carried out by the consultant after the completion of the Phase-1 Project. Referring to the result, it was recommended to construct the additional L-shape groin at the south side of BWN3 as well as conducting the sand filling at shadow area (north side of the L-shape groin) Study for Suitable Beach Conservation Measures (1) Comparison Study at Candidasa The comparison study for beach conservation measures at Candidasa was carried out by assuming three alternatives as shown below. Alternative-1: Alternative-2: Alternative-3: Modification only of the existing seawall Modification of the existing seawall + beach nourishment without new coastal structures (maintain the existing T-shape groins and offshore breakwaters) Modification of the existing seawall + beach nourishment with modification of existing T-shape groins and demolition of existing offshore breakwaters. The result is shown in Figure Alternative-3 is the most suitable beach conservation measures at Candidasa taking into consideration the points of technical aspect, beach utilization, landscaping, environmental impact, and public opinion. (2) Comparison Study at North Kuta Legian Seminyak The comparison study for beach conservation measures at the southwest coast was carried out by assuming three alternatives as shown in Figure Alternative-1: Alternative-2: Alternative-3: Protection by revetment Beach nourishment Beach nourishment with offshore breakwaters The results showed that Alternative-2 is the most suitable beach conservation measures at the southwest coast taking into consideration the points of technical aspect, beach utilization, landscaping, economical aspect, and public opinion. (3) Comparison Study at Kuta (Validity for L-shape Groin) After understanding the significant sand outflow surrounding BWN3, the detailed study was carried out in the Study on Countermeasure for Beach Recession at North Kuta Reef Area) in 21 by the consultant (Nippon Koei Co., Ltd). As the selection of conceivable alternatives, the following four alternatives were considered as shown in Figure Alternative-1: Alternative-2: Alternative-3: Alternative-4: Sand refilling + increase of crown height of BWN3 + construction of groin at down coast Sand refilling + construction of offshore breakwater Sand refilling + construction of L-shape headland Sand refilling + construction of oblique groin to connect BWN
67 in the Republic of Indonesia Based on the preliminary evaluation for each alternative, Alternative-3 was selected as the basic idea of countermeasure. Detailed case studies for four different layout plans as shown in Figure were conducted by using the numerical analysis. Figure shows the calculated sand loss with and without refilling of sand to make it easy to show only the effect of the structure. Even though the difference for each case is not significant, Case 3 showed the most minimal result for sand loss. Predicted seabed elevation at toe position of the revetment is compared at two points (P1 and P2) as shown in Figure As shown in Figure , the significant effect to secure the certain seabed elevation due to construction of an L-shape headland is observed at P1 (3 m far from the trunk position of L-shape headland). At P2, which is positioned near the open space between tip of L-shape headland and BWN3, even though the decrease of seabed elevation is significant in the initial stage, certain elevation can be secured by construction of an L-shape headland. From the results, if the refilling of sand with too much volume will be conducted, most of the sand may flow out. Thus, it is recommended that the refilling of sand shall be conducted only for the purpose of maintaining the certain seabed elevation at serious retreated part
 Public Opinion (From Interview Survey) Evaluation Alternative-1 Alternative-2 Alternative-3 Only Modification of Existing Seawall Modification of")
68 in the Republic of Indonesia Alternative Image Concept Protection of Land Technic al Point of View Wave overtopping Securing of Sandy Beach Beach Utilization Landscaping (Natural viewing) Impact to Marine Environment (Seawater Quality and Corals) Public Opinion (From Interview Survey) Evaluation Alternative-1 Alternative-2 Alternative-3 Only Modification of Existing Seawall Modification of Existing Seawall + Beach Nourishment without new coastal structures Modification of Existing Seawall + Beach Nourishment with new coastal structures + Demolish of existing offshore breakwaters Westward Littoral Drift Demolishof existing Offshore breakwater Sand nourishment (without structures) Sand nourishment Modification of Existing Seawall Modification of Existing Seawall Modification of Existing Seawall -To enhance the continuous access to the beach -To secure the space for beach activity as resort area -To enhance the continuous access to the beach Same as Alternative-2 Protected Protected Protected Still Occur (Same as present condition) Possible to minimize as far as sandy beach is secured Possible to minimize 1) Existing groins and offshore breakwaters are not effective function due to mainly insufficient crown height and length 2) No sandy beach exists (same as present condition) 1) Westward littoral drift exists on this area 2) Existing groins are not effective on function of interrupt of drift sand due to low crown height 3) Thus, it is difficult to maintain the sandy beach without coastal structures Westward littoral drift can be interrupted by construction of coastal structures (headland, groin), and sandy beach can maintained as same image as Sanur & Nusa Dua conservation 1) Walking on walkway along the beach 2) Access point to go to offshore for diving & snorkeling 1) Beach activities (walking, sun-bathing, swimming on the beach) 2) Walking on walkway along the beach 3) Access point to go to offshore for diving & snorkeling Same as Alternative-2 Disturbance due to a lot of existing T-groins & headlands (same as present condition) Open landscaping at offshore side can be secured if all existing coastal structures are demolished Some degree of disturbance is expected but obstruction on landscaping will be significantly improved due to change of shape, armor color, reduce the num. of structures Alternative-1 is without sand filling, therefore no significant impact to marine environment is expected. Beach nourishment is main construction work in Alternative-2. Thus, turbidity during sand filling on the beach and sand mining at offshore area might be impacted to existing corals and seawater quality. It is necessary to consider the suitable construction method to minimize turbidity. Same as Alternative-2 Stakeholders strongly requested to recover the natural sandy beach. Only construction of beach protection facilities is not fulfill their request. To recover the natural sandy beach can be fulfill the request from stakeholders Same as Alternative-2 Not Recommended (Sandy beach cannot be recovered by Alternative-1 even though the land side can be protected. The requirement as tourism area cannot fulfill.) Not recommended (It is difficult to maintain the filling sand due to existence of littoral sand drift. The continuous sand re-filling as maintenance of the beach after the project is required.) Recommended (This alternative can fulfill the request from stakeholders and requirement as tourism area. And sand re-filling after the project as maintenance can be minimized.) Figure Comparison of Alternatives for Beach Conservation Measures at Candidasa 11-15
 Evaluation Alternative-1 Alternative-2 Alternative-3 Protection by Revetment Beach Nourishment Beach Nourishment with offshore breakwaters")
69 in the Republic of Indonesia Item Method Image Protection of Land Technical Point of View Securing of Sandy Beach Beach Utilization Landscaping (Natural viewing) Impact to Marine Environment Construction Cost Public Opinion (from Interview Survey) Evaluation Alternative-1 Alternative-2 Alternative-3 Protection by Revetment Beach Nourishment Beach Nourishment with offshore breakwaters Protected Protected Protected 1) No significant littoral drift was observed in this area based on several analysis. So, coastal structures to interrupt the littoral drift is not necessary. 2) Beach retreat at this area is not so significant with.2m to.5m/yr, but the beach will be gradually retreat by natural wave action. 1) No significant littoral drift was observed in this area based on several analysis. So, coastal structures to interrupt the littoral drift is not necessary. 2) Beach retreat at this area is not so significant with.2m to.5m/yr, but the beach will be gradually retreat by natural wave action. 1) No significant littoral drift was observed in this area based on several analysis. So, it is not necessary to construct the coastal structure to interrupt the littoral drift 2) Sandy beach will be more secured than Alternative-2 1) Beach activities such as sunbathing, bodyboad, etc. are restricted due to narrowness (disappearing in the future) of beach space 2) Religious events (ceremony, etc) for residents are restricted due to insufficient space of beach 1) Beach activities (walking, sun-bathing, swimming) and marine activities (surfing and body board) can be maintained as same as present condition. 2) Religious events, culture for residents are maintained as present 1) Beach activities (walking, sun-bathing, swimming) can be almost maintained, but marine activities (surfing and body board) which are most important activities in this area will significantly disturbed. 2) Religious events, culture for residents are maintained as present Natural landscaping at sea-side is maintained, but deteriorated at beachside than present due to construction of artificial structures. Same natural viewing as present can be maintained at both beach-side and sea-side. A lot of breakwaters disturb natural landscaping and image as world famous resort beaches, significantly Sun-set viewing (this is one of strong advantage of this area) is also disturbed Project beach is volcanic sandy beach and there was no corals. Even though the turbidity will occurred during the sand mining and filling on the beach, the influence to marine environment is not so significant comparing to the coral beaches Same as Alternative-1 Same as Alternative million U$ 9.4 million U$ 49.4 million U$ (Too high) Objection (Artificial structure was not desirable) If necessary (beach is under retreat condition), agreed Strong objection (Significant impact to marine activities) Not Recommended The purpose of beach conservation at this beach is not to protect the land, but to maintain present beach utilization as highest tourism area in Bali. Thus, it is not necessary to construct the revetment. Recommended Width of the beach can be increased than present condition and this can enhance the beach activity with no impact to marine activities and landscaping. Thus, only this conservation method (nourishment) can fulfill the purpose of beach conservation at this beach. Not Recommended Marine activities such as surfing, swimming and body board are the most attractive in this beach. Construction of offshore breakwater significantly impact to current wave condition which is one of the attractive points of this beach. Further, cost is too high. Figure Comparison of Alternatives for Beach Conservation Measures at North Kuta~Legian~Seminak 11-16
70 in the Republic of Indonesia Alternative Image Comment Evaluation Alt-1 Sand refilling Increase of crown height of BWN3 New groin at north A - Theoretically northward longshore transport can be trapped by north groin. But offshore transport due to increase of depth was also suggested from this study, and long groin may be required (unrealistic of construction cost as countermeasure, negative impact for beach utilization effect of north area ) - Additional structure at south side from BWN3 may be required to keep the beach shape Alt-2 Sand refilling New offshore breakwater at south A - Sand outflow from south to north through new offshore breakwater still exists if sufficient periodical refilling of sand for maintenance is not carried out (same problem as present will be happen at south side of new offshore breakwater - it is expected to keep the certain sand at shadow area of L-shape headland Alt-3 Sand refilling New L-shape headland A - northward sand movement can be stopped at south side of L-shape headland. At least, it can be more secure at south side. - Northward transport still exists at north from L- shape headland. So if sufficient periodical re-filling is not conducted, finally almost sand will disappear. - For the functional point of view, similar effect can be expected. Alt-4 Sand refilling Oblique groin A - Deterioration of water exchange and negative impact for landscaping and utilization (strong enclosed image) - Cost become higher than Alt-3 Figure Preliminary Evaluation for Each Alternative at North of Kuta Reef (Source: Nippon Koei Co., Ltd.) Figure Case Study for Numerical Analysis (Source: Nippon Koei Co., Ltd.) 11-17
 P1 P2 Figure 11.5.6 Checking Points of Seabed Elevation (Source: Nippon Koei Co., Ltd.) D.L. (m) 5 4 3 2 case5 case2 1 case3 case4 no refill 1 2 3 4 D.")
71 in the Republic of Indonesia Sand loss(m3) Sand loss(m3) 4, 35, 3, 25, 2, 15, 1, 5, Case1 Case2 Case3 Case4 Case1 Case2 Case3 Case4 (1) Without Refilling Sand (2) With Refilling Sand Figure Comparison of Calculated Sand Loss for Each Case (Source: Nippon Koei Co., Ltd.) P1 P2 Figure Checking Points of Seabed Elevation (Source: Nippon Koei Co., Ltd.) D.L. (m) case5 case2 1 case3 case4 no refill D.L. (m) 5 case1 case2 4 case3 case4 no refill year year (1) P1 (2) P2 Figure Calculated Seabed Elevation at Toe Part of Revetment (P1 and P2) (Source: Nippon Koei Co., Ltd.) 11-18
72 in the Republic of Indonesia 11.6 Basic Layout and Design at Candidasa (1) Design Principle a) Modification of Existing Seawall The existing seawall shall be modified from vertical impermeable type to sloping permeable type revetment. To achieve this, armor-type sloping revetment is planned; The slope gradient is set at 1:2.5 considering easy approach to the beach for tourists and insufficient beach space (1:3 was adopted at Sanur, Nusa Dua, and Kuta in the Phase-1 Project); The crown elevation shall be kept as the same elevation as present elevation of the property. Furthermore, the elevation shall be above the backshore elevation, and is set at +5. m; The alignment of modified revetment will be set back as much as possible to enhance the securing of nourished sand. However, the final alignment will be determined as the result of consensus building with each owner of property and it is difficult to finalize in this stage. Thus, the alignment of revetment in this study is tentatively assumed based on the existing condition for the land use of each property; and Taking into account the harmony on landscaping with light colored white-yellow sand that exist on the coral reef, the limestone with light yellow color is recommended as armor material. Figure Image for Modification of Existing Seawall b) Modification and Demolition of Existing T-shape Groin The existence of many number of groins disturb the beach utilization and natural view as beach resort area. Therefore, it is desirable to minimize the number of groins as much as possible. On the other hand, the function of groin is to interrupt the littoral sand drift and to secure the stable condition. To achieve this, it is required to set sufficient number of groins. These two requirements are under the relation of trade-off. The important consideration on layout design is to make a balance between these two requirements; 11-19
 and the function to interrupt the littoral sand was insufficient. Thus, the crown height for modified groin shall be higher than the expected elevation of sand.")
73 in the Republic of Indonesia Figure Image for Modification of Existing Groins The crown elevation for existing T-shape groin was at +2.2 m in average (.5 m below HWL) and the function to interrupt the littoral sand was insufficient. Thus, the crown height for modified groin shall be higher than the expected elevation of sand. Considering this point of view, the elevation at trunk part of the groin shall be kept at the same elevation as that for the revetment (+5. m); The crown elevation of the modified groin can decrease following the presumed beach slope. Considering this and to minimize the construction cost, the crown elevation of the modified groin is planned to gradually decrease toward the head part. However, in order to take account the use of tourists on the crown part, the elevation of trunk part with certain length shall be set to keep it above the HWL; In order to keep the permeability and to harmonize with revetment on the point of landscaping, the armor type groin with the same material (limestone) shall be applied as structure type of modified groin; In order to enhance the utilization condition on the crown part for tourists and to achieve easy approach from the groin to the beach, side slope gradient is set to keep the same value as that for revetment, 1:2.5; The toe position of modified groin shall be offshore side to the presumed toe position of nourishment to interrupt the drift sand. Based on the experience for Phase-1 design, toe position is set 1 m to 2 m offshore side from the toe position of the filling sand. As mentioned below, the beach width is presumed to be 4 m to 5 m. Thus, the length of the groin is assumed at 6 m to 7 m; and In order to mitigate the existing corals which attach to several existing groins and offshore breakwaters, it is possible to utilize the head part of modified groin as the media for coral transplantation. c) Beach Nourishment Considering the narrow width of the original beach at Candidasa before beach erosion occurred, and the narrowness of the coral reef width and the deepening of the depth on the coral reef flat due to coral mining, difficulty is expected to recover the sandy beach as the same level (2 m to 3 m increase of backshore width) as Sanur and Nusa Dua. As the 11-2
74 in the Republic of Indonesia minimum requirement, it is planned to recover only foreshore part to minimize the sand outflow after the nourishment; The material to be utilized for beach nourishment shall keep the same characteristics of the existing sand on the beach as much as possible. The high priority for the requirement is grain size and color; The beach slope is greatly influenced by the grain size. The beach slope becomes milder in accordance with the increase of fine contents of sand, and becomes easy to shift to offshore. Thus, it is desirable to use coarse sand to enhance the stability of the beach as far as adverse impact on beach utilization is unexpected; Based on the results of grain size and beach slope which was obtained on site, the beach slope is assumed at 1:1 in case that the grain size (D5) is assumed to be.3 mm-.4 mm; The top elevation of the nourishment is set at +4.5 m to assume the same elevation of existing berm top. As the elevation of coral reef flat is -.5 m to +.5 m, the beach width from toe part to the top is assumed from 4 m to 5 m in average; and The color of sand is also one of the important requirements. White or yellow colored sand is required to secure the image as resort beach on coral reef. d) Walkway The walkway shall be constructed for the whole project area. The walkway will be set at crest part of modified revetment. The width of the walkway is set at 1.5 m taking into account the available space behind the revetment, and the required width that the pedestrians can pass each other; and To minimize the wave runup into the properties, flower boxes with 6 cm height and 3 cm width is planned to be installed at the land side of the walkway as prevention facility against wave runup. (2) Layout Plan The position and required length of the modified groins and the resulting presumed shape of beach shall be examined by applying the further detail numerical analysis taking into account the actual beach evolution obtained on site and collected data. On the other hand, this study is still at the feasibility study stage and the detailed numerical analysis is not planned to be conducted. Therefore, the layout of groins was tentatively determined based on the result of the existing beach shape obtained during the site investigation, and the presumed incident wave direction obtained in the numerical computation for waves. The further detailed analysis will be carried out in the detailed design stage. The basic layout image for beach conservation measures at Candidasa is shown in Figures and As explained before, it is desirable to minimize the number of groins (headlands) as far as securing of stable beach condition. Based on this opinion, seven modification groins and six new groins are arranged in 5 km alongshore distance
75 in the Republic of Indonesia Figure Layout Plan at Candidasa (Area 1) Figure Layout Plan at Candidasa (Area 2) 11-22
76 in the Republic of Indonesia As presented in Chapter 12, there are two possibilities for project execution taking into account the total project cost, its economical contribution, and social condition for each area. One idea is to implement at the whole area with 5 km alongshore, in which area is faced with the problem of beach erosion (Areas 1 and 2 in Figure 1.8). Another idea is to implement at Area 1, initially. And the implementation at Area 2 will be decided after obtaining the project contribution at Area 1. The distance between each groin (headland) at Area 2 seems longer than that of Area 1. The layout plan at Area 2 is recommended to be finalized after obtaining the detailed analysis at Area 1 as required. There is one suggestion from the Indonesian government to make a few sections without beach nourishment. The purpose of this suggestion is to make clear the necessity of beach nourishment for each section enclosed by both groin (headland) and to make clear the possibility to recover the sand without beach nourishment. Basically, in this report, it is shown that beach nourishment for all sections should be done. However, taking into consideration this suggestion, the candidate section for without beach nourishment is shown, as required. (3) Structure Design a) Design Criteria i) Design Tide Condition The design tide condition, which was employed in the Phase-1 Project, is as follows: H.W.L. : +2.6 m M.W.L. : +1.3 m L.W.L. :. m According to the tide observation carried out in this study (Section 1.2 in Chapter 1), the obtained tide change at Candidasa was not so different from that of south area. Therefore, the same tide condition can be applied as design tide condition at Candidasa. ii) Offshore Design Waves Offshore design waves are presented referring to the Project Completion Report (PCR) in the Phase-1 Project. There are two seasons in Bali, the wet season that is governed by tropical monsoon from December to March when the west winds prevail, and the dry season from May to October where the east to south east winds prevail. The U.S. Navy Marine Climatic Atlas of World Volume 3 Indian Ocean (1976) presents the overall offshore wave climate to the south of Bali Island in the Indian Ocean, including the statistical data of wave heights, wave periods, and wave directions for the last 12 years. On the basis of this statistical wave data, the offshore wave characteristic in the project site can be visualized. The predominant wave directions near the site are south-east during the wet season and south-west during the dry season. The predominant offshore wave periods are 5-1 seconds. These offshore waves, when approaching Bali Island, develop into swells at 1-15 seconds. In the existing design wave height with return periods of 1 to 12 years were developed from the following historical wave data. U.S. Navy Statistic Data (Marine Climatic Atlas of World); Wave forecast data offshore of Indonesia; and Wave observation data at Kuta Beach ( ) 11-23
77 in the Republic of Indonesia On the basis of the above data source, the wave height with several return periods were hindcasted as outlined in Table For the designing of shore protection facilities in Bali Beach, the wave heights with a return period of 5 years have been adopted. The design wave height, averaging the three results, has been determined as (Ho) 5 = 5.5 m. The actual wave observation at Kuta indicates that the predominant wave periods offshore of the reef are 1 to 15 seconds, and occasionally reach 16 seconds when high waves attack the beach. Considering the combined probability of wave heights and wave periods, the offshore wave period (To) has been set at 16 seconds. The wave directions vary depending on the prevailing wind directions during wet and dry seasons. The prevailing wave directions of the southern coast of Bali Island are distributed between south-east and south-west. Table Statistical Offshore Wave Height with Each Return Period Return Period Actual (Kuta) U.S. Navy Statistic Forecasting Wave Observation Data (Year) (m) (m) (m) > (Source: PCR in Phase-1 Project) Table Offshore Design Waves (5-year Return Period) H (m) T (s) θ SW to SE (Source: PCR in Phase-1 Project) On the basis of the above consideration, the design offshore waves have been determined as shown in Table iii) Design Waves for Coastal Structures Prior to setting up the design waves for coastal structures, the equivalent deep water wave height (Ho ) shall be estimated by using the following formula. H Where, ' Kd KrH ' H =, T 1 = T 3 : Equivalent deepwater wave height (significant waves) H : Offshore wave height (significant waves) : Offshore significant wave periods K, : Diffraction and refraction coefficients T d K r 11-24
78 in the Republic of Indonesia The refraction and diffraction coefficients were obtained by the numerical computation for offshore wave field as shown in Chapter 7. The obtained equivalent offshore waves for each wave direction are shown in Table As the result, H =4.1 m (θ: SSE) was adopted at Candidasa area as shown in Table Table Equivalent Offshore Wave Height for Each Wave Direction H (m) T (s) 5.5 θ SSW S SE Kr H '(m) T 1/3 (s) θ S 16 SSE SSE 16 Table Design Wave Height for Coastal Structures H '(m) 4.1 T 1/3 (s) 16 G.L. (m) (at reef edge). H.W.L. (m) +2.6 depth (m) 2.6 Bottom slope at offshore 1:2 H '/L.1 η max /H '.17 Reef Width (m) 15 H 1/3 (m) 1.4 The design waves for coastal structures such as revetment, groin, and headland are calculated by using the Takayama formula (1977) which is applied to the estimation of wave height on the coral reef as shown below. Where, H H 1 3 ' x = B exp A H ' h + α H 2 ' x : Shoreward distance from reef end h 2 : Water depths added by water lend rise at a given distance shoreward from reef end A, α : Constant (A =.5, α =.33) 11-25
79 in the Republic of Indonesia And B and h2 can be developed as follows: Where, H B = 1 3 x= ' H α h H 2 ' H h2 ( h η ) 21 H ho x= = ' + ' ' H H (H 1/3 ) x = η : Water depth above reef surface : Significant wave height at (x = ) developed from f breaking limit wave height formula by Dr Goda) : Wave set up at reef edge Applying the geographical condition of coral reef at Candidasa, the design wave height for costal structures are calculated H 1/3 =1.4 m. b) Structure Design for Groins and Headlands The required weight of armor material for groins and headlands was calculated by using the Hudson formula as shown below. Where, W = K D ( S γ H r r 3 1) 3 cotθ W γ r S r θ H K d : Minimum weight requirement of armor unit : Unit weight of armor material : Specific gravity of armor material against seawater : Angle of mound slope with horizontal : Waves height at mound installation point : Stability coefficient Calculated result is shown in Table According to the common design standard for coastal facility design, it is recommended to increase the armor size at head part. Thus, the size of armor material for each part of groins and headlands are set as shown in Table
80 in the Republic of Indonesia Table Required Weight for Armor Material Kd 2. (rough, breaking waves) H 1/3 (m) 1.4 Slope 1:2.5 W (ton).47 Table Armor Size for Each Part of Groin, Headland Trunk Part Head Part.5 ton.7 ton c) Structure Design for Revetment The required weight of armor material for revetment was basically the same as that for groins and headlands. However, there is no need to consider the increase of armor size. Therefore, the size of the armor for revetment was set at.5 tons. d) Idea for Cost Reduction to Armor Layer for Groin and Revetment Two layer system was applied for the armor layer taking into account of the stability of armor layers. And same kind of armor material was commonly employed. In the Phase-1 Project, light colored limestone was employed in order to consider the landscaping as world tourism area. The limestone was transported from Sumbawa Island to fulfill the required specifications, and the same quarry site was recommended in the Phase-2 Project. However, the price of limestone becomes higher than that of andesite which was employed as under-layer and core layer about 2 times more or less, due to increase of transportation cost. As the experience of the Phase-1 Project, it was lessoned and learned that the armor stone which was placed at the 1st layer was never exposed to the surface, and didn t disturb to the landscaping even if the other kinds of armor stone was placed to the 1st layer. Considering this experience, it was recommended to employ the andesite for the 1st layer of armor layer for groins, headlands and revetment as cheaper stone in order to reduce the construction cost. e) Design for Beach Nourishment i) Selection of Beach Nourishment Materials i-1) Potential of Sand Borrow Site The potential area of sand borrow site was investigated as presented in the Section 1.5 of Chapter 1. It is desirable to find the sand borrow area near the project area in order to minimize the construction cost and to avoid social problems. The candidate area was evaluated taking into account the grain size, color, and potential quantity for the nourishment. The fundamental requirements as sand borrow material are as follows: Grain size shall be coarse and with high content of fine sand (approximately less than.2 mm of grain size) is not allowed; Color of sand shall be maintained light gray or light brown color similar to the existing foreshore sand as much as possible; and The quantity of sand is expected to fulfill the requirement for the nourishment
81 in the Republic of Indonesia Even though some difficulty was experienced in looking for the sand borrow site to fulfill the abovementioned requirements, some locations have potential, which is at the eastern part of Candidasa and near Patangbai. According to the bottom sampling on the surface, the grain size (D5) was.5 mm or more. Further detailed investigation shall be required to ensure the potential for sand borrow. But it was assumed that the specified sand will be utilized. i-2) Relation between Grain Size and Foreshore Slope It is very important on the design of beach nourishment to know the relation between the grain size and foreshore slope on the beach. By taking the sand samples and checking the foreshore slope at the points where the sandy beach still remain, the relation between the grain size and foreshore slope is shown in Figure The grain size is distributed from D5=.2 mm to.6 mm and foreshore slope is varied from S=1/12 to 1/5. Representative grain size at foreshore slope is.35 mm and S=1/1. Figure Relation Between Grain Size(D5) and Foreshore Slope ii) Cross Section Dimension of Beach Nourishment The following dimensions are mainly required to be determined for the design of beach nourishment (Figure ). Beach width ; Backshore elevation; and Foreshore slope. Beach width As mentioned before, the difficulty to recover the beach width with sufficient backshore area was expected. Thus, the beach width was considered only at foreshore area. Based on the elevation on the coral reef and foreshore slope, the beach width was set at approximately 4 m to 5 m 11-28
82 in the Republic of Indonesia Backshore elevation The back shore elevation shall be set taking into account the existing condition. Based on the survey result, the elevation at backshore was approximately +4.5 m. Based on this result, the same elevation with +4.5 m was set as the elevation at backshore area. Foreshore slope The foreshore slope was determined taking into account the existing condition of the beach and the grain size of borrow material. Referring to Figure , the foreshore slope was set at S=1/1. Beach Width Backshore Foreshore Outer Beach BackshoreWidth Backshore Elevation Forshore Slope Outershore Slope Remark Offshore : Offhore Area from Breaking Point (B.P.) Outershore : Area from B.P. to Shoreline at Low Tide Foreshore : Area from Shoreline at Low Tide to Wave Run-up Point Backshore : Land-side Area from Shoreshore Figure Determination of Cross Section Dimension (Source: Coastal Engineering Manual (CEM), 26) (4) Typical Cross Section Drawing The typical cross section drawing for beach nourishment, revetment, and groin are shown in Figures to
83 in the Republic of Indonesia Figure Typical Cross Section for Beach Nourishment Figure Typical Cross Section for Revetment 11-3
84 in the Republic of Indonesia Figure Typical Cross Section for Groin 11-31
85 in the Republic of Indonesia 11.7 Basic Layout and Design at North Kuta Legian Seminyak (1) Design Principle a) Beach Nourishment Considering the technical point of view on expected direction of littoral drift and the advantage of beach in this area, the beach nourishment with no coastal structure is planned. b) Walkway The wall, road, and walkway exist at most part of the target area. Thus, the walkway is only set at some parts of the northern area. (2) Layout Plan The target area for beach nourishment is from the north boundary at the end of beach nourishment at the Phase-1 Project until Kudeta at Seminyak with 2.9 km alongshore taking into account the condition of waves and littoral sand drift. The basic layout image for beach conservation measures at the southwest coast is shown in Figure Figure Layout Plan for Beach Nourishment at Southwest Coast (North Kuta - Legian - Seminyak)) 11-32
86 in the Republic of Indonesia (3) Design for Beach Nourishment a) Selection of Beach Nourishment Materials i) Potential of Sand Borrow Site The potential area of sand borrow site was investigated near the project area as presented in Section 1.5 of Chapter 1. The candidate area was evaluated mainly taking into account the grain size and the following results were obtained; The contents of fine sand (D5 <.2 mm) were significant at the north offshore area; On the other hand, the suitable fine sand and grain size can be found at the outer reef area of Kuta; Further detailed investigation will be required to ensure its potential for sand borrows. However, it was assumed to borrow the sand at the outer reef area of Kuta. ii) Relation between Grain Size and Foreshore Slope The relation between the grain size and foreshore slope at this area is shown in Figure The grain size is distributed from D5 =.2 mm to.6 mm and the foreshore slope is varied from S=1/15 to 1/7. The representative grain size at foreshore slope is.35 mm and S=1/1. Figure Relation between Grain Size (D5) and Foreshore Slope b) Cross Section Dimension of Beach Nourishment Beach width The target width for beach nourishment is set at 2 m increase at the elevation of HWL taking into account the beach retreat for the past 3 years. Backshore elevation The backshore elevation shall be set taking into account the existing condition. Based on the survey result, the elevation at backshore was approximately +5.5 m. Based on this result, the same elevation with +5.5 m was set as the elevation at backshore area
87 in the Republic of Indonesia Foreshore slope The foreshore slope was determined taking into account the existing condition of the beach and the grain size of borrow material. Referring to Figure , the foreshore slope was set at S=1/1. This slope is the same as that for beach nourishment at north Kuta carried out in the Phase-1 Project. (4) Typical Cross Section Drawing The typical cross section drawing for beach nourishment is shown in Figure Figure Typical Cross Section for Beach Nourishment 11.8 Basic Layout and Design for Improvement at Kuta (1) Design Principle The target for the improvement at Kuta area (the Phase-1 Project area) is as follows: To reduce sand outflow and to maintain the sandy beach from the south end of sand stopper to BWN2; and To avoid further decrease of elevation at the toe part of revetment surrounding BWN3 area. One of the main reasons that causes continuous beach retreat between BWN1 and BWN2 was due to insufficient function to interrupt the northward littoral drift. To improve this, it is recommended to consider the original design concept, which is to replace the existing offshore breakwater BWN1 and BWN2 to headland type structure. For this, it is basically recommended to add the groin part for BWN1 and BWN
88 in the Republic of Indonesia To improve the present condition surrounding the BWN3 area, the construction of a new L-shape groin at the south side of BWN3 was recommended as shown in Figure In addition, the sand filling was also recommended at shadow area for this L-shape groin to recover the present urgent condition. However, it is recommended not to overfill sand at the shadow area of L-shape groin in order to avoid sand loss. (2) Layout and Typical Cross Section Drawing The layout and typical cross section drawing for the recommended improvement at Kuta are shown in Figures to Figure Layout Drawing for the Improvement at Kuta 11-35


89 in the Republic of Indonesia Figure B - B Typical Cross Section for the Improvement of Existing Offshore Breakwater (BWN2) Figure B - B Typical Cross Section for New L-shape Groin 11-36
 Beach Erosion Among the east coast beaches, Candidasa was selected as candidate site of Phase-2 Project.")
90 in the Republic of Indonesia 11.9 Principle for Planning of Beach Control at Other East Coast Area (1) Beach Erosion Among the east coast beaches, Candidasa was selected as candidate site of Phase-2 Project. This selection was taking into account both natural and economical point of view. However, beach erosion has seriously occurred in this area from Unda River mouth to Ayung River mouth with 25 km alongshore as shown in Figure As explained in the section 9.3 of Chapters 9, the serious beach erosion with more than 2 m retreat of the beach at a maximum at this area was caused by significant decrease of sand inflow from the river, which was mainly caused by the improvement of water control for the river and large scale sand mining at the river mouth. Even though this area is out of the selected area for Phase-2 Project, the principle for the planning of beach conservation measures are suggested based on the examined beach condition. Figure Shoreline Change at East Coast between 1981 and 211 (2) Principle for Planning of Beach Conservation If beach erosion persists and the shoreline continues to retreat, the efficiency of artificial coastal protection facilities such as seawall, revetment, etc., are limited. Even if protection facilities were constructed, it is impossible to reduce beach erosion without solving first the fundamental cause of erosion, which is to prevent the decrease of sand inflow from the river. On the other hand, if beach erosion continues almost at an even condition and the retreat of the beach is observed not significant, the artificial protection facilities will be effective to 11-37
LONG-TERM SHORELINE RECESSION ON EASTERN BALI COAST CAUSED BY RIVERBED MINING
 Proceedings of the 7 th International Conference on Asian and Pacific Coasts (APAC 2013) Bali, Indonesia, September 24-26, 2013 LONG-TERM SHORELINE RECESSION ON EASTERN BALI COAST CAUSED BY RIVERBED MINING
Volume and Shoreline Changes along Pinellas County Beaches during Tropical Storm Debby
 Volume and Shoreline Changes along Pinellas County Beaches during Tropical Storm Debby Ping Wang and Tiffany M. Roberts Coastal Research Laboratory University of South Florida July 24, 2012 Introduction
LAB: WHERE S THE BEACH
 Name: LAB: WHERE S THE BEACH Introduction When you build a sandcastle on the beach, you don't expect it to last forever. You spread out your towel to sunbathe, but you know you can't stay in the same spot
SHORELINE ROTATION CAUSED BY LARGE-SCALE EXCAVATION OF REEF FLAT ON SANUR BEACH IN BALI
 SHORELINE ROTATION CAUSED BY LARGE-SCALE EXCAVATION OF REEF FLAT ON SANUR BEACH IN BALI Masatoshi Endo, Akio Kobayashi, Takaaki Uda, Yasuhito Noshi and Susumu Onaka In the southern part of Sanur Beach
OECS Regional Engineering Workshop September 29 October 3, 2014
 B E A C H E S. M A R I N A S. D E S I G N. C O N S T R U C T I O N. OECS Regional Engineering Workshop September 29 October 3, 2014 Coastal Erosion and Sea Defense: Introduction to Coastal Dynamics David
SORTING AND SELECTIVE MOVEMENT OF SEDIMENT ON COAST WITH STEEP SLOPE- MASUREMENTS AND PREDICTION
 SORTING AND SELECTIVE MOVEMENT OF SEDIMENT ON COAST WITH STEEP SLOPE- MASUREMENTS AND PREDICTION Toshiro San-nami 1, Takaaki Uda 2, Masumi Serizawa 1 and Toshinori Ishikawa 2 Conveyer belts carrying gravel
SAND ACCUMULATION IN WAVE-SHELTER ZONE OF OHARAI PORT AND CHANGE IN GRAIN SIZE OF SEABED MATERIALS ON NEARBY COAST
 SAND ACCUMULATION IN WAVE-SHELTER ZONE OF OHARAI PORT AND CHANGE IN GRAIN SIZE OF SEABED MATERIALS ON NEARBY COAST Takeo Matsu-ura, Takaaki Uda, Takayuki Kumada and Michio Sumiya Beach changes around facing
Julebæk Strand. Effect full beach nourishment
 Julebæk Strand Effect full beach nourishment Aim of Study This study is a part of the COADAPT funding and the aim of the study is to analyze the effect of beach nourishment. In order to investigate the
Long Beach Island Holgate Spit Little Egg Inlet Historical Evolution Introduction Longshore Transport Map, Survey and Photo Historic Sequence
 Appendix B Long Beach Island Holgate Spit Little Egg Inlet Historical Evolution Introduction The undeveloped southern end of Long Beach Island (LBI) is referred to as the Holgate spit as it adjoins the
Chapter 10 Lecture Outline. The Restless Oceans
 Chapter 10 Lecture Outline The Restless Oceans Focus Question 10.1 How does the Coriolis effect influence ocean currents? The Ocean s Surface Circulation Ocean currents Masses of water that flow from one
CHAPTER 134 INTRODUCTION
 CHAPTER 134 NEW JETTIES FOR TUNG-KANG FISHING HARBOR, TAIWAN Chi-Fu Su Manager Engineering Department Taiwan Fisheries Consultants, Inc. Taipei, Taiwan INTRODUCTION Tung-Kang Fishing Harbor, which is about
Australian Coastal Councils Conference
 Australian Coastal Councils Conference Kiama March 2019 Where Has My Beach Gone? (and what can I do about it?) Dr Andrew McCowan Water Technology Where Has My Beach Gone? Where Has My Beach Gone? Where
STATUS REPORT FOR THE SUBMERGED REEF BALL TM ARTIFICIAL REEF SUBMERGED BREAKWATER BEACH STABILIZATION PROJECT FOR THE GRAND CAYMAN MARRIOTT HOTEL
 August 23 STATUS REPORT FOR THE SUBMERGED REEF BALL TM ARTIFICIAL REEF SUBMERGED BREAKWATER BEACH STABILIZATION PROJECT FOR THE GRAND CAYMAN MARRIOTT HOTEL performed by Lee E. Harris, Ph.D., P.E. Consulting
IMPACTS OF COASTAL PROTECTION STRATEGIES ON THE COASTS OF CRETE: NUMERICAL EXPERIMENTS
 IMPACTS OF COASTAL PROTECTION STRATEGIES ON THE COASTS OF CRETE: NUMERICAL EXPERIMENTS Tsanis, I.K., Saied, U.M., Valavanis V. Department of Environmental Engineering, Technical University of Crete, Chania,
Oceans and Coasts. Chapter 18
 Oceans and Coasts Chapter 18 Exploring the oceans The ocean floor Sediments thicken and the age of the seafloor increases from ridge to shore The continental shelf off the northeast United States Constituent
HURRICANE SANDY LIMITED REEVALUATION REPORT UNION BEACH, NEW JERSEY DRAFT ENGINEERING APPENDIX SUB APPENDIX D SBEACH MODELING
 HURRICANE SANDY LIMITED REEVALUATION REPORT UNION BEACH, NEW JERSEY DRAFT ENGINEERING APPENDIX SUB APPENDIX D SBEACH MODELING Rev. 18 Feb 2015 1 SBEACH Modeling 1.0 Introduction Following the methodology
Coasts. 1. Coastal Processes. 1.1 Coastal erosion. 1.2 Sediment transport. Coastal Processes and Landforms. i. Hydraulic action
 Coasts Coastal Processes and Landforms 1. Coastal Processes 1.1 Coastal erosion i. Hydraulic action When waves strike against a rock surface, the waves trap air in the rock joints. This air is compressed
Figure 4, Photo mosaic taken on February 14 about an hour before sunset near low tide.
 The Impact on Great South Bay of the Breach at Old Inlet Charles N. Flagg and Roger Flood School of Marine and Atmospheric Sciences, Stony Brook University Since the last report was issued on January 31
Low-crested offshore breakwaters: a functional tool for beach management
 Environmental Problems in Coastal Regions VI 237 Low-crested offshore breakwaters: a functional tool for beach management K. Spyropoulos & E. Andrianis TRITON Consulting Engineers, Greece Abstract Beach
Reading Material. Inshore oceanography, Anikouchine and Sternberg The World Ocean, Prentice-Hall
 Reading Material Inshore oceanography, Anikouchine and Sternberg The World Ocean, Prentice-Hall BEACH PROCESSES AND COASTAL ENVIRONMENTS COASTAL FEATURES Cross section Map view Terminology for Coastal
Deep-water orbital waves
 What happens when waves approach shore? Deep-water orbital waves Fig. 9.16, p. 211 Wave motion is influenced by water depth and shape of the shoreline wave buildup zone surf zone beach Wave base deepwater
SELECTION OF THE PREFERRED MANAGEMENT OPTION FOR STOCKTON BEACH APPLICATION OF 2D COASTAL PROCESSES MODELLING
 SELECTION OF THE PREFERRED MANAGEMENT OPTION FOR STOCKTON BEACH APPLICATION OF 2D COASTAL PROCESSES MODELLING C Allery 1 1 DHI Water and Environment, Sydney, NSW Abstract This paper presents an approach
Available online at ScienceDirect. Procedia Engineering 116 (2015 )
") Available online at www.sciencedirect.com ScienceDirect Procedia Engineering 116 (2015 ) 320 325 8th International Conference on Asian and Pacific Coasts (APAC 2015) Department of Ocean Engineering, IIT
Available online at www.sciencedirect.com ScienceDirect Procedia Engineering 116 (2015 ) 320 325 8th International Conference on Asian and Pacific Coasts (APAC 2015) Department of Ocean Engineering, IIT
MAR 110 LECTURE #15 Wave Hazards
 1 MAR 110 LECTURE #15 Wave Hazards Rogue Wave Hazard Rogue waves are very large open ocean waves of sometimes can range in height from 60 ft (20m) to120 feet (40m) and thus a significant hazard to large
Inlet Management Study for Pass-A-Grille and Bunces Pass, Pinellas County, Florida
 Inlet Management Study for Pass-A-Grille and Bunces Pass, Pinellas County, Florida Final Report Submitted By Ping Wang, Ph.D., Jun Cheng Ph.D., Zachary Westfall, and Mathieu Vallee Coastal Research Laboratory
New Jersey Coastal Zone Overview. The New Jersey Beach Profile Network (NJBPN) 3 Dimensional Assessments. Quantifying Shoreline Migration
 3 Dimensional Assessments. Quantifying Shoreline Migration") New Jersey Coastal Zone Overview The New Jersey Beach Profile Network (NJBPN) Objectives Profile Locations Data Collection Analyzing NJBPN Data Examples 3 Dimensional Assessments Methodology Examples Quantifying
New Jersey Coastal Zone Overview The New Jersey Beach Profile Network (NJBPN) Objectives Profile Locations Data Collection Analyzing NJBPN Data Examples 3 Dimensional Assessments Methodology Examples Quantifying
Cross-shore sediment transports on a cut profile for large scale land reclamations
 Cross-shore sediment transports on a cut profile for large scale land reclamations Martijn Onderwater 1 Dano Roelvink Jan van de Graaff 3 Abstract When building a large scale land reclamation, the safest
Overview. Beach Features. Coastal Regions. Other Beach Profile Features. CHAPTER 10 The Coast: Beaches and Shoreline Processes.
 Overview CHAPTER 10 The Coast: Beaches and Shoreline Processes Coastal regions constantly change. The beach is a dominant coastal feature. Wave activity continually modifies the beach and coastal areas.
THE PREPARATORY SURVEY ON BALI BEACH CONSERVATION PROJECT-PHASE II IN THE REPUBLIC OF INDONESIA
 DIRECTORATE GENERAL OF WATER RESOURCES MINISTRY OF PUBLIC WORKS THE GOVERNMENT OF THE REPUBLIC OF INDONESIA THE PREPARATORY SURVEY ON BALI BEACH CONSERVATION PROJECT-PHASE II IN THE REPUBLIC OF INDONESIA
page - Laboratory Exercise #5 Shoreline Processes
 page - Laboratory Exercise #5 Shoreline Processes Section A Shoreline Processes: Overview of Waves The ocean s surface is influenced by three types of motion (waves, tides and surface currents). Shorelines
An Update of Coastal Erosion in Puerto Rico
 Jack Morelock and Maritza Barreto An Update of Coastal Erosion in Puerto Rico Department of Marine Sciences, University of Puerto Rico at Mayagüez and Geography Department, University of Puerto Rico at
ALTERNATIVES FOR COASTAL STORM DAMAGE MITIGATION
 ALTERNATIVES FOR COASTAL STORM DAMAGE MITIGATION Dave Basco Old Dominion University, Norfolk, Virginia, USA National Park Service Photo STRUCTURAL (changes to natural, physical system) hardening (seawalls,
Anatomy of Coastal Regions
 The Coast I. BEACH ANATOMY Anatomy of Coastal Regions Terms for different parts of beaches and coastal regions Are all about ENERGY- ie, where the ocean s energy Mostly through tides and waves, and shape
Town of Duck, North Carolina
 Tracking No. 00.00.2010 Erosion Mitigation And Shoreline Management Feasibility Study Town of Duck, North Carolina Coastal Planning & Engineering of North Carolina August 15, 2012 Tom Jarrett Robert Neal
Shorelines Earth - Chapter 20 Stan Hatfield Southwestern Illinois College
 Shorelines Earth - Chapter 20 Stan Hatfield Southwestern Illinois College The Shoreline A Dynamic Interface The shoreline is a dynamic interface (common boundary) among air, land, and the ocean. The shoreline
Chapter. The Dynamic Ocean
 Chapter The Dynamic Ocean An ocean current is the mass of ocean water that flows from one place to another. 16.1 The Composition of Seawater Surface Circulation Surface Currents Surface currents are movements
INTRODUCTION TO COASTAL ENGINEERING AND MANAGEMENT
 Advanced Series on Ocean Engineering Volume 16 INTRODUCTION TO COASTAL ENGINEERING AND MANAGEMENT J. William Kamphuis Queen's University, Canada World Scientific Singapore New Jersey London Hong Kong Contents
Lecture Outlines PowerPoint. Chapter 15 Earth Science, 12e Tarbuck/Lutgens
 Lecture Outlines PowerPoint Chapter 15 Earth Science, 12e Tarbuck/Lutgens 2009 Pearson Prentice Hall This work is protected by United States copyright laws and is provided solely for the use of instructors
TITLE: COASTAL EROSION AND LANDFORMS.
 TITLE: COASTAL EROSION AND LANDFORMS. AIM: What are the factors that influence the formation of coastal features along Fishing Pond beach Trinidad? LOCATION OF FIELD STUDY: The study was carried out in
HARBOUR SEDIMENTATION - COMPARISON WITH MODEL
 HARBOUR SEDIMENTATION - COMPARISON WITH MODEL ABSTRACT A mobile-bed model study of Pointe Sapin Harbour, in the Gulf of St. Lawrence, resulted in construction of a detached breakwater and sand trap to
LAKKOPETRA (GREECE) EUROSION Case Study. Contact: Kyriakos SPYROPOULOS. TRITON Consulting Engineers. 90 Pratinou Str Athens (GREECE)
 EUROSION Case Study. Contact: Kyriakos SPYROPOULOS. TRITON Consulting Engineers. 90 Pratinou Str Athens (GREECE)") LAKKOPETRA (GREECE) Contact: Kyriakos SPYROPOULOS TRITON Consulting Engineers 90 Pratinou Str. 11634 Athens (GREECE) Tel: +32 10 729 57 61 Fax: +32 10 724 33 58 e-mail: kspyropoulos@tritonsa.gr 19 1 1.
LAKKOPETRA (GREECE) Contact: Kyriakos SPYROPOULOS TRITON Consulting Engineers 90 Pratinou Str. 11634 Athens (GREECE) Tel: +32 10 729 57 61 Fax: +32 10 724 33 58 e-mail: kspyropoulos@tritonsa.gr 19 1 1.
Beach profile surveys and morphological change, Otago Harbour entrance to Karitane May 2014 to June 2015
 Beach profile surveys and morphological change, Otago Harbour entrance to Karitane May 2014 to June 2015 Prepared for Port Otago Ltd Martin Single September 2015 Shore Processes and Management Ltd Contact
Table 4. Volumetric Change Rates Pre-Project and Post-Project for the Town of Duck
 V. VOLUMETRIC CHANGES General Volumetric changes measured over the entire monitoring area for various time periods are provided in Table 4. The volume changes are given in terms of cubic yards/foot of
ALTERNATIVES FOR COASTAL STORM DAMAGE MITIGATION AND FUNCTIONAL DESIGN OF COASTAL STRUCTURES
 The University of the West Indies Organization of American States PROFESSIONAL DEVELOPMENT PROGRAMME: COASTAL INFRASTRUCTURE DESIGN, CONSTRUCTION AND MAINTENANCE A COURSE IN COASTAL DEFENSE SYSTEMS I CHAPTER
CHANGE IN CARBONATE BEACH TRIGGERED BY CONSTRUCTION OF A BRIDGE ON IRABU ISLAND AND ITS SIMULATION USING BG MODEL
 Proceedings of the 7 th International Conference on Asian and Pacific Coasts (APAC 2013) Bali, Indonesia, September 24-26, 2013 CHANGE IN CARBONATE BEACH TRIGGERED BY CONSTRUCTION OF A BRIDGE ON IRABU
BEACH CHANGES CAUSED BY EXTENSION OF OFFSHORE BREAKWATER AND LIMITATIONS OF ARTIFICIAL REEFS CONSTRUCTED AS A MEASURE AGAINST BEACH EROSION
 BEACH CHANGES CAUSED BY EXTENSION OF OFFSHORE BREAKWATER AND LIMITATIONS OF ARTIFICIAL REEFS CONSTRUCTED AS A MEASURE AGAINST BEACH EROSION Yasuhito Noshi 1, Takaaki Uda and Yukiyoshi Hoshigami 3 Beach
April 7, Prepared for: The Caribbean Disaster Emergency Response Agency Prepared by: CEAC Solutions Co. Ltd.
 April 7, 2006 Prepared for: The Caribbean Disaster Emergency Response Agency Prepared by: Introduction CEAC Solutions Co. Ltd was commissioned in May 2005 to prepare coastal beach erosion hazard maps for
Beach Nourishment Impact on Beach Safety and Surfing in the North Reach of Brevard County, Florida
 Beach Nourishment Impact on Beach Safety and Surfing in the North Reach of Brevard County, Florida Prepared by John Hearin, Ph.D. Coastal Engineering Vice Chairman Cocoa Beach Chapter Port Canaveral Patrick
PREDICTION OF BEACH CHANGES AROUND ARTIFICIAL REEF USING BG MODEL
 PREDICTION OF BEACH CHANGES AROUND ARTIFICIAL REEF USING BG MODEL Hiroaki Fujiwara 1, Takaaki Uda 2, Toshiaki Onishi 1, Shiho Miyahara 3 and Masumi Serizawa 3 On the Kaike coast, one of the twelve detached
Exemplar for Internal Assessment Resource Geography Level 3. Resource title: The Coastal Environment Kaikoura
 Exemplar for internal assessment resource Geography 3.5A for Achievement Standard 91430 Exemplar for Internal Assessment Resource Geography Level 3 Resource title: The Coastal Environment Kaikoura This
SEDIMENT BUDGET OF LIDO OF PELLESTRINA (VENICE) Written by Marcello Di Risio Under the supervision of Giorgio Bellotti and Leopoldo Franco
 Written by Marcello Di Risio Under the supervision of Giorgio Bellotti and Leopoldo Franco") SEDIMENT BUDGET OF LIDO OF PELLESTRINA (VENICE) Written by Marcello Di Risio Under the supervision of Giorgio Bellotti and Leopoldo Franco Table of contents: 1. Introduction...3 2. Protection structures
SEDIMENT BUDGET OF LIDO OF PELLESTRINA (VENICE) Written by Marcello Di Risio Under the supervision of Giorgio Bellotti and Leopoldo Franco Table of contents: 1. Introduction...3 2. Protection structures
Appendix E Cat Island Borrow Area Analysis
 Appendix E Cat Island Borrow Area Analysis ERDC/CHL Letter Report 1 Cat Island Borrow Area Analysis Multiple borrow area configurations were considered for Cat Island restoration. Borrow area CI1 is located
4/20/17. #30 - Coastlines - General Principles Coastlines - Overview
 Writing Assignment Due one week from today by 11:59 pm See main class web pages for detailed instructions Essays will be submitted in Illinois Compass (instructions later) Pick one: Earthquakes, tsunamis,
Comparison of Predicted and Measured Shoaling at Morro Bay Harbor Entrance, California
 Comparison of Predicted and Measured Shoaling at Morro Bay Harbor Entrance, California by Edward F. Thompson, Inocencio P. DiRamos, and Robert R. Bottin, Jr. PURPOSE: This Coastal and Hydraulics Engineering
BYPASS HARBOURS AT LITTORAL TRANSPORT COASTS
 BYPASS HARBOURS AT LITTORAL TRANSPORT COASTS by K. Mangor 1, I. Brøker 2, R. Deigaard 3 and N. Grunnet 4 ABSTRACT Maintaining sufficient navigation depth in front of the entrance at harbours on littoral
BEACH NOURISHMENT COMBINED WITH SIC VERTICAL DRAIN IN MALAYSIA. Claus Brøgger 1 and Poul Jakobsen 2
 BEACH NOURISHMENT COMBINED WITH SIC VERTICAL DRAIN IN MALAYSIA. Claus Brøgger 1 and Poul Jakobsen 2 The present paper presents measurements and results from a three year full scale Pilot Project with the
CHAPTER 179. Performance of a Submerged Breakwater for Shore Protection
 CHAPTER 179 Abstract Performance of a Submerged Breakwater for Shore Protection Albert E. Browder',A. Member, ASCE; Robert G. Dean 2, Member, ASCE; and Renjie Chen 3 A summary is presented of the results
RE: Hurricane Matthew Beach Damage Assessment and Recommendations [CSE 2416]
![RE: Hurricane Matthew Beach Damage Assessment and Recommendations [CSE 2416]](/thumbs/83/87675702.jpg "RE: Hurricane Matthew Beach Damage Assessment and Recommendations [CSE 2416]") October 25, 2016 Iris Hill Town Administrator Town of Edisto Beach 2414 Murray St Edisto Beach SC 29438 RE: Hurricane Matthew Beach Damage Assessment and Recommendations [CSE 2416] Dear Iris, Hurricane
October 25, 2016 Iris Hill Town Administrator Town of Edisto Beach 2414 Murray St Edisto Beach SC 29438 RE: Hurricane Matthew Beach Damage Assessment and Recommendations [CSE 2416] Dear Iris, Hurricane
SAND BOTTOM EROSION AND CHANGES OF AN ACTIVE LAYER THICKNESS IN THE SURF ZONE OF THE NORDERNEY ISLAND
 SAND BOTTOM EROSION AND CHANGES OF AN ACTIVE LAYER THICKNESS IN THE SURF ZONE OF THE NORDERNEY ISLAND Kos'yan R. 1, Kunz H. 2, Podymov l. 3 1 Prof.Dr.,The Southern Branch of the P.P.Shirshov Institute
Natural Bridges Field Trip Activity
 Natural Bridges Field Trip Activity This is due in class on MONDAY- March 1 - not in sections! Name TA: NOTE ON THE GRADING OF THIS ASSIGNMENT: Many of the questions below (especially in the tidepool part)
1.5 How do ocean waves and currents change the face of coastal areas? (Chapter 3)
") 1.5 How do ocean waves and currents change the face of coastal areas? (Chapter 3) 1. Hydraulic Action/Pressure - air being forced into crack in rocks. 2. Corrosion (Solution) Minerals such as calcium carbonate
1.5 How do ocean waves and currents change the face of coastal areas? (Chapter 3) 1. Hydraulic Action/Pressure - air being forced into crack in rocks. 2. Corrosion (Solution) Minerals such as calcium carbonate
LABORATORY EXPERIMENTS ON EROSION CONTROL PERFORMANCE OF AN L- SHAPED PERMEABLE STRUCTURE. Abstract
 LABORATORY EXPERIMENTS ON EROSION CONTROL PERFORMANCE OF AN L- SHAPED PERMEABLE STRUCTURE Yuuji Maeda 1, Masayuki Unno 2, Masafumi Sato 2, Takao Kurita 2, Takaaki Uda 3 and Shinji Sato 4 Abstract A new
Figure79. Location map for the 10 NJBPN profile sites in Atlantic County, NJ 155
 154 Figure79. Location map for the 10 NJBPN profile sites in Atlantic County, NJ 155 ATLANTIC COUNTY SPRING 2009 to FALL 2010 The Atlantic County coastline consists of three barrier islands. Between Little
OECS Regional Engineering Workshop September 29 October 3, 2014
 B E A C H E S. M A R I N A S. D E S I G N. C O N S T R U C T I O N. OECS Regional Engineering Workshop September 29 October 3, 2014 Coastal Erosion and Sea Defense: Introduction to Coastal/Marine Structures
Nearshore Placed Mound Physical Model Experiment
 Nearshore Placed Mound Physical Model Experiment PURPOSE: This technical note describes the migration and dispersion of a nearshore mound subjected to waves in a physical model. The summary includes recommendations
Nearshore Sediment Transport What influences the loss of sediment on Beaches? - Waves - Winds - Tidal Currents - River discharge - Runoff
 Tides & Beaches Nearshore Sediment Transport What influences the loss of sediment on Beaches? - Waves - Winds - Tidal Currents - River discharge - Runoff Oceans Ocean Topography Physical Structure of the
EROSION MECHANICS OF A CARBONATE- TOMBOLO BEACH IN MIYAKOJIMA ISLAND, OKINAWA PREFECTURE, JAPAN.
 EROSION MECHANICS OF A CARBONATE- TOMBOLO BEACH IN MIYAKOJIMA ISLAND, OKINAWA PREFECTURE, JAPAN. Ryuichiro NISHI 1, Takaaki UDA 2, Akio KIKUCHI 3 and Kou FURUIKE 4 1) Associate Prof. Dept. of Ocean Civil
Q1. What are the primary causes/contributors to coastal erosion at Westshore and the concept of longshore / littoral drift.
 Q1. What are the primary causes/contributors to coastal erosion at Westshore and the concept of longshore / littoral drift. In order of (timing related) contribution to present problem 1. Beach is too
Chapter 12: Coasts (after a brief review of Tides)
") Chapter 12: Coasts (after a brief review of Tides) 1 Questions from previous classes: What happens when a wave meets a current? wave = people walking current = bus If wave goes with the current, the wave
Chapter 12: Coasts (after a brief review of Tides) 1 Questions from previous classes: What happens when a wave meets a current? wave = people walking current = bus If wave goes with the current, the wave
Variation in Beach Profile and Sediment Characteristics at Popham Beach, Phippsburg, ME
 Colby College Digital Commons @ Colby Undergraduate Research Symposium Student Research 2006 Variation in Beach Profile and Sediment Characteristics at Popham Beach, Phippsburg, ME Kathryn Lidington Colby
COASTAL EROSION: INVESTIGATIONS IN THE SOUTHWEST COAST OF SRI LANKA
 COASTAL EROSION: INVESTIGATIONS IN THE SOUTHWEST COAST OF SRI LANKA Wijayawardane I.S.K. 1, Ansaf K.M.M. 2, Ratnasooriya A.H.R. 3, Samarawickrama S.P. 4 1,2 Postgraduate Student, Department of Civil Engineering,
Technical Brief - Wave Uprush Analysis Island Harbour Club, Gananoque, Ontario
 Technical Brief - Wave Uprush Analysis RIGGS ENGINEERING LTD. 1240 Commissioners Road West Suite 205 London, Ontario N6K 1C7 October 31, 2014 Table of Contents Section Page Table of Contents... i List
Monterey Peninsula College
 Introduction to Google Earth Name Goals 1. To become proficient at using the basic features of Google Earth. 2. To recognize differences in coastal features between the east and west coast of North America.
LOCALLY CONCENTRATED SEVERE BEACH EROSION ON SEISHO COAST CAUSED BY TYPHOON T0709
 F-4 Fourth International Conference on Scour and Erosion 2008 LOCALLY CONCENTRATED SEVERE BEACH EROSION ON SEISHO COAST CAUSED BY TYPHOON T0709 Yoshimitsu TAJIMA 1 and Shinji SATO 2 1 Member of JSCE, Associate
There are many different kinds of beaches which are generally characterized by the dominance of waves, tides, rivers and currents, and in particular
 Fig. 11-11, p. 253 There are many different kinds of beaches which are generally characterized by the dominance of waves, tides, rivers and currents, and in particular differ by the amount of energy, which
Marginal Marine Environments
 Marginal Marine Environments Delta: discrete shoreline protuberances formed where rivers enter oceans, semi-enclosed seas, lakes or lagoons and supply sediment more rapidly than it can be redistributed
CHAPTER 8 ASSESSMENT OF COASTAL VULNERABILITY INDEX
 124 CHAPTER 8 ASSESSMENT OF COASTAL VULNERABILITY INDEX 8.1 INTRODUCTION In order to assess the vulnerability of the shoreline considered under this study against the changing environmental conditions,
EVALUATION OF BEACH EROSION UP-DRIFT OF TIDAL INLETS IN SOUTHWEST AND CENTRAL FLORIDA, USA. Mohamed A. Dabees 1 and Brett D.
 EVALUATION OF BEACH EROSION UP-DRIFT OF TIDAL INLETS IN SOUTHWEST AND CENTRAL FLORIDA, USA Mohamed A. Dabees 1 and Brett D. Moore 1 The paper discusses the analysis of up-drift beach erosion near selected
CHAPTER 281 INFLUENCE OF NEARSHORE HARDBOTTOM ON REGIONAL SEDIMENT TRANSPORT
 CHAPTER 281 INFLUENCE OF NEARSHORE HARDBOTTOM ON REGIONAL SEDIMENT TRANSPORT Paul C.-P. Lin, Ph.D., P.E. 1 and R. Harvey Sasso, P.E. 2 ABSTRACT The influence of nearshore hardbottom on longshore and cross-shore
To: William Woods, Jenni Austin Job No: CentrePort Harbour Deepening Project - Comments on community queries
 Memo To: William Woods, Jenni Austin From: Richard Reinen-Hamill Date: Subject: cc: 1 Purpose This memo sets out our response to issues raised at and after Seatoun community consultation sessions held
Earth Science Chapter 16 Section 3 Review
 Name: Class: Date: Earth Science Chapter 16 Section 3 Review Multiple Choice Identify the choice that best completes the statement or answers the question. 1. The movement of water that parallels the shore
DISAPPEARANCE OF SANDY BEACH TRIGGERED BY EXTENSION OF FISHING PORT BREAKWATER AND EXCESS LAND RECLAMATION
 Proceedings of the 7 th International Conference on Asian and Pacific Coasts (APAC 2013) Bali, Indonesia, September 24-26, 2013 DISAPPEARANCE OF SANDY BEACH TRIGGERED BY EXTENSION OF FISHING PORT BREAKWATER
Essentials of Oceanography Eleventh Edition
 Chapter Chapter 1 10 Clickers Lecture Essentials of Oceanography Eleventh Edition The Coast: Beaches and Shoreline Processes Alan P. Trujillo Harold V. Thurman Chapter Overview Coastal regions have distinct
4/20/17. #31 - Coastal Erosion. Coastal Erosion - Overview
 Writing Assignment Due Monday by 11:59 pm #31 - Coastal Erosion Beach front property! Great View! Buy now at a great price! See main class web pages for detailed instructions Essays will be submitted in
USE OF SEGMENTED OFFSHORE BREAKWATERS FOR BEACH EROSION CONTROL
 .. CETN-III-22 4/84 PURPOSE: USE OF SEGMENTED OFFSHORE BREAKWATERS FOR BEACH EROSION CONTROL To provide information on the functional application of and general design considerations for using offshore
Cove Point Beach Restoration: Utilization of a Spawning Habitat by Horseshoe Crabs (Limulus polyphemus)
") Cove Point Beach Restoration: Utilization of a Spawning Habitat by Horseshoe Crabs (Limulus polyphemus) Paul Bushmann, Jessica Peterson, Bethany Enyeart and Deborah Smith Anne Arundel Community College
Cove Point Beach Restoration: Utilization of a Spawning Habitat by Horseshoe Crabs (Limulus polyphemus) Paul Bushmann, Jessica Peterson, Bethany Enyeart and Deborah Smith Anne Arundel Community College
DUNE STABILIZATION AND BEACH EROSION
 DUNE STABILIZATION AND BEACH EROSION CAPE HATTERAS NATIONAL SEASHORE NORTH CAROLINA ROBERT DOLAN PAUL GODFREY U. S. DEPARTMENT OF INTERIOR NATIONAL PARK SERVICE OFFICE OF NATURAL SCIENCE WASHINGTON, D.
Wind Blow-out Hollow Generated in Fukiage Dune Field, Kagoshima Prefecture, Japan
 R. Nishi Wind Blow-out Hollow Generated in Fukiage Dune Field, Kagoshima Prefecture, Japan Ryuichiro Nishi, Li Elikson and Myokhin PREFACE A sand dune is vulnerable to severe waves and wind. Therefore,
Shoreline Response to an Offshore Wave Screen, Blairgowrie Safe Boat Harbour, Victoria, Australia
 Shoreline Response to an Offshore Wave Screen, Blairgowrie Safe Boat Harbour, Victoria, Australia T.R. Atkins and R. Mocke Maritime Group, Sinclair Knight Merz, P.O. Box H615, Perth 6001, Australia ABSTRACT
Artificial headlands for coastal restoration
 Artificial headlands for coastal restoration J. S. Mani Professor, Department of Ocean Engineering, Indian Institute of Technology Madras, Chennai 636, India Abstract Construction of a satellite harbour
APPLICATION OF SHORE PROTECTION SCHEMES IN HORNB^K Mads Peder J0rgensen ' Peer Skaarup 2 Karsten Mangor 3 J0rgen Juhl 4
 APPLICATION OF SHORE PROTECTION SCHEMES IN HORNB^K Mads Peder J0rgensen ' Peer Skaarup 2 Karsten Mangor 3 J0rgen Juhl 4 ABSTRACT Hornbask Harbour was built more than a hundred years ago on a sandy coast
BEACH PROCESSES AND COASTAL ENVIRONMENTS
 BEACH PROCESSES AND COASTAL ENVIRONMENTS COASTAL FEATURES Cross section Map view TOPICS: Terminology Waves Beach Morphology Barriers Coastal Migration Tides Tidal Flats and Marshes Sediment Budgets Human
Nearshore Morphodynamics. Bars and Nearshore Bathymetry. Sediment packages parallel to shore, that store beach sediment
 Nearshore Morphodynamics http://coastal.er.usgs.gov/bier/images/chandeleur-xbeach-lg.jpg Bars and Nearshore Bathymetry Sediment packages parallel to shore, that store beach sediment Can be up to 50 km
Delaware Chapter Surfrider Foundation - Indian River Inlet Monitoring
 Delaware Chapter Surfrider Foundation - Indian River Inlet Monitoring In 2012, the Delaware Surfrider Foundation Chapter formed the Surf Quality and Access Committee to focus on issues such as surf spot
Chesil Beach, Dorset UK High energy, shingle coastline. Brighton Beach, Sussex UK Pebble beach
 Beaches: Depositional landform Extends from the highest high tide to the lowest low tide. Very important temporary store in coastal system. Accretion: sediment returning to the visible portion of a beach
Technical Brief - Wave Uprush Analysis 129 South Street, Gananoque
 Technical Brief - Wave Uprush Analysis 129 South Street, Gananoque RIGGS ENGINEERING LTD. 1240 Commissioners Road West Suite 205 London, Ontario N6K 1C7 June 12, 2013 Table of Contents Section Page Table
General Coastal Notes + Landforms! 1
 General Coastal Notes + Landforms! 1 Types of Coastlines: Type Description Primary Coast which is essentially in the same condition when sea level stabilized Coastline after the last ice age, younger.
Performance of Upham Beach T-Groin Project and Its Impact to the Downdrift Beach
 Performance of Upham Beach T-Groin Project and Its Impact to the Downdrift Beach Progress Report for the Period of October 2008 to April 2009 Submitted by Ping Wang, Ph.D., and Tiffany M. Roberts Department
INTRODUCTION TO COASTAL ENGINEERING
 The University of the West Indies Organization of American States PROFESSIONAL DEVELOPMENT PROGRAMME: COASTAL INFRASTRUCTURE DESIGN, CONSTRUCTION AND MAINTENANCE A COURSE IN COASTAL DEFENSE SYSTEMS I CHAPTER
Map 8: Ayrshire Coast: Ardrossan North Bay to Stevenston Pier Map Content Descriptions
 Map 8: Ayrshire Coast: Ardrossan North Bay to Stevenston Pier Map Content Descriptions 1. Built Heritage and Archaeology A total of twenty four sites were recorded in the area covered by Map 8. Of these