Vika Grigorieva and Sergey Gulev. Sea Atmosphere Interaction And Climate Laboratory P. P. Shirshov Institute of Oceanology, Russia
|
|
|
- Aileen Harrison
- 5 years ago
- Views:
Transcription

1 Global Ocean Wave Statistics from VOS: a new dataset and associated Atlas Vika Grigorieva and Sergey Gulev Sea Atmosphere Interaction And Climate Laboratory P. P. Shirshov Institute of Oceanology, Russia Outline: ICOADS version 3.0 Voluntary Observing Ship (VOS) data Global climatologies of wave characteristics: wind sea, swell, SWH Inhomogeneities associated with changes in the coding systems Long term trends and extremes
 0.2 m (or 5%) Wave period 1 s 1 s Wind speed 1 m/s 1.")
2 Waves in VOS : ( ) parameter VOS Altimetry NDBC Wave height 0.5 m 0.4 m (or 10%) 0.2 m (or 5%) Wave period 1 s 1 s Wind speed 1 m/s 1.5 m/s 1 m/s Direction

3 Observational density WIND SEA SWELL

4 Global Wind Wave Climatology
5 Multi-stream Wave Climatology ICOADS VOS IMMA-3.0 DECODING, MULTISTAGE QUALITY CONTROL, NEW VARIABLES COMPUTATION SWH=max (Sea,Swell) Wind sea All wave parameters 10 x20, 10 x10, 5 x10, 2 x4, 2 x2 grids Observational density Wave heights and periods Directional steadiness Wave geometry: steepness, wave length, wave age Monthly means, decadal, annual Extreme estimates: 90%, 95%, 99%, 99.99%

6 Wave directions (from where) WIND SEA SWELL W N

 Swell (-0.")
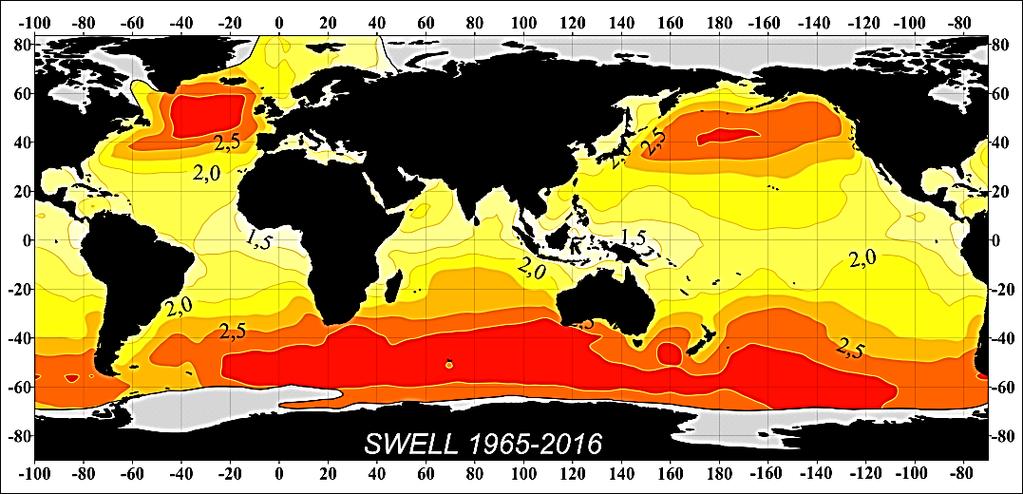
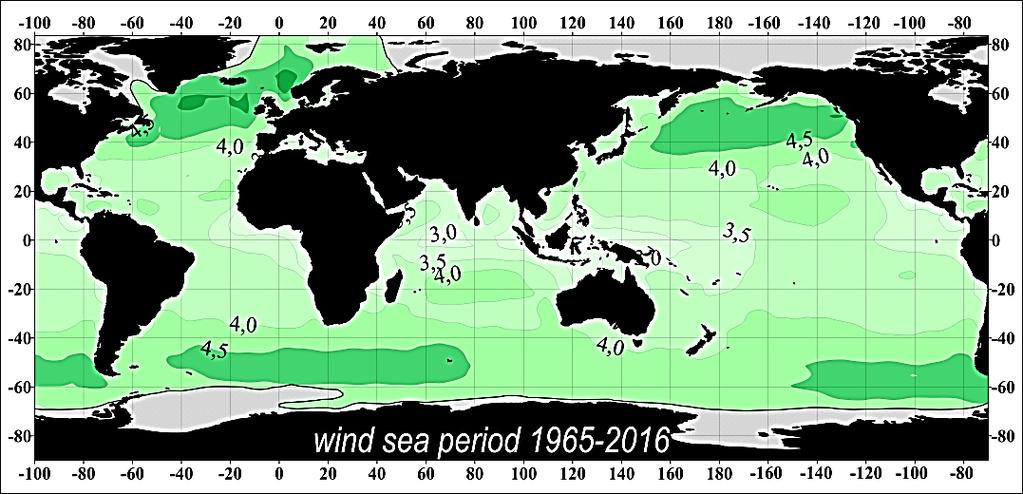
7 Global average grey - 10 x20, blue 10 x10, red 2 x2 SSSS = max sss, sssss SSSS = sss 2 + sssss 2 Wind sea (+0.3 cm/year) Swell (-0.3 cm/year)

8 Long term trends Wind sea are growing of about cm/year in the Northern Hemisphere oceans but swell is slightly decreasing ( cm/year) Wind sea are becoming less steeper and higher while swell is becoming steeper but lower
. Beginning 1 July 1963 both sea (i.e. wind wave) and swell were reported.")
9 Waves in VOS : ( ) IMMA: Prior to 1949 both sets of wave height (sea and swell) fields were apparently reported descriptively in the SHIP code, and thus are expected to be missing (and the swell fields are expected to be missing prior to 1 July 1963). Beginning 1 July 1963 both sea (i.e. wind wave) and swell were reported. Prior to that date only the higher of sea and swell was reported
 value is almost linearly dependent to the square root of the average wave Height (H) above, i.e., D b + a H Degree Height (m) Description 0 no wave Calm (Glassy) 1 0 0.")
10 Ship code: prior to 1949 The WMO sea state code largely adopts the 'wind sea' definition of the Douglas Sea Scale. The Degree (D) value is almost linearly dependent to the square root of the average wave Height (H) above, i.e., D b + a H Degree Height (m) Description 0 no wave Calm (Glassy) Calm (rippled) Smooth Slight Moderate Rough Very rough High Very high Phenomenal Sir Percy Douglas Not adopted D9
, both components are available starting from 1949 (not 1963,")
11 Global average SSSS = max sss, sssss grey - 10 x20, blue 10 x10, red 2 x2 Wave height was converted from the ship code: 11.5 and 7.5m waves influence Actual sea or swell were wrongly reported as SWH (maximum of the 2 components), both components are available starting from 1949 (not 1963, as reported by IMMA)


12 Is there a solution? SSSS = max sss, sssss blue VOS grey - Weibull


13 Trends average P99% 90% significance level t-test average P99% average P99% cm/year average year VOS, Weibull Global trend estimates for demonstrate rather data inhomogeneity then the change in the wave climate Trends computed over different time windows trace the character of temporal changes

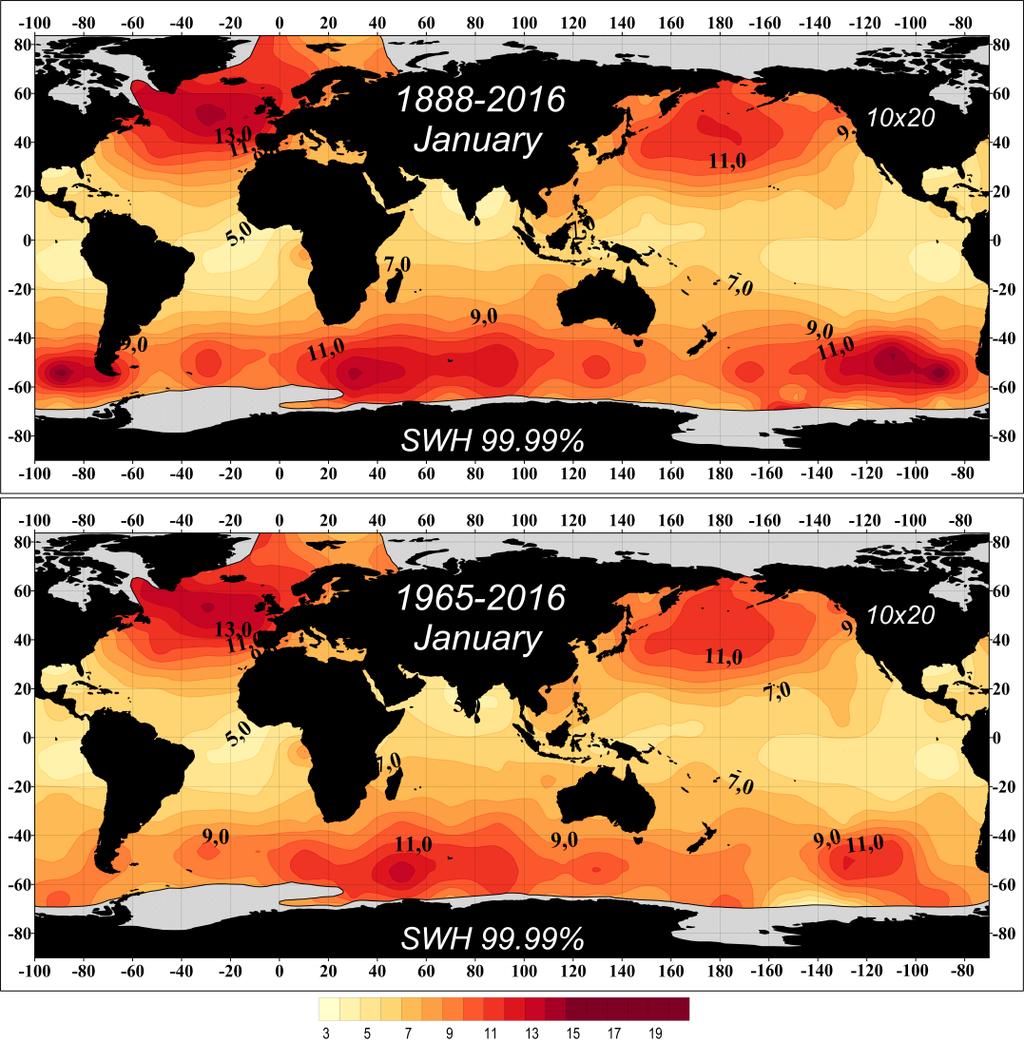
14 Extreme waves ,
15 Conclusions New update of the Global Wind Wave Atlas based upon ICOADS version 3.0 release has been presented: different grids and new wave variables Statistical modeling with Weibull PDF allows for minimizing the impact of sampling onto wave probability distributions Centennial time series of homogenized wave data allow for estimating trends and extremes for different time periods Trends are influenced by the discontinuities associated with changes in the coding systems
")

16 Blue bars - VOS SWH SSSS = (h 2 2 w + h s ) 1 2 Yellow bars SSS Envisat Cabo da Roca

17 Voluntary Observing Ship (VOS): The longest global observations taken visually by marine officers Separate estimates of wind sea and swell Observational practice has never been changed Coding systems have been changed several times, while documented Code precision is 0.5m for heights and 1 sec for periods Assimilated in ICOADS ( New IMMA-formatted data are available nearly operationally 3 streams of data: ( ) and ( ) and (2006-onwards) > telegrams

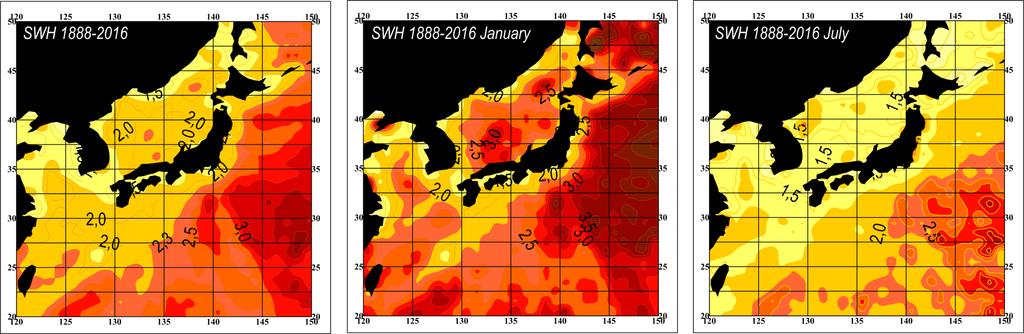
18 Regional climatology 1 x1 ( )
19 Wave directions

20 Weibull average + observations

21 Global Wind Wave Climatology

22 Global Wind Wave Climatology

23 Numbers: ICOADS 2.5 vs ICOADS 3.0 ( ) ICOADS 3.0, *10 6 ICOADS 2.5, *10 6 Difference, *10 6 Number of records Wind sea height Swell height Wind sea swell All wave parameters No difference in wave information before 1960 Whole number of reports is growing (jumping) Wind sea height number is growing (huge leap) Swell height number is decreasing Sea+swell number is decreasing Number of all wave parameters is decreasing
24 Common problems with known cures Unrealistic dates and mistakes in attribution of coordinates of reports («± error» North vs South, East vs West) confuse in wave characteristics Predominantly integer figures for wave height estimates (often rounded to the nearest multiple of 5) Extreme waves (>25 m) Different thresholds before and after 1950 and 2006 influence on extreme and long term estimates Wind sea and swell separation Inconsistency of wave parameters (zero height with the period > 0) Small wave periods («1 sec problem») Zero wave heights: calm or data missing? influence on mean values SWH = ( h 2 w + h max[ h 2 s w ), h 1/ 2 s, ], [ dir [ dir sea sea, dir, dir swell swell ] 30 ] 30 sector sector


25 Artefacts Unrealistic dates days almost in every month each year is leap year problems are fixed Wrong attribution of S/N and E/W coordinates of reports T A Great Lakes January 2011 SST T A Southern Ocean January 2011 SST
 Beaufort scale, buoy and satellite")
 when wind speed is less than 5 m/s Swell = 0 Wind sea = 0 Both = 0 Wind speed when wind")
26 Zero wave heights: calm or data missing Most observations are located in the areas dominated by wind sea with a little occurrence of swell (likely NH) Beaufort scale, buoy and satellite wind-wave analysis allow zero wind waves (or less than 0.5m ) when wind speed is less than 5 m/s Swell = 0 Wind sea = 0 Both = 0 Wind speed when wind sea height = 0 Swell = 0 Wind sea = 0 Both = 0


 H=33.5m?")

27 Wave heights and periods After all QC procedures from reports (27%,1970) to (2%, 2015) Open questions: H=11.5m the real value or not converted feet? (11.5 Ft = 3.5 m) H=33.5m? no swell higher than 10 m swell periods range within 5-15 sec

 decrease of the number of reported moderate waves during")
28 What happened in 2004? 2.5 <H 7.5m 2.5 <H 7.5m sea 0 <H 2.5m swell 0 <H 2.5m H = 0 H = 0 Significant decrease of the number of observations in the Southern Hemisphere: from 20% to 5% 99% of all reported wave heights are smaller than 7.5 m Significant (~10%) decrease of the number of reported moderate waves during the last decade
Extreme waves in visual wave observations by VOS
 Extreme waves in visual wave observations by VOS Vika Grigorieva and Sergey K. Gulev P.P. Shirshov Institute of Oceanology, Russian Academy of Sciences, Moscow, Russia vika@sail.msk.ru http://www.sail.msk.ru
The relevance of ocean surface current in the ECMWF analysis and forecast system. Hans Hersbach Jean-Raymond Bidlot
 The relevance of ocean surface current in the ECMWF analysis and forecast system Hans Hersbach Jean-Raymond Bidlot European Centre for Medium Range Weather Forecasts, Reading, U.K. hans.hersbach@ecmwf.int
The Cross-Calibrated Multi-Platform (CCMP) Ocean Vector Wind Analysis (V2.0)
 Ocean Vector Wind Analysis (V2.0)") The Cross-Calibrated Multi-Platform (CCMP) Ocean Vector Wind Analysis (V2.0) Carl A. Mears, L. Ricciardulli, J. Scott and F. J. Wentz Remote Sensing Systems Ross Hoffman, S. Mark Leidner Robert Atlas Atmospheric
The Cross-Calibrated Multi-Platform (CCMP) Ocean Vector Wind Analysis (V2.0) Carl A. Mears, L. Ricciardulli, J. Scott and F. J. Wentz Remote Sensing Systems Ross Hoffman, S. Mark Leidner Robert Atlas Atmospheric
ENSO Cycle: Recent Evolution, Current Status and Predictions. Update prepared by Climate Prediction Center / NCEP 4 September 2012
 ENSO Cycle: Recent Evolution, Current Status and Predictions Update prepared by Climate Prediction Center / NCEP 4 September 2012 Outline Overview Recent Evolution and Current Conditions Oceanic Niño Index
On the assimilation of SAR wave spectra of S-1A in the wave model MFWAM
 On the assimilation of SAR wave spectra of S-1A in the wave model MFWAM Lotfi Aouf and Alice Dalphinet Météo-France, Département Marine et Océanographie,Toulouse 14 th wave forecasting and hindcasting,
JCOMM Technical Workshop on Wave Measurements from Buoys
 JCOMM Technical Workshop on Wave Measurements from Buoys Val Swail Chair, JCOMM Expert Team on Wind Waves and Storm Surges Neville Smith Vincent Cardone Peter Janssen Gerbrand Komen Peter Taylor WIND WAVES
Tracking of Large-Scale Wave Motions
 Tracking of Large-Scale Wave Motions Nikki Barbee, Adam Cale, Justin Wittrock Dr. William Gutowski Meteorology 44 Fall 29 This semester we have observed large scale wave patterns in both the Northern and
Recovery of sea level fields of the last decades from altimetry and tide gauge data
 Recovery of sea level fields of the last decades from altimetry and tide gauge data Francisco M. Calafat, Damià Gomis, Ananda Pascual, Marta Marcos and Simón Ruiz Mediterranean Institute for Adavanced
Reprocessed QuikSCAT (V04) Wind Vectors with Ku-2011 Geophysical Model Function
 Wind Vectors with Ku-2011 Geophysical Model Function") Reprocessed QuikSCAT (V04) Wind Vectors with Ku-2011 Geophysical Model Function Lucrezia Ricciardulli and Frank Wentz Introduction In April 2011, we reprocessed the QuikSCAT ocean wind vectors using a
Reprocessed QuikSCAT (V04) Wind Vectors with Ku-2011 Geophysical Model Function Lucrezia Ricciardulli and Frank Wentz Introduction In April 2011, we reprocessed the QuikSCAT ocean wind vectors using a
Short-period gravity waves over a high-latitude observation site: Rothera, Antarctica
 Short-period gravity waves over a high-latitude observation site: Rothera, Antarctica K. Nielsen, D. Broutman, M. Taylor, D. Siskind, S. Eckermann, K. Hoppel, R. Hibbins, M. Jarvis, N. Mitchell, J. Russell
Mean Sea Level Pressure and Wind Climatology over the North Indian Ocean: Quality control, Validation and Biases
 Mean Sea Level Pressure and Wind Climatology over the North Indian Ocean: Quality control, Validation and Biases M. Rajeevan and S.K.Dikshit India Meteorological Department Pune. India Introduction India
Metocean criteria for fatigue assessment. Rafael V. Schiller 5th COPEDI Seminar, Oct 8th 2014.
 Metocean criteria for fatigue assessment Rafael V. Schiller 5th COPEDI Seminar, Oct 8th 2014. Metocean requirements along the lifecycle of a project Metocean criteria for fatigue Analysis techniques and
Impact of the tides, wind and shelf circulation on the Gironde river plume dynamics
 Impact of the tides, wind and shelf circulation on the Gironde river plume dynamics F. Toublanc 1, N. Ayoub 2, P. Marsaleix 3, P. De Mey 2 1 CNES/LEGOS 2 CNRS/LEGOS 3 CNRS/LA, Toulouse, France 5th GODAE
Energy Output. Outline. Characterizing Wind Variability. Characterizing Wind Variability 3/7/2015. for Wind Power Management
 Energy Output for Wind Power Management Spring 215 Variability in wind Distribution plotting Mean power of the wind Betz' law Power density Power curves The power coefficient Calculator guide The power
The Wave Climate of Ireland: From Averages to Extremes. Sarah Gallagher, Met Éireann
 The Wave Climate of Ireland: From Averages to Extremes Sarah Gallagher, Met Éireann IMS One Day Conference: The Perfect Storm, 28th March 2015 Motivation & Introduction Methodology - How can we Model Waves?
Atmospheric Waves James Cayer, Wesley Rondinelli, Kayla Schuster. Abstract
 Atmospheric Waves James Cayer, Wesley Rondinelli, Kayla Schuster Abstract It is important for meteorologists to have an understanding of the synoptic scale waves that propagate thorough the atmosphere
Conditions for Offshore Wind Energy Use
 Carl von Ossietzky Universität Oldenburg Institute of Physics Energy Meteorology Group Detlev Heinemann Conditions for Offshore Wind Energy Use Detlev Heinemann ForWind Carl von Ossietzky Universität Oldenburg
Package STI. August 19, Index 7. Compute the Standardized Temperature Index
 Package STI August 19, 2015 Type Package Title Calculation of the Standardized Temperature Index Version 0.1 Date 2015-08-18 Author Marc Fasel [aut, cre] Maintainer Marc Fasel A set
ENSO Update Eastern Region. Michelle L Heureux Climate Prediction Center / NCEP/ NOAA 29 November 2016
 ENSO Update Eastern Region Michelle L Heureux Climate Prediction Center / NCEP/ NOAA 29 November 2016 Summary La Niña conditions are present.* ENSO Alert System Status: La Niña Advisory Equatorial sea
Surface Wind Speed Distributions: Implications for Climate and Wind Power
 Surface Wind Speed Distributions: Implications for Climate and Wind Power Scott B. Capps and Charles S. Zender Department of Earth System Science University of California, Irvine Thanks: W. Liu (JPL),
Jackie May* Mark Bourassa. * Current affilitation: QinetiQ-NA
 Jackie May* Mark Bourassa * Current affilitation: QinetiQ-NA Background/Motivation In situ observations (ships and buoys) are used to validate satellite observations Problems with comparing data Sparseness
Extreme waves in the ECMWF operational wave forecasting system. Jean-Raymond Bidlot Peter Janssen Saleh Abdalla
 Extreme waves in the ECMWF operational wave forecasting system Jean-Raymond Bidlot Peter Janssen Saleh Abdalla European Centre for Medium range Weather Forecasts Shinfield Park, RG 9AX, Reading, United
Atomspheric Waves at the 500hPa Level
 Atomspheric Waves at the 5hPa Level Justin Deal, Eswar Iyer, and Bryce Link ABSTRACT Our study observes and examines large scale motions of the atmosphere. More specifically it examines wave motions at
Atmospheric and Ocean Circulation Lab
 Atmospheric and Ocean Circulation Lab name Key Objectives: The main goal of this lab is to learn about atmospheric and oceanic circulation and how these two processes are strongly inter-dependent and strongly
Indian Ocean Dipole - ENSO - monsoon connections and Overcoming coupled model systematic errors
 Indian Ocean Dipole - ENSO - monsoon connections and Overcoming coupled model systematic errors Hilary Spencer, Rowan Sutton and Julia Slingo CGAM, Reading University h.spencer@reading.ac.uk Monsoon -
Ka Imimoana IMET Data Quality Control Report: 1999, 2000, & 2001
 Ka Imimoana IMET Data Quality Control Report: 1999, 2000, & 2001 Jeremy J. Rolph and Shawn R. Smith Research Vessel Surface Meteorological Data Center Center for Ocean Atmospheric Prediction Studies Florida
Open Ocean Storm Waves in the Arctic
 International Workshop on Wave Hindcasting and Forecasting/Coastal Hazards Symposium Liverpool, UK, 10-15 September 2017 Open Ocean Storm Waves in the Arctic Takuji Waseda,Adrean Webb (UTokyo, Japan) Kazutoshi
Evaluating the impact of ocean gravity wave variability on Aquarius satellite measurements. D. Vandemark, H. Feng Univ. of New Hampshire/EOS
 Evaluating the impact of ocean gravity wave variability on Aquarius satellite measurements D. Vandemark, H. Feng Univ. of New Hampshire/EOS Global Wave model fields, Aquarius L2_wwav files*, Day 240-271
Are Hurricanes Becoming More Furious Under Global Warming?
 Are Hurricanes Becoming More Furious Under Global Warming? Z H A N L I U N I V E R S I T Y O F U T A H A T M O S P H E R I C S C I E N C E S D E P A R T M E N T T U E S D A Y, M A R C H 1 6, 2 0 1 0 OUTLINE
Atmospheric Rossby Waves Fall 2012: Analysis of Northern and Southern 500hPa Height Fields and Zonal Wind Speed
 Atmospheric Rossby Waves Fall 12: Analysis of Northern and Southern hpa Height Fields and Zonal Wind Speed Samuel Schreier, Sarah Stewart, Ashley Christensen, and Tristan Morath Department of Atmospheric
Appendix E Mangaone Stream at Ratanui Hydrological Gauging Station Influence of IPO on Stream Flow
 NZ Transport Agency Peka Peka to North Ōtaki Expressway Hydraulic Investigations for Expressway Crossing of Mangaone Stream and Floodplain Appendix E Mangaone Stream at Ratanui Hydrological Gauging Station
Singularity analysis: A poweful technique for scatterometer wind data processing
 Singularity analysis: A poweful technique for scatterometer wind data processing M. Portabella (ICM-CSIC) W. Lin (ICM-CSIC) A. Stoffelen (KNMI) A. Turiel (ICM-CSIC) G. King (ICM-CSIC) A. Verhoef (KNMI)
Validation of 12.5 km Resolution Coastal Winds. Barry Vanhoff, COAS/OSU Funding by NASA/NOAA
 Validation of 12.5 km Resolution Coastal Winds Barry Vanhoff, COAS/OSU Funding by NASA/NOAA Outline Part 1: Determining empirical land mask Characterizing σ 0 near coast Part 2: Wind retrieval using new
Regional and seasonal inhomogeneity of climatic variability in the Far-Eastern Seas
 Regional and seasonal inhomogeneity of climatic variability in the Far-Eastern Seas Elena I. Ustinova, Yury D. Sorokin and Svetlana Yu. Glebova Pacific Fisheries Research Centre (TINRO-Centre) 699 Shevchenko
OAFlux: global, 0.25, daily
 Including ASCAT in OAFlux Global Vector Wind Analysis (1987 present) with programming support from Dr. Xiangze Jin July 1987 OAFlux: global, 0.25, daily QuikSCAT AMSRE SSMI (F08, F10, F11, F13, F14, F15,
The Setting - Climatology of the Hawaiian Archipelago. Link to Video of Maui Waves
 The Setting - Climatology of the Hawaiian Archipelago Link to Video of Maui Waves What caused this week s weather? What caused this weekend s weather? Today s Objective: Provide overview and description
The role of large-scale modes of climate variability on the Cape Point wave record
 GODAE OceanView 5th COSS-TT meeting, Cape Town 2017 The role of large-scale modes of climate variability on the Cape Point wave record Jennifer Veitch1, Andrew Birkett2, Juliet Hermes1, Christo Rautenbach,
Rokjin J. Park, Jaein I. Jeong, Minjoong Kim
 1. Jeong, J. I. and R. J. Park (2017), Winter monsoon variability and its impact on aerosol concentrations in East Asia, Environmental Pollution, 211, 285-292. 2. Kim, M. J., S. -W. Yeh, and R. J. Park
OCEANOGRAPHY STUDY GUIDE
 OCEANOGRAPHY STUDY GUIDE Chapter 2 Section 1 1. Most abundant salt in ocean. Sodium chloride; NaCl 2. Amount of Earth covered by Water 71% 3. Four oceans: What are they? Atlantic, Pacific, Arctic, Indian
Synoptic forcing of wave states in the southeast Chukchi Sea, Alaska, at nearshore locations
 Nat Hazards (2012) 62:1273 1300 DOI 10.1007/s11069-012-0148-y ORIGINAL PAPER Synoptic forcing of wave states in the southeast Chukchi Sea, Alaska, at nearshore locations Oceana P. Francis David E. Atkinson
Wind Regimes 1. 1 Wind Regimes
 Wind Regimes 1 1 Wind Regimes The proper design of a wind turbine for a site requires an accurate characterization of the wind at the site where it will operate. This requires an understanding of the sources
Earth s oceans covers 71 % _ of the planet s surface. In reality, Earth s ocean waters are all. interconnected as part of a single large global ocean.
 Ocean Motion Met 101: Introduction to the World's Oceans Produced by The COMET Program Geography: Name Pd. Earth s oceans covers 71 % _ of the planet s surface. In reality, Earth s ocean waters are all
CVEN Computer Applications in Engineering and Construction. Programming Assignment #4 Analysis of Wave Data Using Root-Finding Methods
 CVEN 30-501 Computer Applications in Engineering and Construction Programming Assignment #4 Analysis of Wave Data Using Root-Finding Methods Date distributed: 9/30/016 Date due: 10/14/016 at 3:00 PM (electronic
A Computational Assessment of Gas Jets in a Bubbly Co-Flow 1
 A Computational Assessment of Gas Jets in a Bubbly Co-Flow 1 Melissa Fronzeo*, 1 Michael Kinzel 1 The Pennsylvania State University, University Park, PA, USA Abstract In this effort, Computational Fluid
ENVISAT WIND AND WAVE PRODUCTS: MONITORING, VALIDATION AND ASSIMILATION
 ENVISAT WIND AND WAVE PRODUCTS: MONITORING, VALIDATION AND ASSIMILATION Peter A.E.M. Janssen (), Saleh Abdalla (), Jean-Raymond Bidlot (3) European Centre for Medium-Range Weather Forecasts, Shinfield
Wind and Air Pressure
 Wind and Air Pressure When air moves above the surface of the Earth, it is called wind. Wind is caused by differences in air pressure. When a difference in pressure exists, the air will move from areas
Dynamic validation of Globwave SAR wave spectra data using an observation-based swell model. R. Husson and F. Collard
 Dynamic validation of Globwave SAR wave spectra data using an observation-based swell model. R. Husson and F. Collard Context 1978 1979 1980 1981 1982 1983 1984 1985 1986 1987 1988 1989 1990 1991 1992
Atmospheric Rossby Waves in Fall 2011: Analysis of Zonal Wind Speed and 500hPa Heights in the Northern and Southern Hemispheres
 Atmospheric Rossby Waves in Fall 211: Analysis of Zonal Wind Speed and 5hPa Heights in the Northern and Southern s Samuel Cook, Craig Eckstein, and Samantha Santeiu Department of Atmospheric and Geological
Cross-Calibrating OSCAT Land Sigma-0 to Extend the QuikSCAT Land Sigma-0 Climate Record
 Cross-Calibrating OSCAT Land Sigma-0 to Extend the QuikSCAT Land Sigma-0 Climate Record David G. Long Department of Electrical and Computer Engineering Brigham Young University May 2013 0 Scatterometer
On the Challenges of Analysis and Design of Turret-Moored FPSOs in Squalls
 On the Challenges of Analysis and Design of Turret-Moored FPSOs in Squalls Arun Duggal Amir Izadparast Yu Ding 19th SNAME Offshore Symposium 6 February 2014 Overview Squalls, History & Current Practice
WP5 South African Extreme Wind Atlas (WASA)
") WP5 South African Extreme Wind Atlas (WASA) A Kruger South African Weather Service X Larsén DTU Wind Energy 1 Wind Atlas for South Africa project Why do we need extreme wind statistics? Origins of strong
WP5 South African Extreme Wind Atlas (WASA) A Kruger South African Weather Service X Larsén DTU Wind Energy 1 Wind Atlas for South Africa project Why do we need extreme wind statistics? Origins of strong
Sea State Analysis. Topics. Module 7 Sea State Analysis 2/22/2016. CE A676 Coastal Engineering Orson P. Smith, PE, Ph.D.
 Sea State Analysis Module 7 Orson P. Smith, PE, Ph.D. Professor Emeritus Module 7 Sea State Analysis Topics Wave height distribution Wave energy spectra Wind wave generation Directional spectra Hindcasting
Torrild - WindSIM Case study
 Torrild - WindSIM Case study Note: This study differs from the other case studies in format, while here another model; WindSIM is tested as alternative to the WAsP model. Therefore this case should be
Influence of atmospheric circulation on the Namibian upwelling system and the oxygen minimum zone
 International Liege colloquium Influence of atmospheric circulation on the Namibian upwelling system and the oxygen minimum zone Nele Tim, Eduardo Zorita, Birgit Hünicke 09.05.2014 / University of Liège
Aalborg Universitet. Estimation of wave conditions at Liseleje location Bogarino, Bruno; Brorsen, Michael. Publication date: 2007
 Aalborg Universitet Estimation of wave conditions at Liseleje location Bogarino, Bruno; Brorsen, Michael Publication date: 27 Document Version Publisher's PDF, also known as Version of record Link to publication
CPUE standardization and spatio-temporal distribution modelling of dorado (Coryphaena hippurus) in the Pacific Ocean off Peru
 in the Pacific Ocean off Peru") CPUE standardization and spatio-temporal distribution modelling of dorado (Coryphaena hippurus) in the Pacific Ocean off Peru Josymar Torrejón Magallanes 1 ; Wencheng Lau Medrano 1 ; Daniel Grados 1 1
CPUE standardization and spatio-temporal distribution modelling of dorado (Coryphaena hippurus) in the Pacific Ocean off Peru Josymar Torrejón Magallanes 1 ; Wencheng Lau Medrano 1 ; Daniel Grados 1 1
Wave forecasting at ECMWF
 Wave forecasting at ECMWF Peter Janssen, ECMWF 1. . Freak Waves. INTRODUCTION I will briefly discuss progress in ocean wave forecasting at ECMWF during the past years or so, by
Regional Analysis of Extremal Wave Height Variability Oregon Coast, USA. Heidi P. Moritz and Hans R. Moritz
 Regional Analysis of Extremal Wave Height Variability Oregon Coast, USA Heidi P. Moritz and Hans R. Moritz U. S. Army Corps of Engineers, Portland District Portland, Oregon, USA 1. INTRODUCTION This extremal
Historical Analysis of Montañita, Ecuador for April 6-14 and March 16-24
 Historical Analysis of Montañita, Ecuador for April 6-14 and March 16-24 Prepared for the ISA by Mark Willis and the Surfline Forecast and Science Teams Figure 1. Perfect Right- hander at Montañita, Ecuador
Climate variability and changes in the marginal Far-Eastern Seas
 PICES-26 November 2-3, 26 San Diego, USA Climate variability and changes in the marginal Far-Eastern Seas Elena I. Ustinova and Yury D. Sorokin Pacific Fisheries Research Centre (TINRO-Centre) 699 Shevchenko
MARYLAND WIND CLIMATOLOGY FROM WIND PROFILERS
 American Association of State Climatologists, 40 th Annual Meeting, Cape May, NJ. June 23-26, 2015 MARYLAND WIND CLIMATOLOGY FROM WIND PROFILERS Konstantin Vinnikov & Eric Hohman (Office of State Climatologist
ENSO Cycle: Recent Evolution, Current Status and Predictions. Update prepared by Climate Prediction Center / NCEP 8 March 2010
 ENSO Cycle: Recent Evolution, Current Status and Predictions Update prepared by Climate Prediction Center / NCEP 8 March 2010 Outline Overview Recent Evolution and Current Conditions Oceanic Niño Index
3. DYNAMICS OF GLOBAL CLIMATIC INDICES AND MAIN COMMERCIAL CATCHES
 11 3. DYNAMICS OF GLOBAL CLIMATIC INDICES AND MAIN COMMERCIAL CATCHES An important question is whether the main commercial stock production is affected by common factors, which also control the synchronous
Validation of 12.5 km and Super-High Resolution (2-5 km)
") Coastal and Orographic Wind Analyses from High Resolution QuikSCAT and SeaWinds Measurements M.H. Freilich, COAS/OSU D.B. Chelton, COAS/OSU D.G. Long, BYU Clive Dorman, SIO Barry Vanhoff, COAS/OSU OVWST
Coastal and Orographic Wind Analyses from High Resolution QuikSCAT and SeaWinds Measurements M.H. Freilich, COAS/OSU D.B. Chelton, COAS/OSU D.G. Long, BYU Clive Dorman, SIO Barry Vanhoff, COAS/OSU OVWST
APPENDIX B NOAA DROUGHT ANALYSIS 29 OCTOBER 2007
 APPENDIX B NOAA DROUGHT ANALYSIS 29 OCTOBER 2007 ENSO Cycle: Recent Evolution, Current Status and Predictions Update prepared by Climate Prediction Center / NCEP October 29, 2007 Outline Overview Recent
EVALUATION OF ENVISAT ASAR WAVE MODE RETRIEVAL ALGORITHMS FOR SEA-STATE FORECASTING AND WAVE CLIMATE ASSESSMENT
 EVALUATION OF ENVISAT ASAR WAVE MODE RETRIEVAL ALGORITHMS FOR SEA-STATE FORECASTING AND WAVE CLIMATE ASSESSMENT F.J. Melger ARGOSS, P.O. Box 61, 8335 ZH Vollenhove, the Netherlands, Email: info@argoss.nl
Variability in the tropical oceans - Monitoring and prediction of El Niño and La Niña -
 Variability in the tropical oceans - Monitoring and prediction of El Niño and La Niña - Jun ichi HIROSAWA Climate Prediction Division Japan Meteorological Agency SST anomaly in Nov. 1997 1 ( ) Outline
CHANGE OF THE BRIGHTNESS TEMPERATURE IN THE MICROWAVE REGION DUE TO THE RELATIVE WIND DIRECTION
 JP4.12 CHANGE OF THE BRIGHTNESS TEMPERATURE IN THE MICROWAVE REGION DUE TO THE RELATIVE WIND DIRECTION Masanori Konda* Department of Geophysics, Graduate School of Science, Kyoto University, Japan Akira
Monitoring Conditions Offshore with Satellites
 Downloaded from orbit.dtu.dk on: Dec 15, 2017 Monitoring Conditions Offshore with Satellites Karagali, Ioanna; Hasager, Charlotte Bay; Badger, Merete; Bingöl, Ferhat; Ejsing Jørgensen, Hans Publication
Denise L Seman City of Youngstown
 Denise L Seman City of Youngstown The control chart is one of the most important tools of quality control for laboratory data. A control chart is a specific kind of run chart that allows unusual change
7 YEARS METEOMAST AMRUMBANK WEST
 7 YEARS METEOMAST AMRUMBANK WEST Joerg Bendfeld(1), Jens Krieger(2) (1) University of Paderborn, Kompetenzzentrum für nachhaltige Energietechnik KET, Pohlweg 55, 33098 Paderborn, Germany, (2) airwerk GmbH,
Global Warming and Tropical Cyclone Activity in the western North Pacific/ Thermodynamic Controls on Intense TCs
 Global Warming and Tropical Cyclone Activity in the western North Pacific/ Thermodynamic Controls on Intense TCs Johnny Chan Guy Carpenter Asia-Pacific Climate Impact Centre City University of Hong Kong
Naval Postgraduate School, Operational Oceanography and Meteorology. Since inputs from UDAS are continuously used in projects at the Naval
 How Accurate are UDAS True Winds? Charles L Williams, LT USN September 5, 2006 Naval Postgraduate School, Operational Oceanography and Meteorology Abstract Since inputs from UDAS are continuously used
Ocean Wave Forecasting
 Ocean Wave Forecasting Jean-Raymond Bidlot* Marine Prediction Section Predictability Division of the Research Department European Centre for Medium-range Weather Forecasts (E.C.M.W.F.) Reading, UK * With
A Global Climatology of Wind Wave Interaction
 JUNE 2010 H A N L E Y E T A L. 1263 A Global Climatology of Wind Wave Interaction KIRSTY E. HANLEY AND STEPHEN E. BELCHER Department of Meteorology, University of Reading, Reading, United Kingdom PETER
An Overview of 20 th Century Warming and Climate Variability in the Western U.S.
 An Overview of 20 th Century Warming and Climate Variability in the Western U.S. Alan F. Hamlet, Philip W. Mote, Nate Mantua, Dennis P. Lettenmaier JISAO/CSES Climate Impacts Group Dept. of Civil and Environmental
LONG- TERM CHANGE IN PRE- MONSOON THERMAL INDEX OVER CENTRAL INDIAN REGION AND SOUTH WEST MONSOON VARIABILITY
 LONG- TERM CHANGE IN PRE- MONSOON THERMAL INDEX OVER CENTRAL INDIAN REGION AND SOUTH WEST MONSOON VARIABILITY *S.S. Dugam Indian Institute of Tropical Meteorology, Pune-411008 *Author for Correspondence
TRIAXYS Acoustic Doppler Current Profiler Comparison Study
 TRIAXYS Acoustic Doppler Current Profiler Comparison Study By Randolph Kashino, Axys Technologies Inc. Tony Ethier, Axys Technologies Inc. Reo Phillips, Axys Technologies Inc. February 2 Figure 1. Nortek
MAR 110 LECTURE #20 Storm-Generated Waves & Rogue Waves
 MAR 110 LECTURE #20 Storm-Generated Waves & Rogue Waves Wave Principles Review Figure 20.1 Wave Principles (ABOVE) A simple ocean surface wave is a sea level distortion that repeats itself over a distance
Validation Study of the Lufft Ventus Wind Sensor
 Weather Forecasts Renewable Energies Air and Climate Environmental Information Technology METEOTEST Cooperative Fabrikstrasse 14, CH-3012 Bern Tel. +41 (0)31 307 26 26 Fax +41 (0)31 307 26 10 office@meteotest.ch,
Oceans - Laboratory 12
 Oceans - Laboratory 12 (Name) How do ocean waves form? All waves are disturbances of a fluid medium through which energy is moved (Davis, 1997). Ocean waves travel on the interface between oceans and the
Constraining a global, eddying, ocean and sea ice model with scatterometer data
 Constraining a global, eddying, ocean and sea ice model with scatterometer data D. Menemenlis, H. Zhang, D. Moroni, and S. Hristova-Veleva IOVWST, Utrecht, Netherlands, 13 June 2012 QuikSCAT GRACE =? Jason
Characterizing Ireland s wave energy resource
 Snapshots of Doctoral Research at University College Cork 2011 Characterizing Ireland s wave energy resource Brendan Cahill Hydraulics & Maritime Research Centre, UCC Introduction In theory, the energy
BILLY BISHOP TORONTO CITY AIRPORT PRELIMINARY RUNWAY DESIGN COASTAL ENGINEERING STUDY
 Bâtiment Infrastructures municipales Transport Industriel Énergie Environnement BILLY BISHOP TORONTO CITY AIRPORT PRELIMINARY RUNWAY DESIGN COASTAL ENGINEERING STUDY N. Guillemette 1, C. Glodowski 1, P.
Waves. Types of Waves. Parts of a wave. Insert wind_wave.wmv. Shark attack
 Waves Recall: Waves = transmitted energy What causes waves? Wind gravity Earthquakes We will talk about all of these, but first Insert wind_wave.wmv Shark attack Types of Waves Body waves transmit energy
WMS 8.4 Tutorial Hydraulics and Floodplain Modeling HY-8 Modeling Wizard Learn how to model a culvert using HY-8 and WMS
 v. 8.4 WMS 8.4 Tutorial Hydraulics and Floodplain Modeling HY-8 Modeling Wizard Learn how to model a culvert using HY-8 and WMS Objectives Define a conceptual schematic of the roadway, invert, and downstream
Vibration of floors and footfall analysis
 Webinar Autodesk Robot Structural Analysis Professional 20/04/2016 Vibration of floors and footfall analysis Artur Kosakowski Rafał Gawęda Webinar summary In this webinar we will focus on the theoretical
Nanortalik A preliminary analysis of the wind measurements rev 1
 Nanortalik A preliminary analysis of the wind measurements rev 1 Introduction Note pr 14.08.2009 Tove Risberg, Kjeller Vindteknikk AS A 50 m met mast has been measuring the wind speed at Nanortalik Heliport
Exploring the Wind and Wave Climate in the Great Lakes
 Exploring the Wind and Wave Climate in the Great Lakes R.E. Jensen USACE ERDC Coastal and Hydraulics Laboratory 14 th Waves Workshop 8-13 November 2015 Key West, FL Setting / Motivation North America US:
Wind Resource Assessment Østerild National Test Centre for Large Wind Turbines
 Downloaded from orbit.dtu.dk on: Jan 21, 2018 Wind Resource Assessment Østerild National Test Centre for Large Wind Turbines Hansen, Brian Ohrbeck; Courtney, Michael; Mortensen, Niels Gylling Publication
Field Evaluation of the Wave Module for NDBC s New Self-Contained Ocean Observing Payload (SCOOP) on Modified NDBC Hulls
 on Modified NDBC Hulls") Field Evaluation of the Wave Module for NDBC s New Self-Contained Ocean Observing Payload (SCOOP) on Modified NDBC Hulls Richard H. Bouchard 1, Rodney R. Riley 1, Lex A. LeBlanc 1, Michael Vasquez 1, Michael
Field Evaluation of the Wave Module for NDBC s New Self-Contained Ocean Observing Payload (SCOOP) on Modified NDBC Hulls Richard H. Bouchard 1, Rodney R. Riley 1, Lex A. LeBlanc 1, Michael Vasquez 1, Michael
Tropical Pacific Ocean remains on track for El Niño in 2014
 1 of 10 3/06/2014 3:33 PM ENSO Wrap-Up Current state of the Pacific and Indian Ocean Tropical Pacific Ocean remains on track for El Niño in 2014 Issued on Tuesday 3 June 2014 Product Code IDCKGEWWOO The
Crew Transfer Vessel (CTV) Performance Benchmarking. Presented by Stephen Phillips of Seaspeed Marine Consulting Ltd
 Performance Benchmarking. Presented by Stephen Phillips of Seaspeed Marine Consulting Ltd") Crew Transfer Vessel (CTV) Performance Benchmarking Presented by Stephen Phillips of Seaspeed Marine Consulting Ltd BACKGROUND - CT OWA : The Carbon Trust Offshore Wind Accelerator (OWA) brings together
Crew Transfer Vessel (CTV) Performance Benchmarking Presented by Stephen Phillips of Seaspeed Marine Consulting Ltd BACKGROUND - CT OWA : The Carbon Trust Offshore Wind Accelerator (OWA) brings together
Intersatellite Calibrated HIRS Upper Tropospheric Water Vapor
 Intersatellite Calibrated HIRS Upper Tropospheric Water Vapor Lei Shi and John J. Bates NOAA National Climatic Data Center Asheville, North Carolina, U.S.A. 1 NOAA National Climatic Data Center ITSC-XVI
Recent Changes in Wind Chill Temperatures at High Latitudes in North America
 University of Massachusetts Amherst From the SelectedWorks of Raymond S Bradley 2001 Recent Changes in Wind Chill Temperatures at High Latitudes in North America H. F Keimig Raymond S Bradley, University
Wind Stress Working Group 2015 IOVWST Meeting Portland, OR
 Wind Stress Working Group 2015 IOVWST Meeting Portland, OR Summary of Research Topics, Objectives and Questions James B. Edson University of Connecticut SPURS Mooring, Farrar, WHOI Background Motivation
Dynamics and variability of surface wind speed and divergence over mid-latitude ocean fronts
 Dynamics and variability of surface wind speed and divergence over mid-latitude ocean fronts Larry O Neill 1, Tracy Haack 2, and Simon de Szoeke 1 1 Oregon State University, Corvallis, OR 2 Naval Research
Wave research at Department of Oceanography, University of Hawai i
 Wave research at Department of Oceanography, University of Hawai i Hawaii wave climate. Directional waverider buoys around Hawaii. Past and present wave-related research projects. Effect of tides on wave
Evaluation of four numerical wind flow models
 EWEA Resource Assessment Workshop 2013 Evaluation of four numerical wind flow models Michael C. Brower, PhD Chief Technical Officer Jose Vidal, MSc Consulting Services Europe & Latin America Manager Philippe
Grade: 8. Author(s): Hope Phillips
: Hope Phillips") Title: Tying Knots: An Introductory Activity for Writing Equations in Slope-Intercept Form Prior Knowledge Needed: Grade: 8 Author(s): Hope Phillips BIG Idea: Linear Equations how to analyze data from
Title: Tying Knots: An Introductory Activity for Writing Equations in Slope-Intercept Form Prior Knowledge Needed: Grade: 8 Author(s): Hope Phillips BIG Idea: Linear Equations how to analyze data from