PEDESTRIAN-INDUCED BRIDGE RESPONSE. periodic pedestrian loads SAMUEL DAVID ROGERS. A thesis submitted to the Department of Civil Engineering
|
|
|
- Gerard Strickland
- 5 years ago
- Views:
Transcription
1 PEDESTRIAN-INDUCED BRIDGE RESPONSE Using a modal response model to predict the vibrations of a bridge when subjected to periodic pedestrian loads By SAMUEL DAVID ROGERS A thesis submitted to the Department of Civil Engineering in conformity with the requirements for the degree of Master of Applied Science Queen s University Kingston, Ontario, Canada April 2010 Copyright Samuel David Rogers 2010
2 Abstract The availability and use of new materials and construction techniques are allowing bridges to be built that are longer and more slender to those that have been constructed in the past. This can cause bridges to have lower stiffness and damping, and thus be less able to resist dynamic effects. This is of special concern for pedestrian bridges, because the harmonic loads that pedestrians apply to the bridge have the potential to excite the bridge s natural frequencies. In addition, pedestrians can be sensitive to these vibrations. A model was developed in order to better understand the effects that a pedestrian can have on these vibration-prone bridges. The model consisted of two parts: a finite element model that used the structural data for the bridge in order to produce mass-normalized mode shapes, and a bridge-pedestrian interaction program that used the structural and modal data, along with pedestrian loading scenarios, to generate the bridge response. A parametric study of two bridges was conducted. The bridges included: a short span bridge that would not be expected to respond excessively to pedestrian loads, and a long-span, lively bridge that had natural frequencies in the range of pedestrian loading. Many loading cases were examined by varying the following parameters: load case, number of pedestrians, damping, and pacing frequency. The modal solution was an effective method of finding the bridge responses. It was determined that pedestrian loads can be represented by a simple constant plus sinusoidal load. The excessive vibrations of long and slender bridges could be addressed by increasing damping on susceptible modes. - ii -
3 Acknowledgements Many people were directly or indirectly responsible for the completion of this thesis. Many thanks to: Mark Green, for his patience and technical guidance; My family, for their support and love; My friends, for making my time here so enjoyable; Queen s University, the Ontario government, and the Federal government for funding my project; and Anyone else who influenced me along this journey. - iii -
4 Table of Contents Abstract... ii Acknowledgements... iii Table of Contents... iv List of Tables... vii List of Figures...viii Acronyms and Abbreviations... xi Chapter 1.0: Introduction Objectives Outline...2 Chapter 2.0: Literature Review Introduction Footbridge dynamics General Code Natural Frequency Damping Pedestrian loads General Pedestrian Forces Pedestrian Modelling Bridge pedestrian interaction Serviceability Acceleration of Pedestrian Summary...19 Chapter 3.0: Modelling Introduction Finite Element Program Bridge Modelling Mode Shapes Bridge Pedestrian Interaction Bridge Modelling Solving equation of motion Program Summary...27 Model Verification iv -
5 Modal Analysis...29 Load Parameters...31 Constant Load...32 Harmonic Loads...33 Pedestrian Loads...36 Conclusion...38 Chapter 4.0: Parametric Study Parametric Study Bridges First Parametric Study Bridge Second Parametric Study Bridge Finite Element Models FEM Model of First Parametric Study Bridge FEM Model of Second Parametric Study Bridge Parametric Study Constants Pedestrian Speed / Frequency Bridge Damping Number of Pedestrians...49 Chapter 5.0: Results and Discussion First Parametric Study Bridge Results Second Parametric Study Bridge Response to Constant Load Response to Harmonic Load Response to Constant Plus Harmonic Load Pedestrian Load Comparing Loads Multiple Loads 1.0 m/s Four and Eight Pedestrians Varying Number of Pedestrians Damping Results Results of Study Serviceability limits Damping v -
6 5.6 Discussion...78 Chapter 6.0: Conclusions Summary Conclusions Recommendations for future work...81 Chapter 7.0: List of References Appendix A: Modal Data Appendix B: Finite Element Modelling Coordinate Systems (SAP2000 Manual)...89 Frame / Cable Element (SAP2000 Manual)...89 The Plane Element (Subset of Shell Element)...91 Appendix C: Material Data GFRP Section (Strongwell 2009)...94 Kevlar (Dupont 2009) vi -
7 List of Tables Table 2-1: Damping Ratios for Different Materials (Bachmann et al., 1995)... 8 Table 2-2: Dynamic load factors for pedestrian forces Table 4-1: Bridge Data for FEM's Table 4-2: Material data for first parametric study bridge Table 4-3: Material, shape, and element used for each member Table 4-4: Parametric Study Variables Table 5-1: Parametric Study Variables for RMC Bridge Table 5-2: Parametric Study Results for Second Bridge Table A-1: Modal data for test bridge Table A-2: Modal data for first parametric study bridge (RMC) Table A-3: Mode shape data for second parametric study bridge (Aberfeldy) vii -
8 List of Figures Figure 2-1: Fundamental Frequency of 67 footbridges vs. span length (Bachman, 2002)... 7 Figure 2-2: Aggregate walking time histories (vertical, lateral and longitudinal directions) (Zivanovic et al., 2005) Figure 2-3: Vertical Forces from Walking and Running (Wheeler, 1982) Figure 2-4: Feedback mechanism for lock-in effect (Craighead 2008) Figure 2-5: Serviceability Limit Criteria (CHBDC 2006 Cl ) Figure 2-6: Serviceability Deflection Limits (CHBDC 2006 Cl ) Figure 2-7: Serviceability limits for a pedestrian footbridge (CHBDC 2006 Cl ) Figure 3-1: Information flow through models Figure 3-2: Finite element model of bridge (undeformed shape) Figure 3-3: Schematic of FEM and Bridge - Pedestrian Model... Error! Bookmark not defined. Figure 3-4: Cross section of model verification bridge Figure 3-5: 1 st Mode Shape of test bridge (2D) Figure 3-6: Mode shapes 1-3 of test bridge Figure 3-7: Mode Shapes 4 and 5 of test bridge Figure 3-8: Predicted and theoretical response due to constant load Figure 3-9: Predicted and theoretical response to due harmonic load Figure 3-10: Predicted and theoretical response due to harmonic load at natural frequency Figure 3-11: Harmonic loads at 30.0 rad/s and 21.5 rad/s Figure 3-12: Constant plus Harmonic Load and Pedestrian Load Figure 3-13: Bridge response to constant plus harmonic and pedestrian loads Figure 4-1: The Aberfeldy Footbridge (Skinner 2009) Figure 4-2: FEM of first parametric study bridge viii -
9 Figure 4-3: First parametric study bridge mode shapes Figure 4-4: First Parametric study bridge mode shapes Figure 4-5: Cross section of parametric study bridge (Cadei and Stratford 2002) Figure 4-6: Parametric Study Bridge Figure 4-7: Mode 1 of parametric study bridge Figure 4-8: Mode shapes 1-3 of parametric study bridge Figure 4-9: Mode shapes 4-5 of parametric study bridge Figure 5-1: Midpoint response Figure 5-2: Free vibration at midpoint Figure 5-3: Constant Load moving over bridge Figure 5-4: Midpoint response (50 to 60 seconds) Figure 5-5: Free vibration Figure 5-6: Response under load Figure 5-7: Acceleration of constant load Figure 5-8: Midpoint deflection due to harmonic load Figure 5-9: Midpoint response from 50 to 60 seconds Figure 5-10: Midpoint response from 100 to 120 seconds Figure 5-11: Response under harmonic load Figure 5-12: Acceleration of harmonic load Figure 5-13: Midpoint response due to constant plus harmonic load Figure 5-14: Midspan deflection due to pedestrian load Figure 5-15: Peak midspan deflection, between 50 and 60 seconds, due to pedestrian load Figure 5-16: Free vibration (110 seconds) at midspan due to pedestrian load Figure 5-17: Midspan Deflection of three load cases ix -
10 Figure 5-18: Midspan deflection due to four pedestrians Figure 5-19: Midspan deflection due to eight pedestrians Figure 5-20: Midspan Deflection from 1, 4 and 8 pedestrians Figure 5-21: Midpoint deflection for three damping cases Figure 5-22: Effect of damping on free vibration Figure 5-23: Effect of changing number of pedestrians (0% damping) Figure 5-24: Effect of damping at v = 1.2 m/s Figure 5-25: Damping required to meet serviceability Figure 5-26: Effect of damping (8 pedestrian load case) Figure B-1: Frame element coordinate angle with respect to global coordinates Figure B-2: Calculating shear areas for frame element Figure B-3: Shell element joint connectivity Figure B-4: Plate element mesh examples x -
11 Acronyms and Abbreviations 2D Two-dimensional 3D Three-dimensional a acceleration, m/s 2 CHBDC Canadian Highway Bridge Design Code (CSA-S6-06) DLF Dynamic load factor DOF Degree of freedom FEM Finite element modelling FEA Finite element analysis f n n th flexural frequency, Hz FRP Fibre-reinforced polymer G The weight of a load or pedestrian (N) Hz Hertz m Metre m/s Metre per second N Newton Rad Radians s Second - xi -
12 w s maximum static deflection due to a vertical force of 700N i the Fourier coefficient, or dynamic load factor (DLF) of the i th harmonic (Kappa) configuration factor from CHBDC 2006 i the phase shift of the i th harmonic dynamic response factor, from CHBDC xii -
13 Chapter 1.0: Introduction New and innovative construction materials, such as fibre-reinforced polymers (FRP s) are being used more often for structural applications. These materials are often lighter than traditional construction materials such as steel and concrete, and have other beneficial properties that make them ideal for bridges in particular. At the same time, structural engineers are developing and using more sophisticated design software and techniques that allow for more complicated structures to be built. A side effect of this is that bridges can be lighter and longer than before. This is especially true for pedestrian bridges, which are not generally required to resist large static loads that would be experienced on a highway bridge. In general, when bridges become longer and lighter, their natural frequencies decrease. This can put them at risk of increased vibration as their natural frequencies are closer to excitation frequencies. Lighter structures also have less natural damping, further increasing this effect. When long and slender pedestrian bridges are designed, care must be taken that pedestrians do not cause excessive vibrations that can cause discomfort, or potentially structural failure. There have been recent examples, such as the Millenium Footbridge in London, England (which will be discussed in subsequent chapters) where this has happened to newly constructed footbridges, and expensive retrofits were required to rehabilitate the bridges. 1.1 Objectives The main goal of the study was to develop, and verify, a model that could be used to predict the response of a footbridge to different pedestrian loading scenarios. The model could - 1 -
14 then be used to determine if a modal analysis could be used to predict bridge responses, especially for lively bridges that could be susceptible to large vibrations. Key questions to be answered include: Does the horizontal motion of the pedestrian contribute to the vertical motion of the bridge; How does changing damping affect the motion of the bridge; What is the effect of adding multiple pedestrians to the model; How do different pedestrian models compare; and Does the CHBDC 2006 offer a reasonable approximation of a pedestrian load. 1.2 Outline The outline of the thesis, by chapter, is as follows. Chapter 2: Literature Review o Review the relevant literature, including bridge design codes; Chapter 3: Modelling o Develop a pedestrian force model that could be compared to other models, including simple harmonic loads; o Use a finite-element program to model a pedestrian bridge, and extract mass-normalized mode shapes; - 2 -
15 o Using a modal solution, as part of a bridge-pedestrian interaction program, to predict bridge responses; o Verify the solutions against known modal solutions; Chapter 4: Parametric study o Conduct a parametric study to observe the effects of varying the loading case and bridge parameters, including: A short-span bridge where excessive dynamic effects would not be expected; A long-span, lively bridge with natural frequencies in the range of pedestrian pacing frequency; and Chapter 5: Results and discussion o Analyze the generated data and comment on the meaning of the results. Chapter 6: Conclusions - 3 -
16 Chapter 2.0: Literature Review 2.1 Introduction This chapter reviews the literature concerning the dynamic behaviour of footbridges under the influence of pedestrian loads. Factors affecting the behaviour of these bridges are discussed, as well as the loads produced by pedestrians. Finally, literature concerning the interaction between pedestrians and footbridges is reviewed. 2.2 Footbridge dynamics General Footbridges are subjected to relatively small static loads when compared to vehicle bridges; people weigh far less than cars and trucks. As such, footbridges are usually slender when compared to other bridges, an aspect that may lead to greater vibration responses when they are subjected to dynamic loads (Paz, 1997). In some cases, a long slender bridge will have a natural frequency in the same range of the frequency of a walking or running pedestrian. Coupled with a tendency towards using stronger, lighter materials, many newer footbridges are naturally more susceptible to dynamic effects. If these dynamic effects are not considered, they can lead to accelerations and movement beyond the human comfort level. In severe cases, failure may occur (Wolmuth et al., 2003) One of the more celebrated and recent examples of extreme footbridge vibration is the Millennium Footbridge. The Millennium Footbridge was constructed to span the Thames River in central London, and had a total span of 332m (Fitzpatrick, 2001). After it opened on June 10, 2000, the bridge had to be closed immediately, due to excessive lateral vibration - 4 -
17 caused by the initial crowd (Dallard et al., 2001). The excessive motion happened because the first lateral mode of the bridge was at a low frequency of 0.49 Hz (Dallard, 2001). This lower frequency is typical of long and slender bridges, and it is also close to the lateral frequency of a pedestrian s natural footstep. The vibrations were exacerbated by the fact that the pedestrians on the bridge began to pace at the same rate as the natural vibration, a phenomenon known as lock-in effect that will be explored further in section In the end, the Millennium Bridge was retrofitted with a system that included thirty-seven linear viscous dampers and over fifty tuned mass vibration dampers (Newland, 2003). This reduced the vibrations of the susceptible mode, and the bridge is currently open for pedestrian traffic. This effect is by no means unique. A similar effect occurred in Ottawa, Ontario, Canada on a 100-year old pedestrian bridge due to crowd loading by people watching fireworks on Canada Day (Dallard 2001). Sophisticated new construction materials, such as fibre-reinforced polymers (FRPs), are able to withstand larger and larger stresses under static loads (Firth, 2002). This leads to more slender structures that have greater span lengths and smaller cross sectional areas (Bachmann, 2002). As a consequence, these structures have decreased mass and stiffness. The reduction in stiffness will (in most cases) lead to lower natural frequencies with a greater degree of resonance. The reduced mass means that the energy introduced by dynamic action has a greater effect and leads to higher vibration amplitudes Code The Canadian Highway Bridge Design Code (CHBDC CSA-S6-06) gives serviceability requirements designed to limit vibrations to levels acceptable by pedestrians. The basic criterion is that a single pedestrian weighing 700 N should not produce an acceleration - 5 -
18 exceeding the limit given in the code as a function of the first natural frequency of the structure. In lieu of a full dynamic analysis, the acceleration can be approximated using the following equation, which is valid for bridges with up to three spans: 2 a 4 f ws, where: 1 a = acceleration, m/s 2 f 1 = first flexural frequency, Hz w s = maximum static superstructure deflection due to a vertical force of 700N = configuration factor from CHBDC 2006 = dynamic response factor, from CHBDC 2006 Footbridges may vibrate vertically, longitudinally or laterally. To avoid problems with coupling of these modes, a frequency separation between the first flexural frequency of the footbridge and its lateral and longitudinal frequencies must be maintained. Lateral and longitudinal frequencies should be designed so they are not less than 1.5 times the first flexural frequency of the bridge. The frequencies should also be kept over 4 Hz, to avoid resonance from pedestrian loads. The CHBDC 2006 recommends that footbridges with natural frequencies of less than 4 Hz be given special consideration in design, with a detailed analysis warranted if the bridge is to be used extensively by joggers. A number of bridges, including the Millennium footbridge in London and the Interprovincial Bridge in Ottawa (Dallard, 2001) have experienced large sway vibrations at frequencies of 0.7 to 1.1 Hz. The CHBDC 2006 recommends designing bridges such that their first lateral - 6 -
19 natural frequency is out of the range of Hz. Alternatively, a strategy to mitigate unacceptable sway vibration must be developed during the design stage Natural Frequency Several factors determine a footbridge s natural frequency. Construction material, design, mass, and span length are all decisive factors. Of these, span length is often the most important. Figure 2-1 shows typical natural frequencies as a function of span length. Footbridges with longer spans (over 25m) tend to have natural frequencies of 1.5 to 4 Hz, which is in the range of pedestrian excitations. Special care must be taken when designing these bridges. Figure 2-1: Fundamental Frequency of 67 footbridges vs. span length (Bachman, 2002) Damping Footbridges often have small damping, often less than 1% of critical (Weber, 2002). At small amplitudes, damping is provided by the visco-elastic behaviour of the material. At higher - 7 -
20 amplitudes, damping is increased by friction at connections and supports (Weber, 2002). Footfall-induced vibration may be significant, leading to large accelerations, especially when the bridge s natural frequency matches or is close to pacing frequencies. With the introduction of lighter materials, bridges may be constructed with materials that have less relative mass and stiffness, and thus are less able to naturally resist vibrations. Concrete footbridges, for example, have higher damping ratios and smaller responses when subjected to dynamic loads than steel or composite bridges. This is illustrated in Table 2-1. In the absence of more precise information, values for damping may be assumed. Steel structures have an assumed damping of 0.5%, composite concrete-steel superstructures a value of 0.6%, and prestressed or reinforced concrete superstructures a value of 0.8% (Weber, 2002). Table 2-1: Damping Ratios for Different Materials (Bachmann et al., 1995) In cases where excessive vibrations are expected, stiffeners or tuned-mass dampers may be added to structures to increase damping. The stiffeners and dampers are calibrated to dissipate energy from a specific frequency, usually corresponding to the first fundamental frequency of the bridge. Such a procedure was performed on the London Millennium Bridge to control excessive lateral deflection (Fitzpatrick et al., 2001)
21 2.3 Pedestrian loads General Dynamic effects on footbridges stem mainly from walking or running pedestrians. The actions of other pedestrians, such as cyclists or rollerbladers, have a relatively small dynamic component (Bachmann, 2002). Another type of loading, vandal loading, is produced when a pedestrian or group of pedestrians rhythmically jump or sway in order to produce vertical or lateral vibrations. Vandal loading is not generally accounted for in bridge designs, due to the difficulty of modelling the actions (i.e. swaying, jumping, etc.) Most design requirements are based on walking and running pedestrians Pedestrian Forces Pedestrians produce a dynamic time-varying force with vertical, lateral and longitudinal components. These forces vary according to step frequency, step length, speed, and other parameters. Typical force time relationships for these components, based on average walking speed, are given in Figure 2-2. Of these, the vertical component has been investigated the most, because it has the highest magnitude. An example of how the forces exerted by pedestrians change based on their speed can be observed in Figure 2-3, ranging from a slow walk to a sprint
22 Figure 2-2: Aggregate walking time histories (vertical, lateral and longitudinal directions) (Zivanovic et al., 2005)
23 Figure 2-3: Vertical Forces from Walking and Running (Wheeler, 1982) The fact that pedestrians apply two separate forces (right and left foot) at different locations can make it difficult to insert force data in a model. To overcome this obstacle, the forces are combined to get a single, continuous force. During walking, there are periods where the footfalls overlap; i.e. both feet are in contact with the ground at the same time. During running, each footfall is separate, and there are intervals where neither foot is in contact with the ground. Because every human has different, height, weight, stride length, and other characteristics, determining a consistent pacing frequency is difficult. Several researchers have attempted to quantify this. In a study of 505 people, researchers concluded that pacing frequencies followed a normal distribution with a mean pacing rate of 2.0 Hz and a standard deviation of
24 0.173 Hz (Matsumoto et al., 1972). Other researchers (Kerr et al., 2001) have obtained similar values. Standard frequencies for walking, running and jumping have been proposed and are generally accepted. Typical pacing, running and jumping frequencies are 1.4 to 2.4 Hz, 1.9 to 3.3 Hz, and 1.4 to 3.4 Hz, respectively (Bachmann 2002) Pedestrian Modelling To apply the measured dynamic forces of a pedestrian to an analysis it is necessary to create a valid model. There are two general approaches to this task; using time or frequency domain models. In general, time models are more prevalent. In any case, creating a valid model can be difficult for a number of reasons, including (Zivanovic et al., 2005): 1. There are many different types of human-induced forces, changing in both time and space; 2. Forces are dependent on a variety of parameters; 3. The influence of several people and their degree of synchronization is difficult to generalize; and 4. Perception can alter the force applied by pedestrians because people behave differently on more lively footbridges. Despite these factors, several pedestrian force models have been developed. They are based on assumptions that deal with the problems outlined above. Time domain models for walking and running are based on the assumption that both feet produce identical periodic forces. The following Fourier series can be used to represent the periodic forces generated by a walking pedestrian (Bachmann et al., 1995):
25 p n F ( t) G G sin(2 if t ) i 1 i p i Where: G = the person s weight (N) i = the Fourier coefficient, or dynamic load factor (DLF) of the i th harmonic f p = the first fundamental frequency (Hz) i = the phase shift of the i th harmonic i = the order of the harmonic n = the total number of contributing harmonics Several researchers have attempted to quantify the Fourier coefficients, which form the basis for the perfectly periodic pedestrian model. Blanchard et al. (1977) proposed a simple walking model based on resonance at the first fundamental frequency with a vertical DLF of and a pedestrian weight of 700N. This was valid for footbridges with a vertical fundamental frequency up to 4Hz. At higher frequencies, some reduction factors were applied. Bachmann and Ammann (1987) reported the first 5 harmonics for vertical, lateral and longitudinal walking forces. This was followed by research that showed that DLFs exhibited correlation with the frequency of the activity (Rainer et al., 1988). The researchers presented DLFs for the first four harmonics for walking, running, and jumping. Their research was based on only three subjects, so there is some question regarding statistical relevancy. Young (2001) tabulated their work, as well as the work done by some other
26 researchers. Based on his research, he was able to propose DLFs based on the frequency of the activity. The values for DLFs are tabulated below in Table 2-2. Table 2-2: Dynamic load factors for pedestrian forces Authors Dynamic Load Factors Comment Blanchard al. (1977) et For frequencies between 4 and 5 Hz, some reduction factors are applied Bachmann et Values for 2.0 / 2.4 Hz al. (1987) Rainer et al. (1988), DFLs are frequency 1 2, 3, 4 dependent Young (2001) 0.41 f ; f Hz f ; f Hz 2 Values are frequency dependent f ; f Hz f ; f Hz 4 Some work has been conducted in an attempt to quantify the effect that groups of pedestrians have on the Dynamic Load Factors. Unfortunately, the research is mainly confined to floor structures, as opposed to pedestrian bridges. DLFs tend to decrease as the number of people increase, due to imperfect synchronization. For example, people jumping
27 in groups of two, four, six, and eight produce an lower DLFs than people jumping alone (Rainer et al., 1988). The first harmonic, however, was approximately the same. Another approach to modelling pedestrians is to use a frequency domain force model. Frequency domain modelling addresses the fact that human walking cannot be perfectly periodic, and thus cannot be accurately described using a time domain force model. The frequency domain method is based on the assumption that pedestrians can be treated as a stationary random process. Some preliminary models for frequency domain estimations of structural responses to walking pedestrians have been developed (Brownjohn, 2004). The CHBDC 2006 treats pedestrians as a moving harmonic forcing function. The code specifies that the pedestrian walk at a rate of f f, which is the lesser of the first flexural frequency or 4 Hz (4 Hz being the upper footfall frequency for joggers). The pedestrian is assumed to move at the least of 2.5 m/s or 0.9 f 1 m/s, where the latter represents the fundamental frequency of the bridge. The pedestrian is modelled using a prescribed footfall impulse, or a pulsating point load of 180N, which is approximately equal to the fluctuating portion of the footfall approach Bridge pedestrian interaction Pedestrians can exert considerable dynamic forces on bridges. As early as 1831, the failure of a footbridge in Broughton, UK was attributed to dynamic forces caused by sixty soldiers marching in step (Tilly et al., 1982). This event prompted the placement of notices on many bridges advising soldiers to break step while crossing. The large lateral vibrations experienced by the Millennium footbridge in London also highlight the effects that pedestrians may have on footbridges (Dallard, 2001). In almost all reported problems with
28 lively footbridges, excessive vibrations were caused by resonance at one or more mode of vibration (Wolmuth, 2003). An interesting phenomenon that can occur when groups of pedestrians walk over a bridge is synchronization. There are several possible causes of synchronization. First, pedestrians may naturally assume the same gait as those they are walking with. This is especially true when crowd densities are very high (Dallard et al., 2001), because pedestrians are restricted in their motions. Second, pedestrians may naturally adjust their pace in response to bridge vibrations if certain serviceability thresholds are exceeded (Bachmann 2002). This is referred to as lock-in effect. As people synchronize with the vibration of the bridge, they cause an increase in vibrations, which causes more people to synchronize with the bridge, etc. This is especially prevalent for bridges with their natural frequencies at or near average pacing frequency. The lock-in effect, including the feedback mechanism, is illustrated in Figure 2-4. Pedestrians Vibration Vibration More Pedestrians Figure 2-4: Feedback mechanism for lock-in effect (Craighead 2008)
29 2.3.5 Serviceability Acceleration of Pedestrian When a pedestrian experiences large vibrations, serviceability concerns may arise. While the vibrations may not indicate structural weakness, they can cause concern to people walking over a lively bridge. If the vibrations are too high, pedestrians may avoid using the bridge. More research has been done in this area on floors than bridges. Some serviceability limits are summarized in Figure 2-5 and Figure 2-6. For pedestrian footbridges, the acceleration limit is based on the first fundamental frequency of the bridge. The relationship is shown in Figure 2-7. Figure 2-5: Serviceability Limit Criteria (CHBDC 2006 Cl )
30 Figure 2-6: Serviceability Deflection Limits (CHBDC 2006 Cl )

31 Figure 2-7: Serviceability limits for a pedestrian footbridge (CHBDC 2006 Cl ) 2.4 Summary The interaction between pedestrians and bridges is an interesting subject matter that warrants further exploration. Technological and design innovation are allowing longer and more slender bridges to be built. This also makes the bridges more susceptible to dynamic effects. A method for analyzing these bridges will be presented in subsequent chapters. Of particular interest is the effects of changing the pedestrian model from that recommended by CHBDC, and the more comprehensive pedestrian force models discussed in Table 2-2. Also, the applicability of using a modal solution, as compared to the CHBDC recommendations in section 2.2.2, should be investigated. Finally, cases where considering the first mode does not give the worst-case scenario, as prescribed in the CHBDC 2006, will be explored
32 Chapter 3.0: Modelling 3.1 Introduction In order to generate meaningful results, care must be taken to ensure that the models that are developed have a reasonable level of accuracy. The general goal is to input the type of load that will traverse the bridge, along with pertinent material and structural data. The output is a set of bridge and pedestrian reactions, from which conclusions can be derived. In this case, the midpoint deflection of the bridge, the deflection underneath the moving pedestrian, and the acceleration experienced by the pedestrian were found. The deflections can be used to compare different cases; for example, the increase or decrease in deflection due changing the damping on the bridge. The acceleration of the pedestrian can be used to determine serviceability conditions; if the accelerations are large enough, they can be perceived by the pedestrian and cause discomfort, and may cause pedestrians to avoid crossing the bridge altogether. Two models were used to describe the interaction between the pedestrians and bridges. First, a finite-element program was used to model the structure of the bridge. Once the bridge model was complete, it was used to generate mode shapes, and corresponding frequencies, for each bridge. Subsequently a bridge pedestrian interaction program was then used to model the interaction between the pedestrian and the bridge. This program combined the modal and structural information from the FEM model with various load cases to determine the bridge s reactions. A general flow of the inputs and outputs, as well as how both models were used, is shown in Figure 3-1. Both models are discussed in further detail below
33 Bridge Data: Shape of members and structure Material data for members and components Meshing tools FEM FEM Output Natural frequencies and associated mode shapes Bridge Pedestrian model Load Data Load forces Period of motion Number of loads Results Midpoint deflection Acceleration of load Deflection under load Figure 3-1: Information flow through models 3.2 Finite Element Program Finite element modeling is a numerical technique for finding approximate solutions to complex systems and / or equations. To find the solution to the complex problem, such as a vibrating bridge, the solution is approximated into smaller components with easier to solve equations of motion. For a bridge, instead of attempting to solve the partial differential equation of the vibrating structure, the bridge is separated into smaller, discrete parts whose interaction can be solved by algebraic equations. These equations can be solved and numerically integrated to develop an approximate solution
34 To create the finite element models (FEM s) the bridges were constructed from a variety of elements. Each different type of element was given different properties, such as degrees of freedom, constraints, etc. The types of elements used for the bridges were: frame, plane, and cable elements. Each element could have up to six degrees of freedom (DOF): displacement and rotation along each axis. Constraints and restraints could be applied to each DOF in order to develop required solutions, and correctly represent the structure. The elements could also be subjected to up to six forces: axial force, horizontal and vertical shear, bending moment about the horizontal and vertical axis, and axial torque. In addition, each element was given material properties, such as stiffness, density, isotropic or orthotropic, etc., which could be either assigned directly or taken from a pre-existing database. Frame elements (CSI, 2008) are modelled as beam elements connecting two points. During the finite-element solution, each frame element is assigned a local coordinate system, which is related to the global coordinate system, to facilitate results. An example of this relationship is included in Appendix B: Finite Element Modelling. Frame elements can be subjected to all degrees of freedom (DOF), and forces, though constraints and restraints can be applied as required. The ends of the element could be modelled as pinned connections, for example, which would eliminate some (or all) of the rotational degrees of freedom. Material properties that were defined include modulus, shear modulus, density, and shape. This element was used to model most connecting members. Plane elements (CSI, 2008) connect three (triangular) or four (rectangular) points in the same plane. They are used to model 2D solids of uniform thickness. The thickness must be small enough compared to the other dimensions so that the material exhibits plane stress or
35 plane strain. The plane element has three translational degrees of freedom, but does not have any rotational degrees of freedom at its nodes. Material properties can be entered directly, or imported from SAP2000 s existing material library. This element was used to model bridge decks. Because most decks are thin, plane stress conditions were assumed. Cable elements (CSI, 2008) are similar to the frame element, with some additional conditions. The cable has some slack, and can connect two points with a curved shape. Tension can be applied to the cable as an initial condition. The cable element can be subjected to all DOF, however the only element output is axial stress and strain (i.e there is no bending). Cable elements were used to model the cables in suspension / cable stayed bridges Bridge Modelling Each bridge was modelled using the computer program SAP2000. Parameters such as bridge stiffness, member size, etc. were built into the model. In addition, the density, elasticity, stiffness, and other physical properties were entered for every material that was used in the model. Each structure was made of a combination of three elements: frame elements, plane elements, and solid elements. Frame elements were used for most connecting members, plane elements were used for the bridge deck, and cable elements were used for cables. Descriptions of each element, and how SAP2000 meshes it to solve the equation of motion, can be found in Appendix B: Finite Element Modelling. Once the general structure was built, the entire system could be meshed into smaller components in order to develop the approximate equations of motion and extract the mode shapes and associated fundamental frequencies. An example of a double box girder bridge that has been meshed is shown in Figure

36 Figure 3-2: Finite element model of bridge (undeformed shape) The type of mesh that is produced depends on the type of elements used to represent the various structural components of the bridge. Frame and cable elements are divided into smaller elements with the same properties. Plane elements can be meshed into either quadratic or triangular elements; for the bridges in question a quadratic mesh was used because there were few sudden transitions on the bridge deck, where triangular elements would be more applicable Mode Shapes Once the finite element model was built, it was used to generate some structural parameters. The information that was needed for modelling purposes was the first five fundamental frequencies and the corresponding mode shapes. For most footbridges, the first mode shape and associated fundamental frequency will contribute the most to the dynamic response (CHBDC 2006), but five modes were calculated for completeness. For
37 each bridge model, a response was calculated that included additional mode shapes and compared to the standard case to ensure that five mode shapes gave a sufficient response. The critical factor was ensuring that the dynamic range of the forcing function was captured, and in testing, it was found that five mode shapes gave a similar response. Once extracted, the mode shapes were inputted into the second part of the model: the bridge pedestrian interaction. The mode shapes were then compared to theoretical values of simplysupported beams. 3.3 Bridge Pedestrian Interaction The interaction between the bridge model and pedestrian forces was modelled using a Fortran program developed by Green and Cebon (1994), and modified by Varadarajan (1996), Xie (1999) and Shillinglaw (2003). Though the program was intended to model the passage of vehicles over a bridge, the program has the ability to incorporate different types of loads, including pedestrians. The program does not take into account the possibility of the mass of the pedestrians being large enough to affect the mass (and thus the mode shapes) of the bridge. The program is also able to predict a key parameter for pedestrian motion: the acceleration of the pedestrian. This is an important serviceability design parameter; pedestrians should not be subjected to large accelerations while traversing a bridge. In addition to causing discomfort from perceived instability, large accelerations will also promote a lock in effect (Bachmann, 2002), which can create a feedback loop that will cause even larger, more disturbing, accelerations and potentially damage the bridge
38 3.3.1 Bridge Modelling The bridge program solves the following general equation of motion for a bridge (Green 1991, Green and Cebon 1994): (3-1) L = a self-adjoint linear differential operator with respect to the spatial variables (L = 4 x 4) for a simply-supported beam; x = the two-dimensional position vector; m x = mass per unit surface area; y(x, t) = the transverse deflection of the bridge; C = the viscous damping operator with respect to the special variables; and f(x, t) = The force exerted on the bridge. A system governed by the above equation can be solved by applying the following convolution integral (Green 1991): (3-2) f x f, τ = input at position x f ; and h(x, x f, t τ) = impulse function at position x for impulse applied at position x f
39 The impulse function can then be related to mode shapes of the bridge as follows (Green 1991): y x, t = n=1 n (x)q n (t) (3-3) n (x) = normal mode function n = node number q n (t) = the response of the n th normal coordinate The modal response was further refined (Green 1991) to include damping and multiple moving forces, giving a final solution of: y x, t = N t n=1 n l=1 x h n t τ n x l τ P l τ dτ (3-4) N t = number of moving forces (x l for l = 1,2,, N t ) P l t = dynamic loads Solving equation of motion Solving the equation of motion of the bridge model is done in the frequency domain by applying a Discrete Fourier Transform to the above equation (Green 1991). The important input parameters are the mode shapes of the bridge, and the loads that traverse the bridge. The equation is solved in the frequency domain, and then transformed with an inverse Fourier Transform back to the time domain Program Summary
40 The Bridge-Pedestrian program, and its relation to the finite element modelling, is shown in Figure 3-1: Information flow through models. The program takes the inputs from the bridge model, solves the equation of motion as described in the previous paragraph, and outputs data that can be used to describe the response of the bridge to pedestrian loading. Model Verification To verify the accuracy of the model, a bridge was created as a simple case in which certain assumptions could be tested. Several load cases were applied to the bridge, and the response values generated were compared to the same values generated by a theoretical model (Fryba 1972). A simple bridge was chosen: a simply supported beam subjected to constant and periodic moving loads. The bridge was created in SAP 2000, after which the mode shapes were extracted. The bridge was modelled using a relatively slender concrete box-girder section (Figure 3-4). Its base material, including concrete and rebar, was selected from SAP 2000 s list of predefined materials. The concrete selected was a lightweight mixture with a modulus of Elasticity of 1.438E+10 N mm 2 and a density of 1.763E+3 kg/m 3. The bridge is 20m long, with a cross-sectional area of 0.55 m 2 and a linear weight of 961 kg/m. It is approximately 2m wide and 0.6m deep. A 1% of critical damping on all modes was assumed. Its undeformed shape has been shown previously in Figure 3-2. Figure 3-3: Cross section of model verification bridge
.")
41 Modal Analysis A modal analysis was then performed on the bridge to give the first five mode shapes and the corresponding frequencies. The default mesh was used when performing the finiteelement analysis (a description of the default mesh can be found in Appendix B: Finite Element Modelling). The first five modes, their frequencies, and the mode shape date can be found in Appendix A: Modal Data. The deflected shape from the first mode is shown in Figure 3-5; mode shapes 1-3 can be seen in Figure 3-6 and mode shapes 4 and 5 can be seen in Figure 3-7. Figure 3-4: 1 st Mode Shape of test bridge (2D)
42 Mass-normalized mode shape 1.50E-02 Test Bridge: Mode Shapes E E E E-03 Mode 1: 21.5 rad/s -1.00E-02 Mode 2: 58.4 rad/s -1.50E-02 Bridge Position Figure 3-5: Mode shapes 1-3 of test bridge
43 Mass-normalized mode shape 1.50E-02 Test Bridge: Mode Shapes E E E E E-02 Mode 4: rad/s -1.50E-02 Mode 5: rad/s Bridge Position Figure 3-6: Mode Shapes 4 and 5 of test bridge Load Parameters The following load parameters were used: Weight of load = 50 kn (mass = 5097kg) Frequency of load (in the case of harmonic loading) = 30 rad/s Speed of load = 10 m/s The load parameters were selected based on previous research in the area of vehicle loading specifically Shillinglaw (2003), Green (1990). Though the loads parameters do not reflect typical pedestrian loads, they will allow conclusions to be drawn, as the program used assumes linear relationships. Three cases were compared to verify the accuracy of the program: a constant moving load, a harmonic moving load, and a harmonic moving load at
44 the first fundamental frequency. Each case was compared to the theoretical values (Fryba 1972). Fryba solved the equation of motion of a simply-supported beam subjected to various load cases, including a constant load and a sinusoid. He calculated the bridge responses by first applying a Fourier sine transformation to the equation of motion of a beam, and then applying a Laplace Carson integral. The solution can then be transformed and used to verify that the model used in the thesis is accurate for simple cases, before applying it to more complicated situations such as multiple pedestrian loads. Constant Load For the first test, a constant load of 50 kn was run over the test bridge at a speed of 10 m/s to verify the accuracy of the results. The predicted midspan bridge response matched well with the theory, as shown in Figure 3-8. Note that the theoretical response does not calculate any oscillation in terms of free vibration after the load leaves the bridge. While it appears that the two responses are identical, in fact they do vary. The largest variances occur when the load enters and leaves the bridge. This is due to the fact that the numbers at these points are very small, so minor discrepancies (in terms of absolute value) lead to large percentage errors. For the majority of the test, from 0 to 2 seconds, the percent difference is under 1%, with an average error of 0.09%. The maximum absolute error in the test is 0.017mm. The calculated response thus compares quite favourably to the theoretical case
45 Deflection (m) Constant Load: Predicted and Theory Calculated Response Theoretical Response Time (s) Figure 3-7: Predicted and theoretical response due to constant load Harmonic Loads Two harmonic loads were run over the bridge: one at 30 rad/s (Figure 3-9) and one at the bridge s first fundamental frequency, 21.5 rad/s (Figure 3-10). As in Section 3.4.3, the theoretical response does not calculate any oscillation in terms of free vibration after the load leaves the bridge. For both cases, the theoretical and predicted responses are very close. The percent difference between the predicted and theoretical responses averages about 0.2%, though it reaches a max of 3%. The maximum percent difference occurs when the deflections are very low, so while the percent difference may be high, the absolute difference is low (same as in Section 3.4.3). The predicted responses for both cases were
46 Deflection (m) plotted to illustrate the effect of exciting a bridge at its natural frequency (Figure 3-11). As expected, the bridge response is much greater when it experiences resonance Harmonic Load: Predicted and Theory Calculated Response Theoretical Response Time (s) Figure 3-8: Predicted and theoretical response to due harmonic load
47 Deflection (m) Natural Harmonic Load: Predicted and Theory Time (s) Calculated Response Theoretical Response Figure 3-9: Predicted and theoretical response due to harmonic load at natural frequency
48 Deflection (m) rad/s and 21.5 rad/s Harmonic Loads Time (s) 30.0 rad/s 21.5 rad/s Figure 3-10: Harmonic loads at 30.0 rad/s and 21.5 rad/s Pedestrian Loads Pedestrian loads are similar to constant plus harmonic loads, except with several weighting factors that make the load conform to actual footsteps. The equation of the pedestrian forces was discussed in section 2.3.3: Pedestrian Modelling. Dynamic load factors used were as follows (Bachmann et al., 1987): 1 = = = =
49 Force (N) 5 = 0 These values were used as they gave a good approximation of pedestrian forces, and were not frequency dependent. The pedestrian forces used in Section Chapter 0 were plotted against a constant plus a harmonic force to illustrate the difference between the two loads (Figure 3-12). While the forces are quite similar, the pedestrian forces are more jagged due to the typical heel to toe walking motion exerted by the average walker. Though the loads appear to be similar, in fact they vary by up to 20% at some points. The average % difference in the loads is 8.9%. This indicates that approximating a pedestrian load using a sinusoid may significantly affect the solution. If both loads are run over the test bridge, the responses can be seen in Figure The loads are quite similar, but produce slightly divergent responses. This indicates that a constant load plus a sinusoid may be an appropriate approximation of a pedestrian load. This will be explored further in Chapter E E+04 Periodic and Pedestrian Forces Pedestrian Force Periodic Force 6.00E E E E E Time (seconds) Figure 3-11: Constant plus Harmonic Load and Pedestrian Load
50 Deflection (m) Response from Constant Plus Harmonic and Pedestrian Loads Constant Plus Harmonic Pedestrian Time (s) Figure 3-12: Bridge response to constant plus harmonic and pedestrian loads Conclusion The results predicted by the pedestrian vehicle model are similar to the values derived using the theoretical calculations (Fryba, 1972), usually with 1% accuracy. These results have been verified, by comparisons in previous research (Green, 1990), to existing bridge responses. As such, the model can be expected to accurately predict simple cases such as constant and sinusoidal loads. When a more complicated pedestrian force is introduced into the model, it compares favourably with a simple constant plus sinusoidal load. The model appears to give accurate results; however, when applying the model to more complicated scenarios, such as multiple pedestrian loads, care must be taken to ensure the results are reasonable
51 Chapter 4.0: Parametric Study For the parametric study, two bridges were modelled and analyzed. The two bridges were developed for two different scenarios. First, a typical, short-span bridge to represent the typical response to pedestrian motion was selected. Second, a more interesting bridge was selected. There were several important criteria that this bridge should meet in order to make it suitable for study. It should be long and slender, so that its response is in the range as a lively pedestrian bridge. Also, it should have a fundamental frequency between 1 and 2 Hz, so that the worst case scenario of pedestrian induced resonance can be studied. 4.1 Parametric Study Bridges First Parametric Study Bridge The first bridge, with a short span and natural frequencies out of the range of pedestrian excitation was modelled after a bridge at the Royal Military College of Canada (RMC) (Yantha 1994). This FRP bridge was created to run laboratory experiments to determine the effectiveness of FRP for various military applications. The bridge is a truss bridge, constructed with FRP beams, FRP bracing, FRP handrails, and pretensioned cables. It has a total span of 6.0m Second Parametric Study Bridge An excellent real-life example of a pedestrian bridge that fit the conditions listed above can be found in Scotland: the Aberfeldy Footbridge (Figure 4-1). The Aberfeldy footbridge was built in 1992 on a private golf course, spanning the river Tay to link the front and back nine holes (Cadei and Stratford, 2002). It is a fully composite bridge, constructed with a GFRP deck, parapet and towers, and Kevlar cables. Unfortunately, exact section sizes and material

52 properties were not available due to the fact that the bridge is privately owned, and the owner was hesitant to release information. However, enough data was available to construct a reasonable approximation of the bridge. The model of the bridge was changed to a suspension bridge for ease of modelling in SAP2000. While this would certainly change its dynamic properties, including the mode shape, the fact that the actual dynamic properties of the bridge were not available makes this a reasonable change that would not affect the outcome of the thesis. Figure 4-1: The Aberfeldy Footbridge (Skinner 2009) 4.2 Finite Element Models To extract the mode shapes and conduct the dynamic analysis, FEM s for both bridges had to be built. The following sections describe how this was done, including the types of
53 elements used, the section properties, and material properties. A summary of the data used is seen in Table 4-1. Table 4-1: Bridge Data for FEM's Bridge Test RMC Aberfeldy Material Reinforced concrete box girder FRP truss and handrails, steel cables FRP deck and towers, Kevlar cables Length (m) Mass (kg/m) EI (N*mm 4 ) 1st Fundamental Frequency (rad/s) E E E FEM Model of First Parametric Study Bridge The RMC bridge was modelled using ANSYS, a finite element program similar to SAP. The bridge is a truss bridge, with the beams, cross bracing, and handrails made of FRP. A schematic of the bridge is shown in Figure 4-2. The materials in the model are denoted by numbers: material 1 is the FRP beams, material 2 is the FRP handrails, material 3 is the pretensioned cables, and material 4 is the FRP cross-bracing. The material data for the bridge is summarized in Table
54 Figure 4-2: FEM of first parametric study bridge Table 4-2: Material data for first parametric study bridge Element Type (number from Figure 4-2) Modulus, N/m 2 Cross sectional area, m 2 Moment of inertia (horizontal axis), m 4 Moment of inertia (vertical axis), m 4 Mass / unit length, kg/m Initial Strain Main Beams (1) 2.50E E E E E E+00 Handrail (2) 3.00E E E E E E+00 Cables (3) 2.00E E-05 na na na 7.90E-04 Cross Bracing (4) 3.00E E E E E E
55 Modal Deflection (m) Once the FEM was built, the mode shapes for the RMC bridge were extracted. Only vertical modes were considered, so the model was constrained to eliminate lateral, torsional, and compression modes. The mode shapes were plotted in Excel; mode shapes 1-3 in Figure 4-3 and mode shapes 4-5 in Figure 4-4. The actual modal data can be found in Appendix A: Modal Data. 0.1 Mode Shapes Mode 1: 21.7 Hz Mode 2: 37.4 Hz Bridge Position (m) Mode 3: 58.7 Hz Figure 4-3: First parametric study bridge mode shapes
56 Modal Deflection (m) 0.1 Mode Shapes Bridge Position (m) Mode 4: 87.3 Hz Mode 5: Hz Figure 4-4: First Parametric study bridge mode shapes FEM Model of Second Parametric Study Bridge The bridge deck of the Aberfeldy Bridge was made of GFRP sections fused together. A schematic of the cross section of the Aberfeldy bridge, which was replicated for the parametric study, can be found in Figure 4-5. The cross section was proportioned into two elements when building the model. Every 5.0 m, the bridge was braced with a horizontal beam. The bridge was secured at each abutment to the ground, and spanned across two concrete piers. Suspension cables were attached to the tops of the piers, and then tied into the abutments. Every 5.0 m, at the same interval as the cross-bracing, the hanging cables attached the suspension cables to the bridge. The shape, material, and type of element for each section are shown in Table 4-2. Material properties of the deck and section details can be found in Appendix C: Material Data. The piers were constructed of low-density


57 concrete. The tendons in the suspension bridge were made of Kevlar (again, see Appendix C: Material Data). The SAP2000 model can be seen in Figure 4-6. Figure 4-5: Cross section of parametric study bridge (Cadei and Stratford 2002) Figure 4-6: Parametric Study Bridge
58 Table 4-3: Material, shape, and element used for each member Member Shape Material SAP2000 Element Frame member (right) GFRP Frame Frame member (left) GFRP Frame Cross Bracing GFRP Frame Cables Kevlar Cable Upon building the model in SAP2000, the mode shapes could be extracted. As with the RMC bridge, only vertical modes were considered, so the model was constrained to eliminate lateral, torsional, and compression modes. While these other modes are important, the vertical mode was chosen for analysis as it is easier to represent graphically. The other modes could be analyzed in a similar fashion, as the model would remain valid. An example of a mode shape, specifically the first fundamental frequency, can be seen in Figure 4-7. The mode shapes were also plotted; mode shapes 1-3 in Figure 4-8 and mode shapes 4-5 in Figure 4-9. Finally, the full table with the modal data can be found in Appendix A: Modal
, the mass of a pedestrian was considered small enough not to significantly affect the mode shape of the bridge.")
59 Modal Deflection (m) Data. Given that the total mass of the bridge is over 6700kg (not including cables and piers), the mass of a pedestrian was considered small enough not to significantly affect the mode shape of the bridge. Figure 4-7: Mode 1 of parametric study bridge Mode Shapes Position (m) Mode 1: 4.53 rad/s Mode 2: 5.42 rad/s Mode 3: 7.35 rad/s Figure 4-8: Mode shapes 1-3 of parametric study bridge
60 Modal Deflection (m) Mode Shapes Mode 4: rad/s Mode 5: rad/s Position (m) Figure 4-9: Mode shapes 4-5 of parametric study bridge 4.3 Parametric Study To generate the parametric study, the following variables were tested: pedestrian speed and pacing frequency, bridge damping, and number of pedestrians. Three data sets were generated for each case: midpoint deflection of bridge, deflection underneath load, and acceleration of the bridge underneath the load Constants Several variables were kept constant during the parametric study. The physical parameters of the bridge were not changed, and the pedestrian load was kept constant at 700 N. The
61 exact load parameters that were used to describe the pedestrian forces can be found in section Pedestrian Speed / Frequency Pedestrian speed and frequency are correlated; as pedestrians walk at a faster rate their pacing frequency also increases. Speed was varied over a range from a slow stroll (1.0 m/s) to a brisk walk (2.0 m/s). Pacing frequency varied from 1.5 Hz (slow walk) to 2.1 Hz (brisk walk) Bridge Damping The damping level of the bridge can be adjusted. It can also be changed for individual modes, to simulate targeted damping of a troublesome (i.e. leads to large amplitude vibrations) mode. The damping cases considered were: 0%, 0.5%, and 1.0% of critical damping. Such low levels of damping are typical of composite bridges Number of Pedestrians The model can simulate up to twenty pedestrians crossing the bridge. For the purposes of this study, groups of one, four, and eight pedestrians were sent over the bridge. The pedestrians were sent over the bridge in a single-file line 2.0 m apart, and for each test case every pedestrian walked with the same pacing frequency. In addition to the pedestrian load cases, runs included harmonic (sinusoidal) loads and constant (no periodic motion) loads. The test cases that were run are summarized in Table 4-3. For each case, three data sets were produced. Therefore, 72 (plus special cases) simulations were run, producing 216 data sets (plus special cases)
62 Table 4-4: Parametric Study Variables Speed (m/s) Controlled Variable Pacing Frequency (Hz) Damping Load Cases % Constant Load % Harmonic Load % 1 Pedestrian Special Cases 4 Pedestrians Pedestrians
63 Chapter 5.0: Results and Discussion 5.1 First Parametric Study Bridge This bridge, as described in section 4.2.1, was designed to be a simple case where the pedestrian pacing frequency was not in the range of the bridge s natural frequency. This was done to give a baseline for typical response to pedestrian loads. It is only 6m long, so excessive deflections and pedestrian accelerations would not be expected. The cases that were considered are shown in Table 5-1 (note that speed and frequency are correlated). From Figure 2-7, the bridge has an acceleration limit of 1.5 m/s 2. Table 5-1: Parametric Study Variables for RMC Bridge Controlled Variable Speed (m/s) Frequency (Hz) Damping Load Cases % 1 Pedestrian % 4 Pedestrians Results The RMC Bridge is a single-span truss bridge, so would be expected to respond similar to a simply-supported beam. A typical midpoint response, with the speed of a single pedestrian at 1.0m/s and 0% damping is shown in Figure 5-1. The bridge roughly vibrates at the same frequency of the pedestrian footfall. As seen in Figure 5-2, as the pedestrian leaves the bridge it oscillates its first natural frequency of 21.7 Hz. The deflection is minor, at 0.43 mm, which is well below the static limits, as seen in Figure 2-6. The max acceleration of m/s 2 is also well below serviceability limits
64 Deflection (m) Deflection (m) 5.00E E E E E E E E E E E E-04 Response at Midpoint Time (seconds) Figure 5-1: Midpoint response 1.00E-05 Response at Midpoint 5.00E E E E E E-05 Time (seconds) Figure 5-2: Free vibration at midpoint 5.2 Second Parametric Study Bridge
65 The parametric study bridge, as described in Chapter 4 (see Figure 4-6), was an ideal bridge to observe the interaction between pedestrian forces and bridge response. It is a very lively bridge; therefore large responses should be expected. In addition, it has a long centre span. The pedestrians were on the bridge for a long time, giving them enough time to excite it. The pedestrian speed ranged from 1.0 to 2.0 m/s, and the bridge was 110 m long, so pedestrians spent between 110 and 55 seconds traversing the bridge. It is constructed out of FRP decking and cables, and is therefore lighter and more slender than typical bridges. Some simple cases are shown below to illustrate the typical response of the bridge to several different load cases. Only vertical motion was considered; lateral sway, compression, and torsional motion and mode shapes were not discussed. Serviceability limits were taken from clause of the CHBDC 2006 (Figure 2-7). For this bridge, this gave a pedestrian acceleration limit of 0.25 m/s Response to Constant Load By passing a constant load over the bridge, a typical non-periodic response can be shown in Figure 5-3. In the case below, the load had a weight of 700 N (the approximate weight of a single pedestrian) and a speed of 1.0 m/s. From 0 to 25 seconds, the load is passing over the first span of the bridge, which causes a positive deflection of approximately 4.4 mm. From 25 to 100 seconds, as the load passes over the centre span, it causes a negative deflection of 11.4 mm. Finally, after 110 seconds the load leaves the bridge and the midpoint simply oscillates
66 Deflection (m) 6.00E E E-03 Response at Midpoint to Constant Load 0.00E E E E E E E E Time (seconds) Figure 5-3: Constant Load moving over bridge Because it is a constant load, the only periodic motion of the bridge is introduced due to the horizontal movement of the load. By examining a smaller section of the response, this periodic motion can be better analyzed. Consider where the maximum deflection occurs, which is between 50 and 60 seconds (Figure 5-4). While the periodic motion is present, it is only about 1mm of the total deflection. There are about seven cycles in the 10 second interval, which indicates that the bridge is vibrating at its first natural frequency of 0.72 Hz. The free vibration of the bridge (after 110 seconds) is also at the same frequency (Figure 5-5)
67 Deflection (m) Deflection (m) Response at Midpoint to Constant Load 0.00E E E E E E E E-02 Time (seconds) Figure 5-4: Midpoint response (50 to 60 seconds) Response at Midpoint to Constant Load 5.00E E E E E E E-03 Time (seconds) Figure 5-5: Free vibration
68 Deflection (m) The response can also be determined underneath the constant load as it travels over the bridge (Figure 5-6). As the load crosses the first span, it experiences a deflection of 5.2 mm. As it crosses the centre span, it experiences a deflection of 12.5 mm. 2.00E E E-03 Response Under Load E E E E E E-02 Time (seconds) Figure 5-6: Response under load The acceleration response of the load can also be determined. In the case of a constant load, the acceleration of the load is not significant. The maximum acceleration is m/s 2, which is well below the serviceability threshold of 0.25 m/s 2. Clearly, the effect of the constant portion of the pedestrian load has little dynamic effect (Figure 5-7)
69 Acceleration (m/s2) 3.00E-02 Acceleration of Load 2.00E E E E E E-02 Time (seconds) Figure 5-7: Acceleration of constant load Response to Harmonic Load The CHBDC 2006 presents an option of modelling a pedestrian with a sinusoidal load of 180N (the roughly the dynamic portion of a pedestrian crossing. As such, it is relevant to discuss this case. When a harmonic load is passed over the bridge, the response demonstrates the effects of a periodic forcing function. For this case, the load is a sinusoidal load with an amplitude of 180N, a period of 1.5 Hz, and a speed of 1 m/s. As expected, the bridge oscillates around its resting position, with a maximum deflection of 4.16 mm (Figure 5-8). If the data is analyzed from 50 to 60 seconds, a detailed view of the oscillation can be seen. During this period, 15 cycles can be counted, confirming that the frequency of the harmonic load is governing the vibration (Figure 5-9). Once the load leaves the bridge, the bridge vibrates at its fourth fundamental frequency of 1.73 Hz (Figure 5-10). Usually, one would expect the bridge s free vibration to be at its first fundamental frequency (0.73 Hz),
70 Deflection (m) but in this case the frequency of the forcing function most closely matches the fourth fundamental frequency. Thus, this is the form that the free vibration takes. 5.00E E E E E E E E E E E-03 Response at Midpoint Time (s) Figure 5-8: Midpoint deflection due to harmonic load
71 Deflection (m) Deflection (m) 5.00E E E E E E E E E E E-03 Response at Midpoint Time (s) Figure 5-9: Midpoint response from 50 to 60 seconds 2.00E-03 Response at Midpoint 1.50E E E E E E E E-03 Time (s) Figure 5-10: Midpoint response from 100 to 120 seconds
72 Deflection (m) The response can also be calculated underneath the load. As the load traverses the bridge, there is a small response in the first span of approximately 0.70 mm, and a maximum response of 3.7 mm in the centre span (Figure 5-11). The response is periodic, at the same frequency of the load. The acceleration response of the load (Figure 5-12) can also be plotted. The maximum acceleration is m/s 2, which is below serviceability limits. Figure 5-13 provides a closer view of the acceleration response. 5.00E E E E E E E E E E E-03 Response Under Load Time (s) Figure 5-11: Response under harmonic load
73 Deflection (m) Deflection (m) 0.25 Acceleration of Load Time (s) Figure 5-12: Acceleration of harmonic load 0.25 Acceleration of Load Time (s) Figure 5-13: Acceleration of harmonic load from 45 to 65 seconds
74 Deflection (m) Response to Constant Plus Harmonic Load A constant plus harmonic load is a potential representation of a pedestrian load. Instead of mimicking the heel-toe strike (as seen in Figure 2-2), a regular sinusoid is used. For this case, the same DLF s were used from section 3.4.5, except α 2 = α 3 = 0 (α 1 was kept at 0.4). The main purpose of calculating this case was to compare to the more accurate representation of the pedestrian model, which is discussed in the next section. The midpoint response is plotted in Figure E-02 Response at Midpoint 5.00E E E E E E-02 Time (s) Figure 5-14: Midpoint response due to constant plus harmonic load Pedestrian Load The Pedestrian Load, as described in Chapter 3, is a periodic load that is modelled on the force exerted by a human footfall. It is a combination of a constant and harmonic load. A 700 N pedestrian walking over the bridge at 1 m/s with a pacing frequency of 1.5 Hz would create a maximum midspan deflection of 16 mm (Figure 5-14). If the graph is plotted over
75 Deflection (m) seconds (Figure 5-15), greater detail can be seen. The period of vibration of the bridge is 1.5 Hz, the same as the pacing frequency. As the bridge enters free vibration (Figure 5-16) at 110 seconds, is oscillates at the fourth fundamental frequency of 1.72 Hz. 1.00E-02 Mispan Deflection 5.00E E E E E E-02 Time (seconds) Figure 5-15: Midspan deflection due to pedestrian load
76 Deflection (m) Deflection (m) 1.00E-02 Mispan Deflection 5.00E E E E E E-02 Time (seconds) Figure 5-16: Peak midspan deflection, between 50 and 60 seconds, due to pedestrian load 6.00E-03 Mispan Deflection 5.00E E E E E E E E-03 Time (seconds) Figure 5-17: Free vibration (110 seconds) at midspan due to pedestrian load
77 5.2.5 Comparing Loads The three load cases that have been discussed so far can be plotted on the same graph to compare the results. The cases are a constant 700N load, a constant load plus sinusoidal load with an amplitude of 280N, and a 700N pedestrian load (Figure 5-17). The largest response is from the constant and harmonic load. While the constant load generates little in terms of dynamic effects, both other cases contribute noticeable vibrations. Both the constant and harmonic and the pedestrian loads cause a maximum midspan deflection of 17mm, compared to 11mm for the constant load case. The constant plus harmonic and the pedestrian loads create very similar responses, which indicates that a more accurate representation of pedestrian loads may not be necessary. The average percent difference between the load cases is approximately 3.9%, with the largest differences at very small deflections. The max absolute difference is 0.38mm, with the average difference 0.022mm. The main vibration response of the bridge to the constant load is its first fundamental frequency at 0.72 Hz. The pedestrian and the constant plus harmonic loads, however, stimulate the fourth fundamental frequency, which is at 1.73 Hz. This is the closest frequency to the pacing frequency of 1.5 Hz
78 Deflection (mm) Midpoint Deflection of Three Load Cases 0.00E E E E E E E E E E E-02 Time (seconds) Pedestrian Constant load Constant + Harmonic Figure 5-18: Midspan Deflection of three load cases 5.3 Multiple Loads 1.0 m/s A crowd of pedestrians can be simulated by the program to show the effect of multiple pedestrians walking in step. Each pedestrian walks at the same speed, at a distance of 2.0m apart. Simulations of one, four, and eight pedestrians were conducted, with each pedestrian having a weight of 700N and a pacing frequency of 1.5 Hz. The case of one pedestrian was examined above; the four pedestrian and eight pedestrian cases are examined below Four and Eight Pedestrians When four pedestrians traverse the bridge, both the dynamic and static effects are magnified (Figure 5-18). The maximum deflection at midspan is 64mm. The pedestrians
79 Deflection (m) spend a slightly longer time on the bridge due to the fact that they are 2.0m apart. Adding another four pedestrians increases the deflection even further. The maximum deflection at midspan is 112mm (Figure 5-19). The acceleration of the pedestrians also increases, to 0.55 and 0.61 m/s 2 for four and eight pedestrians, respectively. 3.00E E E E E E E E E E E-02 Midspan Deflection Time (seconds) Figure 5-19: Midspan deflection due to four pedestrians
80 Deflection (m) 6.00E E E E E E E E E E-01 Midspan Deflection Time (seconds) Figure 5-20: Midspan deflection due to eight pedestrians Varying Number of Pedestrians The three data sets, which include one, four and eight pedestrians moving at 1.0m/s and pacing with a frequency of 1.5Hz can be plotted on the same graph for comparison (Figure 5-20). As expected, increasing the number of pedestrians increases the deflection at midspan, as well as the amplitude of vibration. The maximum deflection is at different times because of the extra time needed for the additional pedestrians to cross the bridge
81 Deflection (m) 2.00E-02 Midspan Deflection 0.00E E E E E E-01 1 Pedestrian 4 Pedestrians 8 Pedestrians -1.20E-01 Time (s) Figure 5-21: Midspan Deflection from 1, 4 and 8 pedestrians 5.4 Damping For a light bridge such as this one, small levels of structural damping would be expected. Three cases were considered for the analysis: 0%, 0.5% and 1% damping (Figure 5-21). Increasing the structural damping should reduce the amount of vibration of the structure, and cause the free vibration of the bridge to dissipate after the load passes the bridge. For this case, increasing damping has a relatively small effect. This is because the pacing frequency does not match with a fundamental frequency. A larger effect would be expected if the bridge was experiencing resonance. The maximum accelerations experienced were 0.36 m/s2, 0.35 m/s2, and 0.33m/s2 for the 0%, 0.5% and 1% damping cases, respectively. The effect of the damping on the free vibration of the bridge can be seen; for the damped
82 Displacement (m) cases the bridge returns to its stable state while for the 0% damping case it vibrates indefinitely (Figure 5-22) Midpoint Displacement for Three Damping Cases % Damping 0.5% Damping 1% Damping Time (seconds) Figure 5-22: Midpoint deflection for three damping cases
83 Displacement (m) Midpoint Displacement for Three Damping Cases Time (seconds) 0% Damping 0.5% Damping 1% Damping Figure 5-23: Effect of damping on free vibration 5.5 Results To generate the full parametric study, several variables were changed. They were: Load speed, from 1.0 to 2.0 m/s in 0.2 m/s intervals, with a correlated change in frequency Damping: No damping, 0.5% damping and 1.0% damping Number of pedestrians: One, four, or eight pedestrians walking at the same pacing frequency The results are tabulated in Table
84 Table 5-2: Parametric Study Results for Second Bridge Load Case Speed (m/s) Pacing Frequency (rad/s) Damping (%) Midpoint (m) Max response Under Pedestrian Pedestrian acceleration (m) (m/s 2 ) 1 Pedestrian Pedestrian Pedestrian Const + Harm Constant Harmonic Pedestrian Pedestrian Pedestrian Pedestrian Pedestrian Pedestrian Pedestrian Pedestrian Pedestrian Pedestrian Pedestrian Pedestrian Pedestrian Pedestrian Pedestrian Pedestrian Pedestrian Pedestrian % Pedestrian % Pedestrian % Pedestrian % Pedestrian % Pedestrian % Pedestrian % Pedestrian % Pedestrian % Pedestrian % Pedestrian % Pedestrian %
85 8 Pedestrian % Pedestrian % Pedestrian % Pedestrian % Pedestrian % Pedestrian % Pedestrian % Pedestrian % Pedestrian % Pedestrian % Pedestrian % Pedestrian % Pedestrian % Pedestrian % Pedestrian % Pedestrian % Pedestrian % Pedestrian % Pedestrian % Pedestrian % Pedestrian % Pedestrian % Results of Study The results of the experiment demonstrate the effects of pedestrian loads on bridges. When compared to a constant moving load, the periodic force that a pedestrian exerts has a much more pronounced effect. For example, a constant 700N load moving over the bridge at 1.0m/s, causes a maximum midspan deflection of 11mm, compared to 17mm for a pedestrian with the same weight, for an increase of 47%. The effect of adding additional pedestrians increased the maximum deflection of the bridge, as would be expected. Because the pedestrians cross the bridge at the same speed and pacing frequency, they simulate the lock in effect discussed in chapters 2 and
86 Due to its FRP construction, relatively light weight and long span, the parametric study bridge has a low first fundamental frequency, below the slowest pedestrian speed of 1.0m/s that was considered for this experiment. The frequency that was closest to the pacing frequency of the pedestrians was the fourth fundamental frequency Serviceability limits For nearly every case, serviceability limits for pedestrian acceleration of 0.25 m/s (from the CHBDC 2006) were exceeded. At 1.2 m/s, the pedestrian pacing frequency of 1.7 Hz was close to the fourth fundamental frequency of 1.72 Hz. The bridge therefore experienced some resonance, which led to large vibrations. The peak acceleration, when eight pedestrians were traversing the undamped bridge at 1.2 m/s, was 2.35 m/s 2. This is about ten times the acceptable serviceability condition. The maximum deflection experienced at the midspan for this case was 560 mm, which is quite significant considering the centre span is 55m long. When eight pedestrians crossed the bridge, the serviceability limits were exceeded by a factor of two for every case. This is likely due to the excitation of the fourth natural frequency of the bridge. The horizontal motion of the pedestrians caused some excitation of the first natural frequency, but it was not significant. The large accelerations that were simulated are expected. The pedestrian footbridge that served as inspiration for this parametric study is notorious for being lively. Fortunately for this case, the bridge is on a private golf course, and thus does not need to comply with serviceability limits. Increasing the number of pedestrians crossing the bridge has a noticeable effect on the max deflections and accelerations that are experienced. A typical relation is shown in Figure At a speed of 1.2 m/s, the pedestrian pacing frequency is very close to one of the
87 Midpoint Deflection (m) bridge s natural frequencies. Adding multiple pedestrians, to simulate a lock-in effect, increases the effect significantly. All measures of bridge response, including midpoint deflection and pedestrian acceleration experience great increases due to the addition of more pedestrians. At resonance frequencies, the effect is magnified Changing Number of Pedestrians Pedestrian Pedestrian 8 Pedestrian Pedestrian Speed (m/s) Figure 5-24: Effect of changing number of pedestrians (0% damping) Damping Increasing the damping reduced the max deflection and acceleration experienced by the bridge. The effect of damping was more pronounced when the pedestrian footfalls were close to the bridge s natural frequency. Damping at this frequency is large because the pedestrian load is harmonic, and without attenuation, can increase without bound. For example, the acceleration felt by a group of eight pedestrians walking at a speed of 1.2m/s
88 Acceleration (m/s2) with a pacing frequency of 1.7 Hz was lowered from 2.35 m/s 2 to 1.37m/s 2 (Figure 5-24). If the dominant mode is further damped by tuned mass dampers acting on the fourth mode at 1.72 Hz, the acceleration felt by the pedestrians can be reduced even further. For example, by damping the fourth mode by 4%, in addition to a natural damping of 1%, the acceleration can be reduced even further to 0.96 m/s 2. While this is still above the serviceability limit, it is significantly lower than the undamped case. Serviceability limits can be met with an extreme damping case of 1%, with the fourth mode damped to 15% (Figure 5-25). The effect of damping is large because the pedestrian load Effect of Damping at v = 1.2 m/s Pedestrian 4 Pedestrian 8 Pedestrian % 0.5% 1.0% Damping (%) Figure 5-25: Effect of damping at v = 1.2 m/s
89 Acceleration (m/s 2 ) 3.00E-01 Acceleration of load, 15% damping on fourth mode, 1 on others 2.00E E E E E E-01 Time (s) Figure 5-26: Damping required to meet serviceability The effects of damping can be further explored by taking the 8 pedestrian case and varying pedestrian speed and damping (Figure 5-26). The effect is especially pronounced at a speed of 1.2 m/s, where the pacing frequency is near resonance of one of the bridge s natural frequencies. Maximum midpoint deflection decreases by almost 40% from the 0 to 1% damping. When the bridge is not being excited near resonance, however, the effect of damping is very small. This makes a compelling case for installing tuned damping systems at vulnerable frequencies, as opposed to increasing the general damping of the bridge by adding stiffeners or structural mass
90 Midpoint Deflection (m) Effect of Damping: 8 Pedestrians % % 1.0% Speed (m/s) Figure 5-27: Effect of damping (8 pedestrian load case) 5.6 Discussion Pedestrian bridges are slender compared to vehicle bridges, because they are not required to support large static loads. This has several effects that work together to make them susceptible to dynamic loading. First, they usually have a low flexural stiffness, which correlates with lower fundamental frequencies and reduced structural damping. Also, pedestrian loads are very periodic, and at low frequencies. For some bridges, such as the one analyzed above, the mode shapes can match the pacing frequencies, leading to large deflections and uncomfortable motion for the pedestrian crossing the bridge. Modal analysis can be a simple way of assessing the serviceability of a pedestrian footbridge. While the CHBDC has some protocols for ensuring serviceability, complicated
91 bridges require a more detailed analysis. The bridge-pedestrian program is ideally suited for such an analysis. If the program is provided with the mode shapes and their corresponding frequencies, the pedestrian loads, and some simple bridge parameters, is can give an accurate estimation of the deflection that the bridge will undergo, as well as the motion that would be felt by the pedestrian
92 Chapter 6.0: Conclusions 6.1 Summary The response of a parametric study bridge was predicted using a modal-response program. Pedestrian loads were also implemented into the program. The program could predict several types of responses, including the deflection and acceleration at the midpoint of the bridge and underneath the moving load. This procedure was repeated for a variety of cases, including constant loads, sinusoidal loads, and multiple loads. The effects of varying damping and load speed / frequency was also examined. 6.2 Conclusions Several conclusions could be drawn from the parametric study. 1. Very little dynamic response (in the vertical direction) is induced by the horizontal motion of pedestrians, based on pedestrian speeds ranging from 1.0 to 2.0 m/s. The pedestrians do not move fast enough to induce anything more than a minor periodic response. 2. Damping has a more pronounced effect when the periodic motion is greater. This occurs when the pedestrian pacing frequency is near the bridge s natural frequency, where resonance would be expected. Targeted damping of specific modes is a viable method of vibration control, especially modes that are near pedestrian pacing frequency
93 3. Increasing the number of pedestrians increases the deflection and acceleration response of the bridge. The increase is not linear, however. Similarly, the dynamic effects are increase when multiple pedestrians are present. 4. When bridges have a natural frequency in the range of pedestrian pacing frequency of 1.0 to 2.0 Hz, care must be taken that large deflections and accelerations of the pedestrians are avoided. Long and slender bridges are especially susceptible to this, which can cause serviceability issues, in terms of pedestrian discomfort. This problem can be avoided by increasing stiffness, or by increasing damping. Increasing damping can be done by adding dampers that are tuned to a specific, troublesome mode. 5. The pedestrian model (700N plus harmonic motion governed by the assumed dynamic load factors), gives a close approximation to an equivalent harmonic force with a first DLF of 0.4. Using an oscillating 180N force, as permitted by the CHBDC, however, would underestimate pedestrian forces. 6.3 Recommendations for future work The research included in this thesis can be expanded upon in several ways. 1. An interactive model should be developed. The current model is static in each simulation; the pedestrian does not adapt to the bridge conditions. Lock-in effect can only be simulated by changing the initial conditions, as opposed to programming adaptive pedestrians that naturally tune their pacing frequency to the vibration of the bridge
94 2. The model should be subjected to full-scale testing and verification on an active, long, and slender pedestrian footbridge. By comparing to known results, the predictive capabilities of the model could be tested. 3. Transverse and torsional modes should be incorporated to give a complete analysis of bridge response
95 Chapter 7.0: List of References Bachmann, H "Case studies of structures with man-induced vibrations." Journal of structural engineering 118: Bachmann, H "Lively Footbridges a Real Challenge." Footbridge 2002 Design and Dynamic Behaviour of Footbridges, Nov 2002: Bachman, H. and Ammann, W Vibrations in Structures: Induced by Man and Machine. IABSE, Zurich. Bachman, H et al Vibration Problems in Structures: Practical Guidelines. Birkhauser, Basel. John Cadei, Tim Stratford The design, construction and in-service performance of the all-composite Aberfeldy footbridge. Maunsell Limited. Canadian Standards Association, Canadian Highway Bridge Design Code, CAN/ CSA-S Canadian Standards Association, Rexdale, Ontario, Canada. Computers and Structures Inc. (CSI) CSI Analysis Reference Manual for SAP2000, ETABS and SAFE tm. CSI, Berkeley, California. Craighead, JK Course Project Structural Dynamics. Department of Civil Engineering, Queens University. Dallard P., Fitzpartick A. J., Flint A., Low A., Ridsdill Smith, R. M., Willford M. and Roche M London Millennium Bridge:pedestrian-induced lateral vibration. ASCE Journal of Bridge Engineering, 6, No. 6, Dupont Global Website Kevlar Technical Guide. Retrieved from Green, M.F The Dynamic Response of Short-Span Highway Bridges to Heavy Vehicle Loads. Doctor of Philosophy Dissertation, Department of Engineering, University of Cambridge. Firth, I New Materials for Modern Footbridges Footbridge 2002 Design and Dynamic Behaviour of Footbridges, Nov 2002: Fryba, L Vibration of solids and structures under moving loads. Prague, Academia, Fitzpatrick, T., Dallard, P., Le Bourva, S., Low, A., Smith, R., and Willford, M Linking London: The Millennium Bridge. The Royal Academy of Engineering
96 Hartley, M.J., Pavic, A. and Waldron, P Investigation of Pedestrian Walking Loads on a Cable Stayed Footbridge Using Modal Testing and FE Model Updating. Centre for Cement and Concrete, University of Sheffield. Newland, D.E "Pedestrian excitation of bridges." Proceedings of the Institution of Mechanical Engineers. Part C, Mechanical engineering science 218.C5 (2004): Newland, D.E Vibration of the London Millenium Footbridge: Cause and Cure. Department of Engineering, University of Cambridge, International Journal of Acoustics and Vibration, Vol. 8, 1, (2003) 9:14. Pavic, A., Hartley, M.J. and Waldron, P Updating the Analytic Models of Two Footbridges Based on Modal Testing of Full-Scale Structures. Department of Civil and Structural Engineering, the University of Sheffield. Pavic, A. and Reynolds, P Vibration Serviceability of Long-Span Concrete Building Floors. Part 2: Review of Mathematical Modeling Approaches. Shock and Vibration Digest 34.4 (2002): Paz, M Structural Dynamics: Theory and Computation, Fourth Edition. Norwell, Massachusetts, Kluwer Academic Publishers. Poovarodom, N., Kanchanosot S. and Warnitchai, P Application of non-linear multiple tuned mass dampers to suppress man-induced vibrations of a pedestrian bridge. Earthquake engineering & structural dynamics 32.7 (2003): Shillinglaw, Scott G Fatigue Damage of Steel Bridge Girders Due to Dynamic Vehicle Loads.: Master s Thesis, Department of Civil Engineering, Queen s University, Kingston, Ontario, April Skinner, J. M A critical analysis of the Aberfeldy Footbridge, Scotland. Proceedings of Bridge Engineering Conference, University of Bath, Bath, UK Strongwell Composolite Fibreglass Building Panel System. Retrieved from Weber, B Damping of Vibrating Footbridges. Footbridge 2002 Design and Dynamic Behaviour of Footbridges, Nov 2002: J.E. Wheeler Prediction and Control of Pedestrian-Induced Vibrations in Footbridges. ASCE Journal of Structural Division 1008 (ST9), 1982, 2045:2065. Wolmuth, B. and Sutees, J Crowd-related Failure of Bridges. Civil Engineering 156 (2003)116:123. Yantha, P.J Static and Dynamic Analysis of an FRP Vehicle Bridge Using Finite Elements. CIVL 821, CIVL 892 projects. Queens University
97 Young, P Improved floor vibration prediction methodologies. Engineering for Structural Vibration Current developments in research and practice, Arup Vibration Seminar, Institution of Mechanical Engineers, October Zivanovic, S., Pavic, A. and Reynolds, P Vibration Serviceability of Footbridges Under Human-Induced Excitation: a Literature Review. Department of Civil and Structural Engineering, University of Sheffield, Jan
98 Appendix A: Modal Data Table A-1: Modal data for test bridge Mode1 Mode2 Mode3 Mode4 Mode5 Frequency (rad/s) Position (m) E E E E E E E E E E E E E E E E E E E E E E E E E E E E E E E E E E E E E E E E E E E E E E E E E E E E E E E E E E E E E E E E E E E E E E E E E E E E E E E E E E E E E E E E E E E E E E E E E E E E E E E E E E E E E E E E E E E E E E E E E E E E E E E E E E E E E E E E E E E E E E E E E E E E E E E E E E E E E E E E
99 E E E E E E E E E E E E E E E E E E E E E E E E E E E E E E E E E E E E E E E E E E E E E+00 Table A-2: Modal data for first parametric study bridge (RMC) Mode 1: Mode 2 Mode 3 Mode 4 Mode 5 Frequency (Hz) Frequency (rad) location (m) E E E E E E E E E E E E E E E E E E E E E E E E E E E E E E E E E E E E E E E E E E E E E E E E E E E E E E E E E E E E E E E E E E E E E E E E E E E E E E E E E E E E E E E E E E E E E E E E E E E E E E E E E E E E E E E E E E E
100 Table A-3: Mode shape data for second parametric study bridge (Aberfeldy) Mode 1 Mode 2 Mode 3 Mode 4 Mode 5 Frequency (rad/s) Position (m) E E E E E E E E E E E E E E E E E E E E E E E E E E E E E E E E E E E E E E E E E E E E E E E E E E E E E E E E E E E E E E E E E E E E E E E E E E E E E E E E E E E E E E E E E E E E E E E E E E E E E E E E E E E E E E E E E E E
101 Appendix B: Finite Element Modelling Coordinate Systems (SAP2000 Manual) Coordinate systems are used to model and relate different parts of the structure, including loads, displacements, and internal forces. A global system is first designed in the (x,y,z) coordinate system. Z is considered the vertical direction, with the X and Y directions forming a horizontal plane. Each component of the system has its own (1,2,3) coordinate system that relates to the global. Frame / Cable Element (SAP2000 Manual) The frame element was used to model beams, columns and trusses. The frame element can be subjected to biaxial bending, torsion, shear, and axial forces, in addition to external loads and self-weight. In SAP2000, it is modelled as a straight line connecting two points, and is given its own local coordinate system. Endpoint conditions, such as different types of restraints, can be specified. The element has six degrees of freedom, including forces and torsion in all direction. Some of the forces can be released. A cable element, which is a subset of a frame element, would not have any bending forces, for example. Some examples of how a frame element relates to the global coordinate system are seen in Figure B
102 Figure B-1: Frame element coordinate angle with respect to global coordinates The material properties that can be defined for this section are: modulus of elasticity, shear modulus, mass density, and weight density. In addition, geometric properties, including cross-sectional area, moments of inertia in all directions, and shear areas can be either defined or calculated. Examples of shear area calculations can be seen in Figure B
103 Figure B-2: Calculating shear areas for frame element The Plane Element (Subset of Shell Element) The plane element is used to model plate structures such as floors, slabs, and membrane structures. Several conditions, such as thin or thick plate, can be specified. Strengths, moments, forces, and other parameters are numerically integrated over the surface and transferred to the joints of the element. The shape of the plane mesh can be either a
104 quadrilateral or a triangle, as seen in Figure B-3. Some examples of meshing of plane element are demonstrated in Figure B-4. Figure B-3: Shell element joint connectivity
105 Figure B-4: Plate element mesh examples The plate element can experience all six degrees of freedom, which includes motion on and rotation around each axis. Material properties are inputted to generate results. Geometric properties can be entered as well, though most shape parameters are calculated based on the shape of the finite element model
 - 94")
106 Appendix C: Material Data GFRP Section (Strongwell 2009)
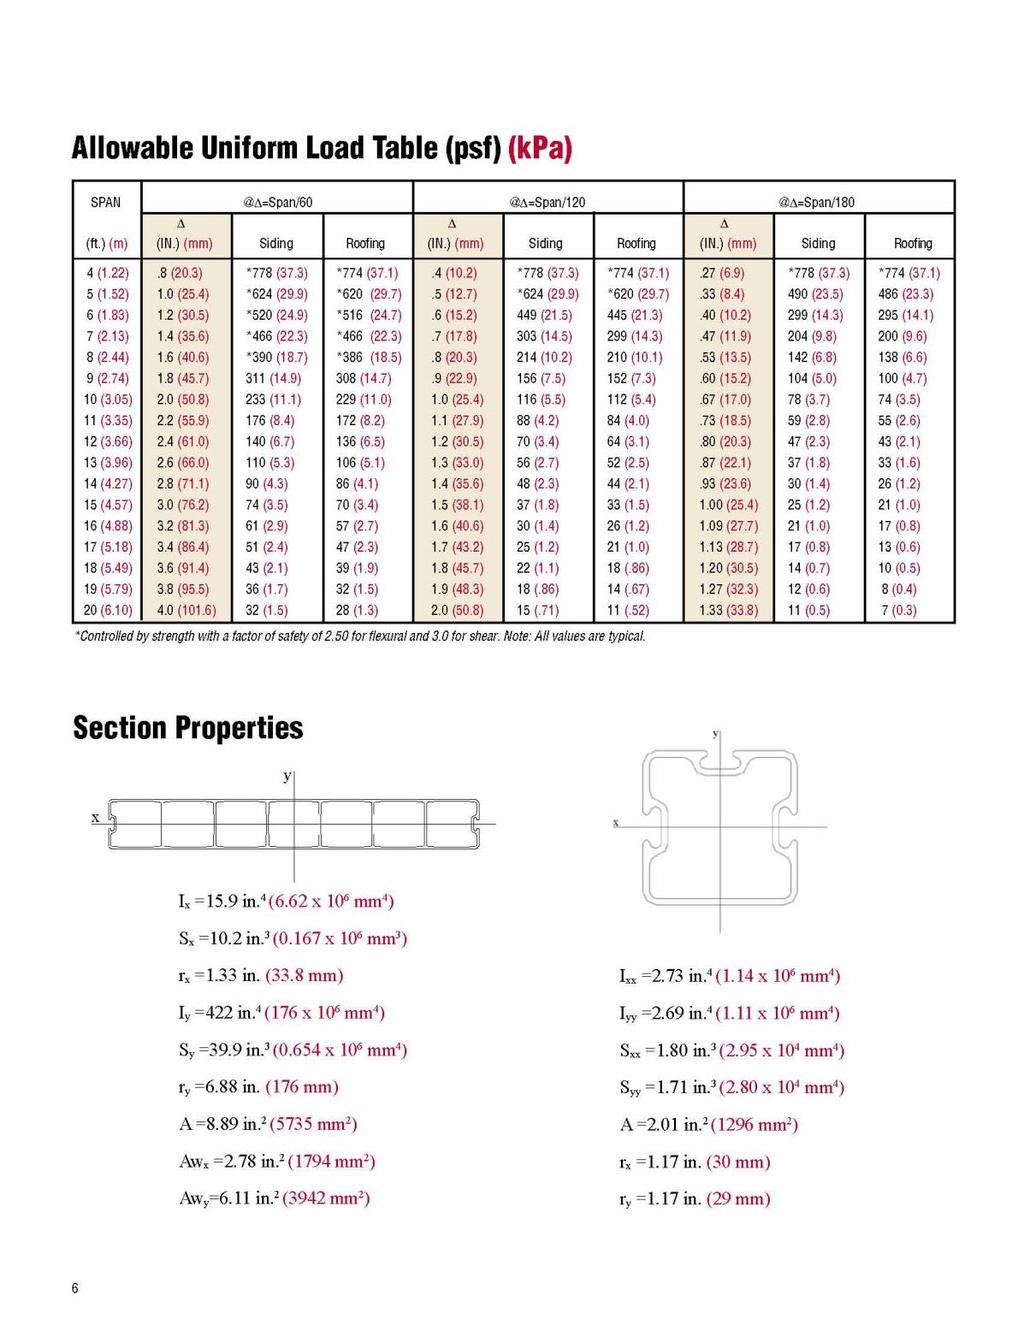
107 - 95 -
")
108 Kevlar (Dupont 2009)
GEA FOR ADVANCED STRUCTURAL DYNAMIC ANALYSIS
 SMART SOLUTIONS FOR VIBRATION MONITORING GEA FOR ADVANCED STRUCTURAL DYNAMIC ANALYSIS ANALYSIS OF CIVIL STRUCTURES - EXPO MERLATA PEDESTRIAN BRIDGE ABSTRACT Civil structures and in particular bridges and
Vibration of floors and footfall analysis
 Webinar Autodesk Robot Structural Analysis Professional 20/04/2016 Vibration of floors and footfall analysis Artur Kosakowski Rafał Gawęda Webinar summary In this webinar we will focus on the theoretical
EMA and Other Dynamic Testing of a 2-Span Prestressed Concrete Floor. Tuan Nguyen, Nicholas Haritos, Emad Gad and John Wilson
 EMA and Other Dynamic Testing of a 2-Span Prestressed Concrete Floor Tuan Nguyen, Nicholas Haritos, Emad Gad and John Wilson INTRODUCTION This paper discusses experimental modal analysis (EMA) using swept
Dynamic investigations of the Solferino footbridge
 Dynamic investigations of the Solferino footbridge C. Cremona Direction for Research and Innovation Ministry for Energy, Ecology, Sustainable Development & Spatial Planning, La Défense, France ABSTRACT:
Vibration response of long cable-stayed timber footbridge case study
 Vibration response of long cable-stayed timber footbridge case study Robert Kliger Chalmers Univ. of Technology Div. of Structural Engineering SE-412 98 Gothenburg Sweden Robert.kliger@chalmers.se Tomas
HUMAN INDUCED VIBRATIONS ON FOOTBRIDGES
 HUMAN INDUCED VIBRATIONS ON FOOTBRIDGES // IEMKE ROOS HUMAN INDUCED VIBRATIONS ON FOOTBRIDGES Iemke Roos // May 2009 Iemke Roos iemkeroos@gmail.com www.arup.com Image: Macintosh Island Pedestrian Bridge,
The Use of BS 5400: Part 10: Code of Practice for Fatigue
 THE HIGHWAYS AGENCY THE SCOTTISH OFFICE DEVELOPMENT DEPARTMENT Amendment No. 1, dated November 1983 THE WELSH OFFICE Y SWYDDFA GYMREIG THE DEPARTMENT OF THE ENVIRONMENT FOR NORTHERN IRELAND The Use of
The Adequacy of Pushover Analysis to Evaluate Vulnerability of Masonry Infilled Steel Frames Subjected to Bi-Directional Earthquake Loading
 The Adequacy of Pushover Analysis to Evaluate Vulnerability of Masonry Infilled Steel Frames Subjected to Bi-Directional Earthquake Loading B.Beheshti Aval & M. Mohammadzadeh K.N.Toosi University of Technology,
PHASE 1 WIND STUDIES REPORT
 PHASE 1 WIND STUDIES REPORT ENVIRONMENTAL STUDIES AND PRELIMINARY DESIGN FOR A SUICIDE DETERRENT SYSTEM Contract 2006-B-17 24 MAY 2007 Golden Gate Bridge Highway and Transportation District Introduction
Performance of single pedestrian load models in predicting dynamic behaviour of flexible aluminum footbridges
 Proceedings of the 9th International Conference on Structural Dynamics, EURODYN 214 Porto, Portugal, 3 June - 2 July 214 A. Cunha, E. Caetano, P. Ribeiro, G. Müller (eds.) ISSN: 2311-92; ISBN: 978-972-752-165-4
Chapter 11 Waves. Waves transport energy without transporting matter. The intensity is the average power per unit area. It is measured in W/m 2.
 Energy can be transported by particles or waves: Chapter 11 Waves A wave is characterized as some sort of disturbance that travels away from a source. The key difference between particles and waves is
Dynamic Investigation of a Suspension Timber Footbridge
 Dynamic Investigation of a Suspension Timber Footbridge Pedro G. A. Segundinho Ph.D Student Structural Engineering, São Carlos School of Engineering, University of São Paulo USP, Av. Trabalhador São carlense,
Waves. harmonic wave wave equation one dimensional wave equation principle of wave fronts plane waves law of reflection
 Waves Vocabulary mechanical wave pulse continuous periodic wave amplitude wavelength period frequency wave velocity phase transverse wave longitudinal wave intensity displacement wave number phase velocity
Application of pushover analysis in estimating seismic demands for large-span spatial structure
 28 September 2 October 2009, Universidad Politecnica de Valencia, Spain Alberto DOMINGO and Carlos LAZARO (eds.) Application of pushover analysis in estimating seismic demands for large-span spatial structure
Special edition paper
 Development of a Track Management Method for Shinkansen Speed Increases Shigeaki Ono** Takehiko Ukai* We have examined the indicators of appropriate track management that represent the ride comfort when
APPLICATION OF PUSHOVER ANALYSIS ON EARTHQUAKE RESPONSE PREDICATION OF COMPLEX LARGE-SPAN STEEL STRUCTURES
 APPLICATION OF PUSHOVER ANALYSIS ON EARTHQUAKE RESPONSE PREDICATION OF COMPLEX LARGE-SPAN STEEL STRUCTURES J.R. Qian 1 W.J. Zhang 2 and X.D. Ji 3 1 Professor, 3 Postgraduate Student, Key Laboratory for
Footbridge Response on Single Pedestrian Induced Vibration Analysis
 Footbridge Response on Single Pedestrian Induced Vibration Analysis J. Kala, V. Salajka and P. Hradil Abstract Many footbridges have natural frequencies that coincide with the dominant frequencies of the
Evaluation of footfall induced vibration in building floor
 Evaluation of footfall induced vibration in building floor T. Nguyen 1, E. Gad 2, J. Wilson 3, N. Lythgo 4 and N. Haritos 5 1. Corresponding Author. PhD student, Faculty of Engineering and Industrial Sciences,
Lesson 14: Simple harmonic motion, Waves (Sections )
") Circular Motion and Simple Harmonic Motion The projection of uniform circular motion along any ais (the -ais here) is the same as simple harmonic motion. We use our understanding of uniform circular motion
Circular Motion and Simple Harmonic Motion The projection of uniform circular motion along any ais (the -ais here) is the same as simple harmonic motion. We use our understanding of uniform circular motion
THE NEW FOOTBRIDGE IN CITY OF CRACOW DYNAMIC DESIGN AND FINAL VERIFICATION IN TEST LOADING
 4 th International Conference THE NEW FOOTBRIDGE IN CITY OF CRACOW DYNAMIC DESIGN AND FINAL VERIFICATION IN TEST LOADING Krzysztof ŻÓŁTOWSKI Professor University of Technology Gdansk, PL k.zoltowski@bridges.pl
Development of a load model for men-induced loads on stairs
 Porto, Portugal, 30 June - 2 July 2014 A. Cunha, E. Caetano, P. Ribeiro, G. Müller (eds.) ISSN: 2311-9020; ISBN: 978-972-752-165-4 Development of a load model for men-induced loads on stairs Benjamin Czwikla
Adaptive Pushover Analysis of Irregular RC Moment Resisting Frames
 Kalpa Publications in Civil Engineering Volume 1, 2017, Pages 132 136 ICRISET2017. International Conference on Research and Innovations in Science, Engineering &Technology. Selected papers in Civil Engineering
Chapter 16. Waves-I Types of Waves
 Chapter 16 Waves-I 16.2 Types of Waves 1. Mechanical waves. These waves have two central features: They are governed by Newton s laws, and they can exist only within a material medium, such as water, air,
Lateral Load Analysis Considering Soil-Structure Interaction. ANDREW DAUMUELLER, PE, Ph.D.
 Lateral Load Analysis Considering Soil-Structure Interaction ANDREW DAUMUELLER, PE, Ph.D. Overview Introduction Methods commonly used to account for soil-structure interaction for static loads Depth to
Footbridge 2005 Second International Conference
 ASSESSMENT AND CONTROL OF HUMAN INDUCED VIBRATIONS IN THE NEW COIMBRA FOOTBRIDGE Elsa CAETANO Assistant Professor University of Porto Porto, Portugal Álvaro CUNHA Associate Professor University of Porto
Quantification of the Effects of Turbulence in Wind on the Flutter Stability of Suspension Bridges
 Quantification of the Effects of Turbulence in Wind on the Flutter Stability of Suspension Bridges T. Abbas 1 and G. Morgenthal 2 1 PhD candidate, Graduate College 1462, Department of Civil Engineering,
ROSE-HULMAN INSTITUTE OF TECHNOLOGY Department of Mechanical Engineering. Mini-project 3 Tennis ball launcher
 Mini-project 3 Tennis ball launcher Mini-Project 3 requires you to use MATLAB to model the trajectory of a tennis ball being shot from a tennis ball launcher to a player. The tennis ball trajectory model
Chapter 11 Waves. Waves transport energy without transporting matter. The intensity is the average power per unit area. It is measured in W/m 2.
 Chapter 11 Waves Energy can be transported by particles or waves A wave is characterized as some sort of disturbance that travels away from a source. The key difference between particles and waves is a
Modeling of Hydraulic Hose Paths
 Mechanical Engineering Conference Presentations, Papers, and Proceedings Mechanical Engineering 9-2002 Modeling of Hydraulic Hose Paths Kurt A. Chipperfield Iowa State University Judy M. Vance Iowa State
RELIABILITY ASSESSMENT, STATIC AND DYNAMIC RESPONSE OF TRANSMISSION LINE TOWER: A COMPARATIVE STUDY
 RELIABILITY ASSESSMENT, STATIC AND DYNAMIC RESPONSE OF TRANSMISSION LINE TOWER: A COMPARATIVE STUDY Yusuf Mansur Hashim M. Tech (Structural Engineering) Student, Sharda University, Greater Noida, (India)
Analytical model of a rope and karabiner system
 Analytical model of a rope and karabiner system By Philippe Bertreau and Chris Pipe 1. Introduction Various climbing accidents involving the failure of karabiners with their gate open have been reported.
G.C.E (A/L) Examination March In collaboration with
 Examination March In collaboration with") ; G.C.E (A/L) Examination March - 2018 Conducted by Field Work Centre, Thondaimanaru In collaboration with FWC Provincial Department of Education Northern Province Grade:- 12 (2019) Physics Part - II Structured
; G.C.E (A/L) Examination March - 2018 Conducted by Field Work Centre, Thondaimanaru In collaboration with FWC Provincial Department of Education Northern Province Grade:- 12 (2019) Physics Part - II Structured
Finite Element Modal Analysis of Twin Ball Screw Driving Linear Guide Feed Unit Table
 2016 3 rd International Conference on Mechanical, Industrial, and Manufacturing Engineering (MIME 2016) ISBN: 978-1-60595-313-7 Finite Element Modal Analysis of Twin Ball Screw Driving Linear Guide Feed
THE TACOMA NARROWS BRIDGE FAILURE Revision A
 By Tom Irvine Email: tomirvine@aol.com December 29, 1999 THE TACOMA NARROWS BRIDGE FAILURE Revision A Introduction The original Tacoma Narrows Bridge was opened to traffic on July 1, 1940. It was located
Friction properties of the face of a hand-held tennis racket
 Available online at www.sciencedirect.com Procedia Engineering 34 (2012 ) 544 549 9 th Conference of the International Sports Engineering Association (ISEA) Friction properties of the face of a hand-held
Equation 1: F spring = kx. Where F is the force of the spring, k is the spring constant and x is the displacement of the spring. Equation 2: F = mg
 1 Introduction Relationship between Spring Constant and Length of Bungee Cord In this experiment, we aimed to model the behavior of the bungee cord that will be used in the Bungee Challenge. Specifically,
Pedestrian traffic flow operations on a platform: observations and comparison with simulation tool SimPed
 Pedestrian traffic flow operations on a platform: observations and comparison with simulation tool SimPed W. Daamen & S. P. Hoogendoorn Department Transport & Planning, Delft University of Technology,
Experimental Investigation of Reykjavik City Footbridge
 Proceedings of the IMAC-XXVIII February 1 4, 1, Jacksonville, Florida USA 1 Society for Experimental Mechanics Inc. Experimental Investigation of Reykjavik City Footbridge S. Živanović 1, E. T. Ingólfsson,
EDEXCEL NATIONALS UNIT 6 MECHANICAL PRINCIPLES and APPLICATIONS. ASSIGNMENT No. 4
 EDEXCEL NATIONALS UNIT 6 MECHANICAL PRINCIPLES and APPLICATIONS ASSIGNMENT No. 4 NAME: I agree to the assessment as contained in this assignment. I confirm that the work submitted is my own work. Signature
for Naval Aircraft Operations
 Seakeeping Assessment of Large Seakeeping Assessment of Large Trimaran Trimaran for Naval Aircraft Operations for Naval Aircraft Operations Presented by Mr. Boyden Williams, Mr. Lars Henriksen (Viking
Analysis of dilatometer test in calibration chamber
 Analysis of dilatometer test in calibration chamber Lech Bałachowski Gdańsk University of Technology, Poland Keywords: calibration chamber, DMT, quartz sand, FEM ABSTRACT: Because DMT in calibration test
INSTRUMENT INSTRUMENTAL ERROR (of full scale) INSTRUMENTAL RESOLUTION. Tutorial simulation. Tutorial simulation
 INSTRUMENTAL RESOLUTION. Tutorial simulation. Tutorial simulation") Lab 1 Standing Waves on a String Learning Goals: To distinguish between traveling and standing waves To recognize how the wavelength of a standing wave is measured To recognize the necessary conditions
Lab 1 Standing Waves on a String Learning Goals: To distinguish between traveling and standing waves To recognize how the wavelength of a standing wave is measured To recognize the necessary conditions
Numerical and Experimental Investigation of the Possibility of Forming the Wake Flow of Large Ships by Using the Vortex Generators
 Second International Symposium on Marine Propulsors smp 11, Hamburg, Germany, June 2011 Numerical and Experimental Investigation of the Possibility of Forming the Wake Flow of Large Ships by Using the
SECTION A INTRODUCTION AND OBJECTIVES
 SECTION A INTRODUCTION AND OBJECTIVES The objective of the Phase 1 wind study is to determine the performance of the Golden Gate Bridge in strong winds with a variety of possible suicide deterrent systems
Analysis of Shear Lag in Steel Angle Connectors
 University of New Hampshire University of New Hampshire Scholars' Repository Honors Theses and Capstones Student Scholarship Spring 2013 Analysis of Shear Lag in Steel Angle Connectors Benjamin Sawyer
Conditions for occurrence of vortex shedding on a large cable stayed bridge. Full scale data from monitoring system
 Conditions for occurrence of vortex shedding on a large cable stayed bridge. Full scale data from monitoring system O. Flamand 1, F. De Oliveira 1 and A. Stathopoulos-Vlamis, P. Papanikolas 2 1 Centre
Wind effects on tall building frames-influence of dynamic parameters
 Indian Journal of Science and Technology Vol. 3 No. 5 (May 21) ISSN: 974-6846 583 Wind effects on tall building frames-influence of dynamic parameters B. Dean Kumar 1 and B.L.P. Swami 2 1 Department of
Multi-directional Vibration Analysis of Cricket bats
 Multi-directional Vibration Analysis of Cricket bats Sabu John & Zhu Bang Li RMIT University, Department of Mechanical & Manufacturing Engineering, Bundoora East Campus, Bundoora, Vic. 3083, Australia.
An Analysis of Reducing Pedestrian-Walking-Speed Impacts on Intersection Traffic MOEs
 An Analysis of Reducing Pedestrian-Walking-Speed Impacts on Intersection Traffic MOEs A Thesis Proposal By XIAOHAN LI Submitted to the Office of Graduate Studies of Texas A&M University In partial fulfillment
ITTC Recommended Procedures and Guidelines
 Page 1 of 6 Table of Contents 1. PURPOSE...2 2. PARAMETERS...2 2.1 General Considerations...2 3 DESCRIPTION OF PROCEDURE...2 3.1 Model Design and Construction...2 3.2 Measurements...3 3.5 Execution of
Seismic Response of Skewed RC Box-Girder Bridges
 Seismic Response of ed RC Box-Girder Bridges Gokhan Pekcan 1 and Ahmed Abdel-Mohti 2 1 Assistant Prof., Department of Civil and Environmental Engineering, University of Nevada Reno, NV 89557. 2 Graduate
IMO REVISION OF THE INTACT STABILITY CODE. Proposal of methodology of direct assessment for stability under dead ship condition. Submitted by Japan
 INTERNATIONAL MARITIME ORGANIZATION E IMO SUB-COMMITTEE ON STABILITY AND LOAD LINES AND ON FISHING VESSELS SAFETY 49th session Agenda item 5 SLF 49/5/5 19 May 2006 Original: ENGLISH REVISION OF THE INTACT
PHYS 102 Quiz Problems Chapter 16 : Waves I Dr. M. F. Al-Kuhaili
 PHYS 102 Quiz Problems Chapter 16 : Waves I Dr. M. F. Al-Kuhaili 1. (TERM 001) A sinusoidal wave traveling in the negative x direction has amplitude of 20.0 cm, a wavelength of 35.0 cm, and a frequency
Gerald D. Anderson. Education Technical Specialist
 Gerald D. Anderson Education Technical Specialist The factors which influence selection of equipment for a liquid level control loop interact significantly. Analyses of these factors and their interactions
Wave Motion. interference destructive interferecne constructive interference in phase. out of phase standing wave antinodes resonant frequencies
 Wave Motion Vocabulary mechanical waves pulse continuous periodic wave amplitude period wavelength period wave velocity phase transverse wave longitudinal wave intensity displacement amplitude phase velocity
Section 1 Types of Waves. Distinguish between mechanical waves and electromagnetic waves.
 Section 1 Types of Waves Objectives Recognize that waves transfer energy. Distinguish between mechanical waves and electromagnetic waves. Explain the relationship between particle vibration and wave motion.
DYNAMIC POSITIONING CONFERENCE October 7-8, New Applications. Dynamic Positioning for Heavy Lift Applications
 Return to Session Directory DYNAMIC POSITIONING CONFERENCE October 7-8, 2008 New Applications Dynamic Positioning for Heavy Lift Applications John Flint and Richard Stephens Converteam UK Ltd. (Rugby,
CHAPTER IV FINITE ELEMENT ANALYSIS OF THE KNEE JOINT WITHOUT A MEDICAL IMPLANT
 39 CHAPTER IV FINITE ELEMENT ANALYSIS OF THE KNEE JOINT WITHOUT A MEDICAL IMPLANT 4.1 Modeling in Biomechanics The human body, apart of all its other functions is a mechanical mechanism and a structure,
Chapter # 08 Waves. [WAVES] Chapter # 08
![Chapter # 08 Waves. [WAVES] Chapter # 08](/thumbs/94/121079132.jpg "Chapter # 08 Waves. [WAVES] Chapter # 08") Chapter # 08 Waves Q2) Write short answers of the following questions. i) What is the difference between progressive and stationary waves? Answer: Progressive Waves 1 Progressive waves are the result of
Chapter # 08 Waves Q2) Write short answers of the following questions. i) What is the difference between progressive and stationary waves? Answer: Progressive Waves 1 Progressive waves are the result of
Calculation of Trail Usage from Counter Data
 1. Introduction 1 Calculation of Trail Usage from Counter Data 1/17/17 Stephen Martin, Ph.D. Automatic counters are used on trails to measure how many people are using the trail. A fundamental question
Finite Element Analysis of an Aluminium Bike Frame
 Finite Element Analysis of an Aluminium Bike Frame Word Count: 1484 1 1. Introduction Each new bike model must pass a series of structural tests before being released for public retail. The purpose of
Development of Human Body Model for the Dynamic Analysis of Footbridges under Pedestrian Induced Excitation
 Steel Structures 8 (2008) 333-345 www.ijoss.org Development of Human Body Model for the Dynamic Analysis of Footbridges under Pedestrian Induced Excitation Sang-Hyo Kim 1, Kwang-Il Cho 2, *, Moon-Seock
Dynamic Analysis of the Rotterdam Central Station Footbridge Breman, C.; Stuit, H.G.; Snijder, H.H.
 Dynamic Analysis of the Rotterdam Central Station Footbridge Breman, C.; Stuit, H.G.; Snijder, H.H. Published in: Proceedings of the 4th International Footbridge Conference, 6-8 July 11, Wroclaw, Poland
Application Block Library Fan Control Optimization
 Application Block Library Fan Control Optimization About This Document This document gives general description and guidelines for wide range fan operation optimisation. Optimisation of the fan operation
ISOLATION OF NON-HYDROSTATIC REGIONS WITHIN A BASIN
 ISOLATION OF NON-HYDROSTATIC REGIONS WITHIN A BASIN Bridget M. Wadzuk 1 (Member, ASCE) and Ben R. Hodges 2 (Member, ASCE) ABSTRACT Modeling of dynamic pressure appears necessary to achieve a more robust
Mechanical Stabilisation for Permanent Roads
 Mechanical Stabilisation for Permanent Roads Tim Oliver VP Global Applications Technology Tensar International toliver@tensar.co.uk Effect of geogrid on particle movement SmartRock Effect of geogrid on
General Accreditation Guidance. User checks and maintenance of laboratory balances
 General Accreditation Guidance User checks and maintenance of laboratory balances January 2018 Copyright National Association of Testing Authorities, Australia 2010 All intellectual property rights in
Humanoid Robots and biped locomotion. Contact: Egidio Falotico
 Humanoid Robots and biped locomotion Contact: Egidio Falotico e.falotico@sssup.it Outline What is a Humanoid? Why Develop Humanoids? Challenges in Humanoid robotics Active vs Passive Locomotion Active
Bending Vibration Analysis of Pipes and Shafts Arranged in Fluid Filled Tubular Spaces Using FEM
 Bending Vibration Analysis of Pipes and Shafts Arranged in Fluid Filled Tubular Spaces Using FEM By Desta Milkessa Under the guidance of : Prof. Dr.Eng. Patrick Kaeding Dipl.-Ing. Michael Holtmann Developed
At each type of conflict location, the risk is affected by certain parameters:
 TN001 April 2016 The separated cycleway options tool (SCOT) was developed to partially address some of the gaps identified in Stage 1 of the Cycling Network Guidance project relating to separated cycleways.
Autodesk Moldflow Communicator Process settings
 Autodesk Moldflow Communicator 212 Process settings Revision 1, 3 March 211. Contents Chapter 1 Process settings....................................... 1 Profiles.................................................
MIL-STD-883G METHOD
 STEADY-STATE LIFE 1. PURPOSE. The steady-state life test is performed for the purpose of demonstrating the quality or reliability of devices subjected to the specified conditions over an extended time
Abstract. 1 Introduction
 A computational method for calculatingthe instantaneous restoring coefficients for a ship moving in waves N. El-Simillawy College of Engineering and Technology, Arab Academyfor Science and Technology,
A STUDY OF THE LOSSES AND INTERACTIONS BETWEEN ONE OR MORE BOW THRUSTERS AND A CATAMARAN HULL
 A STUDY OF THE LOSSES AND INTERACTIONS BETWEEN ONE OR MORE BOW THRUSTERS AND A CATAMARAN HULL L Boddy and T Clarke, Austal Ships, Australia SUMMARY CFD analysis has been conducted on a 100m catamaran hull
SOIL-STRUCTURE INTERACTION ANALYSIS OF THE MANHATTAN BRIDGE FOUNDATIONS
 10NCEE Tenth U.S. National Conference on Earthquake Engineering Frontiers of Earthquake Engineering July 21-25, 2014 Anchorage, Alaska SOIL-STRUCTURE INTERACTION ANALYSIS OF THE MANHATTAN BRIDGE FOUNDATIONS
Dynamic response of composite caissonpiles
 Dynamic response of composite caissonpiles foundations Maosong Huang Department of Geotechnical Engineering Tongji University, Shanghai, China Outline of talk 1 Introduction 2 Lateral response 3 Seismic
Effect of floating bridge vertical motion on vehicle ride comfort and road grip. Dragan Sekulic, Postdoctoral Researcher
 Effect of floating bridge vertical motion on vehicle ride comfort and road grip Dragan Sekulic, Postdoctoral Researcher GOALS OF INVESTIGATION LOADS: WIND+WAVES BRIDGE (VERTICAL) MOTION DRIVER, VEHICLE
Evaluating the Design Safety of Highway Structural Supports
 Evaluating the Design Safety of Highway Structural Supports by Fouad H. Fouad and Elizabeth A. Calvert Department of Civil and Environmental Engineering The University of Alabama at Birmingham Birmingham,
Modal Analysis of Propulsion Shafting of a 48,000 tons Bulk Carrier
 Modal Analysis of Propulsion Shafting of a 48,000 tons Bulk Carrier Zixin Wang a Dalian Scientific Test and Control Technology Institute. 16 Binhai Street. Dalian, 116013, China. Abstract a wangzixin_1@163.com
City of Elizabeth City Neighborhood Traffic Calming Policy and Guidelines
 City of Elizabeth City Neighborhood Traffic Calming Policy and Guidelines I. Purpose: The City of Elizabeth City is committed to ensure the overall safety and livability of residential neighborhoods. One
Developing FE-Tire Model Library for Durability and Crash Simulations
 7 th International LS-DYNA Users Conference Simulation Technology (3) Developing FE-Tire Model Library for Durability and Crash Simulations Masaki Shiraishi*, Naoaki Iwasaki* Tomoharu Saruwatari +, Kimihiro
g L Agenda Chapter 13 Problem 28 Equations of Motion for SHM: What if we have friction or drag? Driven Oscillations; Resonance 4/30/14 k m f = 1 2π
 Agenda Today: HW quiz, More simple harmonic motion and waves Thursday: More waves Midterm scores will be posted by Thursday. Chapter 13 Problem 28 Calculate the buoyant force due to the surrounding air
Blast Damage Consideratons for Horizontal Pressure Vessel and Potential for Domino Effects
 A publication of CHEMICAL ENGINEERING TRANSACTIONS VOL. 26, 2012 Guest Editors: Valerio Cozzani, Eddy De Rademaeker Copyright 2012, AIDIC Servizi S.r.l., ISBN 978-88-95608-17-4; ISSN 1974-9791 The Italian
Applying Hooke s Law to Multiple Bungee Cords. Introduction
 Applying Hooke s Law to Multiple Bungee Cords Introduction Hooke s Law declares that the force exerted on a spring is proportional to the amount of stretch or compression on the spring, is always directed
Development of TEU Type Mega Container Carrier
 Development of 8 700 TEU Type Mega Container Carrier SAKAGUCHI Katsunori : P. E. Jp, Manager, Ship & Offshore Basic Design Department, IHI Marine United Inc. TOYODA Masanobu : P. E, Jp, Ship & Offshore
Chs. 16 and 17 Mechanical Waves
 Chs. 16 and 17 Mechanical Waves The nature of waves A wave is a traveling disturbance that carries energy from one place to another, and even though matter may be disturbed as a wave travels through a
Rudder Investigation. By Harish M
 Rudder Investigation By Harish M Where and on What? Series of RO RO Vessels designed and constructed by Flensberger Schiffbau Gesselshaft GmbH. Rudders independently manufactured by Macor Neptun GmbH.
Define transverse waves and longitudinal waves. Draw a simple diagram of each
 AP Physics Study Guide Chapters 11, 12, 24 Waves, Sound, Light & Interference Name Write the equation that defines each quantity, include units for all quantities. wave speed-wavelength equation natural
Similarly to elastic waves, sound and other propagated waves are graphically shown by the graph:
 Phys 300/301 Physics: Algebra/Trig Eugene Hecht, 3e. Prepared 01/24/06 11.0 Waves & Sounds There are two fundamental waves of transporting energy and momentum: particles and waves. While they seem opposites,
Motion Control of a Bipedal Walking Robot
 Motion Control of a Bipedal Walking Robot Lai Wei Ying, Tang Howe Hing, Mohamed bin Hussein Faculty of Mechanical Engineering Universiti Teknologi Malaysia, 81310 UTM Skudai, Johor, Malaysia. Wylai2@live.my
The OWEZ Meteorological Mast
 The OWEZ Meteorological Mast Analysis of mast-top displacements P.J. Eecen E. Branlard ECN-E--08-067 OWEZ_R_121_mast_top_movement Acknowledgement/Preface The Off Shore wind Farm Egmond aan Zee has a subsidy
AIRMOUNT VIBRATION ISOLATION
 MOUNT VIBRATION ISOLATION SELECTION AND ISOLATION FORMULA Refer to the selection guide on page 33 for Airmount load and isolation capabilities. Follow this procedure: 1. LOAD CAPACITY Select one or two
Analysis of Pressure Rise During Internal Arc Faults in Switchgear
 Analysis of Pressure Rise During Internal Arc Faults in Switchgear ASANUMA, Gaku ONCHI, Toshiyuki TOYAMA, Kentaro ABSTRACT Switchgear include devices that play an important role in operations such as electric
E02 Rigid hinged stinger with piggyback line
 E02 Rigid hinged stinger with piggyback line This model represents a rigid stinger hinged off the back of a lay vessel using the pipelay supports feature. In addition to the lay pipe, another line is included
RESILIENT INFRASTRUCTURE June 1 4, 2016
 RESILIENT INFRASTRUCTURE June 1 4, 2016 CASE STUDIES ON THE IMPACT OF SURROUNDING BUILDINGS ON WIND-INDUCED RESPONSE John Kilpatrick Rowan Williams Davies and Irwin, Guelph, Ontario, Canada ABSTRACT In
Control of surge and pitch motions of a rectangular floating body using internal sloshing phenomena. Minho Ha and *Cheolung Cheong 1)
") Control of surge and pitch motions of a rectangular floating body using internal sloshing phenomena Minho Ha and *Cheolung Cheong 1) School of Mechanical Engineering, PNU, Busan 609-735, Korea 1) ccheong@pusan.ac.kr
Control of surge and pitch motions of a rectangular floating body using internal sloshing phenomena Minho Ha and *Cheolung Cheong 1) School of Mechanical Engineering, PNU, Busan 609-735, Korea 1) ccheong@pusan.ac.kr
Aerodynamic Measures for the Vortex-induced Vibration of π-shape Composite Girder in Cable-stayed Bridge
 Aerodynamic Measures for the Vortex-induced Vibration of π-shape Composite Girder in Cable-stayed Bridge *Feng Wang 1), Jialing Song 2), Tuo Wu 3), and Muxiong Wei 4) 1), 2, 3), 4) Highway School, Chang
Dynamic Component of Ship s Heeling Moment due to Sloshing vs. IMO IS-Code Recommendations
 International Journal on Marine Navigation and Safety of Sea Transportation Volume 4 Number 3 September 2010 Dynamic Component of Ship s Heeling Moment due to Sloshing vs. IMO IS-Code Recommendations P.
The validity of a rigid body model of a cricket ball-bat impact
 Available online at www.sciencedirect.com Procedia Engineering 34 (2012 ) 682 687 9 th Conference of the International Sports Engineering Association (ISEA) The validity of a rigid body model of a cricket
Modal Analysis of Barrels for Assault Rifles
 PROBLEMS OF MECHATRONICS ARMAMENT, AVIATION, SAFETY ENGINEERING ISSN 2081-5891 2 (8), 2012, 7-16 Modal Analysis of Barrels for Assault Rifles Peter LISÝ, Mário ŠTIAVNICKÝ Academy of the Armed Forces of