FINAL PLAN 2018 PUBLIC REVIEW DRAFT
|
|
|
- Magdalene Wilkerson
- 5 years ago
- Views:
Transcription

1 FINAL PLAN 2018 Adopted by the Metropolitan Development Commission as an element of the Comprehensive Plan for Indianapolis and Marion County Resolution 2018-CPS-R-003 November X, 2018 PUBLIC REVIEW DRAFT
2 Acknowledgements City of Indianapolis Joseph H. Hogsett, Mayor Emily Mack, Director Department of Metropolitan Development Dan Parker, Director Department of Public Works Brian Madison, Director Department of Business and Neighborhood Services Melody Park, Chief Engineer Department of Public Works Brad Beaubien, AICP, Long-Range Planning Administrator Department of Metropolitan Development Meredith Klekotka, AICP, Principal Planner for Transportation Integration Department of Metropolitan Development Metropolitan Development Commission John J. Dillon, III, President Alpha Blackburn Karina Bruns Megan Garver Lena Hackett Brigid Robinson Bruce Schumacher William Selm Jessica Thorpe, AICP, Principal Planner for Land Use Strategy Department of Metropolitan Development Nathan Sheets, Multi-Modal Administrator Department of Public Works Mark Zwoyer, Design Administrator Department of Public Works Larry Jones, Planning & Compliance Administrator Department of Public Works David Borden, Construction Administrator Department of Public Works Jamison Hutchins, Bicycle and Pedestrian Planner Department of Public Works Gretchen Zortman, Project Manager Department of Public Works Indianapolis Metropolitan Planning Organization Consultant Team Nelson\Nygaard Consulting Associates Engaging Solutions HNTB Steering Committee Andy Lutz Citizens Energy Group Anna Gremling Indianapolis Metropolitan Planning Organization Betsy McCaw Central Indiana Corporate Partnership Brian Madison City of Indianapolis Brian Payne Central Indiana Community Foundation Bryan Luellen IndyGo Jill Saligoe-Simmel, Ph.D Brad Beaubien, AICP City of Indianapolis Michael Kaufmann Health and Hospital Corporation Mandala Moyo AARP Melody Park City of Indianapolis Sanjay Patel VS Engineering Sharvonne A. Williams MLK Center Jason Larrison CORE Planning Strategies Cameron Radford City of Indianapolis Transportation Task Forces Mode Shift and Land Use Transportation Investments and Economic Development Community Health and Safety Smart and Resilient Mobility
3 CONTENTS Getting Around Indy Today Using Our Values to Set Priorities Indy s Big Moves Moving Forward Appendices A: Existing Conditions Report B: Pedal Indy C: Project Evaluation Framework D: Complete Project List E: Funding Sources

4 ...due...3min SIT MAP
5 1 Getting Around Indy Today This plan is about moving Indy forward. It integrates our transportation plans and priorities to make the city and neighborhoods more resilient, safe, and prosperous. Getting Around Indy Today lays the foundation for Indy Moves. It provides an overview of challenges and opportunities that Indy faces today, and sets the stage for the recommended projects and programs. 5
6 WHERE WE STAND Indy Moves brings together the city s many transportation plans and projects into an integrated vision. It improves mobility choices for an increasingly interconnected future. This means implementing policies and procedures that reflect our goals, and ultimately getting projects built greenways, sidewalks, bike lanes, and new complete streets. A Transportation Funding Gap Existing transportation needs in Indianapolis have far outpaced current funding sources, and we aren t keeping up. Gas taxes provide the bulk of Indianapolis transportation budget, but these revenues will continue to decrease as cars become more efficient and as electrification expands. The state legislature increased the gas tax in 2017, but the increase did not match the need. Other revenue sources are limited or nonexistent: property taxes can t be used for transportation, and additional income and sales taxes are not available for transportation, except for IndyGo. As of 2016, Indianapolis needed $732M to bring the transportation system into a state of good repair. This does not account for the hundreds of miles of planned greenways, roads, sidewalks, and other transportation infrastructure that has yet to be funded. To put this into perspective, the estimated cost to put a sidewalk on at least one side of every Indianapolis street is $1.6B PUBLIC WORKS TRANSPORTATION REVENUES $7.7M* $4.8M CUMULATIVE FUNDS WHEEL TAX * Will be modified in future years due to HEA 1002 Note: Indianapolis receives an average of $21M in federal funding for transportation each year. $3.2M OTHER FEES AND COLLECTIONS $37.6M* STATE TAXES (Gas tax, MVH, LRS) * Will be modified in future years due to HEA 1002 The $37M per year in gas tax revenues is small relative to the $178M we would need annually to maintain the existing transportation network in reasonable condition. INDY MOVES 2018
7 More People and More Opportunities Indianapolis is a growing city. This presents new opportunities and challenges for the people that live and work here. Affordable transportation choices are important for everyone, whether for school, work, visiting friends and family, or getting to an appointment. As described in the Indy Moves Existing Conditions Report (see Appendix A), Indianapolis has the highest cost of transportation as a percent of income (23%). This number is as low as 16% in Minneapolis and 18% in Denver. At the same time, income inequality is rising, with wages rising 3% for the top 5% of households, and dropping 15% for the median household. High transportation costs and declining incomes make it harder for families to access opportunities and improve their quality of life. Higher cost of living and declining wages make equity especially important in selecting transportation investments. Providing more transportation options like walking, biking, and transit in areas where people are more reliant on these modes will have a greater impact on overall mobility. BOONE COUNTY HAMILTON COUNTY TRANSPORTATION EQUITY INDEX Source: Five-Year American Community Survey ( ) HIGHER LAWRENCE 74 HENDRICKS COUNTY SPEEDWAY INDIANAPOLIS 70 HANCOCK COUNTY LOWER BEECH GROVE 465 Higher means greater reliance on non-auto forms of transportation Miles SOUTHPORT 74 SHELBY COUNTY The Equity Index is based on combined densities of people below 200% of the federal poverty level, adults aged 65 and over, youth aged 10 through 17, no-vehicle households, people with a disability, people with limited English proficiency, and people who self-describe as not White/ Caucasian. MORGAN COUNTY JOHNSON COUNTY Data Sources: American Community Survey 5-Year Estimates, LEHD 2014, Indianapolis MPO, and City of Indianapolis 7
8 Making Safety a Top Priority Safe places to walk, bike, take transit, and drive are critical to Indianapolis future. Indy is a Federal Highway Administration Focus City due to its high number of pedestrian and bicycle fatalities. Based on data from the Aries Database, motorists hit an average of one pedestrian every day in Indianapolis. In 2017 alone, 25 people were killed while walking. The vast majority of crashes involve drivers traveling at high speeds or operating a vehicle while under the influence of alcohol or drugs. The city must focus on designing safer streets and increasing transportation choices to ensure people have safe options to move around our city. DENSITY OF CRASHES RESULTING IN PEDESTRIAN INJURY OR FATALITY, Source: Aries Crash Data , Indianapolis MPO, and City of Indianapolis HAMILTON COUNTY BOONE COUNTY GEOR GE ST ST HIG MIC 71ST ST SHADELAND AVE TOWN RD 86TH ST KEYSTONE AVE OKV 465 THOMPSON RD ILLE RD Miles MORGAN COUNTY SOUTHPORT RD ACTON RD MERIDIAN ST 65 CAMBY RD HANCOCK COUNTY EMERSON AVE SHADELAND AVE BRO SOUTHPORT COUNTY LINE RD JOHNSON COUNTY Data Sources: Aries Crash Data , Indianapolis MPO, and City of Indianapolis INDY MOVES 2018 HIGHER SHELBY COUNTY EDGEWOOD AVE EAST ST BLUFF RD D MANN R BEECH GROVE AVE 465 TROY AVE WASHINGTON ST RAYMOND ST N ISO MAD 70 HARDING ST HOLT RD VE YA CK TU 16TH ST SENOUR RD ENGLISH AVE 70 10TH ST MICHIGAN ST MORRIS ST N KE 21ST ST FRANKLIN RD INDIANAPOLIS P GERMAN CHURCH RD KEYSTONE AVE 25TH ST ARLINGTON AVE ROCKVILLE RD LYNHURST DR 10TH ST 38TH ST SHERMAN DR SPEEDWAY 16TH ST COLLEGE AVE 29TH ST ILLINOIS ST DELAWARE ST MOLLER RD 30TH ST ON ET DL N PE 46TH ST RURAL ST HENDRICKS COUNTY RD RACEWAY RD E TT YE FA MERIDIAN ST LA 74 LAWRENCE IKE 56TH ST BI 56TH ST POST RD NF OR D RD BL VD AN 65 LOWER
9 How Indy Commutes WORK COMMUTE MODE SHARE Source: Five-Year American Community Survey ( ) 85% 2% 2% 1% 10% Cars continue to be the way most Indy residents get to work. Eighty-five percent drive alone, and a further 10 percent carpool. What s Been Done Since 2011, three major city-led planning efforts have guided transportation in Indianapolis: Indy Connect, Plan 2020, and Accelerate Indy. In addition, other organizations and agencies have produced related plans, such as the Indianapolis/Marion County Pedestrian Plan and IndyGo Forward. Indy Connect: Regional Bikeways Plan Indianapolis Bicycle Master Plan Indianapolis Complete Streets Ordinance Plan 2020: HUD Consolidated Plan Indy Greenways fullcircle Master Plan Blue Ribbon Panel on Transportation Infrastructure Report Plan 2020: Marion County Thoroughfare Plan Update Plan 2020: Bicentennial Agenda Indy Connect: Central Indiana Transit Plan Accelerate Indy: Global Trade and Investment Strategy Regional Freight Plan Indianapolis/Marion County Pedestrian Plan Plan 2020: Marion County Land Use Plan Update Plan 2020: Regional Center Plan Update Indy Connect: Blue Line TOD Strategic Plan Future Indiana State Rail Plan 2035 Long-Range Transportation Plan Indy Connect: Red Line Alternatives Analysis Final Report Coordinated Public Transit- Human Services Plan Velocity Action Plan Indy Connect: TOD Strategic Plan Accelerate Indy: Comprehensive Economic Development Strategy Accelerate Indy: Metro Export Plan Quarter cent income tax for transit approved Parks Comprehensive Master Plan Update Indianapolis Transportation Improvement Program Plan 2020: Red Line TOD Strategic Plan 2045 Long-Range Transportation Plan Self-Evaluation and Updated ADA Transition Plan IndyGo Forward 9
10 WHAT WE DID In more than a year of developing Indy Moves, we went from shared community values to a prioritized set of projects. Here are the steps we took to get there. Our Process 1 IDENTIFY SHARED VALUES AND GOALS 2 GATHER PROPOSED PROJECTS FROM EXISTING PLANS OVERLAY PROJECTS INTO MULTIMODAL CORRIDORS 4 3 GET FEEDBACK AND PROJECT IDEAS FROM THE COMMUNITY 5 Project PRIORITIZE PROJECTS USING CRITERIA BASED ON SHARED GOALS 6 DEVELOP INDY MOVES CAPITAL PLAN In addition to a priority list of capital projects, Indy Moves provides guidance on programs, policies, organization, and implementation. INDY MOVES 2018
11 2 Using Our Values to Set Priorities Our shared community values underpin Indy Moves. This is your plan, and these are your priorities. Indy Moves uses a set of shared values for transportation and mobility as a starting point to develop transportation priorities. This section explains in greater detail how we gathered input, what you had to say, and how we used your feedback to develop a framework to prioritize projects. 11
12 HOW WE GATHERED INPUT For Indy Moves to be meaningful, it needs to reflect the priorities of the community. Outreach was a critical part of the plans that came before Indy Moves, and that feedback has helped to shape this work. This includes interpreting the key values of Indy s Comprehensive Plan, which calls for making our city healthier, more inclusive, more resilient, and more competitive. Indy Moves is also informed by new input, ensuring that it is current with your transportation needs. We ve heard a lot from Indy residents over the last year, at public open houses, through online surveys, and in our Steering Committee and Task Force meetings. Sources of Input PRIOR PLANS STEERING COMMITTEE & TASK FORCE MEETINGS IN-PERSON OPEN HOUSES Timeline of Outreach Activities ONLINE SURVEYS ONGOING COMMUNITY ENGAGEMENT Key public input point Key public input point Summer 2017 Fall 2017 Winter 2018 Project kickoff Steering Committee meeting Open house public kickoff Pop-up events at neighborhood locations Online survey about transportation strengths, opportunities, and values Steering Committee meeting Task Force meetings 13 open houses to gather neighborhood project ideas Online mapping tool to gather feedback about proposed transportation projects and new project ideas Steering Committee meeting Task Force meetings INDY MOVES 2018


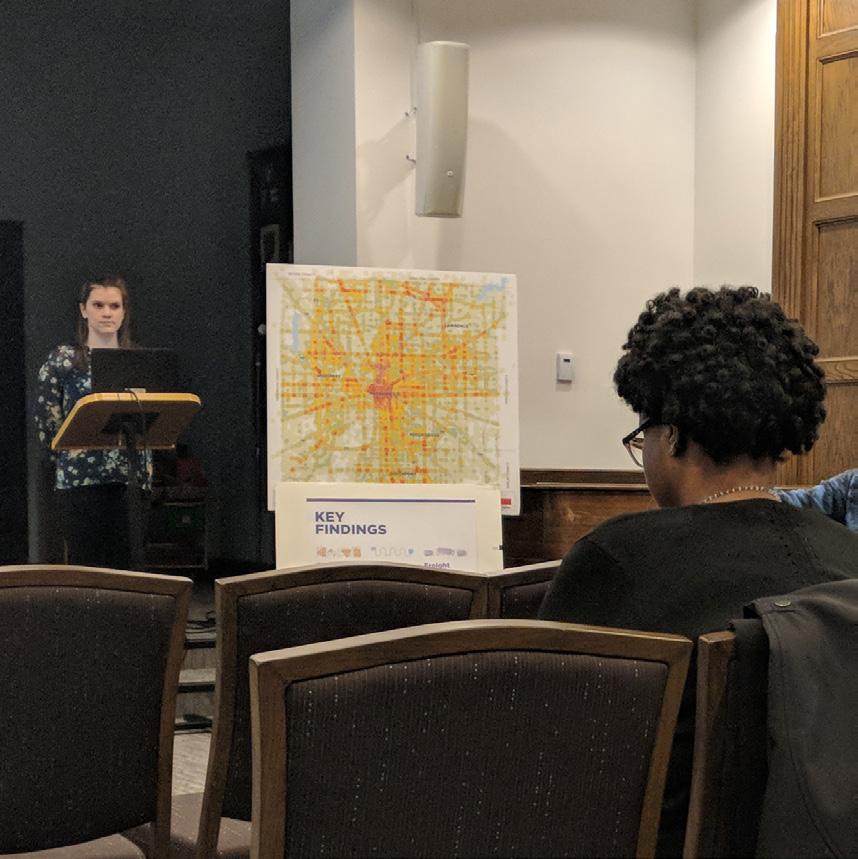
13 PHOTOS OF OUTREACH ACTIVITIES IN INDIANAPOLIS Source: Nelson\Nygaard, City of Indianapolis Key public input point Spring 2018 Summer 2018 Fall 2018 Steering Committee meeting Steering Committee meeting Pedal Indy engagement Open house for draft plan Online tool for comments on draft plan The Steering Committee is made up of community organizations, major institutions, the philanthropic community, city staff working on all aspects of transportation, IndyGo, and members of the private sector. They help ensure Indy Moves reflects community priorities. 13
14 WHAT WE HEARD Early in the development of Indy Moves, we asked you what you like and don t like about getting around Indianapolis today. The feedback we received from more than 1,000 people helped us better understand our strengths and challenges. Here s what you had to say: We need more transportation options. Although the car is the most common mode of transportation in Indy today, many people said that they also walk, bike, and take transit. There was strong support for making non-driving modes more comfortable and attractive. Safety is paramount. A full two-thirds (67%) of you identified safety as a key transportation issue by far the greatest concern. Travel time was of secondary importance at 46%, followed by ease of use (32%) and affordability (30%). Basic walking infrastructure and maintenance is lacking. The biggest challenge identified for walking was the lack of sidewalks. People asked for more sidewalks, fewer gaps, better lighting, and better maintenance of existing infrastructure to make walking better in Indy. For driving, road maintenance is the greatest concern. Nearly three-quarters of people (73%) said driving would be better with no potholes. People also identified reducing congestion (37%) and improving lighting (35%) as ways to make it easier and safer to drive in Indy. For transit, residents want more frequent service and more pleasant waiting areas. Over two-thirds of people (69%) said taking transit would be better with more frequent service. People also asked for more comfortable stops and stations (52%) as well as better connections to transit. For biking, separated bike lanes, trails, and greenways are critical. Citing safety concerns due to high traffic volumes and speeds, people identified greenways and other protected bicycle facilities as both the best part of today s bicycle network and the biggest need to improve bicycling conditions. INDY MOVES 2018


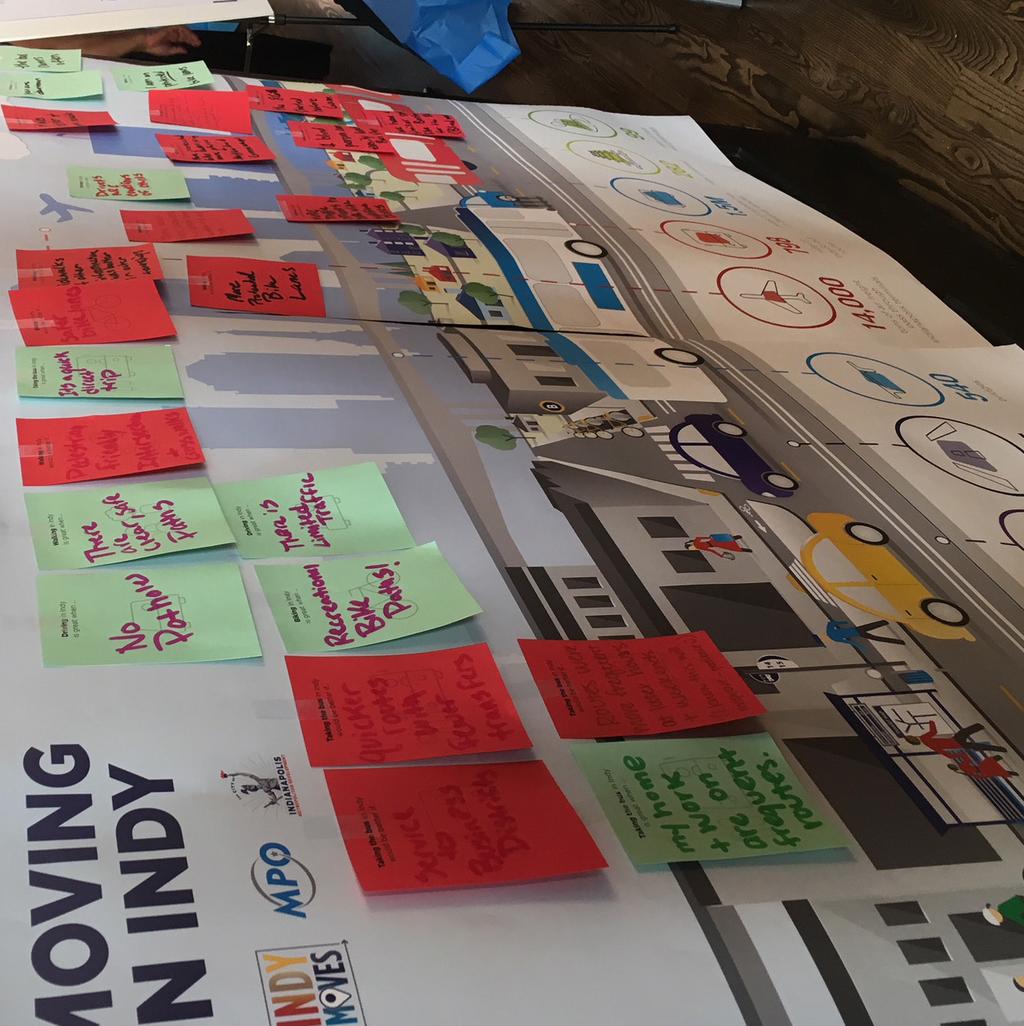
15 FINDINGS FROM OUTREACH ACTIVITIES Source: Nelson\Nygaard, City of Indianapolis 15
16 Indy Moves goals help establish shared priorities We used the values you shared to develop seven goals to guide Indy Moves. Those goals reflect our current priorities as well as where we want to go in the coming decades. They were used to shape the project evaluation framework for capital projects described in the following chapter. Priorities HEALTH & SAFETY Improve safety and promote health No traffic-related fatalities or serious injuries More physical activity and better health outcomes SUSTAINABILITY & RESILIENCE Enhance environmental sustainability and resilience Climate resilient infrastructure Landscaping and complete streets Clean air and reduced emissions ECONOMIC DEVELOPMENT Support inclusive economic development Transportation network connectivity Access to employment and education Seamless connections EQUITY Address disparities and increase access to opportunity Access to community destinations Infrastructure for communities of concern Mobility options for vulnerable populations CHOICES Expand mobility choices Faster, more reliable transit Better active transportation options Accessible transportation network CONNECTIONS Connect and strengthen our region, city, and existing neighborhoods STRATEGIC INVESTMENT Invest strategically and transparently, with a focus on ehancing existing infrastructure Transportation for all ages and abilities Better access to emerging villages, neighborhood nodes, and regional destinations Safe, inviting, active spaces at all times of day Well-maintained infrastructure Cost-benefit balance in project delivery Easy to find project information for the public INDY MOVES 2018
17 3 Indy s Big Moves This plan charts a bold course forward with long-range projects and programs to improve and integrate transportation in Indy. Indy s Big Moves presents our high priority projects, and showcases examples that illustrate where we re heading in terms of the transportation network. It also includes supportive programs and policies that will help us work toward our shared goals. 17

18 WHAT MAKES A PROJECT? The Indy Moves capital projects include many different elements that support people traveling on foot or by bike, on a bus, and in a car. These features combine to create a transportation system for Indianapolis that helps to improve safety and mobility for everyone CITY CENTER...due LIBRARY...3min. TRANSIT MAP TRANSIT IMPROVEMENTS SIDEWALKS HIGH VISIBILITY CROSSWALKS MULTI-USE PATHS BIKE LANES INDY MOVES 2018
19 SMART TRAFFIC SIGNALS TRAFFIC CALMING NEIGHBORWAYS NEW OR EXPANDED ROADS GREENWAYS 19

20 INDY MOVES CAPITAL PROJECTS From 22 prior plans, 14 open houses, and more than 500 individual project ideas provided by Indy residents, we developed four different types of capital projects for Indy Moves. Each of our final 461 projects uses different combinations of the elements shown on the previous pages to create new ways to move around Indianapolis. Despite all that work, these are still preliminary project ideas! Further planning and design will be closely coordinated among city departments and agencies, with the community, and in conjunction with operational improvements (like transit lanes or signal timing) as funding is available. Capital projects help build or improve city infrastructure. They involve new construction, expansion, renovation, or replacement of existing facilities. Unlike operational improvements like traffic signal timing or road restriping capital projects include significant physical infrastructure. Categories of Capital Projects Complete Streets Complete streets allow people of all ages and abilities to use the street, regardless of how they travel. This means providing facilities to support walking, biking, other mobility devices, cars, trucks and, where available, transit. For the purposes of Indy Moves, Complete Streets projects include roadway expansion. Complete Streets projects may include: PROJECTS Complete Street Upgrades Complete Street Upgrades involve upgrading an existing road by adding both walking and biking infrastructure (as well as transit improvements where relevant). This can take the form of a multiuse path or separate sidewalks and bike lanes. These are different from Complete Streets projects because they do not include new road construction or expansion. Complete Street Upgrade projects may include: PROJECTS INDY MOVES 2018

, AND ELLENSBURG, WA (BOTTOM) Source: Nelson\Nygaard 59 PROJECTS 199 PROJECTS Greenways Active Transportation Greenways are shared, off-street paths for")
21 What is a neighborway? Neighborways are slow-speed, lowvolume streets shared by people driving and bicycling. They include improvements that calm traffic and give people walking and bicycling priority: 20 MPH speed limit signs, stop signs for side streets crossing the neighborway, speed humps and traffic circles, wayfinding signs and pavement markings, and easier crossings of busy streets with crosswalks, flashing beacons, or traffic signals. EXAMPLES OF NEIGHBORWAYS IN PORTLAND, OR (TOP), AND ELLENSBURG, WA (BOTTOM) Source: Nelson\Nygaard 59 PROJECTS 199 PROJECTS Greenways Active Transportation Greenways are shared, off-street paths for walking, biking, and other mobility devices like wheelchairs. Greenways are often located in a park-like environment or along a river or abandoned railway. Active Transportation projects include either walking or biking infrastructure. This can mean either sidewalks, neighborways, bike lanes, or protected bike lanes. Active Transportation projects can also include related traffic calming and intersection improvements. Complete separation from auto traffic makes greenways comfortable and accessible for all. They support all types of trips, whether commuting, recreating, shopping, or visiting friends. Greenways projects may include: Active Transportation projects may include: 21
22 All Indy Moves Capital Projects Hamilton County ALL ISO NV ILL ER EAST ST Morgan County MERIDIAN ST PADDOCK RD W MOORESVILLE RD CARROLL RD SHADELAND AVE Hancock County GERMAN CHURCH RD MITTHOEFFER RD POST RD THOMPSON RD CAMBY RD RD SOUTHPORT RD SOUTHPORT SH EL BY V IL LE Shelby County BLUFF RD EDGEWOOD AVE ILLE 465 AVE MANN BL VD BEECH GROVE N ISO 465 OKV MAD 70 RAYMOND ST BRO COUNTY LINE RD TROY AVE RD KE KEYSTONE AVE E AV KY UC T N HARDING ST HOLT RD IN ASH WW WASHINGTON ST SENOUR RD ENGLISH AVE GTO 16TH ST 10TH ST MICHIGAN ST MORRIS ST T NS NF OR D BI KEYSTONE AVE INDIANAPOLIS 70 ACTON RD ROCKVILLE RD LYNHURST DR 10TH ST 21ST ST FRANKLIN RD SPEEDWAY 16TH ST E PIK ND SHADELAND AVE W 21ST ST 25TH ST N TO LE PE ARLINGTON AVE 29TH ST EMERSON AVE 30TH ST RD 56TH ST 38TH ST SHERMAN DR LE COLLEGE AVE MOLLER RD 74 DS VIL LAWRENCE 46TH ST RURAL ST Hendricks County RD RACEWAY RD E TT YE FA CR AW FO R MERIDIAN ST LA W KESSLER BLVD N DR GUION RD D 56TH ST KESSLER BLVD DR ILLINOIS ST DELAWARE ST 65 E 82ND ST 71ST ST R AN HIG MIC 71ST ST GRANDVIEW DR 465 GEOR GE W 79TH ST TOWN RD 86TH ST D N MERIDIAN ST Boone County RD STOP 11 RD MAZE RD COUNTY LINE RD Johnson County Miles Complete Complete Streets Streets Indy Moves projects come from many sources, including the fullcircle Indy Greenways Master Plan (2014), the Thoroughfare Complete Complete StreetStreet Plan (2016), Pedal Indy (2018), and the Indianapolis/Marion Complete Complete StreetStreet Upgrades Upgrades County Pedestrian Plan (2016). Also included are select Multi-Use Multi-Use Path Path individual projects, like the 38th Street International Marketplace WalkBike and Bike Walk and multi-use path, and hundreds of ideas from Indy residents. All BRT Priority BRT Priority of these projects were grouped along corridors to form the four Complete Complete StreetStreet Upgrade Upgrade types of projects shown on the previous pages. More information about these projects is available in Appendix D. Greenways Greenways Greenway Greenway ActiveActive Transportation Transportation Bike Bike Walk Walk BRT Priority BRT Priority ActiveActive Transportation Transportation Freight Freight Rail Relocation Rail Relocation FreightFreight Rail Relocation Rail Relocation INDY MOVES 2018
23 Capital Project Scores Hamilton County ALL ISO NV ILL ER EAST ST CARROLL RD SHADELAND AVE BL VD Hancock County GERMAN CHURCH RD MITTHOEFFER RD POST RD 74 SOUTHPORT RD SOUTHPORT SH EL BY V IL LE RD STOP 11 RD MAZE RD COUNTY LINE RD Johnson County Shelby County MERIDIAN ST PADDOCK RD Morgan County RD COUNTY LINE RD BLUFF RD MANN THOMPSON RD 65 W MOORESVILLE RD ILLE 465 AVE EDGEWOOD AVE CAMBY RD OKV BEECH GROVE N ISO 465 RAYMOND ST BRO MAD 70 KEYSTONE AVE TROY AVE RD KE HARDING ST HOLT RD E AV KY UC T N WASHINGTON ST SENOUR RD ENGLISH AVE IN ASH WW 10TH ST MICHIGAN ST MORRIS ST T NS GTO NF OR D BI KEYSTONE AVE INDIANAPOLIS 70 ACTON RD ROCKVILLE RD LYNHURST DR 10TH ST 21ST ST 16TH ST FRANKLIN RD SPEEDWAY 16TH ST 25TH ST E PIK PE SHADELAND AVE W 21ST ST ON ET L ND ARLINGTON AVE 29TH ST EMERSON AVE 30TH ST RD 56TH ST 38TH ST SHERMAN DR LE COLLEGE AVE MOLLER RD 74 DS VIL LAWRENCE 46TH ST RURAL ST Hendricks County RD RACEWAY RD E TT YE FA CR AW FO R MERIDIAN ST LA W KESSLER BLVD N DR GUION RD D 56TH ST KESSLER BLVD DR ILLINOIS ST DELAWARE ST 65 E 82ND ST 71ST ST R AN HIG MIC 71ST ST GRANDVIEW DR 465 GEOR GE W 79TH ST TOWN RD 86TH ST D N MERIDIAN ST Boone County Miles Using the Indy Moves goals, we developed 14 evaluation criteria to help us determine which projects best meet those goals. The map above shows how the projects scored. Higher scoring projects are found throughout the city. The projects in green represent the projects that received more points in the evaluation, which will be the first to advance into further planning and design as resources become available points 9 10 points 7 8 points 5 6 points 1 4 points 23
24 High Priority Projects Hamilton County ALL ISO NV ILL ER EAST ST Morgan County MERIDIAN ST PADDOCK RD W MOORESVILLE RD CARROLL RD SHADELAND AVE BL VD Hancock County GERMAN CHURCH RD MITTHOEFFER RD POST RD SHADELAND AVE THOMPSON RD 74 SH 65 CAMBY RD RD EL SOUTHPORT RD BY V IL SOUTHPORT LE Shelby County BLUFF RD MANN EDGEWOOD AVE ILLE 465 AVE 465 OKV BEECH GROVE N ISO 70 5 MAD RD KE TROY AVE RAYMOND ST BRO COUNTY LINE RD E AV KY UC T N NF OR D BI 4 WASHINGTON ST SENOUR RD GTO 16TH ST ACTON RD T NS IN ASH WW KEYSTONE AVE ENGLISH AVE 70 10TH ST MICHIGAN ST MORRIS ST HARDING ST 1 INDIANAPOLIS HOLT RD ROCKVILLE RD LYNHURST DR 10TH ST E PIK FRANKLIN RD SPEEDWAY 16TH ST 21ST ST ARLINGTON AVE W 21ST ST 25TH ST EMERSON AVE RD PE 2 SHERMAN DR 29TH ST N TO LE ND 46TH ST 38TH ST KEYSTONE AVE LE 30TH ST COLLEGE AVE MOLLER RD 74 DS VIL LAWRENCE 56TH ST 3 RURAL ST Hendricks County RD RACEWAY RD E TT YE FA CR AW FO R MERIDIAN ST LA W KESSLER BLVD N DR GUION RD D 56TH ST KESSLER BLVD DR ILLINOIS ST DELAWARE ST 65 E 82ND ST 71ST ST R AN HIG MIC 71ST ST GRANDVIEW DR 465 GEOR GE W 79TH ST TOWN RD 86TH ST D N MERIDIAN ST Boone County RD STOP 11 RD MAZE RD COUNTY LINE RD Johnson County The map above presents the highest priority projects based on our evaluation framework (see page 14 and Appendix C). These are the projects to focus on early, for a high level of impact. The numbered projects are showcased on pages as examples of the improvements Indy Moves recommends for each project type. Note: BRT Priority projects are those located along proposed BRT lines. These have special implementation and funding characteristics and require ongoing direct collaboration with IndyGo Miles Complete Complete Streets Streets Complete Complete StreetStreet Complete Complete StreetStreet Upgrades Upgrades Greenways Greenways Greenway Greenway ActiveActive Transportation Transportation Multi-Use Multi-Use Path Path Bike Bike WalkBike and Bike Walk and Walk Walk BRT Priority BRT Priority Complete Complete StreetStreet Upgrade Upgrade BRT Priority BRT Priority ActiveActive Transportation Transportation Freight Freight Rail Relocation Rail Relocation FreightFreight Rail Relocation Rail Relocation INDY MOVES 2018
25 Project Spotlight 1: Girls School Rd Complete Street 3.8 $18.0M PROJECT LENGTH (MI) COST ESTIMATE Complete street with a sidewalk and multi-use path for people walking and bicycling along Girls School Rd between Morris St and Crawfordsville Rd CRAWFORDSVILLE RD Eliza Hendricks School E a gle C re ek I-74 Project Need Improve safety for all, especially south of 10th St, which is a high bike and pedestrian crash area Increase multimodal access to several schools, employment clusters including Carrier, and Indianapolis Public Library Wayne Branch Features Thoroughfare expansion and improvements, including installation of consistent two-way center-turn lane, curb and gutter, drainage improvements, and utility relocation Sidewalk (with curb, gutter, and drainage) and lighting on one side Multi-use path with landscaped buffer along one side Pedestrian crossing improvements at intersections (high-visibility crosswalks, ADAcompliant curb ramps, curb extensions to shorten crossing distance, pedestrian signal heads with countdowns and push buttons) Traffic signal upgrades Key Considerations COUNTRY CLUB RD 10TH ST Ben Davis Park 21ST ST Covenant Christian School Lynhurst Preschool Ben Davis High School Chapel Hill Middle School Chapel Hill Shopping Center Rockville Plaza Complete Street Indianapolis Public Library Wayne Branch Amazon Fulfillment Center Girl Scouts of Indiana Chapelwood Elementary School Chapel Hill Christian School ROCKVILLE RD I-465 HIGH SCHOOL RD Connect new sidewalk segments south of 21st St to the existing sidewalk on the west side of Girls School Rd north of 21st St Key intersection improvements needed at Girls School Rd and Morris St, Rockville Rd, W 21st St, and Crawfordsville Rd MORRIS ST Carrier Target GIRLS SCHOOL RD WASHINGTON ST Miles 25
26 Project Spotlight 2: Arlington Ave Protected Bike Lane 5.1 $5.6M PROJECT LENGTH (MI) COST ESTIMATE Protected bike lanes on Arlington Ave, from 10th St to 56th St Project Need Provide key north-south bike connection for Warren and Lawrence Townships Connect Pleasant Run and Fall Creek, via existing bike lanes south of 10th St, 46th St and Emerson Ave Improve safety for all, as Arlington Ave overlaps with several high-crash zones Increase connections to schools Support future frequent transit service south of 42nd St Features One-way protected bike lane on each side of the street Intersection improvements, including protected intersection treatments, high-visibility crosswalks, and ADA-compliant curb ramps Floating bus islands that route bikes away from traffic and behind people waiting at the bus stop Traffic signal upgrades Key Considerations Low vehicle volumes support repurposing outer travel lanes into one-way protected bike lanes Focus intersection improvements at challenging locations such as the five-way intersection at E 34th and Massachusetts Ave Frequent transit route should account for needs of transit and cyclists 34TH ST 46TH ST EMERSON AVE Cathedral High School 42ND ST Wes Montgomery Park Robert Lee Frost School 106 Arlington Woods Elementary School Little People s Prep Day School I-70 Brien Park Windsor Village West Head Start Center 21ST ST 16TH ST RITTER AVE The Exhibit House DaVita Indy East Dialysis CVS Fall Creek Protected Bike Lane 56TH ST Brook Park Elementary School Arlington High School (closed) Devington Shopping Center Kimball Electronics Fabrication Eskenazi Health Center 30TH ST Unisource Marion Co Health Dept Raytheon Arlington Place Health Campus Family and Social Services Administration Ace Hardware Walgreens MASSACHUSETTS AVE SHADELAND AVE 38TH ST I TH ST INDY MOVES 2018 MICHIGAN ST NEW YORK ST Ellenberger Park P leasan t R un ARLINGTON AVE WASHINGTON ST Miles
27 Project Spotlight 3: Tacoma Ave Neighborway 1.5 $4.5M PROJECT LENGTH (MI) COST ESTIMATE Traffic-calmed neighborway gives priority to people walking and bicycling along Tacoma Ave, from 30th St to the Fall Creek Trail Project Need Improve safety for all in a historic high crash area by establishing a bicycle- and walking-priority route on a low-volume, slow-speed street parallel to the busy Keystone Ave Provide better access to the Fall Creek Trail from the northeastern part of Center Township Enhance connections with bus rapid transit at 38th St Provide safe and comfortable routes to schools, including Joyce Kilmer, KIPP, Tindley, and Avondale Features Neighborway pavement markings and wayfinding Intersection improvements at busy streets: crosswalks, flashing beacons, traffic signals, or sidepaths at skewed intersections Traffic calming: stop signs, speed humps, traffic circles, 20 MPH speed limit Fall Creek Trail connection: landscape maintenance, pedestrian lighting, wayfinding FALL CREEK PKWY N DR RALSTON AVE MILLERSVILLE RD 38TH ST Child Advocacy Center Joyce Kilmer School 69 34TH ST Fall C TACOMA AVE Neighborway reek Trail Sutherland Park Cemetery Fall C Indiana BMV Marion Co Public Health Dept Tindley School OXFORD AVE r e e k Avondale Meadows Academy Avondale Meadows YMCA Washington Park Eskenazi Health Urgent Care East Key Considerations Work closely with residents to design the neighborway and support local access needs Low-volume street with the ability to become an excellent low-stress connection for people walking and bicycling Intersection improvements at busy street crossings (e.g., 38th St) can be a barrier and must be addressed in design Evaluate potential for low-cost walking improvements (e.g., asphalt sidewalk with linear curb stops) north of E 33rd St where there are no sidewalks KIPP Indy Public Schools Bleckwith Park 30TH ST 25TH ST KEYSTONE AVE Indianapolis Metropolitan Police Dept Martindale-Brightwood CDC Miles 27
28 Project Spotlight 4: Vandalia Trail / Minnesota St Neighborway 10 $17.4M PROJECT LENGTH (MI) COST ESTIMATE BRIDGE PORT RD Washington Healthcare Center ROCKVILLE RD GIRLS SCHOOL RD PERIMETER RD Greenway Indianapolis International Airport Kmart HIGH SCHOOL RD PIERSON DR I-465 LYNHURST DR WASHINGTON ST Maplewood Elementary School MINNESOTA ST Indiana National Guard HOLT RD TIBBS AVE I-70 Rolls Royce Plant BELMONT AVE MORRIS ST Neighborway KENTUCKY AVE HARDING ST Mul t Eli Lilly and Company RAYMOND ST i -Use Path Indiana Convention Center SOUTH ST Lucas Oil Stadium Miles Continuous walking and bicycling connection from Bridgeport to downtown via greenway, neighborway, multi-use path, and protected bike lanes Project Need Create a connection between proposed White Lick Creek Greenway and the Eagle Creek Greenway Provide east-west link in Wayne Township from planned greenway to downtown Improve walking and biking access to key employment centers (e.g., Lilly Industrial Center), several elementary schools, Lucas Oil Stadium, as well as White River, Eagle Creek, and White Lick Creek Improve safety in several high-crash zones, including the intersection of Kentucky Ave and South St, and Minneapolis St between Lynhurst Dr and Holt Rd Connect to future Blue Line BRT stations and S Girls School Rd proposed complete street INDY MOVES 2018 Features Off-street greenway in former rail corridor and along the perimeter of Indianapolis International Airport Calm traffic and add sidewalks, wayfinding, sharrows, and signage along Minnesota St A combination of multi-use path and protected bike lanes will complete the connection along busy streets into downtown. Intersection improvements and dedicated space for people walking and riding bicycles to create continuous connection Key Considerations Long-term project may require phasing as partnerships develop and funding becomes available Several portions of the project area have constrained right-of-way, heavy freight traffic, interstate undercrossings, bridges, and busy intersections Special consideration will need to be given to design of the multi-use path to safely and continuously accommodate people walking and bicycling Partnership with Indy Parks and other funding partners will be integral to the success of this project Coordination and partnership with large land owners along this route will be needed, including Indianapolis International Airport and Eli Lilly and Company
29 Project Spotlight 5: Hanna Ave Multi-Use Path and Complete Street 3 $6M PROJECT LENGTH (MI) COST ESTIMATE EAST ST Southgate Plaza Shopping Center University of Indianapolis HANNA AVE Walmart Multi-Use Path Complete Street Southern Plaza Shopping Center LAWRENCE AVE SHELBY ST STATE AVE Raymond F. Brandes Elementary School I Miles MADISON AVE THOMPSON RD KEYSTONE AVE CARSON AVE I-65 SHERMAN DR 9TH AVE Multi-use path and complete street creating continuous, dedicated space for people walking, bicycling, and driving along E Hanna Ave and S Sherman Dr Project Need Improve walking and bicycling access between residential and commercial areas in south Indianapolis, including safe and convenient access to Red Line BRT, University of Indianapolis, and the proposed Lick Creek Greenway Address high crash areas on Hanna Ave and Sherman Dr Provide active transportation infrastructure over I-465 and I-65 Create safe connections to transit on Hanna Ave Features Multi-use path along the entire length of the project including bicycle and pedestrian bridges to connect over I-65 and Carson and Lick Creeks Intersection improvements: high-visibility crosswalks, ADA-compliant curb ramps, pedestrian-activated beacons Transit improvements: bus bulbs, upgraded stops, lighting Traffic signal upgrades Key Considerations E Hanna Ave is a transit route, requiring coordination with IndyGo Outer travel lane can be repurposed to support multiuse path construction in wider portions of corridor, but right-of-way (or coordination with Indy Parks) may be needed in other areas Phased implementation should focus in areas (e.g., E Hanna Ave) that lack sidewalks Thoroughfare expansion and improvements, adding sidewalks and creating a consistent three-lane cross section along Hanna Ave, including curb and gutter and drainage improvements 29
30 MAKING INDY S STREETS SAFER During the development of Indy Moves, we heard from thousands of people that safety is a top priority for Indy residents. To make our streets safer will take a concerted effort. We must implement both policies and programs that set safety as a clear priority for our streets. Vision Zero Implement Indy Vision Zero, with the goal of eliminating fatalities and severe injuries as a result of traffic collisions. Every traffic collision in Indianapolis is a preventable outcome of street design, behavior, and policy. Indy Vision Zero would identify high-risk intersections and corridors, and apply a mix of the following four strategies to improve safety: PEDESTRIAN FATALITIES The number of pedestrians killed by motor vehicles in collisions increased dramatically between 2004 and ENGINEERING AND DESIGN ENFORCEMENT AND EDUCATION EVALUATION AND MONITORING EQUITY Make design changes to streets and intersections to reduce speeding, calm traffic, and provide infrastructure for people walking, bicycling, and taking transit. Encourage safe travel behavior and support a culture of safety. This may include speed monitoring devices, educational programs, and traditional speed limit enforcement. Monitor safety measures and collision locations. Use these data to identify what works best, and to target resources where they will have the greatest impact. Focus efforts to improve safety in communities that are disproportionately affected by traffic collisions and unsafe street conditions. INDY MOVES 2018
31 Street Types Define types of streets to guide right-of-way design based on land uses, safety, and priorities for different transportation modes. Clearly defined street types help to communicate the designs that are appropriate for different kinds of streets. Street type definitions depend on relevant travel modes, adjacent land uses, safety considerations, community needs, the environmental context, and required functionality. NEIGHBORHOOD BUSINESS Narrow travel lanes 2. Frequent pedestrian crossings 3. Parking for both vehicles and bicycles 4. Generous sidewalks CROSSTOWN CONNECTORS 1 4 Developing street types helps to set expectations for the improvements that are appropriate in different contexts. Street design is not one-sizefits all. To support implementation of the capital projects identified in Indy Moves, Indianapolis should develop street types to clarify which streets are priorities for which modes. Each street type should list its anticipated use, typical design features, and desired targets or metrics, such as speed limits, roadway widths, or vehicle volumes. These should be supported by basic cross-sections that demonstrate what people can expect to see Greater vehicle capacity and efficiency 2. Well marked pedestrian crossings 3. Parkways buffer sidewalks from moving travel lanes NETWORK RESIDENTIAL 1 2 Is this street a freight corridor, or a local neighborhood street? Is it home to shops or an elementary school? Street types tell us how to treat these different contexts Marked centerline 2. Shared access points; few driveways 3. Sidewalks on both sides SELECTION OF STREET TYPES IN GRAND RAPIDS, MI Source: Grand Rapids Vital Streets
32 MAKING STRATEGIC INVESTMENTS Indianapolis is a huge city of over 400 square miles. Across that geography, transportation needs are significant, and there is not enough funding for either basic maintenance or new projects. Making strategic investments focusing on existing resources and operational improvements to keep people moving can help to improve the existing system as well as our future transportation network. Maintenance and Repair Funding Program Establish a transportation maintenance funding program to support preservation of existing infrastructure. A dedicated multimodal maintenance and repair fund would help to address the backlog of maintenance needs and help to bring Indianapolis transportation system back into a state of good repair. This program would include: As of 2016, the cost to bring the city s transportation system to a state of good repair was estimated at $732M. MAINTENANCE CYCLES ALL MODES GOAL-ORIENTED TRANSPARENT Formalize regular evaluation and maintenance cycles for different types of infrastructure. Broaden evaluation metrics from pavement condition to include, for example, crosswalk restriping and bike lane condition. Tie maintenance funding to a prioritization process linked to Indy Moves goals. Be transparent by making condition information and maintenance plans accessible to the public. INDY MOVES 2018
33 Adaptive Signals Upgrade traffic signals with adaptive technology to improve travel time reliability for all modes. Adaptive signal control technology uses advanced traffic signals, traffic sensors, and computer algorithms to change signal timing based on real-time traffic conditions. This provides three key benefits: CONGESTION BUS RELIABILITY FREIGHT Improves travel time reliability and reduces congestion Helps keep IndyGo buses moving Supports efficient movement and delivery of goods Explore changes to state law regarding transportation impact fees to help fund transportation improvements in areas of new development. Indy should continue moving forward to implement an adaptive signal network, focused first on the city s most congested corridors. Using adaptive signals with transit signal priority can support IndyGo s transit capital and service investments, including new bus rapid transit. And using adaptive signals on major freight corridors can make it easier and more affordable for both long-haul and local deliveries to reach their destinations. Implementing adaptive signals can be expensive, with major capital costs for equipment and installation. Indianapolis may be able to defray some of these costs by becoming an early adopter of the technology and applying for innovationbased grants and incentives. Transportation Impact Fees Indiana state law limits how cities can apply impact fees. However, Indianapolis should explore potential changes to state law to support development of new types of impact fee programs. Transportation impact fees can be used to fund transportation improvements needed to support new development. Impact fees are an important tool to ensure that private development is contributing to the transportation system in a way that is proportional to the development s size and land use. Indianapolis should work with neighboring jurisdictions and the state to explore changes to impact fee laws that broaden the definition of impacts and the ways fees can be applied. A transportation impact fee program should be paired with other strategies to ensure that transportation improvements are focused in the areas of greatest need. 33
34 PROVIDING MOBILITY OPTIONS While most people in Indy still travel primarily by car, we heard a desire for new ways to travel during our outreach for Indy Moves. Establishing programs that provide incentives to walk, bike, and take transit and disincentives for driving alone can encourage people to try a new way of getting to work, for example. And making connections between modes easy to navigate, especially at key hubs, supports transit and active transportation. Indy Transportation Demand Management Program Increase walk, bike, and transit trips with a citywide Transportation Demand Management (TDM) Program. TDM programs encourage and incentivize people to travel by walking, bicycling, taking transit, or using shared mobility services rather than by driving alone. The city should work with partners, such as employment centers, shopping districts, and stadiums or large event venues, to establish targets for mode share and new education and encouragement about alternative ways to travel. Strategies could encourage workers, for example, to avoid driving alone with incentives like free or discounted transit passes. INDIANAPOLIS NASHVILLE COLUMBUS DENVER ST. PAUL MINNEAPOLIS 85% 84% 84% 76% 74% 65% Most people in Indianapolis still drive alone to work, with only 15% of people carpooling, taking the bus, walking, or biking for their commute. PERCENT OF COMMUTERS WHO DRIVE ALONE TO WORK Source: Five-Year American Community Survey ( ) INDY MOVES 2018
, wayfinding and trip")
35 Mobility Hubs Program Establish a Mobility Hubs Program to make transportation connections seamless. Mobility hubs can include transit connections, high-quality pedestrian and bicycle access, safety and comfort amenities (such as lighting, weather protection, and restrooms), wayfinding and trip planning information, ridehailing pick-up and drop-off space, dedicated car and bike share parking, bicycle storage, real-time travel information, payment kiosks and fare vending, electric vehicle charging, commuter services (including goods delivery or retail services), and placemaking and public realm activation. The City of Indianapolis should continue its work with IndyGo to establish a mobility hubs program that helps connect people to a variety of transportation options at key locations. Mobility hubs come in many different forms, from a regional hub with connections beyond Indianapolis to neighborhood hubs that aggregate services around a local transit stop. Establishing a hub typology based on Indianapolis unique mix of mobility options and then identifying potential locations for mobility hubs is an important first step in creating a citywide mobility hubs program. Major transit facilities with multiple frequent connections are natural places to consolidate and organize mobility services. MOBILITY HUB ELEMENTS IN SEATTLE Source: Seattle Department of Transportation 35
36 EMBRACING NEW FORMS OF MOBILITY Emerging technology, the sharing economy, and new mobility providers have changed the ways we travel. From ride hailing and bike sharing to connected vehicles, new technologies are providing specific mobility options to which Indianapolis must adapt. In light of this, Indy should establish a policy framework to align these emerging mobility opportunities with the city s goals. Connected and Autonomous Vehicles Encourage shared use and regulate vehicle miles traveled. The promise of connected and autonomous vehicles (AVs) for use as both personal vehicles and for freight and public transit has the potential to fundamentally reshape mobility. The state of Indiana is developing a framework for AV regulation, and Indy can build on that starting point. Given the complexity of Indy s multimodal network and travel patterns, it will be important to test AVs in complex, real-life situations to understand their interaction with all modes, including transit. Parking Adjust parking regulations and management of vehicle storage. The parking requirements incorporated in zoning codes are one of the most important determinants of which buildings get built, how they get built, and the transportation choices of those who inhabit them. Indy should consider replacing parking minimums with maximums to avoid over-parking in an era in which parking demand could drop dramatically. Curbspace Adjust approaches to street design and managing curbspace. With more shared mobility options, Indianapolis can adapt street designs and curbspace management to more efficiently and safely accommodate changing travel behavior. As more riders are picked up or dropped off instead of needing to park a vehicle, on-street parking will become available for other mobility and public realm uses. Equity Ensure all people benefit from expanded mobility options. Emerging mobility trends present Indianapolis with the opportunity to shape new technologies and mobility options to create more affordable, integrated transportation choices for those who need them the most. Indianapolis should proactively develop shared mobility equity programs, including requiring mobility providers to offer low-income fare products and provide an array of payment options, targeting historically disadvantaged communities, people with disabilities, and limited English proficiency populations. Indianapolis should adopt policies and regulations such as mandatory data sharing protocols to ensure private mobility providers offer all people and areas of the city consistent access (availability of mobility services) and equal service (reasonable wait times). Indy s recent scooter ordinance is a shared mobility policy that aligns with our transportation goals and values. The ordinance and permit process identify when and where scooters can be used and what shared mobility providers must do to operate in Indianapolis. It also establishes fees that will be used for enforcement and supportive infrastructure. INDY MOVES 2018
37 4 Moving Forward Every journey begins with a single step. This section describes the most important first steps Indianapolis must take to deliver Indy s transportation vision. Focused on funding sources, collaborative project development and delivery, and ways to track progress, Moving Forward outlines how Indy can begin funding and delivering high priority projects and monitor how those efforts move us closer to our goals. 37


38 WORKING TOGETHER Transportation plans, projects, and programs in Indy are planned, designed, funded, delivered, and maintained by several city departments, Indy MPO, IndyGo, INDOT, and private partners. In order to deliver the Indy Moves projects, departments and agencies must coordinate in different ways depending on the type of project. The chart below summarizes the key roles. A number of efforts are underway in Indy to enhance collaborative project delivery, and these are the focus of a departmental strategic planning effort. For example, the city and IndyGo have established staff and leadership coordination meetings to support Red Line Line BRT implementation. And city departments are moving toward more integrated systems, including more widely available and usable project information. City Department Roles Complete Streets Complete Street Upgrades Greenways Active Transportation DPW DMD BNS PUBLIC WORKS Plans, designs, constructs, and maintains projects within the public right-of-way. METROPOLITAN DEVELOPMENT Plans all modes of transportation, including current projects and longrange planning. BUSINESS AND NEIGHBORHOOD SERVICES Issues permits and inspects private development and public right-of-way uses. INDYGO Plans, designs, constructs, and operates public transit projects. DPW PARKS AND RECREATION Plans and oversees parks, trails, and greenways. Minor Role Major Role INDY MOVES 2018


39 Other Important Partners OFFICE OF DISABILITY AFFAIRS OFFICE OF FINANCE AND MANAGEMENT ADA accessibility elements of projects Project funding Project funding and regionally significant enhancements Projects involving active transportation and physical activity Projects in high-crash locations or that address a public safety concern Projects involving state roads Projects that improve health outcomes, serve underrepresented communities, or increase physical activity Tools for Successful Collaboration Key to successful project development and delivery from design and construction to maintenance and performance monitoring is interdepartmental and interagency collaboration. To plan and build great projects, the right parties must weigh in at the right points throughout the project development process. When departments actively coordinate to implement projects, programs, and policies, the result is a product in which partners have a sense of ownership. Creating processes to make interdepartmental and interagency collaboration business as usual will enable Indianapolis to deliver and maintain a worldclass transportation system: Project Development Process Create a consistent capital project development process with nonnegotiable collaboration milestones involving all departments and agencies with a stake in the project. Project Charter Establish a charter that documents a project s intent, objectives, and design and implementation decisions. Exceptions should follow the approval process set forth in Indy s Complete Streets policy. Interdepartmental Team Convene an interdepartmental staff team to guide a project through construction. The team will consult at key project development milestones to facilitate regular feedback and continuity. Any issues not resolved at the staff level should be elevated to a leadership team for resolution. Project Development Checklist Use a project development checklist to ensure that all relevant transportation modes are considered, as well as other elements like stormwater and public realm opportunities. This helps align projects with Indy s Complete Streets ordinance. Pilot Projects Formalize the use of pilot projects as part of the project development and delivery process. Pilots are a low-cost way to test designs and adjust them, if necessary based on their performance. 39
40 GETTING PROJECTS BUILT The priority projects identified in Indy Moves are those that best achieve the community s goals and direct resources where they will have the greatest positive impact. For those projects to become a reality, Indianapolis must adapt everyday project development and delivery procedures to ensure successful implementation, carrying a project s design intent through construction. Projects 1 PROJECT SELECTION Use Indy Moves goals and prioritization framework to assist in project selection Clarify project intent and objectives 3 PILOT PROJECT Pilot the project using low-cost materials Collect data Evaluate based on project objectives INDY MOVES SCOPING Determine the project s charter and scope Consider project intent, department and agency partners, related projects, and maintenance and funding needs Establish and collect baseline data for performance measures
41 USE FINDINGS AS AN INPUT TO HELP SELECT FUTURE PROJECTS 4 PROJECT FUNDED Secure funding from sources such as local funds, Indy MPO, or state and federal grants 7 MEASURE EFFECTIVENESS Revisit objectives Collect data to support performance measurement Count number of people using project 5 CONSTRUCTION Communicate project objectives to contractor Ensure multimodal elements are included Improve design elements Reward efficiency 6 MAINTENANCE Ensure project functions as intended throughout lifespan Engage maintenance staff to share lessons learned 41


42 FUNDING INDY MOVES Funding the Indy Moves capital projects will take a coordinated effort of local, state, federal, and private partners and funding sources. While many transportation funding sources are competitive, Indianapolis has historically been quite successful and can continue this trend by aligning projects with the funding sources for which they are best suited. Taking a creative approach to leveraging multiple funding sources and collaborating with partners will allow Indianapolis to build priority projects and implement new programs. At least $178M is needed each year just to keep Indy s existing transportation system in a state of good repair. Local Funding INDY MOVES 2018 LOCAL CITY FUNDS This includes funding from the city s annual budget and revenue sources. Useful for: operations and maintenance; pilot projects; highpriority projects INCOME TAX One-quarter percent income tax for transit system expansion. Useful for: projects that include transit-supportive infrastructure for planned routes and stops TAX INCREMENT FINANCING Dedicated proportion of property taxes within a specific area to service debt based on an investment in that area. Useful for: projects that anticipate an increase in property taxes in their immediate surroundings MUNICIPAL BONDS Loans against future revenue streams, such as sales, property, or special assessment district taxes. Useful for: long lifespan projects with a broad benefit to Indianapolis Private Funding PUBLIC BENEFITS AGREEMENTS Negotiated agreements for developers to provide benefits to the public. Useful for: localized projects in areas experiencing significant private development, e.g., sidewalks adjacent to new apartments CENTRAL INDIANA COMMUNITY FOUNDATION (CICF) Grant awarding foundation aiming to supporting equity, the creation of vibrant places, and initiatives to attract visitors and businesses to Central Indiana. Useful for: projects that align with the foundation s goals Indianapolis Cultural Trail The Indianapolis Cultural trail is a prime example of a public-private partnership leveraging multiple funding sources to bring a vision for a transportation and community asset to life. Source: Indyculturaltrail.org
 up to $250K to improve walking and biking connections")
 for the")


 Dedicated, discretionary funding for projects that address critical issues facing highways and bridges ($5M+ and")
 funding source for low and")
43 State Funding COMMUNITY CROSSINGS MATCHING GRANTS INDOT matching grants (50%) for road and bridge projects that catalyze economic development, strengthen transportation networks, and create jobs. Useful for: projects that include a roadway or bridge component for which matching funds exist SAFE ROUTES TO SCHOOL INDOT matching grants (80%) up to $250K to improve walking and biking connections to schools. Useful for: lower cost projects that include a walking or biking improvement near schools RECREATIONAL TRAILS PROGRAM Indiana Department of Natural Resources matching grants (80%) for the construction of multi-use paths and greenways. Useful for: projects that include a multi-use path or greenway HIGHWAY SAFETY IMPROVEMENT PROGRAM INDOT funding source for pedestrian or bike projects aimed at reducing traffic fatalities and serious injuries on public roads. Useful for: projects that include a bike or pedestrian component, including multi-use paths, in or near high crash areas Federal Funding TRANSPORTATION INFRASTRUCTURE FINANCE AND INNOVATION ACT (TIFIA) Secured loans, loan guarantees, and standby lines of credit for large surface transportation projects. Useful for: large multimodal projects INFRASTRUCTURE FOR REBUILDING AMERICA (INFRA) Dedicated, discretionary funding for projects that address critical issues facing highways and bridges ($5M+ and $25M+ categories). Useful for: projects that include a highway or bridge component in a critical state of repair COMMUNITY DEVELOPMENT BLOCK GRANTS Housing and Urban Development (HUD) funding source for low and moderate income communities to address a wide range of community development and public infrastructure needs. Useful for: projects in low income areas BETTER UTILIZING INVESTMENTS TO LEVERAGE DEVELOPMENT GRANTS (BUILD) United States Department of Transportation grants for repair and construction of projects that support freight and passenger transportation (formerly TIGER). Useful for: projects that involve passenger transportation or freight corridors With a total project cost of $63 million (including a $6 million maintenance endowment), the Cultural Trail leveraged $27.5 million in private funding to secure $35.5 million in federal grants. Project funding came from the following sources: the Central Indiana Community Foundation, private donors, a federal TIGER grant ($20.5 million), the City of Indianapolis tax increment financing revenues (also committed for Phase 2 expansion), and several not-for-profit organizations. No local tax dollars were used. Aligned with Indy Moves goals to leverage transportation investments as a tool for economic development, the Indiana University Public Policy Institute found that property assessments within approximately one block of the eight mile Indianapolis Cultural Trail have increased 148% since 2008, an increase of $1 billion in assessed property value. The trail has catalyzed investment with new developments and businesses opening along the trail. 43
44 MEASURING SUCCESS To help Indy make progress toward a truly multimodal transportation system and toward achieving the larger goals of Indy Moves it is important to establish indicators that can be tracked and reported over time. The indicators on the following page link Indy Moves goals and use data that are easy to gather, simple to analyze, and straightforward to communicate, both internally and to the community. Two types of indicators paint the picture of progress toward plan goals: 1) indicators highlighting what Indy is building and implementing, and 2) indicators that show whether or not those investments are having their intended impact. To report on progress each year, the city must continue to collect data and expand its data monitoring and management capacity. Establishing a baseline and monitoring the pace and impact of Indy Moves implementation will provide the foundation and justification for future investments. Example Baseline Data: Mode Share and Collisions Commute Mode Share The commute mode share explains how residents get to work, whether on foot, by bike, on the bus, in a carpool, driving alone, or some other way. This information is available in the American Community Survey dataset. Indy Moves strives to reduce the number of people driving alone to work through multimodal investments. COMMUTE MODE SHARE Proportion of employed people in Indianapolis who reach work by each mode ( ) 2% 2% 1% 10% 85% Collisions Involving Pedestrians Collision data explain where crashes occur, and whether pedestrians were injured or killed. This helps to illustrate whether investments in pedestrian infrastructure are helping to improve safety. It also helps determine where to focus future safety investments. By using both citywide and corridorlevel data, it is possible to track progress toward the Indy Moves goal of eliminating all serious and fatal collisions. MOTOR VEHICLE COLLISIONS INVOLVING PEDESTRIANS 1,341 Injuries Fatalities Source: Aries Crash Data , Indianapolis MPO, and City of Indianapolis INDY MOVES 2018
45 Indy Moves Goal Measuring Actions and Impacts DESIRED TREND HEALTH & SAFETY Improve safety and promote health Miles of bike facilities Blocks of sidewalks Number of collisions resulting in injuries and fatalities Increase Increase Decrease SUSTAINABILITY & RESILIENCE Enhance environmental sustainability and resilience Number of green infrastructure streets Number of intersections with operational improvements Total greenhouse gas emissions from transportation Increase Increase Decrease ECONOMIC DEVELOPMENT Support inclusive economic development EQUITY Address disparities and increase access to opportunity Number of job centers or post-secondary institutions served by projects Miles of projects that include two or more modes Percent of low-income population with direct transit connection to living wage jobs Number of projects in racially/ethnicallyconcentrated areas of poverty (R/ECAP) neighborhoods Number of high need equity analysis areas (see page 5) served by projects Increase Increase Increase Increase Increase CHOICES Expand mobility choices Number of projects within 1/2-mile of BRT or 1/4-mile of frequent transit Number of projects within 1/2-mile of existing or proposed greenways Drive alone commute mode share Increase Increase Decrease CONNECTIONS Connect and strengthen our region, city, and existing neighborhoods Number of projects within 10 minutes of a village or neighborhood node Percent of households with direct connections to job centers Increase Increase STRATEGIC INVESTMENT Invest strategically and transparently, with a focus on ehancing existing infrastructure Miles of poor pavement condition addressed by projects Local dollars leveraged Positive responses to customer satisfaction survey Increase Increase Increase Indicators that measure what has been built Indicators that measure Indy Moves impacts 45


46 EXISTING CONDITIONS 2017
PEDESTRIAN ACTION PLAN
 ATTACHMENT 2 CITY OF SANTA MONICA PEDESTRIAN ACTION PLAN CITY OF SANTA MONICA PEDESTRIAN ACTION PLAN This page intentionally left blank EXECUTIVE SUMMARY CHAPTER 1 EXECUTIVE SUMMARY Setting the Stage
EXISTING CONDITIONS 2017
 WHAT IS INDY MOVES? Indy Moves will connect Indianapolis transportation goals, plans, and projects into an integrated mobility future. A coordinated effort of city departments and the metropolitan planning
Proposed. City of Grand Junction Complete Streets Policy. Exhibit 10
 Proposed City of Grand Junction Complete Streets Policy Exhibit 10 1 City of Grand Junction Complete Streets Policy Vision: The Complete Streets Vision is to develop a safe, efficient, and reliable travel
City of Novi Non-Motorized Master Plan 2011 Executive Summary
 City of Novi Non-Motorized Master Plan 2011 Executive Summary Prepared by: February 28, 2011 Why Plan? Encouraging healthy, active lifestyles through pathway and sidewalk connectivity has been a focus
ACTIVE TRANSPORTATION
 ACTIVE TRANSPORTATION Mobility 2040 Supported Goals Improve the availability of transportation options for people and goods. Support travel efficiency measures and system enhancements targeted at congestion
CONNECTING PEOPLE TO PLACES
 CONNECTING PEOPLE TO PLACES 82 EAST BENCH MASTER PLAN 07 Introduction The East Bench transportation system is a collection of slow moving, treelined residential streets and major arteries that are the
Corpus Christi Metropolitan Transportation Plan Fiscal Year Introduction:
 Introduction: The Safe, Accountable, Flexible, Efficient Transportation Equity Act: A Legacy for Users (SAFETEA-LU) has continued the efforts started through the Intermodal Surface Transportation Efficiency
Perryville TOD and Greenway Plan
 Perryville TOD and Greenway Plan Greenway Glossary Pathway: A bicycle and pedestrian path separated from motorized vehicular traffic by an open space, barrier or curb. Multi-use paths may be within the
Bicycle Master Plan Goals, Strategies, and Policies
 Bicycle Master Plan Goals, Strategies, and Policies Mobilizing 5 This chapter outlines the overarching goals, action statements, and action items Long Beach will take in order to achieve its vision of
Chapter 2. Bellingham Bicycle Master Plan Chapter 2: Policies and Actions
 Chapter 2 Bellingham Bicycle Master Plan Chapter 2: Policies and Actions Chapter 2: Policies and Actions The Bicycle Master Plan provides a road map for making bicycling in Bellingham a viable transportation
EXECUTIVE SUMMARY. Vision
 Vision Walking and bicycling in Salt Lake City will be safe, convenient, comfortable, and viable transportation options that connect people to places, foster recreational and economic development opportunities,
CITY OF BLOOMINGTON COMPLETE STREETS POLICY
 CITY OF BLOOMINGTON COMPLETE STREETS POLICY POLICY OBJECTIVE: The City of Bloomington will enhance safety, mobility, accessibility and convenience for transportation network users of all ages and abilities,
2. Context. Existing framework. The context. The challenge. Transport Strategy
 Transport Strategy Providing quality connections Contents 1. Introduction 2. Context 3. Long-term direction 4. Three-year priorities 5. Strategy tree Wellington City Council July 2006 1. Introduction Wellington
WALKNBIKE DRAFT PLAN NASHVILLE, TENNESSEE EXECUTIVE SUMMARY NASHVILLE, TENNESSEE
 NASHVILLE, TENNESSEE EXECUTIVE SUMMARY Executive Summary A world-class multi-modal transportation system is essential to a vibrant city and better quality of life. -Mayor Barry The WalknBike plan aims
Agenda. Overview PRINCE GEORGE S PLAZA METRO AREA PEDESTRIAN PLAN
 PRINCE GEORGE S PLAZA METRO AREA PEDESTRIAN PLAN May 28, 2008 Agenda Welcome and introductions Project overview and issue identification Planning context and strengths Design challenges and initial recommendations
Omaha s Complete Streets Policy
 Omaha s Complete Streets Policy (Adopted August 2015) VISION To create great places and enhance our quality of life, the City of Omaha will provide safe, accessible streets for all users. Complete Streets
A Matter of Fairness: ROCOG s Environmental Justice Protocol. What is Mobility Limitation?
 No Person Left Behind What is Mobility Limitation? What is the Access Limitation? Environmental Justice population should be provided adequate mobility & access to meet their needs; Identify acceptable
Living Streets Policy
 Living Streets Policy Introduction Living streets balance the needs of motorists, bicyclists, pedestrians and transit riders in ways that promote safety and convenience, enhance community identity, create
Welcome. Background. Goals. Vision
 Welcome The formal Public Information Centre (PIC) for the Transportation Master Plan How We GO will be held in early 2017. At that time we will present the recommended transportation system for Niagara
Appendix A-K Public Information Centre 2 Materials
 Appendix A-K Public Information Centre 2 Materials Our Rapid Transit Initiative Make an impact on the future of transit Join the discussion on Rapid Transit in London You re invited to a Public Information
Exhibit 1 PLANNING COMMISSION AGENDA ITEM
 Exhibit 1 PLANNING COMMISSION AGENDA ITEM Project Name: Grand Junction Circulation Plan Grand Junction Complete Streets Policy Applicant: City of Grand Junction Representative: David Thornton Address:
Non-Motorized Transportation 7-1
 Non-Motorized Transportation 7-1 Transportation facilities no longer mean just accommodating a vehicle powered by a combustion engine. Pedestrian and non-motorized facilities are important modes of travel
MASTER BICYCLE AND PEDESTRIAN PLAN
 VILLAGE OF NORTHBROOK MASTER BICYCLE AND PEDESTRIAN PLAN DRAFT PLAN OPEN HOUSE May 2, 2018 AGENDA 1. Community Engagement 2. Vision and Goals 3. General Structure of Plan 4. Recommendations Overview 5.
Chapter 7. Transportation. Transportation Road Network Plan Transit Cyclists Pedestrians Multi-Use and Equestrian Trails
 Chapter 7 Transportation Transportation Road Network Plan Transit Cyclists Pedestrians Multi-Use and Equestrian Trails 7.1 TRANSPORTATION BACKGROUND The District of Maple Ridge faces a number of unique
Kelowna On the Move. Pedestrian and Bicycle Master Plan
 Kelowna On the Move Pedestrian and Bicycle Master Plan Executive Summary April 2016 Purpose of the Plan The Pedestrian and Bicycle Master Plan identifies infrastructure, planning, and policy requirements
Pedestrian, Bicycle and Traffic Calming Strategic Implementation Plan. January 18, 2011
 Pedestrian, Bicycle and Traffic Calming Strategic Implementation Plan January 18, 2011 Tonight s Agenda Receive update on project Provide feedback on two policy issues Complete Streets Policy Project Prioritization
NM-POLICY 1: Improve service levels, participation, and options for non-motorized transportation modes throughout the County.
 Transportation PRINCE WILLIAM COUNTY 2008 COMPREHENSIVE PLAN NON-MOTORIZED PLAN CONTENTS Goals, Policies, and Action Strategies Table 4 (Bike Facility Classifications and Descriptions) Table 5 (Bike Facility
Transportation Master Plan Advisory Task Force
 Transportation Master Plan Advisory Task Force Network Alternatives & Phasing Strategy February 2016 BACKGROUND Table of Contents BACKGROUND Purpose & Introduction 2 Linking the TMP to Key Council Approved
Solana Beach Comprehensive Active Transportation Strategy (CATS)
") Solana Beach Comprehensive Active Transportation Strategy (CATS) 3.0 Goals & Policies The Solana Beach CATS goals and objectives outlined below were largely drawn from the Solana Beach Circulation Element
Solana Beach Comprehensive Active Transportation Strategy (CATS) 3.0 Goals & Policies The Solana Beach CATS goals and objectives outlined below were largely drawn from the Solana Beach Circulation Element
PRINCE GEORGE S PLAZA METRO AREA PEDESTRIAN PLAN
 PRINCE GEORGE S PLAZA METRO AREA PEDESTRIAN PLAN May 28, 2008 Agenda Welcome and introductions Project overview and issue identification Planning context and strengths Design challenges and initial recommendations
TOWN OF PORTLAND, CONNECTICUT COMPLETE STREETS POLICY
 TOWN OF PORTLAND, CONNECTICUT COMPLETE STREETS POLICY I. VISION, GOALS & PRINCIPLES VISION To improve the streets of Portland making them safer and more accessible for all users including pedestrians,
Hennepin County Pedestrian Plan Public Comment Report
 Hennepin County Pedestrian Plan Public Comment Report On May 31, 2013, the draft Hennepin County Pedestrian Plan was released for a 45-day public comment period ending July 15, 2013. The county received
Berkeley Strategic Transportation Plan A-76
 Berkeley Strategic Transportation Plan A-76 Appendices 1. A Team Effort 2. Where We ve Been A-11 Berkeley Strategic Transportation Plan Alameda County Transportation Plan Alameda County will be served
NOTES FROM JUNIOR COUNCIL ORIENTATION SESSION HELD ON MONDAY, JANUARY 22, 2018, AT 3:30 PM IN COUNCIL CHAMBERS, CITY HALL
 CITY OF KAMLOOPS Junior Council Meeting Agenda March 12, 2018, at 3:30 pm in Council Chambers, 7 Victoria Street West, Kamloops, BC Page 1. APPROVAL OF THE AGENDA 2. MINUTES Attachment Recommendation:
City of Jacksonville Mobility Fee Update
 City of Jacksonville Mobility Fee Update 2017 Preliminary Analysis May 3, 2017 Carnival Cruise lines photo credit Presentation Overview Public Outreach Process Pedestrian and Bicycle Master Plan Study
Watertown Complete Streets Prioritization Plan. Public Meeting #1 December 14, 2017
 Watertown Complete Streets Prioritization Plan Public Meeting #1 December 14, 2017 Goals for Public Meeting Overview of MassDOT Complete Streets Funding Program Educate the community on Complete Streets
Goal 3: Foster an environment of partnerships and collaboration to connect our communities and regions to one another.
 Non-Motorized Transportation Plan (NMTP) Draft Vision, Goal and,, Tri-County Regional Planning Commission (TCRPC) Purpose The purpose of the Tri-County Regional Planning Commission (TCRPC) Non-Motorized
Circulation in Elk Grove includes: Motor vehicles, including cars and trucks
 Circulation, as it is used in this General Plan, refers to the many ways people and goods move from place to place in Elk Grove and the region. Circulation in Elk Grove includes: Motor vehicles, including
PEDALING FORWARD. A Glance at the SFMTA s Bike Program for SFMTA.COM
 PEDALING FORWARD A Glance at the SFMTA s Bike Program for 2017-2021 SFMTA.COM INTRODUCTION About This Booklet More people from all walks of life see their bicycle as a more convenient way to get where
AMATS Complete Streets Policy
 AMATS Complete Streets Policy Table of Contents: Section 1. Definition of Complete Streets Section 2. Principles of Complete Streets Section 3. Complete Streets Policy Section 4. Consistency Section 5.
DRAFT MOVING FORWARD RHODE ISLAND BICYCLE MOBILITY PLAN 2018 PREPARED FOR PREPARED BY IN ASSOCIATION WITH
 RHODE ISLAND MOVING FORWARD BICYCLE MOBILITY PLAN 2018 PREPARED FOR PREPARED BY IN ASSOCIATION WITH T AF CHAPTER 1 D R INTRODUCTION CHAPTER 3 ARTICULATES VISION Bicycling is safe, fun and practical in
Chapter 5 Future Transportation
 Chapter 5 Future Transportation The Future Land Use Plan identifies the desired land use designations. The land uses desired for Crozet depend, in large part, on the success of the transportation system,
May 12, 2016 Metro Potential Ballot Measure Issue Brief: Local Return
 Summary: Local return is an important revenue source for cities to maintain their local transportation infrastructure. Most cities use their local return to operate small bus systems and repave streets,
4 Goals, Objectives & Actions
 Chapter4 4 This chapter presents goals, objectives, and recommended actions to support the vision of making Overland Park a safer and easier place to ride a bicycle. 35 4.1 Recommendations Structure The
Bicycle and Pedestrian Connectivity Study Phase 2
 Connectivity Study Phase 2 Process PROCESS OUTCOMES Phase Prepared By STEP I Public Participation and Outreach 1. RTP Outreach activities, and development of the Bike and Ped Task Force Phase 1 2011 OCPC
REGIONAL BICYCLE AND PEDESTRIAN DESIGN GUIDELINES
 REGIONAL BICYCLE AND PEDESTRIAN DESIGN GUIDELINES November 16, 2011 Deb Humphreys North Central Texas Council of Governments Bicycle and Pedestrian Advisory Committee Snapshot of the Guide 1. Introduction
Physical Implications of Complete Streets Policies
 Presentation Overview Physical Implications of Complete Norm Cox, ASLA, LLA Landscape Architect Ann Arbor, Michigan, 10:45 to Noon What Are Complete Streets? What Matters to Bicyclists and Pedestrians
This page intentionally left blank.
 This page intentionally left blank. COMMUNITY Coweta Community Overview Coweta Coweta, a residential community located in Wagoner County, is a suburb of Tulsa situated southeast of the metropolitan area
City of Birmingham Draft Multi-modal Transportation Plan
 City of Birmingham Draft Multi-modal Transportation Plan City Commission Public Hearing Monday, November 25, 2013 7:30 pm Norman Cox, PLA, ASLA The Greenway Collaborative, Inc. Ann Arbor, Michigan The
Active Transportation Facility Glossary
 Active Transportation Facility Glossary This document defines different active transportation facilities and suggests appropriate corridor types. Click on a facility type to jump to its definition. Bike
DRAFT. Table of Contents. Background
 Douglas County Table of Contents Existing Infrastructure 86 Funding 89 Policy and Program Recommendations 90 Infrastructure Recommendations 92 Conclusion 95 Background Home to 4,500 residents and Baker
How To Encourage More Efficient Transportation in Brazilian Cities
 How To Encourage More Efficient Transportation in Brazilian Cities Todd Litman Victoria Transport Policy Institute Presented Seminar on Discouraging The Use Of Cars São Paulo, Brazil 3 September 2013 Creating
2014 Bellingham Bicycle Master Plan
 2014 Bellingham Bicycle Master Plan Acknowledgements The City of Bellingham is honored by the commitment of the numerous community members and bicycling enthusiasts who participated in the development
Cherry Creek Transportation and Land Use Forum September 25, 2013 Meeting Summary
 Cherry Creek Transportation and Land Use Forum September 25, 2013 Meeting Summary I. LEAD-IN TO SMALL GROUP DISCUSSION, POLLING AND STEERING COMMITTEE/TECHNICAL TASK FORCE DISCUSSION The meeting began
Executive Summary Route 30 Corridor Master Plan
 Route Corridor Master Plan Project Overview The Route Corridor Master Plan is a coordinated multimodal transportation and land use plan for the entire stretch of Route through East Whiteland Township,
Governor s Transportation Vision Panel
 Office of Governor Kate Brown Governor s Transportation Vision Panel JLA Public Involvement Project Overview The is a yearlong effort to develop a series of recommendations for the Governor that address
APPENDIX A: Complete Streets Checklist DRAFT NOVEMBER 2016
 APPENDIX A: Complete Streets Checklist DRAFT NOVEMBER 2016 Complete Streets Checklist MetroPlan Orlando s Complete Streets Checklist is an internal planning tool for staff to further implementation of
BIKE PLAN CONTENTS GATEWAY
 CONTENTS Acknowledgments...vii Great Rivers Greenway District Board of Directors... vii Great Rivers Greenway District Staff... vii Project Consultants... vii Committees... viii Citizens Advisory Committee
MARKET/JFK VISION ZERO PILOT PROJECT FEBRUARY 2019 EVALUATION REPORT
 MARKET/JFK VISION ZERO PILOT PROJECT FEBRUARY 2019 EVALUATION REPORT WHY IS THIS PROJECT IMPORTANT? Market Street and JFK Boulevard in Center City are key east-west corridors in the core business district.
o n - m o t o r i z e d transportation is an overlooked element that can greatly enhance the overall quality of life for the community s residents.
 N o n - m o t o r i z e d transportation is an overlooked element that can greatly enhance the overall quality of life for the community s residents. 84 Transportation CHAPTER 11 INTRODUCTION Transportation
Bicycle and Pedestrian Chapter TPP Update Overview. TAB September 20, 2017
 Bicycle and Pedestrian Chapter TPP Update Overview TAB September 20, 2017 Bicycling & Walking in the Twin Cities Where are we now? The Bike-Pedestrian system Current trends New developments Where are we
CHAPTER 3: Vision Statement and Goals
 Davidson Walks & Rolls: Active Transportation Master Plan CHAPTER 3 Contents: Overview Vision Statement Measurable Goals Public Outreach CHAPTER 3: Vision Statement and Goals Overview The vision statement
Active Transportation Access to Transit
 Active Transportation Access to Transit Introduction COMO Connect customers access transit service in many ways, including walking, bicycling, riding in a car and being dropped off, and directly boarding
Incorporating Health in Regional Transportation Planning
 Mayor Karl Dean, Chairman Incorporating Health in Regional Transportation Planning Leslie A. Meehan, AICP Center TRT Intervention Webinar January 29, 2013 Objectives for Today Background About the Nashville
5. Pedestrian System. Accomplishments Over the Past Five Years
 5. Pedestrian System Accomplishments Over the Past Five Years The Alamo Area Metropolitan Planning Organization (MPO) and its partner agencies recognize the importance of improving pedestrian mobility.
Prioritizing Transportation Policy and Funding for Active Transportation, Safety, Equity and Health
 Mayor Karl Dean, Chairman Prioritizing Transportation Policy and Funding for Active Transportation, Safety, Equity and Health Leslie A. Meehan, AICP Planning and Implementing the Active Community Webinar
Climate Change Action Plan: Transportation Sector Discussion Paper: Cycling
 Climate Change Action Plan: Transportation Sector Discussion Paper: Cycling ontario.ca/climatechange Contents 1. Minister of Transportation s message... 3 2. Introduction... 5 3. Sector Overview and Support
Governance and Priorities Committee Report For the July 2, 2015 Meeting
 CITY OF VICTORIA For the July 2, 2015 Meeting To: Governance and Priorities Committee Date: From: Subject: Brad Dellebuur, A/Assistant Director, Transportation and Parking Services Executive Summary The
Broad Street Bicycle Boulevard Design Guidelines
 Broad Street Bicycle Boulevard Design Guidelines Building from the strategies introduced in the 2013 Bicycle Transportation Plan and community input received thus far, City Transportation Staff have identified
Purpose and Need. Chapter Introduction. 2.2 Project Purpose and Need Project Purpose Project Need
 Chapter 2 Purpose and Need 2.1 Introduction The El Camino Real Bus Rapid Transit (BRT) Project (Project) would make transit and other transportation improvements along a 17.6-mile segment of the El Camino
Madison Urban Area and Dane County. Bicycle Transportation Plan Summary. September Introduction. Bicycle Plan Scope and Planning Process
 Bicycle Transportation Plan Summary Madison Urban Area and Dane County Introduction September 2000 Bicycling is an important mode of transportation in the Madison urban area and countywide that is available
Environment and Public Works Committee Presentation
 Mixed Use Centers Complete Streets Guidelines Project Environment and Public Works Committee Presentation December 10, 2008 Project Objectives: Conduct an inter-departmental and agency process to study
STUDY ADVISORY COMMITTEE. October 8, 2015
 STUDY ADVISORY COMMITTEE October 8, 2015 Study Purpose evaluate the long-term transportation strategies and investments needed to sustain the county s economic health and quality of life in the coming
City of Hamilton s Transportation Master Plan (TMP) Public Consultation 3 December 2015
 Public Consultation 3 December 2015") City of Hamilton s Transportation Master Plan (TMP) Public Consultation 3 December 2015 McPhail Transportation Planning Services Ltd. AGENDA 6:00 7:00 pm Viewing Boards / Q & A with the Team 7:00 7:50
City of Hamilton s Transportation Master Plan (TMP) Public Consultation 3 December 2015 McPhail Transportation Planning Services Ltd. AGENDA 6:00 7:00 pm Viewing Boards / Q & A with the Team 7:00 7:50
Appendix C 3. Bicycle / Pedestrian Planning
 Appendix C 3. Bicycle / Pedestrian Planning BICYCLE/PEDESTRIAN PLANNING 2005 Master Plan GOAL: Provide for safe and convenient bicycle and pedestrian circulation throughout the City. Develop a city-wide
Performance Criteria for 2035 Long Range Transportation Plan
 Minimizing Impacts on Natural, Historic, Cultural or Archeological Resources 2035 LRTP Weighting Factor: 7% Objective 1.1: Use appropriate planning and design criteria to protect and enhance the built
SUMMARY OF TRANSPORTATION INVESTMENTS
 Santa Cruz County 2016 Measure D: Transportation Improvement Expenditure Plan - Approved by over 2/3 of Santa Cruz County voters on November 8, 2016 - Overview Measure D, the 2016 Transportation Improvement
Bikeway action plan. Bicycle Friendly Community Workshop March 5, 2007 Rochester, MN
 Bikeway action plan Summary The was held on March 5, 2007 at the Rochester Mayo Civic Center. The workshop was hosted by Rochester-Olmsted County Planning Department in collaboration with the League of
CHAPTER 7.0 IMPLEMENTATION
 CHAPTER 7.0 IMPLEMENTATION Achieving the vision of the Better Streets Plan will rely on the ability to effectively fund, build and maintain improvements, and to sustain improvements over time. CHAPTER
Arlington s Master Transportation Plan
 Arlington s Master Transportation Plan The Master Transportation Plan (MTP) Adopted in eight parts Goals & Policies element and MTP Map adopted in 2007 Bicycle, Pedestrian and Demand and Systems Management
Land Use and Transportation Town Hall September 17, 2018
 Land Use and Transportation Town Hall September 17, 2018 Welcome! Tonight s Agenda: 7:00-7:30 OVERVIEW PRESENTATIONS 7:30-8:15 BREAKOUT SESSIONS 8:15 - End TOWN HALL CITIZEN S TIME Purpose of Tonight s
Houma-Thibodaux Metropolitan Planning Organization STP<200K Funding Application APPLICATION
 APPLICATION HOUMA-THIBODAUX METROPOLITAN PLANNING ORGANIZATION (HTMPO) FOR SURFACE TRANSPORTATION PROGRAM (STP
Transportation Assessment
 Transportation Assessment Midtown Open House February 10, 2018 Overview Midtown in Focus Overview & Purpose of Today Transportation Assessment overview Summary of Transportation work to date Review & Analysis
Moving Cambridge. City of Cambridge Transportation Master Plan Public Consultation Centre. March 7, :00 8:00 PM.
 City of Cambridge Transportation Master Plan Public Consultation Centre March 7, 2018 5:00 8:00 PM Region of Waterloo City of Cambridge Transportation Master Plan Public Consultation Centre March 7, 2018
Duwamish Way-finding and CTR Report
 V. North Tukwila When the North Tukwila Manufacturing and Industrial Center was designated in 1992 as part of the region s land use and transportation plan, the plan called for the area to set a light-rail
Typical Rush Hour Commute. PennyforTransportation.com
 Typical Rush Hour Commute In the News Overview of the Plan Collaborative plan with projects in every community Prioritizing connectivity and congestion relief Dedicated transportation-specific funding;
Lee s Summit Road Improvement Study Public Open House June 7, 2007 Summary of Comment Card Responses
 Lee s Summit Road Improvement Study Public Open House June 7, 2007 Summary of Comment Card Responses Introduction At the Lee s Summit Road Improvement Study Public Open House held Thursday, June 7, 2007
TOWN OF WILLIAMSTON, SC BICYCLE AND PEDESTRIAN MASTER PLAN TOWN OF WILLIAMSTON, SC BICYCLE AND PEDESTRIAN MASTER PLAN
 TOWN OF WILLIAMSTON, SC BICYCLE AND PEDESTRIAN MASTER PLAN Americans Want Choices 55% of Americans would rather drive less & walk more. Transit use is growing faster than population or highway travel.
CITY OF KASSON TRANSPORTATION ALTERNATIVES KASSON SAFE ROUTES TO SCHOOL
 ve ha 8t G B A Mantorville Ave N 240th Ave 16th St NE 11th Ave NE K-M HIGH SCHOOL SUNRISE TRAIL TO MANTORVILLE MNTH 57 SUNSET TRAIL TO MANTORVILLE NE PARK 16TH ST NE TRAIL K-M ELEMENTARY SCHOOL K-M MIDDLE
Toward Zero Deaths. Regional SHSP Road Show Meeting. Virginia Strategic Highway Safety Plan. presented by
 Toward Zero Deaths Regional SHSP Road Show Meeting presented by Virginia Strategic Highway Safety Plan December 1, 2016 1 Welcome & Introductions Purpose of the Meeting Objectives & Key Outcomes Agenda»
Incorporating Health in Regional Transportation Planning
 Mayor Karl Dean, Chairman Incorporating Health in Regional Transportation Planning Leslie A. Meehan, AICP Center TRT Intervention Webinar January 29, 2013 Objectives for Today Background About the Nashville
ACTIVE TRANSPORTATION/NONMOTORIZED TRANSPORTATION
 ACTIVE TRANSPORTATION/NONMOTORIZED TRANSPORTATION BACKGROUND Active transportation, also known as nonmotorized transportation, is increasingly recognized as an important consideration when planning and
Tonight is for you. Learn everything you can. Share all your ideas.
 Strathcona Neighbourhood Renewal Draft Concept Design Tonight is for you. Learn everything you can. Share all your ideas. What is Neighbourhood Renewal? Creating a design with you for your neighbourhood.
NEWMARKET UPHAM S CORNER
 SOUTH STATION Planning Initiative NEWMARKET UPHAM S CORNER COLUMBIA ROAD (P) FOUR CORNERS/GENEVA Working Advisory Group (WAG) Meeting #5 TALBOT AVENUE MORTON STREET BLUE HILL AVE/CUMMINS HWY (P) RIVER
The Florida Bicycle and Pedestrian Partnership Council
 The Florida Bicycle and Pedestrian Partnership Council Input to the Update of the Florida Transportation Plan March 2015 This document presents input from the Florida Bicycle and Pedestrian Advisory Council
Eastern PA Trail Summit October 1, 2018
 Eastern PA Trail Summit October 1, 2018 WHO WE ARE + WHY + WE RE * HERE * * * * * * Session Goals: Discuss how to coordinate planning and design in small, urbanized towns Consider how to develop alternative
RESOLUTION NO ?? A RESOLUTION OF THE CITY OF NEPTUNE BEACH ADOPTING A COMPLETE STREETS POLICY
 RESOLUTION NO. 2018-?? A RESOLUTION OF THE CITY OF NEPTUNE BEACH ADOPTING A COMPLETE STREETS POLICY WHEREAS, safe, convenient, and accessible transportation for all users is a priority of the City of Neptune
Capital and Strategic Planning Committee. Item III - B. April 12, WMATA s Transit-Oriented Development Objectives
 Capital and Strategic Planning Committee Item III - B April 12, 2018 WMATA s Transit-Oriented Development Objectives Page 24 of 76 Washington Metropolitan Area Transit Authority Board Action/Information
Citywide Sidewalk and Crosswalk Programs
 Citywide Sidewalk and Crosswalk Programs Council Meeting October 20, 2015 Presented by Rita Hu and Jamal Mahmoud Program Goals Implement the City s comprehensive plan. Provide pedestrian with safe walking
First Mile, Last Mile: Plans for all Shapes and Sizes. Hannah Lindelof, Principal Planner San Francisco Bay Area Rapid Transit September 18, 2017
 First Mile, Last Mile: Plans for all Shapes and Sizes Hannah Lindelof, Principal Planner San Francisco Bay Area Rapid Transit September 18, 2017 BART Station Access Policy Goals A. Safer, Healthier, Greener.