Gri d l o c k an d Gr o w t h : Th e Effect
|
|
|
- Sheila Banks
- 5 years ago
- Views:
Transcription

1 June 2009 Gri d l o c k an d Gr o w t h : Th e Effect o f Traffic Co n g e s t i o n on Re g i o n a l Economic Performance By David T. Hartgen, Ph.D., P.E. and M. Gregory Fields Project Director: Adrian T. Moore, Ph.D. POLICY STUDY 371
2 Reason Foundation Reason Foundation s mission is to advance a free society by developing, applying and promoting libertarian principles, including individual liberty, free markets and the rule of law. We use journalism and public policy research to influence the frameworks and actions of policymakers, journalists and opinion leaders. Reason Foundation s nonpartisan public policy research promotes choice, competition and a dynamic market economy as the foundation for human dignity and progress. Reason produces rigorous, peer-reviewed research and directly engages the policy process, seeking strategies that emphasize cooperation, flexibility, local knowledge and results. Through practical and innovative approaches to complex problems, Reason seeks to change the way people think about issues and promote policies that allow and encourage individuals and voluntary institutions to flourish. Reason Foundation is a tax-exempt research and education organization as defined under IRS code 501(c)(3). Reason Foundation is supported by voluntary contributions from individuals, foundations and corporations. The views expressed in these essays are those of the individual author, not necessarily those of Reason Foundation or its trustees. Copyright 2009 Reason Foundation. All rights reserved.
3 Reason Foundation Gridlock and Growth: The Effect of Traffic Congestion on Regional Economic Performance By David T. Hartgen, Ph.D., P.E. and M. Gregory Fields Project Director: Adrian T. Moore, Ph.D. The economic performance of cities has fascinated economists and regional scientists for centuries. The role of transportation in creating and maintaining easy and quick access to metropolitan areas and regional economic performance has been studied extensively, particularly in the past 30 years. The most recent efforts have attempted to tie regional performance to accessibility, congestion and transportation system performance. However, varying definitions of access and performance have confounded the research. A related problem is the exclusive attention to access to the central business district (CBD) while ignoring other locations. This report investigates how accessibility affects the economic performance of large U.S. urban regions. The eight regions selected for this study are Charlotte, Salt Lake City, Seattle, Denver, San Francisco, Detroit, Dallas and Atlanta. First we defined accessibility as the number or percentage of jobs or residents within a given drive time from a point, measuring drive time via the available highway networks of the regions. We identified five major destinations, or key points for each region: the central business district (CBD), major mall, large suburb, university and airport, and correlated the accessibility to these points with regional productivity, defined as gross regional product per worker. We then quantified how much current and future traffic congestion (extrapolated for the year 2030) and total congestion relief would affect the economic productivity of each region. Specifically, the study addresses four key questions: How accessible are various points in urban regions? How will the accessibility of these points change in the future? What effect will removing congestion have on accessibility? How would improving accessibility affect the economic performance of the region? We found that the CBD is generally the most accessible place in each region, with typically 30 to 60 percent of jobs and 25 to 50 percent of residents within 25 minutes of downtown under current congested conditions. Other key points have typically one-third to one-half the percentage of CBD jobs or residents within 25 minutes. Our research determined that in the future, rising traffic congestion and rapid suburban growth together mean that key points in most regions will become
4 relatively less accessible than they are now. The reduction in access is typically 1 to10 percent. But removal of congestion would increase the access to key points by 2 to 30 percent, allowing most regions to reverse the expected decline in access and making these key points relatively more accessible as the region grows. The study also finds that a 10 percent decrease in CBD accessibility would decrease regional productivity by about 1 percent, about the same as observed in Europe and Korea in previous studies. But it also suggests that regional economies might be more dependent on access to suburbs, malls and universities than on access to downtowns. Not only are models of productivity somewhat stronger for these sites, but access to them has a stronger effect on regional productivity. Solving congestion would boost gross regional performance by 6 to 30 percent if targeted at suburbs, malls, and universities, but 4 to 10 percent if targeted at CBDs, and just 2 to 8 percent if targeted at airports. Over 20 years the additional tax revenue generated by the productivity gain caused by accessibility improvements is likely to be several times larger than the estimated cost of congestion removal. The study concludes that the focus of transportation plans on CBD access may be misplaced, as regions grow and other locations become relatively more congested. It suggests a re-thinking of plans to improve access through congestion reduction particularly in non-cbd locations.
5 Reason Foundation Table of Contents Introduction...1 Accessibility to Regional Points...4 A. Statistics for Regions and Major Points...4 B. How Accessible are Points within Regions?...7 C. Future Changes in Accessibility...9 How Does Accessibility Affect Regional Economic Performance?...18 Conclusion, Recommendations and Regional Access Summaries...21 A. Conclusion...21 B. Recommendations...22 C. Regional Access Summaries...22 Acknowledgments...33 About the Authors...33 Related Reason Foundation Studies...34 Appendix: Technical Discussions and Methodology...35 Endnotes...54
6 Tables and Figures Table 1: Regional Economies and Traffic Statistics...4 Table 2: Summary of Regional Traffic and Congestion Statistics...5 Table 3: Population and Jobs within 25 Minutes of Key Points...8 Table 4: Changes in Accessibility for CBDs...11 Table 5: Changes in Accessibility for Universities...11 Table 6: Changes in Accessibility for Major Malls...13 Table 7: Changes in Accessibility for Major Suburbs...14 Table 8: Changes in Accessibility for Airports...17 Table 9: Impact of Congestion Relief on Regional Economies...19 Table A.1: Selected Study Points...36 Table A.2: Technical Data for Regional Networks...37 Table A.3: Summary of Best 25-Minute Productivity Models...39 Table A.4: Access of Atlanta CBD...41 Table A.5: Productivity Models of CBD Accessibility...42 Table A.6: Access of UNC Charlotte...44 Table A.7: Productivity Models of University Access...45 Table A.8: Access of Factoria Square Mall, Seattle...47 Table A.9: Productivity Models of Major Mall Access...48 Table A.10: Access of Lakewood, CO...50 Table A.11: Productivity Models of Suburban Accessibility...50 Table A.12: Access from Detroit Metropolitan Airport...52 Table A.13: Productivity Models of Airport Accessibility...53
7 Figure 1: Example of 25-Minute Drive Times for Denver Downtown...2 Figure 2: Study Points for Eight Regions...6 Figure 3: Total Population and Population within 25 Minutes of Key Points...9 Figure 4: Total Jobs and Jobs within 25 Minutes of Key Points...9 Figure 5: 25-Min Drive Time Contours for Downtown Areas...10 Figure 6: 25-Min Drive Time Contours for Universities...12 Figure 7: 25-Min Drive Time Contours for Major Malls...13 Figure 8: 25-Min Drive Time Contours for Major Suburbs...15 Figure 9: 25-Min Drive Time Contours for Airports...16 Figure A.1: 25-Min Drive Time Contours for Downtown Areas FigureA.2: Cumulative Residents and Jobs from Atlanta CBD...41 Figure A.3: 25-Min Drive Time Contours for Universities Figure A.4: Cumulative Residents and Jobs from UNC Charlotte...44 Figure A.5: 25-Min Drive Time Contours for Major Malls...46 Figure A.6: Cumulative Residents and Jobs from Factoria Square Mall, Seattle...47 Figure A.7: 25-Min Drive Time Contours for Major Suburbs...48 Figure A.9: 25-Min Drive Time Contours for Airports...51 Figure A.10: Cumulative Residents and Jobs from Detroit Metropolitan Airport...52
8 GRIDLOCK AND GROWTH STUDY 1 Part 1 Introduction The economic performance of cities has fascinated economists and regional scientists for centuries. The role of transportation in creating and maintaining easy and quick access to metropolitan areas and its effect on regional economic performance has been studied extensively, particularly in the past 30 years. The most recent efforts have attempted to tie regional performance to accessibility, congestion and transportation system performance. However, varying definitions of access and performance have confounded the research. A related problem is the exclusive attention to access to the central business district (CBD) while ignoring other locations. Also, the causal link between congestion and economic competitiveness is nebulous. A recent comprehensive review of about 500 studies concluded that [T]here remains little agreement either on what the term competitiveness means or on how policy intervention should try to enhance it Empirical research directly assessing the role of transport in city competitiveness is relatively scarce There are severe difficulties in attributing causality [between transport and competitiveness.]. 1 The link between traffic congestion and productivity is also not extensively studied. Although some work has been done in Europe and the U.S., few have made direct connections between congestion, accessibility and urban productivity. 2 In short, the linkages remain elusive, hinting of some (but perhaps not much) influence by mature transportation systems on regional performance. A relatively recent empirical approach uses drive time contours that show the geographic area within a given travel time from a point, or the number of entities (jobs, households, income, population groups, etc.) reachable within that time. Drive time measures appear to be a more accurate measure of access than concentric circles, since they reflect both the directionality and the speed of transportation networks. For instance, Figure 1 shows the area enclosed by 25-minute drive time from the Denver downtown, with and without congestion. 3 The uncongested network permits higher free flow speeds and hence a larger contour, particularly along major routes. This results in a significant increase in the number of jobs or residents within 25 minutes of downtown or other parts of the metro area. These increases could (in theory) improve regional performance by reducing travel time and increasing the jobs available to residents, the workers and customers available to employers. Drive time contours express changes in access as transportation systems improve. They determine and illustrate how cities are growing over time, how access is improving or worsening, and how future improvements might change access.

9 2 Reason Foundation Figure 1: Example of 25-Minute Drive Times for Denver Downtown Drive time contours have also recently been used to describe and compare the productivity of regions. Studies comparing overseas locations in terms of drive time spheres of accessibility have revealed some correlation with productivity, but no cross-region study has focused on U.S. locations, which are more auto-dependent and larger geographically. To understand the relationship between accessibility, regional economic performance and congestion, this study investigates how regional economic performance is related to access to downtowns and other major activity centers in the United States. We also look at how congestion affects access and how its reduction would help a region become more accessible and more productive. Specifically, the study addresses four key questions: 1. How accessible are various points in urban regions? 2. How will the accessibility of these points change in the future? 3. What effect will removing congestion have on accessibility? 4. How would improving accessibility affect the economic performance of the region? Seeking a representative sample for this study we reviewed available data and selected the following cities: Charlotte, Salt Lake City, Denver, San Francisco, Seattle, Detroit, Atlanta, and Dallas-Ft. Worth. More cities could not be included, given time and other constraints. We gathered current and future demographic data by zone from each region s respective planning
10 GRIDLOCK AND GROWTH STUDY 3 agencies, and identified points corresponding to central business districts, universities, airports, major malls and major suburban locations and translated this data into a consistent format for ease of analysis. 4 We determined drive time contours for base year and 2030, under both congested and free-flow conditions for each point, and estimated regional productivity, enabling us to examine not only the correlation between traffic congestion relief and regional productivity, but also the relative economic effects of congestion relief for various major destinations in each metropolitan area. 5
11 4 Reason Foundation Part 2 Accessibility to Regional Points A. Statistics for Regions and Major Points This study examines eight urban regions: Charlotte San Francisco Salt Lake City Dallas-Fort Worth Denver Detroit Seattle Atlanta Table 1 summarizes key statistics for the urbanized areas comprising the eight regions. 6 In population they range from 855,000 for Charlotte to million for Atlanta. Daily traffic (daily vehicle-miles-of-travel) 7 varies from 21 M for Salt Lake City to 128 M for Atlanta. Density is expressed in population per square mile. Daily freeway traffic volumes per lane range from 13,957 in Salt Lake City to 19,879 for San Francisco. The gross regional product (GRP) is computed from the region s income-weighted share of gross state product (for the base year of the demographic data). Regional productivity ranges from $81,700 for Salt Lake City to $125,400 for San Francisco. 8 Table 1: Regional Economies and Traffic Statistics Urbanized Area Daily Travel, 2005 Pop, 2005 Area, 2005 Density, 2005 Freeway Daily Traffic/ Lane, 2005 Base Year of Demog. Data Base Year Gross Regional Product Base Year Regional Jobs Base Year GRP/ Worker k VMT k Sq m $ B K K Charlotte 29, ,467 15, $ 93.1 Salt Lake City 21, ,836 13, $ 81.7 Denver 52,437 2, ,570 15, $ Seattle 69,967 3,002 1,185 2,533 16, $ San Francisco 73,251 3, ,314 19, $ Dallas 119,648 3,746 1,712 2,188 18, $ 98.2 Detroit 104,126 3,931 1,439 2,732 17, $ Atlanta 128,353 4,172 3,027 1,378 19, $ 112.0
12 GRIDLOCK AND GROWTH STUDY 5 Table 2 summarizes the current congestion and planned transportation expenditures for the eight regions (the 2003 population data is slightly different from the above 2005 statistics). All are expected to grow substantially over the next 25 years, and congestion (the portion of the TTI index to the right of the decimal) is expected to increase sharply. 9 The TTI or travel time index is a measure of traffic congestion. Free-flow conditions are represented by 1.0 and congestion by the number after the decimal, thus the impact of Charlotte s current congestion is 1.31, i.e., congestion increases travel time by 31 percent. Charlotte s congestion index is predicted to increase from 1.31 to 1.62, doubling delay; Salt Lake City, Denver, Seattle and Dallas predict similar results. Table 2: Summary of Regional Traffic and Congestion Statistics 2003 Urb Area 2030 Urb Area Long-Range Plan Costs ($B) Region Pop, K TTI Pop, K TTI Highway Costs Transit Costs Total Costs Cost to Remove LOS F Congestion, ($B) Charlotte , Salt Lake City , Denver 2, , Atlanta 2, , Seattle 2, , Detroit 3, , San Francisco 4, , Dallas 4, , Each region s long-range plan contains a fiscally constrained estimate of costs, by mode. The regions plans propose substantial highway and transit expenditures, costing from $11.04 B for Charlotte to $118.0 B for San Francisco. However, even with these expenditures, congestion will continue to increase. Forecasts of congestion reflect analysis of historical congestion trends in each region and predicted traffic and population growth. 10 The cost of removing severe congestion (based on unit cost estimates multiplied by predicted system congestion mileage as determined earlier by the authors) ranges from a low of $1.2 B for Salt Lake City to a high of $29.2 B for San Francisco. 11 Figure 2 shows the major road network and study points for each region. These data come initially from each region s transportation modeling agency in the form of networks and demographics. Road networks are typically the higher-level road system (excluding local streets) and contain link travel times at posted (free flow) speeds and at congested (traffic-delayed) speeds, link length, functional class and other items. For this report the driving times over these networks are refined to reasonably approximate on the ground travel times to facilitate drive time contours and estimate accessibility. 12
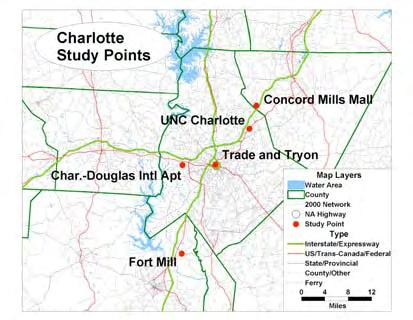


13 6 Reason Foundation Figure 2: Study Points for Eight Regions
14 GRIDLOCK AND GROWTH STUDY 7 There are many definitions of accessibility. In this study, absolute accessibility is defined as the number of residents or jobs reachable within 25 minutes driving time from a given point. Relative accessibility is defined as the percentage of regional residents or jobs within 25 minutes of a given point. Defined as such, absolute accessibility can (and will, due to increased population density) increase, and at the same time relative accessibility can decrease, as rim population increases faster than inner-city population density. The 25-minute drive time is used because it closely approximates the median peak-hour travel time for auto-mode commuters in major cities. This straightforward definition relates directly to road speed, extent and traffic congestion during peak hours. It is also computationally straightforward and comparable across regions and from year to year, and is well understood by planners and interested citizens. However, it does not capture the much larger area that, say, 90 percent of commuters come from. The use of a larger catchment area or a longer commute time would probably strengthen our modeling results. 13 The figure also shows five selected destination points in each of these eight regions. The specific points are: Central business district (CBD, downtown ) Major university Major mall Suburban community Airport While these points are certainly not the only major points in regions, they are indicative of the range of locations which allow the region to function economically. They would also undoubtedly be chosen as starting points in local travel time studies. B. How Accessible are Points within Regions? Table 3 shows that accessibility (the number and percent of jobs or population within 25 minutes of a point) varies substantially across the eight regions. Generally, the CBD (downtown) is the most accessible point, with the percentage of the region s residents within 25 minutes ranging from 26 percent for Charlotte to 55 percent for Salt Lake City. Other points are generally one-third to one-half as accessible as the CBD. Jobs are more concentrated, with 32 to 64 percent of regional jobs within 25 minutes of the CBD; in a few cases, other points have even more jobs within 25 minutes. Figure 3 shows this data comparatively, for population. While San Francisco has the highest total regional population, Salt Lake City actually has the highest percent of regional population (54.6 percent) within 25 minutes of the CBD, and thus the highest regional accessibility. Similarly, Figure 4 shows jobs accessibility comparatively. For jobs, San Francisco has the largest number of jobs in its total region, but Salt Lake City also has the highest percent of jobs (63.8 percent) within 25 minutes of the CBD.
15 8 Reason Foundation Table 3: Population and Jobs within 25 Minutes of Key Points Population Within 25 Minutes Jobs Within 25 Minutes Region Location Number (k) Pct of Region Number (k) Pct of Region Charlotte Total CBD Mall Airport University Suburb Salt Lake City Total Mall CBD Airport Suburb University Seattle Total Mall CBD University Airport Suburb Denver Total CBD University Suburb Mall Airport Atlanta Total CBD Suburb Mall University Airport San Francisco Total CBD Mall Suburb Airport University Detroit Total CBD University Airport Mall Suburb Dallas Total CBD Airport Mall Suburb University
16 GRIDLOCK AND GROWTH STUDY Figure 3: Total Population and Population within 25 Minutes of Key Points Population Charlotte Salt Lake Seattle Denv er A tlanta San Franciso Detr oit Dallas Population (k) Jobs (k) Total CBD Mall Airport University Total CBD Mall Airport University Suburb Total Mall CBD Airport Suburb University Total Mall CBD University Airport Suburb Total CBD University Suburb Mall Airport Total CBD Suburb Mall University Figure 4: Total Jobs and Jobs within 25 Minutes of Key Points Jobs Suburb Total Mall CBD Airport Suburb University Total Mall CBD University Airport Suburb Total CBD University Suburb Mall Airport Total CBD Suburb Mall University Airport Total Airport Total CBD Mall Suburb Airport University Total CBD University Airport Mall Suburb Total CBD Airport Mall Suburb University Charlotte Salt Lake Seattle Denver A tlanta San Franciso Detr oit Dallas C. Future Changes in Accessibility CBD Mall Suburb Airport University Total CBD University Airport Mall Suburb Total CBD Airport Mall Suburb University To determine future changes in accessibility, we computed the proportion of residents and jobs within 25 minutes of each point in each region, for present and future (year 2030) networks, and with and without congestion. We then determined the change (in percent) in accessibility by comparing the base case with other cases. Our assessments are based on equilibrium traffic models for each region which account for congestion, population and employment growth, new and committed roads and transit service, changes in trip origins and destinations, and shifts of routes to faster roads. We used these computations to estimate drive times for congested regions. 14 Table 4 and Figure 5 summarize the findings for the CBDs. Of the eight, seven will experience future declines in the relative access of their CBDs, ranging from -1 percent (meaning 1 percent less accessible than the base year) for Seattle to -17 percent for Denver. This will occur because the suburbs of these regions will grow more rapidly than the inner areas. (All regions will grow in absolute accessibility due to an increase in population density). But removal of congestion would yield significant improvements, between 1 and 41 percent in CBD access, more than offsetting suburban growth in seven of the eight cities.

17 10 Reason Foundation Figure 5: 25-Min Drive Time Contours for Downtown Areas.
18 GRIDLOCK AND GROWTH STUDY 11 Table 4: Changes in Accessibility for CBDs CBD for: Population Within 25 Min of CBD Percent Change in Relative Accessibility, Base Yr vs. Future Yr. Percentage Change in Relative Accessibility, Congested vs. Free Flow Percentage Change in Relative Accessibility, Base Congested vs. Future Free Flow Charlotte 441,000 1 to 3 20 to to 31 Salt Lake City 801,000-6 to to 1-6 to -8 Seattle 966,000-1 to to to 18 Denver 1,181,000-1 to to to 28 Atlanta 1,458,000-5 to to to 4 San Francisco 1,868,000 0 to -3 4 to 5 2 to 4 Detroit 2,035,000-3 to -6 1 to 6-3 to 0.4 Dallas 2,129,000-6 to to 14 1 to 5 Of the eight regions, the seven largest show essentially the same findings: the CBD is likely to decline in relative accessibility as most future growth goes to the suburbs. But total congestion removal would more than offset this projected decline, in some cases by a significant amount. For the smallest city (Charlotte), CBD access will increase slightly, but congestion removal would also greatly improve it. For Salt Lake City, CBD access will decline but since congestion is relatively low the decline is mostly due to suburban growth and removing congestion will have little effect on CBD access. A similar but even more dramatic effect is observed for accessibility to universities. The population and jobs within 25 minutes are generally less for universities than for downtowns, but suburban growth is likely to impact them more. Table 5 and Figure 6 show that six of the eight regions major universities will become relatively less accessible as the region grows and congestion increases. The reductions in relative accessibility range from -1 to -16 percent. (The two exceptions are Charlotte and Salt Lake City). However, the effect of removing congestion from the network is even more substantial on university access than on CBD access. The effect is largest for Charlotte and Denver, and smallest for Detroit. The increase in relative accessibility ranges from a low of -1 in Salt Lake City, to a high of 37 percent for Charlotte. Table 5: Changes in Accessibility for Universities Major University in: Population Within 25 min of Major Univ. Percentage Change in Relative Accessibility, Base Year vs Future Year Percentage Change in Relative Accessibility, Congested vs. Free Flow Percentage Change in Relative Accessibility, Base Congested vs. Future Free flow Charlotte 294,000 2 to 8 29 to to 37 Salt Lake City 350, to 3 0 to to 3 Seattle 838,000-1 to to to 21 Atlanta 916,000-4 to to 19 2 to 4 San Francisco 1,050,000-1 to -4 2 to 5 2 to 3 Dallas 1,133, to to to 24 Denver 1,138,000-2 to to to 29 Detroit 1,454,000-3 to -4 2 to 4 0 to -0.8
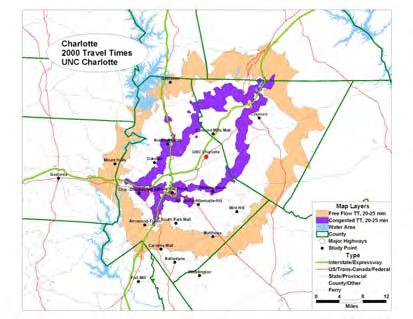


19 12 Reason Foundation Figure 6: 25-Min Drive Time Contours for Universities.
20 GRIDLOCK AND GROWTH STUDY 13 The impact of congestion removal on accessibility to major malls is not as dramatic. Table 6 and Figure 7 show that seven of the eight regions major malls will decline in relative accessibility as the region grows (the exception is Charlotte). However, the removal of congestion from the regional network would more than offset that effect in all regions, and would have the effect of making the major malls considerably more accessible than at present. The largest effect would be for Denver s Aurora Mall (42 to 54 percent) and the smallest for Salt Lake City s Fashion Place Mall (-1 to -4 percent) where the removal of congestion would be insufficient to turn around declining access. Table 6: Changes in Accessibility for Major Malls Major Mall in: Population Within 25 min of Major Mall Percentage Change in Relative Accessibility, Base Year vs. Future Year Percentage Change in Relative Accessibility, Congested vs. Free Flow Percentage Change in Relative Accessibility, Base Congested vs. Future Free Flow Charlotte 402,000 5 to 7 20 to to 27 Denver 595,000-3 to to to 54 Salt Lake City 817,000-3 to -7 2 to 4-1 to -4 Detroit 944, to -3 4 to 8 4 to 5 Seattle 998,000-1 to to to 20 Dallas 1,280,000-3 to to 17 8 to 13 San Francisco 1,489, to -3 4 to 11 5 to 8 Atlanta 1,890,000-5 to to to 11 Figure 7: 25-Min Drive Time Contours for Major Malls
21 14 Reason Foundation Looking at major suburbs (Table 7 and Figure 8) the results are more modest in scale but similar overall: removal of congestion from the regional networks would enable these present-day nearby suburbs to improve their access relative to the remainder of the region. Table 7: Changes in Accessibility for Major Suburbs Major Suburb for: Population Within 25 min of Major Suburb Percentage Change in Relative Accessibility, Base Year vs. Future Year Percentage Change in Relative Accessibility, Congested vs. Free Flow Percentage Change in Relative Accessibility, Base Congested vs. Future Free Flow Charlotte 163,000-1 to to to 33 Salt Lake City 489,000 2 to 4 3 to 6 6 to 7 Seattle 630, to to to 23 Denver 930,000-5 to to to 31 Atlanta 1,300,000-3 to to 20 7 to 9 San Francisco 1,408, to -3 4 to 7 2 to 5 Detroit 901,000 2 to -1 3 to 6 3 to 6 Dallas 1,182,000-3 to to 18 8 to 13


22 Figure 8: 25-Min Drive Time Contours for Major Suburbs GRIDLOCK AND GROWTH STUDY 15
.")


23 16 Reason Foundation The overall results for airports are also similar (Table 8 and Figure 9). Removal of congestion would allow likely declines in airport accessibility to be reversed, increasing the access to the region s airport relative to other points. Only for Salt Lake City is the removal of congestion too small in impact to offset the likely regional decline of airport access caused by suburbanization. Figure 9: 25-Min Drive Time Contours for Airports
24 GRIDLOCK AND GROWTH STUDY 17 Table 8: Changes in Accessibility for Airports Major Airport for: Population Within 25 min of Airport Percentage Change in Relative Accessibility, Base Year vs. Future Year Percentage Change in Relative Accessibility, Congested vs. Free Flow Percentage Change in Relative Accessibility, Base Congested vs. Future Free Flow Charlotte 361, to 9 16 to to 34 Salt Lake City 774,000-4 to to 2-5 to -4 Seattle 750,000-1 to to to 20 Denver 210,000-2 to 6 13 to to 22 Atlanta 987,000-5 to to 17 7 to 10 San Francisco 1,319,000-1 to -3 5 to 7 4 to 5 Detroit 1,038, to -2 3 to 4 1 to 4 Dallas 1,343,000-3 to to to 22
25 18 Reason Foundation Part 3 How Does Accessibility Affect Regional Economic Performance? The Gross National Product is commonly defined as the sum of the value of all goods and services produced annually by the nation. Analogously, one can also think of a Gross State Product or Gross Regional Product as the sum of the value of all goods and services produced annually by a state or urban region. To determine changes in regional economic performance related to changes in accessibility, we first estimated the gross regional product of each region, proportional to state GSP and county income data for the base year. Dividing by the number of workers (jobs) in each region gives the regional productivity, or gross regional product per worker (job). These range from $81,700 for Salt Lake City to $125,400 for San Francisco. 15 Accessibility between jobs and universities or major suburbs shows a stronger and more sensitive relationship with regional productivity than accessibility of population to CBDs. Since the impact of job access to university and trade-school education, suburbs and major malls is an oftenoverlooked element of regional access, the findings suggest that analysts should, at the least, turn to other major points within urban regions in evaluating how access will influence regional performance. The information in Table A-3 (our statistical results on page 39) is generally consistent with that reported by Prud homme and Lee, who found that a 10 percent improvement in 25-minute CBD population accessibility improved regional performance by about 1.3 percent for 22 cities in France. Our data found about 1 percent for the same model. How will congestion removal affect the economic performance of a region? To determine this we calculated the change in regional productivity that would occur if each region were able to totally remove congestion and this change were translated into a change in accessibility. Results are shown in Table 9. The analysis indicates that removal of congestion from these eight regions would lead to significant changes in regional economic performance, depending on the location considered. The largest change is seen using suburbs, malls and universities as the focus, and the smallest using airports as the focus. Of course not all congestion can be removed from a region; this assessment therefore provides an upper bound on the impact of likely congestion-removal strategies.
26 GRIDLOCK AND GROWTH STUDY 19 Table 9: Impact of Congestion Relief on Regional Economies Region Location Base Year Productivity per Worker Percent Change from Relieved Congestion Free Flow Productivity Per Worker Change in Per Worker Productivity Gross City Product under Free Flow Conditions Additional GCP under Free Flow Additional Tax Take Over 20 Years at 7% Estimated Cost to Remove LOS F Congestion ($) ($) ($) ($B) ($B) ($B) ($B) Charlotte Suburb 93, ,774 28, $ 3-5 B University 93, ,635 18, Mall 93, ,605 5, CBD 93, ,314 4, Airport 93, ,023 1, Salt Lake City Suburb 81, ,832 1, $ 1-2 B Mall 81, , University 81, , CBD 81, , Airport 81, , Seattle Suburb 113, ,635 9, $ 5-10 B University 113, ,500 9, CBD 113, ,660 3, Mall 113, ,652 3, Airport 113, ,914 2, Denver Mall 116, ,356 36, $ B Suburb 116, ,342 13, University 116, ,417 8, Airport 116, ,091 8, CBD 116, ,194 6, San Francisco Mall 125, ,728 5, $ B Suburb 125, ,942 2, University 125, ,718 2, CBD 125, ,116 1, Airport 125, ,878 1, Detroit Suburb 107, ,183 3, $ B University 107, ,879 2, Mall 107, ,309 2, CBD 107, ,983 1, Airport 107, , Dallas University 98, ,813 18, $ B Suburb 98, ,554 9, Mall 98, ,421 7, Airport 98, ,205 3, CBD 98, ,452 2, Atlanta Suburb 112, ,382 7, $ B Mall 112, ,070 6, University 112, ,927 5, Airport 112, ,667 2, CBD 112, ,586 2,
27 20 Reason Foundation The results in terms of regional performance and subsequent tax revenues, at 7 percent (a typical state-local tax rate) are quite substantial. For Charlotte for instance, removing congestion in suburbs would have the effect of increasing regional performance by about 30.7 percent; over 20 years the tax take from such an action would amount to $ 31.5 B. On the other hand, removing congestion around the Charlotte CBD would yield just $ 4.6 B in tax take over 20 years. For other regions the effects are generally proportional to the increase in access: Salt Lake City s regional network is currently not as congested as other cities, so removal of congestion would have a marginal impact on its regional economy. Seattle s economy would be most improved in productivity by focusing congestion relief on access to suburbs and universities. Denver s economy would benefit most from accessibility improvements to malls and suburbs. San Francisco s economy would be most improved by access improvements to malls and suburbs. Detroit s economy would benefit most from accessibility improvements to suburbs and universities. Dallas s economy would benefit most from accessibility improvements to universities, suburbs and malls. Atlanta s economy would benefit most from focusing congestion relief on suburbs, malls and universities. Of the five types of sites we looked at, the biggest improvement in regional performance tended to come from improving access to major suburbs and malls. Airport access seems to be the least important player in regional economic performance, even though it is often mentioned by companies looking to relocate. Perhaps they are already reasonably accessible, or perhaps residents and businesses make so few airport trips that airport access is not as critical as some would think.
28 GRIDLOCK AND GROWTH STUDY 21 Part 4 Conclusion, Recommendations and Regional Access Summaries A. Conclusion The most accessible place in most regions is the central business district, with 25 to 54 percent of population and 31 to 63 percent of jobs within 25 minutes peak hour drive time. Other points typically have fewer jobs or residents within 25 minutes than the central business district. However, growing congestion and suburban growth together mean that key points in most regions, including the CBD, will become relatively less accessible in the future. Most key points within regions will decline in relative access as the region grows. These points are already built up, and so will be surrendering their prior access advantages to other points currently developing. However, the impact of congestion removal on the access of these points is substantial. Removal of congestion, would allow regions to reverse the declining access of key points and instead raise their relative access. If these points are to remain accessible to the rest of the region then congestion reduction will be a key strategy in that effort. Most studies of productivity have focused on CBD access; this study suggests that other sites may be more important in the regional economy. Regional productivity seems to depend more on access to other locations than on access to downtown. Not only is regional productivity more sensitive to access to non-cbd points, but the cost of congestion relief for those points may be less too. An implication of this study is that current transportation plans may be placing too much focus on downtowns. Particularly in mid-sized cities where automobility is overwhelmingly predominant the impact of suburban transportation improvements will be more effective in spurring regional economic performance. Clearly the role of suburbs, malls and universities in regional economic performance needs to be more fully explored. However a shift in focus to other key points might pit the CBD against other interests. Another important finding of the study is that access to jobs seems to be more important in regional economic performance than is access to population. Not only is the impact on regional productivity greater, but the impacts from congestion removal are greater when viewed through a job prism than a resident prism. Regions depend on fluid movement between jobs and other locations like malls and universities, as well as residential connections to these sites. Many people come to malls and universities from work sites, not from home.
29 22 Reason Foundation B. Recommendations Recognize that congestion reduces people s access to jobs and firms access to workers, and this can have significant impact on the regional economy. City leaders and planners have long been aware that congestion wastes fuel and people s time, but our findings show that it is a drag on the productivity and growth of the regional economy as well. Pay more attention to the accessibility of other locations, not just CBDs. Our findings suggest that improving accessibility to other key points in the region may provide overlooked opportunities to improve regional performance at a fraction of the cost of improving CBD access. Improve accessibility in other locations. Suburbs, malls and universities, in particular, showed more potential for access improvement and more impact on regional productivity. Remove bottlenecks throughout regions. Relatively modest expenditures spent on removal of bottlenecks in a road system can have substantial impact on accessibility, particularly if congestion is relatively concentrated geographically. These locations should be the first to be explored for improvement. Add capacity in the rims of cities. Our findings suggest that investment in suburban accessibility is likely to be productivity-gaining. Not only is access likely to improve more per dollar invested than in the CBD, but future growth is likely to be higher. Conduct an accessibility assessment for each city. From a planning perspective accessibility studies are a convenient way of understanding the impact of congestion removal, and of comparing alternate treatments. They are under-used in transportation planning, however, because until recently they were difficult to undertake. New software has made the task easier. Reconsider arguments against sprawl. This study suggests that an overlooked benefit of congestion reduction is the ability to improve accessibility. This finding dents the planning wisdom that higher density will yield greater productivity and is therefore preferable. Adding the benefits of greater access may be sufficient to tip arguments in favor of greater, not less, highway access. C. Regional Access Summaries Charlotte: Downtown (441,000 people within 25 minutes) About 441,000 people (26.3 percent of region) are within 25 minutes of the CBD. This will grow to 919,000 (29.5 percent of 2030 region) by This means that the region will get more accessible, by about 3.2 percent, even with congestion. Similar results occur for employment, and for free-flow conditions with increases in the 1.4 to 5.3 percent range. Removal of congestion produces a percent increase in access, about 8-10 times the increase occurring from regional growth. Conclusion: Congestion removal would significantly accelerate the already improving access.
30 GRIDLOCK AND GROWTH STUDY 23 University (294,000 people within 25 minutes) About 294,000 people (17.5 percent of 2000 region) are within 25 minutes of UNC Charlotte. This will grow to 777,000 people (25.0 percent of 2030 region) by This means that the area will become more accessible, by about 7.5 percent, even with congestion. The results are similar for employment, and free-flow conditions, with results ranging from 2.0 to 7.5 percent increases. Congestion removal would produce a 28.6 to 34.8 percent increase in accessibility. Conclusion: Congestion removal would significantly accelerate the already improving access. Major Mall (402,000 people within 25 minutes) About 402,000 people (23.9 percent of 2000 region) are within 25 minutes of Concord Mills Mall. This will grow to 980,000 people (31.3 percent of 2030 region) by This means that the mall area will become more accessible, by about 7.4 percent, even with congestion., The results are similar for employment and free-flow conditions, with increases in the 4.7 to 5.5 percent range. Congestion removal would produce a 19.6 to 27.6 percent increase in accessibility, about three to five times the increase from regional growth. Conclusion: Congestion removal would significantly accelerate the already improving access. Major Suburb (163,000 people within 25 minutes) About 163,000 people (9.7 percent of 2000 region) are within 25 minutes of Fort Mill. This will grow to 278,000 population (9 percent of 2030 region). This means that the area will become less accessible, by -0.7 percent. The results are similar for employment, with reductions in the -1.3 to -2.0 percent range. Free-flow employment enjoys an increase of 2.5 percent. Congestion removal would produce a 23.6 to 34.7 percent increase in accessibility. Conclusion: Congestion removal would reverse the projected decline in access. Airport (361,000 people within 25 minutes) About 361,000 people (21.5 percent of 2000 region) are within 25 minutes of Charlotte- Douglas International Airport. This will grow to 935,000 people (30.0 percent of 2030 region) by This means that the area will become more accessible, by 8.5 percent, even with congestion. The results for employment and free-flow conditions are mixed, with a -0.1 percent decline in free-flow employment access, but 2.2 and 5.3 percent increase in congested free-flow population and congested employment access, respectively. Congestion removal would produce a 15.9 to 31.3 percent increase in accessibility. Conclusion: Congestion removal would further accelerate the already improving access, and reverse any losses in access for free-flow conditions.
31 24 Reason Foundation Salt Lake City: Downtown (about 801,000 people within 25 minutes of CBD) About 801,000 people (54.6 percent of region) are within 25 min of the CBD. This will grow to about 1,081,000 (45.4 percent of region) by (-9.2 percent change). This means that the region will become less accessible, as most growth will be in the edges. The decline in access is -6.8 to -9.2 percent) Similar results occur for employment and for free-flow conditions, with reductions in the to -8.9 percent range. This region is not very congested (TTI 1.28, future 1.59), relative to size. Removal of congestion produces only about a percent improvement in access. Conclusion: Congestion removal would only slightly improve declining access. University (350,000 people within 25 minutes) About 350,000 people (24.1 percent of 2001 region) are within 25 minutes of Brigham Young University. This will grow to 580,000 people (24.6 percent of 2030 region) by This means that the area will become more accessible, by about 0.5 percent. Similar results occur for employment and free-flow conditions, with increases ranging from 1.3 to 3.1 percent. Congestion removal would only produce a 0 to 1.2 percent increase in access. Conclusion: Congestion removal would marginally increase already improving access. Major Malls (817,000 people within 25 minutes) About 817,000 people (55.4 percent of 2001 region) are within 25 minutes of Fashion Place Mall. This will grow to 114,7000 people (48.1 percent of 2030 region) by This means that the mall area will become less accessible, by about -7.3 percent. Similar results occur for employment and free-flow conditions, with reductions ranging from -2.6 to -5.9 percent. Congestion removal would only produce a 1.5 to 3.5 percent increase in access. Conclusion: Congestion removal would slightly improve declining access. Major Suburbs (489,000 people within 25 minutes) About 489,000 people (33.3 percent of 2001 region) are within 25 minutes of American Fork, which will grow to 839,000 (35.3 percent of 2030 region). This means that the area will become more accessible, by about 2 percent, even with congestion. Similar results occur for employment and free-flow conditions, with increases ranging from 3.0 to 4.0 percent. Congestion removal would further increase accessibility by 2.6 to 6.0 percent. Conclusion: Congestion removal would approximately double the access improvements already projected.
32 GRIDLOCK AND GROWTH STUDY 25 Major Airports (774,000 people within 25 minutes) About 774,000 people (53 percent of 2001 region) are within 25 minutes of Salt Lake City International Airport. This will grow to 1,097,000 people (46.2 percent of 2030 region) by This means that the area will become less accessible, by about -6.8 percent. Similar results occur for employment and free-flow conditions, with results ranging from to -5.8 percent. Congestion removal would slightly improve accessibility by 0.10 to 1.7 percent. Conclusion: Congestion removal would slightly improve, but not reverse, the declining access. Seattle: Downtown (966,000 people within 25 minute of the CBD) About 966,000 people (54.1 percent of region) are within 25 minutes of the CBD. This will grow to 1,653,000 people (51.9 percent of 2030 region) by So, the region will become less accessible, by about -2.4 percent. Similar results occur for employment and free-flow conditions, with reductions in the -1.3 to -2.7 percent range. Congestion removal would yield a percent increase in accessibility; about six times the decline in access caused by growth. Conclusion: Congestion removal would reverse the projected decline in accessibility. University (838,000 people within 25 minutes) About 838,000 people (25.6 percent of 2000 region) are within 25 minutes of the University of Washington Seattle. This will grow to 1,065,900 people (23.5 percent of 2030 region) by This means that the area will become less accessible, by about -2.1 percent. Similar results occur for employment and free-flow conditions, with reductions of -1.1 to Congestion removal would yield a 20.8 to 23.5 percent increase in accessibility. Conclusion: Congestion removal would significantly reverse the projected decline in accessibility caused by growth. Major Mall (998,000 people within 25 minutes) About 998,000 people (30.5 percent of 2000 region) are within 25 minutes of Factoria Square Mall. This will grow to 1,294,000 people (28.6 percent of 2030 region) by This means that the mall will become less accessible, by about -1.9 percent. Similar results occur for employment and free-flow conditions, with reductions of to -2.3 percent. Congestion removal would yield a 13.7 to 22.1 percent increase in accessibility. Conclusion: Congestion removal would reverse the projected decline in accessibility caused by growth.
33 26 Reason Foundation Major Suburb (630,000 people within 25 minutes) About 630,000 people (19.3 percent of 2000 region) are within 25 minutes of Redmond. This will grow to 839,000 people (18.6 percent of 2030 region) by This means that the area will become less accessible, by about -0.7 percent. Similar results occur for employment and free-flow conditions, with reductions of -0.6 to percent. Congestion removal would yield a 21.6 to 23.5 percent increase in accessibility. Conclusion: Congestion removal would reverse the projected decline in accessibility caused by growth. Airport (750,000 people within 25 minutes) About 750,000 people (22.9 percent of 2000 region) are within 25 minutes of Seattle- Tacoma International Airport. This will grow to 1,399,000 people (21.5 percent of 2030 region) by This means that the area will become less accessible, by about -1.4 percent. Similar results occur for employment and free-flow conditions, with reductions of -1.6 to percent. Congestion removal would yield an 18.2 to 21.4 percent increase in accessibility. Conclusion: Congestion removal would reverse the projected decline in accessibility caused by growth. Denver: Downtown (1,181,000 people within 25 minutes of the CBD) About 1,181,000 people (47.2 percent of region) are within 25 min of the CBD. Growth will increase this to 1,244,000 people (29.9 percent of 2030 region) by Most of the growth will be in the suburbs, so downtown s accessibility will decline sharply (-17.3 percentage points) according to growth location. Similar results (but a wide spread ranging from -0.8 percentage points to percentage points) occur for employment and free-flow conditions. Congestion removal would yield a percent point increase in access, about three times the decline caused by growth. Conclusion: Congestion removal would reverse the decline in access caused by suburban growth. University (1,138,000 within 25 min) About 1,138,000 people (43.2 percent of 2005 region) are within 25 minutes of the University of Denver. This will decrease to 1,027,000 people (26 percent of 2030 region) by This means that the area will become less accessible by about percent. Similar results occur for employment and free-flow conditions, with reductions varying widely between -2.2 and -17 percent. Congestion removal would yield a large 24.7 to 46.2 percent point increase in access. Conclusion: Congestion removal would significantly reverse the projected decline in accessibility caused by growth.
34 GRIDLOCK AND GROWTH STUDY 27 Major Mall (595,000 people within 25 minutes) About 595,000 people (22.6 percent of 2005 region) are within 25 minutes of Aurora Mall. This will grow to 620,000 people (15.7 percent of 2030 region) by This means that the area will become less accessible, by about -6.9 percent. Similar results occur for employment and free-flow conditions, with reductions of -2.5 to percent. Congestion removal would yield a large 47.3 to 57.0 percent increase in access. Conclusion: Congestion removal would significantly reverse the projected decline in accessibility caused by growth. Major Suburb (930,000 people within 25 minutes) About 930,000 people (35.3 percent of 2005 region) are within 25 minutes of Lakewood. This will decline to 804,000 people (20.4 percent of 2030 region) by This means that the area will become less accessible, by about percent. Similar results occur for employment and free-flow conditions, with reductions of -4.6 to percent. Congestion removal would yield a large 35.7 to 48.4 percent increase in access. Conclusion: Congestion removal would significantly reverse the projected decline in accessibility caused by growth. Airport (210,000 people within 25 minutes) About 210,000 people (8 percent of 2005 region) are within 25 minutes of Denver International Airport. This will grow to 250,000 people (6.3 percent of 2030 region) by This means that the area will become less accessible, by about -1.7 percent. Similar results occur for employment, but free-flow shows increases of 3.9 to 5.9 percent. Congestion removal would yield a 12.9 to 23.2 percent increase in access. Conclusion: congestion removal would reverse the projected decline in accessibility caused by growth, and would more than double the congested access. Atlanta: Downtown (1,419,000 people within 25 minutes of the CBD) About 1,458,000 people (33.7 percent of the 2005 region) are within 25 minutes of the Five Points. This will decrease slightly to 1,419,000; also will be lower by percentage (23.2 percent of 2030 region) since most growth will be in the suburbs. This means that the Atlanta CBD will become relatively less accessible, by about percent. Similar results occur for employment access. The CBD will decline in relative access, from 49.0 percent of jobs to 34.0 percent of jobs within 25 minutes, between 2005 and Under free flow conditions, we find similar results. The range is from -5.5 percent to percent. But congestion removal would increase the Atlanta CBD access by percent, more than offsetting the decline in access caused by suburban growth. Conclusion: Congestion removal would reverse the decline in access caused by suburban growth and allow the region s CBD to improve its accessibility, by about percent.
35 28 Reason Foundation University (916,000 people within 25 minutes) About 916,000 people (25.4 percent of 2000 region) are within 25 minutes of Emory University. This will grow to about 1,097,000 people (15 percent of 2030 region) by This means that the area will become less accessible, by about percent. Similar results occur for employment and free-flow conditions, with reductions ranging from -4.3 to percent. Congestion removal would yield an 8.5 to 18.7 percent increase in access. Conclusion: Congestion removal would reverse the projected decline in accessibility caused by growth. Major Mall (1,189,000 people within 25 minutes) About 1,189,000 people (27.5 percent of 2000 region) are within 25 minutes of Cumberland Mall. This will grow to about people (21.2 percent of 2030 region) by This means that the area will become less accessible, by about -6.3 percent. Similar results occur for employment and free-flow conditions, with reductions ranging from -5.0 to -9.2 percent. Congestion removal would yield a 15.5 to 20.2 percent increase in access, about two to three times the decrease in access due to growth. Conclusion: Congestion removal would reverse the projected decline in accessibility caused by growth. Major Suburb (1,300,000 people within 25 minutes) About 1,300,000 people (30.1 percent of 2000 region) are within 25 minutes of Panthersville. This will grow to about 1,350,000 people (22.1 percent of 2030 region) by This means that the area will become less accessible, by -7.9 percent. Similar results for employment and free-flow conditions, with reductions ranging from to percent. Congestion removal would yield a to 20.2 increase in access Conclusion: Congestion removal would reverse the projected decline in accessibility caused by growth. Airport (987,000 people within 25 minutes) About 987,000 people (22.8 percent of 2000 region) are within 25 minutes of Atlanta- Hartsfield International Airport. This will grow to about 1,416,000 people (17.9 percent of 2030 region) by This means that the area will become less accessible, by about -4.9 percent. Similar results occur for employment and free-flow conditions, with reductions ranging from -2.8 to -6.9 percent. Congestion removal would yield a to 16.5 percent increase in access Conclusion: Congestion removal would reverse the projected decline in accessibility caused by growth.
36 GRIDLOCK AND GROWTH STUDY 29 San Francisco: Downtown (1,868,000 people within 25 minutes of the CBD) San Francisco has 1,868,000 people (27.6 percent of region) within 25 minutes of CBD. This will increase to 2,179,000 people (24.9 percent of region) by This means that the region is getting slightly less accessible, by -2.7 percentage points. Similar modest results occur for employment and free-flow conditions. Results range from -1.8 to -2.6 percent. Congestion removal would yield a 3.7 to 4.6 percentage point increase in accessibility. Conclusion: Congestion removal would hold the CBD at its current level of access, essentially reversing the small decline caused by suburban growth. University (1,050,000 people within 25 minutes) About 1,050,000 people (15.5 percent of 2000 region) are within 25 minutes of Stanford University. This will grow to about people (14.2 percent of 2030 region) by This means that the area will decline in access by -1.3 percent. Mostly similar results occur for employment and free-flow conditions, with employment decreasing by -1 percent free-flow conditions, and -3.5 percent congested. Free-flow conditions population reach shows and increase of 0.4 percent. Congestion removal would yield a 2.2 to 5.0 percent increase in accessibility. Conclusion: Congestion removal would reverse the projected decline in accessibility caused by growth. Major Mall (1,489,000 people within 25 minutes) About 1,489,000 people (22 percent of 2000 region) are within 25 minutes of Southland Mall. This will grow to about 1,707,000 people (19.5 percent of 2030 region) by This means that the mall area will decline in access by -2.5 percent. Mostly similar results occur for employment and free-flow conditions, with employment decreasing by -0.1 percent free-flow conditions, and -3.2 percent congested. Free-flow conditions population reach shows and increase of 0.30 percent. Congestion removal would yield a 4.4 to 10.9 percent increase in accessibility, about twice the amount of decrease due to growth. Conclusion: Congestion removal would reverse the projected decline in accessibility caused by growth. Major Suburb (1,408,000 people within 25 minutes) About 1,408,000 people (20.8 percent of 2000 region) are within 25 minutes of Berkeley. This will grow to about 1,614,000 people (18.4 percent of 2030 region) by This means that the area will decline in access by -2.4 percent. Similar results occur for employment and free-flow conditions, with reductions ranging from -1.0 to -2.7 percent. Congestion removal would yield a 3.7 to 6.9 percent increase in accessibility, about twice the amount of decrease due to growth. Conclusion: Congestion removal would reverse the projected decline in accessibility caused by growth.
37 30 Reason Foundation Airport (1,319,000 people within 25 minutes) About 1,319,000 people (19.5 percent of 2000 region) are within 25 minutes of San Francisco International Airport. This will grow to about 1,494,000 people (17.1 percent of 2030 region) by This means that the area will decline in access by -2.4 percent. Similar results occur for employment and free-flow conditions, with reductions ranging from -1.3 to -2.5 percent. Congestion removal would yield a 4.8 to 7.3 percent increase in accessibility Conclusion: Congestion removal would reverse the projected decline in accessibility caused by growth. Detroit Downtown (2,034,000 Pop within 25 minutes of CBD) Detroit has 2,034,000 people (41.2 percent of 2000 region) within 25 minutes of the CBD. This will increase slowly to 2,207,000 people (37.0 percent of 2030 region) by So the CBD will become less accessible by percentage points. Similar results occur for employment and free flow. Results range from -3.4 to -6.4 percentage points. Congestion relief would yield a 1.3 to 5.8 percent point increase in access. Conclusion: Congestion removal would reverse and essentially offset modestly declining CBD access. University (1,454,000 people within 25 minutes) About 1,454,000 people (29.4 percent of 2000 region) are within 25 minutes of University of Michigan Dearborn. This will shrink to 1,448,000 people (26.8 percent of 2030 region) by This means that the area will decline in access by -2.6 percent. Similar results occur for employment and free-flow conditions, with reductions in access ranging from -2.5 to -4.0 percent. Congestion removal would yield a 1.8 to 4.0 percent increase in accessibility. Conclusion: Congestion removal would reverse the projected decline in accessibility caused by growth. Major Mall (944,000 people within 25 minutes) About 944,000 people (19.1 percent of 2000 region) are within 25 minutes of Twelve Oaks Mall. This will grow to 910,000 people (16.8 percent of 2030 region) by This means that the mall area will decline in access by -2.3 percent. Similar results occur for employment and free-flow conditions, with reductions in access ranging from to Congestion removal would yield a 4.0 to 7.9 percent increase in accessibility, or just more than double the decline in access caused by growth. Conclusion: Congestion removal would reverse the projected decline in accessibility caused by growth.
38 GRIDLOCK AND GROWTH STUDY 31 Major Suburb (901,000 people within 25 minutes) About 901,000 people (18.2 percent of 2000 region) are within 25 minutes of Pontiac. This will grow to 1,018,000 people (18.8 percent of 2030 region) by This means that the area will increase in access by 0.6 percent, even with congestion. Similar results occur for congested employment, with increases in access of 2.2 percent. Free-flow conditions, however, will have reduced access of between -0.2 and -1.4 percent. Congestion removal would yield a 2.7 to 6.1 percent increase in accessibility. Conclusion: Congestion removal would reverse the slight projected decline in free flow accessibility by growth, and would further accelerate already improving congested conditions. Airport (1,038,000 people within 25 minutes) About 1,038,000 people (27.7 percent of 2000 region) are within 25 minutes of Detroit Metropolitan Airport. This will grow to 1,053,000 people (19.5 percent of 2030 region) by This means that the area will decline in access by about -1.5 percent. Similar results occur for free-flow conditions, with reductions between -0.6 and -1.9 percent. Congested employment access shows an increase of 0.5 percent. Congestion removal would yield a 2.5 to 3.8 percent increase in accessibility, or just more than double the decline in access caused by growth. Conclusion: Congestion removal would reverse the slightly declining accessibility. Dallas: Downtown (2,129,000 people within 25 minutes of CBD) Dallas has 2,129,000 people (43.9 percent of region) within 25 minutes of the CBD. This will increase to 2,873,000 people (33.8 percent of 2030 region) by This means that the CBD will become less accessible, by percentage points. Similar results occur for employment and free flow. Results range from -6.4 percentage points to percentage points. Congestion removal would increase CBD access by percentage points, just balancing the decline caused by suburban growth. Conclusion: Congestion removal would essentially balance the decline in access caused by suburban growth. University (1,133,000 people within 25 minutes) About 1,133,000 people (23.4 percent of 2000 region) are within 25 minutes of the University of Texas - Dallas. Will grow to 1,681,000 (19.8 percent of 2030 region). This means that access will decline by 3.6 percent. Similar results occur for free-flow and congested conditions, between -0.3 and -3.3 percent. Congestion removal would yield a 13.5 to 25.8 percent increase in accessibility. Conclusion: Congestion removal would reverse the projected decline in accessibility caused by growth.
39 32 Reason Foundation Major Mall (1,280,000 people within 25 minutes) About 1,280,000 people (26.4 percent of 2000 region) are within 25 minutes of North East Mall. This will grow to 1,815,000 people (22.9 percent of 2030 region) by This means that access will decline by 3.5 percent. Similar results occur for free-flow conditions, between -2.5 and -4.9 percent. Congested employment access is expected to increase by 1 percent. Congestion removal would yield a 9.6 to 17.2 percent increase in accessibility. Conclusion: Congestion removal would reverse the projected decline in accessibility caused by growth. Major Suburb (1,182,000 people within 25 minutes) About 1,182,000 people (24.4 percent of 2000 region) are within 25 minutes of Duncanville. This will grow to 1,702,000 people (20.0 percent of 2030 region) by This means that access will decline by 4.4 percent. Similar results occur for free-flow and congested conditions, between -3.0 and -5.8 percent. Congestion removal would yield a 12.1 to 17.6 percent increase in accessibility. Conclusion: Congestion removal would reverse the projected decline in accessibility caused by growth. Airport (1,343,000 people within 25 minutes) About 1,343,000 people (27.7 percent of 2000 region) are within 25 minutes of Dallas-Ft. Worth International Airport. This will grow to 2,060,000 people (24.2 percent of 2030 region) by This means that access will decline by -3.5 percent. Similar results occur for free-flow conditions, with results ranging from -2.9 to -6.1 percent. Congested employment shows improvements in the amount of 0.1 percent. Congestion removal would yield a 14.3 to 25.2 percent increase in accessibility. Conclusion: Congestion removal would reverse the slightly declining accessibility.
40 GRIDLOCK AND GROWTH STUDY 33 Acknowledgments This study was conducted by David T. Hartgen, Emeritus Professor of Transportation Studies at UNC Charlotte. Professor Hartgen undertook the analysis, directed the gathering of data, developed recommendations and prepared the final report. He was assisted in the analysis by M. Gregory Fields and in the literature review by Jack Sommer. However, this study could not have been completed without the participation of numerous organizations and individuals. Funding for the study was provided by Reason Foundation, Los Angeles CA. The continuing support of Adrian Moore, Robert Poole and Sam Staley of Reason Foundation are gratefully appreciated. The chief transportation planners in eight regions, along with their assistants, provided detailed network and demographic data for each city. David Hansen, an undergraduate student in economics at UNC Charlotte, prepared many of the report graphics and tables. Wendell Cox and several anonymous reviewers provided very helpful assistance. The assistance of all of these individuals and organizations is gratefully appreciated, but the authors of course are alone responsible for the study s contents and recommendations. About the Authors David T. Hartgen (dthartge@uncc.edu) is Emeritus Professor of Transportation Studies at UNC Charlotte. Professor Hartgen is widely known in transportation circles. He established UNC Charlotte s Center for Interdisciplinary Transportation Studies in 1989 and now teaches and conducts research in transportation policy and planning. He is the author of about 330 studies on a wide variety of topics in transportation policy and planning, is the U.S. editor of the international academic journal Transportation, and is active in professional organizations. He is a frequent media interviewee in local and national outlets. Before coming to Charlotte he directed the statistics, traffic forecasting and analysis functions of the New York State Department of Transportation and served as a Policy Analyst at the Federal Highway Administration. He holds engineering degrees from Duke University and Northwestern University. He has taught at SUNY Albany, Union College and Syracuse University and lectures widely. His studies of the comparative performance of transportation systems have received nation-wide attention. He has also recently completed a major component of Reason s Mobility Study that estimates the cost of significantly reducing road congestion nation-wide ( a comprehensive study of congestion in North Carolina ( and a
41 34 Reason Foundation comparative study of the 50 state highway systems ( His current research includes an assessment of the economic impact of highways in South Carolina, a review of transportation performance for the provinces of Canada, a national study of business impacts of congestion, and an assessment of congestion in mid-sized cities. M. Gregory Fields is a graduate student at the University of North Carolina at Charlotte, pursuing degrees in Transportation, Earth Sciences and Sociology. A retired U.S. Army officer, he holds a BS degree from the U.S. Military Academy and an MA from Webster University in St. Louis. He has contributed to several transportation studies including a review of the cost-effectiveness of North Carolina s highway projects, county-level road condition trends in North Carolina, a review of South Carolina s traffic modeling systems, and Reason s recent nation-wide study of congestion. Related Reason Foundation Studies Robert W. Poole, Jr., Miami Toll Truckway: Preliminary Feasibility Study, Reason Foundation Policy Study No. 365, November 2007, Ted Balaker, Why Mobility Matters to Personal Life, Reason Foundation Policy Brief No. 62, July 2007, David T. Hartgen and Ravi K. Karanam, 16th Annual Report on the Performance of State Highway Systems ( ), Reason Foundation Policy Study No. 360, June 2007, Peter Samuel and Robert W. Poole, Jr., The Role of Tolls in Financing 21st Century Highways, Reason Foundation Policy Study No. 359, May 2007, Alain Bertaud and Robert W. Poole, Jr., Density in Atlanta: Implications for Traffic and Transit, Reason Foundation Policy Brief No. 61, April 2007, Robert W. Poole, Jr., Reducing Congestion in Atlanta: A Bold New Approach to Increasing Mobility, Reason Foundation Policy Study No. 351, November 2006, David T. Hartgen, Ph.D., P.E., and M. Gregory Fields, Building Roads to Reduce Traffic Congestion in America's Cities: How Much and at What Cost?, Reason Foundation Policy Study No. 346, August 2006,
42 GRIDLOCK AND GROWTH STUDY 35 Appendix: Technical Discussions and Methodology We reviewed the extensive literature available on accessibility measures. We also considered the urban productivity literature where it is relevant to spatial structure and network. Most recently, Prud homme and Lee 16 developed equations relating the productivity (output per worker) of 22 French and three Korean regions to accessibility, defined as the number of jobs or residents within a maximum reasonable commuting time from the CBD. Their tantalizing work found modest elasticity (about 0.10) between accessibility and productivity, but did not investigate the causality direction or account for other explanations. Cervero 17 extended the work to sub-regional analysis, but no cross-region comparable study has been conducted focusing on U.S. regions, which are more auto-dependent and larger geographically. High-level studies are often accompanied with caveats and this one is no exception. The number of regions reviewed here is small, necessitated by the effort required to conduct accessibility analysis. A larger sample or a different set of cities might yield different results. Particularly, smaller regions are not represented. In smaller cities, accessibility effects of congestion removal are likely to be less substantial, since they are generally less congested, but it might also be more easily accomplished. Further, the locations chosen for accessibility within regions may not be representative of non-cbd locations. The accessibility data itself may be suspect, based solely on local inventories, traffic assessments of unknown accuracy, and plans for growth but this is the same information all other transportation analysis and planning is based on. Transit is not in the mix; that might weaken access in most regions and improve access in larger ones. And the data is cross-sectional; more insight might be gained by tracking changes in accessibility against changes in performance over time. Many factors influence regional productivity not just access. Among the commonly noted are educational quality, crime rates, tax rates, job mix, recreational and amenity availability, utility rates, income transfer payments and private capital investment. None of these factors are included here, and if included they might overshadow the impacts of access. Also, congestion relief is a complex, long-term and expensive undertaking, for example we have not accounted for so-called induced travel whereby decreased congestion fosters an unforeseen increase in per capita travel which might eat into the apparent gains from major capacity additions. These and other considerations indicate that our analysis is not perfect, but our primary findings are that access improvements via congestion relief can have significant regional economic impacts.
43 36 Reason Foundation We derived our findings by following this methodology: 1. Select the cities to be studied and the study points within those cities. We chose the eight regions based on favorable interaction with the various MPOs during a previous study. The regions provided the data we needed and worked with us to resolve any problem areas. (Since these regions are larger than most, they adequately cover the upper range of U.S. cities but not the lower range.) We selected categories of study points that represent situations common to all regions; we then selected the specific study points within each category based on relative size and dispersion within the network coverage area. The following table summarizes the points selected in each region. Table A.1: Selected Study Points Region Category Downtown Airport University Major Mall Major Suburb Atlanta Five points Atlanta-Hartsfield Emory Univ. Cumberland Panthersville Charlotte Trade and Tryon Charlotte-Douglas UNC-Charlotte Concord Mills Ft. Mill Int l Dallas Dallas Convention Center Dallas-Ft. Worth Univ. of Texas-Dallas North East Duncanville Denver Coors Field Denver Int l Univ. of Denver Aurora Lakewood Detroit Comercia Park Detroit Metro Univ. of Michigan-Dearborn Twelve Oaks Pontiac Salt Lake City Delta Center Salt Lake City Int l Brigham Young Univ. Fashion Place American Fork San Francisco SBC park San Francisco Int l Stanford Univ. Southland Berkeley Seattle Band of America Tower Seattle-Tacoma Univ. of Washington-Seattle Factoria Square Redmond 2. Conduct a drive time contour analysis for each point in each city. a. Collect demographic and network data from each of the study cities. We contacted the eight MPOs to obtain both demographic and network data for a base year and a future year. We requested that the network data have variables that reflected free-flow (posted) speed or travel time and congested (peak hour) speed or travel time. In every case but Detroit, the MPO provided us the networks on which to base our analysis. Detroit provided us a skim matrix which shows the total travel times between zones rather than a network with the route paths. We converted networks and demographic data to TransCAD layers, so that we had a consistent format across regions. Collected data is reflected in the table below.
44 GRIDLOCK AND GROWTH STUDY 37 Table A.2: Technical Data for Regional Networks City Years Base - Fut Transportation Network Coordinate System Free Flow Speed/Time Congested Speed/Time Atlanta NAD83 SPEED CGSTDSPD Yes 1002:GA, West Feet Charlotte NAD83 SPfreeAB SPpeakAB Yes 3200:NC Feet Dallas TransCAD PKFRTIME_A PKTIME_AB Yes B Denver TransCAD FF SPEED CONG SPD Yes Detroit Skims Salt Lake City San Francisco 2030 Skims NAD :MI, South Feet UTM - UTM 12 GRS 1980 Meters UTM - UTM 10 GRS 1980 Meters Seattle NAD :WA, North Feet Free Flow DE05AM DK30AM TAZ Layer Yes SFF_TIME AM_TIME Yes FFT CTIM_2_4 Yes AB FF TT AB Cong TT-0 Yes b. Develop drive time contours for selected points in each of the regions. We used the TransCAD band procedure to develop drive time contours around each study point, for both free-flow and congested conditions, for both the base and the future year networks (a total of 20 analyses for each region). We used the travel time variables directly (if they were provided) or calculated the travel times in each category (free-flow or congested) from the speed and length variables. (For Detroit, we used the skim matrix to develop these contours, which were not quite as precise as the ones we developed from the networks, but nevertheless were satisfactory.) c. Calculate the number of people and the number of jobs in each band. Using the overlay function in TransCAD and the TAZ (traffic analysis zones) demographic layers provided by the MPOs, we calculated the population and the employment by location in each of the travel time contours. We then rolled these band totals up to cumulative totals from the origin, and determined trends in population and employment reach in the various categories. 3. Determine the productivity by worker for each region. For each region, we used national statistics to estimate regional productivity (gross regional product/worker) corresponding to the base year of the demographic data, ranging from 1999 to 2005.
45 38 Reason Foundation a. Obtain the total employment and annual payroll for each of the eight regions and their respective states for their appropriate base years. (Per Table 1 in the main report, there were four base years: 1999, 2000, 2001, and 2005.) We extracted both employment and payroll data for all geographies from the County Business Patterns, U.S. Census Bureau, available at: b. Obtain the Gross State Product for each of the study states in their respective base years and the United States as a whole in each of the four base years. Here, we used data from the Bureau of Economic Analysis, U.S. Department of Commerce, available at: c. Calculate the Gross Regional Product (the region s share of the Gross State Product (GSP)). Based on the idea that the ratio of the total MSA payroll to the total state payroll is a good proxy for the ratio of the gross city product to the GSP, we used these ratios for each of the appropriate base years to calculate the gross regional products. d. Calculate the productivity per worker. We then divided this gross regional product by the total MSA employment, from the County Business Patterns to calculate productivity by worker. 4. Estimate productivity models. We used straightforward log-linear regression models to estimate models relating regional productivity (GRP per worker) to accessibility measures for each of the five different types of regional points. Ln(GRP/w) = ln a + bln (X tt ) where the X tt is the size of the population or the jobs within tt minutes of the point. Regional productivity, literally the product divided by the number of workers or per capita, is related to these and other factors such as accessibility, tax rates, crime, education, and other features, and are typically expressed in log-linear form. 18 The coefficients of the log-linear model (b, c, etc.) are particularly useful because they represent the elasticity of productivity with respect to the factors of production. This means that a 100 percent change in X will, for instance, yield a b percent change in productivity. This very useful result can be embedded in a forecasting tool which can be used to estimate the change in productivity caused by a given percent change in X/w 19. Using this model the impact on regional productivity from changes in X such as a reduction of congestion can be estimated. Ideally, with enough data points (greater than 30, say), the effects of several factors can be determined. However, with only eight points, as is the case here, only one or at most two factors can be studied. To determine the relationship between productivity and accessibility, we regressed productivity against accessibility (number of residents or jobs within X minutes of the point), and included a time variable to pick up any residual differences performance in the base years of the data. Consolidating our findings for locations and accessibility criteria, the following table (Table A.3) summarizes the models for 25-minute drive time contours, in order of model strength:
46 GRIDLOCK AND GROWTH STUDY 39 Table A.3: Summary of Best 25-Minute Productivity Models Criterion Location Time Band Intercept (a) t-value Accessibility Elasticity (b) t-value time var (c ) t-value RSQ n Jobs University Jobs Suburb Pop University Pop Suburb Jobs CBD Pop Mall Pop CBD Jobs Mall Jobs Airport Pop Airport These results are quiet comparable to those reported by Prud homme and Lee for France; there, for a similar travel time band, the elasticity productivity to 30-minute job access to the CBD was 0.15 with an RSQ of 0.46, compared with our estimate of 0.11 with an RSQ of For 30-minute population access, Prud homme and Lee found an elasticity of 0.13 with an RSQ of 0.43, compared to our estimate of 0.10 and an RSQ of So, our models are slightly weaker, and less sensitive, than those found for France. The differences may be due to different densities (French regions are typically more compact than U.S. and are less auto-oriented), and differences in industry mix. The models with wider time bands (55-60 minutes) were stronger overall and more sensitive to accessibility. To ensure that these findings are not just surrogates for region size (population, employment) we tested several models, regressing productivity against total regional population and employment, using 55+ minutes as the accessibility band. Results show somewhat stronger RSQs and higher elasticity, suggesting that aggregate simple measures of size, such as total regional population and total regional employment are themselves a stronger indicator of productivity than are interim accessibility bands. However, the use of total regional employment and population would not lead to useful policy results regarding congestion relief or in directional differences in accessibility that our measures contain. So, although our method is more time-consuming that the simpler approach, it is also richer in policy implications. 5. Summarize findings. For each group of points and each region, we summarized findings and prepared summary tables and maps. a. Detailed Findings for Central Business Districts Figure A.1 below shows the 25-minute drive time contours for CBDs in these eight regions, with and without congestion. The following charts and tables show the cumulative data for population and employment, by 5-minute intervals, for Atlanta CBD.
47 40 Reason Foundation Figure A.1: 25-Min Drive Time Contours for Downtown Areas.
48 GRIDLOCK AND GROWTH STUDY 41 Figure A.2: Cumulative Residents and Jobs from Atlanta CBD Atlanta-Downtown-Five Points Population Reach (2005 and 2030) Free Flow vs Congested Population Travel Time 2030 Free Flow 2030 Congested 2005 Free Flow 2005 Congested Atlanta-Downtown-Five Points Population Reach 2005 and 2030 (Free Flow vs Congested) Employment Travel Time 2030 Free Flow 2030 Congested 2005 Free Flow 2005 Congested Table A.4: Access of Atlanta CBD Downtown- Five Points, Within 25 Minutes # Pop %Pop #Emp %Emp 2005 Cong FF Cong FF Ch Pop Ch %Pop Ch Emp Ch %Emp 2005 vs Cong vs FF Cong vs 2005 FF Cong vs 2030 FF Cong vs 2030 FF Looking at the productivity relationships, the following table shows the correlations and elasticities between productivity per worker and regional accessibility, defined as the number of jobs (or population) within X minutes of the CBD, under current congested conditions. The table compares models from France and Korea, developed by Prud homme and Lee, with models from the U.S. Although the sample sizes for the models are very small, the RSQs are reasonably strong, and the elasticities for productivity reasonably consistent. Generally, model strength and elasticity increase as the drive time contour increases, indicating greater correlation between regional productivity and overall regional size. Also, jobs-based access seems to be more strongly correlated with productivity than population-based access. But the U.S.- based models have lower elasticities than the French or Korean models, reflecting the greater
49 42 Reason Foundation spread and auto dependence of U.S. cities, which translates into lower percentages of jobs and population within 25 minutes of the CBD. Table A.5: Productivity Models of CBD Accessibility Location Time Band Intercept (a) t-value Access to Jobs vs. Productivity Productivity Elasticity (b) t-value time var (c ) t-value R sq n US France ? France ? US US US Korea Access to Population vs. Productivity US France ? France ? US US US The models of access to jobs suggest that an elasticity of about 0.11 is an appropriate estimate for the relationship between productivity and access jobs within a 25-minute drive-time of the CBD. For models relating productivity to access to population, slightly lower elasticities, on the order of 0.096, are appropriate. Comparing results with those of Prud homme and Lee, our jobs models are weaker and have lower elasticities than the similar models from France (25 and 35 minutes), and the similar model from Korea (60 minutes). Our population model is also weaker and has lower elasticities than the similar models from France (25 and 30 minutes). This might be caused by the lower density and greater sprawl of U.S. regions, and a corresponding lower influence of access on economic performance. The very small number of cases for Korea (three) should of course be discounted, but in spite of the larger number of cases from France (22), our results for the 30-minute bands are very similar to the French findings. We take this as intriguing, but not definitive evidence that the same general forces may be at work in both nations. b. Detailed Findings for Universities Figure A.3 below shows the 25-minute drive time contours for universities in these eight regions, with and without congestion. The following charts and tables below show the cumulative data for population and employment, by 5-minute intervals, for UNC Charlotte.

50 Figure A.3: 25-Min Drive Time Contours for Universities GRIDLOCK AND GROWTH STUDY 43
51 44 Reason Foundation Population Figure A.4: Cumulative Residents and Jobs from UNC Charlotte Charlotte - UNC Charlotte Population Reach a nd 2030 Free Flow vs Congested Travel Time Free Flow 2030 Congested 2000 Free Flow 2000 Congested Employment Charlotte - UNC Charlotte Employment Reach and 2030 Free Flow vs Congested Free Flow 2030 Congested 2000 Free Flow 2000 Congested Travel Time Table A.6: Access of UNC Charlotte UNC Charlotte, Within 25 Minutes #Pop %Pop #Emp %Emp 2000 Cong FF Cong FF Ch #Pop Ch %Pop Ch # Emp Ch %Emp 2000 vs cong vs FF cong vs 2000FF cong vs 2030 FF cong vs 2030 FF Looking again at regional productivity models, the following table summarizes the results of loglinear models relating productivity per worker to university accessibility. We have no data for other nations, since the Prud homme and Lee study covered only downtowns.
52 GRIDLOCK AND GROWTH STUDY 45 Table A.7: Productivity Models of University Access Access to Jobs vs. Productivity Time Location Band Intercept (a) t-value Elasticity (b) t-value time var (c ) t-value R sq n US US US US Access to Population vs. Productivity US US US US Access to universities has a generally greater correlation with productivity than access to downtowns, and a higher elasticity. As the drive time contour increases from 25 to 55+ minutes, the correlation increases, reflecting (perhaps) the increasing importance of regional campuses to regional productivity. And there is limited evidence that access to jobs is more important than access to population: RSQs are a bit higher and elasticities are also higher. This suggests that access to major universities, particularly from job sites, may have more influence on regional productivity than access to downtowns. Regarding the size of the elasticity, a value of about 0.18 seems appropriate for 25-minute drive time contours. Of course these observations require some interpretation and caution. The sites chosen for our university access are for major campuses within each region, not necessarily the locations of those campuses most closely aligned with the regional economy. The results are therefore highly dependent on the specific locations chosen. And access to community colleges or other important sites of job-related learning are not included. Many schools now provide substantial services over the Web or have other campus sites within a region. This reduces the need to travel to the main campus. And some of our sites are accessible by higher-speed transit services. Of course, the cost of improving road access to university sites might be more or less than the cost of improving access to downtown. The effect of these factors on our findings is unknown, but at the least the findings here generate many possibilities. c. Detailed findings for major malls Figure A.5 below shows the 25-minute drive time contours for major malls in these eight regions, with and without congestion. The following charts and tables show the cumulative data for population and employment, by 5-minute intervals, for Factoria Square Mall.
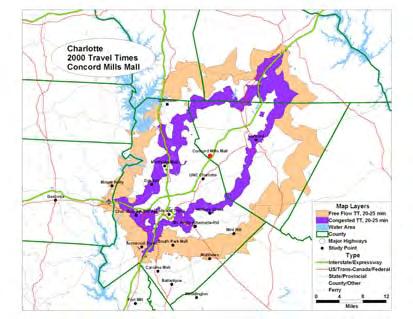


53 46 Reason Foundation Figure A.5: 25-Min Drive Time Contours for Major Malls
54 GRIDLOCK AND GROWTH STUDY 47 Population Employment Figure A.6: Cumulative Residents and Jobs from Factoria Square Mall, Seattle Seattle - Factoria Square Mall Population Reach 2030 Free Flow 2030 Congested 2000 Free Flow 2000 Congested a nd 2030 Free Flow vs Congested Travel Time Seattle - Factoria Square Mall Employment Reach 2030 Free Flow 2030 Congested 2000 and 2030 Free Flow vs Congested Free Flow Congested Travel Time Table A.8: Access of Factoria Square Mall, Seattle Factoria Square Mall, Within 25 Minutes #Pop %Pop #Emp %Emp 2000 Cong FF Cong FF Ch #Pop Ch %Pop Ch #Emp Ch %Emp 2000 vs cong vs FF cong vs 2000FF cong vs 2030 FF cong vs 2030 FF Comparing productivity models, the following table shows results. Generally, the models relating regional productivity to mall access fall between the CBD models and the university models described earlier. The correlations (RSQs) and elasticities for these models are slightly higher than CBD models and slightly lower than university models. Generally, model strength and elasticity increases as the drive time contour increases, perhaps indicating the regional nature of the larger contour. And the population models are slightly, but not uniformly, stronger than the job models, indicating greater importance of rooftops than jobs in retail.


55 48 Reason Foundation These models appear to be slightly stronger (higher correlation) and have slightly steeper elasticities than the CBD models. RSQs are slightly higher and elasticities are slightly higher also. The jobs-based accessibility is also slightly stronger, and elasticities slightly higher than the population based accessibility models. On balance, they suggest that access to major malls, particularly from job sites, may be at least as, and probably slightly more influential, in determining regional productivity than access to the CBD. Table A.9: Productivity Models of Major Mall Access Access to Jobs vs. Productivity Location Time Band Intercept (a) t-value Elasticity (b) t-value time var (c ) t-value R sq n US US US US Access to Population vs. Productivity US US US US d. Detailed findings for major suburbs Figure A.7 below shows the 25-minute drive time contours for major suburbs in these eight regions, with and without congestion. The following charts and tables show the cumulative data for population and employment, by 5-minute intervals, for Lakewood, CO. Figure A.7: 25-Min Drive Time Contours for Major Suburbs

56 GRIDLOCK AND GROWTH STUDY 49 Population Figure A.8: Cumulative Resident and Job Access from Lakewood, CO Denver - Lakewood Population Reach a nd 2030 Free Flow vs Congested Travel Time Denver - Lakewood Employment Reach 2005 and 2030 Free Flow vs Congested 2030 Free Flow 2030 Congested 2005 Free Flow 2005 Congested Employment Travel Time Free Flow 2030 Congested 2005 Free Flow 2005 Congested
57 50 Reason Foundation Table A.10: Access of Lakewood, CO Lakewood, Within 25 Minutes #Pop %Pop #Emp %Emp 2005 Cong FF Cong FF Ch #Pop Ch %Pop Ch #Emp Ch %Emp 2005 vs cong vs FF cong vs 2005FF cong vs 2030 FF cong vs 2030 FF Productivity models relating regional performance to accessibility of major suburbs are summarized in Table A.12. The models are modest in strength. For the jobs-access models, RSQs are actually stronger for the 25-minute time band than for larger time bands, and elasticities are in the range, lower than for universities but higher than for CBDs and malls. For population-access models, RSQs and elasticities are significantly lower, and increase with increasing time band. However the models seem to confirm notions that access from major suburbs to jobs, not population, is at least a relatively important factor in regional productivity. Table A.11: Productivity Models of Suburban Accessibility Access to Jobs vs. Productivity Location Time Band Intercept (a) t-value Elasticity (b) t-value time var (c ) t-value R sq n US US US US Access to Population vs. Productivity US US US US d. Detailed findings for airports Figure A.9 below shows the 25-minute drive time contours for airports in these eight regions, with and without congestion. The following charts and tables show the cumulative data for population and employment, by 5-minute intervals, for Detroit Metro.


58 Figure A.9: 25-Min Drive Time Contours for Airports GRIDLOCK AND GROWTH STUDY 51
Congestion Evaluation Best Practices
 Congestion Evaluation Best Practices Todd Litman Victoria Transport Policy Institute Presented International Transportation and Economic Development Conference 10 April 2014 Congestion Indicators Indicator
Mobility and Congestion
 Technical Memorandum Mobility and Congestion Prepared for: Prepared by: September 25, 2013 1 Table of Contents 1. Introduction... 1 2. Congestion Forecasting Process... 1 2.1 Mobility and Congestion Terms...
Are Highways Crumbling? State Performance Summaries,
 Policy Summary 407 February 2013 Are Highways Crumbling? State Performance Summaries, 1989 2008 by David T. Hartgen, Ph.D., P.E., M. Gregory Fields and Elizabeth San José Project Director: Adrian T. Moore,
Economics of Highway Spending and Traffic Congestion. Todd Litman Victoria Transport Policy Institute Presented Strong Towns Webinar 3 February 2016
 Economics of Highway Spending and Traffic Congestion Todd Litman Victoria Transport Policy Institute Presented Strong Towns Webinar 3 February 2016 Motor Vehicle Travel is Peaking Annual Vehicle Mileage
Briefing Paper #1. An Overview of Regional Demand and Mode Share
 2011 Metro Vancouver Regional Trip Diary Survey Briefing Paper #1 An Overview of Regional Demand and Mode Share Introduction The 2011 Metro Vancouver Regional Trip Diary Survey is the latest survey conducted
Ranking Walkable Urbanism in America s Largest Metros
 Ranking Walkable Urbanism in America s Largest Metros The Largest 30 Metros in the United States SHARE OF U.S. POPULATION SHARE OF U.S. GDP 54% 46% 42% 58% LARGEST 30 METROS REST OF U.S. The Old Dichotomy
Improving Mobility Without Building More Lanes
 Improving Mobility Without Building More Lanes By Mike Salisbury and Will Toor July 2017 Copyright 2017 by Southwest Energy Efficiency Project. All rights reserved. Photo: Courtesy of the Denver Post Anyone
Hunter and Angler Expenditures, Characteristics, and Economic Effects, North Dakota,
 Agribusiness and Applied Economics Report No. 507-S January 2003 Hunter and Angler Expenditures, Characteristics, and Economic Effects, North Dakota, 2001-2002 Dean A. Bangsund and F. Larry Leistritz*
2015 Urban Mobility Scorecard. Scott Weber, Transportation Planner & Analyst James Winters, Regional Planner & Policy Analyst
 2015 Urban Mobility Scorecard Scott Weber, Transportation Planner & Analyst James Winters, Regional Planner & Policy Analyst Introduction 1. Congestion Trends 2. Compounding Problems 3. Possible Solutions
THESE DAYS IT S HARD TO MISS the story that Americans spend
 WHICH COMES FIRST: THE NEIGHBORHOOD OR THE WALKING? BY SUSAN HANDY AND PATRICIA MOKHTARIAN THESE DAYS IT S HARD TO MISS the story that Americans spend more time stuck in traffic than ever, that they re
BUILDING THE CASE FOR TRAVEL OPTIONS IN WASHING TON COUNTY. Image: Steve Morgan. Image: Steve Morgan
 BUILDING THE CASE FOR TRAVEL OPTIONS IN WASHING TON COUNTY Image: Steve Morgan Image: Steve Morgan Image: TriMet Image: TriMet WHAT ARE TRAVEL OPTIONS PROGRAMS? Travel options programs encourage residents,
2045 Long Range Transportation Plan. Summary of Draft
 2045 Long Range Transportation Plan Summary of Draft Fredericksburg Area Metropolitan Planning Organization The George Washington Region includes the City of Fredericksburg and the counties of Caroline,
At-Grade Intersections versus Grade-Separated Interchanges (An Economic Analysis of Several Bypasses)
") Transportation Kentucky Transportation Center Research Report University of Kentucky Year 1975 At-Grade Intersections versus Grade-Separated Interchanges (An Economic Analysis of Several Bypasses) Kenneth
Transportation Kentucky Transportation Center Research Report University of Kentucky Year 1975 At-Grade Intersections versus Grade-Separated Interchanges (An Economic Analysis of Several Bypasses) Kenneth
Measuring Transportation: Traffic, Mobility and Accessibility
 Measuring Transportation: Traffic, Mobility and Accessibility THIS FEATURE COMPARES THREE APPROACHES TO MEASURING TRANSPORTATION SYSTEM PERFORMANCE. TRAFFIC-BASED MEASUREMENTS EVALUATE MOTOR VEHICLE MOVEMENT;
Purpose and Need. Chapter Introduction. 2.2 Project Purpose and Need Project Purpose Project Need
 Chapter 2 Purpose and Need 2.1 Introduction The El Camino Real Bus Rapid Transit (BRT) Project (Project) would make transit and other transportation improvements along a 17.6-mile segment of the El Camino
Preview. Second midterm Tables in your paper Mass Transit as alternative to auto California s problems in urban transportation
 Preview Second midterm Tables in your paper Mass Transit as alternative to auto California s problems in urban transportation Score Distribution 1 st Midterm 2 nd Midterm 3.5-4.0 8% 21% 3.0-3.5 23% 34%
Fixed Guideway Transit Outcomes on Rents, Jobs, and People and Housing
 Fixed Guideway Transit Outcomes on Rents, Jobs, and People and Housing Arthur C. Nelson, Ph.D., ASCE, FAICP Professor of Planning and Real Estate Development University of Arizona 1 Changing Transportation
Calgary Transit Route 302 Southeast BRT Year One Review June
 Calgary Transit Route 302 Southeast BRT Year One Review 2011 June Calgary Transit Route 302 Southeast BRT: Year One Review 2011 April Table of Contents 1.0 Executive Summary... 1 2.0 Introduction... 3
Report Overview Policy versus Performance: Directions for North Carolina s Largest Transit Systems
 For Truth. For Freedom. For the Future of North Carolina Report Overview Policy versus Performance: Directions for North Carolina s Largest Transit Systems By David T. Hartgen Professor of Transportation
Appendix C. Corridor Spacing Research
 Appendix C. Corridor Spacing Research Task 3 of the Twin Cities Bicycle Study called for the development of bicycle corridor spacing guidelines. This section summarizes research of the spacing of planned
Rochester Area Bike Sharing Program Study
 roc bike share Rochester Area Bike Sharing Program Study Executive Summary ~ January 2015 JANUARY 2015 8484 Georgia Avenue, Suite 800 Silver Spring, MD 20910 3495 Winton Pl., Bldg E, Suite 110 Rochester,
Walkable Retail: When Old Becomes New Again Part 1
 Walkable Retail: When Old Becomes New Again Part 1 By Erin Talkington, Vice President, and Jacob Ross, Associate You have probably read the following headline thousands of times, perhaps this year alone:
Appendix T 1: Additional Supporting Data
 Appendix T 1: Additional Supporting Data Project Delivery Delays with the implementation of the 2000 TIP became apparent early in the decade. In response to direction among policy officials, ARC began
Performance Measure Summary - Denver-Aurora CO. Performance Measures and Definition of Terms
 Performance Measure Summary - Denver-Aurora CO There are several inventory and performance measures listed in the pages of this Urban Area Report for the years from 1982 to 2014. There is no single performance
Webinar: The Association Between Light Rail Transit, Streetcars and Bus Rapid Transit on Jobs, People and Rents
 Portland State University PDXScholar TREC Webinar Series Transportation Research and Education Center (TREC) 11-15-2016 Webinar: The Association Between Light Rail Transit, Streetcars and Bus Rapid Transit
2. Context. Existing framework. The context. The challenge. Transport Strategy
 Transport Strategy Providing quality connections Contents 1. Introduction 2. Context 3. Long-term direction 4. Three-year priorities 5. Strategy tree Wellington City Council July 2006 1. Introduction Wellington
Memorandum. Fund Allocation Fund Programming Policy/Legislation Plan/Study Capital Project Oversight/Delivery Budget/Finance Contract/Agreement Other:
 Memorandum Date: November 20, 2017 To: Transportation Authority Board From: Eric Cordoba Deputy Director Capital Projects Subject: 12/5/17 Board Meeting: San Francisco Freeway Corridor Management Study
El Paso to Las Cruces Proposed Rail Service Estimated Ridership and Proposed Schedule
 to Las Cruces Proposed Rail Service Estimated Ridership and Proposed Schedule Ridership estimation is a central consideration when assessing the feasibility of a proposed transit line. A sketch model is
ADOT Statewide Bicycle and Pedestrian Program Summary of Phase IV Activities APPENDIX B PEDESTRIAN DEMAND INDEX
 ADOT Statewide Bicycle and Pedestrian Program Summary of Activities APPENDIX B PEDESTRIAN DEMAND INDEX May 24, 2009 Pedestrian Demand Index for State Highway Facilities Revised: May 29, 2007 Introduction
Indiana Electricity Projections: The 2018 Forecast Update
 Indiana Electricity Projections: The 2018 Forecast Update State Utility Forecasting Group The Energy Center at Discovery Park Purdue University West Lafayette, Indiana October 2018 Summary This report
Preview. Tables in your paper Mass Transit as alternative to auto California s problems in urban transportation
 Preview Tables in your paper Mass Transit as alternative to auto California s problems in urban transportation Integrating tables in your writing Commuting in Urban Areas Last time auto and congestion
Appendix 1 Transit Network Analysis
 Appendix 1 Transit Network Analysis APPENDIX 1 TRANSIT NETWORK ANALYSIS The purpose of this appendix is to provide an update on the transit network analysis as it pertains to: i. SmartTrack ii. Scarborough
Life Transitions and Travel Behaviour Study. Job changes and home moves disrupt established commuting patterns
 Life Transitions and Travel Behaviour Study Evidence Summary 2 Drivers of change to commuting mode Job changes and home moves disrupt established commuting patterns This leaflet summarises new analysis
Highway 49, Highway 351 and Highway 91 Improvements Feasibility Study Craighead County
 Highway 49, Highway 351 and Highway 91 Improvements Feasibility Study Craighead County Executive Summary March 2015 Highway 49, Highway 351 and Highway 91 Improvements Feasibility Study Craighead County
Guidelines for Providing Access to Public Transportation Stations APPENDIX C TRANSIT STATION ACCESS PLANNING TOOL INSTRUCTIONS
 APPENDIX C TRANSIT STATION ACCESS PLANNING TOOL INSTRUCTIONS Transit Station Access Planning Tool Instructions Page C-1 Revised Final Report September 2011 TRANSIT STATION ACCESS PLANNING TOOL INSTRUCTIONS
Regional Transportation Needs Within Southeastern Wisconsin
 Regional Transportation Needs Within Southeastern Wisconsin #118274 May 24, 2006 1 Introduction The Southeastern Wisconsin Regional Planning Commission (SEWRPC) is the official areawide planning agency
Cities Connect. Cities Connect! How Urbanity Supports Social Inclusion
 Cities Connect! How Urbanity Supports Social Inclusion Todd Litman Victoria Transport Policy Institute Metropolis Toronto, Canada - 14 June 2006 Cities Connect People with people. People with jobs. People
METRO Light Rail: Changing Transit Markets in the Phoenix Metropolitan Area
 METRO Light Rail: Changing Transit Markets in the Phoenix Metropolitan Area Abhishek Dayal, AICP Planner III, METRO Light Rail Phoenix, AZ BACKGROUND Transit in the Phoenix Region Transit services in the
Tulsa Metropolitan Area LONG RANGE TRANSPORTATION PLAN
 Tulsa Metropolitan Area LONG RANGE TRANSPORTATION PLAN Indian Nations Council of Governments August 2005 CONTACTING INCOG In developing the Destination 2030 Long Range Transportation Plan, INCOG s Transportation
MEETING Agenda. Introductions. Project Overview. Key Study Components. Alternative Station Concepts. Preferred Station Concept. Next Steps.
 City GARLAND Council ROADVISION Briefing STUDY VISION STUDY Dallas, TX April 8, 2010 1 1 MEETING Agenda Introductions Project Overview Key Study Components Alternative Station Concepts Preferred Station
Dr. Richard Wobbekind Executive Director, Business Research Division and Senior Associate Dean for Academic Programs University of Colorado Boulder
 Dr. Richard Wobbekind Executive Director, Business Research Division and Senior Associate Dean for Academic Programs University of Colorado Boulder Member FDIC VectraBank.com Economic Outlook 2015 Richard
Arnold Hinojosa
 Policy Analysis of the Mass Transit Challenges Facing Rapidly Growing Southern and Western Cities and How These Challenges Can Be Addressed Using the Model Set by Chicago Arnold Hinojosa ahinojosa@kentlaw.edu
100 Most Congested Roadways in Texas
 100 Most Congested Roadways in Texas 2018 Report EXECUTIVE SUMMARY In response to increased roadway congestion throughout the state, in 2009 the Texas Legislature mandated that the Texas Department of
PERFORMANCE ANALYSIS of The Draft 2015 CLRP
 Item 9 PERFORMANCE ANALYSIS of The Draft CLRP Presentation to the Transportation Planning Board September 16, CLRP Performance Analysis 1 What is the Long-Range Transportation Plan (CLRP)? The CLRP identifies
Smart Growth: Residents Social and Psychological Benefits, Costs and Design Barbara Brown
 Smart Growth: Residents Social and Psychological Benefits, Costs and Design Barbara Brown By Scott Siedor 11 At the invitation of the Goodwin-Niering Center for the Environment, Barbara Brown came to Connecticut
Performance Measure Summary - San Jose CA. Performance Measures and Definition of Terms
 Performance Measure Summary - San Jose CA There are several inventory and performance measures listed in the pages of this Urban Area Report for the years from 1982 to 2014. There is no single performance
. ' motion. APPLtlDK.L - L"iLC_t1GLR 201b APPENDIX 7 TECHNICAL MEMOS
 . ' motion APPLtlDK.L - L"iLC_t1GLR 201b APPENDIX 7 TECHNICAL MEMOS The nmotion program will provide a large number of benefits for Middle Tennessee. This document presents selected benefits and other
Coolest Cities Results Summary
 Coolest Cities Results Summary About Coolest Cities Canada s six largest urban areas provide homes and jobs for almost 15 million people, nearly half of our population. Transporting these citizens to and
THE MOST INFORMATIVE EVENT COVERING REAL ESTATE INVESTMENTS
 THE MOST INFORMATIVE EVENT COVERING REAL ESTATE INVESTMENTS 2014 U.S. Economic, Capital Markets, and Retail Market Overview and Outlook Retail Trends 2014 U.S. Economic Overview and Outlook Total Employment
TRANSPORTATION TOMORROW SURVEY
 Clause No. 15 in Report No. 7 of was adopted, without amendment, by the Council of The Regional Municipality of York at its meeting held on April 17, 2014. 15 2011 TRANSPORTATION TOMORROW SURVEY recommends
CONGESTED LOS ANGELES
 CONGESTED LOS ANGELES Prepared For: Mayor Antonio Villaraigosa and City Council City of Los Angeles Prepared By: Jacki Murdock Transportation Analyst LADOT December 11 th, 2011 Outline What causes congestion?
PRELIMINARY DRAFT FIRST AMENDMENT TO VISION 2050: A REGIONAL LAND USE AND TRANSPORTATION PLAN FOR SOUTHEASTERN WISCONSIN
 PRELIMINARY DRAFT FIRST AMENDMENT TO VISION 2050: A REGIONAL LAND USE AND TRANSPORTATION PLAN FOR SOUTHEASTERN WISCONSIN ESTABLISHING TARGETS FOR FEDERAL PERFORMANCE MEASURES: HIGHWAY SAFETY SOUTHEASTERN
ENHANCED PARKWAY STUDY: PHASE 2 CONTINUOUS FLOW INTERSECTIONS. Final Report
 Preparedby: ENHANCED PARKWAY STUDY: PHASE 2 CONTINUOUS FLOW INTERSECTIONS Final Report Prepared for Maricopa County Department of Transportation Prepared by TABLE OF CONTENTS Page EXECUTIVE SUMMARY ES-1
North Carolina Transportation Issues
 North Carolina Transportation Issues David T. Hartgen, Ph.D., P.E. Emeritus Professor of Transportation Studies UNC Charlotte Remarks at the Shaftesbury Lecture John Locke Foundation Raleigh, North Carolina
The Application of Pedestrian Microscopic Simulation Technology in Researching the Influenced Realm around Urban Rail Transit Station
 Journal of Traffic and Transportation Engineering 4 (2016) 242-246 doi: 10.17265/2328-2142/2016.05.002 D DAVID PUBLISHING The Application of Pedestrian Microscopic Simulation Technology in Researching
THE NEXUS OF LIVABILITY, TRANSIT, AND PERFORMANCE MEASUREMENT
 THE NEXUS OF LIVABILITY, TRANSIT, AND PERFORMANCE MEASUREMENT CALACT SPRING CONFERENCE 2013 MAY 17, 2013 FRIDAY MORNING SESSION JONATHAN BROOKS ASSOCIATE TRANSPORTATION RESEARCHER TRANSIT MOBILITY PROGRAM
Sketch Level Assessment. of Traffic Issues. for the Fluor Daniel I-495 HOT Lane Proposal. Ronald F. Kirby
 Sketch Level Assessment of Traffic Issues for the Fluor Daniel I-495 HOT Lane Proposal Ronald F. Kirby Director of Transportation Planning National Capital Region Transportation Planning Board (TPB) Metropolitan
The Case for New Trends in Travel
 The Case for New Trends in Travel The Future of Cities and Travel Steven E. Polzin, PhD. Center for urban Transportation Research University of South Florida October 19, 2008 Successful Strategies from
100 Most Congested Roadways in Texas
 100 Most Congested Roadways in Texas 2017 EXECUTIVE SUMMARY In response to increased roadway congestion throughout the state, in 2009 the Texas Legislature mandated that the Texas Department of Transportation
TOWARDS A BIKE-FRIENDLY CANADA A National Cycling Strategy Overview
 TOWARDS A BIKE-FRIENDLY CANADA A National Cycling Strategy Overview NationalCyclingStrategFrameworkv3.indd 1 Potential for this modal shift can be found in municipalities of all sizes, in every population
ECTS Purpose & Needs. Exhibit Home-Based Work Trips Attracted to the Penn/Jeannette Area
 Exhibit 4.23 - Home-Based Work Trips Attracted to the Penn/Jeannette Area Exhibit 4.24 - Transit Use for Work Trips Attracted to the Penn/Jeannette Area Eastern Corridor Transit Study 61 Greensburg - and
Sustainable Transportation Planning in the Portland Region
 Sustainable Transportation Planning in the Portland Region Jennifer Dill, Ph.D. Associate Professor School of Urban Studies & Planning jdill@pdx.edu http://web.pdx.edu/~jdill/ Outline Elements of a sustainable
FACTS AND FIGURES: MAKING THE CASE FOR COMPLETE STREETS IN LEE COUNTY
 FACTS AND FIGURES: MAKING THE CASE FOR COMPLETE STREETS IN LEE COUNTY Safety: Close to 5,000 pedestrians and bicyclists die each year on U.S. roads, and more than 70,000 are injured. [Mean Streets, Surface
OVERVIEW OF METHODOLOGY
 I N T R O D U C T I O N The Orange County Transportation Authority () is the county transportation commission responsible for planning, funding and delivering transportation improvements in Orange County
Using GPS Data for Arterial Mobility Performance Measures
 Using GPS Data for Arterial Mobility Performance Measures Paul Czech, MnDOT Shawn Turner, TTI CTS Research Conference May 22, 2014 ~ St. Paul, MN Methodology & Results INRIX GPS Data + = Road Inventory
Transit Ridership - Why the Decline and How to Increase. Hosted by the. Virginia Transit Association
 Transit Ridership - Why the Decline and How to Increase Hosted by the Virginia Transit Association Virginia Transit Association 1108 East Main Street, Suite 1108 Richmond, VA 23219 804.643.1166 www.vatransit.com
A Review of Roundabout Speeds in north Texas February 28, 2014
 Denholm 1 A Review of Roundabout Speeds in north Texas February 28, 2014 Word Count: 6,118 words (2,618 + 11 figures x 250 + 3 tables x 250) John P. Denholm III Lee Engineering, LLC 3030 LBJ FRWY, Ste.
SMART 1 Public Meeting #1. February 24, 2016
 SMART 1 Public Meeting #1 February 24, 2016 Agenda Who is the SMTC? SMART 1 project overview Syracuse Metropolitan Transportation Council An Introduction: Who we are & what we do What is an MPO? A Metropolitan
Benefits for the Bronx, Brooklyn, Queens and Staten Island
 Congestion Pricing for New York: Benefits for the Bronx, Brooklyn, and Staten Island Prepared for the Coalition for Traffic Relief April 007 Schaller Consulting 94 Windsor Place, Brooklyn, NY (78) 768-3487
Exploring Factors Affecting Metrorail Ridership in Washington D.C.
 Exploring Factors Affecting Metrorail Ridership in Washington D.C. Chao Liu, Ph.D., Hiro Iseki, Ph.D. National Center for Smart Growth University of Maryland, College Park September 2015, GIS in Transit
Are Highways Crumbling? State and U.S. Highway Performance Trends,
 Policy Study 407 February 2013 Are Highways Crumbling? State and U.S. Highway Performance Trends, 1989 2008 by David T. Hartgen, Ph.D., P.E., M. Gregory Fields and Elizabeth San José Project Director:
TomTom South African Congestion Index
 TomTom South African Congestion Index Disclaimer All copyrights, commercial rights, design rights, trademarks and other elements considered intellectual property that are published in this report are reserved
AAMPO Regional Transportation Attitude Survey
 AAMPO Regional Transportation Attitude Survey Traditionally Underserved Populations helping organizations make better decisions since 1982 2018 Submitted to the AAMPO By: ETC Institute 725 W. Frontier
Capital and Strategic Planning Committee. Item III - B. April 12, WMATA s Transit-Oriented Development Objectives
 Capital and Strategic Planning Committee Item III - B April 12, 2018 WMATA s Transit-Oriented Development Objectives Page 24 of 76 Washington Metropolitan Area Transit Authority Board Action/Information
Interim Transit Ridership Forecast Results Technical Memorandum
 Interim Transit Ridership 401 South Jackson Street Seattle, WA 98104-2826 September 2012 Table of Contents 1 INTRODUCTION... 1-1 1.1 Project Background... 1-1 2 RIDERSHIP FORECASTS... 2-1 2.1 System Ridership
Golfers in Colorado: The Role of Golf in Recreational and Tourism Lifestyles and Expenditures
 Golfers in Colorado: The Role of Golf in Recreational and Tourism Lifestyles and Expenditures by Josh Wilson, Phil Watson, Dawn Thilmany and Steve Davies Graduate Research Assistants, Associate Professor
STAFF REPORT ACTION REQUIRED
 STAFF REPORT ACTION REQUIRED 2016 Ridership Update Date: March 23, 2016 To: From: TTC Board Chief Executive Officer Summary This report provides an update of TTC ridership results to the end of February
Performance Measure Summary - Chicago IL-IN. Performance Measures and Definition of Terms
 Performance Measure Summary - Chicago IL-IN There are several inventory and performance measures listed in the pages of this Urban Area Report for the years from 1982 to 2014. There is no single performance
OR DUNGENESS CRAB FISHERY:
 E 55 OR DUNGENESS CRAB FISHERY: an economic analysis of productivity and profitability David S. Liao Joe B. Stevens OREGON STATE UNIVERSITY SEA GRANT COLLEGE PROGRAM Publication no. ORESU-T-75-005 AGRICULTURAL
Discussion Paper 1 June 2014 Current State of Transportation in Burlington
 Discussion Paper 1 June 2014 Current State of Transportation in Burlington www.burlington.ca/goyourway Discussion Paper 1: Current State of Transportation in Burlington The City of Burlington is developing
Key objectives of the survey were to gain a better understanding of:
 3 COMMUNITY INPUT Community input is an essential part of corridor studies. For the SR 87 corridor study, VTA staff conducted an extensive online survey of people living and commuting along the corridor.
3 ROADWAYS 3.1 CMS ROADWAY NETWORK 3.2 TRAVEL-TIME-BASED PERFORMANCE MEASURES Roadway Travel Time Measures
 ROADWAYS Approximately 6 million trips are made in the Boston metropolitan region every day. The vast majority of these trips (80 to percent, depending on trip type) involve the use of the roadway network
South King County High-Capacity Transit Corridor Study
 HIGH-CAPACITY TRANSIT CORRIDOR STUDY South King County Corridor South King County High-Capacity Transit Corridor Study Corridor Report August 2014 South King County High Capacity Transit Corridor Report
Exceeding expectations: The growth of walking in Vancouver and creating a more walkable city in the future through EcoDensity
 Exceeding expectations: The growth of walking in Vancouver and creating a more walkable city in the future through EcoDensity Melina Scholefield, P. Eng. Manager, Sustainability Group, City of Vancouver
Title VI Fare Change Equity Analysis
 Title VI Fare Change Equity Analysis Evaluation Report Submitted to Dallas Area Rapid Transit Submitted by TranSystems June 2012 Title VI Fare Change Equity Analysis Introduction DART has proposed a schedule
RIDERSHIP PREDICTION
 RIDERSHIP PREDICTION Outline 1. Introduction: route ridership prediction needs and issues. 2. Alternative approaches to route ridership prediction. Professional judgement Survey-based methods Cross-sectional
the 54th Annual Conference of the Association of Collegiate School of Planning (ACSP) in Philadelphia, Pennsylvania November 2 nd, 2014
 in Philadelphia, Pennsylvania November 2 nd, 2014") the 54th Annual Conference of the Association of Collegiate School of Planning (ACSP) in Philadelphia, Pennsylvania November 2 nd, 2014 Hiroyuki Iseki, Ph.D. Assistant Professor Urban Studies and Planning
the 54th Annual Conference of the Association of Collegiate School of Planning (ACSP) in Philadelphia, Pennsylvania November 2 nd, 2014 Hiroyuki Iseki, Ph.D. Assistant Professor Urban Studies and Planning
Typical Rush Hour Commute. PennyforTransportation.com
 Typical Rush Hour Commute In the News Overview of the Plan Collaborative plan with projects in every community Prioritizing connectivity and congestion relief Dedicated transportation-specific funding;
GRAHAM PEDESTRIAN TRANSPORTATION PLAN
 GRAHAM PEDESTRIAN TRANSPORTATION PLAN Chapter 1 I 1.1 Scope and Purpose n March of 2005, the City of Graham contracted with Greenways Incorporated (GWI) to create a Pedestrian Transportation Plan. The
Highway 217 Corridor Study. Phase I Overview Report
 Highway 217 Corridor Study Phase I Overview Report November 3, 24 BACKGROUND AND OVERVIEW Study purpose The Highway 217 Corridor Study is developing multi-modal transportation solutions for traffic problems
The Walkability Indicator. The Walkability Indicator: A Case Study of the City of Boulder, CO. College of Architecture and Planning
 1 : A Case Study of the City of Boulder, CO College of Architecture and Planning University of Colorado Author Note: Daryoosh Ardalan, Urban Regional Planning, College of Architecture and Planning, University
Modal Shift in the Boulder Valley 1990 to 2009
 Modal Shift in the Boulder Valley 1990 to 2009 May 2010 Prepared for the City of Boulder by National Research Center, Inc. 3005 30th Street Boulder, CO 80301 (303) 444-7863 www.n-r-c.com Table of Contents
Land Use and Cycling. Søren Underlien Jensen, Project Manager, Danish Road Directorate Niels Juels Gade 13, 1020 Copenhagen K, Denmark
 Land Use and Cycling Søren Underlien Jensen, Project Manager, Danish Road Directorate Niels Juels Gade 13, 1020 Copenhagen K, Denmark suj@vd.dk Summary: Research about correlation between land use and
Chapter 2 Current and Future Conditions
 Chapter 2 Current and Future Conditions 2.1 An Overview of Ottawa s Transportation System The City of Ottawa is home to about 870,700 people. The city covers an area of 2,760 square kilometres of which
1999 On-Board Sacramento Regional Transit District Survey
 SACOG-00-009 1999 On-Board Sacramento Regional Transit District Survey June 2000 Sacramento Area Council of Governments 1999 On-Board Sacramento Regional Transit District Survey June 2000 Table of Contents
13,351. Overall Statewide Results. How was the survey taken? Do you own or lease a personal vehicle? What is your primary means of transportation?
 Overall Statewide Results 3 1 Houston 2 Dallas 3 Fort Worth 4 San Antonio 2 11 12 Austin 6 Laredo / Pharr 7 Corpus Christi / Yoakum 8 Bryan / Waco 9 Atlanta / Beaumont / Lufkin / Paris / Tyler Amarillo
CITY OF ALPHARETTA DOWNTOWN MASTER PLAN TRAFFIC EVALUATION
 CITY OF ALPHARETTA DOWNTOWN MASTER PLAN TRAFFIC EVALUATION June 2015 CITY OF ALPHARETTA DOWNTOWN MASTER PLAN TRAFFIC EVALUATION Introduction The Alpharetta Downtown Master Plan was developed in the fall
Highway 111 Corridor Study
 Highway 111 Corridor Study June, 2009 LINCOLN CO. HWY 111 CORRIDOR STUDY Draft Study Tea, South Dakota Prepared for City of Tea Sioux Falls Metropolitan Planning Organization Prepared by HDR Engineering,
2009 URBAN MOBILITY REPORT: Six Congestion Reduction Strategies and Their. Effects on Mobility
 2009 URBAN MOBILITY REPORT: Six Congestion Reduction Strategies and Their Effects on Mobility David Schrank Associate Research Scientist and Tim Lomax Research Engineer Texas Transportation Institute The
APPENDIX E BIKEWAY PRIORITIZATION METHODOLOGY
 APPENDIX E BIKEWAY PRIORITIZATION METHODOLOGY INTRODUCTION The network of bikeways recommended in the Bicycle Master Plan is extensive and is likely to be only partially completed during the 25-year life