INFLOW DESIGN FLOOD CONTROL PLAN
|
|
|
- Garry Webb
- 5 years ago
- Views:
Transcription
1 INFLOW DESIGN FLOOD CONTROL PLAN CFR Fly Ash Reservoir II Cardinal Plant Brilliant, Ohio September, 26 Prepared for: Cardinal Operating Company Cardinal Plant Brilliant, Ohio Prepared by: Geotechnical Engineering Services American Electric Power Service Corporation Riverside Plaza Columbus, OH 4325 GERS 6 6


2
3 Table of CONTENTS. OBJECTIVE DESCRIPTION OF THE CCR UNIT INFLOW DESIGN FLOOD (a)(3) FLOOD CONTROL PLAN (c)... iii
4 . OBJECTIVE This report was prepared by AEP Geotechnical Engineering Services (GES) section to fulfill requirements of CFR for the hydrologic and hydraulic evaluation of CCR surface impoundments. 2. DESCRIPTION OF THE CCR UNIT The Cardinal Power Plant in Wells Township, Jefferson County, near the town of Brilliant in eastern Ohio. It is owned by Buckeye Power and AEP Generation Resources (GENCO) and is operated by Cardinal Operating Company. The facility operates two surface impoundments for storing CCR; the Bottom Ash Complex and Cardinal Fly Ash Reservoir II (FAR II) Dam. This report deals with the hydrologic and hydraulic evaluation for the Fly Ash Pond FAR II. The FAR II Dam is a valley filled dam with a unique structure whose current configuration is the result of the original earth fill dam and two separate raisings. The original earth fill dam (Stage ) consisted of a 8 feet high arched earth embankment incorporating a zoned cross section. At 925 feet NGVD, the dam featured a 7 foot wide by,55 feet long crest. The maximum operating pool that could be achieved with the original configuration was El. 93. In 997, the original dam was raised, referred to as Stage 2. Following this raising, the dam was 237 feet high with a 3 foot wide crest. In 23, the dam was raised 3 feet using back to back MSE walls, bringing the dam into its current, Stage 3 configuration. The principal features of the typical section are the MSE wall themselves and a vinyl sheet pile wall extending from the existing clay core to the top of the PMF flood level for seepage cutoff purposes. The FAR II Dam received sluiced fly ash and waste water from the plant via the bottom ash pond. 3. INFLOW DESIGN FLOOD (a)(3) The facility is classified as a High Hazard Potential Dam. Maximum Flood (PMF). The Inflow Design Flood is the Probable 4. FLOOD CONTROL PLAN (C) All storm water runoff from the watershed drains into the reservoir created by the Fly Ash Pond Dam. The design spillway system has enough capacity to pass the probable maximum flood without overtopping the dam. The design is based on the normal pool being at maximum normal operating pool and utilizing only the emergency spillway to handle the PMF without overtopping the crest of the dam. The water discharged through the emergency spillway is directed away from the dam such that it causes no threat to the stability of the structure. The analysis in Attachment A includes excerpts of the 23 design report and the associated report Appendix C that provides the description of the spillway system, flood storage capacity, inflow peak discharge and volume, peak discharge from the facility and maximum pool elevation. The calculations show that the facility has the capacity to manage the inflow design flood. Page of
5 ATTACHMENT A
6 Attachment A Excerpts from 23 Design Report Hydrology and Hydraulics
7 Excerpts FAR II Dam Raising Design Report FAR II Dam Raising Design Report S&ME No /76--4A Cardinal Plant, Brilliant, OH January HYDROLOGIC AND HYDRAULIC ANALYSIS 4. Introduction The existing hydrologic conditions at the proposed dam site are described herein. Blockhouse Run, the major drainage feature in the project area, drains directly into the Ohio River. Approximately one mile upstream of the Ohio River, Blockhouse Run splits into two branches, designated as the East Branch and the West Branch. The East Branch drains the eastern watershed as delineated in the Watershed Map on Plate 2 of Appendix C. The active fly ash dam II inundates the East Branch. The West Branch has been dammed to form the old Fly Ash Reservoir I (FAR I). The location of the dam is shown on the drawings. Extension of the dam will inundate approximately 6 acres, or 24 percent of the area in the eastern watershed. Since the location of the dam is situated downstream of the discharge points of the old dam, runoff from the western watershed drains into the existing reservoir. Therefore, the spillway system of the proposed dam raising has been designed to meet ODNR Class I design criteria based on the runoff from both watersheds. The following sections present the hydrologic considerations and analyses performed during the design phase of this project. 4.2 Basin Characteristics Figure 3. shows the limits of the watershed boundary for the existing Fly Ash Reservoir II(FAR II). The total drainage area above the dam has been divided into two watersheds, East and West, for analysis of the storm runoff entering the reservoir, as shown on Plate 2 of Appendix C. A review of available topographic maps and aerial photos was made to determine essential basin characteristics for each watershed. Such characteristics include the drainage boundaries, areas, slopes, soil types, ground cover, land use and the time of concentration. The time of concentration is defined as the elapsed time for runoff to travel from the hydraulically most distant part of the watershed to some reference point downstream. The old fly ash dam is located in the western watershed. Present land use within the drainage area is limited to reclaimed strip mine areas, some woodlands, and the inactive FAR I. Reclamation of the reservoir area is actively in progress in the form of a residual waste landfill above the level of the ponded fly ash. A built-out landfill condition was also analyzed for the western watershed, using the 25 FAR I PTI. The PTI listed a Curve Number (CN) of 74, therefore the composite CN of the current FAR I condition of 75 was used. See Plates 4 through 6 of Appendix C.
8 FAR II Dam Raising Design Report Cardinal Plant, Brilliant, OHJanuary 23 S&ME No /76--4A Woodlands and scattered reclaimed strip mines constitute the existing land use in the East watershed. Construction of the proposed fly ash dam raising will inundate approximately 6 acres at Elevation 974. feet NGVD, the maximum operating pool elevation. Soil types in the areas have been identified by the Soil Conservation Service (SCS) of the U.S. Department of Agriculture and classified into hydrologic soil groups. Within the study area, all soils fall under the hydrologic soil group B. Table 4.2., below, lists the basin characteristics for the Western and Eastern watersheds. Table 4.2. Basin Characteristics BASIN WATERSHED CHARACTERISTICS WEST EAST Woods Landfill Woods Reservoir Drainage area (acres) Average land slope % 3 n/a 25 n/a Hydrologic soil group C C C n/a SCS curve number (CN) Composite CN 75 n/a Time of concentration (hours) TOTAL AREA (acres) Characteristics of Proposed Reservoir A previously referenced, Drawing No. 2 shows the location of the existing dam. Based on this layout, the reservoir will have the following surface areas and storage capacities - as shown below in Table Table 4.3. Surface Areas and Storage Capacities ELEVATION (Ft. NGVD) AREA (AC) STORAGE (AC-FT) Maximum Pool ,868 Emerg. Spillway ,2 Top of Dam ,5 The area-capacity-elevation curve developed for this dam is shown on Plate 3 of Appendix C. 2
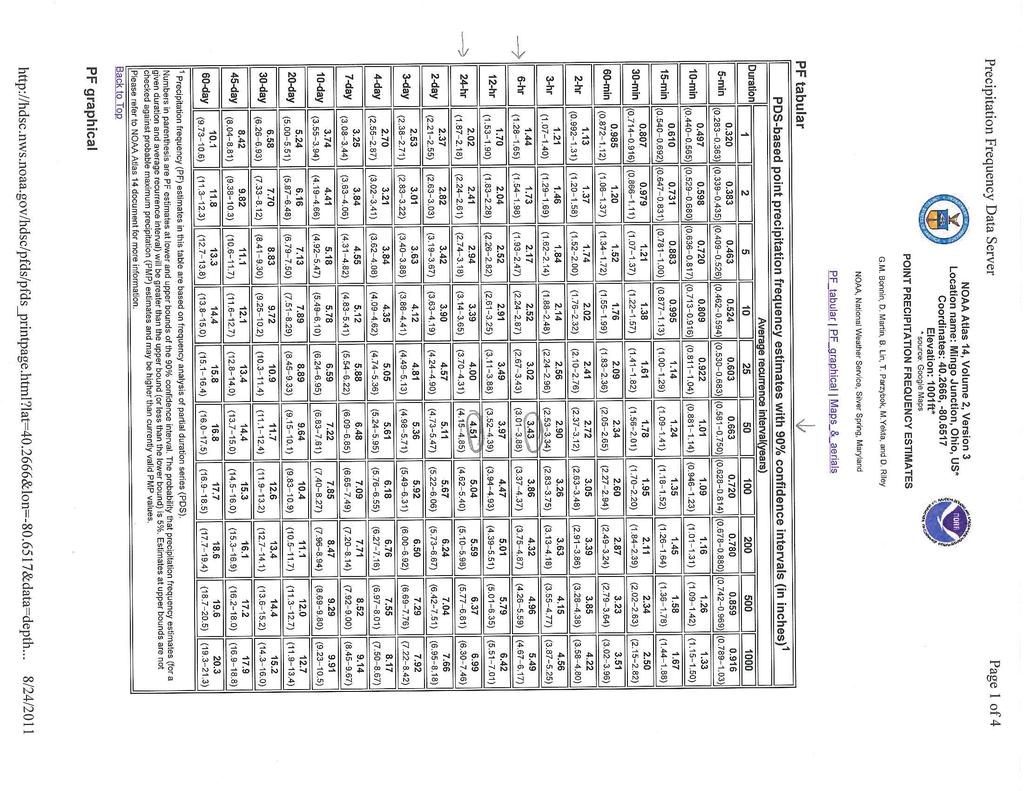
9 FAR II Dam Raising Design Report Cardinal Plant, Brilliant, OHJanuary 23 S&ME No /76--4A 4.4 Design and Assumptions Rainfall - runoff data was not available for the site because the streams flow intermittently. Therefore, runoff hydrographs were generated using the U.S. Army Corps of Engineers HEC- computer program. The SCS dimensionless unit hydrograph method was employed in the calculation of the hydrographs. For each watershed, separate runoff hydrographs were computed and then later combined to form a single inflow hydrograph for the proposed reservoir. Runoff from the West watershed was analyzed based on current landfill construction activity. The landfill area was assumed to be in a disturbed (unvegetated) condition. A composite curve number was used to represent the unvegetated landfill and surrounding wooded areas. This is shown on Plate 4 of Appendix C. In the East watershed, the reservoir surface is modeled as a subbasin to convert direct rainfall into a runoff hydrograph. The ash sluice water of 3.3 mgd (2.6 cfs) is represented as a base flow in the East watershed. Once computed, the runoff hydrographs from the three subbasin watersheds are combined and routed through the reservoir Service Spillway According to OAC 5:2-3-4, design of the principal (service) spillway for class I dams must be such that the average frequency use of the emergency spillway is predicted to be less than once in fifty years. The estimated precipitation for a 5-year storm was obtained from the NOAA Atlas 4. For a 6-hour storm, the precipitation is 3.43 inches, whereas the 24-hour storm amount is 4.5 inches, as shown on Plate 9 of Appendix C. Both 6-hour and 24-hour storm durations with average soil moisture conditions were checked. The 24-hour storm resulted in a higher maximum water surface, therefore this storm duration was used for developing the 5-year storm inflow hydrograph Emergency Spillway OAC 5:2-3-2 specifies that for class I dams, the spillway system shall safely pass the design flood equal to the probable maximum flood (PMF) without any overtopping of the dam. The PMF is the result of the probable maximum precipitation (PMP), defined as the greatest depth of precipitation for a given duration that is meteorologically possible for a given basin at a particular time of year. Generalized estimates of the PMP have been published by the 3
10 FAR II Dam Raising Design Report Cardinal Plant, Brilliant, OHJanuary 23 S&ME No /76--4A Hydrometerological branch of the National Weather Service, as shown on Plates and 2 of Appendix C. For the study area, a 6-hour PMP of 26.5 inches was used as the design rainfall event. The antecedent moisture conditions of the soil cover were assumed to be average. The layout of the control section and outlet channel for the emergency spillway is shown on the Emergency Spillway Plan. The emergency spillway control section will be a section of mass concrete at Elevation It will have a bottom length of 8 feet and side slopes consisting of access ramps at 2 to 5% grades. Downstream of the access ramps and control section, vertical concrete retaining walls wrap into the spillway and guide flow down the channel. The width of the control section along the flow direction will be 5 feet. The downstream channel of the spillway will be stepped. Steps will be formed of the mass concrete beginning at the downstream end of the control section and tying-in to the existing RCC steps. The calculations show that flow downstream of the control section becomes supercritical. The spillway channel transitions from an approximate 3.5H:2V slope along the proposed concrete steps to a 5H:2V slope along the existing RCC steps Analysis All reservoir flood routings were conducted using the HEC- computer program. The program routes floods through the reservoir by the modified Puls method. In general, reservoir storage data and either spillway dimensions or discharge-rating curves are supplied by the user Service Spillway Analysis of the service spillway system consisted of routing the 5-year storm to establish the invert of the emergency spillway. A design for the service spillway was determined and a stagedischarge curve was computed. A maximum operating level of elevation 974 was predetermined based on the projected life of the dam raising. Reservoir routings of the 5-year storm were performed using the maximum operating level of the reservoir. Inflow was calculated as weir flow over the 4-foot stop log. Above Elevation 976, flow will enter through the top of the vertical service spillway structure. This flow was analyzed as both weir and orifice flow. Rating calculations for the service spillway are included on Plates 3 through 9 of Appendix C. 4
11 FAR II Dam Raising Design Report Cardinal Plant, Brilliant, OHJanuary 23 S&ME No /76--4A Emergency Spillway Hydrologic reservoir routings were conducted to analyze the emergency spillway and its ability to pass the probable maximum flood without overtopping the dam. A flat rectangular control section was designed with a width of 5 feet and length of 8 feet. Discharge over the spillway was rated based on calculations of critical depth using the Corps of Engineers HEC-RAS computer program. Cross sections were taken at changes in geometry, slope or surface roughness. Manning's n roughness coefficients were input based on the expected channel surface conditions. Based on literature (see Plates 4 through 42 of Appendix C), a relatively high Manning s roughness coefficient of n=.7 was used to model the stepped spillway surface. As shown on the drawings, proposed reinforced concrete training walls extend from the crest of the dam to a point approximately 3 feet beyond the proposed stepped channel transitions into the existing steps. Downstream from the training walls section, the spillway width becomes feet, consistent with the current configuration. The calculated relationship between stage and discharge was then used in the routing process to determine the maximum discharge and pool elevation. This information was used as the emergency spillway rating and input into HEC-. Discharges from the emergency spillway are routed away from the dam through an existing outlet channel. 4.6 Results 4.6. Service Spillway-Hydraulic Capacity The proposed new principal spillway is a vertical concrete shaft structure with a 4-foot wide opening on one side. The spillway shaft will tie into the existing inclined spillway structure. The existing structure drains into a 54-inch diameter Prestressed Concrete Cylinder Pipe (P.C.C.P.), which then ties into a 42-inch steel pipe extending down the dam. The existing energy dissipator at the outlet of the steel pipe will be utilized. During most of the operating conditions, discharge through the service spillway will be controlled by weir flow over the stop logs in the opening of the shaft. The maximum operating level is set at elevation 974. feet. This corresponds to a maximum stop log elevation of based on the base inflow of 2.6 cfs. The peak inflow during the 5-year, 24-hour storm is 486 cfs, which results from 4.5 inches of rainfall according to NOAA Atlas 4. The reservoir level will rise to elevation feet based 5
12 FAR II Dam Raising Design Report Cardinal Plant, Brilliant, OHJanuary 23 S&ME No /76--4A on an initial pool level of elevation 974. The peak outflow from the dam will be 58 cfs. The HEC- output for the reservoir routings are contained on Plates 44 through 75 of Appendix C Service Spillway-Structural Capacity The 54-inch P.C.C.P. portion of the service spillway was also analyzed for additional internal and external pressures due to the 3-foot dam raising. The pipe is installed under the dam embankment and was trenched into bedrock. Pipe crushing calculations were performed to analyze the additional loading on the pipe from the raised dam. Previous calculations (see 2 As-Built Drawing No ) indicate that the pipe was designed to handle 8 feet of overburden material at 25 pcf. The proposed top of dam will be 74.6 feet above the pipe, therefore the existing concrete pipe will be suitable to handle the additional load. Additional information on as-built drawing also indicates that the pipe is capable of handling internal pressure up to 35 psi. It is possible that at high headwater elevations, the spillway pipe could become pressurized. Under the maximum pool elevation of 983., the maximum static head on the downstream portion of the pipe would be 8.5 feet, or 34.9 psi. As the water will be flowing through the pipe, the actual pressure on the pipe will be less than this value; therefore the pressure should not exceed the pipe rating of 36 psi. See Plates 2 and 2 of Appendix C Emergency Spillway The development of the PMF hydrograph indicates a peak inflow to the reservoir equal to 6,329 cfs. This value represents the combined hydrographs from the West and East watersheds. Values of the runoff from each watershed and the combined runoff are shown in Appendix C. Based on the flood routing, the calculated peak discharge from the dam is 5,49 cfs at a maximum pool elevation of 98.9 feet NGVD. The PMF routing was also checked with the service spillway blocked, which resulted in a maximum pool elevation of and.2 feet of freeboard. Both 6-hour and 24-hour storm durations were checked. The 6-hour storm resulted in a higher maximum water surface, therefore this storm duration was used for developing the PMF inflow hydrograph. Depth of flow in the spillway was determined based on the HEC-RAS analysis. In the proposed spillway section, the training walls were kept a minimum of foot above the critical water surface depth of 4.5 feet, as shown on Plates 23 and 32 of Appendix C. The training wall height downstream of the steps transition was kept to a minimum of foot above the resultant water 6
13 FAR II Dam Raising Design Report Cardinal Plant, Brilliant, OHJanuary 23 S&ME No /76--4A surface depth during the PMF event (2 to 2.5 feet). The existing wall height of 4 feet meets this requirement. The HEC-RAS output is presented as Plates 25 through 36 of Appendix C. The structural analysis of the raised emergency spillway is presented elsewhere in this report. 4.7 Summary and Conclusions The hydrologic/hydraulic studies for the proposed dam raising included estimating the PMF and 5-year flood hydrographs and designing the emergency and service spillways. The U.S. Army Corps of Engineers computer programs HEC- and HEC-RAS were used in the analyses. Hydrograph presented on Plate 43 of Appendix C displays the resultant inflow and outflow hydrographs from HEC- based on the PMF event. Table 4.7., gives a complete summary of the study. The proposed spillway system has enough capacity to pass the probable maximum flood without overtopping the dam. The The water discharged through the emergency spillway is directed away from the dam such that it causes no threat to the stability of the structure. Table 4.7. Hydrologic/Hydraulic Summary for Proposed Raising Of Dam HYDROLOGIC AND HYDRAULIC SUMMARY Drainage Area AREA (AC) 2.2 Sq. Mi. Design Floods (Inflow) PMF Peak 6,329 cfs 5-Yr Peak 547 cfs Peak Discharge PMF 5,49 cfs 5-Yr 58 cfs Maximum Pool Elevations, NVGD PMF 98.9 ft 5-Yr ft Emergency Spillway - Overflow Control Section - Concrete Crest Elevation, NGVD ft Bottom Width 5. ft Side Slopes Vertical Service Spillway - Size Top of Vertical Concrete Structure 976. ft Stop Log Width 4. ft Conduit Size 54" & 42" Maximum Operating Pool Level, NGVD 974. ft 7
14 Attachment A 2 23 Report Appendix C Hydrologic and Hydraulics Analysis
15
16 PLATE

17 PLATE 2
18 PLATE 3
19 CARDINAL FAD 2 CALCULATE COMPOSITE CN - WEST WATERSHED Based off of Worksheet 2 in Appendix D of 2-VI-TR-55, Second Ed., June 986 Soil Name/ Hydrologic Group C C 9 Area (ac) 58. Product of CN x Area 4, , ,78 Cover Description CN Newly graded areas (no vegetation) Woods, good Totals Composite CN Use 74.9 CN = 75 Check FAR Landfill Post-Development conditions: From 25 FAR PTI by GeoSyntec, Post-Development conditions for the final cover system is a CN of 74. (see attached) Therefore, use current landfill construction condition of CN = 75. PLATE 4
20 (from FAR PTI) GEOSYNTEC CONSULTANTS Written by: William Steier Client: AEP Date: 2 October 25 Project: Cardinal Power Plant PAGE Reviewed by: Joo Chai Wong Project/Proposal No.:CHE826 2 OF 4 Date: Task No.: Hydrologic Soil Groups: Interim Conditions Interim site conditions will include exposed temporary waste slopes. FGD waste material is assumed to exhibit similar characteristics to soils of Hydrologic Soils Group C. Post-Development - Soil used to construct the final cover system will consist of low permeability material, which will exhibit characteristics of Hydrologic Soils Group C. Curve Number (CN): Interim Conditions For interim slopes, a CN of 9 is selected, the value recommended by SCS for hydrologic soil group C for newly graded areas. Post-Development - For the final cover system, a curve number (CN) of 74 is used, the value recommended by SCS for hydrologic soil group C for open spaces in good condition (grass cover > 75%). A summary of runoff CN values provided by SCS [SCS, 986] are provided in Table 2. Time of Concentration Tc: The Tc value represents the total time for stormwater runoff to travel from the hydraulically most distant point of a watershed or drainage area to a point of interest. Factors affecting Tc include surface roughness, channel shape and flow patterns, and slope. For this analysis the calculation of Tc evaluates the impact of three different types of stormwater runoff flow: ¾ sheet flow flow over plane surfaces, which is limited to a maximum length of 5 ft.; ¾ shallow concentrated flow after about 5 ft., sheet flow will begin to concentrate, but not necessarily defined in a specific channel; and ¾ channel flow flow that is confined to a defined channel section. The Tc value for a drainage area is the sum of the individual various travel time (Tt) values of the above flow types. The equations for calculating the Tt are presented below ¾ Sheet Flow: Tt =.7 (nl).8 (P2).5 s.4 ¾ Shallow Concentrated Flow: Tt = L 3,6 V CHE826\HYDROLOGIC MODEL.WMS.DOC PLATE 5
21 (from FAR PTI) GEOSYNTEC CONSULTANTS Written by: William Steier Client: AEP PAGE Date: 2 October 25 Project: Cardinal Power Plant Reviewed by: Joo Chai Wong Project/Proposal No.:CHE826 7 OF 4 Date: Task No.: TABLE 2 (from FAR PTI) CHE826\HYDROLOGIC MODEL.WMS.DOC PLATE 6
22 PLATE 7
23 PLATE 8
24 PLATE 9

25 PLATE
26 PLATE
27 PLATE 2
28 PLATE 3 Top of Dam = 983. Emergency Spillway Max Operating Pool Top of Stop Log Cardinal FAD 2 Dam Raising Spillway Capacity - Proposed Top of Dam El. 983, ES width = 5' Box Box Struc. Control Total Lake Stop Log Structure Pipe Inlet Pressure Control E. Spillway Struc. Orifice Elevation Weir Flow Outflow Flow Pipe Flow Outflow Outflow Flow Outflow Weir Flow Flow feet cfs cfs cfs cfs cfs cfs cfs MGD cfs Stop Log Weir Flow Stop Log Weir Flow Stop Log Weir Flow Stop Log Weir Flow Stop Log Weir Flow Stop Log Weir Flow Stop Log Weir Flow Stop Log Weir Flow Stop Log Weir Flow Stop Log Weir Flow Stop Log Weir Flow Stop Log Weir Flow Stop Log Weir Flow Pressure Pipe Flow Pressure Pipe Flow Pressure Pipe Flow Control Type
29 Cardinal FAD 2 Stop Logs Weir Rating Weir Flow Q C SCW LH C SCW 3 2 H Hc Elevation H Q for H/Hc <.3, CSCW becomes 3.33 L= 4. g= 32.2 Crest Elevation= Reference: FHWA-SA Urban Drainage Design Manual Hydraulic Engineering Circular 22 November, 996 PLATE 4
30 Cardinal FAD 2 Existing Spillway Pipe Rating Pipe Inlet Control Q CA 2gh for C=.62 orifice equation becomes: Q 3.9 D 2 h d= 54. Invert Elevation = 9.33 INCHES 54" PCCP Orifice Headwater Elevation Discharge Velocity (ft.) (cfs) (ft/s) Reference: FHWA-SA Urban Drainage Design Manual Hydraulic Engineering Circular 22 November, 996 PLATE 5
31 Cardinal FAD 2 Existing Spillway Pipe Rating Pressure Pipe Flow Computed with the Energy Equation (from inlet to outlet) Manning's n=.5 Inlet Invert: 9 Outlet Invert (z2): 736 Entrance Coefficent Ke=.9 The Darcy-Weisbach friction factor is related to Manning's n through the following equation: Outlet Coefficent Ko=. MH Coefficent KMH=.5 f Bends Coefficent Kb=.8 Pipe Diameter in inches= 42 Pipe Diameter in feet (D)= 3.5 Pipe Eq. Length in feet (L)= 852 Darcy-Weisbach f =.27 D (ft) Outlet Velocity (ft/s) Outlet Flow Rate (ft3/s) The Energy Equation is: p v2 p2 v22 z z2 hl 2g 2g Assuming Free Outlet (TW=El ): Headwater Elevation (z) 85 n Where: v2 L h L 2g f D K e K o Kb Because p, v and p2 all are equal to the energy equation becomes: v 2 v2 L z z2 f Ke Ko Kb 2g 2g D Solving for v gives: v 2g z z2 L f Ke Ko Kb D Determine flow rate Q by: Q VA PLATE 6
32 Cardinal FAD 2 Vertical Box Structure Overflow Rating Weir Flow Q C SCW LH C SCW 3 2 H Hc for H/Hc <.3, CSCW becomes 3.33 Size= 5'-8" x 7'-6 " inside dimensions L= 26.3 g= 32.2 Crest Elevation= 976. Elevation H Q Reference: FHWA-SA Urban Drainage Design Manual Hydraulic Engineering Circular 22 November, 996 PLATE 7
33 Cardinal FAD 2 Vertical Box Structure Overflow Rating Orifice Flow Q CA 2gh Size= A= Grating % Open Area Orifice Centroid Elevation = Headwater Elevation (ft.) '-8" x 7'-6 " inside dimensions 42.5 S.F. 6 % 976. Orifice Discharge Velocity (cfs) (ft/s) Reference: FHWA-SA Urban Drainage Design Manual Hydraulic Engineering Circular 22 November, 996 PLATE 8
34 PLATE 9
35 PLATE 2
36 PLATE 2
37 PLATE 22
38 PLATE 23
39 PLATE 24
40 PLATE PF PF 2 PF 3 PF 4 PF 5 PF 6 PF PF 2 PF 3 PF 4 PF 5 PF 6 PF 7 PF 8 PF 9 PF PF PF 2 PF 3 PF 4 PF 5 PF 6 PF 7 PF 8 PF 9 PF HEC-RAS Plan: Plan 22 River: E. Spillway Reach: Reach River Sta Profile Q Total (cfs) 4 PF 2. 4 PF PF 3. 4 PF PF PF PF PF PF PF Min Ch El (ft) W.S. Elev (ft) Crit W.S. (ft) E.G. Elev (ft) E.G. Slope (ft/ft) Vel Chnl (ft/s) Flow Area (sq ft) Top Width (ft) Froude # Chl
41 PLATE PF PF PF 2 PF 3 PF 4 PF 5 PF 6 PF 7 PF 8 PF 9 PF PF PF 2 PF 3 PF 4 PF 5 PF 6 PF 7 PF 8 PF 9 PF PF PF 2 PF 3 PF 4 PF 5 PF 6 PF 7 PF 8 PF 9 PF HEC-RAS Plan: Plan 22 River: E. Spillway Reach: (Continued) Reach River Sta Profile Q Total Min Ch El (cfs) (ft) PF PF PF PF W.S. Elev (ft) Crit W.S. (ft) E.G. Elev (ft) E.G. Slope (ft/ft) Vel Chnl (ft/s) Flow Area (sq ft) Top Width (ft) Froude # Chl
42 PLATE PF PF 2 PF 3 PF 4 PF 5 PF 6 PF 7 PF PF 2 PF 3 PF 4 PF 5 PF 6 PF 7 PF 8 PF 9 PF PF PF 2 PF 3 PF 4 PF 5 PF 6 PF 7 PF 8 PF 9 PF HEC-RAS Plan: Plan 22 River: E. Spillway Reach: (Continued) Reach River Sta Profile Q Total Min Ch El (cfs) (ft) 85 PF PF PF PF PF PF PF PF PF W.S. Elev (ft) Crit W.S. (ft) E.G. Elev (ft) E.G. Slope (ft/ft) Vel Chnl (ft/s) Flow Area (sq ft) Top Width (ft) Froude # Chl
43 PLATE PF PF 2 PF PF 2 PF 3 PF 4 PF 5 PF 6 PF 7 PF 8 PF 9 PF PF PF 2 PF 3 PF 4 PF 5 PF 6 PF 7 PF 8 PF 9 PF PF PF 2 PF 3 PF 4 PF 5 PF 6 PF 7 PF 8 PF 9 PF HEC-RAS Plan: Plan 22 River: E. Spillway Reach: (Continued) Reach River Sta Profile Q Total Min Ch El (cfs) (ft) 7 PF PF PF W.S. Elev (ft) Crit W.S. (ft) E.G. Elev (ft) E.G. Slope (ft/ft) Vel Chnl (ft/s) Flow Area (sq ft) Top Width (ft) Froude # Chl
44 PLATE PF PF 2 PF 3 PF 4 PF 5 PF 6 PF 7 PF 8 PF PF 2 PF 3 PF 4 PF 5 PF 6 PF 7 PF 8 PF 9 PF PF PF 2 PF 3 PF 4 PF 5 PF 6 PF 7 PF 8 PF 9 PF HEC-RAS Plan: Plan 22 River: E. Spillway Reach: (Continued) Reach River Sta Profile Q Total Min Ch El (cfs) (ft) 52.9 PF PF PF PF PF PF PF PF W.S. Elev (ft) Crit W.S. (ft) E.G. Elev (ft) E.G. Slope (ft/ft) Vel Chnl (ft/s) Flow Area (sq ft) Top Width (ft) Froude # Chl
45 PLATE PF PF 2 PF 3 PF 4 PF 5 PF 6 PF 7 PF 8 PF 9 PF PF PF 2 PF 3 PF 4 PF 5 PF 6 PF 7 PF 8 PF 9 PF PF PF 2 PF 3 PF 4 PF 5 PF 6 PF 7 PF 8 PF 9 PF HEC-RAS Plan: Plan 22 River: E. Spillway Reach: (Continued) Reach River Sta Profile Q Total Min Ch El (cfs) (ft) 3 PF PF W.S. Elev (ft) Crit W.S. (ft) E.G. Elev (ft) E.G. Slope (ft/ft) Vel Chnl (ft/s) Flow Area (sq ft) Top Width (ft) Froude # Chl
46 PLATE 3
47 PLATE 32
48 Emergency Spillway Emergency Spillway RS = 4 lake.4.4 RS = Legend Legend EG PF 9 98 EG PF WS PF 9 WS PF 9 97 Ground Bank Sta 96 Ground Elevation (ft) Elevation (ft) Crit PF Bank Sta Station (ft) Station (ft) Emergency Spillway Emergency Spillway RS = 5 us control RS = ds control Legend Legend EG PF EG PF WS PF 9 WS PF 9 98 Bank Sta 978 Ground Elevation (ft) Elevation (ft) Ground Bank Sta Station (ft) Emergency Spillway Emergency Spillway RS = 99.9 ds control 984 Station (ft). 5 5 RS = Legend EG PF Legend EG PF WS PF 9 Crit PF 9 98 Ground Bank Sta WS PF 9 Elevation (ft) Elevation (ft) Crit PF 9 98 Ground Bank Sta Station (ft) Station (ft) PLATE 33
49 Emergency Spillway Emergency Spillway RS = 93 Wall vertical bend RS = 85 Wall vertical bend Legend EG PF Legend EG PF WS PF Bank Sta Ground Crit PF Elevation (ft) Elevation (ft) Crit PF 9 98 WS PF 9 Ground 972 Bank Sta Station (ft) Emergency Spillway Emergency Spillway RS = 8 transition 97-2 Station (ft) RS = 77 ex. spillway steps Legend EG PF Legend EG PF WS PF Bank Sta Ground Crit PF Elevation (ft) Elevation (ft) Crit PF WS PF 9 Ground 964 Bank Sta Station (ft) Emergency Spillway Emergency Spillway RS = 7 end wall Station (ft) RS = 69.9 ex. wall Legend EG PF Legend EG PF WS PF Bank Sta Ground Crit PF 9 Elevation (ft) Elevation (ft) Crit PF WS PF Bank Sta Ground Station (ft) Station (ft) PLATE 34
50 Emergency Spillway Emergency Spillway RS = 6 toe RS = 53 toe Legend EG PF Legend EG PF WS PF Bank Sta Ground Crit PF 9 Elevation (ft) Elevation (ft) Crit PF WS PF 9 92 Bank Sta Ground Emergency Spillway Emergency Spillway 6 RS = 5 end wall Legend EG PF Crit PF WS PF 9 92 Bank Sta Ground Legend EG PF 9 WS PF 9 Ground Elevation (ft) Elevation (ft) Station (ft) RS = 52.9 toe Station (ft) Bank Sta Station (ft) Emergency Spillway Emergency Spillway RS = Station (ft). 5 8 RS = 3 ex. spillway Legend Legend EG PF EG PF 9 WS PF WS PF Bank Sta Crit PF 9 Elevation (ft) Elevation (ft) Ground 924 Ground Station (ft) Bank Sta Station (ft) PLATE 35
51 Emergency Spillway Emergency Spillway RS = 8 ex. channel.45 RS = 5 ex. channel EG PF Legend Legend EG PF 9 98 WS PF 9 9 Bank Sta Ground Crit PF 9 Elevation (ft) Elevation (ft) Crit PF WS PF 9 94 Bank Sta Ground Station (ft) Station (ft) Emergency Spillway RS = 3 ex. channel outlet Legend EG PF Elevation (ft) Crit PF WS PF Bank Sta Ground Station (ft) PLATE 36
52 PLATE 37
53 PLATE 38
54 PLATE 39
55 Downloaded from ascelibrary.org by William Barry on 8/2/2. For personal use only. No other uses without permission. Copyright (c) 22. American Society of Civil Engineers. All rights reserved. flow and main stream skimming flows: An experimental study. Can. J. Civ. Eng. 3共兲, Henderson, F. M. 共966兲. Open channel flow, MacMillan, New York. Laali, A. R., and Michel, J. M. 共984兲. Air entrainment in ventilated cavities: Case of the fully developed half cavity. J. Fluids Eng., Trans ASME, Sept., 6, Matos, J. 共2兲. Hydraulic design of stepped spillways over RCC dams. Intl Workshop on Hydraulics of Stepped Spillways, Zürich, Switzerland, H. E. Minor and W. H. Hager, eds., Balkema, Rotterdam, The Netherlands, Michel, J. M. 共984兲. Some features of water flows with ventilated cavities. J. Fluids Eng., Trans ASME, Sept., 6, Ohtsu, I, Yasuda, Y., and Takahashi, M. 共2兲. Characteristics of skimming flow over stepped spillways. J. Hydraul. Eng., 26共兲, Shvajnshtejn, A. M. 共999兲. Stepped spillways and energy dissipation. Gidrotekh. Stroit., 5, 5 2 共in Russian兲. Silberman, E., and Song, C. S. 共96兲. Instability of ventilated cavities. J. Ship Res., 5共兲, Toombes, L., and Chanson, H. 共2兲. Air-water flow and gas transfer at aeration cascades: A comparative study of smooth and stepped chutes. Int. Workshop on Hydraulics of Stepped Spillways, Zürich, Switzerland, Balkema, Rotterdam, The Netherlands, Verron, J., and Michel, J. M. 共984兲. Base-vented hydrofoils of finite span under a free surface: An experimental investigation. J. Ship Res., 28共2兲, 9 6. Yasuda, Y., and Chanson, H. 共23兲. Micro- and macroscopic study of two-phase flow on a stepped chute. Proc., 3th IAHR Biennial Congress, Thessaloniki, Greece, J. Ganoulis and P. Prinos, eds., vol. D, Yasuda, Y., and Ohtsu, I. 共999兲. Flow resistance of skimming flow in stepped channels. Proc., 28th IAHR Congress, Graz, Austria, session B4, 共CD-ROM兲. Discussion of Hydraulic Design of Stepped Spillways by Robert M. Boes and Willi H. Hager September 23, Vol. 29, No. 9, pp DOI:.6/共ASCE兲 共23兲29:9共67兲 A. D. Ghare; P. D. Porey2; and R. N. Ingle3 Sr. Lecturer, Civil Engineering Dept., D. C. V. Raman Institute of Technology, Nagpur, India. 2 Professor, Civil Engineering Dept., Visvesvaraya National Institute of Technology, Nagpur, India. 3 Emeritus Fellow, Civil Engineering Dept., Visvesvaraya National Institute of Technology, Nagpur, India. The authors are to be complimented for presenting extensive experimental data on characteristics of aerated skimming flow over stepped spillways along with hydraulic design aspects of stepped spillways. The authors have focused their attention on various aspects, including onset of skimming flow, aeration characteristics, residual energy, and training wall design. Considering the applicability of the design guidelines, the discussers would like to know the height of stepped spillway in the experimental setup for all 3 cases. Further, the authors may clarify regarding the limiting height of prototype stepped spillways up to which the design guidelines presented in this paper could be applied. Fig.. Variation of Manning s n for different H쐓 values The discussers would also like to know the number of steps provided in each case and the location of first step along the spillway profile. Can the authors suggest any readily usable explicit guidelines from hydraulic considerations for deciding on the step height, apart from the given RCC lift thickness? Some other investigators, including Rice and Kadavy 共996兲, Yildiz and Kas 共998兲, Chamani and Rajaratnam 共999兲 have indicated that the step height s affects the energy dissipation over stepped spillway. Eq. 共24兲 includes K, the roughness height perpendicular to the pseudobottom, which can be considered to be a representative term for step height s. In the last paragraph on energy dissipation, it is mentioned that Fig. 2 gives an idea of main parameters involved in the expression of relative residual energy. However, Fig. 2 does not indicate effect of any step height parameter on relative residual energy head ratio 关Hres / Hmax兴. Fig. 共兲 shows a plot compiled by discussers based on experimental data obtained by Ghare 共23兲 and Yildiz and Kas 共998兲, which show the effect of step height on Manning s equivalent n for a stepped spillway. In this plot H* is considered a ratio of spillway height to step height. Can authors provide any other dimensionless plot that covers all the main parameters including step height s affecting the performance of the stepped spillway under skimming flow regime? Proposed Eq. 共24兲 is based on the results obtained from Eqs. 共2兲 and 共2兲. Hence the use of Eq. 共24兲 appears to be a tedious process. As indicated by the authors in Fig. 共2兲, the variation in relative residual energy head ratio for = 4 and 5 is not appreciable; hence a simpler relationship for relative residual energy can be presented eliminating as a variable. The resulting relationship would be applicable for greater than 4. Without a properly designed energy dissipation system on the downstream side, the hydraulic design of a stepped spillway system would be incomplete. The discussers would like to know the opinion of the authors regarding the applicability of the conventional conjugate depth relationship for stilling basin design in case of a stepped spillway where highly aerated flow near the toe of the spillway is encountered. References Chamani, M. R., and Rajaratnam, N. 共999兲. Characteristics of skimming flows over stepped spillways. J. Hydr. Engrg. 25共4兲, / JOURNAL OF HYDRAULIC ENGINEERING ASCE / JUNE 25 J. Hydraul. Eng. 25.3: PLATE 4
56 Downloaded from ascelibrary.org by William Barry on 8/2/2. For personal use only. No other uses without permission. Copyright (c) 22. American Society of Civil Engineers. All rights reserved. (hw,e hw,e2)/2.87 m in the continuity equation yields a terminal velocity of v w,e q d /h w,e 2/ m/s. If the chute was long enough for the attainment of uniform flow, i.e., H dam H dam,u 7 m, the normalized residual head would read H res /H max.36 according to Eq. 共24b兲, with f b.67 from Eq. 共2兲, D h,w,u 4h w,u m and. K/D h,w,u.23.. In this case, 64% of the flow energy of H max 75.2 m would be dissipated on the spillway, and the terminal velocity would amount to v w,e 2/.8 25 m/s. Training Wall Design With.2 for concrete dams, the required sidewall height from Eq. 共25兲 is h d 2.9 m, with h 9,u.74 m from Eq. 共5兲. A sidewall height of 2. m is proposed. If the downstream dam face were prone to erosion, and if it were essential to avoid overtopping of the training walls, distinction should be made about whether the crest profile above the point of tangency is smooth or stepped. In the latter case, the required wall height should be at least h d.5h 9,u 2.6 m, whereas for a smooth crest profile, the wall height should be h d h spray 4s m over about L 25s m from the crest to allow for the spray resulting from nappe impact on the first steps below the smooth crest 共Boes and Minor 22兲. Conclusions The following findings of the present experimental study apply:. The onset of skimming flow is expressed by the ratio of critical depth to step height and follows a linear function as expressed in Eq. 共兲. 2. The uniform equivalent clear water depth h w,u on stepped spillways depends on the chute angle and unit discharge only, as given in Eq. 共4兲. 3. The characteristic uniform mixture depth h 9,u according to Eq. 共5兲 is a function of step height, unit discharge and chute angle. 4. The drawdown length to the approximate location of uniform flow attainment as given in Eq. 共3兲 depends on chute angle and unit discharge only. 5 The bottom roughness friction factor is approximated for a wide range of spillway angles and relative roughness by Eq. 共2兲 or 共2兲. 6. The significant effect of aeration on the reduction of friction factors is illustrated by the ratio f w / f m as function of the mean air concentration, Eq. 共22兲, where f w and f m are friction factors with and without consideration of flow aeration, respectively. 7. A general expression of residual energy head along stepped chutes is given in Eq. 共24兲, with distinction between developing and uniform flow regions. 8. Stepped spillway training walls should be designed according to Eq. 共25兲, taking into account the erosion potential of the downstream dam face. These conclusions in conjunction with the results of Boes and Hager 共23兲 allow for the hydraulic design of stepped spillways for a wide range of boundary conditions including typical applications both for embankment and gravity dams. Acknowledgment The present project was financed by the Swiss National Science Foundation, Grant No The assistance of Professor Y. Yasuda, Nihon University, Tokyo, in providing experimental data is also gratefully acknowledged. Notation The following symbols are used in this paper: b spillway or river width; C depth-averaged air concentration; C i depth-averaged air concentration at inception point; C u uniform depth-averaged air concentration; C(y) local air concentration; D h,w 4R h,w hydraulic diameter; D h,eff wd h,w effective hydraulic diameter; F u/(gh) /2 local Froude number; F q w /(gh 3 ) /2 approach Froude number at jetbox; F q w /(g sin s3)/2 roughness Froude number; * f Darcy Weisbach friction factor of unaerated flow; f b friction factor of bottom roughness; f m Darcy Weisbach friction factor in two-phase flow without consideration of aeration; f s skin friction factor of sidewall roughness; f w Darcy Weisbach friction factor in two-phase flow with consideration of aeration; g gravitational acceleration; H dam vertical spillway or dam height; H dam,u vertical distance from spillway crest to close uniform equivalent clear water flow; H max maximum reservoir energy head; H res residual energy head; h local flow depth; h c critical depth; h d training wall design height; h m mixture depth; h m,i mixture depth at inception point; h spray spray height resulting from nappe impact on steps; h u uniform flow depth; h w ( C )h 9 equivalent clear water depth; h w,e clear water depth at chute end; h w,i clear water depth at inception point; h w,u uniform equivalent clear water depth; h 9 h(c.9) characteristic mixture depth with local air concentration of C.9; h approach flow depth at jetbox; h 9,u uniform characteristic mixture depth; K s cos roughness height perpendicular to pseudobottom; L i black water length from spillway crest to inception point; L s s/sin K/(sin cos ) 2K/sin(2 ) distance between step edges, roughness spacing; Q d design discharge; Q w water discharge; q d design discharge per unit width; q w water discharge per unit width; R ud h,w / Reynolds number; R h,w hydraulic radius; S f friction slope; s step height; u flow velocity in x direction; v m,i mixture velocity at inception point; v w,e clear water velocity at chute end; 678 / JOURNAL OF HYDRAULIC ENGINEERING ASCE / SEPTEMBER 23 J. Hydraul. Eng : PLATE 4
STRUCTURAL STABILITY ASSESSMENT
 STRUCTURAL STABILITY ASSESSMENT CFR 257.73(d) Fly Ash Reservoir II Cardinal Plant Brilliant, Ohio October, 2016 Prepared for: Cardinal Operating Company Cardinal Plant Brilliant, Ohio Prepared by: Geotechnical
HISTORY OF CONSTRUCTION
 HISTORY OF CONSTRUCTION CFR 257.73(c)(1) West Boiler Slag Pond Clifty Creek Plant Madison, Indiana October, 2016 Prepared for: Indiana Kentucky Electric Corporation Prepared by: American Electric Power
Plan B Dam Breach Assessment
 Plan B Dam Breach Assessment Introduction In support of the Local Sponsor permit applications to the states of Minnesota and North Dakota, a dam breach analysis for the Plan B alignment of the Fargo-Moorhead
 Dam Modification Report Stingy Run Fly Ash Reservoir Appendix E Spillway System Design Calculations E1: Spillway/Energy Dissipater Design for 100-year Event CHE8273 8 September 4, 2014 Written by: CJW
Hydraulics of stepped spillways : current status
 FORUM ARTICLE Hydraulics of stepped spillways : current status H. CHANSON Department of Civil Engineering, The University of Queensland, Brisbane QLD 4072, Australia Email : h.chanson@mailbox.uq.edu.au
Sediment Basin 7E-12. Design Manual Chapter 7 - Erosion and Sediment Control 7E - Design Information for ESC Measures BENEFITS.
 7E-12 Design Manual Chapter 7 - Erosion and Sediment Control 7E - Design Information for ESC Measures Sediment Basin BENEFITS Flow Control Erosion Control Sediment Control Runoff Reduction Flow Diversion
Stability of Concrete Macro-Roughness Linings for Overflow Protection of Earth Embankment Dams ( 1 ) - Discussion
 - Discussion") Stability of Concrete Macro-Roughness Linings for Overflow Protection of Earth Embankment Dams ( 1 ) - Discussion H. Chanson (Reader) Dept of Civil Engineering, The University of Queensland, Brisbane QLD
Stability of Concrete Macro-Roughness Linings for Overflow Protection of Earth Embankment Dams ( 1 ) - Discussion H. Chanson (Reader) Dept of Civil Engineering, The University of Queensland, Brisbane QLD
Technical Report Culvert A Hydraulic Analysis
 DATE: November 3, 2011 Technical Report Culvert A Hydraulic Analysis TO: FROM: RE: Jim Reiser, P.E. Project Manager Parsons Brinckerhoff, Inc. Kurt Killian, P.E., CFM Parsons Brinckerhoff, Inc. Design
APPENDIX C VEGETATED EMERGENCY SPILLWAY. VERSION 1.0 March 1, 2011
 APPENDIX C VEGETATED EMERGENCY SPILLWAY VERSION 1.0 March 1, 2011 [NOTE: Could use a better photo more clearly showing the emergency spillway in the context of the dam.] SECTION C-1: DESCRIPTION OF PRACTICE
CHAPTER 4 SPALDING COUNTY, GEORGIA 4.0 CULVERT DESIGN
 SPALDING COUNTY, GEORGIA CHAPTER 4 4.0 CULVERT DESIGN... 4-1 4.1 INTRODUCTION... 4-1 4.2 SYMBOLS AND DEFINITIONS... 4-1 4.3 ENGINEERING DESIGN CRITERIA... 4-2 4.3.1 FREQUENCY FLOOD... 4-2 4.3.2 VELOCITY
CLOSURE PLAN. CFR (b) Bottom Ash Pond Complex Cardinal Plant Brilliant, Ohio. September, 2016
 Bottom Ash Pond Complex Cardinal Plant Brilliant, Ohio. September, 2016") CLOSURE PLAN CFR 257.102(b) Bottom Ash Pond Complex Cardinal Plant Brilliant, Ohio September, 2016 Prepared for: Cardinal Operating Company Cardinal Plant Brilliant, Ohio Prepared by: Geotechnical Engineering
CLOSURE PLAN CFR 257.102(b) Bottom Ash Pond Complex Cardinal Plant Brilliant, Ohio September, 2016 Prepared for: Cardinal Operating Company Cardinal Plant Brilliant, Ohio Prepared by: Geotechnical Engineering
USING A LABYRINTH WEIR TO INCREASE HYDRAULIC CAPACITY. Dustin Mortensen, P.E. 1 Jake Eckersley, P.E. 1
 USING A LABYRINTH WEIR TO INCREASE HYDRAULIC CAPACITY Dustin Mortensen, P.E. 1 Jake Eckersley, P.E. 1 Plum Creek Floodwater Retarding Structure No. 6 is located in an area of Kyle, Texas, that is currently
OFFICE OF STRUCTURES MANUAL FOR HYDROLOGIC AND HYDRAULIC DESIGN CHAPTER 11 APPENDIX B TIDEROUT 2 USERS MANUAL
 OFFICE OF STRUCTURES MANUAL FOR HYDROLOGIC AND HYDRAULIC DESIGN CHAPTER 11 APPENDIX B TIDEROUT 2 USERS MANUAL APRIL 2011 APRIL 2011 Page 1 Preface TIDEROUT 2, Build 1.22 dated June 29, 2006 is the current
HYDRAULIC JUMP AND WEIR FLOW
 HYDRAULIC JUMP AND WEIR FLOW 1 Condition for formation of hydraulic jump When depth of flow is forced to change from a supercritical depth to a subcritical depth Or Froude number decreases from greater
APPENDIX J HYDROLOGY AND WATER QUALITY
 APPENDIX J HYDROLOGY AND WATER QUALITY J-1 Technical Report on Airport Drainage, Northern Sector Airport and Ordinance Creek Watershed / Preliminary Creek Constructed Natural Channel Culvert J-2 Preliminary
COST EFFECTIVE STORAGE CAPACITY INCREASE FOR ALUMINA TAILINGS DISPOSAL AREA THROUGH SPILLWAY OPTIMISATION
 COST EFFECTIVE STORAGE CAPACITY INCREASE FOR ALUMINA TAILINGS DISPOSAL AREA THROUGH SPILLWAY OPTIMISATION Abstract Lonie I * Tailings and Dams, GHD Brisbane, QLD, Australia Queensland Alumina Limited operates
Effect of Fluid Density and Temperature on Discharge Coefficient of Ogee Spillways Using Physical Models
 RESEARCH ARTICLE Effect of Fluid Density and Temperature on Discharge Coefficient of Ogee Spillways Using Physical Models M. SREENIVASULU REDDY 1 DR Y. RAMALINGA REDDY 2 Assistant Professor, School of
General Information for Culvert Design
 Design Manual Chapter 2 - Stormwater 2E - Culvert Design 2E-1 General Information for Culvert Design A. Introduction A culvert is a conduit under an embankment that transports stormwater from one side
CHAPTER 5 CULVERT DESIGN
 CHAPTER 5 CULVERT DESIGN HYDRAULICS OF CULVERTS There are two major types of culvert flow: 1) flow with inlet control, and 2) flow with outlet control. For each type, different factors and formulas are
AIR-WATER FLOW STRUCTURES AT AN ABRUPT DROP WITH SUPERCRITICAL FLOW
 AIR-WATER FLOW STRUCTURES AT AN ABRUPT DROP WITH SUPERCRITICAL FLOW H. CHANSON and L. TOOMBES Department of Civil Engineering, The University of Queensland, Brisbane QLD 4072, Australia 1. Introduction
Transitional Steps Zone in Steeply Sloping Stepped Spillways
 Transitional Steps Zone in Steeply Sloping Stepped Spillways Jalal Attari 1 and Mohammad Sarfaraz 2 1- Assistant Professor, Power and Water University of Technology, Iran 2- Graduate Student, Department
International Journal of Scientific & Engineering Research, Volume 5, Issue 1, January ISSN
 International Journal of Scientific & Engineering Research, Volume 5, Issue 1, January-2014 1356 Study of Safe Hydraulic Design of Stepped Spillway by Physical Models prof. Dr. Abdul-Hassan K. Al-Shukur,
International Journal of Civil Engineering and Technology (IJCIET), ISSN (Print), AND TECHNOLOGY (IJCIET)
, ISSN (Print), AND TECHNOLOGY (IJCIET)") INTERNATIONAL ISSN 0976 6316(Online), Volume JOURNAL 5, Issue 4, April (2014), OF pp. CIVIL 82-90 IAEME ENGINEERING AND TECHNOLOGY (IJCIET) ISSN 0976 6308 (Print) ISSN 0976 6316(Online) Volume 5, Issue
INTERNATIONAL ISSN 0976 6316(Online), Volume JOURNAL 5, Issue 4, April (2014), OF pp. CIVIL 82-90 IAEME ENGINEERING AND TECHNOLOGY (IJCIET) ISSN 0976 6308 (Print) ISSN 0976 6316(Online) Volume 5, Issue
CLAIBORNE LOCK AND DAM PERTINENT DATA
 CLAIBORNE LOCK AND DAM PERTINENT DATA GENERAL Location Clarke, Monroe, & Wilcox Counties, Alabama; Alabama River, river mile 72.5 Drainage area Millers Ferry to Claiborne sq. mi. 836 Total drainage area
Mr. Michael Malone CPS Energy 145 Navarro Street, Mail Drop San Antonio, Texas Project No
 October 17, 2016 Mr. Michael Malone CPS Energy 145 Navarro Street, Mail Drop 100406 San Antonio, Texas 78296 Project No. 0352436 Subject: Compilation of Construction History Calaveras Power Station San
Experimental Investigation of Clear-Water Local Scour at Pile Groups
 Experimental Investigation of Clear-Water Local Scour at Pile Groups B. Ataie-Ashtiani 1 and A. A. Beheshti 2 Abstract: Experiments of local scour around pile groups are carried out under steady clear-water
Indiana LTAP Road Scholar Core Course #10 Culvert Drainage. Presented by Thomas T. Burke, Jr., PhD, PE Christopher B. Burke Engineering, Ltd.
 Indiana LTAP Road Scholar Core Course #10 Culvert Drainage Presented by Thomas T. Burke, Jr., PhD, PE Christopher B. Burke Engineering, Ltd. Objectives Review culvert shapes, end sections, and materials
Effect of channel slope on flow characteristics of undular hydraulic jumps
 River Basin Management III 33 Effect of channel slope on flow characteristics of undular hydraulic jumps H. Gotoh, Y. Yasuda & I. Ohtsu Department of Civil Engineering, College of Science and Technology,
A Comparative Study of Self-aerated Stepped Spillway and Smooth Invert Chute Flow: The effect of Step-induced Macro-roughness
 A Comparative Study of Self-aerated Stepped Spillway and Smooth Invert Chute Flow: The effect of Step-induced Macro-roughness Daniel B. Bung Senior Scientist, Franzius-Institute for Hydraulic, Waterways
2O-2 Open Channel Flow
 Iowa Stormwater Management Manual O- O- Open Channel Flow A. Introduction The beginning of any channel design or modification is to understand the hydraulics of the stream. The procedures for performing
Culvert Design An Overview of the NYS Highway Design Manual Chapter 8
 Seventeenth Statewide Conference on Local Bridges Culvert Design An Overview of the NYS Highway Design Manual Chapter 8 Tuesday, October 25, 2011 Training Session: Culvert Design, Analysis - talk 2 Presented
Greenup Lock Filling and Emptying System Study
 Fourth LACCEI International Latin American and Caribbean Conference for Engineering and Technology (LACCET 2006) Breaking Frontiers and Barriers in Engineering: Education, Research and Practice 21-23 June
STRUCTURE S-65 PURPOSE SPILLWAY OPERATION
 STRUCTURE S-65 This structure is a reinforced concrete, gated spillway with discharge controlled by three cable operated, vertical lift gates, and a reinforced concrete lock structure with two pairs of
Chutes Part 2: Synthetic linings
 s Part 2: Synthetic linings DRAINAGE CONTROL TECHNIQUE Low Gradient Velocity Control Short Term Steep Gradient Channel Lining Medium-Long Term Outlet Control [1] Soil Treatment Permanent [2] [1] s can
SUPERCRITICAL FLOW AT AN ABRUPT DROP : FLOW PATTERNS AND AERATION
 SUPERCRITICAL FLOW AT AN ABRUPT DROP : FLOW PATTERNS AND AERATION by H. Chanson, Senior Lecturer, and L. Toombes, Ph.D. student Dept. of Civil Engineering, The University of Queensland, Brisbane QLD 4072,
Experiment (13): Flow channel
: Flow channel") Experiment (13): Flow channel Introduction: An open channel is a duct in which the liquid flows with a free surface exposed to atmospheric pressure. Along the length of the duct, the pressure at the surface
Experiment (13): Flow channel Introduction: An open channel is a duct in which the liquid flows with a free surface exposed to atmospheric pressure. Along the length of the duct, the pressure at the surface
The Basics of Culvert and Inlet Design
 PDHonline Course C619 (8 PDH) The Basics of Culvert and Inlet Design Jerry D. Morrow, PE 2013 PDH Online PDH Center 5272 Meadow Estates Drive Fairfax, VA 22030 6658 Phone & Fax: 703 988 0088 www.pdhonline.org
Discharge Coefficient in Siphon Spillway with Different Cross Sections
 World Applied Sciences Journal 17 (): 163-167, 01 ISSN 1818-495 IDOSI Publications, 01 Discharge Coefficient in Siphon Spillway with Different Cross Sections 1 Amin Ghafourian and Mohd. Nordin Adlan 1
HY-8 Version 7.2 Build Date January 17, Federal Highway Administration.
 HY-8 Version 7.2 Build Date January 17, 2012 Federal Highway Administration http://www.fhwa.dot.gov/engineering/hydraulics/software/hy8/index.cfm SIMPLE Simple to use Use for simple culverts and bridges
Advanced Hydraulics Prof. Dr. Suresh A. Kartha Department of Civil Engineering Indian Institute of Technology, Guwahati
 Advanced Hydraulics Prof. Dr. Suresh A. Kartha Department of Civil Engineering Indian Institute of Technology, Guwahati Module - 4 Hydraulics Jumps Lecture - 4 Features of Hydraulic Jumps (Refer Slide
Outlet Structures T-12
 Description This section provides guidance and details for outlet structures for use primarily with BMPs utilizing sedimentation, (i.e., extended detention basins (EDBs), retention ponds, and constructed
MEMORANDUM. TNC Fisher Slough Final Design and Permitting Subject: DRAFT Technical Memorandum: Levee Emergency Spillway Design
 MEMORANUM TNC Fisher Slough Final esign and Permitting Subject: RAFT Technical Memorandum: Levee Emergency Spillway esign To: From: Internal Memorandum For Record Yen Hsu Chen (Tetra Tech) avid Cline (Tetra
Stormwater Management Pond Design Brief. Greely Village Centre - Commercial Phase - Ultimate Conditions - - City of Ottawa -
 Stormwater Management Pond Design Brief Greely Village Centre - Commercial Phase - Ultimate Conditions - - City of Ottawa - December 2008 Ref: 647-07 J.F. Sabourin and Associates Inc. Water Resources and
EXPERIMENTAL STUDY OF ENERGY DISSIPATION OVER STEPPED GABION SPILLWAYS WITH LOW HEIGHTS *
 IJST, Transactions of Civil ngineering, Vol. 36, No. C, pp 53-64 Printed in The Islamic Republic of Iran, Shiraz University XPRIMNTAL STUDY OF NRGY DISSIPATION OVR STPPD GABION SPILLWAYS WITH LOW HIGHTS
Flow Characteristics and Energy Dissipation Over Traditional and Stepped Spillway with Semicircular Crest
 International Journal of Civil & Environmental Engineering IJCEE-IJENS Vol: 14 No: 02 13 Flow Characteristics and Energy Dissipation Over Traditional and Stepped Spillway with Semicircular Crest 1 Rasul
APPENDIX H LAKE OKEECHOBEE FLOOD ROUTINES
 1 2 3 APPENDIX H LAKE OKEECHOBEE FLOOD ROUTINES 1 2 3 4 5 6 7 8 9 10 11 12 13 14 15 16 17 18 19 20 21 22 23 24 25 26 27 28 29 30 31 32 33 34 35 36 37 38 39 40 41 42 43 44 45 LAKE OKEECHOBEE FLOOD ROUTINGS
InvestigatingThe Effect of Number of Steps on Energy Dissipation of Stepped Spillways Based on the New Design Approach.
 InvestigatingThe Effect of Number of Steps on Energy Dissipation of Stepped Spillways Based on the New Design Approach Mohammad Karami 1. Department of Civil Engineering, Dehloran branch,islamic azad university,
Annex E Bridge Pier Protection Plan
 Annex E Bridge Pier Protection Plan Table E1 Bridge Types and Locations Table E2 Flow Conditions For River Sections Figure E1 Bridge Abutment Protection Figure E2 Bridge Pier Protection Figure E3 Central
VIRGINIA SOIL AND WATER CONSERVATION BOARD GUIDANCE DOCUMENT ON DAM BREAK INUNDATION ZONE AND INCREMENTAL DAMAGE ANALYSIS AND MAPPING PROCEDURES
 (Approved XXXXX, 2010) Working Draft Version January 14, 2010 VIRGINIA SOIL AND WATER CONSERVATION BOARD GUIDANCE DOCUMENT ON DAM BREAK INUNDATION ZONE AND INCREMENTAL DAMAGE ANALYSIS AND MAPPING PROCEDURES
APPENDIX B HYDRAULIC DESIGN DATA FOR CULVERTS
 TM 5-820-4/AFM 88-5, Chap 4 APPENDIX B HYDRAULIC DESIGN DATA FOR CULVERTS B-1. General. a. This appendix presents diagrams, charts, coefficients and related information useful in design of culverts. The
EXAMPLES (OPEN-CHANNEL FLOW) AUTUMN 2018
 AUTUMN 2018") EXAMPLES (OPEN-CHANNEL FLOW) AUTUMN 2018 Normal and Critical Depths Q1. If the discharge in a channel of width 5 m is 20 m 3 s 1 and Manning s n is 0.02 m 1/3 s, find: (a) the normal depth and Froude number
EXAMPLES (OPEN-CHANNEL FLOW) AUTUMN 2018 Normal and Critical Depths Q1. If the discharge in a channel of width 5 m is 20 m 3 s 1 and Manning s n is 0.02 m 1/3 s, find: (a) the normal depth and Froude number
ANSWERS TO QUESTIONS IN THE NOTES AUTUMN 2018
 ANSWERS TO QUESTIONS IN THE NOTES AUTUMN 2018 Section 1.2 Example. The discharge in a channel with bottom width 3 m is 12 m 3 s 1. If Manning s n is 0.013 m -1/3 s and the streamwise slope is 1 in 200,
Rock Ramp Design Guidelines. David Mooney MS Chris Holmquist-Johnson MS Drew Baird Ph.D. P.E. Kent Collins P.E.
 Rock Ramp Design Guidelines David Mooney MS Chris Holmquist-Johnson MS Drew Baird Ph.D. P.E. Kent Collins P.E. Rock Ramp Design Guidelines OUTLINE Local and System Interactions with Rock Ramps Ramp Geometry
Transactions on Ecology and the Environment vol 12, 1996 WIT Press, ISSN
 Open boundary condition for unsteady open-channel flow K. Mizumura Civil Engineering Department, Kanazawa Institute of Technology, 7-1 Ogigaoka, Nonoichimachi, Ishikawa Pref. 921, Japan Abstract Initial
Evaluation of step s slope on energy dissipation in stepped spillway
 International Journal of Engineering & Technology, 3 (4) (2014) 501-505 Science Publishing Corporation www.sciencepubco.com/index.php/ijet doi: 10.14419/ijet.v3i4.3561 Research Paper Evaluation of step
The Hydraulic Design of an Arced Labyrinth Weir at Isabella Dam
 Utah State University DigitalCommons@USU International Symposium on Hydraulic Structures Jun 28th, 1:30 PM The Hydraulic Design of an Arced Labyrinth Weir at Isabella Dam E. A. Thompson Sacramento District
PRELIMINARY RISK ASSESSMENT RIDM PROJECT FOR A DAM WITH A VEGETATION- LINED SPILLWAY AND FERC PILOT
 PRELIMINARY RISK ASSESSMENT FOR A DAM WITH A VEGETATION- LINED SPILLWAY AND FERC PILOT RIDM PROJECT MAY 3, 2018 DAVID S. BOWLES AND LOREN R. ANDERSON RAC ENGINEERS AND ECONOMISTS, LLC AND UTAH STATE UNIVERSITY
Advanced Hydraulics Prof. Dr. Suresh A. Kartha Department of Civil Engineering Indian Institute of Technology, Guwahati
 Advanced Hydraulics Prof. Dr. Suresh A. Kartha Department of Civil Engineering Indian Institute of Technology, Guwahati Module - 4 Hydraulic Jumps Lecture - 1 Rapidly Varied Flow- Introduction Welcome
Broadly speaking, there are four different types of structures, each with its own particular function:
 3 The selection of structures 3.1 Introduction In selecting a suitable structure to measure or regulate the flow rate in open channels, all demands that will be made upon the structure should be listed.
Discharge Coefficient in Oblique Side Weirs
 Iran Agricultural Research ol. 5 No. and ol. 6 No. - Printed in the Islamic Republic of Iran 007 Shiraz University Discharge Coefficient in Oblique Side Weirs T. HONAR ** AND M. JAAN * Department of Water
APPENDIX A STRUCTURE DESCRIPTIONS AND RATING CURVES
 3 4 5 6 7 8 9 0 3 APPENDIX A STRUCTURE DESCRIPTIONS AND RATING CURVES Kissimmee River Vol December 005 Version Draft 4 3 4 5 6 7 8 9 0 3 4 5 6 7 8 9 0 3 4 5 6 7 8 9 30 3 3 33 34 35 36 37 38 39 40 4 4 43
Lecture 10 : Sewer Appurtenances
 1 P age Module 8 : Sewer Appurtenances Lecture 10 : Sewer Appurtenances 2 P age The structures, which are constructed at suitable intervals along the sewerage system to help its efficient operation and
WMS 8.4 Tutorial Hydraulics and Floodplain Modeling HY-8 Modeling Wizard Learn how to model a culvert using HY-8 and WMS
 v. 8.4 WMS 8.4 Tutorial Hydraulics and Floodplain Modeling HY-8 Modeling Wizard Learn how to model a culvert using HY-8 and WMS Objectives Define a conceptual schematic of the roadway, invert, and downstream
PENNDRAIN.rep. HEC-RAS Version May 2005 U.S. Army Corp of Engineers Hydrologic Engineering Center 609 Second Street Davis, California
 HEC-RAS Version 3.1.3 May 2005 U.S. Army Corp of Engineers Hydrologic Engineering Center 609 Second Street Davis, California X X XXXXXX XXXX XXXX XX XXXX X X X X X X X X X X X X X X X X X X X XXXXXXX XXXX
Designing Labyrinth Spillways for Less than Ideal Conditions Real World Application of Laboratory Design Methods
 Designing Labyrinth Spillways for Less than Ideal Conditions Real World Application of Laboratory Design Methods Gregory Richards, P.E., CFM, Gannett Fleming, Inc. Blake Tullis, Ph.D., Utah Water Research
TABLE OF CONTENTS LEGAL NOTICE
 Closure Plan for Existing CCR Rev. 0 Surface Impoundments Page No. i TABLE OF CONTENTS 1. INTRODUCTION AND PURPOSE... 1 2. CLOSURE PLAN NARRATIVE DESCRIPTION... 2 3. FINAL COVER SYSTEM DESCRIPTION... 3
3. GRADUALLY-VARIED FLOW (GVF) AUTUMN 2018
 AUTUMN 2018") 3. GRADUALLY-VARIED FLOW (GVF) AUTUMN 2018 3.1 Normal Flow vs Gradually-Varied Flow V 2 /2g EGL (energy grade line) Friction slope S f h Geometric slope S 0 In flow the downslope component of weight balances
3. GRADUALLY-VARIED FLOW (GVF) AUTUMN 2018 3.1 Normal Flow vs Gradually-Varied Flow V 2 /2g EGL (energy grade line) Friction slope S f h Geometric slope S 0 In flow the downslope component of weight balances
Modelling of Pressurised Pipes within InfoWorks ICM and CS
 Modelling of Pressurised Pipes within InfoWorks ICM and CS 1. Introduction Correctly modelling pressurised pipes, variously described as forcemains or rising mains, can be one of the more difficult aspects
CENTER PIVOT EVALUATION AND DESIGN
 CENTER PIVOT EVALUATION AND DESIGN Dale F. Heermann Agricultural Engineer USDA-ARS 2150 Centre Avenue, Building D, Suite 320 Fort Collins, CO 80526 Voice -970-492-7410 Fax - 970-492-7408 Email - dale.heermann@ars.usda.gov
Exercise (3): Open Channel Flow Rapidly Varied Flow
: Open Channel Flow Rapidly Varied Flow") Exercise (3): Open Channel Flow Rapidly Varied Flow 1) A hydraulic jump exists in a trapezoidal channel having a bed width of 7 m and side slope of 1:1. The flowing discharge is 25 m 3 /sec. Construct
Exercise (3): Open Channel Flow Rapidly Varied Flow 1) A hydraulic jump exists in a trapezoidal channel having a bed width of 7 m and side slope of 1:1. The flowing discharge is 25 m 3 /sec. Construct
Whitewater Valley Station Surface Impoundment Coal Combustion Residual Annual Report
 Whitewater Valley Station Wayne County, Indiana GAI Project Number: C151119.07 July 2017 Prepared by: GAI Consultants, Inc. Murrysville Office 4200 Triangle Lane Export, Pennsylvania 15632-1358 Prepared
STRUCTURE 65-B PURPOSE SPILLWAY OPERATION
 STRUCTURE 65-B This structure is a reinforced concrete, gated spillway with discharge controlled by three cable operated vertical lift gates and a reinforced concrete lock structure with two pairs of sector
Numerical investigation of transition between free surface flow and pressurized flow for a circular pipe flowing full upstream
 Numerical investigation of transition between free surface flow and pressurized flow for a circular pipe flowing full upstream Tanjina Afrin 1, Abdul A. Khan 2, Nigel B. Kaye 3 AUTHORS: 1 Assistant Professor,
Chapter 11. Culverts and Bridges Design Checklist for Culvert Design
 Yes No N/A Design Requirements I. GENERAL DESIGN GUIDELINES Chapter 11. Culverts and Bridges A. Culvert design is in accordance with the Culverts chapter of Volume 2 of the UDFCD Manual for additional
DESIGN OF BELL-MOUTH SPILLWAY AT BARVI DAM
 DESIGN OF BELL-MOUTH SPILLWAY AT BARVI DAM Akshay Haldankar 1, Mahesh Bhadra 2, Rahul Harad 3, Darpan Kapre 4, Dipali Patil 5 1,2,3,4 Under graduate,dept. of Civil Engineering, DRIEMS Neral. 5Assistant
Follow this and additional works at:
 Lehigh University Lehigh Preserve Fritz Laboratory Reports Civil and Environmental Engineering 1987 Model study. Of a culvert safety grating - south 4th and brookdale streets, ALLENTOWN, PA for the Allentown
Spillway Design for Small Dams
 Spillway Design for Small Dams by David E. Fantina, PE Introduction: This course presents an overview of the features that go into the design of spillways for small dams. Small dams in this course refer
STUDY ON TSUNAMI PROPAGATION INTO RIVERS
 ABSTRACT STUDY ON TSUNAMI PROPAGATION INTO RIVERS Min Roh 1, Xuan Tinh Nguyen 2, Hitoshi Tanaka 3 When tsunami wave propagation from the narrow river mouth, water surface is raised and fluctuated by long
TABLE OF CONTENTS EXECUTIVE SUMMARY 1
 SLI Doc. No. 505573-3001-4HER-0001 00 12-Sept-2012 ii TABLE OF CONTENTS PAGE EXECUTIVE SUMMARY 1 1 INTRODUCTION... 3 2 OBJECTIVES... 5 3 WIND DATA... 6 3.1 Wind Rose... 7 4 SOCIÉTÉ D ÉNERGIE DE LA BAIE
Suitable Applications Check dams may be appropriate in the following situations: To promote sedimentation behind the dam.
 Categories EC Erosion Control SE Sediment Control TC Tracking Control WE Wind Erosion Control Non-Stormwater NS Management Control Waste Management and WM Materials Pollution Control Legend: Primary Category
Culvert Design for Low and High Gradient Streams in the Midwest. Dale Higgins, Hydrologist Chequamegon-Nicolet National Forest
 Culvert Design for Low and High Gradient Streams in the Midwest Dale Higgins, Hydrologist Chequamegon-Nicolet National Forest Overview Culvert Design Considerations Hydraulic Terms Culvert Impacts Low
Modeling of Long Culverts and Stormdrains A Comparison of Different Methods
 Modeling of Long Culverts and Stormdrains A Comparison of Different Methods Shrinivas Kaulgud, P.E., CFM Cheryl Hannan, P.E., CFM, LEED AP October 12, 2017 Presentation Outline Introduction Case Studies
Section 5: Pond Outlets
 Section : Pond Outlets Defining and calculating pond outlet devices 8 Minutes Press Space, PageDown, or Click to advance. Press PageUp to reverse. Esc to exit. Right-Click for other options. Outlets Introduction
Evaluating the Spillway Capacity of the Morning Glory Spillway at Harriman Dam
 Evaluating the Spillway Capacity of the Morning Glory Spillway at Harriman Dam Damian M. Gomez, P.E., CFM, Gomez and Sullivan Engineers, D.P.C. Dan Gessler, Ph.D., P.E., D.WRE, Alden Research Laboratory,
TABLE OF CONTENTS LEGAL NOTICE
 Closure Plan for Existing CCR Revision: 1 Surface Impoundments Page No. i TABLE OF CONTENTS 1. INTRODUCTION... 1 2. PROPOSED CCR IMPOUNDMENT CLOSURE PROCEDURE... 3 3. PROPOSED COVER SYSTEM... 4 4. ESTIMATED
IMPACT OF MAKING THE CREST OF WEIR MULTIFACETED ON DISCHARGE COEFFICIENT OF MORNING GLORY SPILLWAY
 IMPACT OF MAKING THE CREST OF WEIR MULTIFACETED ON DISCHARGE COEFFICIENT OF MORNING GLORY SPILLWAY Ali Bagheri 1 and *Ebrahim Nohani 2 1 Department of Water Engineering, Qaemshahr Branch, Islamic Azad
TABLE OF CONTENTS LEGAL NOTICE
 Surface Impoundments Page No. i TABLE OF CONTENTS 1. INTRODUCTION... 1 2. PROPOSED CCR IMPOUNDMENT CLOSURE PROCEDURE... 3 3. PROPOSED COVER SYSTEM... 4 4. ESTIMATED MAXIMUM INVENTORY OF CCR... 4 5. ESTIMATED
Ermenek Dam and HEPP: Spillway Test & 3D Numeric-Hydraulic Analysis of Jet Collision
 Ermenek Dam and HEPP: Spillway Test & 3D Numeric-Hydraulic Analysis of Jet Collision J.Linortner & R.Faber Pöyry Energy GmbH, Turkey-Austria E.Üzücek & T.Dinçergök General Directorate of State Hydraulic
DAM BREAK WAVE WITH ENERGY DISSIPATION : TWO CASE STUDIES
 Proc. 29th IAHR Congress, Beijing, Theme C, Tsinghua Univ. Press, Beijing, pp. 311-318 (ISBN 7-302-04676-X/TV). DAM BREAK WAVE WITH ENERGY DISSIPATION : TWO CASE STUDIES H. Chanson (1) and S. Aoki (2)
Comparison of stepped and smooth spillway effects on stream reaeration
 Comparison of stepped and smooth spillway effects on stream reaeration Egemen Aras 1* and Mehmet Berkun 2 1 Gumushane University, Department of Civil Engineering, Gumushane 29100, Turkey 2 Karadeniz Technical
CLOSURE PLAN. CCR (b) GERS East and West Bottom Ash Ponds. Pirkey Power Plant Hallsville, Texas. October, 2016
 GERS East and West Bottom Ash Ponds. Pirkey Power Plant Hallsville, Texas. October, 2016") CLOSURE PLAN CCR 257.102(b) East and West Bottom Ash Ponds Pirkey Power Plant Hallsville, Texas October, 2016 Prepared for : Southwest Electric Power Company - Pirkey Plant Hallsville, Texas Prepared by:
CLOSURE PLAN CCR 257.102(b) East and West Bottom Ash Ponds Pirkey Power Plant Hallsville, Texas October, 2016 Prepared for : Southwest Electric Power Company - Pirkey Plant Hallsville, Texas Prepared by:
2. RAPIDLY-VARIED FLOW (RVF) AUTUMN 2018
 AUTUMN 2018") 2. RAPIDLY-VARIED FLOW (RVF) AUTUMN 2018 Rapidly-varied flow is a significant change in water depth over a short distance (a few times water depth). It occurs where there is a local disturbance to the
2. RAPIDLY-VARIED FLOW (RVF) AUTUMN 2018 Rapidly-varied flow is a significant change in water depth over a short distance (a few times water depth). It occurs where there is a local disturbance to the
International Journal of Technical Research and Applications e-issn: , Volume 4, Issue 3 (May-June, 2016), PP.
, PP.") DESIGN AND ANALYSIS OF FEED CHECK VALVE AS CONTROL VALVE USING CFD SOFTWARE R.Nikhil M.Tech Student Industrial & Production Engineering National Institute of Engineering Mysuru, Karnataka, India -570008
DESIGN AND ANALYSIS OF FEED CHECK VALVE AS CONTROL VALVE USING CFD SOFTWARE R.Nikhil M.Tech Student Industrial & Production Engineering National Institute of Engineering Mysuru, Karnataka, India -570008
JACKTOWN ACRES FLOOD MITIGATION IMPROVEMENTS ANALYSIS
 JACKTOWN ACRES FLOOD MITIGATION IMPROVEMENTS ANALYSIS SITUATE IN: NORTH HUNTINGDON TOWNSHIP WESTMORELAND COUNTY, PENNSYLVANIA PREPARED FOR: North Huntingdon Township 11279 Center Highway North Huntingdon,
3D NUMERICAL MODELLING OF THE CAPACITY FOR A PARTIALLY PRESSURIZED SPILLWAY
 3D NUMERICAL MODELLING OF THE CAPACITY FOR A PARTIALLY PRESSURIZED SPILLWAY Samuel Vingerhagen 1 & Nils Reidar B. Olsen 1 1 Department of Hydraulic and Environmental Engineering, The Norwegian Univeristy
HEC 26 Aquatic Organism Passage Design Manual Evolution & Application
 HEC 26 Aquatic Organism Passage Design Manual Evolution & Application Sven Leon, P.E., Hydraulics Engineer Federal Highway Administration 2015 Alaska Fish Passage Meeting October 13 14, 2015 VTRC, Juneau,
Stormwater Level of Service Study - Phase 2 Flooding Adjacent to Rock Creek
 Stormwater Level of Service Study - Phase 2 Flooding Adjacent to Rock Creek City of Fairway, Kansas Fairway Stormwater Level of Service Study - Phase 2 Project No. 108200 Revision 1 12/6/2018 Stormwater
Hours / 100 Marks Seat No.
 17421 21415 3 Hours / 100 Marks Seat No. Instructions : (1) All Questions are compulsory. (2) Answer each next main Question on a new page. (3) Illustrate your answers with neat sketches wherever necessary.
The Physical Model Study of the Folsom Dam Auxiliary Spillway System
 ST. ANTHONY FALLS LABORATORY Engineering, Environmental and Geophysical Fluid Dynamics PROJECT REPORT 511 The Physical Model Study of the Folsom Dam Auxiliary Spillway System By Matthew L. Lueker, Omid
Impact of anti-vortex blade position on discharge experimental study on the coefficient of morning glory spillway
 Journal of Scientific Research and Development (7): 91-95, 015 Available online at www.jsrad.org ISSN 1115-7569 015 JSRAD Impact of anti-vortex blade position on discharge experimental study on the coefficient